UNITED STATES
SECURITIES AND EXCHANGE COMMISSION
Washington, DC 20549
FORM N-CSR
CERTIFIED SHAREHOLDER REPORT OF REGISTERED
MANAGEMENT INVESTMENT COMPANIES
Investment Company Act file number 811-22641
Franklin Alternative Strategies Funds
(Exact name of registrant as specified in charter)
One Franklin Parkway, San Mateo, CA 94403-1906
(Address of principal executive offices) (Zip code)
Craig S. Tyle, One Franklin Parkway, San Mateo, CA 94403-1906
(Name and address of agent for service)
Registrant’s telephone number, including area code: 650 312-2000
Date of fiscal year end: 5/31
Date of reporting period: 5/31/17
Item 1. Reports to Stockholders.
 | Annual Report and Shareholder Letter May 31, 2017 |
Franklin K2 Alternative Strategies Fund
A SERIES OF FRANKLIN ALTERNATIVE STRATEGIES FUNDS

Sign up for electronic delivery at franklintempleton.com/edelivery
Franklin Templeton Investments
Gain From Our Perspective®
At Franklin Templeton Investments, we’re dedicated to one goal: delivering exceptional asset management for our clients. By bringing together multiple, world-class investment teams in a single firm, we’re able to offer specialized expertise across styles and asset classes, all supported by the strength and resources of one of the world’s largest asset managers. This has helped us to become a trusted partner to individual and institutional investors across the globe.
Dear Fellow Shareholder:
During the 12 months ended May 31, 2017, the global economy expanded amid improved commodity prices, investor optimism about pro-growth policies in the U.S. and the victory of Emmanuel Macron as France’s president. The U.S. Federal Reserve (Fed) raised its federal funds rate in December 2016 and in March 2017 as policymakers cited ongoing economic expansion. Monetary policy around the globe also remained generally accommodative. In this environment, global developed stock markets, as measured by the MSCI World Index, posted a +17.09% total return for the period.1 Global emerging market stocks, as measured by the MSCI Emerging Markets Index, delivered a +27.88% total return.1 Global government bonds, as measured by the Citigroup World Government Bond Index, had a -0.46% total return.1
A couple of weeks after the end of the reporting period, the Fed raised its target range a quarter point to 1.00%–1.25%. Despite low inflation, the Fed made this decision amid signs of a strengthening labor market and moderately rising economic activity.
In all economic environments, we are committed to our long-term perspective and disciplined investment approach as we conduct diligent, fundamental analysis of securities with a continual emphasis on investment risk management.
We believe active, professional investment management serves investors well. We also recognize the important role of financial advisors in today’s markets and encourage investors to continue to seek their advice. Amid changing market and economic
conditions, we are confident investors with a well-diversified portfolio and a patient, long-term outlook will be well positioned for the years ahead.
In addition, Franklin K2 Alternative Strategies Fund’s annual report includes more detail about prevailing conditions and a discussion about investment decisions during the period. Please remember all securities markets fluctuate, as do mutual fund share prices.
We thank you for investing with Franklin Templeton, welcome your questions and comments, and look forward to continuing to serve your investment needs.
Sincerely,

William Y. Yun, CFA
President and Chief Executive Officer – Investment Management
Franklin Alternative Strategies Funds
This letter reflects our analysis and opinions as of May 31, 2017, unless otherwise indicated. The information is not a complete analysis of every aspect of any market, country, industry, security or fund. Statements of fact are from sources considered reliable.
CFA® is a trademark owned by CFA Institute.
1. Source: Morningstar.
See www.franklintempletondatasources.com for additional data provider information.
| Not FDIC Insured | | | May Lose Value | | | No Bank Guarantee |
| franklintempleton.com | Not part of the annual report | 1 |
Annual Report
Visit franklintempleton.com for fund updates, to access your account, or to find helpful financial planning tools.
| 2 | Annual Report | franklintempleton.com |
Annual Report
Franklin K2 Alternative Strategies Fund
We are pleased to bring you Franklin K2 Alternative Strategies Fund’s annual report for the fiscal year ended May 31, 2017.
Your Fund’s Goal and Main Investments
The Fund seeks capital appreciation with lower volatility relative to the broad equity markets. The Fund seeks to achieve its investment goal by allocating its assets across multiple non- traditional or “alternative” strategies, including but not limited to relative value, long short equity, global macro and event driven. The Fund is structured as a multi-manager fund, meaning the Fund’s assets are independently managed by multiple subadvisors, while the Fund’s investment manager retains overall responsibility for the Fund’s investments. The Fund may invest in a wide range of securities and other investments including, but not limited to: equity securities including common stocks, preferred stocks, convertible securities, rights and warrants, private and registered investment vehicles and exchange-traded funds (ETFs); and debt securities including bonds, notes, debentures, banker’s acceptances and commercial paper; loans and loan participations; and mortgage-backed or other asset-backed securities, including collateralized debt obligations; as well as derivatives, commodities and currencies.
Performance Overview
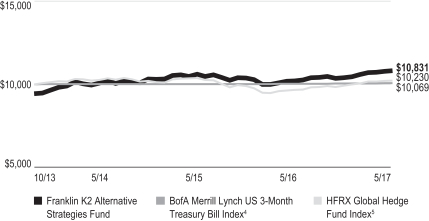
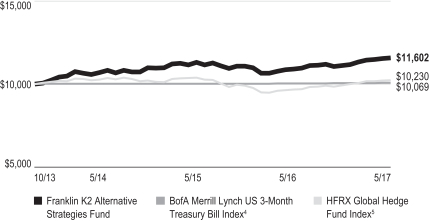
The Fund’s Class A shares delivered a +6.07% cumulative total return for the 12 months under review. For comparison, the Fund’s primary benchmark, the BofA Merrill Lynch US 3-Month Treasury Bill Index, which tracks the performance of short-term U.S. government securities with a remaining term to final maturity of less than three months, posted a +0.44% total return for the same period.1 Also for comparison, the Fund’s secondary benchmark, the HFRX Global Hedge Fund Index, which is designed to be representative of the overall composition of the hedge fund universe, generated a +5.98% total return for the same period.2 You can find more of the Fund’s performance data in the Performance Summary beginning on page 7.
Strategy Allocation*
Based on Total Investments as of 5/31/17
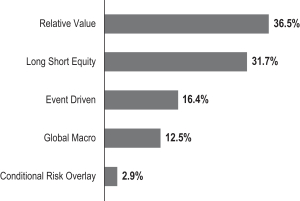
*Figures represent the net Fund exposure and include certain derivatives held in the portfolio (or their underlying reference assets) or unsettled trades and may not total 100% or may be negative due to rounding, use of any derivatives or other factors.
Performance data represent past performance, which does not guarantee future results. Investment return and principal value will fluctuate, and you may have a gain or loss when you sell your shares. Current performance may differ from figures shown. For most recent month-end performance, go to franklintempleton.com or call (800) 342-5236.
Economic and Market Overview
The global economy grew moderately during the period under review. In this environment, global developed and emerging market stocks rose significantly, as measured by the MSCI All Country World Index. Global markets were aided by accommodative monetary policies of various central banks, improved industrial commodity prices at certain points during the period, investor optimism about pro-growth policies in the U.S., continued hopes of tax reforms under the Trump administration, the victory of Emmanuel Macron as France’s President and encouraging corporate earnings reports. A deal by major oil producing countries in December to curb oil production also supported global equity markets.
1. Source: Morningstar.
2. Source: FactSet. Hedge Fund Research, Inc. – www.hedgefundresearch.com. The HFRX Global Hedge Fund Index is being used under license from Hedge Fund Research, Inc., which does not endorse or approve of any of the contents of this report.
The indexes are unmanaged and include reinvestment of any income or distributions. They do not reflect any fees, expenses or sales charges. One cannot invest directly in an index, and an index is not representative of the Fund’s portfolio. Unlike most asset class indexes, HFR Index returns reflect fees and expenses.
The dollar value, number of shares or principal amount, and names of all portfolio holdings are listed in the Fund’s Consolidated Statement of Investments (SOI). The Consolidated SOI begins on page 16.
| franklintempleton.com | Annual Report | 3 |
FRANKLIN K2 ALTERNATIVE STRATEGIES FUND
However, investors expressed concerns about the timing and economic effects of the U.K.’s exit from the European Union (also known as “Brexit”) and the U.S. executive order banning entry from some Muslim-majority countries. Other headwinds included the health of European banks, concerns surrounding U.S. political turmoil, political worries in the European Union, geopolitical tensions in certain regions and worries about global oversupply in oil production despite a pact to extend cuts.
The U.S. economy expanded during the period. The economy strengthened in 2016’s third quarter, but moderated in the next two quarters, largely due to declines in private inventory investment and government spending. The manufacturing sector generally expanded, and the services sector also continued to grow. The unemployment rate decreased from 4.7% in May 2016 to 4.3% at period-end.3 Monthly retail sales were volatile, but mostly grew during the period. Annual inflation, as measured by the Consumer Price Index, generally increased during the period. At its December 2016 meeting, the U.S. Federal Reserve (Fed) raised its target range for the federal funds rate from 0.25%–0.50% to 0.50%–0.75%. The Fed, at its March 2017 meeting, made the widely anticipated increase in its federal funds target rate to 0.75%–1.00%. Following a weak batch of data releases in April, the Fed, at its May meeting, kept its interest rate unchanged.
In Europe, the U.K.’s economy grew at a faster rate in 2016’s fourth quarter over the third quarter, supported by growth in services. However, the nation’s growth rate moderated in 2017’s first quarter, largely due to slower growth in household spending. The Bank of England cut its benchmark interest rate and expanded its massive bond-buying program in August 2016 to boost the nation’s growth. The eurozone’s growth held steady in the first quarter over the previous quarter. The bloc’s annual inflation rate increased gradually to reach its highest level in four years in February, but declined in March. Although it rebounded in April, the inflation rate fell again in May due to slower growth in prices of energy and food products. The European Central Bank, at its April meeting, kept its key policy rates unchanged.
In Asia, Japan’s quarterly gross domestic product (GDP) accelerated in 2016’s fourth quarter and 2017’s first quarter. In April 2017, the Bank of Japan slightly increased its GDP forecasts for the 2018 fiscal year; however, inflation forecasts were reduced.
In emerging markets, Brazil’s quarterly GDP grew for the first time in two years, as its first-quarter 2017 GDP grew compared to the previous quarter. The country’s central bank cut its
benchmark interest rate several times between November 2016 and May 2017 to spur economic growth. Russia’s GDP grew in 2016’s fourth quarter and 2017’s first quarter compared to the prior-year periods, as oil prices rebounded, exports and industrial production grew, and consumer demand showed signs of improvement. The Bank of Russia reduced its key interest rate in June and September 2016 and in March and April 2017 to try to revive its economy. China’s economic growth decelerated in 2016’s fourth quarter compared to the previous year, although growth edged up in 2017’s first quarter compared to 2016’s first quarter, largely driven by higher government spending. The People’s Bank of China left its benchmark interest rate unchanged during the period. Overall, emerging market stocks, as measured by the MSCI Emerging Markets Index, rose during the period.
Investment Strategy
We manage the Fund using a multi-manager approach. While we are responsible for the Fund’s overall investments, we allocate assets to multiple subadvisors, each of whom independently manages a separate portion of the Fund’s portfolio in accordance with some or all of the following strategies: long short equity, relative value, event driven and global macro. We allocate the Fund’s assets among these strategies utilizing a top-down approach, generating the Fund’s strategy weightings by taking into account market conditions, risk factors, diversification, liquidity, transparency, and availability of various subadvisors and other investment options, among other things. The allocations to specific subadvisors may change from time to time based upon our assessment of their correlations to various markets and to each other, their risk profiles and return expectations. Long short equity strategies generally seek to produce returns from investments in the equity markets by taking long and short positions in stocks and stock indexes (through the use of derivatives or ETFs). Relative value strategies encompass a wide range of investment techniques that are intended to profit from pricing inefficiencies. Event driven strategies generally invest in securities of companies undergoing significant corporate events. Global macro strategies generally focus on broad-based economic opportunities across numerous markets and investments.
The Fund may take long and/or short positions in a wide range of asset classes, including equities, fixed income, commodities and currencies, among others. Long positions benefit from an increase in the price of the underlying instrument or asset class, while short positions benefit from a decrease in that price. The
3. Source: Bureau of Labor Statistics.
See www.franklintempletondatasources.com for additional data provider information.
| 4 | Annual Report | franklintempleton.com |
FRANKLIN K2 ALTERNATIVE STRATEGIES FUND
Fund may use derivatives for hedging and nonhedging (investment) purposes. Such derivative investments may include futures contracts, swaps, options and currency forward contracts. The Fund may engage in active and frequent trading as part of its investment strategies.
What is a futures contract?
A futures contract is an agreement between the Fund and a counterparty made through a U.S. or foreign futures exchange to buy or sell an underlying instrument or asset at a specific price on a future date.
What are swap agreements?
Swap agreements, such as interest rate, currency and credit default swaps, are contracts between the Fund and another party (the swap counterparty). In a basic swap transaction, the Fund agrees with the swap counterparty to exchange the returns (or differentials in rates of return) earned or realized on a particular “notional amount” of underlying instruments. The notional amount is the set amount selected by the parties as the basis on which to calculate the obligations that they have agreed to exchange. The parties typically do not actually exchange the notional amount. Instead, they agree to exchange the returns that would be earned or realized if the notional amount were invested in given instruments or at given interest rates.
What is an option?
An option is a contract to buy or sell a specific financial product known as the option’s underlying instrument at a specific price. The buyer of an option has the right, but not the obligation, to buy or sell the underlying instrument at or until a specified expiration date. Conversely, the seller (“writer”) of an option who opens a transaction is obligated to buy or sell the underlying instrument should the option holder exercise that right.
What is a currency forward contract?
A currency forward contract is an agreement between the Fund and a counterparty to buy or sell a foreign currency in exchange for another currency at a specific exchange rate on a future date.
Manager’s Discussion
The Fund’s overall performance was positive for the 12-month review period, with four underlying strategies—relative value, long short equity, event driven and global macro—generating gains. A conditional risk overlay strategy implemented in March to help mitigate downside risk exposure detracted over the period. Performance contribution was led by the relative value strategy, followed by long short equity, event driven and global macro, respectively.
| Subadvisors | ||||
| 5/31/17 | ||||
| Long Short Equity | ||||
Chilton Investment Company, LLC | ||||
Impala Asset Management LLC | ||||
Jennison Associates, LLC | ||||
Portland Hill Capital LLP | ||||
Wellington Management Company, LLP | ||||
| Relative Value | ||||
Basso Capital Management, L.P. | ||||
Chatham Asset Management, LLC | ||||
Lazard Asset Management, LLC | ||||
Loomis Sayles & Company, L.P. | ||||
| Event Driven | ||||
Halcyon Arbitrage IC Management LP | ||||
P. Schoenfeld Asset Management L.P. | ||||
York Registered Holdings, L.P. | ||||
| Global Macro | ||||
Emso Asset Management Limited | ||||
Graham Capital Management, L.P. | ||||
What is a conditional risk overlay (CRO) strategy?
From time to time, the Fund’s Investment Manager may implement its CRO strategy, which seeks to neutralize certain market sensitivities that may exist in the Fund. The CRO strategy involves investing in derivatives or other instruments in an effort to reduce volatility and provide a hedge against market declines. When implemented, the strategy will reduce the Fund’s ability to benefit from positive market movements.
The Fund’s long short equity strategy subadvisors were Chilton Investment Company, Impala Asset Management, Jennison Associates, Portland Hill Capital and Wellington Management Company. All five subadvisors contributed gains for the 12-month period, led by Jennison. In aggregate, the top performance drivers for the strategy were communications, technology and health care positions. The largest detractors were consumer non-cyclical, energy and utilities positions. In terms of geographical exposure, positions in U.S., Canadian and French equities were the top contributors to gains, while exposures to the Netherlands, Hungary and Belgium detracted slightly.
The Fund’s relative value strategy subadvisors were Basso Capital Management, Chatham Asset Management, Lazard Asset Management and Loomis Sayles & Company. All four subadvisors contributed positively to the Fund’s performance for the 12-month period. In aggregate, the top performance drivers for the strategy by asset class were credit and cash exposures, while currencies and equities (short equity portfolio hedges) were the largest detractors. In terms of aggregate sector performance, the
| franklintempleton.com | Annual Report | 5 |
FRANKLIN K2 ALTERNATIVE STRATEGIES FUND
top contributors were communications, basic materials and energy positions. Financial and currency positions detracted.
The Fund’s event driven strategy subadvisors were P. Schoenfeld Asset Management, York Registered Holdings (all assets were withdrawn from York during the period, but it remained an approved subadvisor) and Halcyon Arbitrage IC Management (a new subadvisor that we allocated to in June 2016). All three subadvisors contributed to performance for the 12-month period. In aggregate the top performance drivers for the strategy by asset class were equities, credit and currencies. No asset classes detracted from the strategy’s performance over the period. Health care, energy and communications positions contributed significantly to returns, while industrials and government credit positions detracted.
The Fund’s global macro strategy subadvisors were Graham Capital Management and Emso Asset Management Limited. The overall strategy benefited Fund performance, with Emso providing positive returns and Graham with negative returns. In aggregate, the top performance drivers for the strategy by asset class were equity, interest-rate and credit positions, while commodity and currency positions detracted. Equity index, emerging market government credit and interest-rate derivatives positions were among the top contributors, while energy and environment, agriculture and livestock, and currency positions detracted.
Thank you for your participation in Franklin K2 Alternative Strategies Fund. We look forward to continuing to serve your investment needs.
 |
David C. Saunders |

 |  Brooks Ritchey Brooks Ritchey | |
Robert Christian
Portfolio Management Team |
The foregoing information reflects our analysis, opinions and portfolio holdings as of May 31, 2017, the end of the reporting period. The way we implement our main investment strategies and the resulting portfolio holdings may change depending on factors such as market and economic conditions. These opinions may not be relied upon as investment advice or an offer for a particular security. The information is not a complete analysis of every aspect of any market, country, industry, security or the Fund. Statements of fact are from sources considered reliable, but the investment manager makes no representation or warranty as to their completeness or accuracy. Although historical performance is no guarantee of future results, these insights may help you understand our investment management philosophy.
| 6 | Annual Report | franklintempleton.com |
FRANKLIN K2 ALTERNATIVE STRATEGIES FUND
Performance Summary as of May 31, 2017
The performance table and graphs do not reflect any taxes that a shareholder would pay on Fund dividends, capital gain distributions, if any, or any realized gains on the sale of Fund shares. Total return reflects reinvestment of the Fund’s dividends and capital gain distributions, if any, and any unrealized gains or losses. Your dividend income will vary depending on dividends or interest paid by securities in the Fund’s portfolio, adjusted for operating expenses of each class. Capital gain distributions are net profits realized from the sale of portfolio securities.
Performance as of 5/31/171
Cumulative total return excludes sales charges. Average annual total return includes maximum sales charges. Sales charges will vary depending on the size of the investment and the class of share purchased. The maximum is 5.75% and the minimum is 0%. Class A: 5.75% maximum initial sales charge; Advisor Class: no sales charges. For other share classes, visit franklintempleton.com.
| Share Class | Cumulative Total Return2 | Average Annual Total Return3 | ||||||
| A | ||||||||
1-Year | +6.07% | +0.00% | ||||||
3-Year | +7.58% | +0.46% | ||||||
Since Inception (10/11/13) | +14.92% | +2.22% | ||||||
| Advisor | ||||||||
1-Year | +6.29% | +6.29% | ||||||
3-Year | +8.51% | +2.76% | ||||||
Since Inception (10/11/13) | +16.02% | +4.17% | ||||||
Performance data represent past performance, which does not guarantee future results. Investment return and principal value will fluctuate, and you may have a gain or loss when you sell your shares. Current performance may differ from figures shown. For most recent month-end performance, go to franklintempleton.com or call (800) 342-5236.
See page 9 for Performance Summary footnotes.
| franklintempleton.com | Annual Report | 7 |
FRANKLIN K2 ALTERNATIVE STRATEGIES FUND
PERFORMANCE SUMMARY
Total Return Index Comparison for a Hypothetical $10,000 Investment1
Total return represents the change in value of an investment over the periods shown. It includes any applicable maximum sales charge, Fund expenses, account fees and reinvested distributions. The unmanaged indexes include reinvestment of any income or distributions. These differ from the Fund in composition and do not pay management fees or expenses. One cannot invest directly in an index.
Class A (10/11/13–5/31/17)
Advisor Class (10/11/13–5/31/17)
See page 9 for Performance Summary footnotes.
| 8 | Annual Report | franklintempleton.com |
FRANKLIN K2 ALTERNATIVE STRATEGIES FUND
PERFORMANCE SUMMARY
Distributions (6/1/16–5/31/17)
| Share Class | Net Investment Income | |||
A | $0.0489 | |||
C | — | |||
R | $0.0523 | |||
R6 | $0.0940 | |||
Advisor | $0.0829 | |||
Total Annual Operating Expenses6
| Share Class | With Waiver | Without Waiver | ||||||
A | 2.88% | 3.40% | ||||||
Advisor | 2.63% | 3.15% | ||||||
Each class of shares is available to certain eligible investors and has different annual fees and expenses, as described in the prospectus.
All investments involve risks, including possible loss of principal. The market values of securities owned by the Fund will go up or down, sometimes rapidly or unpredictably. The Fund’s performance depends on the manager’s skill in selecting, overseeing and allocating Fund assets to the subadvisors. The Fund is actively managed and could experience losses if the investment manager’s and subadvisors’ judgment about particular investments made for the Fund’s portfolio prove to be incorrect. Some subadvisors may have little or no experience managing the assets of a registered investment company. Foreign investments are subject to greater investment risk such as political, economic, credit and information risks as well as risk of currency fluctuations. Investments in derivatives involve costs and create economic leverage, which may result in significant volatility and cause the Fund to participate in losses (as well as gains) that significantly exceed the Fund’s initial investment. Lower rated or high yield debt securities involve greater credit risk, including the possibility of default or bankruptcy. Currency management strategies could result in losses to the Fund if currencies do not perform as the investment manager or subadvisor expects. The Fund may make short sales of securities, which involves the risk that losses may exceed the original amount invested. Merger arbitrage investments risk loss if a proposed reorganization in which the Fund invests is renegotiated or terminated. Liquidity risk exists when securities have become more difficult to sell, or are unable to be sold, at the price at which they have been valued. The Fund’s prospectus also includes a description of the main investment risks.
1. The Fund has an expense reduction contractually guaranteed through 9/30/17 and a fee waiver related to the management fee paid by a subsidiary. Fund investment results reflect the expense reduction and fee waiver; without these reductions, the results would have been lower.
2. Cumulative total return represents the change in value of an investment over the periods indicated.
3. Average annual total return represents the average annual change in value of an investment over the periods indicated. Return for less than one year, if any, has not been annualized.
4. Source: Morningstar. The BofA Merrill Lynch US 3-Month Treasury Bill Index is an index of short-term U.S. government securities with a remaining term to final maturity of less than three months.
5. Source: Factset. Hedge Fund Research, Inc. – www.hedgefundresearch.com. The HFRX Global Hedge Fund Index is being used under license from Hedge Fund Research, Inc., which does not endorse or approve of any of the contents of this report. The HFRX Global Hedge Fund Index is designed to be representative of the overall composition of the hedge fund universe. It is composed of all eligible hedge fund strategies, including but not limited to convertible arbitrage, distressed securities, equity hedge, equity market neutral, event driven, macro, merger arbitrage and relative value arbitrage. The strategies are asset weighted based on the distribution of assets in the hedge fund industry.
6. Figures are as stated in the Fund’s current prospectus and may differ from the expense ratios disclosed in the Your Fund’s Expenses and Consolidated Financial Highlights sections in this report. In periods of market volatility, assets may decline significantly, causing total annual Fund operating expenses to become higher than the figures shown.
See www.franklintempletondatasources.com for additional data provider information.
| franklintempleton.com | Annual Report | 9 |
FRANKLIN K2 ALTERNATIVE STRATEGIES FUND
As a Fund shareholder, you can incur two types of costs: (1) transaction costs, including sales charges (loads) on Fund purchases and redemptions; and (2) ongoing Fund costs, including management fees, distribution and service (12b-1) fees, and other Fund expenses. All mutual funds have ongoing costs, sometimes referred to as operating expenses. The table below shows ongoing costs of investing in the Fund and can help you understand these costs and compare them with those of other mutual funds. The table assumes a $1,000 investment held for the six months indicated.
Actual Fund Expenses
The table below provides information about actual account values and actual expenses in the columns under the heading “Actual.” In these columns the Fund’s actual return, which includes the effect of Fund expenses, is used to calculate the “Ending Account Value” for each class of shares. You can estimate the expenses you paid during the period by following these steps (of course, your account value and expenses will differ from those in this illustration): Divide your account value by $1,000 (if your account had an $8,600 value, then $8,600 ÷ $1,000 = 8.6). Then multiply the result by the number in the row for your class of shares under the headings “Actual” and “Expenses Paid During Period” (if Actual Expenses Paid During Period were $7.50, then 8.6 x $7.50 =$64.50). In this illustration, the actual expenses paid this period are $64.50.
Hypothetical Example for Comparison with Other Funds
Under the heading “Hypothetical” in the table, information is provided about hypothetical account values and hypothetical expenses based on the Fund’s actual expense ratio and an assumed rate of return of 5% per year before expenses, which is not the Fund’s actual return. This information may not be used to estimate the actual ending account balance or expenses you paid for the period, but it can help you compare ongoing costs of investing in the Fund with those of other funds. To do so, compare this 5% hypothetical example for the class of shares you hold with the 5% hypothetical examples that appear in the shareholder reports of other funds.
Please note that expenses shown in the table are meant to highlight ongoing costs and do not reflect any transactional costs. Therefore, information under the heading “Hypothetical” is useful in comparing ongoing costs only, and will not help you compare total costs of owning different funds. In addition, if transactional costs were included, your total costs would have been higher.
| Actual (actual return after expenses) | Hypothetical (5% annual return before expenses) | |||||||||||||||||||||||
Share | Beginning Account Value 12/1/16 | Ending Account Value 5/31/17 | Expenses Paid During Period 12/1/16–5/31/171,2 | Ending Account Value 5/31/17 | Expenses Paid During Period 12/1/16–5/31/171,2 | Net Annualized Expense Ratio2 | ||||||||||||||||||
| A | $ | 1,000 | $ | 1,041.00 | $ | 13.69 | $ | 1,011.52 | $ | 13.49 | 2.69 | % | ||||||||||||
| C | $ | 1,000 | $ | 1,036.80 | $ | 17.42 | $ | 1,007.83 | $ | 17.17 | 3.43 | % | ||||||||||||
| R | $ | 1,000 | $ | 1,039.30 | $ | 14.95 | $ | 1,010.27 | $ | 14.74 | 2.94 | % | ||||||||||||
| R6 | $ | 1,000 | $ | 1,043.30 | $ | 11.97 | $ | 1,013.21 | $ | 11.80 | 2.35 | % | ||||||||||||
| Advisor | $ | 1,000 | $ | 1,042.20 | $ | 12.42 | $ | 1,012.76 | $ | 12.24 | 2.44 | % | ||||||||||||
1. Expenses are equal to the annualized expense ratio for the six-month period as indicated above—in the far right column—multiplied by the simple average account value over the period indicated, and then multiplied by 182/365 to reflect the one-half year period.
2. Reflects expenses after fee waivers and expense reimbursements. Does not include acquired fund fees and expenses.
| 10 | Annual Report | franklintempleton.com |
FRANKLIN ALTERNATIVE STRATEGIES FUNDS
Consolidated Financial Highlights
Franklin K2 Alternative Strategies Fund
| Year Ended May 31, | ||||||||||||||||
| 2017 | 2016 | 2015 | 2014a | |||||||||||||
| Class A | ||||||||||||||||
| Per share operating performance (for a share outstanding throughout the year) | ||||||||||||||||
Net asset value, beginning of year | $ | 10.55 | $ | 11.16 | $ | 10.64 | $ | 10.00 | ||||||||
|
| |||||||||||||||
| Income from investment operationsb: | ||||||||||||||||
Net investment income (loss)c | 0.03 | (0.05 | ) | (0.11 | ) | (0.02 | ) | |||||||||
Net realized and unrealized gains (losses) | 0.61 | (0.38 | ) | 0.70 | 0.70 | |||||||||||
|
| |||||||||||||||
Total from investment operations | 0.64 | (0.43 | ) | 0.59 | 0.68 | |||||||||||
|
| |||||||||||||||
| Less distributions from: | ||||||||||||||||
Net investment income | (0.05 | ) | (0.14 | ) | (0.07 | ) | (0.04 | ) | ||||||||
Net realized gains | — | (0.04 | ) | — | — | |||||||||||
|
| |||||||||||||||
Total distributions | (0.05 | ) | (0.18 | ) | (0.07 | ) | (0.04 | ) | ||||||||
|
| |||||||||||||||
Net asset value, end of year | $ | 11.14 | $ | 10.55 | $ | 11.16 | $ | 10.64 | ||||||||
|
| |||||||||||||||
Total returnd | 6.07% | (3.89)% | 5.53% | 6.82% | ||||||||||||
| Ratios to average net assetse | ||||||||||||||||
Expenses before waiver, payments by affiliates and expense reductionf | 3.07% | 3.22% | 3.40% | 3.33% | ||||||||||||
Expenses net of waiver, payments by affiliates and expense reductionf | 2.73% | 2.88% | g | 2.99% | g | 2.83% | ||||||||||
Expenses incurred in connection with securities sold short | 0.53% | 0.67% | 0.65% | 0.56% | ||||||||||||
Net investment income (loss) | 0.10% | (0.44)% | (0.95)% | (0.35)% | ||||||||||||
| Supplemental data | ||||||||||||||||
Net assets, end of year (000’s) | $119,385 | $177,412 | $148,991 | $96,889 | ||||||||||||
Portfolio turnover rate | 209.45% | 229.90% | 295.81% | 181.06% | ||||||||||||
aFor the period October 11, 2013 (commencement of operations) to May 31, 2014.
bThe amount shown for a share outstanding throughout the period may not correlate with the Consolidated Statement of Operations for the period due to the timing of sales and repurchases of the Fund’s shares in relation to income earned and/or fluctuating fair value of the investments of the Fund.
cBased on average daily shares outstanding.
dTotal return does not reflect sales commissions or contingent deferred sales charges, if applicable, and is not annualized for periods less than one year.
eRatios are annualized for periods less than one year.
fIncludes dividend and/or interest expense on securities sold short and security borrowing fees, if any. See below for the ratios of such expenses to average net assets for the periods presented. See Note 1(h).
gBenefit of expense reduction rounds to less than 0.01%.
| franklintempleton.com | The accompanying notes are an integral part of these financial statements. | Annual Report | 11 |
FRANKLIN ALTERNATIVE STRATEGIES FUNDS
CONSOLIDATED FINANCIAL HIGHLIGHTS
Franklin K2 Alternative Strategies Fund (continued)
| Year Ended May 31, | ||||||||||||||||
| 2017 | 2016 | 2015 | 2014a | |||||||||||||
| Class C | ||||||||||||||||
| Per share operating performance (for a share outstanding throughout the year) | ||||||||||||||||
Net asset value, beginning of year | $ | 10.45 | $ | 11.09 | $ | 10.60 | $ | 10.00 | ||||||||
|
| |||||||||||||||
| Income from investment operationsb: | ||||||||||||||||
Net investment income (loss)c | (0.04 | ) | (0.12 | ) | (0.17 | ) | (0.08 | ) | ||||||||
Net realized and unrealized gains (losses) | 0.59 | (0.39 | ) | 0.69 | 0.72 | |||||||||||
|
| |||||||||||||||
Total from investment operations | 0.55 | (0.51 | ) | 0.52 | 0.64 | |||||||||||
|
| |||||||||||||||
| Less distributions from: | ||||||||||||||||
Net investment income | — | (0.09 | ) | (0.03 | ) | (0.04 | ) | |||||||||
Net realized gains | — | (0.04 | ) | — | — | |||||||||||
|
| |||||||||||||||
Total distributions | — | (0.13 | ) | (0.03 | ) | (0.04 | ) | |||||||||
|
| |||||||||||||||
Net asset value, end of year | $ | 11.00 | $ | 10.45 | $ | 11.09 | $ | 10.60 | ||||||||
|
| |||||||||||||||
Total returnd | 5.26% | (4.62)% | 4.87% | 6.42% | ||||||||||||
| Ratios to average net assetse | ||||||||||||||||
Expenses before waiver, payments by affiliates and expense reductionf | 3.79% | 3.96% | 4.04% | 4.03% | ||||||||||||
Expenses net of waiver, payments by affiliates and expense reductionf | 3.45% | 3.62% | g | 3.63% | g | 3.53% | ||||||||||
Expenses incurred in connection with securities sold short | 0.53% | 0.67% | 0.65% | 0.56% | ||||||||||||
Net investment income (loss) | (0.62)% | (1.18)% | (1.59)% | (1.05)% | ||||||||||||
| Supplemental data | ||||||||||||||||
Net assets, end of year (000’s) | $55,496 | $71,154 | $37,937 | $16,618 | ||||||||||||
Portfolio turnover rate | 209.45% | 229.90% | 295.81% | 181.06% | ||||||||||||
aFor the period October 11, 2013 (commencement of operations) to May 31, 2014.
bThe amount shown for a share outstanding throughout the period may not correlate with the Consolidated Statement of Operations for the period due to the timing of sales and repurchases of the Fund’s shares in relation to income earned and/or fluctuating fair value of the investments of the Fund.
cBased on average daily shares outstanding.
dTotal return does not reflect sales commissions or contingent deferred sales charges, if applicable, and is not annualized for periods less than one year.
eRatios are annualized for periods less than one year.
fIncludes dividend and/or interest expense on securities sold short and security borrowing fees, if any. See below for the ratios of such expenses to average net assets for the periods presented. See Note 1(h).
gBenefit of expense reduction rounds to less than 0.01%.
| 12 | Annual Report | The accompanying notes are an integral part of these financial statements. | franklintempleton.com |
FRANKLIN ALTERNATIVE STRATEGIES FUNDS
CONSOLIDATED FINANCIAL HIGHLIGHTS
Franklin K2 Alternative Strategies Fund (continued)
| Year Ended May 31, | ||||||||||||||||
| 2017 | 2016 | 2015 | 2014a | |||||||||||||
| Class R | ||||||||||||||||
| Per share operating performance (for a share outstanding throughout the year) | ||||||||||||||||
Net asset value, beginning of year | $ | 10.61 | $ | 11.15 | $ | 10.62 | $ | 10.00 | ||||||||
|
| |||||||||||||||
| Income from investment operationsb: | ||||||||||||||||
Net investment income (loss)c | (0.25 | ) | (0.10 | ) | (0.16 | ) | (0.05 | ) | ||||||||
Net realized and unrealized gains (losses) | 0.86 | (0.40 | ) | 0.73 | 0.71 | |||||||||||
|
| |||||||||||||||
Total from investment operations | 0.61 | (0.50 | ) | 0.57 | 0.66 | |||||||||||
|
| |||||||||||||||
| Less distributions from: | ||||||||||||||||
Net investment income | (0.05 | ) | — | (0.04 | ) | (0.04 | ) | |||||||||
Net realized gains | — | (0.04 | ) | — | — | |||||||||||
|
| |||||||||||||||
Total distributions | (0.05 | ) | (0.04 | ) | (0.04 | ) | (0.04 | ) | ||||||||
|
| |||||||||||||||
Net asset value, end of year | $ | 11.17 | $ | 10.61 | $ | 11.15 | $ | 10.62 | ||||||||
|
| |||||||||||||||
Total returnd | 5.79% | (4.51)% | 5.39% | 6.62% | ||||||||||||
| Ratios to average net assetse | ||||||||||||||||
Expenses before waiver, payments by affiliates and expense reductionf | 3.32% | 3.46% | 3.57% | 3.63% | ||||||||||||
Expenses net of waiver, payments by affiliates and expense reductionf | 2.98% | 3.12% | g | 3.16% | g | 3.13% | ||||||||||
Expenses incurred in connection with securities sold short | 0.53% | 0.67% | 0.65% | 0.56% | ||||||||||||
Net investment income (loss) | (0.15)% | (0.68)% | (1.12)% | (0.65)% | ||||||||||||
| Supplemental data | ||||||||||||||||
Net assets, end of year (000’s) | $597 | $341 | $9,173 | $11,660 | ||||||||||||
Portfolio turnover rate | 209.45% | 229.90% | 295.81% | 181.06% | ||||||||||||
aFor the period October 11, 2013 (commencement of operations) to May 31, 2014.
bThe amount shown for a share outstanding throughout the period may not correlate with the Consolidated Statement of Operations for the period due to the timing of sales and repurchases of the Fund’s shares in relation to income earned and/or fluctuating fair value of the investments of the Fund.
cBased on average daily shares outstanding.
dTotal return is not annualized for periods less than one year.
eRatios are annualized for periods less than one year.
fIncludes dividend and/or interest expense on securities sold short and security borrowing fees, if any. See below for the ratios of such expenses to average net assets for the periods presented. See Note 1(h).
gBenefit of expense reduction rounds to less than 0.01%.
| franklintempleton.com | The accompanying notes are an integral part of these financial statements. | Annual Report | 13 |
FRANKLIN ALTERNATIVE STRATEGIES FUNDS
CONSOLIDATED FINANCIAL HIGHLIGHTS
Franklin K2 Alternative Strategies Fund (continued)
| Year Ended May 31, | ||||||||||||||||
| 2017 | 2016 | 2015 | 2014a | |||||||||||||
| Class R6 | ||||||||||||||||
| Per share operating performance (for a share outstanding throughout the year) | ||||||||||||||||
Net asset value, beginning of year | $ | 10.59 | $ | 11.18 | $ | 10.66 | $ | 10.00 | ||||||||
|
| |||||||||||||||
| Income from investment operationsb: | ||||||||||||||||
Net investment income (loss)c | 0.02 | (0.01 | ) | (0.08 | ) | (0.01 | ) | |||||||||
Net realized and unrealized gains (losses) | 0.65 | (0.37 | ) | 0.70 | 0.71 | |||||||||||
|
| |||||||||||||||
Total from investment operations | 0.67 | (0.38 | ) | 0.62 | 0.70 | |||||||||||
|
| |||||||||||||||
| Less distributions from: | ||||||||||||||||
Net investment income | (0.09 | ) | (0.17 | ) | (0.10 | ) | (0.04 | ) | ||||||||
Net realized gains | — | (0.04 | ) | — | — | |||||||||||
|
| |||||||||||||||
Total distributions | (0.09 | ) | (0.21 | ) | (0.10 | ) | (0.04 | ) | ||||||||
|
| |||||||||||||||
Net asset value, end of year | $ | 11.17 | $ | 10.59 | $ | 11.18 | $ | 10.66 | ||||||||
|
| |||||||||||||||
Total returnd | 6.40% | (3.45)% | 5.80% | 7.02% | ||||||||||||
| Ratios to average net assetse | ||||||||||||||||
Expenses before waiver, payments by affiliates and expense reductionf | 2.73% | 2.87% | 2.98% | 3.19% | ||||||||||||
Expenses net of waiver, payments by affiliates and expense reductionf | 2.39% | 2.53% | g | 2.60% | g | 2.69% | ||||||||||
Expenses incurred in connection with securities sold short | 0.53% | 0.67% | 0.65% | 0.56% | ||||||||||||
Net investment income (loss) | 0.44% | (0.09)% | (0.56)% | (0.21)% | ||||||||||||
| Supplemental data | ||||||||||||||||
Net assets, end of year (000’s) | $265,247 | $265,517 | $239,754 | $215,526 | ||||||||||||
Portfolio turnover rate | 209.45% | 229.90% | 295.81% | 181.06% | ||||||||||||
aFor the period October 11, 2013 (commencement of operations) to May 31, 2014.
bThe amount shown for a share outstanding throughout the period may not correlate with the Consolidated Statement of Operations for the period due to the timing of sales and repurchases of the Fund’s shares in relation to income earned and/or fluctuating fair value of the investments of the Fund.
cBased on average daily shares outstanding.
dTotal return is not annualized for periods less than one year.
eRatios are annualized for periods less than one year.
fIncludes dividend and/or interest expense on securities sold short and security borrowing fees, if any. See below for the ratios of such expenses to average net assets for the periods presented. See Note 1(h).
gBenefit of expense reduction rounds to less than 0.01%.
| 14 | Annual Report | The accompanying notes are an integral part of these financial statements. | franklintempleton.com |
FRANKLIN ALTERNATIVE STRATEGIES FUNDS
CONSOLIDATED FINANCIAL HIGHLIGHTS
Franklin K2 Alternative Strategies Fund (continued)
| Year Ended May 31, | ||||||||||||||||
| 2017 | 2016 | 2015 | 2014a | |||||||||||||
| Advisor Class | ||||||||||||||||
| Per share operating performance (for a share outstanding throughout the year) | ||||||||||||||||
Net asset value, beginning of year | $ | 10.58 | $ | 11.18 | $ | 10.65 | $ | 10.00 | ||||||||
|
| |||||||||||||||
| Income from investment operationsb: | ||||||||||||||||
Net investment income (loss)c | 0.04 | (0.02 | ) | (0.02 | ) | (0.02 | ) | |||||||||
Net realized and unrealized gains (losses) | 0.62 | (0.38 | ) | 0.64 | 0.71 | |||||||||||
|
| |||||||||||||||
Total from investment operations | 0.66 | (0.40 | ) | 0.62 | 0.69 | |||||||||||
|
| |||||||||||||||
| Less distributions from: | ||||||||||||||||
Net investment income | (0.08 | ) | (0.16 | ) | (0.09 | ) | (0.04 | ) | ||||||||
Net realized gains | — | (0.04 | ) | — | — | |||||||||||
|
| |||||||||||||||
Total distributions | (0.08 | ) | (0.20 | ) | (0.09 | ) | (0.04 | ) | ||||||||
|
| |||||||||||||||
Net asset value, end of year | $ | 11.16 | $ | 10.58 | $ | 11.18 | $ | 10.65 | ||||||||
|
| |||||||||||||||
Total returnd | 6.29% | (3.58)% | 5.88% | 6.92% | ||||||||||||
| Ratios to average net assetse | ||||||||||||||||
Expenses before waiver, payments by affiliates and expense reductionf | 2.82% | 2.96% | 3.07% | 3.21% | ||||||||||||
Expenses net of waiver, payments by affiliates and expense reductionf | 2.48% | 2.62% | g | 2.66% | g | 2.71% | ||||||||||
Expenses incurred in connection with securities sold short | 0.53% | 0.67% | 0.65% | 0.56% | ||||||||||||
Net investment income (loss) | 0.35% | (0.18)% | (0.62)% | (0.23)% | ||||||||||||
| Supplemental data | ||||||||||||||||
Net assets, end of year (000’s) | $674,828 | $722,216 | $329,139 | $54,593 | ||||||||||||
Portfolio turnover rate | 209.45% | 229.90% | 295.81% | 181.06% | ||||||||||||
aFor the period October 11, 2013 (commencement of operations) to May 31, 2014.
bThe amount shown for a share outstanding throughout the period may not correlate with the Consolidated Statement of Operations for the period due to the timing of sales and repurchases of the Fund’s shares in relation to income earned and/or fluctuating fair value of the investments of the Fund.
cBased on average daily shares outstanding.
dTotal return is not annualized for periods less than one year.
eRatios are annualized for periods less than one year.
fIncludes dividend and/or interest expense on securities sold short and security borrowing fees, if any. See below for the ratios of such expenses to average net assets for the periods presented. See Note 1(h).
gBenefit of expense reduction rounds to less than 0.01%.
| franklintempleton.com | The accompanying notes are an integral part of these financial statements. | Annual Report | 15 |
FRANKLIN ALTERNATIVE STRATEGIES FUNDS
Consolidated Statement of Investments, May 31, 2017
| Franklin K2 Alternative Strategies Fund | ||||||||||||||
| Country | Shares/Warrants | Value | ||||||||||||
| Common Stocks and Other Equity Interests 35.9% | ||||||||||||||
| Aerospace & Defense 0.5% | ||||||||||||||
Arconic Inc. | United States | 9,718 | $ | 266,953 | ||||||||||
| a | DigitalGlobe Inc. | United States | 98,397 | 3,065,067 | ||||||||||
Lockheed Martin Corp. | United States | 5,880 | 1,653,044 | |||||||||||
United Technologies Corp. | United States | 729 | 88,413 | |||||||||||
|
| |||||||||||||
| 5,073,477 | ||||||||||||||
|
| |||||||||||||
| Air Freight & Logistics 0.3% | ||||||||||||||
| b | FedEx Corp. | United States | 18,270 | 3,541,457 | ||||||||||
|
| |||||||||||||
| Airlines 0.4% | ||||||||||||||
Copa Holdings SA | Panama | 4,355 | 492,289 | |||||||||||
| b | Latam Airlines, ADR | Chile | 22,937 | 254,601 | ||||||||||
| b | Southwest Airlines Co. | United States | 13,565 | 815,121 | ||||||||||
| a,b | Spirit Airlines Inc. | United States | 34,420 | 1,827,702 | ||||||||||
| a,b | United Continental Holdings Inc. | United States | 8,708 | 693,766 | ||||||||||
|
| |||||||||||||
| 4,083,479 | ||||||||||||||
|
| |||||||||||||
| Auto Components 0.0%† | ||||||||||||||
Delphi Automotive PLC | United States | 476 | 41,874 | |||||||||||
|
| |||||||||||||
| Automobiles 0.2% | ||||||||||||||
| b | General Motors Co. | United States | 15,575 | 528,460 | ||||||||||
| b | Harley-Davidson Inc. | United States | 17,848 | 946,122 | ||||||||||
Thor Industries Inc. | United States | 12,332 | 1,116,416 | |||||||||||
|
| |||||||||||||
| 2,590,998 | ||||||||||||||
|
| |||||||||||||
| Banks 0.4% | ||||||||||||||
Barclays PLC, ADR | United Kingdom | 108,406 | 293,318 | |||||||||||
BB&T Corp. | United States | 1,683 | 70,097 | |||||||||||
Citigroup Inc. | United States | 46,605 | 2,821,467 | |||||||||||
| a | Israel Discount Bank Ltd. | Israel | 40,644 | 105,656 | ||||||||||
JPMorgan Chase & Co. | United States | 2,656 | 218,190 | |||||||||||
PNC Financial Services Group Inc. | United States | 794 | 94,248 | |||||||||||
Sberbank of Russia PJSC, ADR | Russia | 12,579 | 140,256 | |||||||||||
US Bancorp | United States | 1,774 | 90,279 | |||||||||||
Wells Fargo & Co. | United States | 2,088 | 106,780 | |||||||||||
|
| |||||||||||||
| 3,940,291 | ||||||||||||||
|
| |||||||||||||
| Beverages 0.6% | ||||||||||||||
| b | Brown-Forman Corp., B | United States | 8,527 | 442,978 | ||||||||||
Coca-Cola Co. | United States | 1,339 | 60,884 | |||||||||||
| b | Constellation Brands Inc., A | United States | 5,807 | 1,061,229 | ||||||||||
Davide Campari-Milano SpA | Italy | 368,714 | 2,578,376 | |||||||||||
Dr. Pepper Snapple Group Inc. | United States | 11,946 | 1,108,708 | |||||||||||
| a | Monster Beverage Corp. | United States | 26,681 | 1,348,992 | ||||||||||
PepsiCo Inc. | United States | 1,475 | 172,383 | |||||||||||
| c | Refresco Group NV, 144A | Netherlands | 18,845 | 372,268 | ||||||||||
|
| |||||||||||||
| 7,145,818 | ||||||||||||||
|
| |||||||||||||
| Biotechnology 2.5% | ||||||||||||||
| a | Actelion Ltd. | Switzerland | 390 | 110,733 | ||||||||||
| a | Actelion Ltd. (New Line) | Switzerland | 12,587 | 3,612,809 | ||||||||||
| a | Aeglea BioTherapeutics Inc. | United States | 13,829 | 58,358 | ||||||||||
| a | Agios Pharmaceuticals Inc. | United States | 2,859 | 133,430 | ||||||||||
| a | Alexion Pharmaceuticals Inc. | United States | 7,965 | 780,809 | ||||||||||
| 16 | Annual Report | franklintempleton.com |
FRANKLIN ALTERNATIVE STRATEGIES FUNDS
CONSOLIDATED STATEMENT OF INVESTMENTS
Franklin K2 Alternative Strategies Fund (continued)
| Country | Shares/Warrants | Value | ||||||||||||
| Common Stocks and Other Equity Interests (continued) | ||||||||||||||
| Biotechnology (continued) | ||||||||||||||
Alkermes PLC | United States | 7,054 | $ | 407,439 | ||||||||||
| a | Amicus Therapeutics Inc. | United States | 79,676 | 639,001 | ||||||||||
| a | Argenx SE, ADR | Netherlands | 2,340 | 48,789 | ||||||||||
| a | Audentes Therapeutics Inc. | United States | 16,211 | 231,331 | ||||||||||
| a | Avexis Inc. | United States | 3,345 | 236,659 | ||||||||||
| a | BioCryst Pharmaceuticals Inc. | United States | 31,921 | 164,393 | ||||||||||
| a | BioMarin Pharmaceutical Inc. | United States | 34,813 | 3,051,011 | ||||||||||
| a | Bluebird Bio Inc. | United States | 16,058 | 1,209,970 | ||||||||||
| a | Blueprint Medicines Corp. | United States | 2,815 | 101,002 | ||||||||||
| a | Cara Therapeutics Inc. | United States | 4,849 | 80,299 | ||||||||||
| a | Celgene Corp. | United States | 20,961 | 2,398,148 | ||||||||||
| a | Clovis Oncology Inc. | United States | 19,562 | 1,010,573 | ||||||||||
| a | Corvus Pharmaceuticals Inc. | United States | 14,167 | 143,937 | ||||||||||
| a | DBV Technologies SA, ADR | France | 8,052 | 267,326 | ||||||||||
| a | Epizyme Inc. | United States | 32,473 | 464,364 | ||||||||||
| a | Exelixis Inc. | United States | 44,879 | 839,686 | ||||||||||
| a | GlycoMimetics Inc. | United States | 25,681 | 325,892 | ||||||||||
| a | Incyte Corp. Ltd. | United States | 16,301 | 2,108,208 | ||||||||||
| a | Insmed Inc. | United States | 18,832 | 290,389 | ||||||||||
| a | Kite Pharma Inc. | United States | 10,484 | 758,203 | ||||||||||
| a | La Jolla Pharmaceutical Co. | United States | 13,841 | 395,853 | ||||||||||
| a | MacroGenics Inc. | United States | 3,993 | 70,876 | ||||||||||
| a | Natera Inc. | United States | 33,255 | 340,531 | ||||||||||
| a | Neurocrine Biosciences Inc. | United States | 7,112 | 309,159 | ||||||||||
| a | Otonomy Inc. | United States | 20,111 | 246,360 | ||||||||||
| a | OvaScience Inc. | United States | 29,527 | 37,795 | ||||||||||
| a | Ovid therapeutics Inc. | United States | 9,045 | 115,324 | ||||||||||
| a | ProQR Therapeutics NV | Netherlands | 37,569 | 184,088 | ||||||||||
| a | Proteostasis Therapeutics Inc. | United States | 32,992 | 130,648 | ||||||||||
| a | Prothena Corp. PLC | Ireland | 8,682 | 442,869 | ||||||||||
| a | Regeneron Pharmaceuticals Inc. | United States | 2,014 | 924,547 | ||||||||||
| a | Retrophin Inc. | United States | 12,435 | 197,095 | ||||||||||
| a | Sage Therapeutics Inc. | United States | 18,512 | 1,223,828 | ||||||||||
| a | Sarepta Therapeutics Inc. | United States | 10,290 | 307,054 | ||||||||||
| a,d | Savara Inc., wts., 6/14/18 | United States | 68,920 | 69 | ||||||||||
Shire PLC, ADR | United Kingdom | 6,697 | 1,156,706 | |||||||||||
| a | Syndax Pharmaceuticals Inc. | United States | 14,388 | 174,670 | ||||||||||
| a | Tesaro Inc. | United States | 5,354 | 799,406 | ||||||||||
| a | TG Therapeutics Inc. | United States | 21,809 | 245,351 | ||||||||||
| a | Ultragenyx Pharmaceutical Inc. | United States | 9,098 | 489,927 | ||||||||||
UroGen Pharma Ltd. | Israel | 3,366 | 60,083 | |||||||||||
| a | Vertex Pharmaceuticals Inc. | United States | 5,895 | 728,622 | ||||||||||
|
| |||||||||||||
| 28,053,620 | ||||||||||||||
|
| |||||||||||||
| Building Products 0.2% | ||||||||||||||
| b | AO Smith Corp. | United States | 6,066 | 332,841 | ||||||||||
Fortune Brands Home & Security Inc. | United States | 34,545 | 2,179,790 | |||||||||||
Johnson Controls International PLC | United States | 1,651 | 68,946 | |||||||||||
|
| |||||||||||||
| 2,581,577 | ||||||||||||||
|
| |||||||||||||
| Capital Markets 0.1% | ||||||||||||||
| b | Moody’s Corp. | United States | 10,529 | 1,247,160 | ||||||||||
|
| |||||||||||||
| franklintempleton.com | Annual Report | 17 |
FRANKLIN ALTERNATIVE STRATEGIES FUNDS
CONSOLIDATED STATEMENT OF INVESTMENTS
Franklin K2 Alternative Strategies Fund (continued)
| Country | Shares/Warrants | Value | ||||||||||||
| Common Stocks and Other Equity Interests (continued) | ||||||||||||||
| Chemicals 1.6% | ||||||||||||||
Clariant AG | Switzerland | 61,958 | $ | 1,296,669 | ||||||||||
Croda International PLC | United Kingdom | 21,384 | 1,091,889 | |||||||||||
| b | Dow Chemical Co. | United States | 11,326 | 701,759 | ||||||||||
E. I. du Pont de Nemours & Co. | United States | 588 | 46,405 | |||||||||||
Huntsman Corp. | United States | 931 | 22,251 | |||||||||||
| a,b | Ingevity Corp. | United States | 37,829 | 2,234,559 | ||||||||||
| b | Monsanto Co. | United States | 31,622 | 3,713,055 | ||||||||||
| b | Olin Corp. | United States | 4,001 | 117,389 | ||||||||||
PPG Industries Inc. | United States | 5,518 | 586,894 | |||||||||||
Praxair Inc. | United States | 12,958 | 1,714,214 | |||||||||||
| b | Sherwin-Williams Co. | United States | 15,353 | 5,093,665 | ||||||||||
Trinseo SA | United States | 627 | 40,410 | |||||||||||
Valspar Corp. | United States | 5,928 | 669,805 | |||||||||||
|
| |||||||||||||
| 17,328,964 | ||||||||||||||
|
| |||||||||||||
| Commercial Services & Supplies 0.2% | ||||||||||||||
| a | Atento SA | Spain | 81,313 | 841,590 | ||||||||||
Edenred | France | 37,687 | 994,047 | |||||||||||
|
| |||||||||||||
| 1,835,637 | ||||||||||||||
|
| |||||||||||||
| Communications Equipment 0.6% | ||||||||||||||
| a | Arista Networks Inc. | United States | 6,771 | 997,910 | ||||||||||
Brocade Communications Systems Inc. | United States | 212,622 | 2,685,416 | |||||||||||
| a | Lumentum Holdings Inc. | United States | 11,539 | 658,300 | ||||||||||
| a,b | Oclaro Inc. | United States | 118,282 | 1,050,344 | ||||||||||
| a | Quantenna Communications Inc. | United States | 30,830 | 589,469 | ||||||||||
Radware Ltd. | Israel | 20,124 | 354,384 | |||||||||||
Sandvine Corp. | Canada | 64,086 | 184,072 | |||||||||||
|
| |||||||||||||
| 6,519,895 | ||||||||||||||
|
| |||||||||||||
| Construction Materials 0.6% | ||||||||||||||
Buzzi Unicem SpA | Italy | 20,144 | 522,953 | |||||||||||
HeidelbergCement AG | Germany | 22,655 | 2,109,265 | |||||||||||
| b | Martin Marietta Materials Inc. | United States | 13,721 | 3,074,876 | ||||||||||
| a,b | Summit Materials Inc., A | United States | 27,160 | 729,518 | ||||||||||
|
| |||||||||||||
| 6,436,612 | ||||||||||||||
|
| |||||||||||||
| Consumer Finance 0.2% | ||||||||||||||
| d | iPayment Inc. | United States | 4,383,615 | 1,753,446 | ||||||||||
|
| |||||||||||||
| Containers & Packaging 0.4% | ||||||||||||||
| b | Ball Corp. | United States | 122,178 | 4,997,080 | ||||||||||
WestRock Co. | United States | 744 | 40,489 | |||||||||||
|
| |||||||||||||
| 5,037,569 | ||||||||||||||
|
| |||||||||||||
| Diversified Financial Services 0.3% | ||||||||||||||
| a | Berkshire Hathaway Inc., B | United States | 19,513 | 3,225,109 | ||||||||||
ECN Capital Corp. | Canada | 38,981 | 106,481 | |||||||||||
|
| |||||||||||||
| 3,331,590 | ||||||||||||||
|
| |||||||||||||
| Diversified Telecommunication Services 0.8% | ||||||||||||||
AT&T Inc. | United States | 14,360 | 553,291 | |||||||||||
CenturyLink Inc. | United States | 3,890 | 97,055 | |||||||||||
| a,b | Level 3 Communications Inc. | United States | 92,609 | 5,512,088 | ||||||||||
| 18 | Annual Report | franklintempleton.com |
FRANKLIN ALTERNATIVE STRATEGIES FUNDS
CONSOLIDATED STATEMENT OF INVESTMENTS
Franklin K2 Alternative Strategies Fund (continued)
| Country | Shares/Warrants | Value | ||||||||||||
| Common Stocks and Other Equity Interests (continued) | ||||||||||||||
| Diversified Telecommunication Services (continued) | ||||||||||||||
| a | ORBCOMM Inc. | United States | 16,093 | $ | 157,711 | |||||||||
| a,e | Straight Path Communications Inc., B | United States | 4,010 | 717,389 | ||||||||||
| a,e | Telecom Italia SpA | Italy | 207,695 | 194,352 | ||||||||||
Telecom Italia SpA, RSP | Italy | 2,281,032 | 1,759,095 | |||||||||||
Verizon Communications Inc. | United States | 2,496 | 116,413 | |||||||||||
|
| |||||||||||||
| 9,107,394 | ||||||||||||||
|
| |||||||||||||
| Electric Utilities 0.0%† | ||||||||||||||
Exelon Corp. | United States | 1,868 | 67,827 | |||||||||||
NextEra Energy Inc. | United States | 699 | 98,867 | |||||||||||
PG&E Corp. | United States | 1,025 | 70,089 | |||||||||||
|
| |||||||||||||
| 236,783 | ||||||||||||||
|
| |||||||||||||
| Electronic Equipment, Instruments & Components 0.5% | ||||||||||||||
Alps Electric Co. Ltd. | Japan | 23,600 | 662,718 | |||||||||||
Fabrinet | Thailand | 6,893 | 242,840 | |||||||||||
| a | Flex Ltd. | Singapore | 80,556 | 1,390,397 | ||||||||||
| a,b | Itron Inc. | United States | 29,148 | 1,971,862 | ||||||||||
Largan Precision Co. Ltd. | Taiwan | 2,650 | 418,481 | |||||||||||
Tongda Group Holdings Ltd. | Hong Kong | 3,310,000 | 942,978 | |||||||||||
| a,b | VeriFone Systems Inc. | United States | 18,482 | 338,036 | ||||||||||
|
| |||||||||||||
| 5,967,312 | ||||||||||||||
|
| |||||||||||||
| Energy Equipment & Services 0.0%† | ||||||||||||||
Halliburton Co. | United States | 2,214 | 100,051 | |||||||||||
|
| |||||||||||||
| Food & Staples Retailing 0.4% | ||||||||||||||
Casey’s General Stores Inc. | United States | 26,277 | 3,058,380 | |||||||||||
Costco Wholesale Corp. | United States | 7,338 | 1,323,995 | |||||||||||
|
| |||||||||||||
| 4,382,375 | ||||||||||||||
|
| |||||||||||||
| Food Products 0.9% | ||||||||||||||
AdvancePierre Foods Holdings Inc. | United States | 5,213 | 209,927 | |||||||||||
Lindt & Spruengli AG | Switzerland | 35 | 2,568,582 | |||||||||||
| b | Mead Johnson Nutrition Co. | United States | 75,001 | 6,706,589 | ||||||||||
Mondelez International Inc. | United States | 1,318 | 61,406 | |||||||||||
|
| |||||||||||||
| 9,546,504 | ||||||||||||||
|
| |||||||||||||
| Gas Utilities 0.1% | ||||||||||||||
| b | WGL Holdings Inc. | United States | 17,687 | 1,463,422 | ||||||||||
|
| |||||||||||||
| Health Care Equipment & Supplies 1.0% | ||||||||||||||
| a | Alere Inc. | United States | 11,121 | 539,480 | ||||||||||
| a | Boston Scientific Corp. | United States | 32,213 | 870,717 | ||||||||||
CR Bard Inc. | United States | 10,882 | 3,345,453 | |||||||||||
| b | DENTSPLY SIRONA Inc. | United States | 31,146 | 1,978,394 | ||||||||||
| a | DexCom Inc. | United States | 14,067 | 940,238 | ||||||||||
| a | Edwards Lifesciences Corp. | United States | 5,492 | 631,965 | ||||||||||
| a | GenMark Diagnostics Inc. | United States | 27,031 | 349,781 | ||||||||||
| a,b | IDEXX Laboratories Inc. | United States | 4,933 | 830,668 | ||||||||||
| a | iRhythm Technologies Inc. | United States | 1,485 | 51,500 | ||||||||||
Medtronic PLC | United States | 1,282 | 108,047 | |||||||||||
| a | Nevro Corp. | United States | 6,812 | 468,870 | ||||||||||
| franklintempleton.com | Annual Report | 19 |
FRANKLIN ALTERNATIVE STRATEGIES FUNDS
CONSOLIDATED STATEMENT OF INVESTMENTS
Franklin K2 Alternative Strategies Fund (continued)
| Country | Shares/Warrants | Value | ||||||||||||
| Common Stocks and Other Equity Interests (continued) | ||||||||||||||
| Health Care Equipment & Supplies (continued) | ||||||||||||||
Smith & Nephew PLC | United Kingdom | 72,763 | $ | 1,269,389 | ||||||||||
|
| |||||||||||||
| 11,384,502 | ||||||||||||||
|
| |||||||||||||
| Health Care Providers & Services 0.9% | ||||||||||||||
Aetna Inc. | United States | 8,255 | 1,195,819 | |||||||||||
Celesio AG | Germany | 61,856 | 1,840,692 | |||||||||||
| a | Centene Corp. | United States | 11,383 | 826,747 | ||||||||||
Cigna Corp. | United States | 8,876 | 1,431,078 | |||||||||||
Humana Inc. | United States | 8,283 | 1,923,810 | |||||||||||
UnitedHealth Group Inc. | United States | 17,423 | 3,052,161 | |||||||||||
| a | VCA Inc. | United States | 3,517 | 324,021 | ||||||||||
|
| |||||||||||||
| 10,594,328 | ||||||||||||||
|
| |||||||||||||
| Health Care Technology 0.0%† | ||||||||||||||
| a | Tabula Rasa HealthCare Inc. | United States | 4,863 | 64,435 | ||||||||||
|
| |||||||||||||
| Hotels, Restaurants & Leisure 0.6% | ||||||||||||||
| b | Brinker International Inc. | United States | 19,296 | 756,982 | ||||||||||
| b | Carnival Corp. | United States | 26,700 | 1,710,669 | ||||||||||
| b | Domino’s Pizza Inc. | United States | 8,935 | 1,891,718 | ||||||||||
Extended Stay America Inc. | United States | 36,127 | 657,512 | |||||||||||
Hilton Worldwide Holdings Inc. | United States | 1,490 | 99,040 | |||||||||||
McDonald’s Corp. | United States | 813 | 122,674 | |||||||||||
| a | Panera Bread Co., A | United States | 2,086 | 656,026 | ||||||||||
Starbucks Corp. | United States | 5,148 | 327,464 | |||||||||||
|
| |||||||||||||
| 6,222,085 | ||||||||||||||
|
| |||||||||||||
| Household Durables 0.3% | ||||||||||||||
Sony Corp. | Japan | 28,400 | 1,034,452 | |||||||||||
Whirlpool Corp. | United States | 15,486 | 2,873,273 | |||||||||||
|
| |||||||||||||
| 3,907,725 | ||||||||||||||
|
| |||||||||||||
| Household Products 0.0%† | ||||||||||||||
The Procter & Gamble Co. | United States | 1,131 | 99,630 | |||||||||||
|
| |||||||||||||
| Industrial Conglomerates 0.1% | ||||||||||||||
General Electric Co. | United States | 3,889 | 106,481 | |||||||||||
Honeywell International Inc. | United States | 820 | 109,052 | |||||||||||
Roper Technologies Inc. | United States | 501 | 113,827 | |||||||||||
Smiths Group PLC | United Kingdom | 17,888 | 369,454 | |||||||||||
|
| |||||||||||||
| 698,814 | ||||||||||||||
|
| |||||||||||||
| Insurance 0.3% | ||||||||||||||
Allied World Assurance Co. Holdings AG | United States | 20,292 | 1,066,751 | |||||||||||
Chubb Ltd. | United States | 630 | 90,210 | |||||||||||
MetLife Inc. | United States | 1,617 | 81,804 | |||||||||||
RSA Insurance Group PLC | United Kingdom | 44,331 | 357,273 | |||||||||||
| b | W.R. Berkley Corp. | United States | 19,975 | 1,378,075 | ||||||||||
|
| |||||||||||||
| 2,974,113 | ||||||||||||||
|
| |||||||||||||
| Internet & Direct Marketing Retail 1.0% | ||||||||||||||
| a,b | Amazon.com Inc. | United States | 1,994 | 1,983,272 | ||||||||||
| b | Expedia Inc. | United States | 12,813 | 1,842,253 | ||||||||||
| a,b | Liberty Interactive Corp. QVC Group, A | United States | 84,364 | 1,979,179 | ||||||||||
| a,b | Netflix Inc. | United States | 4,095 | 667,772 | ||||||||||
| 20 | Annual Report | franklintempleton.com |
FRANKLIN ALTERNATIVE STRATEGIES FUNDS
CONSOLIDATED STATEMENT OF INVESTMENTS
Franklin K2 Alternative Strategies Fund (continued)
| Country | Shares/Warrants | Value | ||||||||||||
| Common Stocks and Other Equity Interests (continued) | ||||||||||||||
| Internet & Direct Marketing Retail (continued) | ||||||||||||||
| a,b | Priceline Group Inc. | United States | 1,029 | $ | 1,931,526 | |||||||||
Rakuten Inc. | Japan | 54,000 | 656,289 | |||||||||||
| a,b | Wayfair Inc., A | United States | 32,358 | 2,036,936 | ||||||||||
|
| |||||||||||||
| 11,097,227 | ||||||||||||||
|
| |||||||||||||
| Internet Software & Services 1.6% | ||||||||||||||
| a | Akamai Technologies Inc. | United States | 13,818 | 651,519 | ||||||||||
| a,b | Alibaba Group Holding Ltd., ADR | China | 16,055 | 1,966,095 | ||||||||||
| a,b | Alphabet Inc., A | United States | 1,261 | 1,244,721 | ||||||||||
| a,b | Alphabet Inc., C | United States | 1,289 | 1,243,705 | ||||||||||
| a | Benefitfocus Inc. | United States | 11,353 | 361,025 | ||||||||||
| a,b | eBay Inc. | United States | 61,833 | 2,120,872 | ||||||||||
| a,b | Facebook Inc. | United States | 30,401 | 4,604,535 | ||||||||||
| a | GoDaddy Inc., A | United States | 19,100 | 785,774 | ||||||||||
| a | Just Eat PLC | United Kingdom | 113,837 | 984,906 | ||||||||||
| a,d | Pandora Media Inc. | United States | 2,175 | 19,358 | ||||||||||
SINA Corp. | China | 2,500 | 244,925 | |||||||||||
Tencent Holdings Ltd. | China | 25,900 | 889,419 | |||||||||||
| a | VeriSign Inc. | United States | 15,587 | 1,405,324 | ||||||||||
Yandex NV, A | Russia | 7,500 | 198,600 | |||||||||||
| a | Zillow Group Inc., A | United States | 8,117 | 356,255 | ||||||||||
| a,b | Zillow Group Inc., C | United States | 15,397 | 670,077 | ||||||||||
|
| |||||||||||||
| 17,747,110 | ||||||||||||||
|
| |||||||||||||
| IT Services 3.4% | ||||||||||||||
Accenture PLC, A | United States | 7,172 | 892,699 | |||||||||||
| b | Alliance Data Systems Corp. | United States | 11,099 | 2,676,302 | ||||||||||
| b | Automatic Data Processing Inc. | United States | 12,364 | 1,265,703 | ||||||||||
| a,b | Blackhawk Network Holdings Inc. | United States | 11,400 | 494,190 | ||||||||||
| b | Cardtronics PLC, A | United States | 11,767 | 403,020 | ||||||||||
| b | Cognizant Technology Solutions Corp., A | United States | 17,146 | 1,147,239 | ||||||||||
| a | Conduent Inc. | United States | 15,709 | 257,785 | ||||||||||
| a,b | EPAM Systems Inc. | United States | 17,129 | 1,436,780 | ||||||||||
| a,b | ExlService Holdings Inc. | United States | 36,502 | 1,911,610 | ||||||||||
| a | FleetCor Technologies Inc. | United States | 23,859 | 3,442,615 | ||||||||||
Genpact Ltd. | United States | 102,465 | 2,799,344 | |||||||||||
| b | Global Payments Inc. | United States | 46,688 | 4,277,087 | ||||||||||
| b | MasterCard Inc., A | United States | 32,766 | 4,026,286 | ||||||||||
| a,b | MoneyGram International Inc. | United States | 54,380 | 947,299 | ||||||||||
| a,c | Nets AS, 144A | Denmark | 12,085 | 242,377 | ||||||||||
| a,b | PayPal Holdings Inc. | United States | 74,326 | 3,880,560 | ||||||||||
| b | Total System Services Inc. | United States | 37,100 | 2,209,305 | ||||||||||
| a,b | Vantiv Inc., A | United States | 4,636 | 290,770 | ||||||||||
| b | Visa Inc., A | United States | 26,051 | 2,480,837 | ||||||||||
| a,b | WEX Inc. | United States | 23,018 | 2,351,519 | ||||||||||
| c | Worldpay Group PLC, 144A | United Kingdom | 92,257 | 369,204 | ||||||||||
|
| |||||||||||||
| 37,802,531 | ||||||||||||||
|
| |||||||||||||
| Life Sciences Tools & Services 0.4% | ||||||||||||||
| a | Genfit | France | 10,021 | 337,489 | ||||||||||
Gerresheimer AG | Germany | 23,831 | 2,040,997 | |||||||||||
| a | Illumina Inc. | United States | 7,574 | 1,343,325 | ||||||||||
| a,b | Mettler-Toledo International Inc. | United States | 1,664 | 969,796 | ||||||||||
| franklintempleton.com | Annual Report | 21 |
FRANKLIN ALTERNATIVE STRATEGIES FUNDS
CONSOLIDATED STATEMENT OF INVESTMENTS
Franklin K2 Alternative Strategies Fund (continued)
| Country | Shares/Warrants | Value | ||||||||||||
| Common Stocks and Other Equity Interests (continued) | ||||||||||||||
| Life Sciences Tools & Services (continued) | ||||||||||||||
| a | NanoString Technologies Inc. | United States | 5,354 | $ | 98,192 | |||||||||
|
| |||||||||||||
| 4,789,799 | ||||||||||||||
|
| |||||||||||||
| Machinery 0.6% | ||||||||||||||
Cummins Inc. | United States | 448 | 70,650 | |||||||||||
Dover Corp. | United States | 744 | 61,417 | |||||||||||
Mueller Water Products Inc. | United States | 15,177 | 169,679 | |||||||||||
| a,b | Navistar International Corp. | United States | 21,558 | 557,705 | ||||||||||
Timken Co. | United States | 37,388 | 1,725,456 | |||||||||||
| b | Trinity Industries Inc. | United States | 84,994 | 2,169,047 | ||||||||||
Xylem Inc. | United States | 32,447 | 1,691,787 | |||||||||||
|
| |||||||||||||
| 6,445,741 | ||||||||||||||
|
| |||||||||||||
| Marine 0.2% | ||||||||||||||
Irish Continental Group PLC | Ireland | 404,138 | 2,412,960 | |||||||||||
| a | Scorpio Bulkers Inc. | United States | 12,866 | 74,623 | ||||||||||
|
| |||||||||||||
| 2,487,583 | ||||||||||||||
|
| |||||||||||||
| Media 2.1% | ||||||||||||||
| a,b | Charter Communications Inc., A | United States | 3,751 | 1,296,158 | ||||||||||
Comcast Corp., A | United States | 26,625 | 1,109,996 | |||||||||||
| a | DISH Network Corp., A | United States | 5,350 | 341,169 | ||||||||||
Entertainment One Ltd. | Canada | 67,140 | 211,421 | |||||||||||
Grupo Televisa SAB, ADR | Mexico | 10,870 | 263,924 | |||||||||||
ITV PLC | United Kingdom | 293,248 | 739,420 | |||||||||||
| a | Liberty Braves Group, A | United States | 10,643 | 252,452 | ||||||||||
| a,b | Liberty Broadband Corp., C | United States | 9,528 | 849,612 | ||||||||||
| a | Liberty Global PLC LiLAC, C | United Kingdom | 3,003 | 62,943 | ||||||||||
| a | Liberty Global PLC, C | United Kingdom | 47,230 | 1,403,676 | ||||||||||
| a | Postmedia Network Canada Corp. | Canada | 666,338 | 251,569 | ||||||||||
Stroeer SE & Co. KGaA | Germany | 44,132 | 2,841,197 | |||||||||||
| b | Time Warner Inc. | United States | 72,096 | 7,172,831 | ||||||||||
Tribune Media Co., A | United States | 51,054 | 1,950,263 | |||||||||||
Viacom Inc., B | United States | 15,252 | 530,617 | |||||||||||
Vivendi SA | France | 113,967 | 2,471,532 | |||||||||||
Walt Disney Co. | United States | 18,197 | 1,964,184 | |||||||||||
|
| |||||||||||||
| 23,712,964 | ||||||||||||||
|
| |||||||||||||
| Metals & Mining 0.8% | ||||||||||||||
Boliden AB | Sweden | 38,128 | 1,043,635 | |||||||||||
Dominion Diamond Corp. | Canada | 116,106 | 1,497,768 | |||||||||||
First Quantum Minerals Ltd. | Canada | 156,135 | 1,316,488 | |||||||||||
Teck Resources Ltd. | Canada | 215,864 | 3,855,331 | |||||||||||
Voestalpine AG | Austria | 20,951 | 948,595 | |||||||||||
|
| |||||||||||||
| 8,661,817 | ||||||||||||||
|
| |||||||||||||
| Multi-Utilities 0.0%† | ||||||||||||||
Sempra Energy | United States | 452 | 52,653 | |||||||||||
|
| |||||||||||||
| Multiline Retail 0.0%† | ||||||||||||||
Nordstrom Inc. | United States | 3,890 | 162,602 | |||||||||||
|
| |||||||||||||
| Oil, Gas & Consumable Fuels 1.0% | ||||||||||||||
| a | Amyris Inc. | United States | 59,900 | 15,514 | ||||||||||
Anadarko Petroleum Corp. | United States | 5,381 | 271,902 | |||||||||||
| a | Bonanza Creek Energy Inc. | United States | 12,809 | 452,030 | ||||||||||
| 22 | Annual Report | franklintempleton.com |
FRANKLIN ALTERNATIVE STRATEGIES FUNDS
CONSOLIDATED STATEMENT OF INVESTMENTS
Franklin K2 Alternative Strategies Fund (continued)
| Country | Shares/Warrants | Value | ||||||||||||
| Common Stocks and Other Equity Interests (continued) | ||||||||||||||
| Oil, Gas & Consumable Fuels (continued) | ||||||||||||||
Canadian Natural Resources Ltd. | Canada | 1,920 | �� | $ | 55,411 | |||||||||
Chevron Corp. | United States | 1,204 | 124,590 | |||||||||||
Encana Corp. | Canada | 5,670 | 55,112 | |||||||||||
EQT Corp. | United States | 406 | 22,440 | |||||||||||
| a,d | Etablissements Maurel Et Prom, Contingent Value, rts., 12/31/17 | France | 131,406 | — | ||||||||||
Exxon Mobil Corp. | United States | 1,247 | 100,384 | |||||||||||
Golar LNG Ltd. | Bermuda | 1,386 | 32,245 | |||||||||||
| a | Halcon Resources Corp. | United States | 50,698 | 308,244 | ||||||||||
| a | Halcon Resources Corp., wts., 9/09/20 | United States | 2,159 | 1,835 | ||||||||||
| b | Hess Corp. | United States | 31,037 | 1,424,288 | ||||||||||
| a,d,f | Interoil Corp., Contingent Distribution | Singapore | 54,920 | 229,583 | ||||||||||
| a | Jagged Peak Energy Inc. | United States | 21,292 | 277,009 | ||||||||||
| a,b | Laredo Petroleum Inc. | United States | 21,319 | 250,498 | ||||||||||
Marathon Oil Corp. | United States | 19,784 | 257,588 | |||||||||||
Marathon Petroleum Corp. | United States | 37,300 | 1,941,092 | |||||||||||
| a | Pacific Exploration and Production Corp. | Colombia | 4,655 | 136,116 | ||||||||||
| a | Parsley Energy Inc., A | United States | 9,232 | 273,729 | ||||||||||
| a | PDC Energy Inc. | United States | 5,726 | 284,353 | ||||||||||
Phillips 66 | United States | 30,991 | 2,358,725 | |||||||||||
Valero Energy Corp. | United States | 322 | 19,793 | |||||||||||
| a | Whiting Petroleum Corp. | United States | 113,933 | 804,367 | ||||||||||
| b | Williams Cos Inc. | United States | 42,454 | 1,214,184 | ||||||||||
|
| |||||||||||||
| 10,911,032 | ||||||||||||||
|
| |||||||||||||
| Paper & Forest Products 0.4% | ||||||||||||||
| a | Canfor Corp. | Canada | 180,635 | 2,572,763 | ||||||||||
West Fraser Timber Co. Ltd. | Canada | 38,519 | 1,676,946 | |||||||||||
|
| |||||||||||||
| 4,249,709 | ||||||||||||||
|
| |||||||||||||
| Pharmaceuticals 1.3% | ||||||||||||||
| a | Aerie Pharmaceuticals Inc. | United States | 29,547 | 1,638,381 | ||||||||||
Allergan PLC | United States | 16,578 | 3,709,328 | |||||||||||
| a,d | Assembly Biosciences Inc. | United States | 29,400 | 747,054 | ||||||||||
AstraZeneca PLC, ADR | United Kingdom | 44,284 | 1,522,927 | |||||||||||
Bristol-Myers Squibb Co. | United States | 22,839 | 1,232,164 | |||||||||||
| a,c | Cassiopea SpA, 144A | Italy | 4,184 | 146,875 | ||||||||||
| a | Dermira Inc. | United States | 16,370 | 448,865 | ||||||||||
Eli Lilly & Co. | United States | 12,440 | 989,851 | |||||||||||
| a | GW Pharmaceuticals PLC, ADR | United Kingdom | 6,335 | 624,694 | ||||||||||
Hikma Pharmaceuticals PLC | Jordan | 10,168 | 221,143 | |||||||||||
Johnson & Johnson | United States | 939 | 120,427 | |||||||||||
| a | Ocular Therapeutix Inc. | United States | 42,865 | 437,223 | ||||||||||
| e | Pfizer Inc. | United States | 5,437 | 177,518 | ||||||||||
Stada Arzneimittel AG | Germany | 28,763 | 2,080,834 | |||||||||||
|
| |||||||||||||
| 14,097,284 | ||||||||||||||
|
| |||||||||||||
| Professional Services 0.7% | ||||||||||||||
| b | Equifax Inc. | United States | 8,711 | 1,191,665 | ||||||||||
Experian PLC | United Kingdom | 49,615 | 1,034,325 | |||||||||||
| a,b | Huron Consulting Group Inc. | United States | 17,239 | 716,280 | ||||||||||
| a,b | TransUnion | United States | 44,920 | 1,963,453 | ||||||||||
| a,b | TriNet Group Inc. | United States | 49,798 | 1,540,252 | ||||||||||
| franklintempleton.com | Annual Report | 23 |
FRANKLIN ALTERNATIVE STRATEGIES FUNDS
CONSOLIDATED STATEMENT OF INVESTMENTS
Franklin K2 Alternative Strategies Fund (continued)
| Country | Shares/Warrants | Value | ||||||||||||
| Common Stocks and Other Equity Interests (continued) | ||||||||||||||
| Professional Services (continued) | ||||||||||||||
| a,b | WageWorks Inc. | United States | 13,841 | $ | 979,251 | |||||||||
|
| |||||||||||||
| 7,425,226 | ||||||||||||||
|
| |||||||||||||
| Road & Rail 0.5% | ||||||||||||||
CSX Corp. | United States | 1,403 | 76,000 | |||||||||||
| b | Old Dominion Freight Line Inc. | United States | 14,853 | 1,326,670 | ||||||||||
| b | Union Pacific Corp. | United States | 35,207 | 3,883,332 | ||||||||||
|
| |||||||||||||
| 5,286,002 | ||||||||||||||
|
| |||||||||||||
| Semiconductors & Semiconductor Equipment 1.7% | ||||||||||||||
Broadcom Ltd. | United States | 2,770 | 663,360 | |||||||||||
| a | Cavium Inc. | United States | 6,924 | 505,244 | ||||||||||
Intel Corp. | United States | 17,220 | 621,814 | |||||||||||
| a | MACOM Technology Solutions Holdings Inc. | United States | 24,532 | 1,495,716 | ||||||||||
| a | MaxLinear Inc., A | United States | 9,900 | 308,385 | ||||||||||
| b | Microchip Technology Inc. | United States | 8,062 | 671,565 | ||||||||||
NVIDIA Corp. | United States | 5,055 | 729,689 | |||||||||||
| a,b | NXP Semiconductors NV | Netherlands | 85,342 | 9,379,086 | ||||||||||
| a | ON Semiconductor Corp. | United States | 8,194 | 126,843 | ||||||||||
QUALCOMM Inc. | United States | 47,773 | 2,735,960 | |||||||||||
| a | Semiconductor Manufacturing International Corp. | China | 216,000 | 227,571 | ||||||||||
| a | Siltronic AG | Germany | 1,617 | 144,899 | ||||||||||
Sumco Corp. | Japan | 20,800 | 343,881 | |||||||||||
Teradyne Inc. | United States | 1,734 | 61,644 | |||||||||||
Tower Semiconductor Ltd. | Israel | 31,800 | 806,448 | |||||||||||
|
| |||||||||||||
| 18,822,105 | ||||||||||||||
|
| |||||||||||||
| Software 2.1% | ||||||||||||||
Activision Blizzard Inc. | United States | 9,008 | 527,689 | |||||||||||
| a,b | Adobe Systems Inc. | United States | 5,015 | 711,428 | ||||||||||
Atlassian Corp. PLC | Australia | 17,000 | 607,920 | |||||||||||
Blackbaud Inc. | United States | 6,900 | 570,837 | |||||||||||
| a,b | Dell Technologies Inc., V | United States | 24,101 | 1,672,368 | ||||||||||
| a | Electronic Arts Inc. | United States | 1,000 | 113,330 | ||||||||||
Globant SA | United States | 16,700 | 653,972 | |||||||||||
| a,b | Guidewire Software Inc. | United States | 14,314 | 950,736 | ||||||||||
| a | HubSpot Inc. | United States | 13,004 | 937,588 | ||||||||||
| b | Intuit Inc. | United States | 5,000 | 703,200 | ||||||||||
| b | Microsoft Corp. | United States | 84,372 | 5,892,540 | ||||||||||
| b | Mobileye NV | Israel | 94,512 | 5,850,293 | ||||||||||
Nexon Co. Ltd. | Japan | 18,500 | 349,287 | |||||||||||
| a,b | Nintendo Co. Ltd., ADR | Japan | 25,500 | 964,665 | ||||||||||
| e | Oracle Corp. | United States | 3,960 | 179,744 | ||||||||||
| a | Proofpoint Inc. | United States | 2,860 | 245,960 | ||||||||||
| a,b | Salesforce.com Inc. | United States | 14,481 | 1,298,077 | ||||||||||
| a | ServiceNow Inc. | United States | 7,738 | 809,782 | ||||||||||
| a | Workday Inc., A | United States | 2,500 | 249,950 | ||||||||||
|
| |||||||||||||
| 23,289,366 | ||||||||||||||
|
| |||||||||||||
| Specialty Retail 1.3% | ||||||||||||||
| a,b | Autozone Inc. | United States | 2,429 | 1,471,780 | ||||||||||
| a,b | Cabela’s Inc. | United States | 47,769 | 2,523,636 | ||||||||||
| b | CST Brands Inc. | United States | 31,367 | 1,515,967 | ||||||||||
| 24 | Annual Report | franklintempleton.com |
FRANKLIN ALTERNATIVE STRATEGIES FUNDS
CONSOLIDATED STATEMENT OF INVESTMENTS
Franklin K2 Alternative Strategies Fund (continued)
| Country | Shares/Warrants | Value | ||||||||||||
| Common Stocks and Other Equity Interests (continued) | ||||||||||||||
| Specialty Retail (continued) | ||||||||||||||
| b | Foot Locker Inc. | United States | 18,615 | $ | 1,105,917 | |||||||||
| b | The Gap Inc. | United States | 37,477 | 843,233 | ||||||||||
Home Depot Inc. | United States | 31,086 | 4,772,012 | |||||||||||
| a,b | MarineMax Inc. | United States | 52,105 | 940,495 | ||||||||||
| a | O’Reilly Automotive Inc. | United States | 5,458 | 1,321,273 | ||||||||||
| a | Sports Direct International PLC | United Kingdom | 155,760 | 597,448 | ||||||||||
|
| |||||||||||||
| 15,091,761 | ||||||||||||||
|
| |||||||||||||
| Technology Hardware, Storage & Peripherals 0.2% | ||||||||||||||
| e | Apple Inc. | United States | 7,470 | 1,141,117 | ||||||||||
Seagate Technology PLC | United States | 13,058 | 568,937 | |||||||||||
Western Digital Corp. | United States | 10,099 | 909,516 | |||||||||||
|
| |||||||||||||
| 2,619,570 | ||||||||||||||
|
| |||||||||||||
| Textiles, Apparel & Luxury Goods 0.4% | ||||||||||||||
Coach Inc. | United States | 34,990 | 1,616,888 | |||||||||||
Hanesbrands Inc. | United States | 12,897 | 266,323 | |||||||||||
Michael Kors Holdings Ltd. | United States | 37,596 | 1,247,435 | |||||||||||
Moncler SpA | Italy | 19,901 | 484,676 | |||||||||||
NIKE Inc., B | United States | 25,558 | 1,354,319 | |||||||||||
|
| |||||||||||||
| 4,969,641 | ||||||||||||||
|
| |||||||||||||
| Tobacco 1.1% | ||||||||||||||
Altria Group Inc. | United States | 1,463 | 110,369 | |||||||||||
| e | Philip Morris International Inc. | United States | 1,076 | 128,905 | ||||||||||
| b | Reynolds American Inc. | United States | 171,233 | 11,515,419 | ||||||||||
|
| |||||||||||||
| 11,754,693 | ||||||||||||||
|
| |||||||||||||
| Trading Companies & Distributors 0.1% | ||||||||||||||
Brenntag AG | Germany | 13,005 | 752,376 | |||||||||||
|
| |||||||||||||
| Wireless Telecommunication Services 0.0%† | ||||||||||||||
NTT DoCoMo Inc. | Japan | 16,700 | 409,697 | |||||||||||
|
| |||||||||||||
Total Common Stocks and Other Equity Interests | 399,931,426 | |||||||||||||
|
| |||||||||||||
| Exchange Traded Funds (Cost $355,300) 0.0%† | ||||||||||||||
| e | Financial Select Sector SPDR Fund | United States | 14,825 | 344,681 | ||||||||||
|
| |||||||||||||
| Convertible Preferred Stocks 0.8% | ||||||||||||||
| Capital Markets 0.1% | ||||||||||||||
Virtus Investment Partners Inc., 7.25%, cvt. pfd. | United States | 6,217 | 581,849 | |||||||||||
|
| |||||||||||||
| Electronic Equipment, Instruments & Components 0.2% | ||||||||||||||
| g | Belden Inc., 6.75%, cvt. pfd. | United States | 871 | 86,952 | ||||||||||
MTS Systems Corp., 8.75%, cvt. pfd. | United States | 15,166 | 1,814,612 | |||||||||||
|
| |||||||||||||
| 1,901,564 | ||||||||||||||
|
| |||||||||||||
| Equity Real Estate Investment Trusts (REITs) 0.1% | ||||||||||||||
Welltower Inc., 6.50%, cvt. pfd., I | United States | 10,636 | 689,851 | |||||||||||
|
| |||||||||||||
| Health Care Equipment & Supplies 0.1% | ||||||||||||||
| a | Becton Dickinson and Co., 6.125%, cvt. pfd., A | United States | 19,376 | 1,036,810 | ||||||||||
|
| |||||||||||||
| Independent Power & Renewable Electricity Producers 0.0%† | ||||||||||||||
Dynegy Inc., 7.00%, cvt. pfd. | United States | 6,245 | 388,127 | |||||||||||
|
| |||||||||||||
| franklintempleton.com | Annual Report | 25 |
FRANKLIN ALTERNATIVE STRATEGIES FUNDS
CONSOLIDATED STATEMENT OF INVESTMENTS
Franklin K2 Alternative Strategies Fund (continued)
| Country | Shares/Warrants | Value | ||||||||||||
| Convertible Preferred Stocks (continued) | ||||||||||||||
| Internet Software & Services 0.3% | ||||||||||||||
| c | Mandatory Exchangeable Trust, 5.75%, cvt. pfd., 144A | China | 25,668 | $ | 3,676,042 | |||||||||
|
| |||||||||||||
Total Convertible Preferred Stocks (Cost $6,936,056) | 8,274,243 | |||||||||||||
|
| |||||||||||||
| Preferred Stocks 0.5% | ||||||||||||||
| Consumer Finance 0.3% | ||||||||||||||
| a,d | iPayment Inc., pfd. | United States | 28,073 | 2,807,316 | ||||||||||
|
| |||||||||||||
| Diversified Financial Services 0.0%† | ||||||||||||||
| a,d | Aergen Structured Investments Cayman Blocker LLC, pfd. | Ireland | 4,480 | 448,000 | ||||||||||
|
| |||||||||||||
| Diversified Telecommunication Services 0.0%† | ||||||||||||||
Iridium Communications Inc., 7.00%, pfd. | United States | 4,502 | 497,471 | |||||||||||
|
| |||||||||||||
| Food Products 0.0%† | ||||||||||||||
Bunge Ltd., 4.875%, pfd. | United States | 2,342 | 253,756 | |||||||||||
|
| |||||||||||||
| Oil, Gas & Consumable Fuels 0.1% | ||||||||||||||
WPX Energy Inc., 6.25%, pfd. | United States | 16,729 | 847,993 | |||||||||||
|
| |||||||||||||
| Pharmaceuticals 0.0%† | ||||||||||||||
Teva Pharmaceutical Industries Ltd., 7.00%, pfd. | Israel | 47 | 23,500 | |||||||||||
|
| |||||||||||||
| Technology Hardware, Storage & Peripherals 0.1% | ||||||||||||||
| a,h | NCR Corp., 5.50%, pfd., PIK | United States | 332 | 502,150 | ||||||||||
|
| |||||||||||||
Total Preferred Stocks (Cost $5,511,290) | 5,380,186 | |||||||||||||
|
| |||||||||||||
| Principal Amount* | ||||||||||||||
| Convertible Bonds 14.7% | ||||||||||||||
| Aerospace & Defense 0.2% | ||||||||||||||
| b,c | Aerojet Rocketdyne Holdings Inc., senior note, 144A, 2.25%, 12/15/23 | United States | 1,544,000 | 1,677,170 | ||||||||||
The KEYW Holding Corp., senior note, 2.50%, 7/15/19 | United States | 892,000 | 857,435 | |||||||||||
|
| |||||||||||||
| 2,534,605 | ||||||||||||||
|
| |||||||||||||
| Air Freight & Logistics 0.1% | ||||||||||||||
Atlas Air Worldwide Holdings Inc., senior note, | United States | 333,000 | 342,990 | |||||||||||
Atlas Air Worldwide Holdings Inc., senior note, | United States | 449,000 | 470,889 | |||||||||||
|
| |||||||||||||
| 813,879 | ||||||||||||||
|
| |||||||||||||
| Auto Components 0.1% | ||||||||||||||
Horizon Global Corp., senior note, 2.75%, 7/01/22 | United States | 1,073,000 | 1,026,727 | |||||||||||
|
| |||||||||||||
| Automobiles 0.3% | ||||||||||||||
Tesla Inc., senior note, 2.375%, 3/15/22 | United States | 1,851,000 | 2,205,004 | |||||||||||
| b | Tesla Motors Inc., senior note, 0.25%, 3/01/19 | United States | 673,000 | 740,720 | ||||||||||
|
| |||||||||||||
| 2,945,724 | ||||||||||||||
|
| |||||||||||||
| Biotechnology 1.2% | ||||||||||||||
Acorda Therapeutics Inc., senior note, 1.75%, 6/15/21 | United States | 728,000 | 566,475 | |||||||||||
AMAG Pharmaceuticals Inc., senior note, 3.25%, 6/01/22 | United States | 949,000 | 888,501 | |||||||||||
| b,c | Amicus Therapeutics Inc., senior note, 144A, 3.00%, 12/15/23 | United States | 963,000 | 1,414,406 | ||||||||||
| b | BioMarin Pharmaceutical Inc., senior sub. note, 1.50%, 10/15/20 | United States | 921,000 | 1,083,902 | ||||||||||
| b | Clovis Oncology Inc., senior note, 2.50%, 9/15/21 | United States | 1,106,000 | 1,279,504 | ||||||||||
| b | Emergent BioSolutions Inc., senior note, 2.875%, 1/15/21 | United States | 817,000 | 1,022,782 | ||||||||||
| c | Flexion Therapeutics Inc., senior note, 144A, 3.375%, 5/01/24 | United States | 926,000 | 879,700 | ||||||||||
Intercept Pharmaceuticals Inc., senior note, 3.25%, 7/01/23 | United States | 1,055,000 | 989,063 | |||||||||||
| 26 | Annual Report | franklintempleton.com |
FRANKLIN ALTERNATIVE STRATEGIES FUNDS
CONSOLIDATED STATEMENT OF INVESTMENTS
Franklin K2 Alternative Strategies Fund (continued)
| Country | Principal Amount* | Value | ||||||||||||
| Convertible Bonds (continued) | ||||||||||||||
| Biotechnology (continued) | ||||||||||||||
Ionis Pharmaceuticals Inc., senior note, 1.00%, 11/15/21 | United States | 235,000 | $ | 238,525 | ||||||||||
Ligand Pharmaceuticals Inc., senior note, 0.75%, 8/15/19 | United States | 1,203,000 | 1,817,282 | |||||||||||
| b,c | Neurocrine Biosciences Inc., senior note, 144A, 2.25%, 5/15/24 | United States | 1,798,000 | 1,748,555 | ||||||||||
| b | PDL BioPharma Inc., senior note, 2.75%, 12/01/21 | United States | 743,000 | 657,555 | ||||||||||
PTC Therapeutics Inc., senior note, 3.00%, 8/15/22 | United States | 599,000 | 425,664 | |||||||||||
|
| |||||||||||||
| 13,011,914 | ||||||||||||||
|
| |||||||||||||
| Capital Markets 0.6% | ||||||||||||||
Ares Capital Corp., senior note, | ||||||||||||||
4.75%, 1/15/18 | United States | 1,713,000 | 1,744,048 | |||||||||||
c 144A, 3.75%, 2/01/22 | United States | 1,421,000 | 1,423,664 | |||||||||||
| b | Cowen Group Inc., senior note, 3.00%, 3/15/19 | United States | 699,000 | 708,174 | ||||||||||
FXCM Inc., senior note, 2.25%, 6/15/18 | United States | 539,000 | 233,118 | |||||||||||
| c | Hercules Capital Inc., senior note, 144A, 4.375%, 2/01/22 | United States | 564,000 | 573,870 | ||||||||||
Prospect Capital Corp., senior note, 4.95%, 7/15/22 | United States | 899,000 | 885,515 | |||||||||||
| c | TCP Capital Corp., senior note, 144A, 4.625%, 3/01/22 | United States | 844,000 | 860,880 | ||||||||||
|
| |||||||||||||
| 6,429,269 | ||||||||||||||
|
| |||||||||||||
| Commercial Services & Supplies 0.1% | ||||||||||||||
RWT Holdings Inc., senior note, 5.625%, 11/15/19 | United States | 854,000 | 888,694 | |||||||||||
|
| |||||||||||||
| Communications Equipment 0.4% | ||||||||||||||
| b | Ciena Corp., senior note, 4.00%, 12/15/20 | United States | 568,000 | 782,775 | ||||||||||
| c | Finisar Corp., senior bond, 144A, 0.50%, 12/15/36 | United States | 165,000 | 157,678 | ||||||||||
| b | InterDigital Inc., senior note, 1.50%, 3/01/20 | United States | 2,355,000 | 2,940,806 | ||||||||||
| c | Viavi Solutions Inc., senior note, 144A, 1.00%, 3/01/24 | United States | 936,000 | 1,013,805 | ||||||||||
|
| |||||||||||||
| 4,895,064 | ||||||||||||||
|
| |||||||||||||
| Construction & Engineering 0.1% | ||||||||||||||
Dycom Industries Inc., senior note, 0.75%, 9/15/21 | United States | 751,000 | 845,344 | |||||||||||
| i | Mirait Holdings Corp., senior note, Reg S, zero cpn., 12/30/21 | Japan | 30,000,000 | JPY | 287,133 | |||||||||
| c | Tutor Perini Corp., senior note, 144A, 2.875%, 6/15/21 | United States | 415,000 | 468,691 | ||||||||||
|
| |||||||||||||
| 1,601,168 | ||||||||||||||
|
| |||||||||||||
| Construction Materials 0.2% | ||||||||||||||
| b | Cemex SAB de CV, sub. note, | |||||||||||||
3.75%, 3/15/18 | Mexico | 932,000 | 1,047,335 | |||||||||||
3.72%, 3/15/20 | Mexico | 1,134,000 | 1,255,905 | |||||||||||
|
| |||||||||||||
| 2,303,240 | ||||||||||||||
|
| |||||||||||||
| Consumer Finance 0.4% | ||||||||||||||
| b | Encore Capital Group Inc., senior note, |
| ||||||||||||
3.00%, 11/27/17 | United States | 241,000 | 286,489 | |||||||||||
c 144A, 3.25%, 3/15/22 | United States | 1,357,000 | 1,378,203 | |||||||||||
PRA Group Inc., senior note, | ||||||||||||||
b 3.00%, 8/01/20 | United States | 1,247,000 | 1,177,636 | |||||||||||
c 144A, 3.50%, 6/01/23 | United States | 1,226,000 | 1,232,896 | |||||||||||
|
| |||||||||||||
| 4,075,224 | ||||||||||||||
|
| |||||||||||||
| Diversified Consumer Services 0.1% | ||||||||||||||
| b | Carriage Services Inc., sub. note, 2.75%, 3/15/21 | United States | 504,000 | 644,490 | ||||||||||
|
| |||||||||||||
| franklintempleton.com | Annual Report | 27 |
FRANKLIN ALTERNATIVE STRATEGIES FUNDS
CONSOLIDATED STATEMENT OF INVESTMENTS
Franklin K2 Alternative Strategies Fund (continued)
| Country | Principal Amount* | Value | ||||||||||||
| Convertible Bonds (continued) | ||||||||||||||
| Diversified Financial Services 0.1% | ||||||||||||||
| c | Element Financial Corp., sub. note, 144A, | |||||||||||||
5.125%, 6/30/19 | Canada | 851,000 | CAD | $ | 634,698 | |||||||||
4.25%, 6/30/20 | Canada | 1,368,000 | CAD | 977,353 | ||||||||||
|
| |||||||||||||
| 1,612,051 | ||||||||||||||
|
| |||||||||||||
| Electrical Equipment 0.0%† | ||||||||||||||
| b | General Cable Corp., sub. bond, 4.50%, 11/15/29 | United States | 406,000 | 307,799 | ||||||||||
|
| |||||||||||||
| Electronic Equipment, Instruments & Components 0.6% | ||||||||||||||
| b | Knowles Corp., senior note, 3.25%, 11/01/21 | United States | 1,022,000 | 1,211,070 | ||||||||||
| c | OSI Systems Inc., senior note, 144A, 1.25%, 9/01/22 | United States | 696,000 | 699,045 | ||||||||||
| b | TTM Technologies Inc., senior note, 1.75%, 12/15/20 | United States | 843,000 | 1,498,959 | ||||||||||
| b | Vishay Intertechnology Inc., senior bond, 2.25%, 11/15/40 | United States | 2,892,000 | 3,732,488 | ||||||||||
|
| |||||||||||||
| 7,141,562 | ||||||||||||||
|
| |||||||||||||
| Energy Equipment & Services 0.3% | ||||||||||||||
| c | Ensco Jersey Finance Ltd., senior note, 144A, 3.00%, 1/31/24 | United States | 635,000 | 536,575 | ||||||||||
| c | Nabors Industries Inc., senior note, 144A, 0.75%, 1/15/24 | United States | 927,000 | 764,775 | ||||||||||
SEACOR Holdings Inc., senior bond, | ||||||||||||||
2.50%, 12/15/27 | United States | 628,000 | 629,178 | |||||||||||
3.00%, 11/15/28 | United States | 1,030,000 | 905,112 | |||||||||||
Weatherford International Ltd., senior note, 5.875%, 7/01/21 | United States | 731,000 | 808,669 | |||||||||||
|
| |||||||||||||
| 3,644,309 | ||||||||||||||
|
| |||||||||||||
| Equity Real Estate Investment Trusts (REITs) 1.0% | ||||||||||||||
| b,c | American Residential Properties Inc., senior note, 144A, 3.25%, 11/15/18 | United States | 963,000 | 1,253,706 | ||||||||||
| b,c | Colony Starwood Homes, senior note, 144A, 3.50%, 1/15/22 | United States | 1,258,000 | 1,349,991 | ||||||||||
| b,c | Empire State Realty OP LP, senior note, 144A, 2.625%, 8/15/19 | United States | 2,301,000 | 2,618,826 | ||||||||||
| b | Forest City Enterprises Inc., senior note, 3.625%, 8/15/20 | United States | 1,453,000 | 1,591,035 | ||||||||||
Forest City Realty Trust Inc., senior note, 4.25%, 8/15/18 | United States | 624,000 | 712,140 | |||||||||||
| b | National Health Investors Inc., senior note, 3.25%, 4/01/21 | United States | 1,686,000 | 1,911,502 | ||||||||||
| b | Starwood Waypoint Residential Trust, senior note, 3.00%, 7/01/19 | United States | 1,059,000 | 1,265,505 | ||||||||||
|
| |||||||||||||
| 10,702,705 | ||||||||||||||
|
| |||||||||||||
| Health Care Equipment & Supplies 0.6% | ||||||||||||||
| c | DexCom Inc., senior note, 144A, 0.75%, 5/15/22 | United States | 755,000 | 739,900 | ||||||||||
Hologic Inc., senior bond, zero cpn., 12/15/43 | United States | 549,000 | 682,476 | |||||||||||
| b,c | Insulet Corp., senior note, 144A, 1.25%, 9/15/21 | United States | 782,000 | 777,113 | ||||||||||
| i | Nipro Corp., senior note, Reg S, zero cpn., 1/29/21 | Japan | 40,000,000 | JPY | 431,603 | |||||||||
| b | NuVasive Inc., senior note, 2.25%, 3/15/21 | United States | 685,000 | 936,737 | ||||||||||
Quidel Corp., senior note, 3.25%, 12/15/20 | United States | 1,041,000 | 1,108,014 | |||||||||||
| b | Wright Medical Group Inc., senior note, 2.00%, 2/15/20 | United States | 1,069,000 | 1,172,559 | ||||||||||
| b | Wright Medical Group NV, senior note, 2.25%, 11/15/21 | United States | 883,000 | 1,224,611 | ||||||||||
|
| |||||||||||||
| 7,073,013 | ||||||||||||||
|
| |||||||||||||
| Health Care Providers & Services 0.2% | ||||||||||||||
Brookdale Senior Living Inc., senior note, 2.75%, 6/15/18 | United States | 384,000 | 381,120 | |||||||||||
| b | HealthSouth Corp., senior bond, 2.00%, 12/01/43 | United States | 315,000 | 399,262 | ||||||||||
| b | Healthways Inc., senior note, 1.50%, 7/01/18 | United States | 815,000 | 1,427,269 | ||||||||||
|
| |||||||||||||
| 2,207,651 | ||||||||||||||
|
| |||||||||||||
| Health Care Technology 0.2% | ||||||||||||||
| b | Allscripts Healthcare Solutions Inc., senior note, 1.25%, 7/01/20 | United States | 1,020,000 | 997,687 | ||||||||||
| 28 | Annual Report | franklintempleton.com |
FRANKLIN ALTERNATIVE STRATEGIES FUNDS
CONSOLIDATED STATEMENT OF INVESTMENTS
Franklin K2 Alternative Strategies Fund (continued)
| Country | Principal Amount* | Value | ||||||||||||
| Convertible Bonds (continued) | ||||||||||||||
| Health Care Technology (continued) | ||||||||||||||
| c | Evolent Health Inc., senior note, 144A, 2.00%, 12/01/21 | United States | 50,000 | $ | 61,375 | |||||||||
Medidata Solutions Inc., senior note, 1.00%, 8/01/18 | United States | 830,000 | 1,075,369 | |||||||||||
|
| |||||||||||||
| 2,134,431 | ||||||||||||||
|
| |||||||||||||
| Household Durables 0.1% | ||||||||||||||
KB Home, senior note, 1.375%, 2/01/19 | United States | 150,000 | 156,000 | |||||||||||
| b | LGI Homes Inc., senior sub. note, 4.25%, 11/15/19 | United States | 621,000 | 992,824 | ||||||||||
|
| |||||||||||||
| 1,148,824 | ||||||||||||||
|
| |||||||||||||
| Independent Power & Renewable Electricity Producers 0.0%† | ||||||||||||||
| b | Pattern Energy Group Inc., senior note, 4.00%, 7/15/20 | United States | 209,000 | 213,572 | ||||||||||
|
| |||||||||||||
| Insurance 0.1% | ||||||||||||||
| b | AmTrust Financial Services Inc., senior bond, 2.75%, 12/15/44 | United States | 850,000 | 609,344 | ||||||||||
| c | HCI Group Inc., senior bond, 144A, 4.25%, 3/01/37 | United States | 241,000 | 230,004 | ||||||||||
|
| |||||||||||||
| 839,348 | ||||||||||||||
|
| |||||||||||||
| Internet & Direct Marketing Retail 0.1% | ||||||||||||||
| b | Shutterfly Inc., senior note, 0.25%, 5/15/18 | United States | 1,226,000 | 1,239,026 | ||||||||||
|
| |||||||||||||
| Internet Software & Services 1.3% | ||||||||||||||
| c | Carbonite Inc., senior note, 144A, 2.50%, 4/01/22 | United States | 816,000 | 836,400 | ||||||||||
| b | Cornerstone OnDemand Inc., senior note, 1.50%, 7/01/18 | United States | 300,000 | 305,437 | ||||||||||
j2 Global Inc., senior bond, 3.25%, 6/15/29 | United States | 1,422,000 | 1,945,474 | |||||||||||
Twitter Inc., senior note, | ||||||||||||||
0.25%, 9/15/19 | United States | 828,000 | 785,565 | |||||||||||
b 1.00%, 9/15/21 | United States | 1,878,000 | 1,731,281 | |||||||||||
WebMD Health Corp., senior note, | ||||||||||||||
2.50%, 1/31/18 | United States | 1,019,000 | 1,051,481 | |||||||||||
b 1.50%, 12/01/20 | United States | 1,048,000 | 1,297,555 | |||||||||||
c 144A, 2.625%, 6/15/23 | United States | 950,000 | 922,094 | |||||||||||
Yahoo! Inc., zero cpn., 12/01/18 | United States | 3,712,000 | 3,971,840 | |||||||||||
| b,c | Zillow Group Inc., senior note, 144A, 2.00%, 12/01/21 | United States | 1,032,000 | 1,148,100 | ||||||||||
|
| |||||||||||||
| 13,995,227 | ||||||||||||||
|
| |||||||||||||
| IT Services 0.3% | ||||||||||||||
| c | Blackhawk Network Holdings Inc., senior note, 144A, 1.50%, 1/15/22 | United States | 617,000 | 690,654 | ||||||||||
Cardtronics Inc., senior note, 1.00%, 12/01/20 | United States | 1,070,000 | 1,036,563 | |||||||||||
| b | CSG Systems International Inc., senior bond, 4.25%, 3/15/36 | United States | 1,198,000 | 1,276,619 | ||||||||||
| c | Square Inc., senior note, 144A, 0.375%, 3/01/22 | United States | 302,000 | 363,910 | ||||||||||
|
| |||||||||||||
| 3,367,746 | ||||||||||||||
|
| |||||||||||||
| Life Sciences Tools & Services 0.2% | ||||||||||||||
Albany Molecular Research Inc., senior note, 2.25%, 11/15/18 | United States | 1,728,000 | 2,326,320 | |||||||||||
Fluidigm Corp., senior bond, 2.75%, 2/01/34 | United States | 521,000 | 356,885 | |||||||||||
|
| |||||||||||||
| 2,683,205 | ||||||||||||||
|
| |||||||||||||
| Machinery 0.2% | ||||||||||||||
| b,c | Greenbrier Cos Inc., senior note, 144A, 2.875%, 2/01/24 | United States | 1,089,000 | 1,150,256 | ||||||||||
Navistar International Corp., senior sub. note, | ||||||||||||||
4.50%, 10/15/18 | United States | 159,000 | 157,708 | |||||||||||
b 4.75%, 4/15/19 | United States | 1,344,000 | 1,308,720 | |||||||||||
|
| |||||||||||||
| 2,616,684 | ||||||||||||||
|
| |||||||||||||
| franklintempleton.com | Annual Report | 29 |
FRANKLIN ALTERNATIVE STRATEGIES FUNDS
CONSOLIDATED STATEMENT OF INVESTMENTS
Franklin K2 Alternative Strategies Fund (continued)
| Country | Principal Amount* | Value | ||||||||||||
| Convertible Bonds (continued) | ||||||||||||||
| Media 1.2% | ||||||||||||||
| b,c | DISH Network Corp., senior note, 144A, 2.375%, 3/15/24 | United States | 2,907,000 | $ | 3,046,900 | |||||||||
| b,c | DISH Network Corp., A, senior bond, 144A, 3.375%, 8/15/26 | United States | 4,498,000 | 5,490,371 | ||||||||||
Liberty Interactive LLC, senior bond, | ||||||||||||||
4.00%, 11/15/29 | United States | 1,122,000 | 718,080 | |||||||||||
c 144A, 1.75%, 9/30/46 | United States | 317,000 | 370,296 | |||||||||||
Liberty Media Corp., | ||||||||||||||
b senior bond, 1.375%, 10/15/23 | United States | 1,099,000 | 1,291,215 | |||||||||||
c senior bond, 144A, 2.25%, 9/30/46 | United States | 397,000 | 430,249 | |||||||||||
c senior note, 144A, 1.00%, 1/30/23 | United States | 261,000 | 287,426 | |||||||||||
| c | World Wrestling Entertainment Inc., senior note, 144A, 3.375%, 12/15/23 | United States | 1,561,000 | 1,659,538 | ||||||||||
|
| |||||||||||||
| 13,294,075 | ||||||||||||||
|
| |||||||||||||
| Metals & Mining 0.2% | ||||||||||||||
| b | AK Steel Corp., senior note, 5.00%, 11/15/19 | United States | 957,000 | 1,355,351 | ||||||||||
| c | Pretium Resources Inc., senior sub. note, 144A, 2.25%, 3/15/22 | Canada | 414,000 | 377,258 | ||||||||||
RTI International Metals Inc., senior note, 1.625%, 10/15/19 | United States | 240,000 | 283,800 | |||||||||||
|
| |||||||||||||
| 2,016,409 | ||||||||||||||
|
| |||||||||||||
| Mortgage Real Estate Investment Trusts (REITs) 0.8% | ||||||||||||||
Apollo Commercial Real Estate Finance Inc., senior note, 5.50%, 3/15/19 | United States | 346,000 | 376,277 | |||||||||||
Blackstone Mortgage Trust Inc., senior note, | ||||||||||||||
5.25%, 12/01/18 | United States | 858,000 | 973,830 | |||||||||||
4.375%, 5/05/22 | United States | 596,000 | 597,862 | |||||||||||
| b | Colony Capital Inc., senior note, 3.875%, 1/15/21 | United States | 1,666,000 | 1,702,444 | ||||||||||
New York Mortgage Trust Inc., senior note, 6.25%, 1/15/22 | United States | 282,000 | 279,180 | |||||||||||
| b | Redwood Trust Inc., senior note, 4.625%, 4/15/18 | United States | 1,040,000 | 1,055,600 | ||||||||||
Starwood Property Trust Inc., senior note, | ||||||||||||||
b 3.75%, 10/15/17 | United States | 2,296,000 | 2,313,220 | |||||||||||
4.375%, 4/01/23 | United States | 986,000 | 984,151 | |||||||||||
Two Harbors Investment Corp., senior note, 6.25%, 1/15/22 | United States | 733,000 | 765,985 | |||||||||||
|
| |||||||||||||
| 9,048,549 | ||||||||||||||
|
| |||||||||||||
| Oil, Gas & Consumable Fuels 0.6% | ||||||||||||||
| b | Aegean Marine Petroleum Network Inc., senior note, | |||||||||||||
4.00%, 11/01/18 | Greece | 692,000 | 649,615 | |||||||||||
c 144A, 4.25%, 12/15/21 | Greece | 2,560,000 | 1,851,200 | |||||||||||
| b,c | Chesapeake Energy Corp., senior note, 144A, 5.50%, 9/15/26 | United States | 699,000 | 677,593 | ||||||||||
| b | DHT Holdings Inc., senior note, 4.50%, 10/01/19 | United States | 407,000 | 403,184 | ||||||||||
| c | Golar LNG Ltd., senior note, 144A, 2.75%, 2/15/22 | Bermuda | 540,000 | 502,875 | ||||||||||
| b | Green Plains Inc., senior note, | |||||||||||||
3.25%, 10/01/18 | United States | 1,251,000 | 1,552,022 | |||||||||||
c 144A, 4.125%, 9/01/22 | United States | 1,201,000 | 1,247,539 | |||||||||||
Whiting Petroleum Corp., senior note, 1.25%, 4/01/20 | United States | 25,000 | 21,953 | |||||||||||
|
| |||||||||||||
| 6,905,981 | ||||||||||||||
|
| |||||||||||||
| Personal Products 0.1% | ||||||||||||||
Herbalife Ltd., senior note, 2.00%, 8/15/19 | United States | 771,000 | 803,771 | |||||||||||
|
| |||||||||||||
| Pharmaceuticals 0.4% | ||||||||||||||
Depomed Inc., senior note, 2.50%, 9/01/21 | United States | 622,000 | 548,138 | |||||||||||
Impax Laboratories Inc., senior note, 2.00%, 6/15/22 | United States | 260,000 | 223,925 | |||||||||||
| b,c | Medicines Co., senior note, 144A, 2.75%, 7/15/23 | United States | 876,000 | 938,415 | ||||||||||
| 30 | Annual Report | franklintempleton.com |
FRANKLIN ALTERNATIVE STRATEGIES FUNDS
CONSOLIDATED STATEMENT OF INVESTMENTS
Franklin K2 Alternative Strategies Fund (continued)
| Country | Principal Amount* | Value | ||||||||||||
| Convertible Bonds (continued) | ||||||||||||||
| Pharmaceuticals (continued) | ||||||||||||||
| c | Pacira Pharmaceuticals Inc., senior note, 144A, 2.375%, 4/01/22 | United States | 524,000 | $ | 537,428 | |||||||||
| c | Sucampo Pharmaceuticals Inc., senior note, 144A, 3.25%, 12/15/21 | United States | 1,018,000 | 972,826 | ||||||||||
Theravance Inc., senior note, 2.125%, 1/15/23 | United States | 1,531,000 | 1,389,382 | |||||||||||
|
| |||||||||||||
| 4,610,114 | ||||||||||||||
|
| |||||||||||||
| Professional Services 0.1% | ||||||||||||||
| b | 51job Inc., senior note, 3.25%, 4/15/19 | China | 714,000 | 824,670 | ||||||||||
|
| |||||||||||||
| Real Estate Management & Development 0.0%† | ||||||||||||||
| i | Immofinanz AG, senior note, Reg S, 2.00%, 1/24/24 | Austria | 300,000 | EUR | 375,762 | |||||||||
|
| |||||||||||||
| Semiconductors & Semiconductor Equipment 0.9% | ||||||||||||||
| b,c | Cypress Semiconductor Corp., senior note, 144A, 4.50%, 1/15/22 | United States | 961,000 | 1,186,234 | ||||||||||
| c | Inphi Corp., senior note, 144A, 0.75%, 9/01/21 | United States | 903,000 | 909,208 | ||||||||||
| b | Intel Corp., junior sub. bond, 3.25%, 8/01/39 | United States | 823,000 | 1,444,884 | ||||||||||
Microchip Technology Inc., | ||||||||||||||
c junior sub. bond, 144A, 2.25%, 2/15/37 | United States | 1,279,000 | 1,446,869 | |||||||||||
senior sub. bond, 1.625%, 2/15/25 | United States | 1,905,000 | 3,089,672 | |||||||||||
b,c senior sub. bond, 144A, 1.625%, 2/15/27 | United States | 1,104,000 | 1,223,370 | |||||||||||
| c | ON Semiconductor Corp., senior note, 144A, 1.625%, 10/15/23 | United States | 604,000 | 628,160 | ||||||||||
| c | Silicon Laboratories Inc., senior note, 144A, 1.375%, 3/01/22 | United States | 636,000 | 686,880 | ||||||||||
|
| |||||||||||||
| 10,615,277 | ||||||||||||||
|
| |||||||||||||
| Software 0.9% | ||||||||||||||
Bottomline Technologies de Inc., senior note, 1.50%, 12/01/17 | United States | 899,000 | 911,923 | |||||||||||
BroadSoft Inc., senior note, 1.00%, 9/01/22 | United States | 1,525,000 | 1,822,375 | |||||||||||
| b | Citrix Systems Inc., senior note, 0.50%, 4/15/19 | United States | 1,113,000 | 1,377,337 | ||||||||||
FireEye Inc., senior bond, 1.625%, 6/01/35 | United States | 590,000 | 538,375 | |||||||||||
| c | HubSpot Inc., senior note, 144A, 0.25%, 6/01/22 | United States | 483,000 | 486,924 | ||||||||||
Nuance Communications Inc., | ||||||||||||||
senior bond, 1.00%, 12/15/35 | United States | 75,000 | 73,313 | |||||||||||
c senior note, 144A, 1.25%, 4/01/25 | United States | 544,000 | 569,840 | |||||||||||
| c | RealPage Inc., senior note, 144A, 1.50%, 11/15/22 | United States | 701,000 | 734,298 | ||||||||||
Rovi Corp., senior note, 0.50%, 3/01/20 | United States | 603,000 | 586,041 | |||||||||||
ServiceNow Inc., senior note, zero cpn., | ||||||||||||||
b 11/01/18 | United States | 1,037,000 | 1,503,002 | |||||||||||
c 144A, 6/01/22 | United States | 976,000 | 986,980 | |||||||||||
|
| |||||||||||||
| 9,590,408 | ||||||||||||||
|
| |||||||||||||
| Textiles, Apparel & Luxury Goods 0.1% | ||||||||||||||
Iconix Brand Group Inc., senior sub. note, 1.50%, 3/15/18 | United States | 600,000 | 584,250 | |||||||||||
|
| |||||||||||||
| Thrifts & Mortgage Finance 0.0%† | ||||||||||||||
| c | LendingTree Inc., senior note, 144A, 0.625%, 6/01/22 | United States | 357,000 | 364,586 | ||||||||||
|
| |||||||||||||
| Trading Companies & Distributors 0.1% | ||||||||||||||
| c | Kaman Corp., senior note, 144A, 3.25%, 5/01/24 | United States | 1,143,000 | 1,141,571 | ||||||||||
|
| |||||||||||||
| Transportation Infrastructure 0.2% | ||||||||||||||
| i | DP World Ltd., senior bond, Reg S, 1.75%, 6/19/24 | United Arab Emirates | 1,800,000 | 1,879,560 | ||||||||||
Macquarie Infrastructure Corp., senior note, 2.00%, 10/01/23 | United States | 180,000 | 178,537 | |||||||||||
|
| |||||||||||||
| 2,058,097 | ||||||||||||||
|
| |||||||||||||
Total Convertible Bonds (Cost $157,145,862) | 164,330,671 | |||||||||||||
|
| |||||||||||||
| franklintempleton.com | Annual Report | 31 |
FRANKLIN ALTERNATIVE STRATEGIES FUNDS
CONSOLIDATED STATEMENT OF INVESTMENTS
Franklin K2 Alternative Strategies Fund (continued)
| Country | Principal Amount* | Value | ||||||||||||
| Convertible Bonds in Reorganization 0.1% | ||||||||||||||
| Chemicals 0.1% | ||||||||||||||
| b,k | TerraVia Holdings Inc., senior sub. note, 5.00%, 10/01/19 | United States | 1,117,000 | $ | 423,064 | |||||||||
|
| |||||||||||||
| Communications Equipment 0.0%† | ||||||||||||||
| k | Nortel Networks Corp., senior note, 2.125%, 4/15/14 | Canada | 384,000 | 374,400 | ||||||||||
|
| |||||||||||||
| Semiconductors & Semiconductor Equipment 0.0%† | ||||||||||||||
| k | SunEdison Inc., senior note, | |||||||||||||
2.375%, 4/15/22 | United States | 247,000 | 4,940 | |||||||||||
c 144A, 0.25%, 1/15/20 | United States | 126,000 | 2,520 | |||||||||||
|
| |||||||||||||
| 7,460 | ||||||||||||||
|
| |||||||||||||
Total Convertible Bonds in Reorganization | 804,924 | |||||||||||||
|
| |||||||||||||
| Corporate Bonds and Notes 15.7% | ||||||||||||||
| Aerospace & Defense 0.1% | ||||||||||||||
Embraer Netherlands Finance BV, senior bond, | ||||||||||||||
5.05%, 6/15/25 | Brazil | 95,000 | 98,230 | |||||||||||
5.40%, 2/01/27 | Brazil | 130,000 | 134,827 | |||||||||||
| c | Embraer Overseas Ltd., senior bond, 144A, 5.696%, 9/16/23 | Brazil | 90,000 | 96,862 | ||||||||||
| c | Meccanica Holdings USA Inc., senior bond, 144A, 6.25%, 1/15/40 | Italy | 555,000 | 616,050 | ||||||||||
|
| |||||||||||||
| 945,969 | ||||||||||||||
|
| |||||||||||||
| Auto Components 0.0%† | ||||||||||||||
| c | Midas Intermediate Holdco II LLC / Midas Intermediate Holdco II Finance Inc., senior note, 144A, 7.875%, 10/01/22 | United States | 170,000 | 174,145 | ||||||||||
|
| |||||||||||||
| Automobiles 0.1% | ||||||||||||||
| c,l | BMW U.S. Capital LLC, senior note, 144A, FRN, 1.53%, 4/06/20 | Germany | 480,000 | 480,305 | ||||||||||
| l | Toyota Motor Credit Corp., senior note, FRN, | United States | 40,000 | 40,183 | ||||||||||
| l | Toyota Motor Credit Corp., senior note, FRN, | United States | 255,000 | 256,712 | ||||||||||
|
| |||||||||||||
| 777,200 | ||||||||||||||
|
| |||||||||||||
| Banks 0.1% | ||||||||||||||
| c | Banco Macro SA, senior note, 144A, 17.50%, 5/08/22 | Argentina | 1,740,000 | ARS | 107,748 | |||||||||
| l | Bank of America Corp., senior note, FRN, 2.198%, 1/15/19 | United States | 20,000 | 20,229 | ||||||||||
| l | Citibank NA, senior note, FRN, 1.41%, 11/09/18 | United States | 485,000 | 485,371 | ||||||||||
| l | JPMorgan Chase & Co., senior note, FRN, 1.882%, 6/01/21 | United States | 480,000 | 480,204 | ||||||||||
| l | Wells Fargo & Co., senior note, FRN, 1.364%, 6/02/17 | United States | 115,000 | 115,000 | ||||||||||
|
| |||||||||||||
| 1,208,552 | ||||||||||||||
|
| |||||||||||||
| Beverages 0.0%† | ||||||||||||||
| l | PepsiCo Inc., senior note, FRN, 1.42%, 10/04/19 | United States | 260,000 | 261,445 | ||||||||||
|
| |||||||||||||
| Biotechnology 0.1% | ||||||||||||||
| l | Amgen Inc., senior note, FRN, 1.632%, 5/11/20 | United States | 485,000 | 489,268 | ||||||||||
| c | Grifols SA, senior note, 144A, 3.20%, 5/01/25 | Spain | 225,000 | EUR | 256,161 | |||||||||
|
| |||||||||||||
| 745,429 | ||||||||||||||
|
| |||||||||||||
| Capital Markets 0.0%† | ||||||||||||||
Donnelley Financial Solutions Inc., senior note, 8.25%, 10/15/24 | United States | 180,000 | 189,450 | |||||||||||
|
| |||||||||||||
| Commercial Services & Supplies 1.2% | ||||||||||||||
| c | Harland Clarke Holdings Corp., senior note, 144A, 9.25%, 3/01/21 | United States | 7,314,000 | 7,167,720 | ||||||||||
| 32 | Annual Report | franklintempleton.com |
FRANKLIN ALTERNATIVE STRATEGIES FUNDS
CONSOLIDATED STATEMENT OF INVESTMENTS
Franklin K2 Alternative Strategies Fund (continued)
| Country | Principal Amount* | Value | ||||||||||||
| Corporate Bonds and Notes (continued) | ||||||||||||||
| Commercial Services & Supplies (continued) | ||||||||||||||
RR Donnelley & Sons Co., | ||||||||||||||
b senior bond, 6.50%, 11/15/23 | United States | 1,512,000 | $ | 1,534,680 | ||||||||||
b senior bond, 6.00%, 4/01/24 | United States | 2,463,000 | 2,426,055 | |||||||||||
senior bond, 6.625%, 4/15/29 | United States | 262,000 | 251,520 | |||||||||||
senior note, 7.00%, 2/15/22 | United States | 1,585,000 | 1,664,250 | |||||||||||
|
| |||||||||||||
| 13,044,225 | ||||||||||||||
|
| |||||||||||||
| Construction & Engineering 0.2% | ||||||||||||||
| c | Engility Corp., senior note, 144A, 8.875%, 9/01/24 | United States | 1,515,000 | 1,634,306 | ||||||||||
| c | Great Lakes Dredge & Dock Corp., senior note, 144A, 8.00%, 5/15/22 | United States | 160,000 | 162,800 | ||||||||||
|
| |||||||||||||
| 1,797,106 | ||||||||||||||
|
| |||||||||||||
| Construction Materials 0.0%† | ||||||||||||||
| c | Cemex SAB de CV, senior secured bond, first lien, 144A, 6.125%, 5/05/25 | Mexico | 365,000 | 393,288 | ||||||||||
|
| |||||||||||||
| Consumer Finance 0.3% | ||||||||||||||
| l | Capital One Financial Corp., senior note, FRN, 1.941%, 5/12/20 | United States | 485,000 | 485,681 | ||||||||||
| c | iPayment Inc., secured, second lien, 144A, 10.75%, 4/15/24 | United States | 2,378,000 | 2,669,305 | ||||||||||
|
| |||||||||||||
| 3,154,986 | ||||||||||||||
|
| |||||||||||||
| Diversified Financial Services 1.9% | ||||||||||||||
| l | American Honda Finance Corp., senior note, FRN, 1.602%, 9/20/17 | United States | 180,000 | 180,258 | ||||||||||
| c,l | Banco Hipotecario SA, senior note, 144A, FRN, 21.354%, 1/12/20 | Argentina | 3,890,000 | ARS | 247,228 | |||||||||
| c,l | Banco Supervielle SA, senior note, 144A, FRN, 24.167%, 8/09/20 | Argentina | 3,800,000 | ARS | 257,967 | |||||||||
| c,l | Bank of Tokyo-Mitsubishi UFJ Ltd., senior note, 144A, FRN, 2.141%, 9/14/18 | Japan | 335,000 | 337,735 | ||||||||||
| i | Citigroup Global Markets Holdings Inc., zero cpn., Reg S, | |||||||||||||
7/13/17 | Egypt | 16,546,094 | EGP | 893,078 | ||||||||||
7/27/17 | Egypt | 14,516,210 | EGP | 777,548 | ||||||||||
9/21/17 | Egypt | 46,465,292 | EGP | 2,415,220 | ||||||||||
10/12/17 | Egypt | 14,378,990 | EGP | 739,199 | ||||||||||
| b | Everi Payments Inc., senior note, 10.00%, 1/15/22 | United States | 6,346,000 | 7,004,397 | ||||||||||
| c | Financiera de Desarrollo Territorial SA Findeter, senior bond, 144A, 7.875%, 8/12/24 | Colombia | 795,000,000 | COP | 272,741 | |||||||||
| l | JPMorgan Chase Bank NA, senior note, FRN, 1.746%, 9/23/19 | United States | 515,000 | 518,608 | ||||||||||
| c | Ladder Capital Finance Holdings LLP, senior note, 144A, 5.875%, 8/01/21 | United States | 225,000 | 230,344 | ||||||||||
| b,c | Opal Acquisition Inc., senior note, 144A, 8.875%, 12/15/21 | United States | 7,840,000 | 7,134,400 | ||||||||||
Rumo Luxembourg Sarl, senior note, 7.375%, 2/09/24 | Brazil | 200,000 | 207,480 | |||||||||||
|
| |||||||||||||
| 21,216,203 | ||||||||||||||
|
| |||||||||||||
| Diversified Telecommunication Services 0.7% | ||||||||||||||
Frontier Communications Corp., senior note, 10.50%, 9/15/22 | United States | 4,793,000 | 4,721,105 | |||||||||||
Intelsat Jackson Holdings SA, | ||||||||||||||
senior bond, 7.25%, 10/15/20 | Luxembourg | 1,852,000 | 1,680,690 | |||||||||||
senior note, 7.25%, 4/01/19 | Luxembourg | 934,000 | 896,640 | |||||||||||
| i | MTN Mauritius Investment Ltd., senior bond, Reg S, 6.50%, 10/13/26 | South Africa | 720,000 | 755,460 | ||||||||||
| l | Verizon Communications Inc., senior note, FRN, 1.506%, 6/09/17 | United States | 125,000 | 125,005 | ||||||||||
|
| |||||||||||||
| 8,178,900 | ||||||||||||||
|
| |||||||||||||
| Electric Utilities 0.5% | ||||||||||||||
| i | 1MDB Energy Ltd., senior note, Reg S, 5.99%, 5/11/22 | Malaysia | 1,300,000 | 1,420,453 | ||||||||||
Bruce Mansfield Unit 1 2007 Pass Through Trust, secured bond, | United States | 2,953,117 | 1,155,407 | |||||||||||
| c | Enel SpA, sub. bond, 144A, 8.75% to 9/24/23, FRN thereafter, 9/24/73 | Italy | 745,000 | 882,825 | ||||||||||
| franklintempleton.com | Annual Report | 33 |
FRANKLIN ALTERNATIVE STRATEGIES FUNDS
CONSOLIDATED STATEMENT OF INVESTMENTS
Franklin K2 Alternative Strategies Fund (continued)
| Country | Principal Amount* | Value | ||||||||||||
| Corporate Bonds and Notes (continued) | ||||||||||||||
| Electric Utilities (continued) | ||||||||||||||
| b | GenOn Americas Generation LLC, senior bond, 9.125%, 5/01/31 | United States | 1,738,000 | $ | 1,581,580 | |||||||||
|
| |||||||||||||
| 5,040,265 | ||||||||||||||
|
| |||||||||||||
| Energy Equipment & Services 0.2% | ||||||||||||||
| b,c | McDermott International Inc., second lien, 144A, 8.00%, 5/01/21 | United States | 1,857,000 | 1,926,638 | ||||||||||
| i | Subsea 7 SA, senior note, Reg S, 1.00%, 10/05/17 | United Kingdom | 600,000 | 597,750 | ||||||||||
|
| |||||||||||||
| 2,524,388 | ||||||||||||||
|
| |||||||||||||
| Food & Staples Retailing 0.2% | ||||||||||||||
| c | Albertsons Cos. LLC / Safeway Inc. / New Albertson’s Inc. / Albertson’s LLC, senior note, 144A, 6.625%, 6/15/24 | United States | 65,000 | 67,437 | ||||||||||
| c | BRF GmbH, senior bond, 144A, 4.35%, 9/29/26 | Brazil | 530,000 | 497,930 | ||||||||||
| b,c | The Fresh Market Inc., secured note, first lien, 144A, 9.75%, 5/01/23 | United States | 1,320,000 | 1,118,700 | ||||||||||
|
| |||||||||||||
| 1,684,067 | ||||||||||||||
|
| |||||||||||||
| Food Products 0.0%† | ||||||||||||||
| c | JBS USA LLC / JBS USA Finance Inc., senior bond, 144A, 5.75%, 6/15/25 | United States | 180,000 | 174,600 | ||||||||||
|
| |||||||||||||
| Gas Utilities 0.2% | ||||||||||||||
AmeriGas Partners LP / AmeriGas Finance Corp., senior note, 5.50%, 5/20/25 | United States | 220,000 | 223,850 | |||||||||||
NGL Energy Partners LP / NGL Energy Finance Corp., senior note, | ||||||||||||||
5.125%, 7/15/19 | United States | 230,000 | 231,725 | |||||||||||
6.875%, 10/15/21 | United States | 30,000 | 30,525 | |||||||||||
c 144A, 7.50%, 11/01/23 | United States | 840,000 | 854,700 | |||||||||||
c 144A, 6.125%, 3/01/25 | United States | 245,000 | 232,138 | |||||||||||
| l | Transcanada Trust, junior sub. bond, FRN, 5.30%, 3/15/77 | Canada | 980,000 | 1,006,337 | ||||||||||
|
| |||||||||||||
| 2,579,275 | ||||||||||||||
|
| |||||||||||||
| Health Care Providers & Services 0.2% | ||||||||||||||
Kindred Healthcare Inc., senior note, 8.75%, 1/15/23 | United States | 2,551,000 | 2,675,361 | |||||||||||
|
| |||||||||||||
| Hotels, Restaurants & Leisure 0.2% | ||||||||||||||
| b,c | Jack Ohio Finance LLC / Jack Ohio Finance 1 Corp., senior secured note, second lien, 144A, 10.25%, 11/15/22 | United States | 1,325,000 | 1,459,156 | ||||||||||
| c | Mohegan Tribal Gaming Authority, senior note, 144A, 7.875%, 10/15/24 | United States | 558,000 | 578,228 | ||||||||||
| b,c | Viking Cruises Ltd., senior bond, 144A, 6.25%, 5/15/25 | United States | 580,000 | 568,400 | ||||||||||
|
| |||||||||||||
| 2,605,784 | ||||||||||||||
|
| |||||||||||||
| Independent Power & Renewable Electricity Producers 0.1% | ||||||||||||||
| b | GenOn Energy Inc., senior note, 9.875%, 10/15/20 | United States | 1,996,000 | 1,462,070 | ||||||||||
|
| |||||||||||||
| Industrial Conglomerates 0.1% | ||||||||||||||
Icahn Enterprises LP / Icahn Enterprises Finance Corp., senior note, | ||||||||||||||
6.25%, 2/01/22 | United States | 225,000 | 234,844 | |||||||||||
6.75%, 2/01/24 | United States | 295,000 | 308,644 | |||||||||||
|
| |||||||||||||
| 543,488 | ||||||||||||||
|
| |||||||||||||
| IT Services 0.0%† | ||||||||||||||
| c | Acwa Power Management And Investments One Ltd., secured bond, 144A, 5.95%, 12/15/39 | Saudi Arabia | 485,000 | 495,633 | ||||||||||
|
| |||||||||||||
| Life Sciences Tools & Services 0.0%† | ||||||||||||||
| c | Quintiles IMS Inc., senior note, 144A, 3.25%, 3/15/25 | United States | 230,000 | EUR | 266,370 | |||||||||
|
| |||||||||||||
| 34 | Annual Report | franklintempleton.com |
FRANKLIN ALTERNATIVE STRATEGIES FUNDS
CONSOLIDATED STATEMENT OF INVESTMENTS
Franklin K2 Alternative Strategies Fund (continued)
| Country | Principal Amount* | Value | ||||||||||||
| Corporate Bonds and Notes (continued) | ||||||||||||||
| Machinery 0.3% | ||||||||||||||
| l | Caterpillar Financial Services Corp., senior note, FRN, | |||||||||||||
1.276%, 6/09/17 | United States | 300,000 | $ | 300,005 | ||||||||||
1.886%, 2/23/18 | United States | 505,000 | 507,313 | |||||||||||
| c | Cloud Crane Escrow LLC, secured note, second lien, 144A, 10.125%, 8/01/24 | United States | 81,000 | 88,290 | ||||||||||
Navistar International Corp., senior bond, 8.25%, 11/01/21 | United States | 2,393,000 | 2,433,370 | |||||||||||
|
| |||||||||||||
| 3,328,978 | ||||||||||||||
|
| |||||||||||||
| Media 3.4% | ||||||||||||||
| c | American Media Inc., 144A, | |||||||||||||
b secured note, second lien, 5.50%, 9/01/21 | United States | 1,253,845 | 1,264,816 | |||||||||||
sub. note, zero cpn., 3/01/22 | United States | 20,085,513 | 16,294,372 | |||||||||||
Clear Channel Worldwide Holdings Inc., senior sub. note, B, 7.625%, 3/15/20 | United States | 1,095,000 | 1,104,581 | |||||||||||
| c | Cox Communications Inc., senior bond, 144A, | |||||||||||||
4.70%, 12/15/42 | United States | 120,000 | 108,754 | |||||||||||
4.50%, 6/30/43 | United States | 220,000 | 194,217 | |||||||||||
DISH DBS Corp., senior note, | ||||||||||||||
5.875%, 11/15/24 | United States | 405,000 | 432,844 | |||||||||||
7.75%, 7/01/26 | United States | 250,000 | 294,375 | |||||||||||
| c | Lee Enterprises Inc., senior secured note, first lien, 144A, 9.50%, 3/15/22 | United States | 3,783,000 | 3,943,778 | ||||||||||
The McClatchy Co., senior bond, | ||||||||||||||
7.15%, 11/01/27 | United States | 1,062,000 | 988,988 | |||||||||||
6.875%, 3/15/29 | United States | 3,743,000 | 3,059,903 | |||||||||||
| c,h | Postmedia Network Inc., secured note, second lien, 144A, PIK, 10.25%, 7/15/23 | Canada | 4,371,874 | 5,197,065 | ||||||||||
| c | Time Inc., senior note, 144A, 5.75%, 4/15/22 | United States | 4,625,000 | 4,804,219 | ||||||||||
Time Warner Cable Inc., senior bond, 4.50%, 9/15/42 | United States | 240,000 | 230,250 | |||||||||||
| l | Viacom Inc., junior sub. bond, FRN, 6.25%, 2/28/57 | United States | 60,000 | 61,832 | ||||||||||
|
| |||||||||||||
| 37,979,994 | ||||||||||||||
|
| |||||||||||||
| Metals & Mining 0.5% | ||||||||||||||
AK Steel Corp., | ||||||||||||||
b senior bond, 8.375%, 4/01/22 | United States | 701,000 | 727,726 | |||||||||||
senior note, 7.625%, 10/01/21 | United States | 4,580,000 | 4,733,888 | |||||||||||
Vale Overseas Ltd., senior bond, 6.25%, 8/10/26 | Brazil | 155,000 | 167,787 | |||||||||||
|
| |||||||||||||
| 5,629,401 | ||||||||||||||
|
| |||||||||||||
| Oil, Gas & Consumable Fuels 2.8% | ||||||||||||||
| c | Alta Mesa Holdings LP / Alta Mesa Finance Services Corp., senior note, 144A, 7.875%, 12/15/24 | United States | 360,000 | 378,900 | ||||||||||
| c | Ascent Resources Utica Holdings LLC / ARU Finance Corp., senior note, 144A, 10.00%, 4/01/22 | United States | 365,000 | 376,406 | ||||||||||
| c | Baytex Energy Corp., senior note, 144A, | |||||||||||||
5.125%, 6/01/21 | Canada | 30,000 | 28,275 | |||||||||||
5.625%, 6/01/24 | Canada | 1,000,000 | 917,500 | |||||||||||
| c | Bellatrix Exploration Ltd., senior note, 144A, 8.50%, 5/15/20 | Canada | 625,000 | 590,625 | ||||||||||
| d | Bonanza Creek Energy Inc., Escrow Account, | |||||||||||||
6.75%, 4/15/21 | United States | 115,000 | — | |||||||||||
5.75%, 2/01/23 | United States | 415,000 | — | |||||||||||
| l | BP Capital Markets PLC, senior note, FRN, 1.607%, 2/13/18 | United Kingdom | 105,000 | 105,305 | ||||||||||
California Resources Corp., | ||||||||||||||
c secured note, second lien, 144A, 8.00%, 12/15/22 | United States | 280,000 | 210,700 | |||||||||||
| franklintempleton.com | Annual Report | 35 |
FRANKLIN ALTERNATIVE STRATEGIES FUNDS
CONSOLIDATED STATEMENT OF INVESTMENTS
Franklin K2 Alternative Strategies Fund (continued)
| Country | Principal Amount* | Value | ||||||||||||
| Corporate Bonds and Notes (continued) | ||||||||||||||
| Oil, Gas & Consumable Fuels (continued) | ||||||||||||||
California Resources Corp. (continued) | ||||||||||||||
senior note, 5.50%, 9/15/21 | United States | 9,000 | $ | 6,165 | ||||||||||
senior note, 6.00%, 11/15/24 | United States | 112,000 | 71,120 | |||||||||||
| c | Callon Petroleum Co., senior note, 144A, 6.125%, 10/01/24 | United States | 335,000 | 348,400 | ||||||||||
| b | Calumet Specialty Products Partners LP / Calumet Finance Corp., senior note, 6.50%, 4/15/21 | United States | 1,686,000 | 1,517,400 | ||||||||||
Canadian Natural Resources Ltd., senior bond, 3.90%, 2/01/25 | Canada | 20,000 | 20,395 | |||||||||||
| c | Cenovus Energy Inc., senior bond, 144A, 5.40%, 6/15/47 | Canada | 245,000 | 237,805 | ||||||||||
| c | Cheniere Corpus Christi Holdings LLC, secured bond, 144A, 5.125%, 6/30/27 | United States | 1,140,000 | 1,157,100 | ||||||||||
| c | Chesapeake Energy Corp., 144A, | |||||||||||||
secured note, second lien, 8.00%, 12/15/22 | United States | 125,000 | 135,625 | |||||||||||
m senior bond, 8.00%, 6/15/27 | United States | 75,000 | 73,594 | |||||||||||
senior note, 8.00%, 1/15/25 | United States | 200,000 | 199,750 | |||||||||||
| l | Chevron Corp., senior note, FRN, 1.352%, 11/15/17 | United States | 145,000 | 145,103 | ||||||||||
| h | Comstock Resources Inc., senior secured note, first lien, PIK, 10.00% (all cash), 3/15/20 | United States | 3,353,000 | 3,420,060 | ||||||||||
Continental Resources Inc., | ||||||||||||||
senior bond, 5.00%, 9/15/22 | United States | 1,040,000 | 1,045,200 | |||||||||||
senior note, 4.50%, 4/15/23 | United States | 35,000 | 34,475 | |||||||||||
senior note, 3.80%, 6/01/24 | United States | 405,000 | 380,457 | |||||||||||
Eclipse Resources Corp., senior note, 8.875%, 7/15/23 | United States | 545,000 | 551,812 | |||||||||||
Enable Midstream Partners LP, senior bond, 5.00%, 5/15/44 | United States | 400,000 | 381,958 | |||||||||||
Energy Transfer Partners LP, senior bond, 6.125%, 12/15/45 | United States | 540,000 | 603,226 | |||||||||||
EnLink Midstream Partners LP, senior bond, | ||||||||||||||
5.60%, 4/01/44 | United States | 145,000 | 150,774 | |||||||||||
5.05%, 4/01/45 | United States | 245,000 | 238,160 | |||||||||||
| b | EP Energy LLC / Everest Acquisition Finance Inc., senior note, 9.375%, 5/01/20 | United States | 1,276,000 | 1,157,970 | ||||||||||
| i,l | EP PetroEcuador via Noble Sovereign Funding I Ltd., secured note, FRN, Reg S, 6.781%, 9/24/19 | Ecuador | 424,737 | 426,861 | ||||||||||
| c | Halcon Resources Corp., senior note, 144A, 6.75%, 2/15/25 | United States | 295,000 | 276,562 | ||||||||||
| c | Hilcorp Energy I LP / Hilcorp Finance Co., senior bond, 144A, 5.00%, 12/01/24 | United States | 590,000 | 561,975 | ||||||||||
HollyFrontier Corp., senior bond, 5.875%, 4/01/26 | United States | 900,000 | 970,989 | |||||||||||
Kinder Morgan Energy Partners LP, senior bond, | ||||||||||||||
5.625%, 9/01/41 | United States | 130,000 | 135,747 | |||||||||||
5.00%, 8/15/42 | United States | 300,000 | 295,986 | |||||||||||
4.70%, 11/01/42 | United States | 150,000 | 144,617 | |||||||||||
5.00%, 3/01/43 | United States | 145,000 | 142,787 | |||||||||||
Marathon Oil Corp., senior bond, 5.20%, 6/01/45 | United States | 585,000 | 591,983 | |||||||||||
Matador Resources Co., senior note, 6.875%, 4/15/23 | United States | 312,000 | 329,160 | |||||||||||
| c | MEG Energy Corp., 144A, | |||||||||||||
senior bond, 6.375%, 1/30/23 | Canada | 180,000 | 155,250 | |||||||||||
senior bond, 7.00%, 3/31/24 | Canada | 665,000 | 578,550 | |||||||||||
senior secured note, second lien, 6.50%, 1/15/25 | Canada | 230,000 | 225,688 | |||||||||||
MPLX LP, senior bond, 5.20%, 3/01/47 | United States | 240,000 | 249,319 | |||||||||||
Oasis Petroleum Inc., | ||||||||||||||
senior bond, 6.875%, 1/15/23 | United States | 70,000 | 70,700 | |||||||||||
senior note, 6.875%, 3/15/22 | United States | 725,000 | 735,875 | |||||||||||
| c | Parsley Energy LLC / Parsley Finance Corp., senior note, 144A, 6.25%, 6/01/24 | United States | 270,000 | 286,200 | ||||||||||
| c | PDC Energy Inc., senior note, 144A, 6.125%, 9/15/24 | United States | 130,000 | 134,225 | ||||||||||
Petrobras Global Finance BV, | ||||||||||||||
senior bond, 7.375%, 1/17/27 | Brazil | 615,000 | 660,817 | |||||||||||
senior bond, 5.625%, 5/20/43 | Brazil | 165,000 | 138,600 | |||||||||||
senior bond, 7.25%, 3/17/44 | Brazil | 165,000 | 163,515 | |||||||||||
| 36 | Annual Report | franklintempleton.com |
FRANKLIN ALTERNATIVE STRATEGIES FUNDS
CONSOLIDATED STATEMENT OF INVESTMENTS
Franklin K2 Alternative Strategies Fund (continued)
| Country | Principal Amount* | Value | ||||||||||||
| Corporate Bonds and Notes (continued) | ||||||||||||||
| Oil, Gas & Consumable Fuels (continued) | ||||||||||||||
Petrobras Global Finance BV (continued) | ||||||||||||||
senior note, 5.375%, 1/27/21 | Brazil | 882,000 | $ | 905,329 | ||||||||||
senior note, 8.375%, 5/23/21 | Brazil | 1,199,000 | 1,351,453 | |||||||||||
senior note, 6.125%, 1/17/22 | Brazil | 219,000 | 227,870 | |||||||||||
senior note, 8.75%, 5/23/26 | Brazil | 75,000 | 87,469 | |||||||||||
Petroleos Mexicanos, senior note, | ||||||||||||||
6.375%, 2/04/21 | Mexico | 770,000 | 844,613 | |||||||||||
4.25%, 1/15/25 | Mexico | 247,000 | 242,999 | |||||||||||
6.875%, 8/04/26 | Mexico | 317,000 | 356,292 | |||||||||||
i,l FRN, Reg S, 4.77%, 3/11/22 | Mexico | 402,000 | 436,572 | |||||||||||
Petroleos Mexicanos, senior note, | ||||||||||||||
i Reg S, 5.375%, 3/13/22 | Mexico | 442,000 | 470,398 | |||||||||||
i Reg S, 1.875%, 4/21/22 | Mexico | 869,000 | EUR | 967,674 | ||||||||||
i Reg S, 3.75%, 2/21/24 | Mexico | 290,000 | EUR | 337,876 | ||||||||||
Rice Energy Inc., senior note, 6.25%, 5/01/22 | United States | 345,000 | 359,662 | |||||||||||
Rose Rock Midstream LP / Rose Rock Finance Corp., senior note, 5.625%, 11/15/23 | United States | 285,000 | 285,177 | |||||||||||
RSP Permian Inc., senior note, 6.625%, 10/01/22 | United States | 1,250,000 | 1,323,437 | |||||||||||
SM Energy Co., |
| |||||||||||||
senior bond, 6.50%, 1/01/23 | United States | 85,000 | 84,150 | |||||||||||
senior bond, 5.625%, 6/01/25 | United States | 10,000 | 9,447 | |||||||||||
senior bond, 6.75%, 9/15/26 | United States | 90,000 | 88,650 | |||||||||||
senior note, 6.50%, 11/15/21 | United States | 10,000 | 10,150 | |||||||||||
senior note, 6.125%, 11/15/22 | United States | 220,000 | 217,800 | |||||||||||
senior note, 5.00%, 1/15/24 | United States | 230,000 | 213,900 | |||||||||||
| c | Transocean Proteus Ltd., senior note, 144A, 6.25%, 12/01/24 | United States | 340,000 | 351,900 | ||||||||||
Williams Partners LP, senior bond, 6.30%, 4/15/40 | United States | 335,000 | 396,616 | |||||||||||
| c,l | YPF SA, senior note, 144A, FRN, 23.083%, 7/07/20 | Argentina | 245,000 | 276,804 | ||||||||||
|
| |||||||||||||
| 31,605,904 | ||||||||||||||
|
| |||||||||||||
| Paper & Forest Products 1.2% | ||||||||||||||
Resolute Forest Products Inc., senior note, 5.875%, 5/15/23 | United States | 13,328,000 | 13,194,720 | |||||||||||
|
| |||||||||||||
| Pharmaceuticals 0.1% | ||||||||||||||
| c | Valeant Pharmaceuticals International Inc., senior note, 144A, 5.875%, 5/15/23 | United States | 870,000 | 712,856 | ||||||||||
|
| |||||||||||||
| Professional Services 0.1% | ||||||||||||||
| b,c | Altegrity Inc., senior note, first lien, 144A, 9.50%, 7/01/19 | United States | 1,442,000 | 1,535,730 | ||||||||||
|
| |||||||||||||
| Real Estate Management & Development 0.0%† | ||||||||||||||
| c | Rialto Holdings LLC / Rialto Corp., senior note, 144A, 7.00%, 12/01/18 | United States | 178,000 | 182,005 | ||||||||||
|
| |||||||||||||
| Retailing 0.1% | ||||||||||||||
| i | Punch Taverns Finance PLC, Reg S, |
| ||||||||||||
7.32%, 10/15/25 | United Kingdom | 146,000 | GBP | 250,847 | ||||||||||
7.274%, 10/15/26 | United Kingdom | 225,000 | GBP | 399,636 | ||||||||||
|
| |||||||||||||
| 650,483 | ||||||||||||||
|
| |||||||||||||
| Road & Rail 0.1% | ||||||||||||||
| i,j | RZD Capital PLC, (Russian Railways), loan participation, senior note, Reg S, 4.375%, 3/01/24 | Russia | 839,000 | 848,636 | ||||||||||
|
| |||||||||||||
| Semiconductors & Semiconductor Equipment 0.0%† | ||||||||||||||
| l | Intel Corp., senior note, FRN, 1.262%, 5/11/20 | United States | 485,000 | 484,543 | ||||||||||
|
| |||||||||||||
| franklintempleton.com | Annual Report | 37 |
FRANKLIN ALTERNATIVE STRATEGIES FUNDS
CONSOLIDATED STATEMENT OF INVESTMENTS
Franklin K2 Alternative Strategies Fund (continued)
| Country | Principal Amount* | Value | ||||||||||||
| Corporate Bonds and Notes (continued) | ||||||||||||||
| Software 0.0%† | ||||||||||||||
| l | Oracle Corp., senior note, FRN, 1.35%, 7/07/17 | United States | 135,000 | $ | 135,039 | |||||||||
|
| |||||||||||||
| Specialty Retail 0.5% | ||||||||||||||
| b | CST Brands Inc., senior note, 5.00%, 5/01/23 | United States | 2,488,000 | 2,590,008 | ||||||||||
| l | Lowe’s Cos. Inc., senior note, FRN, 1.721%, 9/14/18 | United States | 255,000 | 256,764 | ||||||||||
| c | PetSmart Inc., 144A, |
| ||||||||||||
senior note, 7.125%, 3/15/23 | United States | 319,000 | 298,265 | |||||||||||
senior note, 8.875%, 6/01/25 | United States | 1,915,000 | 1,903,031 | |||||||||||
senior secured, first lien note, 5.875%, 6/01/25 | United States | 160,000 | 161,200 | |||||||||||
|
| |||||||||||||
| 5,209,268 | ||||||||||||||
|
| |||||||||||||
| Technology Hardware, Storage & Peripherals 0.1% | ||||||||||||||
| c | Diamond 1 Finance Corp. / Diamond 2 Finance Corp., senior secured bond, first lien, 144A, 6.02%, 6/15/26 | United States | 1,170,000 | 1,292,741 | ||||||||||
|
| |||||||||||||
| Thrifts & Mortgage Finance 0.0%† | ||||||||||||||
Santander Holdings USA Inc., senior bond, 4.50%, 7/17/25 | United States | 20,000 | 20,630 | |||||||||||
|
| |||||||||||||
| Trading Companies & Distributors 0.0%† | ||||||||||||||
Aircastle Ltd., senior note, 5.00%, 4/01/23 | United States | 125,000 | 133,829 | |||||||||||
|
| |||||||||||||
| Wireless Telecommunication Services 0.1% | ||||||||||||||
| i | GTH Finance BV, senior note, Reg S, 6.25%, 4/26/20 | Netherlands | 249,000 | 266,162 | ||||||||||
Qwest Capital Funding Inc., senior bond, 6.875%, 7/15/28 | United States | 260,000 | 247,650 | |||||||||||
|
| |||||||||||||
| 513,812 | ||||||||||||||
|
| |||||||||||||
Total Corporate Bonds and Notes (Cost $154,031,014) | 175,596,768 | |||||||||||||
|
| |||||||||||||
| Corporate Bonds and Notes in Reorganization 0.7% | ||||||||||||||
| Communications Equipment 0.5% | ||||||||||||||
| b,c,k | Avaya Inc., senior note, first lien, 144A, 7.00%, 4/01/19 | United States | 799,000 | 657,178 | ||||||||||
| k | Nortel Networks Capital Corp., senior bond, 7.875%, 6/15/26 | Canada | 221,000 | 215,475 | ||||||||||
| k | Nortel Networks Ltd., senior note, | |||||||||||||
zero cpn., 7/15/11 | Canada | 3,448,000 | 3,430,760 | |||||||||||
10.125%, 7/15/13 | Canada | 1,199,000 | 1,231,972 | |||||||||||
|
| |||||||||||||
| 5,535,385 | ||||||||||||||
|
| |||||||||||||
| Diversified Telecommunication Services 0.0%† | ||||||||||||||
| c,k | Oi SA, senior note, 144A, 9.75%, 9/15/16 | Brazil | 300,000 | BRL | 24,452 | |||||||||
|
| |||||||||||||
| Electric Utilities 0.2% | ||||||||||||||
| c,k | Energy Future Intermediate Holding Co. LLC / EFIH Finance Inc., secured, second lien bond, 144A, 11.75%, 3/01/22 | United States | 1,886,767 | 2,551,853 | ||||||||||
|
| |||||||||||||
Total Corporate Bonds and Notes in Reorganization | 8,111,690 | |||||||||||||
|
| |||||||||||||
| l,n | Senior Floating Rate Interests 0.7% | |||||||||||||
| Aerospace & Defense 0.1% | ||||||||||||||
Avolon, Term Loan B, 3.76%, 3/21/22 | United States | 160,000 | 162,356 | |||||||||||
TransDigm Group Inc., Term Loan E, 4.147%, 5/14/22 | United States | 29,099 | 29,199 | |||||||||||
TransDigm Inc., Term Loan F, 4.04%, 6/09/23 | United States | 205,421 | 206,031 | |||||||||||
|
| |||||||||||||
| 397,586 | ||||||||||||||
|
| |||||||||||||
| Auto Components 0.0%† | ||||||||||||||
Tectum Holdings/Truck Hero, Term Loan, 5.156%, 4/22/24 | United States | 218,001 | 216,775 | |||||||||||
|
| |||||||||||||
| 38 | Annual Report | franklintempleton.com |
FRANKLIN ALTERNATIVE STRATEGIES FUNDS
CONSOLIDATED STATEMENT OF INVESTMENTS
Franklin K2 Alternative Strategies Fund (continued)
| Country | Principal Amount* | Value | ||||||||||||
| l,n | Senior Floating Rate Interests (continued) | |||||||||||||
| Building Products 0.0%† | ||||||||||||||
Ply Gem Holdings Inc., Term Loan, first lien, 4.147%, 2/01/21 | United States | 27,233 | $ | 27,429 | ||||||||||
|
| |||||||||||||
| Capital Markets 0.0%† | ||||||||||||||
Donnelley Financial Solutions Inc., Term Loan B, 5.00%, 9/29/23 | United States | 76,229 | 77,070 | |||||||||||
|
| |||||||||||||
| Commercial Services & Supplies 0.0%† | ||||||||||||||
Camelot Finance LP, Term Loan, 4.54%, 10/03/23 | United States | 130,758 | 131,616 | |||||||||||
GFL Environmental, Term Loan B, 3.897%, 9/29/23 | Canada | 69,650 | 69,955 | |||||||||||
|
| |||||||||||||
| 201,571 | ||||||||||||||
|
| |||||||||||||
| Construction & Engineering 0.0%† | ||||||||||||||
Engility Corp., Term Loan B2, 6.75%, 8/14/23 | United States | 98,111 | 98,929 | |||||||||||
|
| |||||||||||||
| Containers & Packaging 0.0%† | ||||||||||||||
BWay, Term Loan B, 4.245%, 4/03/24 | United States | 240,000 | 239,871 | |||||||||||
|
| |||||||||||||
| Diversified Financial Services 0.1% | ||||||||||||||
B.C. Unlimited Liability Co., Term Loan, 3.25%, 2/16/24 | United States | 30,000 | 30,059 | |||||||||||
Cequel/SuddenLink, Term Loan, 3.28%, 7/28/25 | United States | 24,299 | 24,317 | |||||||||||
Gates Global Inc., Term Loan, 4.408%, 4/01/24 | United States | 130,822 | 131,548 | |||||||||||
Harbor Frieght Tools USA Inc., Term Loan B, 4.29%, 8/18/23 | United States | 118,275 | 118,431 | |||||||||||
Serta Simmons Holdings LLC, Term Loan, second lien, 9.18%, 11/08/24 | United States | 199,727 | 202,598 | |||||||||||
Ziggo BV, Term Loan E, 3.49%, 4/15/25 | United States | 181,200 | 182,305 | |||||||||||
|
| |||||||||||||
| 689,258 | ||||||||||||||
|
| |||||||||||||
| Diversified Telecommunication Services 0.0%† | ||||||||||||||
Sprint Communications Inc., Term Loan B, 3.56%, 2/02/24 | United States | �� | 225,000 | 225,603 | ||||||||||
Zayo Group, Term Loan B2, 3.51%, 1/19/24 | United States | 38,384 | 38,684 | |||||||||||
|
| |||||||||||||
| 264,287 | ||||||||||||||
|
| |||||||||||||
| Electric Utilities 0.0%† | ||||||||||||||
| l | Power Buyer LLC, Delayed Draw, first lien, Term Loan, 4.43%, 5/06/20 | United States | 65,949 | 65,908 | ||||||||||
|
| |||||||||||||
| Electronic Equipment, Instruments & Components 0.1% | ||||||||||||||
Veritas US Inc., Term Loan B, 6.772%, 1/27/23 | United States | 730,836 | 732,481 | |||||||||||
|
| |||||||||||||
| Food & Staples Retailing 0.0%† | ||||||||||||||
Albertsons Cos. Inc., Term Loan B4, 4.04%, 8/25/21 | United States | 299,250 | 300,747 | |||||||||||
|
| |||||||||||||
| Food Products 0.0%† | ||||||||||||||
Post Holdings Inc., Term Loan B, 3.28%, 5/24/24 | United States | 62,727 | 63,142 | |||||||||||
|
| |||||||||||||
| Health Care Providers & Services 0.1% | ||||||||||||||
Envision Healthcare Corp., Term Loan B, 4.15%, 12/01/23 | United States | 74,813 | 75,689 | |||||||||||
Inventiv Health Inc., Initial Term Loan, 4.95%, 11/09/23 | United States | 483,788 | 487,027 | |||||||||||
Team Health Inc., Term Loan B, 3.79%, 2/06/24 | United States | 239,946 | 239,526 | |||||||||||
Universal Services, Delayed Draw, Term Loan B, 4.79%, 7/28/22 | United States | 118,500 | 119,092 | |||||||||||
|
| |||||||||||||
| 921,334 | ||||||||||||||
|
| |||||||||||||
| Hotels, Restaurants & Leisure 0.0%† | ||||||||||||||
Boyd Gaming Corp., Term Loan B, 3.45%, 9/15/23 | United States | 64,444 | 64,876 | |||||||||||
|
| |||||||||||||
| Insurance 0.1% | ||||||||||||||
Asurion LLC, Term Loan, 10.04%, 8/31/21 | United States | 525,000 | 543,375 | |||||||||||
|
| |||||||||||||
| Internet Software & Services 0.0%† | ||||||||||||||
GTT Communications, Term Loan B, 5.06%, 1/09/24 | United States | 52,868 | 53,609 | |||||||||||
Rackspace Hosting Inc., Term Loan B, 4.67%, 11/03/23 | United States | 84,787 | 85,387 | |||||||||||
| franklintempleton.com | Annual Report | 39 |
FRANKLIN ALTERNATIVE STRATEGIES FUNDS
CONSOLIDATED STATEMENT OF INVESTMENTS
Franklin K2 Alternative Strategies Fund (continued)
| Country | Principal Amount* | Value | ||||||||||||
| l,n | Senior Floating Rate Interests (continued) | |||||||||||||
| Internet Software & Services (continued) | ||||||||||||||
Uber Technologies Inc., Term Loan, 5.01%, 7/13/23 | United States | 258,700 | $ | 257,665 | ||||||||||
|
| |||||||||||||
| 396,661 | ||||||||||||||
|
| |||||||||||||
| IT Services 0.0%† | ||||||||||||||
Gartner Inc., Term Loan B, 3.04%, 4/05/24 | United States | 30,000 | 30,262 | |||||||||||
Presidio Inc., Term Loan B, 4.398%, 2/02/22 | United States | 164,898 | 166,547 | |||||||||||
|
| |||||||||||||
| 196,809 | ||||||||||||||
|
| |||||||||||||
| Machinery 0.0%† | ||||||||||||||
North American Lifting Holdings Inc., Initial Term Loan, 5.647%, 11/27/20 | United States | 15,497 | 14,954 | |||||||||||
|
| |||||||||||||
| Media 0.0%† | ||||||||||||||
AMC Entertainment Holdings Inc., Term Loan B, 3.742%, 12/15/23 | United States | 24,938 | 25,131 | |||||||||||
Cablevision SA, Term Loan B, 3.25%, 7/17/25 | United States | 34,913 | 34,940 | |||||||||||
CBS Radio Inc., Term Loan B, 4.51%, 10/17/23 | United States | 90,316 | 91,230 | |||||||||||
|
| |||||||||||||
| 151,301 | ||||||||||||||
|
| |||||||||||||
| Metals & Mining 0.0%† | ||||||||||||||
Signode Industrial Group, Initial Term Loan B, 3.79%, 5/01/21 | United States | 23,750 | 23,957 | |||||||||||
|
| |||||||||||||
| Oil, Gas & Consumable Fuels 0.1% | ||||||||||||||
California Resources Corp., Term Loan L, 11.38%, 12/31/21 | United States | 485,000 | 537,744 | |||||||||||
Chesapeake Energy Corp., Term Loan A, 8.69%, 8/23/21 | United States | 293,445 | 317,776 | |||||||||||
MEG Energy Corp., Term Loan B, 4.68%, 12/31/23 | Canada | 28,422 | 28,409 | |||||||||||
Southcross Energy Partners LP, senior secured, Term Loan B, first lien guaranteed, 5.429%, 8/04/21 | United States | 29,252 | 26,510 | |||||||||||
|
| |||||||||||||
| 910,439 | ||||||||||||||
|
| |||||||||||||
| Retailing 0.0%† | ||||||||||||||
Talbots Inc., Term Loan, first lien, 5.54%, 3/19/20 | United States | 59,768 | 55,883 | |||||||||||
|
| |||||||||||||
| Semiconductors & Semiconductor Equipment 0.0%† | ||||||||||||||
Cavium Inc., Term Loan B, 3.28%, 8/16/22 | United States | 65,598 | 65,926 | |||||||||||
|
| |||||||||||||
| Software 0.0%† | ||||||||||||||
Change Healthcare Holdings LLC, Term Loan, 3.79%, 3/01/24 | United States | 159,818 | 160,517 | |||||||||||
|
| |||||||||||||
| Specialty Retail 0.0%† | ||||||||||||||
Bass Pro Group LLC, Term Loan B, 6.147%, 12/15/23 | United States | 245,000 | 238,492 | |||||||||||
The Men’s Warehouse Inc., Term Loan B, 4.50%, 6/18/21 | United States | 98,630 | 93,205 | |||||||||||
|
| |||||||||||||
| 331,697 | ||||||||||||||
|
| |||||||||||||
| Technology Hardware, Storage & Peripherals 0.1% | ||||||||||||||
Xerox Busines, Term Loan B, 4.99%, 12/07/23 | United States | 418,950 | 426,543 | |||||||||||
|
| |||||||||||||
| Trading Companies & Distributors 0.0%† | ||||||||||||||
HD Supply Inc., Term Loan B, 3.897%, 10/17/23 | United States | 144,275 | 145,297 | |||||||||||
|
| |||||||||||||
| Wireless Telecommunication Services 0.0%† | ||||||||||||||
Virgin Media, Term Loan I, 3.74%, 1/31/25 | United Kingdom | 210,000 | 211,138 | |||||||||||
|
| |||||||||||||
Total Senior Floating Rate Interests (Cost $7,856,679) | 7,995,761 | |||||||||||||
|
| |||||||||||||
| Foreign Government and Agency Securities 3.2% | ||||||||||||||
| i | Africa Finance Corp., senior note, Reg S, 3.875%, 4/13/24 | Supranational | 869,000 | 865,089 | ||||||||||
Argentine Bonos del Tesoro, | ||||||||||||||
22.75%, 3/05/18 | Argentina | 21,997,056 | ARS | 1,375,545 | ||||||||||
21.20%, 9/19/18 | Argentina | 12,181,123 | ARS | 763,740 | ||||||||||
| 40 | Annual Report | franklintempleton.com |
FRANKLIN ALTERNATIVE STRATEGIES FUNDS
CONSOLIDATED STATEMENT OF INVESTMENTS
Franklin K2 Alternative Strategies Fund (continued)
| Country | Principal Amount* | Value | ||||||||||||
| Foreign Government and Agency Securities (continued) | ||||||||||||||
Brazil Letras do Tesouro Nacional, senior note, zero cpn., 7/01/17 | Brazil | 3,700,000 | BRL | $ | 1,133,733 | |||||||||
| i | Eastern and Southern African Trade and Development Bank, senior note, Reg S, 5.375%, 3/14/22 | Supranational | 929,000 | 945,545 | ||||||||||
Government of Argentina, | ||||||||||||||
7.82%, 12/31/33 | Argentina | 1,589,400 | EUR | 1,894,835 | ||||||||||
2.26% to 3/31/19, 4.74% thereafter, 12/31/38 | Argentina | 2,313,071 | EUR | 1,680,408 | ||||||||||
i Reg S, 5.00%, 1/15/27 | Argentina | 419,000 | EUR | 454,720 | ||||||||||
senior bond, 7.82%, 12/31/33 | Argentina | 610,990 | EUR | 735,091 | ||||||||||
senior note, 8.75%, 6/02/17 | Argentina | 2,083,173 | 2,083,173 | |||||||||||
l senior note, FRN, 22.518%, 10/09/17 | Argentina | 34,739,921 | ARS | 2,153,325 | ||||||||||
i senior note, Reg S, 3.875%, 1/15/22 | Argentina | 1,046,000 | EUR | 1,187,180 | ||||||||||
senior note, 5.625%, 1/26/22 | Argentina | 525,000 | 548,362 | |||||||||||
| i | Government of Ecuador, senior note, Reg S, 10.75%, 3/28/22 | Ecuador | 316,000 | 340,095 | ||||||||||
| i | Government of Egypt, senior note, Reg S, 6.125%, 1/31/22 | Egypt | 1,185,000 | 1,219,365 | ||||||||||
| i | Government of Guatemala, senior bond, Reg S, 4.375%, 6/05/27 | Guatemala | 530,000 | 526,380 | ||||||||||
| c | Government of Hellenic Republic, senior note, 144A, 4.75%, 4/17/19 | Greece | 2,161,000 | EUR | 2,388,959 | |||||||||
| i | Government of Honduras, senior note, Reg S, 8.75%, 12/16/20 | Honduras | 200,000 | 229,624 | ||||||||||
| i | Government of Iraq, senior bond, Reg S, 5.80%, 1/15/28 | Iraq | 564,000 | 519,734 | ||||||||||
| i | Government of Pakistan, senior note, Reg S, 6.75%, 12/03/19 | Pakistan | 648,000 | 686,305 | ||||||||||
| i | Government of Paraguay, Reg S, | |||||||||||||
senior bond, 4.70%, 3/27/27 | Paraguay | 200,000 | 206,500 | |||||||||||
senior note, 4.625%, 1/25/23 | Paraguay | 945,000 | 994,612 | |||||||||||
Government of Poland, senior bond, 2.50%, 7/25/27 | Poland | 13,222,000 | PLN | 3,334,067 | ||||||||||
Government of Russia, | ||||||||||||||
7.40%, 12/07/22 | Russia | 189,093,000 | RUB | 3,320,619 | ||||||||||
7.75%, 9/16/26 | Russia | 20,242,000 | RUB | 360,987 | ||||||||||
i Government of Ukraine, Reg S, | ||||||||||||||
7.75%, 9/01/19 | Ukraine | 1,030,000 | 1,058,294 | |||||||||||
7.75%, 9/01/21 | Ukraine | 1,346,000 | 1,364,763 | |||||||||||
Mexican Bonos, senior bond, 5.75%, 3/05/26 | Mexico | 100,000 | u MXN | 482,983 | ||||||||||
| i | National Highways Authority of India, senior note, Reg S, 7.30%, 5/18/22 | India | 50,000,000 | INR | 778,535 | |||||||||
| c | Provincia de Buenos Aires, 144A, | |||||||||||||
senior bond, 7.875%, 6/15/27 | Argentina | 240,000 | 252,994 | |||||||||||
senior note, 5.75%, 6/15/19 | Argentina | 250,000 | 260,313 | |||||||||||
l senior note, FRN, 23.893%, 5/31/22 | Argentina | 15,505,000 | ARS | 982,152 | ||||||||||
senior note, 6.50%, 2/15/23 | Argentina | 185,000 | 191,475 | |||||||||||
|
| |||||||||||||
Total Foreign Government and Agency Securities | 35,319,502 | |||||||||||||
|
| |||||||||||||
| Asset-Backed Securities and Commercial Mortgage-Backed Securities 2.0% | ||||||||||||||
| Airlines 0.1% | ||||||||||||||
| c | Air Canada 2015-2 Class B Pass Through Trust, third lien note, 144A, 5.00%, 6/15/25 | Canada | 481,432 | 497,969 | ||||||||||
Latam Airlines 2015-1 Class B Pass Through Trust, secured note, 4.50%, 8/15/25 | Chile | 702,956 | 696,805 | |||||||||||
|
| |||||||||||||
| 1,194,774 | ||||||||||||||
|
| |||||||||||||
| Banks 0.0%† | ||||||||||||||
| l | Wells Fargo Mortgage Backed Securities 2003-M Trust, A1, FRN, 2.999%, 12/25/33 | United States | 27,828 | 28,086 | ||||||||||
| l | Wells Fargo Mortgage Backed Securities 2004-0 Trust, A1, FRN, | United States | 11,065 | 11,328 | ||||||||||
| franklintempleton.com | Annual Report | 41 |
FRANKLIN ALTERNATIVE STRATEGIES FUNDS
CONSOLIDATED STATEMENT OF INVESTMENTS
Franklin K2 Alternative Strategies Fund (continued)
| Country | Principal Amount* | Value | ||||||||||||
| Asset-Backed Securities and Commercial Mortgage-Backed Securities (continued) | ||||||||||||||
| Banks (continued) | ||||||||||||||
Wells Fargo Mortgage Backed Securities 2005-16 Trust, A18, 6.00%, 1/25/36 | United States | 5,402 | $ | 5,387 | ||||||||||
| l | Wells Fargo Mortgage Backed Securities 2005-AR10 Trust, 2A4, FRN, 3.116%, 6/25/35 | United States | 16,765 | 17,164 | ||||||||||
|
| |||||||||||||
| 61,965 | ||||||||||||||
|
| |||||||||||||
| Commercial Services & Supplies 0.0%† | ||||||||||||||
| c | Shenton Aircraft Investment I Ltd., 2015-A, 144A, 4.75%, 10/15/42 | United States | 301,829 | 310,669 | ||||||||||
|
| |||||||||||||
| Consumer Finance 0.1% | ||||||||||||||
American Express Credit Account Master Trust, | ||||||||||||||
l 2012-A, FRN, 1.259%, 1/15/20 | United States | 100,000 | 100,012 | |||||||||||
2014-A, 1.26%, 1/15/20 | United States | 100,000 | 99,996 | |||||||||||
2014-A, 1.49%, 4/15/20 | United States | 100,000 | 100,067 | |||||||||||
l 2014-A, FRN, 1.279%, 5/15/20 | United States | 100,000 | 100,088 | |||||||||||
| l | Bank of America Credit Card Trust, FRN, | |||||||||||||
A, 1.369%, 6/15/21 | United States | 100,000 | 100,484 | |||||||||||
A3, 1.279%, 1/15/20 | United States | 100,000 | 100,057 | |||||||||||
|
| |||||||||||||
| 600,704 | ||||||||||||||
|
| |||||||||||||
| Diversified Financial Services 1.6% | ||||||||||||||
| l | Adjustable Rate Mortgage 2005-1 Trust, 3A1, FRN, 3.216%, 5/25/35 | United States | 108,806 | 107,976 | ||||||||||
| c | AIM Aviation Finance Ltd., 2015-B1, 144A, 5.072%, 2/15/40 | Cayman Islands | 314,732 | 308,831 | ||||||||||
| c | Ajax Mortgage Loan 2016-B Trust, A, 144A, 4.00%, 9/25/65 | United States | 160,491 | 160,595 | ||||||||||
| c | Ajax Mortgage Loan 2016-C Trust, A, 144A, 4.00%, 10/25/57 | United States | 145,836 | 145,766 | ||||||||||
| l | Alliance Bancorp 2007-OA1 Trust, A1, FRN, 1.264%, 7/25/37 | United States | 326,234 | 247,744 | ||||||||||
Ally Auto Receivables 2016-3 Trust, A3, 1.44%, 8/17/20 | United States | 180,000 | 179,934 | |||||||||||
| l | American Express Issuance 2013-2 Trust II, A, FRN, 1.419%, 8/15/19 | United States | 240,000 | 240,945 | ||||||||||
| l | American Home Mortgage Investment 2005-2 Trust, 1A1, FRN, | United States | 91,309 | 78,021 | ||||||||||
| l | American Home Mortgage Investment 2006-1 Trust, 11A1, FRN, | United States | 321,762 | 278,138 | ||||||||||
Banc of America Alternative Loan 2003-8 Trust, 1CB1, 5.50%, 10/25/33 | United States | 9,851 | 10,075 | |||||||||||
Banc of America Alternative Loan 2004-6 Trust, 2A1, 6.00%, 7/25/34 | United States | 247,597 | 259,504 | |||||||||||
Banc of America Funding 2005-5 Trust, 1A1, 5.50%, 9/25/35 | United States | 14,384 | 15,153 | |||||||||||
Banc of America Funding 2007-4 Trust, 5A1, 5.50%, 11/25/34 | United States | 164,813 | 165,389 | |||||||||||
| l | Banc of America Mortgage 2005-A Trust, 2A1, FRN, 3.466%, 2/25/35 | United States | 10,378 | 10,383 | ||||||||||
| c | Bayview Opportunity Master Fund 2016-LT1 Trust, A1, 144A, | United States | 71,275 | 71,022 | ||||||||||
| c | Bayview Opportunity Master Fund IIA 2016-RPL3 Trust, A1, 144A, | United States | 42,554 | 42,474 | ||||||||||
| c | Bayview Opportunity Master Fund IIIA 2016-RN3 Trust, A1, 144A, | United States | 56,742 | 56,814 | ||||||||||
| c,l | Bayview Opportunity Master Fund IIIb 2017-RN2 Trust, A1, 144A, FRN, | United States | 100,000 | 100,250 | ||||||||||
| c | Bayview Opportunity Master Fund IVB 2017-NPL1 Trust, A1, A1, 144A, | United States | 111,819 | 111,915 | ||||||||||
BCAP LLC 2007-AA2 Trust, 22A1, 6.00%, 3/25/22 | United States | 186,701 | 184,490 | |||||||||||
| c | Blackbird Capital Aircraft Lease Securitization Ltd., 2016-1, A, 144A, 4.213%, 12/16/41 | United States | 249,688 | 256,467 | ||||||||||
| c,l | BLCP Hotel 2014-CLRN Trust, E, 144A, FRN, 4.659%, 8/15/29 | United States | 100,000 | 100,782 | ||||||||||
BMW Vehicle Owner 2014-A3 Trust, 0.97%, 11/26/18 | United States | 11,616 | 11,611 | |||||||||||
| 42 | Annual Report | franklintempleton.com |
FRANKLIN ALTERNATIVE STRATEGIES FUNDS
CONSOLIDATED STATEMENT OF INVESTMENTS
Franklin K2 Alternative Strategies Fund (continued)
| Country | Principal Amount* | Value | ||||||||||||
| Asset-Backed Securities and Commercial Mortgage-Backed Securities (continued) | ||||||||||||||
| Diversified Financial Services (continued) | ||||||||||||||
BXHT 2015-DRMZ Mortgage Trust, 9.189%, 7/15/29 | United States | 239,031 | $ | 232,644 | ||||||||||
| c | CAM Mortgage 2016-1 Trust, 144A, | |||||||||||||
A, 4.00%, 1/15/56 | United States | 32,924 | 33,233 | |||||||||||
l M, FRN, 5.00%, 1/15/56 | United States | 150,000 | 145,923 | |||||||||||
| c,l | CCRESG Commercial Mortgage 2016-HEAT Trust, D, 144A, FRN, 5.488%, 4/10/29 | United States | 100,000 | 102,189 | ||||||||||
Chase Issuance Trust, | ||||||||||||||
l 2007-A12, FRN, 1.039%, 8/15/19 | United States | 330,000 | 330,007 | |||||||||||
2014-A6, 1.26%, 7/15/19 | United States | 100,000 | 99,997 | |||||||||||
l 2015-A1, FRN, 1.309%, 2/18/20 | United States | 110,000 | 110,206 | |||||||||||
2015-A2, 1.59%, 2/18/20 | United States | 135,000 | 135,227 | |||||||||||
l A5, FRN, 1.359%, 4/15/21 | United States | 120,000 | 120,624 | |||||||||||
| c | CLI Funding LLC, 2014-2A, 144A, 3.38%, 10/18/29 | United States | 73,545 | 72,691 | ||||||||||
| c | Coinstar Funding 2017-1 LLC, A2, 144A, 5.216%, 4/25/47 | United States | 245,000 | 249,371 | ||||||||||
| c | Colony American Finance Ltd., 2015-1, D, 144A, 5.649%, 10/15/47 | United States | 115,000 | 117,943 | ||||||||||
| c,l | Colony American Homes, 2014-2, 144A, FRN, 4.23%, 7/17/31 | United States | 100,000 | 100,914 | ||||||||||
| c,l | COMM 2016-SAVA Mortgage Trust, C, 144A, FRN, 3.99%, 10/15/34 | United States | 155,000 | 156,132 | ||||||||||
Countrywide Alternative Loan Trust, | ||||||||||||||
2003-1A1, 5.75%, 12/25/33 | United States | 66,267 | 68,085 | |||||||||||
2003-A7, 5.50%, 7/25/33 | United States | 20,698 | 20,612 | |||||||||||
2004-16CB, 5.50%, 7/25/34 | United States | 48,592 | 49,716 | |||||||||||
2004-16CB, 5.50%, 8/25/34 | United States | 50,579 | 52,197 | |||||||||||
2004-1A1, 5.50%, 4/25/34 | United States | 42,770 | 43,541 | |||||||||||
2004-5A1, 5.75%, 1/25/35 | United States | 8,708 | 8,767 | |||||||||||
2004-J10, 6.00%, 9/25/34 | United States | 109,647 | 113,288 | |||||||||||
2005-2A1, 5.50%, 2/25/25 | United States | 9,450 | 9,644 | |||||||||||
l 2005-2A1, FRN, 1.234%, 5/25/35 | United States | 49,783 | 41,722 | |||||||||||
| l | Countrywide Home Loans Mortgage Pass-Through 2004-12 Trust, 8A1, FRN, 3.271%, 8/25/34 | United States | 14,643 | 14,049 | ||||||||||
| l | Countrywide Home Loans Mortgage Pass-Through 2004-HYB4 Trust, 2A1, FRN, 3.204%, 9/20/34 | United States | 106,267 | 103,281 | ||||||||||
Countrywide Home Loans Mortgage Pass-Through 2005-21 Trust, A17, 5.50%, 10/25/35 | United States | 14,279 | 12,937 | |||||||||||
| c | CPS Auto Receivables 2014-B Trust, D, 144A, 4.62%, 5/15/20 | United States | 110,000 | 110,568 | ||||||||||
| c | CPS Auto Receivables 2016-B Trust, E, 144A, 8.14%, 5/15/23 | United States | 500,000 | 539,249 | ||||||||||
| c,l | Credit Suisse Mortgage Capital Certificates, 2015-A, 144A, FRN, 2.239%, 3/15/28 | United States | 110,000 | 110,014 | ||||||||||
| c | CSMC OA LLC, 2014-E, 144A, 4.373%, 9/15/37 | United States | 300,000 | 261,549 | ||||||||||
| l | Deutsche Mortgage Securities Inc. Mortgage Loan 2004-7 Trust, AR1, FRN, 1.374%, 6/25/34 | United States | 97,195 | 90,106 | ||||||||||
| l | DSLA Mortgage Loan 2005-AR5 Trust, 2A1A, FRN, 1.334%, 9/19/45 | United States | 60,354 | 46,964 | ||||||||||
| c | DT Auto Owner 2014-3 Trust, D, 144A, 4.47%, 11/15/21 | United States | 50,000 | 51,203 | ||||||||||
| c | DT Auto Owner 2016-1 Trust, D, 144A, 4.66%, 12/15/22 | United States | 180,000 | 183,893 | ||||||||||
| c | DT Auto Owner 2016-2 Trust, D, 144A, 5.43%, 11/15/22 | United States | 240,000 | 250,966 | ||||||||||
| i,l | Dukinfield 2 PLC, FRN, Reg S, 1.595%, 12/20/52 | United Kingdom | 229,351 | GBP | 299,276 | |||||||||
| i,l | Eurosail PLC, 2007-2X, FRN, Reg S, 0.494%, 3/13/45 | United Kingdom | 67,853 | GBP | 85,515 | |||||||||
| c | First Investors Auto Owner 2016-1 Trust, D, 144A, 4.70%, 4/18/22 | United States | 110,000 | 114,514 | ||||||||||
Ford Credit Auto Owner Trust, | ||||||||||||||
c 2014-A, 144A, 2.31%, 4/15/26 | United States | 100,000 | 101,304 | |||||||||||
2014-A3, 0.90%, 10/15/18 | United States | 11,931 | 11,926 | |||||||||||
| franklintempleton.com | Annual Report | 43 |
FRANKLIN ALTERNATIVE STRATEGIES FUNDS
CONSOLIDATED STATEMENT OF INVESTMENTS
Franklin K2 Alternative Strategies Fund (continued)
| Country | Principal Amount* | Value | ||||||||||||
| Asset-Backed Securities and Commercial Mortgage-Backed Securities (continued) | ||||||||||||||
| Diversified Financial Services (continued) | ||||||||||||||
Ford Credit Auto Owner Trust (continued) | ||||||||||||||
2014-A3, 1.06%, 5/15/19 | United States | 20,286 | $ | 20,265 | ||||||||||
2015-A3, 1.28%, 9/15/19 | United States | 49,282 | 49,265 | |||||||||||
| l | Freddie Mac Structured Agency Credit Risk Debt Notes, FRN, | |||||||||||||
2013-M2, 5.274%, 11/25/23 | United States | 250,000 | 278,043 | |||||||||||
2015-M2, 2.874%, 10/25/27 | United States | 250,000 | 255,896 | |||||||||||
2015-M3, 4.324%, 10/25/27 | United States | 250,000 | 275,556 | |||||||||||
| c | GCAT 2017-2 LLC, A1, 144A, 3.50%, 4/25/47 | United States | 132,577 | 132,590 | ||||||||||
| c | GCAT 2017-3 LLC, A1, 144A, 3.352%, 4/25/47 | United States | 96,655 | 96,991 | ||||||||||
| l | GMACM Mortgage Loan 2005-AR4 Trust, 3A1, FRN, 3.676%, 7/19/35 | United States | 181,529 | 176,752 | ||||||||||
| c,l | GP Portfolio 2014-GGP Trust, A, 144A, FRN, 2.189%, 2/15/27 | United States | 64,335 | 64,544 | ||||||||||
GSR Mortgage Loan 2005-4F Trust, 6A1, 6.50%, 2/25/35 | United States | 15,864 | 15,928 | |||||||||||
| l | GSR Mortgage Loan 2005-AR6 Trust, 4A5, FRN, 3.059%, 9/25/35 | United States | 147,675 | 148,389 | ||||||||||
| l | Harborview Mortgage Loan 2003-2 Trust, 1A, FRN, 1.744%, 10/19/33 | United States | 102,616 | 97,770 | ||||||||||
| l | Harborview Mortgage Loan 2004-11 Trust, 2A2A, FRN, 1.644%, 1/19/35 | United States | 149,252 | 130,112 | ||||||||||
| l | Harborview Mortgage Loan 2004-2 Trust, 1A1, FRN, 1.524%, 6/19/34 | United States | 150,397 | 144,973 | ||||||||||
Honda Auto Receivables 2014-2 Owner Trust, A3, 0.77%, 3/19/18 | United States | 4,855 | 4,853 | |||||||||||
Honda Auto Receivables 2014-3 Owner Trust, A4, 1.31%, 10/15/20 | United States | 30,000 | 29,995 | |||||||||||
Honda Auto Receivables 2015-1 Owner Trust, A3, 1.05%, 10/15/18 | United States | 25,002 | 24,985 | |||||||||||
Honda Auto Receivables 2015-3 Owner Trust, A3, 1.27%, 4/18/19 | United States | 103,505 | 103,461 | |||||||||||
Hyundai Auto Receivables 2015-A Owner Trust, A3, 1.05%, 4/15/19 | United States | 23,038 | 23,015 | |||||||||||
| l | JP Morgan Chase Commercial Mortgage Securities 2007-LDP10 Trust, AM, FRN, 5.464%, 1/15/49 | United States | 53,095 | 53,047 | ||||||||||
| c,l | JP Morgan Chase Commercial Mortgage Securities 2015-SGP Trust, D, 144A, FRN, 5.489%, 7/15/36 | United States | 180,000 | 182,464 | ||||||||||
| l | JP Morgan Mortgage 2003-A2 Trust, 3A1, FRN, 2.98%, 11/25/33 | United States | 11,995 | 11,542 | ||||||||||
JP Morgan Mortgage 2004-S1 Trust, 2A1, 6.00%, 9/25/34 | United States | 160,974 | 163,253 | |||||||||||
| l | JP Morgan Mortgage 2005-A1 Trust, 6T1, FRN, 3.415%, 2/25/35 | United States | 21,409 | 21,250 | ||||||||||
| l | JP Morgan Mortgage 2005-A3 Trust, 4A1, FRN, 3.089%, 6/25/35 | United States | 10,588 | 10,696 | ||||||||||
| l | JP Morgan Mortgage 2006-A1 Trust, 1A2, FRN, 3.224%, 2/25/36 | United States | 40,635 | 37,947 | ||||||||||
| l | JP Morgan Mortgage 2006-A7 Trust, 2A4, FRN, 3.252%, 1/25/37 | United States | 32,772 | 31,117 | ||||||||||
| l | JP Morgan Mortgage 2007-A1 Trust, 4A2, FRN, 3.197%, 7/25/35 | United States | 7,948 | 7,986 | ||||||||||
| l | Lehman XS 2006-2N Trust, 1A1, FRN, 1.284%, 2/25/46 | United States | 69,301 | 56,363 | ||||||||||
| i,l | Ludgate Funding PLC, FRN, Reg S, |
| ||||||||||||
2007-A2B, 0.00% 1/01/61 | United Kingdom | 36,816 | EUR | 39,623 | ||||||||||
2008-A1, 0.939%, 1/01/61 | United Kingdom | 172,674 | GBP | 216,978 | ||||||||||
| l | MASTR Adjustable Rate Mortgages 2004-7 Trust, 3A1, FRN, 2.915%, 7/25/34 | United States | 48,313 | 47,197 | ||||||||||
MASTR Alternative Loan 2004-2 Trust, 8A4, 5.50%, 3/25/34 | United States | 245,000 | 250,127 | |||||||||||
MASTR Alternative Loan 2004-8 Trust, 2A1, 6.00%, 9/25/34 | United States | 88,350 | 94,609 | |||||||||||
| c | Merlin Aviation Holdings DAC, 2016-A, 144A, 4.50%, 12/15/32 | United States | 188,750 | 185,722 | ||||||||||
| l | Merrill Lynch Mortgage Investors MLCC, FRN, |
| ||||||||||||
2006-1A, 3.143%, 2/25/36 | United States | 104,774 | 99,719 | |||||||||||
2006-2A, 3.019%, 5/25/36 | United States | 10,852 | 10,578 | |||||||||||
| c,l | Morgan Stanley Capital I 2011-C2 Trust, E, 144A, FRN, 5.483%, 6/15/44 | United States | 150,000 | 142,948 | ||||||||||
| c | Motel 6 2015-M6MZ Trust, M, 144A, 8.23%, 2/05/20 | United States | 983,758 | 999,744 | ||||||||||
National City Mortgage Capital 2008-1 Trust, 2A1, 6.00%, 3/25/38 | United States | 49,802 | 52,035 | |||||||||||
| l | New York Mortgage 2006-1 Trust, 2A2, FRN, 3.583%, 5/25/36 | United States | 30,687 | 28,350 | ||||||||||
| i,l | Newgate Fund PLC, 2007-A2B, FRN, Reg S, 0.27%, 12/15/50 | United Kingdom | 79,349 | EUR | 88,040 | |||||||||
| c,l | NextGear Floorplan Master 2017-A1 Owner Trust, 144A, FRN, 2.091%, 4/18/22 | United States | 240,000 | 240,190 | ||||||||||
Nissan Auto Receivables 2016-C Owner Trust, A3, 1.18%, 1/15/21 | United States | 85,000 | 84,483 | |||||||||||
| c | OneMain Financial Issuance 2014-A Trust, 144A, 3.19%, 3/18/26 | United States | 150,000 | 151,697 | ||||||||||
| 44 | Annual Report | franklintempleton.com |
FRANKLIN ALTERNATIVE STRATEGIES FUNDS
CONSOLIDATED STATEMENT OF INVESTMENTS
Franklin K2 Alternative Strategies Fund (continued)
| Country | Principal Amount* | Value | ||||||||||||
| Asset-Backed Securities and Commercial Mortgage-Backed Securities (continued) | ||||||||||||||
| Diversified Financial Services (continued) | ||||||||||||||
| c | OneMain Financial Issuance 2015-3 Trust, B, 144A, 4.16%, 11/20/28 | United States | 155,000 | $ | 150,752 | |||||||||
| c | OneMain Financial Issuance 2015-D Trust, 144A, 5.64%, 7/18/25 | United States | 285,000 | 286,152 | ||||||||||
| c | OneMain Financial Issuance 2016-2 Trust, B, 144A, 5.94%, 3/20/28 | United States | 335,000 | 349,568 | ||||||||||
| l | RALI 2006-QO4 Trust, 2A1, FRN, 1.214%, 4/25/46 | United States | 91,756 | 83,233 | ||||||||||
| l | RALI 2006-QO7 Trust, 3A2, FRN, 1.229%, 9/25/46 | United States | 40,438 | 31,655 | ||||||||||
| l | RFMSI 2005-SA1 Trust, FRN, 4.251%, 3/25/35 | United States | 139,309 | 114,817 | ||||||||||
| i,l | RMAC Securities PLC, FRN, Reg S, |
| ||||||||||||
2005-A2C, 0.031%, 6/12/43 | United Kingdom | 22,007 | EUR | 24,048 | ||||||||||
2006-A2C, zero cpn., 6/12/44 | United Kingdom | 51,716 | EUR | 56,231 | ||||||||||
| c,l | SCG Trust 2013-SRP1, FRN, 144A, |
| ||||||||||||
A, 2.639%, 11/15/26 | United States | 100,000 | 99,301 | |||||||||||
B, 3.489%, 11/15/26 | United States | 100,000 | 96,613 | |||||||||||
C, 4.239%, 11/15/26 | United States | 100,000 | 97,510 | |||||||||||
D, 4.333%, 11/15/26 | United States | 245,000 | 231,514 | |||||||||||
| c | Sierra Timeshare 2013-3 Receivables Funding LLC, A, 144A, 2.20%, 10/20/30 | United States | 34,235 | 34,254 | ||||||||||
| l | SLM Private Credit Student Loan 2003-A Trust, A3, FRN, 3.56%, A, 6/15/32 | United States | 115,000 | 115,023 | ||||||||||
| l | SLM Private Credit Student Loan 2003-B Trust, A3, FRN, 3.28%, B, 3/15/33 | United States | 300,000 | 299,728 | ||||||||||
| c | Sofi Professional Loan Program 2016-A LLC, B, 144A, 3.57%, 1/26/38 | United States | 183,953 | 185,597 | ||||||||||
| l | Structured Adjustable Rate Mortgage Loan Trust, FRN, |
| ||||||||||||
1A, 3.229%, 6/25/34 | United States | 17,292 | 17,159 | |||||||||||
2005-A1, 1.334%, 7/25/35 | United States | 329,952 | 267,410 | |||||||||||
7A3, 3.343%, 9/25/34 | United States | 28,738 | 29,069 | |||||||||||
Structured Asset Securities Corp. 2005-1 Trust, 7A7, 5.50%, 2/25/35 | United States | 17,519 | 17,517 | |||||||||||
| c | TAL Advantage V LLC, A, 144A, 3.55%, 11/20/38 | United States | 65,000 | 64,484 | ||||||||||
| i,l | Towd Point Mortgage Funding 2016-GR1X PLC, B, FRN, Reg S, 1.736%, 7/20/46 | United Kingdom | 100,000 | GBP | 129,980 | |||||||||
Toyota Auto Receivables 2014-C Owner Trust, A3, 0.93%, 7/16/18 | United States | 7,789 | 7,783 | |||||||||||
Toyota Auto Receivables 2015-C Owner Trust, A3, 1.34%, 6/17/19 | United States | 118,367 | 118,366 | |||||||||||
Toyota Auto Receivables 2016-C Owner Trust, A3, 1.14%, 8/17/20 | United States | 70,000 | 69,657 | |||||||||||
USAA Auto Owner 2015-1 Trust, A3, 1.20%, 6/17/19 | United States | 86,603 | 86,577 | |||||||||||
USAA Auto Owner 2016-1 Trust, A3, 1.20%, 6/15/20 | United States | 120,000 | 119,664 | |||||||||||
| c | VOLT LIV LLC, 144A, |
| ||||||||||||
2017-A1, 3.625%, 2/25/47 | United States | 115,991 | 116,562 | |||||||||||
2017-A2, 6.00%, 2/25/47 | United States | 100,000 | 101,633 | |||||||||||
| c | VOLT LV LLC, 2017-A1, 144A, 3.50%, 3/25/47 | United States | 96,168 | 96,492 | ||||||||||
| c | VOLT XL LLC, 2015-A2, 144A, 4.875%, 11/27/45 | United States | 140,000 | 138,192 | ||||||||||
| c | VOLT XLVIII LLC, 2016-A1, 144A, 3.50%, 7/25/46 | United States | 208,102 | 209,426 | ||||||||||
| c | VOLT XXXIII LLC, 2015-A1, 144A, 3.50%, 3/25/55 | United States | 91,869 | 92,452 | ||||||||||
| c | VOLT XXXV, 2016-A1, 144A, 3.50%, 9/25/46 | United States | 171,920 | 172,862 | ||||||||||
| l | Wells Fargo Bank, N.A., Adjustable Rate Mortgage 2004-4 Trust, 3A1, FRN, 3.367%, 3/25/35 | United States | 43,889 | 42,809 | ||||||||||
| c,l | WF-RBS Commercial Mortgage 2012-C6 Trust, D, 144A, FRN, 5.577%, 4/15/45 | United States | 150,000 | 151,609 | ||||||||||
| l | World Financial Network Credit Card Master 2015-A Trust, FRN, 1.469%, 2/15/22 | United States | 120,000 | 120,275 | ||||||||||
|
| |||||||||||||
| 17,753,328 | ||||||||||||||
|
| |||||||||||||
| Equity Real Estate Investment Trusts (REITs) 0.1% | ||||||||||||||
| c | American Homes 4 Rent, 144A, | |||||||||||||
2014-E, 6.231%, 10/17/36 | United States | 250,000 | 278,708 | |||||||||||
2014-E, 6.418%, 12/17/36 | United States | 100,000 | 112,832 | |||||||||||
| franklintempleton.com | Annual Report | 45 |
FRANKLIN ALTERNATIVE STRATEGIES FUNDS
CONSOLIDATED STATEMENT OF INVESTMENTS
Franklin K2 Alternative Strategies Fund (continued)
| Country | Principal Amount* | Value | ||||||||||||
| Asset-Backed Securities and Commercial Mortgage-Backed Securities (continued) | ||||||||||||||
| Equity Real Estate Investment Trusts (REITs) (continued) | ||||||||||||||
| c | American Homes 4 Rent, 144A (continued) | |||||||||||||
2015-E, 5.639%, 4/17/52 | United States | 210,000 | $ | 226,190 | ||||||||||
|
| |||||||||||||
| 617,730 | ||||||||||||||
|
| |||||||||||||
| Hotels, Restaurants & Leisure 0.0%† | ||||||||||||||
| c,m | Five Guys Holdings Inc., 2017-A2, 144A, 4.60%, 7/25/47 | United States | 75,000 | 75,000 | ||||||||||
|
| |||||||||||||
| Mortgage Real Estate Investment Trusts (REITs) 0.0%† | ||||||||||||||
Citigroup Mortgage Loan 2005-2 Trust, 1A4, FRN, 2.971%, 5/25/35 | United States | 85 | 85 | |||||||||||
| l | Citigroup Mortgage Loan 2005-3 Trust, 2A3, FRN, 3.035%, 8/25/35 | United States | 99,861 | 96,711 | ||||||||||
| c,l | Citigroup Mortgage Loan 2009-10 Trust, 6A2, 144A, FRN, 3.183%, 9/25/34 | United States | 105,421 | 100,450 | ||||||||||
|
| |||||||||||||
| 197,246 | ||||||||||||||
|
| |||||||||||||
| Thrifts & Mortgage Finance 0.1% | ||||||||||||||
Citibank Credit Card Issuance Trust, |
| |||||||||||||
l 2013-A2, FRN, 1.309%, 5/26/20 | United States | 125,000 | 125,267 | |||||||||||
l 2013-A7, FRN, 1.424%, 9/10/20 | United States | 200,000 | 200,892 | |||||||||||
2014-A8, 1.73%, 4/09/20 | United States | 100,000 | 100,283 | |||||||||||
Credit Suisse First Boston Mortgage Securities Corp., |
| |||||||||||||
l 2003-4A1, FRN, 3.314%, 12/25/33 | United States | 5,519 | 5,491 | |||||||||||
2003-4A4, 5.75%, 11/25/33 | United States | 26,785 | 28,163 | |||||||||||
l 2003-7A1, FRN, 3.203%, 11/25/33 | United States | 8,595 | 8,392 | |||||||||||
l 2004-3A1, FRN, 3.358%, 5/25/34 | United States | 21,752 | 20,571 | |||||||||||
2005-2A1, 5.25%, 11/25/20 | United States | 45,063 | 44,239 | |||||||||||
| l | GS Mortgage Securities 2007-GG10 Trust, AM, FRN, 5.768%, 8/10/45 | United States | 510,000 | 513,298 | ||||||||||
| l | IndyMac INDX Mortgage Loan 2004-AR7 Trust, A5, FRN, 2.244%, 9/25/34 | United States | 70,190 | 62,063 | ||||||||||
| l | IndyMac INDX Mortgage Loan 2004-AR12 Trust, A1, FRN, 1.804%, 12/25/34 | United States | 104,614 | 88,970 | ||||||||||
| l | IndyMac INDX Mortgage Loan 2006-AR2 Trust, 2A1, FRN, 1.234%, 2/25/46 | United States | 343,487 | 278,518 | ||||||||||
| l | IndyMac INDX Mortgage Loan 2005-AR11 Trust, A3, FRN, 3.16%, 8/25/35 | United States | 82,143 | 68,496 | ||||||||||
|
| |||||||||||||
| 1,544,643 | ||||||||||||||
|
| |||||||||||||
Total Asset-Backed Securities and Commercial Mortgage-Backed Securities (Cost $21,732,878) | 22,356,059 | |||||||||||||
|
| |||||||||||||
| Number of Contracts | ||||||||||||||
| Options Purchased 0.2% | ||||||||||||||
| Calls – Exchange-Traded | ||||||||||||||
| Auto Components 0.0%† | ||||||||||||||
Adient PLC, October Strike Price $80.00, Expires 10/20/17 | United States | 225 | 39,375 | |||||||||||
|
| |||||||||||||
| Beverages 0.0%† | ||||||||||||||
Molson Coors Brewing Co., October Strike Price $97.50, Expires 10/20/17 | United States | 18 | 5,940 | |||||||||||
|
| |||||||||||||
| Biotechnology 0.0%† | ||||||||||||||
Emergent BioSolutions Inc., September Strike Price $35.00, Expires 9/15/17 | United States | 60 | 9,150 | |||||||||||
Intercept Pharmaceuticals Inc., June Strike Price $130.00, Expires 6/16/17 | United States | 16 | 320 | |||||||||||
|
| |||||||||||||
| 9,470 | ||||||||||||||
|
| |||||||||||||
| Chemicals 0.0%† | ||||||||||||||
The Dow Chemical Co., September Strike Price $70.00, Expires 9/15/17 | United States | 136 | 4,692 | |||||||||||
The Dow Chemical Co., January Strike Price $70.00, Expires 1/19/18 | United States | 136 | 14,960 | |||||||||||
|
| |||||||||||||
| 19,652 | ||||||||||||||
|
| |||||||||||||
| 46 | Annual Report | franklintempleton.com |
FRANKLIN ALTERNATIVE STRATEGIES FUNDS
CONSOLIDATED STATEMENT OF INVESTMENTS
Franklin K2 Alternative Strategies Fund (continued)
| Country | Number of Contracts | Value | ||||||||||||
| Options Purchased (continued) | ||||||||||||||
| Calls – Exchange-Traded (continued) | ||||||||||||||
| Construction & Engineering 0.0%† | ||||||||||||||
Dycom Industries Inc., June Strike Price $110.00, Expires 6/16/17 | United States | 3 | $ | 21 | ||||||||||
|
| |||||||||||||
| Construction Materials 0.0%† | ||||||||||||||
Cemex SAB de CV, ADR, July Strike Price $9.00, Expires 7/21/17 | Mexico | 151 | 2,416 | |||||||||||
|
| |||||||||||||
| Consumer Finance 0.0%† | ||||||||||||||
PRA Group Inc., June Strike Price $35.00, Expires 6/16/17 | United States | 11 | 660 | |||||||||||
PRA Group Inc., June Strike Price $37.50, Expires 6/16/17 | United States | 90 | 900 | |||||||||||
|
| |||||||||||||
| 1,560 | ||||||||||||||
|
| |||||||||||||
| Diversified Telecommunication Services 0.0%† | ||||||||||||||
Frontier Communications Corp., August Strike Price $3.00, Expires 8/18/17 | United States | 193 | 965 | |||||||||||
Frontier Communications Corp., November Strike Price $1.50, Expires 11/17/17 | United States | 130 | 1,820 | |||||||||||
Telecom Italia SpA, December Strike Price 0.90 EUR, Expires 12/15/17 | Italy | 1,118 | 55,260 | |||||||||||
Telecom Italia SpA, June Strike Price 0.76 EUR, Expires 6/15/18 | Italy | 554 | 80,780 | |||||||||||
|
| |||||||||||||
| 138,825 | ||||||||||||||
|
| |||||||||||||
| Electronic Equipment, Instruments & Components 0.0%† | ||||||||||||||
Knowles Corp., June Strike Price $22.50, Expires 6/16/17 | United States | 47 | 1,410 | |||||||||||
|
| |||||||||||||
| Exchange Traded Funds 0.0%† | ||||||||||||||
PowerShares QQQ Trust Series 1, June Strike Price $137.00, Expires 6/16/17 | United States | 20 | 9,660 | |||||||||||
SPDR S&P Oil & Gas Exploration & Production ETF, December Strike Price $35.00, Expires 12/15/17 | United States | 476 | 84,014 | |||||||||||
|
| |||||||||||||
| 93,674 | ||||||||||||||
|
| |||||||||||||
| Food & Staples Retailing 0.0%† | ||||||||||||||
The Kroger Co., October Strike Price $29.00, Expires 10/20/17 | United States | 308 | 70,840 | |||||||||||
|
| |||||||||||||
| Insurance 0.0%† | ||||||||||||||
American International Group Inc., January Strike Price $65.00, Expires 1/19/18 | United States | 56 | 17,080 | |||||||||||
American International Group Inc., January Strike Price $67.50, Expires 1/19/18 | United States | 55 | 11,440 | |||||||||||
|
| |||||||||||||
| 28,520 | ||||||||||||||
|
| |||||||||||||
| Internet Software & Services 0.0%† | ||||||||||||||
| d | Pandora Media Inc., June Strike Price $15.00, Expires 6/16/17 | United States | 32 | 64 | ||||||||||
WebMD Health Corp., June Strike Price $55.00, Expires 6/16/17 | United States | 32 | 6,400 | |||||||||||
|
| |||||||||||||
| 6,464 | ||||||||||||||
|
| |||||||||||||
| Media 0.1% | ||||||||||||||
Charter Communications Inc., January Strike Price $360.00, Expires 1/19/18 | United States | 62 | 146,320 | |||||||||||
DISH Network Corp., January Strike Price $70.00, Expires 1/19/18 | United States | 508 | 228,600 | |||||||||||
Liberty Global PLC, July Strike Price $40.00, Expires 7/21/17 | United Kingdom | 272 | 1,088 | |||||||||||
Vivendi SA, September Strike Price 22.00 EUR, Expires 9/15/17 | France | 196 | 4,184 | |||||||||||
|
| |||||||||||||
| 380,192 | ||||||||||||||
|
| |||||||||||||
| Metals & Mining 0.0%† | ||||||||||||||
AK Steel Holding Corp., June Strike Price $6.50, Expires 6/16/17 | United States | 302 | 5,134 | |||||||||||
AK Steel Holding Corp., June Strike Price $7.00, Expires 6/16/17 | United States | 289 | 2,601 | |||||||||||
Teck Resources Ltd., August Strike Price $22.00, Expires 8/18/17 | Canada | 63 | 2,268 | |||||||||||
| franklintempleton.com | Annual Report | 47 |
FRANKLIN ALTERNATIVE STRATEGIES FUNDS
CONSOLIDATED STATEMENT OF INVESTMENTS
Franklin K2 Alternative Strategies Fund (continued)
| Country | Number of Contracts | Value | ||||||||||||||||
| Options Purchased (continued) | ||||||||||||||||||
| Calls – Exchange-Traded (continued) | ||||||||||||||||||
| Metals & Mining (continued) | ||||||||||||||||||
Thyssenkrupp AG, September Strike Price 24.00 EUR, Expires 9/15/17 | Germany | 786 | $ | 114,784 | ||||||||||||||
Thyssenkrupp AG, September Strike Price 26.00 EUR, Expires 9/15/17 | Germany | 214 | 15,626 | |||||||||||||||
|
| |||||||||||||||||
| 140,413 | ||||||||||||||||||
|
| |||||||||||||||||
| Multi-Utilities 0.0%† | ||||||||||||||||||
E.ON SE, December Strike Price 8.00 EUR, Expires 12/15/17 | Germany | 726 | 38,331 | |||||||||||||||
|
| |||||||||||||||||
| Semiconductors & Semiconductor Equipment 0.0%† | ||||||||||||||||||
Cypress Semiconductor Corp., July Strike Price $14.00, Expires 7/21/17 | United States | 151 | 10,570 | |||||||||||||||
NXP Semiconductors NV, January Strike Price $110.00, Expires 1/19/18 | Netherlands | 222 | 108,780 | |||||||||||||||
|
| |||||||||||||||||
| 119,350 | ||||||||||||||||||
|
| |||||||||||||||||
| Software 0.0%† | ||||||||||||||||||
Bottomline Technologies de Inc., June Strike Price $25.00, Expires 6/16/17 | United States | 32 | 1,680 | |||||||||||||||
Mobileye NV, January Strike Price $60.00, Expires 1/19/18 | Israel | 26 | 8,580 | |||||||||||||||
ServiceNow Inc., July Strike Price $110.00, Expires 7/21/17 | United States | 15 | 2,640 | |||||||||||||||
TiVo Corp., June Strike Price $21.00, Expires 6/16/17 | United States | 32 | 1,040 | |||||||||||||||
|
| |||||||||||||||||
| 13,940 | ||||||||||||||||||
|
| |||||||||||||||||
| Wireless Telecommunication Services 0.0%† | ||||||||||||||||||
Vodafone Group PLC, ADR, January Strike Price $32.00, Expires 1/19/18 | United Kingdom | 552 | 30,360 | |||||||||||||||
Vodafone Group PLC, ADR, January Strike Price $40.00, Expires 1/19/18 | United Kingdom | 36 | 108 | |||||||||||||||
|
| |||||||||||||||||
| 30,468 | ||||||||||||||||||
|
| |||||||||||||||||
| Counterparty | Notional Amount* | |||||||||||||||||
| Calls – Over-the-Counter | ||||||||||||||||||
| Currency Options 0.0%† | ||||||||||||||||||
USD/EUR, July Strike Price $1.05, Expires 7/31/17 | United States | MSCO | 2,149,000 | 372 | ||||||||||||||
|
| |||||||||||||||||
| Number of Contracts | ||||||||||||||||||
| Puts – Exchange-Traded | ||||||||||||||||||
| Aerospace & Defense 0.0%† | ||||||||||||||||||
Zodiac Aerospace, June Strike Price 20.00 EUR, Expires 6/16/17 | France | 47 | 264 | |||||||||||||||
|
| |||||||||||||||||
| Diversified Financial Services 0.1% | ||||||||||||||||||
CAC 40 Index, July Strike Price 5,100.00 EUR, Expires 7/21/17 | France | 85 | 52,717 | |||||||||||||||
Deutsche Boerse AG German Stock Index DAX, July Strike Price 12,000.00 EUR, Expires 7/21/17 | Germany | 55 | 21,810 | |||||||||||||||
| 48 | Annual Report | franklintempleton.com |
FRANKLIN ALTERNATIVE STRATEGIES FUNDS
CONSOLIDATED STATEMENT OF INVESTMENTS
Franklin K2 Alternative Strategies Fund (continued)
| Country | Number of Contracts | Value | ||||||||||||
| Options Purchased (continued) | ||||||||||||||
| Puts – Exchange-Traded (continued) | ||||||||||||||
| Diversified Financial Services (continued) | ||||||||||||||
EURO STOXX 50 Price EUR, July Strike Price 3,400.00 EUR, Expires 7/21/17 | Germany | 99 | $ | 31,696 | ||||||||||
EURO STOXX Utilities Price EUR, September Strike Price 270.00 EUR, Expires 9/15/17 | Germany | 166 | 59,673 | |||||||||||
S&P 500 Index, June Strike Price $2,220.00, Expires 6/16/17 | United States | 7 | 560 | |||||||||||
S&P 500 Index, June Strike Price $2,250.00, Expires 6/16/17 | United States | 102 | 10,200 | |||||||||||
S&P 500 Index, June Strike Price $2,275.00, Expires 6/16/17 | United States | 166 | 23,240 | |||||||||||
S&P 500 Index, June Strike Price $2,350.00, Expires 6/16/17 | United States | 28 | 10,920 | |||||||||||
S&P 500 Index, June Strike Price $2,300.00, Expires 6/30/17 | United States | 319 | 149,930 | |||||||||||
S&P 500 Index, July Strike Price $2,300.00, Expires 7/21/17 | United States | 57 | 58,767 | |||||||||||
|
| |||||||||||||
| 419,513 | ||||||||||||||
|
| |||||||||||||
| Exchange Traded Funds 0.0%† | ||||||||||||||
iShares iBoxx High Yield Corporate Bond ETF, July Strike Price $87.00, Expires 7/21/17 | United States | 278 | 12,510 | |||||||||||
PowerShares QQQ Trust Series 1, August Strike Price $135.00, Expires 8/18/17 | United States | 276 | 44,160 | |||||||||||
SPDR S&P 500 ETF Trust, July Strike Price $233.00, Expires 7/21/17 | United States | 197 | 26,398 | |||||||||||
|
| |||||||||||||
| 83,068 | ||||||||||||||
|
| |||||||||||||
| Independent Power & Renewable Electricity Producers 0.0%† | ||||||||||||||
Dynegy Inc., June Strike Price $5.00, Expires 6/16/17 | United States | 138 | 690 | |||||||||||
Pattern Energy Group Inc., June Strike Price $17.50, Expires 6/16/17 | United States | 66 | 330 | |||||||||||
|
| |||||||||||||
| 1,020 | ||||||||||||||
|
| |||||||||||||
| Internet & Direct Marketing Retail 0.0%† | ||||||||||||||
Netflix Inc., June Strike Price $100.00, Expires 6/16/17 | United States | 261 | 261 | |||||||||||
|
| |||||||||||||
| Internet Software & Services 0.0%† | ||||||||||||||
Pandora Media Inc., June Strike Price $10.00, Expires 6/16/17 | United States | 52 | 7,644 | |||||||||||
|
| |||||||||||||
| Media 0.0%† | ||||||||||||||
Vivendi SA, June Strike Price 16.00 EUR, Expires 6/16/17 | France | 121 | 136 | |||||||||||
|
| |||||||||||||
| Metals & Mining 0.0%† | ||||||||||||||
Thyssenkrupp AG, June Strike Price 22.00 EUR, Expires 6/16/17 | Germany | 83 | 932 | |||||||||||
|
| |||||||||||||
| Mortgage Real Estate Investment Trusts (REITs) 0.0%† | ||||||||||||||
Two Harbors Investment Corp., June Strike Price $9.00, Expires 6/16/17 | United States | 68 | 272 | |||||||||||
|
| |||||||||||||
| Oil, Gas & Consumable Fuels 0.0%† | ||||||||||||||
Aegean Marine Petroleum Network Inc., July Strike Price $5.00, Expires 7/21/17 | Greece | 127 | 7,620 | |||||||||||
WPX Energy Inc., August Strike Price $10.00, Expires 8/18/17 | United States | 84 | 5,880 | |||||||||||
|
| |||||||||||||
| 13,500 | ||||||||||||||
|
| |||||||||||||
| Pharmaceuticals 0.0%† | ||||||||||||||
Innoviva Inc., June Strike Price $10.00, Expires 6/16/17 | United States | 64 | 320 | |||||||||||
|
| |||||||||||||
| franklintempleton.com | Annual Report | 49 |
FRANKLIN ALTERNATIVE STRATEGIES FUNDS
CONSOLIDATED STATEMENT OF INVESTMENTS
Franklin K2 Alternative Strategies Fund (continued)
| Country | Counterparty | Notional Amount* | Value | |||||||||||||||
| Options Purchased (continued) | ||||||||||||||||||
| Puts – Over-the-Counter | ||||||||||||||||||
| Currency Options | ||||||||||||||||||
USD/PHP, May Strike Price 50.95 PHP, Expires 5/18/18 | United States | BOFA | 2,950,000 | $ | 62,232 | |||||||||||||
USD/CAD, July Strike Price 1.36 CAD, Expires 7/31/17 | United States | DBAB | 3,200,000 | 19,205 | ||||||||||||||
|
| |||||||||||||||||
| 81,437 | ||||||||||||||||||
|
| |||||||||||||||||
Total Options Purchased (Cost $2,408,448) | 1,749,600 | |||||||||||||||||
|
| |||||||||||||||||
Total Investments before Short Term Investments (Cost $737,801,021) | 830,195,511 | |||||||||||||||||
|
| |||||||||||||||||
| Principal Amount* | ||||||||||||||||||
| Short Term Investments 21.0% | ||||||||||||||||||
| U.S. Government and Agency Securities (Cost $36,036,089) 3.2% | ||||||||||||||||||
| b,o | U.S. Treasury Bill, 7/27/17 | United States | 36,080,000 | 36,031,581 | ||||||||||||||
|
| |||||||||||||||||
| Shares | ||||||||||||||||||
| Money Market Funds 14.9% | ||||||||||||||||||
| p,q | Dreyfus Government Cash Management, Institutional Shares, 0.72% | United States | 47,292,076 | 47,292,076 | ||||||||||||||
| p | Fidelity Investments Money Market Funds, 0.65% | United States | 119,205,930 | 119,205,930 | ||||||||||||||
|
| |||||||||||||||||
Total Money Market Funds | 166,498,006 | |||||||||||||||||
|
| |||||||||||||||||
| Principal Amount* | ||||||||||||||||||
| Repurchase Agreements (Cost $32,634,570) 2.9% | ||||||||||||||||||
| r | Joint Repurchase Agreement, 0.793%, 6/01/17 | United States | 32,634,570 | 32,634,570 | ||||||||||||||
BNP Paribas Securities Corp. (Maturity Value $14,229,215) | ||||||||||||||||||
Collateralized by U.S. Government Agency Securities, 0.83% - 2.375%, 3/28/18 - 4/05/22; oU.S. Treasury Bill, 11/16/17; U.S. Treasury Note, 0.75% - 2.125%, 4/15/18 - 2/28/22; and U.S. Treasury Note, Index Linked, 1.375%, 7/15/18 (valued at $33,297,121) | ||||||||||||||||||
|
| |||||||||||||||||
Total Investments (Cost $972,969,686) 95.5% | 1,065,359,668 | |||||||||||||||||
Options Written (0.0)%† | (274,388 | ) | ||||||||||||||||
Securities Sold Short (21.4)% | (238,768,195 | ) | ||||||||||||||||
Other Assets, less Liabilities 25.9% | 289,236,042 | |||||||||||||||||
|
| |||||||||||||||||
Net Assets 100.0% | $ | 1,115,553,127 | ||||||||||||||||
|
| |||||||||||||||||
| 50 | Annual Report | franklintempleton.com |
FRANKLIN ALTERNATIVE STRATEGIES FUNDS
CONSOLIDATED STATEMENT OF INVESTMENTS
Franklin K2 Alternative Strategies Fund (continued)
| Country | Number of Contracts | Value | ||||||||||||
| s | Options Written (0.0)%† | |||||||||||||
| Calls – Exchange-Traded | ||||||||||||||
| Chemicals (0.0)%† | ||||||||||||||
| d | Akzo Nobel NV, June Strike Price 80.00 EUR, Expires 6/16/17 | Netherlands | 28 | $ | (2,359 | ) | ||||||||
|
| |||||||||||||
| Diversified Telecommunication Services (0.0)%† | ||||||||||||||
Straight Path Communications Inc., August Strike Price $190.00, Expires 8/18/17 | United States | 40 | (10,100 | ) | ||||||||||
Telecom Italia SpA, December Strike Price 1.20 EUR, Expires 12/15/17 | Italy | 1,118 | (5,777 | ) | ||||||||||
|
| |||||||||||||
| (15,877 | ) | |||||||||||||
|
| |||||||||||||
| Exchange Traded Funds (0.0)%† | ||||||||||||||
Financial Select Sector SPDR Fund, July Strike Price $25.00, Expires 7/21/17 | United States | 102 | (306 | ) | ||||||||||
SPDR S&P Oil & Gas Exploration & Production ETF, December Strike Price $39.00, Expires 12/15/17 | United States | 476 | (32,606 | ) | ||||||||||
|
| |||||||||||||
| (32,912 | ) | |||||||||||||
|
| |||||||||||||
| Food & Staples Retailing (0.0)%† | ||||||||||||||
The Kroger Co., October Strike Price $32.00, Expires 10/20/17 | United States | 308 | (29,260 | ) | ||||||||||
|
| |||||||||||||
| Pharmaceuticals (0.0)%† | ||||||||||||||
Pfizer Inc., July Strike Price $36.00, Expires 7/21/17 | United States | 47 | (94 | ) | ||||||||||
|
| |||||||||||||
| Software (0.0)%† | ||||||||||||||
Oracle Corp., July Strike Price $48.00, Expires 7/21/17 | United States | 38 | (1,216 | ) | ||||||||||
|
| |||||||||||||
| Technology Hardware, Storage & Peripherals (0.0)%† | ||||||||||||||
Apple Inc., July Strike Price $165.00, Expires 7/21/17 | United States | 13 | (936 | ) | ||||||||||
|
| |||||||||||||
| Tobacco (0.0)%† | ||||||||||||||
Philip Morris International Inc., June Strike Price $120.00, Expires 6/16/17 | United States | 10 | (1,400 | ) | ||||||||||
|
| |||||||||||||
| Puts – Exchange-Traded | ||||||||||||||
| Beverages (0.0)%† | ||||||||||||||
Molson Coors Brewing Co., October Strike Price $92.50, Expires 10/20/17 | United States | 18 | (5,940 | ) | ||||||||||
|
| |||||||||||||
| Biotechnology (0.0)%† | ||||||||||||||
Emergent BioSolutions Inc., September Strike Price $30.00, Expires 9/15/17 | United States | 60 | (10,350 | ) | ||||||||||
Intercept Pharmaceuticals Inc., June Strike Price $100.00, Expires 6/16/17 | United States | 23 | (2,300 | ) | ||||||||||
|
| |||||||||||||
| (12,650 | ) | |||||||||||||
|
| |||||||||||||
| Construction & Engineering (0.0)%† | ||||||||||||||
Dycom Industries Inc., June Strike Price $100.00, Expires 6/16/17 | United States | 6 | (10,284 | ) | ||||||||||
|
| |||||||||||||
| Construction Materials (0.0)%† | ||||||||||||||
Cemex SAB de CV, ADR, July Strike Price $8.00, Expires 7/21/17 | Mexico | 151 | (4,379 | ) | ||||||||||
|
| |||||||||||||
| Consumer Finance (0.0)%† | ||||||||||||||
PRA Group Inc., June Strike Price $35.00, Expires 6/16/17 | United States | 53 | (5,300 | ) | ||||||||||
|
| |||||||||||||
| Diversified Financial Services (0.0)%† | ||||||||||||||
CAC 40 Index, July Strike Price 4,800.00 EUR, Expires 7/21/17 | France | 85 | (16,261 | ) | ||||||||||
Deutsche Boerse AG German Stock Index DAX, July Strike Price 11,300.00 EUR, Expires 7/21/17 | Germany | 55 | (6,425 | ) | ||||||||||
EURO STOXX 50 Price EUR, July Strike Price 3,200.00 EUR, Expires 7/21/17 | Germany | 99 | (9,898 | ) | ||||||||||
EURO STOXX Utilities Price EUR, September Strike Price 250.00 EUR, Expires 9/15/17 | Germany | 166 | (21,445 | ) | ||||||||||
S&P 500 Index, June Strike Price $2,300.00, Expires 6/16/17 | United States | 28 | (5,040 | ) | ||||||||||
S&P 500 Index, July Strike Price $2,150.00, Expires 7/21/17 | United States | 57 | (18,810 | ) | ||||||||||
|
| |||||||||||||
| (77,879 | )�� | |||||||||||||
|
| |||||||||||||
| franklintempleton.com | Annual Report | 51 |
FRANKLIN ALTERNATIVE STRATEGIES FUNDS
CONSOLIDATED STATEMENT OF INVESTMENTS
Franklin K2 Alternative Strategies Fund (continued)
| Country | Number of Contracts | Value | ||||||||||||
| s | Options Written (continued) | |||||||||||||
| Puts – Exchange-Traded (continued) | ||||||||||||||
| Exchange Traded Funds (0.0)%† | ||||||||||||||
PowerShares QQQ Trust Series 1, August Strike Price $127.00, Expires 8/18/17 | United States | 276 | $ | (17,388 | ) | |||||||||
|
| |||||||||||||
| Insurance (0.0)%† | ||||||||||||||
American International Group Inc., January Strike Price $52.50, Expires 1/19/18 | United States | 56 | (5,740 | ) | ||||||||||
|
| |||||||||||||
| Internet Software & Services (0.0)%† | ||||||||||||||
| d | Pandora Media Inc., June Strike Price $12.00, Expires 6/16/17 | United States | 32 | (10,400 | ) | |||||||||
WebMD Health Corp., June Strike Price $45.00, Expires 6/16/17 | United States | 32 | (640 | ) | ||||||||||
WebMD Health Corp., June Strike Price $50.00, Expires 6/16/17 | United States | 32 | (480 | ) | ||||||||||
|
| |||||||||||||
| (11,520 | ) | |||||||||||||
|
| |||||||||||||
| Machinery (0.0)%† | ||||||||||||||
The Greenbrier Cos Inc., July Strike Price $40.00, Expires 7/21/17 | United States | 15 | (1,650 | ) | ||||||||||
|
| |||||||||||||
| Metals & Mining (0.0)%† | ||||||||||||||
AK Steel Holding Corp., June Strike Price $6.00, Expires 6/16/17 | United States | 289 | (6,936 | ) | ||||||||||
Teck Resources Ltd., August Strike Price $19.00, Expires 8/18/17 | Canada | 63 | (13,671 | ) | ||||||||||
Thyssenkrupp AG, September Strike Price 19.00 EUR, Expires 9/15/17 | Germany | 217 | (4,388 | ) | ||||||||||
|
| |||||||||||||
| (24,995 | ) | |||||||||||||
|
| |||||||||||||
| Multi-Utilities (0.0)%† | ||||||||||||||
E.ON SE, December Strike Price 6.00 EUR, Expires 12/15/17 | Germany | 726 | (5,709 | ) | ||||||||||
|
| |||||||||||||
| Semiconductors & Semiconductor Equipment (0.0)%† | ||||||||||||||
Microchip Technology Inc., July Strike Price $77.50, Expires 7/21/17 | United States | 45 | (3,375 | ) | ||||||||||
|
| |||||||||||||
| Software (0.0)%† | ||||||||||||||
Bottomline Technologies de Inc., June Strike Price $20.00, Expires 6/16/17 | United States | 21 | (105 | ) | ||||||||||
ServiceNow Inc., July Strike Price $95.00, Expires 7/21/17 | United States | 15 | (1,500 | ) | ||||||||||
TiVo Corp., June Strike Price $18.00, Expires 6/16/17 | United States | 32 | (1,920 | ) | ||||||||||
|
| |||||||||||||
| (3,525 | ) | |||||||||||||
|
| |||||||||||||
Total Options Written (Premiums Received $378,784) | (274,388 | ) | ||||||||||||
|
| |||||||||||||
| Shares | ||||||||||||||
| t | Securities Sold Short (21.4)% | |||||||||||||
| Common Stocks (9.9)% | ||||||||||||||
| Aerospace & Defense (0.2)% | ||||||||||||||
Aerojet Rocketdyne Holdings Inc. | United States | 30,340 | (664,446 | ) | ||||||||||
KEYW Holding Corp. | United States | 21,561 | (198,577 | ) | ||||||||||
MacDonald Dettwiler & Associates Ltd. | Canada | 30,803 | (1,425,181 | ) | ||||||||||
|
| |||||||||||||
| (2,288,204 | ) | |||||||||||||
|
| |||||||||||||
| Air Freight & Logistics (0.2)% | ||||||||||||||
Atlas Air Worldwide Holdings Inc. | United States | 7,314 | (356,192 | ) | ||||||||||
CH Robinson Worldwide Inc. | United States | 19,193 | (1,286,123 | ) | ||||||||||
XPO Logistics Inc. | United States | 3,126 | (164,427 | ) | ||||||||||
|
| |||||||||||||
| (1,806,742 | ) | |||||||||||||
|
| |||||||||||||
| Airlines (0.0)%† | ||||||||||||||
Allegiant Travel Co. | United States | 1,182 | (161,934 | ) | ||||||||||
Norwegian Air Shuttle ASA | Norway | 4,856 | (130,807 | ) | ||||||||||
|
| |||||||||||||
| (292,741 | ) | |||||||||||||
|
| |||||||||||||
| 52 | Annual Report | franklintempleton.com |
FRANKLIN ALTERNATIVE STRATEGIES FUNDS
CONSOLIDATED STATEMENT OF INVESTMENTS
Franklin K2 Alternative Strategies Fund (continued)
| Country | Shares | Value | ||||||||||||
| t | Securities Sold Short (continued) | |||||||||||||
| Common Stocks (continued) | ||||||||||||||
| Auto Components (0.0)%† | ||||||||||||||
Horizon Global Corp. | United States | 23,051 | $ | (339,080 | ) | |||||||||
|
| |||||||||||||
| Automobiles (0.3)% | ||||||||||||||
Bayerische Motoren Werke AG | Germany | 4,359 | (407,847 | ) | ||||||||||
Nissan Motor Co. Ltd. | Japan | 80,359 | (770,213 | ) | ||||||||||
Tesla Motors Inc. | United States | 4,688 | (1,598,655 | ) | ||||||||||
|
| |||||||||||||
| (2,776,715 | ) | |||||||||||||
|
| |||||||||||||
| Banks (0.0)%† | ||||||||||||||
Australia & New Zealand Banking Group Ltd. | Australia | 3,030 | (63,063 | ) | ||||||||||
Bendigo & Adelaide Bank Ltd. | Australia | 7,400 | (61,969 | ) | ||||||||||
|
| |||||||||||||
| (125,032 | ) | |||||||||||||
|
| |||||||||||||
| Biotechnology (0.6)% | ||||||||||||||
Acorda Therapeutics Inc. | United States | 7,827 | (108,013 | ) | ||||||||||
AMAG Pharmaceuticals Inc. | United States | 21,816 | (377,417 | ) | ||||||||||
Amicus Therapeutics Inc. | United States | 136,197 | (1,092,300 | ) | ||||||||||
BioMarin Pharmaceutical Inc. | United States | 4,891 | (428,647 | ) | ||||||||||
Clovis Oncology Inc. | United States | 12,333 | (637,123 | ) | ||||||||||
Emergent BioSolutions Inc. | United States | 15,901 | (507,719 | ) | ||||||||||
Flexion Therapeutics Inc. | United States | 23,082 | (394,471 | ) | ||||||||||
Intercept Pharmaceuticals Inc. | United States | 2,924 | (327,196 | ) | ||||||||||
Ligand Pharmaceuticals Inc. | United States | 13,594 | (1,471,958 | ) | ||||||||||
Neurocrine Biosciences Inc. | United States | 10,368 | (450,697 | ) | ||||||||||
PDL BioPharma Inc. | United States | 157,508 | (376,444 | ) | ||||||||||
PTC Therapeutics Inc. | United States | 5,993 | (75,092 | ) | ||||||||||
|
| |||||||||||||
| (6,247,077 | ) | |||||||||||||
|
| |||||||||||||
| Capital Markets (0.1)% | ||||||||||||||
Ares Capital Corp. | United States | 19,481 | (324,359 | ) | ||||||||||
Cowen Group Inc., A | United States | 15,145 | (227,936 | ) | ||||||||||
Hercules Capital Inc. | United States | 2,800 | (36,484 | ) | ||||||||||
Prospect Capital Corp. | United States | 8,102 | (64,654 | ) | ||||||||||
TCP Capital Corp. | United States | 16,097 | (271,878 | ) | ||||||||||
Virtus Investment Partners Inc. | United States | 3,982 | (400,987 | ) | ||||||||||
|
| |||||||||||||
| (1,326,298 | ) | |||||||||||||
|
| |||||||||||||
| Chemicals (0.3)% | ||||||||||||||
CF Industries Holdings Inc. | United States | 31,209 | (839,522 | ) | ||||||||||
Eastman Chemical Co. | United States | 3,273 | (262,200 | ) | ||||||||||
Huntsman Corp. | United States | 50,799 | (1,214,096 | ) | ||||||||||
Mosaic Co. | United States | 21,836 | (494,149 | ) | ||||||||||
TerraVia Holdings Inc. | United States | 110,459 | (29,106 | ) | ||||||||||
Yara International ASA | Norway | 26,710 | (992,936 | ) | ||||||||||
|
| |||||||||||||
| (3,832,009 | ) | |||||||||||||
|
| |||||||||||||
| Communications Equipment (0.3)% | ||||||||||||||
ARRIS International PLC | United States | 6,248 | (175,194 | ) | ||||||||||
Ciena Corp. | United States | 15,075 | (353,961 | ) | ||||||||||
InterDigital Inc. | United States | 25,485 | (2,064,285 | ) | ||||||||||
Viavi Solutions Inc. | United States | 42,156 | (473,412 | ) | ||||||||||
|
| |||||||||||||
| (3,066,852 | ) | |||||||||||||
|
| |||||||||||||
| franklintempleton.com | Annual Report | 53 |
FRANKLIN ALTERNATIVE STRATEGIES FUNDS
CONSOLIDATED STATEMENT OF INVESTMENTS
Franklin K2 Alternative Strategies Fund (continued)
| Country | Shares | Value | ||||||||||||
| t | Securities Sold Short (continued) | |||||||||||||
| Common Stocks (continued) | ||||||||||||||
| Construction & Engineering (0.1)% | ||||||||||||||
Dycom Industries Inc. | United States | 4,842 | $ | (407,648 | ) | |||||||||
Mirait Holdings Corp. | Japan | 5,900 | (59,719 | ) | ||||||||||
Tutor Perini Corp. | United States | 10,138 | (263,081 | ) | ||||||||||
|
| |||||||||||||
| (730,448 | ) | |||||||||||||
|
| |||||||||||||
| Construction Materials (0.1)% | ||||||||||||||
Cemex SAB de CV, ADR | Mexico | 75,990 | (628,437 | ) | ||||||||||
|
| |||||||||||||
| Consumer Finance (0.1)% | ||||||||||||||
Encore Capital Group Inc. | United States | 22,672 | (820,726 | ) | ||||||||||
PRA Group Inc. | United States | 14,252 | (495,970 | ) | ||||||||||
|
| |||||||||||||
| (1,316,696 | ) | |||||||||||||
|
| |||||||||||||
| Diversified Consumer Services (0.0)%† | ||||||||||||||
Carriage Services Inc. | United States | 17,600 | (462,704 | ) | ||||||||||
|
| |||||||||||||
| Diversified Financial Services (0.0)%† | ||||||||||||||
Element Financial Corp. | Canada | 27,706 | (175,566 | ) | ||||||||||
|
| |||||||||||||
| Diversified Telecommunication Services (0.6)% | ||||||||||||||
AT&T Inc. | United States | 68,988 | (2,658,108 | ) | ||||||||||
CenturyLink Inc. | United States | 132,301 | (3,300,910 | ) | ||||||||||
Iridium Communications Inc. | United States | 43,016 | (425,858 | ) | ||||||||||
|
| |||||||||||||
| (6,384,876 | ) | |||||||||||||
|
| |||||||||||||
| Electrical Equipment (0.0)%† | ||||||||||||||
Eaton Corp. PLC | United States | 3,805 | (294,431 | ) | ||||||||||
General Cable Corp. | United States | 11,111 | (183,887 | ) | ||||||||||
|
| |||||||||||||
| (478,318 | ) | |||||||||||||
|
| |||||||||||||
| Electronic Equipment, Instruments & Components (0.6)% | ||||||||||||||
Knowles Corp. | United States | 40,454 | (692,977 | ) | ||||||||||
MTS Systems Corp. | United States | 28,143 | (1,459,215 | ) | ||||||||||
OSI Systems Inc. | United States | 2,844 | (225,216 | ) | ||||||||||
TTM Technologies Inc. | United States | 78,649 | (1,277,260 | ) | ||||||||||
Vishay Intertechnology Inc. | United States | 201,880 | (3,300,738 | ) | ||||||||||
|
| |||||||||||||
| (6,955,406 | ) | |||||||||||||
|
| |||||||||||||
| Energy Equipment & Services (0.1)% | ||||||||||||||
Ensco PLC | United States | 27,750 | (173,160 | ) | ||||||||||
Nabors Industries Ltd. | United States | 14,730 | (129,624 | ) | ||||||||||
SEACOR Holdings Inc. | United States | 2,382 | (145,802 | ) | ||||||||||
Weatherford International PLC | United States | 58,776 | (282,125 | ) | ||||||||||
|
| |||||||||||||
| (730,711 | ) | |||||||||||||
|
| |||||||||||||
| Equity Real Estate Investment Trusts (REITs) (0.8)% | ||||||||||||||
American Homes 4 Rent | United States | 41,025 | (921,832 | ) | ||||||||||
AvalonBay Communities Inc. | United States | 1,700 | (325,108 | ) | ||||||||||
Camden Property Trust | United States | 1,961 | (163,371 | ) | ||||||||||
Colony NorthStar Inc., A | United States | 25,317 | (357,729 | ) | ||||||||||
Colony Starwood Homes | United States | 39,560 | (1,367,589 | ) | ||||||||||
Empire State Realty Trust Inc. | United States | 76,295 | (1,586,936 | ) | ||||||||||
Forest City Realty Trust Inc. | United States | 41,878 | (953,562 | ) | ||||||||||
Iron Mountain Inc. | United States | 8,977 | (313,477 | ) | ||||||||||
| 54 | Annual Report | franklintempleton.com |
FRANKLIN ALTERNATIVE STRATEGIES FUNDS
CONSOLIDATED STATEMENT OF INVESTMENTS
Franklin K2 Alternative Strategies Fund (continued)
| Country | Shares | Value | ||||||||||||
| t | Securities Sold Short (continued) | |||||||||||||
| Common Stocks (continued) | ||||||||||||||
| Equity Real Estate Investment Trusts (REITs) (continued) | ||||||||||||||
LaSalle Hotel Properties | United States | 11,211 | $ | (318,953 | ) | |||||||||
National Health Investors Inc. | United States | 15,452 | (1,166,935 | ) | ||||||||||
Omega Healthcare Investors Inc. | United States | 26,178 | (819,895 | ) | ||||||||||
Ryman Hospitality Properties Inc. | United States | 5,734 | (369,327 | ) | ||||||||||
Welltower Inc. | United States | 7,730 | (560,734 | ) | ||||||||||
|
| |||||||||||||
| (9,225,448 | ) | |||||||||||||
|
| |||||||||||||
| Food & Staples Retailing (0.0)%† | ||||||||||||||
SUPERVALU Inc. | United States | 46,577 | (179,321 | ) | ||||||||||
|
| |||||||||||||
| Health Care Equipment & Supplies (0.5)% | ||||||||||||||
Becton Dickinson and Co. | United States | 9,008 | (1,704,584 | ) | ||||||||||
DexCom Inc. | United States | 4,574 | (305,726 | ) | ||||||||||
Hologic Inc. | United States | 4,269 | (184,890 | ) | ||||||||||
Insulet Corp. | United States | 7,363 | (309,025 | ) | ||||||||||
Nipro Corp. | Japan | 11,300 | (157,741 | ) | ||||||||||
NuVasive Inc. | United States | 8,515 | (638,881 | ) | ||||||||||
Quidel Corp. | United States | 15,585 | (386,820 | ) | ||||||||||
Wright Medical Group NV | United States | 51,618 | (1,379,233 | ) | ||||||||||
|
| |||||||||||||
| (5,066,900 | ) | |||||||||||||
|
| |||||||||||||
| Health Care Providers & Services (0.2)% | ||||||||||||||
HealthSouth Corp. | United States | 8,189 | (371,207 | ) | ||||||||||
Tivity Health Inc. | United States | 40,046 | (1,359,562 | ) | ||||||||||
|
| |||||||||||||
| (1,730,769 | ) | |||||||||||||
|
| |||||||||||||
| Health Care Technology (0.1)% | ||||||||||||||
Allscripts Healthcare Solutions Inc. | United States | 14,801 | (168,879 | ) | ||||||||||
Medidata Solutions Inc. | United States | 10,299 | (733,083 | ) | ||||||||||
|
| |||||||||||||
| (901,962 | ) | |||||||||||||
|
| |||||||||||||
| Hotels, Restaurants & Leisure (0.1)% | ||||||||||||||
Wynn Resorts Ltd. | United States | 4,133 | (531,917 | ) | ||||||||||
|
| |||||||||||||
| Household Durables (0.1)% | ||||||||||||||
LGI Homes Inc. | United States | 23,398 | (758,095 | ) | ||||||||||
Meritage Homes Corp. | United States | 7,354 | (293,425 | ) | ||||||||||
Newell Brands Inc. | United States | 5,181 | (274,334 | ) | ||||||||||
PulteGroup Inc. | United States | 13,516 | (306,408 | ) | ||||||||||
|
| |||||||||||||
| (1,632,262 | ) | |||||||||||||
|
| |||||||||||||
| Independent Power & Renewable Electricity Producers (0.0)%† | ||||||||||||||
Dynegy Inc. | United States | 30,865 | (255,253 | ) | ||||||||||
Pattern Energy Group Inc. | United States | 1,776 | (40,067 | ) | ||||||||||
|
| |||||||||||||
| (295,320 | ) | |||||||||||||
|
| |||||||||||||
| Insurance (0.1)% | ||||||||||||||
AmTrust Financial Services Inc. | United States | 10,107 | (132,806 | ) | ||||||||||
Fairfax Financial Holdings Ltd. | Canada | 908 | (397,704 | ) | ||||||||||
HCI Group Inc. | United States | 2,181 | (96,989 | ) | ||||||||||
|
| |||||||||||||
| (627,499 | ) | |||||||||||||
|
| |||||||||||||
| Internet & Direct Marketing Retail (0.0)%† | ||||||||||||||
Shutterfly Inc. | United States | 4,367 | (216,123 | ) | ||||||||||
|
| |||||||||||||
| franklintempleton.com | Annual Report | 55 |
FRANKLIN ALTERNATIVE STRATEGIES FUNDS
CONSOLIDATED STATEMENT OF INVESTMENTS
Franklin K2 Alternative Strategies Fund (continued)
| Country | Shares | Value | ||||||||||||
| t | Securities Sold Short (continued) | |||||||||||||
| Common Stocks (continued) | ||||||||||||||
| Internet Software & Services (0.9)% | ||||||||||||||
Alibaba Group Holding Ltd., ADR | China | 26,952 | $ | (3,300,542 | ) | |||||||||
Carbonite Inc. | United States | 19,929 | (370,679 | ) | ||||||||||
Cornerstone OnDemand Inc. | United States | 902 | (33,699 | ) | ||||||||||
j2 Global Inc. | United States | 16,257 | (1,375,667 | ) | ||||||||||
MercadoLibre Inc. | Argentina | 80 | (22,009 | ) | ||||||||||
WebMD Health Corp. | United States | 15,953 | (893,049 | ) | ||||||||||
Yahoo! Inc. | United States | 77,506 | (3,900,102 | ) | ||||||||||
Zillow Group Inc. | United States | 9,523 | (414,441 | ) | ||||||||||
|
| |||||||||||||
| (10,310,188 | ) | |||||||||||||
|
| |||||||||||||
| IT Services (0.1)% | ||||||||||||||
Blackhawk Network Holdings Inc. | United States | 6,067 | (263,004 | ) | ||||||||||
Cardtronics PLC | United States | 10,225 | (350,206 | ) | ||||||||||
CSG Systems International Inc. | United States | 6,641 | (264,909 | ) | ||||||||||
International Business Machines Corp. | United States | 1,628 | (248,482 | ) | ||||||||||
Square Inc. | United States | 8,949 | (205,738 | ) | ||||||||||
|
| |||||||||||||
| (1,332,339 | ) | |||||||||||||
|
| |||||||||||||
| Leisure Products (0.0)%† | ||||||||||||||
Polaris Industries Inc. | United States | 2,620 | (219,032 | ) | ||||||||||
|
| |||||||||||||
| Life Sciences Tools & Services (0.1)% | ||||||||||||||
Albany Molecular Research Inc. | United States | 81,467 | (1,585,348 | ) | ||||||||||
Fluidigm Corp. | United States | 3,233 | (14,645 | ) | ||||||||||
|
| |||||||||||||
| (1,599,993 | ) | |||||||||||||
|
| |||||||||||||
| Machinery (0.1)% | ||||||||||||||
Greenbrier Cos Inc. | United States | 9,262 | (409,843 | ) | ||||||||||
Navistar International Corp. | United States | 6,866 | (177,624 | ) | ||||||||||
SKF AB, B | Sweden | 13,619 | (278,604 | ) | ||||||||||
Volvo AB | Sweden | 17,180 | (280,884 | ) | ||||||||||
|
| |||||||||||||
| (1,146,955 | ) | |||||||||||||
|
| |||||||||||||
| Marine (0.0)%† | ||||||||||||||
Kirby Corp. | United States | 5,776 | (382,660 | ) | ||||||||||
|
| |||||||||||||
| Media (0.4)% | ||||||||||||||
Charter Communications Inc., A | United States | 609 | (210,440 | ) | ||||||||||
DISH Network Corp., A | United States | 30,831 | (1,966,093 | ) | ||||||||||
Liberty Media Corp. | United States | 4,390 | (146,187 | ) | ||||||||||
Liberty SiriusXM Group | United States | 15,633 | (651,427 | ) | ||||||||||
Sinclair Broadcast Group Inc. | United States | 11,738 | (380,311 | ) | ||||||||||
Time Warner Inc. | United States | 758 | (75,413 | ) | ||||||||||
World Wrestling Entertainment Inc. | United States | 33,451 | (682,735 | ) | ||||||||||
|
| |||||||||||||
| (4,112,606 | ) | |||||||||||||
|
| |||||||||||||
| Metals & Mining (0.1)% | ||||||||||||||
AK Steel Holding Corp. | United States | 123,967 | (756,199 | ) | ||||||||||
Pretium Resources Inc. | Canada | 16,941 | (151,622 | ) | ||||||||||
Teck Resources Ltd. | Canada | 3,355 | (59,920 | ) | ||||||||||
|
| |||||||||||||
| (967,741 | ) | |||||||||||||
|
| |||||||||||||
| Mortgage Real Estate Investment Trusts (REITs) (0.2)% | ||||||||||||||
Apollo Commercial Real Estate Finance Inc. | United States | 9,624 | (177,659 | ) | ||||||||||
| 56 | Annual Report | franklintempleton.com |
FRANKLIN ALTERNATIVE STRATEGIES FUNDS
CONSOLIDATED STATEMENT OF INVESTMENTS
Franklin K2 Alternative Strategies Fund (continued)
| Country | Shares | Value | ||||||||||||
| t | Securities Sold Short (continued) | |||||||||||||
| Common Stocks (continued) | ||||||||||||||
| Mortgage Real Estate Investment Trusts (REITs) (continued) | ||||||||||||||
Blackstone Mortgage Trust Inc., A | United States | 24,165 | $ | (750,323 | ) | |||||||||
New York Mortgage Trust Inc. | United States | 13,587 | (84,511 | ) | ||||||||||
Redwood Trust Inc. | United States | 14,210 | (240,433 | ) | ||||||||||
Starwood Property Trust Inc. | United States | 4,383 | (96,514 | ) | ||||||||||
Two Harbors Investment Corp. | United States | 36,701 | (366,276 | ) | ||||||||||
|
| |||||||||||||
| (1,715,716 | ) | |||||||||||||
|
| |||||||||||||
| Multiline Retail (0.0)%† | ||||||||||||||
Target Corp. | United States | 1,039 | (57,301 | ) | ||||||||||
|
| |||||||||||||
| Oil, Gas & Consumable Fuels (0.3)% | ||||||||||||||
Aegean Marine Petroleum Network Inc. | Greece | 110,208 | (506,957 | ) | ||||||||||
Chesapeake Energy Corp. | United States | 45,939 | (232,451 | ) | ||||||||||
Golar LNG Ltd. | Bermuda | 10,458 | (243,305 | ) | ||||||||||
Green Plains Inc. | United States | 82,279 | (1,756,657 | ) | ||||||||||
WPX Energy Inc. | United States | 61,895 | (669,704 | ) | ||||||||||
|
| |||||||||||||
| (3,409,074 | ) | |||||||||||||
|
| |||||||||||||
| Paper & Forest Products (0.1)% | ||||||||||||||
Domtar Corp. | United States | 19,825 | (721,234 | ) | ||||||||||
|
| |||||||||||||
| Personal Products (0.0)%† | ||||||||||||||
Herbalife Ltd. | United States | 4,915 | (352,799 | ) | ||||||||||
|
| |||||||||||||
| Pharmaceuticals (0.2)% | ||||||||||||||
Depomed Inc. | United States | 18,025 | (188,902 | ) | ||||||||||
Idorsia Ltd. | Switzerland | 9,440 | (65,789 | ) | ||||||||||
Innoviva Inc. | United States | 32,599 | (398,360 | ) | ||||||||||
Medicines Co. | United States | 13,655 | (543,059 | ) | ||||||||||
Pacira Pharmaceuticals Inc. | United States | 4,359 | (193,540 | ) | ||||||||||
Sucampo Pharmaceuticals Inc., A | United States | 37,499 | (374,990 | ) | ||||||||||
|
| |||||||||||||
| (1,764,640 | ) | |||||||||||||
|
| |||||||||||||
| Professional Services (0.0)%† | ||||||||||||||
51job Inc., ADR | China | 7,914 | (344,971 | ) | ||||||||||
|
| |||||||||||||
| Real Estate Management & Development (0.0)%† | ||||||||||||||
Immofinanz AG | Austria | 59,276 | (133,110 | ) | ||||||||||
|
| |||||||||||||
| Road & Rail (0.1)% | ||||||||||||||
Schneider National Inc., B | United States | 16,287 | (323,460 | ) | ||||||||||
Werner Enterprises Inc. | United States | 10,854 | (295,771 | ) | ||||||||||
|
| |||||||||||||
| (619,231 | ) | |||||||||||||
|
| |||||||||||||
| Semiconductors & Semiconductor Equipment (0.7)% | ||||||||||||||
Cypress Semiconductor Corp. | United States | 42,724 | (597,709 | ) | ||||||||||
Inphi Corp. | United States | 6,409 | (254,309 | ) | ||||||||||
Intel Corp. | United States | 34,410 | (1,242,545 | ) | ||||||||||
Microchip Technology Inc. | United States | 62,923 | (5,241,486 | ) | ||||||||||
ON Semiconductor Corp. | United States | 16,273 | (251,906 | ) | ||||||||||
Silicon Laboratories Inc. | United States | 3,723 | (278,480 | ) | ||||||||||
|
| |||||||||||||
| (7,866,435 | ) | |||||||||||||
|
| |||||||||||||
| Software (0.6)% | ||||||||||||||
Bottomline Technologies de Inc. | United States | 3,850 | (96,288 | ) | ||||||||||
| franklintempleton.com | Annual Report | 57 |
FRANKLIN ALTERNATIVE STRATEGIES FUNDS
CONSOLIDATED STATEMENT OF INVESTMENTS
Franklin K2 Alternative Strategies Fund (continued)
| Country | Shares | Value | ||||||||||||
| t | Securities Sold Short (continued) | |||||||||||||
| Common Stocks (continued) | ||||||||||||||
| Software (continued) | ||||||||||||||
BroadSoft Inc. | United States | 27,932 | $ | (1,117,280 | ) | |||||||||
Citrix Systems Inc. | United States | 11,384 | (939,635 | ) | ||||||||||
FireEye Inc. | United States | 1,884 | (28,241 | ) | ||||||||||
HubSpot Inc. | United States | 2,518 | (181,548 | ) | ||||||||||
Nuance Communications Inc. | United States | 12,392 | (229,376 | ) | ||||||||||
RealPage Inc. | United States | 7,127 | (246,594 | ) | ||||||||||
ServiceNow Inc. | United States | 12,467 | (1,304,672 | ) | ||||||||||
TiVo Corp. | United States | 4,742 | (84,408 | ) | ||||||||||
VMware Inc., A | United States | 22,897 | (2,224,444 | ) | ||||||||||
|
| |||||||||||||
| (6,452,486 | ) | |||||||||||||
|
| |||||||||||||
| Specialty Retail (0.1)% | ||||||||||||||
Advance Auto Parts Inc. | United States | 488 | (65,211 | ) | ||||||||||
Asbury Automotive Group Inc. | United States | 7,363 | (411,960 | ) | ||||||||||
Lithia Motors Inc., A | United States | 4,571 | (415,275 | ) | ||||||||||
Penske Automotive Group Inc. | United States | 5,767 | (244,233 | ) | ||||||||||
Sally Beauty Holdings Inc. | United States | 22,738 | (409,739 | ) | ||||||||||
|
| |||||||||||||
| (1,546,418 | ) | |||||||||||||
|
| |||||||||||||
| Technology Hardware, Storage & Peripherals (0.0)%† | ||||||||||||||
NCR Corp. | United States | 9,308 | (358,637 | ) | ||||||||||
|
| |||||||||||||
| Textiles, Apparel & Luxury Goods (0.1)% | ||||||||||||||
Under Armour Inc., A | United States | 31,562 | (604,728 | ) | ||||||||||
|
| |||||||||||||
| Thrifts & Mortgage Finance (0.0)%† | ||||||||||||||
LendingTree Inc. | United States | 648 | (100,829 | ) | ||||||||||
|
| |||||||||||||
| Tobacco (0.2)% | ||||||||||||||
British American Tobacco PLC, ADR | United Kingdom | 37,494 | (2,704,067 | ) | ||||||||||
|
| |||||||||||||
| Trading Companies & Distributors (0.1)% | ||||||||||||||
Gatx Corp. | United States | 8,456 | (502,963 | ) | ||||||||||
Kaman Corp. | United States | 6,064 | (292,952 | ) | ||||||||||
|
| |||||||||||||
| (795,915 | ) | |||||||||||||
|
| |||||||||||||
Total Common Stocks (Proceeds $109,390,923) | (109,990,538 | ) | ||||||||||||
|
| |||||||||||||
| Exchange Traded Funds (9.6)% | ||||||||||||||
Consumer Discretionary Select Sector SPDR ETF | United States | 32,941 | (2,999,278 | ) | ||||||||||
Consumer Staples Select Sector SPDR ETF | United States | 10,014 | (567,193 | ) | ||||||||||
Health Care Select Sector SPDR Fund | United States | 37,519 | (2,854,446 | ) | ||||||||||
Industrial Select Sector SPDR ETF | United States | 5,820 | (392,966 | ) | ||||||||||
iShares 20+ Year Treasury Bond ETF | United States | 2,221 | (276,292 | ) | ||||||||||
iShares Core S&P Small-Cap ETF | United States | 47,432 | (3,241,029 | ) | ||||||||||
iShares Edge MSCI USA Momentum Factor ETF | United States | 26,770 | (2,377,711 | ) | ||||||||||
iShares Micro-Cap ETF | United States | 13,891 | (1,172,261 | ) | ||||||||||
iShares Nasdaq Biotechnology ETF | United States | 11,117 | (3,176,683 | ) | ||||||||||
iShares North American Tech ETF | United States | 24,121 | (3,577,578 | ) | ||||||||||
iShares North American Tech-Multimedia Networking ETF | United States | 36,134 | (1,634,341 | ) | ||||||||||
iShares North American Tech-Software ETF | United States | 29,855 | (4,135,813 | ) | ||||||||||
iShares PHLX Semiconductor ETF | United States | 15,763 | (2,332,766 | ) | ||||||||||
iShares Russell 1000 Growth ETF | United States | 10,853 | (1,295,197 | ) | ||||||||||
iShares Russell 2000 ETF | United States | 40,318 | (5,496,150 | ) | ||||||||||
iShares Russell 2000 Growth ETF | United States | 25,517 | (4,167,692 | ) | ||||||||||
| 58 | Annual Report | franklintempleton.com |
FRANKLIN ALTERNATIVE STRATEGIES FUNDS
CONSOLIDATED STATEMENT OF INVESTMENTS
Franklin K2 Alternative Strategies Fund (continued)
| Country | Shares | Value | ||||||||||||
| t | Securities Sold Short (continued) | |||||||||||||
| Exchange Traded Funds (continued) | ||||||||||||||
iShares Russell 2000 Value ETF | United States | 13,174 | $ | (1,514,615 | ) | |||||||||
iShares Russell Mid-Cap Growth ETF | United States | 13,972 | (1,506,461 | ) | ||||||||||
iShares S&P Small-Cap 600 Growth ETF | United States | 12,442 | (1,889,691 | ) | ||||||||||
iShares STOXX Europe 600 UCITS ETF | Germany | 21,174 | (931,933 | ) | ||||||||||
iShares U.S. Consumer Goods ETF | United States | 8,393 | (1,026,884 | ) | ||||||||||
PowerShares Nasdaq Internet Portfolio | United States | 18,615 | (1,941,358 | ) | ||||||||||
PowerShares QQQ Trust Series 1 | United States | 4,700 | (664,063 | ) | ||||||||||
PureFunds ISE Cyber Security ETF | United States | 155,280 | (4,709,642 | ) | ||||||||||
SPDR S&P 500 ETF Trust | United States | 187,420 | (45,250,685 | ) | ||||||||||
SPDR S&P MidCap 400 ETF Trust | United States | 7,249 | (2,271,619 | ) | ||||||||||
Utilities Select Sector SPDR Fund | United States | 22,608 | (1,217,215 | ) | ||||||||||
Vanguard Small-Cap Growth ETF | United States | 30,519 | (4,366,659 | ) | ||||||||||
|
| |||||||||||||
Total Exchange Traded Funds (Proceeds $101,512,605) | (106,988,221 | ) | ||||||||||||
|
| |||||||||||||
| Principal Amount* | ||||||||||||||
| Convertible Bonds and Notes (0.1)% | ||||||||||||||
| Internet & Direct Marketing Retail (0.1)% | ||||||||||||||
Priceline Group Inc., senior note, 0.90%, 9/15/21 | United States | 748,000 | (859,732 | ) | ||||||||||
|
| |||||||||||||
| Semiconductors & Semiconductor Equipment (0.0)%† | ||||||||||||||
ON Semiconductor Corp., senior note, 1.00%, 12/01/20 | United States | 318,000 | (346,024 | ) | ||||||||||
|
| |||||||||||||
| Software (0.0)%† | ||||||||||||||
Proofpoint Inc., senior note, 0.75%, 6/15/20 | United States | 400,000 | (492,250 | ) | ||||||||||
|
| |||||||||||||
Total Convertible Bonds and Notes (Proceeds $1,551,233) | (1,698,006 | ) | ||||||||||||
|
| |||||||||||||
| Corporate Bonds and Notes (1.4)% | ||||||||||||||
| Aerospace & Defense (0.1)% | ||||||||||||||
| c | Bombardier Inc., senior note, 144A, 8.75%, 12/01/21 | Canada | 949,000 | (1,055,169 | ) | |||||||||
|
| |||||||||||||
| Chemicals (0.4)% | ||||||||||||||
| c | CVR Partners LP / CVR Nitrogen Finance Corp., senior note, 144A, 9.25%, 6/15/23 | United States | 4,281,000 | (4,452,240 | ) | |||||||||
|
| |||||||||||||
| Electric Utilities (0.0)%† | ||||||||||||||
Talen Energy Supply LLC, senior note, 6.50%, 6/01/25 | United States | 116,000 | (87,000 | ) | ||||||||||
|
| |||||||||||||
| Equity Real Estate Investment Trusts (REITs) (0.0)%† | ||||||||||||||
| c | Rayonier AM Products Inc., senior bond, 144A, 5.50%, 6/01/24 | United States | 176,000 | (172,920 | ) | |||||||||
|
| |||||||||||||
| Multiline Retail (0.1)% | ||||||||||||||
Kohl’s Corp., senior bond, 4.25%, 7/17/25 | United States | 584,000 | (580,261 | ) | ||||||||||
|
| |||||||||||||
| Pharmaceuticals (0.6)% | ||||||||||||||
Teva Pharmaceutical Finance Netherlands III BV, senior bond, 3.15%, 10/01/26 | Israel | 4,327,000 | (4,071,556 | ) | ||||||||||
| c | Valeant Pharmaceuticals International Inc., senior bond, 144A, 6.125%, 4/15/25 | United States | 3,402,000 | (2,725,852 | ) | |||||||||
|
| |||||||||||||
| (6,797,408 | ) | |||||||||||||
|
| |||||||||||||
| Wireless Telecommunication Services (0.2)% | ||||||||||||||
T-Mobile U.S. Inc., senior bond, 6.50%, 1/15/26 | United States | 2,679,000 | (2,963,644 | ) | ||||||||||
|
| |||||||||||||
Total Corporate Bonds and Notes (Proceeds $15,838,748) | (16,108,642 | ) | ||||||||||||
|
| |||||||||||||
| franklintempleton.com | Annual Report | 59 |
FRANKLIN ALTERNATIVE STRATEGIES FUNDS
CONSOLIDATED STATEMENT OF INVESTMENTS
Franklin K2 Alternative Strategies Fund (continued)
| Country | Principal Amount* | Value | ||||||||||||
| t | Securities Sold Short (continued) | |||||||||||||
| U.S. Government and Agency Securities (0.4)% | ||||||||||||||
U.S. Treasury Note, | ||||||||||||||
0.75%, 4/30/18 | United States | 2,418,000 | $ | (2,408,036 | ) | |||||||||
2.25%, 2/15/27 | United States | 1,570,000 | (1,574,752 | ) | ||||||||||
|
| |||||||||||||
Total U.S. Government and Agency Securities | (3,982,788 | ) | ||||||||||||
|
| |||||||||||||
Total Securities Sold Short (Proceeds $232,267,745) | $ | (238,768,195 | ) | |||||||||||
|
| |||||||||||||
See Abbreviations on page 95.
†Rounds to less than 0.1% of net assets.
*The principal/notional amount is stated in U.S. dollars unless otherwise indicated.
aNon-income producing.
bA portion or all of the security has been segregated as collateral for securities sold short, open swap, forward, futures and written options contracts. At May 31, 2017, the aggregate value of these securities and/or cash pledged amounted to $487,483,296, representing 43.7% of net assets.
cSecurity was purchased pursuant to Rule 144A under the Securities Act of 1933 and may be sold in transactions exempt from registration only to qualified institutional buyers or in public offering registered under the Securities Act of 1933. These securities have been deemed liquid under guidelines approved by the Trust’s Board of Trustees. At May 31, 2017, the net value of these securities was $148,426,894, representing 13.3% of net assets.
dSecurity has been deemed illiquid because it may not be able to be sold within seven days. At May 31, 2017, the net value of these securities was $5,992,131, representing 0.5% of net assets.
eA portion or all of the security is held in connection with written option contracts open at period end.
fContingent distributions represent the right to receive additional distributions, if any, during the reorganization of the underlying company.
gVariable rate security. The rate shown represents the yield at period end.
hIncome may be received in additional securities and/or cash.
iSecurity was purchased pursuant to Regulation S under the Securities Act of 1933, which exempts from registration securities offered and sold outside of the United States. Such a security cannot be sold in the United States without either an effective registration statement filed pursuant to the Securities Act of 1933, or pursuant to an exemption from registration. These securities have been deemed liquid under guidelines approved by the Trust’s Board of Trustees. At May 31, 2017, the aggregate value of these securities was $27,293,860, representing 2.4% of net assets.
jSee Note 1(f) regarding loan participation notes.
kDefaulted security or security for which income has been deemed uncollectible.
lThe coupon rate shown represents the rate at period end.
mA portion or all of the security purchased on a delayed delivery basis. See Note 1(d).
nSee Note 1(j) regarding senior floating rate interests.
oThe security was issued on a discount basis with no stated coupon rate.
pThe rate shown is the annualized seven-day yield at period end.
qA portion or all of the security is owned by K2 Holdings Investment Corp., a wholly-owned subsidiary of the Fund. See Note 1(i).
rSee Note 1(c) regarding joint repurchase agreement.
sSee Note 1(e) regarding written options.
tSee Note 1(h) regarding securities sold short.
uPrincipal amount is stated in 100 Mexican Peso Units.
| 60 | Annual Report | franklintempleton.com |
FRANKLIN ALTERNATIVE STRATEGIES FUNDS
CONSOLIDATED STATEMENT OF INVESTMENTS
Franklin K2 Alternative Strategies Fund (continued)
At May 31, 2017, the Fund had the following futures contracts outstanding. See Note 1(e).
| Futures Contracts | ||||||||||||||||||||||||
| Description | Type | Number of Contracts | Notional Value | Expiration Date | Unrealized Appreciation | Unrealized Depreciation | ||||||||||||||||||
| Commodity Contractsa | ||||||||||||||||||||||||
Aluminum | Long | 93 | $ | 4,464,581 | 6/19/17 | $ | 45,112 | $ | — | |||||||||||||||
Aluminum | Short | 93 | 4,464,581 | 6/19/17 | 69,611 | — | ||||||||||||||||||
Aluminum | Long | 40 | 1,931,500 | 9/18/17 | — | (26,347 | ) | |||||||||||||||||
Aluminum | Short | 2 | 96,575 | 9/18/17 | 919 | — | ||||||||||||||||||
Brent Crude Oil | Short | 145 | 7,360,200 | 6/30/17 | 401,420 | — | ||||||||||||||||||
Cocoa | Short | 33 | 673,070 | 7/14/17 | 29,408 | — | ||||||||||||||||||
Cocoa | Short | 2 | 41,204 | 9/14/17 | — | (1,690 | ) | |||||||||||||||||
Coffee | Short | 17 | 839,588 | 9/19/17 | 8,821 | — | ||||||||||||||||||
Copper | Long | 32 | 4,532,600 | 6/19/17 | — | (192,487 | ) | |||||||||||||||||
Copper | Short | 32 | 4,532,600 | 6/19/17 | 56,388 | — | ||||||||||||||||||
Copper | Long | 3 | 426,750 | 9/18/17 | 1,998 | — | ||||||||||||||||||
Corn | Short | 52 | 967,200 | 7/14/17 | — | (1,591 | ) | |||||||||||||||||
Cotton | Long | 6 | 218,370 | 12/06/17 | — | (452 | ) | |||||||||||||||||
Gold 100 Oz | Long | 2 | 255,080 | 8/29/17 | 546 | — | ||||||||||||||||||
Kansas City Wheat | Short | 17 | 366,988 | 7/14/17 | 27,404 | — | ||||||||||||||||||
Low Sulphur Diesel | Short | 5 | 318,759 | 6/30/17 | — | (12,498 | ) | |||||||||||||||||
Low Sulphur Gas Oil | Short | 8 | 356,600 | 7/12/17 | — | (3,887 | ) | |||||||||||||||||
Natural Gas | Short | 13 | 399,230 | 6/28/17 | 15,851 | — | ||||||||||||||||||
RBOB Gasoline | Short | 22 | 1,475,166 | 6/30/17 | — | (74,696 | ) | |||||||||||||||||
Silver | Long | 12 | 1,044,360 | 7/27/17 | — | (34,787 | ) | |||||||||||||||||
Soybean Oil | Short | 18 | 338,472 | 7/14/17 | 13,103 | — | ||||||||||||||||||
Soybeans | Short | 49 | 2,244,200 | 7/14/17 | 84,192 | — | ||||||||||||||||||
Sugar | Short | 35 | 593,096 | 9/29/17 | 5,849 | — | ||||||||||||||||||
Wheat | Short | 17 | 364,863 | 7/14/17 | 8,666 | — | ||||||||||||||||||
Zinc | Long | 55 | 3,561,250 | 6/19/17 | — | (318,984 | ) | |||||||||||||||||
Zinc | Short | 55 | 3,561,250 | 6/19/17 | 73,615 | — | ||||||||||||||||||
Zinc | Long | 4 | 260,375 | 9/18/17 | — | (3,887 | ) | |||||||||||||||||
Zinc | Short | 4 | 260,375 | 9/18/17 | 3,838 | — | ||||||||||||||||||
|
|
|
| |||||||||||||||||||||
| 45,948,883 | 846,741 | (671,306 | ) | |||||||||||||||||||||
|
|
|
| |||||||||||||||||||||
| Equity Contracts | ||||||||||||||||||||||||
Amsterdam Index | Short | 1 | 117,458 | 7/21/17 | 358 | — | ||||||||||||||||||
CAC 40 10 Euro Indexa | Short | 2 | 118,323 | 6/16/17 | 279 | — | ||||||||||||||||||
CBOE Volatility Index | Long | 17 | 229,925 | 8/16/17 | — | (8,971 | ) | |||||||||||||||||
DAX Indexa | Long | 12 | 4,259,091 | 6/16/17 | 211,492 | — | ||||||||||||||||||
DJIA Mini E-CBOT Indexa | Long | 89 | 9,345,890 | 6/16/17 | 56,123 | — | ||||||||||||||||||
EURO STOXX 50 Price EURa | Long | 26 | 1,037,733 | 6/16/17 | 66,197 | — | ||||||||||||||||||
EURO STOXX 50 Price EUR | Short | 760 | 30,333,749 | 6/16/17 | — | (720,718 | ) | |||||||||||||||||
FTSE 100 Indexa | Long | 135 | 13,059,410 | 6/16/17 | 349,329 | — | ||||||||||||||||||
FTSE 100 Index | Short | 100 | 9,673,637 | 6/16/17 | — | (301,281 | ) | |||||||||||||||||
Hang Seng Indexa | Long | 24 | 3,923,902 | 6/29/17 | 49,449 | — | ||||||||||||||||||
Nasdaq 100 E-Mini Indexa | Long | 48 | 5,561,520 | 6/16/17 | 402,161 | — | ||||||||||||||||||
Nikkei 225 Indexa | Long | 25 | 4,437,923 | 6/08/17 | 107,343 | — | ||||||||||||||||||
Russell 2000 Mini Indexa | Long | 33 | 2,259,015 | 6/16/17 | 11,925 | — | ||||||||||||||||||
S&P 500 E-Mini Indexa | Long | 77 | 9,282,735 | 6/16/17 | 202,829 | — | ||||||||||||||||||
S&P 500 E-Mini Index | Short | 1,369 | 165,039,795 | 6/16/17 | — | (3,612,045 | ) | |||||||||||||||||
STOXX 600 Bank Index | Short | 157 | 1,593,474 | 6/16/17 | — | (55,316 | ) | |||||||||||||||||
TOPIX Indexa | Long | 16 | 2,268,172 | 6/08/17 | 37,139 | — | ||||||||||||||||||
|
|
|
| |||||||||||||||||||||
| 262,541,752 | 1,494,624 | (4,698,331 | ) | |||||||||||||||||||||
|
|
|
| |||||||||||||||||||||
| Interest Rate Contracts | ||||||||||||||||||||||||
3 Month Euribora | Long | 368 | 103,607,095 | 6/18/18 | 52,846 | — | ||||||||||||||||||
3 Month Euribora | Long | 5 | 1,406,441 | 12/17/18 | 261 | — | ||||||||||||||||||
90 Day Eurodollara | Long | 737 | 181,394,125 | 6/18/18 | 67,430 | — | ||||||||||||||||||
90 Day Eurodollara | Long | 11 | 2,702,563 | 12/17/18 | 766 | — | ||||||||||||||||||
90 Day Eurodollar | Short | 200 | 49,110,000 | 3/18/19 | — | (140,514 | ) | |||||||||||||||||
90 Day Sterlinga | Long | 553 | 88,689,620 | 6/20/18 | 103,343 | — | ||||||||||||||||||
| franklintempleton.com | Annual Report | 61 |
FRANKLIN ALTERNATIVE STRATEGIES FUNDS
CONSOLIDATED STATEMENT OF INVESTMENTS
Franklin K2 Alternative Strategies Fund (continued)
| Futures Contracts (continued) | ||||||||||||||||||||||||
| Description | Type | Number of Contracts | Notional Value | Expiration Date | Unrealized Appreciation | Unrealized Depreciation | ||||||||||||||||||
| Interest Rate Contracts (continued) | ||||||||||||||||||||||||
90 Day Sterlinga | Long | 7 | $ | 1,121,639 | 12/19/18 | $ | — | $ | (119 | ) | ||||||||||||||
Australian 10 Yr. Bonda | Long | 126 | 12,336,432 | 6/15/17 | 105,762 | — | ||||||||||||||||||
Euro BOBL | Short | 29 | 4,306,395 | 6/08/17 | 222 | (2,341 | ) | |||||||||||||||||
Euro-Bund | Short | 32 | 5,834,979 | 6/08/17 | 23,742 | — | ||||||||||||||||||
Euro-Buxl 30 Yr. Bond | Short | 11 | 2,079,668 | 6/08/17 | — | (17,606 | ) | |||||||||||||||||
Euro Schatz | Short | �� | 66 | 8,323,863 | 6/08/17 | 180 | — | |||||||||||||||||
Long Gilta | Long | 29 | 4,780,462 | 9/27/17 | 18,699 | — | ||||||||||||||||||
U.S. Treasury 5 Yr. Note | Short | 27 | 3,207,938 | 6/30/17 | — | (39,717 | ) | |||||||||||||||||
U.S. Treasury 10 Yr. Note | Short | 11 | 1,392,188 | 6/21/17 | — | (24,063 | ) | |||||||||||||||||
U.S. Treasury 10 Yr. Note | Short | 25 | 3,157,422 | 9/20/17 | — | (4,736 | ) | |||||||||||||||||
U.S. Treasury Ultra 10 Yr. Note | Short | 36 | 4,886,437 | 9/20/17 | — | (25,665 | ) | |||||||||||||||||
U.S. Treasury Long Bonda | Long | 170 | 26,148,125 | 9/20/17 | 286,137 | — | ||||||||||||||||||
U.S. Treasury Long Bond | Short | 15 | 2,307,188 | 9/20/17 | — | (18,338 | ) | |||||||||||||||||
U.S. Treasury Ultra Bond | Short | 13 | 2,146,625 | 9/20/17 | — | (25,188 | ) | |||||||||||||||||
|
|
|
| |||||||||||||||||||||
| 508,939,205 | 659,388 | (298,287 | ) | |||||||||||||||||||||
|
|
|
| |||||||||||||||||||||
Total Futures Contracts |
| $ | 817,429,840 | $ | 3,000,753 | $ | (5,667,924 | ) | ||||||||||||||||
|
|
|
| |||||||||||||||||||||
Net unrealized appreciation (depreciation) |
| $ | (2,667,171 | ) | ||||||||||||||||||||
|
| |||||||||||||||||||||||
aA portion or all of the contracts are owned by K2 Holdings Investment Corp., a wholly-owned subsidiary of the Fund. See Note 1(i).
At May 31, 2017, the Fund had the following forward exchange contracts outstanding. See Note 1(e).
| Forward Exchange Contracts | ||||||||||||||||||||||||||||
| Currency | Counterpartya | Type | Quantity | Contract Amount* | Settlement Date | Unrealized Appreciation | Unrealized Depreciation | |||||||||||||||||||||
| OTC Forward Exchange Contracts | ||||||||||||||||||||||||||||
Brazilian Real | MSCS | Buy | 2,970,000 | 873,529 | 6/01/17 | $ | 44,285 | $ | — | |||||||||||||||||||
Brazilian Real | MSCS | Sell | 2,970,000 | 946,885 | 6/01/17 | 29,071 | — | |||||||||||||||||||||
Mexican Peso | MSCS | Buy | 19,205,000 | 961,452 | 6/01/17 | 68,528 | — | |||||||||||||||||||||
Polish Zloty | MSCS | Sell | 11,860,000 | 3,047,316 | 6/02/17 | — | (140,814 | ) | ||||||||||||||||||||
South African Rand | MSCS | Sell | 12,905,000 | 959,779 | 6/02/17 | — | (24,209 | ) | ||||||||||||||||||||
Turkish Lira | MSCS | Buy | 3,445,000 | 958,569 | 6/02/17 | 17,933 | — | |||||||||||||||||||||
Japanese Yen | GSCO | Buy | 1,045,929 | 9,443 | 6/05/17 | 3 | — | |||||||||||||||||||||
British Pound | MSCS | Sell | 100,000 | 129,478 | 6/12/17 | 582 | — | |||||||||||||||||||||
Euro | BOFA | Sell | 1,395,000 | 1,528,906 | 6/12/17 | — | (39,219 | ) | ||||||||||||||||||||
Hungarian Forint | BOFA | Buy | 433,500,000 | 1,522,762 | 6/12/17 | 57,809 | — | |||||||||||||||||||||
British Pound | DBAB | Sell | 481,000 | 619,581 | 6/15/17 | — | (472 | ) | ||||||||||||||||||||
Brazilian Real | BOFA | Sell | 275,000 | 85,245 | 6/16/17 | 567 | — | |||||||||||||||||||||
British Pound | BNYM | Sell | 2,875,000 | 3,716,426 | 6/16/17 | 10,162 | — | |||||||||||||||||||||
Euro | BNYM | Sell | 7,026,000 | 7,678,986 | 6/16/17 | 80 | (220,802 | ) | ||||||||||||||||||||
Swiss Franc | BNYM | Buy | 2,300,000 | 2,360,112 | 6/16/17 | 17,166 | — | |||||||||||||||||||||
Swiss Franc | BNYM | Sell | 823,000 | 818,335 | 6/16/17 | — | (32,317 | ) | ||||||||||||||||||||
Euro | DBAB | Sell | 183,000 | 202,911 | 6/19/17 | — | (2,880 | ) | ||||||||||||||||||||
New Zealand Dollar | DBAB | Sell | 805,000 | 554,094 | 6/19/17 | — | (16,025 | ) | ||||||||||||||||||||
New Zealand Dollar | MSCS | Sell | 1,300,000 | 894,569 | 6/19/17 | — | (26,119 | ) | ||||||||||||||||||||
Swedish Krona | MSCS | Buy | 13,525,000 | 1,538,259 | 6/19/17 | 19,663 | — | |||||||||||||||||||||
British Pound | DBAB | Buy | 337,000 | 426,729 | 6/20/17 | 8,494 | (725 | ) | ||||||||||||||||||||
British Pound | DBAB | Sell | 1,162,000 | 1,436,658 | 6/20/17 | 532 | (62,042 | ) | ||||||||||||||||||||
Canadian Dollar | DBAB | Buy | 1,912,000 | 1,397,724 | 6/20/17 | 18,248 | — | |||||||||||||||||||||
Canadian Dollar | DBAB | Sell | 1,909,000 | 1,393,923 | 6/20/17 | 2,609 | (22,436 | ) | ||||||||||||||||||||
Euro | DBAB | Buy | 2,101,000 | 2,280,591 | 6/20/17 | 82,204 | (4 | ) | ||||||||||||||||||||
Euro | DBAB | Sell | 4,665,000 | 5,039,965 | 6/20/17 | 111 | (206,422 | ) | ||||||||||||||||||||
Swiss Franc | DBAB | Sell | 95,000 | 95,269 | 6/20/17 | 1 | (2,951 | ) | ||||||||||||||||||||
Chinese Yuan | DBAB | Buy | 10,299,492 | 1,511,076 | 6/21/17 | 7,277 | — | |||||||||||||||||||||
Chinese Yuan | DBAB | Sell | 10,299,492 | 1,483,435 | 6/21/17 | — | (34,917 | ) | ||||||||||||||||||||
Chinese Yuan | MSCO | Buy | 10,963,274 | 1,572,134 | 6/21/17 | 44,074 | — | |||||||||||||||||||||
| 62 | Annual Report | franklintempleton.com |
FRANKLIN ALTERNATIVE STRATEGIES FUNDS
CONSOLIDATED STATEMENT OF INVESTMENTS
Franklin K2 Alternative Strategies Fund (continued)
| Forward Exchange Contracts (continued) | ||||||||||||||||||||||||||||
| Currency | Counterpartya | Type | Quantity | Contract Amount* | Settlement Date | Unrealized Appreciation | Unrealized Depreciation | |||||||||||||||||||||
| OTC Forward Exchange Contracts (continued) | ||||||||||||||||||||||||||||
Chinese Yuan | MSCO | Sell | 10,963,274 | 1,574,731 | 6/21/17 | $ | — | $ | (41,477 | ) | ||||||||||||||||||
Euro | BNYM | Buy | 543,689 | 585,143 | 6/21/17 | 26,324 | — | |||||||||||||||||||||
Euro | BNYM | Sell | 2,673,011 | 2,871,541 | 6/21/17 | — | (134,703 | ) | ||||||||||||||||||||
Euro | BOFA | Buy | 512,564 | 563,275 | 6/21/17 | 13,188 | — | |||||||||||||||||||||
Euro | DBAB | Buy | 2,036,575 | 2,263,538 | 6/21/17 | 26,927 | — | |||||||||||||||||||||
Euro | DBAB | Sell | 9,535,151 | 10,220,066 | 6/21/17 | — | (503,785 | ) | ||||||||||||||||||||
Euro | MSCO | Buy | 1,716,307 | 1,883,036 | 6/21/17 | 47,232 | — | |||||||||||||||||||||
Euro | MSCO | Sell | 1,726,044 | 1,875,368 | 6/21/17 | — | (65,854 | ) | ||||||||||||||||||||
Indian Rupee | MSCO | Buy | 73,509,527 | 1,138,800 | 6/21/17 | — | (2,610 | ) | ||||||||||||||||||||
Mexican Peso | BOFA | Buy | 29,932,900 | 1,575,608 | 6/21/17 | 23,860 | — | |||||||||||||||||||||
Mexican Peso | BOFA | Sell | 29,932,900 | 1,592,006 | 6/21/17 | — | (7,462 | ) | ||||||||||||||||||||
Mexican Peso | DBAB | Buy | 13,609,590 | 721,305 | 6/21/17 | 5,925 | — | |||||||||||||||||||||
Mexican Peso | MSCO | Buy | 14,358,967 | 764,466 | 6/21/17 | 2,807 | — | |||||||||||||||||||||
Mexican Peso | MSCO | Sell | 57,174,845 | 3,044,640 | 6/21/17 | 22,207 | (32,712 | ) | ||||||||||||||||||||
Russian Ruble | BOFA | Sell | 49,575,629 | 846,390 | 6/21/17 | — | (23,369 | ) | ||||||||||||||||||||
Russian Ruble | MSCO | Buy | 61,473,010 | 1,044,900 | 6/21/17 | 33,589 | — | |||||||||||||||||||||
Russian Ruble | MSCO | Sell | 156,556,614 | 2,696,080 | 6/21/17 | — | (50,564 | ) | ||||||||||||||||||||
South African Rand | MSCO | Sell | 13,807,585 | 991,134 | 6/21/17 | — | (57,540 | ) | ||||||||||||||||||||
Swiss Franc | BNYM | Buy | 532,074 | 537,232 | 6/21/17 | 12,907 | — | |||||||||||||||||||||
Swiss Franc | BNYM | Sell | 3,017,074 | 3,016,125 | 6/21/17 | — | (103,384 | ) | ||||||||||||||||||||
Turkish Lira | DBAB | Buy | 4,624,994 | 1,224,904 | 6/21/17 | 77,637 | — | |||||||||||||||||||||
Turkish Lira | DBAB | Sell | 4,624,994 | 1,200,611 | 6/21/17 | — | (101,930 | ) | ||||||||||||||||||||
Turkish Lira | MSCO | Buy | 5,436,317 | 1,486,795 | 6/21/17 | 44,239 | — | |||||||||||||||||||||
Turkish Lira | MSCO | Sell | 1,489,022 | 408,231 | 6/21/17 | — | (11,124 | ) | ||||||||||||||||||||
Indonesian Rupiah | MSCS | Sell | 12,800,000,000 | 958,227 | 6/22/17 | — | (442 | ) | ||||||||||||||||||||
Australian Dollarb | MSCO | Buy | 21,965,000 | 16,538,666 | 6/23/17 | 2,616 | (226,266 | ) | ||||||||||||||||||||
Australian Dollarb | MSCO | Sell | 20,002,000 | 15,000,848 | 6/23/17 | 148,753 | (4,854 | ) | ||||||||||||||||||||
British Poundb | MSCO | Buy | 28,971,000 | 37,212,727 | 6/23/17 | 209,875 | (66,307 | ) | ||||||||||||||||||||
British Poundb | MSCO | Sell | 15,962,000 | 19,563,330 | 6/23/17 | 166 | (1,018,842 | ) | ||||||||||||||||||||
Canadian Dollarb | MSCO | Buy | 6,798,000 | 5,064,059 | 6/23/17 | 6 | (29,362 | ) | ||||||||||||||||||||
Canadian Dollarb | MSCO | Sell | 27,543,000 | 20,519,538 | 6/23/17 | 137,008 | (16,238 | ) | ||||||||||||||||||||
Eurob | MSCO | Buy | 33,282,000 | 36,487,154 | 6/23/17 | 948,107 | — | |||||||||||||||||||||
Eurob | MSCO | Sell | 21,644,000 | 23,076,702 | 6/23/17 | — | (1,268,254 | ) | ||||||||||||||||||||
Japanese Yenb | MSCO | Buy | 3,988,848,000 | 36,024,643 | 6/23/17 | 133,145 | (102,274 | ) | ||||||||||||||||||||
Japanese Yenb | MSCO | Sell | 3,258,361,000 | 28,704,880 | 6/23/17 | 3,028 | (750,729 | ) | ||||||||||||||||||||
Mexican Pesob | MSCO | Buy | 174,318,000 | 9,072,267 | 6/23/17 | 240,064 | (877 | ) | ||||||||||||||||||||
Mexican Pesob | MSCO | Sell | 88,124,000 | 4,432,048 | 6/23/17 | — | (275,226 | ) | ||||||||||||||||||||
New Zealand Dollarb | MSCO | Buy | 13,166,000 | 9,099,310 | 6/23/17 | 224,362 | — | |||||||||||||||||||||
New Zealand Dollarb | MSCO | Sell | 18,490,000 | 12,836,206 | 6/23/17 | 437 | (258,164 | ) | ||||||||||||||||||||
Swiss Francb | MSCO | Buy | 31,115,000 | 31,692,478 | 6/23/17 | 483,319 | — | |||||||||||||||||||||
Swiss Francb | MSCO | Sell | 22,488,000 | 22,425,174 | 6/23/17 | — | (829,504 | ) | ||||||||||||||||||||
Canadian Dollar | MSCS | Sell | 1,920,000 | 1,427,589 | 6/26/17 | 5,523 | — | |||||||||||||||||||||
Euro | DBAB | Sell | 230,000 | 257,559 | 6/26/17 | — | (1,186 | ) | ||||||||||||||||||||
Norwegian Krone | MSCS | Buy | 12,600,000 | 1,501,453 | 6/26/17 | — | (9,560 | ) | ||||||||||||||||||||
Australian Dollar | BNYM | Sell | 577,000 | 434,164 | 6/30/17 | 5,633 | — | |||||||||||||||||||||
British Pound | BNYM | Sell | 538,000 | 681,808 | 6/30/17 | 124 | (12,197 | ) | ||||||||||||||||||||
British Pound | MSCO | Buy | 661,629 | 856,285 | 6/30/17 | — | (2,956 | ) | ||||||||||||||||||||
British Pound | MSCO | Sell | 1,480,144 | 1,897,960 | 6/30/17 | 1,240 | (12,282 | ) | ||||||||||||||||||||
Canadian Dollar | MSCO | Buy | 1,265,377 | 927,859 | 6/30/17 | 9,618 | (190 | ) | ||||||||||||||||||||
Canadian Dollar | MSCO | Sell | 8,784,474 | 6,516,440 | 6/30/17 | 13,684 | (4,070 | ) | ||||||||||||||||||||
Colombian Peso | MSCS | Sell | 780,000,000 | 266,826 | 6/30/17 | 651 | — | |||||||||||||||||||||
Euro | BNYM | Buy | 1,900,000 | 2,069,901 | 6/30/17 | 68,030 | — | |||||||||||||||||||||
Euro | BNYM | Sell | 7,251,000 | 7,821,763 | 6/30/17 | — | (337,254 | ) | ||||||||||||||||||||
Euro | BOFA | Sell | 2,800,000 | 3,143,392 | 6/30/17 | — | (7,242 | ) | ||||||||||||||||||||
Euro | MSCO | Buy | 259,717 | 288,453 | 6/30/17 | 3,787 | — | |||||||||||||||||||||
Euro | MSCO | Sell | 1,174,507 | 1,283,180 | 6/30/17 | — | (38,406 | ) | ||||||||||||||||||||
Hong Kong Dollar | BNYM | Sell | 686,000 | 88,436 | 6/30/17 | 338 | — | |||||||||||||||||||||
Japanese Yen | MSCO | Buy | 86,707,361 | 784,432 | 6/30/17 | 5,201 | (5,621 | ) | ||||||||||||||||||||
| franklintempleton.com | Annual Report | 63 |
FRANKLIN ALTERNATIVE STRATEGIES FUNDS
CONSOLIDATED STATEMENT OF INVESTMENTS
Franklin K2 Alternative Strategies Fund (continued)
| Forward Exchange Contracts (continued) | ||||||||||||||||||||||||||||
| Currency | Counterpartya | Type | Quantity | Contract Amount* | Settlement Date | Unrealized Appreciation | Unrealized Depreciation | |||||||||||||||||||||
| OTC Forward Exchange Contracts (continued) | ||||||||||||||||||||||||||||
Norwegian Krone | MSCO | Buy | 9,770,674 | 1,138,413 | 6/30/17 | $ | 18,554 | $ | — | |||||||||||||||||||
Norwegian Krone | MSCS | Buy | 12,480,000 | 1,500,626 | 6/30/17 | — | (22,842 | ) | ||||||||||||||||||||
Swedish Krona | MSCO | Buy | 1,571,552 | 179,738 | 6/30/17 | 1,407 | — | |||||||||||||||||||||
Swedish Krona | MSCO | Sell | 5,738,099 | 650,091 | 6/30/17 | — | (11,310 | ) | ||||||||||||||||||||
Mexican Peso | MSCS | Buy | 19,205,000 | 1,028,441 | 7/03/17 | — | (4,328 | ) | ||||||||||||||||||||
Polish Zloty | MSCS | Sell | 11,860,000 | 3,191,260 | 7/03/17 | 4,052 | — | |||||||||||||||||||||
South African Rand | MSCS | Sell | 12,905,000 | 973,323 | 7/03/17 | — | (4,651 | ) | ||||||||||||||||||||
Turkish Lira | MSCS | Buy | 3,445,000 | 965,135 | 7/03/17 | 1,614 | — | |||||||||||||||||||||
Brazilian Real | MSCS | Sell | 3,350,000 | 966,671 | 7/06/17 | — | (60,150 | ) | ||||||||||||||||||||
Canadian Dollar | GSCO | Sell | 2,000,000 | 1,484,820 | 7/20/17 | 2,914 | — | |||||||||||||||||||||
Argentine Peso | BOFA | Buy | 17,629,690 | 1,088,252 | 7/21/17 | — | (20,167 | ) | ||||||||||||||||||||
Argentine Peso | BOFA | Sell | 11,887,717 | 738,459 | 7/21/17 | 18,248 | — | |||||||||||||||||||||
Canadian Dollar | BNYM | Sell | 2,875,000 | 2,114,888 | 7/21/17 | — | (15,385 | ) | ||||||||||||||||||||
Euro | BNYM | Buy | 325,000 | 366,223 | 7/21/17 | — | (129 | ) | ||||||||||||||||||||
Euro | BNYM | Sell | 878,000 | 977,126 | 7/21/17 | — | (11,890 | ) | ||||||||||||||||||||
Japanese Yen | BNYM | Sell | 61,000,000 | 548,322 | 7/21/17 | — | (3,752 | ) | ||||||||||||||||||||
Euro | BOFA | Sell | 225,000 | 245,723 | 8/11/17 | — | (8,021 | ) | ||||||||||||||||||||
Russian Ruble | MSCS | Sell | 56,500,000 | 971,750 | 8/24/17 | — | (6,161 | ) | ||||||||||||||||||||
Turkish Lira | MSCS | Buy | 3,500,000 | 951,152 | 8/24/17 | 16,259 | — | |||||||||||||||||||||
Chinese Yuan | BOFA | Buy | 11,100,000 | 1,574,289 | 9/19/17 | 47,416 | — | |||||||||||||||||||||
Chinese Yuan | BOFA | Sell | 11,100,000 | 1,616,780 | 9/19/17 | — | (4,926 | ) | ||||||||||||||||||||
Chinese Yuan | MSCS | Buy | 4,300,000 | 609,497 | 9/19/17 | 18,731 | — | |||||||||||||||||||||
Chinese Yuan | MSCS | Sell | 4,300,000 | 627,234 | 9/19/17 | — | (995 | ) | ||||||||||||||||||||
Argentine Peso | BOFA | Buy | 2,708,339 | 161,403 | 9/20/17 | — | (2,015 | ) | ||||||||||||||||||||
Euro | JPHQ | Sell | 1,893,297 | 50,638,117 | CZK | 11/29/17 | 171,408 | (135,524 | ) | |||||||||||||||||||
Czech Koruna | MSCO | Sell | 47,091,687 | 1,750,621 | EUR | 12/15/17 | 92,887 | (138,489 | ) | |||||||||||||||||||
Euro | MSCO | Sell | 1,985,404 | 53,038,073 | CZK | 12/15/17 | 141,792 | (106,021 | ) | |||||||||||||||||||
Czech Koruna | MSCO | Sell | 18,995,258 | 718,701 | EUR | 1/10/18 | 40,919 | (45,554 | ) | |||||||||||||||||||
Euro | MSCO | Sell | 714,860 | 18,995,258 | CZK | 1/10/18 | 29,296 | (20,293 | ) | |||||||||||||||||||
Euro | MSCO | Sell | 3,841 | 4,257 | 1/10/18 | — | (111 | ) | ||||||||||||||||||||
Philippine Peso | BOFA | Buy | 145,790,000 | 2,861,433 | 5/21/18 | 21,472 | — | |||||||||||||||||||||
|
| |||||||||||||||||||||||||||
Total Forward Exchange Contracts |
| $ | 4,037,925 | $ | (7,869,885 | ) | ||||||||||||||||||||||
|
| |||||||||||||||||||||||||||
Net unrealized appreciation (depreciation) |
| $ | (3,831,960 | ) | ||||||||||||||||||||||||
|
| |||||||||||||||||||||||||||
*In U.S. dollars unless otherwise indicated.
aMay be comprised of multiple contracts with the same counterparty, currency and settlement date.
bA portion or all of the contracts are owned by K2 Holdings Investment Corp., a wholly-owned subsidiary of the Fund. See Note 1(i).
At May 31, 2017, the Fund had the following credit default swap contracts outstanding. See Note 1(e).
Credit Default Swap Contracts
| Description | Periodic Payment Rate | Counterparty/ Exchange | Notional Amounta | Expiration Date | Unamortized Upfront Payments (Receipts) | Unrealized Appreciation | Unrealized Depreciation | Value | Ratingb | |||||||||||||||||||||||||||||||
| Centrally Cleared Swap Contracts | ||||||||||||||||||||||||||||||||||||||||
| Contracts to Buy Protection | ||||||||||||||||||||||||||||||||||||||||
| Single Name | ||||||||||||||||||||||||||||||||||||||||
Government of Mexico | 1.00 | % | ICE | 1,810,000 | 12/20/21 | $ | 51,249 | $ | — | $ | (46,549 | ) | $ | 4,700 | ||||||||||||||||||||||||||
Government of South Africa | 1.00 | % | ICE | 2,644,000 | 12/20/21 | 181,272 | — | (98,856 | ) | 82,416 | ||||||||||||||||||||||||||||||
Government of South Africa | 1.00 | % | ICE | 1,495,000 | 6/20/22 | 77,628 | — | (15,394 | ) | 62,234 | ||||||||||||||||||||||||||||||
Government of South Korea | 1.00 | % | ICE | 1,947,567 | 12/20/21 | (56,447 | ) | 14,929 | — | (41,518 | ) | |||||||||||||||||||||||||||||
Government of Turkey | 1.00 | % | ICE | 1,976,000 | 9/20/20 | 157,717 | — | (138,822 | ) | 18,895 | ||||||||||||||||||||||||||||||
Government of Turkey | 1.00 | % | ICE | 1,723,000 | 12/20/20 | 104,521 | — | (80,801 | ) | 23,720 | ||||||||||||||||||||||||||||||
Government of Turkey | 1.00 | % | ICE | 429,000 | 12/20/21 | 26,235 | — | (11,650 | ) | 14,585 | ||||||||||||||||||||||||||||||
| 64 | Annual Report | franklintempleton.com |
FRANKLIN ALTERNATIVE STRATEGIES FUNDS
CONSOLIDATED STATEMENT OF INVESTMENTS
Franklin K2 Alternative Strategies Fund (continued)
Credit Default Swap Contracts (continued)
| Description | Periodic Payment Rate | Counterparty/ Exchange | Notional Amounta | Expiration Date | Unamortized Upfront Payments (Receipts) | Unrealized Appreciation | Unrealized Depreciation | Value | Ratingb | |||||||||||||||||||||||||||||||
| Centrally Cleared Swap Contracts (continued) | ||||||||||||||||||||||||||||||||||||||||
| Contracts to Buy Protection (continued) | ||||||||||||||||||||||||||||||||||||||||
| Traded Index | ||||||||||||||||||||||||||||||||||||||||
CDX.NA.HY.28 | 5.00 | % | ICE | 3,200,000 | 6/20/22 | $ | (196,594 | ) | $ | — | $ | (34,900 | ) | $ | (231,494 | ) | ||||||||||||||||||||||||
| Contracts to Sell Protectionc | ||||||||||||||||||||||||||||||||||||||||
| Single Name | ||||||||||||||||||||||||||||||||||||||||
Government of Russia | 1.00 | % | ICE | 2,800,131 | 9/20/20 | (339,145 | ) | 347,632 | — | 8,487 | BB+ | |||||||||||||||||||||||||||||
Government of Russia | 1.00 | % | ICE | 413,000 | 6/20/21 | (30,563 | ) | 27,851 | — | (2,712 | ) | BB+ | ||||||||||||||||||||||||||||
Government of Russia | 1.00 | % | ICE | 374,000 | 12/20/21 | (13,888 | ) | 7,985 | — | (5,903 | ) | BB+ | ||||||||||||||||||||||||||||
|
| |||||||||||||||||||||||||||||||||||||||
Total Centrally Cleared Swap Contracts |
| $ | (38,015 | ) | $ | 398,397 | $ | (426,972 | ) | $ | (66,590 | ) | ||||||||||||||||||||||||||||
|
| |||||||||||||||||||||||||||||||||||||||
| OTC Swap Contracts | ||||||||||||||||||||||||||||||||||||||||
| Contracts to Buy Protection | ||||||||||||||||||||||||||||||||||||||||
| Single Name | ||||||||||||||||||||||||||||||||||||||||
Enel SpA | 1.00 | % | BZWS | 900,000 | EUR | 6/20/22 | 6,144 | — | (17,725 | ) | (11,581 | ) | ||||||||||||||||||||||||||||
Government of Argentina | 5.00 | % | MSCO | 2,137,000 | 6/20/17 | (4,301 | ) | — | (22,611 | ) | (26,912 | ) | ||||||||||||||||||||||||||||
Government of China | 1.00 | % | MSCS | 500,000 | 6/20/22 | (2,934 | ) | — | (3,433 | ) | (6,367 | ) | ||||||||||||||||||||||||||||
Government of South Korea | 1.00 | % | MSCS | 1,150,000 | 6/20/22 | (26,310 | ) | — | (212 | ) | (26,522 | ) | ||||||||||||||||||||||||||||
Government of Turkey | 1.00 | % | BOFA | 925,000 | 6/20/22 | 59,309 | — | (19,089 | ) | 40,220 | ||||||||||||||||||||||||||||||
Intesa Sanpaolo SpA | 1.00 | % | BZWS | 900,000 | EUR | 6/20/22 | 24,044 | — | (12,196 | ) | 11,848 | |||||||||||||||||||||||||||||
| Traded Index | ||||||||||||||||||||||||||||||||||||||||
CDX.EM.27 | 1.00 | % | DBAB | 500,000 | 6/20/22 | 26,832 | — | (5,972 | ) | 20,860 | ||||||||||||||||||||||||||||||
CMBX.NA.BBB-.S6 | 3.00 | % | MSCS | 154,000 | 5/11/63 | 16,577 | 352 | — | 16,929 | |||||||||||||||||||||||||||||||
CMBX.NA.BBB-.S6 | 3.00 | % | MSCS | 154,000 | 5/11/63 | 16,242 | 687 | — | 16,929 | |||||||||||||||||||||||||||||||
CMBX.NA.BBB-.S6 | 3.00 | % | MSCS | 104,000 | 5/11/63 | 15,217 | — | (3,785 | ) | 11,432 | ||||||||||||||||||||||||||||||
iTraxx Asia Ex Japan | 1.00 | % | MSCS | 945,000 | 6/20/22 | (663 | ) | — | (5,443 | ) | (6,106 | ) | ||||||||||||||||||||||||||||
|
| |||||||||||||||||||||||||||||||||||||||
Total OTC Swap Contracts |
| $ | 130,157 | $ | 1,039 | $ | (90,466 | ) | $ | 40,730 | ||||||||||||||||||||||||||||||
|
| |||||||||||||||||||||||||||||||||||||||
Total Credit Default Swap Contracts |
| $ | 92,142 | $ | 399,436 | $ | (517,438 | ) | $ | (25,860 | ) | |||||||||||||||||||||||||||||
|
| |||||||||||||||||||||||||||||||||||||||
Net unrealized appreciation (depreciation) |
| $ | (118,002 | ) | ||||||||||||||||||||||||||||||||||||
|
| |||||||||||||||||||||||||||||||||||||||
aIn U.S. dollars unless otherwise indicated. For contracts to sell protection, the notional amount is equal to the maximum potential amount of the future payments and no recourse provisions have been entered into in association with the contracts.
bBased on Standard and Poor’s (S&P) Rating for single name swaps.
cThe Fund enters contracts to sell protection to create a long credit position. Performance triggers include default, bankruptcy or restructuring for single name swaps.
See Notes 1(e) and 9 regarding derivative financial instruments and other derivative information, respectively.
At May 31, 2017, the Fund had the following cross-currency swap contracts outstanding. See Note 1(e).
Cross-Currency Swap Contracts
| Description | Counterparty | Notional Amount | Expiration Date | Unrealized Appreciation | Unrealized Depreciation | |||||||||||||||||||
| OTC Swap Contracts | ||||||||||||||||||||||||
Receive Fixed annual 11.29% | DBAB | | 3,770,600 1,028,280 |
| | TRY USD | 6/21/22 | $ | 19,128 | $ | — | |||||||||||||
Receive Fixed annual 11.01% | DBAB | | 2,677,905 746,142 |
| | TRY USD | 6/21/22 | 7,377 | — | |||||||||||||||
Receive Fixed annual 11.23% | BOFA | | 3,781,032 1,032,787 |
| | TRY USD | 6/21/22 | 19,437 | — | |||||||||||||||
|
| |||||||||||||||||||||||
Total Cross-Currency Swap Contracts |
| $ | 45,942 | $ | — | |||||||||||||||||||
|
| |||||||||||||||||||||||
Net unrealized appreciation (depreciation) |
| $ | 45,942 | |||||||||||||||||||||
|
| |||||||||||||||||||||||
| franklintempleton.com | Annual Report | 65 |
FRANKLIN ALTERNATIVE STRATEGIES FUNDS
CONSOLIDATED STATEMENT OF INVESTMENTS
Franklin K2 Alternative Strategies Fund (continued)
At May 31, 2017, the Fund had the following interest rate swap contracts outstanding. See Note 1(e).
Interest Rate Swap Contracts
| Description | Counterparty/ Exchange | Notional Amount* | Expiration Date | Unrealized Appreciation | Unrealized Depreciation | |||||||||||||||||||
| Centrally Cleared Swaps | ||||||||||||||||||||||||
Receive Fixed rate 7.43% | LCH | 19,030,429 | ZAR | 6/21/22 | $ | 2,699 | $ | — | ||||||||||||||||
Receive Floating rate 3 Month USD-LIBOR | CME | 1,663,200 | 7/18/26 | 89,877 | — | |||||||||||||||||||
Receive Floating rate 6 Month GBP-LIBOR | LCH | 800,000 | GBP | 1/05/67 | — | (41,029 | ) | |||||||||||||||||
Receive Floating rate 6 Month GBP-LIBOR | LCH | 688,548 | GBP | 1/07/47 | — | (9,760 | ) | |||||||||||||||||
Receive Floating rate 6 Month GBP-LIBOR | LCH | 761,018 | GBP | 11/29/46 | — | (38,108 | ) | |||||||||||||||||
Receive Floating rate 6 Month GBP-LIBOR | LCH | 399,138 | GBP | 12/03/46 | — | (24,952 | ) | |||||||||||||||||
|
| |||||||||||||||||||||||
Total Centrally Cleared Swap Contracts |
| $ | 92,576 | $ | (113,849 | ) | ||||||||||||||||||
|
| |||||||||||||||||||||||
| OTC Swap Contracts | ||||||||||||||||||||||||
Receive Fixed rate 6.13% | BOFA | 28,653,000 | MXN | 7/03/26 | — | (154,303 | ) | |||||||||||||||||
Receive Fixed rate 6.14% | DBAB | 9,000,000 | MXN | 7/03/26 | — | (48,302 | ) | |||||||||||||||||
Receive Floating rate 3 Month ZAR-JIBAR-SAFEX | BZWS | 12,500,000 | ZAR | 5/05/25 | — | (14,834 | ) | |||||||||||||||||
|
| |||||||||||||||||||||||
Total OTC Swap Contracts |
| $ | — | $ | (217,439 | ) | ||||||||||||||||||
|
| |||||||||||||||||||||||
Total Interest Rate Swap Contracts |
| $ | 92,576 | $ | (331,288 | ) | ||||||||||||||||||
|
| |||||||||||||||||||||||
Net unrealized appreciation (depreciation) |
| $ | (238,712 | ) | ||||||||||||||||||||
|
| |||||||||||||||||||||||
*In U.S. dollars unless otherwise indicated.
At May 31, 2017, the Fund had the following total return swap contracts outstanding. See Note 1(e).
| Total Return Swap Contracts | ||||||||||||||||||||||||||||
| Underlying Instrument | Financing Rate | Counter- Party | Notional Value* | Expiration Date | Unrealized Appreciation | Unrealized Depreciation | ||||||||||||||||||||||
| OTC Swap Contracts | ||||||||||||||||||||||||||||
| Equity Contracts - Long | ||||||||||||||||||||||||||||
Booker Group PLC | LIBOR + 45 | DBAB | 359,002 | GBP | 7/03/17 | $ | 10,298 | $ | — | |||||||||||||||||||
Sky PLC | LIBOR + 45 | DBAB | 1,782,588 | GBP | 7/03/17 | — | (17,451 | ) | ||||||||||||||||||||
LafargeHolcim Ltd. | LIBOR + 50 | MSCS | 3,315,591 | CHF | 7/26/17 | 103,627 | — | |||||||||||||||||||||
Nestle SA | LIBOR + 50 | MSCS | 3,399,488 | CHF | 7/26/17 | 85,360 | — | |||||||||||||||||||||
Black Hills Corp. | LIBOR + 75 | DBAB | 995,456 | 7/31/17 | 23,263 | — | ||||||||||||||||||||||
Frontier Communications Corp. | LIBOR + 75 | DBAB | 878,833 | 7/31/17 | 22,868 | — | ||||||||||||||||||||||
Hess Corp. | LIBOR + 75 | DBAB | 468,131 | 7/31/17 | — | (30,387 | ) | |||||||||||||||||||||
Welltower Inc. | LIBOR + 75 | DBAB | 948,917 | 7/31/17 | 22,689 | — | ||||||||||||||||||||||
Christian Dior SA | LIBOR + 45 | DBAB | 3,146,319 | EUR | 8/15/17 | 8,687 | — | |||||||||||||||||||||
Advanced Semiconductor Engineering Inc. | LIBOR + 65 | DBAB | 1,696,723 | 9/19/17 | 54,018 | — | ||||||||||||||||||||||
Akzo Nobel NV | EONIA + 65 | MSCS | 210,789 | EUR | 10/30/17 | — | (62 | ) | ||||||||||||||||||||
Christian Dior SA | EONIA + 65 | MSCS | 1,957,340 | EUR | 10/30/17 | — | (277 | ) | ||||||||||||||||||||
EDP Renovaveis SA | EONIA + 65 | MSCS | 498,009 | EUR | 10/30/17 | — | (90 | ) | ||||||||||||||||||||
Vivendi SA | EONIA + 65 | MSCS | 1,771,002 | EUR | 10/30/17 | — | (243 | ) | ||||||||||||||||||||
Celesio AG | EONIA + 65 | MSCS | 613,244 | EUR | 11/02/17 | — | (164 | ) | ||||||||||||||||||||
E.ON SE | EONIA + 65 | MSCS | 2,452,722 | EUR | 11/02/17 | 64,115 | — | |||||||||||||||||||||
Stada Arzneimittel AG | EONIA + 65 | MSCS | 1,329,474 | EUR | 11/02/17 | — | (298 | ) | ||||||||||||||||||||
Thyssenkrupp AG | EONIA + 65 | MSCS | 1,884,786 | EUR | 11/02/17 | — | (56 | ) | ||||||||||||||||||||
ONEOK Partners LP | LIBOR + 85 | DBAB | 3,084,998 | 11/06/17 | — | (84,493 | ) | |||||||||||||||||||||
| 66 | Annual Report | franklintempleton.com |
FRANKLIN ALTERNATIVE STRATEGIES FUNDS
CONSOLIDATED STATEMENT OF INVESTMENTS
Franklin K2 Alternative Strategies Fund (continued)
| Total Return Swap Contracts (continued) | ||||||||||||||||||||||||||
| Underlying Instrument | Financing Rate | Counter- Party | Notional Value* | Expiration Date | Unrealized Appreciation | Unrealized Depreciation | ||||||||||||||||||||
| OTC Swap Contracts (continued) | ||||||||||||||||||||||||||
| Equity Contracts - Long (continued) | ||||||||||||||||||||||||||
Yamagata Bank Ltd. | LIBOR + 75 | DBAB | 2,504,100 | JPY | 11/17/17 | $ | — | $ | (261 | ) | ||||||||||||||||
Hess Corp. | LIBOR + 75 | BNPP | 245,549 | 11/30/17 | — | (9,939 | ) | |||||||||||||||||||
Tatts Group Ltd. | RBACR + 55 | MSCS | 1,540,405 | AUD | 12/05/17 | — | (1,539 | ) | ||||||||||||||||||
CR Bard Inc. | FEDEF + 40 | MSCS | 323,416 | 12/21/17 | — | (165 | ) | |||||||||||||||||||
Level 3 Communications Inc. | FEDEF + 40 | MSCS | 325,158 | 12/21/17 | — | (165 | ) | |||||||||||||||||||
ONEOK Partners LP | FEDEF + 100 | MSCS | 315,274 | 12/21/17 | — | (240 | ) | |||||||||||||||||||
Tribune Media Co. | FEDEF + 40 | MSCS | 290,091 | 12/21/17 | 1,743 | — | ||||||||||||||||||||
Siemens AG | EURIBOR + 80 | BNPP | 521,000 | EUR | 12/29/17 | 42,105 | — | |||||||||||||||||||
Accor SA | EURIBOR + 50 | MSCS | 568,441 | EUR | 1/10/18 | 120,350 | — | |||||||||||||||||||
Air France-KLM | EURIBOR + 50 | MSCS | 171,727 | EUR | 1/10/18 | 49,957 | — | |||||||||||||||||||
Kering | EURIBOR + 50 | MSCS | 359,191 | EUR | 1/10/18 | 113,370 | — | |||||||||||||||||||
Moncler SpA | EURIBOR + 50 | MSCS | 72,516 | EUR | 1/10/18 | 49,876 | — | |||||||||||||||||||
Plastic Omnium SA | EURIBOR + 50 | MSCS | 634,049 | EUR | 1/10/18 | 107,382 | — | |||||||||||||||||||
Anglo American PLC | LIBOR + 50 | MSCS | 350,980 | GBP | 1/18/18 | 203,503 | — | |||||||||||||||||||
Antofagasta PLC | LIBOR + 50 | MSCS | 550,284 | GBP | 1/18/18 | 377,251 | — | |||||||||||||||||||
International Consolidated Airlines Group SA | LIBOR + 50 | MSCS | 466,024 | GBP | 1/18/18 | 265,195 | — | |||||||||||||||||||
Rio Tinto PLC | LIBOR + 50 | MSCS | 812,958 | GBP | 1/18/18 | 377,895 | — | |||||||||||||||||||
Smurfit Kappa Group PLC | LIBOR + 50 | MSCS | 358,801 | GBP | 1/18/18 | 20,999 | — | |||||||||||||||||||
Booker Group PLC | SONIA + 65 | MSCS | 1,883,474 | GBP | 2/06/18 | — | (1,605 | ) | ||||||||||||||||||
Sky PLC | SONIA + 65 | MSCS | 3,675,490 | GBP | 2/06/18 | — | (3,223 | ) | ||||||||||||||||||
Vodafone Group PLC | SONIA + 65 | MSCS | 1,233,807 | GBP | 2/06/18 | — | (929 | ) | ||||||||||||||||||
WS Atkins PLC | SONIA + 65 | MSCS | 603,032 | GBP | 2/06/18 | — | (253 | ) | ||||||||||||||||||
Anima Holding SpA | LIBOR + 50 | MSCS | 49,454 | EUR | 4/12/18 | — | (3,279 | ) | ||||||||||||||||||
Barclays PLC | LIBOR + 50 | MSCS | 875,939 | GBP | 4/12/18 | — | (198 | ) | ||||||||||||||||||
BNP Paribas SA | LIBOR + 50 | MSCS | 2,102,835 | EUR | 4/12/18 | — | (59,022 | ) | ||||||||||||||||||
Croda International PLC | LIBOR + 50 | MSCS | 255,151 | GBP | 4/12/18 | 21,849 | — | |||||||||||||||||||
Danone SA | LIBOR + 50 | MSCS | 2,733,709 | EUR | 4/12/18 | 51,635 | — | |||||||||||||||||||
Hikma Pharmaceuticals PLC | LIBOR + 50 | MSCS | 765,422 | GBP | 4/12/18 | — | (135,532 | ) | ||||||||||||||||||
Iliad SA | LIBOR + 50 | MSCS | 4,220,916 | EUR | 4/12/18 | 7,976 | — | |||||||||||||||||||
ITV PLC | LIBOR + 50 | MSCS | 2,214,327 | GBP | 4/12/18 | — | (8,451 | ) | ||||||||||||||||||
Remy Cointreau SA | LIBOR + 50 | MSCS | 1,194,915 | EUR | 4/12/18 | 35,841 | — | |||||||||||||||||||
RSA Insurance Group PLC | LIBOR + 50 | MSCS | 1,052,676 | GBP | 4/12/18 | 18,124 | — | |||||||||||||||||||
Smith & Nephew PLC | LIBOR + 50 | MSCS | 1,052,563 | GBP | 4/12/18 | 51,439 | — | |||||||||||||||||||
Smiths Group PLC | LIBOR + 50 | MSCS | 1,135,926 | GBP | 4/12/18 | — | (42,295 | ) | ||||||||||||||||||
Societe Generale SA | LIBOR + 50 | MSCS | 2,095,075 | EUR | 4/12/18 | — | (56,443 | ) | ||||||||||||||||||
Sports Direct International PLC | LIBOR + 50 | MSCS | 718,440 | GBP | 4/12/18 | — | (29,884 | ) | ||||||||||||||||||
Valeo SA | LIBOR + 100 | DBAB | 355,294 | EUR | 5/02/18 | 16,470 | — | |||||||||||||||||||
Alfa Financial Software Holdings PLC | LIBOR + 100 | DBAB | 30,973 | GBP | 5/09/18 | 10,437 | — | |||||||||||||||||||
Alphabet Inc. | LIBOR + 50 | MSCS | 1,354,071 | 5/25/18 | 309,576 | — | ||||||||||||||||||||
Caterpillar Inc. | LIBOR + 50 | MSCS | 1,729,533 | 5/25/18 | 194,768 | — | ||||||||||||||||||||
CSX Corp. | LIBOR + 50 | MSCS | 1,832,630 | 5/25/18 | 175,733 | — | ||||||||||||||||||||
Freeport-McMoRan Inc. | LIBOR + 50 | MSCS | 1,204,863 | 5/25/18 | — | (99,639 | ) | |||||||||||||||||||
Las Vegas Sands Corp. | LIBOR + 50 | MSCS | 1,175,157 | 5/25/18 | 26,299 | — | ||||||||||||||||||||
Newmont Mining Corp. | LIBOR + 50 | MSCS | 1,570,066 | 5/25/18 | 20,557 | — | ||||||||||||||||||||
NVR Inc. | LIBOR + 50 | MSCS | 2,863,096 | 5/25/18 | 1,476,944 | — | ||||||||||||||||||||
Swift Transportation Co. | LIBOR + 50 | MSCS | 1,228,989 | 5/25/18 | 175,902 | — | ||||||||||||||||||||
Actelion Ltd. | FEDEF + 115 | MSCS | 4,459,781 | 8/10/18 | — | (11,375 | ) | |||||||||||||||||||
Brunswick Corp. | LIBOR + 50 | MSCS | 838,797 | 9/20/18 | 87,494 | — | ||||||||||||||||||||
Delta Air Lines Inc. | LIBOR + 50 | MSCS | 2,193,829 | 9/20/18 | 133,712 | — | ||||||||||||||||||||
Monster Beverage Corp. | LIBOR + 50 | MSCS | 918,966 | 9/20/18 | 42,021 | — | ||||||||||||||||||||
Rio Tinto PLC | LIBOR + 50 | MSCS | 2,811,729 | 9/20/18 | 115,439 | — | ||||||||||||||||||||
Take-Two Interactive Software Inc. | LIBOR + 50 | MSCS | 2,103,600 | 9/20/18 | 1,528,511 | — | ||||||||||||||||||||
Yahoo! Inc. | FEDEF + 40 | MSCS | 3,837,757 | 12/20/18 | 1,141,095 | — | ||||||||||||||||||||
Global Logistic Properties Ltd. | SIBOR + 65 | MSCS | 1,772,799 | SGD | 1/15/19 | — | (1,132 | ) | ||||||||||||||||||
Belle International Holdings Ltd. | HIBOR + 65 | MSCS | 10,538,780 | HKD | 1/16/19 | — | (427 | ) | ||||||||||||||||||
| franklintempleton.com | Annual Report | 67 |
FRANKLIN ALTERNATIVE STRATEGIES FUNDS
CONSOLIDATED STATEMENT OF INVESTMENTS
Franklin K2 Alternative Strategies Fund (continued)
| Total Return Swap Contracts (continued) | ||||||||||||||||||||||||||||
| Underlying Instrument | Financing Rate | Counter- Party | Notional Value* | Expiration Date | Unrealized Appreciation | Unrealized Depreciation | ||||||||||||||||||||||
| OTC Swap Contracts (continued) | ||||||||||||||||||||||||||||
| Equity Contracts - Long (continued) | ||||||||||||||||||||||||||||
Svenska Cellulosa AB SA | STIBOR + 65 | MSCS | 2,291,356 | SEK | 4/24/19 | $ | — | $ | (27 | ) | ||||||||||||||||||
|
| |||||||||||||||||||||||||||
| $ | 7,766,373 | $ | (599,544 | ) | ||||||||||||||||||||||||
|
| |||||||||||||||||||||||||||
| OTC Swap Contracts | ||||||||||||||||||||||||||||
| Equity Contracts - Short | ||||||||||||||||||||||||||||
Tesco PLC | LIBOR - 40 | DBAB | 282,247 | GBP | 7/03/17 | — | (11,351 | ) | ||||||||||||||||||||
Alstria Office REIT-AG | LIBOR - 40 | DBAB | 2,604,212 | EUR | 7/19/17 | 5,828 | — | |||||||||||||||||||||
ASM Pacific Technology Ltd. | LIBOR - 50 | DBAB | 2,129,600 | HKD | 7/19/17 | 20,762 | — | |||||||||||||||||||||
China Railway Construction Corp. Ltd. | LIBOR - 41 | DBAB | 1,387,997 | HKD | 7/19/17 | 7,645 | — | |||||||||||||||||||||
Deutsche EuroShop AG | LIBOR - 40 | DBAB | 546,957 | EUR | 7/19/17 | 17,492 | — | |||||||||||||||||||||
Drillisch AG | LIBOR - 453 | DBAB | 5,562,539 | EUR | 7/19/17 | 118,532 | — | |||||||||||||||||||||
ENN Energy Holdings Ltd. | LIBOR - 46 | DBAB | 281,050 | HKD | 7/19/17 | — | (4,448 | ) | ||||||||||||||||||||
Fresenius SE & Co. KGaA | LIBOR - 40 | DBAB | 676,879 | EUR | 7/19/17 | 19,758 | — | |||||||||||||||||||||
Haitian International Holdings Ltd. | LIBOR - 40 | DBAB | 616,440 | HKD | 7/19/17 | 2,455 | — | |||||||||||||||||||||
Haitong International Securities Group Ltd. | LIBOR - 175 | DBAB | 316,508 | HKD | 7/19/17 | — | (1,640 | ) | ||||||||||||||||||||
Hansteen Holdings PLC | LIBOR - 100 | DBAB | 2,371,293 | EUR | 7/19/17 | 19,010 | — | |||||||||||||||||||||
Kloeckner & Co. SE | LIBOR - 40 | DBAB | 66,106 | EUR | 7/19/17 | 1,878 | — | |||||||||||||||||||||
OCI NV | LIBOR - 200 | DBAB | 355,329 | EUR | 7/19/17 | — | (14,519 | ) | ||||||||||||||||||||
Pacific Basin Shipping Ltd. | LIBOR - 150 | DBAB | 55,380 | HKD | 7/19/17 | — | (704 | ) | ||||||||||||||||||||
Playtech PLC | LIBOR - 40 | DBAB | 1,423,548 | EUR | 7/19/17 | 5,039 | — | |||||||||||||||||||||
Shenzhou International Group Holdings Ltd. | LIBOR - 45 | DBAB | 32,110,548 | HKD | 7/19/17 | — | (31,035 | ) | ||||||||||||||||||||
Siemens AG | LIBOR - 40 | DBAB | 1,396,737 | EUR | 7/19/17 | 35,670 | — | |||||||||||||||||||||
Steinhoff International Holdings NV | LIBOR - 75 | DBAB | 1,313,041 | EUR | 7/19/17 | — | (22,388 | ) | ||||||||||||||||||||
Yuexiu Transport Infrastructure Ltd. | LIBOR - 189 | DBAB | 4,318,120 | HKD | 7/19/17 | — | (432 | ) | ||||||||||||||||||||
Koninklijke KPN NV | LIBOR - 40 | DBAB | 75,104 | EUR | 7/19/17 | — | (3,383 | ) | ||||||||||||||||||||
Swisscom AG | TOIS - 40 | MSCS | 587,930 | CHF | 7/19/17 | — | (421 | ) | ||||||||||||||||||||
Iberdrola SA | LIBOR - 40 | DBAB | 1,709,784 | EUR | 7/20/17 | — | (95,485 | ) | ||||||||||||||||||||
NH Hotel Group SA | LIBOR - 40 | DBAB | 155,459 | EUR | 7/20/17 | — | (2,923 | ) | ||||||||||||||||||||
Ayala Land Inc. | LIBOR - 500 | DBAB | 120,596 | 7/21/17 | — | (6,241 | ) | |||||||||||||||||||||
Advanced Micro Devices Inc. | LIBOR - 35 | DBAB | 163,169 | 7/31/17 | 3,322 | — | ||||||||||||||||||||||
Advanced Semiconductor Engineering Inc. | LIBOR - 35 | DBAB | 1,654,191 | 7/31/17 | — | (42,312 | ) | |||||||||||||||||||||
Apollo Commercial Real Estate Finance Inc. | LIBOR - 35 | DBAB | 241,623 | 7/31/17 | — | (3,036 | ) | |||||||||||||||||||||
Black Hills Corp. | LIBOR - 35 | DBAB | 897,159 | 7/31/17 | — | (15,390 | ) | |||||||||||||||||||||
Citrix Systems Inc. | LIBOR - 35 | DBAB | 1,085,341 | 7/31/17 | 47,884 | — | ||||||||||||||||||||||
Ctrip.com International Ltd. | LIBOR - 35 | DBAB | 5,287,141 | 7/31/17 | 50,035 | — | ||||||||||||||||||||||
DHT Holdings Inc. | LIBOR - 35 | DBAB | 705,865 | 7/31/17 | 48,463 | — | ||||||||||||||||||||||
DISH Network Corp. | LIBOR - 35 | DBAB | 259,297 | 7/31/17 | — | (653 | ) | |||||||||||||||||||||
Euronet Worldwide Inc. | LIBOR - 35 | DBAB | 1,504,157 | 7/31/17 | — | (48,820 | ) | |||||||||||||||||||||
Frontier Communications Corp. | LIBOR - 200 | DBAB | 618,633 | 7/31/17 | — | (8,864 | ) | |||||||||||||||||||||
General Cable Corp. | LIBOR - 35 | DBAB | 53,774 | 7/31/17 | — | (151 | ) | |||||||||||||||||||||
Golar LNG Ltd. | LIBOR - 35 | DBAB | 1,097,590 | 7/31/17 | 183,098 | — | ||||||||||||||||||||||
Gramercy Property Trust | LIBOR - 35 | DBAB | 1,220,747 | 7/31/17 | — | (66,439 | ) | |||||||||||||||||||||
Hess Corp. | LIBOR - 35 | DBAB | 376,305 | 7/31/17 | 29,002 | — | ||||||||||||||||||||||
Intel Corp. | LIBOR - 35 | DBAB | 1,123,556 | 7/31/17 | — | (23,485 | ) | |||||||||||||||||||||
Medicines Co. | LIBOR - 35 | DBAB | 1,966,227 | 7/31/17 | 280,059 | — | ||||||||||||||||||||||
MercadoLibre Inc. | LIBOR - 35 | DBAB | 1,549,983 | 7/31/17 | 106,578 | — | ||||||||||||||||||||||
Molina Healthcare Inc. | LIBOR - 35 | DBAB | 3,273,295 | 7/31/17 | 142,540 | — | ||||||||||||||||||||||
Nuance Communications Inc. | LIBOR - 35 | DBAB | 456,895 | 7/31/17 | 14,956 | — | ||||||||||||||||||||||
Palo Alto Networks Inc. | LIBOR - 35 | DBAB | 2,294,115 | 7/31/17 | 23,385 | — | ||||||||||||||||||||||
Pandora Media Inc. | LIBOR - 35 | DBAB | 54,043 | 7/31/17 | 4,571 | — | ||||||||||||||||||||||
Pattern Energy Group Inc. | LIBOR - 35 | DBAB | 118,088 | 7/31/17 | — | (2,045 | ) | |||||||||||||||||||||
Priceline Group Inc. | LIBOR - 35 | DBAB | 3,509,722 | 7/31/17 | — | (121,682 | ) | |||||||||||||||||||||
Salesforce.com Inc. | LIBOR - 35 | DBAB | 2,518,277 | 7/31/17 | 3,884 | — | ||||||||||||||||||||||
| 68 | Annual Report | franklintempleton.com |
FRANKLIN ALTERNATIVE STRATEGIES FUNDS
CONSOLIDATED STATEMENT OF INVESTMENTS
Franklin K2 Alternative Strategies Fund (continued)
| Total Return Swap Contracts (continued) | ||||||||||||||||||||||||||
| Underlying Instrument | Financing Rate | Counter- Party | Notional Value* | Expiration Date | Unrealized Appreciation | Unrealized Depreciation | ||||||||||||||||||||
| OTC Swap Contracts (continued) | ||||||||||||||||||||||||||
| Equity Contracts - Short (continued) | ||||||||||||||||||||||||||
ServiceNow Inc. | LIBOR - 35 | DBAB | 1,689,756 | 7/31/17 | $ | — | $ | (100,701 | ) | |||||||||||||||||
Ship Finance International Ltd. | LIBOR - 90 | DBAB | 1,423,494 | 7/31/17 | 60,635 | — | ||||||||||||||||||||
Siliconware Precision Industries Co. Ltd. | LIBOR - 35 | DBAB | 251,746 | 7/31/17 | — | (9,315 | ) | |||||||||||||||||||
Starwood Property Trust Inc. | LIBOR - 35 | DBAB | 111,735 | 7/31/17 | — | (1,615 | ) | |||||||||||||||||||
TAL Education Group | LIBOR - 35 | DBAB | 3,340,456 | 7/31/17 | 119,894 | — | ||||||||||||||||||||
Theravance Biopharma Inc. | LIBOR - 125 | DBAB | 587,974 | 7/31/17 | 18,789 | — | ||||||||||||||||||||
VeriSign Inc. | LIBOR - 35 | DBAB | 6,309,142 | 7/31/17 | — | (2,127 | ) | |||||||||||||||||||
Welltower Inc. | LIBOR - 35 | DBAB | 786,827 | 7/31/17 | — | (9,491 | ) | |||||||||||||||||||
Workday Inc. | LIBOR - 35 | DBAB | 844,101 | 7/31/17 | — | (17,035 | ) | |||||||||||||||||||
Hermes International | LIBOR - 50 | DBAB | 1,059,256 | EUR | 8/15/17 | 12,242 | — | |||||||||||||||||||
Siliconware Precision Industries Co. Ltd. | LIBOR - 150 | DBAB | 266,233 | 9/19/17 | — | (12,220 | ) | |||||||||||||||||||
IHH Healthcare Bhd | LIBOR - 311 | DBAB | 398,415 | SGD | 9/20/17 | 17,406 | — | |||||||||||||||||||
Subsea 7 SA | LIBOR - 75 | DBAB | 398,047 | EUR | 10/19/17 | 63,567 | — | |||||||||||||||||||
Tenaga Nasional Bhd | LIBOR - 50 | DBAB | 116,526 | 10/19/17 | 581 | — | ||||||||||||||||||||
Hermes International | EONIA - 40 | MSCS | 650,686 | EUR | 10/30/17 | — | (217 | ) | ||||||||||||||||||
Proximus SADP | EONIA - 50 | MSCS | 261,655 | EUR | 11/02/17 | — | (176 | ) | ||||||||||||||||||
ONEOK Inc. | LIBOR - 35 | DBAB | 3,101,004 | 11/06/17 | 97,433 | — | ||||||||||||||||||||
AEON Financial Service Co. Ltd. | LIBOR - 40 | DBAB | 5,998,099 | JPY | 11/17/17 | 249 | — | |||||||||||||||||||
DCM Holdings Co. Ltd. | LIBOR - 40 | DBAB | 128,640,794 | JPY | 11/17/17 | 38,517 | — | |||||||||||||||||||
EDION Corp. | LIBOR - 350 | DBAB | 67,402,135 | JPY | 11/17/17 | — | (43,476 | ) | ||||||||||||||||||
K’s Holdings Corp. | LIBOR - 40 | DBAB | 38,123,006 | JPY | 11/17/17 | — | (33,353 | ) | ||||||||||||||||||
Kansai Paint Co. Ltd. | LIBOR - 40 | DBAB | 22,312,164 | JPY | 11/17/17 | 3,329 | — | |||||||||||||||||||
Nippon Ceramic Co. Ltd. | LIBOR - 450 | DBAB | 95,090 | JPY | 11/17/17 | — | (25 | ) | ||||||||||||||||||
Oita Bank Ltd. | LIBOR - 40 | DBAB | 978,714 | 11/17/17 | 53,067 | — | ||||||||||||||||||||
OSG Corp. | LIBOR - 125 | DBAB | 139,549,300 | JPY | 11/17/17 | 13,087 | — | |||||||||||||||||||
Resorttrust Inc. | LIBOR - 40 | DBAB | 590,100 | JPY | 11/17/17 | — | (299 | ) | ||||||||||||||||||
Sankyo Co. Ltd. | LIBOR - 40 | DBAB | 17,474,238 | JPY | 11/17/17 | 2,268 | — | |||||||||||||||||||
SBI Holdings Inc. | LIBOR - 40 | DBAB | 8,063,359 | JPY | 11/17/17 | 672 | — | |||||||||||||||||||
Shionogi & Co. Ltd. | LIBOR - 40 | DBAB | 74,603,194 | JPY | 11/17/17 | 22,847 | — | |||||||||||||||||||
Suzuki Motor Corp. | LIBOR - 40 | DBAB | 81,206,781 | JPY | 11/17/17 | — | (13,069 | ) | ||||||||||||||||||
Teijin Ltd. | LIBOR - 40 | DBAB | 37,631,205 | JPY | 11/17/17 | — | (8,164 | ) | ||||||||||||||||||
Toho Holdings Co. Ltd. | LIBOR - 40 | DBAB | 56,764,278 | JPY | 11/17/17 | 1,685 | — | |||||||||||||||||||
Tohoku Electric Power Co. Inc. | LIBOR - 40 | DBAB | 99,926,390 | JPY | 11/17/17 | — | (31,016 | ) | ||||||||||||||||||
Toppan Printing Co. Ltd. | LIBOR - 40 | DBAB | 50,771,953 | JPY | 11/17/17 | — | (5,576 | ) | ||||||||||||||||||
Unicharm Corp. | LIBOR - 40 | DBAB | 57,782,402 | JPY | 11/17/17 | — | (16,678 | ) | ||||||||||||||||||
Yamada Denki Co. Ltd. | LIBOR - 40 | DBAB | 297,706,798 | JPY | 11/17/17 | — | (153,440 | ) | ||||||||||||||||||
Yamagata Bank Ltd. | LIBOR - 150 | DBAB | 774,387 | 11/17/17 | 1,667 | — | ||||||||||||||||||||
Yamaguchi Financial Group Inc. | LIBOR - 40 | DBAB | 2,504,621 | 11/17/17 | — | (4,150 | ) | |||||||||||||||||||
British American Tobacco PLC | LIBOR - 40 | DBAB | 3,658,136 | 11/27/17 | — | (80,128 | ) | |||||||||||||||||||
British Land Co. PLC | LIBOR - 40 | BNPP | 106,734 | GBP | 11/29/17 | — | (655 | ) | ||||||||||||||||||
Evonik Industries AG | LIBOR - 35 | BNPP | 694,100 | EUR | 11/29/17 | — | (1,448 | ) | ||||||||||||||||||
Fresenius SE & Co. KGaA | LIBOR - 35 | BNPP | 521,310 | EUR | 11/29/17 | — | (2,737 | ) | ||||||||||||||||||
General Cable Corp. | LIBOR - 30 | BNPP | 35,469 | 11/30/17 | 633 | — | ||||||||||||||||||||
Hess Corp. | LIBOR - 30 | BNPP | 200,808 | 11/30/17 | 8,031 | — | ||||||||||||||||||||
Lam Research Corp. | LIBOR - 30 | BNPP | 2,198,923 | 11/30/17 | — | (18,070 | ) | |||||||||||||||||||
Tabcorp Holdings Ltd. | RBACR - 67 | MSCS | 200,828 | AUD | 12/05/17 | 105 | — | |||||||||||||||||||
Takashimaya Co. Ltd. | LIBOR - 40 | BNPP | 3,888,595 | JPY | 12/27/17 | 733 | — | |||||||||||||||||||
Ayala Land Inc. | LIBOR - 400 | BNPP | 565,935 | 12/28/17 | 5,416 | — | ||||||||||||||||||||
Galp Energia SGPS SA | LIBOR - 35 | BNPP | 129,512 | EUR | 12/29/17 | 4,260 | — | |||||||||||||||||||
J Sainsbury PLC | LIBOR - 40 | BNPP | 776,330 | GBP | 12/29/17 | — | (26,020 | ) | ||||||||||||||||||
Richter Gideon Nyrt | LIBOR - 50 | BNPP | 958,047 | EUR | 12/29/17 | — | (11,506 | ) | ||||||||||||||||||
Siemens AG | LIBOR - 35 | BNPP | 1,047,526 | EUR | 12/29/17 | — | (10,348 | ) | ||||||||||||||||||
Nyrstar NV | LIBOR - 363 | DBAB | 136,095 | EUR | 1/15/18 | — | (13,684 | ) | ||||||||||||||||||
British Land Co. PLC | LIBOR - 40 | DBAB | 295,158 | GBP | 1/17/18 | 21,213 | — | |||||||||||||||||||
Carillion PLC | LIBOR - 200 | DBAB | 126,947 | GBP | 1/17/18 | — | (12,891 | ) | ||||||||||||||||||
| franklintempleton.com | Annual Report | 69 |
FRANKLIN ALTERNATIVE STRATEGIES FUNDS
CONSOLIDATED STATEMENT OF INVESTMENTS
Franklin K2 Alternative Strategies Fund (continued)
| Total Return Swap Contracts (continued) | ||||||||||||||||||||||||||||
| Underlying Instrument | Financing Rate | Counter- Party | Notional Value* | Expiration Date | Unrealized Appreciation | Unrealized Depreciation | ||||||||||||||||||||||
| OTC Swap Contracts (continued) | ||||||||||||||||||||||||||||
| Equity Contracts - Short (continued) | ||||||||||||||||||||||||||||
Great Portland Estates PLC | LIBOR - 40 | DBAB | 699,820 | GBP | 1/17/18 | $ | 99,960 | $ | — | |||||||||||||||||||
Intu Properties PLC | LIBOR - 200 | DBAB | 16,474 | GBP | 1/17/18 | 186 | — | |||||||||||||||||||||
J Sainsbury PLC | LIBOR - 50 | DBAB | 147,000 | GBP | 1/17/18 | — | (14,861 | ) | ||||||||||||||||||||
Primary Health Properties PLC | LIBOR - 250 | DBAB | 254,835 | GBP | 1/17/18 | 1,872 | — | |||||||||||||||||||||
Richter Gedeon Nyrt | LIBOR - 40 | DBAB | 2,076,189 | EUR | 1/17/18 | — | (17,264 | ) | ||||||||||||||||||||
St. Modwen Properties PLC | LIBOR - 40 | DBAB | 11,653 | GBP | 1/17/18 | 275 | — | |||||||||||||||||||||
UNITE Group PLC | LIBOR - 40 | DBAB | 2,677,551 | GBP | 1/17/18 | 87,844 | — | |||||||||||||||||||||
easyJet PLC | SONIA - 35 | MSCS | 345,517 | GBP | 1/18/18 | — | (192,103 | ) | ||||||||||||||||||||
AEON Financial Service Co. Ltd. | LIBOR - 40 | BNPP | 33,404,800 | JPY | 1/29/18 | 6,845 | — | |||||||||||||||||||||
Primary Health Properties PLC | LIBOR - 275 | BNPP | 16,922 | GBP | 1/29/18 | — | (52 | ) | ||||||||||||||||||||
Suzuki Motor Corp. | LIBOR - 40 | BNPP | 75,499,200 | JPY | 1/29/18 | — | (2,624 | ) | ||||||||||||||||||||
CP ALL PCL | LIBOR - 100 | DBAB | 223,203 | 2/06/18 | 3,004 | — | ||||||||||||||||||||||
Tesco PLC | SONIA - 35 | MSCS | 1,494,883 | GBP | 2/06/18 | — | (220 | ) | ||||||||||||||||||||
STMicroelectronics NV | LIBOR - 40 | DBAB | 277,121 | 2/27/18 | 4,998 | — | ||||||||||||||||||||||
SPDR S&P 500 ETF Trust | FEDEF - 35 | MSCS | 4,584,460 | 2/27/18 | — | (565,257 | ) | |||||||||||||||||||||
Prysmian SpA | EURIBOR - 35 | BNPP | 1,390,462 | EUR | 2/28/18 | 1,795 | — | |||||||||||||||||||||
Larsen & Toubro Ltd. | LIBOR - 200 | DBAB | 250,193 | 3/17/18 | — | (4,301 | ) | |||||||||||||||||||||
APERAM SA | LIBOR - 35 | BNPP | 333,519 | 3/28/18 | 3,688 | — | ||||||||||||||||||||||
National Grid PLC | LIBOR - 40 | BNPP | 334,503 | GBP | 3/28/18 | — | (1,991 | ) | ||||||||||||||||||||
STMicroelectronics NV | LIBOR - 35 | BNPP | 4,083,018 | 3/28/18 | 7,223 | — | ||||||||||||||||||||||
Premier Oil PLC | LIBOR - 450 | DBAB | 239,763 | 4/03/18 | 10,169 | — | ||||||||||||||||||||||
Adidas AG | EONIA - 36 | MSCS | 1,489,228 | EUR | 4/12/18 | 95,175 | — | |||||||||||||||||||||
JD Sports Fashion PLC | SONIA - 30 | MSCS | 219,051 | GBP | 4/12/18 | — | (2,286 | ) | ||||||||||||||||||||
LVMH Moet Hennessy Louis Vuitton SE | EONIA - 40 | MSCS | 3,621,175 | EUR | 4/12/18 | 89,277 | — | |||||||||||||||||||||
Unilever NV | EONIA - 40 | MSCS | 1,370,893 | EUR | 4/12/18 | — | (49,225 | ) | ||||||||||||||||||||
ASM Pacific Technology Ltd. | HIBOR - 75 | BNPP | 9,401,000 | HKD | 4/27/18 | — | (13,128 | ) | ||||||||||||||||||||
Nyrstar NV | EURIBOR - 35 | BNPP | 78,244 | EUR | 4/27/18 | — | (7,131 | ) | ||||||||||||||||||||
Societe Generale SA | LIBOR - 45 | DBAB | 99,477 | EUR | 5/02/18 | — | (802 | ) | ||||||||||||||||||||
Galp Energia SGPS SA | LIBOR - 40 | DBAB | 382,800 | EUR | 5/12/18 | 22,692 | — | |||||||||||||||||||||
Chugoku Electric Power Co. Inc. | LIBOR - 40 | BNPP | 7,236,289 | JPY | 5/29/18 | 1,518 | — | |||||||||||||||||||||
Deutsche EuroShop AG | EURIBOR - 35 | BNPP | 207,547 | EUR | 5/29/18 | 143 | — | |||||||||||||||||||||
Janus Henderson Group PLC | LIBOR - 30 | CITI | 569,912 | 5/29/18 | — | (41,434 | ) | |||||||||||||||||||||
Remy Cointreau SA | EURIBOR - 35 | BNPP | 144,858 | EUR | 5/29/18 | — | (663 | ) | ||||||||||||||||||||
Anglo American PLC | LIBOR - 25 | BNPP | 1,685,856 | GBP | 5/30/18 | 53,405 | — | |||||||||||||||||||||
Tullow Oil PLC | LIBOR - 15 | BNPP | 949,439 | 5/30/18 | 100,973 | — | ||||||||||||||||||||||
ServiceNow Inc. | LIBOR - 35 | MSCS | 432,809 | 5/30/18 | — | (12,661 | ) | |||||||||||||||||||||
Maire Tecnimont SpA | LIBOR - 225 | DBAB | 320,515 | EUR | 6/11/18 | — | (13,401 | ) | ||||||||||||||||||||
Bayer AG | EURIBOR - 35 | BNPP | 630,403 | EUR | 6/27/18 | — | (8,282 | ) | ||||||||||||||||||||
Koninklijke KPN NV | LIBOR - 35 | BNPP | 26,510 | EUR | 6/27/18 | — | (613 | ) | ||||||||||||||||||||
Alibaba Group Holding Ltd. | FEDEF - 35 | MSCS | 1,234,629 | 12/20/18 | — | (462,618 | ) | |||||||||||||||||||||
Becton Dickinson and Co. | FEDEF - 35 | MSCS | 101,049 | 2/06/19 | 21 | — | ||||||||||||||||||||||
CenturyLink Inc. | FEDEF - 66 | MSCS | 194,710 | 2/06/19 | 19 | — | ||||||||||||||||||||||
ONEOK Inc. | FEDEF - 35 | MSCS | 315,468 | 5/21/19 | 71 | — | ||||||||||||||||||||||
Sinclair Broadcast Group Inc. | FEDEF - 35 | MSCS | 56,603 | 5/21/19 | — | (302 | ) | |||||||||||||||||||||
|
| |||||||||||||||||||||||||||
| $ | 2,351,325 | $ | (2,578,696 | ) | ||||||||||||||||||||||||
|
| |||||||||||||||||||||||||||
| OTC Swap Contracts | ||||||||||||||||||||||||||||
| Fixed Income Contracts - Long | ||||||||||||||||||||||||||||
Parpublica-Participacoes Publicas SGPS SA | LIBOR + 90 | DBAB | 1,143,162 | EUR | 6/06/17 | — | (15,331 | ) | ||||||||||||||||||||
Resorttrust Inc. | LIBOR + 90 | DBAB | 10,077,500 | JPY | 6/19/17 | 712 | — | |||||||||||||||||||||
Siem Industries Inc. | LIBOR + 90 | DBAB | 484,897 | EUR | 6/19/17 | — | (41,519 | ) | ||||||||||||||||||||
Alstria Office REIT-AG | LIBOR + 90 | DBAB | 2,941,067 | EUR | 7/19/17 | 109,428 | — | |||||||||||||||||||||
British Land Jersey Ltd. | LIBOR + 90 | DBAB | 1,130,251 | GBP | 7/19/17 | — | (22,827 | ) | ||||||||||||||||||||
Carillion Finance White 2015 Ltd. | LIBOR + 90 | DBAB | 2,351,042 | GBP | 7/19/17 | 20,681 | — | |||||||||||||||||||||
Deutsche EuroShop AG | LIBOR + 90 | DBAB | 628,649 | EUR | 7/19/17 | — | (26,252 | ) | ||||||||||||||||||||
| 70 | Annual Report | franklintempleton.com |
FRANKLIN ALTERNATIVE STRATEGIES FUNDS
CONSOLIDATED STATEMENT OF INVESTMENTS
Franklin K2 Alternative Strategies Fund (continued)
| Total Return Swap Contracts (continued) | ||||||||||||||||||||||||||
| Underlying Instrument | Financing Rate | Counter- Party | Notional Value* | Expiration Date | Unrealized Appreciation | Unrealized Depreciation | ||||||||||||||||||||
| OTC Swap Contracts (continued) | ||||||||||||||||||||||||||
| Fixed Income Contracts - Long (continued) | ||||||||||||||||||||||||||
Drillisch AG | LIBOR + 90 | DBAB | 5,425,857 | EUR | 7/19/17 | $ | 228,713 | $ | — | |||||||||||||||||
Fresenius SE & Co. KGaA | LIBOR + 90 | DBAB | 807,750 | EUR | 7/19/17 | — | (31,080 | ) | ||||||||||||||||||
Great Portland Estates Capital Jersey Ltd. | LIBOR + 90 | DBAB | 1,607,521 | GBP | 7/19/17 | — | (36,208 | ) | ||||||||||||||||||
Hansteen Jersey Securities Ltd. | LIBOR + 90 | DBAB | 2,718,863 | EUR | 7/19/17 | 3,972 | — | |||||||||||||||||||
PHP Finance Jersey Ltd. | LIBOR + 90 | DBAB | 476,818 | GBP | 7/19/17 | — | (18,071 | ) | ||||||||||||||||||
St. Modwen Properties Securities Jersey Ltd. | LIBOR + 90 | DBAB | 199,813 | GBP | 7/19/17 | 839 | — | |||||||||||||||||||
Steinhoff Finance Holding GmbH | LIBOR + 90 | DBAB | 2,306,879 | EUR | 7/19/17 | 6,089 | — | |||||||||||||||||||
Unite Jersey Issuer Ltd. | LIBOR + 90 | DBAB | 2,692,055 | GBP | 7/19/17 | — | (78,672 | ) | ||||||||||||||||||
Gulf Keystone Petroleum Ltd. | LIBOR + 90 | DBAB | 201,611 | 7/20/17 | 2,118 | — | ||||||||||||||||||||
America Movil SAB de CV | LIBOR + 90 | DBAB | 2,560,740 | EUR | 7/25/17 | 25,253 | — | |||||||||||||||||||
Klockner & Co. Financial Services SA | LIBOR + 90 | DBAB | 204,261 | EUR | 7/25/17 | 808 | — | |||||||||||||||||||
Advanced Micro Devices Inc. | LIBOR + 75 | DBAB | 207,941 | 7/31/17 | 933 | — | ||||||||||||||||||||
Apollo Commercial Real Estate Finance Inc. | LIBOR + 75 | DBAB | 504,979 | 7/31/17 | 4,705 | — | ||||||||||||||||||||
Citrix Systems Inc. | LIBOR + 75 | DBAB | 1,682,814 | 7/31/17 | — | (58,283 | ) | |||||||||||||||||||
Ctrip.com International Ltd. | LIBOR + 75 | DBAB | 6,289,469 | 7/31/17 | — | (51,324 | ) | |||||||||||||||||||
DHT Holdings Inc. | LIBOR + 75 | DBAB | 2,990,466 | 7/31/17 | — | (25,075 | ) | |||||||||||||||||||
DISH Network Corp. | LIBOR + 75 | DBAB | 398,467 | 7/31/17 | 1,272 | — | ||||||||||||||||||||
Euronet Worldwide Inc. | LIBOR + 75 | DBAB | 2,404,372 | 7/31/17 | 51,924 | — | ||||||||||||||||||||
General Cable Corp. | LIBOR + 75 | DBAB | 98,149 | 7/31/17 | 2,121 | — | ||||||||||||||||||||
Golar LNG Ltd. | LIBOR + 75 | DBAB | 2,422,707 | 7/31/17 | — | (205,977 | ) | |||||||||||||||||||
GPT Property Trust LP | LIBOR + 75 | DBAB | 1,414,515 | 7/31/17 | 76,548 | — | ||||||||||||||||||||
Intel Corp. | LIBOR + 75 | DBAB | 1,339,246 | 7/31/17 | 18,253 | — | ||||||||||||||||||||
Medicines Co. | LIBOR + 75 | DBAB | 2,663,943 | 7/31/17 | — | (254,304 | ) | |||||||||||||||||||
MercadoLibre Inc. | LIBOR + 75 | DBAB | 1,668,036 | 7/31/17 | — | (96,287 | ) | |||||||||||||||||||
Molina Healthcare Inc. | LIBOR + 75 | DBAB | 3,894,483 | 7/31/17 | — | (121,395 | ) | |||||||||||||||||||
Nuance Communications Inc. | LIBOR + 75 | DBAB | 822,836 | 7/31/17 | — | (4,342 | ) | |||||||||||||||||||
Palo Alto Networks Inc. | LIBOR + 75 | DBAB | 3,918,310 | 7/31/17 | — | (10,625 | ) | |||||||||||||||||||
Pandora Media Inc. | LIBOR + 75 | DBAB | 292,891 | 7/31/17 | — | (915 | ) | |||||||||||||||||||
Pattern Energy Group Inc. | LIBOR + 75 | DBAB | 417,486 | 7/31/17 | 4,335 | — | ||||||||||||||||||||
Priceline Group Inc. | LIBOR + 75 | DBAB | 3,601,545 | 7/31/17 | 115,166 | — | ||||||||||||||||||||
Salesforce.com Inc. | LIBOR + 75 | DBAB | 2,822,533 | 7/31/17 | 4,020 | — | ||||||||||||||||||||
ServiceNow Inc. | LIBOR + 75 | DBAB | 2,200,378 | 7/31/17 | 108,606 | — | ||||||||||||||||||||
Ship Finance International Ltd | LIBOR + 75 | DBAB | 3,048,211 | 7/31/17 | — | (33,163 | ) | |||||||||||||||||||
Ship Finance International Ltd. | LIBOR + 75 | DBAB | 481,095 | 7/31/17 | — | (6,369 | ) | |||||||||||||||||||
Starwood Property Trust Inc. | LIBOR + 75 | DBAB | 1,952,956 | 7/31/17 | 6,524 | — | ||||||||||||||||||||
Starwood Property Trust Inc. | LIBOR + 75 | DBAB | 322,750 | 7/31/17 | 2,963 | — | ||||||||||||||||||||
TAL Education Group | LIBOR + 75 | DBAB | 3,469,921 | 7/31/17 | — | (247,760 | ) | |||||||||||||||||||
Theravance Biopharma Inc. | LIBOR + 75 | DBAB | 854,306 | 7/31/17 | — | (26,815 | ) | |||||||||||||||||||
VeriSign Inc. | LIBOR + 75 | DBAB | 6,395,099 | 7/31/17 | 18,173 | — | ||||||||||||||||||||
Workday Inc. | LIBOR + 75 | DBAB | 1,265,957 | 7/31/17 | 17,844 | — | ||||||||||||||||||||
Egyptian Treasury Bill | 0.35% | DBAB | 1,471,697 | 8/15/17 | 2,183 | — | ||||||||||||||||||||
Cahaya Capital Ltd. | LIBOR + 100 | DBAB | 1,067,980 | 8/17/17 | 4,239 | — | ||||||||||||||||||||
Asia View Ltd. | LIBOR + 90 | DBAB | 1,097,375 | 8/18/17 | 2,773 | — | ||||||||||||||||||||
CP Foods Holdings Ltd. | LIBOR + 90 | DBAB | 822,611 | 8/18/17 | — | (452 | ) | |||||||||||||||||||
PB Issuer No 4 Ltd. | LIBOR + 90 | DBAB | 584,368 | 8/18/17 | 2,517 | — | ||||||||||||||||||||
British Land Jersey Ltd. | LIBOR + 80 | BNPP | 405,321 | GBP | 9/10/17 | — | (761 | ) | ||||||||||||||||||
Indah Capital Ltd. | LIBOR + 100 | DBAB | 1,073,750 | SGD | 9/19/17 | — | (30,348 | ) | ||||||||||||||||||
Siliconware Precision Industries Co. Ltd. | LIBOR + 100 | DBAB | 1,966,562 | 9/19/17 | 18,017 | — | ||||||||||||||||||||
Parpublica-Participacoes Publicas SGPS SA | EURIBOR + 80 | BNPP | 702,807 | EUR | 9/28/17 | — | (3,890 | ) | ||||||||||||||||||
Green Plains Inc. | LIBOR + 100 | DBAB | 290,973 | 9/29/17 | 26,297 | — | ||||||||||||||||||||
Dana Gas Sukuk Ltd. | LIBOR + 90 | DBAB | 142,402 | 10/31/17 | 4,024 | — | ||||||||||||||||||||
SBI Holdings Inc. | LIBOR + 90 | DBAB | 21,801,500 | JPY | 11/02/17 | — | (5,953 | ) | ||||||||||||||||||
| franklintempleton.com | Annual Report | 71 |
FRANKLIN ALTERNATIVE STRATEGIES FUNDS
CONSOLIDATED STATEMENT OF INVESTMENTS
Franklin K2 Alternative Strategies Fund (continued)
| Total Return Swap Contracts (continued) | ||||||||||||||||||||||||||
| Underlying Instrument | Financing Rate | Counter- Party | Notional Value* | Expiration Date | Unrealized Appreciation | Unrealized Depreciation | ||||||||||||||||||||
| OTC Swap Contracts (continued) | ||||||||||||||||||||||||||
| Fixed Income Contracts - Long (continued) | ||||||||||||||||||||||||||
Golden Ocean Group Ltd. | LIBOR + 90 | DBAB | 893,375 | 11/07/17 | $ | — | $ | (13,773 | ) | |||||||||||||||||
DCM Holdings Co. Ltd. | LIBOR + 90 | DBAB | 258,495,000 | JPY | 11/17/17 | — | (34,293 | ) | ||||||||||||||||||
EDION Corp. | LIBOR + 90 | DBAB | 93,160,000 | JPY | 11/17/17 | 34,370 | — | |||||||||||||||||||
K’s Holdings Corp. | LIBOR + 90 | DBAB | 51,387,520 | JPY | 11/17/17 | — | (506 | ) | ||||||||||||||||||
Kansai Paint Co. Ltd. | LIBOR + 90 | DBAB | 94,331,250 | JPY | 11/17/17 | 5,687 | — | |||||||||||||||||||
OSG Corp. | LIBOR + 90 | DBAB | 173,040,000 | JPY | 11/17/17 | — | (22,774 | ) | ||||||||||||||||||
Sankyo Co. Ltd. | LIBOR + 90 | DBAB | 112,777,500 | JPY | 11/17/17 | — | (1,856 | ) | ||||||||||||||||||
Shionogi & Co. Ltd. | LIBOR + 90 | DBAB | 89,955,000 | JPY | 11/17/17 | — | (26,974 | ) | ||||||||||||||||||
Suzuki Motor Corp. | LIBOR + 90 | DBAB | 201,400,050 | JPY | 11/17/17 | 11,648 | — | |||||||||||||||||||
Teijin Ltd. | LIBOR + 90 | DBAB | 83,142,500 | JPY | 11/17/17 | — | (9,119 | ) | ||||||||||||||||||
Toho Holdings Co. Ltd. | LIBOR + 90 | DBAB | 128,425,000 | JPY | 11/17/17 | — | (33,938 | ) | ||||||||||||||||||
Tohoku Electric Power Co. Inc. | LIBOR + 90 | DBAB | 216,693,750 | JPY | 11/17/17 | 19,443 | — | |||||||||||||||||||
Tohoku Electric Power Co. Inc. | LIBOR + 90 | DBAB | 212,100,000 | JPY | 11/17/17 | 18,273 | — | |||||||||||||||||||
Toppan Printing Co. Ltd. | LIBOR + 90 | DBAB | 81,501,910 | JPY | 11/17/17 | 3,330 | — | |||||||||||||||||||
Unicharm Corp. | LIBOR + 90 | DBAB | 75,960,000 | JPY | 11/17/17 | 13,433 | — | |||||||||||||||||||
Yamada Denki Co. Ltd. | LIBOR + 90 | DBAB | 441,747,930 | JPY | 11/17/17 | 96,507 | — | |||||||||||||||||||
Deutsche EuroShop AG | EURIBOR + 80 | BNPP | 242,302 | EUR | 11/20/17 | — | (164 | ) | ||||||||||||||||||
Egyptian Treasury Bill | 0.35% | DBAB | 772,441 | 11/25/17 | — | (3,161 | ) | |||||||||||||||||||
AYC Finance Ltd. | LIBOR + 100 | BNPP | 1,113,171 | 11/29/17 | 17,048 | — | ||||||||||||||||||||
Fresenius SE & Co. KGaA | EURIBOR + 80 | BNPP | 464,010 | EUR | 11/29/17 | 4,632 | — | |||||||||||||||||||
RAG-Stiftung | EURIBOR + 80 | BNPP | 2,088,280 | EUR | 11/29/17 | 4,320 | — | |||||||||||||||||||
Sacyr SA | EURIBOR + 80 | BNPP | 201,505 | EUR | 11/29/17 | — | (550 | ) | ||||||||||||||||||
General Cable Corp. | LIBOR + 75 | BNPP | 61,525 | 11/30/17 | 39 | — | ||||||||||||||||||||
Lam Research Corp. | LIBOR + 75 | BNPP | 2,199,618 | 11/30/17 | 12,340 | — | ||||||||||||||||||||
Oita Bank Ltd. | LIBOR + 90 | DBAB | 2,455,250 | 12/19/17 | — | (50,819 | ) | |||||||||||||||||||
Yamagata Bank Ltd. | LIBOR + 90 | DBAB | 2,831,500 | 12/19/17 | 11,757 | — | ||||||||||||||||||||
Yamaguchi Financial Group Inc. | LIBOR + 90 | DBAB | 4,454,775 | 12/19/17 | — | (2,553 | ) | |||||||||||||||||||
Takashimaya Co. Ltd. | LIBOR + 75 | BNPP | 31,555,110 | JPY | 12/27/17 | 162 | — | |||||||||||||||||||
J Sainsbury PLC | LIBOR + 80 | BNPP | 2,036,051 | GBP | 12/29/17 | 3,442 | — | |||||||||||||||||||
Magyar Nemzeti Vagyonkezelo ZRT | EURIBOR + 80 | BNPP | 1,393,088 | EUR | 12/29/17 | 8,926 | — | |||||||||||||||||||
J Sainsbury PLC | LIBOR + 90 | DBAB | 317,794 | GBP | 1/15/18 | 5,122 | — | |||||||||||||||||||
Nyrstar NV | LIBOR + 90 | DBAB | 514,577 | EUR | 1/15/18 | 16,996 | — | |||||||||||||||||||
Magyar Nemzeti Vagyonkezelo ZRT | LIBOR + 90 | DBAB | 3,534,242 | EUR | 1/17/18 | 31,719 | — | |||||||||||||||||||
China Railway Construction Corp. Ltd. | LIBOR + 100 | DBAB | 301,250 | 1/22/18 | — | (9,314 | ) | |||||||||||||||||||
AEON Financial Service Co. Ltd. | LIBOR + 75 | BNPP | 111,787,136 | JPY | 1/29/18 | — | (15,465 | ) | ||||||||||||||||||
CP Foods Holdings Ltd. | LIBOR + 75 | BNPP | 409,178 | 1/29/18 | 2,165 | — | ||||||||||||||||||||
ENN Energy Holdings Ltd. | LIBOR + 90 | BNPP | 258,277 | 1/29/18 | 70 | — | ||||||||||||||||||||
Suzuki Motor Corp. | LIBOR + 75 | BNPP | 13,572,150 | JPY | 1/29/18 | — | (501 | ) | ||||||||||||||||||
ACS Actividades Finance BV | LIBOR + 90 | DBAB | 2,236,745 | EUR | 2/09/18 | 113,093 | — | |||||||||||||||||||
OCI NV | LIBOR + 90 | DBAB | 2,087,783 | EUR | 2/09/18 | 51,855 | — | |||||||||||||||||||
Intu Jersey 2 Ltd. | LIBOR + 90 | DBAB | 97,281 | GBP | 2/17/18 | 148 | — | |||||||||||||||||||
PT Jersey Ltd. | LIBOR + 90 | DBAB | 1,967,924 | EUR | 2/19/18 | — | (8,395 | ) | ||||||||||||||||||
Shenzhou International Group Holdings Ltd. | LIBOR + 90 | DBAB | 33,937,667 | HKD | 2/19/18 | 38,375 | — | |||||||||||||||||||
Larsen & Toubro Ltd. | LIBOR + 150 | DBAB | 830,280 | 2/20/18 | 1,939 | — | ||||||||||||||||||||
STMicroelectronics NV | LIBOR + 90 | DBAB | 555,053 | 2/27/18 | — | (12,069 | ) | |||||||||||||||||||
Prysmian SpA | EURIBOR + 80 | BNPP | 2,109,142 | EUR | 2/28/18 | 4,550 | — | |||||||||||||||||||
Chugoku Electric Power Co. Inc. | LIBOR + 75 | BNPP | 39,976,040 | JPY | 3/02/18 | — | (347 | ) | ||||||||||||||||||
Premier Oil Finance Jersey Ltd. | LIBOR + 90 | DBAB | 895,172 | 3/17/18 | 13,739 | — | ||||||||||||||||||||
APERAM SA | LIBOR + 80 | BNPP | 517,149 | 3/28/18 | — | (2,439 | ) | |||||||||||||||||||
National Grid North America Inc. | LIBOR + 80 | BNPP | 1,248,690 | GBP | 3/28/18 | 10,976 | — | |||||||||||||||||||
STMicroelectronics NV | LIBOR + 80 | BNPP | 3,808,364 | 3/28/18 | — | (4,792 | ) | |||||||||||||||||||
NH Hotel Group SA | LIBOR + 90 | DBAB | 467,251 | EUR | 4/12/18 | 11,643 | — | |||||||||||||||||||
Sacyr SA | LIBOR + 90 | DBAB | 98,800 | EUR | 4/12/18 | 1,899 | — | |||||||||||||||||||
ASM Pacific Technology Ltd. | HIBOR + 90 | BNPP | 17,324,830 | HKD | 4/27/18 | 17,309 | — | |||||||||||||||||||
Nyrstar NV | EURIBOR + 80 | BNPP | 522,545 | EUR | 4/27/18 | 8,143 | — | |||||||||||||||||||
AYC Finance Ltd. | LIBOR + 90 | DBAB | 626,375 | 5/12/18 | 15,371 | — | ||||||||||||||||||||
| 72 | Annual Report | franklintempleton.com |
FRANKLIN ALTERNATIVE STRATEGIES FUNDS
CONSOLIDATED STATEMENT OF INVESTMENTS
Franklin K2 Alternative Strategies Fund (continued)
| Total Return Swap Contracts (continued) | ||||||||||||||||||||||||||||
| Underlying Instrument | Financing Rate | Counter- Party | Notional Value* | Expiration Date | Unrealized Appreciation | Unrealized Depreciation | ||||||||||||||||||||||
| OTC Swap Contracts (continued) | ||||||||||||||||||||||||||||
| Fixed Income Contracts - Long (continued) | ||||||||||||||||||||||||||||
Haitian International Holdings Ltd. | LIBOR + 90 | DBAB | 526,649 | 5/12/18 | $ | — | $ | (3,441 | ) | |||||||||||||||||||
Zhen Ding Technology Holding Ltd. | LIBOR + 90 | DBAB | 101,587 | 5/12/18 | 157 | — | ||||||||||||||||||||||
ASM Pacific Technology Ltd. | LIBOR + 90 | DBAB | 2,590,000 | HKD | 5/18/18 | — | (12,430 | ) | ||||||||||||||||||||
Chugoku Electric Power Co. Inc. | LIBOR + 75 | BNPP | 120,495,240 | JPY | 5/29/18 | — | (1,830 | ) | ||||||||||||||||||||
Janus Capital Group Inc. | LIBOR + 75 | CITI | 745,390 | 5/29/18 | 431 | — | ||||||||||||||||||||||
Orpar SA | EURIBOR + 80 | BNPP | 230,854 | EUR | 5/29/18 | 481 | — | |||||||||||||||||||||
Tullow Oil Jersey Ltd. | LIBOR + 80 | BNPP | 2,218,258 | 5/30/18 | — | (100,153 | ) | |||||||||||||||||||||
Volcan Holdings PLC | LIBOR + 75 | BNPP | 2,052,666 | GBP | 5/30/18 | — | (30,935 | ) | ||||||||||||||||||||
Maire Tecnimont SpA | LIBOR + 90 | DBAB | 350,220 | EUR | 6/11/18 | 14,173 | — | |||||||||||||||||||||
Haitong International Securities Group Ltd. | LIBOR + 90 | DBAB | 7,940,000 | HKD | 6/25/18 | 11,169 | — | |||||||||||||||||||||
Bayer Capital Corp. BV | EURIBOR + 80 | BNPP | 770,774 | EUR | 6/27/18 | 8,807 | — | |||||||||||||||||||||
|
| |||||||||||||||||||||||||||
| $ | 1,537,737 | $ | (1,856,589 | ) | ||||||||||||||||||||||||
|
| |||||||||||||||||||||||||||
| OTC Swap Contracts | ||||||||||||||||||||||||||||
| Fixed Income Contracts - Short | ||||||||||||||||||||||||||||
iBoxx USD Liquid High Yield Index | LIBOR | JPHQ | 7,170,000 | 6/20/17 | — | (103,712 | ) | |||||||||||||||||||||
iBoxx USD Liquid High Yield Index | LIBOR | JPHQ | 1,640,000 | 6/20/17 | — | (33,194 | ) | |||||||||||||||||||||
iBoxx USD Liquid High Yield Index | LIBOR | JPHQ | 1,640,000 | 6/20/17 | — | (37,709 | ) | |||||||||||||||||||||
iBoxx USD Liquid High Yield Index | LIBOR | JPHQ | 4,510,000 | 6/20/17 | — | (73,903 | ) | |||||||||||||||||||||
iBoxx USD Liquid High Yield Index | LIBOR | JPHQ | 4,500,000 | 6/20/17 | — | (77,005 | ) | |||||||||||||||||||||
iBoxx USD Liquid High Yield Index | LIBOR | JPHQ | 3,600,000 | 6/20/17 | — | (26,080 | ) | |||||||||||||||||||||
IBoxx USD Liquid Investment Grade Index | LIBOR | JPHQ | 1,041,000 | 6/20/17 | — | (28,487 | ) | |||||||||||||||||||||
IBoxx USD Liquid Investment Grade Index | LIBOR | JPHQ | 383,000 | 6/20/17 | — | (10,481 | ) | |||||||||||||||||||||
iBoxx USD Liquid High Yield Index | LIBOR | MSCO | 980,000 | 6/20/17 | — | (15,710 | ) | |||||||||||||||||||||
iBoxx USD Liquid Investment Grade Index | LIBOR | MSCO | 661,000 | 6/20/17 | — | (19,388 | ) | |||||||||||||||||||||
United Kingdom Gilt | LIBOR - 75 | DBAB | 413,898 | GBP | 7/03/17 | — | (4,846 | ) | ||||||||||||||||||||
|
| |||||||||||||||||||||||||||
| $ | — | $ | (430,515 | ) | ||||||||||||||||||||||||
|
| |||||||||||||||||||||||||||
Total Return Swap Contracts |
| $ | 11,655,435 | $ | (5,465,344 | ) | ||||||||||||||||||||||
|
| |||||||||||||||||||||||||||
Net unrealized appreciation (depreciation) |
| $ | 6,190,091 | |||||||||||||||||||||||||
|
| |||||||||||||||||||||||||||
*In U.S. dollars unless otherwise indicated.
See Abbreviations on page 95.
| franklintempleton.com | The accompanying notes are an integral part of these financial statements. | Annual Report | 73 |
FRANKLIN ALTERNATIVE STRATEGIES FUNDS
Consolidated Financial Statements
Consolidated Statement of Assets and Liabilities
May 31, 2017
Franklin K2 Alternative Strategies Fund
Assets: | ||||
Investments in securities: | ||||
Cost - Unaffiliated issuers | $ | 940,335,116 | ||
Cost - Repurchase agreements | 32,634,570 | |||
|
| |||
Total cost of investments | $ | 972,969,686 | ||
|
| |||
Value - Unaffiliated issuers | $ | 1,032,725,098 | ||
Value - Repurchase agreements | 32,634,570 | |||
|
| |||
Total value of investments | $ | 1,065,359,668 | ||
Cash | 47,551,610 | |||
Foreign currency, at value (cost $558,021) | 660,074 | |||
Receivables: | ||||
Investment securities sold | 24,054,398 | |||
Capital shares sold | 907,442 | |||
Dividends and interest | 5,269,795 | |||
Due from brokers | 230,915,769 | |||
Variation margin | 323,705 | |||
OTC swap contracts (upfront payments $171,096) | 164,365 | |||
Unrealized appreciation on OTC forward exchange contracts | 4,037,925 | |||
Unrealized appreciation on OTC swap contracts | 11,702,416 | |||
Unrealized appreciation on unfunded loan commitments (Note 8) | 9,829 | |||
Other assets | 802 | |||
|
| |||
Total assets | 1,390,957,798 | |||
|
| |||
Liabilities: | ||||
Payables: | ||||
Investment securities purchased | 12,863,252 | |||
Capital shares redeemed | 1,596,734 | |||
Management fees | 1,660,177 | |||
Distribution fees | 73,698 | |||
Transfer agent fees | 92,066 | |||
OTC swap contracts (upfront receipts $96,675) | 34,208 | |||
Options written, at value (premiums received $378,784) | 274,388 | |||
Securities sold short, at value (proceeds $232,267,745) | 238,768,195 | |||
Due to brokers | 5,713,425 | |||
Unrealized depreciation on OTC forward exchange contracts | 7,869,885 | |||
Unrealized depreciation on OTC swap contracts | 5,773,249 | |||
Accrued expenses and other liabilities | 685,394 | |||
|
| |||
Total liabilities | 275,404,671 | |||
|
| |||
Net assets, at value | $ | 1,115,553,127 | ||
|
| |||
Net assets consist of: | ||||
Paid-in capital | $ | 1,064,227,035 | ||
Undistributed net investment income | 6,072,954 | |||
Net unrealized appreciation (depreciation) | 85,511,321 | |||
Accumulated net realized gain (loss) | (40,258,183 | ) | ||
|
| |||
Net assets, at value | $ | 1,115,553,127 | ||
|
|
| 74 | Annual Report | The accompanying notes are an integral part of these financial statements. | franklintempleton.com |
FRANKLIN ALTERNATIVE STRATEGIES FUNDS
CONSOLIDATED FINANCIAL STATEMENTS
Consolidated Statement of Assets and Liabilities (continued)
May 31, 2017
Franklin K2 Alternative Strategies Fund
| Class A: | ||||
Net assets, at value | $119,385,229 | |||
|
| |||
Shares outstanding | 10,716,639 | |||
|
| |||
Net asset value per sharea | $11.14 | |||
|
| |||
Maximum offering price per share (net asset value per share ÷ 94.25%) | $11.82 | |||
|
| |||
| Class C: | ||||
Net assets, at value | $55,496,322 | |||
|
| |||
Shares outstanding | 5,043,230 | |||
|
| |||
Net asset value and maximum offering price per sharea | $11.00 | |||
|
| |||
| Class R: | ||||
Net assets, at value | $597,045 | |||
|
| |||
Shares outstanding | 53,450 | |||
|
| |||
Net asset value and maximum offering price per share | $11.17 | |||
|
| |||
| Class R6: | ||||
Net assets, at value | $265,246,984 | |||
|
| |||
Shares outstanding | 23,751,783 | |||
|
| |||
Net asset value and maximum offering price per share | $11.17 | |||
|
| |||
| Advisor Class: | ||||
Net assets, at value | $674,827,547 | |||
|
| |||
Shares outstanding | 60,468,592 | |||
|
| |||
Net asset value and maximum offering price per share | $11.16 | |||
|
| |||
aRedemption price is equal to net asset value less contingent deferred sales charges, if applicable.
| franklintempleton.com | The accompanying notes are an integral part of these financial statements. | Annual Report | 75 |
FRANKLIN ALTERNATIVE STRATEGIES FUNDS
CONSOLIDATED FINANCIAL STATEMENTS
Consolidated Statement of Operations
for the year ended May 31, 2017
Franklin K2 Alternative Strategies Fund
Investment income: | ||||
Dividends | $ | 4,952,749 | ||
Interest | 27,408,300 | |||
|
| |||
Total investment income | 32,361,049 | |||
|
| |||
Expenses: | ||||
Management fees (Note 3a) | 23,492,541 | |||
Distribution fees: (Note 3c) | ||||
Class A | 356,684 | |||
Class C | 610,580 | |||
Class R | 2,281 | |||
Transfer agent fees: (Note 3e) | ||||
Class A | 137,358 | |||
Class C | 60,712 | |||
Class R | 438 | |||
Class R6 | 1,101 | |||
Advisor Class | 648,111 | |||
Custodian fees (Note 4) | 314,136 | |||
Reports to shareholders | 95,073 | |||
Registration and filing fees | 201,265 | |||
Professional fees | 508,463 | |||
Trustees’ fees and expenses | 418,831 | |||
Dividends and/or interest on securities sold short | 4,399,415 | |||
Security borrowing fees | 1,645,287 | |||
Other | 150,005 | |||
|
| |||
Total expenses | 33,042,281 | |||
Expense reductions (Note 4) | (188,958 | ) | ||
Expenses waived/paid by affiliates (Note 3f) | (3,724,630 | ) | ||
|
| |||
Net expenses | 29,128,693 | |||
|
| |||
Net investment income | 3,232,356 | |||
|
| |||
Realized and unrealized gains (losses): | ||||
Net realized gain (loss) from: | ||||
Investments | 58,498,312 | |||
Written options | 1,963,032 | |||
Foreign currency transactions | 4,009,363 | |||
Futures contracts | (7,210,176 | ) | ||
Securities sold short | (35,230,755 | ) | ||
Swap contracts | 4,877,661 | |||
|
| |||
Net realized gain (loss) | 26,907,437 | |||
|
| |||
Net change in unrealized appreciation (depreciation) on: | ||||
Investments | 41,916,216 | |||
Translation of other assets and liabilities denominated in foreign currencies | (3,705,154 | ) | ||
Written options | (135,179 | ) | ||
Futures contracts | (3,055,339 | ) | ||
Swap contracts | 4,060,173 | |||
|
| |||
Net change in unrealized appreciation (depreciation) | 39,080,717 | |||
|
| |||
Net realized and unrealized gain (loss) | 65,988,154 | |||
|
| |||
Net increase (decrease) in net assets resulting from operations | $ | 69,220,510 | ||
|
|
| 76 | Annual Report | The accompanying notes are an integral part of these financial statements. | franklintempleton.com |
FRANKLIN ALTERNATIVE STRATEGIES FUNDS
CONSOLIDATED FINANCIAL STATEMENTS
Consolidated Statements of Changes in Net Assets
Franklin K2 Alternative Strategies Fund
| Year End May 31, | ||||||||
| 2017 | 2016 | |||||||
Increase (decrease) in net assets: | ||||||||
Operations: | ||||||||
Net investment income (loss) | $ | 3,232,356 | $ | (2,799,208 | ) | |||
Net realized gain (loss) | 26,907,437 | (53,359,785 | ) | |||||
Net change in unrealized appreciation (depreciation) | 39,080,717 | 18,801,300 | ||||||
|
| |||||||
Net increase (decrease) in net assets resulting from operations | 69,220,510 | (37,357,693 | ) | |||||
|
| |||||||
Distributions to shareholders from: | ||||||||
Net investment income: | ||||||||
Class A | (630,342 | ) | (2,592,416 | ) | ||||
Class C | — | (644,384 | ) | |||||
Class R | (2,647 | ) | — | |||||
Class R6 | (2,240,746 | ) | (4,016,413 | ) | ||||
Advisor Class | (4,861,190 | ) | (10,110,090 | ) | ||||
Net realized gains: | ||||||||
Class A | — | (696,387 | ) | |||||
Class C | — | (262,371 | ) | |||||
Class R | — | (1,174 | ) | |||||
Class R6 | — | (894,391 | ) | |||||
Advisor Class | — | (2,315,995 | ) | |||||
|
| |||||||
Total distributions to shareholders | (7,734,925 | ) | (21,533,621 | ) | ||||
|
| |||||||
Capital share transactions: (Note 2) | ||||||||
Class A | (65,872,266 | ) | 38,612,258 | |||||
Class C | (18,888,454 | ) | 37,013,071 | |||||
Class R | 231,379 | (8,810,100 | ) | |||||
Class R6 | (14,356,196 | ) | 39,418,868 | |||||
Advisor Class | (83,686,963 | ) | 424,302,558 | |||||
|
| |||||||
Total capital share transactions | (182,572,500 | ) | 530,536,655 | |||||
|
| |||||||
Net increase (decrease) in net assets | (121,086,915 | ) | 471,645,341 | |||||
Net assets: | ||||||||
Beginning of year | 1,236,640,042 | 764,994,701 | ||||||
|
| |||||||
End of year | $ | 1,115,553,127 | $ | 1,236,640,042 | ||||
|
| |||||||
Undistributed net investment income included in net assets: | ||||||||
End of year | $ | 6,072,954 | $ | 2,947,721 | ||||
|
| |||||||
| franklintempleton.com | The accompanying notes are an integral part of these financial statements. | Annual Report | 77 |
FRANKLIN ALTERNATIVE STRATEGIES FUNDS
Notes to Consolidated Financial Statements
Franklin K2 Alternative Strategies Fund
1. Organization and Significant Accounting Policies
Franklin Alternative Strategies Funds (Trust) is registered under the Investment Company Act of 1940 (1940 Act) as an open-end management investment company, consisting of four separate funds and applies the specialized accounting and reporting guidance in U.S. Generally Accepted Accounting Principles (U.S. GAAP). Franklin K2 Alternative Strategies Fund (Fund) is included in this report. The Fund offers five classes of shares: Class A, Class C, Class R, Class R6 and Advisor Class. Each class of shares may differ by its initial sales load, contingent deferred sales charges, voting rights on matters affecting a single class, its exchange privilege and fees primarily due to differing arrangements for distribution and transfer agent fees.
The following summarizes the Fund’s significant accounting policies.
a. Financial Instrument Valuation
The Fund’s investments in financial instruments are carried at fair value daily. Fair value is the price that would be received to sell an asset or paid to transfer a liability in an orderly transaction between market participants on the measurement date. The Fund calculates the net asset value (NAV) per share as of 4 p.m. Eastern time each day the New York Stock Exchange (NYSE) is open for trading. Under compliance policies and procedures approved by the Trust’s Board of Trustees (the Board), the Fund’s administrator has responsibility for oversight of valuation, including leading the cross-functional Valuation Committee (VC). The VC provides administration and oversight of the Fund’s valuation policies and procedures, which are approved annually by the Board. Among other things, these procedures allow the Fund to utilize independent pricing services, quotations from securities and financial instrument dealers, and other market sources to determine fair value.
Equity securities, exchange traded funds, exchange traded notes and derivative financial instruments (derivatives) listed on an exchange or on the NASDAQ National Market System are valued at the last quoted sale price or the official closing price of the day, respectively. Foreign equity securities are valued as of the close of trading on the foreign stock exchange on which the security is primarily traded or as of 4 p.m. Eastern time. The value is then converted into its U.S. dollar equivalent at the foreign exchange rate in effect at 4 p.m. Eastern time on the day that the value of the security is determined. Over-the-counter
(OTC) securities are valued within the range of the most recent quoted bid and ask prices. Securities that trade in multiple markets or on multiple exchanges are valued according to the broadest and most representative market. Certain equity securities are valued based upon fundamental characteristics or relationships to similar securities.
Debt securities generally trade in the OTC market rather than on a securities exchange. The Fund’s pricing services use multiple valuation techniques to determine fair value. In instances where sufficient market activity exists, the pricing services may utilize a market-based approach through which quotes from market makers are used to determine fair value. In instances where sufficient market activity may not exist or is limited, the pricing services also utilize proprietary valuation models which may consider market characteristics such as benchmark yield curves, credit spreads, estimated default rates, anticipated market interest rate volatility, coupon rates, anticipated timing of principal repayments, underlying collateral, and other unique security features in order to estimate the relevant cash flows, which are then discounted to calculate the fair value. Securities denominated in a foreign currency are converted into their U.S. dollar equivalent at the foreign exchange rate in effect at 4 p.m. Eastern time on the date that the values of the foreign debt securities are determined.
Investments in open-end mutual funds are valued at the closing NAV. Investments in repurchase agreements are valued at cost, which approximates fair value.
Certain derivatives are centrally cleared or trade in the OTC market. The Fund’s pricing services use various techniques including industry standard option pricing models and proprietary discounted cash flow models to determine the fair value of those instruments. The Fund’s net benefit or obligation under the derivative contract, as measured by the fair value of the contract, is included in net assets.
The Fund has procedures to determine the fair value of financial instruments for which market prices are not reliable or readily available. Under these procedures, the VC convenes on a regular basis to review such financial instruments and considers a number of factors, including significant unobservable valuation inputs, when arriving at fair value. The VC primarily employs a market-based approach which may use related or comparable assets or liabilities, recent transactions, market multiples, book values, and other relevant information for the investment to determine the fair value of the investment. An income-based
| 78 | Annual Report | franklintempleton.com |
FRANKLIN ALTERNATIVE STRATEGIES FUNDS
NOTES TO CONSOLIDATED FINANCIAL STATEMENTS
Franklin K2 Alternative Strategies Fund (continued)
valuation approach may also be used in which the anticipated future cash flows of the investment are discounted to calculate fair value. Discounts may also be applied due to the nature or duration of any restrictions on the disposition of the investments. Due to the inherent uncertainty of valuations of such investments, the fair values may differ significantly from the values that would have been used had an active market existed. The VC employs various methods for calibrating these valuation approaches including a regular review of key inputs and assumptions, transactional back-testing or disposition analysis, and reviews of any related market activity.
Trading in securities on foreign securities stock exchanges and OTC markets may be completed before 4 p.m. Eastern time. In addition, trading in certain foreign markets may not take place on every Fund’s business day. Occasionally, events occur between the time at which trading in a foreign security is completed and 4 p.m. Eastern time that might call into question the reliability of the value of a portfolio security held by the Fund. As a result, differences may arise between the value of the Fund’s portfolio securities as determined at the foreign market close and the latest indications of value at 4 p.m. Eastern time. In order to minimize the potential for these differences, the VC monitors price movements following the close of trading in foreign stock markets through a series of country specific market proxies (such as baskets of American Depositary Receipts, futures contracts and exchange traded funds). These price movements are measured against established trigger thresholds for each specific market proxy to assist in determining if an event has occurred that may call into question the reliability of the values of the foreign securities held by the Fund. If such an event occurs, the securities may be valued using fair value procedures, which may include the use of independent pricing services.
When the last day of the reporting period is a non-business day, certain foreign markets may be open on those days that the Fund’s NAV is not calculated, which could result in differences between the value of the Fund’s portfolio securities on the last business day and the last calendar day of the reporting period. Any significant security valuation changes due to an open foreign market are adjusted and reflected by the Fund for financial reporting purposes.
b. Foreign Currency Translation
Portfolio securities and other assets and liabilities denominated in foreign currencies are translated into U.S. dollars based on the exchange rate of such currencies against U.S. dollars on the date of valuation. The Fund may enter into foreign currency
exchange contracts to facilitate transactions denominated in a foreign currency. Purchases and sales of securities, income and expense items denominated in foreign currencies are translated into U.S. dollars at the exchange rate in effect on the transaction date. Portfolio securities and assets and liabilities denominated in foreign currencies contain risks that those currencies will decline in value relative to the U.S. dollar. Occasionally, events may impact the availability or reliability of foreign exchange rates used to convert the U.S. dollar equivalent value. If such an event occurs, the foreign exchange rate will be valued at fair value using procedures established and approved by the Board.
The Fund does not separately report the effect of changes in foreign exchange rates from changes in market prices on securities held. Such changes are included in net realized and unrealized gain or loss from investments in the Consolidated Statement of Operations.
Realized foreign exchange gains or losses arise from sales of foreign currencies, currency gains or losses realized between the trade and settlement dates on securities transactions and the difference between the recorded amounts of dividends, interest, and foreign withholding taxes and the U.S. dollar equivalent of the amounts actually received or paid. Net unrealized foreign exchange gains and losses arise from changes in foreign exchange rates on foreign denominated assets and liabilities other than investments in securities held at the end of the reporting period.
c. Joint Repurchase Agreement
The Fund enters into a joint repurchase agreement whereby its uninvested cash balance is deposited into a joint cash account with other funds managed by the investment manager or an affiliate of the investment manager and is used to invest in one or more repurchase agreements. The value and face amount of the joint repurchase agreement are allocated to the funds based on their pro-rata interest. A repurchase agreement is accounted for as a loan by the Fund to the seller, collateralized by securities which are delivered to the Fund’s custodian. The fair value, including accrued interest, of the initial collateralization is required to be at least 102% of the dollar amount invested by the funds, with the value of the underlying securities marked to market daily to maintain coverage of at least 100%. Repurchase agreements are subject to the terms of Master Repurchase Agreements (MRAs) with approved counterparties (sellers). The MRAs contain various provisions, including but not limited to events of default and maintenance of collateral for repurchase agreements. In the event of default by either the seller or the
| franklintempleton.com | Annual Report | 79 |
FRANKLIN ALTERNATIVE STRATEGIES FUNDS
NOTES TO CONSOLIDATED FINANCIAL STATEMENTS
Franklin K2 Alternative Strategies Fund (continued)
1. Organization and Significant Accounting Policies (continued)
c. Joint Repurchase Agreement (continued)
Fund, certain MRAs may permit the non-defaulting party to net and close-out all transactions, if any, traded under such agreements. The Fund may sell securities it holds as collateral and apply the proceeds towards the repurchase price and any other amounts owed by the seller to the Fund in the event of default by the seller. This could involve costs or delays in addition to a loss on the securities if their value falls below the repurchase price owed by the seller. The joint repurchase agreement held by the Fund at year end, as indicated in the Consolidated Statement of Investments, had been entered into on May 31, 2017.
d. Securities Purchased on a Delayed Delivery Basis
The Fund purchases securities on a delayed delivery basis, with payment and delivery scheduled for a future date. These transactions are subject to market fluctuations and are subject to the risk that the value at delivery may be more or less than the trade date purchase price. Although the Fund will generally purchase these securities with the intention of holding the securities, it may sell the securities before the settlement date. Sufficient assets have been segregated for these securities.
e. Derivative Financial Instruments
The Fund invested in derivatives in order to manage risk or gain exposure to various other investments or markets. Derivatives are financial contracts based on an underlying or notional amount, require no initial investment or an initial net investment that is smaller than would normally be required to have a similar response to changes in market factors, and require or permit net settlement. Derivatives contain various risks including the potential inability of the counterparty to fulfill their obligations under the terms of the contract, the potential for an illiquid secondary market, and/or the potential for market movements which expose the Fund to gains or losses in excess of the amounts shown in the Consolidated Statement of Assets and Liabilities. Realized gain and loss and unrealized appreciation and depreciation on these contracts for the period are included in the Consolidated Statement of Operations.
Derivative counterparty credit risk is managed through a formal evaluation of the creditworthiness of all potential counterparties. The Fund attempts to reduce its exposure to counterparty credit risk on OTC derivatives, whenever possible, by entering into International Swaps and Derivatives Association (ISDA)
master agreements with certain counterparties. These agreements contain various provisions, including but not limited to collateral requirements, events of default, or early termination. Termination events applicable to the counterparty include certain deteriorations in the credit quality of the counterparty. Termination events applicable to the Fund include failure of the Fund to maintain certain net asset levels and/or limit the decline in net assets over various periods of time. In the event of default or early termination, the ISDA master agreement gives the non-defaulting party the right to net and close-out all transactions traded, whether or not arising under the ISDA agreement, to one net amount payable by one counterparty to the other. However, absent an event of default or early termination, OTC derivative assets and liabilities are presented gross and not offset in the Consolidated Statement of Assets and Liabilities. Early termination by the counterparty may result in an immediate payment by the Fund of any net liability owed to that counterparty under the ISDA agreement.
Collateral requirements differ by type of derivative. Collateral or initial margin requirements are set by the broker or exchange clearing house for exchange traded and centrally cleared derivatives. Initial margin deposited is held at the exchange and can be in the form of cash and/or securities. For OTC derivatives traded under an ISDA master agreement, posting of collateral is required by either the Fund or the applicable counterparty if the total net exposure of all OTC derivatives with the applicable counterparty exceeds the minimum transfer amount, which typically ranges from $100,000 to $250,000, and can vary depending on the counterparty and the type of the agreement. Generally, collateral is determined at the close of Fund business each day and any additional collateral required due to changes in derivative values may be delivered by the Fund or the counterparty the next business day, or within a few business days. Collateral pledged and/or received by the Fund for OTC derivatives, if any, is held in segregated accounts with the Fund’s custodian/counterparty broker and can be in the form of cash and/or securities. Unrestricted cash may be invested according to the Fund’s investment objectives. To the extent that the amounts due to the Fund from its counterparties are not subject to collateralization or are not fully collateralized, the Fund bears the risk of loss from counterparty non-performance.
The Fund entered into exchange traded futures contracts primarily to manage and/or gain exposure to commodity price, interest rate, certain foreign currencies and equity price risk. A futures contract is an agreement between the Fund and a counterparty to buy or sell an asset at a specified price on a
| 80 | Annual Report | franklintempleton.com |
FRANKLIN ALTERNATIVE STRATEGIES FUNDS
NOTES TO CONSOLIDATED FINANCIAL STATEMENTS
Franklin K2 Alternative Strategies Fund (continued)
future date. Required initial margins are pledged by the Fund, and the daily change in fair value is accounted for as a variation margin payable or receivable in the Consolidated Statement of Assets and Liabilities.
The Fund entered into OTC forward exchange contracts primarily to manage and/or gain exposure to certain foreign currencies. A forward exchange contract is an agreement between the Fund and a counterparty to buy or sell a foreign currency at a specific exchange rate on a future date.
The Fund entered into credit default swap contracts primarily to manage and/or gain exposure to credit risk. A credit default swap is an agreement between the Fund and a counterparty whereby the buyer of the contract receives credit protection and the seller of the contract guarantees the credit worthiness of a referenced debt obligation. These agreements may be privately negotiated in the over-the-counter market (OTC credit default swaps) or may be executed in a multilateral trade facility platform, such as a registered exchange (centrally cleared credit default swaps). The underlying referenced debt obligation may be a single issuer of corporate or sovereign debt, a credit index, a basket of issuers or indices, or a tranche of a credit index or basket of issuers or indices. In the event of a default of the underlying referenced debt obligation, the buyer is entitled to receive the notional amount of the credit default swap contract from the seller in exchange for the referenced debt obligation, a net settlement amount equal to the notional amount of the credit default swap less the recovery value of the referenced debt obligation, or other agreed upon amount. For centrally cleared credit default swaps, required initial margins are pledged by the Fund, and the daily change in fair value is accounted for as a variation margin payable or receivable in the Consolidated Statement of Assets and Liabilities. Over the term of the contract, the buyer pays the seller a periodic stream of payments, provided that no event of default has occurred. Such periodic payments are accrued daily as an unrealized appreciation or depreciation until the payments are made, at which time they are realized. Upfront payments and receipts are reflected in the Consolidated Statement of Assets and Liabilities and represent compensating factors between stated terms of the credit default swap agreement and prevailing market conditions (credit spreads and other relevant factors). These upfront payments and receipts are amortized over the term of the contract as a realized gain or loss in the Consolidated Statement of Operations.
The Fund entered into OTC cross currency swap contracts primarily to manage and/or gain exposure to certain foreign
currencies. A cross currency swap is an agreement between the Fund and a counterparty to exchange cash flows (determined using either a fixed or floating rate) based on the notional amounts of two different currencies. The notional amounts are typically determined based on the spot exchange rates at the opening of the contract. Cross currency swaps may require the exchange of notional amounts at the opening and/or closing of the contract. Over the term of the contract, contractually required payments to be paid and to be received are accrued daily and recorded as unrealized depreciation and appreciation until the payments are made, at which time they are realized. Upfront payments and receipts, if any, are reflected in the Consolidated Statement of assets and Liabilities and represent compensating factors between stated terms of the cross currency swap contract and prevailing market conditions (interest rate spreads and other relevant factors). These upfront payments and receipts are amortized over the term of the contract as a realized gain or loss in the Consolidated Statement of Operations.
The Fund entered into interest rate swap contracts primarily to manage interest rate risk. An interest rate swap is an agreement between the Fund and a counterparty to exchange cash flows based on the difference between two interest rates, applied to a notional amount. These agreements may be privately negotiated in the over-the-counter market (OTC interest rate swaps) or may be executed on a registered exchange (centrally cleared interest rate swaps). For centrally cleared interest rate swaps, required initial margins are pledged by the Fund, and the daily change in fair value is accounted for as a variation margin payable or receivable in the Consolidated Statement of Assets and Liabilities. Over the term of the contract, contractually required payments to be paid and to be received are accrued daily and recorded as unrealized depreciation and appreciation until the payments are made, at which time they are realized.
The Fund entered into OTC total return swap contracts primarily to manage and/or gain exposure to interest rate, equity price and credit risk of an underlying instrument such as a stock, bond, index or basket of securities or indices. A total return swap is an agreement between the Fund and a counterparty to exchange a return linked to an underlying instrument for a floating or fixed rate payment, both based upon a notional amount. Over the term of the contract, contractually required payments to be paid or received are accrued daily and recorded as unrealized appreciation or depreciation until the payments are made, at which time they are recognized as realized gain or loss.
| franklintempleton.com | Annual Report | 81 |
FRANKLIN ALTERNATIVE STRATEGIES FUNDS
NOTES TO CONSOLIDATED FINANCIAL STATEMENTS
Franklin K2 Alternative Strategies Fund (continued)
1. Organization and Significant Accounting Policies (continued)
e. Derivative Financial Instruments (continued)
The Fund purchased or wrote exchange traded and/or OTC option contracts primarily to manage and/or gain exposure to interest rate, equity price and foreign exchange rate risk. An option is a contract entitling the holder to purchase or sell a specific amount of shares or units of an asset or notional amount of a swap (swaption), at a specified price. When an option is purchased or written, an amount equal to the premium paid or received is recorded as an asset or liability, respectively. Upon exercise of an option, the acquisition cost or sales proceeds of the underlying investment is adjusted by any premium received or paid. Upon expiration of an option, any premium received or paid is recorded as a realized gain or loss. Upon closing an option other than through expiration or exercise, the difference between the premium received or paid and the cost to close the position is recorded as a realized gain or loss.
See Notes 6 and 9 regarding investment transactions and other derivative information, respectively.
f. Loan Participation Notes
The Fund invests in loan participation notes (Participations). Participations are loans originally issued to a borrower by one or more financial institutions (the Lender) and subsequently sold to other investors, such as the Fund. Participations typically result in the Fund having a contractual relationship only with the Lender and not with the borrower. The Fund has the right to receive from the Lender any payments of principal, interest and fees which the Lender received from the borrower. The Fund generally has no rights to either enforce compliance by the borrower with the terms of the loan agreement or to any collateral relating to the original loan. As a result, the Fund assumes the credit risk of both the borrower and the Lender that is selling the Participation. The Participations may also involve interest rate risk and liquidity risk, including the potential default or insolvency of the borrower and/or the Lender.
g. Exchange Traded Notes
The Fund purchases exchange traded notes. Exchange traded notes are senior, unsecured, unsubordinated debt securities issued by an underwriting bank. Exchange traded notes are designed to provide investors access to the returns of various market benchmarks and intended to replicate the economic effects that would apply had the Fund directly purchased the
underlying referenced asset or basket of assets. The risks of exchange traded notes include the credit risk of the issuer, counterparty risk, and the potential inability of the Fund to dispose of the exchange traded note in the normal course of business.
h. Securities Sold Short
The Fund is engaged in selling securities short, which obligates the Fund to replace a borrowed security with the same security at current fair value. The Fund incurs a loss if the price of the security increases between the date of the short sale and the date on which the Fund replaces the borrowed security. The Fund realizes a gain if the price of the security declines between those dates. Gains are limited to the price at which the Fund sold the security short, while losses are potentially unlimited in size.
The Fund is required to establish a margin account with the broker lending the security sold short. While the short sale is outstanding, the broker retains the proceeds of the short sale to the extent necessary to meet margin requirements until the short position is closed out. A deposit must also be maintained with the Fund’s custodian/counterparty broker consisting of cash and/or securities having a value equal to a specified percentage of the value of the securities sold short. The Fund is obligated to pay fees for borrowing the securities sold short and is required to pay the counterparty any dividends and/or interest due on securities sold short. Such dividends and/or interest and any security borrowing fees are recorded as an expense to the Fund.
i. Investments in K2 Holdings Investment Corp. (K2 Subsidiary)
The Fund invests in certain financial instruments and commodity-linked derivative investments through its investment in the K2 Subsidiary. The K2 Subsidiary is a Cayman Islands exempted company with limited liability, is a wholly-owned subsidiary of the Fund, and is able to invest in certain financial instruments and commodity-linked derivative investments consistent with the investment objective of the Fund. At May 31, 2017, the K2 Subsidiary’s investments, as well as any other assets and liabilities of the K2 Subsidiary, are reflected in the Fund’s Consolidated Statement of Investments and Consolidated Statement of Assets and Liabilities. The financial statements have been consolidated and include the accounts of the Fund and the K2 Subsidiary. All inter-company transactions and balances have been eliminated. For tax purposes, the Fund is required to increase its taxable income by its share of the K2 Subsidiary’s income. Net losses incurred by the K2 Subsidiary cannot offset income earned by the Fund and cannot be carried back or
| 82 | Annual Report | franklintempleton.com |
FRANKLIN ALTERNATIVE STRATEGIES FUNDS
NOTES TO CONSOLIDATED FINANCIAL STATEMENTS
Franklin K2 Alternative Strategies Fund (continued)
forward by the K2 Subsidiary to offset income from prior or future years. At May 31, 2017, the net assets of the K2 Subsidiary were $19,416,324, representing 1.7% of the Fund’s consolidated net assets. The Fund’s investment in the K2 Subsidiary is limited to 25% of consolidated assets.
j. Senior Floating Rate Interests
The Fund invests in senior secured corporate loans that pay interest at rates which are periodically reset by reference to a base lending rate plus a spread. These base lending rates are generally the prime rate offered by a designated U.S. bank or the London InterBank Offered Rate (LIBOR). Senior secured corporate loans often require prepayment of principal from excess cash flows or at the discretion of the borrower. As a result, actual maturity may be substantially less than the stated maturity. Senior secured corporate loans in which the Fund invests are generally readily marketable, but may be subject to certain restrictions on resale.
k. Income and Deferred Taxes
It is the Fund’s policy to qualify as a regulated investment company under the Internal Revenue Code. The Fund intends to distribute to shareholders substantially all of its taxable income and net realized gains to relieve it from federal income and excise taxes. As a result, no provision for U.S. federal income taxes is required.
The Fund may be subject to foreign taxation related to income received, capital gains on the sale of securities and certain foreign currency transactions in the foreign jurisdictions in which it invests. Foreign taxes, if any, are recorded based on the tax regulations and rates that exist in the foreign markets in which the Fund invests. When a capital gain tax is determined to apply, the Fund records an estimated deferred tax liability in an amount that would be payable if the securities were disposed of on the valuation date.
The Fund may recognize an income tax liability related to its uncertain tax positions under U.S. GAAP when the uncertain tax position has a less than 50% probability that it will be sustained upon examination by the tax authorities based on its technical merits. As of May 31, 2017, the Fund has determined that no tax liability is required in its consolidated financial statements related to uncertain tax positions for any open tax years (or expected to be taken in future tax years). Open tax years are those that remain subject to examination and are based on each tax jurisdiction’s statute of limitation.
l. Security Transactions, Investment Income, Expenses and Distributions
Security transactions are accounted for on trade date. Realized gains and losses on security transactions are determined on a specific identification basis. Interest income and estimated expenses are accrued daily. Amortization of premium and accretion of discount on debt securities are included in interest income. Dividend income and dividends declared on securities sold short are recorded on the ex-dividend date except for certain dividends from securities where the dividend rate is not available. In such cases, the dividend is recorded as soon as the information is received by the Fund. Distributions to shareholders are recorded on the ex-dividend date and are determined according to income tax regulations (tax basis). Distributable earnings determined on a tax basis may differ from earnings recorded in accordance with U.S. GAAP. These differences may be permanent or temporary. Permanent differences are reclassified among capital accounts to reflect their tax character. These reclassifications have no impact on net assets or the results of operations. Temporary differences are not reclassified, as they may reverse in subsequent periods.
Common expenses incurred by the Trust are allocated among the funds based on the ratio of net assets of each fund to the combined net assets of the Trust. Fund specific expenses are charged directly to the fund that incurred the expense.
Realized and unrealized gains and losses and net investment income, not including class specific expenses, are allocated daily to each class of shares based upon the relative proportion of net assets of each class. Differences in per share distributions, by class, are generally due to differences in class specific expenses.
m. Accounting Estimates
The preparation of financial statements in accordance with U.S. GAAP requires management to make estimates and assumptions that affect the reported amounts of assets and liabilities at the date of the financial statements and the amounts of income and expenses during the reporting period. Actual results could differ from those estimates.
n. Guarantees and Indemnifications
Under the Trust’s organizational documents, its officers and trustees are indemnified by the Trust against certain liabilities arising out of the performance of their duties to the Trust. Additionally, in the normal course of business, the Trust, on behalf
| franklintempleton.com | Annual Report | 83 |
FRANKLIN ALTERNATIVE STRATEGIES FUNDS
NOTES TO CONSOLIDATED FINANCIAL STATEMENTS
Franklin K2 Alternative Strategies Fund (continued)
1. Organization and Significant Accounting Policies (continued)
n. Guarantees and Indemnifications (continued)
of the Fund, enters into contracts with service providers that contain general indemnification clauses. The Trust’s maximum exposure under these arrangements is unknown as this would
involve future claims that may be made against the Trust that have not yet occurred. Currently, the Trust expects the risk of loss to be remote.
2. Shares of Beneficial Interest
At May 31, 2017, there were an unlimited number of shares authorized (without par value). Transactions in the Fund’s shares were as follows:
| Year Ended May 31, | ||||||||||||||||||||
| 2017 | 2016 | |||||||||||||||||||
| Shares | Amount | Shares | Amount | |||||||||||||||||
| Class A Shares: | ||||||||||||||||||||
Shares sold | 2,844,434 | $ | 30,795,994 | 13,295,280 | $ | 143,673,278 | ||||||||||||||
Shares issued in reinvestment of distributions | 55,946 | 603,102 | 298,189 | 3,172,727 | ||||||||||||||||
Shares redeemed | (8,995,275 | ) | (97,271,362 | ) | (10,133,166 | ) | (108,233,747 | ) | ||||||||||||
|
| |||||||||||||||||||
Net increase (decrease) | (6,094,895 | ) | $ | (65,872,266 | ) | 3,460,303 | $ | 38,612,258 | ||||||||||||
|
| |||||||||||||||||||
| Class C Shares: | ||||||||||||||||||||
Shares sold | 930,313 | $ | 9,991,199 | 5,119,256 | $ | 55,145,221 | ||||||||||||||
Shares issued in reinvestment of distributions | — | — | 79,128 | 836,381 | ||||||||||||||||
Shares redeemed | (2,694,807 | ) | (28,879,653 | ) | (1,811,936 | ) | (18,968,531 | ) | ||||||||||||
|
| |||||||||||||||||||
Net increase (decrease) | (1,764,494 | ) | $ | (18,888,454 | ) | 3,386,448 | $ | 37,013,071 | ||||||||||||
|
| |||||||||||||||||||
| Class R Shares: | ||||||||||||||||||||
Shares sold | 23,673 | $ | 256,901 | 13,984 | $ | 149,262 | ||||||||||||||
Shares issued in reinvestment of distributions | 245 | 2,647 | 106 | 1,140 | ||||||||||||||||
Shares redeemed | (2,617 | ) | (28,169 | ) | (804,855 | ) | (8,960,502 | ) | ||||||||||||
|
| |||||||||||||||||||
Net increase (decrease) | 21,301 | $ | 231,379 | (790,765 | ) | $ | (8,810,100 | ) | ||||||||||||
|
| |||||||||||||||||||
| Class R6 Shares: | ||||||||||||||||||||
Shares sold | 819,703 | $ | 8,933,673 | 5,337,514 | $ | 57,004,431 | ||||||||||||||
Shares issued in reinvestment of distributions | 207,304 | 2,236,814 | 459,924 | 4,902,787 | ||||||||||||||||
Shares redeemed | (2,353,888 | ) | (25,526,683 | ) | (2,155,223 | ) | (22,488,350 | ) | ||||||||||||
|
| |||||||||||||||||||
Net increase (decrease) | (1,326,881 | ) | $ | (14,356,196 | ) | 3,642,215 | $ | 39,418,868 | ||||||||||||
|
| |||||||||||||||||||
| Advisor Class Shares: | ||||||||||||||||||||
Shares sold | 20,997,587 | $ | 228,852,167 | 64,566,684 | $ | 695,799,599 | ||||||||||||||
Shares issued in reinvestment of distributions | 340,700 | 3,676,152 | 966,546 | 10,303,451 | ||||||||||||||||
Shares redeemed | (29,140,039 | ) | (316,215,282 | ) | (26,703,118 | ) | (281,800,492 | ) | ||||||||||||
|
| |||||||||||||||||||
Net increase (decrease) | (7,801,752 | ) | $ | (83,686,963 | ) | 38,830,112 | $ | 424,302,558 | ||||||||||||
|
| |||||||||||||||||||
| 84 | Annual Report | franklintempleton.com |
FRANKLIN ALTERNATIVE STRATEGIES FUNDS
NOTES TO CONSOLIDATED FINANCIAL STATEMENTS
Franklin K2 Alternative Strategies Fund (continued)
3. Transactions with Affiliates
Franklin Resources, Inc. is the holding company for various subsidiaries that together are referred to as Franklin Templeton Investments. Certain officers and trustees of the Trust are also officers and/or directors of the following subsidiaries:
| Subsidiary | Affiliation | |
K2/D&S Management Co., L.L.C. (K2 Advisors) | Investment manager | |
Franklin Templeton Services, LLC (FT Services) | Administrative manager | |
Franklin Templeton Distributors, Inc. (Distributors) | Principal underwriter | |
Franklin Templeton Investor Services, LLC (Investor Services) | Transfer agent |
a. Management Fees
The Fund and K2 Subsidiary pay an investment management fee to K2 Advisors of 2.05% per year of the average daily net assets of the Fund and K2 Subsidiary. Management fees paid by the Fund are reduced on assets invested in the K2 Subsidiary, in an amount not to exceed the management fees paid by K2 Subsidiary.
On July 11, 2017, the Board approved the proposal to change the Fund’s investment management fee agreement. The new agreement will be effective on October 1, 2017.
Effective October 1, 2017, the Fund and K2 Subsidiary will pay fees of 1.90% per year of the average daily net assets of the Fund and K2 Subsidiary.
Under each subadvisory agreement, the below entities provide subadvisory services to the Fund or K2 Subsidiary. The subadvisory fees are paid by K2 Advisors based on the Fund and K2 Subsidiary average daily net assets, and is not an additional expense of the Fund or K2 Subsidiary.
| Subadvisors |
Basso Capital Management, L.P. |
Chatham Asset Management, LLC |
Chilton Investment Company, LLC |
Emso Asset Management Limited |
Graham Capital Management, L.P. |
Halcyon Arbitrage IC Management LP |
Impala Asset Management, LLC |
Jennison Associates, LLC |
Lazard Asset Management, LLC |
Loomis Sayles & Company, L.P. |
P. Schoenfeld Asset Management L.P. |
Portland Hill Capital LLP |
Wellington Management Company, LLP |
York Registered Holdings, L.P. |
b. Administrative Fees
Under an agreement with K2 Advisors, FT Services provides administrative services to the Fund and K2 Subsidiary. The fee is paid by K2 Advisors based on the Fund and K2 Subsidiary average daily net assets, and is not an additional expense of the Fund or K2 Subsidiary.
| franklintempleton.com | Annual Report | 85 |
FRANKLIN ALTERNATIVE STRATEGIES FUNDS
NOTES TO CONSOLIDATED FINANCIAL STATEMENTS
Franklin K2 Alternative Strategies Fund (continued)
3. Transactions with Affiliates (continued)
c. Distribution Fees
The Board has adopted distribution plans for each share class, with the exception of Class R6 and Advisor Class shares, pursuant to Rule 12b-1 under the 1940 Act. Under the Fund’s Class A reimbursement distribution plan, the Fund reimburses Distributors for costs incurred in connection with the servicing, sale and distribution of the Fund’s shares up to the maximum annual plan rate. Under the Class A reimbursement distribution plan, costs exceeding the maximum for the current plan year cannot be reimbursed in subsequent periods. In addition, under the Fund’s Class C and R compensation distribution plans, the Fund pays Distributors for costs incurred in connection with the servicing, sale and distribution of the Fund’s shares up to the maximum annual plan rate for each class. The plan year, for purposes of monitoring compliance with the maximum annual plan rates, is February 1 through January 31 for each fund.
The maximum annual plan rates, based on the average daily net assets, for each class, are as follows:
Class A | 0.30% | |||
Class C | 1.00% | |||
Class R | 0.50% |
The Board has set the current rate at 0.25% per year for Class A shares until further notice and approval by the Board.
d. Sales Charges/Underwriting Agreements
Front-end sales charges and contingent deferred sales charges (CDSC) do not represent expenses of the Fund. These charges are deducted from the proceeds of sales of Fund shares prior to investment or from redemption proceeds prior to remittance, as applicable. Distributors has advised the Fund of the following commission transactions related to the sales and redemptions of the Fund’s shares for the year:
Sales charges retained net of commissions paid to unaffiliated broker/dealers | $ | 42,640 | ||
CDSC retained | $ | 13,896 |
e. Transfer Agent Fees
Each class of shares, except for Class R6, pays transfer agent fees to Investor Services for its performance of shareholder servicing obligations and reimburses Investor Services for out of pocket expenses incurred, including shareholder servicing fees paid to third parties. These fees are allocated daily based upon their relative proportion of such classes’ aggregate net assets. Class R6 pays Investor Services transfer agent fees specific to that class.
For the year ended May 31, 2017, the Fund paid transfer agent fees of $847,720, of which $248,590 was retained by Investor Services.
f. Waiver and Expense Reimbursements
K2 Advisors has contractually agreed in advance to waive or limit its fees and to assume as its own expense certain expenses otherwise payable by the Fund so that the expenses (excluding distribution fees, acquired fund fees and expenses, and expenses related to securities sold short) for each class of the Fund do not exceed 1.95%, and Class R6 does not exceed 1.86% based on the average net assets of each class (other than certain non-routine expenses or costs, including those relating to litigation, indemnification, reorganizations, and liquidations) until September 30, 2017. Total expenses waived or paid are not subject to recapture subsequent to the Fund’s fiscal year end.
| 86 | Annual Report | franklintempleton.com |
FRANKLIN ALTERNATIVE STRATEGIES FUNDS
NOTES TO CONSOLIDATED FINANCIAL STATEMENTS
Franklin K2 Alternative Strategies Fund (continued)
g. Other Affiliated Transactions
At May 31, 2017, the shares of the Fund were owned by the following entities:
| Shares | Percentage of Outstanding Sharesa | |||||||
Franklin Moderate Allocation Fund | 8,929,097 | 8.9% | ||||||
Franklin Conservative Allocation Fund | 5,731,980 | 5.7% | ||||||
Franklin Growth Allocation Fund | 5,317,292 | 5.3% | ||||||
Franklin LifeSmart 2025 Retirement Target Fund | 316,134 | 0.3% | ||||||
Franklin LifeSmart 2035 Retirement Target Fund | 272,845 | 0.3% | ||||||
Franklin LifeSmart 2045 Retirement Target Fund | 186,190 | 0.2% | ||||||
Franklin LifeSmart 2030 Retirement Target Fund | 107,299 | 0.1% | ||||||
Franklin LifeSmart 2020 Retirement Target Fund | 92,871 | 0.1% | ||||||
Franklin LifeSmart 2040 Retirement Target Fund | 87,606 | 0.1% | ||||||
Franklin LifeSmart 2050 Retirement Target Fund | 68,701 | 0.1% | ||||||
Franklin NextStep Moderate Fund | 45,148 | 0.1% | ||||||
Franklin NextStep Growth Fund | 21,147 | 0.0% | b | |||||
Franklin LifeSmart 2055 Retirement Target Fund | 17,499 | 0.0% | b | |||||
| 21,193,809 | 21.2% | |||||||
|
| |||||||
aInvestment activities of significant shareholders could have a material impact on the Fund.
bRounds to less than 0.1%.
4. Expense Offset Arrangement
The Fund has entered into an arrangement with its custodian whereby credits realized as a result of uninvested cash balances are used to reduce a portion of the Fund’s custodian expenses. During the year ended May 31, 2017, the custodian fees were reduced as noted in the Consolidated Statement of Operations.
5. Income Taxes
For tax purposes, capital losses may be carried over to offset future capital gains, if any. At May 31, 2017, the capital loss carryforwards were as follows:
Capital loss carryforwards: | ||||
Short term | $ | 15,442,373 | ||
Long term | 4,135,682 | |||
|
| |||
Total capital loss carryforwards | $ | 19,578,055 | ||
|
|
During the year ended May 31, 2017, the Fund utilized $21,118,796 of capital loss carryforwards.
The tax character of distributions paid during the years ended May 31, 2017 and 2016, was as follows:
| 2017 | 2016 | |||||||
Distributions paid from: | ||||||||
Ordinary income | $ | 7,734,925 | $ | 17,363,303 | ||||
Long term capital gain | — | 4,170,318 | ||||||
|
| |||||||
Total distributions paid | $ | 7,734,925 | $ | 21,533,621 | ||||
|
| |||||||
| franklintempleton.com | Annual Report | 87 |
FRANKLIN ALTERNATIVE STRATEGIES FUNDS
NOTES TO CONSOLIDATED FINANCIAL STATEMENTS
Franklin K2 Alternative Strategies Fund (continued)
5. Income Taxes (continued)
At May 31, 2017, the cost of investments, net unrealized appreciation (depreciation) and undistributed ordinary income for income tax purposes were as follows:
Cost of investments | $ | 996,716,759 | ||
|
| |||
Unrealized appreciation | $ | 81,569,224 | ||
Unrealized depreciation | (12,926,315 | ) | ||
|
| |||
Net unrealized appreciation (depreciation) | $ | 68,642,909 | ||
|
| |||
Distributable earnings – undistributed ordinary income | $ | 12,258,134 | ||
|
|
Differences between income and/or capital gains as determined on a book basis and a tax basis are primarily due to differing treatments of foreign currency transactions, swaps, investments in the K2 Subsidiary and wash sales.
6. Investment Transactions
Purchases and sales of investments and securities sold short (excluding short term securities) for the year ended May 31, 2017, aggregated $2,290,112,591 and $2,415,062,570, respectively.
Transactions in options written during the year ended May 31, 2017, were as follows:
| Number of Contracts | Notional Amount In $ | Premiums | ||||||||||
Options outstanding at May 31, 2016 | 8,966 | $ | 6,200,000 | $ | 1,021,236 | |||||||
Options written | 34,721 | — | 5,664,056 | |||||||||
Options expired | (5,629 | ) | (6,200,000 | ) | (505,397 | ) | ||||||
Options exercised | (1,155 | ) | — | (122,233 | ) | |||||||
Options closed | (32,071 | ) | — | (5,678,878 | ) | |||||||
|
| |||||||||||
Options outstanding at May 31, 2017 | 4,832 | $ | — | $ | 378,784 | |||||||
|
| |||||||||||
The Fund sold certain long positions held in the portfolio and simultaneously entered into total return swaps on the positions, retaining substantially all of the exposure to the economic return and the related risks on the long positions. At May 31, 2017, the transfers of financial assets accounted for as sales were as follows:
| At Original Transactions Dates | At Year Ended May 31, 2017 | |||||||||||||||||||||||
Cost Basis of Positions Sold | Gross Cash Received for Positions Sold | Fair Value of Transferred Assetsa | Gross Derivative Assets | Gross Derivative Liabilities | ||||||||||||||||||||
Sales and total return swaps | $ | 10,323,551 | $ | 11,708,411 | $ | 1,158,173 | $ | 12,866,584 | $ | 11,708,411 | ||||||||||||||
|
| |||||||||||||||||||||||
a$1,256,411 of gross derivative assets and $98,238 of gross derivative liabilities are included as unrealized appreciation and depreciation on OTC swap contracts, respectively, in the Consolidated Statement of Assets and Liabilities. See Note 9 regarding other derivative information.
bBalances are presented on a gross basis, based on each leg of the swap contract, before the application of counterparty and cash collateral offsetting.
See Notes 1(e) and 9 regarding derivative financial instruments and other derivative information, respectively.
7. Credit Risk and Defaulted Securities
The Fund may purchase the pre-default or defaulted debt of distressed companies. Distressed companies are financially troubled and could be or are already involved in financial restructuring or bankruptcy. Risks associated with purchasing these securities include the possibility that the bankruptcy or other restructuring process takes longer than expected, or that distributions in restructuring are
| 88 | Annual Report | franklintempleton.com |
FRANKLIN ALTERNATIVE STRATEGIES FUNDS
NOTES TO CONSOLIDATED FINANCIAL STATEMENTS
Franklin K2 Alternative Strategies Fund (continued)
less than anticipated, either or both of which may result in unfavorable consequences to the Fund. If it becomes probable that the income on debt securities, including those of distressed companies, will not be collected, the Fund discontinues accruing income and recognizes an adjustment for uncollectible interest.
At May 31, 2017, the aggregate long value of distressed company securities for which interest recognition has been discontinued was $8,916,614, representing 0.8% of the Fund’s net assets. For information as to specific securities, see the accompanying Consolidated Statement of Investments.
8. Unfunded Loan Commitments
The Fund enters into certain credit agreements, all or a portion of which may be unfunded. The Fund is obligated to fund these loan commitments at the borrowers’ discretion. Unfunded loan commitments and funded portions of credit agreements are marked to market daily. Funded portions of credit agreements are presented in the Consolidated Statements of Investments.
At May 31, 2017, unfunded commitments were as follows:
| Borrower | Unfunded Commitment | |||
The AES Corp., Term Loan B, 3.06%, 5/24/22 | $ | 240,392 | ||
Albertsons Cos. Inc., Term Loan B-4, 3.81%, 8/25/21 | 278,923 | |||
Almonde Inc., Term Loan, 4.56%, 4/26/24 | 150,000 | |||
Ashland Global, Term Loan B, 3.06%, 5/24/24 | 30,000 | |||
Axalta Coating, Term Loan B, 3.06%, 6/21/24 | 60,170 | |||
Centurylink Inc., Term Loan B, 3.81%, 1/31/25 | 245,000 | |||
Consolidated Communications Inc., Term Loan B, 4.06%, 10/05/23 | 95,000 | |||
Hyperion Insurance Group Ltd., Term Loan B, 5.06%, 4/29/22 | 41,749 | |||
Micro Focus, Term Loan B, 3.81%, 4/29/24 | 7,877 | |||
Micro Focus, Term Loan B-3, 3.81%, 4/19/24 | 53,194 | |||
NeuStar Inc., Term Loan B, 4.81%, 3/01/24 | 110,000 | |||
Post Holdings Inc., Term Loan B, 3.31%, 5/24/24 | 52,273 | |||
Quikrete Holdings Inc., Term Loan B, 3.81%, 11/15/23 | 209,475 | |||
U.S.I. Inc., Term Loan B, 4.06%, 5/16/24 | 245,701 | |||
|
| |||
| $ | 1,819,754 | |||
|
| |||
9. Other Derivative Information
At May 31, 2017, the Fund’s investments in derivative contracts are reflected in the Consolidated Statement of Assets and Liabilities as follows:
Asset Derivatives |
| Liability Derivatives |
| |||||||||
| Derivative Contracts Not Accounted for as Hedging Instruments | Consolidated Statement of Assets and Liabilities Location | Fair Value | Consolidated Statement of Assets and Liabilities Location | Fair Value | ||||||||
Interest rate contracts | Variation margin | $ | 751,964 | a | Variation margin | $ | 412,136 | a | ||||
Unrealized appreciation on OTC swap contracts | 1,537,737 | Unrealized depreciation on OTC swap contracts | 2,078,874 | |||||||||
Foreign exchange contracts | Investments in securities, at value | 81,809 | b | |||||||||
Unrealized appreciation on OTC forward exchange contracts | 4,037,925 | Unrealized depreciation on OTC forward exchange contracts | 7,869,885 | |||||||||
Unrealized appreciation on OTC swap contracts | 45,942 | |||||||||||
| franklintempleton.com | Annual Report | 89 |
FRANKLIN ALTERNATIVE STRATEGIES FUNDS
NOTES TO CONSOLIDATED FINANCIAL STATEMENTS
Franklin K2 Alternative Strategies Fund (continued)
9. Other Derivative Information (continued)
Asset Derivatives |
| Liability Derivatives |
| |||||||||
| Derivative Contracts Not Accounted for as Hedging Instruments | Consolidated Statement of Assets and Liabilities Location | Fair Value | Consolidated Statement of Assets and Liabilities Location | Fair Value | ||||||||
Credit contracts | Variation margin | $ | 398,397 | a | Variation margin | $ | 426,972 | a | ||||
OTC swap contracts (upfront payments) | 164,365 | OTC swap contracts (upfront receipts) | 34,208 | |||||||||
Unrealized appreciation on OTC swap contracts | 1,039 | Unrealized depreciation on OTC swap contracts | 516,135 | |||||||||
Equity contracts | Investments in securities, at value | 1,667,791 | b | Options written, at value | 274,388 | |||||||
Variation margin | 1,494,624 | a | Variation margin | 4,698,331 | a | |||||||
Unrealized appreciation on OTC swap contracts | 10,117,698 | Unrealized depreciation on OTC swap contracts | 3,178,240 | |||||||||
Commodity contracts | Variation margin | 846,741 | a | Variation margin | 671,306 | a | ||||||
|
|
|
| |||||||||
Totals | $ | 21,146,032 | $ | 20,160,475 | ||||||||
|
|
|
| |||||||||
aThis amount reflects the cumulative appreciation (depreciation) of futures contracts and centrally cleared swap contracts as reported in the Consolidated Statement of Investments. Only the variation margin receivable/payable at year end is separately reported within the Consolidated Statement of Assets and Liabilities. Prior variation margin movements were recorded to cash upon receipt or payment.
bPurchased option contracts are included in investments in securities, at value in the Consolidated Statement of Assets and Liabilities.
For the year ended May 31, 2017, the effect of derivative contracts in the Fund’s Consolidated Statement of Operations was as follows:
| Derivative Contracts Not Accounted for as Hedging Instruments | Consolidated Statement of Operations Location | Net Realized Gain (Loss) for the Year | Consolidated Statement of Operations Location | Net Change in Unrealized Appreciation (Depreciation) for the Year | ||||||||
Net realized gain (loss) from: | Net change in unrealized appreciation (depreciation) on: | |||||||||||
Interest rate contracts | Investments | $ | (284,815 | )a | Investments | $ | 207,392 | a | ||||
Written options | 85,291 | Written options | (84,468 | ) | ||||||||
Futures contracts | 1,787,444 | Futures contracts | (432,603 | ) | ||||||||
Swap contracts | 18,436,139 | Swap contracts | (2,475,172 | ) | ||||||||
Foreign exchange contracts | Investments | (158,090 | )a | Investments | (72,326 | )a | ||||||
Foreign currency transactions | 3,981,242 | b | Translation of other assets and liabilities denominated in foreign currencies | (3,826,260 | )b | |||||||
Futures contracts | 20,028 | Swap contracts | 45,942 | |||||||||
Credit contracts | Swap contracts | (836,185 | ) | Swap contracts | (665,510 | ) | ||||||
Equity contracts | Investments | (14,717,955 | )a | Investments | 2,300,942 | a | ||||||
Written options | 1,877,741 | Written options | (50,711 | ) | ||||||||
Futures contracts | 2,501,594 | Futures contracts | (3,311,027 | ) | ||||||||
Swap contracts | (12,722,293 | ) | Swap contracts | 7,154,913 | ||||||||
Commodity contracts | Futures contracts | (11,519,242 | ) | Futures contracts | 688,291 | |||||||
|
|
|
| |||||||||
Totals | $ | (11,549,101 | ) | $ | (520,597 | ) | ||||||
|
|
|
| |||||||||
aPurchased option contracts are included in net realized gain (loss) from investments and net change in unrealized appreciation (depreciation) on investments in the Consolidated Statement of Operations.
bForward exchange contracts are included in net realized gain (loss) from foreign currency transactions and net change in unrealized appreciation (depreciation) on translation of other assets and liabilities denominated in foreign currencies in the Consolidated Statement of Operations.
| 90 | Annual Report | franklintempleton.com |
FRANKLIN ALTERNATIVE STRATEGIES FUNDS
NOTES TO CONSOLIDATED FINANCIAL STATEMENTS
Franklin K2 Alternative Strategies Fund (continued)
For the year ended May 31, 2017, the average month end fair value of derivatives represented 2.8% of average month end net assets. The average month end number of open derivative contracts for the year was 1,045.
At May 31, 2017, the Fund’s OTC derivative assets and liabilities are as follows:
| Gross Amounts of Assets and Liabilities Presented in the Consolidated Statement of Assets and Liabilities | ||||||||
| Assetsa | Liabilitiesa | |||||||
| Derivatives | ||||||||
Forward Exchange Contracts | $ | 4,037,925 | $ | 7,869,885 | ||||
Options Purchased | 81,809 | — | ||||||
Swap Contracts | 11,866,781 | 5,807,457 | ||||||
|
| |||||||
Total | $ | 15,986,515 | $ | 13,677,342 | ||||
|
| |||||||
aAbsent an event of default or early termination, OTC derivative assets and liabilities are presented gross and not offset in the Consolidated Statement of Assets and Liabilities.
At May 31, 2017, the Fund’s OTC derivative assets, which may be offset against the Fund’s OTC derivative liabilities and collateral received from the counterparty, are as follows:
| Amounts Not Offset in the Consolidated Statement of Assets and Liabilities | ||||||||||||||||||||
| Gross Amounts of Assets Presented in the Consolidated Statement of Assets and Liabilities | Financial Instruments Available for Offset | Financials Instruments Collateral Received | Cash Collateral Received | Net Amount (Not Less than Zero) | ||||||||||||||||
| Counterparty | ||||||||||||||||||||
BNPP | $ | 340,178 | $ | (277,034 | ) | $ | — | $ | — | $ | 63,144 | |||||||||
BNYM | 140,764 | (140,764 | ) | — | — | — | ||||||||||||||
BOFA | 323,538 | (285,813 | ) | — | — | 37,725 | ||||||||||||||
BZWS | 30,188 | (30,188 | ) | — | — | — | ||||||||||||||
CITI | 431 | (431 | ) | — | — | — | ||||||||||||||
DBAB | 3,877,127 | (3,877,127 | ) | — | — | — | ||||||||||||||
GSCO | 2,917 | — | — | — | 2,917 | |||||||||||||||
JPHQ | 171,408 | (171,408 | ) | — | — | — | ||||||||||||||
MSCO | 552,905 | (552,905 | ) | — | — | — | ||||||||||||||
MSCOc | 2,530,886 | (2,530,886 | ) | — | — | — | ||||||||||||||
MSCS | 8,016,173 | (2,085,550 | ) | — | — | 5,930,623 | ||||||||||||||
|
| |||||||||||||||||||
Total | $ | 15,986,515 | $ | (9,952,106 | ) | $ | — | $ | — | $ | 6,034,409 | |||||||||
|
| |||||||||||||||||||
| franklintempleton.com | Annual Report | 91 |
FRANKLIN ALTERNATIVE STRATEGIES FUNDS
NOTES TO CONSOLIDATED FINANCIAL STATEMENTS
Franklin K2 Alternative Strategies Fund (continued)
9. Other Derivative Information (continued)
At May 31, 2017, the Fund’s OTC derivative liabilities, which may be offset against the Fund’s OTC derivative assets and collateral pledged to the counterparty, are as follows:
| Amounts Not Offset in the Consolidated Statement of Assets and Liabilities | ||||||||||||||||||||
| Gross Amounts of Liabilities Presented in the Consolidated Statement of Assets and Liabilities | Financial Instruments Available for Offset | Financials Instruments Collateral Pledgeda | Cash Collateral Pledgedb | Net Amount (Not Less than Zero) | ||||||||||||||||
| Counterparty | ||||||||||||||||||||
BNPP | $ | 277,034 | $ | (277,034 | ) | $ | — | $ | — | $ | — | |||||||||
BNYM | 871,813 | (140,764 | ) | — | (360,000 | ) | 371,049 | |||||||||||||
BOFA | 285,813 | (285,813 | ) | — | — | — | ||||||||||||||
BZWS | 44,755 | (30,188 | ) | — | — | 14,567 | ||||||||||||||
CITI | 41,434 | (431 | ) | — | (41,003 | ) | — | |||||||||||||
DBAB | 3,988,757 | (3,877,127 | ) | — | (111,630 | ) | — | |||||||||||||
GSCO | — | — | — | — | — | |||||||||||||||
JPHQ | 526,095 | (171,408 | ) | — | (354,687 | ) | — | |||||||||||||
MSCO | 709,194 | (552,905 | ) | — | (156,289 | ) | — | |||||||||||||
MSCOc | 4,846,897 | (2,530,886 | ) | — | (2,316,011 | ) | — | |||||||||||||
MSCS | 2,085,550 | (2,085,550 | ) | — | — | — | ||||||||||||||
|
| |||||||||||||||||||
Total | $ | 13,677,342 | $ | (9,952,106 | ) | $ | — | $ | (3,339,620 | ) | $ | 385,616 | ||||||||
|
| |||||||||||||||||||
aSee the accompanying Consolidated Statement of Investments for securities pledged as collateral for derivatives.
bIn some instances, the collateral amounts disclosed in the table above were adjusted due to the requirement to limit the collateral amounts to avoid the effect of overcollateralization. Actual collateral received and/or pledged may be more than the amounts disclosed herein.
cRepresents derivatives owned by the K2 Holdings Investment Corp., a wholly-owned subsidiary of the Fund. See Note 1(i).
See Notes 1(e) and 6 regarding derivative financial instruments and investment transactions, respectively.
See Abbreviations on page 95.
10. Credit Facility
The Fund, together with other U.S. registered and foreign investment funds (collectively, Borrowers), managed by Franklin Templeton Investments, are borrowers in a joint syndicated senior unsecured credit facility totaling $2 billion (Global Credit Facility) which matures on February 9, 2018. This Global Credit Facility provides a source of funds to the Borrowers for temporary and emergency purposes, including the ability to meet future unanticipated or unusually large redemption requests.
Under the terms of the Global Credit Facility, the Fund shall, in addition to interest charged on any borrowings made by the Fund and other costs incurred by the Fund, pay its share of fees and expenses incurred in connection with the implementation and maintenance of the Global Credit Facility, based upon its relative share of the aggregate net assets of all of the Borrowers, including an annual commitment fee of 0.15% based upon the unused portion of the Global Credit Facility. These fees are reflected in other expenses in the Consolidated Statement of Operations. During the year ended May 31, 2017, the Fund did not use the Global Credit Facility.
| 92 | Annual Report | franklintempleton.com |
FRANKLIN ALTERNATIVE STRATEGIES FUNDS
NOTES TO CONSOLIDATED FINANCIAL STATEMENTS
Franklin K2 Alternative Strategies Fund (continued)
11. Fair Value Measurements
The Fund follows a fair value hierarchy that distinguishes between market data obtained from independent sources (observable inputs) and the Fund’s own market assumptions (unobservable inputs). These inputs are used in determining the value of the Fund’s financial instruments and are summarized in the following fair value hierarchy:
| • | Level 1 – quoted prices in active markets for identical financial instruments |
| • | Level 2 – other significant observable inputs (including quoted prices for similar financial instruments, interest rates, prepayment speed, credit risk, etc.) |
| • | Level 3 – significant unobservable inputs (including the Fund’s own assumptions in determining the fair value of financial instruments) |
The input levels are not necessarily an indication of the risk or liquidity associated with financial instruments at that level.
For movements between the levels within the fair value hierarchy, the Fund has adopted a policy of recognizing the transfers as of the date of the underlying event which caused the movement.
A summary of inputs used as of May 31, 2017, in valuing the Fund’s assets and liabilities carried at fair value, is as follows:
| Level 1 | Level 2 | Level 3 | Total | |||||||||||||
| Assets: | ||||||||||||||||
Investments in Securities:a |
| |||||||||||||||
Common Stocks and Other Equity Interests | $ | 397,948,328 | $ | 69 | $ | 1,983,029 | b | $ | 399,931,426 | |||||||
Exchange Traded Funds | 344,681 | — | — | 344,681 | ||||||||||||
Convertible Preferred Stocks | 581,849 | 7,692,394 | — | 8,274,243 | ||||||||||||
Preferred Stocks | 277,256 | 1,847,614 | 3,255,316 | 5,380,186 | ||||||||||||
Convertible Bonds | — | 164,330,671 | — | 164,330,671 | ||||||||||||
Convertible Bonds in Reorganization | — | 804,924 | — | 804,924 | ||||||||||||
Corporate Bonds and Notes | — | 175,596,768 | — | b | 175,596,768 | |||||||||||
Corporate Bonds and Notes in Reorganization | — | 8,111,690 | — | 8,111,690 | ||||||||||||
Senior Floating Rate Interests | — | 7,995,761 | — | 7,995,761 | ||||||||||||
Foreign Government and Agency Securities | — | 35,319,502 | — | 35,319,502 | ||||||||||||
Asset-Backed Securities and Commercial Mortgage-Backed Securities | — | 22,356,059 | — | 22,356,059 | ||||||||||||
Options Purchased | 1,667,791 | 81,809 | — | 1,749,600 | ||||||||||||
Short Term Investments | 202,529,587 | 32,634,570 | — | 235,164,157 | ||||||||||||
|
| |||||||||||||||
Total Investments in Securities | $ | 603,349,492 | $ | 456,771,831 | $ | 5,238,345 | $ | 1,065,359,668 | ||||||||
|
| |||||||||||||||
Other Financial Instruments: |
| |||||||||||||||
Futures Contracts | 3,000,753 | — | — | 3,000,753 | ||||||||||||
Forward Exchange Contracts | — | 4,037,925 | — | 4,037,925 | ||||||||||||
Swap Contracts | — | 12,193,389 | — | 12,193,389 | ||||||||||||
Unfunded Loan Commitments | — | 9,829 | — | 9,829 | ||||||||||||
|
| |||||||||||||||
Total Other Financial Instruments | $ | 3,000,753 | $ | 16,241,143 | $ | — | $ | 19,241,896 | ||||||||
|
| |||||||||||||||
| Liabilities: | ||||||||||||||||
Other Financial Instruments: |
| |||||||||||||||
Options Written | $ | 274,388 | $ | — | $ | — | $ | 274,388 | ||||||||
Securities Sold Short | 216,978,759 | 21,789,436 | — | 238,768,195 | ||||||||||||
Futures Contracts | 5,667,924 | — | — | 5,667,924 | ||||||||||||
Forward Exchange Contracts | — | 7,869,885 | — | 7,869,885 | ||||||||||||
Swap Contracts | — | 6,314,070 | — | 6,314,070 | ||||||||||||
|
| |||||||||||||||
Total Other Financial Instruments | $ | 222,921,071 | $ | 35,973,391 | $ | — | $ | 258,894,462 | ||||||||
|
| |||||||||||||||
aFor detailed categories, see the accompanying Consolidated Statement of Investments.
bIncludes securities determined to have no value at May 31, 2017.
| franklintempleton.com | Annual Report | 93 |
FRANKLIN ALTERNATIVE STRATEGIES FUNDS
NOTES TO CONSOLIDATED FINANCIAL STATEMENTS
Franklin K2 Alternative Strategies Fund (continued)
11. Fair Value Measurements (continued)
A reconciliation of assets in which Level 3 inputs are used in determining fair value is presented when there are significant Level 3 financial instruments at the end of the year.
12. New Accounting Pronouncements
In March 2017, the Financial Accounting Standards Board (FASB) issued Accounting Standards Update (ASU) No. 2017-08, Receivables — Nonrefundable Fees and Other Costs (Subtopic 310-20): Premium Amortization on Purchased Callable Debt Securities. The amendments in the ASU shorten the amortization period for certain callable debt securities, held at a premium, to be amortized to the earliest call date. The ASU does not require an accounting change for securities held at a discount; which continues to be amortized to maturity. The ASU is effective for fiscal years and interim periods within those fiscal years beginning after December 15, 2018. Management is currently evaluating the impact, if any, of applying this provision.
13. Investment Company Reporting Modernization
In October 2016, the U.S. Securities and Exchange Commission adopted new rules and amended existing rules (together, final rules) intended to modernize the reporting and disclosure of information by registered investment companies. In part, the final rules amend Regulation S-X and require standardized, enhanced disclosures about derivatives in investment company financial statements, as well as other amendments. The compliance date for the amendments to Regulation S-X is August 1, 2017. Management has reviewed the requirements and believes the adoption of the amendments to Regulation S-X will not have a material impact on the Fund’s financial statements and related disclosures.
14. Subsequent Events
The Fund has evaluated subsequent events through the issuance of the consolidated financial statements and determined that no events have occurred that require disclosure other than those already disclosed in the financial statements.
| 94 | Annual Report | franklintempleton.com |
FRANKLIN ALTERNATIVE STRATEGIES FUNDS
NOTES TO CONSOLIDATED FINANCIAL STATEMENTS
Franklin K2 Alternative Strategies Fund (continued)
Abbreviations
| Counterparty/Exchange | Currency | Selected Portfolio | ||||||||
| BNPP | BNP Paribas | ARS | Argentine Peso | ADR | American Depositary Receipt | |||||
| BNYM | The Bank of New York Mellon Corp. | AUD | Australian Dollar | ARM | Adjustable Rate Mortgage | |||||
| BOFA | Bank of America, N.A. | BRL | Brazilian Real | EONIA | Euro OverNight Index Average | |||||
| BZWS | Barclays Bank PLC | CAD | Canadian Dollar | ETF | Exchange Traded Fund | |||||
| CITI | Citibank, N.A. | CHF | Swiss Franc | EURIBOR | Euro Interbank Offered Rate | |||||
| CME | Chicago Mercantile Exchange | COP | Colombian Peso | FEDEF | Federal Funds Effective Rate | |||||
| DBAB | Deutsche Bank, AG | CZK | Czech Koruna | FRN | Floating Rate Note | |||||
| GSCO | Goldman Sachs International | EGP | Egyptian Pound | FTSE | Financial Times Stock Exchange | |||||
| ICE | Intercontinental Exchange, Inc. | EUR | Euro | HIBOR | Hong Kong Interbank Offer Rate | |||||
| JPHQ | JP Morgan Chase Bank, N.A. | GBP | British Pound | JIBAR | Johannesburg Interbank Agreed Rate | |||||
| LCH | LCH.Clearnet LLC | HKD | Hong Kong Dollar | LIBOR | London InterBank Offered Rate | |||||
| MSCO | Morgan Stanley & Co., LLC | INR | Indian Rupee | MSCI | Morgan Stanley Capital International | |||||
| MSCS | Morgan Stanley Capital Services LLC | JPY | Japanese Yen | PIK | Payment In-Kind | |||||
Index | MXN | Mexican Peso | RBACR | Reserve Bank of Australia Cash Rate | ||||||
| PHP | Philippine Peso | REIT | Real Estate Investment Trust | |||||||
| CDX.EM | CDX Emerging Markets Index | PLN | Polish Zloty | SAFEX | South African Futures Exchange | |||||
| CDX.NA.HY | CDX North America High Yield Index | RUB | Russian Ruble | SIBOR | Singapore Interbank Offered Rate | |||||
| CMBX.NA | Commercial Mortgage Backed North America Index | SEK | Swedish Krona | SONIA | Sterling Overnight Index Average | |||||
| SGD | Singapore Dollar | SPDR | Standard & Poor’s Depositary Receipt | |||||||
| TRY | Turkish Lira | STIBOR | Stockholm Interbank Offered Rate | |||||||
| USD | United States Dollar | TIIE | Interbank Equilibrium Interest Rate | |||||||
| ZAR | South African Rand | TOIS | Swiss Tomorrow-Overnight Index Swap Rate | |||||||
| TOPIX | Tokyo Price Index | |||||||||
| franklintempleton.com | Annual Report | 95 |
FRANKLIN ALTERNATIVE STRATEGIES FUNDS
Report of Independent Registered Public Accounting Firm
To the Board of Trustees of Franklin Alternative Strategies Funds and Shareholders of Franklin K2 Alternative Strategies Fund:
We have audited the accompanying consolidated statement of assets and liabilities, including the consolidated statement of investments, of Franklin K2 Alternative Strategies Fund (the “Fund”) (one of the funds constituting the Franklin Alternative Strategies Funds), as of May 31, 2017, and the related consolidated statement of operations for the year then ended, the consolidated statements of changes in net assets for each of the two years in the period then ended and the consolidated financial highlights for each of the periods indicated therein. These consolidated financial statements and financial highlights are the responsibility of the Fund’s management. Our responsibility is to express an opinion on these consolidated financial statements and financial highlights based on our audits.
We conducted our audits in accordance with the standards of the Public Company Accounting Oversight Board (United States). Those standards require that we plan and perform the audit to obtain reasonable assurance about whether the financial statements and financial highlights are free of material misstatement. We were not engaged to perform an audit of the Fund’s internal control over financial reporting. Our audits included consideration of internal control over financial reporting as a basis for designing audit procedures that are appropriate in the circumstances, but not for the purpose of expressing an opinion on the effectiveness of the Fund’s internal control over financial reporting. Accordingly, we express no such opinion. An audit also includes examining, on a test basis, evidence supporting the amounts and disclosures in the financial statements and financial highlights, assessing the accounting principles used and significant estimates made by management, and evaluating the overall financial statement presentation. Our procedures included confirmation of securities owned as of May 31, 2017, by correspondence with the custodian and others, or by other appropriate auditing procedures where replies from others were not received. We believe that our audits provide a reasonable basis for our opinion.
In our opinion, the financial statements and financial highlights referred to above present fairly, in all material respects, the consolidated financial position of Franklin K2 Alternative Strategies Fund (one of the funds constituting the Franklin Alternative Strategies Funds) at May 31, 2017, the consolidated results of its operations for the year then ended, the consolidated changes in its net assets for each of the two years in the period then ended and the consolidated financial highlights for each of the periods indicated therein, in conformity with U.S. generally accepted accounting principles.

Boston, Massachusetts
July 26, 2017
| 96 | Annual Report | franklintempleton.com |
FRANKLIN ALTERNATIVE STRATEGIES FUNDS
Under Section 854(b)(1)(A) of the Internal Revenue Code (Code), the Fund hereby reports 39.49% of the ordinary income dividends as income qualifying for the dividends received deduction for the fiscal year ended May 31, 2017.
Under Section 854(b)(1)(B) of the Code, the Fund hereby reports the maximum amount allowable but no less than $3,560,057 as qualified dividends for purposes of the maximum rate under Section 1(h)(11) of the Code for the fiscal year ended May 31, 2017. Distributions, including qualified dividend income, paid during calendar year 2017 will be reported to shareholders on Form 1099-DIV by mid-February 2018. Shareholders are advised to check with their tax advisors for information on the treatment of these amounts on their individual income tax returns.
| franklintempleton.com | Annual Report | 97 |
FRANKLIN ALTERNATIVE STRATEGIES FUNDS
The name, year of birth and address of the officers and board members, as well as their affiliations, positions held with the Funds, principal occupations during at least the past five years and number of U.S. registered portfolios overseen in the Franklin Templeton Investments fund complex, are shown below. Generally, each board member serves until that person’s successor is elected and qualified.
Independent Board Members
| Name, Year of Birth and Address | Position | Length of Time Served | Number of Portfolios in Fund Complex Overseen by Board Member* | Other Directorships Held During at Least the Past 5 Years | ||||
| Edward I. Altman, Ph.D. (1941) c/o Franklin Mutual Advisers, LLC 101 John F. Kennedy Parkway Short Hills, NJ 07078-2789 | Trustee | Since 2011 | 16 | None | ||||
| Principal Occupation During at Least the Past 5 Years: | ||||||||
| Max L. Heine Professor of Finance, Emeritus and Director of The Credit and Debt Markets Research Program, Salomon Center, Stern School of Business, New York University; editor and author of numerous financial publications; financial consultant; an adviser to numerous financial and publishing organizations; and formerly, Vice Director, Salomon Center, Stern School of Business, New York University. | ||||||||
Ann Torre Bates (1958) | Trustee | Since 2011 | 42 | Ares Capital Corporation (specialty finance company) (2010-present), United Natural Foods, Inc. (distributor of natural, organic and specialty foods) (2013-present), Allied Capital Corporation (financial services) (2003-2010) and SLM Corporation (Sallie Mae) (1997-2014) and Navient Corporation (loan management, servicing and asset recovery) (2014-2016). | ||||
| Principal Occupation During at Least the Past 5 Years: | ||||||||
| Director of various companies; and formerly, Executive Vice President and Chief Financial Officer, NHP Incorporated (manager of multifamily housing) (1995-1997); and Vice President and Treasurer, US Airways, Inc. (until 1995). | ||||||||
| Burton J. Greenwald (1929) c/o Franklin Mutual Advisers, LLC 101 John F. Kennedy Parkway Short Hills, NJ 07078-2789 | Trustee | Since 2011 | 16 | Franklin Templeton Emerging Markets Debt Opportunities Fund PLC (1999-present) and Fiduciary International Ireland Limited (1999-2015). | ||||
| Principal Occupation During at Least the Past 5 Years: | ||||||||
| Managing Director, B.J. Greenwald Associates (management consultants to the financial services industry); and formerly, Chairman, Fiduciary Trust International Funds; Executive Vice President, L.F. Rothschild Fund Management, Inc.; President and Director, Merit Mutual Funds; President, Underwriting Division and Director, National Securities & Research Corporation; Governor, Investment Company Institute; and Chairman, ICI Public Information Committee. | ||||||||
| Keith E. Mitchell (1954) c/o Franklin Mutual Advisers, LLC 101 John F. Kennedy Parkway Short Hills, NJ 07078-2789 | Trustee | Since 2011 | 16 | None | ||||
| Principal Occupation During at Least the Past 5 Years: | ||||||||
| Director of various boards of asset management firms; and formerly, Managing Member, Mitchell, Hartley & Bechtel Advisers, LLC (formerly, Mitchell Advisers, LLC) (advisory firm) (2003-2015) and Managing Director, Putman Lovell NBF. | ||||||||
| 98 | Annual Report | franklintempleton.com |
FRANKLIN ALTERNATIVE STRATEGIES FUNDS
Independent Board Members (continued)
| Name, Year of Birth and Address | Position | Length of Time Served | Number of Portfolios in Fund Complex Overseen by Board Member* | Other Directorships Held During at Least the Past 5 Years | ||||
| David W. Niemiec (1949) c/o Franklin Mutual Advisers, LLC 101 John F. Kennedy Parkway Short Hills, NJ 07078-2789 | Trustee | Since 2015 | 42 | Hess Midstream Partners LP (oil and gas midstream infrastructure) (April 2017). | ||||
| Principal Occupation During at Least the Past 5 Years: | ||||||||
| Advisor, Saratoga Partners (private equity fund); and formerly, Managing Director, Saratoga Partners (1998-2001) and SBC Warburg Dillon Read (investment banking) (1997-1998); Vice Chairman, Dillon, Read & Co. Inc. (investment banking) (1991-1997); and Chief Financial Officer, Dillon, Read & Co. Inc. (1982-1997). | ||||||||
| Charles Rubens II (1930) c/o Franklin Mutual Advisers, LLC 101 John F. Kennedy Parkway Short Hills, NJ 07078-2789 | Trustee | Since 2011 | 16 | None | ||||
| Principal Occupation During at Least the Past 5 Years: | ||||||||
| Private investor and president of non-profit organizations; and formerly, an executive of Time, Inc.; and Trustee of Colorado College. | ||||||||
| Jan Hopkins Trachtman (1947) c/o Franklin Mutual Advisers, LLC 101 John F. Kennedy Parkway Short Hills, NJ 07078-2789 | Trustee | Since 2011 | 16 | None | ||||
| Principal Occupation During at Least the Past 5 Years: | ||||||||
| President and Founder, The Jan Hopkins Group (communications consulting firm); serves on Advisory Board of Knight Bagehot Fellowship; and formerly, President, Economic Club of New York (2007-2015); Anchor/Correspondent, CNN Financial News (until 2003); Managing Director and Head of Client Communications, Citigroup Private Bank (until 2005); Off-Air Reporter, ABC News’ World News Tonight; and Editor, CBS Network News. | ||||||||
| Robert E. Wade (1946) c/o Franklin Mutual Advisers, LLC 101 John F. Kennedy Parkway Short Hills, NJ 07078-2789 | Trustee and Chairman of the Board | Trustee and Chairman of the Board since 2011 | 42 | El Oro Ltd (investments) (2003-present). | ||||
| Principal Occupation During at Least the Past 5 Years: | ||||||||
| Attorney at law engaged in private practice (1972-2008) and member of various boards. | ||||||||
| Gregory H. Williams (1943) c/o Franklin Mutual Advisers, LLC 101 John F. Kennedy Parkway Short Hills, NJ 07078-2789 | Trustee | Since 2015 | 16 | None | ||||
| Principal Occupation During at Least the Past 5 Years: | ||||||||
| Private investor; Consultant; and formerly, President, University of Cincinnati (2009-2012); President, The City College of New York (2001-2009); Dean, College of Law, Ohio State University (1993-2001); and Associate Vice President, Academic Affairs and Professor of Law, University of Iowa (1977-1993). | ||||||||
| franklintempleton.com | Annual Report | 99 |
FRANKLIN ALTERNATIVE STRATEGIES FUNDS
Interested Board Members and Officers
| Name, Year of Birth and Address | Position | Length of Time Served | Number of Portfolios in Fund Complex Overseen by Board Member* | Other Directorships Held During at Least the Past 5 Years | ||||
| **Gregory E. Johnson (1961) One Franklin Parkway San Mateo, CA 94403-1906 | Trustee | Since 2011 | 156 | None | ||||
| Principal Occupation During at Least the Past 5 Years: | ||||||||
| Chairman of the Board, Member – Office of the Chairman, Director and Chief Executive Officer, Franklin Resources, Inc.; officer and/or director or trustee, as the case may be, of some of the other subsidiaries of Franklin Resources, Inc. and of 44 of the investment companies in Franklin Templeton Investments; and Chairman, Investment Company Institute; and formerly, President, Franklin Resources, Inc. (1994-2015). | ||||||||
| **Jennifer M. Johnson (1964) One Franklin Parkway San Mateo, CA 94403-1906 | Trustee | Since 2015 | 19 | None | ||||
| Principal Occupation During at Least the Past 5 Years: | ||||||||
| President and Chief Operating Officer, Franklin Resources, Inc.; officer and/or director or trustee, as the case may be, of some of the other subsidiaries of Franklin Resources, Inc. and of four of the investment companies in Franklin Templeton Investments; and formerly, Chief Operating Officer and Executive Vice President, Franklin Resources, Inc. (1994-2015); Executive Vice President of Operations and Technology, Franklin Resources, Inc. (2005-2010); and Senior Vice President, Franklin Resources, Inc. (2003-2005). | ||||||||
| Alison E. Baur (1964) One Franklin Parkway San Mateo, CA 94403-1906 | Vice President | Since 2012 | Not Applicable | Not Applicable | ||||
| Principal Occupation During at Least the Past 5 Years: | ||||||||
| Deputy General Counsel, Franklin Templeton Investments; and officer of some of the other subsidiaries of Franklin Resources, Inc. and of 45 of the investment companies in Franklin Templeton Investments. | ||||||||
| Aliya S. Gordon (1973) One Franklin Parkway San Mateo, CA 94403-1906 | Vice President | Since 2011 | Not Applicable | Not Applicable | ||||
Principal Occupation During at Least the Past 5 Years: | ||||||||
| Senior Associate General Counsel, Franklin Templeton Investments; and officer of 45 of the investment companies in Franklin Templeton Investments. | ||||||||
| Steven J. Gray (1955) One Franklin Parkway San Mateo, CA 94403-1906 | Secretary and Vice President | Secretary and Vice President since 2011 | Not Applicable | Not Applicable | ||||
| Principal Occupation During at Least the Past 5 Years: | ||||||||
| Senior Associate General Counsel, Franklin Templeton Investments; Vice President, Franklin Templeton Distributors, Inc. and FT AlphaParity, LLC; and officer of 45 of the investment companies in Franklin Templeton Investments. | ||||||||
Madison S. Gulley (1964) 300 S.E. 2nd Street Fort Lauderdale, FL 33301-1923 | President and Chief Executive Officer – Investment Management | Since June 2017 | Not Applicable | Not Applicable | ||||
| Principal Occupation During at Least the Past 5 Years: | ||||||||
| Executive Vice President, Franklin Advisers, Inc., Franklin Advisory Services, LLC, Franklin Templeton Institutional, LLC; Templeton Global Advisors, Limited, and Templeton Investment Counsel, LLC; Senior Vice President, Franklin Templeton Companies, LLC; officer and/or director or trustee, as the case may be, of some of the other subsidiaries of Franklin Resources, Inc. and of one of the investment companies in Franklin Templeton Investments. | ||||||||
| 100 | Annual Report | franklintempleton.com |
FRANKLIN ALTERNATIVE STRATEGIES FUNDS
Interested Board Members and Officers (continued)
| Name, Year of Birth and Address | Position | Length of Time Served | Number of Portfolios in Fund Complex Overseen by Board Member* | Other Directorships Held During at Least the Past 5 Years | ||||
Matthew T. Hinkle (1971) One Franklin Parkway San Mateo, CA 94403-1906 | Chief | Since June 2017 | Not Applicable | Not Applicable | ||||
| Principal Occupation During at Least the Past 5 Years: | ||||||||
| Senior Vice President, U.S. Fund Administration Reporting & Fund Tax, Franklin Templeton Investments; officer of 45 of the investment companies in Franklin Templeton Investments; and formerly, Vice President, Global Tax (2012-April 2017) and Treasurer/Assistant Treasurer, Franklin Templeton Investments (2009-2017). | ||||||||
| Robert G. Kubilis (1973) 300 S.E. 2nd Street Fort Lauderdale, FL 33301-1923 | Treasurer, Chief Financial Officer and Chief Accounting Officer | Since 2015 | Not Applicable | Not Applicable | ||||
| Principal Occupation During at Least the Past 5 Years: | ||||||||
| Treasurer, U.S. Fund Administration & Reporting, Franklin Templeton Investments; and officer of 18 of the investment companies in Franklin Templeton Investments. | ||||||||
| Robert Lim (1948) One Franklin Parkway San Mateo, CA 94403-1906 | Vice President – AML Compliance | Since 2016 | Not Applicable | Not Applicable | ||||
| Principal Occupation During at Least the Past 5 Years: | ||||||||
| Vice President, Franklin Templeton Companies, LLC; Chief Compliance Officer, Franklin Templeton Distributors, Inc. and Franklin Templeton Investor Services, LLC; and officer of 45 of the investment companies in Franklin Templeton Investments. | ||||||||
| Kimberly H. Novotny (1972) 300 S.E. 2nd Street Fort Lauderdale, FL 33301-1923 | Vice President | Since 2013 | Not Applicable | Not Applicable | ||||
| Principal Occupation During at Least the Past 5 Years: | ||||||||
| Associate General Counsel, Franklin Templeton Investments; Vice President and Corporate Secretary, Fiduciary Trust International of the South; Vice President, Templeton Investment Counsel, LLC; Assistant Secretary, Franklin Resources, Inc.; and officer of 45 of the investment companies in Franklin Templeton Investments. | ||||||||
| Robert C. Rosselot (1960) 300 S.E. 2nd Street Fort Lauderdale, FL 33301-1923 | Chief Compliance Officer | Since 2013 | Not Applicable | Not Applicable | ||||
| Principal Occupation During at Least the Past 5 Years: | ||||||||
| Director, Global Compliance, Franklin Templeton Investments; Vice President, Franklin Templeton Companies, LLC; officer of 45 of the investment companies in Franklin Templeton Investments; and formerly, Senior Associate General Counsel, Franklin Templeton Investments (2007-2013); and Secretary and Vice President, Templeton Group of Funds (2004-2013). | ||||||||
| Karen L. Skidmore (1952) One Franklin Parkway San Mateo, CA 94403-1906 | Vice President | Since 2011 | Not Applicable | Not Applicable | ||||
| Principal Occupation During at Least the Past 5 Years: | ||||||||
| Senior Associate General Counsel, Franklin Templeton Investments; and officer of 45 of the investment companies in Franklin Templeton Investments. | ||||||||
| franklintempleton.com | Annual Report | 101 |
FRANKLIN ALTERNATIVE STRATEGIES FUNDS
Interested Board Members and Officers (continued)
| Name, Year of Birth and Address | Position | Length of Time Served | Number of Portfolios in Fund Complex Overseen by Board Member* | Other Directorships Held During at Least the Past 5 Years | ||||
| Navid J. Tofigh (1972) One Franklin Parkway San Mateo, CA 94403-1906 | Vice President | Since 2015 | Not Applicable | Not Applicable | ||||
| Principal Occupation During at Least the Past 5 Years: | ||||||||
| Associate General Counsel, Franklin Templeton Investments; and officer of 45 of the investment companies in Franklin Templeton Investments. | ||||||||
| Craig S. Tyle (1960) One Franklin Parkway San Mateo, CA 94403-1906 | Vice President | Since 2011 | Not Applicable | Not Applicable | ||||
| Principal Occupation During at Least the Past 5 Years: | ||||||||
| General Counsel and Executive Vice President, Franklin Resources, Inc.; and officer of some of the other subsidiaries of Franklin Resources, Inc. and of 45 of the investment companies in Franklin Templeton Investments. | ||||||||
| Lori A. Weber (1964) 300 S.E. 2nd Street Fort Lauderdale, FL 33301-1923 | Vice President | Since 2011 | Not Applicable | Not Applicable | ||||
| Principal Occupation During at Least the Past 5 Years: | ||||||||
| Senior Associate General Counsel, Franklin Templeton Investments; Assistant Secretary, Franklin Resources, Inc.; Vice President and Secretary, Templeton Investment Counsel, LLC; and officer of 45 of the investment companies in Franklin Templeton Investments. | ||||||||
*We base the number of portfolios on each separate series of the U.S. registered investment companies within the Franklin Templeton Investments fund complex. These portfolios have a common investment manager or affiliated investment managers.
**Gregory E. Johnson is considered to be an interested person of the Fund under the federal securities laws due to his position as an officer and director of Franklin Resources, Inc. (Resources), which is the parent company of the Fund’s investment manager and distributor. Jennifer M. Johnson is considered to be an interested person of the Fund under the federal securities laws due to her position as officer and director of Resources.
Note 1: Gregory E. Johnson and Jennifer M. Johnson are siblings.
Note 2: Officer information is current as of the date of this report. It is possible that after this date, information about officers may change.
Note 3: Effective June 1, 2017, William Y. Yun ceased to be an officer of the trust.
The Fund’s Board has determined that certain of the members of the Audit Committee, including Ann Torre Bates, are audit committee financial experts, and “independent,” under those provisions of the Sarbanes-Oxley Act of 2002, and the rules and form amendments adopted by the Securities and Exchange Commission, relating to audit committee financial experts.
The Statement of Additional Information (SAI) includes additional information about the board members and is available, without charge, upon request. Shareholders may call (800) DIAL BEN/342-5236 to request the SAI.
| 102 | Annual Report | franklintempleton.com |
FRANKLIN ALTERNATIVE STRATEGIES FUNDS
FRANKLIN K2 ALTERNATIVE STRATEGIES FUND
Board Approval of Investment Management Agreements and Sub-Advisory Agreements
FRANKLIN K2 ALTERNATIVE STRATEGIES FUND (“Fund”)
The Board of Trustees (Board) of Franklin Alternative Strategies Funds (the Trust), including a majority of trustees that are not “interested persons” as such term is defined in section 2(a)(19) of the Investment Company Act of 1940 (hereinafter referred to as “independent trustees”), at an in-person meeting held on May 22, 2017, unanimously approved the renewal of the Fund’s investment management agreement with K2/D&S Management Co., L.L.C. (K2 Advisors), and of each sub-advisory agreement between K2 Advisors and each of following sub-advisors (the Sub-Advisors):
Basso Capital Management, L.P.
Chatham Asset Management, LLC
Chilton Investment Company, LLC
EMSO Asset Management Limited
Graham Capital Management, L.P.
Impala Asset Management, LLC
Jennison Associates, LLC
Lazard Asset Management, LLC
Loomis Sayles & Company, L.P.
P. Schoenfeld Asset Management L.P.
Portland Hill Asset Management Limited
Wellington Management Company, LLP
Prior to a meeting of all of the trustees for the purpose of considering such renewal, the independent trustees participated in two other meetings held in connection with the renewal process. Throughout the process, the independent trustees received assistance and advice from and met separately with independent counsel. The independent trustees met with and interviewed officers of K2 Advisors and certain Sub-Advisors (including portfolio managers), the transfer agent and shareholder services group and the distributor. In approving the renewal of the investment management agreement and the subadvisory agreements for the Fund, the Board, including the independent trustees, determined that the investment management fee structure was fair and reasonable and that continuance of the agreement was in the best interests of the Fund and its shareholders.
In making the foregoing approvals, the Board considered various materials related to the investment management agreement and the sub-advisory agreements including: (1) a copy of the investment management agreement and sub-advisory agreements; (2) information describing the nature, quality and extent
of services that K2 Advisors and each Sub-Advisor provided, and are expected to provide, to the Fund, and the investment management fees and sub-advisory fees payable to K2 Advisors and each Sub-Advisor; (3) reports from K2 Advisors on the continued diligence conducted on each Sub-Advisor and the reasons for recommending renewal of each of the sub-advisory agreements, including, but not limited to, each Sub-Advisor’s background, experience, personnel, operations, policies, procedures and compliance functions; and (4) a report from the Trust’s Chief Compliance Officer regarding K2 Advisors’ and each Sub-Advisor’s compliance program and capabilities, including policies and procedures in place to address potential conflicts of interest, and the diligence undertaken by the Trust’s Chief Compliance Officer with respect thereto. The Board also noted that it received an annual report on all payments made by Franklin Templeton Investments (FTI) or the Fund to financial intermediaries engaged in the sale of Fund shares, as well as a memorandum relating to third-party servicing arrangements in response to a Guidance Update from the U.S. Securities and Exchange Commission (SEC) relating to mutual fund distribution and sub-accounting fees.
The Board also took into account information furnished throughout the year at regular Board meetings, as well as information specifically requested and furnished for the renewal process, which culminated in the meetings referred to above for the specific purpose of considering such agreements. Information furnished throughout the year included, among others, reports on the Fund’s investment performance, expenses, portfolio composition, derivatives, asset segregation, portfolio turnover, Rule 12b-1 plan, distribution, shareholder servicing, legal and compliance matters, pricing of securities, sales and redemptions, and marketing support payments made to financial intermediaries, as well as a third-party survey of transfer agent fees charged funds within the FTI complex in comparison with those charged other fund complexes deemed comparable. Also, related financial statements and other information about the scope and quality of services provided by K2 Advisors and its affiliates and enhancements to such services over the past year were provided. In addition, the trustees received periodic reports throughout the year and during the renewal process relating to compliance with the Fund’s investment policies and restrictions. During the renewal process, the independent trustees considered K2 Advisors’ methods of operation within the Franklin Templeton group and its activities on behalf of other clients.
The information obtained by the trustees during the renewal process also included a special report prepared by Broadridge Financial Solutions, Inc., an independent third-party analyst that
| franklintempleton.com | Annual Report | 103 |
FRANKLIN ALTERNATIVE STRATEGIES FUNDS
FRANKLIN K2 ALTERNATIVE STRATEGIES FUND
SHAREHOLDER INFORMATION
utilizes data from Lipper, Inc. (“Lipper”), comparing the Fund’s investment performance and expenses with those of other mutual funds deemed comparable to such Fund as selected by Broadridge (Broadridge Section 15(c) Report). The trustees reviewed the Broadridge Section 15(c) Report and its usefulness in the renewal process with respect to matters such as comparative fees, expenses, expense ratios and performance. The Board considered K2 Advisors’ views that the peer group determined by Lipper for comparison purposes may not be an entirely appropriate representation of the Fund’s peer universe. K2 Advisors explained that the universe of funds that are managed using multi-manager, multi-strategy structures, like the Fund, is still evolving, and has presented challenges in identifying an appropriate set of peers for the Fund. It was noted by K2 Advisors that the peer group compiled by Lipper includes single-manager funds which, due to their nature and relative simplicity, have lower expense ratios and are not true peers for fee comparison purposes. In addition, many of the sponsors of funds with multi-manager strategies that K2 Advisors considers to be peers were excluded from the peer group and K2 Advisors believes that the Fund’s expenses are consistent with those funds. While noting the limitations of the Broadridge Section 15(c) Report, the Board concluded that the Broadridge Section 15(c) Report was helpful in the performance of its duties.
In addition, the trustees received a Profitability Study (Profitability Study) prepared by management discussing the profitability to FTI from its overall U.S. fund operations, as well as on an individual fund-by-fund basis. Over the past year, the Board and counsel to the independent trustees continued to receive reports on management’s handling of recent regulatory inquiries and pending legal actions against K2 Advisors and its affiliates. The independent trustees were satisfied with the actions taken to date by management in response to such regulatory and legal matters. The independent trustees also received reports from the Trust’s Chief Compliance Officer on regulatory inquiries and pending legal actions against the Sub-Advisors applicable to the services provided by the Sub-Advisors to the Fund and noted that there were not any issues in this regard that should prevent the renewal of the sub-advisory agreements.
The trustees reviewed the personnel, operations, financial condition, and investment management capabilities, methodologies and resources of K2 Advisors and each Sub-Advisor, including each management team’s expertise in the management of other alternative strategies funds. As part of this review, particular attention was given to (1) the diligent risk management program of K2 Advisors and its parent, including those aspects of the program related to selecting and overseeing sub-advisors to the
Fund and continual monitoring and management of cybersecurity, liquidity and counterparty credit risk, (2) each Sub-Advisor’s risk management program, and (3) derivatives and other complex instruments that are held and expected to be held by the Fund and how such instruments are used to carry out the Fund’s investment goal.
The Board also took into account, among other things, management’s efforts in establishing a global credit facility for the benefit of the Fund and other accounts managed by FTI to provide a source of cash for temporary and emergency purposes or to meet unusual redemption requests as well as the strong financial position of K2 Advisors’ parent company and its commitment to the mutual fund business. In addition, the Board received updates from management on the SEC’s progress in implementing the rule-making requirements established by the Dodd-Frank Wall Street Reform and Consumer Protection Act (Dodd-Frank Act), which was enacted July 21, 2010, and K2 Advisors’ and its affiliates’ compliance with rules and regulations already promulgated by the SEC under such act.
In addition to the above and other matters considered by the trustees throughout the course of the year, the following discussion relates to certain primary factors relevant to the Board’s decision. This discussion of the information and factors considered by the Board (including the information and factors discussed above) is not intended to be exhaustive, but rather summarizes certain factors considered by the Board. In view of the wide variety of factors considered, the Board did not, unless otherwise noted, find it practicable to quantify or otherwise assign relative weights to the foregoing factors. In addition, individual trustees may have assigned different weights to various factors.
NATURE, EXTENT AND QUALITY OF SERVICES. The trustees reviewed the nature, extent and quality of the services provided, and to be provided, by K2 Advisors and each Sub-Advisor. In this regard, they reviewed the Fund’s investment goal and K2 Advisors’ and each Sub-Advisor’s investment strategy and sub-strategy, and K2 Advisors’ and each Sub-Advisor’s ability to implement such investment strategy and/or sub-strategy, including, but not limited to, K2 Advisors’ and each Sub-Advisor’s trading practices, investment decision processes and reputation. The Board also considered the investment management services that the investment manager provides to the Cayman Islands-based company, which is wholly owned by the Fund (Cayman Subsidiary).
The Board noted that the Fund employs a “manager of managers” structure, whereby K2 Advisors is responsible for selecting
| 104 | Annual Report | franklintempleton.com |
FRANKLIN ALTERNATIVE STRATEGIES FUNDS
FRANKLIN K2 ALTERNATIVE STRATEGIES FUND
SHAREHOLDER INFORMATION
sub-advisors (subject to Board approval), allocating the Fund’s assets among them, and overseeing the sub-advisors’ day-to-day management of the Fund’s assets. The Board noted the responsibilities that K2 Advisors has as the Fund’s investment manager, including (1) due diligence on the Sub-Advisors and any potential new sub-advisors to the Fund, their respective trading strategies, risk management, operations and businesses, (2) on-going oversight and monitoring of the day-to-day investment activities of Sub-Advisors and other service providers, including their respective compliance with the investment mandate and restrictions, compliance policies and procedures and federal securities laws, and K2 Advisors’ ongoing assessment of their performance, (3) portfolio construction with respect to the allocation of assets among Sub-Advisors, investment funds, cash and other investments, (4) risk management, (5) preparing quarterly reports to the Board, and (6) the implementation of Board directives as they relate to the Fund. The Trustees also considered the successful performance of K2 Advisors in managing the Fund and other investment products with similar investment strategies to the investment strategies of the Fund that are not subject to the Investment Company Act of 1940.
With respect to the sub-advisory services provided, and to be provided, by each Sub-Advisor, the Board noted the responsibilities that each Sub-Advisor has with respect to the portion of the Fund’s assets allocated to the Sub-Advisor by K2 Advisors (Sub-Advised Portion), including, among others, implementing the investment strategies with respect to the Sub-Advised Portion and ensuring compliance with the investment strategies, policies and limitations of the Sub-Advised Portion. The trustees considered the successful performance of each Sub-Advisor in managing the Fund and other investment products with similar investment strategies to the investment strategies of its Sub-Advised Portion of the Fund, including, with respect to certain Sub-Advisors, mutual funds with similar investment strategies. The Board considered K2 Advisors’ rationale for recommending the continued retention of each Sub-Advisor.
The trustees reviewed the Fund’s portfolio management teams at K2 Advisors and each Sub-Advisor, including each such team’s performance, staffing, skills and compensation program. With respect to portfolio manager compensation, management assured the trustees that the Fund’s long-term performance is a significant component of incentive-based compensation for K2 Advisors’ portfolio management team and noted that a portion of a K2 Advisors’ portfolio manager’s incentive-based compensation is paid in shares of pre-designated funds from the portfolio manager’s fund management area. The trustees noted that the portfolio manager compensation program aligned
the interests of the portfolio managers with that of Fund shareholders. During regular Board meetings and the aforementioned meetings of the independent trustees, the trustees considered periodic reports provided to them showing that K2 Advisors and the Sub-Advisors complied with the investment policies and restrictions of the Fund as well as other reports periodically furnished to the Board covering matters such as the compliance of portfolio managers and other management personnel with the code of ethics covering the investment management personnel, the adherence to fair value pricing procedures established by the Board and the accuracy of net asset value calculations. The Board noted the extent of the benefits provided to Fund shareholders from being part of the Franklin Templeton group of funds, including the right to exchange investments between funds (same class) without a sales charge, the ability to reinvest Fund dividends into other funds and the right to combine holdings of other funds to obtain reduced sales charges.
The trustees discussed with management various other products, portfolios and entities that are advised by K2 Advisors and each Sub-Advisor and the allocation of assets and expenses among and within them, as well as their relative fees and reasons for differences with respect thereto and any potential conflicts.
The Board also considered a report from the Trust’s Chief Compliance Officer regarding K2 Advisors’ and each Sub-Advisor’s compliance programs and capabilities as such programs and capabilities relate to the operations of the Fund and the monitoring and testing of such program undertaken by the Trust’s Chief Compliance Officer. The Board considered the selection and due diligence process employed by K2 Advisors in selecting and deciding to retain each Sub-Advisor as a sub-advisor to the Fund, including the due diligence undertaken with respect to the Sub-Advisor’s compliance and risk management capabilities. The trustees considered K2 Advisors’ significant efforts in developing and implementing compliance procedures established in accordance with SEC and other requirements.
The Board also considered the nature, extent and quality of the services to be provided under the Fund’s other service agreements to determine that, on an overall basis, Fund shareholders were well served. In this connection, the Board also took into account transfer agent and shareholder services provided to Fund shareholders by an affiliate of K2 Advisors, noting continuing expenditures by management to increase and improve the scope of such services and favorable periodic reports on shareholder services conducted by independent third parties. While such considerations directly affected the trustees’ decision in renewing
| franklintempleton.com | Annual Report | 105 |
FRANKLIN ALTERNATIVE STRATEGIES FUNDS
FRANKLIN K2 ALTERNATIVE STRATEGIES FUND
SHAREHOLDER INFORMATION
the Fund’s transfer agent and shareholder services agreement, the Board also considered these commitments as incidental benefits to Fund shareholders deriving from the investment management relationship.
Based on their review, the trustees were satisfied with the nature and quality of the overall services provided, and to be provided, by K2 Advisors and its affiliates and each Sub Advisor to the Fund and its shareholders and were confident in the abilities of K2 Advisors and each Sub-Advisor to implement their respective investment strategy and/or sub-strategy and to provide quality services to the Fund and its shareholders.
INVESTMENT PERFORMANCE. As the Fund commenced operations in October 2013, the trustees reviewed the investment performance of the Fund and each Sub-Advisor for the one, two and three-year periods ended December 31, 2016. As part of their review, they inquired of management regarding benchmark and hedging activities. Consideration was also given to performance in the context of available levels of cash, including as affected by net flows, during the periods. The trustees had meetings during the year, including the meetings referred to above held in connection with the renewal process, with the Fund’s portfolio managers to discuss performance and the management of the Fund and each Sub-Advisor.
In addition, attention in assessing performance was given to the Broadridge Section 15(c) Report. That report showed the investment performance of the Fund (Class A shares) in comparison to other funds determined comparable by Lipper. The comparable funds to the Fund, as chosen by Lipper, included all retail and institutional alternative multi-strategy funds.K2-ASF: The Fund had total returns in the middle performing quintile for the one-year period ended December 31, 2016 and total returns in the second-best performing quintile for the two and three-year periods ended December 31, 2016. The Board was satisfied with such performance.
The trustees also compared Fund performance to other industry benchmarks, including measures of risk-adjusted performance of a fund, as part of their evaluation of investment performance. The trustees concluded that the Fund had performed well in comparison to its various benchmarks and in the context of the Fund’s investment goal.
Comparative Expenses and Profitability.
The trustees considered the cost of the services provided, and to be provided, by K2 Advisors and each Sub-Advisor and the profits realized by K2 Advisors and its affiliates from their
relationships with the Fund. In considering the appropriateness of the management fee and other expenses charged to the Fund, the Board took into account various factors including investment performance and matters relating to Fund operations, including, but not limited to, the quality and experience of K2 Advisors personnel. The Board also reviewed and considered the investment management fees in light of the nature, extent and quality of the investment management services provided, and to be provided, by K2 Advisors and each Sub-Advisor, as more fully discussed above. The Board noted that the sub-advisory fees are paid by K2 Advisors to each Sub-Advisor and are not additional fees borne by the Fund. The Board also noted that the subadvisory fees paid, and to be paid, by K2 Advisors to each Sub-Advisor were the product of arms-length negotiations between K2 Advisors and each Sub-Advisor. Furthermore, the Board took into account that information regarding Sub-Advisor profitability is not legally required to be provided and noted that, despite requests by K2 Advisors of such information, the Sub-Advisors had not provided profitability information. Accordingly, profitability information of the sub-advisors was given lesser weight than other factors. In addition, the Board considered the allocation of the investment management fee charged to the Fund between K2 Advisors and each Sub-Advisor in light of the nature, extent and quality of the investment management services provided, and to be provided, by K2 Advisors and each Sub-Advisor. As part of this discussion, the Board took into account the fee waiver and expense limitation arrangement in effect, and the amount of Fund expenses that were absorbed since inception of the Fund by K2 Advisors through such waivers and arrangements. The Board also considered the investment management services that the investment manager provides to the Cayman Subsidiary and the related fee waivers that were in place.
Consideration was also given to a comparative analysis in the Broadridge Section 15(c) Report of the investment management fee and total expense ratio of the Fund in comparison with those of a group of other funds selected by Lipper as its appropriate Lipper expense group. Lipper expense data is based upon information taken from the Fund’s most recent semi-annual report, which reflects historical asset levels that may be quite different from those currently existing, particularly in a period of market volatility.
In reviewing comparative costs, emphasis was given to the Fund’s contractual management fee in comparison with the contractual management fee that would have been charged by other funds within its Lipper expense group assuming they were similar in size to the Fund, as well as the actual total expenses of the
| 106 | Annual Report | franklintempleton.com |
FRANKLIN ALTERNATIVE STRATEGIES FUNDS
FRANKLIN K2 ALTERNATIVE STRATEGIES FUND
SHAREHOLDER INFORMATION
Fund in comparison with those of its Lipper expense group. The Lipper contractual management fee analysis includes administrative charges as being part of the management fee, and total expenses, for comparative consistency, are shown by Lipper for Fund Class A shares. The Fund’s contractual management fee rate was in the most expensive quintile of its Lipper expense group (both for the basic expense group and the expense group that only included sub-advised funds) and its total expenses were in the second-most expensive quintile of such group (both for the basic expense group and the expense group that only included sub-advised funds). Noting the factors and limitations noted above with respect to the Broadridge Section 15(c) Report and factors relating to the Fund’s operations, such as the quality and experience of K2 Advisors and the Sub-Advisors and the nature and quality of the services provided and to be provided by K2 Advisors and the Sub-Advisors, the Board found such comparative fees and expenses to be acceptable.
The trustees also reviewed the Profitability Study addressing profitability of Franklin Resources, Inc., from its overall U.S. fund business, as well as profitability to K2 Advisors and its affiliates, from providing investment management and other services to the Fund during the 12-month period ended September 30, 2016, the most recent fiscal year-end of Franklin Resources, Inc. The trustees reviewed the basis on which such reports are prepared and the cost allocation methodology utilized in the Profitability Study, it being recognized that allocation methodologies may each be reasonable while producing different results. In this respect, the Board noted that the reasonableness of the cost allocation methodologies was reviewed by independent accountants on an every other year basis.
The independent trustees met with management to discuss the Profitability Study. This included, among other things, a comparison of investment management income with investment management expenses of the Fund; comparison of underwriting revenues and expenses; the relative relationship of investment management and underwriting expenses; shareholder servicing profitability; economies of scale; and the relative contribution of the Fund to the profitability of K2 Advisors and its parent. In discussing the Profitability Study with the Board, K2 Advisors
stated its belief that the costs incurred in establishing the infrastructure necessary to operate the type of mutual fund operations conducted by it and its affiliates may not be fully reflected in the expenses allocated to the Fund in determining its profitability.
The Board also took into account management’s expenditures in improving shareholder services provided to the Fund, as well as the need to meet additional regulatory and compliance requirements resulting from the Sarbanes-Oxley Act, the Dodd-Frank Act and recent SEC and other regulatory requirements. The trustees also considered the extent to which K2 Advisors and the Sub-Advisors may derive ancillary benefits from Fund operations, including those derived from the allocation of Fund brokerage and the use of commission dollars to pay for research and other similar services.
Based upon their consideration of all these factors, the trustees determined that the level of profits realized by K2 Advisors and its affiliates in providing services to the Fund was not excessive in view of the nature, quality and extent of services provided. In addition, the Board noted that shareholders are able to redeem their Fund shares at any time if shareholders believe that Fund fees and expenses are too high or if they are dissatisfied with the performance of the Fund.
ECONOMIES OF SCALE. The Board considered economies of scale realized by K2 Advisors and its affiliates and the Sub-Advisors as the Fund grows larger and the extent to which they are shared with Fund shareholders, as for example, in the level of the investment management fees charged, in the quality and efficiency of services rendered and in increased capital commitments benefiting the Fund directly or indirectly. The Board also considered the fee waiver and expense limitation arrangement in effect, and the amount of Fund expenses that were absorbed since inception of the Fund by K2 Advisors through such waiver and arrangement. The Board concluded that economies of scale were deemed not to be a significant factor at that time in light of, among other matters, the fee waiver and expense limitation arrangement in effect and the fact that the Fund had less than four complete years of operating results.
| franklintempleton.com | Annual Report | 107 |
FRANKLIN ALTERNATIVE STRATEGIES FUNDS
FRANKLIN K2 ALTERNATIVE STRATEGIES FUND
SHAREHOLDER INFORMATION
Proxy Voting Policies and Procedures
The Fund’s investment manager has established Proxy Voting Policies and Procedures (Policies) that the Fund uses to determine how to vote proxies relating to portfolio securities. Shareholders may view the Fund’s complete Policies online at franklintempleton.com. Alternatively, shareholders may request copies of the Policies free of charge by calling the Proxy Group collect at (954) 527-7678 or by sending a written request to: Franklin Templeton Companies, LLC, 300 S.E. 2nd Street, Fort Lauderdale, FL 33301, Attention: Proxy Group. Copies of the Fund’s proxy voting records are also made available online at franklintempleton.com and posted on the U.S. Securities and Exchange Commission’s website at sec.gov and reflect the most recent 12-month period ended June 30.
Quarterly Statement of Investments
The Trust, on behalf of the Fund, files a complete statement of investments with the U.S. Securities and Exchange Commission for the first and third quarters for each fiscal year on Form N-Q. Shareholders may view the filed Form N-Q by visiting the Commission’s website at sec.gov. The filed form may also be viewed and copied at the Commission’s Public Reference Room in Washington, DC. Information regarding the operations of the Public Reference Room may be obtained by calling (800) SEC-0330.
Householding of Reports and Prospectuses
You will receive the Fund’s financial reports every six months as well as an annual updated summary prospectus (prospectus available upon request). To reduce Fund expenses, we try to identify related shareholders in a household and send only one copy of the financial reports and summary prospectus. This process, called “householding,” will continue indefinitely unless you instruct us otherwise. If you prefer not to have these documents householded, please call us at (800) 632-2301. At any time you may view current prospectuses/summary prospectuses and financial reports on our website. If you choose, you may receive these documents through electronic delivery.
| 108 | Annual Report | franklintempleton.com |

Annual Report and Shareholder Letter
Franklin K2 Alternative Strategies Fund
Investment Manager
K2/D&S Management Co., L.L.C.
Distributor
Franklin Templeton Distributors, Inc.
(800) DIAL BEN® / 342-5236
franklintempleton.com
Shareholder Services
(800) 632-2301
Authorized for distribution only when accompanied or preceded by a summary prospectus and/or prospectus. Investors should carefully consider a fund’s investment goals, risks, charges and expenses before investing. A prospectus contains this and other information; please read it carefully before investing.
To help ensure we provide you with quality service, all calls to and from our service areas are monitored and/or recorded.
| © 2017 Franklin Templeton Investments. All rights reserved. | 068 A 07/17 |
| Annual Report and Shareholder Letter
May 31, 2017 |

Franklin Pelagos Commodities Strategy Fund
A SERIES OF FRANKLIN ALTERNATIVE STRATEGIES FUNDS
|

Sign up for electronic delivery at franklintempleton.com/edelivery
Franklin Templeton Investments
Gain From Our Perspective®
At Franklin Templeton Investments, we’re dedicated to one goal: delivering exceptional asset management for our clients. By bringing together multiple, world-class investment teams in a single firm, we’re able to offer specialized expertise across styles and asset classes, all supported by the strength and resources of one of the world’s largest asset managers. This has helped us to become a trusted partner to individual and institutional investors across the globe.
Dear Fellow Shareholder:
During the 12 months ended May 31, 2017, mostly upbeat economic data, improved U.S. corporate earnings and generally supportive monetary policies were positives for the securities markets. After maintaining its target interest rate in the 0.25%–0.50% range for nearly a year, the U.S. Federal Reserve (Fed) increased its target range for the federal funds rate twice, in December 2016 and March 2017, to 0.75%–1.00%. In this environment, U.S. stocks, as measured by the Standard & Poor’s® 500 Index, generated a +17.47% total return for the 12-month period.1 Commodities, as measured by the Bloomberg Commodity Index, had a -2.45% total return during the 12-month period, hindered by falling energy and agricultural commodity prices.1
A couple of weeks after the end of the reporting period, the Fed raised its target range a quarter point to 1.00%–1.25%. Despite low inflation, the Fed made this decision amid signs of a strengthening labor market and moderately rising economic activity.
In all economic environments, we are committed to our long-term perspective and disciplined investment approach as we conduct a diligent, fundamental analysis of securities with a regular emphasis on investment risk management.
We believe active, professional investment management serves investors well. We also recognize the important role of financial advisors in today’s markets and encourage investors to continue to seek their advice. Amid changing markets and economic conditions, we are confident investors with a
well-diversified portfolio and a patient, long-term outlook should be well positioned for the years ahead.
In addition, Franklin Pelagos Commodities Strategy Fund’s annual report includes more detail about prevailing conditions and a discussion about investment decisions during the period. Please remember all securities markets fluctuate, as do mutual fund share prices.
We thank you for investing with Franklin Templeton, welcome your questions and comments, and look forward to continuing to serve your investment needs.
Sincerely,

William Y. Yun, CFA
President and Chief Executive Officer –
Investment Management
Franklin Alternative Strategies Funds
This letter reflects our analysis and opinions as of May 31, 2017, unless otherwise indicated. The information is not a complete analysis of every aspect of any market, country, industry, security or fund. Statements of fact are from sources considered reliable.
CFA® is a trademark owned by CFA Institute.
1. Source: Morningstar.
See www.franklintempletondatasources.com for additional data provider information.
| Not FDIC Insured | | | May Lose Value | | | No Bank Guarantee |
| franklintempleton.com | Not part of the annual report | 1 | ||||
Visit franklintempleton.com for fund updates, to access your account, or to find helpful financial planning tools.
2 | Annual Report | franklintempleton.com | ||
Franklin Pelagos Commodities Strategy Fund
This annual report for Franklin Pelagos Commodities Strategy Fund covers the fiscal year ended May 31, 2017.
Your Fund’s Goal and Main Investments
The Fund seeks long-term total return by providing exposure to the commodities markets. It invests mainly in commodity-linked derivative instruments and securities of the U.S. government, its agencies and instrumentalities and other fixed income securities.
Performance Overview
The Fund’s Class A shares had a -5.41% cumulative total return for the 12 months under review. In comparison, the benchmark Bloomberg Commodity Index, which measures performance of exchange-traded futures contracts on physical commodities, had a -2.45% total return for the same period.1 You can find more of the Fund’s performance data in the Performance Summary beginning on page 7.
Performance data represent past performance, which does not guarantee future results. Investment return and principal value will fluctuate, and you may have a gain or loss when you sell your shares. Current performance may differ from figures shown. For most recent month-end performance, go to franklintempleton.com or call (800) 342-5236.
What is a futures contract?
|
| A futures contract is an agreement between the Fund and a counterparty made through a U.S. or foreign futures exchange to buy or sell an underlying instrument or asset at a specific price on a future date. |
Economic and Market Overview
The U.S. economy expanded during the 12 months under review. The economy strengthened in 2016’s third quarter, but moderated in the next two quarters, largely due to declines in private inventory investment and government spending. The manufacturing sector
generally expanded, and the services sector also continued to grow. The unemployment rate decreased from 4.7% in May 2016 to 4.3% at period-end.2 Monthly retail sales were volatile, but grew during most of the period. Annual inflation, as measured by the Consumer Price Index, increased from 1.0% to 1.9% during the period.
After maintaining its target interest rate in the 0.25%–0.50% range for nearly a year, the U.S. Federal Reserve (Fed), at its December 2016 meeting, increased its target range for the federal funds rate to 0.50%–0.75%, as policymakers noted improvement in the U.S. labor market and rising but still low inflation levels. The Fed, at its March 2017 meeting, made the widely anticipated increase in its federal funds target rate to 0.75%–1.00%. Following a weak batch of data releases in April, the Fed, at its May meeting, kept its interest rate unchanged. However, the committee members viewed the recent economic slowdown as transitory, increasing market expectations of a rate hike at its June meeting.
U.S. equity markets rose during the period, benefiting from mostly upbeat economic data, better U.S. corporate earnings and signs of improvement in the Chinese and European economies. Ongoing expansionary monetary policies from key central banks, investor optimism arising from pro-growth and pro-business policy plans in the U.S., and the victory of Emmanuel Macron as France’s President also helped U.S. equities. However, the U.K.’s historic vote to leave the European Union (also known as “Brexit”), global growth concerns and geopolitical tensions in the Middle East and Korean peninsula weighed on market sentiment. In mid-May, U.S. equities declined due to escalating political uncertainty and investors’ concerns surrounding President Trump’s ability to deliver on a reform agenda. The broad U.S. stock market, as measured by the Standard & Poor’s® 500 Index, generated a +17.47% total return for the period.1
Commodity prices, as measured by the Bloomberg Commodity Index, delivered a negative return during the period. Oil prices were mostly volatile, but rose toward the end of 2016 after
1. Source: Morningstar.
The index is unmanaged and includes reinvestment of any income or distributions. It does not reflect any fees, expenses or sales charges. One cannot invest directly in an index, and an index is not representative of the Fund’s portfolio.
2. Source: Bureau of Labor Statistics.
See www.franklintempletondatasources.com for additional data provider information.
The dollar value, number of shares or principal amount, and names of all portfolio holdings are listed in the Fund’s Consolidated Statement of Investments (SOI). The Consolidated SOI begins on page 16.
| franklintempleton.com | Annual Report | 3 | ||
FRANKLIN PELAGOS COMMODITIES STRATEGY FUND
members of the Organization of the Petroleum Exporting Countries (OPEC) reached a consensus on reductions in crude output in an effort to ease record inventories and stabilize the market. Oil prices declined during 2017 as rising crude production in the U.S. threatened to offset the continuing effort to reduce global stockpiles. In addition, gold and metal prices fell during the period’s first half, as orderly U.S. election results and expectations of an interest-rate hike led investors to rotate out of safe haven assets in favor of investments typically geared for a cyclical upswing in economic activity. Gold prices mostly rose in 2017, on an uptick in safe-haven demand, largely driven by political worries in the U.S. and Europe. Among agricultural commodities, corn, wheat, soybeans and sugar declined by value.
Investment Strategy
We utilize an actively managed fundamental and quantitative investment process to provide exposure to a variety of commodity sectors and indexes by investing in commodity-linked derivative instruments including commodity-linked total return swaps, commodity futures, commodity index futures and options on commodity futures and commodity index futures, which may provide exposure to foreign and emerging markets. By investing in these derivative instruments, we seek to gain exposure to the returns of real assets that trade in the commodities markets without direct investment in physical commodities. Real assets include such things as industrial and precious metals, gas, oil, livestock, agricultural or meat products and other items.
What is a swap agreement?
|
| A swap agreement, such as a commodity-linked total return swap, is a contract between the Fund and a counterparty to exchange on a future date the returns, or differentials in return, that would have been earned or realized if a notional amount were invested in specific instruments. |
What is an option?
|
| An option is a contract to buy or sell a specific financial product known as the option’s underlying instrument at a specific price. The buyer of an option has the right, but not the obligation, to buy or sell the underlying instrument at or until a specified expiration date. Conversely, the seller (“writer”) of an option who opens a transaction is obligated to buy or sell the underlying instrument should the option holder exercise that right. |
Portfolio Composition
5/31/17
| % of Consolidated | ||||
| Net Assets | ||||
U.S. Treasury Bill | 64.8% | |||
U.S. Treasury Note | 18.1% | |||
FFCB | 7.9% | |||
FHLMC | 7.9% | |||
FHLB | 1.4% | |||
Other Assets, less Liabilities** | -0.1% | |||
See Abbreviations on page 33.
*Portfolio composition figures are stated as a percentage of total and may not equal 100% or may be negative due to rounding, use of any derivatives, unsettled trades or other factors.
**Includes unrealized appreciation/depreciation on open futures contracts, as well as other assets and liabilities. See supplementary commodity exposure tables on page 5 for additional information related to the Fund’s economic exposure to commodities.
Manager’s Discussion
During its fiscal year, the Fund obtained its commodities exposure through swaps on commodities indexes and through commodities futures and options on commodities futures. These exposures were supported with U.S. Treasury bills and other fixed income securities.
During the period, commodity sector returns for the Fund’s benchmark were mixed. Industrial metals returns were positive and outperformed precious metals, and livestock sector returns were positive, driven by strong returns for cattle. However, returns in energy were negative, as were returns from agriculture. Overall contributions to Fund returns came largely from industrial metals, whereas agriculture was a significant detractor. In livestock, cattle contributed to Fund returns but lean hogs detracted, resulting in a negative contribution for the sector. There were divergences in commodity sector returns for the Fund’s benchmark that were not captured by the Fund’s active management, and the Fund lagged its benchmark over the period. The Fund’s positions in metals, energy and livestock hindered relative returns, while agriculture aided relative performance. Relative returns for metals and energy were hurt by silver, nickel and petroleum positioning over the period, and positive relative returns for agriculture were limited by agriculture positioning in 2016’s third quarter.
Industrial metals posted strong returns over the period due to supply issues. Physical markets for copper and zinc were indicated as tight through the lens of treatment charges to smelters and refiners for processing concentrates. Output reduction, whether planned or unplanned, was the dominant theme in industrial metals markets. Labor issues were underscored by disputes and ensuing disruption at the world’s top two copper mines. Additionally, market sentiment priced in
4 | Annual Report | franklintempleton.com | ||
FRANKLIN PELAGOS COMMODITIES STRATEGY FUND
enthusiasm for major infrastructure projects in the U.S. and Asia. Precious metals returns were positive over the period, with the exception of platinum, but lagged the returns of most industrial metals. Total known exchange-traded vehicle holdings of gold and silver increased over the period with those of silver outpacing gold, as silver is more tied to industrial use than gold.
Within the energy sector, the petroleum subsector posted negative returns as West Texas Intermediate crude oil futures traded in a $16 per barrel range from lows below $40 to highs above $55 per barrel. The central storyline behind the price action was posturing on production by OPEC and Russia. Oil prices declined after OPEC’s summer of 2016 meeting ended with no production deal. In September, OPEC informally agreed to an Algerian proposal to limit production and an official meeting in November gave formal agreement to OPEC and non-OPEC production limits. The agreement sent crude oil to its highs in January and a subsequent lack of meaningful oil inventory declines brought selling pressure. The debate around an extension of the production agreement continued over the remainder of the period and prices fluctuated as a result. Against this backdrop, the oil rig count in the U.S. increased meaningfully in response to higher prices set after the agreement. In the U.S. natural gas market, the seasonal supply and demand balance was trending in a supportive direction for prices until a historically warm winter changed the fundamental environment and put a cap on prices.
Agriculture returns were largely negative over the period with the exception of cotton. Near-ideal growing conditions for U.S. crops produced record crops of corn and soybeans and much of the pain was felt in 2016’s third quarter which brought more relative selling for soybeans than corn, from a total return perspective. Record soybean production in Brazil also weighed on prices. Cotton prices were higher as the stocks-to-use metric for China continued to fall from 2014 and 2015 levels and U.S. exports of cotton were above their five-year average. Profit margins for beef packers, which were above seasonal averages for much of the reporting period, combined with increased buying pressure in futures contracts to result in higher price levels for cattle contracts.
Fund Exposure to Commodities
The following table summarizes the Fund’s economic exposure to commodities derived through its investment in commodity-linked total return swap contracts. At May 31, 2017, the Fund’s exposure based on notional value represented 80.4% of consolidated net assets.
Commodity-Linked Total Return Swap Exposure*
| % of Consolidated Net Assets | ||||
| Long | ||||
Gold | 12.3% | |||
Copper | 7.8% | |||
Soybeans | 7.4% | |||
Aluminum | 5.2% | |||
Soybean Meal | 4.7% | |||
Live Cattle | 4.3% | |||
Natural Gas | 3.9% | |||
Corn | 3.9% | |||
Unleaded Gasoline | 3.8% | |||
Heating Oil | 3.5% | |||
Wheat | 3.5% | |||
Zinc | 2.7% | |||
Lean Hogs | 2.7% | |||
Soybean Oil | 2.6% | |||
Sugar | 2.5% | |||
Nickel | 2.3% | |||
Coffee | 2.3% | |||
WTI Crude Oil | 1.9% | |||
Brent Crude Oil | 1.9% | |||
Kansas Wheat | 1.2% | |||
*Figures are stated as a percentage of total and may not equal 100% or may be negative due to rounding, use of any derivatives, unsettled trades or other factors. The Fund’s exposure was calculated using the commodity sector weightings of the FP Custom Master Index multiplied by the Fund’s percentage notional exposure.
The following table summarizes the Fund’s economic exposure to commodities derived through its investment in futures contracts. At May 31, 2017, the Fund’s exposure based on notional value represented 19.2% of consolidated net assets.
Commodity Futures Exposure*
| % of Consolidated Net Assets | ||||
| Long | ||||
WTI Crude Oil | 9.5% | |||
Brent Crude Oil | 5.3% | |||
Gold | 4.4% | |||
*Figures are stated as a percentage of total and may not equal 100% or may be negative due to rounding, use of any derivatives, unsettled trades or other factors.
| franklintempleton.com | Annual Report | 5 | ||
FRANKLIN PELAGOS COMMODITIES STRATEGY FUND
As fellow shareholders, we were disappointed with the Fund’s performance in the recent challenging environment for commodities. However, we remain committed to our active investment process and long-term perspective, keeping in mind that volatility is not uncommon for commodities markets. Thank you for your participation in Franklin Pelagos Commodities Strategy Fund. We look forward to continuing to serve your financial needs.
 |
Stephen P. Burke | |
 |
John C. Pickart, CFA | |
| Wayne D. Ryan, CAIA | ||
| Portfolio Management Team | ||


The foregoing information reflects our analysis, opinions and portfolio holdings as of May 31, 2017, the end of the reporting period. The way we implement our main investment strategies and the resulting portfolio holdings may change depending on factors such as market and economic conditions. These opinions may not be relied upon as investment advice or an offer for a particular security. The information is not a complete analysis of every aspect of any market, country, industry, security or the Fund. Statements of fact are from sources considered reliable, but the investment manager makes no representation or warranty as to their completeness or accuracy. Although historical performance is no guarantee of future results, these insights may help you understand our investment management philosophy.
6 | Annual Report | franklintempleton.com | ||
FRANKLIN PELAGOS COMMODITIES STRATEGY FUND
Performance Summary as of May 31, 2017
The performance table and graphs do not reflect any taxes that a shareholder would pay on Fund dividends, capital gain distributions, if any, or any realized gains on the sale of Fund shares. Total return reflects reinvestment of the Fund’s dividends and capital gain distributions, if any, and any unrealized gains or losses. Your dividend income will vary depending on dividends or interest paid by securities in the Fund’s portfolio, adjusted for operating expenses of each class. Capital gain distributions are net profits realized from the sale of portfolio securities.
Performance as of 5/31/171
Cumulative total return excludes sales charges. Average annual total return includes maximum sales charges. Sales charges will vary depending on the size of the investment and the class of share purchased. The maximum is 5.75% and the minimum is 0%. Class A: 5.75% maximum initial sales charge; Advisor Class: no sales charges. For other share classes, visit franklintempleton.com.
| Cumulative | Average Annual | |||||||||||
| Share Class | Total Return2 | Total Return3 | ||||||||||
A | ||||||||||||
1-Year | -5.41% | -10.79% | ||||||||||
3-Year | -35.17% | -15.15% | ||||||||||
Since Inception (1/10/14) | -31.08% | -11.96% | ||||||||||
Advisor | ||||||||||||
1-Year | -5.15% | -5.15% | ||||||||||
5-Year | -31.58% | -7.31% | ||||||||||
Since Inception (12/7/11) | -37.40% | -8.19% | ||||||||||
Performance data represent past performance, which does not guarantee future results. Investment return and principal value will fluctuate, and you may have a gain or loss when you sell your shares. Current performance may differ from figures shown. For most recent month-end performance, go to franklintempleton.com or call (800) 342-5236.
See page 9 for Performance Summary footnotes.
| franklintempleton.com | Annual Report | 7 | ||
FRANKLIN PELAGOS COMMODITIES STRATEGY FUND
PERFORMANCE SUMMARY
Total Return Index Comparison for a Hypothetical $10,000 Investment1
Total return represents the change in value of an investment over the periods shown. It includes any applicable maximum sales charge, Fund expenses, account fees and reinvested distributions. The unmanaged index includes reinvestment of any income or distributions. It differs from the Fund in composition and does not pay management fees or expenses. One cannot invest directly in an index.
Class A (1/10/14–5/31/17)
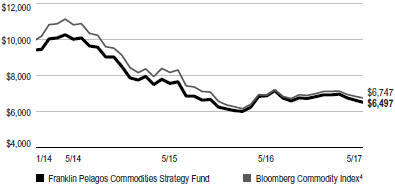
Advisor Class (12/7/11–5/31/17)
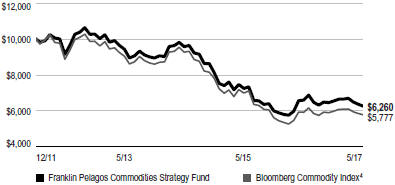
See page 9 for Performance Summary footnotes.
8 | Annual Report | franklintempleton.com | ||
FRANKLIN PELAGOS COMMODITIES STRATEGY FUND
PERFORMANCE SUMMARY
Total Annual Operating Expenses5
| Share Class | With Waiver | Without Waiver | ||||||
A | 1.20% | 2.34% | ||||||
Advisor | 0.95% | 2.09% | ||||||
Each class of shares is available to certain eligible investors and has different annual fees and expenses, as described in the prospectus.
All investments involve risks, including possible loss of principal. Investing in physical commodities, either directly or through derivative instruments such as commodity-linked total return swaps, commodity futures, commodity index futures and options on commodity futures and commodities index futures, presents unique risks, is speculative and can be extremely volatile. Market prices of commodities may fluctuate rapidly based on numerous factors, including: changes in supply and demand relationships; weather; agriculture; trade; domestic and foreign political and economic events and policies; diseases; pestilence; technological developments; currency exchange rate fluctuations; and monetary and other governmental policies, action and inaction. Derivative instruments involve costs and can create leverage in the Fund’s portfolio, which may result in significant volatility and cause the Fund to participate in losses (as well as gains) in an amount that significantly exceeds the Fund’s initial investment. The Fund may not achieve the anticipated benefits and may realize losses, which could be significant. Bond prices generally move in the opposite direction of interest rates. Thus, as prices of bonds in the Fund adjust to a rise in interest rates, the Fund’s share price may decline. Foreign investing carries additional risks such as currency and market volatility and political, social and economic instability, risks which are heightened in less developed or emerging market countries. The Fund is actively managed but there is no guarantee that the manager’s investment decisions will produce the desired results. The Fund’s prospectus also includes a description of the main investment risks.
1. The Fund has an expense reduction contractually guaranteed through 9/30/17 and a fee waiver related to the management fee paid by a subsidiary. The Fund also has a fee waiver associated with any investments it makes in a Franklin Templeton money fund and/or other Franklin Templeton fund, contractually guaranteed through 9/30/17. Fund investment results reflect the expense reduction and fee waivers; without these reductions, the results would have been lower.
2. Cumulative total return represents the change in value of an investment over the periods indicated.
3. Average annual total return represents the average annual change in value of an investment over the periods indicated. Return for less than one year, if any, has not been annualized.
4. Source: Morningstar. The Bloomberg Commodity Index comprises exchange-traded futures on physical commodities, which are weighted to account for economic significance and market liquidity.
5. Figures are as stated in the Fund’s current prospectus and may differ from the expense ratios disclosed in the Your Fund’s Expenses and Consolidated Financial Highlights sections in this report. In periods of market volatility, assets may decline significantly, causing total annual Fund operating expenses to become higher than the figures shown. See www.franklintempletondatasources.com for additional data provider information.
| franklintempleton.com | Annual Report | 9 | ||
FRANKLIN PELAGOS COMMODITIES STRATEGY FUND
As a Fund shareholder, you can incur two types of costs: (1) transaction costs, including sales charges (loads) on Fund purchases and redemptions; and (2) ongoing Fund costs, including management fees, distribution and service (12b-1) fees, and other Fund expenses. All mutual funds have ongoing costs, sometimes referred to as operating expenses. The table below shows ongoing costs of investing in the Fund and can help you understand these costs and compare them with those of other mutual funds. The table assumes a $1,000 investment held for the six months indicated.
Actual Fund Expenses
The table below provides information about actual account values and actual expenses in the columns under the heading “Actual.” In these columns the Fund’s actual return, which includes the effect of Fund expenses, is used to calculate the “Ending Account Value” for each class of shares. You can estimate the expenses you paid during the period by following these steps (of course, your account value and expenses will differ from those in this illustration): Divide your account value by $1,000 (if your account had an $8,600 value, then $8,600 ÷ $1,000 = 8.6). Then multiply the result by the number in the row for your class of shares under the headings “Actual” and “Expenses Paid During Period” (if Actual Expenses Paid During Period were $7.50, then 8.6 x $7.50 = $64.50). In this illustration, the actual expenses paid this period are $64.50.
Hypothetical Example for Comparison with Other Funds
Under the heading “Hypothetical” in the table, information is provided about hypothetical account values and hypothetical expenses based on the Fund’s actual expense ratio and an assumed rate of return of 5% per year before expenses, which is not the Fund’s actual return. This information may not be used to estimate the actual ending account balance or expenses you paid for the period, but it can help you compare ongoing costs of investing in the Fund with those of other funds. To do so, compare this 5% hypothetical example for the class of shares you hold with the 5% hypothetical examples that appear in the shareholder reports of other funds.
Please note that expenses shown in the table are meant to highlight ongoing costs and do not reflect any transactional costs. Therefore, information under the heading “Hypothetical” is useful in comparing ongoing costs only, and will not help you compare total costs of owning different funds. In addition, if transactional costs were included, your total costs would have been higher.
| Actual | Hypothetical | |||||||||||||||||
| (actual return after expenses) | (5% annual return before expenses) | |||||||||||||||||
|
| |||||||||||||||||
| Expenses | Expenses | Net | ||||||||||||||||
| Beginning | Ending | Paid During | Ending | Paid During | Annualized | |||||||||||||
| Share | Account | Account | Period | Account | Period | Expense | ||||||||||||
| Class | Value 12/1/16 | Value 5/31/17 | 12/1/16–5/31/171,2 | Value 5/31/17 | 12/1/16–5/31/171,2 | Ratio2 | ||||||||||||
|
|
|
| |||||||||||||||
| A | $1,000 | $953.30 | $5.84 | $1,018.95 | $6.04 | 1.20% | ||||||||||||
| C | $1,000 | $950.60 | $9.48 | $1,015.21 | $9.80 | 1.95% | ||||||||||||
| R | $1,000 | $951.50 | $6.71 | $1,018.05 | $6.94 | 1.38% | ||||||||||||
| R6 | $1,000 | $955.40 | $3.32 | $1,021.54 | $3.43 | 0.68% | ||||||||||||
| Advisor | $1,000 | $955.70 | $4.63 | $1,020.19 | $4.78 | 0.95% | ||||||||||||
1. Expenses are equal to the annualized expense ratio for the six-month period as indicated above–in the far right column–multiplied by the simple average account value over the period indicated, and then multiplied by 182/365 to reflect the one-half year period.
2. Reflects expenses after fee waivers and expense reimbursements. Does not include acquired fund fees and expenses.
10 | Annual Report | franklintempleton.com | ||
FRANKLIN ALTERNATIVE STRATEGIES FUNDS
Consolidated Financial Highlights
Franklin Pelagos Commodities Strategy Fund
| Year Ended May 31, | ||||||||||||||||
| 2017 | 2016 | 2015 | 2014a | |||||||||||||
Class A | ||||||||||||||||
Per share operating performance | ||||||||||||||||
(for a share outstanding throughout the year) | ||||||||||||||||
Net asset value, beginning of year | $ 6.47 | $ 7.12 | $ 9.44 | $ 8.88 | ||||||||||||
Income from investment operationsb: | ||||||||||||||||
Net investment income (loss)c | (0.04) | (0.08) | (0.09) | (0.08) | ||||||||||||
Net realized and unrealized gains (losses) | (0.31) | (0.57) | (2.23) | 0.64 | ||||||||||||
Total from investment operations | (0.35) | (0.65) | (2.32) | 0.56 | ||||||||||||
Net asset value, end of year | $ 6.12 | $ 6.47 | $ 7.12 | $ 9.44 | ||||||||||||
Total returnd | (5.41)% | (9.13)% | (24.58)% | 6.31% | ||||||||||||
Ratios to average net assetse | ||||||||||||||||
Expenses before waiver and payments by affiliates and expense reduction | 1.71% | 2.14% | 2.05% | 3.38% | ||||||||||||
Expenses net of waiver and payments by affiliates and expense reductionf | 1.20% | 1.21% | 1.25% | 1.25% | ||||||||||||
Net investment income (loss) | (0.61)% | (0.79)% | (0.94)% | (0.94)% | ||||||||||||
Supplemental data | ||||||||||||||||
Net assets, end of year (000’s) | $4,846 | $3,814 | $2,080 | $601 | ||||||||||||
Portfolio turnover rate | 42.22% | 28.03% | 62.10% | 34.28% | ||||||||||||
aFor the period January 10, 2014 (commencement of operations) to May 31, 2014.
bThe amount shown for a share outstanding throughout the period may not correlate with the Consolidated Statement of Operations for the period due to the timing of sales and repurchases of the Fund’s shares in relation to income earned and/or fluctuating fair value of the investments of the Fund.
cBased on average daily shares outstanding.
dTotal return does not reflect sales commissions or contingent deferred sales charges, if applicable, and is not annualized for periods less than one year.
eRatios are annualized for periods less than one year.
fBenefit of expense reduction rounds to less than 0.01%.
| franklintempleton.com | The accompanying notes are an integral part of these consolidated financial statements. | Annual Report | 11 | ||
FRANKLIN ALTERNATIVE STRATEGIES FUNDS
CONSOLIDATED FINANCIAL HIGHLIGHTS
Franklin Pelagos Commodities Strategy Fund (continued)
| Year Ended May 31, | ||||||||||||||||
| 2017 | 2016 | 2015 | 2014a | |||||||||||||
Class C | ||||||||||||||||
Per share operating performance | ||||||||||||||||
(for a share outstanding throughout the year) | ||||||||||||||||
Net asset value, beginning of year | $ 6.36 | $ 7.05 | $ 9.41 | $ 8.88 | ||||||||||||
Income from investment operationsb: | ||||||||||||||||
Net investment income (loss)c | (0.10) | (0.16) | (0.15) | (0.09) | ||||||||||||
Net realized and unrealized gains (losses) | (0.29) | (0.53) | (2.21) | 0.62 | ||||||||||||
Total from investment operations | (0.39) | (0.69) | (2.36) | 0.53 | ||||||||||||
Net asset value, end of year | $ 5.97 | $ 6.36 | $ 7.05 | $ 9.41 | ||||||||||||
Total returnd | (6.13)% | (9.79)% | (25.08)% | 5.97% | ||||||||||||
Ratios to average net assetse | ||||||||||||||||
Expenses before waiver and payments by affiliates and expense reduction | 2.46% | 2.88% | 2.75% | 4.08% | ||||||||||||
Expenses net of waiver and payments by affiliates and expense reductionf | 1.95% | 1.95% | 1.95% | 1.95% | ||||||||||||
Net investment income (loss) | (1.36)% | (1.53)% | (1.64)% | (1.64)% | ||||||||||||
Supplemental data | ||||||||||||||||
Net assets, end of year (000’s) | $963 | $862 | $377 | $60 | ||||||||||||
Portfolio turnover rate | 42.22% | 28.03% | 62.10% | 34.28% | ||||||||||||
aFor the period January 10, 2014 (commencement of operations) to May 31, 2014.
bThe amount shown for a share outstanding throughout the period may not correlate with the Consolidated Statement of Operations for the period due to the timing of sales and repurchases of the Fund’s shares in relation to income earned and/or fluctuating fair value of the investments of the Fund.
cBased on average daily shares outstanding.
dTotal return does not reflect sales commissions or contingent deferred sales charges, if applicable, and is not annualized for periods less than one year.
eRatios are annualized for periods less than one year.
fBenefit of expense reduction rounds to less than 0.01%.
12 | Annual Report | The accompanying notes are an integral part of these consolidated financial statements. | franklintempleton.com | ||
FRANKLIN ALTERNATIVE STRATEGIES FUNDS
CONSOLIDATED FINANCIAL HIGHLIGHTS
Franklin Pelagos Commodities Strategy Fund (continued)
| Year Ended May 31, | ||||||||||||||||
| 2017 | 2016 | 2015 | 2014a | |||||||||||||
Class R | ||||||||||||||||
Per share operating performance | ||||||||||||||||
(for a share outstanding throughout the year) | ||||||||||||||||
Net asset value, beginning of year | $ 6.44 | $ 7.10 | $ 9.44 | $ 8.88 | ||||||||||||
Income from investment operationsb: | ||||||||||||||||
Net investment income (loss)c | (0.05) | (0.06) | (0.10) | (0.06) | ||||||||||||
Net realized and unrealized gains (losses) | (0.31) | (0.60) | (2.24) | 0.62 | ||||||||||||
Total from investment operations | (0.36) | (0.66) | (2.34) | 0.56 | ||||||||||||
Net asset value, end of year | $ 6.08 | $ 6.44 | $ 7.10 | $ 9.44 | ||||||||||||
Total returnd | (5.59)% | (9.30)% | (24.79)% | 6.31% | ||||||||||||
Ratios to average net assetse | ||||||||||||||||
Expenses before waiver and payments by affiliates and expense reduction | 1.85% | 2.34% | 2.27% | 3.58% | ||||||||||||
Expenses net of waiver and payments by affiliates and expense reductionf | 1.34% | 1.41% | 1.47% | 1.45% | ||||||||||||
Net investment income (loss) | (0.75)% | (0.99)% | (1.16)% | (1.14)% | ||||||||||||
Supplemental data | ||||||||||||||||
Net assets, end of year (000’s) | $23 | $9 | $4 | $5 | ||||||||||||
Portfolio turnover rate | 42.22% | 28.03% | 62.10% | 34.28% | ||||||||||||
aFor the period January 10, 2014 (commencement of operations) to May 31, 2014.
bThe amount shown for a share outstanding throughout the period may not correlate with the Consolidated Statement of Operations for the period due to the timing of sales and repurchases of the Fund’s shares in relation to income earned and/or fluctuating fair value of the investments of the Fund.
cBased on average daily shares outstanding.
dTotal return is not annualized for periods less than one year.
eRatios are annualized for periods less than one year.
fBenefit of expense reduction rounds to less than 0.01%.
franklintempleton.com | The accompanying notes are an integral part of these consolidated financial statements. | Annual Report | 13 | ||
FRANKLIN ALTERNATIVE STRATEGIES FUNDS
CONSOLIDATED FINANCIAL HIGHLIGHTS
Franklin Pelagos Commodities Strategy Fund (continued)
| Year Ended May 31, | ||||||||||||||||
| 2017 | 2016 | 2015 | 2014a | |||||||||||||
Class R6 | ||||||||||||||||
Per share operating performance | ||||||||||||||||
(for a share outstanding throughout the year) | ||||||||||||||||
Net asset value, beginning of year | $ 6.53 | $ 7.16 | $ 9.46 | $ 8.88 | ||||||||||||
Income from investment operationsb: | ||||||||||||||||
Net investment income (loss)c | (0.01) | (0.02) | (0.04) | (0.03) | ||||||||||||
Net realized and unrealized gains (losses) | (0.31) | (0.61) | (2.26) | 0.61 | ||||||||||||
Total from investment operations | (0.32) | (0.63) | (2.30) | 0.58 | ||||||||||||
Net asset value, end of year | $ 6.21 | $ 6.53 | $ 7.16 | $ 9.46 | ||||||||||||
Total returnd | (4.90)% | (8.80)% | (24.31)% | 6.53% | ||||||||||||
Ratios to average net assetse | ||||||||||||||||
Expenses before waiver and payments by affiliates and expense reduction | 1.02% | 1.10% | 1.53% | 1.58% | ||||||||||||
Expenses net of waiver and payments by affiliates and expense reductionf | 0.70% | 0.76% | 0.86% | 0.86% | ||||||||||||
Net investment income (loss) | (0.11)% | (0.34)% | (0.55)% | (0.55)% | ||||||||||||
Supplemental data | ||||||||||||||||
Net assets, end of year (000’s) | $118,839 | $131,500 | $53,068 | $67,732 | ||||||||||||
Portfolio turnover rate | 42.22% | 28.03% | 62.10% | 34.28% | ||||||||||||
aFor the period January 10, 2014 (commencement of operations) to May 31, 2014.
bThe amount shown for a share outstanding throughout the period may not correlate with the Consolidated Statement of Operations for the period due to the timing of sales and repurchases of the Fund’s shares in relation to income earned and/or fluctuating fair value of the investments of the Fund.
cBased on average daily shares outstanding.
dTotal return is not annualized for periods less than one year.
eRatios are annualized for periods less than one year. fBenefit of expense reduction rounds to less than 0.01%.
14 | Annual Report | The accompanying notes are an integral part of these consolidated financial statements. | franklintempleton.com | ||
FRANKLIN ALTERNATIVE STRATEGIES FUNDS
CONSOLIDATED FINANCIAL HIGHLIGHTS
Franklin Pelagos Commodities Strategy Fund (continued)
| Year Ended May 31, | ||||||||||||||||||||
| 2017 | 2016 | 2015 | 2014 | 2013 | ||||||||||||||||
Advisor Class | ||||||||||||||||||||
Per share operating performance | ||||||||||||||||||||
(for a share outstanding throughout the year) | ||||||||||||||||||||
Net asset value, beginning of year | $ 6.60 | $ 7.25 | $ 9.58 | $ 9.43 | $ 9.15 | |||||||||||||||
Income from investment operationsa: | ||||||||||||||||||||
Net investment income (loss)b | (0.03) | (0.09) | (0.07) | (0.05) | (0.08) | |||||||||||||||
Net realized and unrealized gains (losses) | (0.31) | (0.56) | (2.26) | 0.20 | 0.36 | |||||||||||||||
Total from investment operations | (0.34) | (0.65) | (2.33) | 0.15 | 0.28 | |||||||||||||||
Less distributions from net investment income | — | — | — | — | (—) | c | ||||||||||||||
Net asset value, end of year. | $ 6.26 | $ 6.60 | $ 7.25 | $ 9.58 | $ 9.43 | |||||||||||||||
Total return | (5.15)% | (8.97)% | (24.32)% | 1.59% | 3.06% | |||||||||||||||
Ratios to average net assets | ||||||||||||||||||||
Expenses before waiver and payments by affiliates and expense reduction | 1.46% | 1.88% | 1.75% | 1.88% | 1.14% | |||||||||||||||
Expenses net of waiver and payments by affiliates and expense reduction | 0.95%d | 0.95%d | 0.95%d | 1.04%d | 1.10% | |||||||||||||||
Net investment income (loss) | (0.36)% | (0.53)% | (0.64)% | (0.70)% | (0.76)% | |||||||||||||||
Supplemental data | ||||||||||||||||||||
Net assets, end of year (000’s) | $2,062 | $675 | $248 | $126 | $107,853 | |||||||||||||||
Portfolio turnover rate | 42.22% | 28.03% | 62.10% | 34.28% | 21.47% | |||||||||||||||
aThe amount shown for a share outstanding throughout the period may not correlate with the Consolidated Statement of Operations for the period due to the timing of sales and repurchases of the Fund’s shares in relation to income earned and/or fluctuating fair value of the investments of the Fund.
bBased on average daily shares outstanding.
cAmount rounds to less than $0.01 per share.
dBenefit of expense reduction rounds to less than 0.01%.
franklintempleton.com | The accompanying notes are an integral part of these consolidated financial statements. | Annual Report | 15 | ||
FRANKLIN ALTERNATIVE STRATEGIES FUNDS
Consolidated Statement of Investments, May 31, 2017
Franklin Pelagos Commodities Strategy Fund
Principal
| Value
| |||||||||
U.S. Government and Agency Securities 33.9% | ||||||||||
FFCB, 0.96%, 7/27/18 | $10,000,000 | $ 9,969,150 | ||||||||
FHLMC, 1.25%, 7/26/19 | 10,000,000 | 9,934,810 | ||||||||
U.S. Treasury Note, 0.75%, 10/31/17 | 23,000,000 | 22,965,868 | ||||||||
|
| |||||||||
Total U.S. Government and Agency Securities (Cost $43,009,803) | 42,869,828 | |||||||||
|
| |||||||||
Number of
| ||||||||||
Options Purchased (Cost $376,619) 0.2% | ||||||||||
Puts - Exchange-Traded | ||||||||||
a | WTI Crude Oil, November Strike Price $45, Expires 11/15/17 | 131 | 280,340 | |||||||
|
| |||||||||
Total Investments before Short Term Investments (Cost $43,386,422) | 43,150,168 | |||||||||
|
| |||||||||
Principal
| ||||||||||
Short Term Investments 66.2% | ||||||||||
U.S. Government and Agency Securities 66.2% | ||||||||||
a ,b FHLB, 6/01/17 | $1,750,000 | 1,750,000 | ||||||||
b U.S. Treasury Bill, | 14,000,000 | 13,982,963 | ||||||||
7/20/17 | 23,000,000 | 22,973,596 | ||||||||
a,c10/12/17 | 33,500,000 | 33,379,936 | ||||||||
5/24/18 | 12,000,000 | 11,867,016 | ||||||||
|
| |||||||||
| Total U.S. Government and Agency Securities (Cost $83,998,273) | 83,953,511 | |||||||||
|
| |||||||||
| Total Investments (Cost $127,384,695) 100.3% | 127,103,679 | |||||||||
| Options Written (0.1)% | (176,850 | ) | ||||||||
| d Other Assets, less Liabilities (0.2)% | (194,711 | ) | ||||||||
|
| |||||||||
| Net Assets 100.0% | $126,732,118 | |||||||||
|
| |||||||||
Number of
| ||||||||||
e | Options Written (Premiums received $317,682) (0.1)% | |||||||||
Calls - Exchange-Traded | ||||||||||
a | WTI Crude Oil, November Strike Price $55, Expires 11/15/17 | 131 | (176,850 | ) | ||||||
|
| |||||||||
aA portion or all of the security is owned by FPC Holdings Corp., a wholly-owned subsidiary of the Fund. See Note 1(c).
bThe security was issued on a discount basis with no stated coupon rate.
cA portion or all of the security has been segregated as collateral for open futures contracts. At May 31, 2017, the value of this security and/or cash pledged amounted to $1,544,403, representing 1.2% of net assets.
dIncludes unrealized appreciation/depreciation on open commodity futures contracts, as well as other assets and liabilities.
eSee Note 1(b) regarding written options.
16 | Annual Report | franklintempleton.com | ||
FRANKLIN ALTERNATIVE STRATEGIES FUNDS
CONSOLIDATED STATEMENT OF INVESTMENTS
Franklin Pelagos Commodities Strategy Fund (continued)
At May 31, 2017, the Fund had the following futures contracts outstanding. See Note 1(b).
Futures Contractsa
| Number of | Notional | Expiration | Unrealized | Unrealized | ||||||||||||||||||||
| Description | Type | Contracts | Value | Date | Appreciation | Depreciation | ||||||||||||||||||
Commodity Contracts | ||||||||||||||||||||||||
Brent Crude Oil | Long | 131 | $ | 6,692,790 | 7/31/17 | $ | — | $ | (198,136 | ) | ||||||||||||||
Gold | Long | 44 | 5,611,760 | 8/29/17 | 16,183 | — | ||||||||||||||||||
WTI Crude Oil | Long | 95 | 4,590,400 | 6/20/17 | — | (571,989 | ) | |||||||||||||||||
WTI Crude Oil | Long | 151 | 7,417,120 | 11/20/17 | — | (88,976 | ) | |||||||||||||||||
|
|
|
| |||||||||||||||||||||
Total Futures Contracts | $ | 24,312,070 | $ | 16,183 | $ | (859,101 | ) | |||||||||||||||||
|
|
|
| |||||||||||||||||||||
Net unrealized appreciation (depreciation) | $ | (842,918 | ) | |||||||||||||||||||||
At May 31, 2017, the Fund had the following commodity-linked total return swap contracts outstanding. See Note 1(b).
Commodity-Linked Total Return Swap Contractsa
| Pay | Notional | Expiration | Unrealized | Unrealized | ||||||||||||||||||||
| Underlying Instruments | Fixed Rate | Counterparty | Value | Date | Appreciation | Depreciation | ||||||||||||||||||
OTC Swap Contracts | ||||||||||||||||||||||||
Long | ||||||||||||||||||||||||
FP Custom Master Indexb | 0.22% | MSCS | $ | 101,900,000 | 6/23/17 | $— | $— | |||||||||||||||||
aA portion or all of the contracts are owned by FPC Holdings Corp., a wholly-owned subsidiary of the Fund. See Note 1(c).
bRepresents a custom index comprised of a basket of underlying instruments. Additional information regarding the custom basket’s underlying instruments and their respective values including fees are as follows:
| Unrealized | Unrealized | |||||||||||||||
| Underlying Instruments | Notional Valuec | Appreciation | Depreciation | |||||||||||||
Bloomberg Commodity Aluminum Subindex 3 Month Forward | $ 6,623,500 | $ — | $ — | |||||||||||||
Bloomberg Commodity Brent Crude Oil Subindex | 2,343,700 | — | — | |||||||||||||
Bloomberg Commodity Coffee Subindex | 2,853,200 | — | — | |||||||||||||
Bloomberg Commodity Copper Subindex | 9,884,300 | — | — | |||||||||||||
Bloomberg Commodity Corn Subindex 3 Month Forward | 4,891,200 | — | — | |||||||||||||
Bloomberg Commodity Gold Subindex | 15,590,700 | — | — | |||||||||||||
Bloomberg Commodity Heating Oil Subindex 1 Month Forward | 4,483,600 | — | — | |||||||||||||
Bloomberg Commodity Kansas Wheat Subindex 3 Month Forward | 1,528,500 | — | — | |||||||||||||
Bloomberg Commodity Lean Hogs Subindex | 3,464,600 | — | — | |||||||||||||
Bloomberg Commodity Live Cattle Subindex | 5,400,700 | — | — | |||||||||||||
Bloomberg Commodity Natural Gas Subindex 1 Month Forward | 4,993,100 | — | — | |||||||||||||
Bloomberg Commodity Nickel Subindex 3 Month Forward | 2,955,100 | — | — | |||||||||||||
Bloomberg Commodity Soybean Meal Subindex | 6,012,100 | — | — | |||||||||||||
Bloomberg Commodity Soybean Oil Subindex | 3,260,800 | — | — | |||||||||||||
Bloomberg Commodity Soybeans Subindex | 9,374,800 | — | — | |||||||||||||
Bloomberg Commodity Sugar Subindex | 3,158,900 | — | — | |||||||||||||
Bloomberg Commodity Unleaded Gasoline Subindex 1 Month Forward | 4,789,300 | — | — | |||||||||||||
Bloomberg Commodity Wheat Subindex 3 Month Forward | 4,381,700 | — | — | |||||||||||||
Bloomberg Commodity WTI Crude Oil Subindex 1 Month Forward | 2,445,600 | — | — | |||||||||||||
Bloomberg Commodity Zinc Subindex. | 3,464,600 | — | — | |||||||||||||
|
|
|
| |||||||||||||
Total custom index | $101,900,000 | $ — | $ — | |||||||||||||
|
|
|
| |||||||||||||
| franklintempleton.com | Annual Report | 17 | ||
FRANKLIN ALTERNATIVE STRATEGIES FUNDS
CONSOLIDATED STATEMENT OF INVESTMENTS
Franklin Pelagos Commodities Strategy Fund (continued)
Commodity-Linked Total Return Swap Contractsa (continued)
cNotional value represents the fair value of each underlying instrument (including the financing rate fee which is calculated based on the custom swap contract’s original notional value of $101,900,000, allocated to each underlying instrument on a pro-rata basis).
See Abbreviations on page 33.
18 | Annual Report | The accompanying notes are an integral part of these consolidated financial statements. | franklintempleton.com | ||
FRANKLIN ALTERNATIVE STRATEGIES FUNDS
Consolidated Financial Statements
Consolidated Statement of Assets and Liabilities
May 31, 2017
Franklin Pelagos Commodities Strategy Fund
Assets: | ||||
Investments in securities: | ||||
Cost - Unaffiliated issuers | $127,384,695 | |||
|
| |||
Value - Unaffiliated issuers | $127,103,679 | |||
Cash | 2,154,247 | |||
Receivables: | ||||
Capital shares sold | 43,227 | |||
Interest | 90,387 | |||
Affiliates | 8,477 | |||
Other assets | 75 | |||
|
| |||
Total assets | 129,400,092 | |||
|
| |||
Liabilities: | ||||
Payables: | ||||
Capital shares redeemed | 32,516 | |||
Management fees | 38,789 | |||
Distribution fees | 1,833 | |||
Variation margin | 500,094 | |||
Options written, at value (premiums received $ 317,682) | 176,850 | |||
Due to brokers | 1,859,121 | |||
Accrued expenses and other liabilities | 58,771 | |||
|
| |||
Total liabilities | 2,667,974 | |||
|
| |||
Net assets, at value | $126,732,118 | |||
|
| |||
Net assets consist of: | ||||
Paid-in capital | $127,990,926 | |||
Accumulated net investment loss | (101,488 | ) | ||
Net unrealized appreciation (depreciation) | (983,102 | ) | ||
Accumulated net realized gain (loss) | (174,218 | ) | ||
|
| |||
Net assets, at value | $126,732,118 | |||
|
| |||
franklintempleton.com | The accompanying notes are an integral part of these consolidated financial statements. | Annual Report | 19 | ||
FRANKLIN ALTERNATIVE STRATEGIES FUNDS
CONSOLIDATED FINANCIAL STATEMENTS
Consolidated Statement of Assets and Liabilities (continued)
May 31, 2017
Franklin Pelagos Commodities Strategy Fund
Class A: | ||||
Net assets, at value | $ 4,845,778 | |||
|
| |||
Shares outstanding | 791,289 | |||
|
| |||
Net asset value per sharea | $6.12 | |||
|
| |||
Maximum offering price per share (net asset value per share ÷ 94.25%) | $6.49 | |||
|
| |||
Class C: | ||||
Net assets, at value | $ 963,039 | |||
|
| |||
Shares outstanding | 161,304 | |||
|
| |||
Net asset value and maximum offering price per sharea | $5.97 | |||
|
| |||
Class R: | ||||
Net assets, at value | $ 23,047 | |||
|
| |||
Shares outstanding | 3,789 | |||
|
| |||
Net asset value and maximum offering price per share | $6.08 | |||
|
| |||
Class R6: | ||||
Net assets, at value | $118,838,697 | |||
|
| |||
Shares outstanding | 19,126,925 | |||
|
| |||
Net asset value and maximum offering price per share | $6.21 | |||
|
| |||
Advisor Class: | ||||
Net assets, at value | $ 2,061,557 | |||
|
| |||
Shares outstanding | 329,330 | |||
|
| |||
Net asset value and maximum offering price per share | $6.26 | |||
|
|
aRedemption price is equal to net asset value less contingent deferred sales charges, if applicable.
20 | Annual Report | The accompanying notes are an integral part of these consolidated financial statements. | franklintempleton.com | ||
FRANKLIN ALTERNATIVE STRATEGIES FUNDS
CONSOLIDATED FINANCIAL STATEMENTS
Consolidated Statement of Operations
for the year ended May 31, 2017
Franklin Pelagos Commodities Strategy Fund
Investment income: | ||||
Dividends from non-controlled affiliates (Note 3f) | $ 2 | |||
Interest | 790,913 | |||
|
| |||
Total investment income | 790,915 | |||
|
| |||
Expenses: | ||||
Management fees (Note 3a) | 1,136,700 | |||
Distribution fees: (Note 3c) | ||||
Class A | 11,143 | |||
Class C | 10,296 | |||
Class R | 49 | |||
Transfer agent fees: (Note 3e) | ||||
Class A | 19,528 | |||
Class C | 4,513 | |||
Class R | 55 | |||
Class R6 | 60 | |||
Advisor Class. | 5,770 | |||
Custodian fees (Note 4) | 2,054 | |||
Reports to shareholders | 17,170 | |||
Registration and filing fees | 88,914 | |||
Professional fees | 54,182 | |||
Trustees’ fees and expenses | 48,191 | |||
Other | 15,026 | |||
|
| |||
Total expenses. | 1,413,651 | |||
Expense reductions (Note 4) | (803 | ) | ||
Expenses waived/paid by affiliates (Note 3f and 3g) | (441,975 | ) | ||
|
| |||
Net expenses. | 970,873 | |||
|
| |||
Net investment income (loss) | (179,958 | ) | ||
|
| |||
Realized and unrealized gains (losses): | ||||
Net realized gain (loss) from: | ||||
Investments | (271,402 | ) | ||
Written options | 256,385 | |||
Futures contracts | (118,989 | ) | ||
Swap contracts | (5,575,782 | ) | ||
|
| |||
Net realized gain (loss) | (5,709,788 | ) | ||
|
| |||
Net change in unrealized appreciation (depreciation) on: | ||||
Investments | (180,704 | ) | ||
Written options | 140,832 | |||
Futures contracts | (1,092,486 | ) | ||
Swap contracts | 346,898 | |||
|
| |||
Net change in unrealized appreciation (depreciation) | (785,460 | ) | ||
|
| |||
Net realized and unrealized gain (loss) | (6,495,248 | ) | ||
|
| |||
Net increase (decrease) in net assets resulting from operations | $(6,675,206 | ) | ||
|
| |||
| franklintempleton.com | The accompanying notes are an integral part of these consolidated financial statements. | Annual Report | 21 | ||
FRANKLIN ALTERNATIVE STRATEGIES FUNDS
CONSOLIDATED FINANCIAL STATEMENTS
Consolidated Statements of Changes in Net Assets
Franklin Pelagos Commodities Strategy Fund
| Year Ended May 31, | ||||||||
| 2017 | 2016 | |||||||
| ||||||||
Increase (decrease) in net assets: | ||||||||
Operations: | ||||||||
Net investment income (loss) | $ | (179,958 | ) | $ | (347,124 | ) | ||
Net realized gain (loss) | (5,709,788 | ) | (1,003,848 | ) | ||||
Net change in unrealized appreciation (depreciation) | (785,460 | ) | (646,629 | ) | ||||
|
| |||||||
Net increase (decrease) in net assets resulting from operations | (6,675,206 | ) | (1,997,601 | ) | ||||
|
| |||||||
Capital share transactions: (Note 2) | ||||||||
Class A | 1,308,813 | 1,805,061 | ||||||
Class C | 170,718 | 495,022 | ||||||
Class R | 15,801 | 4,615 | ||||||
Class R6 | (6,433,256 | ) | 80,347,873 | |||||
Advisor Class | 1,486,143 | 427,868 | ||||||
|
| |||||||
Total capital share transactions | (3,451,781 | ) | 83,080,439 | |||||
|
| |||||||
Net increase (decrease) in net assets | (10,126,987 | ) | 81,082,838 | |||||
Net assets: | ||||||||
Beginning of year | 136,859,105 | 55,776,267 | ||||||
|
| |||||||
End of year | $ | 126,732,118 | $ | 136,859,105 | ||||
|
| |||||||
Accumulated net investment loss included in net assets: | ||||||||
End of year | $ | (101,488 | ) | $ | (153,903 | ) | ||
|
| |||||||
22 | Annual Report | The accompanying notes are an integral part of these consolidated financial statements. | franklintempleton.com | ||
FRANKLIN ALTERNATIVE STRATEGIES FUNDS
Notes to Consolidated Financial Statements
Franklin Pelagos Commodities Strategy Fund
1. Organization and Significant Accounting Policies
Franklin Alternative Strategies Funds (Trust) is registered under the Investment Company Act of 1940 (1940 Act) as an open-end management investment company, consisting of four separate funds and applies the specialized accounting and reporting guidance in U.S. Generally Accepted Accounting Principles (U.S. GAAP). Franklin Pelagos Commodities Strategy Fund (Fund) is included in this report. The Fund offers five classes of shares: Class A, Class C, Class R, Class R6 and Advisor Class. Each class of shares may differ by its initial sales load, contingent deferred sales charges, voting rights on matters affecting a single class, its exchange privilege and fees primarily due to differing arrangements for distribution and transfer agent fees.
The following summarizes the Fund’s significant accounting policies.
a. Financial Instrument Valuation
The Fund’s investments in financial instruments are carried at fair value daily. Fair value is the price that would be received to sell an asset or paid to transfer a liability in an orderly transaction between market participants on the measurement date. The Fund calculates the net asset value (NAV) per share as of 4 p.m. Eastern time each day the New York Stock Exchange (NYSE) is open for trading. Under compliance policies and procedures approved by the Trust’s Board of Trustees (the Board), the Fund’s administrator has responsibility for oversight of valuation, including leading the cross-functional Valuation Committee (VC). The VC provides administration and oversight of the Fund’s valuation policies and procedures, which are approved annually by the Board. Among other things, these procedures allow the Fund to utilize independent pricing services, quotations from securities and financial instrument dealers, and other market sources to determine fair value.
Debt securities generally trade in the over-the-counter (OTC) market rather than on a securities exchange. The Fund’s pricing services use multiple valuation techniques to determine fair value. In instances where sufficient market activity exists, the pricing services may utilize a market-based approach through which quotes from market makers are used to determine fair value. In instances where sufficient market activity may not exist or is limited, the pricing services also utilize proprietary valuation models which may consider market characteristics
such as benchmark yield curves, credit spreads, estimated default rates, anticipated market interest rate volatility, coupon rates, anticipated timing of principal repayments, underlying collateral, and other unique security features in order to estimate the relevant cash flows, which are then discounted to calculate the fair value.
Investments in open-end mutual funds are valued at the closing NAV.
Derivative financial instruments listed on an exchange are valued at the official closing price of the day. Certain derivative financial instruments trade in the OTC market. The Fund’s pricing services use various techniques including industry standard option pricing models and proprietary discounted cash flow models to determine the fair value of those instruments. The Fund’s net benefit or obligation under the derivative contract, as measured by the fair value of the contract, is included in net assets.
The Fund has procedures to determine the fair value of financial instruments for which market prices are not reliable or readily available. Under these procedures, the VC convenes on a regular basis to review such financial instruments and considers a number of factors, including significant unobservable valuation inputs, when arriving at fair value. The VC primarily employs a market-based approach which may use related or comparable assets or liabilities, recent transactions, market multiples, book values, and other relevant information for the investment to determine the fair value of the investment. An income-based valuation approach may also be used in which the anticipated future cash flows of the investment are discounted to calculate fair value. Discounts may also be applied due to the nature or duration of any restrictions on the disposition of the investments. Due to the inherent uncertainty of valuations of such investments, the fair values may differ significantly from the values that would have been used had an active market existed. The VC employs various methods for calibrating these valuation approaches including a regular review of key inputs and assumptions, transactional back-testing or disposition analysis, and reviews of any related market activity.
b. Derivative Financial Instruments
The Fund invested in derivative financial instruments in order to manage risk or gain exposure to various other investments or markets. Derivatives are financial contracts based on an underlying or notional amount, require no initial investment or
franklintempleton.com | Annual Report | 23 | ||
FRANKLIN ALTERNATIVE STRATEGIES FUNDS
NOTES TO CONSOLIDATED FINANCIAL STATEMENTS
Franklin Pelagos Commodities Strategy Fund (continued)
1. Organization and Significant Accounting
Policies (continued)
b. Derivative Financial Instruments (continued)
an initial net investment that is smaller than would normally be required to have a similar response to changes in market factors, and require or permit net settlement. Derivatives contain various risks including the potential inability of the counterparty to fulfill their obligations under the terms of the contract, the potential for an illiquid secondary market, and/or the potential for market movements which expose the Fund to gains or losses in excess of the amounts shown in the Consolidated Statement of Assets and Liabilities. Realized gain and loss and unrealized appreciation and depreciation on these contracts for the period are included in the Consolidated Statement of Operations.
Derivative counterparty credit risk is managed through a formal evaluation of the creditworthiness of all potential counter-parties. The Fund attempts to reduce its exposure to counterparty credit risk on OTC derivatives, whenever possible, by entering into International Swaps and Derivatives Association (ISDA) master agreements with certain counterparties. These agreements contain various provisions, including but not limited to collateral requirements, events of default, or early termination. Termination events applicable to the counterparty include certain deteriorations in the credit quality of the counterparty. Termination events applicable to the Fund include failure of the Fund to maintain certain net asset levels and/or limit the decline in net assets over various periods of time. In the event of default or early termination, the ISDA master agreement gives the non-defaulting party the right to net and close-out all transactions traded, whether or not arising under the ISDA agreement, to one net amount payable by one counterparty to the other. However, absent an event of default or early termination, OTC derivative assets and liabilities are presented gross and not offset in the Consolidated Statement of Assets and Liabilities. Early termination by the counterparty may result in an immediate payment by the Fund of any net liability owed to that counterparty under the ISDA agreement. At May 31, 2017, the Fund had no OTC derivatives in a net liability position for such contracts.
Collateral requirements differ by type of derivative. Collateral or initial margin requirements are set by the broker or exchange clearing house for exchange traded and centrally cleared derivatives. Initial margin deposited is held at the exchange and can be in the form of cash and/or securities. For OTC
derivatives traded under an ISDA master agreement, posting of collateral is required by either the Fund or the applicable counterparty if the total net exposure of all OTC derivatives with the applicable counterparty exceeds the minimum transfer amount, which typically ranges from $100,000 to $250,000, and can vary depending on the counterparty and the type of the agreement. Generally, collateral is determined at the close of Fund business each day and any additional collateral required due to changes in derivative values may be delivered by the Fund or the counterparty the next business day, or within a few business days. Collateral pledged and/or received by the Fund for OTC derivatives, if any, is held in segregated accounts with the Fund’s custodian/counterparty broker and can be in the form of cash and/or securities. Unrestricted cash may be invested according to the Fund’s investment objectives. To the extent that the amounts due to the Fund from its counterparties are not subject to collateralization or are not fully collateralized, the Fund bears the risk of loss from counterparty non-performance.
The Fund entered into exchange traded futures contracts primarily to gain exposure to commodity price risk. A futures contract is an agreement between the Fund and a counterparty to buy or sell an asset at a specified price on a future date. Required initial margins are pledged by the Fund, and the daily change in fair value is accounted for as a variation margin payable or receivable in the Consolidated Statement of Assets and Liabilities.
The Fund entered into OTC commodity-linked total return swap contracts primarily to gain exposure to commodity price risk of an underlying instrument such as a stock, bond, index or basket of securities or indices. A total return swap is an agreement between the Fund and a counterparty to exchange a return linked to an underlying instrument for a floating or fixed rate payment, both based upon a notional amount. Over the term of the contract, contractually required payments to be paid or received are accrued daily and recorded as unrealized appreciation or depreciation until the payments are made, at which time they are recognized as realized gain or loss.
The Fund purchased or wrote exchange traded option contracts primarily to manage and/or gain exposure to commodity price risk. An option is a contract entitling the holder to purchase or sell a specific amount of shares or units of an asset or notional amount of a swap (swaption), at a specified price. When an option is purchased or written, an amount equal to the premium paid or received is recorded as an asset or liability, respectively. Upon exercise of an option, the acquisition cost or sales
24 | Annual Report | franklintempleton.com | ||
FRANKLIN ALTERNATIVE STRATEGIES FUNDS
NOTES TO CONSOLIDATED FINANCIAL STATEMENTS
Franklin Pelagos Commodities Strategy Fund (continued)
proceeds of the underlying investment is adjusted by any premium received or paid. Upon expiration of an option, any premium received or paid is recorded as a realized gain or loss. Upon closing an option other than through expiration or exercise, the difference between the premium received or paid and the cost to close the position is recorded as a realized gain or loss.
See Notes 6 and 7 regarding investment transactions and other derivative information, respectively.
c. Investments in FPC Holdings Corp. (FP Subsidiary)
The Fund invests in certain financial instruments and commodity-linked derivative investments through its investment in the FP Subsidiary. The FP Subsidiary is a Cayman Islands exempted company with limited liability, is a wholly-owned subsidiary of the Fund, and is able to invest in certain financial instruments and commodity-linked derivative investments consistent with the investment objective of the Fund. At May 31, 2017, the FP Subsidiary’s investments as well as any other assets and liabilities of the FP Subsidiary are reflected in the Fund’s Consolidated Statement of Investments and Consolidated Statement of Assets and Liabilities. The financial statements have been consolidated and include the accounts of the Fund and the FP Subsidiary. All intercompany transactions and balances have been eliminated. For tax purposes, the Fund is required to increase its taxable income by its share of the FP Subsidiary’s income. Net losses incurred by the FP Subsidiary cannot offset income earned by the Fund and cannot be carried back or forward by the FP Subsidiary to offset income from prior or future years. At May 31, 2017, the net assets of the FP Subsidiary were $26,303,140, representing 20.8% of the Fund’s consolidated net assets. The Fund’s investment in the FP Subsidiary is limited to 25% of consolidated assets.
d. Income Taxes
It is the Fund’s policy to qualify as a regulated investment company under the Internal Revenue Code. The Fund intends to distribute to shareholders substantially all of its taxable income and net realized gains to relieve it from federal income and excise taxes. As a result, no provision for U.S. federal income taxes is required.
The Fund may recognize an income tax liability related to its uncertain tax positions under U.S. GAAP when the uncertain tax position has a less than 50% probability that it will be
sustained upon examination by the tax authorities based on its technical merits. As of May 31, 2017, the Fund has determined that no tax liability is required in its consolidated financial statements related to uncertain tax positions for any open tax years (or expected to be taken in future tax years). Open tax years are those that remain subject to examination and are based on each tax jurisdiction’s statute of limitation.
e. Security Transactions, Investment Income, Expenses and Distributions
Security transactions are accounted for on trade date. Realized gains and losses on security transactions are determined on a specific identification basis. Interest income and estimated expenses are accrued daily. Amortization of premium and accretion of discount on debt securities are included in interest income. Dividend income is recorded on the ex-dividend date. Distributions to shareholders are recorded on the ex-dividend date and are determined according to income tax regulations (tax basis). Distributable earnings determined on a tax basis may differ from earnings recorded in accordance with U.S. GAAP. These differences may be permanent or temporary. Permanent differences are reclassified among capital accounts to reflect their tax character. These reclassifications have no impact on net assets or the results of operations. Temporary differences are not reclassified, as they may reverse in subsequent periods.
Common expenses incurred by the Trust are allocated among the Funds based on the ratio of net assets of each Fund to the combined net assets of the Trust. Fund specific expenses are charged directly to the Fund that incurred the expense.
Realized and unrealized gains and losses and net investment income, not including class specific expenses, are allocated daily to each class of shares based upon the relative proportion of net assets of each class. Differences in per share distributions by class are generally due to differences in class specific expenses.
f. Accounting Estimates
The preparation of financial statements in accordance with U.S. GAAP requires management to make estimates and assumptions that affect the reported amounts of assets and liabilities at the date of the financial statements and the amounts of income and expenses during the reporting period. Actual results could differ from those estimates.
franklintempleton.com | Annual Report | 25 | ||
FRANKLIN ALTERNATIVE STRATEGIES FUNDS
NOTES TO CONSOLIDATED FINANCIAL STATEMENTS
Franklin Pelagos Commodities Strategy Fund (continued)
1. Organization and Significant Accounting
Policies (continued)
g. Guarantees and Indemnifications
Under the Trust’s organizational documents, its officers and trustees are indemnified by the Trust against certain liabilities arising out of the performance of their duties to the Trust. Additionally, in the normal course of business, the Trust, on
behalf of the Fund, enters into contracts with service providers that contain general indemnification clauses. The Trust’s maximum exposure under these arrangements is unknown as this would involve future claims that may be made against the Trust that have not yet occurred. Currently, the Trust expects the risk of loss to be remote.
2. Shares of Beneficial Interest
At May 31, 2017, there were an unlimited number of shares authorized (without par value). Transactions in the Fund’s shares were as follows:
| Year Ended May 31, | ||||||||||||||||
| 2017 | 2016 | |||||||||||||||
| Shares | Amount | Shares | Amount | |||||||||||||
Class A Shares: | ||||||||||||||||
Shares sold | 468,367 | $ | 3,019,447 | 410,630 | $ | 2,517,563 | ||||||||||
Shares redeemed | (266,214 | ) | (1,710,634 | ) | (113,450 | ) | (712,502 | ) | ||||||||
Net increase (decrease) | 202,153 | $ | 1,308,813 | 297,180 | $ | 1,805,061 | ||||||||||
Class C Shares: | ||||||||||||||||
Shares sold | 86,217 | $ | 545,742 | 97,440 | $ | 584,239 | ||||||||||
Shares redeemed | (60,610 | ) | (375,024 | ) | (15,208 | ) | (89,217 | ) | ||||||||
Net increase (decrease) | 25,607 | $ | 170,718 | 82,232 | $ | 495,022 | ||||||||||
Class R Shares: | ||||||||||||||||
Shares sold | 3,232 | $ | 20,979 | 792 | $ | 4,615 | ||||||||||
Shares redeemed | (798 | ) | (5,178 | ) | — | — | ||||||||||
Net increase (decrease) | 2,434 | $ | 15,801 | 792 | $ | 4,615 | ||||||||||
Class R6 Shares: | ||||||||||||||||
Shares sold | 282,587 | $ | 1,822,567 | 14,259,716 | $ | 89,857,489 | ||||||||||
Shares redeemed | (1,279,804 | ) | (8,255,823 | ) | (1,547,056 | ) | (9,509,616 | ) | ||||||||
Net increase (decrease) | (997,217 | ) | $ | (6,433,256 | ) | 12,712,660 | $ | 80,347,873 | ||||||||
Advisor Class Shares: | ||||||||||||||||
Shares sold | 286,725 | $ | 1,872,420 | 75,153 | $ | 475,789 | ||||||||||
Shares redeemed | (59,539 | ) | (386,277 | ) | (7,203 | ) | (47,921 | ) | ||||||||
Net increase (decrease) | 227,186 | $ | 1,486,143 | 67,950 | $ | 427,868 | ||||||||||
26 | Annual Report | franklintempleton.com | ||
FRANKLIN ALTERNATIVE STRATEGIES FUNDS
NOTES TO CONSOLIDATED FINANCIAL STATEMENTS
Franklin Pelagos Commodities Strategy Fund (continued)
3. Transactions with Affiliates
Franklin Resources, Inc. is the holding company for various subsidiaries that together are referred to as Franklin Templeton Investments. Certain officers and trustees of the Trust are also officers and/or directors of the following subsidiaries:
| Subsidiary | Affiliation | |
FT AlphaParity, LLC (FTAP) (formerly Franklin Alternative Strategies Advisers, LLC) | Investment manager | |
Franklin Templeton Services, LLC (FT Services) | Administrative manager | |
Franklin Templeton Distributors, Inc. (Distributors) | Principal underwriter | |
Franklin Templeton Investor Services, LLC (Investor Services) | Transfer agent |
a. Management Fees
The Fund and FP Subsidiary pay an investment management fee to FTAP of 0.85% per year of the average daily net assets of the Fund and FP Subsidiary. Management fees paid by the Fund are reduced on assets invested in the FP Subsidiary, in an amount not to exceed the management fees paid by the FP Subsidiary.
b. Administrative Fees
Under an agreement with FTAP, FT Services provides administrative services to the Fund and FP Subsidiary. The fee is paid by FTAP based on the Fund and FP Subsidiary average daily net assets, and is not an additional expense of the Fund or FP Subsidiary.
c. Distribution Fees
The Board has adopted distribution plans for each share class, with the exception of Class R6 and Advisor Class shares, pursuant to Rule 12b-1 under the 1940 Act. Under the Fund’s Class A reimbursement distribution plan, the Fund reimburses Distributors for costs incurred in connection with the servicing, sale and distribution of the Fund’s shares up to the maximum annual plan rate. Under the Class A reimbursement distribution plan, costs exceeding the maximum for the current plan year cannot be reimbursed in subsequent periods. In addition, under the Fund’s Class C and R compensation distribution plans, the Fund pays Distributors for costs incurred in connection with the servicing, sale and distribution of the Fund’s shares up to the maximum annual plan rate for each class. The plan year, for purposes of monitoring compliance with the maximum annual plan rates, is February 1 through January 31 for each Fund.
The maximum annual plan rates, based on the average daily net assets, for each class, are as follows:
Class A | 0.30 | % | ||
Class C | 1.00 | % | ||
Class R | 0.50 | % |
The Board has set the current rate at 0.25% per year for Class A shares until further notice and approval by the Board.
d. Sales Charges/Underwriting Agreements
Front-end sales charges and contingent deferred sales charges (CDSC) do not represent expenses of the Fund. These charges are deducted from the proceeds of sales of Fund shares prior to investment or from redemption proceeds prior to remittance, as applicable. Distributors has advised the Fund of the following commission transactions related to the sales and redemptions of the Fund’s shares for the year:
Sales charges retained net of commissions paid to unaffiliated | $ | 6,050 | ||
CDSC retained | $ | 235 |
franklintempleton.com | Annual Report | 27 | ||
FRANKLIN ALTERNATIVE STRATEGIES FUNDS
NOTES TO CONSOLIDATED FINANCIAL STATEMENTS
Franklin Pelagos Commodities Strategy Fund (continued)
3. Transactions with Affiliates (continued)
e. Transfer Agent Fees
Each class of shares, except for Class R6, pays transfer agent fees to Investor Services for its performance of shareholder servicing obligations and reimburses Investor Services for out of pocket expenses incurred, including shareholder servicing fees paid to third parties. These fees are allocated daily based upon their relative proportion of such classes’ aggregate net assets. Class R6 pays Investor Services transfer agent fees specific to that class.
For the year ended May 31, 2017, the Fund paid transfer agent fees of $29,926, of which $16,508 was retained by Investor Services.
f. Investments in Affiliated Management Investment Companies
The Fund invests in one or more affiliated management investment companies for purposes other than exercising a controlling influence over the management or policies. Management fees paid by the Fund are waived on assets invested in the affiliated management investment companies, as noted in the Consolidated Statement of Operations, in an amount not to exceed the management and administrative fees paid directly or indirectly by each affiliate. Prior to June 1, 2013, the waiver was accounted for as a reduction to management fees. During the year ended May 31, 2017, the Fund held investments in affiliated management investment companies as follows:
Number of Shares Held at Beginning of Year | Gross Additions | Gross Reductions | Number of Shares of Year | Value at End of Year | Investment Income | Realized Gain (Loss) | % of Affiliated Fund Shares Outstanding Held at End of Year | |||||||||||||||||||||||||
Non-Controlled Affiliates | ||||||||||||||||||||||||||||||||
Institutional Fiduciary Trust Money Market Portfolio, 0.44% | 836,916 | 13,169,593 | (14,006,509 | ) | – | $– | $2 | $– | – | % | ||||||||||||||||||||||
|
| |||||||||||||||||||||||||||||||
g. Waiver and Expense Reimbursements
FTAP has contractually agreed in advance to waive or limit its fees and to assume as its own expense certain expenses otherwise payable by the Fund so that the expenses (excluding distribution fees, acquired fund fees and expenses) for each class of the Fund do not exceed 0.95% and Class R6 does not exceed 0.68% based on the average net assets of each class (other than certain non-routine expenses or costs, including those relating to litigation, indemnification, reorganizations, and liquidations) until September 30, 2017. Total expenses waived or paid are not subject to recapture subsequent to the Fund’s fiscal year end. Prior to October 1, 2016, expenses for Class R6 were limited to 0.73%.
28 | Annual Report | franklintempleton.com | ||
FRANKLIN ALTERNATIVE STRATEGIES FUNDS
NOTES TO CONSOLIDATED FINANCIAL STATEMENTS
Franklin Pelagos Commodities Strategy Fund (continued)
h. Other Affiliated Transactions
At May 31, 2017, the shares of the Fund were owned by the following entities:
| Percentage of | ||||||||
| Shares | Outstanding Sharesa | |||||||
Franklin Moderate Allocation Fund | 7,988,098 | 39.1% | ||||||
Franklin Conservative Allocation Fund | 5,120,808 | 25.1% | ||||||
Franklin Growth Allocation Fund | 4,693,281 | 23.0% | ||||||
Franklin LifeSmart 2025 Retirement Target Fund | 376,638 | 1.8% | ||||||
Franklin LifeSmart 2035 Retirement Target Fund | 310,657 | 1.5% | ||||||
Franklin LifeSmart 2045 Retirement Target Fund | 218,645 | 1.1% | ||||||
Franklin LifeSmart 2030 Retirement Target Fund | 117,779 | 0.6% | ||||||
Franklin LifeSmart 2020 Retirement Target Fund | 107,975 | 0.5% | ||||||
Franklin LifeSmart 2040 Retirement Target Fund | 95,031 | 0.5% | ||||||
Franklin LifeSmart 2050 Retirement Target Fund | 77,465 | 0.4% | ||||||
Franklin LifeSmart 2055 Retirement Target Fund | 20,548 | 0.1% | ||||||
Franklin Resources, Inc | 563 | —% | b | |||||
|
| |||||||
| 19,127,488 | 93.7% | |||||||
|
| |||||||
a Investment activities of significant shareholders could have a material impact on the Fund.
b Rounds to less than 0.01%.
4. Expense Offset Arrangement
The Fund has entered into an arrangement with its custodian whereby credits realized as a result of uninvested cash balances are used to reduce a portion of the Fund’s custodian expenses. During the year ended May 31, 2017, the custodian fees were reduced as noted in the Consolidated Statement of Operations.
5. Income Taxes
For tax purposes, capital losses may be carried over to offset future capital gains, if any. At May 31, 2017, the Fund had long-term capital loss carryforwards of $174,215.
During the year ended May 31, 2017, the Fund utilized $1,560 of capital loss carryforwards.
At May 31, 2017, the cost of investments and net unrealized appreciation (depreciation) for income tax purposes were as follows:
Cost of investments | $ | 127,422,509 | ||
Unrealized appreciation | $ | 1,897 | ||
Unrealized depreciation | (320,727 | ) | ||
Net unrealized appreciation (depreciation) | $ | (318,830 | ) | |
Differences between income and/or capital gains as determined on a book basis and a tax basis are primarily due to differing treatments of bond discounts and premiums and investments in the FP Subsidiary.
6. Investment Transactions
Purchases and sales of investments (excluding short term securities) for the year ended May 31, 2017, aggregated $20,000,000 and $18,000,000, respectively.
| franklintempleton.com | Annual Report | 29 | ||
FRANKLIN ALTERNATIVE STRATEGIES FUNDS
NOTES TO CONSOLIDATED FINANCIAL STATEMENTS
Franklin Pelagos Commodities Strategy Fund (continued)
6. Investment Transactions (continued)
Transactions in options written during the year ended May 31, 2017, were as follows:
Number of Contracts | Premiums | |||||||
Options outstanding at May 31, 2016 | — | $ | — | |||||
Options written | 623 | 574,067 | ||||||
Options expired | (492 | ) | (256,385 | ) | ||||
Options exercised | — | — | ||||||
Options closed | — | — | ||||||
Options outstanding at May 31, 2017 | 131 | $ | 317,682 | |||||
See Notes 1(b) and 7 regarding derivative financial instruments and other derivative information, respectively.
7. Other Derivative Information
At May 31, 2017, the Fund’s investments in derivative contracts are reflected in the Consolidated Statement of Assets and Liabilities as follows:
| Asset Derivatives | Liability Derivatives | |||||||||||||||
Derivative Contracts Not Accounted for as Hedging Instruments | Consolidated Statement of Assets and Liabilities Location | Fair Value | Consolidated Statement of Assets and Liabilities Location | Fair Value | ||||||||||||
Commodity contracts | Investments in securities, at value | $ | 280,340 | a | Options written, at value | $ | 176,850 | |||||||||
| Variation margin | 16,183 | b | Variation margin | 859,101 | b | |||||||||||
|
|
|
| |||||||||||||
Totals | $ | 296,523 | $ | 1,035,951 | ||||||||||||
|
|
|
| |||||||||||||
aPurchased option contracts are included in investments in securities, at value in the Consolidated Statement of Assets and Liabilities.
bThis amount reflects the cumulative appreciation (depreciation) of futures contracts as reported in the Consolidated Statement of Investments. Only the variation margin receivable/payable at year end is separately reported within the Consolidated Statement of Assets and Liabilities. Prior variation margin movements were recorded to cash upon receipt or payment.
For the year ended May 31, 2017, the effect of derivative contracts in the Fund’s Consolidated Statement of Operations was as follows:
Derivative Contracts Not Accounted for as Hedging Instruments | Consolidated Statement of Operations Location | Net Realized Gain (Loss) for the Year | Consolidated Statement of Operations Location | Net Change in Unrealized (Depreciation) for the | ||||||||||
| Net realized gain (loss) from: | Net change in unrealized | |||||||||||||
| appreciation (depreciation) on: | ||||||||||||||
Commodity contracts | Investments | $ (272,959)a | Investments | $ (96,279 | )a | |||||||||
| Written options | 256,385 | Written options | 140,832 | |||||||||||
| Futures contracts | (118,989) | Futures contracts | (1,092,486 | ) | ||||||||||
| Swap contracts | (5,575,782) | Swap contracts | 346,898 | |||||||||||
|
|
|
| |||||||||||
Totals | $(5,711,345) | $ (701,035 | ) | |||||||||||
|
|
|
| |||||||||||
aPurchased option contracts are included in net realized gain (loss) from investments and net change in unrealized appreciation (depreciation) on investments in the Consolidated Statement of Operations.
For the year ended May 31, 2017, the average month end fair value of derivatives represented 1.6% of average month end net assets. The average month end number of open derivative contracts for the year was 7.
See Notes 1(b) and 6 regarding derivative financial instruments and investment transactions, respectively.
30 | Annual Report | franklintempleton.com | ||
FRANKLIN ALTERNATIVE STRATEGIES FUNDS
NOTES TO CONSOLIDATED FINANCIAL STATEMENTS
Franklin Pelagos Commodities Strategy Fund (continued)
8. Credit Facility
The Fund, together with other U.S. registered and foreign investment funds (collectively, Borrowers), managed by Franklin Templeton Investments, are borrowers in a joint syndicated senior unsecured credit facility totaling $2 billion (Global Credit Facility) which matures on February 9, 2018. This Global Credit Facility provides a source of funds to the Borrowers for temporary and emergency purposes, including the ability to meet future unanticipated or unusually large redemption requests.
Under the terms of the Global Credit Facility, the Fund shall, in addition to interest charged on any borrowings made by the Fund and other costs incurred by the Fund, pay its share of fees and expenses incurred in connection with the implementation and maintenance of the Global Credit Facility, based upon its relative share of the aggregate net assets of all of the Borrowers, including an annual commitment fee of 0.15% based upon the unused portion of the Global Credit Facility. These fees are reflected in other expenses in the Consolidated Statement of Operations. During the year ended May 31, 2017, the Fund did not use the Global Credit Facility.
9. Fair Value Measurements
The Fund follows a fair value hierarchy that distinguishes between market data obtained from independent sources (observable inputs) and the Fund’s own market assumptions (unobservable inputs). These inputs are used in determining the value of the Fund’s financial instruments and are summarized in the following fair value hierarchy:
| • | Level 1 – quoted prices in active markets for identical financial instruments |
| • | Level 2 – other significant observable inputs (including quoted prices for similar financial instruments, interest rates, prepayment speed, credit risk, etc.) |
| • | Level 3 – significant unobservable inputs (including the Fund’s own assumptions in determining the fair value of financial instruments) |
The input levels are not necessarily an indication of the risk or liquidity associated with financial instruments at that level.
For movements between the levels within the fair value hierarchy, the Fund has adopted a policy of recognizing the transfers as of the date of the underlying event which caused the movement.
A summary of inputs used as of May 31, 2017, in valuing the Fund’s assets and liabilities carried at fair value, is as follows:
| Level 1 | Level 2 | Level 3 | Total | |||||||||||||
Assets: | ||||||||||||||||
Investments in Securities: | ||||||||||||||||
U.S. Government and Agency Securities | $ | — | $ | 42,869,828 | $ | — | $ | 42,869,828 | ||||||||
Options Purchased | 280,340 | — | — | 280,340 | ||||||||||||
Short Term Investments | 82,203,511 | 1,750,000 | — | 83,953,511 | ||||||||||||
Total Investments in Securities | $ | 82,483,851 | $ | 44,619,828 | $ | — | $ | 127,103,679 | ||||||||
Other Financial Instruments: | ||||||||||||||||
Futures Contracts | $ | 16,183 | $ | — | $ | — | $ | 16,183 | ||||||||
Liabilities: | ||||||||||||||||
Other Financial Instruments: | ||||||||||||||||
Options Written | $ | 176,850 | $ | — | $ | — | $ | 176,850 | ||||||||
Futures Contracts | 859,101 | — | — | 859,101 | ||||||||||||
Total Other Financial Instruments | $ | 1,035,951 | $ | — | $ | — | $ | 1,035,951 | ||||||||
| franklintempleton.com | Annual Report | 31 | ||
FRANKLIN ALTERNATIVE STRATEGIES FUNDS
NOTES TO CONSOLIDATED FINANCIAL STATEMENTS
Franklin Pelagos Commodities Strategy Fund (continued)
9. Fair Value Measurements (continued)
A reconciliation of assets in which Level 3 inputs are used in determining fair value is presented when there are significant Level 3 financial instruments at the end of the year.
10. Investment Company Reporting Modernization
In October 2016, the U.S. Securities and Exchange Commission adopted new rules and amended existing rules (together, final rules) intended to modernize the reporting and disclosure of information by registered investment companies. In part, the final rules amend Regulation S-X and require standardized, enhanced disclosures about derivatives in investment company financial statements, as well as other amendments. The compliance date for the amendments to Regulation S-X is August 1, 2017. Management has reviewed the requirements and believes the adoption of the amendments to Regulation S-X will not have a material impact on the Fund’s financial statements and related disclosures.
11. Subsequent Events
The Fund has evaluated subsequent events through the issuance of the consolidated financial statements and determined that no events have occurred that require disclosure.
32 | Annual Report | franklintempleton.com | ||
FRANKLIN ALTERNATIVE STRATEGIES FUNDS
NOTES TO CONSOLIDATED FINANCIAL STATEMENTS
Franklin Pelagos Commodities Strategy Fund (continued)
Abbreviations
| ||
| Counterparty | Selected Portfolio | |
| MSCS Morgan Stanley Capital Services, LLC | FFCB Federal Farm Credit Bank | |
| FHLB Federal Home Loan Bank | ||
| FHLMC Federal Home Loan Mortgage Corp. |
| franklintempleton.com | Annual Report | 33 | ||
FRANKLIN ALTERNATIVE STRATEGIES FUNDS
Report of Independent Registered Public Accounting Firm
To the Board of Trustees of Franklin Alternative Strategies Funds and Shareholders of Franklin Pelagos Commodities Strategy Fund:
We have audited the accompanying consolidated statement of assets and liabilities, including the consolidated statement of investments, of Franklin Pelagos Commodities Strategy Fund (the “Fund”) (one of the funds constituting the Franklin Alternative Strategies Funds), as of May 31, 2017, and the related consolidated statement of operations for the year then ended, the consolidated statements of changes in net assets for each of the two years in the period then ended and the financial highlights for each of the periods indicated therein. These financial statements and financial highlights are the responsibility of the Fund’s management. Our responsibility is to express an opinion on these financial statements and financial highlights based on our audits.
We conducted our audits in accordance with the standards of the Public Company Accounting Oversight Board (United States). Those standards require that we plan and perform the audit to obtain reasonable assurance about whether the financial statements and financial highlights are free of material misstatement. We were not engaged to perform an audit of the Fund’s internal control over financial reporting. Our audits included consideration of internal control over financial reporting as a basis for designing audit procedures that are appropriate in the circumstances, but not for the purpose of expressing an opinion on the effectiveness of the Fund’s internal control over financial reporting. Accordingly, we express no such opinion. An audit also includes examining, on a test basis, evidence supporting the amounts and disclosures in the financial statements and financial highlights, assessing the accounting principles used and significant estimates made by management, and evaluating the overall financial statement presentation. Our procedures included confirmation of securities owned as of May 31, 2017, by correspondence with the custodian and brokers. We believe that our audits provide a reasonable basis for our opinion.
In our opinion, the consolidated financial statements and financial highlights referred to above present fairly, in all material respects, the consolidated financial position of Franklin Pelagos Commodities Strategy Fund (one of the funds constituting the Franklin Alternative Strategies Funds) at May 31, 2017, the consolidated results of its operations for the year then ended, the consolidated changes in its net assets for each of the two years in the period then ended and the financial highlights for each of the periods indicated therein, in conformity with U.S. generally accepted accounting principles.
Boston, Massachusetts
July 26, 2017

34 | Annual Report | franklintempleton.com | ||
FRANKLIN ALTERNATIVE STRATEGIES FUNDS
The name, year of birth and address of the officers and board members, as well as their affiliations, positions held with the Funds, principal occupations during at least the past five years and number of U.S. registered portfolios overseen in the Franklin Templeton Investments fund complex, are shown below. Generally, each board member serves until that person’s successor is elected and qualified.
Independent Board Members
| Number of Portfolios in | ||||||||
Name, Year of Birth and Address | Position | Length of Time Served | Fund Complex Overseen by Board Member* | Other Directorships Held During at Least the Past 5 Years | ||||
Edward I. Altman, Ph.D. (1941) c/o Franklin Mutual Advisers, LLC 101 John F. Kennedy Parkway Short Hills, NJ 07078-2789 | Trustee | Since 2011 | 16 | None | ||||
Principal Occupation During at Least the Past 5 Years: | ||||||||
| Max L. Heine Professor of Finance, Emeritus and Director of The Credit and Debt Markets Research Program, Salomon Center, Stern School of Business, New York University; editor and author of numerous financial publications; financial consultant; an adviser to numerous financial and publishing organizations; and formerly, Vice Director, Salomon Center, Stern School of Business, New York University. | ||||||||
Ann Torre Bates (1958) c/o Franklin Mutual Advisers, LLC 101 John F. Kennedy Parkway Short Hills, NJ 07078-2789 | Trustee | Since 2011 | 42 | Ares Capital Corporation (specialty finance company) (2010-present), United Natural Foods, Inc. (distributor of natural, organic and specialty foods) (2013-present), Allied Capital Corporation (financial services) (2003-2010) and SLM Corporation (Sallie Mae) (1997-2014) and Navient Corporation (loan management, servicing and asset recovery) (2014-2016). | ||||
| Principal Occupation During at Least the Past 5 Years: | ||||||||
| Director of various companies; and formerly, Executive Vice President and Chief Financial Officer, NHP Incorporated (manager of multifamily housing) (1995-1997); and Vice President and Treasurer, US Airways, Inc. (until 1995). | ||||||||
Burton J. Greenwald (1929) c/o Franklin Mutual Advisers, LLC 101 John F. Kennedy Parkway Short Hills, NJ 07078-2789 | Trustee | Since 2011 | 16 | Franklin Templeton Emerging Markets Debt Opportunities Fund PLC (1999-present) and Fiduciary International Ireland Limited (1999-2015). | ||||
| Principal Occupation During at Least the Past 5 Years: | ||||||||
| Managing Director, B.J. Greenwald Associates (management consultants to the financial services industry); and formerly, Chairman, Fiduciary Trust International Funds; Executive Vice President, L.F. Rothschild Fund Management, Inc.; President and Director, Merit Mutual Funds; President, Underwriting Division and Director, National Securities & Research Corporation; Governor, Investment Company Institute; and Chairman, ICI Public Information Committee. | ||||||||
Keith E. Mitchell (1954) c/o Franklin Mutual Advisers, LLC 101 John F. Kennedy Parkway Short Hills, NJ 07078-2789 | Trustee | Since 2011 | 16 | None | ||||
| Principal Occupation During at Least the Past 5 Years: | ||||||||
Director of various boards of asset management firms; and formerly, Managing Member, Mitchell, Hartley & Bechtel Advisers, LLC (formerly, Mitchell Advisers, LLC) (advisory firm) (2003-2015) and Managing Director, Putman Lovell NBF. | ||||||||
David W. Niemiec (1949) c/o Franklin Mutual Advisers, LLC 101 John F. Kennedy Parkway Short Hills, NJ 07078-2789 | Trustee | Since 2015 | 42 | Hess Midstream Partners LP (oil and gas midstream infrastructure) (April 2017-present). | ||||
| Principal Occupation During at Least the Past 5 Years: | ||||||||
| Advisor, Saratoga Partners (private equity fund); and formerly, Managing Director, Saratoga Partners (1998-2001) and SBC Warburg Dillon Read (investment banking) (1997-1998); Vice Chairman, Dillon, Read & Co. Inc. (investment banking) (1991-1997); and Chief Financial Officer, Dillon, Read & Co. Inc. (1982-1997). | ||||||||
| franklintempleton.com | Annual Report | 35 | ||
FRANKLIN ALTERNATIVE STRATEGIES FUNDS
Independent Board Members (continued)
| Number of Portfolios in | ||||||||
Name, Year of Birth and Address | Position | Length of Time Served | Fund Complex Overseen by Board Member* | Other Directorships Held During at Least the Past 5 Years | ||||
| Charles Rubens II (1930) | Trustee | Since 2011 | 16 | None | ||||
| c/o Franklin Mutual Advisers, LLC | ||||||||
| 101 John F. Kennedy Parkway | ||||||||
| Short Hills, NJ 07078-2789 | ||||||||
| Principal Occupation During at Least the Past 5 Years: | ||||||||
| Private investor and president of non-profit organizations; and formerly, an executive of Time, Inc.; and Trustee of Colorado College. | ||||||||
| Jan Hopkins Trachtman (1947) | Trustee | Since 2011 | 16 | None | ||||
| c/o Franklin Mutual Advisers, LLC | ||||||||
| 101 John F. Kennedy Parkway | ||||||||
| Short Hills, NJ 07078-2789 | ||||||||
| Principal Occupation During at Least the Past 5 Years: | ||||||||
| President and Founder, The Jan Hopkins Group (communications consulting firm); serves on Advisory Board of Knight Bagehot Fellowship; and formerly, President, Economic Club of New York (2007-2015); Anchor/Correspondent, CNN Financial News (until 2003); Managing Director and Head of Client Communications, Citigroup Private Bank (until 2005); Off-Air Reporter, ABC News’ World News Tonight; and Editor, CBS Network News. | ||||||||
| Robert E. Wade (1946) | Trustee and | Trustee and | 42 | El Oro Ltd (investments) | ||||
| c/o Franklin Mutual Advisers, LLC | Chairman of | Chairman of the | (2003-present). | |||||
| 101 John F. Kennedy Parkway | the Board | Board since 2011 | ||||||
| Short Hills, NJ 07078-2789 | ||||||||
| Principal Occupation During at Least the Past 5 Years: | ||||||||
| Attorney at law engaged in private practice (1972-2008) and member of various boards. | ||||||||
| Gregory H. Williams (1943) | Trustee | Since 2015 | 16 | None | ||||
| c/o Franklin Mutual Advisers, LLC | ||||||||
| 101 John F. Kennedy Parkway | ||||||||
| Short Hills, NJ 07078-2789 | ||||||||
| Principal Occupation During at Least the Past 5 Years: | ||||||||
| Private investor; Consultant; and formerly, President, University of Cincinnati (2009-2012); President, The City College of New York (2001-2009); Dean, College of Law, Ohio State University (1993-2001); and Associate Vice President, Academic Affairs and Professor of Law, University of Iowa (1977-1993). | ||||||||
| Interested Board Members and Officers | ||||||||
| Number of Portfolios in | ||||||||
Name, Year of Birth and Address | Position | Length of Time Served | Fund Complex Overseen by Board Member* | Other Directorships Held During at Least the Past 5 Years | ||||
| **Gregory E. Johnson (1961) | Trustee | Since 2011 | 156 | None | ||||
| One Franklin Parkway | ||||||||
| San Mateo, CA 94403-1906 | ||||||||
| Principal Occupation During at Least the Past 5 Years: | ||||||||
| Chairman of the Board, Member – Office of the Chairman, Director and Chief Executive Officer, Franklin Resources, Inc.; officer and/or director or trustee, as the case may be, of some of the other subsidiaries of Franklin Resources, Inc. and of 44 of the investment companies in Franklin Templeton Investments; and Chairman, Investment Company Institute; and formerly, President, Franklin Resources, Inc. (1994-2015). | ||||||||
| **Jennifer M. Johnson (1964) | Trustee | Since 2015 | 19 | None | ||||
| One Franklin Parkway | ||||||||
| San Mateo, CA 94403-1906 | ||||||||
| Principal Occupation During at Least the Past 5 Years: | ||||||||
| President and Chief Operating Officer, Franklin Resources, Inc.; officer and/or director or trustee, as the case may be, of some of the other subsidiaries of Franklin Resources, Inc. and of four of the investment companies in Franklin Templeton Investments; and formerly, Chief Operating Officer and Executive Vice President, Franklin Resources, Inc. (1994-2015); Executive Vice President of Operations and Technology, Franklin Resources, Inc. (2005-2010); and Senior Vice President, Franklin Resources, Inc. (2003-2005). | ||||||||
36 | Annual Report | franklintempleton.com | ||
FRANKLIN ALTERNATIVE STRATEGIES FUNDS
Interested Board Members and Officers (continued)
| Name, Year of Birth and Address | Position | Length of Time Served | Number of Portfolios in Fund Complex Overseen by Board Member* | Other Directorships Held During at Least the Past 5 Years | ||||
| Alison E. Baur (1964) | Vice President | Since 2012 | Not Applicable | Not Applicable | ||||
| One Franklin Parkway | ||||||||
| San Mateo, CA 94403-1906 | ||||||||
| Principal Occupation During at Least the Past 5 Years: | ||||||||
| Deputy General Counsel, Franklin Templeton Investments; and officer of some of the other subsidiaries of Franklin Resources, Inc. and of 45 of the investment companies in Franklin Templeton Investments. | ||||||||
| Aliya S. Gordon (1973) | Vice President | Since 2011 | Not Applicable | Not Applicable | ||||
| One Franklin Parkway | ||||||||
| San Mateo, CA 94403-1906 | ||||||||
| Principal Occupation During at Least the Past 5 Years: | ||||||||
| Senior Associate General Counsel, Franklin Templeton Investments; and officer of 45 of the investment companies in Franklin Templeton Investments. | ||||||||
| Steven J. Gray (1955) | Secretary and | Secretary and Vice | Not Applicable | Not Applicable | ||||
| One Franklin Parkway | Vice President | President Since | ||||||
| San Mateo, CA 94403-1906 | 2011 | |||||||
Principal Occupation During at Least the Past 5 Years: | ||||||||
| Senior Associate General Counsel, Franklin Templeton Investments; Vice President, Franklin Templeton Distributors, Inc. and FT AlphaParity, LLC; and officer of 45 of the investment companies in Franklin Templeton Investments. | ||||||||
| Madison S. Gulley (1964) | President and | Since | Not Applicable | Not Applicable | ||||
| 300 S.E. 2nd Street | Chief Executive | June 2017 | ||||||
| Fort Lauderdale, FL 33301-1923 | Officer – | |||||||
| Investment | ||||||||
| Management | ||||||||
| Principal Occupation During at Least the Past 5 Years: | ||||||||
| Executive Vice President, Franklin Advisers, Inc., Franklin Advisory Services, LLC, Franklin Templeton Institutional, LLC; Templeton Global Advisors, Limited, and Templeton Investment Counsel, LLC; Senior Vice President, Franklin Templeton Companies, LLC; officer and/or director or trustee, as the case may be, of some of the other subsidiaries of Franklin Resources, Inc. and of one of the investment companies in Franklin Templeton Investments. | ||||||||
| Matthew T. Hinkle (1971) | Chief Executive | Since | Not Applicable | Not Applicable | ||||
| One Franklin Parkway | Officer - | June 2017 | ||||||
| San Mateo, CA 94403-1906 | Finance and | |||||||
| Administration | ||||||||
| Principal Occupation During at Least the Past 5 Years: | ||||||||
| Senior Vice President, U.S. Fund Administration Reporting & Fund Tax, Franklin Templeton Investments; officer of 45 of the investment companies in Franklin Templeton Investments; and formerly, Vice President, Global Tax (2012-April 2017) and Treasurer/Assistant Treasurer, Franklin Templeton Investments (2009-2017). | ||||||||
| Robert G. Kubilis (1973) | Treasurer, | Since 2015 | Not Applicable | Not Applicable | ||||
| 300 S.E. 2nd Street | Chief Financial | |||||||
| Fort Lauderdale, FL 33301-1923 | Officer and | |||||||
| Chief | ||||||||
| Accounting | ||||||||
| Officer | ||||||||
| Principal Occupation During at Least the Past 5 Years: | ||||||||
| Treasurer, U.S. Fund Administration & Reporting, Franklin Templeton Investments; and officer of 18 of the investment companies in Franklin Templeton Investments. | ||||||||
| Robert Lim (1948) | Vice | Since 2016 | Not Applicable | Not Applicable | ||||
| One Franklin Parkway | President – | |||||||
| San Mateo, CA 94403-1906 | AML | |||||||
| Compliance | ||||||||
| Principal Occupation During at Least the Past 5 Years: | ||||||||
| Vice President, Franklin Templeton Companies, LLC; Chief Compliance Officer, Franklin Templeton Distributors, Inc. and Franklin Templeton Investor Services, LLC; and officer of 45 of the investment companies in Franklin Templeton Investments. | ||||||||
| franklintempleton.com | Annual Report | 37 | ||
FRANKLIN ALTERNATIVE STRATEGIES FUNDS
Interested Board Members and Officers (continued)
| Number of Portfolios in | ||||||||
Name, Year of Birth and Address | Position | Length of Time Served | Fund Complex Overseen by Board Member* | Other Directorships Held During at Least the Past 5 Years | ||||
| Kimberly H. Novotny (1972) | Vice President | Since 2013 | Not Applicable | Not Applicable | ||||
| 300 S.E. 2nd Street | ||||||||
| Fort Lauderdale, FL 33301-1923 | ||||||||
| Principal Occupation During at Least the Past 5 Years: | ||||||||
| Associate General Counsel, Franklin Templeton Investments; Vice President and Corporate Secretary, Fiduciary Trust International of the South; Vice President, Templeton Investment Counsel, LLC; Assistant Secretary, Franklin Resources, Inc.; and officer of 45 of the investment companies in Franklin Templeton Investments. | ||||||||
| Robert C. Rosselot (1960) | Chief | Since 2013 | Not Applicable | Not Applicable | ||||
| 300 S.E. 2nd Street | Compliance | |||||||
| Fort Lauderdale, FL 33301-1923 | Officer | |||||||
| Principal Occupation During at Least the Past 5 Years: | ||||||||
| Director, Global Compliance, Franklin Templeton Investments; Vice President, Franklin Templeton Companies, LLC; officer of 45 of the investment companies in Franklin Templeton Investments; and formerly, Senior Associate General Counsel, Franklin Templeton Investments (2007-2013); and Secretary and Vice President, Templeton Group of Funds (2004-2013). | ||||||||
| Karen L. Skidmore (1952) | Vice President | Since 2011 | Not Applicable | Not Applicable | ||||
| One Franklin Parkway | ||||||||
| San Mateo, CA 94403-1906 | ||||||||
| Principal Occupation During at Least the Past 5 Years: | ||||||||
| Senior Associate General Counsel, Franklin Templeton Investments; and officer of 45 of the investment companies in Franklin Templeton Investments. | ||||||||
| Navid J. Tofigh (1972) | Vice President | Since 2015 | Not Applicable | Not Applicable | ||||
| One Franklin Parkway | ||||||||
| San Mateo, CA 94403-1906 | ||||||||
| Principal Occupation During at Least the Past 5 Years: | ||||||||
| Associate General Counsel, Franklin Templeton Investments; and officer of 45 of the investment companies in Franklin Templeton Investments. | ||||||||
| Craig S. Tyle (1960) | Vice President | Since 2011 | Not Applicable | Not Applicable | ||||
| One Franklin Parkway | ||||||||
| San Mateo, CA 94403-1906 | ||||||||
| Principal Occupation During at Least the Past 5 Years: | ||||||||
| General Counsel and Executive Vice President, Franklin Resources, Inc.; and officer of some of the other subsidiaries of Franklin Resources, Inc. and of 45 of the investment companies in Franklin Templeton Investments. | ||||||||
| Lori A. Weber (1964) | Vice President | Since 2011 | Not Applicable | Not Applicable | ||||
| 300 S.E. 2nd Street | ||||||||
| Fort Lauderdale, FL 33301-1923 | ||||||||
| Principal Occupation During at Least the Past 5 Years: | ||||||||
| Senior Associate General Counsel, Franklin Templeton Investments; Assistant Secretary, Franklin Resources, Inc.; Vice President and Secretary, Templeton Investment Counsel, LLC; and officer of 45 of the investment companies in Franklin Templeton Investments. | ||||||||
*We base the number of portfolios on each separate series of the U.S. registered investment companies within the Franklin Templeton Investments fund complex. These portfolios have a common investment manager or affiliated investment managers.
**Gregory E. Johnson is considered to be an interested person of the Fund under the federal securities laws due to his position as an officer and director of Franklin Resources, Inc. (Resources), which is the parent company of the Fund’s investment manager and distributor. Jennifer M. Johnson is considered to be an interested person of the Fund under the federal securities laws due to her position as officer and director of Resources.
Note 1: Gregory E. Johnson and Jennifer M. Johnson are siblings.
Note 2: Officer information is current as of the date of this report. It is possible that after this date, information about officers may change.
Note 3: Effective June 1, 2017, William Y. Yun ceased to be an officer of the trust.
The Fund’s Board has determined that certain of the members of the Audit Committee, including Ann Torre Bates, are audit committee financial experts, and “independent,” under those provisions of the Sarbanes-Oxley Act of 2002, and the rules and form amendments adopted by the Securities and Exchange Commission, relating to audit committee financial experts.
The Statement of Additional Information (SAI) includes additional information about the board members and is available, without charge, upon request. Shareholders may call (800) DIAL BEN/342-5236 to request the SAI.
38 | Annual Report | franklintempleton.com | ||
FRANKLIN ALTERNATIVE STRATEGIES FUNDS
FRANKLIN PELAGOS COMMODITIES STRATEGY FUND
Board Approval of Investment Management Agreement
FRANKLIN PELAGOS COMMODITIES STRATEGY FUND (FUND)
The Board of Trustees (Board), including a majority of trustees that are not “interested persons” as such term is defined in section 2(a)(19) of the Investment Company Act of 1940 (hereinafter referred to as “independent trustees”), at an in-person meeting held on May 22, 2017, unanimously approved the renewal of the Fund’s investment management agreement. Prior to a meeting of all of the trustees for the purpose of considering such renewal, the independent trustees participated in two other meetings held in connection with the renewal process. Throughout the process, the independent trustees received assistance and advice from and met separately with independent counsel. The independent trustees met with and interviewed officers of the investment manager (including portfolio managers), the transfer agent and shareholder services group and the distributor. In approving the renewal of the investment management agreement for the Fund, the Board, including the independent trustees, determined that the investment management fee structure was fair and reasonable and that continuance of the agreement was in the best interests of the Fund and its shareholders.
In reaching their decision on the investment management agreement, the trustees took into account information furnished throughout the year at regular Board meetings, as well as information specifically requested and furnished for the renewal process, which culminated in the meetings referred to above for the specific purpose of considering such agreement. Information furnished throughout the year included, among others, reports on the Fund’s investment performance, expenses, portfolio composition, derivatives, asset segregation, portfolio turnover, Rule 12b-1 plan, distribution, shareholder servicing, legal and compliance matters, pricing of securities, sales and redemptions, and marketing support payments made to financial intermediaries, as well as a third-party survey of transfer agent fees charged to funds within the Franklin Templeton Investments (FTI) complex in comparison with those charged to other fund complexes deemed comparable. Also, related financial statements and other information about the scope and quality of services provided by the investment manager and its affiliates and enhancements to such services over the past year were provided. In addition, the trustees received periodic reports throughout the year and during the renewal process relating to compliance with the Fund’s
investment policies and restrictions. During the renewal process, the independent trustees considered the investment manager’s methods of operation within the Franklin Templeton group and its activities on behalf of other clients. The Board also noted that it received an annual report on all payments made by FTI or the Fund to financial intermediaries engaged in the sale of Fund shares, as well as a memorandum relating to third-party servicing arrangements in response to a Guidance Update from the U.S. Securities and Exchange Commission (SEC) relating to mutual fund distribution and sub-accounting fees.
The information obtained by the trustees during the renewal process also included a special report prepared by Broadridge Financial Solutions, Inc., an independent third-party analyst that utilizes data from Lipper, Inc. (“Lipper”), comparing the Fund’s investment performance and expenses with those of other mutual funds deemed comparable to the Fund as selected by Lipper (Broadridge Section 15(c) Report). The trustees reviewed the Broadridge Section 15(c) Report and its usefulness in the renewal process with respect to matters such as comparative fees, expenses, expense ratios and performance. They concluded that the report continues to be a reliable resource in the performance of their duties.
In addition, the trustees received a Profitability Study (Profitability Study) prepared by management discussing the profitability to FTI from its overall U.S. fund operations, as well as on an individual fund-by-fund basis. Over the past year, the Board and counsel to the independent trustees continued to receive reports on management’s handling of recent regulatory inquiries and pending legal actions against the investment manager and its affiliates. The independent trustees were satisfied with the actions taken to date by management in response to such regulatory and legal matters.
Particular attention was given to the diligent risk management program of the investment manager, including continual monitoring and management of cyber security, liquidity and counterparty credit risk, and attention given to derivatives and other complex instruments that are held and expected to be held by the Fund and how such instruments are used to carry out the Fund’s investment goal. The Board also took into account, among other things, management’s efforts in establishing a global credit facility for the benefit of the Fund and other accounts managed by FTI to provide a source of cash for temporary and emergency purposes or to meet unusual redemption requests as well as the strong financial position of the investment manager’s parent company and its commitment
| franklintempleton.com | Annual Report | 39 | ||
FRANKLIN ALTERNATIVE STRATEGIES FUNDS
FRANKLIN PELAGOS COMMODITIES STRATEGY FUND
SHAREHOLDER INFORMATION
to the mutual fund business. In addition, the Board received updates from management on the SEC’s progress in implementing the rule-making requirements established by the Dodd-Frank Wall Street Reform and Consumer Protection Act (Dodd-Frank Act), which was enacted July 21, 2010, and the compliance of the investment manager with rules and regulations already promulgated by the SEC under such act, as well as the compliance of the investment manager with comprehensive rules and regulations promulgated by the U.S. Commodity Futures Trading Commission.
In addition to the above and other matters considered by the trustees throughout the course of the year, the following discussion relates to certain primary factors relevant to the Board’s decision. This discussion of the information and factors considered by the Board (including the information and factors discussed above) is not intended to be exhaustive, but rather summarizes certain factors considered by the Board. In view of the wide variety of factors considered, the Board did not, unless otherwise noted, find it practicable to quantify or otherwise assign relative weights to the foregoing factors. In addition, individual trustees may have assigned different weights to various factors.
NATURE, EXTENT AND QUALITY OF SERVICES. The trustees reviewed the nature, extent and quality of the services provided, and to be provided, by the investment manager. In this regard, they reviewed the Fund’s actively managed fundamental and quantitative investment philosophy and process and the investment manager’s ability to implement such philosophy and process, including, but not limited to, the investment manager’s trading practices and investment decision processes and efforts to ensure compliance with the Fund’s investment goals, policies, and limitations. The Board also considered the investment management services that the investment manager provides to the Cayman Islands-based company, which is wholly owned by the Fund (Cayman Subsidiary). The trustees reviewed the Fund’s portfolio management team, including its performance, staffing, skills and compensation program. With respect to portfolio manager compensation, management assured the trustees that the Fund’s long-term performance is a significant component of incentive-based compensation and noted that a portion of a portfolio manager’s incentive-based compensation is paid in shares of pre-designated funds from the portfolio manager’s fund management area. The trustees noted that the portfolio manager compensation program aligned the interests of the portfolio managers with that of shareholders of the Fund.
The trustees discussed with management various other products, portfolios and entities that are advised by the investment manager and the allocation of assets and expenses among and within them, as well as their relative fees and reasons for differences with respect thereto and any potential conflicts. During regular Board meetings and the aforementioned meetings of the independent trustees, the trustees considered periodic reports provided to them showing that the investment manager complied with the investment policies and restrictions of the Fund as well as other reports periodically furnished to the Board covering matters such as the compliance of portfolio managers and other management personnel with the code of ethics covering the investment management personnel, the adherence to fair value pricing procedures established by the Board and the accuracy of net asset value calculations. The Board noted the extent of the benefits provided to Fund shareholders from being part of the Franklin Templeton group of funds, including the right to exchange investments between funds (same class) without a sales charge, the ability to reinvest Fund dividends into other funds and the right to combine holdings of other funds to obtain reduced sales charges. The Board considered the investment manager’s significant efforts in developing and implementing compliance procedures established in accordance with SEC and other requirements.
The Board also considered the nature, extent and quality of the services to be provided under the Fund’s other service agreements to determine that, on an overall basis, Fund shareholders were well served. In this connection, the Board also took into account transfer agent and shareholder services provided to Fund shareholders by an affiliate of the investment manager, noting continuing expenditures by management to increase and improve the scope of such services and favorable periodic reports on shareholder services conducted by independent third parties. While such considerations directly affected the trustees’ decision in renewing the Fund’s transfer agent and shareholder services agreement, the Board also considered these commitments as incidental benefits to Fund shareholders deriving from the investment management relationship. Based on their review, the trustees were satisfied with the nature and quality of the overall services provided, and to be provided, by the investment manager and its affiliates to the Fund and its shareholders and were confident in the abilities of the management team to continue to implement the Fund’s actively managed fundamental and quantitative investment philosophy and process and to provide quality services to the Fund and its shareholders.
40 | Annual Report | franklintempleton.com | ||
FRANKLIN ALTERNATIVE STRATEGIES FUNDS
FRANKLIN PELAGOS COMMODITIES STRATEGY FUND
SHAREHOLDER INFORMATION
INVESTMENT PERFORMANCE. As the Fund commenced operations in December 2011, the trustees reviewed the investment performance of the Fund for the one-, three- and five-year periods ended December 31, 2016. As part of their review, they inquired of management regarding benchmark and hedging activities. Consideration was also given to performance in the context of available levels of cash, including as affected by net flows, during the periods. The trustees had meetings during the year, including the meetings referred to above held in connection with the renewal process, with the Fund’s portfolio managers to discuss performance and the management of the Fund. In addition, particular attention in assessing performance was given to the Broadridge Section 15(c) Report. That report showed the investment performance of the Fund (Class A shares) in comparison to other funds determined comparable by Lipper. The comparable funds to the Fund, as chosen by Lipper, included all retail and institutional commodities general funds. The Fund had total returns in the second-highest performing quintile for the one-year period ended December 31, 2016, and had annualized total returns for the three- and five-year periods also in the second-highest performing quintiles. The Board found such comparative performance to be satisfactory.
COMPARATIVE EXPENSES AND PROFITABILITY. The trustees considered the cost of the services provided and to be provided and the losses incurred by the investment manager and its affiliates from their respective relationships with the Fund. As part of the approval process, they explored with management the trends in expense ratios over the past three fiscal years and the reasons for any increases in the Fund’s expense ratios (or components thereof). In considering the appropriateness of the management fee and other expenses charged to the Fund, the Board took into account various factors including investment performance and matters relating to Fund operations, including, but not limited to, the quality and experience of its portfolio managers and research staff. As part of this discussion, the Board took into account the fee waiver and expense limitation arrangement in effect. The Board also considered the investment management services that the investment manager provides to the Cayman Subsidiary and the related fee waivers that were in place. The Board considered the nature of the services provided by the investment manager to the other mutual fund it subadvises with similar investment goals as the Fund, the fees that it charges for such services and any potential conflicts. Consideration was also given to a comparative analysis in the Broadridge Section 15(c) Report of the investment management fee and total expense ratio of the Fund in comparison with those of a group of other funds
selected by Lipper as its appropriate Lipper expense group. Lipper expense data is based upon information taken from the Fund’s most recent semi-annual report, which reflects historical asset levels that may be quite different from those currently existing, particularly in a period of market volatility. While recognizing such inherent limitation and the fact that expense ratios generally increase as assets decline and decrease as assets grow, the Board believed the independent analysis conducted by Lipper to be an appropriate measure of comparative expenses.
In reviewing comparative costs, emphasis was given to the Fund’s contractual management fee in comparison with the contractual management fee that would have been charged by other funds within its Lipper expense group assuming they were similar in size to the Fund, as well as the actual total expenses of the Fund in comparison with those of its Lipper expense group. The Lipper contractual management fee analysis includes administrative charges as being part of the management fee, and total expenses, for comparative consistency, are shown by Lipper for Fund Class A shares. The Fund’s contractual management fee rate was in the least expensive quintile of its Lipper expense group and its total expenses (including Rule 12b-1 fees) were also in the least expensive quintile of such group. The Board was satisfied with such comparative fees and expenses.
The trustees also reviewed the Profitability Study addressing profitability of Franklin Resources, Inc., from its overall U.S. fund business, as well as profitability to the Fund’s investment manager and its affiliates, from providing investment management and other services to the Fund during the 12-month period ended September 30, 2016, the most recent fiscal year end of Franklin Resources, Inc. The trustees reviewed the basis on which such reports are prepared and the cost allocation methodology utilized in the Profitability Study, it being recognized that allocation methodologies may each be reasonable while producing different results. In this respect, the Board noted that the reasonableness of the cost allocation methodologies was reviewed by independent accountants on an every other year basis.
The independent trustees met with management to discuss the Profitability Study. This included, among other things, a comparison of investment management income with investment management expenses of the Fund; comparison of underwriting revenues and expenses; the relative relationship of investment management and underwriting expenses; shareholder servicing profitability; economies of scale; and the relative contribution
| franklintempleton.com | Annual Report | 41 | ||
FRANKLIN ALTERNATIVE STRATEGIES FUNDS
FRANKLIN PELAGOS COMMODITIES STRATEGY FUND
SHAREHOLDER INFORMATION
of the Fund to the profitability of the investment manager and its parent. In discussing the Profitability Study with the Board, the investment manager stated its belief that the costs incurred in establishing the infrastructure necessary to operate the type of mutual fund operations conducted by it and its affiliates may not be fully reflected in the expenses allocated to the Fund in determining its profitability. The Board also took into account management’s expenditures in improving shareholder services provided to the Fund, as well as the need to meet additional regulatory and compliance requirements resulting from the Sarbanes-Oxley Act, the Dodd-Frank Act and recent SEC and other regulatory requirements. The trustees also considered the extent to which the investment manager may derive ancillary benefits from Fund operations.
ECONOMIES OF SCALE. The Board considered economies of scale realized by the investment manager and its affiliates as the Fund grows larger and the extent to which they are shared with Fund shareholders, as for example, in the level of the investment management fees charged, in the quality and efficiency of services rendered and in increased capital commitments benefiting the Fund directly or indirectly. The Board also considered the fee waiver and expense limitation arrangement in effect, and the amount of Fund expenses that were absorbed since inception of the Fund by the investment manager through such waiver and arrangement. The Board concluded that economies of scale were deemed not to be a significant factor at that time in light of, among other matters, the fee waiver and expense limitation arrangement in effect and the limited size of assets under management.
Proxy Voting Policies and Procedures
The Fund’s investment manager has established Proxy Voting Policies and Procedures (Policies) that the Fund uses to determine how to vote proxies relating to portfolio securities. Shareholders may view the Fund’s complete Policies online at franklintempleton.com. Alternatively, shareholders may request copies of the Policies free of charge by calling the Proxy Group collect at (954) 527-7678 or by sending a written request to: Franklin Templeton Companies, LLC, 300 S.E. 2nd Street, Fort Lauderdale, FL 33301, Attention: Proxy Group. Copies of the Fund’s proxy voting records are also made available online at franklintempleton.com and posted on the U.S. Securities and Exchange Commission’s website at sec.gov and reflect the most recent 12-month period ended June 30.
Quarterly Statement of Investments
The Trust, on behalf of the Fund, files a complete statement of investments with the U.S. Securities and Exchange Commission for the first and third quarters for each fiscal year on Form N-Q. Shareholders may view the filed Form N-Q by visiting the Commission’s website at sec.gov. The filed form may also be viewed and copied at the Commission’s Public Reference Room in Washington, DC. Information regarding the operations of the Public Reference Room may be obtained by calling (800) SEC-0330.
Householding of Reports and Prospectuses
You will receive the Fund’s financial reports every six months as well as an annual updated summary prospectus (prospectus available upon request). To reduce Fund expenses, we try to identify related shareholders in a household and send only one copy of the financial reports and summary prospectus. This process, called “householding,” will continue indefinitely unless you instruct us otherwise. If you prefer not to have these documents householded, please call us at (800) 632-2301. At any time you may view current prospectuses/summary prospectuses and financial reports on our website. If you choose, you may receive these documents through electronic delivery.
42 | Annual Report | franklintempleton.com | ||
This page intentionally left blank.
This page intentionally left blank.
 | Annual Report and Shareholder Letter Franklin Pelagos Commodities Strategy Fund
Investment Manager FT AlphaParity, LLC
Distributor Franklin Templeton Distributors, Inc. (800) DIAL BEN® / 342-5236 franklintempleton.com
Shareholder Services (800) 632-2301 |
Authorized for distribution only when accompanied or preceded by a summary prospectus and/or prospectus. Investors should carefully consider a fund’s investment goals, risks, charges and expenses before investing. A prospectus contains this and other information; please read it carefully before investing.
To help ensure we provide you with quality service, all calls to and from our service areas are monitored and/or recorded.
© 2017 Franklin Templeton Investments. All rights reserved. | 995 A 07/17 |
 | Annual Report and Shareholder Letter May 31, 2017 |
Franklin K2 Long Short Credit Fund
A SERIES OF FRANKLIN ALTERNATIVE STRATEGIES FUNDS

Sign up for electronic delivery at franklintempleton.com/edelivery
Franklin Templeton Investments
Gain From Our Perspective®
At Franklin Templeton Investments, we’re dedicated to one goal: delivering exceptional asset management for our clients. By bringing together multiple, world-class investment teams in a single firm, we’re able to offer specialized expertise across styles and asset classes, all supported by the strength and resources of one of the world’s largest asset managers. This has helped us to become a trusted partner to individual and institutional investors across the globe.
Dear Fellow Shareholder:
During the 12 months ended May 31, 2017, the global economy expanded amid improved commodity prices, investor optimism about pro-growth policies in the U.S. and the victory of Emmanuel Macron as France’s president. The U.S. Federal Reserve (Fed) raised its federal funds rate in December 2016 and in March 2017 as policymakers cited ongoing economic expansion. Monetary policy around the globe also remained generally accommodative. In this environment, global developed stock markets, as measured by the MSCI World Index, posted a +17.09% total return for the period.1 Global emerging market stocks, as measured by the MSCI Emerging Markets Index, delivered a +27.88% total return.1 Global government bonds, as measured by the Citigroup World Government Bond Index, had a -0.46% total return.1
A couple of weeks after the end of the reporting period, the Fed raised its target range a quarter point to 1.00%–1.25%. Despite low inflation, the Fed made this decision amid signs of a strengthening labor market and moderately rising economic activity.
In all economic environments, we are committed to our long-term perspective and disciplined investment approach as we conduct diligent, fundamental analysis of securities with a continual emphasis on investment risk management.
We believe active, professional investment management serves investors well. We also recognize the important role of financial advisors in today’s markets and encourage investors to continue to seek their advice. Amid changing market and economic
conditions, we are confident investors with a well-diversified portfolio and a patient, long-term outlook will be well positioned for the years ahead.
In addition, Franklin K2 Long Short Credit Fund’s annual report includes more detail about prevailing conditions and a discussion about investment decisions during the period. Please remember all securities markets fluctuate, as do mutual fund share prices.
We thank you for investing with Franklin Templeton, welcome your questions and comments, and look forward to continuing to serve your investment needs.
Sincerely,

William Y. Yun, CFA
President and Chief Executive Officer – Investment Management
Franklin Alternative Strategies Funds
This letter reflects our analysis and opinions as of May 31, 2017, unless otherwise indicated. The information is not a complete analysis of every aspect of any market, country, industry, security or fund. Statements of fact are from sources considered reliable.
CFA® is a trademark owned by CFA Institute.
1. Source: Morningstar.
See www.franklintempletondatasources.com for additional data provider information.
| Not FDIC Insured | | | May Lose Value | | | No Bank Guarantee |
| franklintempleton.com | Not part of the annual report | 1 |
Annual Report
Visit franklintempleton.com for fund updates, to access your account, or to find helpful financial planning tools.
| 2 | Annual Report | franklintempleton.com |
Annual Report
Franklin K2 Long Short Credit Fund
We are pleased to bring you Franklin K2 Long Short Credit Fund’s annual report for the fiscal year ended May 31, 2017.
Your Fund’s Goal and Main Investments
The Fund seeks total return through a combination of current income, capital preservation and capital appreciation. The Fund seeks to achieve its investment goal by allocating its assets across multiple non-traditional or “alternative” strategies, including but not limited to credit long short, structured credit and emerging market fixed income. The Fund is structured as a multi-manager fund, meaning the Fund’s assets are managed by multiple subadvisors, while the Fund’s investment manager has overall responsibility for the Fund’s investments.
Under normal market conditions, the Fund invests at least 80% of its net assets, plus the amount of any borrowings for investment purposes, in credit-related investments. The Fund invests in a wide range of securities and other investments including, but not limited to: corporate bonds, mortgage-backed securities and asset-backed securities, U.S. government and agency securities, collateralized debt and loan obligations, foreign government and supranational debt securities, loans and loan participations and derivatives with similar economic characteristics. The Fund may also invest in repurchase agreements, reverse repurchase agreements, mortgage real estate investment trusts (REITs) and other similar transactions.
Performance Overview
The Fund’s Class A shares delivered a +7.58% cumulative total return for the 12 months under review. For comparison, the Fund’s primary benchmark, the BofA Merrill Lynch US 3-Month Treasury Bill Index, which is an index of short-term U.S. government securities with a remaining term to final maturity of less than three months, posted a +0.44% total return for the same period.1 Also for comparison, the Fund’s secondary benchmark, the HFRX Fixed Income-Credit Index, which measures performance of strategies with exposure to credit across a broad continuum of credit substrategies, generated a +6.29%
Portfolio Composition*
5/31/17
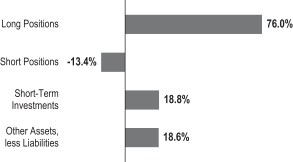
*Figures represent the net Fund exposure and include certain derivatives held in the portfolio (or their underlying reference assets) or unsettled trades and may not total 100% or may be negative due to rounding, use of any derivatives or other factors.
total return for the same period.2 You can find more of the Fund’s performance data in the Performance Summary beginning on page 7.
Performance data represent past performance, which does not guarantee future results. Investment return and principal value will fluctuate, and you may have a gain or loss when you sell your shares. Current performance may differ from figures shown. For most recent month-end performance, go to franklintempleton.com or call (800) 342-5236.
Economic and Market Overview
The global economy grew moderately during the period under review. In this environment, global developed and emerging market stocks rose significantly, as measured by the MSCI All Country World Index. Global markets were aided by accommodative monetary policies of various central banks, improved industrial commodity prices at certain points during the period, investor optimism about pro-growth policies in the U.S., continued hopes of tax reforms under the Trump administration, the victory of Emmanuel Macron as France’s President and encouraging corporate earnings reports. A deal by major oil producing countries in December to curb oil production also supported global equity markets.
1. Source: Morningstar.
2. Source: FactSet. Hedge Fund Research, Inc. – www.hedgefundresearch.com. The HFRX Fixed Income-Credit Index is being used under license from Hedge Fund Research, Inc., which does not endorse or approve of any of the contents of this report.
The indexes are unmanaged and include reinvestment of any income or distributions. They do not reflect any fees, expenses or sales charges. One cannot invest directly in an index, and an index is not representative of the Fund’s portfolio. Unlike most asset class indexes, HFR Index returns reflect fees and expenses.
The dollar value, number of shares or principal amount, and names of all portfolio holdings are listed in the Fund’s Statement of Investments (SOI). The SOI begins on page 16.
| franklintempleton.com | Annual Report | 3 |
FRANKLIN K2 LONG SHORT CREDIT FUND
However, investors expressed concerns about the timing and economic effects of the U.K.’s exit from the European Union (also known as “Brexit”) and the U.S. executive order banning entry from some Muslim-majority countries. Other headwinds included the health of European banks, concerns surrounding U.S. political turmoil, political worries in the European Union, geopolitical tensions in certain regions and worries about global oversupply in oil production despite a pact to extend cuts.
The U.S. economy expanded during the period. The economy strengthened in 2016’s third quarter, but moderated in the next two quarters, largely due to declines in private inventory investment and government spending. The manufacturing sector generally expanded, and the services sector also continued to grow. The unemployment rate decreased from 4.7% in May 2016 to 4.3% at period-end.3 Monthly retail sales were volatile, but mostly grew during the period. Annual inflation, as measured by the Consumer Price Index, generally increased during the period. At its December 2016 meeting, the U.S. Federal Reserve (Fed) raised its target range for the federal funds rate from 0.25%–0.50% to 0.50%–0.75%. The Fed, at its March 2017 meeting, made the widely anticipated increase in its federal funds target rate to 0.75%–1.00%. Following a weak batch of data releases in April, the Fed, at its May meeting, kept its interest rate unchanged.
In Europe, the U.K.’s economy grew at a faster rate in 2016’s fourth quarter over the third quarter, supported by growth in services. However, the nation’s growth rate moderated in 2017’s first quarter, largely due to slower growth in household spending. The Bank of England cut its benchmark interest rate and expanded its massive bond-buying program in August 2016 to boost the nation’s growth. The eurozone’s growth held steady in the first quarter over the previous quarter. The bloc’s annual inflation rate increased gradually to reach its highest level in four years in February, but declined in March. Although it rebounded in April, the inflation rate fell again in May due to slower growth in prices of energy and food products. The European Central Bank, at its April meeting, kept its key policy rates unchanged.
In Asia, Japan’s quarterly gross domestic product (GDP) accelerated in 2016’s fourth quarter and 2017’s first quarter. In April 2017, the Bank of Japan slightly increased its GDP forecasts for the 2018 fiscal year; however, inflation forecasts were reduced.
In emerging markets, Brazil’s quarterly GDP grew for the first time in two years, as its first-quarter 2017 GDP grew compared
to the previous quarter. The country’s central bank cut its benchmark interest rate several times between November 2016 and May 2017 to spur economic growth. Russia’s GDP grew in 2016’s fourth quarter and 2017’s first quarter compared to the prior-year periods, as oil prices rebounded, exports and industrial production grew, and consumer demand showed signs of improvement. The Bank of Russia reduced its key interest rate in June and September 2016 and in March and April 2017 to try to revive its economy. China’s economic growth decelerated in 2016’s fourth quarter compared to the previous year, although growth edged up in 2017’s first quarter compared to 2016’s first quarter, largely driven by higher government spending. The People’s Bank of China left its benchmark interest rate unchanged during the period. Overall, emerging market stocks, as measured by the MSCI Emerging Markets Index, rose during the period.
Investment Strategy
We manage the Fund using a multi-manager approach. While we are responsible for the Fund’s overall investments, we allocate assets to multiple subadvisors, each of whom independently manages a separate portion of the Fund’s portfolio in accordance with some or all of the following strategies: credit long short, structured credit and emerging market fixed income. We allocate the Fund’s assets among these strategies utilizing a top-down approach, generating the Fund’s strategy and subadvisor weightings by taking into account market conditions, risk factors, diversification, liquidity, transparency, and other investment options, among other things.
Credit long short strategies seek to isolate issuer-specific exposure, while limiting general market risks, by taking long and/or short positions in debt securities and other related instruments. Structured credit strategies aim to profit from trading in interest-rate sensitive securities such as residential and commercial mortgage-backed securities, REITs, credit default swaps on various indexes, collateralized loan obligations and asset-backed securities. Emerging market fixed income strategies invest in corporate and/or sovereign securities in emerging markets countries with a focus on fixed income.
The Fund takes long and/or short positions in a wide range of asset classes, including credit, fixed income, equities and currencies, among others. The Fund may gain long or short exposure to select instruments by utilizing derivatives, engaging in short sales or entering into a series of purchase and sale contracts or repurchase agreements. Long positions benefit from an increase in the price of the underlying instrument, while
3. Source: Bureau of Labor Statistics
See www.franklintempletondatasources.com for additional data provider information.
| 4 | Annual Report | franklintempleton.com |
FRANKLIN K2 LONG SHORT CREDIT FUND
short positions benefit from a decrease in that price. The Fund may also use derivatives for hedging and nonhedging (investment) purposes. Such derivative investments may include currency forward contracts; futures contracts; put and call options on currencies, securities, indexes and exchange-traded funds; and swaps. The Fund may engage in active and frequent trading as part of its investment strategies.
What is a currency forward contract?
A currency forward contract is an agreement between the Fund and a counterparty to buy or sell a foreign currency in exchange for another currency at a specific exchange rate on a future date.
What is a futures contract?
A futures contract is an agreement between the Fund and a counterparty made through a U.S. or foreign futures exchange to buy or sell an underlying instrument or asset at a specific price on a future date.
What is an option?
An option is a contract to buy or sell a specific financial product known as the option’s underlying instrument at a specific price. The buyer of an option has the right, but not the obligation, to buy or sell the underlying instrument at or until a specified expiration date. Conversely, the seller (“writer”) of an option who opens a transaction is obligated to buy or sell the underlying instrument should the option holder exercise that right.
What are swap agreements?
Swap agreements, such as interest rate, currency and credit default swaps, are contracts between the Fund and another party (the swap counterparty). In a basic swap transaction, the Fund agrees with the swap counterparty to exchange the returns (or differentials in rates of return) earned or realized on a particular “notional amount” of underlying instruments. The notional amount is the set amount selected by the parties as the basis on which to calculate the obligations that they have agreed to exchange. The parties typically do not actually exchange the notional amount. Instead, they agree to exchange the returns that would be earned or realized if the notional amount were invested in given instruments or at given interest rates.
Manager’s Discussion
The Fund’s subadvisors for the 12-month period under review were Apollo Credit Management, Candlewood Investment Group, Chatham Asset Management, Ellington Global Asset Management and Emso Asset Management Limited. All subadvisors generated positive returns for the period and contributed to the Fund’s performance. Ellington was the top performer in terms of contribution to aggregate gains, followed by Chatham, Emso, Candlewood and Apollo, respectively.
| Subadvisors | ||||
| 5/31/17 | ||||
| Credit Long Short | ||||
Apollo Credit Management LLC | ||||
Chatham Asset Management, LLC | ||||
| Structured Credit | ||||
Candlewood Investment Group, L.P. | ||||
Ellington Global Asset Management, L.L.C. | ||||
| Emerging Markets Fixed Income | ||||
Emso Asset Management Limited | ||||
In terms of strategy performance, the largest contributor to the Fund’s performance was structured credit, followed by credit long short and emerging markets fixed income.
By asset class, the top contributors to the Fund’s aggregate performance were credit and interest rates, while equity and currency exposures detracted. Equity detracted due to the subadvisors’ use of short positions on equity indexes as a portfolio hedge against overall market declines.
In terms of aggregate sector exposures, the top performance drivers for the Fund were mortgage securities, communications, asset-backed securities, government credit, basic materials and energy. Key detractors to aggregate performance were equity, credit and fixed income indexes, and consumer staples and industrials.
Broadly speaking, the Fund’s subadvisors benefited from the continued rally in credit assets over the period. In addition to the support from the credit markets, the subadvisors generated gains from a variety of event-driven long positions. In structured products, non-agency residential mortgage-backed securities experienced modest tightening, and litigation-related non-agency residential mortgage-backed bonds saw a healthy bid as originators were more inclined to settle. Commercial mortgage-backed securities (CMBS) benefited subadvisors from both the long (specific legacy bonds where loans were paying off) and short side (CMBX indexes, which are synthetic indexes that offer exposure to CMBS, trading wider due to weakness in retail).
| franklintempleton.com | Annual Report | 5 |
FRANKLIN K2 LONG SHORT CREDIT FUND
Thank you for your participation in Franklin K2 Long Short Credit Fund. We look forward to continuing to serve your future investment needs.
 |
Charmaine Chin |

 |
Jeff Schmidt | |
Robert Christian David C. Saunders
Portfolio Management Team |

The foregoing information reflects our analysis, opinions and portfolio holdings as of May 31, 2017, the end of the reporting period. The way we implement our main investment strategies and the resulting portfolio holdings may change depending on factors such as market and economic conditions. These opinions may not be relied upon as investment advice or an offer for a particular security. The information is not a complete analysis of every aspect of any market, country, industry, security or the Fund. Statements of fact are from sources considered reliable, but the investment manager makes no representation or warranty as to their completeness or accuracy. Although historical performance is no guarantee of future results, these insights may help you understand our investment management philosophy.
| 6 | Annual Report | franklintempleton.com |
FRANKLIN K2 LONG SHORT CREDIT FUND
Performance Summary as of May 31, 2017
The performance table and graphs do not reflect any taxes that a shareholder would pay on Fund dividends, capital gain distributions, if any, or any realized gains on the sale of Fund shares. Total return reflects reinvestment of the Fund’s dividends and capital gain distributions, if any, and any unrealized gains or losses. Your dividend income will vary depending on dividends or interest paid by securities in the Fund’s portfolio, adjusted for operating expenses of each class. Capital gain distributions are net profits realized from the sale of portfolio securities.
Performance as of 5/31/171
Cumulative total return excludes sales charges. Average annual total return includes maximum sales charges. Sales charges will vary depending on the size of the investment and the class of share purchased. The maximum is 5.75% and the minimum is 0%. Class A: 5.75% maximum initial sales charge; Advisor Class: no sales charges. For other share classes, visit franklintempleton.com.
| Share Class | Cumulative Total Return2 | Average Annual Total Return3 | ||||||
| A | ||||||||
1-Year | +7.58% | +1.39% | ||||||
Since Inception (9/8/15) | +10.80% | +2.54% | ||||||
| Advisor | ||||||||
1-Year | +7.70% | +7.70% | ||||||
Since Inception (9/8/15) | +10.92% | +6.18% | ||||||
Performance data represent past performance, which does not guarantee future results. Investment return and principal value will fluctuate, and you may have a gain or loss when you sell your shares. Current performance may differ from figures shown. For most recent month-end performance, go to franklintempleton.com or call (800) 342-5236.
See page 9 for Performance Summary footnotes.
| franklintempleton.com | Annual Report | 7 |
FRANKLIN K2 LONG SHORT CREDIT FUND
PERFORMANCE SUMMARY
Total Return Index Comparison for a Hypothetical $10,000 Investment1
Total return represents the change in value of an investment over the periods shown. It includes any applicable maximum sales charge, Fund expenses, account fees and reinvested distributions. The unmanaged indexes include reinvestment of any income or distributions. These differ from the Fund in composition and do not pay management fees or expenses. One cannot invest directly in an index.
Class A (9/8/15–5/31/17)
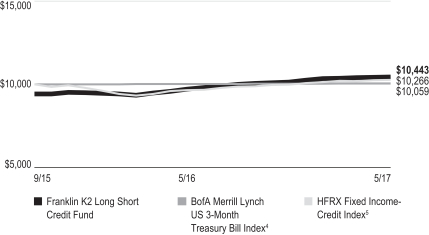
Advisor Class (9/8/15–5/31/17)
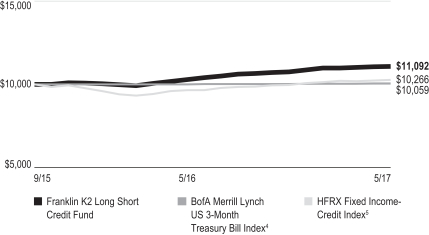
See page 9 for Performance Summary footnotes.
| 8 | Annual Report | franklintempleton.com |
FRANKLIN K2 LONG SHORT CREDIT FUND
PERFORMANCE SUMMARY
Distributions (6/1/16–5/31/17)
| Share Class | Net Investment | Short-Term Capital Gain | Total | |||||||||
A | $0.3184 | $0.1028 | $0.4212 | |||||||||
C | $0.2818 | $0.1028 | $0.3846 | |||||||||
R | $0.3157 | $0.1028 | $0.4185 | |||||||||
R6 | $0.3208 | $0.1028 | $0.4236 | |||||||||
Advisor | $0.3199 | $0.1028 | $0.4227 | |||||||||
Total Annual Operating Expenses6
| Share Class | With Waiver | Without Waiver | ||||||
A | 2.60% | 3.61% | ||||||
Advisor | 2.35% | 3.36% | ||||||
Each class of shares is available to certain eligible investors and has different annual fees and expenses, as described in the prospectus.
All investments involve risks, including possible loss of principal. The market values of securities owned by the Fund will go up or down, sometimes rapidly or unpredictably. The Fund’s performance depends on the manager’s skill in selecting, overseeing and allocating Fund assets to the subadvisors. The Fund is actively managed and could experience losses if the manager’s and subadvisors’ judgment about particular Fund portfolio investments prove to be incorrect. Some subadvisors may have little or no experience managing the assets of a registered investment company. Bond prices generally move in the opposite direction of interest rates. Changes in the financial strength of a bond issuer or in a bond’s credit rating may affect its value. Lower rated or high yield debt securities (junk bonds) involve greater credit risk, including the possibility of default or bankruptcy. Liquidity risk exists when securities become more difficult to sell, or are unable to be sold, at the price at which they’ve been valued. Investments in derivatives involve costs and create economic leverage, which may result in significant volatility and cause the Fund to participate in losses (as well as gains) that significantly exceed the Fund’s initial investment. The Fund may make short sales of securities, which involves the risk that losses may exceed the original amount invested. The Fund’s prospectus also includes a description of the main investment risks.
1. The Fund has an expense reduction contractually guaranteed through 9/30/17. Fund investment results reflect the expense reduction; without this reduction, the results would have been lower.
2. Cumulative total return represents the change in value of an investment over the periods indicated.
3. Average annual total return represents the average annual change in value of an investment over the periods indicated. Return for less than one year, if any, has not been annualized.
4. Source: Morningstar. The BofA Merrill Lynch US 3-Month Treasury Bill Index is an index of short-term U.S. government securities with a remaining term to final maturity of less than three months.
5. Source: Factset. Hedge Fund Research, Inc. – www.hedgefundresearch.com. The HFRX Fixed Income-Credit Index measures performance of strategies with exposure to credit across a broad continuum of credit substrategies, including corporate, sovereign, distressed, convertible, asset backed, capital structure arbitrage, multi-strategy and other relative value and event driven substrategies. Investment thesis across all strategies is predicated on realization of a valuation discrepancy between the related credit instruments. Strategies may also include and utilize equity securities, credit derivatives, government fixed income, commodities, currencies or other hybrid securities.
6. Figures are as stated in the Fund’s current prospectus and may differ from the expense ratios disclosed in the Your Fund’s Expenses and Financial Highlights sections in this report. In periods of market volatility, assets may decline significantly, causing total annual Fund operating expenses to become higher than the figures shown.
See www.franklintempletondatasources.com for additional data provider information.
| franklintempleton.com | Annual Report | 9 |
FRANKLIN K2 LONG SHORT CREDIT FUND
As a Fund shareholder, you can incur two types of costs: (1) transaction costs, including sales charges (loads) on Fund purchases and redemptions; and (2) ongoing Fund costs, including management fees, distribution and service (12b-1) fees, and other Fund expenses. All mutual funds have ongoing costs, sometimes referred to as operating expenses. The table below shows ongoing costs of investing in the Fund and can help you understand these costs and compare them with those of other mutual funds. The table assumes a $1,000 investment held for the six months indicated.
Actual Fund Expenses
The table below provides information about actual account values and actual expenses in the columns under the heading “Actual.” In these columns the Fund’s actual return, which includes the effect of Fund expenses, is used to calculate the “Ending Account Value” for each class of shares. You can estimate the expenses you paid during the period by following these steps (of course, your account value and expenses will differ from those in this illustration): Divide your account value by $1,000 (if your account had an $8,600 value, then $8,600 ÷ $1,000 = 8.6). Then multiply the result by the number in the row for your class of shares under the headings “Actual” and “Expenses Paid During Period” (if Actual Expenses Paid During Period were $7.50, then 8.6 × $7.50 =$64.50). In this illustration, the actual expenses paid this period are $64.50.
Hypothetical Example for Comparison with Other Funds
Under the heading “Hypothetical” in the table, information is provided about hypothetical account values and hypothetical expenses based on the Fund’s actual expense ratio and an assumed rate of return of 5% per year before expenses, which is not the Fund’s actual return. This information may not be used to estimate the actual ending account balance or expenses you paid for the period, but it can help you compare ongoing costs of investing in the Fund with those of other funds. To do so, compare this 5% hypothetical example for the class of shares you hold with the 5% hypothetical examples that appear in the shareholder reports of other funds.
Please note that expenses shown in the table are meant to highlight ongoing costs and do not reflect any transactional costs. Therefore, information under the heading “Hypothetical” is useful in comparing ongoing costs only, and will not help you compare total costs of owning different funds. In addition, if transactional costs were included, your total costs would have been higher.
| Actual (actual return after expenses) | Hypothetical (5% annual return before expenses) | |||||||||||||||||||||||
Share | Beginning Account Value 12/1/16 | Ending Account Value 5/31/17 | Expenses Paid During Period 12/1/16–5/31/171,2 | Ending Account Value 5/31/17 | Expenses Paid During Period 12/1/16–5/31/171,2 | Net Annualized Expense Ratio2 | ||||||||||||||||||
| A | $ | 1,000 | $ | 1,030.20 | $ | 15.13 | $ | 1,010.02 | $ | 14.98 | 2.99 | % | ||||||||||||
| C | $ | 1,000 | $ | 1,024.90 | $ | 19.69 | $ | 1,005.48 | $ | 19.50 | 3.90 | % | ||||||||||||
| R | $ | 1,000 | $ | 1,029.10 | $ | 17.00 | $ | 1,008.18 | $ | 16.82 | 3.36 | % | ||||||||||||
| R6 | $ | 1,000 | $ | 1,030.40 | $ | 14.63 | $ | 1,010.52 | $ | 14.49 | 2.89 | % | ||||||||||||
| Advisor | $ | 1,000 | $ | 1,030.30 | $ | 14.68 | $ | 1,010.47 | $ | 14.54 | 2.90 | % | ||||||||||||
1. Expenses are equal to the annualized expense ratio for the six-month period as indicated above—in the far right column—multiplied by the simple average account value over the period indicated, and then multiplied by 182/365 to reflect the one-half year period.
2. Reflects expenses after fee waivers and expense reimbursements. Does not include acquired fund fees and expenses.
| 10 | Annual Report | franklintempleton.com |
FRANKLIN ALTERNATIVE STRATEGIES FUNDS
Franklin K2 Long Short Credit Fund
| Year Ended May 31, | ||||||||
| 2017 | 2016a | |||||||
| Class A | ||||||||
| Per share operating performance (for a share outstanding throughout the year) | ||||||||
Net asset value, beginning of year | $ | 10.15 | $ | 10.00 | ||||
|
| |||||||
| Income from investment operationsb: | ||||||||
Net investment incomec | 0.23 | 0.21 | ||||||
Net realized and unrealized gains (losses) | 0.53 | 0.08 | ||||||
|
| |||||||
Total from investment operations | 0.76 | 0.29 | ||||||
|
| |||||||
| Less distributions from: | ||||||||
Net investment income | (0.32 | ) | (0.08 | ) | ||||
Net realized gains | (0.10 | ) | (0.06 | ) | ||||
|
| |||||||
Total distributions | (0.42 | ) | (0.14 | ) | ||||
|
| |||||||
Net asset value, end of year | $ | 10.49 | $ | 10.15 | ||||
|
| |||||||
Total returnd | 7.58% | 2.99% | ||||||
| Ratios to average net assetse | ||||||||
Expenses before waiver, payments by affiliates and expense reductionf | 3.50% | 3.37% | ||||||
Expenses net of waiver, payments by affiliates and expense reductionf | 2.75% | 2.30% | g | |||||
Expenses incurred in connection with securities sold short | 0.76% | 0.40% | ||||||
Net investment income | 2.24% | 2.85% | ||||||
| Supplemental data | ||||||||
Net assets, end of year (000’s) | $41,001 | $28,198 | ||||||
Portfolio turnover rate | 317.70% | 511.62% | ||||||
aFor the period September 8, 2015 (commencement of operations) to May 31, 2016.
bThe amount shown for a share outstanding throughout the period may not correlate with the Statement of Operations for the period due to the timing of sales and repurchases of the Fund’s shares in relation to income earned and/or fluctuating fair value of the investments of the Fund.
cBased on average daily shares outstanding.
dTotal return does not reflect sales commissions or contingent deferred sales charges, if applicable, and is not annualized for periods less than one year.
eRatios are annualized for periods less than one year, except for non-recurring expenses, if any.
fIncludes dividend and/or interest expense on securities sold short and security borrowing fees, if any. See below for the ratios of such expenses to average net assets for the periods presented. See Note 1(f).
gBenefit of expense reduction rounds to less than 0.01%.
| franklintempleton.com | The accompanying notes are an integral part of these financial statements. | Annual Report | 11 |
FRANKLIN ALTERNATIVE STRATEGIES FUNDS
FINANCIAL HIGHLIGHTS
Franklin K2 Long Short Credit Fund (continued)
| Year Ended May 31, | ||||||||
| 2017 | 2016a | |||||||
| Class C | ||||||||
| Per share operating performance (for a share outstanding throughout the year) | ||||||||
Net asset value, beginning of year | $ | 10.07 | $ | 10.00 | ||||
|
| |||||||
| Income from investment operationsb: | ||||||||
Net investment incomec | 0.14 | 0.09 | ||||||
Net realized and unrealized gains (losses) | 0.52 | 0.12 | ||||||
|
| |||||||
Total from investment operations | 0.66 | 0.21 | ||||||
|
| |||||||
| Less distributions from: | ||||||||
Net investment income | (0.28 | ) | (0.08 | ) | ||||
Net realized gains | (0.10 | ) | (0.06 | ) | ||||
|
| |||||||
Total distributions | (0.38 | ) | (0.14 | ) | ||||
|
| |||||||
Net asset value, end of year | $ | 10.35 | $ | 10.07 | ||||
|
| |||||||
Total returnd | 6.56% | 2.20% | ||||||
| Ratios to average net assetse | ||||||||
Expenses before waiver, payments by affiliates and expense reductionf | 4.44% | 3.62% | ||||||
Expenses net of waiver, payments by affiliates and expense reductionf | 3.69% | 2.55% | g | |||||
Expenses incurred in connection with securities sold short | 0.76% | 0.40% | ||||||
Net investment income | 1.30% | 2.60% | ||||||
| Supplemental data | ||||||||
Net assets, end of year (000’s) | $1,507 | $270 | ||||||
Portfolio turnover rate | 317.70% | 511.62% | ||||||
aFor the period September 8, 2015 (commencement of operations) to May 31, 2016.
bThe amount shown for a share outstanding throughout the period may not correlate with the Statement of Operations for the period due to the timing of sales and repurchases of the Fund’s shares in relation to income earned and/or fluctuating fair value of the investments of the Fund.
cBased on average daily shares outstanding.
dTotal return does not reflect sales commissions or contingent deferred sales charges, if applicable, and is not annualized for periods less than one year.
eRatios are annualized for periods less than one year, except for non-recurring expenses, if any.
fIncludes dividend and/or interest expense on securities sold short and security borrowing fees, if any. See below for the ratios of such expenses to average net assets for the periods presented. See Note 1(f).
gBenefit of expense reduction rounds to less than 0.01%.
| 12 | Annual Report | The accompanying notes are an integral part of these financial statements. | franklintempleton.com |
FRANKLIN ALTERNATIVE STRATEGIES FUNDS
FINANCIAL HIGHLIGHTS
Franklin K2 Long Short Credit Fund (continued)
| Year Ended May 31, | ||||||||
| 2017 | 2016a | |||||||
| Class R | ||||||||
| Per share operating performance (for a share outstanding throughout the year) | ||||||||
Net asset value, beginning of year | $ | 10.10 | $ | 10.00 | ||||
|
| |||||||
| Income from investment operationsb: | ||||||||
Net investment incomec | 0.20 | 0.08 | ||||||
Net realized and unrealized gains (losses) | 0.53 | 0.16 | ||||||
|
| |||||||
Total from investment operations | 0.73 | 0.24 | ||||||
|
| |||||||
| Less distributions from: | ||||||||
Net investment income | (0.32 | ) | (0.08 | ) | ||||
Net realized gains | (0.10 | ) | (0.06 | ) | ||||
|
| |||||||
Total distributions | (0.42 | ) | (0.14 | ) | ||||
|
| |||||||
Net asset value, end of year | $ | 10.41 | $ | 10.10 | ||||
|
| |||||||
Total returnd | 7.29% | 2.48% | ||||||
| Ratios to average net assetse | ||||||||
Expenses before waiver, payments by affiliates and expense reductionf | 3.83% | 3.37% | ||||||
Expenses net of waiver, payments by affiliates and expense reductionf | 3.08% | 2.30% | g | |||||
Expenses incurred in connection with securities sold short | 0.76% | 0.40% | ||||||
Net investment income | 1.91% | 2.85% | ||||||
| Supplemental data | ||||||||
Net assets, end of year (000’s) | $127 | $12 | ||||||
Portfolio turnover rate | 317.70% | 511.62% | ||||||
aFor the period September 8, 2015 (commencement of operations) to May 31, 2016.
bThe amount shown for a share outstanding throughout the period may not correlate with the Statement of Operations for the period due to the timing of sales and repurchases of the Fund’s shares in relation to income earned and/or fluctuating fair value of the investments of the Fund.
cBased on average daily shares outstanding.
dTotal return is not annualized for periods less than one year.
eRatios are annualized for periods less than one year, except for non-recurring expenses, if any.
fIncludes dividend and/or interest expense on securities sold short and security borrowing fees, if any. See below for the ratios of such expenses to average net assets for the periods presented. See Note 1(f).
gBenefit of expense reduction rounds to less than 0.01%.
| franklintempleton.com | The accompanying notes are an integral part of these financial statements. | Annual Report | 13 |
FRANKLIN ALTERNATIVE STRATEGIES FUNDS
FINANCIAL HIGHLIGHTS
Franklin K2 Long Short Credit Fund (continued)
| Year Ended May 31, | ||||||||
| 2017 | 2016a | |||||||
| Class R6 | ||||||||
| Per share operating performance (for a share outstanding throughout the year) | ||||||||
Net asset value, beginning of year | $ | 10.15 | $ | 10.00 | ||||
|
| |||||||
| Income from investment operationsb: | ||||||||
Net investment incomec | 0.24 | 0.23 | ||||||
Net realized and unrealized gains (losses) | 0.53 | 0.06 | ||||||
|
| |||||||
Total from investment operations | 0.77 | 0.29 | ||||||
|
| |||||||
| Less distributions from: | ||||||||
Net investment income | (0.32 | ) | (0.08 | ) | ||||
Net realized gains | (0.10 | ) | (0.06 | ) | ||||
|
| |||||||
Total distributions | (0.42 | ) | (0.14 | ) | ||||
|
| |||||||
Net asset value, end of year | $ | 10.50 | $ | 10.15 | ||||
|
| |||||||
Total returnd | 7.71% | 3.01% | ||||||
| Ratios to average net assetse | ||||||||
Expenses before waiver, payments by affiliates and expense reductionf | 3.43% | 3.35% | ||||||
Expenses net of waiver, payments by affiliates and expense reductionf | 2.68% | 2.28% | g | |||||
Expenses incurred in connection with securities sold short | 0.76% | 0.40% | ||||||
Net investment income | 2.31% | 2.87% | ||||||
| Supplemental data | ||||||||
Net assets, end of year (000’s) | $13,052 | $12,384 | ||||||
Portfolio turnover rate | 317.70% | 511.62% | ||||||
aFor the period September 8, 2015 (commencement of operations) to May 31, 2016.
bThe amount shown for a share outstanding throughout the period may not correlate with the Statement of Operations for the period due to the timing of sales and repurchases of the Fund’s shares in relation to income earned and/or fluctuating fair value of the investments of the Fund.
cBased on average daily shares outstanding.
dTotal return is not annualized for periods less than one year.
eRatios are annualized for periods less than one year, except for non-recurring expenses, if any.
fIncludes dividend and/or interest expense on securities sold short and security borrowing fees, if any. See below for the ratios of such expenses to average net assets for the periods presented. See Note 1(f).
gBenefit of expense reduction rounds to less than 0.01%.
| 14 | Annual Report | The accompanying notes are an integral part of these financial statements. | franklintempleton.com |
FRANKLIN ALTERNATIVE STRATEGIES FUNDS
FINANCIAL HIGHLIGHTS
Franklin K2 Long Short Credit Fund (continued)
| Year Ended May 31, | ||||||||
| 2017 | 2016a | |||||||
| Advisor Class | ||||||||
| Per share operating performance (for a share outstanding throughout the year) | ||||||||
Net asset value, beginning of year | $ | 10.15 | $ | 10.00 | ||||
|
| |||||||
| Income from investment operationsb: | ||||||||
Net investment incomec | 0.24 | 0.20 | ||||||
Net realized and unrealized gains (losses) | 0.53 | 0.09 | ||||||
|
| |||||||
Total from investment operations | 0.77 | 0.29 | ||||||
|
| |||||||
| Less distributions from: | ||||||||
Net investment income | (0.32 | ) | (0.08 | ) | ||||
Net realized gains | (0.10 | ) | (0.06 | ) | ||||
|
| |||||||
Total distributions | (0.42 | ) | (0.14 | ) | ||||
|
| |||||||
Net asset value, end of year | $ | 10.50 | $ | 10.15 | ||||
|
| |||||||
Total returnd | 7.70% | 2.99% | ||||||
| Ratios to average net assetse | ||||||||
Expenses before waiver, payments by affiliates and expense reductionf | 3.44% | 3.36% | ||||||
Expenses net of waiver, payments by affiliates and expense reductionf | 2.69% | 2.29% | g | |||||
Expenses incurred in connection with securities sold short | 0.76% | 0.40% | ||||||
Net investment income | 2.30% | 2.86% | ||||||
| Supplemental data | ||||||||
Net assets, end of year (000’s) | $25,125 | $23,058 | ||||||
Portfolio turnover rate | 317.70% | 511.62% | ||||||
aFor the period September 8, 2015 (commencement of operations) to May 31, 2016.
bThe amount shown for a share outstanding throughout the period may not correlate with the Statement of Operations for the period due to the timing of sales and repurchases of the Fund’s shares in relation to income earned and/or fluctuating fair value of the investments of the Fund.
cBased on average daily shares outstanding.
dTotal return is not annualized for periods less than one year.
eRatios are annualized for periods less than one year, except for non-recurring expenses, if any.
fIncludes dividend and/or interest expense on securities sold short and security borrowing fees, if any. See below for the ratios of such expenses to average net assets for the periods presented. See Note 1(f).
gBenefit of expense reduction rounds to less than 0.01%.
| franklintempleton.com | The accompanying notes are an integral part of these financial statements. | Annual Report | 15 |
FRANKLIN ALTERNATIVE STRATEGIES FUNDS
Statement of Investments, May 31, 2017
| Franklin K2 Long Short Credit Fund | ||||||||||||||
| Country | Shares/Rights | Value | ||||||||||||
| Common Stocks and Other Equity Interests 1.1% | ||||||||||||||
| Consumer Finance 0.2% | ||||||||||||||
| n | iPayment Inc. | United States | 466,839 | $ | 186,736 | |||||||||
|
| |||||||||||||
| Diversified Telecommunication Services 0.1% | ||||||||||||||
| a | CenturyLink Inc. | United States | 3,103 | 77,420 | ||||||||||
|
| |||||||||||||
| Equity Real Estate Investment Trusts (REITs) 0.1% | ||||||||||||||
| a,b | iStar Inc. | United States | 5,069 | 61,385 | ||||||||||
|
| |||||||||||||
| Independent Power & Renewable Electricity Producers 0.6% | ||||||||||||||
| a | NRG Yield Inc., A | United States | 24,429 | 420,179 | ||||||||||
| a | NRG Yield Inc., C | United States | 4,177 | 73,933 | ||||||||||
|
| |||||||||||||
| 494,112 | ||||||||||||||
|
| |||||||||||||
| Media 0.0%† | ||||||||||||||
| b | Postmedia Network Canada Corp. | Canada | 56,068 | 21,168 | ||||||||||
|
| |||||||||||||
| Pharmaceuticals 0.0%† | ||||||||||||||
| b | Sanofi, Contingent Value, rts., 12/31/20 | France | 26,594 | 10,638 | ||||||||||
|
| |||||||||||||
| Road & Rail 0.1% | ||||||||||||||
| b | Hertz Global Holdings Inc. | United States | 3,406 | 34,775 | ||||||||||
|
| |||||||||||||
Total Common Stocks and Other Equity Interests | 886,234 | |||||||||||||
|
| |||||||||||||
| Convertible Preferred Stocks 0.3% | ||||||||||||||
| Diversified Telecommunication Services 0.1% | ||||||||||||||
Frontier Communications Corp., 11.125%, cvt. pfd. | United States | 1,370 | 46,456 | |||||||||||
|
| |||||||||||||
| Independent Power & Renewable Electricity Producers 0.2% | ||||||||||||||
| a | Dynegy Inc., 7.00%, cvt. pfd. | United States | 2,582 | 160,471 | ||||||||||
|
| |||||||||||||
Total Convertible Preferred Stocks (Cost $222,586) | 206,927 | |||||||||||||
|
| |||||||||||||
| Preferred Stocks 0.4% | ||||||||||||||
| Consumer Finance 0.3% | ||||||||||||||
b,n | iPayment Inc., pfd. | United States | 2,990 | 298,969 | ||||||||||
|
| |||||||||||||
| Thrifts & Mortgage Finance 0.1% | ||||||||||||||
| b | FHLMC, 8.375%, pfd., Z | United States | 6,334 | 39,271 | ||||||||||
| b | FNMA, 8.25%, pfd., S | United States | 2,025 | 12,960 | ||||||||||
|
| |||||||||||||
| 52,231 | ||||||||||||||
|
| |||||||||||||
Total Preferred Stocks (Cost $360,308) | 351,200 | |||||||||||||
|
| |||||||||||||
| Principal Amount* | ||||||||||||||
| Convertible Bonds 0.8% | ||||||||||||||
| Energy Equipment & Services 0.3% | ||||||||||||||
Weatherford International Ltd., senior note, 5.875%, 7/01/21 | United States | 218,000 | 241,163 | |||||||||||
|
| |||||||||||||
| Independent Power & Renewable Electricity Producers 0.5% | ||||||||||||||
| d | NRG Yield Inc., senior note, 144A, 3.50%, 2/01/19 | United States | 132,000 | 133,980 | ||||||||||
| a | Pattern Energy Group Inc., senior note, 4.00%, 7/15/20 | United States | 247,000 | 252,403 | ||||||||||
|
| |||||||||||||
| 386,383 | ||||||||||||||
|
| |||||||||||||
Total Convertible Bonds (Cost $624,269) | 627,546 | |||||||||||||
|
| |||||||||||||
| 16 | Annual Report | franklintempleton.com |
FRANKLIN ALTERNATIVE STRATEGIES FUNDS
STATEMENT OF INVESTMENTS
Franklin K2 Long Short Credit Fund (continued)
| Country | Principal Amount* | Value | ||||||||||||
| Corporate Bonds and Notes 33.9% | ||||||||||||||
| Banks 0.3% | ||||||||||||||
| a | JPMorgan Chase & Co., senior bond, 3.782% to 2/01/27, FRN thereafter, 2/01/28 | United States | 276,000 | $ | 283,111 | |||||||||
|
| |||||||||||||
| Capital Markets 0.2% | ||||||||||||||
The Goldman Sachs Group Inc., | ||||||||||||||
senior bond, 3.691% to 6/05/27, FRN thereafter, 6/05/28 | United States | 93,000 | 93,000 | |||||||||||
a senior note, 3.85%, 1/26/27 | United States | 35,000 | 35,684 | |||||||||||
|
| |||||||||||||
| 128,684 | ||||||||||||||
|
| |||||||||||||
| Commercial Services & Supplies 2.1% | ||||||||||||||
| d | Harland Clarke Holdings Corp., senior note, 144A, 9.25%, 3/01/21 | United States | 947,000 | 928,060 | ||||||||||
RR Donnelley & Sons Co., | ||||||||||||||
senior bond, 6.50%, 11/15/23 | United States | 196,000 | 198,940 | |||||||||||
a senior bond, 6.00%, 4/01/24 | United States | 344,000 | 338,840 | |||||||||||
senior bond, 6.625%, 4/15/29 | United States | 28,000 | 26,880 | |||||||||||
a senior note, 7.00%, 2/15/22 | United States | 201,000 | 211,050 | |||||||||||
|
| |||||||||||||
| 1,703,770 | ||||||||||||||
|
| |||||||||||||
| Construction & Engineering 0.3% | ||||||||||||||
| d | Engility Corp., senior note, 144A, 8.875%, 9/01/24 | United States | 193,000 | 208,199 | ||||||||||
| d | Great Lakes Dredge & Dock Corp., senior note, 144A, 8.00%, 5/15/22 | United States | 21,000 | 21,367 | ||||||||||
|
| |||||||||||||
| 229,566 | ||||||||||||||
|
| |||||||||||||
| Construction Materials 0.5% | ||||||||||||||
| a,d | Standard Industries Inc./NJ, senior note, 144A, 5.50%, 2/15/23 | United States | 313,000 | 330,606 | ||||||||||
| d | Summit Materials LLC / Summit Materials Finance Corp., senior note, 144A, 5.125%, 6/01/25 | United States | 37,000 | 37,555 | ||||||||||
|
| |||||||||||||
| 368,161 | ||||||||||||||
|
| |||||||||||||
| Consumer Finance 0.4% | ||||||||||||||
| d | iPayment Inc., second lien, 144A, 10.75%, 4/15/24 | United States | 308,000 | 345,730 | ||||||||||
|
| |||||||||||||
| Containers & Packaging 0.6% | ||||||||||||||
| a | Reynolds Group Issuer Inc. / Reynolds Group Issuer LLC / Reynolds Group Issuer Luxembourg SA, senior secured note, first lien, 6.875%, 2/15/21 | United States | 486,102 | 498,862 | ||||||||||
|
| |||||||||||||
| Diversified Financial Services 3.9% | ||||||||||||||
| d | ASP AMC Merger Sub Inc., senior note, 144A, 8.00%, 5/15/25 | United States | 287,000 | 281,619 | ||||||||||
| e | Citigroup Global Markets Holdings Inc., Reg S, zero cpn., | |||||||||||||
7/27/17 | Egypt | 5,000,000 | EGP | 267,820 | ||||||||||
9/21/17 | Egypt | 8,639,375 | EGP | 449,066 | ||||||||||
10/12/17 | Egypt | 5,000,000 | EGP | 257,041 | ||||||||||
| a | Everi Payments Inc., senior note, 10.00%, 1/15/22 | United States | 809,000 | 892,934 | ||||||||||
| a,d | Opal Acquisition Inc., senior note, 144A, 8.875%, 12/15/21 | United States | 1,068,000 | 971,880 | ||||||||||
|
| |||||||||||||
| 3,120,360 | ||||||||||||||
|
| |||||||||||||
| Diversified Telecommunication Services 2.9% | ||||||||||||||
Frontier Communications Corp., | ||||||||||||||
senior bond, 9.00%, 8/15/31 | United States | 35,000 | 28,875 | |||||||||||
a senior note, 10.50%, 9/15/22 | United States | 620,000 | 610,700 | |||||||||||
senior note, 11.00%, 9/15/25 | United States | 70,000 | 65,713 | |||||||||||
Intelsat Jackson Holdings SA, | ||||||||||||||
a senior note, 7.25%, 4/01/19 | Luxembourg | 974,000 | 935,040 | |||||||||||
senior note, 7.50%, 4/01/21 | Luxembourg | 54,000 | 48,330 | |||||||||||
a,d senior secured note, first lien, 144A, 9.50%, 9/30/22 | Luxembourg | 254,000 | 304,165 | |||||||||||
a,d senior secured note, first lien, 144A, 8.00%, 2/15/24 | Luxembourg | 113,000 | 122,322 | |||||||||||
| franklintempleton.com | Annual Report | 17 |
FRANKLIN ALTERNATIVE STRATEGIES FUNDS
STATEMENT OF INVESTMENTS
Franklin K2 Long Short Credit Fund (continued)
| Country | Principal Amount* | Value | ||||||||||||
| Corporate Bonds and Notes (continued) | ||||||||||||||
| Diversified Telecommunication Services (continued) | ||||||||||||||
| e | MTN Mauritius Investment Ltd., senior note, Reg S, 6.50%, 10/13/26 | South Africa | 200,000 | $ | 209,850 | |||||||||
|
| |||||||||||||
| 2,324,995 | ||||||||||||||
|
| |||||||||||||
| Electric Utilities 0.2% | ||||||||||||||
| d | Talen Energy Supply LLC, senior note, 144A, 9.50%, 7/15/22 | United States | 223,000 | 196,797 | ||||||||||
|
| |||||||||||||
| Electrical Equipment 0.1% | ||||||||||||||
NEW Areva Holding SA, senior bond, 4.875%, 9/23/24 | France | 100,000 | EUR | 121,086 | ||||||||||
|
| |||||||||||||
| Energy Equipment & Services 1.9% | ||||||||||||||
| d | McDermott International Inc., second lien, 144A, 8.00%, 5/01/21 | United States | 237,000 | 245,888 | ||||||||||
| a,d | Targa Resources Partners LP / Targa Resources Partners Finance Corp., senior bond, 144A, 5.375%, 2/01/27 | United States | 733,000 | 767,817 | ||||||||||
| a,d | Transocean Inc., senior note, 144A, 9.00%, 7/15/23 | United States | 164,000 | 172,200 | ||||||||||
Weatherford International Ltd., | ||||||||||||||
senior bond, 9.625%, 3/01/19 | United States | 88,000 | 97,020 | |||||||||||
senior note, 5.125%, 9/15/20 | United States | 270,000 | 272,025 | |||||||||||
|
| |||||||||||||
| 1,554,950 | ||||||||||||||
|
| |||||||||||||
| Equity Real Estate Investment Trusts (REITs) 0.6% | ||||||||||||||
| a | iStar Inc., senior note, 5.00%, 7/01/19 | United States | 476,000 | 483,140 | ||||||||||
|
| |||||||||||||
| Health Care Providers & Services 0.6% | ||||||||||||||
| a | HCA Inc., senior secured bond, first lien, 5.25%, 4/15/25 | United States | 153,000 | 167,440 | ||||||||||
Kindred Healthcare Inc., senior note, 8.75%, 1/15/23 | United States | 330,000 | 346,088 | |||||||||||
|
| |||||||||||||
| 513,528 | ||||||||||||||
|
| |||||||||||||
| Hotels, Restaurants & Leisure 0.4% | ||||||||||||||
| d | Jack Ohio Finance LLC / Jack Ohio Finance 1 Corp., senior secured note, second lien, 144A, 10.25%, 11/15/22 | United States | 141,000 | 155,276 | ||||||||||
| d | Mohegan Tribal Gaming Authority, senior note, 144A, 7.875%, 10/15/24 | United States | 54,000 | 55,958 | ||||||||||
| d | Viking Cruises Ltd., senior bond, 144A, 6.25%, 5/15/25 | United States | 75,000 | 73,500 | ||||||||||
|
| |||||||||||||
| 284,734 | ||||||||||||||
|
| |||||||||||||
| Independent Power & Renewable Electricity Producers 0.5% | ||||||||||||||
| a,d | Atlantica Yield PLC, senior note, 144A, 7.00%, 11/15/19 | Spain | 351,000 | 370,305 | ||||||||||
|
| |||||||||||||
| Machinery 0.4% | ||||||||||||||
| d | Cloud Crane Escrow LLC, secured note, second lien, 144A, 10.125%, 8/01/24 | United States | 10,000 | 10,900 | ||||||||||
Navistar International Corp., senior bond, 8.25%, 11/01/21 | United States | 310,000 | 315,230 | |||||||||||
|
| |||||||||||||
| 326,130 | ||||||||||||||
|
| |||||||||||||
| Media 5.7% | ||||||||||||||
| d | American Media Inc., 144A, | |||||||||||||
secured note, second lien, 5.50%, 9/01/21 | United States | 255,232 | 257,465 | |||||||||||
sub. note, zero cpn., 3/01/22 | United States | 2,463,010 | 1,998,117 | |||||||||||
| d | Lee Enterprises Inc., senior secured note, first lien, 144A, 9.50%, 3/15/22 | United States | 405,000 | 422,213 | ||||||||||
The McClatchy Co., | ||||||||||||||
senior bond, 7.15%, 11/01/27 | United States | 113,000 | 105,231 | |||||||||||
senior bond, 6.875%, 3/15/29 | United States | 394,000 | 322,095 | |||||||||||
senior secured note, first lien, 9.00%, 12/15/22 | United States | 154,000 | 160,930 | |||||||||||
| a,d,f | Postmedia Network Inc., secured note, second lien, 144A, PIK, 10.25%, 7/15/23 | Canada | 457,005 | 543,265 | ||||||||||
| a,d | Time Inc., senior note, 144A, 5.75%, 4/15/22 | United States | 736,000 | 764,520 | ||||||||||
|
| |||||||||||||
| 4,573,836 | ||||||||||||||
|
| |||||||||||||
| 18 | Annual Report | franklintempleton.com |
FRANKLIN ALTERNATIVE STRATEGIES FUNDS
STATEMENT OF INVESTMENTS
Franklin K2 Long Short Credit Fund (continued)
| Country | Principal Amount* | Value | ||||||||||||
| Corporate Bonds and Notes (continued) | ||||||||||||||
| Metals & Mining 0.9% | ||||||||||||||
AK Steel Corp., | ||||||||||||||
senior bond, 8.375%, 4/01/22 | United States | 90,000 | $ | 93,431 | ||||||||||
senior note, 7.625%, 10/01/21 | United States | 584,000 | 603,623 | |||||||||||
| e,g | CSN Islands XII Corp., senior bond, Reg S, 7.00% to 3/23/17, FRN thereafter, Perpetual | Brazil | 71,000 | 44,730 | ||||||||||
|
| |||||||||||||
| 741,784 | ||||||||||||||
|
| |||||||||||||
| Oil, Gas & Consumable Fuels 4.2% | ||||||||||||||
| a,d | Calfrac Holdings LP, senior bond, 144A, 7.50%, 12/01/20 | Canada | 216,000 | 193,320 | ||||||||||
| d | Cheniere Corpus Christi Holdings LLC, secured bond, 144A, 5.125%, 6/30/27 | United States | 83,000 | 84,245 | ||||||||||
Chesapeake Energy Corp., senior bond, 6.625%, 8/15/20 | United States | 407,000 | 426,841 | |||||||||||
| f | Comstock Resources Inc., senior secured note, first lien, PIK, 10.00%, (all cash), 3/15/20 | United States | 451,000 | 460,020 | ||||||||||
CONSOL Energy Inc., senior note, | ||||||||||||||
5.875%, 4/15/22 | United States | 164,000 | 162,565 | |||||||||||
8.00%, 4/01/23 | United States | 166,000 | 175,752 | |||||||||||
EP Energy LLC / Everest Acquisition Finance Inc., senior note, 9.375%, 5/01/20 | United States | 165,000 | 149,738 | |||||||||||
| a,d | Permian Resources LLC, senior secured note, first lien, 144A, 13.00%, 11/30/20 | United States | 393,000 | 457,845 | ||||||||||
Petrobras Global Finance BV, senior note, | ||||||||||||||
5.375%, 1/27/21 | Brazil | 102,000 | 104,698 | |||||||||||
6.125%, 1/17/22 | Brazil | 157,000 | 163,359 | |||||||||||
8.375%, 5/23/21 | Brazil | 142,000 | 160,055 | |||||||||||
Petroleos Mexicanos, senior note, | ||||||||||||||
6.375%, 2/04/21 | Mexico | 108,000 | 118,465 | |||||||||||
6.875%, 8/04/26 | Mexico | 59,000 | 66,313 | |||||||||||
c,e FRN, Reg S, 4.77%, 3/11/22 | Mexico | 66,000 | 71,676 | |||||||||||
e Reg S, 1.875%, 4/21/22 | Mexico | 200,000 | EUR | 222,710 | ||||||||||
e Reg S, 3.75%, 2/21/24 | Mexico | 100,000 | EUR | 116,509 | ||||||||||
e Reg S, 5.375%, 3/13/22 | Mexico | 75,000 | 79,819 | |||||||||||
| a,d | Seven Generations Energy Ltd., senior note, 144A, 8.25%, 5/15/20 | Canada | 143,000 | 150,150 | ||||||||||
|
| |||||||||||||
| 3,364,080 | ||||||||||||||
|
| |||||||||||||
| Paper & Forest Products 2.1% | ||||||||||||||
| a | Resolute Forest Products Inc., senior note, 5.875%, 5/15/23 | United States | 1,725,000 | 1,707,750 | ||||||||||
|
| |||||||||||||
| Road & Rail 1.3% | ||||||||||||||
| a,d | Florida East Coast Holdings Corp., 144A, | |||||||||||||
senior note, 9.75%, 5/01/20 | United States | 276,000 | 295,665 | |||||||||||
senior secured note, first lien, 6.75%, 5/01/19 | United States | 430,000 | 443,975 | |||||||||||
| d | The Hertz Corp., secured note, second lien, 144A, 7.625%, 6/01/22 | United States | 138,000 | 138,000 | ||||||||||
| e,h | RZD Capital PLC, (Russian Railways), loan participation, senior note, Reg S, 4.375%, 3/01/24 | Russia | 200,000 | 202,297 | ||||||||||
|
| |||||||||||||
| 1,079,937 | ||||||||||||||
|
| |||||||||||||
| Semiconductors & Semiconductor Equipment 0.6% | ||||||||||||||
| a,d | Broadcom Corp. / Broadcom Cayman Finance Ltd., senior note, 144A, 3.875%, 1/15/27 | United States | 447,000 | 454,501 | ||||||||||
|
| |||||||||||||
| Software 0.9% | ||||||||||||||
| a,d | Open Text Corp., senior bond, 144A, 5.875%, 6/01/26 | Canada | 699,000 | 750,118 | ||||||||||
|
| |||||||||||||
| Specialty Retail 2.3% | ||||||||||||||
| d | PetSmart Inc., 144A, | |||||||||||||
senior note, 7.125%, 3/15/23 | United States | 365,000 | 341,275 | |||||||||||
senior note, 8.875%, 6/01/25 | United States | 820,000 | 814,875 | |||||||||||
| franklintempleton.com | Annual Report | 19 |
FRANKLIN ALTERNATIVE STRATEGIES FUNDS
STATEMENT OF INVESTMENTS
Franklin K2 Long Short Credit Fund (continued)
| Country | Principal Amount* | Value | ||||||||||||
| Corporate Bonds and Notes (continued) | ||||||||||||||
| Specialty Retail (continued) | ||||||||||||||
| d | PetSmart Inc., 144A, (continued) | |||||||||||||
senior secured, first lien note, 5.875%, 6/01/25 | United States | 677,000 | $ | 682,077 | ||||||||||
|
| |||||||||||||
| 1,838,227 | ||||||||||||||
|
| |||||||||||||
Total Corporate Bonds and Notes (Cost $25,075,241) | 27,364,142 | |||||||||||||
|
| |||||||||||||
| Foreign Government and Agency Securities 5.9% | ||||||||||||||
| e | Africa Finance Corp., senior note, Reg S, 3.875%, 4/13/24 | Supranational | 200,000 | 199,100 | ||||||||||
Argentine Bonos del Tesoro, | ||||||||||||||
22.75%, 3/05/18 | Argentina | 4,088,592 | ARS | 255,673 | ||||||||||
21.20%, 9/19/18 | Argentina | 2,260,868 | ARS | 141,753 | ||||||||||
Government of Argentina, | ||||||||||||||
7.82%, 12/31/33 | Argentina | 250,451 | EUR | 298,580 | ||||||||||
2.26% to 3/31/19, 4.74% thereafter, 12/31/38 | Argentina | 328,282 | EUR | 238,492 | ||||||||||
senior bond, 7.82%, 12/31/33 | Argentina | 213,296 | EUR | 256,619 | ||||||||||
senior note, 8.75%, 6/02/17 | Argentina | 300,000 | 300,000 | |||||||||||
c senior note, FRN, 22.518%, 10/09/17 | Argentina | 6,449,438 | ARS | 399,763 | ||||||||||
e senior note, Reg S, 3.875%, 1/15/22 | Argentina | 200,000 | EUR | 226,994 | ||||||||||
senior note, 5.625%, 1/26/22 | Argentina | 93,000 | 97,138 | |||||||||||
| e | Government of Ecuador, senior note, Reg S, 10.75%, 3/28/22 | Ecuador | 200,000 | 215,250 | ||||||||||
| e | Government of Egypt, senior note, Reg S, 6.125%, 1/31/22 | Egypt | 200,000 | 205,800 | ||||||||||
| d | Government of Hellenic Republic, senior note, 144A, 4.75%, 4/17/19 | Greece | 410,000 | EUR | 453,250 | |||||||||
| e | Government of Paraguay, senior note, Reg S, 4.625%, 1/25/23 | Paraguay | 200,000 | 210,500 | ||||||||||
Government of Russia, | ||||||||||||||
7.40%, 12/07/22 | Russia | 35,864,000 | RUB | 629,800 | ||||||||||
7.75%, 9/16/26 | Russia | 3,840,000 | RUB | 68,481 | ||||||||||
| e | Government of Ukraine, Reg S, | |||||||||||||
7.75%, 9/01/19 | Ukraine | 149,000 | 153,093 | |||||||||||
7.75%, 9/01/21 | Ukraine | 294,000 | 298,098 | |||||||||||
| e | National Highways Authority of India, senior note, Reg S, 7.30%, 5/18/22 | India | 10,000,000 | INR | 155,707 | |||||||||
|
| |||||||||||||
Total Foreign Government and Agency Securities (Cost $4,656,921) | 4,804,091 | |||||||||||||
|
| |||||||||||||
| Asset-Backed Securities and Commercial Mortgage-Backed Securities 31.8% | ||||||||||||||
| Banks 5.5% | ||||||||||||||
| c | Wachovia Bank Commercial Mortgage 2007-C30 Trust, AJ, FRN, 5.413%, 12/15/43 | United States | 1,557,361 | 1,584,645 | ||||||||||
| c | Wachovia Bank Commercial Mortgage 2007-C31 Trust, AJ, FRN, 5.66%, 4/15/47 | United States | 2,165,346 | 2,203,261 | ||||||||||
| d | Wachovia Bank Commercial Mortgage 2007-C32 Trust, AMFX, 144A, 5.703%, 6/15/49 | United States | 634,581 | 648,915 | ||||||||||
|
| |||||||||||||
| 4,436,821 | ||||||||||||||
|
| |||||||||||||
| Consumer Finance 1.1% | ||||||||||||||
| c | Impac CMB 2004-9 Trust, 1A2, FRN, 1.904%, 1/25/35 | United States | 944,756 | 880,162 | ||||||||||
|
| |||||||||||||
| Diversified Financial Services 20.6% | ||||||||||||||
| c | American Home Mortgage Assets 2005-1 Trust, 1A1, FRN, 3.418%, 11/25/35 | United States | 258,441 | 224,957 | ||||||||||
| d | Avant Loans Funding 2016-B Trust, A, 144A, 3.92%, 8/15/19 | United States | 133,432 | 133,707 | ||||||||||
| c | Banc of America Mortgage 2005-L Trust, 3A1, FRN, 3.424%, 1/25/36 | United States | 552,901 | 518,058 | ||||||||||
| c,d | BCAP LLC 2009-RR6-I Trust, 2009-3A1, 144A, FRN, 3.445%, 12/26/37 | United States | 634,729 | 593,170 | ||||||||||
| c,d | BCAP LLC 2010-RR1 Trust, 1A4, 144A, FRN, 3.445%, 3/26/37 | United States | 617,784 | 521,107 | ||||||||||
| c,d | BCAP LLC 2013-RR1 Trust, 3A4, 144A, FRN, 6.00%, 10/26/37 | United States | 743,124 | 661,572 | ||||||||||
| 20 | Annual Report | franklintempleton.com |
FRANKLIN ALTERNATIVE STRATEGIES FUNDS
STATEMENT OF INVESTMENTS
Franklin K2 Long Short Credit Fund (continued)
| Country | Principal Amount* | Value | ||||||||||||
| Asset-Backed Securities and Commercial Mortgage-Backed Securities (continued) | ||||||||||||||
| Diversified Financial Services (continued) | ||||||||||||||
| c | Bear Stearns ARM 2006-2 Trust, 4A1, FRN, 3.391%, 7/25/36 | United States | 106,063 | $ | 98,437 | |||||||||
COMM Mortgage Trust, 2006-C8, AJ, 5.377%, 12/10/46 | United States | 918,557 | 927,742 | |||||||||||
| c | Countrywide Alternative Loan 2005-IM1 Trust, A1, FRN, 1.324%, 1/25/36 | United States | 269,863 | 244,913 | ||||||||||
| c | Countrywide Alternative Loan 2006-29T1 Trust, 1A4, FRN, 1.424%, 10/25/36 | United States | 908,173 | 564,574 | ||||||||||
Countrywide Alternative Loan 2006-4CB Trust, 2006-2A3, 5.50%, 4/25/36 | United States | 128,770 | 122,918 | |||||||||||
Credit Suisse First Boston Mortgage Securities Corp., 1A2, 7.50%, 3/25/32 | United States | 583,533 | 628,547 | |||||||||||
CSMC Mortgage-Backed 2006-4 Trust, 9A1, 6.50%, 5/25/36 | United States | 986,882 | 660,742 | |||||||||||
| c | DSLA Mortgage Loan 2006-AR1 Trust, 2A1A, FRN, 1.603%, 4/19/47 | United States | 982,834 | 919,376 | ||||||||||
| c | GSAA Home Equity 2006-18 Trust, AF2A, FRN, 5.629%, 11/25/36 | United States | 237,375 | 137,068 | ||||||||||
| c | Home Equity Mortgage Loan Asset-Backed 2001-A Trust, AV, FRN, 1.544%, 3/25/31 | United States | 791,700 | 715,955 | ||||||||||
JP Morgan Chase Commercial Mortgage Securities 2006-LDP9 Trust, AM, 5.372%, 5/15/47 | United States | 306,836 | 306,580 | |||||||||||
| c | JP Morgan Chase Commercial Mortgage Securities 2007-LDP11 Trust, AM, FRN, 5.722%, 6/15/49 | United States | 750,000 | 769,453 | ||||||||||
| c | JP Morgan Mortgage 2006-A5 Trust, 6A1, FRN, 3.10%, 8/25/36 | United States | 597,836 | 503,444 | ||||||||||
| c | JP Morgan Mortgage 2007-A2 Trust, 2A1, FRN, 3.376%, 4/25/37 | United States | 399,749 | 361,942 | ||||||||||
| c,d | Katonah Ltd. 2007-B1L Trust, 144A, FRN, 4.153%, 4/23/22 | Cayman Islands | 1,000,000 | 1,000,653 | ||||||||||
| c | MASTR Seasoned Securitization 2004-1 Trust, 4A1, FRN, 3.134%, 10/25/32 | United States | 86,162 | 86,974 | ||||||||||
| c | Merrill Lynch Mortgage Investors 2003-A2 Trust, 1M1, FRN, 3.015%, 3/25/33 | United States | 341,678 | 237,467 | ||||||||||
| c | National Collegiate Student Loan 2007-4 Trust, A3A2, FRN, 4.544%, 3/25/38 | United States | 1,000,000 | 904,315 | ||||||||||
| c | Provident Funding Mortgage Loan 2003-1 Trust, B1, FRN, 3.027%, 8/25/33 | United States | 109,603 | 103,057 | ||||||||||
| c | RAAC 2005-SP3 Trust, FRN, 3.524%, 12/25/35 | United States | 800,000 | 803,753 | ||||||||||
| c | RAAC 2007-SP1 Trust, FRN, 1.594%, 3/25/37 | United States | 100,000 | 93,976 | ||||||||||
| c | Sequoia Mortgage 2004-5 Trust, B1, FRN, 1.73%, 6/20/34 | United States | 379,266 | 303,284 | ||||||||||
| d | SpringCastle America Funding LLC, B, 144A, 4.10%, 10/25/33 | United States | 800,000 | 785,272 | ||||||||||
| d | VOLT LVII LLC, 2017-A1, 144A, 3.375%, 4/25/47 | United States | 687,004 | 688,587 | ||||||||||
| c,d | Voya CLO 2016-3 Ltd., C, 144A, FRN, 5.008%, 10/18/27 | Cayman Islands | 1,650,000 | 1,664,272 | ||||||||||
| c | WaMu Mortgage Pass-Through Certificates 2007-OA3 Trust, 2A1A, FRN, 1.451%, 4/25/47 | United States | 90,436 | 81,557 | ||||||||||
| c | Washington Mutual Mortgage Pass-Through Certificates, 2006-4, 3A2B, FRN, 1.104%, 5/25/36 | United States | 467,158 | 275,664 | ||||||||||
|
| |||||||||||||
| 16,643,093 | ||||||||||||||
|
| |||||||||||||
| Mortgage Real Estate Investment Trusts (REITs) 2.0% | ||||||||||||||
| c | Citigroup Mortgage Loan 2006-AR7 Trust, 2A4A, FRN, 3.067%, 11/25/36 | United States | 648,957 | 530,253 | ||||||||||
| c,d | Citigroup Mortgage Loan 2008-RR1 Trust, A1A1, 144A, FRN, 1.094%, 1/25/37 | United States | 992,589 | 772,849 | ||||||||||
| d | Citigroup Mortgage Loan 2009-8 Trust, 2A2, 144A, 6.10%, 4/25/37 | United States | 437,178 | 339,985 | ||||||||||
|
| |||||||||||||
| 1,643,087 | ||||||||||||||
|
| |||||||||||||
| Thrifts & Mortgage Finance 2.6% | ||||||||||||||
| c | IndyMac INDX Mortgage Loan 2004-AR14 Trust, 2A1A, FRN, 1.744%, 1/25/35 | United States | 878,241 | 688,703 | ||||||||||
| c | IndyMac INDX Mortgage Loan 2005-AR13 Trust, 4A1, FRN, 3.112%, 8/25/35 | United States | 476,567 | 422,187 | ||||||||||
| c | IndyMac INDX Mortgage Loan 2005-AR16IP Trust, A1, FRN, 1.664%, 7/25/45 | United States | 372,421 | 344,955 | ||||||||||
| c | IndyMac INDX Mortgage Loan 2006-AR29 Trust, A2, FRN, 1.104%, 11/25/36 | United States | 252,928 | 208,614 | ||||||||||
| c | IndyMac INDX Mortgage Loan 2007-AR15 Trust, 2A1, FRN, 3.736%, 8/25/37 | United States | 482,785 | 411,409 | ||||||||||
|
| |||||||||||||
| 2,075,868 | ||||||||||||||
|
| |||||||||||||
Total Asset-Backed Securities and Commercial Mortgage-Backed Securities | 25,679,031 | |||||||||||||
|
| |||||||||||||
| franklintempleton.com | Annual Report | 21 |
FRANKLIN ALTERNATIVE STRATEGIES FUNDS
STATEMENT OF INVESTMENTS
Franklin K2 Long Short Credit Fund (continued)
| Country | Number of Contracts | Value | ||||||||||||
| Options Purchased 0.1% | ||||||||||||||
| Calls – Exchange-Traded | ||||||||||||||
| Independent Power & Renewable Electricity Producers 0.0%† | ||||||||||||||
NRG Yield Inc., A, September Strike Price $17.50, Expires 9/15/17 | United States | 56 | $ | 4,620 | ||||||||||
|
| |||||||||||||
| Media 0.0%† | ||||||||||||||
Gray Television Inc., August Strike Price $12.50, Expires 8/18/17 | United States | 36 | 2,880 | |||||||||||
Nexstar Media Group Inc., A, August Strike Price $60.00, Expires 8/18/17 | United States | 9 | 2,970 | |||||||||||
Sinclair Broadcast Group Inc., December Strike Price $35.00, Expires 12/15/17 | United States | 134 | 30,820 | |||||||||||
Sinclair Broadcast Group Inc., June Strike Price $36.00, Expires 6/16/17 | United States | 50 | 900 | |||||||||||
|
| |||||||||||||
| 37,570 | ||||||||||||||
|
| |||||||||||||
| Metals & Mining 0.0%† | ||||||||||||||
Nucor Corp., July Strike Price $75.00, Expires 7/21/17 | United States | 70 | 140 | |||||||||||
|
| |||||||||||||
| Road & Rail 0.0%† | ||||||||||||||
Hertz Global Holdings Inc., June Strike Price $17.50, Expires 6/16/17 | United States | 32 | 160 | |||||||||||
|
| |||||||||||||
| Puts – Exchange-Traded | ||||||||||||||
| Auto Components 0.0%† | ||||||||||||||
American Axle & Manufacturing Holdings Inc., January Strike Price $15.00, Expires 1/18/19 | United States | 14 | 4,130 | |||||||||||
|
| |||||||||||||
| Automobiles 0.0%† | ||||||||||||||
Tesla Inc., January Strike Price $175.00, Expires 1/19/18 | United States | 6 | 1,584 | |||||||||||
|
| |||||||||||||
| Diversified Financial Services 0.1% | ||||||||||||||
S&P 500 Index, June Strike Price $2,250.00, Expires 6/16/17 | United States | 13 | 1,300 | |||||||||||
S&P 500 Index, June Strike Price $2,275.00, Expires 6/16/17 | United States | 21 | 2,940 | |||||||||||
S&P 500 Index, June Strike Price $2,300.00, Expires 6/30/17 | United States | 41 | 19,270 | |||||||||||
|
| |||||||||||||
| 23,510 | ||||||||||||||
|
| |||||||||||||
| Exchange Traded Funds 0.0%† | ||||||||||||||
iShares iBoxx High Yield Corporate Bond ETF, July Strike Price $88.00, Expires 7/21/17 | United States | 72 | 5,832 | |||||||||||
iShares MSCI Singapore Capped ETF, August Strike Price $23.00, Expires 8/18/17 | United States | 92 | 3,220 | |||||||||||
SPDR S&P 500 ETF Trust, June Strike Price $230.00, Expires 6/16/17 | United States | 51 | 1,071 | |||||||||||
SPDR S&P 500 ETF Trust, July Strike Price $230.00, Expires 7/21/17 | United States | 36 | 3,672 | |||||||||||
|
| |||||||||||||
| 13,795 | ||||||||||||||
|
| |||||||||||||
| Food Products 0.0%† | ||||||||||||||
Blue Buffalo Pet Products Inc., December Strike Price $20.00, Expires 12/15/17 | United States | 46 | 3,105 | |||||||||||
|
| |||||||||||||
| Health Care Providers & Services 0.0%† | ||||||||||||||
Express Scripts Holding Co., September Strike Price $55.00, Expires 9/15/17 | United States | 37 | 4,717 | |||||||||||
|
| |||||||||||||
| Metals & Mining 0.0%† | ||||||||||||||
Cia Siderurgica Nacional SA, ADR, June Strike Price $2.00, Expires 6/16/17 | Brazil | 28 | 280 | |||||||||||
|
| |||||||||||||
| Pharmaceuticals 0.0%† | ||||||||||||||
Mallinckrodt PLC, January Strike Price $30.00, Expires 1/19/18 | United States | 36 | 6,300 | |||||||||||
|
| |||||||||||||
| Software 0.0%† | ||||||||||||||
Synchronoss Technologies Inc., June Strike Price $10.00, Expires 6/16/17 | United States | 83 | 1,868 | |||||||||||
|
| |||||||||||||
| 22 | Annual Report | franklintempleton.com |
FRANKLIN ALTERNATIVE STRATEGIES FUNDS
STATEMENT OF INVESTMENTS
Franklin K2 Long Short Credit Fund (continued)
| Country | Counterparty | Notional Amount* | Value | |||||||||||||||
| Options Purchased (continued) | ||||||||||||||||||
| Puts – Over-the-Counter | ||||||||||||||||||
| Currency Options 0.0%† | ||||||||||||||||||
SAR/USD, January Strike Price 3.78 SAR, Expires 1/23/18 | Saudi Arabia | GSCO | 2,390,525 | SAR | $ | 2,594 | ||||||||||||
|
| |||||||||||||||||
Total Options Purchased (Cost $176,339) | 104,373 | |||||||||||||||||
|
| |||||||||||||||||
| Principal Amount* | ||||||||||||||||||
| U.S. Government and Agency Securities 1.7% | ||||||||||||||||||
U.S. Treasury Bond, 3.00%, 2/15/47 | United States | 258,000 | 264,637 | |||||||||||||||
U.S. Treasury Note, | ||||||||||||||||||
1.875%, 4/30/22 | United States | 690,000 | 693,693 | |||||||||||||||
2.375%, 5/15/27 | United States | 366,000 | 371,454 | |||||||||||||||
|
| |||||||||||||||||
Total U.S. Government and Agency Securities | 1,329,784 | |||||||||||||||||
|
| |||||||||||||||||
Total Investments before Short Term Investments | 61,353,328 | |||||||||||||||||
|
| |||||||||||||||||
| Shares | ||||||||||||||||||
Short Term Investments 18.8% | ||||||||||||||||||
Money Market Funds (Cost $11,809,659) 14.6% | ||||||||||||||||||
| i | Fidelity Investments Money Market Funds, 0.65% | United States | 11,809,659 | 11,809,659 | ||||||||||||||
|
| |||||||||||||||||
| Principal Amount* | ||||||||||||||||||
Repurchase Agreements (Cost $3,422,669) 4.2% | ||||||||||||||||||
| j | Joint Repurchase Agreement, 0.793%, 6/01/17 | United States | 3,422,669 | 3,422,669 | ||||||||||||||
BNP Paribas Securities Corp. (Maturity Value $1,492,340) | ||||||||||||||||||
Collateralized by U.S. Government Agency Securities, 0.83% - 2.375%, 3/28/18 - 4/05/22; k U.S. Treasury Bill, 11/16/17; U.S. Treasury Note, 0.75% - 2.125%, 4/15/18 - 2/28/22; and U.S. Treasury Note, Index Linked, 1.375%, 7/15/18 (valued at $3,492,168) | ||||||||||||||||||
|
| |||||||||||||||||
Total Investments (Cost $73,579,694) 94.8% | 76,585,656 | |||||||||||||||||
Options Written (0.0)%† | (4,550 | ) | ||||||||||||||||
Securities Sold Short (13.4)% | (10,859,671 | ) | ||||||||||||||||
Other Assets, less Liabilities 18.6% | 15,091,782 | |||||||||||||||||
|
| |||||||||||||||||
Net Assets 100.0% | $ | 80,813,217 | ||||||||||||||||
|
| |||||||||||||||||
| Number of Contracts | ||||||||||||||||||
| l | Options Written (Premiums Received $2,513) (0.0)%† | |||||||||||||||||
| Puts – Exchange-Traded | ||||||||||||||||||
| Independent Power & Renewable Electricity Producers | ||||||||||||||||||
NRG Yield Inc., C, August Strike Price $17.50, Expires 8/18/17 | United States | 70 | (4,550 | ) | ||||||||||||||
|
| |||||||||||||||||
| franklintempleton.com | Annual Report | 23 |
FRANKLIN ALTERNATIVE STRATEGIES FUNDS
STATEMENT OF INVESTMENTS
Franklin K2 Long Short Credit Fund (continued)
| Country | Shares | Value | ||||||||||||
| m | Securities Sold Short (13.4)% | |||||||||||||
| Common Stocks (0.3)% | ||||||||||||||
| Equity Real Estate Investment Trusts (REITs) (0.2)% | ||||||||||||||
Seritage Growth Properties | United States | 4,328 | $ | (169,874 | ) | |||||||||
|
| |||||||||||||
Internet Software & Services (0.1)% | ||||||||||||||
CoStar Group Inc. | United States | 213 | (55,714 | ) | ||||||||||
|
| |||||||||||||
| Total Common Stocks (Proceeds $230,388) | (225,588) | |||||||||||||
|
| |||||||||||||
| Principal Amount* | ||||||||||||||
| Corporate Bonds and Notes (13.0)% | ||||||||||||||
| Aerospace & Defense (0.2)% | ||||||||||||||
| d | Bombardier Inc., senior note, 144A, 8.75%, 12/01/21 | Canada | 123,000 | (136,761 | ) | |||||||||
|
| |||||||||||||
| Air Freight & Logistics (0.2)% | ||||||||||||||
| e | Autostrade per l’Italia SpA, senior bond, Reg S, 1.75%, 2/01/27 | Italy | 169,000 | EUR | (193,693 | ) | ||||||||
|
| |||||||||||||
Auto Components (0.4)% | ||||||||||||||
American Axle & Manufacturing Inc., senior bond, 6.625%, 10/15/22 | United States | 305,000 | (316,438 | ) | ||||||||||
|
| |||||||||||||
| Automobiles (0.3)% | ||||||||||||||
Ford Motor Co., senior bond, 4.346%, 12/08/26 | United States | 210,000 | (214,718 | ) | ||||||||||
|
| |||||||||||||
Chemicals (2.0)% | ||||||||||||||
| d | CVR Partners LP / CVR Nitrogen Finance Corp., senior note, 144A, 9.25%, 6/15/23 | United States | 492,000 | (511,680 | ) | |||||||||
| e | K+S AG, senior note, Reg S, | |||||||||||||
4.125%, 12/06/21 | Germany | 188,000 | EUR | (237,554 | ) | |||||||||
3.00%, 6/20/22 | Germany | 294,000 | EUR | (352,206 | ) | |||||||||
Potash Corp. of Saskatchewan Inc., senior bond, 3.00%, 4/01/25 | Canada | 500,000 | (487,804 | ) | ||||||||||
|
| |||||||||||||
| (1,589,244 | ) | |||||||||||||
|
| |||||||||||||
| Commercial Services & Supplies (0.2)% | ||||||||||||||
Quad/Graphics Inc., senior note, 7.00%, 5/01/22 | United States | 178,000 | (179,363 | ) | ||||||||||
|
| |||||||||||||
| Construction & Engineering (0.0)%† | ||||||||||||||
| e | Astaldi SpA, senior note, Reg S, 7.125%, 12/01/20 | Italy | 26,000 | EUR | (30,605 | ) | ||||||||
|
| |||||||||||||
| Diversified Telecommunication Services (0.6)% | ||||||||||||||
| e | Telefonica Emisiones SAU, senior bond, Reg S, 3.987%, 1/23/23 | Spain | 200,000 | EUR | (264,889 | ) | ||||||||
Windstream Services LLC, | ||||||||||||||
senior bond, 7.75%, 10/01/21 | United States | 171,000 | (166,298 | ) | ||||||||||
senior note, 7.75%, 10/15/20 | United States | 92,000 | (93,121 | ) | ||||||||||
|
| |||||||||||||
| (524,308 | ) | |||||||||||||
|
| |||||||||||||
| Electric Utilities (0.5)% | ||||||||||||||
| e | Enel Finance International NV, senior bond, Reg S, 1.375%, 6/01/26 | Italy | 251,000 | EUR | (281,520 | ) | ||||||||
Talen Energy Supply LLC, senior note, 6.50%, 6/01/25 | United States | 218,000 | (163,500 | ) | ||||||||||
|
| |||||||||||||
| (445,020 | ) | |||||||||||||
|
| |||||||||||||
| Electrical Equipment (0.1)% | ||||||||||||||
NEW Areva Holding SA, senior bond, 4.375%, 11/06/19 | France | 100,000 | EUR | (117,885 | ) | |||||||||
|
| |||||||||||||
| Energy Equipment & Services (0.2)% | ||||||||||||||
Transocean Inc., senior bond, | ||||||||||||||
8.125%, 12/15/21 | United States | 27,000 | (28,282 | ) | ||||||||||
5.80%, 10/15/22 | United States | 176,000 | (165,440 | ) | ||||||||||
|
| |||||||||||||
| (193,722 | ) | |||||||||||||
|
| |||||||||||||
| 24 | Annual Report | franklintempleton.com |
FRANKLIN ALTERNATIVE STRATEGIES FUNDS
STATEMENT OF INVESTMENTS
Franklin K2 Long Short Credit Fund (continued)
| Country | Principal Amount* | Value | ||||||||||||
| m | Securities Sold Short (continued) | |||||||||||||
| Corporate Bonds and Notes (continued) | ||||||||||||||
| Equity Real Estate Investment Trusts (REITs) (0.0)%† | ||||||||||||||
| d | Rayonier AM Products Inc., senior bond, 144A, 5.50%, 6/01/24 | United States | 22,000 | $ | (21,615 | ) | ||||||||
|
| |||||||||||||
| Food & Staples Retailing (0.6)% | ||||||||||||||
| e | Rallye SA, senior note, Reg S, 4.00%, 4/02/21 | France | 200,000 | EUR | (233,887 | ) | ||||||||
Tesco PLC, senior bond, 6.125%, 2/24/22 | United Kingdom | 194,000 | GBP | (289,391 | ) | |||||||||
|
| |||||||||||||
| (523,278 | ) | |||||||||||||
|
| |||||||||||||
| Food Products (0.6)% | ||||||||||||||
| e | Boparan Finance PLC, senior secured note, first lien, Reg S, 5.50%, 7/15/21 | United Kingdom | 269,000 | GBP | (351,097 | ) | ||||||||
| e | Premier Foods Finance PLC, secured note, Reg S, 6.50%, 3/15/21 | United Kingdom | 74,000 | GBP | (98,255 | ) | ||||||||
|
| |||||||||||||
| (449,352 | ) | |||||||||||||
|
| |||||||||||||
| Health Care Providers & Services (0.6)% | ||||||||||||||
| d | Mallinckrodt International Finance SA / Mallinckrodt CB LLC, senior note, 144A, | |||||||||||||
4.875%, 4/15/20 | United States | 64,000 | (64,320 | ) | ||||||||||
5.75%, 8/01/22 | United States | 406,000 | (400,925 | ) | ||||||||||
|
| |||||||||||||
| (465,245 | ) | |||||||||||||
|
| |||||||||||||
| Machinery (0.8)% | ||||||||||||||
| e | Galapagos Holding SA, senior secured note, first lien, Reg S, 7.00%, 6/15/22 | Luxembourg | 342,000 | EUR | (356,841 | ) | ||||||||
John Deere Capital Corp., senior note, 2.80%, 3/06/23 | United States | 179,000 | (182,053 | ) | ||||||||||
| e | Paternoster Holding III GmbH, senior secured note, first lien, Reg S, 8.50%, 2/15/23 | Germany | 70,000 | EUR | (83,423 | ) | ||||||||
|
| |||||||||||||
| (622,317 | ) | |||||||||||||
|
| |||||||||||||
| Media (0.7)% | ||||||||||||||
| d | Altice Financing SA, senior secured note, first lien, 144A, 6.50%, 1/15/22 | Luxembourg | 47,000 | (49,468 | ) | |||||||||
| e | Altice Luxembourg SA, senior note, Reg S, 7.25%, 5/15/22 | Luxembourg | 277,000 | EUR | (330,250 | ) | ||||||||
| d | Nexstar Broadcasting Inc., senior note, 144A, 5.625%, 8/01/24 | United States | 53,000 | (53,530 | ) | |||||||||
| d | Sinclair Television Group Inc., 144A, | |||||||||||||
senior bond, 5.125%, 2/15/27 | United States | 31,000 | (30,302 | ) | ||||||||||
senior note, 5.875%, 3/15/26 | United States | 132,000 | (136,290 | ) | ||||||||||
|
| |||||||||||||
| (599,840 | ) | |||||||||||||
|
| |||||||||||||
| Metals & Mining (0.4)% | ||||||||||||||
| d | Cliffs Natural Resources Inc., senior note, 144A, 5.75%, 3/01/25 | United States | 152,000 | (145,920 | ) | |||||||||
Freeport-McMoRan Inc., senior note, 3.55%, 3/01/22 | United States | 186,000 | (174,840 | ) | ||||||||||
|
| |||||||||||||
| (320,760 | ) | |||||||||||||
|
| |||||||||||||
| Multiline Retail (0.5)% | ||||||||||||||
Kohl’s Corp., senior bond, 4.25%, 7/17/25 | United States | 89,000 | (88,430 | ) | ||||||||||
Target Corp., senior bond, 3.625%, 4/15/46 | United States | 322,000 | (301,046 | ) | ||||||||||
|
| |||||||||||||
| (389,476 | ) | |||||||||||||
|
| |||||||||||||
| Oil, Gas & Consumable Fuels (0.5)% | ||||||||||||||
Chesapeake Energy Corp., senior note, | ||||||||||||||
4.875%, 4/15/22 | United States | 133,000 | (124,355 | ) | ||||||||||
d 144A, 8.00%, 1/15/25 | United States | 114,000 | (113,858 | ) | ||||||||||
| d | MEG Energy Corp., senior secured note, second lien, 144A, 6.50%, 1/15/25 | Canada | 144,000 | (141,300 | ) | |||||||||
|
| |||||||||||||
| (379,513 | ) | |||||||||||||
|
| |||||||||||||
| franklintempleton.com | Annual Report | 25 |
FRANKLIN ALTERNATIVE STRATEGIES FUNDS
STATEMENT OF INVESTMENTS
Franklin K2 Long Short Credit Fund (continued)
| Country | Principal Amount* | Value | ||||||||||||
| m | Securities Sold Short (continued) | |||||||||||||
| Corporate Bonds and Notes (continued) | ||||||||||||||
| Pharmaceuticals (1.4)% | ||||||||||||||
Teva Pharmaceutical Finance Netherlands III BV, senior bond, 3.15%, 10/01/26 | Israel | 865,000 | $ | (813,935 | ) | |||||||||
| d | Valeant Pharmaceuticals International Inc., senior bond, 144A, 6.125%, 4/15/25 | United States | 440,000 | (352,550 | ) | |||||||||
|
| |||||||||||||
| (1,166,485 | ) | |||||||||||||
|
| |||||||||||||
| Road & Rail (0.3)% | ||||||||||||||
The Hertz Corp., senior note, | ||||||||||||||
6.75%, 4/15/19 | United States | 100,000 | (100,150 | ) | ||||||||||
7.375%, 1/15/21 | United States | 61,000 | (57,798 | ) | ||||||||||
d 144A, 5.50%, 10/15/24 | United States | 98,000 | (79,135 | ) | ||||||||||
|
| |||||||||||||
| (237,083 | ) | |||||||||||||
|
| |||||||||||||
| Semiconductors & Semiconductor Equipment (0.3)% | ||||||||||||||
QUALCOMM Inc., senior bond, 3.45%, 5/20/25 | United States | 206,000 | (212,448 | ) | ||||||||||
|
| |||||||||||||
| Technology Hardware, Storage & Peripherals (0.3)% | ||||||||||||||
| d | Diamond 1 Finance Corp. / Diamond 2 Finance Corp., senior note, 144A, 7.125%, 6/15/24 | United States | 184,000 | (205,114 | ) | |||||||||
|
| |||||||||||||
| Trading Companies & Distributors (0.8)% | ||||||||||||||
GATX Corp., senior bond, 4.85%, 6/01/21 | United States | 576,000 | (627,543 | ) | ||||||||||
|
| |||||||||||||
| Wireless Telecommunication Services (0.5)% | ||||||||||||||
T-Mobile U.S. Inc., senior bond, 6.50%, 1/15/26 | United States | 348,000 | (384,975 | ) | ||||||||||
|
| |||||||||||||
| Total Corporate Bonds and Notes (Proceeds $10,219,647) | (10,546,801) | |||||||||||||
|
| |||||||||||||
| U.S. Government and Agency Securities (Proceeds $87,250) (0.1)% | ||||||||||||||
U.S. Treasury Note, 2.375%, 5/15/27 | United States | 86,000 | (87,282 | ) | ||||||||||
|
| |||||||||||||
Total Securities Sold Short (Proceeds $10,537,285) | $ | (10,859,671 | ) | |||||||||||
|
| |||||||||||||
See Abbreviations on page 49.
†Rounds to less than 0.1% of net assets.
*The principal/notional amount is stated in U.S. dollars unless otherwise indicated.
aA portion or all of the security has been segregated as collateral for securities sold short, open swap, forward, and written option contracts. At May 31, 2017, the aggregate value of these securities and/or cash pledged amounted to $22,523,648, representing 27.9% of net assets.
bNon-income producing.
cThe coupon rate shown represents the rate at period end.
dSecurity was purchased pursuant to Rule 144A under the Securities Act of 1933 and may be sold in transactions exempt from registration only to qualified institutional buyers or in public offering registered under the Securities Act of 1933. These securities have been deemed liquid under guidelines approved by the Trust’s Board of Trustees. At May 31, 2017, the net value of these securities was $20,346,321, representing 25.2% of net assets.
eSecurity was purchased pursuant to Regulation S under the Securities Act of 1933, which exempts from registration securities offered and sold outside of the United States. Such a security cannot be sold in the United States without either an effective registration statement filed pursuant to the Securities Act of 1933, or pursuant to an exemption from registration. These securities have been deemed liquid under guidelines approved by the Trust’s Board of Trustees. At May 31, 2017, the net value of these securities was $771,840, representing 1.0% of net assets.
fIncome may be received in additional securities and/or cash.
gPerpetual security with no stated maturity date.
hSee Note 1(e) regarding loan participation notes.
iThe rate shown is the annualized seven-day yield at period end.
jSee Note 1(c) regarding joint repurchase agreement.
kThe security was issued on a discount basis with no stated coupon rate.
lSee Note 1(d) regarding written options.
mSee Note 1(f) regarding securities sold short.
nSecurity has been deemed illiquid because it may not be able to be sold within seven days. At May 31, 2017, the aggregate value of these securities was $485,705, representing 0.6% of net assets.
| 26 | Annual Report | franklintempleton.com |
FRANKLIN ALTERNATIVE STRATEGIES FUNDS
STATEMENT OF INVESTMENTS
Franklin K2 Long Short Credit Fund (continued)
At May 31, 2017, the Fund had the following futures contracts outstanding. See Note 1(d).
| Futures Contracts | ||||||||||||||||||||||||
| Description | Type | Number of Contracts | Notional Value | Expiration Date | Unrealized Appreciation | Unrealized Depreciation | ||||||||||||||||||
| Equity Contracts | ||||||||||||||||||||||||
S&P 500 E-Mini Index | Short | 2 | $ | 241,110 | 6/16/17 | $ | — | $ | (4,503 | ) | ||||||||||||||
|
|
|
| |||||||||||||||||||||
| Interest Rate Contracts | ||||||||||||||||||||||||
Euro-Buxl 30 Yr. Bond | Short | 2 | 378,122 | 6/08/17 | — | (3,190 | ) | |||||||||||||||||
Euro BOBL | Short | 1 | 148,496 | 6/08/17 | — | (334 | ) | |||||||||||||||||
Euro Schatz | Short | 12 | 1,513,430 | 6/08/17 | 12 | — | ||||||||||||||||||
U.S. Treasury 10 Yr. Note | Short | 4 | 505,187 | 9/20/17 | — | (758 | ) | |||||||||||||||||
|
|
|
| |||||||||||||||||||||
| 2,545,235 | 12 | (4,282 | ) | |||||||||||||||||||||
|
|
|
| |||||||||||||||||||||
Total Futures Contracts | $ | 2,786,345 | $ | 12 | $ | (8,785 | ) | |||||||||||||||||
|
|
|
| |||||||||||||||||||||
Net unrealized appreciation (depreciation) |
| $ | (8,773 | ) | ||||||||||||||||||||
|
| |||||||||||||||||||||||
At May 31, 2017, the Fund had the following forward exchange contracts outstanding. See Note 1(d).
| Forward Exchange Contracts | ||||||||||||||||||||||||||||||||
| Currency | Counterpartya | Type | Quantity | Contract Amount* | Settlement Date | Unrealized Appreciation | Unrealized Depreciation | |||||||||||||||||||||||||
| OTC Forward Exchange Contracts | ||||||||||||||||||||||||||||||||
Chinese Yuan | DBAB | Buy | 1,912,750 | 280,626 | 6/21/17 | $ | 1,351 | $ | — | |||||||||||||||||||||||
Chinese Yuan | DBAB | Sell | 1,912,750 | 275,493 | 6/21/17 | — | (6,485 | ) | ||||||||||||||||||||||||
Chinese Yuan | MSCO | Buy | 1,933,924 | 277,325 | 6/21/17 | 7,775 | — | |||||||||||||||||||||||||
Chinese Yuan | MSCO | Sell | 1,933,924 | 277,783 | 6/21/17 | — | (7,317 | ) | ||||||||||||||||||||||||
Euro | BOFA | Buy | 95,196 | 104,615 | 6/21/17 | 2,449 | — | |||||||||||||||||||||||||
Euro | DBAB | Buy | 374,504 | 416,219 | 6/21/17 | 4,972 | — | |||||||||||||||||||||||||
Euro | DBAB | Sell | 1,776,632 | 1,904,210 | 6/21/17 | — | (93,908 | ) | ||||||||||||||||||||||||
Euro | MSCO | Buy | 312,050 | 342,250 | 6/21/17 | 8,703 | — | |||||||||||||||||||||||||
Euro | MSCO | Sell | 325,212 | 353,381 | 6/21/17 | — | (12,375 | ) | ||||||||||||||||||||||||
Indian Rupee | MSCO | Buy | 13,660,898 | 211,633 | 6/21/17 | — | (485 | ) | ||||||||||||||||||||||||
Mexican Peso | BOFA | Buy | 5,561,941 | 292,770 | 6/21/17 | 4,433 | — | |||||||||||||||||||||||||
Mexican Peso | BOFA | Sell | 5,561,941 | 295,816 | 6/21/17 | — | (1,387 | ) | ||||||||||||||||||||||||
Mexican Peso | DBAB | Buy | 2,581,469 | 136,817 | 6/21/17 | 1,124 | — | |||||||||||||||||||||||||
Mexican Peso | MSCO | Buy | 2,669,530 | 142,125 | 6/21/17 | 522 | — | |||||||||||||||||||||||||
Mexican Peso | MSCO | Sell | 10,790,239 | 574,647 | 6/21/17 | 4,212 | (6,143 | ) | ||||||||||||||||||||||||
Russian Ruble | BOFA | Sell | 9,221,024 | 157,428 | 6/21/17 | — | (4,347 | ) | ||||||||||||||||||||||||
Russian Ruble | MSCO | Buy | 11,431,282 | 194,305 | 6/21/17 | 6,246 | — | |||||||||||||||||||||||||
Russian Ruble | MSCO | Sell | 29,091,406 | 501,128 | 6/21/17 | — | (9,254 | ) | ||||||||||||||||||||||||
South African Rand | MSCO | Sell | 2,566,440 | 184,224 | 6/21/17 | — | (10,695 | ) | ||||||||||||||||||||||||
Turkish Lira | DBAB | Buy | 845,103 | 223,821 | 6/21/17 | 14,186 | — | |||||||||||||||||||||||||
Turkish Lira | DBAB | Sell | 845,103 | 219,382 | 6/21/17 | — | (18,625 | ) | ||||||||||||||||||||||||
Turkish Lira | MSCO | Buy | 1,015,197 | 277,650 | 6/21/17 | 8,262 | — | |||||||||||||||||||||||||
Turkish Lira | MSCO | Sell | 266,471 | 73,056 | 6/21/17 | — | (1,991 | ) | ||||||||||||||||||||||||
British Pound | JPHQ | Sell | 1,010,000 | 1,264,126 | 6/30/17 | — | (38,511 | ) | ||||||||||||||||||||||||
Euro | JPHQ | Sell | 120,000 | 130,175 | 6/30/17 | — | (4,852 | ) | ||||||||||||||||||||||||
Argentine Peso | BOFA | Buy | 3,265,921 | 201,600 | 7/21/17 | — | (3,736 | ) | ||||||||||||||||||||||||
Argentine Peso | BOFA | Sell | 2,190,948 | 136,101 | 7/21/17 | 3,363 | — | |||||||||||||||||||||||||
Argentine Peso | BOFA | Buy | 494,999 | 29,499 | 9/20/17 | — | (368 | ) | ||||||||||||||||||||||||
Euro | JPHQ | Sell | 279,762 | 7,482,512 | CZK | 11/29/17 | 25,328 | (20,026 | ) | |||||||||||||||||||||||
Czech Koruna | MSCO | Sell | 5,655,481 | 210,241 | EUR | 12/15/17 | 11,207 | (16,685 | ) | |||||||||||||||||||||||
Euro | MSCO | Sell | 325,434 | 8,693,639 | CZK | 12/15/17 | 23,242 | (17,378 | ) | |||||||||||||||||||||||
Czech Koruna | MSCO | Sell | 3,530,738 | 133,588 | EUR | 1/10/18 | 7,606 | (8,467 | ) | |||||||||||||||||||||||
Euro | MSCO | Sell | 132,874 | 3,530,738 | CZK | 1/10/18 | 5,445 | (3,772 | ) | |||||||||||||||||||||||
Euro | MSCO | Sell | 714 | 791 | 1/10/18 | — | (21 | ) | ||||||||||||||||||||||||
|
| |||||||||||||||||||||||||||||||
Total Forward Exchange Contracts |
| $ | 140,426 | $ | (286,828 | ) | ||||||||||||||||||||||||||
|
| |||||||||||||||||||||||||||||||
Net unrealized appreciation (depreciation) |
| $ | (146,402 | ) | ||||||||||||||||||||||||||||
|
| |||||||||||||||||||||||||||||||
*In U.S. dollars unless otherwise indicated.
aMay be comprised of multiple contracts with the same counterparty, currency and settlement date.
| franklintempleton.com | Annual Report | 27 |
FRANKLIN ALTERNATIVE STRATEGIES FUNDS
STATEMENT OF INVESTMENTS
Franklin K2 Long Short Credit Fund (continued)
At May 31, 2017, the Fund had the following credit default swap contracts outstanding. See Note 1(d).
Credit Default Swap Contracts
| Description | Periodic Payment Rate | Counterparty/ Exchange | Notional Amounta | Expiration Date | Unamortized Upfront Payments (Receipts) | Unrealized Appreciation | Unrealized Depreciation | Value | Ratingb | |||||||||||||||||||||||||||
| Centrally Cleared Swap Contracts | ||||||||||||||||||||||||||||||||||||
| Contracts to Buy Protection | ||||||||||||||||||||||||||||||||||||
| Single Name | ||||||||||||||||||||||||||||||||||||
Government of Mexico | 1.00 | % | ICE | 301,000 | 12/20/21 | $ | 8,523 | $ | — | $ | (7,741 | ) | $ | 782 | ||||||||||||||||||||||
Government of South Africa | 1.00 | % | ICE | 394,000 | 12/20/21 | 26,964 | — | (14,683 | ) | 12,281 | ||||||||||||||||||||||||||
Government of South Africa | 1.00 | % | ICE | 376,000 | 6/20/22 | 19,788 | — | (4,136 | ) | 15,652 | ||||||||||||||||||||||||||
Government of South Korea | 1.00 | % | ICE | 355,184 | 12/20/21 | (10,020 | ) | 2,449 | — | (7,571 | ) | |||||||||||||||||||||||||
Government of Turkey | 1.00 | % | ICE | 503,000 | 12/20/20 | 41,382 | — | (34,457 | ) | 6,925 | ||||||||||||||||||||||||||
Government of Turkey | 1.00 | % | ICE | 159,000 | 6/20/21 | 10,950 | — | (7,454 | ) | 3,496 | ||||||||||||||||||||||||||
Government of Turkey | 1.00 | % | ICE | 98,000 | 12/20/21 | 5,993 | — | (2,661 | ) | 3,332 | ||||||||||||||||||||||||||
Government of Turkey | 1.00 | % | ICE | 6,000 | 6/20/22 | 316 | — | (43 | ) | 273 | ||||||||||||||||||||||||||
| Traded Index | ||||||||||||||||||||||||||||||||||||
CDX.NA.HY.25 | 5.00 | % | ICE | 1,430,800 | 12/20/20 | 14,454 | — | (125,695 | ) | (111,241 | ) | |||||||||||||||||||||||||
CDX.NA.HY.27 | 5.00 | % | ICE | 675,000 | 12/20/21 | (47,830 | ) | — | (6,023 | ) | (53,853 | ) | ||||||||||||||||||||||||
| Contracts to Sell Protectionc | ||||||||||||||||||||||||||||||||||||
| Single Name | ||||||||||||||||||||||||||||||||||||
Government of Russia | 1.00 | % | ICE | 457,000 | 6/20/21 | (33,432 | ) | 30,431 | — | (3,001 | ) | BB+ | ||||||||||||||||||||||||
Government of Russia | 1.00 | % | ICE | 189,000 | 12/20/21 | (7,018 | ) | 4,035 | — | (2,983 | ) | BB+ | ||||||||||||||||||||||||
|
| |||||||||||||||||||||||||||||||||||
Total Centrally Cleared Swap Contracts |
| $ | 30,070 | $ | 36,915 | $ | (202,893 | ) | $ | (135,908 | ) | |||||||||||||||||||||||||
|
| |||||||||||||||||||||||||||||||||||
| OTC Swap Contracts | ||||||||||||||||||||||||||||||||||||
| Contracts to Buy Protection | ||||||||||||||||||||||||||||||||||||
| Single Name | ||||||||||||||||||||||||||||||||||||
AK Steel Corp. | 5.00 | % | BZWS | 95,000 | 6/20/22 | 189 | — | (4,276 | ) | (4,087 | ) | |||||||||||||||||||||||||
American Axle & Manufacturing Inc. | 5.00 | % | JPHQ | 226,000 | 12/20/21 | (21,267 | ) | 5,059 | — | (16,208 | ) | |||||||||||||||||||||||||
American Axle & Manufacturing Inc. | 5.00 | % | BZWS | 30,000 | 6/20/22 | (1,800 | ) | — | (77 | ) | (1,877 | ) | ||||||||||||||||||||||||
American Axle & Manufacturing Inc. | 5.00 | % | JPHQ | 76,000 | 6/20/22 | (3,987 | ) | — | (90 | ) | (4,077 | ) | ||||||||||||||||||||||||
Astaldi SpA | 5.00 | % | BZWS | 85,000 | EUR | 6/20/18 | (227 | ) | — | (1,286 | ) | (1,513 | ) | |||||||||||||||||||||||
Catepillar Financial Services Corp. | 1.00 | % | JPHQ | 618,000 | 6/20/21 | 2,123 | — | (17,444 | ) | (15,321 | ) | |||||||||||||||||||||||||
Chesapeake Energy Corp. | 5.00 | % | GSCO | 218,000 | 6/20/22 | 10,669 | — | (321 | ) | 10,348 | ||||||||||||||||||||||||||
Ford Motor Co. | 5.00 | % | GSCO | 182,000 | 12/20/21 | (28,021 | ) | — | (3,143 | ) | (31,164 | ) | ||||||||||||||||||||||||
Ford Motor Co. | 5.00 | % | GSCO | 189,000 | 12/20/21 | (27,534 | ) | — | (4,829 | ) | (32,363 | ) | ||||||||||||||||||||||||
Ford Motor Credit Company LLC | 5.00 | % | GSCO | 189,000 | 12/20/21 | (28,165 | ) | — | (4,167 | ) | (32,332 | ) | ||||||||||||||||||||||||
Frontier Communications Corp. | 5.00 | % | BZWS | 141,000 | 6/20/22 | 19,665 | — | (1,622 | ) | 18,043 | ||||||||||||||||||||||||||
Galapagos Holding SA | 5.00 | % | BZWS | 71,000 | EUR | 6/20/18 | (1,643 | ) | — | (544 | ) | (2,187 | ) | |||||||||||||||||||||||
Government of Argentina | 5.00 | % | MSCO | 308,000 | 6/20/17 | (620 | ) | — | (3,259 | ) | (3,879 | ) | ||||||||||||||||||||||||
Itochu Corp. | 1.00 | % | GSCO | 20,022,000 | JPY | 6/20/21 | (3,516 | ) | — | (2,024 | ) | (5,540 | ) | |||||||||||||||||||||||
Itochu Corp. | 1.00 | % | JPHQ | 1,921,000 | JPY | 12/20/21 | (488 | ) | — | (65 | ) | (553 | ) | |||||||||||||||||||||||
JFE Holdings Inc. | 1.00 | % | JPHQ | 9,728,000 | JPY | 12/20/21 | (1,859 | ) | — | (928 | ) | (2,787 | ) | |||||||||||||||||||||||
K. Hovnanian Enterprises Inc. | 5.00 | % | BZWS | 94,500 | 12/20/17 | 1,003 | — | (89 | ) | 914 | ||||||||||||||||||||||||||
Kobe Steel Ltd. | 1.00 | % | JPHQ | 14,626,000 | JPY | 12/20/21 | (1,105 | ) | — | (1,572 | ) | (2,677 | ) | |||||||||||||||||||||||
Macy’s Retail Holdings Inc. | 1.00 | % | JPHQ | 172,000 | 12/20/21 | 11,482 | — | (2,773 | ) | 8,709 | ||||||||||||||||||||||||||
Macy’s Retail Holdings Inc. | 1.00 | % | JPHQ | 86,000 | 12/20/21 | 5,383 | — | (1,029 | ) | 4,354 | ||||||||||||||||||||||||||
Marubeni Corp. | 1.00 | % | GSCO | 62,079,000 | JPY | 6/20/21 | 3,109 | — | (18,440 | ) | (15,331 | ) | ||||||||||||||||||||||||
Mitsui OSK Lines Ltd. | 1.00 | % | JPHQ | 13,708,000 | JPY | 12/20/21 | 1,071 | — | (1,759 | ) | (688 | ) | ||||||||||||||||||||||||
Pitney Bowes Inc. | 1.00 | % | JPHQ | 257,500 | 12/20/21 | 11,511 | — | (8,504 | ) | 3,007 | ||||||||||||||||||||||||||
Pizzaexpress Financing 1 PLC | 5.00 | % | JPHQ | 543,000 | EUR | 6/20/21 | (22,792 | ) | 27,222 | — | 4,430 | |||||||||||||||||||||||||
Rallye SA | 5.00 | % | BZWS | 71,000 | EUR | 6/20/19 | 5,404 | — | (10,451 | ) | (5,047 | ) | ||||||||||||||||||||||||
Rallye SA | 5.00 | % | JPHQ | 175,000 | EUR | 6/20/19 | 14,176 | — | (26,615 | ) | (12,439 | ) | ||||||||||||||||||||||||
Rallye SA | 5.00 | % | GSCO | 10,000 | EUR | 12/20/19 | 612 | — | (1,259 | ) | (647 | ) | ||||||||||||||||||||||||
Rallye SA | 5.00 | % | GSCO | 27,000 | EUR | 12/20/21 | 1,220 | — | (1,303 | ) | (83 | ) | ||||||||||||||||||||||||
Sharp Corporation | 1.00 | % | JPHQ | 4,914,000 | JPY | 12/20/18 | 598 | — | (531 | ) | 67 | |||||||||||||||||||||||||
Sprint Communications Inc. | 5.00 | % | BZWS | 222,000 | 12/20/21 | (15,992 | ) | — | (12,987 | ) | (28,979 | ) | ||||||||||||||||||||||||
| 28 | Annual Report | franklintempleton.com |
FRANKLIN ALTERNATIVE STRATEGIES FUNDS
STATEMENT OF INVESTMENTS
Franklin K2 Long Short Credit Fund (continued)
Credit Default Swap Contracts (continued)
| Description | Periodic Payment Rate | Counterparty/ Exchange | Notional Amounta | Expiration Date | Unamortized Upfront Payments (Receipts) | Unrealized Appreciation | Unrealized Depreciation | Value | Ratingb | |||||||||||||||||||||||||||
| OTC Swap Contracts (continued) | ||||||||||||||||||||||||||||||||||||
| Contracts to Buy Protection (continued) | ||||||||||||||||||||||||||||||||||||
| Single Name (continued) | ||||||||||||||||||||||||||||||||||||
The Hertz Corp. | 5.00 | % | BZWS | 102,000 | 12/20/19 | $ | (3,563 | ) | $ | 5,327 | $ | — | $ | 1,764 | ||||||||||||||||||||||
The Hertz Corp. | 5.00 | % | BZWS | 108,000 | 12/20/19 | (3,774 | ) | 5,642 | — | 1,868 | ||||||||||||||||||||||||||
The Hertz Corp. | 5.00 | % | JPHQ | 50,000 | 12/20/19 | (1,687 | ) | 2,552 | — | 865 | ||||||||||||||||||||||||||
The Hertz Corp. | 5.00 | % | JPHQ | 3,000 | 12/20/19 | (108 | ) | 160 | — | 52 | ||||||||||||||||||||||||||
The Hertz Corp. | 5.00 | % | JPHQ | 92,000 | 12/20/19 | (2,975 | ) | 4,567 | — | 1,592 | ||||||||||||||||||||||||||
The Hertz Corp. | 5.00 | % | JPHQ | 29,000 | 6/20/22 | 5,510 | — | (3 | ) | 5,507 | ||||||||||||||||||||||||||
The Hertz Corp. | 5.00 | % | JPHQ | 29,000 | 6/20/22 | 5,256 | — | — | 5,256 | |||||||||||||||||||||||||||
| Contracts to Sell Protectionc | ||||||||||||||||||||||||||||||||||||
| Single Name | ||||||||||||||||||||||||||||||||||||
Windstream Services LLC | 5.00 | % | BZWS | 86,000 | 12/20/21 | (4,158 | ) | — | (173 | ) | (4,331 | ) | B+ | |||||||||||||||||||||||
|
| |||||||||||||||||||||||||||||||||||
Total OTC Swap Contracts | $ | (76,300 | ) | $ | 50,529 | $ | (131,563 | ) | $ | (157,334 | ) | |||||||||||||||||||||||||
|
| |||||||||||||||||||||||||||||||||||
Total Credit Default Swap Contracts | $ | (46,230 | ) | $ | 87,444 | $ | (334,456 | ) | $ | (293,242 | ) | |||||||||||||||||||||||||
|
| |||||||||||||||||||||||||||||||||||
Net unrealized appreciation (depreciation) |
| $ | (247,012 | ) | ||||||||||||||||||||||||||||||||
|
| |||||||||||||||||||||||||||||||||||
aIn U.S. dollars unless otherwise indicated. For contracts to sell protection, the notional amount is equal to the maximum potential amount of the future payments and no recourse provisions have been entered into in association with the contracts.
bBased on Standard and Poor’s (S&P) Rating for single name swaps.
cThe Fund enters contracts to sell protection to create a long credit position. Performance triggers include default, bankruptcy or restructuring for single name swaps.
See Notes 1(d) and 8 regarding derivative financial instruments and other derivative information, respectively.
At May 31, 2017, the Fund had the following cross-currency swap contracts outstanding. See Note 1(d).
| Cross-Currency Swap Contracts | ||||||||||||||||||||
| Description | Counterparty | Notional Amount | Expiration Date | Unrealized Appreciation | Unrealized Depreciation | |||||||||||||||
| OTC Swap Contracts | ||||||||||||||||||||
| Receive Fixed annual 11.01% | DBAB | 496,253 | TRY | 6/21/22 | $ | 1,367 | $ | — | ||||||||||||
Pay Floating quarterly 3 Month USD-LIBOR | 138,271 | USD | ||||||||||||||||||
Receive Fixed annual 11.23% | BOFA | 702,632 | TRY | 6/21/22 | 3,612 | — | ||||||||||||||
Pay Floating quarterly 3 Month USD-LIBOR | 191,923 | USD | ||||||||||||||||||
Receive Fixed annual 11.29% | DBAB | 700,693 | TRY | 6/21/22 | 3,555 | — | ||||||||||||||
Pay Floating quarterly 3 Month USD-LIBOR | 191,086 | USD | ||||||||||||||||||
|
| |||||||||||||||||||
Total Cross-Currency Swap Contracts | $ | 8,534 | $ | — | ||||||||||||||||
|
| |||||||||||||||||||
Net unrealized appreciation (depreciation) |
| $ | 8,534 | |||||||||||||||||
|
| |||||||||||||||||||
At May 31, 2017, the Fund had the following interest rate swap contracts outstanding. See Note 1(d).
| Interest Rate Swap Contracts | ||||||||||||||||||||
| Description | Counterparty/ Exchange | Notional Amount | Expiration Date | Unrealized Appreciation | Unrealized Depreciation | |||||||||||||||
| Centrally Cleared Swap Contracts | ||||||||||||||||||||
Receive Fixed rate 7.43% | LCH | 3,609,831 | ZAR | 6/21/22 | $ | 512 | $ | — | ||||||||||||
Receive Floating rate 6 Month GBP-LIBOR Pay Fixed rate 1.29% | LCH | 21,000 | GBP | 2/28/67 | — | (246 | ) | |||||||||||||
Receive Floating rate 6 Month GBP-LIBOR Pay Fixed rate 1.37% | LCH | 100,000 | GBP | 1/05/67 | — | (5,111 | ) | |||||||||||||
Receive Floating rate 6 Month GBP-LIBOR Pay Fixed rate 1.44% | LCH | 156,995 | GBP | �� | 1/07/47 | — | (2,226 | ) | ||||||||||||
| franklintempleton.com | Annual Report | 29 |
FRANKLIN ALTERNATIVE STRATEGIES FUNDS
STATEMENT OF INVESTMENTS
Franklin K2 Long Short Credit Fund (continued)
| Interest Rate Swap Contracts (continued) | ||||||||||||||||||||
| Description | Counterparty/ Exchange | Notional Amount | Expiration Date | Unrealized Appreciation | Unrealized Depreciation | |||||||||||||||
| Centrally Cleared Swap Contracts (continued) | ||||||||||||||||||||
Receive Floating rate 6 Month GBP-LIBOR Pay Fixed rate 1.56% | LCH | 112,459 | GBP | 11/29/46 | $ | — | $ | (5,631 | ) | |||||||||||
Receive Floating rate 6 Month GBP-LIBOR Pay Fixed rate 1.60% | LCH | 82,713 | GBP | 12/03/46 | — | (5,171 | ) | |||||||||||||
|
| |||||||||||||||||||
Total Interest Rate Swap Contracts |
| $ | 512 | $ | (18,385 | ) | ||||||||||||||
|
| |||||||||||||||||||
Net unrealized appreciation (depreciation) |
| $ | (17,873 | ) | ||||||||||||||||
|
| |||||||||||||||||||
At May 31, 2017, the Fund had the following total return swap contracts outstanding. See Note 1(d).
| Total Return Swap Contracts | ||||||||||||||||||||||||
| Underlying Instrument | Financing Rate | Counterparty | Notional Value | Expiration Date | Unrealized Appreciation | Unrealized Depreciation | ||||||||||||||||||
| OTC Swap Contracts | ||||||||||||||||||||||||
| Fixed Income Contracts - Long | ||||||||||||||||||||||||
Egyptian Treasury Bill | 0.35 | % | DBAB | $ | 194,721 | 8/15/17 | $ | 289 | $ | — | ||||||||||||||
Egyptian Treasury Bill | 0.35 | % | DBAB | 171,934 | 11/27/17 | — | (704 | ) | ||||||||||||||||
|
| |||||||||||||||||||||||
| $ | 289 | $ | (704 | ) | ||||||||||||||||||||
|
| |||||||||||||||||||||||
| Fixed Income Contracts - Short | ||||||||||||||||||||||||
iBoxx USD Liquid High Yield Index | LIBOR | JPHQ | 980,000 | 6/20/17 | $ | — | $ | (14,175 | ) | |||||||||||||||
iBoxx USD Liquid High Yield Index | LIBOR | JPHQ | 170,000 | 6/20/17 | — | (3,441 | ) | |||||||||||||||||
iBoxx USD Liquid High Yield Index | LIBOR | JPHQ | 170,000 | 6/20/17 | — | (3,909 | ) | |||||||||||||||||
iBoxx USD Liquid High Yield Index | LIBOR | JPHQ | 580,000 | 6/20/17 | — | (9,504 | ) | |||||||||||||||||
iBoxx USD Liquid High Yield Index | LIBOR | JPHQ | 500,000 | 6/20/17 | — | (8,556 | ) | |||||||||||||||||
iBoxx USD Liquid High Yield Index | LIBOR | JPHQ | 400,000 | 6/20/17 | — | (2,898 | ) | |||||||||||||||||
iBoxx USD Liquid Investment Grade Index | LIBOR | JPHQ | 224,000 | 6/20/17 | — | (6,130 | ) | |||||||||||||||||
iBoxx USD Liquid High Yield Index | LIBOR | MSCO | 100,000 | 6/20/17 | — | (1,603 | ) | |||||||||||||||||
iBoxx USD Liquid Investment Grade Index | LIBOR | MSCO | 71,000 | 6/20/17 | — | (2,082 | ) | |||||||||||||||||
|
| |||||||||||||||||||||||
| $ | — | $ | (52,298 | ) | ||||||||||||||||||||
|
| |||||||||||||||||||||||
Total Return Swap Contracts |
| $ | 289 | $ | (53,002 | ) | ||||||||||||||||||
|
| |||||||||||||||||||||||
Net unrealized appreciation (depreciation) |
| $ | (52,713 | ) | ||||||||||||||||||||
|
| |||||||||||||||||||||||
See Abbreviations on page 49.
| 30 | Annual Report | The accompanying notes are an integral part of these financial statements. | franklintempleton.com |
FRANKLIN ALTERNATIVE STRATEGIES FUNDS
Statement of Assets and Liabilities
May 31, 2017
Franklin K2 Long Short Credit Fund
Assets: | ||||
Investments in securities: | ||||
Cost - Unaffiliated issuers | $ | 70,157,025 | ||
Cost - Repurchase agreements | 3,422,669 | |||
|
| |||
Total cost of investments | $ | 73,579,694 | ||
|
| |||
Value - Unaffiliated issuers | $ | 73,162,987 | ||
Value - Repurchase agreements | 3,422,669 | |||
|
| |||
Total value of investments | 76,585,656 | |||
Cash | 1,773,792 | |||
Foreign currency, at value (cost $1,100,186) | 1,272,379 | |||
Receivables: | ||||
Investment securities sold | 2,261,812 | |||
Capital shares sold | 5,000 | |||
Dividends and interest | 398,900 | |||
Affiliates | 1,140 | |||
Due from brokers | 12,359,170 | |||
Variation margin | 9,352 | |||
OTC swap contracts (upfront payments $109,788) | 98,981 | |||
Unrealized appreciation on OTC forward exchange contracts | 140,426 | |||
Unrealized appreciation on OTC swap contracts | 59,352 | |||
Other assets | 15 | |||
|
| |||
Total assets | 94,965,975 | |||
|
| |||
Liabilities: | ||||
Payables: | ||||
Investment securities purchased | 2,271,374 | |||
Capital shares redeemed | 71,537 | |||
Management fees | 106,556 | |||
Distribution fees | 3,246 | |||
OTC swap contracts (upfront receipts $205,670) | 175,281 | |||
Options written, at value (premiums received $2,513) | 4,550 | |||
Securities sold short, at value (proceeds $10,537,285) | 10,859,671 | |||
Due to brokers | 39,027 | |||
Unrealized depreciation on OTC forward exchange contracts | 286,828 | |||
Unrealized depreciation on OTC swap contracts | 184,565 | |||
Accrued expenses and other liabilities | 150,123 | |||
|
| |||
Total liabilities | 14,152,758 | |||
|
| |||
Net assets, at value | $ | 80,813,217 | ||
|
| |||
Net assets consist of: | ||||
Paid-in capital | $ | 76,998,452 | ||
Undistributed net investment income | 281,852 | |||
Net unrealized appreciation (depreciation) | 2,386,583 | |||
Accumulated net realized gain (loss) | 1,146,330 | |||
|
| |||
Net assets, at value | $ | 80,813,217 | ||
|
|
| franklintempleton.com | The accompanying notes are an integral part of these financial statements. | Annual Report | 31 |
FRANKLIN ALTERNATIVE STRATEGIES FUNDS
FINANCIAL STATEMENTS
Statement of Assets and Liabilities (continued)
May 31, 2017
Franklin K2 Long Short Credit Fund
| Class A: | ||||
Net assets, at value | $ | 41,001,474 | ||
|
| |||
Shares outstanding | 3,907,203 | |||
|
| |||
Net asset value per sharea | $10.49 | |||
|
| |||
Maximum offering price per share (net asset value per share ÷ 94.25%) | $11.13 | |||
|
| |||
| Class C: | ||||
Net assets, at value | $ | 1,506,866 | ||
|
| |||
Shares outstanding | 145,653 | |||
|
| |||
Net asset value and maximum offering price per sharea | $10.35 | |||
|
| |||
| Class R: | ||||
Net assets, at value | $ | 127,211 | ||
|
| |||
Shares outstanding | 12,221 | |||
|
| |||
Net asset value and maximum offering price per share | $10.41 | |||
|
| |||
| Class R6: | ||||
Net assets, at value | $ | 13,052,472 | ||
|
| |||
Shares outstanding | 1,243,099 | |||
|
| |||
Net asset value and maximum offering price per share | $10.50 | |||
|
| |||
| Advisor Class: | ||||
Net assets, at value | $ | 25,125,194 | ||
|
| |||
Shares outstanding | 2,392,419 | |||
|
| |||
Net asset value and maximum offering price per share | $10.50 | |||
|
| |||
aRedemption price is equal to net asset value less contingent deferred sales charges, if applicable.
| 32 | Annual Report | The accompanying notes are an integral part of these financial statements. | franklintempleton.com |
FRANKLIN ALTERNATIVE STRATEGIES FUNDS
FINANCIAL STATEMENTS
Statement of Operations
for the year ended May 31, 2017
Franklin K2 Long Short Credit Fund
Investment income: | ||||
Dividends | $ | 112,255 | ||
Interest | 3,235,915 | |||
Paydown gain (loss) | 313,411 | |||
|
| |||
Total investment income | 3,661,581 | |||
|
| |||
Expenses: | ||||
Management fees (Note 3a) | 1,502,139 | |||
Distribution fees: (Note 3c) | ||||
Class A | 21,887 | |||
Class C | 10,123 | |||
Class R | 219 | |||
Transfer agent fees: (Note 3e) | ||||
Class A | 5,001 | |||
Class C | 143 | |||
Class R | 8 | |||
Class R6 | 80 | |||
Advisor Class | 3,482 | |||
Custodian fees (Note 4) | 73,259 | |||
Reports to shareholders | 17,273 | |||
Registration and filing fees | 83,262 | |||
Professional fees | 127,573 | |||
Trustees’ fees and expenses | 22,083 | |||
Amortization of offering costs | 116,489 | |||
Dividends and/or interest on securities sold short | 433,462 | |||
Security borrowing fees | 126,420 | |||
Other | 17,339 | |||
|
| |||
Total expenses | 2,560,242 | |||
|
| |||
Expense reductions (Note 4) | (21,187 | ) | ||
Expenses waived/paid by affiliates (Note 3f) | (532,832 | ) | ||
|
| |||
Net expenses | 2,006,223 | |||
|
| |||
Net investment income | 1,655,358 | |||
|
| |||
Realized and unrealized gains (losses): | ||||
Net realized gain (loss) from: | ||||
Investments | 2,334,002 | |||
Written options | 66,367 | |||
Foreign currency transactions | 240,133 | |||
Futures contracts | (6,860 | ) | ||
Securities sold short | 1,113 | |||
Swap contracts | (393,926 | ) | ||
|
| |||
Net realized gain (loss) | 2,240,829 | |||
|
| |||
Net change in unrealized appreciation (depreciation) on: | ||||
Investments | 1,536,070 | |||
Translation of other assets and liabilities denominated in foreign currencies | 1,223 | |||
Written options | (977 | ) | ||
Futures contracts | 4,269 | |||
Swap contracts | (164,863 | ) | ||
|
| |||
Net change in unrealized appreciation (depreciation) | 1,375,722 | |||
|
| |||
Net realized and unrealized gain (loss) | 3,616,551 | |||
|
| |||
Net increase (decrease) in net assets resulting from operations | $ | 5,271,909 | ||
|
|
| franklintempleton.com | The accompanying notes are an integral part of these financial statements. | Annual Report | 33 |
FRANKLIN ALTERNATIVE STRATEGIES FUNDS
FINANCIAL STATEMENTS
Statements of Changes in Net Assets
Franklin K2 Long Short Credit Fund
| Year Ended May 31, | ||||||||
| 2017 | 2016a | |||||||
Increase (decrease) in net assets: | ||||||||
Operations: | ||||||||
Net investment income | $ | 1,655,358 | $ | 1,204,284 | ||||
Net realized gain (loss) | 2,240,829 | (258,648 | ) | |||||
Net change in unrealized appreciation (depreciation) | 1,375,722 | 1,010,861 | ||||||
|
| |||||||
Net increase (decrease) in net assets resulting from operations | 5,271,909 | 1,956,497 | ||||||
|
| |||||||
Distributions to shareholders from: | ||||||||
Net investment income: | ||||||||
Class A | (1,140,497 | ) | (223,550 | ) | ||||
Class C | (31,012 | ) | (748 | ) | ||||
Class R | (2,328 | ) | (97 | ) | ||||
Class R6 | (380,096 | ) | (99 | ) | ||||
Advisor Class | (755,488 | ) | (199,097 | ) | ||||
Net realized gains: | ||||||||
Class A | (368,226 | ) | (175,371 | ) | ||||
Class C | (11,313 | ) | (576 | ) | ||||
Class R | (758 | ) | (76 | ) | ||||
Class R6 | (121,801 | ) | (76 | ) | ||||
Advisor Class | (242,776 | ) | (155,996 | ) | ||||
|
| |||||||
Total distributions to shareholders | (3,054,295 | ) | (755,686 | ) | ||||
|
| |||||||
Capital share transactions: (Note 2) | ||||||||
Class A | 11,826,722 | 27,777,884 | ||||||
Class C | 1,228,788 | 262,842 | ||||||
Class R | 115,130 | 10,000 | ||||||
Class R6 | 231,683 | 11,915,470 | ||||||
Advisor Class | 1,271,511 | 22,754,762 | ||||||
|
| |||||||
Total capital share transactions | 14,673,834 | 62,720,958 | ||||||
|
| |||||||
Net increase (decrease) in net assets | 16,891,448 | 63,921,769 | ||||||
Net assets: | ||||||||
Beginning of year | 63,921,769 | — | ||||||
|
| |||||||
End of year | $ | 80,813,217 | $ | 63,921,769 | ||||
|
| |||||||
Undistributed net investment income included in net assets: | ||||||||
End of year | $ | 281,852 | $ | 498,976 | ||||
|
| |||||||
aFor the period September 8, 2015 (commencement of operations) to May 31, 2016.
| 34 | Annual Report | The accompanying notes are an integral part of these financial statements. | franklintempleton.com |
FRANKLIN ALTERNATIVE STRATEGIES FUNDS
Franklin K2 Long Short Credit Fund
1. Organization and Significant Accounting Policies
Franklin Alternative Strategies Funds (Trust) is registered under the Investment Company Act of 1940 (1940 Act) as an open-end management investment company, consisting of four separate funds and applies the specialized accounting and reporting guidance in U.S. Generally Accepted Accounting Principles (U.S. GAAP). Franklin K2 Long Short Credit Fund (Fund) is included in this report. The Fund offers five classes of shares: Class A, Class C, Class R, Class R6 and Advisor Class. Each class of shares may differ by its initial sales load, contingent deferred sales charges, voting rights on matters affecting a single class, its exchange privilege and fees primarily due to differing arrangements for distribution and transfer agent fees.
The following summarizes the Fund’s significant accounting policies.
a. Financial Instrument Valuation
The Fund’s investments in financial instruments are carried at fair value daily. Fair value is the price that would be received to sell an asset or paid to transfer a liability in an orderly transaction between market participants on the measurement date. The Fund calculates the net asset value (NAV) per share as of 4 p.m. Eastern time each day the New York Stock Exchange (NYSE) is open for trading. Under compliance policies and procedures approved by the Trust’s Board of Trustees (the Board), the Fund’s administrator has responsibility for oversight of valuation, including leading the cross-functional Valuation Committee (VC). The VC provides administration and oversight of the Fund’s valuation policies and procedures, which are approved annually by the Board. Among other things, these procedures allow the Fund to utilize independent pricing services, quotations from securities and financial instrument dealers, and other market sources to determine fair value.
Equity securities, exchange traded funds and derivative financial instruments (derivatives) listed on an exchange or on the NASDAQ National Market System are valued at the last quoted sale price or the official closing price of the day, respectively. Foreign equity securities are valued as of the close of trading on the foreign stock exchange on which the security is primarily traded or as of 4 p.m. Eastern time. The value is then converted into its U.S. dollar equivalent at the foreign exchange rate in effect at 4 p.m. Eastern time on the day that the value of the security is determined. Over-the-counter (OTC) securities are valued within the range of the most recent quoted bid and ask
prices. Securities that trade in multiple markets or on multiple exchanges are valued according to the broadest and most representative market. Certain equity securities are valued based upon fundamental characteristics or relationships to similar securities.
Debt securities generally trade in the OTC market rather than on a securities exchange. The Fund’s pricing services use multiple valuation techniques to determine fair value. In instances where sufficient market activity exists, the pricing services may utilize a market-based approach through which quotes from market makers are used to determine fair value. In instances where sufficient market activity may not exist or is limited, the pricing services also utilize proprietary valuation models which may consider market characteristics such as benchmark yield curves, credit spreads, estimated default rates, anticipated market interest rate volatility, coupon rates, anticipated timing of principal repayments, underlying collateral, and other unique security features in order to estimate the relevant cash flows, which are then discounted to calculate the fair value. Securities denominated in a foreign currency are converted into their U.S. dollar equivalent at the foreign exchange rate in effect at 4 p.m. Eastern time on the date that the values of the foreign debt securities are determined.
Investments in open-end mutual funds are valued at the closing NAV. Investments in repurchase agreements are valued at cost, which approximates fair value.
Certain derivatives are centrally cleared or trade in the OTC market. The Fund’s pricing services use various techniques including industry standard option pricing models and proprietary discounted cash flow models to determine the fair value of those instruments. The Fund’s net benefit or obligation under the derivative contract, as measured by the fair value of the contract, is included in net assets.
The Fund has procedures to determine the fair value of financial instruments for which market prices are not reliable or readily available. Under these procedures, the VC convenes on a regular basis to review such financial instruments and considers a number of factors, including significant unobservable valuation inputs, when arriving at fair value. The VC primarily employs a market-based approach which may use related or comparable assets or liabilities, recent transactions, market multiples, book values, and other relevant information for the investment to determine the fair value of the investment. An income-based valuation approach may also be used in which the anticipated
| franklintempleton.com | Annual Report | 35 |
FRANKLIN ALTERNATIVE STRATEGIES FUNDS
NOTES TO FINANCIAL STATEMENTS
Franklin K2 Long Short Credit Fund (continued)
1. Organization and Significant Accounting Policies (continued)
a. Financial Instrument Valuation (continued)
future cash flows of the investment are discounted to calculate fair value. Discounts may also be applied due to the nature or duration of any restrictions on the disposition of the investments. Due to the inherent uncertainty of valuations of such investments, the fair values may differ significantly from the values that would have been used had an active market existed. The VC employs various methods for calibrating these valuation approaches including a regular review of key inputs and assumptions, transactional back-testing or disposition analysis, and reviews of any related market activity.
Trading in securities on foreign securities stock exchanges and OTC markets may be completed before 4 p.m. Eastern time. In addition, trading in certain foreign markets may not take place on every Fund’s business day. Occasionally, events occur between the time at which trading in a foreign security is completed and 4 p.m. Eastern time that might call into question the reliability of the value of a portfolio security held by the Fund. As a result, differences may arise between the value of the Fund’s portfolio securities as determined at the foreign market close and the latest indications of value at 4 p.m. Eastern time. In order to minimize the potential for these differences, the VC monitors price movements following the close of trading in foreign stock markets through a series of country specific market proxies (such as baskets of American Depositary Receipts, futures contracts and exchange traded funds). These price movements are measured against established trigger thresholds for each specific market proxy to assist in determining if an event has occurred that may call into question the reliability of the values of the foreign securities held by the Fund. If such an event occurs, the securities may be valued using fair value procedures, which may include the use of independent pricing services.
When the last day of the reporting period is a non-business day, certain foreign markets may be open on those days that the Fund’s NAV is not calculated, which could result in differences between the value of the Fund’s portfolio securities on the last business day and the last calendar day of the reporting period. Any significant security valuation changes due to an open foreign market are adjusted and reflected by the Fund for financial reporting purposes.
b. Foreign Currency Translation
Portfolio securities and other assets and liabilities denominated in foreign currencies are translated into U.S. dollars based on the exchange rate of such currencies against U.S. dollars on the date of valuation. The Fund may enter into foreign currency exchange contracts to facilitate transactions denominated in a foreign currency. Purchases and sales of securities, income and expense items denominated in foreign currencies are translated into U.S. dollars at the exchange rate in effect on the transaction date. Portfolio securities and assets and liabilities denominated in foreign currencies contain risks that those currencies will decline in value relative to the U.S. dollar. Occasionally, events may impact the availability or reliability of foreign exchange rates used to convert the U.S. dollar equivalent value. If such an event occurs, the foreign exchange rate will be valued at fair value using procedures established and approved by the Board.
The Fund does not separately report the effect of changes in foreign exchange rates from changes in market prices on securities held. Such changes are included in net realized and unrealized gain or loss from investments in the Statement of Operations.
Realized foreign exchange gains or losses arise from sales of foreign currencies, currency gains or losses realized between the trade and settlement dates on securities transactions and the difference between the recorded amounts of dividends, interest, and foreign withholding taxes and the U.S. dollar equivalent of the amounts actually received or paid. Net unrealized foreign exchange gains and losses arise from changes in foreign exchange rates on foreign denominated assets and liabilities other than investments in securities held at the end of the reporting period.
c. Joint Repurchase Agreement
The Fund enters into a joint repurchase agreement whereby its uninvested cash balance is deposited into a joint cash account with other funds managed by the investment manager or an affiliate of the investment manager and is used to invest in one or more repurchase agreements. The value and face amount of the joint repurchase agreement are allocated to the funds based on their pro-rata interest. A repurchase agreement is accounted for as a loan by the Fund to the seller, collateralized by securities which are delivered to the Fund’s custodian. The fair value, including accrued interest, of the initial collateralization is required to be at least 102% of the dollar amount invested by the funds, with the value of the underlying securities marked to market daily to maintain coverage of at least 100%. Repurchase
| 36 | Annual Report | franklintempleton.com |
FRANKLIN ALTERNATIVE STRATEGIES FUNDS
NOTES TO FINANCIAL STATEMENTS
Franklin K2 Long Short Credit Fund (continued)
agreements are subject to the terms of Master Repurchase Agreements (MRAs) with approved counterparties (sellers). The MRAs contain various provisions, including but not limited to events of default and maintenance of collateral for repurchase agreements. In the event of default by either the seller or the Fund, certain MRAs may permit the non-defaulting party to net and close-out all transactions, if any, traded under such agreements. The Fund may sell securities it holds as collateral and apply the proceeds towards the repurchase price and any other amounts owed by the seller to the Fund in the event of default by the seller. This could involve costs or delays in addition to a loss on the securities if their value falls below the repurchase price owed by the seller. The joint repurchase agreement held by the Fund at year end, as indicated in the Statement of Investments, had been entered into on May 31, 2017.
d. Derivative Financial Instruments
The Fund invested in derivatives in order to manage risk or gain exposure to various other investments or markets. Derivatives are financial contracts based on an underlying or notional amount, require no initial investment or an initial net investment that is smaller than would normally be required to have a similar response to changes in market factors, and require or permit net settlement. Derivatives contain various risks including the potential inability of the counterparty to fulfill their obligations under the terms of the contract, the potential for an illiquid secondary market, and/or the potential for market movements which expose the Fund to gains or losses in excess of the amounts shown in the Statement of Assets and Liabilities. Realized gain and loss and unrealized appreciation and depreciation on these contracts for the period are included in the Statement of Operations.
Derivative counterparty credit risk is managed through a formal evaluation of the creditworthiness of all potential counterparties. The Fund attempts to reduce its exposure to counterparty credit risk on OTC derivatives, whenever possible, by entering into International Swaps and Derivatives Association (ISDA) master agreements with certain counterparties. These agreements contain various provisions, including but not limited to collateral requirements, events of default, or early termination. Termination events applicable to the counterparty include certain deteriorations in the credit quality of the counterparty. Termination events applicable to the Fund include failure of the Fund to maintain certain net asset levels and/or limit the decline in net assets over various periods of time. In the event of default or early termination, the ISDA master agreement gives the non-
defaulting party the right to net and close-out all transactions traded, whether or not arising under the ISDA agreement, to one net amount payable by one counterparty to the other. However, absent an event of default or early termination, OTC derivative assets and liabilities are presented gross and not offset in the Statement of Assets and Liabilities. Early termination by the counterparty may result in an immediate payment by the Fund of any net liability owed to that counterparty under the ISDA agreement.
Collateral requirements differ by type of derivative. Collateral or initial margin requirements are set by the broker or exchange clearing house for exchange traded and centrally cleared derivatives. Initial margin deposited is held at the exchange and can be in the form of cash and/or securities. For OTC derivatives traded under an ISDA master agreement, posting of collateral is required by either the Fund or the applicable counterparty if the total net exposure of all OTC derivatives with the applicable counterparty exceeds the minimum transfer amount, which typically ranges from $100,000 to $250,000, and can vary depending on the counterparty and the type of the agreement. Generally, collateral is determined at the close of Fund business each day and any additional collateral required due to changes in derivative values may be delivered by the Fund or the counterparty the next business day, or within a few business days. Collateral pledged and/or received by the Fund for OTC derivatives, if any, is held in segregated accounts with the Fund’s custodian/counterparty broker and can be in the form of cash and/or securities. Unrestricted cash may be invested according to the Fund’s investment objectives. To the extent that the amounts due to the Fund from its counterparties are not subject to collateralization or are not fully collateralized, the Fund bears the risk of loss from counterparty non-performance.
The Fund entered into exchange traded futures contracts primarily to manage and/or gain exposure to interest rate and equity price risk. A futures contract is an agreement between the Fund and a counterparty to buy or sell an asset at a specified price on a future date. Required initial margins are pledged by the Fund, and the daily change in fair value is accounted for as a variation margin payable or receivable in the Statement of Assets and Liabilities.
The Fund entered into OTC forward exchange contracts primarily to manage and/or gain exposure to certain foreign currencies. A forward exchange contract is an agreement between the Fund and a counterparty to buy or sell a foreign currency at a specific exchange rate on a future date.
| franklintempleton.com | Annual Report | 37 |
FRANKLIN ALTERNATIVE STRATEGIES FUNDS
NOTES TO FINANCIAL STATEMENTS
Franklin K2 Long Short Credit Fund (continued)
1. Organization and Significant Accounting Policies (continued)
d. Derivative Financial Instruments (continued)
The Fund entered into credit default swap contracts primarily to manage and/or gain exposure to credit risk. A credit default swap is an agreement between the Fund and a counterparty whereby the buyer of the contract receives credit protection and the seller of the contract guarantees the credit worthiness of a referenced debt obligation. These agreements may be privately negotiated in the over-the-counter market (OTC credit default swaps) or may be executed in a multilateral trade facility platform, such as a registered exchange (centrally cleared credit default swaps). The underlying referenced debt obligation may be a single issuer of corporate or sovereign debt, a credit index, a basket of issuers or indices, or a tranche of a credit index or basket of issuers or indices. In the event of a default of the underlying referenced debt obligation, the buyer is entitled to receive the notional amount of the credit default swap contract from the seller in exchange for the referenced debt obligation, a net settlement amount equal to the notional amount of the credit default swap less the recovery value of the referenced debt obligation, or other agreed upon amount. For centrally cleared credit default swaps, required initial margins are pledged by the Fund, and the daily change in fair value is accounted for as a variation margin payable or receivable in the Statement of Assets and Liabilities. Over the term of the contract, the buyer pays the seller a periodic stream of payments, provided that no event of default has occurred. Such periodic payments are accrued daily as an unrealized appreciation or depreciation until the payments are made, at which time they are realized. Upfront payments and receipts are reflected in the Statement of Assets and Liabilities and represent compensating factors between stated terms of the credit default swap agreement and prevailing market conditions (credit spreads and other relevant factors). These upfront payments and receipts are amortized over the term of the contract as a realized gain or loss in the Statement of Operations.
The Fund entered into OTC cross currency swap contracts primarily to manage and/or gain exposure to certain foreign currencies. A cross currency swap is an agreement between the Fund and a counterparty to exchange cash flows (determined using either a fixed or floating rate) based on the notional amounts of two different currencies. The notional amounts are typically determined based on the spot exchange rates at the opening of the contract. Cross currency swaps may require the
exchange of notional amounts at the opening and/or closing of the contract. Over the term of the contract, contractually required payments to be paid and to be received are accrued daily and recorded as unrealized depreciation and appreciation until the payments are made, at which time they are realized. Upfront payments and receipts, if any, are reflected in the Statement of Assets and Liabilities and represent compensating factors between stated terms of the cross currency swap contract and prevailing market conditions (interest rate spreads and other relevant factors). These upfront payments and receipts are amortized over the term of the contract as a realized gain or loss in the Statement of Operations.
The Fund entered into interest rate swap contracts primarily to manage interest rate risk. An interest rate swap is an agreement between the Fund and a counterparty to exchange cash flows based on the difference between two interest rates, applied to a notional amount. These agreements may be privately negotiated in the over-the-counter market (OTC interest rate swaps) or may be executed on a registered exchange (centrally cleared interest rate swaps). For centrally cleared interest rate swaps, required initial margins are pledged by the Fund, and the daily change in fair value is accounted for as a variation margin payable or receivable in the Statement of Assets and Liabilities. Over the term of the contract, contractually required payments to be paid and to be received are accrued daily and recorded as unrealized depreciation and appreciation until the payments are made, at which time they are realized.
The Fund entered into OTC total return swap contracts primarily to manage and/or gain exposure to interest rate and credit risk of an underlying instrument such as a stock, bond, index or basket of securities or indices. A total return swap is an agreement between the Fund and a counterparty to exchange a return linked to an underlying instrument for a floating or fixed rate payment, both based upon a notional amount. Over the term of the contract, contractually required payments to be paid or received are accrued daily and recorded as unrealized appreciation or depreciation until the payments are made, at which time they are recognized as realized gain or loss.
The Fund purchased or wrote exchange traded and/or OTC option contracts primarily to manage and/or gain exposure to interest rate, equity price and foreign exchange rate risk. An option is a contract entitling the holder to purchase or sell a specific amount of shares or units of an asset or notional amount of a swap (swaption), at a specified price. When an option is purchased or written, an amount equal to the premium paid or
| 38 | Annual Report | franklintempleton.com |
FRANKLIN ALTERNATIVE STRATEGIES FUNDS
NOTES TO FINANCIAL STATEMENTS
Franklin K2 Long Short Credit Fund (continued)
received is recorded as an asset or liability, respectively. Upon exercise of an option, the acquisition cost or sales proceeds of the underlying investment is adjusted by any premium received or paid. Upon expiration of an option, any premium received or paid is recorded as a realized gain or loss. Upon closing an option other than through expiration or exercise, the difference between the premium received or paid and the cost to close the position is recorded as a realized gain or loss.
See Notes 6 and 8 regarding investment transactions and other derivative information, respectively.
e. Loan Participation Notes
The Fund invests in loan participation notes (Participations). Participations are loans originally issued to a borrower by one or more financial institutions (the Lender) and subsequently sold to other investors, such as the Fund. Participations typically result in the Fund having a contractual relationship only with the Lender and not with the borrower. The Fund has the right to receive from the Lender any payments of principal, interest and fees which the Lender received from the borrower. The Fund generally has no rights to either enforce compliance by the borrower with the terms of the loan agreement or to any collateral relating to the original loan. As a result, the Fund assumes the credit risk of both the borrower and the Lender that is selling the Participation. The Participations may also involve interest rate risk and liquidity risk, including the potential default or insolvency of the borrower and/or the Lender.
f. Securities Sold Short
The Fund is engaged in selling securities short, which obligates the Fund to replace a borrowed security with the same security at current fair value. The Fund incurs a loss if the price of the security increases between the date of the short sale and the date on which the Fund replaces the borrowed security. The Fund realizes a gain if the price of the security declines between those dates. Gains are limited to the price at which the Fund sold the security short, while losses are potentially unlimited in size.
The Fund is required to establish a margin account with the broker lending the security sold short. While the short sale is outstanding, the broker retains the proceeds of the short sale to the extent necessary to meet margin requirements until the short position is closed out. A deposit must also be maintained with the Fund’s custodian/counterparty broker consisting of cash and/or securities having a value equal to a specified percentage of the value of the securities sold short. The Fund is obligated
to pay fees for borrowing the securities sold short and is required to pay the counterparty any dividends and/or interest due on securities sold short. Such dividends and/or interest and any security borrowing fees are recorded as an expense to the Fund.
g. Income and Deferred Taxes
It is the Fund’s policy to qualify as a regulated investment company under the Internal Revenue Code. The Fund intends to distribute to shareholders substantially all of its taxable income and net realized gains to relieve it from federal income and excise taxes. As a result, no provision for U.S. federal income taxes is required.
The Fund may be subject to foreign taxation related to income received, capital gains on the sale of securities and certain foreign currency transactions in the foreign jurisdictions in which it invests. Foreign taxes, if any, are recorded based on the tax regulations and rates that exist in the foreign markets in which the Fund invests. When a capital gain tax is determined to apply, the Fund records an estimated deferred tax liability in an amount that would be payable if the securities were disposed of on the valuation date.
The Fund may recognize an income tax liability related to its uncertain tax positions under U.S. GAAP when the uncertain tax position has a less than 50% probability that it will be sustained upon examination by the tax authorities based on its technical merits. As of May 31, 2017, the Fund has determined that no tax liability is required in its financial statements related to uncertain tax positions for any open tax years (or expected to be taken in future tax years). Open tax years are those that remain subject to examination and are based on each jurisdiction’s statute of limitation.
h. Security Transactions, Investment Income, Expenses and Distributions
Security transactions are accounted for on trade date. Realized gains and losses on security transactions are determined on a specific identification basis. Interest income and estimated expenses are accrued daily. Amortization of premium and accretion of discount on debt securities are included in interest income. Paydown gains and losses are recorded as an adjustment to interest income separately in the Statement of Operations. Dividend income and dividends declared on securities sold short are recorded on the ex-dividend date except for certain dividends from securities where the dividend rate is not
| franklintempleton.com | Annual Report | 39 |
FRANKLIN ALTERNATIVE STRATEGIES FUNDS
NOTES TO FINANCIAL STATEMENTS
Franklin K2 Long Short Credit Fund (continued)
1. Organization and Significant Accounting Policies (continued)
h. Security Transactions, Investment Income, Expenses and Distributions (continued)
available. In such cases, the dividend is recorded as soon as the information is received by the Fund. Distributions to shareholders are recorded on the ex-dividend date and are determined according to income tax regulations (tax basis). Distributable earnings determined on a tax basis may differ from earnings recorded in accordance with U.S. GAAP. These differences may be permanent or temporary. Permanent differences are reclassified among capital accounts to reflect their tax character. These reclassifications have no impact on net assets or the results of operations. Temporary differences are not reclassified, as they may reverse in subsequent periods.
Common expenses incurred by the Trust are allocated among the funds based on the ratio of net assets of each fund to the combined net assets of the Trust. Fund specific expenses are charged directly to the fund that incurred the expense.
Realized and unrealized gains and losses and net investment income, not including class specific expenses, are allocated daily to each class of shares based upon the relative proportion
of net assets of each class. Differences in per share distributions, by class, are generally due to differences in class specific expenses.
i. Offering Costs
Offering costs are amortized on a straight line basis over twelve months.
j. Accounting Estimates
The preparation of financial statements in accordance with U.S. GAAP requires management to make estimates and assumptions that affect the reported amounts of assets and liabilities at the date of the financial statements and the amounts of income and expenses during the reporting period. Actual results could differ from those estimates.
k. Guarantees and Indemnifications
Under the Trust’s organizational documents, its officers and trustees are indemnified by the Trust against certain liabilities arising out of the performance of their duties to the Trust. Additionally, in the normal course of business, the Trust, on behalf of the Fund, enters into contracts with service providers that contain general indemnification clauses. The Trust’s maximum exposure under these arrangements is unknown as this would involve future claims that may be made against the Trust that have not yet occurred. Currently, the Trust expects the risk of loss to be remote.
2. Shares of Beneficial Interest
At May 31, 2017, there were an unlimited number of shares authorized (without par value). Transactions in the Fund’s shares were as follows:
| Year Ended May 31, | ||||||||||||||||||||
| 2017 | 2016a | |||||||||||||||||||
| Shares | Amount | Shares | Amount | |||||||||||||||||
| Class A Shares: | ||||||||||||||||||||
Shares sold | 1,264,686 | $ | 13,252,348 | 2,783,146 | $ | 27,833,801 | ||||||||||||||
Shares issued in reinvestment of distributions | 34,170 | 351,266 | 74 | 736 | ||||||||||||||||
Shares redeemed | (169,475 | ) | (1,776,892 | ) | (5,398 | ) | (56,653 | ) | ||||||||||||
|
| |||||||||||||||||||
Net increase (decrease) | 1,129,381 | $ | 11,826,722 | 2,777,822 | $ | 27,777,884 | ||||||||||||||
|
| |||||||||||||||||||
| Class C Shares: | ||||||||||||||||||||
Shares sold | 188,527 | $ | 1,949,434 | 526,223 | $ | 5,258,893 | ||||||||||||||
Shares issued in reinvestment of distributions | 4,162 | 42,325 | 117 | 1,149 | ||||||||||||||||
Shares redeemed | (73,843 | ) | (762,971 | ) | (499,533 | ) | (4,997,200 | ) | ||||||||||||
|
| |||||||||||||||||||
Net increase (decrease) | 118,846 | $ | 1,228,788 | 26,807 | $ | 262,842 | ||||||||||||||
|
| |||||||||||||||||||
| 40 | Annual Report | franklintempleton.com |
FRANKLIN ALTERNATIVE STRATEGIES FUNDS
NOTES TO FINANCIAL STATEMENTS
Franklin K2 Long Short Credit Fund (continued)
| Year Ended May 31, | ||||||||||||||||||||
| 2017 | 2016a | |||||||||||||||||||
| Shares | Amount | Shares | Amount | |||||||||||||||||
| Class R Shares: | ||||||||||||||||||||
Shares sold | 10,774 | $ | 112,554 | 500,001 | $ | 5,000,010 | ||||||||||||||
Shares issued in reinvestment of distributions | 253 | 2,586 | — | — | ||||||||||||||||
Shares redeemed | (1 | ) | (10 | ) | (498,806 | ) | (4,990,010 | ) | ||||||||||||
|
| |||||||||||||||||||
Net increase (decrease) | 11,026 | $ | 115,130 | 1,195 | $ | 10,000 | ||||||||||||||
|
| |||||||||||||||||||
| Class R6 Shares: | ||||||||||||||||||||
Shares sold | 111,147 | $ | 1,158,073 | 1,993,087 | $ | 19,659,680 | ||||||||||||||
Shares issued in reinvestment of distributions | 48,773 | 501,391 | — | — | ||||||||||||||||
Shares redeemed | (136,747 | ) | (1,427,781 | ) | (773,161 | ) | (7,744,210 | ) | ||||||||||||
|
| |||||||||||||||||||
Net increase (decrease) | 23,173 | $ | 231,683 | 1,219,926 | $ | 11,915,470 | ||||||||||||||
|
| |||||||||||||||||||
| Advisor Class Shares: | ||||||||||||||||||||
Shares sold | 150,611 | $ | 1,573,709 | 2,506,772 | $ | 25,097,674 | ||||||||||||||
Shares issued in reinvestment of distributions | 4,635 | 47,694 | 2,934 | 29,016 | ||||||||||||||||
Shares redeemed | (33,736 | ) | (349,892 | ) | (238,797 | ) | (2,371,928 | ) | ||||||||||||
|
| |||||||||||||||||||
Net increase (decrease) | 121,510 | $ | 1,271,511 | 2,270,909 | $ | 22,754,762 | ||||||||||||||
|
| |||||||||||||||||||
aFor the period September 8, 2015 (commencement of operations) to May 31, 2016.
3. Transactions with Affiliates
Franklin Resources, Inc. is the holding company for various subsidiaries that together are referred to as Franklin Templeton Investments. Certain officers and trustees of the Trust are also officers and/or directors of the following subsidiaries:
| Subsidiary | Affiliation | |
K2/D&S Management Co., L.L.C. (K2 Advisors) | Investment manager | |
Franklin Templeton Services, LLC (FT Services) | Administrative manager | |
Franklin Templeton Distributors, Inc. (Distributors) | Principal underwriter | |
Franklin Templeton Investor Services, LLC (Investor Services) | Transfer agent |
a. Management Fees
The Fund pays an investment management fee to K2 Advisors of 2.05% per year of the average daily net assets of the Fund.
On July 11, 2017, the Board approved the proposal to change the Fund’s investment management fee agreement. The new agreement will be effective on October 1, 2017.
Effective October 1, 2017, the Fund will pay fees of 1.90% per year of the average daily net assets of the Fund.
Under each subadvisory agreement, the below entities provide subadvisory services to the Fund. The subadvisory fees are paid by K2 Advisors based on the Fund’s average daily net assets, and is not an additional expense of the Fund.
| Subadvisors |
Apollo Credit Management LLC |
Candlewood Investment Group, L.P. |
Chatham Asset Management, LLC |
Ellington Global Asset Management, L.L.C. |
Emso Asset Management Limited |
| franklintempleton.com | Annual Report | 41 |
FRANKLIN ALTERNATIVE STRATEGIES FUNDS
NOTES TO FINANCIAL STATEMENTS
Franklin K2 Long Short Credit Fund (continued)
3. Transactions with Affiliates (continued)
b. Administrative Fees
Under an agreement with K2 Advisors, FT Services provides administrative services to the Fund. The fee is paid by K2 Advisors based on the Fund’s average daily net assets, and is not an additional expense of the Fund.
c. Distribution Fees
The Board has adopted distribution plans for each share class, with the exception of Class R6 and Advisor Class shares, pursuant to Rule 12b-1 under the 1940 Act. Under the Fund’s Class A reimbursement distribution plan, the Fund reimburses Distributors for costs incurred in connection with the servicing, sale and distribution of the Fund’s shares up to the maximum annual plan rate. Under the Class A reimbursement distribution plan, costs exceeding the maximum for the current plan year cannot be reimbursed in subsequent periods. In addition, under the Fund’s Class C and R compensation distribution plans, the Fund pays Distributors for costs incurred in connection with the servicing, sale and distribution of the Fund’s shares up to the maximum annual plan rate for each class. The plan year, for purposes of monitoring compliance with the maximum annual plan rates, is February 1 through January 31 for each fund.
The maximum annual plan rates, based on the average daily net assets, for each class, are as follows:
Class A | 0.25% | |||
Class C | 1.00% | |||
Class R | 0.50% |
d. Sales Charges/Underwriting Agreements
Front-end sales charges and contingent deferred sales charges (CDSC) do not represent expenses of the Fund. These charges are deducted from the proceeds of sales of Fund shares prior to investment or from redemption proceeds prior to remittance, as applicable. Distributors has advised the Fund of the following commission transactions related to the sales and redemptions of the Fund’s shares for the year:
Sales charges retained net of commissions paid to unaffiliated broker/dealers | $ | 2,392 | ||
CDSC retained | $ | 264 |
e. Transfer Agent Fees
Each class of shares, except for Class R6, pays transfer agent fees to Investor Services for its performance of shareholder servicing obligations and reimburses Investor Services for out of pocket expenses incurred, including shareholder servicing fees paid to third parties. These fees are allocated daily based upon their relative proportion of such classes’ aggregate net assets. Class R6 pays Investor Services transfer agent fees specific to that class.
For the year ended May 31, 2017, the Fund paid transfer agent fees of $8,714, of which $4,606 was retained by Investor Services.
f. Waiver and Expense Reimbursements
K2 Advisors has contractually agreed in advance to waive or limit its fees and to assume as its own expense certain expenses otherwise payable by the Fund so that the expenses (excluding distribution fees, acquired fund fees and expenses, and expenses related to securities sold short) for each class of the Fund do not exceed 1.95%, and Class R6 does not exceed 1.94% based on the average net assets of each class (other than certain non-routine expenses or costs, including those relating to litigation, indemnification, reorganizations, and liquidations) until September 30, 2017. Total expenses waived or paid are not subject to recapture subsequent to the Fund’s fiscal year end. Prior to October 1, 2016, expenses for Class R6 were limited to 1.89%.
| 42 | Annual Report | franklintempleton.com |
FRANKLIN ALTERNATIVE STRATEGIES FUNDS
NOTES TO FINANCIAL STATEMENTS
Franklin K2 Long Short Credit Fund (continued)
g. Other Affiliated Transactions
At May 31, 2017, the shares of the Fund were owned by the following entities:
| Shares | Percentage of Outstanding | |||||||
Franklin Resources, Inc. | 4,999,195 | 64.9% | ||||||
Franklin LifeSmart 2025 Retirement Target Fund | 340,182 | 4.4% | ||||||
Franklin LifeSmart 2035 Retirement Target Fund | 295,289 | 3.8% | ||||||
Franklin LifeSmart 2045 Retirement Target Fund | 200,502 | 2.6% | ||||||
Franklin LifeSmart 2030 Retirement Target Fund | 117,464 | 1.5% | ||||||
Franklin LifeSmart 2020 Retirement Target Fund | 100,350 | 1.3% | ||||||
Franklin LifeSmart 2040 Retirement Target Fund | 95,712 | 1.2% | ||||||
Franklin LifeSmart 2050 Retirement Target Fund | 73,615 | 1.0% | ||||||
Franklin LifeSmart 2055 Retirement Target Fund | 18,791 | 0.2% | ||||||
| 6,241,100 | 80.9% | |||||||
|
| |||||||
aInvestment activities of significant shareholders could have a material impact on the Fund.
4. Expense Offset Arrangement
The Fund has entered into an arrangement with its custodian whereby credits realized as a result of uninvested cash balances are used to reduce a portion of the Fund’s custodian expenses. During the year ended May 31, 2017, the custodian fees were reduced as noted in the Statement of Operations.
5. Income Taxes
For tax purposes, capital losses may be carried over to offset future capital gains, if any. During the year ended May 31, 2017, the fund utilized $60,004 of capital loss carryforwards.
The tax character of distributions paid during the years ended May 31, 2017 and 2016, was as follows:
| 2017 | 2016 | |||||||
Distributions paid from ordinary income | $ | 3,054,295 | $ | 755,686 | ||||
At May 31, 2017, the cost of investments, net unrealized appreciation (depreciation), undistributed ordinary income and undistributed long term capital gains for income tax purposes were as follows:
Cost of investments | $ | 73,731,175 | ||
|
| |||
Unrealized appreciation | $ | 3,648,463 | ||
Unrealized depreciation | (793,982 | ) | ||
|
| |||
Net unrealized appreciation (depreciation) | $ | 2,854,481 | ||
|
| |||
Undistributed ordinary income | $ | 965,418 | ||
Undistributed long term capital gains | 347,631 | |||
|
| |||
Distributable earnings | $ | 1,313,049 | ||
|
|
Differences between income and/or capital gains as determined on a book basis and a tax basis are primarily due to differing treatments of bond discounts and premiums, foreign currency transactions, paydown losses, swaps, offering costs and wash sales.
The Fund utilized a tax accounting practice to treat a portion of the proceeds from capital shares redeemed as a distribution from realized capital gains.
| franklintempleton.com | Annual Report | 43 |
FRANKLIN ALTERNATIVE STRATEGIES FUNDS
NOTES TO FINANCIAL STATEMENTS
Franklin K2 Long Short Credit Fund (continued)
6. Investment Transactions
Purchases and sales of investments and securities sold short (excluding short term securities) for the year ended May 31, 2017, aggregated $199,228,650 and $201,659,543, respectively.
Transactions in options written during the year ended May 31, 2017, were as follows:
| Number of Contracts | Premiums | |||||||
Options outstanding at May 31, 2016 | 170 | $ | 9,583 | |||||
Options written | 1,885 | 136,187 | ||||||
Options expired | (785 | ) | (39,514 | ) | ||||
Options exercised | (46 | ) | (3,094 | ) | ||||
Options closed | (1,154 | ) | (100,649 | ) | ||||
|
| |||||||
Options outstanding at May 31, 2017 | 70 | $ | 2,513 | |||||
|
| |||||||
See Notes 1(d) and 8 regarding derivative financial instruments and other derivative information, respectively.
7. Credit Risk
At May 31, 2017, the Fund had 23.8% of its portfolio invested in high yield and other securities rated below investment grade. These securities may be more sensitive to economic conditions causing greater price volatility and are potentially subject to a greater risk of loss due to default than higher rated securities.
8. Other Derivative Information
At May 31, 2017, the Fund’s investments in derivative contracts are reflected in the Statement of Assets and Liabilities as follows:
Asset Derivatives | Liability Derivatives | |||||||||||
| Derivative Contracts Not Accounted for as Hedging Instruments | Statement of Assets and Liabilities Location | Fair Value | Statement of Assets and Liabilities Location | Fair Value | ||||||||
Interest rate contracts | Variation margin | $ | 524 | a | Variation margin | $ | 22,667 | a | ||||
Unrealized appreciation on OTC swap contracts | 289 | Unrealized depreciation on OTC swap contracts | 704 | |||||||||
Foreign exchange contracts | Investments in securities, at value | 2,594 | b | |||||||||
Unrealized appreciation on OTC forward exchange contracts | 140,426 | Unrealized depreciation on OTC forward exchange contracts | 286,828 | |||||||||
Unrealized appreciation on OTC swap contracts | 8,534 | |||||||||||
Credit contracts | Variation margin | 36,915 | a | Variation margin | 202,893 | a | ||||||
OTC swap contracts (upfront payments) | 98,981 | OTC swap contracts (upfront receipts) | 175,281 | |||||||||
Unrealized appreciation on OTC swap contracts | 50,529 | Unrealized depreciation on OTC swap contracts | 183,861 | |||||||||
Equity contracts | Investments in securities, at value | 101,779 | b | Options written, at value | 4,550 | |||||||
Variation margin | 4,503 | a | ||||||||||
|
|
|
| |||||||||
Totals | $ | 440,571 | $ | 881,287 | ||||||||
|
|
|
| |||||||||
aThis amount reflects the cumulative appreciation (depreciation) of futures contracts and centrally cleared swaps contracts as reported in the Statement of Investments. Only the variation margin receivable/payable at year end is separately reported within the Statement of Assets and Liabilities. Prior variation margin movements were recorded to cash upon receipt or payment.
bPurchased option contracts are included in investments in securities, at value in the Statement of Assets and Liabilities.
| 44 | Annual Report | franklintempleton.com |
FRANKLIN ALTERNATIVE STRATEGIES FUNDS
NOTES TO FINANCIAL STATEMENTS
Franklin K2 Long Short Credit Fund (continued)
For the year ended May 31, 2017, the effect of derivative contracts in the Fund’s Statement of Operations was as follows:
| Derivative Contracts Not Accounted for as Hedging Instruments | Statement of Operations Location | Net Realized Gain (Loss) for the Year | Statement of Operations Location | Net Change in Unrealized Appreciation (Depreciation) for the Year | ||||||||
Net realized gain (loss) from: | Net change in unrealized appreciation (depreciation) on: | |||||||||||
Interest rate contracts | Investments | $ | (12,623 | )a | Investments | $ | 4,096 | a | ||||
Futures contracts | 42,222 | Futures contracts | 178 | |||||||||
Swap contracts | (4,041 | ) | Swap contracts | (18,288 | ) | |||||||
Foreign exchange contracts | Foreign currency transactions | 295,664 | b | Investments | (4,432 | )a | ||||||
Translation of other assets and liabilities denominated in foreign currencies | (169,801 | )b | ||||||||||
Swap contracts | 8,534 | |||||||||||
Credit contracts | Swap contracts | (389,885 | ) | Swap contracts | (155,109 | ) | ||||||
Equity contracts | Investments | (495,264 | )a | Investments | (51,069 | )a | ||||||
Written options | 66,367 | Written options | (977 | ) | ||||||||
Futures contracts | (49,082 | ) | Futures contracts | 4,091 | ||||||||
|
|
|
| |||||||||
Totals | $ | (546,642 | ) | $ | (382,777 | ) | ||||||
|
|
|
| |||||||||
aPurchased option contracts are included in net realized gain (loss) from investments and net change in unrealized appreciation (depreciation) on investments in the Statement of Operations.
bForward exchange contracts are included in net realized gain (loss) from foreign currency transactions and net change in unrealized appreciation (depreciation) on translation of other assets and liabilities denominated in foreign currencies in the Statement of Operations.
For the year ended May 31, 2017, the average month end fair value of derivatives represented 0.9% of average month end net assets. The average month end number of open derivative contracts for the year was 101.
At May 31, 2017, the Fund’s OTC derivative assets and liabilities are as follows:
| Gross Amounts of Assets and Liabilities Presented in the Statement of Assets and Liabilities | ||||||||
| Assetsa | Liabilitiesa | |||||||
| Derivatives | ||||||||
Forward Exchange Contracts | $ | 140,426 | $ | 286,828 | ||||
Options Purchased | 2,594 | — | ||||||
Swap Contracts | 158,333 | 359,846 | ||||||
|
| |||||||
Total | $ | 301,353 | $ | 646,674 | ||||
|
| |||||||
aAbsent an event of default or early termination, OTC derivative assets and liabilities are presented gross and not offset in the Statement of Assets and Liabilities.
| franklintempleton.com | Annual Report | 45 |
FRANKLIN ALTERNATIVE STRATEGIES FUNDS
NOTES TO FINANCIAL STATEMENTS
Franklin K2 Long Short Credit Fund (continued)
8. Other Derivative Information (continued)
At May 31, 2017, the Fund’s OTC derivative assets, which may be offset against the Fund’s OTC derivative liabilities, and collateral received from the counterparty, are as follows:
| Amounts Not Offset in the Statement of Assets and Liabilities | ||||||||||||||||||||
| Gross Amounts of Assets Presented in the Statement of Assets and Liabilities | Financial Instruments Available for Offset | Financial Instruments Collateral Received | Cash Collateral Received | Net Amount (Not less than zero) | ||||||||||||||||
| Counterparty | ||||||||||||||||||||
BOFA | $ | 13,857 | $ | (9,838 | ) | $ | — | $ | — | $ | 4,019 | |||||||||
BZWS | 37,230 | (37,230 | ) | — | — | — | ||||||||||||||
DBAB | 26,844 | (26,844 | ) | — | — | — | ||||||||||||||
GSCO | 18,204 | (18,204 | ) | — | — | — | ||||||||||||||
JPHQ | 121,998 | (121,998 | ) | — | — | — | ||||||||||||||
MSCO | 83,220 | (83,220 | ) | — | — | — | ||||||||||||||
|
| |||||||||||||||||||
Total | $ | 301,353 | $ | (297,334 | ) | $ | — | $ | — | $ | 4,019 | |||||||||
|
| |||||||||||||||||||
At May 31, 2017, the Fund’s OTC derivative liabilities, which may be offset against the Fund’s OTC derivative assets, and collateral pledged to the counterparty, are as follows:
| Amounts Not Offset in the Statement of Assets and Liabilities | ||||||||||||||||||||
| Gross Amounts of Liabilities Presented in the Statement of Assets and Liabilities | Financial Instruments Available for Offset | Financial Instruments Collateral Pledgeda | Cash Collateral Pledgedb | Net Amount (Not less than zero) | ||||||||||||||||
| Counterparty | ||||||||||||||||||||
BOFA | $ | 9,838 | $ | (9,838 | ) | $ | — | $ | — | $ | — | |||||||||
BZWS | 62,662 | (37,230 | ) | — | — | 25,432 | ||||||||||||||
DBAB | 119,722 | (26,844 | ) | — | — | 92,878 | ||||||||||||||
GSCO | 122,722 | (18,204 | ) | — | (104,518 | ) | — | |||||||||||||
JPHQ | 229,583 | (121,998 | ) | — | — | 107,585 | ||||||||||||||
MSCO | 102,147 | (83,220 | ) | — | (18,927 | ) | — | |||||||||||||
|
| |||||||||||||||||||
Total | $ | 646,674 | $ | (297,334 | ) | $ | — | $ | (123,445 | ) | $ | 225,895 | ||||||||
|
| |||||||||||||||||||
aSee the accompanying Statement of Investments for securities pledged as collateral for derivatives.
bIn some instances, the collateral amounts disclosed in the table above were adjusted due to the requirement to limit the collateral amounts to avoid the effect of over collateralization. Actual collateral received and/or pledged may be more than the amounts disclosed herein.
See Notes 1(d) and 6 regarding derivative financial instruments and investment transactions, respectively.
See Abbreviations on page 49.
9. Credit Facility
The Fund, together with other U.S. registered and foreign investment funds (collectively, Borrowers), managed by Franklin Templeton Investments, are borrowers in a joint syndicated senior unsecured credit facility totaling $2 billion (Global Credit Facility) which matures on February 9, 2018. This Global Credit Facility provides a source of funds to the Borrowers for temporary and emergency purposes, including the ability to meet future unanticipated or unusually large redemption requests.
| 46 | Annual Report | franklintempleton.com |
FRANKLIN ALTERNATIVE STRATEGIES FUNDS
NOTES TO FINANCIAL STATEMENTS
Franklin K2 Long Short Credit Fund (continued)
Under the terms of the Global Credit Facility, the Fund shall, in addition to interest charged on any borrowings made by the Fund and other costs incurred by the Fund, pay its share of fees and expenses incurred in connection with the implementation and maintenance of the Global Credit Facility, based upon its relative share of the aggregate net assets of all of the Borrowers, including an annual commitment fee of 0.15% based upon the unused portion of the Global Credit Facility. These fees are reflected in other expenses in the Statement of Operations. During the year ended May 31, 2017, the Fund did not use the Global Credit Facility.
10. Fair Value Measurements
The Fund follows a fair value hierarchy that distinguishes between market data obtained from independent sources (observable inputs) and the Fund’s own market assumptions (unobservable inputs). These inputs are used in determining the value of the Fund’s financial instruments and are summarized in the following fair value hierarchy:
| • | Level 1 – quoted prices in active markets for identical financial instruments |
| • | Level 2 – other significant observable inputs (including quoted prices for similar financial instruments, interest rates, prepayment speed, credit risk, etc.) |
| • | Level 3 – significant unobservable inputs (including the Fund’s own assumptions in determining the fair value of financial instruments) |
The input levels are not necessarily an indication of the risk or liquidity associated with financial instruments at that level.
For movements between the levels within the fair value hierarchy, the Fund has adopted a policy of recognizing the transfers as of the date of the underlying event which caused the movement.
A summary of inputs used as of May 31, 2017, in valuing the Fund’s assets and liabilities carried at fair value, is as follows:
| Level 1 | Level 2 | Level 3 | Total | |||||||||||||
| Assets: | ||||||||||||||||
Investments in Securities:a | ||||||||||||||||
Common Stocks and Other Equity Interests | $ | 699,498 | $ | — | $ | 186,736 | $ | 886,234 | ||||||||
Convertible Preferred Stocks | 206,927 | — | — | 206,927 | ||||||||||||
Preferred Stocks | 52,231 | — | 298,969 | 351,200 | ||||||||||||
Convertible Bonds | — | 627,546 | — | 627,546 | ||||||||||||
Corporate Bonds and Notes | — | 27,364,142 | — | 27,364,142 | ||||||||||||
Foreign Government and Agency Securities | — | 4,804,091 | — | 4,804,091 | ||||||||||||
Asset-Backed Securities and Commercial Mortgage-Backed Securities | — | 25,375,747 | 303,284 | 25,679,031 | ||||||||||||
Options Purchased | 101,779 | 2,594 | — | 104,373 | ||||||||||||
U.S. Government and Agency Securities | — | 1,329,784 | — | 1,329,784 | ||||||||||||
Short Term Investments | 11,809,659 | 3,422,669 | — | 15,232,328 | ||||||||||||
|
| |||||||||||||||
Total Investments in Securities | $ | 12,870,094 | $ | 62,926,573 | $ | 788,989 | $ | 76,585,656 | ||||||||
|
| |||||||||||||||
Other Financial Instruments: | ||||||||||||||||
Futures Contracts | $ | 12 | $ | — | $ | — | $ | 12 | ||||||||
Forward Exchange Contracts | — | 140,426 | — | 140,426 | ||||||||||||
Swap Contracts | — | 96,779 | — | 96,779 | ||||||||||||
|
| |||||||||||||||
Total Other Financial Instruments | $ | 12 | $ | 237,205 | $ | — | $ | 237,217 | ||||||||
|
| |||||||||||||||
| franklintempleton.com | Annual Report | 47 |
FRANKLIN ALTERNATIVE STRATEGIES FUNDS
NOTES TO FINANCIAL STATEMENTS
Franklin K2 Long Short Credit Fund (continued)
10. Fair Value Measurements (continued)
| Level 1 | Level 2 | Level 3 | Total | |||||||||||||
| Liabilities: | ||||||||||||||||
Other Financial Instruments: | ||||||||||||||||
Options Written | $ | 4,550 | $ | — | $ | — | $ | 4,550 | ||||||||
Securities Sold Shorta | 225,588 | 10,634,083 | — | 10,859,671 | ||||||||||||
Futures Contracts | 8,785 | — | — | 8,785 | ||||||||||||
Forward Exchange Contracts | — | 286,828 | — | 286,828 | ||||||||||||
Swap Contracts | — | 405,843 | — | 405,843 | ||||||||||||
|
| |||||||||||||||
Total Other Financial Instruments | $ | 238,923 | $ | 11,326,754 | $ | — | $ | 11,565,677 | ||||||||
|
| |||||||||||||||
a For detailed categories, see the accompanying Statement of Investments.
A reconciliation of assets in which Level 3 inputs are used in determining fair value is presented when there are significant Level 3 financial instruments at the end of the year.
11. New Accounting Pronouncements
In March 2017, the Financial Accounting Standards Board (FASB) issued Accounting Standards Update (ASU) No. 2017-08, Receivables — Nonrefundable Fees and Other Costs (Subtopic 310-20): Premium Amortization on Purchased Callable Debt Securities. The amendments in the ASU shorten the amortization period for certain callable debt securities, held at a premium, to be amortized to the earliest call date. The ASU does not require an accounting change for securities held at a discount; which continues to be amortized to maturity. The ASU is effective for fiscal years and interim periods within those fiscal years beginning after December 15, 2018. Management is currently evaluating the impact, if any, of applying this provision.
12. Investment Company Reporting Modernization
In October 2016, the U.S. Securities and Exchange Commission adopted new rules and amended existing rules (together, final rules) intended to modernize the reporting and disclosure of information by registered investment companies. In part, the final rules amend Regulation S-X and require standardized, enhanced disclosures about derivatives in investment company financial statements, as well as other amendments. The compliance date for the amendments to Regulation S-X is August 1, 2017. Management has reviewed the requirements and believes the adoption of the amendments to Regulation S-X will not have a material impact on the Fund’s financial statements and related disclosures.
13. Subsequent Events
The Fund has evaluated subsequent events through the issuance of the financial statements and determined that no events have occurred that require disclosure other than those already disclosed in the financial statements.
| 48 | Annual Report | franklintempleton.com |
FRANKLIN ALTERNATIVE STRATEGIES FUNDS
NOTES TO FINANCIAL STATEMENTS
Franklin K2 Long Short Credit Fund (continued)
Abbreviations
| Counterparty/Exchange | Currency | Selected Portfolio | Index | |||||||||||
| BOFA | Bank of America, N.A. | ARS | Argentine Peso | ADR | American Depositary Receipt | CDX.NA.HY | CDX North America High Yield | |||||||
| BZWS | Barclays Bank PLC | CZK | Czech Koruna | ARM | Adjustable Rate Mortgage | |||||||||
| DBAB | Deutsche Bank, A.G. | EGP | Egyptian Pound | CLO | Collateralized Loan Obligation | |||||||||
| GSCO | Goldman Sachs International | EUR | Euro | ETF | Exchange Traded Fund | |||||||||
| ICE | Intercontinental Exchange, Inc. | GBP | British Pound | FHLMC | Federal Home Loan Mortgage Corp. | |||||||||
| JPHQ | JP Morgan Chase Bank, N.A. | INR | Indian Rupee | FNMA | Federal National Mortgage Association | |||||||||
| LCH | LCH.Clearnet LLC | JPY | Japanese Yen | FRN | Floating Rate Note | |||||||||
| MSCO | Morgan Stanley & Co., LLC | RUB | Russian Ruble | JIBAR | Johannesburg Interbank Agreed Rate | |||||||||
| SAR | Saudi Riyal | LIBOR | London InterBank Offered Rate | |||||||||||
| TRY | Turkish Lira | MSCI | Morgan Stanley Capital International | |||||||||||
| USD | United States Dollar | PIK | Payment In-Kind | |||||||||||
| ZAR | South African Rand | REIT | Real Estate Investment Trust | |||||||||||
SAFEX | South African Futures Exchange | |||||||||||||
| SPDR | Standard & Poor Depositary Receipt | |||||||||||||
| franklintempleton.com | Annual Report | 49 |
FRANKLIN ALTERNATIVE STRATEGIES FUNDS
Report of Independent Registered Public Accounting Firm
To the Board of Trustees of Franklin Alternative Strategies Funds and Shareholders of Franklin K2 Long Short Credit Fund:
We have audited the accompanying statement of assets and liabilities, including the statement of investments, of Franklin K2 Long Short Credit Fund (the “Fund”) (one of the funds constituting the Franklin Alternative Strategies Funds), as of May 31, 2017, and the related statement of operations for the year then ended and the statement of changes in net assets and the financial highlights for each of the periods indicated therein. These financial statements and financial highlights are the responsibility of the Fund’s management. Our responsibility is to express an opinion on these financial statements and financial highlights based on our audits.
We conducted our audits in accordance with the standards of the Public Company Accounting Oversight Board (United States). Those standards require that we plan and perform the audit to obtain reasonable assurance about whether the financial statements and financial highlights are free of material misstatement. We were not engaged to perform an audit of the Fund’s internal control over financial reporting. Our audits included consideration of internal control over financial reporting as a basis for designing audit procedures that are appropriate in the circumstances, but not for the purpose of expressing an opinion on the effectiveness of the Fund’s internal control over financial reporting. Accordingly, we express no such opinion. An audit also includes examining, on a test basis, evidence supporting the amounts and disclosures in the financial statements and financial highlights, assessing the accounting principles used and significant estimates made by management, and evaluating the overall financial statement presentation. Our procedures included confirmation of securities owned as of May 31, 2017, by correspondence with the custodian and others, or by other appropriate auditing procedures where replies from others were not received. We believe that our audits provide a reasonable basis for our opinion.
In our opinion, the financial statements and financial highlights referred to above present fairly, in all material respects, the financial position of Franklin K2 Long Short Credit Fund (one of the funds constituting the Franklin Alternative Strategies Funds) at May 31, 2017, the results of its operations for the year then ended and the changes in its net assets and the financial highlights for each of the periods indicated therein, in conformity with U.S. generally accepted accounting principles.

Boston, Massachusetts
July 26, 2017
| 50 | Annual Report | franklintempleton.com |
FRANKLIN ALTERNATIVE STRATEGIES FUNDS
Under Section 852(b)(3)(C) of the Internal Revenue Code (Code), the Fund hereby reports the maximum amount allowable but no less than $46,651 as long term capital gain dividend for the fiscal year ended May 31, 2017.
Under Section 871(k)(2)(C) of the Code, the Fund hereby reports the maximum amount allowable but no less than $744,874 as short term capital gain dividend for purposes of the tax imposed under Section 871(a)(1)(A) of the Code for the fiscal year ended May 31, 2017.
| franklintempleton.com | Annual Report | 51 |
FRANKLIN ALTERNATIVE STRATEGIES FUNDS
The name, year of birth and address of the officers and board members, as well as their affiliations, positions held with the Funds, principal occupations during at least the past five years and number of U.S. registered portfolios overseen in the Franklin Templeton Investments fund complex, are shown below. Generally, each board member serves until that person’s successor is elected and qualified.
Independent Board Members
| Name, Year of Birth and Address | Position | Length of Time Served | Number of Portfolios in Fund Complex Overseen by Board Member* | Other Directorships Held During at Least the Past 5 Years | ||||
| Edward I. Altman, Ph.D. (1941) c/o Franklin Mutual Advisers, LLC 101 John F. Kennedy Parkway Short Hills, NJ 07078-2789 | Trustee | Since 2011 | 16 | None | ||||
| Principal Occupation During at Least the Past 5 Years: | ||||||||
| Max L. Heine Professor of Finance, Emeritus and Director of The Credit and Debt Markets Research Program, Salomon Center, Stern School of Business, New York University; editor and author of numerous financial publications; financial consultant; an adviser to numerous financial and publishing organizations; and formerly, Vice Director, Salomon Center, Stern School of Business, New York University. | ||||||||
Ann Torre Bates (1958) | Trustee | Since 2011 | 42 | Ares Capital Corporation (specialty finance company) (2010-present), United Natural Foods, Inc. (distributor of natural, organic and specialty foods) (2013-present), Allied Capital Corporation (financial services) (2003-2010) and SLM Corporation (Sallie Mae) (1997-2014) and Navient Corporation (loan management, servicing and asset recovery) (2014-2016). | ||||
| Principal Occupation During at Least the Past 5 Years: | ||||||||
| Director of various companies; and formerly, Executive Vice President and Chief Financial Officer, NHP Incorporated (manager of multifamily housing) (1995-1997); and Vice President and Treasurer, US Airways, Inc. (until 1995). | ||||||||
| Burton J. Greenwald (1929) c/o Franklin Mutual Advisers, LLC 101 John F. Kennedy Parkway Short Hills, NJ 07078-2789 | Trustee | Since 2011 | 16 | Franklin Templeton Emerging Markets Debt Opportunities Fund PLC (1999-present) and Fiduciary International Ireland Limited (1999-2015). | ||||
| Principal Occupation During at Least the Past 5 Years: | ||||||||
| Managing Director, B.J. Greenwald Associates (management consultants to the financial services industry); and formerly, Chairman, Fiduciary Trust International Funds; Executive Vice President, L.F. Rothschild Fund Management, Inc.; President and Director, Merit Mutual Funds; President, Underwriting Division and Director, National Securities & Research Corporation; Governor, Investment Company Institute; and Chairman, ICI Public Information Committee. | ||||||||
| Keith E. Mitchell (1954) c/o Franklin Mutual Advisers, LLC 101 John F. Kennedy Parkway Short Hills, NJ 07078-2789 | Trustee | Since 2011 | 16 | None | ||||
| Principal Occupation During at Least the Past 5 Years: | ||||||||
| Director of various boards of asset management firms; and formerly, Managing Member, Mitchell, Hartley & Bechtel Advisers, LLC (formerly, Mitchell Advisers, LLC) (advisory firm) (2003-2015) and Managing Director, Putman Lovell NBF. | ||||||||
| 52 | Annual Report | franklintempleton.com |
FRANKLIN ALTERNATIVE STRATEGIES FUNDS
Independent Board Members (continued)
| Name, Year of Birth and Address | Position | Length of Time Served | Number of Portfolios in Fund Complex Overseen by Board Member* | Other Directorships Held During at Least the Past 5 Years | ||||
| David W. Niemiec (1949) c/o Franklin Mutual Advisers, LLC 101 John F. Kennedy Parkway Short Hills, NJ 07078-2789 | Trustee | Since 2015 | 42 | Hess Midstream Partners LP (oil and gas midstream infrastructure) (April 2017). | ||||
| Principal Occupation During at Least the Past 5 Years: | ||||||||
| Advisor, Saratoga Partners (private equity fund); and formerly, Managing Director, Saratoga Partners (1998-2001) and SBC Warburg Dillon Read (investment banking) (1997-1998); Vice Chairman, Dillon, Read & Co. Inc. (investment banking) (1991-1997); and Chief Financial Officer, Dillon, Read & Co. Inc. (1982-1997). | ||||||||
| Charles Rubens II (1930) c/o Franklin Mutual Advisers, LLC 101 John F. Kennedy Parkway Short Hills, NJ 07078-2789 | Trustee | Since 2011 | 16 | None | ||||
| Principal Occupation During at Least the Past 5 Years: | ||||||||
| Private investor and president of non-profit organizations; and formerly, an executive of Time, Inc.; and Trustee of Colorado College. | ||||||||
| Jan Hopkins Trachtman (1947) c/o Franklin Mutual Advisers, LLC 101 John F. Kennedy Parkway Short Hills, NJ 07078-2789 | Trustee | Since 2011 | 16 | None | ||||
| Principal Occupation During at Least the Past 5 Years: | ||||||||
| President and Founder, The Jan Hopkins Group (communications consulting firm); serves on Advisory Board of Knight Bagehot Fellowship; and formerly, President, Economic Club of New York (2007-2015); Anchor/Correspondent, CNN Financial News (until 2003); Managing Director and Head of Client Communications, Citigroup Private Bank (until 2005); Off-Air Reporter, ABC News’ World News Tonight; and Editor, CBS Network News. | ||||||||
| Robert E. Wade (1946) c/o Franklin Mutual Advisers, LLC 101 John F. Kennedy Parkway Short Hills, NJ 07078-2789 | Trustee and Chairman of the Board | Trustee and Chairman of the Board since 2011 | 42 | El Oro Ltd (investments) (2003-present). | ||||
| Principal Occupation During at Least the Past 5 Years: | ||||||||
| Attorney at law engaged in private practice (1972-2008) and member of various boards. | ||||||||
| Gregory H. Williams (1943) c/o Franklin Mutual Advisers, LLC 101 John F. Kennedy Parkway Short Hills, NJ 07078-2789 | Trustee | Since 2015 | 16 | None | ||||
| Principal Occupation During at Least the Past 5 Years: | ||||||||
| Private investor; Consultant; and formerly, President, University of Cincinnati (2009-2012); President, The City College of New York (2001-2009); Dean, College of Law, Ohio State University (1993-2001); and Associate Vice President, Academic Affairs and Professor of Law, University of Iowa (1977-1993). | ||||||||
| franklintempleton.com | Annual Report | 53 |
FRANKLIN ALTERNATIVE STRATEGIES FUNDS
Interested Board Members and Officers
| Name, Year of Birth and Address | Position | Length of Time Served | Number of Portfolios in Fund Complex Overseen by Board Member* | Other Directorships Held During at Least the Past 5 Years | ||||
| **Gregory E. Johnson (1961) One Franklin Parkway San Mateo, CA 94403-1906 | Trustee | Since 2011 | 156 | None | ||||
| Principal Occupation During at Least the Past 5 Years: | ||||||||
| Chairman of the Board, Member – Office of the Chairman, Director and Chief Executive Officer, Franklin Resources, Inc.; officer and/or director or trustee, as the case may be, of some of the other subsidiaries of Franklin Resources, Inc. and of 44 of the investment companies in Franklin Templeton Investments; and Chairman, Investment Company Institute; and formerly, President, Franklin Resources, Inc. (1994-2015). | ||||||||
| **Jennifer M. Johnson (1964) One Franklin Parkway San Mateo, CA 94403-1906 | Trustee | Since 2015 | 19 | None | ||||
| Principal Occupation During at Least the Past 5 Years: | ||||||||
| President and Chief Operating Officer, Franklin Resources, Inc.; officer and/or director or trustee, as the case may be, of some of the other subsidiaries of Franklin Resources, Inc. and of four of the investment companies in Franklin Templeton Investments; and formerly, Chief Operating Officer and Executive Vice President, Franklin Resources, Inc. (1994-2015); Executive Vice President of Operations and Technology, Franklin Resources, Inc. (2005-2010); and Senior Vice President, Franklin Resources, Inc. (2003-2005). | ||||||||
| Alison E. Baur (1964) One Franklin Parkway San Mateo, CA 94403-1906 | Vice President | Since 2012 | Not Applicable | Not Applicable | ||||
| Principal Occupation During at Least the Past 5 Years: | ||||||||
| Deputy General Counsel, Franklin Templeton Investments; and officer of some of the other subsidiaries of Franklin Resources, Inc. and of 45 of the investment companies in Franklin Templeton Investments. | ||||||||
| Aliya S. Gordon (1973) One Franklin Parkway San Mateo, CA 94403-1906 | Vice President | Since 2011 | Not Applicable | Not Applicable | ||||
Principal Occupation During at Least the Past 5 Years: | ||||||||
| Senior Associate General Counsel, Franklin Templeton Investments; and officer of 45 of the investment companies in Franklin Templeton Investments. | ||||||||
| Steven J. Gray (1955) One Franklin Parkway San Mateo, CA 94403-1906 | Secretary and Vice President | Secretary and Vice President since 2011 | Not Applicable | Not Applicable | ||||
| Principal Occupation During at Least the Past 5 Years: | ||||||||
| Senior Associate General Counsel, Franklin Templeton Investments; Vice President, Franklin Templeton Distributors, Inc. and FT AlphaParity, LLC; and officer of 45 of the investment companies in Franklin Templeton Investments. | ||||||||
Madison S. Gulley (1964) 300 S.E. 2nd Street Fort Lauderdale, FL 33301-1923 | President and Chief Executive Officer – Investment Management | Since June 2017 | Not Applicable | Not Applicable | ||||
| Principal Occupation During at Least the Past 5 Years: | ||||||||
| Executive Vice President, Franklin Advisers, Inc., Franklin Advisory Services, LLC, Franklin Templeton Institutional, LLC; Templeton Global Advisors, Limited, and Templeton Investment Counsel, LLC; Senior Vice President, Franklin Templeton Companies, LLC; officer and/or director or trustee, as the case may be, of some of the other subsidiaries of Franklin Resources, Inc. and of one of the investment companies in Franklin Templeton Investments. | ||||||||
| 54 | Annual Report | franklintempleton.com |
FRANKLIN ALTERNATIVE STRATEGIES FUNDS
Interested Board Members and Officers (continued)
| Name, Year of Birth and Address | Position | Length of Time Served | Number of Portfolios in Fund Complex Overseen by Board Member* | Other Directorships Held During at Least the Past 5 Years | ||||
Matthew T. Hinkle (1971) One Franklin Parkway San Mateo, CA 94403-1906 | Chief Executive Officer – Finance and Administration | Since June 2017 | Not Applicable | Not Applicable | ||||
| Principal Occupation During at Least the Past 5 Years: | ||||||||
| Senior Vice President, U.S. Fund Administration Reporting & Fund Tax, Franklin Templeton Investments; officer of 45 of the investment companies in Franklin Templeton Investments; and formerly, Vice President, Global Tax (2012-April 2017) and Treasurer/Assistant Treasurer, Franklin Templeton Investments (2009-2017). | ||||||||
| Robert G. Kubilis (1973) 300 S.E. 2nd Street Fort Lauderdale, FL 33301-1923 | Treasurer, Chief Financial Officer and Chief Accounting Officer | Since 2015 | Not Applicable | Not Applicable | ||||
| Principal Occupation During at Least the Past 5 Years: | ||||||||
| Treasurer, U.S. Fund Administration & Reporting, Franklin Templeton Investments; and officer of 18 of the investment companies in Franklin Templeton Investments. | ||||||||
| Robert Lim (1948) One Franklin Parkway San Mateo, CA 94403-1906 | Vice President – AML Compliance | Since 2016 | Not Applicable | Not Applicable | ||||
| Principal Occupation During at Least the Past 5 Years: | ||||||||
| Vice President, Franklin Templeton Companies, LLC; Chief Compliance Officer, Franklin Templeton Distributors, Inc. and Franklin Templeton Investor Services, LLC; and officer of 45 of the investment companies in Franklin Templeton Investments. | ||||||||
| Kimberly H. Novotny (1972) 300 S.E. 2nd Street Fort Lauderdale, FL 33301-1923 | Vice President | Since 2013 | Not Applicable | Not Applicable | ||||
| Principal Occupation During at Least the Past 5 Years: | ||||||||
| Associate General Counsel, Franklin Templeton Investments; Vice President and Corporate Secretary, Fiduciary Trust International of the South; Vice President, Templeton Investment Counsel, LLC; Assistant Secretary, Franklin Resources, Inc.; and officer of 45 of the investment companies in Franklin Templeton Investments. | ||||||||
| Robert C. Rosselot (1960) 300 S.E. 2nd Street Fort Lauderdale, FL 33301-1923 | Chief Compliance Officer | Since 2013 | Not Applicable | Not Applicable | ||||
| Principal Occupation During at Least the Past 5 Years: | ||||||||
| Director, Global Compliance, Franklin Templeton Investments; Vice President, Franklin Templeton Companies, LLC; officer of 45 of the investment companies in Franklin Templeton Investments; and formerly, Senior Associate General Counsel, Franklin Templeton Investments (2007-2013); and Secretary and Vice President, Templeton Group of Funds (2004-2013). | ||||||||
| Karen L. Skidmore (1952) One Franklin Parkway San Mateo, CA 94403-1906 | Vice President | Since 2011 | Not Applicable | Not Applicable | ||||
| Principal Occupation During at Least the Past 5 Years: | ||||||||
| Senior Associate General Counsel, Franklin Templeton Investments; and officer of 45 of the investment companies in Franklin Templeton Investments. | ||||||||
| franklintempleton.com | Annual Report | 55 |
FRANKLIN ALTERNATIVE STRATEGIES FUNDS
Interested Board Members and Officers (continued)
| Name, Year of Birth and Address | Position | Length of Time Served | Number of Portfolios in Fund Complex Overseen by Board Member* | Other Directorships Held During at Least the Past 5 Years | ||||
| Navid J. Tofigh (1972) One Franklin Parkway San Mateo, CA 94403-1906 | Vice President | Since 2015 | Not Applicable | Not Applicable | ||||
| Principal Occupation During at Least the Past 5 Years: | ||||||||
| Associate General Counsel, Franklin Templeton Investments; and officer of 45 of the investment companies in Franklin Templeton Investments. | ||||||||
| Craig S. Tyle (1960) One Franklin Parkway San Mateo, CA 94403-1906 | Vice President | Since 2011 | Not Applicable | Not Applicable | ||||
| Principal Occupation During at Least the Past 5 Years: | ||||||||
| General Counsel and Executive Vice President, Franklin Resources, Inc.; and officer of some of the other subsidiaries of Franklin Resources, Inc. and of 45 of the investment companies in Franklin Templeton Investments. | ||||||||
| Lori A. Weber (1964) 300 S.E. 2nd Street Fort Lauderdale, FL 33301-1923 | Vice President | Since 2011 | Not Applicable | Not Applicable | ||||
| Principal Occupation During at Least the Past 5 Years: | ||||||||
| Senior Associate General Counsel, Franklin Templeton Investments; Assistant Secretary, Franklin Resources, Inc.; Vice President and Secretary, Templeton Investment Counsel, LLC; and officer of 45 of the investment companies in Franklin Templeton Investments. | ||||||||
*We base the number of portfolios on each separate series of the U.S. registered investment companies within the Franklin Templeton Investments fund complex. These portfolios have a common investment manager or affiliated investment managers.
**Gregory E. Johnson is considered to be an interested person of the Fund under the federal securities laws due to his position as an officer and director of Franklin Resources, Inc. (Resources), which is the parent company of the Fund’s investment manager and distributor. Jennifer M. Johnson is considered to be an interested person of the Fund under the federal securities laws due to her position as officer and director of Resources.
Note 1: Gregory E. Johnson and Jennifer M. Johnson are siblings.
Note 2: Officer information is current as of the date of this report. It is possible that after this date, information about officers may change.
Note 3: Effective June 1, 2017, William Y. Yun ceased to be an officer of the trust.
The Fund’s Board has determined that certain of the members of the Audit Committee, including Ann Torre Bates, are audit committee financial experts, and “independent,” under those provisions of the Sarbanes-Oxley Act of 2002, and the rules and form amendments adopted by the Securities and Exchange Commission, relating to audit committee financial experts.
The Statement of Additional Information (SAI) includes additional information about the board members and is available, without charge, upon request. Shareholders may call (800) DIAL BEN/342-5236 to request the SAI.
| 56 | Annual Report | franklintempleton.com |
FRANKLIN ALTERNATIVE STRATEGIES FUNDS
FRANKLIN K2 LONG SHORT CREDIT FUND
Board Approval of Investment Management Agreements and Sub-Advisory Agreements
FRANKLIN K2 LONG SHORT CREDIT FUND
(“Fund”)
The Board of Trustees (Board) of Franklin Alternative Strategies Funds (the Trust), including a majority of trustees that are not “interested persons” as such term is defined in section 2(a)(19) of the Investment Company Act of 1940 (hereinafter referred to as “independent trustees”), at an in-person meeting held on May 22, 2017, unanimously approved the renewal of the Fund’s investment management agreement with K2/D&S Management Co., L.L.C. (K2 Advisors), and of each sub-advisory agreement between K2 Advisors and each of following sub-advisors (the Sub-Advisors):
Apollo Credit Management, LLC
Candlewood Investment Group, L.P.
Chatham Asset Management, LLC
Ellington Global Asset Management, L.L.C.
EMSO Asset Management Limited
Logan Circle Partners, L.P.
Prior to a meeting of all of the trustees for the purpose of considering such renewal, the independent trustees participated in two other meetings held in connection with the renewal process. Throughout the process, the independent trustees received assistance and advice from and met separately with independent counsel. The independent trustees met with and interviewed officers of K2 Advisors and certain Sub-Advisors (including portfolio managers), the transfer agent and shareholder services group and the distributor. In approving the renewal of the investment management agreement and the subadvisory agreements for the Fund, the Board, including the independent trustees, determined that the investment management fee structure was fair and reasonable and that continuance of the agreement was in the best interests of the Fund and its shareholders.
In making the foregoing approvals, the Board considered various materials related to the investment management agreement and the sub-advisory agreements including: (1) a copy of the investment management agreement and sub-advisory agreements; (2) information describing the nature, quality and extent of services that K2 Advisors and each Sub-Advisor provided, and are expected to provide, to the Fund, and the investment management fees and sub-advisory fees payable to K2 Advisors and each Sub-Advisor; (3) reports from K2 Advisors on the continued diligence conducted on each Sub-Advisor and the reasons for recommending renewal of each of the sub-advisory
agreements, including, but not limited to, each Sub-Advisor’s background, experience, personnel, operations, policies, procedures and compliance functions; and (4) a report from the Trust’s Chief Compliance Officer regarding K2 Advisors’ and each Sub-Advisor’s compliance program and capabilities, including policies and procedures in place to address potential conflicts of interest, and the diligence undertaken by the Trust’s Chief Compliance Officer with respect thereto. The Board also noted that it received an annual report on all payments made by Franklin Templeton Investments (FTI) or the Fund to financial intermediaries engaged in the sale of Fund shares, as well as a memorandum relating to third-party servicing arrangements in response to a Guidance Update from the U.S. Securities and Exchange Commission (SEC) relating to mutual fund distribution and sub-accounting fees.
The Board also took into account information furnished throughout the year at regular Board meetings, as well as information specifically requested and furnished for the renewal process, which culminated in the meetings referred to above for the specific purpose of considering such agreements. Information furnished throughout the year included, among others, reports on the Fund’s investment performance, expenses, portfolio composition, derivatives, asset segregation, portfolio turnover, Rule 12b-1 plan, distribution, shareholder servicing, legal and compliance matters, pricing of securities, sales and redemptions, and marketing support payments made to financial intermediaries, as well as a third-party survey of transfer agent fees charged funds within the FTI complex in comparison with those charged other fund complexes deemed comparable. Also, related financial statements and other information about the scope and quality of services provided by K2 Advisors and its affiliates and enhancements to such services over the past year were provided. In addition, the trustees received periodic reports throughout the year and during the renewal process relating to compliance with the Fund’s investment policies and restrictions. During the renewal process, the independent trustees considered K2 Advisors’ methods of operation within the Franklin Templeton group and its activities on behalf of other clients.
The information obtained by the trustees during the renewal process also included a special report prepared by Broadridge Financial Solutions, Inc., an independent third-party analyst that utilizes data from Lipper, Inc. (“Lipper”), comparing the Fund’s investment performance and expenses with those of other mutual funds deemed comparable to such Fund as selected by Broadridge (Broadridge Section 15(c) Report). The trustees reviewed the Broadridge Section 15(c) Report and its usefulness in the renewal process with respect to matters such as comparative
| franklintempleton.com | Annual Report | 57 |
FRANKLIN ALTERNATIVE STRATEGIES FUNDS
FRANKLIN K2 LONG SHORT CREDIT FUND
SHAREHOLDER INFORMATION
fees, expenses, expense ratios and performance. The Board considered K2 Advisors’ views that the peer group determined by Lipper for comparison purposes may not be an entirely appropriate representation of the Fund’s peer universe. K2 Advisors explained that the universe of funds that are managed using multi-manager, multi-strategy structures, like the Fund, is still evolving, and has presented challenges in identifying an appropriate set of peers for the Fund. It was noted by K2 Advisors that the peer group compiled by Lipper includes single-manager funds which, due to their nature and relative simplicity, have lower expense ratios and are not true peers for fee comparison purposes. In addition, many of the sponsors of funds with multi-manager strategies that K2 Advisors considers to be peers were excluded from the peer group and K2 Advisors believes that the Fund’s expenses are consistent with those funds. While noting the limitations of the Broadridge Section 15(c) Report, the Board concluded that the Broadridge Section 15(c) Report was helpful in the performance of its duties.
In addition, the trustees received a Profitability Study (Profitability Study) prepared by management discussing the profitability to FTI from its overall U.S. fund operations, as well as on an individual fund-by-fund basis. Over the past year, the Board and counsel to the independent trustees continued to receive reports on management’s handling of recent regulatory inquiries and pending legal actions against K2 Advisors and its affiliates. The independent trustees were satisfied with the actions taken to date by management in response to such regulatory and legal matters. The independent trustees also received reports from the Trust’s Chief Compliance Officer on regulatory inquiries and pending legal actions against the Sub-Advisors applicable to the services provided by the Sub-Advisors to the Fund and noted that there were not any issues in this regard that should prevent the renewal of the sub-advisory agreements.
The trustees reviewed the personnel, operations, financial condition, and investment management capabilities, methodologies and resources of K2 Advisors and each Sub-Advisor, including each management team’s expertise in the management of other alternative strategies funds. As part of this review, particular attention was given to (1) the diligent risk management program of K2 Advisors and its parent, including those aspects of the program related to selecting and overseeing sub-advisors to the Fund and continual monitoring and management of cybersecurity, liquidity and counterparty credit risk, (2) each Sub-Advisor’s risk management program, and (3) derivatives and other complex instruments that are held and expected to be held by the Fund and how such instruments are used to carry out the Fund’s investment goal.
The Board also took into account, among other things, management’s efforts in establishing a global credit facility for the benefit of the Fund and other accounts managed by FTI to provide a source of cash for temporary and emergency purposes or to meet unusual redemption requests as well as the strong financial position of K2 Advisors’ parent company and its commitment to the mutual fund business. In addition, the Board received updates from management on the SEC’s progress in implementing the rule-making requirements established by the Dodd-Frank Wall Street Reform and Consumer Protection Act (Dodd-Frank Act), which was enacted July 21, 2010, and K2 Advisors’ and its affiliates’ compliance with rules and regulations already promulgated by the SEC under such act.
In addition to the above and other matters considered by the trustees throughout the course of the year, the following discussion relates to certain primary factors relevant to the Board’s decision. This discussion of the information and factors considered by the Board (including the information and factors discussed above) is not intended to be exhaustive, but rather summarizes certain factors considered by the Board. In view of the wide variety of factors considered, the Board did not, unless otherwise noted, find it practicable to quantify or otherwise assign relative weights to the foregoing factors. In addition, individual trustees may have assigned different weights to various factors.
NATURE, EXTENT AND QUALITY OF SERVICES. The trustees reviewed the nature, extent and quality of the services provided, and to be provided, by K2 Advisors and each Sub-Advisor. In this regard, they reviewed the Fund’s investment goal and K2 Advisors’ and each Sub-Advisor’s investment strategy and sub-strategy, and K2 Advisors’ and each Sub-Advisor’s ability to implement such investment strategy and/or sub-strategy, including, but not limited to, K2 Advisors’ and each Sub-Advisor’s trading practices, investment decision processes and reputation.
The Board noted that the Fund employs a “manager of managers” structure, whereby K2 Advisors is responsible for selecting sub-advisors (subject to Board approval), allocating the Fund’s assets among them, and overseeing the sub-advisors’ day-to-day management of the Fund’s assets. The Board noted the responsibilities that K2 Advisors has as the Fund’s investment manager, including (1) due diligence on the Sub-Advisors and any potential new sub-advisors to the Fund, their respective trading strategies, risk management, operations and businesses, (2) on-going oversight and monitoring of the day-to-day investment activities of Sub-Advisors and other service providers,
| 58 | Annual Report | franklintempleton.com |
FRANKLIN ALTERNATIVE STRATEGIES FUNDS
FRANKLIN K2 LONG SHORT CREDIT FUND
SHAREHOLDER INFORMATION
including their respective compliance with the investment mandate and restrictions, compliance policies and procedures and federal securities laws, and K2 Advisors’ ongoing assessment of their performance, (3) portfolio construction with respect to the allocation of assets among Sub-Advisors, investment funds, cash and other investments, (4) risk management, (5) preparing quarterly reports to the Board, and (6) the implementation of Board directives as they relate to the Fund. The Trustees also considered the successful performance of K2 Advisors in managing the Fund and other investment products with similar investment strategies to the investment strategies of the Fund that are not subject to the Investment Company Act of 1940.
With respect to the sub-advisory services provided, and to be provided, by each Sub-Advisor, the Board noted the responsibilities that each Sub-Advisor has with respect to the portion of the Fund’s assets allocated to the Sub-Advisor by K2 Advisors (Sub-Advised Portion), including, among others, implementing the investment strategies with respect to the Sub-Advised Portion and ensuring compliance with the investment strategies, policies and limitations of the Sub-Advised Portion. The trustees considered the successful performance of each Sub-Advisor in managing the Fund and other investment products with similar investment strategies to the investment strategies of its Sub-Advised Portion of the Fund, including, with respect to certain Sub-Advisors, mutual funds with similar investment strategies. The Board considered K2 Advisors’ rationale for recommending the continued retention of each Sub-Advisor.
The trustees reviewed the Fund’s portfolio management teams at K2 Advisors and each Sub-Advisor, including each such team’s performance, staffing, skills and compensation program. With respect to portfolio manager compensation, management assured the trustees that the Fund’s long-term performance is a significant component of incentive-based compensation for K2 Advisors’ portfolio management team and noted that a portion of a K2 Advisors’ portfolio manager’s incentive-based compensation is paid in shares of pre-designated funds from the portfolio manager’s fund management area. The trustees noted that the portfolio manager compensation program aligned the interests of the portfolio managers with that of Fund shareholders. During regular Board meetings and the aforementioned meetings of the independent trustees, the trustees considered periodic reports provided to them showing that K2 Advisors and the Sub-Advisors complied with the investment policies and restrictions of the Fund as well as other reports periodically furnished to the Board covering matters such as the compliance of portfolio managers and other management personnel with the code of ethics covering the investment management personnel,
the adherence to fair value pricing procedures established by the Board and the accuracy of net asset value calculations. The Board noted the extent of the benefits provided to Fund shareholders from being part of the Franklin Templeton group of funds, including the right to exchange investments between funds (same class) without a sales charge, the ability to reinvest Fund dividends into other funds and the right to combine holdings of other funds to obtain reduced sales charges.
The trustees discussed with management various other products, portfolios and entities that are advised by K2 Advisors and each Sub-Advisor and the allocation of assets and expenses among and within them, as well as their relative fees and reasons for differences with respect thereto and any potential conflicts.
The Board also considered a report from the Trust’s Chief Compliance Officer regarding K2 Advisors’ and each Sub-Advisor’s compliance programs and capabilities as such programs and capabilities relate to the operations of the Fund and the monitoring and testing of such program undertaken by the Trust’s Chief Compliance Officer. The Board considered the selection and due diligence process employed by K2 Advisors in selecting and deciding to retain each Sub-Advisor as a sub-advisor to the Fund, including the due diligence undertaken with respect to the Sub-Advisor’s compliance and risk management capabilities. The trustees considered K2 Advisors’ significant efforts in developing and implementing compliance procedures established in accordance with SEC and other requirements.
The Board also considered the nature, extent and quality of the services to be provided under the Fund’s other service agreements to determine that, on an overall basis, Fund shareholders were well served. In this connection, the Board also took into account transfer agent and shareholder services provided to Fund shareholders by an affiliate of K2 Advisors, noting continuing expenditures by management to increase and improve the scope of such services and favorable periodic reports on shareholder services conducted by independent third parties. While such considerations directly affected the trustees’ decision in renewing the Fund’s transfer agent and shareholder services agreement, the Board also considered these commitments as incidental benefits to Fund shareholders deriving from the investment management relationship.
Based on their review, the trustees were satisfied with the nature and quality of the overall services provided, and to be provided, by K2 Advisors and its affiliates and each Sub Advisor to the Fund and its shareholders and were confident in the abilities of K2 Advisors and each Sub-Advisor to implement
| franklintempleton.com | Annual Report | 59 |
FRANKLIN ALTERNATIVE STRATEGIES FUNDS
FRANKLIN K2 LONG SHORT CREDIT FUND
SHAREHOLDER INFORMATION
their respective investment strategy and/or sub-strategy and to provide quality services to the Fund and its shareholders.
INVESTMENT PERFORMANCE. As the Fund commenced operations in September 2015, the trustees reviewed the investment performance of the Fund and each Sub-Advisor for the one -year period ended December 31, 2016. As part of their review, they inquired of management regarding benchmark and hedging activities. Consideration was also given to performance in the context of available levels of cash, including as affected by net flows, during the periods. The trustees had meetings during the year, including the meetings referred to above held in connection with the renewal process, with the Fund’s portfolio managers to discuss performance and the management of the Fund and each Sub-Advisor.
In addition, attention in assessing performance was given to the Broadridge Section 15(c) Report. That report showed the investment performance of the Fund (Class A shares) in comparison to other funds determined comparable by Lipper. The comparable funds to the Fund, as chosen by Lipper, included all retail and institutional alternative credit focus funds. The Fund had total returns in the second-best performing quintile for the one-year period ended December 31, 2016. The Board was satisfied with such performance.
The trustees also compared Fund performance to other industry benchmarks, including measures of risk-adjusted performance of a fund, as part of their evaluation of investment performance. The trustees concluded that the Fund had performed well in comparison to its various benchmarks and in the context of the Fund’s investment goal.
Comparative Expenses and Profitability.
The trustees considered the cost of the services provided, and to be provided, by K2 Advisors and each Sub-Advisor and the losses realized by K2 Advisors and its affiliates from their relationships with the Fund. In considering the appropriateness of the management fee and other expenses charged to the Fund, the Board took into account various factors including investment performance and matters relating to Fund operations, including, but not limited to, the quality and experience of K2 Advisors personnel. The Board also reviewed and considered the investment management fees in light of the nature, extent and quality of the investment management services provided, and to be provided, by K2 Advisors and each Sub-Advisor, as more fully discussed above. The Board noted that the sub-advisory fees are paid by K2 Advisors to each Sub-Advisor and are not additional fees borne by the Fund. The Board also noted
that the subadvisory fees paid, and to be paid, by K2 Advisors to each Sub-Advisor were the product of arms-length negotiations between K2 Advisors and each Sub-Advisor. Furthermore, the Board took into account that information regarding Sub-Advisor profitability is not legally required to be provided and noted that, despite requests by K2 Advisors of such information, the Sub-Advisors had not provided profitability information. Accordingly, profitability information of the sub-advisors was given lesser weight than other factors. In addition, the Board considered the allocation of the investment management fee charged to the Fund between K2 Advisors and each Sub-Advisor in light of the nature, extent and quality of the investment management services provided, and to be provided, by K2 Advisors and each Sub-Advisor. As part of this discussion, the Board took into account the fee waiver and expense limitation arrangement in effect, and the amount of Fund expenses that were absorbed since inception of the Fund by K2 Advisors through such waivers and arrangements.
Consideration was also given to a comparative analysis in the Broadridge Section 15(c) Report of the investment management fee and total expense ratio of the Fund in comparison with those of a group of other funds selected by Lipper as its appropriate Lipper expense group. Lipper expense data is based upon information taken from the Fund’s most recent semi-annual report, which reflects historical asset levels that may be quite different from those currently existing, particularly in a period of market volatility.
In reviewing comparative costs, emphasis was given to the Fund’s contractual management fee in comparison with the contractual management fee that would have been charged by other funds within its Lipper expense group assuming they were similar in size to the Fund, as well as the actual total expenses of the Fund in comparison with those of its Lipper expense group. The Lipper contractual management fee analysis includes administrative charges as being part of the management fee, and total expenses, for comparative consistency, are shown by Lipper for Fund Class A shares. The Fund’s contractual management fee rate was in the most expensive quintile of its Lipper expense group (both for the basic expense group and the expense group that only included sub-advised funds) and its total expenses were in the second-most expensive quintile of the basic expense group and the middle quintile for the expense group that only included sub-advised funds. Noting the factors and limitations noted above with respect to the Broadridge Section 15(c) Report and factors relating to the Fund’s operations, such as the quality and experience of K2 Advisors and the Sub-Advisors and the nature and quality of the services
| 60 | Annual Report | franklintempleton.com |
FRANKLIN ALTERNATIVE STRATEGIES FUNDS
FRANKLIN K2 LONG SHORT CREDIT FUND
SHAREHOLDER INFORMATION
provided and to be provided by K2 Advisors and the Sub-Advisors, the Board found such comparative fees and expenses to be acceptable.
The trustees also reviewed the Profitability Study addressing profitability of Franklin Resources, Inc., from its overall U.S. fund business, as well as profitability to K2 Advisors and its affiliates, from providing investment management and other services to the Fund during the 12-month period ended September 30, 2016, the most recent fiscal year-end of Franklin Resources, Inc. The trustees reviewed the basis on which such reports are prepared and the cost allocation methodology utilized in the Profitability Study, it being recognized that allocation methodologies may each be reasonable while producing different results. In this respect, the Board noted that the reasonableness of the cost allocation methodologies was reviewed by independent accountants on an every other year basis.
The independent trustees met with management to discuss the Profitability Study. This included, among other things, a comparison of investment management income with investment management expenses of the Fund; comparison of underwriting revenues and expenses; the relative relationship of investment management and underwriting expenses; shareholder servicing profitability; economies of scale; and the relative contribution of the Fund to the profitability of K2 Advisors and its parent. In discussing the Profitability Study with the Board, K2 Advisors stated its belief that the costs incurred in establishing the infrastructure necessary to operate the type of mutual fund operations conducted by it and its affiliates may not be fully reflected in the expenses allocated to the Fund in determining its profitability.
The Board also took into account management’s expenditures in improving shareholder services provided to the Fund, as well as the need to meet additional regulatory and compliance requirements resulting from the Sarbanes-Oxley Act, the Dodd-Frank Act and recent SEC and other regulatory requirements. The trustees also considered the extent to which K2 Advisors and the Sub-Advisors may derive ancillary benefits from Fund operations, including those derived from the allocation of Fund brokerage and the use of commission dollars to pay for research and other similar services.
The Board noted that shareholders are able to redeem their Fund shares at any time if shareholders believe that Fund fees and expenses are too high or if they are dissatisfied with the performance of the Fund.
ECONOMIES OF SCALE. The Board considered economies of scale realized by K2 Advisors and its affiliates and the Sub-Advisors as the Fund grows larger and the extent to which they are shared with Fund shareholders, as for example, in the level of the investment management fees charged, in the quality and efficiency of services rendered and in increased capital commitments benefiting the Fund directly or indirectly. The Board also considered the fee waiver and expense limitation arrangement in effect, and the amount of Fund expenses that were absorbed since inception of the Fund by K2 Advisors through such waiver and arrangement. The Board concluded that economies of scale were deemed not to be a significant factor at that time in light of, among other matters, the fee waiver and expense limitation arrangement in effect and the fact that the Fund had less than two complete years of operating results.
| franklintempleton.com | Annual Report | 61 |
FRANKLIN ALTERNATIVE STRATEGIES FUNDS
FRANKLIN K2 LONG SHORT CREDIT FUND
SHAREHOLDER INFORMATION
Proxy Voting Policies and Procedures
The Fund’s investment manager has established Proxy Voting Policies and Procedures (Policies) that the Fund uses to determine how to vote proxies relating to portfolio securities. Shareholders may view the Fund’s complete Policies online at franklintempleton.com. Alternatively, shareholders may request copies of the Policies free of charge by calling the Proxy Group collect at (954) 527-7678 or by sending a written request to: Franklin Templeton Companies, LLC, 300 S.E. 2nd Street, Fort Lauderdale, FL 33301, Attention: Proxy Group. Copies of the Fund’s proxy voting records are also made available online at franklintempleton.com and posted on the U.S. Securities and Exchange Commission’s website at sec.gov and reflect the most recent 12-month period ended June 30.
Quarterly Statement of Investments
The Trust, on behalf of the Fund, files a complete statement of investments with the U.S. Securities and Exchange Commission for the first and third quarters for each fiscal year on Form N-Q. Shareholders may view the filed Form N-Q by visiting the Commission’s website at sec.gov. The filed form may also be viewed and copied at the Commission’s Public Reference Room in Washington, DC. Information regarding the operations of the Public Reference Room may be obtained by calling (800) SEC-0330.
Householding of Reports and Prospectuses
You will receive the Fund’s financial reports every six months as well as an annual updated summary prospectus (prospectus available upon request). To reduce Fund expenses, we try to identify related shareholders in a household and send only one copy of the financial reports and summary prospectus. This process, called “householding,” will continue indefinitely unless you instruct us otherwise. If you prefer not to have these documents householded, please call us at (800) 632-2301. At any time you may view current prospectuses/summary prospectuses and financial reports on our website. If you choose, you may receive these documents through electronic delivery.
| 62 | Annual Report | franklintempleton.com |

Annual Report and Shareholder Letter
Franklin K2 Long Short Credit Fund
Investment Manager
K2/D&S Management Co., L.L.C.
Distributor
Franklin Templeton Distributors, Inc.
(800) DIAL BEN® / 342-5236
franklintempleton.com
Shareholder Services
(800) 632-2301
Authorized for distribution only when accompanied or preceded by a summary prospectus and/or prospectus. Investors should carefully consider a fund’s investment goals, risks, charges and expenses before investing. A prospectus contains this and other information; please read it carefully before investing.
To help ensure we provide you with quality service, all calls to and from our service areas are monitored and/or recorded.
| © 2017 Franklin Templeton Investments. All rights reserved. | 948 A 07/17 |
 | Annual Report and Shareholder Letter May 31, 2017 |
Franklin K2 Global Macro Opportunities Fund
A SERIES OF FRANKLIN ALTERNATIVE STRATEGIES FUNDS

Sign up for electronic delivery at franklintempleton.com/edelivery
Franklin Templeton Investments
Gain From Our Perspective®
At Franklin Templeton Investments, we’re dedicated to one goal: delivering exceptional asset management for our clients. By bringing together multiple, world-class investment teams in a single firm, we’re able to offer specialized expertise across styles and asset classes, all supported by the strength and resources of one of the world’s largest asset managers. This has helped us to become a trusted partner to individual and institutional investors across the globe.
Dear Fellow Shareholder:
This first annual report for Franklin K2 Global Macro Opportunities Fund covers the period since the Fund’s inception on July 11, 2016, through May 31, 2017. Seeking capital appreciation over a full market cycle, we allocate assets among carefully selected alternative managers as we pursue opportunities across global macro-focused alternative investment strategies. Our robust manager research process seeks to provide access to a talented group of hedge fund managers and strategies. One of our strengths is our application of extensive risk processes, systems and data to seek to ensure risks can be continually measured, monitored and managed.
During the period since the Fund’s inception, the global economy expanded amid improved commodity prices, the Organization of the Petroleum Exporting Countries’ agreement to curb oil production, investor optimism about pro-growth policies in the U.S. and the victory of Emmanuel Macron as France’s president. The U.S. Federal Reserve (Fed) raised its federal funds rate in December 2016 and in March 2017 as policymakers cited ongoing economic expansion. Monetary policy around the globe also remained generally accommodative. In this environment, global developed stock markets, as measured by the MSCI World Index, posted a +16.65% total return for the period.1 Global emerging market stocks, as measured by the MSCI Emerging Markets Index, delivered a +20.74% total
return.1 Global government bonds, as measured by the Citigroup World Government Bond Index, had a -4.19% total return.1
A couple of weeks after the end of the reporting period, the Fed raised its target range a quarter point to 1.00%–1.25%. Despite low inflation, the Fed made this decision amid signs of a strengthening labor market and moderately rising economic activity.
In all economic environments, we are committed to our long-term perspective and disciplined investment approach as we conduct diligent, fundamental analysis of securities with a continual emphasis on investment risk management.
We believe active, professional investment management serves investors well. We also recognize the important role of financial advisors in today’s markets and encourage investors to continue to seek their advice. Amid changing market and economic conditions, we are confident investors with a well-diversified portfolio and a patient, long-term outlook will be well positioned for the years ahead.
In addition, Franklin K2 Global Macro Opportunities Fund’s annual report includes more detail about prevailing conditions and a discussion about investment decisions during the period. Please remember all securities markets fluctuate, as do mutual fund share prices.
1. Source: Morningstar.
See www.franklintempletondatasources.com for additional data provider information.
| Not FDIC Insured | | | May Lose Value | | | No Bank Guarantee |
| franklintempleton.com | Not part of the annual report | 1 |
We thank you for investing with Franklin Templeton, welcome your questions and comments, and look forward to continuing to serve your investment needs.
Sincerely,

William Y. Yun, CFA
President and Chief Executive Officer – Investment Management
Franklin Alternative Strategies Funds
This letter reflects our analysis and opinions as of May 31, 2017, unless otherwise indicated. The information is not a complete analysis of every aspect of any market, country, industry, security or fund. Statements of fact are from sources considered reliable.
CFA® is a trademark owned by CFA Institute.
Contents
Annual Report
Visit franklintempleton.com for fund updates, to access your account, or to find helpful financial planning tools.
| 2 | Not part of the annual report | franklintempleton.com |
Annual Report
Franklin K2 Global Macro Opportunities Fund
This annual report for Franklin K2 Global Macro Opportunities Fund covers the fiscal year since the Fund’s inception on July 11, 2016, through May 31, 2017.
Your Fund’s Goal and Main Investments
The Fund seeks capital appreciation over a full business and economic cycle, which may include periods of rising and declining interest rates. The Fund seeks to achieve its investment goal by allocating its assets across global macro-focused investment strategies, which are “non-traditional” or “alternative” strategies that generally focus on macroeconomic opportunities across numerous markets and investments. The Fund is structured as a multi-manager fund, meaning the Fund’s assets are managed by multiple subadvisors, while the Fund’s investment manager has overall responsibility for the Fund’s investments. The Fund’s principal investments include both U.S. and foreign (including emerging markets) securities and exchange traded and over-the-counter (“OTC”) derivative instruments, and may include asset classes such as equities, fixed income, interest rates, currencies or commodities. The Fund invests primarily in a wide range of derivative instruments that provide the Fund with broad exposure, either long or short, to these various asset classes. Long positions benefit from an increase in the price of the underlying instrument or asset class, while short positions benefit from a decrease in that price.
Performance Overview
The Fund’s Class A shares had a -7.64% cumulative total return for the period since the Fund’s inception through period-end. For comparison, the Fund’s primary benchmark, the BofA Merrill Lynch US 3-Month Treasury Bill Index, which is an index of short-term U.S. government securities with a remaining term to final maturity of less than three months, produced a +0.40% total return for the same period.1 Also for comparison, the Fund’s secondary benchmark, the HFRX Macro/CTA Index, which measures performance of global macro strategies with exposure to equity, fixed income, hard currency and commodity
Portfolio Composition*
5/31/17
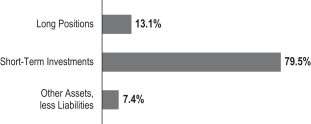
*Figures represent the net Fund exposure and include certain derivatives held in the portfolio (or their underlying reference assets) or unsettled trades and may not total 100% or may be negative due to rounding, use of any derivatives or other factors.
markets, had a -3.53% total return for the same period.2 You can find more of the Fund’s performance data in the Performance Summary beginning on page 7.
Performance data represent past performance, which does not guarantee future results. Investment return and principal value will fluctuate, and you may have a gain or loss when you sell your shares. Current performance may differ from figures shown. For most recent month-end performance, go to franklintempleton.com or call (800) 342-5236.
Economic and Market Overview
The global economy grew moderately during the period under review. In this environment, global developed and emerging market stocks rose significantly, as measured by the MSCI All Country World Index. Global markets were aided by accommodative monetary policies of various central banks, improved industrial commodity prices at certain points during the period, investor optimism about pro-growth policies in the U.S., continued hopes of tax reforms under the Trump administration, the victory of Emmanuel Macron as France’s President and encouraging corporate earnings reports. A deal by major oil producing countries in December to curb oil production also supported global equity markets.
1. Source: Morningstar.
2. Source: FactSet. Hedge Fund Research, Inc. – www.hedgefundresearch.com. The HFRX Macro/CTA Index is being used under license from Hedge Fund Research, Inc., which does not endorse or approve of any of the contents of this report.
The indexes are unmanaged and include reinvestment of any income or distributions. They do not reflect any fees, expenses or sales charges. One cannot invest directly in an index, and an index is not representative of the Fund’s portfolio. Unlike most asset class indexes, HFR Index returns reflect fees and expenses.
See www.franklintempletondatasources.com for additional data provider information.
The dollar value, number of shares or principal amount, and names of all portfolio holdings are listed in the Fund’s Consolidated Statement of Investments (SOI). The Consolidated SOI begins on page 16.
| franklintempleton.com | Annual Report | 3 |
FRANKLIN K2 GLOBAL MACRO OPPORTUNITIES FUND
However, investors expressed concerns about the timing and economic effects of the U.K.’s exit from the European Union (also known as “Brexit”) and the U.S. executive order banning entry from some Muslim-majority countries. Other headwinds included the health of European banks, concerns surrounding U.S. political turmoil, political worries in the European Union, geopolitical tensions in certain regions and worries about global oversupply in oil production despite a pact to extend cuts.
The U.S. economy expanded during the period. The economy strengthened in 2016’s third quarter, but moderated in the next two quarters, largely due to declines in private inventory investment and government spending. The manufacturing sector generally expanded, and the services sector also continued to grow. The unemployment rate decreased from 4.9% in July 2016 to 4.3% at period-end.3 Monthly retail sales were volatile, but mostly grew during the period. Annual inflation, as measured by the Consumer Price Index, generally increased during the period. At its December 2016 meeting, the U.S. Federal Reserve (Fed) raised its target range for the federal funds rate from 0.25%–0.50% to 0.50%–0.75%. The Fed, at its March 2017 meeting, made the widely anticipated increase in its federal funds target rate to 0.75%–1.00%. Following a weak batch of data releases in April, the Fed, at its May meeting, kept its interest rate unchanged.
In Europe, the U.K.’s economy grew at a faster rate in 2016’s fourth quarter over the third quarter, supported by growth in services. However, the nation’s growth rate moderated in 2017’s first quarter, largely due to slower growth in household spending. The Bank of England cut its benchmark interest rate and expanded its massive bond-buying program in August 2016 to boost the nation’s growth. The eurozone’s growth held steady in the first quarter over the previous quarter. The bloc’s annual inflation rate increased gradually to reach its highest level in four years in February, but declined in March. Although it rebounded in April, the inflation rate fell again in May due to slower growth in prices of energy and food products. The European Central Bank, at its April meeting, kept its key policy rates unchanged.
In Asia, Japan’s quarterly gross domestic product (GDP) accelerated in 2016’s fourth quarter and 2017’s first quarter. In April 2017, the Bank of Japan slightly increased its GDP forecasts for the 2018 fiscal year; however, inflation forecasts were reduced.
In emerging markets, Brazil’s quarterly GDP grew for the first time in two years, as its first-quarter 2017 GDP grew compared to the previous quarter. The country’s central bank cut its benchmark interest rate several times between November 2016 and May 2017 to spur economic growth. Russia’s GDP grew in
2016’s fourth quarter and 2017’s first quarter compared to the prior-year periods, as oil prices rebounded, exports and industrial production grew, and consumer demand showed signs of improvement. The Bank of Russia reduced its key interest rate in June and September 2016 and in March and April 2017 to try to revive its economy. China’s economic growth decelerated in 2016’s fourth quarter compared to the previous year, although growth edged up in 2017’s first quarter compared to 2016’s first quarter, largely driven by higher government spending. The People’s Bank of China left its benchmark interest rate unchanged during the period. Overall, emerging market stocks, as measured by the MSCI Emerging Markets Index, rose during the period.
Investment Strategy
We manage the Fund using a multi-manager approach. While we are responsible for the Fund’s overall investments, we allocate assets to multiple subadvisors, each of whom independently manages a separate portion of the Fund’s portfolio in accordance with discretionary and systematic focused global macro strategies. We allocate the Fund’s assets among these strategies utilizing a top-down approach, generating the Fund’s strategy weightings by taking into account market conditions, risk factors, diversification, liquidity, and availability of various subadvisors and other investment options, among other things.
Discretionary global macro strategies seek to profit by tactically investing across different asset classes, markets (including emerging markets) and investment opportunities through a combination of fundamental market analysis and quantitative modeling, whereas systematic global macro strategies seek to profit by utilizing quantitative models to identify investment opportunities across different asset classes and markets in order to construct a portfolio of investments. Quantitative trading models are proprietary systems that rely on mathematical computations to identify trading opportunities. Subadvisors may use strategies which include a combination of discretionary and systematic focused strategies.
The Fund may invest in equities and various debt instruments, such as securities of the U.S. government, its agencies and instrumentalities and sovereign, quasi-sovereign and corporate bonds. Such debt instruments may have variable or fixed interest rates, may be of any maturity, duration or credit rating and may include high yield (junk) bonds and distressed debt securities (securities of companies that are, or are about to be, involved in reorganizations, financial restructurings, or bankruptcy). The Fund will use a variety of derivatives to implement its investment strategies, which may include futures
| 4 | Annual Report | franklintempleton.com |
FRANKLIN K2 GLOBAL MACRO OPPORTUNITIES FUND
contracts, swaps, currency forward contracts, and options. The Fund may engage in active and frequent trading as part of its investment strategies.
What is a futures contract?
A futures contract is an agreement between the Fund and a counterparty made through a U.S. or foreign futures exchange to buy or sell an underlying instrument or asset at a specific price on a future date.
What are swap agreements?
Swap agreements, such as interest rate, currency and credit default swaps, are contracts between the Fund and another party (the swap counterparty). In a basic swap transaction, the Fund agrees with the swap counterparty to exchange the returns (or differentials in rates of return) earned or realized on a particular “notional amount” of underlying instruments. The notional amount is the set amount selected by the parties as the basis on which to calculate the obligations that they have agreed to exchange. The parties typically do not actually exchange the notional amount. Instead, they agree to exchange the returns that would be earned or realized if the notional amount were invested in given instruments or at given interest rates.
What is a currency forward contract?
A currency forward contract is an agreement between the Fund and a counterparty to buy or sell a foreign currency in exchange for another currency at a specific exchange rate on a future date.
What is an option?
An option is a contract to buy or sell a specific financial product known as the option’s underlying instrument at a specific price. The buyer of an option has the right, but not the obligation, to buy or sell the underlying instrument at or until a specified expiration date. Conversely, the seller (“writer”) of an option who opens a transaction is obligated to buy or sell the underlying instrument should the option holder exercise that right.
Manager’s Discussion
The Fund’s subadvisors for the period under review were P/E Global, Aspect Capital Limited, Graham Capital Management and Emso Asset Management Limited. In aggregate, the Fund had negative returns over the period, with two of the four subadvisors, Graham Capital Management and P/E Global, posting losses. Emso Asset Management and Aspect Capital posted gains.
In terms of the Fund’s aggregate asset class exposure, the top contributors to performance were credit and equity exposures, while commodity, currency and interest-rate exposures were the largest detractors.
| Subadvisors | ||||
| 5/31/17 | ||||
| Discretionary Macro | ||||
Emso Asset Management Limited | ||||
| Systematic Macro | ||||
Aspect Capital Limited | ||||
Graham Capital Management, L.P. | ||||
P/E Global LLC | ||||
Aggregate positions in emerging market sovereign and corporate credit, equity indexes, industrial metals and precious metals were among the top contributors to performance. Key detractors included aggregate positions in energy, developed markets, government credit, currencies, agriculture and livestock.
In terms of geographic exposures, Greece, Brazil, Argentina, Hungary and Hong Kong contributed to performance. In contrast, exposures to the U.S., Japan, the U.K., Germany and Australia detracted.
In February, we entered into a subadvisory agreement with P/E Global and allocated assets to it. Broadly speaking, we maintained a neutral outlook for systematic macro strategies. Although systematic managers have benefited from recent strong trends in some markets (for example, equities), many other asset classes remained choppy and subject to various challenges, presenting few sustainable trends to follow. The strength of equity trends has led to a reasonable amount of buying, while depressed volatilities have allowed most models to extend their exposures. Although we believe this is unlikely to cause any liquidity issues given the depth of the traded markets, long exposure can nevertheless result in increased sensitivity to a market correction. Most longer-dated systematic strategies should be able to adjust and benefit from a potential prolonged correction, but are less likely to do well in choppy, back-and-forth markets.
| franklintempleton.com | Annual Report | 5 |
FRANKLIN K2 GLOBAL MACRO OPPORTUNITIES FUND
Thank you for your participation in Franklin K2 Global Macro Opportunities Fund. We look forward to continuing to serve your future investment needs.
 |
Robert Christian |

 |
Brooks Ritchey | |
Anthony Zanolla, CFA
Portfolio Management Team |

The foregoing information reflects our analysis, opinions and portfolio holdings as of May 31, 2017, the end of the reporting period. The way we implement our main investment strategies and the resulting portfolio holdings may change depending on factors such as market and economic conditions. These opinions may not be relied upon as investment advice or an offer for a particular security. The information is not a complete analysis of every aspect of any market, country, industry, security or the Fund. Statements of fact are from sources considered reliable, but the investment manager makes no representation or warranty as to their completeness or accuracy. Although historical performance is no guarantee of future results, these insights may help you understand our investment management philosophy.
| 6 | Annual Report | franklintempleton.com |
FRANKLIN K2 GLOBAL MACRO OPPORTUNITIES FUND
Performance Summary as of May 31, 2017
The performance table and graphs do not reflect any taxes that a shareholder would pay on Fund dividends, capital gain distributions, if any, or any realized gains on the sale of Fund shares. Total return reflects reinvestment of the Fund’s dividends and capital gain distributions, if any, and any unrealized gains or losses. Your dividend income will vary depending on dividends or interest paid by securities in the Fund’s portfolio, adjusted for operating expenses of each class. Capital gain distributions are net profits realized from the sale of portfolio securities.
Performance as of 5/31/171
Cumulative total return excludes sales charges. Average annual total return includes maximum sales charges. Sales charges will vary depending on the size of the investment and the class of share purchased. The maximum is 5.75% and the minimum is 0%. Class A: 5.75% maximum initial sales charge; Advisor Class: no sales charges. For other share classes, visit franklintempleton.com.
| Share Class | Cumulative Total Return2 | Average Annual Total Return3 | ||||||
| A | ||||||||
Since Inception (7/11/16) | -7.64% | -12.95% | ||||||
| Advisor | ||||||||
Since Inception (7/11/16) | -7.42% | -7.42% | ||||||
Performance data represent past performance, which does not guarantee future results. Investment return and principal value will fluctuate, and you may have a gain or loss when you sell your shares. Current performance may differ from figures shown. For most recent month-end performance, go to franklintempleton.com or call (800) 342-5236.
See page 9 for Performance Summary footnotes.
| franklintempleton.com | Annual Report | 7 |
FRANKLIN K2 GLOBAL MACRO OPPORTUNITIES FUND
PERFORMANCE SUMMARY
Total Return Index Comparison for a Hypothetical $10,000 Investment1
Total return represents the change in value of an investment over the periods shown. It includes any applicable maximum sales charge, Fund expenses, account fees and reinvested distributions. The unmanaged indexes include reinvestment of any income or distributions. These differ from the Fund in composition and do not pay management fees or expenses. One cannot invest directly in an index.
Class A (7/11/16–5/31/17)
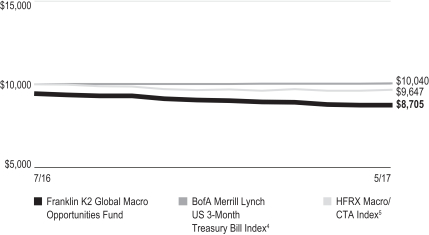
Advisor Class (7/11/16–5/31/17)
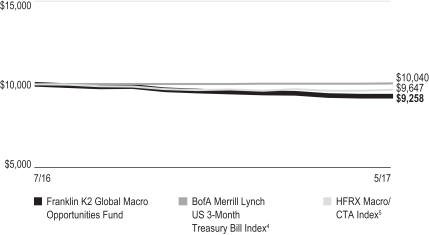
See page 9 for Performance Summary footnotes.
| 8 | Annual Report | franklintempleton.com |
FRANKLIN K2 GLOBAL MACRO OPPORTUNITIES FUND
PERFORMANCE SUMMARY
Distributions (7/11/16–5/31/17)
| Share Class | Net Investment Income | |||
A | $0.0581 | |||
C | $0.0441 | |||
R | $0.0594 | |||
R6 | $0.0601 | |||
Advisor | $0.0595 | |||
Total Annual Operating Expenses6
| Share Class | With Waiver | Without Waiver | ||||||
A | 2.25% | 4.90% | ||||||
Advisor | 2.00% | 4.65% | ||||||
Each class of shares is available to certain eligible investors and has different annual fees and expenses, as described in the prospectus.
All investments involve risks, including possible loss of principal. The Fund is actively managed and could experience losses if the investment manager’s or subadvisors’ judgment about particular investments made for the Fund prove to be incorrect. Investments in derivatives involve costs and create economic leverage, which may result in significant volatility and cause the Fund to participate in losses (as well as gains) that significantly exceed the Fund’s initial investment. The market values of securities owned by the Fund will go up or down, sometimes rapidly or unpredictably. Liquidity risk may exist when securities have become more difficult to sell, or are unable to be sold, at the price at which they have been valued. The subadvisors may not be successful in maintaining effective and operational trading models used to implement systematic strategies. An issuer of debt securities may fail to make interest payments or repay principal when due. Lower rated or high yield debt securities involve greater credit risk, including the possibility of default or bankruptcy. When interest rates rise, debt security prices tend to fall. Foreign investments are subject to greater investment risk such as political, economic, credit, information and currency fluctuation risks. Investments in emerging markets are subject to the risks of foreign investing and have additional heightened risks. Commodity and commodity-linked investments present unique risks, are speculative and can be extremely volatile. The Fund’s prospectus also includes a description of the main investment risks.
1. The Fund has an expense reduction contractually guaranteed through 9/30/17 and a fee waiver related to the management fee paid by a subsidiary. Fund investment results reflect the expense reduction and fee waiver; without these reductions, the results would have been lower.
2. Cumulative total return represents the change in value of an investment over the periods indicated.
3. Average annual total return represents the average annual change in value of an investment over the periods indicated. Return for less than one year, if any, has not been annualized.
4. Source: Morningstar. The BofA Merrill Lynch US 3-Month Treasury Bill Index is an index of short-term U.S. government securities with a remaining term to final maturity of less than three months.
5. Source: Factset. Hedge Fund Research, Inc. – www.hedgefundresearch.com. The HFRX Macro/CTA Index is being used under license from Hedge Fund Research, Inc., which does not endorse or approve of any of the contents of this report. The HFRX Macro/CTA Index measures performance of global macro strategies with exposure to equity, fixed income, hard currency and commodity markets.
6. Figures are as stated in the Fund’s current prospectus and may differ from the expense ratios disclosed in the Your Fund’s Expenses and Consolidated Financial Highlights sections in this report. In periods of market volatility, assets may decline significantly, causing total annual Fund operating expenses to become higher than the figures shown.
See www.franklintempletondatasources.com for additional data provider information.
| franklintempleton.com | Annual Report | 9 |
FRANKLIN K2 GLOBAL MACRO OPPORTUNITIES FUND
As a Fund shareholder, you can incur two types of costs: (1) transaction costs, including sales charges (loads) on Fund purchases and redemptions; and (2) ongoing Fund costs, including management fees, distribution and service (12b-1) fees, and other Fund expenses. All mutual funds have ongoing costs, sometimes referred to as operating expenses. The table below shows ongoing costs of investing in the Fund and can help you understand these costs and compare them with those of other mutual funds. The table assumes a $1,000 investment held for the six months indicated.
Actual Fund Expenses
The table below provides information about actual account values and actual expenses in the columns under the heading “Actual.” In these columns the Fund’s actual return, which includes the effect of Fund expenses, is used to calculate the “Ending Account Value” for each class of shares. You can estimate the expenses you paid during the period by following these steps (of course, your account value and expenses will differ from those in this illustration): Divide your account value by $1,000 (if your account had an $8,600 value, then $8,600 ÷ $1,000 = 8.6). Then multiply the result by the number in the row for your class of shares under the headings “Actual” and “Expenses Paid During Period” (if Actual Expenses Paid During Period were $7.50, then 8.6 × $7.50 =$64.50). In this illustration, the actual expenses paid this period are $64.50.
Hypothetical Example for Comparison with Other Funds
Under the heading “Hypothetical” in the table, information is provided about hypothetical account values and hypothetical expenses based on the Fund’s actual expense ratio and an assumed rate of return of 5% per year before expenses, which is not the Fund’s actual return. This information may not be used to estimate the actual ending account balance or expenses you paid for the period, but it can help you compare ongoing costs of investing in the Fund with those of other funds. To do so, compare this 5% hypothetical example for the class of shares you hold with the 5% hypothetical examples that appear in the shareholder reports of other funds.
Please note that expenses shown in the table are meant to highlight ongoing costs and do not reflect any transactional costs. Therefore, information under the heading “Hypothetical” is useful in comparing ongoing costs only, and will not help you compare total costs of owning different funds. In addition, if transactional costs were included, your total costs would have been higher.
| Actual (actual return after expenses) | Hypothetical (5% annual return before expenses) | |||||||||||||||||||||||
Share | Beginning Account Value 12/1/16 | Ending Account Value 5/31/17 | Expenses Paid During Period 12/1/16–5/31/171,2 | Ending Account Value 5/31/17 | Expenses Paid During Period 12/1/16–5/31/171,2 | Net Annualized Expense Ratio2 | ||||||||||||||||||
| A | $ | 1,000 | $ | 965.10 | $ | 10.63 | $ | 1,014.11 | $ | 10.90 | 2.17 | % | ||||||||||||
| C | $ | 1,000 | $ | 961.50 | $ | 14.43 | $ | 1,010.22 | $ | 14.78 | 2.95 | % | ||||||||||||
| R | $ | 1,000 | $ | 965.30 | $ | 10.19 | $ | 1,014.56 | $ | 10.45 | 2.08 | % | ||||||||||||
| R6 | $ | 1,000 | $ | 966.40 | $ | 9.02 | $ | 1,015.76 | $ | 9.25 | 1.84 | % | ||||||||||||
| Advisor | $ | 1,000 | $ | 967.40 | $ | 9.37 | $ | 1,015.41 | $ | 9.60 | 1.91 | % | ||||||||||||
1. Expenses are equal to the annualized expense ratio for the six-month period as indicated above—in the far right column—multiplied by the simple average account value over the period indicated, and then multiplied by 182/365 to reflect the one-half year period.
2. Reflects expenses after fee waivers and expense reimbursements. Does not include acquired fund fees and expenses.
| 10 | Annual Report | franklintempleton.com |
FRANKLIN ALTERNATIVE STRATEGIES FUNDS
Consolidated Financial Highlights
Franklin K2 Global Macro Opportunities Fund
| Period Ended May 31, 2017a | ||||
| Class A | ||||
Per share operating performance (for a share outstanding throughout the period) | ||||
Net asset value, beginning of period | $ | 10.00 | ||
|
| |||
| Income from investment operationsb: | ||||
Net investment income (loss)c | (0.09 | ) | ||
Net realized and unrealized gains (losses) | (0.66 | ) | ||
|
| |||
Total from investment operations | (0.75 | ) | ||
|
| |||
Less distributions from net investment income | (0.06 | ) | ||
|
| |||
Net asset value, end of period | $9.19 | |||
|
| |||
Total returnd | (7.64)% | |||
| Ratios to average net assetse | ||||
Expenses before waiver, payments by affiliates and expense reduction | 4.22% | |||
Expenses net of waiver, payments by affiliates and expense reduction | 2.16% | f | ||
Net investment income (loss) | (1.04)% | |||
| Supplemental data | ||||
Net assets, end of period (000’s) | $90 | |||
Portfolio turnover rate | 239.84% | |||
aFor the period July 11, 2016 (commencement of operations) to May 31, 2017.
bThe amount shown for a share outstanding throughout the period may not correlate with the Consolidated Statement of Operations for the period due to the timing of sales and repurchases of the Fund’s shares in relation to income earned and/or fluctuating fair value of the investments of the Fund.
cBased on average daily shares outstanding.
dTotal return does not reflect sales commissions or contingent deferred sales charges, if applicable, and is not annualized for periods less than one year.
eRatios are annualized for periods less than one year, except for non-recurring expenses, if any.
fBenefit of expense reduction rounds to less than 0.01%.
| franklintempleton.com | The accompanying notes are an integral part of these financial statements. | Annual Report | 11 |
FRANKLIN ALTERNATIVE STRATEGIES FUNDS
CONSOLIDATED FINANCIAL HIGHLIGHTS
Franklin K2 Global Macro Opportunities Fund (continued)
| Period Ended May 31, 2017a | ||||
| Class C | ||||
Per share operating performance (for a share outstanding throughout the period) | ||||
Net asset value, beginning of period | $ | 10.00 | ||
|
| |||
| Income from investment operationsb: | ||||
Net investment income (loss)c | (0.15 | ) | ||
Net realized and unrealized gains (losses) | (0.68 | ) | ||
|
| |||
Total from investment operations | (0.83 | ) | ||
|
| |||
Less distributions from net investment income | (0.04 | ) | ||
|
| |||
Net asset value, end of period | $9.13 | |||
|
| |||
Total returnd | (8.27)% | |||
| Ratios to average net assetse | ||||
Expenses before waiver, payments by affiliates and expense reduction | 4.98% | |||
Expenses net of waiver, payments by affiliates and expense reduction | 2.92% | f | ||
Net investment income (loss) | (1.80)% | |||
| Supplemental data | ||||
Net assets, end of period (000’s) | $188 | |||
Portfolio turnover rate | 239.84% | |||
aFor the period July 11, 2016 (commencement of operations) to May 31, 2017.
bThe amount shown for a share outstanding throughout the period may not correlate with the Consolidated Statement of Operations for the period due to the timing of sales and repurchases of the Fund’s shares in relation to income earned and/or fluctuating fair value of the investments of the Fund.
cBased on average daily shares outstanding.
dTotal return does not reflect sales commissions or contingent deferred sales charges, if applicable, and is not annualized for periods less than one year.
eRatios are annualized for periods less than one year, except for non-recurring expenses, if any.
fBenefit of expense reduction rounds to less than 0.01%.
| 12 | Annual Report | The accompanying notes are an integral part of these financial statements. | franklintempleton.com |
FRANKLIN ALTERNATIVE STRATEGIES FUNDS
CONSOLIDATED FINANCIAL HIGHLIGHTS
Franklin K2 Global Macro Opportunities Fund (continued)
| Period Ended May 31, 2017a | ||||
| Class R | ||||
Per share operating performance (for a share outstanding throughout the period) | ||||
Net asset value, beginning of period | $ | 10.00 | ||
|
| |||
| Income from investment operationsb: | ||||
Net investment income (loss)c | (0.08 | ) | ||
Net realized and unrealized gains (losses) | (0.68 | ) | ||
|
| |||
Total from investment operations | (0.76 | ) | ||
|
| |||
Less distributions from net investment income | (0.06 | ) | ||
|
| |||
Net asset value, end of period | $9.18 | |||
|
| |||
Total returnd | (7.63)% | |||
| Ratios to average net assetse | ||||
Expenses before waiver, payments by affiliates and expense reduction | 4.18% | |||
Expenses net of waiver, payments by affiliates and expense reduction | 2.12% | f | ||
Net investment income (loss) | (1.00)% | |||
| Supplemental data | ||||
Net assets, end of period (000’s) | $9 | |||
Portfolio turnover rate | 239.84% | |||
aFor the period July 11, 2016 (commencement of operations) to May 31, 2017.
bThe amount shown for a share outstanding throughout the period may not correlate with the Consolidated Statement of Operations for the period due to the timing of sales and repurchases of the Fund’s shares in relation to income earned and/or fluctuating fair value of the investments of the Fund.
cBased on average daily shares outstanding.
dTotal return is not annualized for periods less than one year.
eRatios are annualized for periods less than one year, except for non-recurring expenses, if any.
fBenefit of expense reduction rounds to less than 0.01%.
| franklintempleton.com | The accompanying notes are an integral part of these financial statements. | Annual Report | 13 |
FRANKLIN ALTERNATIVE STRATEGIES FUNDS
CONSOLIDATED FINANCIAL HIGHLIGHTS
Franklin K2 Global Macro Opportunities Fund (continued)
| Period Ended May 31, 2017a | ||||
| Class R6 | ||||
Per share operating performance (for a share outstanding throughout the period) | ||||
Net asset value, beginning of period | $ | 10.00 | ||
|
| |||
| Income from investment operationsb: | ||||
Net investment income (loss)c | (0.07 | ) | ||
Net realized and unrealized gains (losses) | (0.68 | ) | ||
|
| |||
Total from investment operations | (0.75 | ) | ||
|
| |||
Less distributions from net investment income | (0.06 | ) | ||
|
| |||
Net asset value, end of period | $9.19 | |||
|
| |||
Total returnd | (7.52)% | |||
| Ratios to average net assetse | ||||
Expenses before waiver, payments by affiliates and expense reduction | 4.30% | |||
Expenses net of waiver, payments by affiliates and expense reduction | 1.94% | f | ||
Net investment income (loss) | (0.82)% | |||
| Supplemental data | ||||
Net assets, end of period (000’s) | $9 | |||
Portfolio turnover rate | 239.84% | |||
aFor the period July 11, 2016 (commencement of operations) to May 31, 2017.
bThe amount shown for a share outstanding throughout the period may not correlate with the Consolidated Statement of Operations for the period due to the timing of sales and repurchases of the Fund’s shares in relation to income earned and/or fluctuating fair value of the investments of the Fund.
cBased on average daily shares outstanding.
dTotal return is not annualized for periods less than one year.
eRatios are annualized for periods less than one year, except for non-recurring expenses, if any.
fBenefit of expense reduction rounds to less than 0.01%.
| 14 | Annual Report | The accompanying notes are an integral part of these financial statements. | franklintempleton.com |
FRANKLIN ALTERNATIVE STRATEGIES FUNDS
CONSOLIDATED FINANCIAL HIGHLIGHTS
Franklin K2 Global Macro Opportunities Fund (continued)
| Period Ended May 31, 2017a | ||||
| Advisor Class | ||||
Per share operating performance (for a share outstanding throughout the period) | ||||
Net asset value, beginning of period | $ | 10.00 | ||
|
| |||
| Income from investment operationsb: | ||||
Net investment income (loss)c | (0.07 | ) | ||
Net realized and unrealized gains (losses) | (0.68 | ) | ||
|
| |||
Total from investment operations | (0.75 | ) | ||
|
| |||
Less distributions from net investment income | (0.06 | ) | ||
|
| |||
Net asset value, end of period | $9.19 | |||
|
| |||
Total returnd | (7.42)% | |||
| Ratios to average net assetse | ||||
Expenses before waiver, payments by affiliates and expense reduction | 3.99% | |||
Expenses net of waiver, payments by affiliates and expense reduction | 1.93% | f | ||
Net investment income (loss) | (0.81)% | |||
| Supplemental data | ||||
Net assets, end of period (000’s) | $22,975 | |||
Portfolio turnover rate | 239.84% | |||
aFor the period July 11, 2016 (commencement of operations) to May 31, 2017.
bThe amount shown for a share outstanding throughout the period may not correlate with the Consolidated Statement of Operations for the period due to the timing of sales and repurchases of the Fund’s shares in relation to income earned and/or fluctuating fair value of the investments of the Fund.
cBased on average daily shares outstanding.
dTotal return is not annualized for periods less than one year.
eRatios are annualized for periods less than one year, except for non-recurring expenses, if any.
fBenefit of expense reduction rounds to less than 0.01%.
| franklintempleton.com | The accompanying notes are an integral part of these financial statements. | Annual Report | 15 |
FRANKLIN ALTERNATIVE STRATEGIES FUNDS
Consolidated Statement of Investments, May 31, 2017
| Franklin K2 Global Macro Opportunities Fund | ||||||||||||||
| Country | Principal Amount* | Value | ||||||||||||
| Corporate Bonds and Notes 2.7% | ||||||||||||||
| Oil, Gas & Consumable Fuels 2.7% | ||||||||||||||
Petrobras Global Finance BV, senior note, | ||||||||||||||
5.375%, 1/27/21 | Brazil | 156,000 | $ | 160,126 | ||||||||||
8.375%, 5/23/21 | Brazil | 21,000 | 23,670 | |||||||||||
6.125%, 1/17/22 | Brazil | 59,000 | 61,390 | |||||||||||
Petroleos Mexicanos, senior note, | ||||||||||||||
6.00%, 3/05/20 | Mexico | 139,000 | 150,589 | |||||||||||
6.375%, 2/04/21 | Mexico | 126,000 | 138,209 | |||||||||||
a,bFRN, Reg S, 4.77%, 3/11/22 | Mexico | 42,000 | 45,612 | |||||||||||
aReg S, 5.375%, 3/13/22 | Mexico | 40,000 | 42,570 | |||||||||||
|
| |||||||||||||
Total Corporate Bonds and Notes (Cost $601,282) | 622,166 | |||||||||||||
|
| |||||||||||||
| Foreign Government and Agency Securities 10.4% | ||||||||||||||
Argentine Bonos del Tesoro, | ||||||||||||||
22.75%, 3/05/18 | Argentina | 2,351,852 | ARS | 147,069 | ||||||||||
21.20%, 9/19/18 | Argentina | 1,301,465 | ARS | 81,600 | ||||||||||
Government of Argentina, | ||||||||||||||
7.82%, 12/31/33 | Argentina | 220,177 | EUR | 262,488 | ||||||||||
2.26% to 3/31/19, 4.74% thereafter, 12/31/38 | Argentina | 228,585 | EUR | 166,062 | ||||||||||
aReg S, 5.00%, 1/15/27 | Argentina | 100,000 | EUR | 108,525 | ||||||||||
senior bond, 7.82%, 12/31/33 | Argentina | 16,513 | EUR | 19,867 | ||||||||||
bsenior note, FRN, 22.518%, 10/09/17 | Argentina | 3,707,312 | ARS | 229,795 | ||||||||||
asenior note, Reg S, 3.875%, 1/15/22 | Argentina | 100,000 | EUR | 113,497 | ||||||||||
senior note, 5.625%, 1/26/22 | Argentina | 56,000 | 58,492 | |||||||||||
| a | Government of Egypt, senior note, Reg S, 6.125%, 1/31/22 | Egypt | 200,000 | 205,800 | ||||||||||
| c | Government of Hellenic Republic, senior note, 144A, 4.75%, 4/17/19 | Greece | 235,000 | EUR | 259,790 | |||||||||
Government of Russia, | ||||||||||||||
7.40%, 12/07/22 | Russia | 20,592,000 | RUB | 361,611 | ||||||||||
7.75%, 9/16/26 | Russia | 2,205,000 | RUB | 39,323 | ||||||||||
| a | Government of Ukraine, Reg S, | |||||||||||||
7.75%, 9/01/19 | Ukraine | 107,000 | 109,939 | |||||||||||
7.75%, 9/01/21 | Ukraine | 100,000 | 101,394 | |||||||||||
| a | National Highways Authority of India, senior note, Reg S, 7.30%, 5/18/22 | India | 10,000,000 | INR | 155,707 | |||||||||
|
| |||||||||||||
Total Foreign Government and Agency Securities | 2,420,959 | |||||||||||||
|
| |||||||||||||
Total Investments before Short Term Investments | 3,043,125 | |||||||||||||
|
| |||||||||||||
| Shares | ||||||||||||||
| Short Term Investments 79.5% | ||||||||||||||
| Money Market Funds 75.2% | ||||||||||||||
| d,e | Dreyfus Government Cash Management, Institutional Shares, 0.72% | United States | 5,366,881 | 5,366,881 | ||||||||||
| e | Fidelity Investments Money Market Funds, 0.65% | United States | 12,142,285 | 12,142,285 | ||||||||||
|
| |||||||||||||
| Total Money Market Funds (Cost $17,509,166) | 17,509,166 | |||||||||||||
|
| |||||||||||||
| 16 | Annual Report | franklintempleton.com |
FRANKLIN ALTERNATIVE STRATEGIES FUNDS
CONSOLIDATED STATEMENT OF INVESTMENTS
Franklin K2 Global Macro Opportunities Fund (continued)
| Country | Principal Amount* | Value | ||||||||||||
| Repurchase Agreements (Cost $1,006,840) 4.3% | ||||||||||||||
| f | Joint Repurchase Agreement, 0.793%, 6/01/17 | United States | 1,006,840 | $ | 1,006,840 | |||||||||
BNP Paribas Securities Corp. (Maturity Value $438,999) | ||||||||||||||
Collateralized by U.S. Government Agency Securities, 0.83% - 2.375%, | ||||||||||||||
|
| |||||||||||||
Total Investments (Cost $21,503,175) 92.6% | 21,559,131 | |||||||||||||
Other Assets, less Liabilities 7.4% | 1,712,181 | |||||||||||||
|
| |||||||||||||
Net Assets 100.0% | $ | 23,271,312 | ||||||||||||
|
| |||||||||||||
See Abbreviations on page 37.
*The principal amount is stated in U.S. dollars unless otherwise indicated.
aSecurity was purchased pursuant to Regulation S under the Securities Act of 1933, which exempts from registration securities offered and sold outside of the United States. Such a security cannot be sold in the United States without either an effective registration statement filed pursuant to the Securities Act of 1933, or pursuant to an exemption from registration. These securities have been deemed liquid under guidelines approved by the Trust’s Board of Trustees. At May 31, 2017, the aggregate value of these securities was $883,044, representing 3.8% of net assets.
bThe coupon rate shown represents the rate at period end.
cSecurity was purchased pursuant to Rule 144A under the Securities Act of 1933 and may be sold in transactions exempt from registration only to qualified institutional buyers or in public offering registered under the Securities Act of 1933. This security has been deemed liquid under guidelines approved by the Trust’s Board of Trustees. At May 31, 2017, the value of this security was $259,790, representing 1.1% of net assets.
dA portion or all of the security is owned by K2 GMOF Holdings Corp., a wholly-owned subsidiary of the Fund. See Note 1(e).
eThe rate shown is the annualized seven-day yield at period end.
fSee Note 1(c) regarding joint repurchase agreement.
gThe security was issued on a discount basis with no stated coupon rate.
At May 31, 2017, the Fund had the following futures contracts outstanding. See Note 1(d).
| Futures Contracts | ||||||||||||||||||||||||
| Description | Type | Number of Contracts | Notional Value | Expiration Date | Unrealized Appreciation | Unrealized Depreciation | ||||||||||||||||||
| Commodity Contractsa | ||||||||||||||||||||||||
Aluminum | Long | 10 | $ | 480,062 | 6/19/17 | $ | 3,972 | $ | — | |||||||||||||||
Aluminum | Short | 10 | 480,062 | 6/19/17 | 2,747 | — | ||||||||||||||||||
Aluminum | Long | 7 | 338,013 | 9/18/17 | — | (3,363 | ) | |||||||||||||||||
Brent Crude Oil | Short | 12 | 609,120 | 6/30/17 | 34,552 | — | ||||||||||||||||||
Cocoa | Short | 3 | 61,188 | 7/14/17 | — | (1,218 | ) | |||||||||||||||||
Coffee | Short | 1 | 48,506 | 7/19/17 | 91 | — | ||||||||||||||||||
Copper | Long | 4 | 566,575 | 6/19/17 | — | (24,162 | ) | |||||||||||||||||
Copper | Short | 4 | 566,575 | 6/19/17 | 388 | — | ||||||||||||||||||
Copper | Long | 1 | 64,500 | 7/27/17 | 285 | — | ||||||||||||||||||
Copper | Long | 4 | 569,000 | 9/18/17 | 5,713 | — | ||||||||||||||||||
Corn | Short | 4 | 74,400 | 7/14/17 | — | (237 | ) | |||||||||||||||||
Gold 100 Oz | Long | 5 | 637,700 | 8/29/17 | 4,899 | — | ||||||||||||||||||
Kansas City Wheat | Short | 1 | 21,588 | 7/14/17 | 235 | — | ||||||||||||||||||
Low Sulphur Gas Oil | Short | 2 | 127,504 | 6/30/17 | — | (6,636 | ) | |||||||||||||||||
Natural Gas | Short | 3 | 92,130 | 6/28/17 | 5,593 | — | ||||||||||||||||||
Nickel | Long | 1 | 53,586 | 6/19/17 | — | (1,016 | ) | |||||||||||||||||
Nickel | Short | 1 | 53,586 | 6/19/17 | 2,097 | — | ||||||||||||||||||
Nickel | Short | 1 | 53,904 | 9/18/17 | 1,014 | — | ||||||||||||||||||
RBOB Gasoline | Short | 6 | 402,318 | 6/30/17 | — | (14,348 | ) | |||||||||||||||||
Silver | Long | 3 | 261,090 | 7/27/17 | — | (9,212 | ) | |||||||||||||||||
| franklintempleton.com | Annual Report | 17 |
FRANKLIN ALTERNATIVE STRATEGIES FUNDS
CONSOLIDATED STATEMENT OF INVESTMENTS
Franklin K2 Global Macro Opportunities Fund (continued)
| Futures Contracts (continued) | ||||||||||||||||||||||||
| Description | Type | Number of Contracts | Notional Value | Expiration Date | Unrealized Appreciation | Unrealized Depreciation | ||||||||||||||||||
| Commodity Contractsa (continued) | ||||||||||||||||||||||||
Soybean Oil | Short | 3 | $ | 56,412 | 7/14/17 | $ | 796 | $ | — | |||||||||||||||
Soybeans | Short | 11 | 423,850 | 7/14/17 | 20,349 | — | ||||||||||||||||||
Sugar | Short | 10 | 166,544 | 6/30/17 | 18,484 | — | ||||||||||||||||||
Sugar | Short | 5 | 84,728 | 9/29/17 | 714 | — | ||||||||||||||||||
Wheat | Short | 4 | 85,850 | 7/14/17 | 2,176 | — | ||||||||||||||||||
WTI Crude Oil | Short | 8 | 386,560 | 6/20/17 | — | (12,738 | ) | |||||||||||||||||
Zinc | Long | 5 | 323,750 | 6/19/17 | — | (28,796 | ) | |||||||||||||||||
Zinc | Short | 5 | 323,750 | 6/19/17 | 6,098 | — | ||||||||||||||||||
Zinc | Long | 1 | 65,094 | 9/18/17 | — | (972 | ) | |||||||||||||||||
|
|
|
| |||||||||||||||||||||
| 7,477,945 | 110,203 | (102,698 | ) | |||||||||||||||||||||
|
|
|
| |||||||||||||||||||||
| Currency Contracts | ||||||||||||||||||||||||
AUD/USD | Long | 5 | 371,600 | 6/19/17 | — | (4,782 | ) | |||||||||||||||||
CAD/USD | Short | 15 | 1,110,975 | 6/20/17 | — | (9,480 | ) | |||||||||||||||||
EUR/USD | Long | 2 | 281,400 | 6/19/17 | 1,426 | — | ||||||||||||||||||
EUR/USD | Short | 9 | 1,266,300 | 6/19/17 | — | (59,692 | ) | |||||||||||||||||
GBP/USD | Short | 2 | 161,250 | 6/19/17 | — | (995 | ) | |||||||||||||||||
JPY/USD | Short | 39 | 4,412,850 | 6/19/17 | — | (116,618 | ) | |||||||||||||||||
MXN/USD | Long | 12 | 320,760 | 6/19/17 | 8,292 | — | ||||||||||||||||||
NZD/USD | Long | 2 | 141,940 | 6/19/17 | 615 | — | ||||||||||||||||||
|
|
|
| |||||||||||||||||||||
| 8,067,075 | 10,333 | (191,567 | ) | |||||||||||||||||||||
|
|
|
| |||||||||||||||||||||
| Equity Contracts | ||||||||||||||||||||||||
Amsterdam Index | Long | 1 | 117,604 | 6/16/17 | — | (1,903 | ) | |||||||||||||||||
CAC 40 10 Euro Index | Long | 2 | 118,323 | 6/16/17 | — | (1,634 | ) | |||||||||||||||||
DJIA Mini E-CBOT Index | Long | 2 | 210,020 | 6/16/17 | 721 | — | ||||||||||||||||||
DJIA Mini E-CBOT Index | Short | 1 | 105,010 | 6/16/17 | — | (747 | ) | |||||||||||||||||
EURO STOXX 50 Index | Long | 3 | 119,738 | 6/16/17 | 7,039 | — | ||||||||||||||||||
FTSE 100 Index | Long | 3 | 290,209 | 6/16/17 | 4,006 | — | ||||||||||||||||||
FTSE/MIB Index | Long | 1 | 116,593 | 6/16/17 | 9,136 | — | ||||||||||||||||||
H-Shares Index | Long | 2 | 134,231 | 6/29/17 | 3,414 | — | ||||||||||||||||||
Hang Seng Index | Long | 6 | 980,975 | 6/29/17 | 12,110 | — | ||||||||||||||||||
Mini MSCI EAFE Index | Long | 3 | 282,885 | 6/16/17 | 13,694 | — | ||||||||||||||||||
Mini MSCI Emerging Market Index | Long | 9 | 451,710 | 6/16/17 | 23,712 | — | ||||||||||||||||||
Nasdaq 100 E-Mini Index | Long | 2 | 231,730 | 6/16/17 | 16,913 | — | ||||||||||||||||||
Nikkei 225 Index | Long | 3 | 532,551 | 6/08/17 | 11,013 | — | ||||||||||||||||||
OMX Stockholm 30 Index | Long | 13 | 245,001 | 6/16/17 | — | (1,231 | ) | |||||||||||||||||
Russell 2000 Mini Index | Long | 2 | 136,910 | 6/16/17 | 35 | — | ||||||||||||||||||
Russell 2000 Mini Index | Short | 12 | 821,460 | 6/16/17 | 3,524 | — | ||||||||||||||||||
S&P 500 E-Mini Index | Long | 1 | 120,555 | 6/16/17 | 2,400 | — | ||||||||||||||||||
S&P 500 E-Mini Index | Short | 3 | 361,665 | 6/16/17 | — | (4,391 | ) | |||||||||||||||||
S&P Midcap 400 E-Mini Index | Long | 1 | 172,000 | 6/16/17 | 1,823 | — | ||||||||||||||||||
S&P/TSX 60 Index | Long | 1 | 134,005 | 6/15/17 | — | (1,020 | ) | |||||||||||||||||
SPI 200 Index | Long | 2 | 213,256 | 6/15/17 | — | (856 | ) | |||||||||||||||||
TOPIX Index | Long | 3 | 425,282 | 6/08/17 | 4,841 | — | ||||||||||||||||||
|
|
|
| |||||||||||||||||||||
| 6,321,713 | 114,381 | (11,782 | ) | |||||||||||||||||||||
|
|
|
| |||||||||||||||||||||
| Interest Rate Contracts | ||||||||||||||||||||||||
10 Yr. Mini Japan Government Bond | Long | 1 | 136,009 | 6/12/17 | 570 | — | ||||||||||||||||||
90 Day Bank Bill | Long | 6 | 4,440,250 | 12/07/17 | 841 | — | ||||||||||||||||||
90 Day Bank Bill | Long | 5 | 3,699,572 | 6/07/18 | 1,407 | — | ||||||||||||||||||
90 Day Bank Bill | Long | 6 | 4,440,032 | 3/08/18 | 1,204 | — | ||||||||||||||||||
90 Day Bank Bill | Long | 2 | 1,480,047 | 9/07/17 | 123 | — | ||||||||||||||||||
90 Day Bank Bill | Long | 3 | 2,219,471 | 9/13/18 | 1,100 | — | ||||||||||||||||||
90 Day Eurodollar | Short | 1 | 246,687 | 9/18/17 | 948 | — | ||||||||||||||||||
90 Day Eurodollar | Short | 1 | 246,512 | 12/18/17 | — | (15 | ) | |||||||||||||||||
90 Day Eurodollar | Short | 1 | 246,338 | 3/19/18 | — | (40 | ) | |||||||||||||||||
90 Day Sterling | Long | 1 | 160,234 | 12/19/18 | 79 | — | ||||||||||||||||||
| 18 | Annual Report | franklintempleton.com |
FRANKLIN ALTERNATIVE STRATEGIES FUNDS
CONSOLIDATED STATEMENT OF INVESTMENTS
Franklin K2 Global Macro Opportunities Fund (continued)
| Futures Contracts (continued) | ||||||||||||||||||||||||
| Description | Type | Number of Contracts | Notional Value | Expiration Date | Unrealized Appreciation | Unrealized Depreciation | ||||||||||||||||||
| Interest Rate Contracts (continued) | ||||||||||||||||||||||||
90 Day Sterling | Long | 1 | $ | 159,928 | 12/18/19 | $ | 128 | $ | — | |||||||||||||||
90 Day Sterling | Long | 1 | 160,379 | 6/20/18 | 79 | — | ||||||||||||||||||
90 Day Sterling | Long | 2 | 320,178 | 6/19/19 | 233 | — | ||||||||||||||||||
90 Day Sterling | Long | 1 | 160,427 | 3/21/18 | 31 | — | ||||||||||||||||||
90 Day Sterling | Long | 3 | 480,509 | 3/20/19 | 235 | — | ||||||||||||||||||
90 Day Sterling | Long | 1 | 160,315 | 9/19/18 | — | (33 | ) | |||||||||||||||||
90 Day Sterling | Long | 1 | 160,009 | 9/18/19 | 138 | — | ||||||||||||||||||
Australian 3 Yr. Bond | Long | 16 | 1,339,209 | 6/15/17 | 3,487 | — | ||||||||||||||||||
Australian 10 Yr. Bond | Long | 3 | 293,725 | 6/15/17 | 2,680 | — | ||||||||||||||||||
Canadian 10 Yr. Bond | Long | 9 | 969,123 | 9/20/17 | 4,533 | — | ||||||||||||||||||
Euro BOBL | Long | 1 | 148,496 | 6/08/17 | 448 | — | ||||||||||||||||||
Euro BOBL | Long | 1 | 149,406 | 9/07/17 | 10 | — | ||||||||||||||||||
Euro-BTP Italian Government Bond | Long | 3 | 448,691 | 6/08/17 | 860 | — | ||||||||||||||||||
Euro-BTP Italian Government Bond | Short | 1 | 149,564 | 6/08/17 | 402 | — | ||||||||||||||||||
Euro-Bund | Long | 2 | 364,686 | 6/08/17 | 2,681 | — | ||||||||||||||||||
Euro-Buxl 30 Yr. Bond | Short | 1 | 189,061 | 6/08/17 | — | (1,594 | ) | |||||||||||||||||
Euro Schatz | Short | 7 | 882,834 | 6/08/17 | 58 | — | ||||||||||||||||||
Long Gilt | Long | 11 | 1,813,279 | 9/27/17 | 5,030 | — | ||||||||||||||||||
U.S. Treasury 2 Yr. Note | Short | 1 | 216,484 | 9/29/17 | — | (48 | ) | |||||||||||||||||
U.S. Treasury 5 Yr. Note | Long | 8 | 946,500 | 9/29/17 | 2,833 | — | ||||||||||||||||||
U.S. Treasury 10 Yr. Note | Long | 38 | 4,799,281 | 9/20/17 | 26,069 | — | ||||||||||||||||||
U.S. Treasury 10 Yr. Note | Short | 3 | 378,891 | 9/20/17 | — | (568 | ) | |||||||||||||||||
|
|
|
| |||||||||||||||||||||
| 32,006,127 | 56,207 | (2,298 | ) | |||||||||||||||||||||
|
|
|
| |||||||||||||||||||||
Total Futures Contracts |
| $ | 53,872,860 | $ | 291,124 | $ | (308,345 | ) | ||||||||||||||||
|
|
|
| |||||||||||||||||||||
Net unrealized appreciation (depreciation) |
| $ | (17,221 | ) | ||||||||||||||||||||
|
| |||||||||||||||||||||||
aA portion or all of the contracts are owned by K2 GMOF Holdings Corp., a wholly-owned subsidiary of the Fund. See Note 1(e).
At May 31, 2017, the Fund had the following forward exchange contracts outstanding. See Note 1(d).
| Forward Exchange Contracts | ||||||||||||||||||||||||||||
| Currency | Counterpartya | Type | Quantity | Contract Amount* | Settlement Date | Unrealized Appreciation | Unrealized Depreciation | |||||||||||||||||||||
| OTC Forward Exchange Contracts | ||||||||||||||||||||||||||||
Brazilian Real | JPHQ | Buy | 956,534 | 300,000 | 6/21/17 | $ | — | $ | (5,798 | ) | ||||||||||||||||||
Brazilian Real | JPHQ | Sell | 504,710 | 150,000 | 6/21/17 | — | (5,234 | ) | ||||||||||||||||||||
Chilean Peso | JPHQ | Buy | 65,526,590 | 100,000 | 6/21/17 | — | (2,819 | ) | ||||||||||||||||||||
Chilean Peso | JPHQ | Sell | 66,858,410 | 100,000 | 6/21/17 | 954 | (110 | ) | ||||||||||||||||||||
Chinese Yuan | DBAB | Buy | 1,100,028 | 161,389 | 6/21/17 | 777 | — | |||||||||||||||||||||
Chinese Yuan | DBAB | Sell | 1,100,028 | 158,437 | 6/21/17 | — | (3,729 | ) | ||||||||||||||||||||
Chinese Yuan | MSCO | Buy | 1,178,511 | 168,999 | 6/21/17 | 4,738 | — | |||||||||||||||||||||
Chinese Yuan | MSCO | Sell | 1,178,511 | 169,278 | 6/21/17 | — | (4,459 | ) | ||||||||||||||||||||
Euro | BOFA | Buy | 54,818 | 60,241 | 6/21/17 | 1,410 | — | |||||||||||||||||||||
Euro | DBAB | Buy | 217,739 | 241,993 | 6/21/17 | 2,890 | — | |||||||||||||||||||||
Euro | DBAB | Sell | 931,978 | 998,987 | 6/21/17 | — | (49,177 | ) | ||||||||||||||||||||
Euro | JPHQ | Sell | 1,200,000 | 1,310,488 | 6/21/17 | — | (39,110 | ) | ||||||||||||||||||||
Euro | MSCO | Buy | 177,811 | 195,019 | 6/21/17 | 4,959 | — | |||||||||||||||||||||
Euro | MSCO | Sell | 185,049 | 201,048 | 6/21/17 | — | (7,072 | ) | ||||||||||||||||||||
Hungarian Forint | JPHQ | Buy | 61,842,599 | 221,877 | 6/21/17 | 3,685 | — | |||||||||||||||||||||
Hungarian Forint | JPHQ | Sell | 31,320,444 | 100,000 | EUR | 6/21/17 | 4,792 | (6,564 | ) | |||||||||||||||||||
Indian Rupee | JPHQ | Buy | 32,733,952 | 500,000 | 6/21/17 | 6,082 | (134 | ) | ||||||||||||||||||||
Indian Rupee | JPHQ | Sell | 6,463,232 | 100,000 | 6/21/17 | 102 | — | |||||||||||||||||||||
Indian Rupee | MSCO | Buy | 7,872,961 | 121,967 | 6/21/17 | — | (279 | ) | ||||||||||||||||||||
Mexican Peso | BOFA | Buy | 3,202,255 | 168,560 | 6/21/17 | 2,553 | — | |||||||||||||||||||||
Mexican Peso | BOFA | Sell | 3,202,256 | 170,315 | 6/21/17 | — | (798 | ) | ||||||||||||||||||||
| franklintempleton.com | Annual Report | 19 |
FRANKLIN ALTERNATIVE STRATEGIES FUNDS
CONSOLIDATED STATEMENT OF INVESTMENTS
Franklin K2 Global Macro Opportunities Fund (continued)
| Forward Exchange Contracts (continued) | ||||||||||||||||||||||||||||
| Currency | Counterpartya | Type | Quantity | Contract Amount* | Settlement Date | Unrealized Appreciation | Unrealized Depreciation | |||||||||||||||||||||
| OTC Forward Exchange Contracts (continued) | ||||||||||||||||||||||||||||
Mexican Peso | DBAB | Buy | 1,482,759 | 78,586 | 6/21/17 | $ | 646 | $ | — | |||||||||||||||||||
Mexican Peso | MSCO | Buy | 1,536,997 | 81,829 | 6/21/17 | 300 | — | |||||||||||||||||||||
Mexican Peso | MSCO | Sell | 6,200,181 | 330,193 | 6/21/17 | 2,418 | (3,533 | ) | ||||||||||||||||||||
New Israeli Shekel | JPHQ | Buy | 2,164,709 | 600,000 | 6/21/17 | 11,837 | — | |||||||||||||||||||||
New Israeli Shekel | JPHQ | Sell | 727,344 | 200,000 | 6/21/17 | — | (5,578 | ) | ||||||||||||||||||||
Taiwan Dollar | JPHQ | Buy | 1,502,192 | 50,000 | 6/21/17 | — | (26 | ) | ||||||||||||||||||||
Taiwan Dollar | JPHQ | Sell | 1,528,000 | 50,000 | 6/21/17 | — | (833 | ) | ||||||||||||||||||||
Norwegian Krone | JPHQ | Buy | 3,222,588 | 380,184 | 6/21/17 | 1,760 | (409 | ) | ||||||||||||||||||||
Norwegian Krone | JPHQ | Sell | 8,407,146 | 900,000 | EUR | 6/21/17 | 33,149 | (16,311 | ) | |||||||||||||||||||
Philippine Peso | JPHQ | Buy | 5,014,978 | 100,000 | 6/21/17 | 673 | (9 | ) | ||||||||||||||||||||
Philippine Peso | JPHQ | Sell | 5,043,761 | 100,000 | 6/21/17 | — | (1,241 | ) | ||||||||||||||||||||
Polish Zloty | JPHQ | Buy | 1,488,737 | 378,029 | 6/21/17 | 22,091 | — | |||||||||||||||||||||
Polish Zloty | JPHQ | Sell | 421,293 | 100,000 | EUR | 6/21/17 | 1,788 | (2,551 | ) | |||||||||||||||||||
Russian Ruble | BOFA | Sell | 5,323,742 | 90,891 | 6/21/17 | — | (2,510 | ) | ||||||||||||||||||||
Russian Ruble | MSCO | Buy | 6,594,300 | 112,088 | 6/21/17 | 3,603 | — | |||||||||||||||||||||
Russian Ruble | MSCO | Sell | 16,749,488 | 288,434 | 6/21/17 | — | (5,420 | ) | ||||||||||||||||||||
Singapore Dollar | JPHQ | Sell | 140,185 | 100,000 | 6/21/17 | — | (1,340 | ) | ||||||||||||||||||||
South African Rand | JPHQ | Buy | 3,797,209 | 300,000 | 6/21/17 | — | (11,606 | ) | ||||||||||||||||||||
South African Rand | JPHQ | Sell | 1,374,477 | 100,000 | 6/21/17 | — | (4,390 | ) | ||||||||||||||||||||
South African Rand | MSCO | Sell | 1,477,169 | 106,034 | 6/21/17 | — | (6,156 | ) | ||||||||||||||||||||
South Korean Won | JPHQ | Buy | 55,509,214 | 50,000 | 6/21/17 | — | (407 | ) | ||||||||||||||||||||
South Korean Won | JPHQ | Sell | 56,653,287 | 50,000 | 6/21/17 | — | (616 | ) | ||||||||||||||||||||
Swedish Krona | JPHQ | Buy | 2,887,835 | 330,396 | 6/21/17 | 2,289 | — | |||||||||||||||||||||
Swedish Krona | JPHQ | Sell | 4,820,069 | 500,000 | EUR | 6/21/17 | 15,682 | (8,633 | ) | |||||||||||||||||||
Thailand Baht | JPHQ | Buy | 13,790,933 | 400,000 | 6/21/17 | 4,860 | — | |||||||||||||||||||||
Thailand Baht | JPHQ | Sell | 6,923,450 | 200,000 | 6/21/17 | — | (3,251 | ) | ||||||||||||||||||||
Turkish Lira | DBAB | Buy | 495,863 | 131,327 | 6/21/17 | 8,324 | — | |||||||||||||||||||||
Turkish Lira | DBAB | Sell | 495,863 | 128,722 | 6/21/17 | — | (10,928 | ) | ||||||||||||||||||||
Turkish Lira | JPHQ | Buy | 730,713 | 200,000 | 6/21/17 | 5,791 | — | |||||||||||||||||||||
Turkish Lira | JPHQ | Sell | 737,563 | 200,000 | 6/21/17 | — | (7,720 | ) | ||||||||||||||||||||
Turkish Lira | MSCO | Buy | 584,081 | 159,742 | 6/21/17 | 4,753 | — | |||||||||||||||||||||
Turkish Lira | MSCO | Sell | 154,021 | 42,226 | 6/21/17 | — | (1,151 | ) | ||||||||||||||||||||
Australian Dollar | MSCO | Buy | 1,052,000 | 792,989 | 6/23/17 | 1,151 | (12,744 | ) | ||||||||||||||||||||
Australian Dollar | MSCO | Sell | 1,813,000 | 1,356,673 | 6/23/17 | 11,489 | (1,463 | ) | ||||||||||||||||||||
British Pound | MSCO | Buy | 1,989,000 | 2,561,804 | 6/23/17 | 9,019 | (6,128 | ) | ||||||||||||||||||||
British Pound | MSCO | Sell | 1,702,000 | 2,106,450 | 6/23/17 | 994 | (89,168 | ) | ||||||||||||||||||||
Canadian Dollar | MSCO | Buy | 1,158,000 | 865,494 | 6/23/17 | 12 | (7,872 | ) | ||||||||||||||||||||
Canadian Dollar | MSCO | Sell | 1,216,000 | 897,949 | 6/23/17 | 1,963 | (4,601 | ) | ||||||||||||||||||||
Euro | MSCO | Buy | 2,482,000 | 2,725,758 | 6/23/17 | 65,972 | — | |||||||||||||||||||||
Euro | MSCO | Sell | 1,951,000 | 2,091,712 | 6/23/17 | — | (102,753 | ) | ||||||||||||||||||||
Japanese Yen | MSCO | Buy | 287,613,000 | 2,593,406 | 6/23/17 | 14,799 | (8,449 | ) | ||||||||||||||||||||
Japanese Yen | MSCO | Sell | 287,613,000 | 2,547,348 | 6/23/17 | 6,202 | (58,613 | ) | ||||||||||||||||||||
Mexican Peso | MSCO | Buy | 10,484,000 | 551,124 | 6/23/17 | 8,903 | (7 | ) | ||||||||||||||||||||
Mexican Peso | MSCO | Sell | 10,484,000 | 541,853 | 6/23/17 | 616 | (18,780 | ) | ||||||||||||||||||||
New Zealand Dollar | MSCO | Buy | 516,000 | 360,085 | 6/23/17 | 5,382 | (53 | ) | ||||||||||||||||||||
New Zealand Dollar | MSCO | Sell | 640,000 | 444,997 | 6/23/17 | — | (8,227 | ) | ||||||||||||||||||||
Swiss Franc | MSCO | Buy | 1,379,000 | 1,392,911 | 6/23/17 | 33,104 | — | |||||||||||||||||||||
Swiss Franc | MSCO | Sell | 1,379,000 | 1,368,895 | 6/23/17 | — | (57,118 | ) | ||||||||||||||||||||
Argentine Peso | BOFA | Buy | 1,891,101 | 116,735 | 7/21/17 | — | (2,163 | ) | ||||||||||||||||||||
Argentine Peso | BOFA | Sell | 1,279,122 | 79,458 | 7/21/17 | 1,964 | — | |||||||||||||||||||||
Argentine Peso | BOFA | Buy | 290,189 | 17,294 | 9/20/17 | — | (216 | ) | ||||||||||||||||||||
Euro | JPHQ | Sell | 195,124 | 5,218,795 | CZK | 11/29/17 | 17,665 | (13,967 | ) | |||||||||||||||||||
Czech Koruna | MSCO | Sell | 4,673,515 | 173,737 | EUR | 12/15/17 | 9,224 | (13,751 | ) | |||||||||||||||||||
Euro | MSCO | Sell | 206,132 | 5,506,602 | CZK | 12/15/17 | 14,721 | (11,007 | ) | |||||||||||||||||||
Czech Koruna | MSCO | Sell | 2,031,397 | 76,860 | EUR | 1/10/18 | 4,376 | (4,872 | ) | |||||||||||||||||||
Euro | MSCO | Sell | 76,449 | 2,031,397 | CZK | 1/10/18 | 3,133 | (2,170 | ) | |||||||||||||||||||
Euro | MSCO | Sell | 411 | 455 | 1/10/18 | — | (12 | ) | ||||||||||||||||||||
|
| |||||||||||||||||||||||||||
Total Forward Exchange Contracts |
| $ | 363,595 | $ | (644,036 | ) | ||||||||||||||||||||||
|
| |||||||||||||||||||||||||||
Net unrealized appreciation (depreciation) |
| $ | (280,441 | ) | ||||||||||||||||||||||||
|
| |||||||||||||||||||||||||||
*In U.S. dollars unless otherwise indicated.
aMay be comprised of multiple contracts with the same counterparty, currency and settlement date.
| 20 | Annual Report | franklintempleton.com |
FRANKLIN ALTERNATIVE STRATEGIES FUNDS
CONSOLIDATED STATEMENT OF INVESTMENTS
Franklin K2 Global Macro Opportunities Fund (continued)
At May 31, 2017, the Fund had the following credit default swap contracts outstanding. See Note 1(d).
Credit Default Swap Contracts
| Description | Periodic Payment Rate | Counterparty/ Exchange | Notional Amounta | Expiration Date | Unamortized Upfront Payments (Receipts) | Unrealized Appreciation | Unrealized Depreciation | Value | Ratingb | |||||||||||||||||||||||||||
| Centrally Cleared Swap Contracts | ||||||||||||||||||||||||||||||||||||
| Contracts to Buy Protection | ||||||||||||||||||||||||||||||||||||
| Single Name | ||||||||||||||||||||||||||||||||||||
Government of Turkey | 1.00 | % | ICE | $ | 405,000 | 6/20/21 | $ | 24,334 | $ | — | $ | (15,428 | ) | $ | 8,906 | |||||||||||||||||||||
Government of Mexico | 1.00 | % | ICE | 191,000 | 12/20/21 | 5,408 | — | (4,912 | ) | 496 | ||||||||||||||||||||||||||
Government of South Africa | 1.00 | % | ICE | 275,000 | 12/20/21 | 18,824 | — | (10,251 | ) | 8,573 | ||||||||||||||||||||||||||
Government of South Korea | 1.00 | % | ICE | 207,885 | 12/20/21 | (5,982 | ) | 1,550 | — | (4,432 | ) | |||||||||||||||||||||||||
Government of Turkey | 1.00 | % | ICE | 43,000 | 12/20/21 | 2,630 | — | (1,168 | ) | 1,462 | ||||||||||||||||||||||||||
Government of South Africa | 1.00 | % | ICE | 168,000 | 6/20/22 | 8,826 | — | (1,832 | ) | 6,994 | ||||||||||||||||||||||||||
| Contracts to Sell Protectionc | ||||||||||||||||||||||||||||||||||||
| Single Name | ||||||||||||||||||||||||||||||||||||
Government of Russia | 1.00 | % | ICE | 393,000 | 12/20/21 | (14,594 | ) | 8,391 | — | (6,203 | ) | BB+ | ||||||||||||||||||||||||
|
|
|
| |||||||||||||||||||||||||||||||||
Total Credit Default Swap Contracts |
| $ | 1,682,885 | $ | 39,446 | $ | 9,941 | $ | (33,591 | ) | $ | 15,796 | ||||||||||||||||||||||||
|
|
|
| |||||||||||||||||||||||||||||||||
Net unrealized appreciation (depreciation) |
| $ | (23,650 | ) | ||||||||||||||||||||||||||||||||
|
| |||||||||||||||||||||||||||||||||||
aFor contracts to sell protection, the notional amount is equal to the maximum potential amount of the future payments and no recourse provisions have been entered into in association with the contracts.
bBased on Standard and Poor’s (S&P) Rating for single name swaps.
cThe Fund enters contracts to sell protection to create a long credit position. Performance triggers include default, bankruptcy or restructuring for single name swaps.
See Notes 1(d) and 7 regarding derivative financial instruments and other derivative information, respectively.
At May 31, 2017, the Fund had the following interest rate swap contracts outstanding. See Note 1(d).
| Interest Rate Swap Contracts | ||||||||||||||||||||
| Description | Counterparty/ Exchange | Notional Amount | Expiration Date | Unrealized Appreciation | Unrealized Depreciation | |||||||||||||||
| Centrally Cleared Swaps | ||||||||||||||||||||
Receive Floating rate 6 Month GBP-LIBOR | LCH | 78,445 | GBP | 11/29/46 | $ | — | $ | (3,928 | ) | |||||||||||
Receive Floating rate 6 Month GBP-LIBOR | LCH | 38,267 | GBP | 12/03/46 | — | (2,392 | ) | |||||||||||||
Receive Floating rate 6 Month GBP-LIBOR | LCH | 71,000 | GBP | 2/28/67 | — | (833 | ) | |||||||||||||
Receive Floating rate 6 Month GBP-LIBOR | LCH | 85,166 | GBP | 1/07/47 | — | (1,207 | ) | |||||||||||||
Receive Fixed rate 7.43% | LCH | 2,073,775 | ZAR | 6/21/22 | 294 | — | ||||||||||||||
|
| |||||||||||||||||||
Total Interest Rate Swap Contracts |
| $ | 294 | $ | (8,360 | ) | ||||||||||||||
|
| |||||||||||||||||||
Net unrealized appreciation (depreciation) |
| $ | (8,066 | ) | ||||||||||||||||
|
| |||||||||||||||||||
See Abbreviations on page 37.
| franklintempleton.com | The accompanying notes are an integral part of these financial statements. | Annual Report | 21 |
FRANKLIN ALTERNATIVE STRATEGIES FUNDS
Consolidated Financial Statements
Consolidated Statement of Assets and Liabilities
May 31, 2017
Franklin K2 Global Macro Opportunities Fund
Assets: | ||||
Investments in securities: | ||||
Cost - Unaffiliated issuers | $ | 20,496,335 | ||
Cost - Repurchase agreements | 1,006,840 | |||
|
| |||
Total cost of investments | $ | 21,503,175 | ||
|
| |||
Value - Unaffiliated issuers | $ | 20,552,291 | ||
Value - Repurchase agreements | 1,006,840 | |||
|
| |||
Total value of investments | 21,559,131 | |||
Foreign currency, at value (cost $607) | 340 | |||
Receivables: | ||||
Investment securities sold | 4,415 | |||
Capital shares sold | 20,000 | |||
Interest | 68,729 | |||
Affiliates | 128,681 | |||
Due from brokers | 1,819,271 | |||
Variation margin | 41,821 | |||
Offering costs | 38,861 | |||
Unrealized appreciation on OTC forward exchange contracts | 363,595 | |||
Other assets | 17 | |||
|
| |||
Total assets | 24,044,861 | |||
|
| |||
Liabilities: | ||||
Payables: | ||||
Investment securities purchased | 6,039 | |||
Distribution fees | 169 | |||
Transfer agent fees | 60 | |||
Professional fees | 50,101 | |||
Due to brokers | 23,615 | |||
Unrealized depreciation on OTC forward exchange contracts | 644,036 | |||
Accrued expenses and other liabilities | 49,529 | |||
|
| |||
Total liabilities | 773,549 | |||
|
| |||
Net assets, at value | $ | 23,271,312 | ||
|
| |||
Net assets consist of: | ||||
Paid-in capital | $ | 24,123,399 | ||
Undistributed net investment income | 156,975 | |||
Net unrealized appreciation (depreciation) | (273,050 | ) | ||
Accumulated net realized gain (loss) | (736,012 | ) | ||
|
| |||
Net assets, at value | $ | 23,271,312 | ||
|
|
| 22 | Annual Report | The accompanying notes are an integral part of these financial statements. | franklintempleton.com |
FRANKLIN ALTERNATIVE STRATEGIES FUNDS
CONSOLIDATED FINANCIAL STATEMENTS
Consolidated Statement of Assets and Liabilities (continued)
May 31, 2017
Franklin K2 Global Macro Opportunities Fund
| Class A: | ||||
Net assets, at value | $ | 89,617 | ||
|
| |||
Shares outstanding | 9,752 | |||
|
| |||
Net asset value per sharea | $9.19 | |||
|
| |||
Maximum offering price per share (net asset value per share ÷ 94.25%) | $9.75 | |||
|
| |||
| Class C: | ||||
Net assets, at value | $ | 188,361 | ||
|
| |||
Shares outstanding | 20,635 | |||
|
| |||
Net asset value and maximum offering price per sharea | $9.13 | |||
|
| |||
| Class R: | ||||
Net assets, at value | $ | 9,180 | ||
|
| |||
Shares outstanding | 1,000 | |||
|
| |||
Net asset value and maximum offering price per share | $9.18 | |||
|
| |||
| Class R6: | ||||
Net assets, at value | $ | 9,192 | ||
|
| |||
Shares outstanding | 1,000 | |||
|
| |||
Net asset value and maximum offering price per share | $9.19 | |||
|
| |||
| Advisor Class: | ||||
Net assets, at value | $ | 22,974,962 | ||
|
| |||
Shares outstanding | 2,499,019 | |||
|
| |||
Net asset value and maximum offering price per share | $9.19 | |||
|
| |||
aRedemption price is equal to net asset value less contingent deferred sales charges, if applicable.
| franklintempleton.com | The accompanying notes are an integral part of these financial statements. | Annual Report | 23 |
FRANKLIN ALTERNATIVE STRATEGIES FUNDS
CONSOLIDATED FINANCIAL STATEMENTS
Consolidated Statement of Operations
for the period ended May 31, 2017a
Franklin K2 Global Macro Opportunities Fund
Investment income: | ||||
Dividends | $ | 45,347 | ||
Interest | 193,557 | |||
|
| |||
Total investment income | 238,904 | |||
|
| |||
Expenses: | ||||
Management fees (Note 3a) | 437,618 | |||
Distribution fees: (Note 3c) | ||||
Class A | 60 | |||
Class C | 1,215 | |||
Class R | 16 | |||
Transfer agent fees: (Note 3e) | ||||
Class A | 1 | |||
Class C | 2 | |||
Class R6 | 26 | |||
Advisor Class | 399 | |||
Custodian fees (Note 4) | 40,001 | |||
Reports to shareholders | 11,085 | |||
Registration and filing fees | 9,591 | |||
Professional fees | 75,830 | |||
Trustees’ fees and expenses | 5 | |||
Amortization of offering costs | 307,097 | |||
Other | 5,539 | |||
|
| |||
Total expenses | 888,485 | |||
|
| |||
Expense reductions (Note 4) | (44 | ) | ||
Expenses waived/paid by affiliates (Note 3f) | (474,469 | ) | ||
|
| |||
Net expenses | 413,972 | |||
|
| |||
Net investment income (loss) | (175,068 | ) | ||
|
| |||
Realized and unrealized gains (losses): | ||||
Net realized gain (loss) from: | ||||
Investments | 148,964 | |||
Foreign currency transactions | 117,322 | |||
Futures contracts | (1,694,905 | ) | ||
Swap contracts | (4,424 | ) | ||
|
| |||
Net realized gain (loss) | (1,433,043 | ) | ||
|
| |||
Net change in unrealized appreciation (depreciation) on: | ||||
Investments | 55,956 | |||
Translation of other assets and liabilities denominated in foreign currencies | (280,069 | ) | ||
Futures contracts | (17,221 | ) | ||
Swap contracts | (31,716 | ) | ||
|
| |||
Net change in unrealized appreciation (depreciation) | (273,050 | ) | ||
|
| |||
Net realized and unrealized gain (loss) | (1,706,093 | ) | ||
|
| |||
Net increase (decrease) in net assets resulting from operations | $ | (1,881,161 | ) | |
|
|
aFor the period July 11, 2016 (commencement of operations) to May 31, 2017.
| 24 | Annual Report | The accompanying notes are an integral part of these financial statements. | franklintempleton.com |
FRANKLIN ALTERNATIVE STRATEGIES FUNDS
CONSOLIDATED FINANCIAL STATEMENTS
Consolidated Statement of Changes in Net Assets
Franklin K2 Global Macro Opportunities Fund
| Period Ended May 31, 2017a | ||||
Increase (decrease) in net assets: | ||||
Operations: | ||||
Net investment income (loss) | $ | (175,068 | ) | |
Net realized gain (loss) | (1,433,043 | ) | ||
Net change in unrealized appreciation (depreciation) | (273,050 | ) | ||
|
| |||
Net increase (decrease) in net assets resulting from operations | (1,881,161 | ) | ||
|
| |||
Distributions to shareholders from: | ||||
Net investment income: | ||||
Class A | (183 | ) | ||
Class C | (661 | ) | ||
Class R | (60 | ) | ||
Class R6 | (60 | ) | ||
Advisor Class | (148,675 | ) | ||
|
| |||
Total distributions to shareholders | (149,639 | ) | ||
|
| |||
Capital share transactions: (Note 2) | ||||
Class A | 91,676 | |||
Class C | 200,616 | |||
Class R | 10,000 | |||
Class R6 | 10,000 | |||
Advisor Class | 24,989,820 | |||
|
| |||
Total capital share transactions | 25,302,112 | |||
|
| |||
Net increase (decrease) in net assets | 23,271,312 | |||
Net assets: | ||||
End of period | $ | 23,271,312 | ||
|
| |||
Undistributed net investment income included in net assets: | ||||
End of period | $ | 156,975 | ||
|
| |||
aFor the period July 11, 2016 (commencement of operations) to May 31, 2017.
| franklintempleton.com | The accompanying notes are an integral part of these financial statements. | Annual Report | 25 |
FRANKLIN ALTERNATIVE STRATEGIES FUNDS
Notes to Consolidated Financial Statements
Franklin K2 Global Macro Opportunities Fund
1. Organization and Significant Accounting Policies
Franklin Alternative Strategies Funds (Trust) is registered under the Investment Company Act of 1940 (1940 Act) as an open-end management investment company, consisting of four separate funds and applies the specialized accounting and reporting guidance in U.S. Generally Accepted Accounting Principles (U.S. GAAP). Franklin K2 Global Macro Opportunities Fund (Fund) is included in this report. The Fund commenced operations on July 11, 2016, with five classes of shares: Class A, Class C, Class R, Class R6 and Advisor Class. Effective August 1, 2016, the Fund began publicly offering its shares. Each class of shares may differ by its initial sales load, contingent deferred sales charges, voting rights on matters affecting a single class, its exchange privilege and fees primarily due to differing arrangements for distribution and transfer agent fees.
The following summarizes the Fund’s significant accounting policies.
a. Financial Instrument Valuation
The Fund’s investments in financial instruments are carried at fair value daily. Fair value is the price that would be received to sell an asset or paid to transfer a liability in an orderly transaction between market participants on the measurement date. The Fund calculates the net asset value (NAV) per share as of 4 p.m. Eastern time each day the New York Stock Exchange (NYSE) is open for trading. Under compliance policies and procedures approved by the Trust’s Board of Trustees (the Board), the Fund’s administrator has responsibility for oversight of valuation, including leading the cross-functional Valuation Committee (VC). The VC provides administration and oversight of the Fund’s valuation policies and procedures, which are approved annually by the Board. Among other things, these procedures allow the Fund to utilize independent pricing services, quotations from securities and financial instrument dealers, and other market sources to determine fair value.
Debt securities generally trade in the over-the-counter (OTC) market rather than on a securities exchange. The Fund’s pricing services use multiple valuation techniques to determine fair value. In instances where sufficient market activity exists, the pricing services may utilize a market-based approach through which quotes from market makers are used to determine fair value. In instances where sufficient market activity may not exist or is limited, the pricing services also utilize proprietary
valuation models which may consider market characteristics such as benchmark yield curves, credit spreads, estimated default rates, anticipated market interest rate volatility, coupon rates, anticipated timing of principal repayments, underlying collateral, and other unique security features in order to estimate the relevant cash flows, which are then discounted to calculate the fair value. Securities denominated in a foreign currency are converted into their U.S. dollar equivalent at the foreign exchange rate in effect at 4 p.m. Eastern time on the date that the values of the foreign debt securities are determined.
Investments in open-end mutual funds are valued at the closing NAV. Investments in repurchase agreements are valued at cost, which approximates fair value.
Derivative financial instruments (derivatives) listed on an exchange are valued at the official closing price of the day. Certain derivatives are centrally cleared or trade in the OTC market. The Fund’s pricing services use various techniques including industry standard option pricing models and proprietary discounted cash flow models to determine the fair value of those instruments. The Fund’s net benefit or obligation under the derivative contract, as measured by the fair value of the contract, is included in net assets.
The Fund has procedures to determine the fair value of financial instruments for which market prices are not reliable or readily available. Under these procedures, the VC convenes on a regular basis to review such financial instruments and considers a number of factors, including significant unobservable valuation inputs, when arriving at fair value. The VC primarily employs a market-based approach which may use related or comparable assets or liabilities, recent transactions, market multiples, book values, and other relevant information for the investment to determine the fair value of the investment. An income-based valuation approach may also be used in which the anticipated future cash flows of the investment are discounted to calculate fair value. Discounts may also be applied due to the nature or duration of any restrictions on the disposition of the investments. Due to the inherent uncertainty of valuations of such investments, the fair values may differ significantly from the values that would have been used had an active market existed. The VC employs various methods for calibrating these valuation approaches including a regular review of key inputs and assumptions, transactional back-testing or disposition analysis, and reviews of any related market activity.
| 26 | Annual Report | franklintempleton.com |
FRANKLIN ALTERNATIVE STRATEGIES FUNDS
NOTES TO CONSOLIDATED FINANCIAL STATEMENTS
Franklin K2 Global Macro Opportunities Fund (continued)
b. Foreign Currency Translation
Portfolio securities and other assets and liabilities denominated in foreign currencies are translated into U.S. dollars based on the exchange rate of such currencies against U.S. dollars on the date of valuation. The Fund may enter into foreign currency exchange contracts to facilitate transactions denominated in a foreign currency. Purchases and sales of securities, income and expense items denominated in foreign currencies are translated into U.S. dollars at the exchange rate in effect on the transaction date. Portfolio securities and assets and liabilities denominated in foreign currencies contain risks that those currencies will decline in value relative to the U.S. dollar. Occasionally, events may impact the availability or reliability of foreign exchange rates used to convert the U.S. dollar equivalent value. If such an event occurs, the foreign exchange rate will be valued at fair value using procedures established and approved by the Board.
The Fund does not separately report the effect of changes in foreign exchange rates from changes in market prices on securities held. Such changes are included in net realized and unrealized gain or loss from investments in the Consolidated Statement of Operations.
Realized foreign exchange gains or losses arise from sales of foreign currencies, currency gains or losses realized between the trade and settlement dates on securities transactions and the difference between the recorded amounts of dividends, interest, and foreign withholding taxes and the U.S. dollar equivalent of the amounts actually received or paid. Net unrealized foreign exchange gains and losses arise from changes in foreign exchange rates on foreign denominated assets and liabilities other than investments in securities held at the end of the reporting period.
c. Joint Repurchase Agreement
The Fund enters into a joint repurchase agreement whereby its uninvested cash balance is deposited into a joint cash account with other funds managed by the investment manager or an affiliate of the investment manager and is used to invest in one or more repurchase agreements. The value and face amount of the joint repurchase agreement are allocated to the funds based on their pro-rata interest. A repurchase agreement is accounted for as a loan by the Fund to the seller, collateralized by securities which are delivered to the Fund’s custodian. The fair value, including accrued interest, of the initial collateralization is required to be at least 102% of the dollar amount invested by the funds, with the value of the underlying securities marked to
market daily to maintain coverage of at least 100%. Repurchase agreements are subject to the terms of Master Repurchase Agreements (MRAs) with approved counterparties (sellers). The MRAs contain various provisions, including but not limited to events of default and maintenance of collateral for repurchase agreements. In the event of default by either the seller or the Fund, certain MRAs may permit the non-defaulting party to net and close-out all transactions, if any, traded under such agreements. The Fund may sell securities it holds as collateral and apply the proceeds towards the repurchase price and any other amounts owed by the seller to the Fund in the event of default by the seller. This could involve costs or delays in addition to a loss on the securities if their value falls below the repurchase price owed by the seller. The joint repurchase agreement held by the Fund at period end, as indicated in the Consolidated Statement of Investments, had been entered into on May 31, 2017.
d. Derivative Financial Instruments
The Fund invested in derivatives in order to manage risk or gain exposure to various other investments or markets. Derivatives are financial contracts based on an underlying or notional amount, require no initial investment or an initial net investment that is smaller than would normally be required to have a similar response to changes in market factors, and require or permit net settlement. Derivatives contain various risks including the potential inability of the counterparty to fulfill their obligations under the terms of the contract, the potential for an illiquid secondary market, and/or the potential for market movements which expose the Fund to gains or losses in excess of the amounts shown in the Consolidated Statement of Assets and Liabilities. Realized gain and loss and unrealized appreciation and depreciation on these contracts for the period are included in the Consolidated Statement of Operations.
Derivative counterparty credit risk is managed through a formal evaluation of the creditworthiness of all potential counterparties. The Fund attempts to reduce its exposure to counterparty credit risk on OTC derivatives, whenever possible, by entering into International Swaps and Derivatives Association (ISDA) master agreements with certain counterparties. These agreements contain various provisions, including but not limited to collateral requirements, events of default, or early termination. Termination events applicable to the counterparty include certain deteriorations in the credit quality of the counterparty. Termination events applicable to the Fund include failure of the Fund to maintain certain net asset levels and/or limit the decline
| franklintempleton.com | Annual Report | 27 |
FRANKLIN ALTERNATIVE STRATEGIES FUNDS
NOTES TO CONSOLIDATED FINANCIAL STATEMENTS
Franklin K2 Global Macro Opportunities Fund (continued)
1. Organization and Significant Accounting Policies (continued)
d. Derivative Financial Instruments (continued)
or early termination, the ISDA master agreement gives the non-defaulting party the right to net and close-out all transactions traded, whether or not arising under the ISDA agreement, to one net amount payable by one counterparty to the other. However, absent an event of default or early termination, OTC derivative assets and liabilities are presented gross and not offset in the Consolidated Statement of Assets and Liabilities. Early termination by the counterparty may result in an immediate payment by the Fund of any net liability owed to that counterparty under the ISDA agreement.
Collateral requirements differ by type of derivative. Collateral or initial margin requirements are set by the broker or exchange clearing house for exchange traded and centrally cleared derivatives. Initial margin deposited is held at the exchange and can be in the form of cash and/or securities. For OTC derivatives traded under an ISDA master agreement, posting of collateral is required by either the Fund or the applicable counterparty if the total net exposure of all OTC derivatives with the applicable counterparty exceeds the minimum transfer amount, which typically ranges from $100,000 to $250,000, and can vary depending on the counterparty and the type of the agreement. Generally, collateral is determined at the close of Fund business each day and any additional collateral required due to changes in derivative values may be delivered by the Fund or the counterparty the next business day, or within a few business days. Collateral pledged and/or received by the Fund for OTC derivatives, if any, is held in segregated accounts with the Fund’s custodian/counterparty broker and can be in the form of cash and/or securities. Unrestricted cash may be invested according to the Fund’s investment objectives. To the extent that the amounts due to the Fund from its counterparties are not subject to collateralization or are not fully collateralized, the Fund bears the risk of loss from counterparty non-performance.
The Fund entered into exchange traded futures contracts primarily to manage and/or gain exposure to commodity price, interest rate, certain foreign currencies and equity price risk. A futures contract is an agreement between the Fund and a counterparty to buy or sell an asset at a specified price on a future date. Required initial margins are pledged by the Fund, and the daily change in fair value is accounted for as a variation margin payable or receivable in the Consolidated Statement of Assets and Liabilities.
The Fund entered into OTC forward exchange contracts primarily to manage and/or gain exposure to certain foreign currencies. A forward exchange contract is an agreement between the Fund and a counterparty to buy or sell a foreign currency at a specific exchange rate on a future date.
The Fund entered into credit default swap contracts primarily to manage and/or gain exposure to credit risk. A credit default swap is an agreement between the Fund and a counterparty whereby the buyer of the contract receives credit protection and the seller of the contract guarantees the credit worthiness of a referenced debt obligation. These agreements may be privately negotiated in the over-the-counter market (OTC credit default swaps) or may be executed in a multilateral trade facility platform, such as a registered exchange (centrally cleared credit default swaps). The underlying referenced debt obligation may be a single issuer of corporate or sovereign debt, a credit index, a basket of issuers or indices, or a tranche of a credit index or basket of issuers or indices. In the event of a default of the underlying referenced debt obligation, the buyer is entitled to receive the notional amount of the credit default swap contract from the seller in exchange for the referenced debt obligation, a net settlement amount equal to the notional amount of the credit default swap less the recovery value of the referenced debt obligation, or other agreed upon amount. For centrally cleared credit default swaps, required initial margins are pledged by the Fund, and the daily change in fair value is accounted for as a variation margin payable or receivable in the Consolidated Statement of Assets and Liabilities. Over the term of the contract, the buyer pays the seller a periodic stream of payments, provided that no event of default has occurred. Such periodic payments are accrued daily as an unrealized appreciation or depreciation until the payments are made, at which time they are realized. Upfront payments and receipts are reflected in the Consolidated Statement of Assets and Liabilities and represent compensating factors between stated terms of the credit default swap agreement and prevailing market conditions (credit spreads and other relevant factors). These upfront payments and receipts are amortized over the term of the contract as a realized gain or loss in the Consolidated Statement of Operations.
The Fund entered into interest rate swap contracts primarily to manage interest rate risk. An interest rate swap is an agreement between the Fund and a counterparty to exchange cash flows based on the difference between two interest rates, applied to a notional amount. These agreements may be privately negotiated in the over-the-counter market (OTC interest rate swaps) or may be executed on a registered exchange (centrally cleared
| 28 | Annual Report | franklintempleton.com |
FRANKLIN ALTERNATIVE STRATEGIES FUNDS
NOTES TO CONSOLIDATED FINANCIAL STATEMENTS
Franklin K2 Global Macro Opportunities Fund (continued)
in net assets over various periods of time. In the event of default interest rate swaps). For centrally cleared interest rate swaps, required initial margins are pledged by the Fund, and the daily change in fair value is accounted for as a variation margin payable or receivable in the Consolidated Statement of Assets and Liabilities. Over the term of the contract, contractually required payments to be paid and to be received are accrued daily and recorded as unrealized depreciation and appreciation until the payments are made, at which time they are realized.
The Fund purchased or wrote exchange traded option contracts primarily to manage and/or gain exposure to equity price risk. An option is a contract entitling the holder to purchase or sell a specific amount of shares or units of an asset or notional amount of a swap (swaption), at a specified price. When an option is purchased or written, an amount equal to the premium paid or received is recorded as an asset or liability, respectively. Upon exercise of an option, the acquisition cost or sales proceeds of the underlying investment is adjusted by any premium received or paid. Upon expiration of an option, any premium received or paid is recorded as a realized gain or loss. Upon closing an option other than through expiration or exercise, the difference between the premium received or paid and the cost to close the position is recorded as a realized gain or loss.
See Note 7 regarding other derivative information.
e. Investments in K2 GMOF Holdings Corp. (K2 Subsidiary)
The Fund invests in certain financial instruments and commodity-linked derivative investments through its investment in the K2 Subsidiary. The K2 Subsidiary is a Cayman Islands exempted company with limited liability, is a wholly owned subsidiary of the Fund, and is able to invest in certain financial instruments and commodity-linked derivative investments consistent with the investment objective of the Fund. At May 31, 2017, the K2 Subsidiary’s investments, as well as any other assets and liabilities of the K2 Subsidiary, are reflected in the Fund’s Consolidated Statement of Investments and Consolidated Statement of Assets and Liabilities. The financial statements have been consolidated and include the accounts of the Fund and the K2 Subsidiary. All inter-company transactions and balances have been eliminated. For tax purposes, the Fund is required to increase its taxable income by its share of the K2 Subsidiary’s income. Net losses incurred by the K2 Subsidiary cannot offset income earned by the Fund and cannot be carried back or forward by the K2 Subsidiary to offset income from prior or future years. At May 31, 2017, the net assets of the K2 Subsidiary were
$5,710,702, representing 24.5% of the Fund’s consolidated net assets. The Fund’s investment in the K2 Subsidiary is limited to 25% of consolidated assets.
f. Income and Deferred Taxes
It is the Fund’s policy to qualify as a regulated investment company under the Internal Revenue Code. The Fund intends to distribute to shareholders substantially all of its taxable income and net realized gains to relieve it from federal income and excise taxes. As a result, no provision for U.S. federal income taxes is required.
The Fund may be subject to foreign taxation related to income received, capital gains on the sale of securities and certain foreign currency transactions in the foreign jurisdictions in which it invests. Foreign taxes, if any, are recorded based on the tax regulations and rates that exist in the foreign markets in which the Fund invests. When a capital gain tax is determined to apply, the Fund records an estimated deferred tax liability in an amount that would be payable if the securities were disposed of on the valuation date.
The Fund may recognize an income tax liability related to its uncertain tax positions under U.S. GAAP when the uncertain tax position has a less than 50% probability that it will be sustained upon examination by the tax authorities based on its technical merits. As of May 31, 2017, the Fund has determined that no tax liability is required in its consolidated financial statements related to uncertain tax positions (or expected to be taken in future tax years).
g. Security Transactions, Investment Income, Expenses and Distributions
Security transactions are accounted for on trade date. Realized gains and losses on security transactions are determined on a specific identification basis. Interest income and estimated expenses are accrued daily. Amortization of premium and accretion of discount on debt securities are included in interest income. Dividend income is recorded on the ex-dividend date. Distributions to shareholders are recorded on the ex-dividend date and are determined according to income tax regulations (tax basis). Distributable earnings determined on a tax basis may differ from earnings recorded in accordance with U.S. GAAP. These differences may be permanent or temporary. Permanent differences are reclassified among capital accounts to reflect their tax character. These reclassifications have no impact on net assets or the results of operations. Temporary differences are not reclassified, as they may reverse in subsequent periods.
| franklintempleton.com | Annual Report | 29 |
FRANKLIN ALTERNATIVE STRATEGIES FUNDS
NOTES TO CONSOLIDATED FINANCIAL STATEMENTS
Franklin K2 Global Macro Opportunities Fund (continued)
1. Organization and Significant Accounting Policies (continued)
g. Security Transactions, Investment Income, Expenses and Distributions (continued)
Common expenses incurred by the Trust are allocated among the funds based on the ratio of net assets of each fund to the combined net assets of the Trust. Fund specific expenses are charged directly to the fund that incurred the expense.
Realized and unrealized gains and losses and net investment income, not including class specific expenses, are allocated daily to each class of shares based upon the relative proportion of net assets of each class. Differences in per share distributions, by class, are generally due to differences in class specific expenses.
h. Offering Costs
Offering costs are amortized on a straight line basis over twelve months.
i. Accounting Estimates
The preparation of financial statements in accordance with U.S. GAAP requires management to make estimates and assumptions that affect the reported amounts of assets and liabilities at the date of the financial statements and the amounts of income and expenses during the reporting period. Actual results could differ from those estimates.
j. Guarantees and Indemnifications
Under the Trust’s organizational documents, its officers and trustees are indemnified by the Trust against certain liabilities arising out of the performance of their duties to the Trust. Additionally, in the normal course of business, the Trust, on behalf of the Fund, enters into contracts with service providers that contain general indemnification clauses. The Trust’s maximum exposure under these arrangements is unknown as this would involve future claims that may be made against the Trust that have not yet occurred. Currently, the Trust expects the risk of loss to be remote.
2. Shares of Beneficial Interest
At May 31, 2017, there were an unlimited number of shares authorized (without par value). Transactions in the Fund’s shares were as follows:
| Period Ended May 31, 2017a | ||||||||
| Shares | Amount | |||||||
| Class A Shares: | ||||||||
Shares sold | 9,921 | $ | 93,309 | |||||
Shares issued in reinvestment of distributions | 13 | 125 | ||||||
Shares redeemed | (182 | ) | (1,758 | ) | ||||
|
| |||||||
Net increase (decrease) | 9,752 | $ | 91,676 | |||||
|
| |||||||
| Class C Shares: | ||||||||
Shares sold | 20,588 | $ | 200,170 | |||||
Shares issued in reinvestment of distributions | 65 | 617 | ||||||
Shares redeemed | (18 | ) | (171 | ) | ||||
|
| |||||||
Net increase (decrease) | 20,635 | $ | 200,616 | |||||
|
| |||||||
| Class R Shares: | ||||||||
Shares sold | 1,001 | $ | 10,010 | |||||
Shares redeemed | (1 | ) | (10 | ) | ||||
|
| |||||||
Net increase (decrease) | 1,000 | $ | 10,000 | |||||
|
| |||||||
| Class R6 Shares: | ||||||||
Shares sold | 1,001 | $ | 10,010 | |||||
Shares redeemed | (1 | ) | (10 | ) | ||||
|
| |||||||
Net increase (decrease) | 1,000 | $ | 10,000 | |||||
|
| |||||||
| 30 | Annual Report | franklintempleton.com |
FRANKLIN ALTERNATIVE STRATEGIES FUNDS
NOTES TO CONSOLIDATED FINANCIAL STATEMENTS
Franklin K2 Global Macro Opportunities Fund (continued)
| Period Ended May 31, 2017a | ||||||||
| Shares | Amount | |||||||
| Advisor Class Shares: | ||||||||
Shares sold | 2,499,776 | $ | 24,996,798 | |||||
Shares issued in reinvestment of distributions | 17 | 163 | ||||||
Shares redeemed | (774 | ) | (7,141 | ) | ||||
|
| |||||||
Net increase (decrease) | 2,499,019 | $ | 24,989,820 | |||||
|
| |||||||
aFor the period July 11, 2016 (commencement of operations) to May 31, 2017.
3. Transactions with Affiliates
Franklin Resources, Inc. is the holding company for various subsidiaries that together are referred to as Franklin Templeton Investments. Certain officers and trustees of the Trust are also officers and/or directors of the following subsidiaries:
| Subsidiary | Affiliation | |
K2/D&S Management Co., L.L.C. (K2 Advisors) | Investment manager | |
Franklin Templeton Services, LLC (FT Services) | Administrative manager | |
Franklin Templeton Distributors, Inc. (Distributors) | Principal underwriter | |
Franklin Templeton Investor Services, LLC (Investor Services) | Transfer agent |
a. Management Fees
The Fund and K2 Subsidiary pay an investment management fee to K2 Advisors of 2.05% per year of the average daily net assets of the Fund and K2 Subsidiary. Management fees paid by the Fund are reduced on assets invested in the K2 Subsidiary, in an amount not to exceed the management fees paid by the K2 Subsidiary
On July 11, 2017, the Board approved the proposal to change the Fund’s investment management fee agreement. The new agreement will be effective on October 1, 2017.
Effective October 1, 2017, the Fund and K2 Subsidiary will pay fees of 1.90% per year of the average daily net assets of the Fund and K2 Subsidiary.
Under each subadvisory agreement, the below entities provide subadvisory services to the Fund or K2 Subsidiary. The subadvisory fees are paid by K2 Advisors based on the Fund and K2 Subsidiary average daily net assets, and is not an additional expense of the Fund or K2 Subsidiary.
| Subadvisors |
Aspect Capital Limited |
Emso Asset Management Limited |
Graham Capital Management L.P. |
P/E GLOBAL LLC |
b. Administrative Fees
Under an agreement with K2 Advisors, FT Services provides administrative services to the Fund and K2 Subsidiary. The fee is paid by K2 Advisors based on the Fund and K2 Subsidiary average daily net assets, and is not an additional expense of the Fund or K2 Subsidiary.
| franklintempleton.com | Annual Report | 31 |
FRANKLIN ALTERNATIVE STRATEGIES FUNDS
NOTES TO CONSOLIDATED FINANCIAL STATEMENTS
Franklin K2 Global Macro Opportunities Fund (continued)
3. Transactions with Affiliates (continued)
c. Distribution Fees
The Board has adopted distribution plans for each share class, with the exception of Class R6 and Advisor Class shares, pursuant to Rule 12b-1 under the 1940 Act. Under the Fund’s Class A reimbursement distribution plan, the Fund reimburses Distributors for costs incurred in connection with the servicing, sale and distribution of the Fund’s shares up to the maximum annual plan rate. Under the Class A reimbursement distribution plan, costs exceeding the maximum for the current plan year cannot be reimbursed in subsequent periods. In addition, under the Fund’s Class C and R compensation distribution plans, the Fund pays Distributors for costs incurred in connection with the servicing, sale and distribution of the Fund’s shares up to the maximum annual plan rate for each class. The plan year, for purposes of monitoring compliance with the maximum annual plan rates, is February 1 through January 31 for each fund.
The maximum annual plan rates, based on the average daily net assets, for each class, are as follows:
Class A | 0.25% | |||
Class C | 1.00% | |||
Class R | 0.50% |
d. Sales Charges/Underwriting Agreements
Front-end sales charges and contingent deferred sales charges (CDSC) do not represent expenses of the Fund. These charges are deducted from the proceeds of sales of Fund shares prior to investment or from redemption proceeds prior to remittance, as applicable. Distributors has advised the Fund of the following commission transactions related to the sales and redemptions of the Fund’s shares for the period:
Sales charges retained net of commissions paid to unaffiliated broker/dealers | $ | 105 |
e. Transfer Agent Fees
Each class of shares, except for Class R6, pays transfer agent fees to Investor Services for its performance of shareholder servicing obligations and reimburses Investor Services for out of pocket expenses incurred, including shareholder servicing fees paid to third parties. These fees are allocated daily based upon their relative proportion of such classes’ aggregate net assets. Class R6 pays Investor Services transfer agent fees specific to that class.
For the period ended May 31, 2017, the Fund paid transfer agent fees of $428, of which $285 was retained by Investor Services.
f. Waiver and Expense Reimbursements
K2 Advisors has contractually agreed in advance to waive or limit its fees and to assume as its own expense certain expenses otherwise payable by the Fund so that the expenses (excluding distribution fees, acquired fund fees and expenses, and expenses related to securities sold short) for each class of the Fund do not exceed 1.95%, and Class R6 does not exceed 1.94% based on the average net assets of each class (other than certain non-routine expenses or costs, including those relating to litigation, indemnification, reorganizations, and liquidations) until September 30, 2017. Total expenses waived or paid are not subject to recapture subsequent to the Fund’s fiscal year end.
g. Other Affiliated Transactions
At May 31, 2017, Franklin Resources, Inc. owned 98.8% of the Fund’s outstanding shares. Investment activities of this shareholder could have a material impact on the Fund.
| 32 | Annual Report | franklintempleton.com |
FRANKLIN ALTERNATIVE STRATEGIES FUNDS
NOTES TO CONSOLIDATED FINANCIAL STATEMENTS
Franklin K2 Global Macro Opportunities Fund (continued)
4. Expense Offset Arrangement
The Fund has entered into an arrangement with its custodian whereby credits realized as a result of uninvested cash balances are used to reduce a portion of the Fund’s custodian expenses. During the period ended May 31, 2017, the custodian fees were reduced as noted in the Consolidated Statement of Operations.
5. Income Taxes
For tax purposes, capital losses may be carried over to offset future capital gains, if any. At May 31, 2017, the capital loss carryforwards were as follows:
| Capital loss carryforwards: | ||||
Short term | $ | 297,021 | ||
Long term | 503,314 | |||
|
| |||
Total capital loss carryforwards | $ | 800,335 | ||
|
|
For tax purposes, the Fund may elect to defer any portion of a late-year ordinary loss to the first day of the following fiscal year. At May 31, 2017, the Fund deferred late-year ordinary losses of $77,479.
The tax character of distributions paid during the period ended May 31, 2017, was as follows:
Distributions paid from ordinary income | $ | 149,639 |
At May 31, 2017, the cost of investments and net unrealized appreciation (depreciation) for income tax purposes were as follows:
Cost of investments | $ | 21,510,122 | ||
|
| |||
Unrealized appreciation | $ | 974,282 | ||
Unrealized depreciation | (925,273 | ) | ||
|
| |||
Net unrealized appreciation (depreciation) | $ | 49,009 | ||
|
|
Differences between income and/or capital gains as determined on a book basis and a tax basis are primarily due to differing treatments of foreign currency transactions, investments in the K2 Subsidiary and offering costs.
6. Investment Transactions
Purchases and sales of investments (excluding short term securities) for the period ended May 31, 2017, aggregated $7,627,592 and $5,233,012, respectively.
| franklintempleton.com | Annual Report | 33 |
FRANKLIN ALTERNATIVE STRATEGIES FUNDS
NOTES TO CONSOLIDATED FINANCIAL STATEMENTS
Franklin K2 Global Macro Opportunities Fund (continued)
7. Other Derivative Information
At May 31, 2017, the Fund’s investments in derivative contracts are reflected in the Consolidated Statement of Assets and Liabilities as follows:
Asset Derivatives | Liability Derivatives | |||||||||||
| Derivative Contracts Not Accounted for as Hedging Instruments | Consolidated Statement of Assets and Liabilities Location | Fair Value | Consolidated Statement of Assets and Liabilities Location | Fair Value | ||||||||
Interest rate contracts | Variation margin | $ | 56,501 | a | Variation margin | $ | 10,658 | a | ||||
Foreign exchange contracts | Variation margin | 10,333 | a | Variation margin | 191,567 | a | ||||||
Unrealized appreciation on OTC forward exchange contracts | 363,595 | Unrealized depreciation on OTC forward exchange contracts | 644,036 | |||||||||
Credit contracts | Variation margin | 9,941 | a | Variation margin | 33,591 | a | ||||||
Equity contracts | Variation margin | 114,381 | a | Variation margin | 11,782 | a | ||||||
Commodity contracts | Variation margin | 110,203 | a | Variation margin | 102,698 | a | ||||||
|
|
|
| |||||||||
Totals | $ | 664,954 | $ | 994,332 | ||||||||
|
|
|
| |||||||||
aThis amount reflects the cumulative appreciation (depreciation) of futures contracts and centrally cleared swaps contracts as reported in the Consolidated Statement of Investments. Only the variation margin receivable/payable at period end is separately reported within the Consolidated Statement of Assets and Liabilities. Prior variation margin movements were recorded to cash upon receipt or payment.
For the period ended May 31, 2017, the effect of derivative contracts in the Fund’s Consolidated Statement of Operations was as follows:
| Derivative Contracts Not Accounted for as Hedging Instruments | Consolidated Statement of Operations Location | Net Realized Gain (Loss) for the Period | Consolidated Statement of Operations Location | Net Change in Unrealized Appreciation (Depreciation) for the Period | ||||||||
Net realized gain (loss) from: | Net change in unrealized appreciation (depreciation) on: | |||||||||||
Interest rate contracts | Futures contracts | $ | (532,474 | ) | Futures contracts | $ | 53,909 | |||||
Swap contracts | 4,615 | Swap contracts | (8,066 | ) | ||||||||
Foreign exchange contracts | Foreign currency transactions | 111,167 | a | Translation of other assets and liabilities denominated in foreign currencies | (280,441 | )a | ||||||
Futures contracts | (296,382 | ) | Futures contracts | (181,234 | ) | |||||||
Swap contracts | 4,448 | |||||||||||
Credit contracts | Swap contracts | (13,487 | ) | Swap contracts | (23,650 | ) | ||||||
Equity contracts | Futures contracts | (68,425 | ) | Futures contracts | 102,599 | |||||||
Investments | (1,880 | )b | ||||||||||
Commodity contracts | Futures contracts | (797,624 | ) | Futures contracts | 7,505 | |||||||
|
|
|
| |||||||||
Totals | $ | (1,590,042 | ) | $ | (329,378 | ) | ||||||
|
|
|
| |||||||||
aForward exchange contracts are included in net realized gain (loss) from foreign currency transactions and net change in unrealized appreciation (depreciation) on translation of other assets and liabilities denominated in foreign currencies in the Consolidated Statement of Operations.
bPurchased option contracts are included in net realized gain (loss) from investments in the Consolidated Statement of Operations.
For the period ended May 31, 2017, the average month end fair value of derivatives represented 3.7% of average month end net assets. The average month end number of open derivative contracts for the period was 325.
| 34 | Annual Report | franklintempleton.com |
FRANKLIN ALTERNATIVE STRATEGIES FUNDS
NOTES TO CONSOLIDATED FINANCIAL STATEMENTS
Franklin K2 Global Macro Opportunities Fund (continued)
At May 31, 2017, the Fund’s OTC derivative assets and liabilities are as follows:
| Gross Amounts of Assets and Liabilities Presented in the Consolidated Statement of Assets and Liabilities | ||||||||
| Assetsa | Liabilitiesa | |||||||
| Derivatives | ||||||||
Forward Exchange Contracts | $ | 363,595 | $ | 644,036 | ||||
|
| |||||||
aAbsent an event of default or early termination, OTC derivative assets and liabilities are presented gross and not offset in the Consolidated Statement of Assets and Liabilities.
At May 31, 2017, the Fund’s OTC derivative assets, which may be offset against the Fund’s OTC derivative liabilities and collateral received from the counterparty, are as follows:
| Amounts Not Offset in the Consolidated Statement of Assets and Liabilities | ||||||||||||||||||||
Gross Amounts of Assets | Financial | Financials | Cash | Net Amount (Not Less than Zero) | ||||||||||||||||
| Counterparty | ||||||||||||||||||||
BOFA | $ | 5,927 | $ | (5,687 | ) | $ | — | $ | — | $ | 240 | |||||||||
DBAB | 12,637 | (12,637 | ) | — | — | — | ||||||||||||||
JPHQ | 133,200 | (133,200 | ) | — | — | — | ||||||||||||||
MSCO | 211,831 | (211,831 | ) | — | — | — | ||||||||||||||
|
| |||||||||||||||||||
Total | $ | 363,595 | $ | (363,355 | ) | $ | — | $ | — | $ | 240 | |||||||||
|
| |||||||||||||||||||
At May 31, 2017, the Fund’s OTC derivative liabilities, which may be offset against the Fund’s OTC derivative assets and collateral pledged to the counterparty, are as follows:
| Amounts Not Offset in the Consolidated Statement of Assets and Liabilities | ||||||||||||||||||||
Gross Amounts of Liabilities | Financial | Financials | Cash Collateral Pledgeda | Net Amount (Not Less than Zero) | ||||||||||||||||
| Counterparty | ||||||||||||||||||||
BOFA | $ | 5,687 | $ | (5,687 | ) | $ | — | $ | — | $ | — | |||||||||
DBAB | 63,834 | (12,637 | ) | — | — | 51,197 | ||||||||||||||
JPHQ | 138,657 | (133,200 | ) | — | — | 5,457 | ||||||||||||||
MSCO | 435,858 | (211,831 | ) | — | (224,027 | ) | — | |||||||||||||
|
| |||||||||||||||||||
Total | $ | 644,036 | $ | (363,355 | ) | $ | — | $ | (224,027 | ) | $ | 56,654 | ||||||||
|
| |||||||||||||||||||
aIn some instances, the collateral amounts disclosed in the table above were adjusted due to the requirement to limit collateral amounts to avoid the effect of overcollateralization. Actual collateral received and/or pledged may be more than the amounts disclosed herein.
See Note 1(d) regarding derivative financial instruments.
See Abbreviations on page 37.
| franklintempleton.com | Annual Report | 35 |
FRANKLIN ALTERNATIVE STRATEGIES FUNDS
NOTES TO CONSOLIDATED FINANCIAL STATEMENTS
Franklin K2 Global Macro Opportunities Fund (continued)
8. Credit Facility
The Fund, together with other U.S. registered and foreign investment funds (collectively, Borrowers), managed by Franklin Templeton Investments, are borrowers in a joint syndicated senior unsecured credit facility totaling $2 billion (Global Credit Facility) which matures on February 9, 2018. This Global Credit Facility provides a source of funds to the Borrowers for temporary and emergency purposes, including the ability to meet future unanticipated or unusually large redemption requests. The Fund began participating in the Global Credit Facility on February 10, 2017.
Under the terms of the Global Credit Facility, the Fund shall, in addition to interest charged on any borrowings made by the Fund and other costs incurred by the Fund, pay its share of fees and expenses incurred in connection with the implementation and maintenance of the Global Credit Facility, based upon its relative share of the aggregate net assets of all of the Borrowers, including an annual commitment fee of 0.15% based upon the unused portion of the Global Credit Facility. These fees are reflected in other expenses in the Consolidated Statement of Operations. During the period ended May 31, 2017, the Fund did not use the Global Credit Facility.
9. Fair Value Measurements
The Fund follows a fair value hierarchy that distinguishes between market data obtained from independent sources (observable inputs) and the Fund’s own market assumptions (unobservable inputs). These inputs are used in determining the value of the Fund’s financial instruments and are summarized in the following fair value hierarchy:
| • | Level 1 – quoted prices in active markets for identical financial instruments |
| • | Level 2 – other significant observable inputs (including quoted prices for similar financial instruments, interest rates, prepayment speed, credit risk, etc.) |
| • | Level 3 – significant unobservable inputs (including the Fund’s own assumptions in determining the fair value of financial instruments) |
The input levels are not necessarily an indication of the risk or liquidity associated with financial instruments at that level.
For movements between the levels within the fair value hierarchy, the Fund has adopted a policy of recognizing the transfers as of the date of the underlying event which caused the movement.
A summary of inputs used as of May 31, 2017, in valuing the Fund’s assets and liabilities carried at fair value, is as follows:
| Level 1 | Level 2 | Level 3 | Total | |||||||||||||
| Assets: | ||||||||||||||||
Investments in Securities:a | ||||||||||||||||
Corporate Bonds and Notes | $ | — | $ | 622,166 | $ | — | $ | 622,166 | ||||||||
Foreign Government and Agency Securities | — | 2,420,959 | — | 2,420,959 | ||||||||||||
Short Term Investments | 17,509,166 | 1,006,840 | — | 18,516,006 | ||||||||||||
|
| |||||||||||||||
Total Investments in Securities | $ | 17,509,166 | $ | 4,049,965 | $ | — | $ | 21,559,131 | ||||||||
|
| |||||||||||||||
Other Financial Instruments: | ||||||||||||||||
Futures Contracts | $ | 291,124 | $ | — | $ | — | $ | 291,124 | ||||||||
Forward Exchange Contracts | — | 363,595 | — | 363,595 | ||||||||||||
Swap Contracts | — | 10,235 | — | 10,235 | ||||||||||||
|
| |||||||||||||||
Total Other Financial Instruments | $ | 291,124 | $ | 373,830 | $ | — | $ | 664,954 | ||||||||
|
| |||||||||||||||
| 36 | Annual Report | franklintempleton.com |
FRANKLIN ALTERNATIVE STRATEGIES FUNDS
NOTES TO CONSOLIDATED FINANCIAL STATEMENTS
Franklin K2 Global Macro Opportunities Fund (continued)
| Level 1 | Level 2 | Level 3 | Total | |||||||||||||
| Liabilities: | ||||||||||||||||
Other Financial Instruments: | ||||||||||||||||
Futures Contracts | $ | 308,345 | $ | — | $ | — | $ | 308,345 | ||||||||
Forward Exchange Contracts | — | 644,036 | — | 644,036 | ||||||||||||
Swap Contracts | — | 41,951 | — | 41,951 | ||||||||||||
|
| |||||||||||||||
Total Other Financial Instruments | $ | 308,345 | $ | 685,987 | $ | — | $ | 994,332 | ||||||||
|
| |||||||||||||||
aFor detailed categories, see the accompanying Consolidated Statement of Investments.
A reconciliation of assets in which Level 3 inputs are used in determining fair value is presented when there are significant Level 3 financial instruments at the end of the period.
10. Investment Company Reporting Modernization
In October 2016, the U.S. Securities and Exchange Commission adopted new rules and amended existing rules (together, final rules) intended to modernize the reporting and disclosure of information by registered investment companies. In part, the final rules amend Regulation S-X and require standardized, enhanced disclosures about derivatives in investment company financial statements, as well as other amendments. The compliance date for the amendments to Regulation S-X is August 1, 2017. Management has reviewed the requirements and believes the adoption of the amendments to Regulation S-X will not have a material impact on the Fund’s financial statements and related disclosures.
11. Subsequent Events
The Fund has evaluated subsequent events through the issuance of the consolidated financial statements and determined that no events have occurred that require disclosure other than those already disclosed in the financial statements.
Abbreviations
| Counterparty/Exchange | Currency | Selected Portfolio | ||||||||
BOFA | Bank of America, N.A. | ARS | Argentine Peso | EAFE | Europe, Australasia & Far East | |||||
DBAB | Deutsche Bank, AG | AUD | Australian Dollar | FRN | Floating Rate Note | |||||
ICE | Intercontinental Exchange, Inc. | CAD | Canadian Dollar | FTSE | Financial Times Stock Exchange | |||||
JPHQ | JP Morgan Chase Bank, N.A. | CZK | Czech Koruna | JIBAR | Johannesburg Interbank Agreed Rate | |||||
LCH | LCH.Clearnet LLC | EUR | Euro | LIBOR | London InterBank Offered Rate | |||||
MSCO | Morgan Stanley & Co., LLC | GBP | British Pound | MSCI | Morgan Stanley Capital International | |||||
| INR | Indian Rupee | OMX | Stockholm Stock Exchange | |||||||
| JPY | Japanese Yen | SAFEX | South African Futures Exchange | |||||||
| MXN | Mexican Peso | TOPIX | Tokyo Price Index | |||||||
| NZD | New Zealand Dollar | TSX | Toronto Stock Exchange | |||||||
| RUB | Russian Ruble | |||||||||
| USD | United States Dollar | |||||||||
| ZAR | South African Rand | |||||||||
| franklintempleton.com | Annual Report | 37 |
FRANKLIN ALTERNATIVE STRATEGIES FUNDS
Report of Independent Registered Public Accounting Firm
To the Board of Trustees of Franklin Alternative Strategies Funds and Shareholders of Franklin K2 Global Macro Opportunities Fund:
We have audited the accompanying consolidated statement of assets and liabilities, including the consolidated statement of investments, of Franklin K2 Global Macro Opportunities Fund (the “Fund”) (one of the funds constituting the Franklin Alternative Strategies Funds), as of May 31, 2017, and the related consolidated statement of operations, the consolidated statement of changes in net assets and the financial highlights for the period from July 11, 2016 (commencement of operations) through May 31, 2017. These financial statements and financial highlights are the responsibility of the Fund’s management. Our responsibility is to express an opinion on these financial statements and financial highlights based on our audit.
We conducted our audit in accordance with the standards of the Public Company Accounting Oversight Board (United States). Those standards require that we plan and perform the audit to obtain reasonable assurance about whether the financial statements and financial highlights are free of material misstatement. We were not engaged to perform an audit of the Fund’s internal control over financial reporting. Our audit included consideration of internal control over financial reporting as a basis for designing audit procedures that are appropriate in the circumstances, but not for the purpose of expressing an opinion on the effectiveness of the Fund’s internal control over financial reporting. Accordingly, we express no such opinion. An audit also includes examining, on a test basis, evidence supporting the amounts and disclosures in the financial statements and financial highlights, assessing the accounting principles used and significant estimates made by management, and evaluating the overall financial statement presentation. Our procedures included confirmation of securities owned as of May 31, 2017, by correspondence with the custodian and others, or by other appropriate auditing procedures where replies from others were not received. We believe that our audit provides a reasonable basis for our opinion.
In our opinion, the consolidated financial statements and financial highlights referred to above present fairly, in all material respects, the consolidated financial position of Franklin K2 Global Macro Opportunities Fund (one of the funds constituting the Franklin Alternative Strategies Funds) at May 31, 2017, the consolidated results of its operations, the consolidated changes in its net assets and the financial highlights for the period from July 11, 2016 (commencement of operations) through May 31, 2017, in conformity with U.S. generally accepted accounting principles.

Boston, Massachusetts
July 26, 2017
| 38 | Annual Report | franklintempleton.com |
FRANKLIN ALTERNATIVE STRATEGIES FUNDS
The name, year of birth and address of the officers and board members, as well as their affiliations, positions held with the Funds, principal occupations during at least the past five years and number of U.S. registered portfolios overseen in the Franklin Templeton Investments fund complex, are shown below. Generally, each board member serves until that person’s successor is elected and qualified.
Independent Board Members
| Name, Year of Birth and Address | Position | Length of Time Served | Number of Portfolios in Fund Complex Overseen by Board Member* | Other Directorships Held During at Least the Past 5 Years | ||||
| Edward I. Altman, Ph.D. (1941) c/o Franklin Mutual Advisers, LLC 101 John F. Kennedy Parkway Short Hills, NJ 07078-2789 | Trustee | Since 2011 | 16 | None | ||||
| Principal Occupation During at Least the Past 5 Years: | ||||||||
| Max L. Heine Professor of Finance, Emeritus and Director of The Credit and Debt Markets Research Program, Salomon Center, Stern School of Business, New York University; editor and author of numerous financial publications; financial consultant; an adviser to numerous financial and publishing organizations; and formerly, Vice Director, Salomon Center, Stern School of Business, New York University. | ||||||||
Ann Torre Bates (1958) | Trustee | Since 2011 | 42 | Ares Capital Corporation (specialty finance company) (2010-present), United Natural Foods, Inc. (distributor of natural, organic and specialty foods) (2013-present), Allied Capital Corporation (financial services) (2003-2010) and SLM Corporation (Sallie Mae) (1997-2014) and Navient Corporation (loan management, servicing and asset recovery) (2014-2016). | ||||
| Principal Occupation During at Least the Past 5 Years: | ||||||||
| Director of various companies; and formerly, Executive Vice President and Chief Financial Officer, NHP Incorporated (manager of multifamily housing) (1995-1997); and Vice President and Treasurer, US Airways, Inc. (until 1995). | ||||||||
| Burton J. Greenwald (1929) c/o Franklin Mutual Advisers, LLC 101 John F. Kennedy Parkway Short Hills, NJ 07078-2789 | Trustee | Since 2011 | 16 | Franklin Templeton Emerging Markets Debt Opportunities Fund PLC (1999-present) and Fiduciary International Ireland Limited (1999-2015). | ||||
| Principal Occupation During at Least the Past 5 Years: | ||||||||
| Managing Director, B.J. Greenwald Associates (management consultants to the financial services industry); and formerly, Chairman, Fiduciary Trust International Funds; Executive Vice President, L.F. Rothschild Fund Management, Inc.; President and Director, Merit Mutual Funds; President, Underwriting Division and Director, National Securities & Research Corporation; Governor, Investment Company Institute; and Chairman, ICI Public Information Committee. | ||||||||
| Keith E. Mitchell (1954) c/o Franklin Mutual Advisers, LLC 101 John F. Kennedy Parkway Short Hills, NJ 07078-2789 | Trustee | Since 2011 | 16 | None | ||||
| Principal Occupation During at Least the Past 5 Years: | ||||||||
| Director of various boards of asset management firms; and formerly, Managing Member, Mitchell, Hartley & Bechtel Advisers, LLC (formerly, Mitchell Advisers, LLC) (advisory firm) (2003-2015) and Managing Director, Putman Lovell NBF. | ||||||||
| franklintempleton.com | Annual Report | 39 |
FRANKLIN ALTERNATIVE STRATEGIES FUNDS
Independent Board Members (continued)
| Name, Year of Birth and Address | Position | Length of Time Served | Number of Portfolios in Fund Complex Overseen by Board Member* | Other Directorships Held During at Least the Past 5 Years | ||||
| David W. Niemiec (1949) c/o Franklin Mutual Advisers, LLC 101 John F. Kennedy Parkway Short Hills, NJ 07078-2789 | Trustee | Since 2015 | 42 | Hess Midstream Partners LP (oil and gas midstream infrastructure) (April 2017). | ||||
| Principal Occupation During at Least the Past 5 Years: | ||||||||
| Advisor, Saratoga Partners (private equity fund); and formerly, Managing Director, Saratoga Partners (1998-2001) and SBC Warburg Dillon Read (investment banking) (1997-1998); Vice Chairman, Dillon, Read & Co. Inc. (investment banking) (1991-1997); and Chief Financial Officer, Dillon, Read & Co. Inc. (1982-1997). | ||||||||
| Charles Rubens II (1930) c/o Franklin Mutual Advisers, LLC 101 John F. Kennedy Parkway Short Hills, NJ 07078-2789 | Trustee | Since 2011 | 16 | None | ||||
| Principal Occupation During at Least the Past 5 Years: | ||||||||
| Private investor and president of non-profit organizations; and formerly, an executive of Time, Inc.; and Trustee of Colorado College. | ||||||||
| Jan Hopkins Trachtman (1947) c/o Franklin Mutual Advisers, LLC 101 John F. Kennedy Parkway Short Hills, NJ 07078-2789 | Trustee | Since 2011 | 16 | None | ||||
| Principal Occupation During at Least the Past 5 Years: | ||||||||
| President and Founder, The Jan Hopkins Group (communications consulting firm); serves on Advisory Board of Knight Bagehot Fellowship; and formerly, President, Economic Club of New York (2007-2015); Anchor/Correspondent, CNN Financial News (until 2003); Managing Director and Head of Client Communications, Citigroup Private Bank (until 2005); Off-Air Reporter, ABC News’ World News Tonight; and Editor, CBS Network News. | ||||||||
| Robert E. Wade (1946) c/o Franklin Mutual Advisers, LLC 101 John F. Kennedy Parkway Short Hills, NJ 07078-2789 | Trustee and Chairman of the Board | Trustee and Chairman of the Board since 2011 | 42 | El Oro Ltd (investments) (2003-present). | ||||
| Principal Occupation During at Least the Past 5 Years: | ||||||||
| Attorney at law engaged in private practice (1972-2008) and member of various boards. | ||||||||
| Gregory H. Williams (1943) c/o Franklin Mutual Advisers, LLC 101 John F. Kennedy Parkway Short Hills, NJ 07078-2789 | Trustee | Since 2015 | 16 | None | ||||
| Principal Occupation During at Least the Past 5 Years: | ||||||||
| Private investor; Consultant; and formerly, President, University of Cincinnati (2009-2012); President, The City College of New York (2001-2009); Dean, College of Law, Ohio State University (1993-2001); and Associate Vice President, Academic Affairs and Professor of Law, University of Iowa (1977-1993). | ||||||||
| 40 | Annual Report | franklintempleton.com |
FRANKLIN ALTERNATIVE STRATEGIES FUNDS
Interested Board Members and Officers
| Name, Year of Birth and Address | Position | Length of Time Served | Number of Portfolios in Fund Complex Overseen by Board Member* | Other Directorships Held During at Least the Past 5 Years | ||||
| **Gregory E. Johnson (1961) One Franklin Parkway San Mateo, CA 94403-1906 | Trustee | Since 2011 | 156 | None | ||||
| Principal Occupation During at Least the Past 5 Years: | ||||||||
| Chairman of the Board, Member – Office of the Chairman, Director and Chief Executive Officer, Franklin Resources, Inc.; officer and/or director or trustee, as the case may be, of some of the other subsidiaries of Franklin Resources, Inc. and of 44 of the investment companies in Franklin Templeton Investments; and Chairman, Investment Company Institute; and formerly, President, Franklin Resources, Inc. (1994-2015). | ||||||||
| **Jennifer M. Johnson (1964) One Franklin Parkway San Mateo, CA 94403-1906 | Trustee | Since 2015 | 19 | None | ||||
| Principal Occupation During at Least the Past 5 Years: | ||||||||
| President and Chief Operating Officer, Franklin Resources, Inc.; officer and/or director or trustee, as the case may be, of some of the other subsidiaries of Franklin Resources, Inc. and of four of the investment companies in Franklin Templeton Investments; and formerly, Chief Operating Officer and Executive Vice President, Franklin Resources, Inc. (1994-2015); Executive Vice President of Operations and Technology, Franklin Resources, Inc. (2005-2010); and Senior Vice President, Franklin Resources, Inc. (2003-2005). | ||||||||
| Alison E. Baur (1964) One Franklin Parkway San Mateo, CA 94403-1906 | Vice President | Since 2012 | Not Applicable | Not Applicable | ||||
| Principal Occupation During at Least the Past 5 Years: | ||||||||
| Deputy General Counsel, Franklin Templeton Investments; and officer of some of the other subsidiaries of Franklin Resources, Inc. and of 45 of the investment companies in Franklin Templeton Investments. | ||||||||
| Aliya S. Gordon (1973) One Franklin Parkway San Mateo, CA 94403-1906 | Vice President | Since 2011 | Not Applicable | Not Applicable | ||||
Principal Occupation During at Least the Past 5 Years: | ||||||||
| Senior Associate General Counsel, Franklin Templeton Investments; and officer of 45 of the investment companies in Franklin Templeton Investments. | ||||||||
| Steven J. Gray (1955) One Franklin Parkway San Mateo, CA 94403-1906 | Secretary and Vice President | Secretary and Vice President since 2011 | Not Applicable | Not Applicable | ||||
| Principal Occupation During at Least the Past 5 Years: | ||||||||
| Senior Associate General Counsel, Franklin Templeton Investments; Vice President, Franklin Templeton Distributors, Inc. and FT AlphaParity, LLC; and officer of 45 of the investment companies in Franklin Templeton Investments. | ||||||||
Madison S. Gulley (1964) 300 S.E. 2nd Street Fort Lauderdale, FL 33301-1923 | President and Chief Executive Officer – Investment Management | Since June 2017 | Not Applicable | Not Applicable | ||||
| Principal Occupation During at Least the Past 5 Years: | ||||||||
| Executive Vice President, Franklin Advisers, Inc., Franklin Advisory Services, LLC, Franklin Templeton Institutional, LLC; Templeton Global Advisors, Limited, and Templeton Investment Counsel, LLC; Senior Vice President, Franklin Templeton Companies, LLC; officer and/or director or trustee, as the case may be, of some of the other subsidiaries of Franklin Resources, Inc. and of one of the investment companies in Franklin Templeton Investments. | ||||||||
| franklintempleton.com | Annual Report | 41 |
FRANKLIN ALTERNATIVE STRATEGIES FUNDS
Interested Board Members and Officers (continued)
| Name, Year of Birth and Address | Position | Length of Time Served | Number of Portfolios in Fund Complex Overseen by Board Member* | Other Directorships Held During at Least the Past 5 Years | ||||
Matthew T. Hinkle (1971) One Franklin Parkway San Mateo, CA 94403-1906 | Chief Executive Officer – Finance and Administration | Since June 2017 | Not Applicable | Not Applicable | ||||
| Principal Occupation During at Least the Past 5 Years: | ||||||||
| Senior Vice President, U.S. Fund Administration Reporting & Fund Tax, Franklin Templeton Investments; officer of 45 of the investment companies in Franklin Templeton Investments; and formerly, Vice President, Global Tax (2012-April 2017) and Treasurer/Assistant Treasurer, Franklin Templeton Investments (2009-2017). | ||||||||
| Robert G. Kubilis (1973) 300 S.E. 2nd Street Fort Lauderdale, FL 33301-1923 | Treasurer, Chief Financial Officer and Chief Accounting Officer | Since 2015 | Not Applicable | Not Applicable | ||||
| Principal Occupation During at Least the Past 5 Years: | ||||||||
| Treasurer, U.S. Fund Administration & Reporting, Franklin Templeton Investments; and officer of 18 of the investment companies in Franklin Templeton Investments. | ||||||||
| Robert Lim (1948) One Franklin Parkway San Mateo, CA 94403-1906 | Vice President – AML Compliance | Since 2016 | Not Applicable | Not Applicable | ||||
| Principal Occupation During at Least the Past 5 Years: | ||||||||
| Vice President, Franklin Templeton Companies, LLC; Chief Compliance Officer, Franklin Templeton Distributors, Inc. and Franklin Templeton Investor Services, LLC; and officer of 45 of the investment companies in Franklin Templeton Investments. | ||||||||
| Kimberly H. Novotny (1972) 300 S.E. 2nd Street Fort Lauderdale, FL 33301-1923 | Vice President | Since 2013 | Not Applicable | Not Applicable | ||||
| Principal Occupation During at Least the Past 5 Years: | ||||||||
| Associate General Counsel, Franklin Templeton Investments; Vice President and Corporate Secretary, Fiduciary Trust International of the South; Vice President, Templeton Investment Counsel, LLC; Assistant Secretary, Franklin Resources, Inc.; and officer of 45 of the investment companies in Franklin Templeton Investments. | ||||||||
| Robert C. Rosselot (1960) 300 S.E. 2nd Street Fort Lauderdale, FL 33301-1923 | Chief Compliance Officer | Since 2013 | Not Applicable | Not Applicable | ||||
| Principal Occupation During at Least the Past 5 Years: | ||||||||
| Director, Global Compliance, Franklin Templeton Investments; Vice President, Franklin Templeton Companies, LLC; officer of 45 of the investment companies in Franklin Templeton Investments; and formerly, Senior Associate General Counsel, Franklin Templeton Investments (2007-2013); and Secretary and Vice President, Templeton Group of Funds (2004-2013). | ||||||||
| Karen L. Skidmore (1952) One Franklin Parkway San Mateo, CA 94403-1906 | Vice President | Since 2011 | Not Applicable | Not Applicable | ||||
| Principal Occupation During at Least the Past 5 Years: | ||||||||
| Senior Associate General Counsel, Franklin Templeton Investments; and officer of 45 of the investment companies in Franklin Templeton Investments. | ||||||||
| 42 | Annual Report | franklintempleton.com |
FRANKLIN ALTERNATIVE STRATEGIES FUNDS
Interested Board Members and Officers (continued)
| Name, Year of Birth and Address | Position | Length of Time Served | Number of Portfolios in Fund Complex Overseen by Board Member* | Other Directorships Held During at Least the Past 5 Years | ||||
| Navid J. Tofigh (1972) One Franklin Parkway San Mateo, CA 94403-1906 | Vice President | Since 2015 | Not Applicable | Not Applicable | ||||
| Principal Occupation During at Least the Past 5 Years: | ||||||||
| Associate General Counsel, Franklin Templeton Investments; and officer of 45 of the investment companies in Franklin Templeton Investments. | ||||||||
| Craig S. Tyle (1960) One Franklin Parkway San Mateo, CA 94403-1906 | Vice President | Since 2011 | Not Applicable | Not Applicable | ||||
| Principal Occupation During at Least the Past 5 Years: | ||||||||
| General Counsel and Executive Vice President, Franklin Resources, Inc.; and officer of some of the other subsidiaries of Franklin Resources, Inc. and of 45 of the investment companies in Franklin Templeton Investments. | ||||||||
| Lori A. Weber (1964) 300 S.E. 2nd Street Fort Lauderdale, FL 33301-1923 | Vice President | Since 2011 | Not Applicable | Not Applicable | ||||
| Principal Occupation During at Least the Past 5 Years: | ||||||||
| Senior Associate General Counsel, Franklin Templeton Investments; Assistant Secretary, Franklin Resources, Inc.; Vice President and Secretary, Templeton Investment Counsel, LLC; and officer of 45 of the investment companies in Franklin Templeton Investments. | ||||||||
*We base the number of portfolios on each separate series of the U.S. registered investment companies within the Franklin Templeton Investments fund complex. These portfolios have a common investment manager or affiliated investment managers.
**Gregory E. Johnson is considered to be an interested person of the Fund under the federal securities laws due to his position as an officer and director of Franklin Resources, Inc. (Resources), which is the parent company of the Fund’s investment manager and distributor. Jennifer M. Johnson is considered to be an interested person of the Fund under the federal securities laws due to her position as officer and director of Resources.
Note 1: Gregory E. Johnson and Jennifer M. Johnson are siblings.
Note 2: Officer information is current as of the date of this report. It is possible that after this date, information about officers may change.
Note 3: Effective June 1, 2017, William Y. Yun ceased to be an officer of the trust.
The Fund’s Board has determined that certain of the members of the Audit Committee, including Ann Torre Bates, are audit committee financial experts, and “independent,” under those provisions of the Sarbanes-Oxley Act of 2002, and the rules and form amendments adopted by the Securities and Exchange Commission, relating to audit committee financial experts.
The Statement of Additional Information (SAI) includes additional information about the board members and is available, without charge, upon request. Shareholders may call (800) DIAL BEN/342-5236 to request the SAI.
| franklintempleton.com | Annual Report | 43 |
FRANKLIN ALTERNATIVE STRATEGIES FUNDS
FRANKLIN K2 GLOBAL MACRO OPPORTUNITIES FUND
Board Approval of Investment Management Agreement and Sub-Advisory Agreements
FRANKLIN K2 GLOBAL MACRO OPPORTUNITIES FUND
(“Fund”)
The Board of Trustees (Board), including the independent trustees, at a Board meeting held on May 16, 2016, unanimously approved the Investment Management Agreement between Franklin Alternatives Strategies Funds (Trust), on behalf of Franklin K2 Global Macro Fund (Fund), and K2 Advisors/ D&S Management Co., L.L.C. (K2 Advisors), and each Sub-Advisory Agreement between K2 Advisors and each of EMSO Asset Management Limited (EMSO), Graham Capital Management, L.P. (Graham), and Aspect Capital Limited (together with EMSO and Graham, the Sub-Advisors).
Prior to a meeting of all of the trustees for the purpose of considering such approvals, the trustees participated in two other meetings held in connection with the approval process (those trustees unable to attend in person were present by telephonic conference means). Throughout the process, the independent trustees received assistance and advice from and met separately with independent counsel. The independent trustees met with and interviewed officers of the investment manager and Sub-Advisors (including portfolio managers), the transfer agent and shareholder services group and the distributor. In approving the investment management agreement and the sub-advisory agreements for the Fund, the Board, including the independent trustees, determined that the investment management agreement and the sub-advisory agreements, including the investment management and sub-advisory fee structure provided for in the agreements, were fair and reasonable.
In making the foregoing approvals, the Board considered various materials related to the investment management agreement and the sub-advisory agreements including: (1) a copy of the proposed form of investment management agreement and sub-advisory agreements; (2) information describing the nature, quality and extent of services that K2 Advisors and each Sub-Advisor would provide to the Fund, and the proposed investment management fees and sub-advisory fees payable to K2 Advisors and each Sub-Advisor; (3) reports from K2 Advisors on the diligence conducted on each Sub-Advisor and the reasons for recommending each Sub-Advisor, as a sub-advisor for the Fund, including, but not limited to, each Sub-Advisor’s background, experience, personnel, operations, policies, procedures and compliance functions and plans for the integration of
such operations, policies, procedures and compliance functions with those of K2 Advisors; and (4) a report from the Trust’s Chief Compliance Officer regarding K2 Advisors’ and each Sub-Advisor’s compliance program and capabilities, including policies and procedures in place to address potential conflicts of interest, and the diligence undertaken by the Trust’s Chief Compliance Officer with respect thereto.
The Board’s consideration of whether to approve the investment management agreement and each sub-advisory agreement took into account several factors including, but not limited to, the following: (1) the nature and quality of the services to be provided by K2 Advisors and each Sub-Advisor to the Fund under the proposed investment management agreement and sub-advisory agreements, respectively; (2) K2 Advisors’ and each Sub-Advisor’s experience as a manager of other funds and accounts; (3) K2 Advisors’ and each Sub-Advisor’s strength and reputation within the industry; (4) the fairness of the compensation under the proposed investment management agreement and sub-advisory agreements; (5) the pricing structure (including fee waivers and the estimated expense ratio to be borne by shareholders) of the Fund; (6) the personnel, operations, financial condition and investment management capabilities, methodologies and resources of K2 Advisors and each Sub-Advisor, including each management team’s expertise in the management of other global macro funds; (7) profitability matters; (8) reports from K2 Advisors on the diligence conducted on each Sub-Advisor and the reasons for recommending each Sub-Advisor as a sub-advisor for the Fund, including, but not limited to, each Sub-Advisor’s background, experience, personnel, operations, policies, procedures and compliance functions and plans for the integration of such operations, policies, procedures and compliance functions with those of K2 Advisors; and (9) a report from the Trust’s Chief Compliance Officer regarding K2 Advisors’ and each Sub-Advisor’s compliance program and capabilities, including policies and procedures in place to address potential conflicts of interest, and the diligence undertaken by the Trust’s Chief Compliance Officer with respect thereto. Particular attention was given to (1) the diligent risk management program of K2 Advisors, including those aspects of the program related to selecting and overseeing sub-advisors to the Fund, (2) each Sub-Advisor’s risk management program, and (3) derivatives and other complex instruments that are expected to be held by the Fund and how such instruments are expected to be used to carry out the Fund’s investment goals.
The Board was also provided with a report from Lipper, Inc., an independent third party (Lipper), comparing the Fund’s
| 44 | Annual Report | franklintempleton.com |
FRANKLIN ALTERNATIVE STRATEGIES FUNDS
FRANKLIN K2 GLOBAL MACRO OPPORTUNITIES FUND
SHAREHOLDER INFORMATION
proposed fees with the fees of other funds in the Fund’s Lipper selected peer group (Lipper Report). The Board reviewed this information and its usefulness in the approval process with respect to matters such as comparative fees and expense ratios. The Board considered that the Lipper Report contains only a limited number of multi-manager funds. The Board concluded that the Lipper Report was helpful in the performance of its duties.
The following sets forth some of the primary information and factors relevant to the Board’s decisions. This discussion of the information and factors considered by the Board (including the information and factors discussed above) is not intended to be exhaustive, but rather summarizes certain factors considered by the Board. In view of the wide variety of factors considered, the Board did not, unless otherwise noted, find it practicable to quantify or otherwise assign relative weights to the foregoing factors. In addition, individual trustees may have assigned different weights to various factors.
NATURE, EXTENT AND QUALITY OF SERVICES. The trustees reviewed the nature, extent and quality of the services to be provided by K2 Advisors and each Sub-Advisor. In this regard, they reviewed the Fund’s proposed investment goal, K2 Advisors’ and each Sub-Advisor’s proposed investment strategy, and K2 Advisors’ and each Sub-Advisor’s ability to implement such investment goal and/or investment strategy, including, but not limited to, K2 Advisors’ and each Sub-Advisor’s trading practices and investment decision processes. The Board noted the responsibilities that K2 Advisors would have as the Fund’s investment manager, including (1) due diligence of the Sub-Advisors, their respective trading strategies, risk management, operations and businesses, (2) oversight and monitoring of the day-to-day investment activities of the Sub-Advisors and the ongoing assessment of their performance, (3) portfolio construction with respect to the allocation of assets among Sub-Advisors, investment funds, cash and other investments, (4) risk management, (5) on-going oversight and monitoring of the Sub-Advisors’ compliance with the investment mandate, compliance policies and procedures and federal securities laws, (6) preparing quarterly reports to the Board, and (7) the implementation of Board directives as they relate to the Fund. The trustees considered the successful performance of K2 Advisors in managing Franklin K2 Alternative Strategies Fund (K2 ASF) and Franklin K2 Long Short Credit Fund (K2 LSCF). The trustees also took into account that the investment management arrangement for the Fund involved the use of a wholly owned Cayman Island subsidiary for certain holdings and that K2 Advisors waives a portion of investment management fees
from the Fund to the extent it receives investment management fees from such subsidiary corporation.
With respect to the sub-advisory services to be provided by the Sub-Advisors, the Board noted the responsibilities that each Sub-Advisor would have with respect to the portion of the Fund’s assets allocated to the Sub-Advisor by K2 Advisors (Sub-Advised Portion), including, among others, implementing the investment strategies with respect to the Sub-Advised Portion and ensuring compliance with the investment strategies, policies and limitations of the Sub-Advised Portion. The trustees considered the successful performance of each Sub-Advisor in managing other investment products with investment strategies similar to the investment strategies of its Sub-Advised Portion of the Fund, including, with respect to certain Sub-Advisors, mutual funds with similar investment strategies.
The trustees reviewed the Fund’s portfolio management team at K2 Advisors and each Sub-Advisor, including each such team’s performance, staffing, skills and compensation program. The trustees considered various other products, portfolios and entities that are advised by K2 Advisors and each Sub-Advisor and the allocation of assets and expenses among and within them, as well as their relative fees and reasons for differences with respect thereto and any potential conflicts. The Board also considered a report from the Trust’s Chief Compliance Officer regarding K2 Advisors’ and each Sub-Advisor’s compliance program as such policies relate to the operations of the Fund. The Board considered the selection and due diligence process employed by K2 Advisors in proposing each Sub-Advisor as a sub-advisor to the Fund, including the due diligence undertaken with respect to the Sub-Advisor’s compliance capabilities, and efforts to integrate each Sub-Advisor’s operations, policies, procedures and compliance functions with those of K2 Advisors. The trustees considered K2 Advisors’ significant efforts in developing and implementing compliance procedures established in accordance with U.S. Securities and Exchange Commission and other requirements. They also considered the nature, extent and quality of the services to be provided under the other service agreements with affiliates of K2 Advisors.
Based on their review, the trustees were satisfied with the nature and quality of the overall services to be provided by K2 Advisors, its affiliates and each Sub-Advisor to the Fund and its shareholders and were confident in the abilities of K2 Advisors and each Sub-Advisor to implement their respective proposed investment strategy and to provide quality services to the Fund and its shareholders.
| franklintempleton.com | Annual Report | 45 |
FRANKLIN ALTERNATIVE STRATEGIES FUNDS
FRANKLIN K2 GLOBAL MACRO OPPORTUNITIES FUND
SHAREHOLDER INFORMATION
INVESTMENT PERFORMANCE. The Board noted that, as the Fund had not yet commenced investment operations, there was no investment performance for the Fund. As noted earlier, the Board did consider the investment performance of K2 Advisors in managing K2 ASF and K2-LSCF, as well as the investment performance of each Sub-Advisor in managing other investment products with investment strategies similar to the investment strategies of its Sub-Advised Portion of the Fund, including, with respect to certain Sub-Advisors, mutual funds with similar investment strategies. The Board also considered the proposed performance benchmarks for the Fund and how such benchmarks were selected by K2 Advisors and would be utilized to measure performance of K2 Advisors and each Sub-Advisor.
COMPARATIVE EXPENSES AND PROFITABILITY. The Board considered the cost of the services to be provided and the profits to be realized by K2 Advisors (and its affiliates) and each Sub-Advisor from their respective relationships with the Fund. The Board noted that K2 Advisors, its affiliates and each Sub-Advisor could not report any financial results from their relationships with the Fund because the Fund had not yet commenced investment operations, and thus, the Board could not evaluate K2 Advisors’, its affiliates’ or each Sub-Advisor’s profitability with respect to the Fund. The Board considered that the Fund is expected to incur considerable expenses in its first year of operation, which will largely be absorbed by K2 Advisors through expense waivers, and is not anticipated to generate significant, if any, profit for K2 Advisors and/or its affiliates for some time.
In considering the appropriateness of the investment management fee charged to the Fund, the Board also reviewed and considered the investment management fees in light of the nature, extent and quality of the investment management services expected to be provided by K2 Advisors and each Sub-Advisor, as more fully discussed above. The Board noted that the sub-advisory fees would be paid by K2 Advisors to each Sub-Advisor and would not be additional fees to be borne by the Fund. The Board also noted that the sub-advisory fees to be paid by K2 Advisors to each Sub-Advisor were the product of arms-length negotiations between K2 Advisors and each Sub-Advisor and the Board considered the allocation of the investment management fee charged to the Fund between K2 Advisors and each Sub-Advisor in light of the nature, extent and quality of the investment management services expected to be provided by K2 Advisors and each Sub-Advisor. The trustees considered various other products, portfolios and entities that are advised by K2 Advisors and each Sub-Advisor and the
allocation of assets and expenses among and within them, as well as their relative fees and reasons for differences with respect thereto and any potential conflicts. The Board considered the extent to which K2 Advisors and each Sub-Advisor may derive ancillary benefits from Fund operations.
Consideration was also given to the information in the Lipper Report on other alternative global macro funds determined by Lipper to be in the Fund’s expense group (the “Comparable Funds”). It was noted that the Lipper contractual management fee analysis includes administrative charges as being part of the management fee. The Board noted that the contractual investment management fee of the Fund was within the range of fees charged by the Comparable Funds. The Board also noted that the expected total expenses (including the proposed fee waiver and expense limitation arrangements) of the Fund were within the range of total expenses of the Comparable Funds (including the Comparable Funds’ fee waiver and expense limitation arrangements). It was noted that the Lipper Report presented a limited comparison because, as discussed earlier, of the limited number of multi-manager funds available for inclusion in the Lipper Report due to the nature of the Fund.
Based upon its consideration of all these factors, the Board determined that the investment management and sub-advisory fee structure was fair and reasonable.
ECONOMIES OF SCALE. The Board considered economies of scale that may be realized by K2 Advisors, its affiliates and each Sub-Advisor as the Fund grows larger and the extent to which they are shared with Fund shareholders, as for example, in the level of the investment management and sub-advisory fees charged, in the quality and efficiency of services rendered and in increased capital commitments benefiting the Fund directly or indirectly. Because the Fund had not yet commenced operations, the Board concluded that economies of scale were difficult to consider at this time.
Proxy Voting Policies and Procedures
The Fund’s investment manager has established Proxy Voting Policies and Procedures (Policies) that the Fund uses to determine how to vote proxies relating to portfolio securities. Shareholders may view the Fund’s complete Policies online at franklintempleton.com. Alternatively, shareholders may request copies of the Policies free of charge by calling the Proxy Group collect at (954) 527-7678 or by sending a written request to: Franklin Templeton Companies, LLC, 300 S.E. 2nd Street, Fort Lauderdale, FL 33301, Attention: Proxy Group. Copies of the Fund’s proxy voting records are also made available online at
| 46 | Annual Report | franklintempleton.com |
FRANKLIN ALTERNATIVE STRATEGIES FUNDS
FRANKLIN K2 GLOBAL MACRO OPPORTUNITIES FUND
SHAREHOLDER INFORMATION
franklintempleton.com and posted on the U.S. Securities and Exchange Commission’s website at sec.gov and reflect the most recent 12-month period ended June 30.
Quarterly Statement of Investments
The Trust, on behalf of the Fund, files a complete statement of investments with the U.S. Securities and Exchange Commission for the first and third quarters for each fiscal year on Form N-Q. Shareholders may view the filed Form N-Q by visiting the Commission’s website at sec.gov. The filed form may also be viewed and copied at the Commission’s Public Reference Room in Washington, DC. Information regarding the operations of the Public Reference Room may be obtained by calling (800) SEC-0330.
Householding of Reports and Prospectuses
You will receive the Fund’s financial reports every six months as well as an annual updated summary prospectus (prospectus available upon request). To reduce Fund expenses, we try to identify related shareholders in a household and send only one copy of the financial reports and summary prospectus. This process, called “householding,” will continue indefinitely unless you instruct us otherwise. If you prefer not to have these documents householded, please call us at (800) 632-2301. At any time you may view current prospectuses/summary prospectuses and financial reports on our website. If you choose, you may receive these documents through electronic delivery.
| franklintempleton.com | Annual Report | 47 |

Annual Report and Shareholder Letter
Franklin K2 Global Macro Opportunities Fund
Investment Manager
K2/D&S Management Co., L.L.C.
Distributor
Franklin Templeton Distributors, Inc.
(800) DIAL BEN® / 342-5236
franklintempleton.com
Shareholder Services
(800) 632-2301
Authorized for distribution only when accompanied or preceded by a summary prospectus and/or prospectus. Investors should carefully consider a fund’s investment goals, risks, charges and expenses before investing. A prospectus contains this and other information; please read it carefully before investing.
To help ensure we provide you with quality service, all calls to and from our service areas are monitored and/or recorded.
| © 2017 Franklin Templeton Investments. All rights reserved. | 973 A 07/17 |
Item 2. Code of Ethics.
(a) The Registrant has adopted a code of ethics that applies to its principal executive officers and principal financial and accounting officer.
(c) N/A
(d) N/A
(f) Pursuant to Item 12(a)(1), the Registrant is attaching as an exhibit a copy of its code of ethics that applies to its principal executive officers and principal financial and accounting officer.
Item 3. Audit Committee Financial Expert.
(a)(1) The Registrant has an audit committee financial expert serving on its audit committee.
(2) The audit committee financial expert is Ann Torre Bates and she is “independent” as defined under the relevant Securities and Exchange Commission Rules and Releases.
Item 4. Principal Accountant Fees and Services.
(a) Audit Fees
The aggregate fees paid to the principal accountant for professional services rendered by the principal accountant for the audit of the registrant’s annual financial statements or for services that are normally provided by the principal accountant in connection with statutory and regulatory filings or engagements were $278,106 for the fiscal year ended May 31, 2017 and $221,182 for the fiscal year ended May 31, 2016.
(b) Audit-Related Fees
There were no fees paid to the principal accountant for assurance and related services rendered by the principal accountant to the registrant that are reasonably related to the performance of the audit of the registrant’s financial statements and are not reported under paragraph (a) of Item 4.
There were no fees paid to the principal accountant for assurance and related services rendered by the principal accountant to the registrant’s investment adviser and any entity controlling, controlled by or under common control with the investment adviser that provides ongoing services to the registrant that are reasonably related to the performance of the audit of their financial statements.
(c) Tax Fees
The aggregate fees paid to the principal accountant for professional services rendered by the principal accountant to the registrant for tax compliance, tax advice and tax planning were $4,445 for the fiscal year ended May 31, 2017 and $4,299 for the fiscal year ended May 31, 2016. The services for which these fees were paid include identifying passive foreign investment companies to manage exposure to tax liabilities.
The aggregate fees paid to the principal accountant for professional services rendered by the principal accountant to the registrant’s investment adviser and any entity controlling, controlled by or under common control with the investment adviser that provides ongoing services to the registrant for tax compliance, tax advice and tax planning were $75,060 for the fiscal year ended May 31, 2017 and $114,500 for the fiscal year ended May 31, 2016. The services for which these fees were paid included technical tax consultation for withholding tax report to foreign governments, application of local country tax laws and tax advice.
(d) All Other Fees
There were no fees paid to the principal accountant for products and services rendered by the principal accountant to the registrant not reported in paragraphs (a)-(c) of Item 4.
There were no fees paid to the principal accountant for products and services rendered by the principal accountant to the registrant’s investment adviser and any entity controlling, controlled by or under common control with the investment adviser that provides ongoing services to the registrant other than the services reported in paragraphs (a)-(c) of Item 4.
(e) (1) The registrant’s audit committee is directly responsible for approving the services to be provided by the auditors, including:
(i) pre-approval of all audit and audit related services;
(ii) pre-approval of all non-audit related services to be provided to the Fund by the auditors;
(iii) pre-approval of all non-audit related services to be provided to the registrant by the auditors to the registrant’s investment adviser or to any entity that controls, is controlled by or is under common control with the registrant’s investment adviser and that provides ongoing services to the registrant where the non-audit services relate directly to the operations or financial reporting of the registrant; and
(iv) establishment by the audit committee, if deemed necessary or appropriate, as an alternative to committee pre-approval of services to be provided by the auditors, as required by paragraphs (ii) and (iii) above, of policies and procedures to permit such services to be pre-approved by other means, such as through establishment of guidelines or by action of a designated member or members of the committee; provided the policies and procedures are detailed as to the particular service and the committee is informed of each service and such policies and procedures do not include delegation of audit committee responsibilities, as contemplated under the Securities Exchange Act of 1934, to management; subject, in the case of (ii) through (iv), to any waivers, exceptions or exemptions that may be available under applicable law or rules.
(e) (2) None of the services provided to the registrant described in paragraphs (b)-(d) of Item 4 were approved by the audit committee pursuant to paragraph (c)(7)(i)(C) of Rule 2-01 of regulation S-X.
(f) No disclosures are required by this Item 4(f).
(g) The aggregate non-audit fees paid to the principal accountant for services rendered by the principal accountant to the registrant and the registrant’s investment adviser and any entity controlling, controlled by or under common control with the investment adviser that provides ongoing services to the registrant were $79,505 for the fiscal year ended May 31, 2017 and $118,799 for the fiscal year ended May 31, 2016.
(h) The registrant’s audit committee of the board has considered whether the provision of non-audit services that were rendered to the registrant’s investment adviser (not including any sub-adviser whose role is primarily portfolio management and is subcontracted with or overseen by another investment adviser), and any entity controlling, controlled by, or under common control with the investment adviser that provides ongoing services to the registrant that were not pre-approved pursuant to paragraph (c)(7)(ii) of Rule 2-01 of Regulation S-X is compatible with maintaining the principal accountant’s independence.
Item 5. Audit Committee of Listed Registrants.
N/A
Item 6. Schedule of Investments.
N/A
Item 7. Disclosure of Proxy Voting Policies and Procedures for Closed-End Management Investment Companies.
N/A
Item 8. Portfolio Managers of Closed-End Management Investment Companies.
N/A
Item 9. Purchases of Equity Securities by Closed-End Management Investment Company and Affiliated Purchasers.
N/A
Item 10. Submission of Matters to a Vote of Security Holders.
There have been no changes to the procedures by which shareholders may recommend nominees to the Registrant’s Board of Trustees that would require disclosure herein.
Item 11. Controls and Procedures.
(a) Evaluation of Disclosure Controls and Procedures. The Registrant maintains disclosure controls and procedures that are designed to ensure that information required to be disclosed in the Registrant’s filings under the Securities Exchange Act of 1934 and the Investment Company Act of 1940 is recorded, processed, summarized and reported within the periods specified in the rules and forms of the Securities and Exchange Commission. Such information is accumulated and communicated to the Registrant’s management, including its principal executive officer and principal financial officer, as appropriate, to allow timely decisions regarding required disclosure. The Registrant’s management, including the principal executive officer and the principal financial officer, recognizes that any set of controls and procedures, no matter how well designed and operated, can provide only reasonable assurance of achieving the desired control objectives.
Within 90 days prior to the filing date of this Shareholder Report on Form N-CSR, the Registrant had carried out an evaluation, under the supervision and with the participation of the Registrant’s management, including the Registrant’s principal executive officer and the Registrant’s principal financial officer, of the effectiveness of the design and operation of the Registrant’s disclosure controls and procedures. Based on such evaluation, the Registrant’s principal executive officer and principal financial officer concluded that the Registrant’s disclosure controls and procedures are effective.
(b) Changes in Internal Controls. There have been no changes in the Registrant’s internal controls or in other factors that could materially affect the internal controls over financial reporting subsequent to the date of their evaluation in connection with the preparation of this Shareholder Report on Form N-CSR.
Item 12. Exhibits.
(a) (1) Code of Ethics
(a) (2) Certifications pursuant to Section 302 of the Sarbanes-Oxley Act of 2002 of Matthew T. Hinkle, Chief Executive Officer - Finance and Administration, and Robert G. Kubilis, Chief Financial Officer and Chief Accounting Officer
(b) Certifications pursuant to Section 906 of the Sarbanes-Oxley Act of 2002 of Matthew T. Hinkle, Chief Executive Officer - Finance and Administration, and Robert G. Kubilis, Chief Financial Officer and Chief Accounting Officer
SIGNATURES
Pursuant to the requirements of the Securities Exchange Act of 1934 and the Investment Company Act of 1940, the registrant has duly caused this report to be signed on its behalf by the undersigned, thereunto duly authorized.
| FRANKLIN ALTERATIVE STRATEGIES FUNDS | ||
| By | /s/ Matthew T. Hinkle | |
| Matthew T. Hinkle | ||
Chief Executive Officer - Finance and Administration | ||
| Date July 27, 2017 | ||
Pursuant to the requirements of the Securities Exchange Act of 1934 and the Investment Company Act of 1940, this report has been signed below by the following persons on behalf of the registrant and in the capacities and on the dates indicated.
| By | /s/ Matthew T. Hinkle | |
| Matthew T. Hinkle | ||
Chief Executive Officer - Finance and Administration | ||
| Date July 27, 2017 | ||
| By | /s/ Robert G. Kubilis | |
| Robert G. Kubilis | ||
Chief Financial Officer and Chief Accounting Officer | ||
| Date July 27, 2017 | ||