UNITED STATES
SECURITIES AND EXCHANGE COMMISSION
Washington, DC 20549
FORM N-CSR
CERTIFIED SHAREHOLDER REPORT OF REGISTERED MANAGEMENT INVESTMENT COMPANIES
Investment Company Act file number_811-22641
__Franklin Alternative Strategies Funds
(Exact name of registrant as specified in charter)
One Franklin Parkway, San Mateo, CA 94403-1906
(Address of principal executive offices) (Zip code)
Craig S. Tyle, One Franklin Parkway, San Mateo, CA 94403-1906
(Name and address of agent for service)
Registrant's telephone number, including area code: _650 312-2000
Date of fiscal year end: 5/31
Date of reporting period: _5/31/15
Item 1. Reports to Stockholders.
Franklin Templeton Investments
Gain From Our Perspective®
At Franklin Templeton Investments, we’re dedicated to one goal: delivering exceptional asset management for our clients. By bringing together multiple, world-class investment teams in a single firm, we’re able to offer specialized expertise across styles and asset classes, all supported by the strength and resources of one of the world’s largest asset managers. This has helped us to become a trusted partner to individual and institutional investors across the globe.
Focus on Investment Excellence
At the core of our firm, you’ll find multiple independent investment teams—each with a focused area of expertise—from traditional to alternative strategies and multi-asset solutions. And because our portfolio groups operate autonomously, their strategies can be combined to deliver true style and asset class diversification.
All of our investment teams share a common commitment to excellence grounded in rigorous, fundamental research and robust, disciplined risk management. Decade after decade, our consistent, research-driven processes have helped Franklin Templeton earn an impressive record of strong, long-term results.
Global Perspective Shaped by Local Expertise
In today’s complex and interconnected world, smart investing demands a global perspective. Franklin Templeton pioneered international investing over 60 years ago, and our expertise in emerging markets spans more than a quarter of a century. Today, our investment professionals are on the ground across the globe, spotting investment ideas and potential risks firsthand. These locally based teams bring in-depth understanding of local companies, economies and cultural nuances, and share their best thinking across our global research network.
Strength and Experience
Franklin Templeton is a global leader in asset management serving clients in over 150 countries.1 We run our business with the same prudence we apply to asset management, staying focused on delivering relevant investment solutions, strong long-term results and reliable, personal service. This approach, focused on putting clients first, has helped us to become one of the most trusted names in financial services.
1. As of 12/31/14. Clients are represented by the total number of shareholder accounts.
Not FDIC Insured | May Lose Value | No Bank Guarantee
| Contents | |
| Shareholder Letter | 1 |
| Annual Report | |
| Franklin K2 Alternative Strategies | |
| Fund | 3 |
| Performance Summary | 7 |
| Your Fund’s Expenses | 12 |
| Consolidated Financial Highlights and | |
| Consolidated Statement of | |
| Investments | 14 |
| Consolidated Financial Statements | 73 |
| Notes to Consolidated Financial | |
| Statements | 77 |
| Report of Independent Registered | |
| Public Accounting Firm | 94 |
| Tax Information | 95 |
| Board Members and Officers | 96 |
| Shareholder Information | 101 |
| franklintempleton.com | |
Annual Report
Franklin K2 Alternative Strategies Fund
We are pleased to bring you Franklin K2 Alternative Strategies Fund’s annual report for the fiscal year ended May 31, 2015.
Your Fund’s Goal and Main Investments
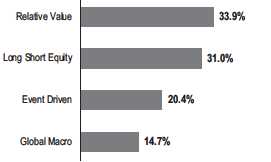
The Fund seeks capital appreciation with lower volatility relative to the broad equity markets. The Fund seeks to achieve its investment goal by allocating its assets across multiple non-traditional or “alternative” strategies, including but not limited to long short equity, relative value, event driven and global macro. The Fund is structured as a multi-manager fund, meaning the Fund’s assets are independently managed by multiple investment managers (subadvisors), while the Fund’s investment manager retains overall responsibility for the Fund’s investments. The Fund may invest in a wide range of securities and other investments including, but not limited to: equity securities including common stocks, preferred stocks, convertible securities, rights and warrants, private and registered investment vehicles and exchange-traded funds (ETFs); and debt securities including bonds, notes, debentures, banker’s acceptances and commercial paper; loans and loan participations; and mortgage-backed or other asset-backed securities, including collateralized debt obligations; as well as derivatives, commodities and currencies.
Performance Overview
The Fund’s Class A shares delivered a +5.53% cumulative total return for the 12 months under review. For comparison, the Fund’s primary benchmark, the BofA Merrill Lynch 3-Month U.S. Treasury Bill (T-Bill) Index, which tracks the performance of short-term U.S. government securities with a remaining term to final maturity of less than three months, posted a +0.02% total return.1 Also for comparison, the Fund’s secondary benchmark, the HFRX Global Hedge Fund Index, which is designed to be representative of the overall composition of the hedge fund universe, produced a +1.11% total return.2 You can find more of the Fund’s performance data in the Performance Summary beginning on page 7.
Performance data represent past performance, which does not guarantee future results. Investment return and principal value will fluctuate, and you may have a gain or loss when you sell your shares. Current performance may differ from figures
shown. Please visit franklintempleton.com or call (800) 342-5236 for most recent month-end performance.
Strategy Allocation
Based on Total Investments as of 5/31/15
Economic and Market Overview
The global economy expanded moderately during the 12 months under review despite slowing growth in some countries. As measured by the MSCI World Index, stocks in global developed markets advanced overall during the 12-month period amid a generally accommodative monetary policy environment and signs of economic improvement in Europe and Japan. Prices of oil and other commodities declined sharply during the 12-month period owing largely to strong global supply.
U.S. economic growth moderated, especially in the second half of the period. In 2015’s first quarter, low energy prices, U.S. dollar strength and a labor dispute at West Coast ports led exports to decline. Lower business investment and state and local government spending also weighed on the economy, while increases in consumer spending and private inventory investment offered some support. In October, the U.S. Federal Reserve Board (Fed) ended its expansion of its bond buying program and kept its target interest rate at 0%–0.25% while considering when it might be appropriate to raise it. In its April meeting, the Fed attributed the economy’s first-quarter slowdown to transitory factors. The Fed reiterated that it would raise interest rates when it saw further improvement in the labor market and was reasonably confident that inflation would move back to its 2% objective over the medium term.
1. Source: Morningstar.
2. Source: FactSet. Hedge Fund Research, Inc. – www.hedgefundresearch.com. The HFRX Global Hedge Fund Index is being used under license from Hedge Fund
Research, Inc., which does not endorse or approve of any of the contents of this report.
The indexes are unmanaged and include reinvestment of any income or distributions. One cannot invest directly in an index, and an index is not representative of the Fund’s portfolio.
See www.franklintempletondatasources.com for additional data provider information.
The dollar value, number of shares or principal amount, and names of all portfolio holdings are listed in the Fund’s Consolidated Statement of Investments (SOI).
The Consolidated SOI begins on page 19.
franklintempleton.com
Annual Report
3
FRANKLIN K2 ALTERNATIVE STRATEGIES FUND
Outside the U.S., the U.K. economy grew relatively well through 2014, aided by the services and manufacturing sectors but moderated in 2015’s first quarter as the construction, mining and agriculture sectors contracted. Near period-end, the Conservative Party’s unexpected victory in the U.K. general elections supported investor sentiment. In the eurozone, economic growth improved during the 12-month period. Spain expanded at a solid pace, and France and Italy returned to growth in 2015’s first quarter. However, Germany, the region’s largest economy, slowed during the first quarter amid sluggish exports. In June and September 2014, the European Central Bank (ECB) reduced interest rates. The ECB also expanded asset purchases to boost inflation and the economy. The region was adversely affected by deflationary pressures and the crisis in Ukraine; however it, benefited from lower oil prices, a weaker euro that helped exports, the ECB’s accommodative policy and an improved 2015 eurozone growth forecast.
The Bank of Japan (BOJ) broadened its stimulus measures amid weak domestic demand and lower inflation. In December, Japan’s ruling coalition was reelected and announced a new stimulus package to revive economic growth. The country exited recession in the fourth quarter, supported largely by exports. The Japanese economy continued to grow in 2015’s first quarter, driven by an increase in private demand as business investment and private consumption rose. Near period-end, the BOJ lowered its economic growth and inflation forecasts and maintained its monetary policy.
In emerging markets, economic growth generally moderated. Brazil continued to face headwinds such as high inflation, lower commodity prices and a severe drought. To reduce a widening fiscal deficit and regain investors’ confidence after a first-quarter 2015 decline in growth, Brazil’s government approved austerity measures that curbed social security and labor benefits. Central bank actions varied across emerging markets, as some banks raised interest rates in response to rising inflation and weakening currencies, while others lowered interest rates to promote economic growth. In the recent global environment, emerging market stocks, as measured by the MSCI Emerging Markets Index, were fairly flat for the 12-month period.
Investment Strategy
We manage the Fund using a multi-manager approach. While we are responsible for the Fund’s overall investments, we allocate assets to multiple subadvisors, each of whom independently manages a separate portion of the Fund’s portfolio in accordance with some or all of the following strategies: long short equity, relative value, event driven and global macro. We allocate the Fund’s assets among these strategies utilizing a top-down
approach, generating the Fund’s strategy weightings by taking into account market conditions, risk factors, diversification, liquidity, transparency, and availability of various subadvisors and other investment options, among other things. The allocations to specific subadvisors may change from time to time based upon our assessment of their correlations to various markets and to each other, their risk profiles and return expectations. Long short equity strategies generally seek to produce returns from investments in the equity markets by taking long and short positions in stocks and common stock indexes (through the use of derivatives or through a short position in an ETF). Relative value strategies encompass a wide range of investment techniques that are intended to profit from pricing inefficiencies. Event driven strategies generally invest in securities of companies undergoing significant corporate events. Global macro strategies generally focus on broad-based economic opportunities across numerous markets and investments.
The Fund may take long and/or short positions in a wide range of asset classes, including equities, fixed income, commodities and currencies, among others. Long positions benefit from an increase in the price of the underlying instrument or asset class, while short positions benefit from a decrease in that price. The Fund may use derivatives for hedging and nonhedging (investment) purposes. Such derivative investments may include futures contracts, swaps, options and currency forward contracts. The Fund may engage in active and frequent trading as part of its investment strategies.
What is a futures contract?
A futures contract, or a future, is an agreement between the Fund and a counterparty made through a U.S. or foreign futures exchange to buy or sell an underlying instrument or asset at a specific price on a future date.
What is a swap agreement?
A swap agreement, such as an equity total return swap, is a contract between the Fund and a counterparty to exchange on a future date the returns, or differentials in rates of return, that would have been earned or realized if a notional amount were invested in specific instruments.
A credit default swap, or CDS, is an agreement between two parties whereby the buyer receives credit protection from the seller. The buyer makes periodic payments over the term of the agreement in return for a payment by the seller in the event of a default or other credit event.
An interest-rate swap is an agreement between two parties to exchange interest rate obligations, generally one based on an interest rate fixed to maturity and the other based on an interest rate that changes in accordance with changes in a designated benchmark (for example, LIBOR, prime, commercial paper or other benchmarks).
4 Annual Report
franklintempleton.com
FRANKLIN K2 ALTERNATIVE STRATEGIES FUND
What is an option?
An option is a contract to buy or sell a specific financial product known as the option’s underlying instrument at a specific price. The buyer of an option has the right, but not the obligation, to buy or sell the underlying instrument at or until a specified expiration date. Conversely, the seller (writer) of an option who opens a transaction is obligated to buy or sell the underlying instrument should the option holder exercise that right.
What is a currency forward contract?
A currency forward contract, or currency forward, is an agreement between the Fund and a counterparty to buy or sell a foreign currency at a specific exchange rate on a future date.
Manager’s Discussion
All four strategies in which the Fund’s assets were allocated contributed to performance for the period, led by long short equity and global macro.
The Fund’s long short equity strategy managers were Chilton Investment Company, Impala Asset Management, Independence Capital Asset Partners, Jennison Associates and Wellington Management Company. During this period, we removed Independence Capital from the Fund. Following a period of underperformance, the manager decided to close its firm. In aggregate, all five subadvisors contributed positive performance for the period, led by Jennison and Wellington.
For Jennison, stock selection in health care aided returns, largely due to long holdings in biotechnology and pharmaceutical companies. A series of successful Food and Drug Administration trials, favorable drug pricing trends and a wave of acquisition activity helped drive positive performance. For Wellington, exposures in technology and consumer non-cyclicals drove positive returns, as did several holdings tied to the business services industry. Continued industry consolidation, specifically linked to the business process solutions segment, served as a positive catalyst during the period.
Overall, the managers generally benefited from an improving relative return environment where stock price dispersion created opportunities to potentially gain from both long and short positions. For example, when oil prices declined in October, energy companies with low cost structures were not as sensitive to the decline as high cost producers. Capital goods companies, whose growth had been driven by oil price increases, came under pressure. Conversely, airlines, cruise lines and shippers benefited from cheaper crude oil.
| Subadvisors |
| 5/31/15 |
| Long Short Equity |
| Chilton Investment Company, LLC |
| Impala Asset Management, LLC |
| Jennison Associates, LLC |
| Wellington Management Company, LLP |
| Event Driven |
| P. Schoenfeld Asset Management L.P. |
| York Registered Holdings, L.P. |
| Relative Value |
| Basso Capital Management, L.P. |
| Chatham Asset Management, LLC |
| Lazard Asset Management, LLC |
| Loomis Sayles & Company, L.P. |
| Global Macro |
| EMSO Partners Limited |
| Graham Capital Management, L.P. |
Equity index hedging across all five managers in the strategy weighed on returns. Hedges significantly detracted as equity markets broadly continued to rally over the reporting period. Additionally, a number of long positions in the energy sector suffered large losses amid a crude oil price decline during 2014’s fourth quarter. Although managers held limited exposures to direct oil exploration and production companies, holdings in several energy services firms detracted from performance due to falling end-market demand trends. Long exposure to the Chinese gaming segment, particularly through casino resort positions, also hindered the Fund as anti-corruption and regulatory efforts in the region threatened Macau-based revenues.
Net and gross exposures within the long short strategy remained relatively unchanged throughout the period. Managers maintained elevated gross and net exposures but sought to take advantage of market volatility to reposition their portfolios in new opportunities as old holdings approached their respective price targets.
What is net exposure?
Net exposure is the percentage difference between a hedge fund’s long and short exposure, and is a measure of a fund’s exposure to market fluctuations. A fund has a net long, or bullish, exposure if the percentage invested in long positions exceeds the percentage invested in short positions, and has a net short, or bearish, position if short positions exceed long positions. If the percentage invested in long positions equals the investment in short positions, net exposure is zero or neutral.
| franklintempleton.com | Annual Report | 5 |
FRANKLIN K2 ALTERNATIVE STRATEGIES FUND
What is gross exposure?
Gross exposure equals the value of long positions and short positions, and can be expressed either in dollar terms or percentage terms. It indicates total exposure to financial markets and provides an insight into the investment amount at risk from market fluctuations. The higher the gross exposure, the bigger the potential loss (or gain).
Our global macro exposure was primarily through assets managed by Graham Capital Management, though we added a small portion through EMSO Partners Limited in the period’s final two months. Graham contributed measurably to performance, while EMSO had a flat result. Graham’s tactical trend-following strategy performed well due to strong trends across asset classes. Developed market fixed income securities generally rallied throughout the period largely as a result of accommodative monetary policy from central banks and decreases in growth expectations. The U.S. dollar rallied significantly due to expectations for the Fed to begin tightening policy in 2015. Short commodities positioning contributed, particularly in energy where oil prices fell substantially. Long equity positioning contributed modestly as equity prices generally appreciated. Graham gave back some of these gains last April mostly due to a sharp reversal in trends. However, its risk-management framework helped limit the extent of the losses.
The Fund’s event driven strategy managers were P. Schoenfeld Asset Management and York Registered Holdings. Although the strategy delivered positive performance for the period, returns reflected elevated levels of volatility, particularly in 2014’s latter half. For the year under review, P. Schoenfeld had a modest negative return, while York produced a solid gain. Positive performance drivers for the period were diverse, and included a number of one-time company events such as mergers, restructurings and special dividends for companies in a variety of sectors including technology, communications and consumer noncyclical. Conversely, detractors were concentrated among several announced mergers that failed to reach completion, most notably in the pharmaceutical and telecommunication sectors. The resulting negative performance from these sectors significantly pared gains elsewhere in the strategy’s portfolio, with portfolio-level hedges further adding to losses.
Our relative value strategy managers were Basso Capital Management, Chatham Asset Management, Lazard Asset Management and Loomis Sayles & Company. In aggregate, the strategy delivered a modest positive return for the period with three of the four subadvisors (Basso, Lazard and Loomis Sayles) contributing to performance. Chatham was the only manager to post a decline, as its exposures to corporate bonds in the communications and energy sectors dragged on returns. Loomis
Sayles produced gains mostly though currency forwards, convertible bonds and corporate bonds, while bond futures detracted. Overall, increased fixed income market volatility in late 2014 hampered the strategy, although its effects varied by manager. Hedged investments in fixed income and convertible bond strategies seemed to fare better in the volatile environment, while allocations with greater market exposure were negatively affected. Results in early 2015 were stronger for all of the managers in the group, as high yield, convertible bonds and fixed income strategies were all positive. Conversely, hedges held within this manager group detracted during the period.
Thank you for your participation in Franklin K2 Alternative Strategies Fund. We look forward to continuing to serve your investment needs.

The foregoing information reflects our analysis, opinions and portfolio holdings as of May 31, 2015, the end of the reporting period. The way we implement our main investment strategies and the resulting portfolio holdings may change depending on factors such as market and economic conditions. These opinions may not be relied upon as investment advice or an offer for a particular security. The information is not a complete analysis of every aspect of any market, country, industry, security or the Fund. Statements of fact are from sources considered reliable, but the investment manager makes no representation or warranty as to their completeness or accuracy. Although historical performance is no guarantee of future results, these insights may help you understand our investment management philosophy.
6 Annual Report
franklintempleton.com
FRANKLIN K2 ALTERNATIVE STRATEGIES FUND
Performance Summary as of May 31, 2015
Your dividend income will vary depending on dividends or interest paid by securities in the Fund’s portfolio, adjusted for operating expenses of each class. Capital gain distributions are net profits realized from the sale of portfolio securities. The performance table and graphs do not reflect any taxes that a shareholder would pay on Fund dividends, capital gain distributions, if any, or any realized gains on the sale of Fund shares. Total return reflects reinvestment of the Fund’s dividends and capital gain distributions, if any, and any unrealized gains or losses.
| Net Asset Value | ||||||
| Share Class (Symbol) | 5/31/15 | 5/31/14 | Change | |||
| A (FAAAX) | $ | 11.16 | $ | 10.64 | +$ | 0.52 |
| C (FASCX) | $ | 11.09 | $ | 10.60 | +$ | 0.49 |
| R (FSKKX) | $ | 11.15 | $ | 10.62 | +$ | 0.53 |
| R6 (FASRX) | $ | 11.18 | $ | 10.66 | +$ | 0.52 |
| Advisor (FABZX) | $ | 11.18 | $ | 10.65 | +$ | 0.53 |
| Distributions (6/1/14–5/31/15) | ||
| Dividend | ||
| Share Class | Income | |
| A | $ | 0.0668 |
| C | $ | 0.0258 |
| R | $ | 0.0408 |
| R6 | $ | 0.0952 |
| Advisor | $ | 0.0930 |
franklintempleton.com
Annual Report
7
| FRANKLIN K2 ALTERNATIVE STRATEGIES FUND |
| PERFORMANCE SUMMARY |
Performance as of 5/31/151
Cumulative total return excludes sales charges. Average annual total returns and value of $10,000 investment include maximum sales charges. Class A: 5.75% maximum initial sales charge; Class C: 1% contingent deferred sales charge in first year only;
Class R/R6/Advisor Class: no sales charges.
| Average Annual | Total Annual Operating Expenses6 | ||||||||||||||
| Cumulative | Average Annual | Value of $10,000 | Total Return | ||||||||||||
| Share Class | Total Return2 | Total Return3 | Investment4 | (6/30/15 | )5 | (with waiver) | (without waiver) | ||||||||
| A | 2.82 | % | 3.71 | % | |||||||||||
| 1-Year | + | 5.53 | % | -0.54 | % | $ | 9,946 | -3.17 | % | ||||||
| Since Inception (10/11/13) | + | 12.73 | % | + | 3.77 | % | $ | 10,625 | + | 2.78 | % | ||||
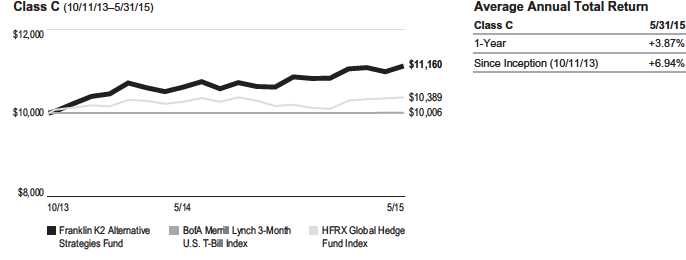
| C | 3.52 | % | 4.41 | % | |||||||||||
| 1-Year | + | 4.87 | % | + | 3.87 | % | $ | 10,387 | + | 1.11 | % | ||||
| Since Inception (10/11/13) | + | 11.60 | % | + | 6.94 | % | $ | 11,160 | + | 5.70 | % | ||||
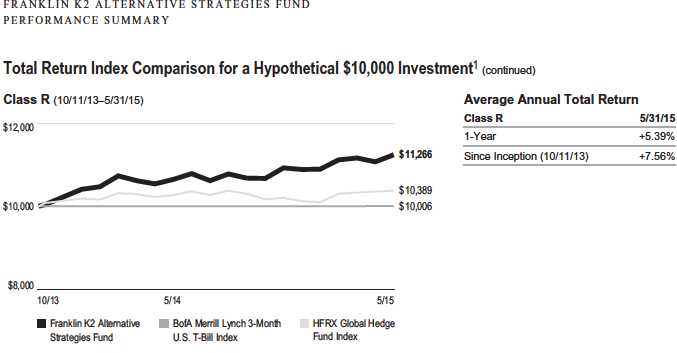
| R | 3.02 | % | 3.91 | % | |||||||||||
| 1-Year | + | 5.39 | % | + | 5.39 | % | $ | 10,539 | + | 2.15 | % | ||||
| Since Inception (10/11/13) | + | 12.66 | % | + | 7.56 | % | $ | 11,266 | + | 5.90 | % | ||||
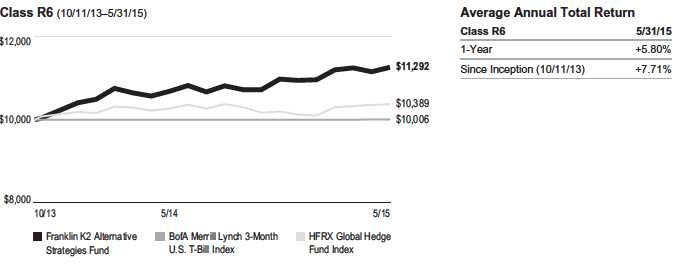
| R6 | 2.45 | % | 3.34 | % | |||||||||||
| 1-Year | + | 5.80 | % | + | 5.80 | % | $ | 10,580 | + | 3.12 | % | ||||
| Since Inception (10/11/13) | + | 12.92 | % | + | 7.71 | % | $ | 11,292 | + | 6.71 | % | ||||
| Advisor | 2.52 | % | 3.41 | % | |||||||||||
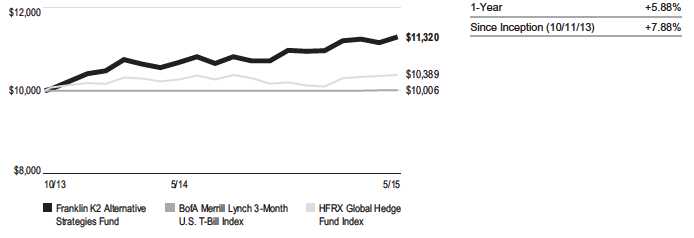
| 1-Year | + | 5.88 | % | + | 5.88 | % | $ | 10,588 | + | 3.19 | % | ||||
| Since Inception (10/11/13) | + | 13.20 | % | + | 7.88 | % | $ | 11,320 | + | 6.70 | % | ||||
Performance data represent past performance, which does not guarantee future results. Investment return and principal value will fluctuate, and you may have a gain or loss when you sell your shares. Current performance may differ from figures shown. For most recent month-end performance, go to franklintempleton.com or call (800) 342-5236.
8 Annual Report
franklintempleton.com
| FRANKLIN K2 ALTERNATIVE STRATEGIES FUND |
| PERFORMANCE SUMMARY |
Total Return Index Comparison for a Hypothetical $10,000 Investment1
Total return represents the change in value of an investment over the periods shown. It includes any applicable maximum sales charge, Fund expenses, account fees and reinvested distributions. The unmanaged indexes include reinvestment of any income or distributions. These differ from the Fund in composition and do not pay management fees or expenses. One cannot invest directly in an index.
franklintempleton.com
Annual Report
9
10 Annual Report
franklintempleton.com
| FRANKLIN K2 ALTERNATIVE STRATEGIES FUND | ||
| PERFORMANCE SUMMARY | ||
| Total Return Index Comparison for a Hypothetical $10,000 Investment1 (continued) | ||
| Advisor Class (10/11/13–5/31/15) | Average Annual Total Return | |
| Advisor Class | 5/31/15 | |
All investments involve risks, including possible loss of principal. The market values of securities owned by the Fund will go up or down, sometimes rapidly or unpredictably. The Fund’s performance depends on the manager’s skill in selecting, overseeing, and allocating Fund assets. The Fund is actively managed and could experience losses if the investment manager’s and subadvisors’ judgment about particular investments made for the Fund’s portfolio prove to be incorrect. Some subadvisors may have little or no experience managing the assets of a registered investment company. Foreign investments are subject to greater investment risk such as political, economic, credit and information risks as well as risk of currency fluctuations. Investments in derivatives involve costs and can create economic leverage, which may result in significant volatility and cause the Fund to participate in losses (as well as gains) that significantly exceed the Fund’s initial investment. Currency management strategies could result in losses to the Fund if currencies do not perform as the investment manager or subadvisor expects. Lower rated or high yield debt securities involve greater credit risk, including the possibility of default or bankruptcy. The Fund may make short sales of securities, which involves the risk that losses may exceed the original amount invested. Merger arbitrage investments risk loss if a proposed reorganization in which the Fund invests is renegotiated or terminated. Liquidity risk exists when securities have become more difficult to sell at the price at which the Fund has valued the securities. The Fund’s prospectus also includes a description of the main investment risks.
Class C: Class R: Class R6: Advisor Class: | These shares have higher annual fees and expenses than Class A shares. Shares are available to certain eligible investors as described in the prospectus. These shares have higher annual fees and expenses than Class A shares. Shares are available to certain eligible investors as described in the prospectus. Shares are available to certain eligible investors as described in the prospectus. |
1. The Fund has an expense reduction contractually guaranteed through at least 9/30/15 and a fee waiver related to the management fee paid by a subsidiary. Fund invest-
ment results reflect the expense reduction and fee waiver, to the extent applicable; without these reductions, the results would have been lower.
2. Cumulative total return represents the change in value of an investment over the periods indicated.
3. Average annual total return represents the average annual change in value of an investment over the periods indicated.
4. These figures represent the value of a hypothetical $10,000 investment in the Fund over the periods indicated.
5. In accordance with SEC rules, we provide standardized average annual total return information through the latest calendar quarter.
6. Figures are as stated in the Fund’s current prospectus. In periods of market volatility, assets may decline significantly, causing total annual Fund operating expenses to
become higher than the figures shown.
7. Source: Morningstar. The BofA Merrill Lynch 3-Month U.S. T-Bill Index is an index of short-term U.S. government securities with a remaining term to final maturity of less
than three months.
8. Source: Factset. Hedge Fund Research, Inc. – www.hedgefundresearch.com. The HFRX Global Hedge Fund Index is being used under license from Hedge Fund
Research, Inc., which does not endorse or approve of any of the contents of this report. The HFRX Global Hedge Fund Index is designed to be representative of the overall
composition of the hedge fund universe. It is composed of all eligible hedge fund strategies, including but not limited to convertible arbitrage, distressed securities, equity
hedge, equity market neutral, event driven, macro, merger arbitrage and relative value arbitrage. The strategies are asset weighted based on the distribution of assets in the
hedge fund industry.
See www.franklintempletondatasources.com for additional data provider information.
franklintempleton.com
Annual Report
11
FRANKLIN K2 ALTERNATIVE STRATEGIES FUND
Your Fund’s Expenses
As a Fund shareholder, you can incur two types of costs:
- Transaction costs, including sales charges (loads) on Fund purchases; and
- Ongoing Fund costs, including management fees, distribution and service (12b-1) fees, and other Fund expenses. All mutual funds have ongoing costs, sometimes referred to as operating expenses.
The following table shows ongoing costs of investing in the Fund and can help you understand these costs and compare them with those of other mutual funds. The table assumes a $1,000 investment held for the six months indicated.
Actual Fund Expenses
The first line (Actual) for each share class listed in the table provides actual account values and expenses. The “Ending Account Value” is derived from the Fund’s actual return, which includes the effect of Fund expenses.
You can estimate the expenses you paid during the period by following these steps. Of course, your account value and expenses will differ from those in this illustration:
1. Divide your account value by $1,000.
If an account had an $8,600 value, then $8,600 ÷ $1,000 = 8.6.
2. Multiply the result by the number under the heading “Expenses Paid During Period.”
If Expenses Paid During Period were $7.50, then 8.6 × $7.50 = $64.50.
In this illustration, the estimated expenses paid this period are $64.50.
Hypothetical Example for Comparison with Other Funds
Information in the second line (Hypothetical) for each class in the table can help you compare ongoing costs of investing in the Fund with those of other mutual funds. This information may not be used to estimate the actual ending account balance or expenses you paid during the period. The hypothetical “Ending Account Value” is based on the actual expense ratio for each class and an assumed 5% annual rate of return before expenses, which does not represent the Fund’s actual return. The figure under the heading “Expenses Paid During Period” shows the hypothetical expenses your account would have incurred under this scenario. You can compare this figure with the 5% hypothetical examples that appear in shareholder reports of other funds.
Please note that expenses shown in the table are meant to highlight ongoing costs and do not reflect any transaction costs, such as sales charges. Therefore, the second line for each class is useful in comparing ongoing costs only, and will not help you compare total costs of owning different funds. In addition, if transaction costs were included, your total costs would have been higher. Please refer to the Fund prospectus for additional information on operating expenses.
12 Annual Report
franklintempleton.com
FRANKLIN K2 ALTERNATIVE STRATEGIES FUND
YOUR FUND’S EXPENSES
| Beginning Account | Ending Account | Expenses Paid During | ||||
| Share Class | Value 12/1/14 | Value 5/31/15 | Period* 12/1/14–5/31/15 | |||
| A | ||||||
| Actual | $ | 1,000 | $ | 1,028.30 | $ | 14.51 |
| Hypothetical (5% return before expenses) | $ | 1,000 | $ | 1,010.62 | $ | 14.39 |
| C | ||||||
| Actual | $ | 1,000 | $ | 1,024.60 | $ | 17.92 |
| Hypothetical (5% return before expenses) | $ | 1,000 | $ | 1,007.23 | $ | 17.77 |
| R | ||||||
| Actual | $ | 1,000 | $ | 1,026.80 | $ | 15.46 |
| Hypothetical (5% return before expenses) | $ | 1,000 | $ | 1,009.67 | $ | 15.33 |
| R6 | ||||||
| Actual | $ | 1,000 | $ | 1,029.00 | $ | 12.60 |
| Hypothetical (5% return before expenses) | $ | 1,000 | $ | 1,012.52 | $ | 12.49 |
| Advisor | ||||||
| Actual | $ | 1,000 | $ | 1,029.80 | $ | 12.96 |
| Hypothetical (5% return before expenses) | $ | 1,000 | $ | 1,012.17 | $ | 12.84 |
*Expenses are calculated using the most recent six-month expense ratio, net of expense waivers, annualized for each class (A: 2.87%; C: 3.55%;
R: 3.06%; R6: 2.49% and Advisor: 2.56%), multiplied by the average account value over the period, multiplied by 182/365 to reflect the one-half
year period.
franklintempleton.com
Annual Report
13
| FRANKLIN ALTERNATIVE STRATEGIES FUNDS | ||||||
| Consolidated Financial Highlights | ||||||
| Franklin K2 Alternative Strategies Fund | ||||||
| Year End May 31, | ||||||
| 2015 | 2014 | a | ||||
| Class A | �� | |||||
| Per share operating performance | ||||||
| (for a share outstanding throughout the year) | ||||||
| Net asset value, beginning of year | $ | 10.64 | $ | 10.00 | ||
| Income from investment operationsb: | ||||||
| Net investment income (loss)c | (0.11 | ) | (0.02 | ) | ||
| Net realized and unrealized gains (losses) | 0.70 | 0.70 | ||||
| Total from investment operations | 0.59 | 0.68 | ||||
| Less distributions from net investment income | (0.07 | ) | (0.04 | ) | ||
| Net asset value, end of year | $ | 11.16 | $ | 10.64 | ||
| Total returnd | 5.53 | % | 6.82 | % | ||
| Ratios to average net assetse | ||||||
| Expenses before waiver, payments by affiliates and expense reductionf | 3.40 | % | 3.33 | % | ||
| Expenses net of waiver, payments by affiliates and expense reductionf | 2.99 | %g | 2.83 | % | ||
| Expenses incurred in connection with securities sold short | 0.65 | % | 0.56 | % | ||
| Net investment income (loss) | (0.95 | )% | (0.35 | )% | ||
| Supplemental data | ||||||
| Net assets, end of year (000’s) | $ | 148,991 | $ | 96,889 | ||
| Portfolio turnover rate | 295.81 | % | 181.06 | % | ||
aFor the period October 11, 2013 (commencement of operations) to May 31, 2014.
bThe amount shown for a share outstanding throughout the period may not correlate with the Consolidated Statement of Operations for the period due to the timing of sales
and repurchases of Fund shares in relation to income earned and/or fluctuating fair value of the investments of the Fund.
cBased on average daily shares outstanding.
dTotal return does not reflect sales commissions or contingent deferred sales charges, if applicable, and is not annualized for periods less than one year.
eRatios are annualized for periods less than one year.
fIncludes dividend and interest expense on securities sold short and security borrowing fees, if any. See below for the ratios of such expenses to average net assets for the
periods presented. See Note 1(g).
gBenefit of expense reduction rounds to less than 0.01%.
14 Annual Report | The accompanying notes are an integral part of these consolidated financial statements. franklintempleton.com
FRANKLIN ALTERNATIVE STRATEGIES FUNDS
CONSOLIDATED FINANCIAL H IGHLIGHTS
| Franklin K2 Alternative Strategies Fund (continued) | ||||||
| Year End May 31, | ||||||
| 2015 | 2014 | a | ||||
| Class C | ||||||
| Per share operating performance | ||||||
| (for a share outstanding throughout the year) | ||||||
| Net asset value, beginning of year | $ | 10.60 | $ | 10.00 | ||
| Income from investment operationsb: | ||||||
| Net investment income (loss)c | (0.17 | ) | (0.08 | ) | ||
| Net realized and unrealized gains (losses) | 0.69 | 0.72 | ||||
| Total from investment operations | 0.52 | 0.64 | ||||
| Less distributions from net investment income | (0.03 | ) | (0.04 | ) | ||
| Net asset value, end of year | $ | 11.09 | $ | 10.60 | ||
| Total returnd | 4.87 | % | 6.42 | % | ||
| Ratios to average net assetse | ||||||
| Expenses before waiver, payments by affiliates and expense reductionf | 4.04 | % | 4.03 | % | ||
| Expenses net of waiver, payments by affiliates and expense reductionf | 3.63 | %g | 3.53 | % | ||
| Expenses incurred in connection with securities sold short | 0.65 | % | 0.56 | % | ||
| Net investment income (loss) | (1.59 | )% | (1.05 | )% | ||
| Supplemental data | ||||||
| Net assets, end of year (000’s) | $ | 37,937 | $ | 16,618 | ||
| Portfolio turnover rate | 295.81 | % | 181.06 | % | ||
aFor the period October 11, 2013 (commencement of operations) to May 31, 2014.
bThe amount shown for a share outstanding throughout the period may not correlate with the Consolidated Statement of Operations for the period due to the timing of sales
and repurchases of Fund shares in relation to income earned and/or fluctuating fair value of the investments of the Fund.
cBased on average daily shares outstanding.
dTotal return does not reflect sales commissions or contingent deferred sales charges, if applicable, and is not annualized for periods less than one year.
eRatios are annualized for periods less than one year.
fIncludes dividend and interest expense on securities sold short and security borrowing fees, if any. See below for the ratios of such expenses to average net assets for the
periods presented. See Note 1(g).
gBenefit of expense reduction rounds to less than 0.01%.
franklintempleton.com The accompanying notes are an integral part of these consolidated financial statements. | Annual Report 15
FRANKLIN ALTERNATIVE STRATEGIES FUNDS
CONSOLIDATED FINANCIAL H IGHLIGHTS
| Franklin K2 Alternative Strategies Fund (continued) | ||||||
| Year End May 31, | ||||||
| 2015 | 2014 | a | ||||
| Class R | ||||||
| Per share operating performance | ||||||
| (for a share outstanding throughout the year) | ||||||
| Net asset value, beginning of year | $ | 10.62 | $ | 10.00 | ||
| Income from investment operationsb: | ||||||
| Net investment income (loss)c | (0.16 | ) | (0.05 | ) | ||
| Net realized and unrealized gains (losses) | 0.73 | 0.71 | ||||
| Total from investment operations | 0.57 | 0.66 | ||||
| Less distributions from net investment income | (0.04 | ) | (0.04 | ) | ||
| Net asset value, end of year | $ | 11.15 | $ | 10.62 | ||
| Total returnd | 5.39 | % | 6.62 | % | ||
| Ratios to average net assetse | ||||||
| Expenses before waiver, payments by affiliates and expense reductionf | 3.57 | % | 3.63 | % | ||
| Expenses net of waiver, payments by affiliates and expense reductionf | 3.16 | %g | 3.13 | % | ||
| Expenses incurred in connection with securities sold short | 0.65 | % | 0.56 | % | ||
| Net investment income (loss) | (1.12 | )% | (0.65 | )% | ||
| Supplemental data | ||||||
| Net assets, end of year (000’s) | $ | 9,173 | $ | 11,660 | ||
| Portfolio turnover rate | 295.81 | % | 181.06 | % | ||
aFor the period October 11, 2013 (commencement of operations) to May 31, 2014.
bThe amount shown for a share outstanding throughout the period may not correlate with the Consolidated Statement of Operations for the period due to the timing of sales
and repurchases of Fund shares in relation to income earned and/or fluctuating fair value of the investments of the Fund.
cBased on average daily shares outstanding.
dTotal return is not annualized for periods less than one year.
eRatios are annualized for periods less than one year.
fIncludes dividend and interest expense on securities sold short and security borrowing fees, if any. See below for the ratios of such expenses to average net assets for the
periods presented. See Note 1(g).
gBenefit of expense reduction rounds to less than 0.01%.
16 Annual Report | The accompanying notes are an integral part of these consolidated financial statements. franklintempleton.com
FRANKLIN ALTERNATIVE STRATEGIES FUNDS
CONSOLIDATED FINANCIAL H IGHLIGHTS
| Franklin K2 Alternative Strategies Fund (continued) | ||||||
| Year End May 31, | ||||||
| 2015 | 2014 | a | ||||
| Class R6 | ||||||
| Per share operating performance | ||||||
| (for a share outstanding throughout the year) | ||||||
| Net asset value, beginning of year | $ | 10.66 | $ | 10.00 | ||
| Income from investment operationsb: | ||||||
| Net investment income (loss)c | (0.08 | ) | (0.01 | ) | ||
| Net realized and unrealized gains (losses) | 0.70 | 0.71 | ||||
| Total from investment operations | 0.62 | 0.70 | ||||
| Less distributions from net investment income | (0.10 | ) | (0.04 | ) | ||
| Net asset value, end of year | $ | 11.18 | $ | 10.66 | ||
| Total returnd | 5.80 | % | 7.02 | % | ||
| Ratios to average net assetse | ||||||
| Expenses before waiver, payments by affiliates and expense reductionf | 2.98 | % | 3.19 | % | ||
| Expenses net of waiver, payments by affiliates and expense reductionf | 2.60 | %g | 2.69 | % | ||
| Expenses incurred in connection with securities sold short | 0.65 | % | 0.56 | % | ||
| Net investment income (loss) | (0.56 | )% | (0.21 | )% | ||
| Supplemental data | ||||||
| Net assets, end of year (000’s) | $ | 239,754 | $ | 215,526 | ||
| Portfolio turnover rate | 295.81 | % | 181.06 | % | ||
aFor the period October 11, 2013 (commencement of operations) to May 31, 2014.
bThe amount shown for a share outstanding throughout the period may not correlate with the Consolidated Statement of Operations for the period due to the timing of sales
and repurchases of Fund shares in relation to income earned and/or fluctuating fair value of the investments of the Fund.
cBased on average daily shares outstanding.
dTotal return is not annualized for periods less than one year.
eRatios are annualized for periods less than one year.
fIncludes dividend and interest expense on securities sold short and security borrowing fees, if any. See below for the ratios of such expenses to average net assets for the
periods presented. See Note 1(g).
gBenefit of expense reduction rounds to less than 0.01%.
franklintempleton.com The accompanying notes are an integral part of these consolidated financial statements. | Annual Report 17
FRANKLIN ALTERNATIVE STRATEGIES FUNDS
CONSOLIDATED FINANCIAL H IGHLIGHTS
| Franklin K2 Alternative Strategies Fund (continued) | ||||||
| Year End May 31, | ||||||
| 2015 | 2014 | a | ||||
| Advisor Class | ||||||
| Per share operating performance | ||||||
| (for a share outstanding throughout the year) | ||||||
| Net asset value, beginning of year | $ | 10.65 | $ | 10.00 | ||
| Income from investment operationsb: | ||||||
| Net investment income (loss)c | (0.02 | ) | (0.02 | ) | ||
| Net realized and unrealized gains (losses) | 0.64 | 0.71 | ||||
| Total from investment operations | 0.62 | 0.69 | ||||
| Less distributions from net investment income | (0.09 | ) | (0.04 | ) | ||
| Net asset value, end of year | $ | 11.18 | $ | 10.65 | ||
| Total returnd | 5.88 | % | 6.92 | % | ||
| Ratios to average net assetse | ||||||
| Expenses before waiver, payments by affiliates and expense reductionf | 3.07 | % | 3.21 | % | ||
| Expenses net of waiver, payments by affiliates and expense reductionf | 2.66 | %g | 2.71 | % | ||
| Expenses incurred in connection with securities sold short | 0.65 | % | 0.56 | % | ||
| Net investment income (loss) | (0.62 | )% | (0.23 | )% | ||
| Supplemental data | ||||||
| Net assets, end of year (000’s) | $ | 329,139 | $ | 54,593 | ||
| Portfolio turnover rate | 295.81 | % | 181.06 | % | ||
aFor the period October 11, 2013 (commencement of operations) to May 31, 2014.
bThe amount shown for a share outstanding throughout the period may not correlate with the Consolidated Statement of Operations for the period due to the timing of sales
and repurchases of Fund shares in relation to income earned and/or fluctuating fair value of the investments of the Fund.
cBased on average daily shares outstanding.
dTotal return is not annualized for periods less than one year.
eRatios are annualized for periods less than one year.
fIncludes dividend and interest expense on securities sold short and security borrowing fees, if any. See below for the ratios of such expenses to average net assets for the
periods presented. See Note 1(g).
gBenefit of expense reduction rounds to less than 0.01%.
18 Annual Report | The accompanying notes are an integral part of these consolidated financial statements. franklintempleton.com
FRANKLIN ALTERNATIVE STRATEGIES FUNDS
| Consolidated Statement of Investments, May 31, 2015 | ||||
| Franklin K2 Alternative Strategies Fund | ||||
| Country | Shares | Value | ||
| Common Stocks and Other Equity Interests 43.2% | ||||
| Aerospace & Defense 0.6% | ||||
| aB/E Aerospace Inc | United States | 22,151 | $ | 1,270,139 |
| bMacDonald Dettwiler & Associates Ltd | Canada | 1,368 | 107,682 | |
| aTransDigm Group Inc | United States | 10,202 | 2,306,060 | |
| United Technologies Corp | United States | 6,754 | 791,366 | |
| 4,475,247 | ||||
| Air Freight & Logistics 0.4% | ||||
| aFedEx Corp | United States | 16,464 | 2,851,894 | |
| Airlines 0.9% | ||||
| bAir Canada, B | Canada | 20,893 | 231,174 | |
| Alaska Air Group Inc | United States | 6,350 | 410,464 | |
| American Airlines Group Inc | United States | 45,844 | 1,942,410 | |
| b,c,dAMR Corp., Contingent Distribution | United States | 3,268 | — | |
| aDelta Air Lines Inc | United States | 42,817 | 1,837,706 | |
| bInternational Consolidated Airlines Group SA | United Kingdom | 135,472 | 1,147,085 | |
| Southwest Airlines Co | United States | 10,150 | 376,058 | |
| bSpirit Airlines Inc | United States | 1,692 | 107,560 | |
| b,eUnited Continental Holdings Inc | United States | 3,267 | 178,346 | |
| b,fWizz Air Holdings PLC, 144A | Switzerland | 18,707 | 434,594 | |
| 6,665,397 | ||||
| Auto Components 0.1% | ||||
| Continental AG | Germany | 1,042 | 240,616 | |
| Cie Generale des Etablissements Michelin | France | 4,459 | 477,830 | |
| 718,446 | ||||
| Automobiles 0.3% | ||||
| bPeugeot SA | France | 90,398 | 1,886,394 | |
| a,bTesla Motors Inc | United States | 2,760 | 692,208 | |
| 2,578,602 | ||||
| Banks 0.5% | ||||
| aBank of America Corp | United States | 13,791 | 227,551 | |
| b,eCommerzbank AG | Germany | 42,389 | 564,023 | |
| aGreat Western Bancorp Inc | United States | 11,117 | 257,692 | |
| KBC Groep NV | Belgium | 1,438 | 96,419 | |
| Mitsubishi UFJ Financial Group Inc | Japan | 13,500 | 100,199 | |
| Mizuho Financial Group Inc | Japan | 48,600 | 107,526 | |
| Sumitomo Mitsui Financial Group Inc | Japan | 3,400 | 155,324 | |
| Swedbank AB | Sweden | 6,064 | 142,239 | |
| aWells Fargo & Co | United States | 33,474 | 1,873,205 | |
| 3,524,178 | ||||
| Beverages 1.4% | ||||
| aAnheuser-Busch InBev NV, ADR | Belgium | 23,667 | 2,853,294 | |
| aBrown-Forman Corp., B | United States | 16,066 | 1,514,542 | |
| aConstellation Brands Inc., A | United States | 15,009 | 1,769,411 | |
| Cott Corp | Canada | 8,400 | 80,556 | |
| Davide Campari-Milano SpA | Italy | 44,011 | 335,943 | |
| Heineken NV | Netherlands | 19,825 | 1,553,339 | |
| Molson Coors Brewing Co., B | United States | 34,716 | 2,547,460 | |
franklintempleton.com
Annual Report
19
FRANKLIN ALTERNATIVE STRATEGIES FUNDS
CONSOLIDATED STATEMENT O F INVESTMENTS
| Franklin K2 Alternative Strategies Fund (continued) | ||||
| Country | Shares | Value | ||
| Common Stocks and Other Equity Interests (continued) | ||||
| Beverages (continued) | ||||
| Pernod Ricard SA | France | 3,190 | $ | 394,327 |
| 11,048,872 | ||||
| Biotechnology 3.0% | ||||
| bACADIA Pharmaceuticals Inc | United States | 7,618 | 313,862 | |
| bAcorda Therapeutics Inc | United States | 3,412 | 103,998 | |
| bAdaptimmune Therapeutics PLC, ADR | United Kingdom | 3,463 | 53,434 | |
| bAduro Biotech Inc | United States | 1,005 | 33,949 | |
| bAffimed NV | Germany | 11,509 | 120,039 | |
| a,bAgios Pharmaceuticals Inc | United States | 1,610 | 196,452 | |
| a,bAlexion Pharmaceuticals Inc | United States | 4,245 | 695,501 | |
| a,bAlnylam Pharmaceuticals Inc | United States | 9,890 | 1,296,480 | |
| bAmicus Therapeutics Inc | United States | 12,330 | 151,782 | |
| bAnacor Pharmaceuticals Inc | United States | 2,208 | 157,254 | |
| bApplied Genetic Technologies Corp | United States | 8,369 | 167,798 | |
| bAtara Biotherapeutics Inc | United States | 6,054 | 256,447 | |
| bAvalanche Biotechnologies Inc | United States | 998 | 37,205 | |
| bBellicum Pharmaceuticals Inc | United States | 2,274 | 56,259 | |
| bBioCryst Pharmaceuticals Inc | United States | 11,148 | 124,969 | |
| a,bBiogen Idec Inc | United States | 3,507 | 1,392,244 | |
| a,bBioMarin Pharmaceutical Inc | United States | 22,882 | 2,873,293 | |
| bBluebird Bio Inc | United States | 5,760 | 1,118,880 | |
| bCara Therapeutics Inc | United States | 2,846 | 27,094 | |
| a,bCelgene Corp | United States | 11,082 | 1,268,224 | |
| bChimerix Inc | United States | 4,919 | 205,860 | |
| bCoherus Biosciences Inc | United States | 4,296 | 105,553 | |
| bConatus Pharmaceuticals Inc | United States | 6,497 | 35,409 | |
| bConcert Pharmaceuticals Inc | United States | 4,091 | 65,415 | |
| bDyax Corp | United States | 19,482 | 513,156 | |
| bEPIRUS Biopharmaceuticals Inc | United States | 20,417 | 110,048 | |
| bEpizyme Inc | United States | 2,526 | 47,918 | |
| bEsperion Therapeutics Inc | United States | 864 | 92,889 | |
| bExelixis Inc | United States | 11,879 | 37,419 | |
| bFibrocell Science Inc | United States | 21,949 | 101,404 | |
| bFlexion Therapeutics Inc | United States | 4,228 | 84,179 | |
| a,bGilead Sciences Inc | United States | 5,581 | 626,579 | |
| bIdera Pharmaceuticals Inc | United States | 21,866 | 83,965 | |
| bImmune Design Corp | United States | 1,995 | 43,551 | |
| a,bIncyte Corp. Ltd | United States | 16,139 | 1,777,711 | |
| bInotek Pharmaceuticals Corp | United States | 10,152 | 59,288 | |
| bInsmed Inc | United States | 10,759 | 236,052 | |
| a,bIntercept Pharmaceuticals Inc | United States | 3,803 | 970,507 | |
| bInvitae Corp | United States | 330 | 4,108 | |
| bKindred Biosciences Inc | United States | 18,995 | 122,518 | |
| a,bKYTHERA Biopharmaceuticals Inc | United States | 2,312 | 116,455 | |
| bMacroGenics Inc | United States | 1,150 | 37,202 | |
| bMedgenics Inc | United States | 8,461 | 63,880 | |
| bNeurocrine Biosciences Inc | United States | 7,853 | 344,433 | |
| bNexvet Biopharma PLC | Ireland | 3,167 | 14,410 | |
| bOtonomy Inc | United States | 11,489 | 281,710 | |
20 Annual Report
franklintempleton.com
FRANKLIN ALTERNATIVE STRATEGIES FUNDS
CONSOLIDATED STATEMENT O F INVESTMENTS
| Franklin K2 Alternative Strategies Fund (continued) | ||||
| Country | Shares | Value | ||
| Common Stocks and Other Equity Interests (continued) | ||||
| Biotechnology (continued) | ||||
| a,bOvaScience Inc | United States | 19,349 | $ | 656,512 |
| bPortola Pharmaceuticals Inc | United States | 8,291 | 346,730 | |
| bProQR Therapeutics NV | Netherlands | 3,761 | 68,601 | |
| bProthena Corp. PLC | Ireland | 4,961 | 195,662 | |
| bRegeneron Pharmaceuticals Inc | United States | 1,430 | 732,961 | |
| bRegulus Therapeutics Inc | United States | 5,130 | 72,436 | |
| bRetrophin Inc | United States | 7,105 | 224,802 | |
| a,bSangamo BioSciences Inc | United States | 17,200 | 210,700 | |
| bSynageva BioPharma Corp | United States | 8,176 | 1,744,840 | |
| a,bSynta Pharmaceuticals Corp | United States | 61,266 | 131,109 | |
| bTesaro Inc | United States | 3,108 | 182,626 | |
| bUltragenyx Pharmaceutical Inc | United States | 7,154 | 622,398 | |
| bVerastem Inc | United States | 5,013 | 43,362 | |
| a,bVertex Pharmaceuticals Inc | United States | 4,287 | 549,979 | |
| bXencor Inc | United States | 6,400 | 116,096 | |
| bZafgen Inc | United States | 1,989 | 64,762 | |
| 22,590,359 | ||||
| Building Products 0.3% | ||||
| aFortune Brands Home & Security Inc | United States | 46,135 | 2,115,751 | |
| Capital Markets 0.0%† | ||||
| b,f,gHuatai Securities Co. Ltd., 144A | China | 67,403 | 215,588 | |
| Chemicals 2.1% | ||||
| aAir Products & Chemicals Inc | United States | 22,576 | 3,313,254 | |
| Akzo Nobel NV | Netherlands | 25,844 | 1,968,458 | |
| aEcolab Inc | United States | 4,918 | 563,849 | |
| aFMC Corp | United States | 25,886 | 1,479,903 | |
| LyondellBasell Industries NV, A | United States | 5,443 | 550,287 | |
| aThe Sherwin-Williams Co | United States | 9,402 | 2,709,468 | |
| Sigma-Aldrich Corp | United States | 6,535 | 910,325 | |
| a,bWR Grace & Co | United States | 48,120 | 4,712,392 | |
| 16,207,936 | ||||
| Commercial Services & Supplies 0.4% | ||||
| bAtento SA | Luxembourg | 44,855 | 584,461 | |
| Edenred | France | 26,709 | 674,692 | |
| bMetalico Inc | United States | 128,489 | 42,774 | |
| MSA Safety Inc | United States | 31,213 | 1,395,221 | |
| Tyco International Ltd | United States | 6,065 | 244,783 | |
| West Corp | United States | 6,555 | 200,583 | |
| 3,142,514 | ||||
| Communications Equipment 0.7% | ||||
| bArista Networks Inc | United States | 7,670 | 536,210 | |
| a,bCiena Corp | United States | 20,225 | 487,827 | |
| aCisco Systems Inc | United States | 47,191 | 1,383,168 | |
| a,bF5 Networks Inc | United States | 2,735 | 343,762 | |
| Nokia Corp., ADR | Finland | 49,914 | 363,873 | |
| Nokia OYJ, A | Finland | 130,347 | 951,297 | |
| bPalo Alto Networks Inc | United States | 879 | 148,982 | |
| QUALCOMM Inc | United States | 9,505 | 662,308 | |
franklintempleton.com
Annual Report
21
FRANKLIN ALTERNATIVE STRATEGIES FUNDS
CONSOLIDATED STATEMENT O F INVESTMENTS
| Franklin K2 Alternative Strategies Fund (continued) | ||||
| Country | Shares | Value | ||
| Common Stocks and Other Equity Interests (continued) | ||||
| Communications Equipment (continued) | ||||
| bRadware Ltd | Israel | 24,350 | $ | 574,904 |
| 5,452,331 | ||||
| Construction Materials 0.9% | ||||
| Buzzi Unicem SpA | Italy | 94,052 | 1,438,928 | |
| a,bCemex SAB de CV | Mexico | 47,470 | 441,471 | |
| Eagle Materials Inc | United States | 21,164 | 1,766,771 | |
| Martin Marietta Materials Inc | United States | 12,559 | 1,871,417 | |
| bSummit Materials Inc., A | United States | 38,407 | 1,056,192 | |
| 6,574,779 | ||||
| Consumer Finance 0.0%† | ||||
| bSpringleaf Holdings Inc | United States | 2,765 | 131,393 | |
| bUnifin Financiera SAPI de CV SOFOM ENR | Mexico | 40,099 | 82,808 | |
| 214,201 | ||||
| Containers & Packaging 0.0%† | ||||
| bBerry Plastics Group Inc | United States | 6,785 | 227,094 | |
| bIntertape Polymer Group Inc | Canada | 7,403 | 115,545 | |
| 342,639 | ||||
| Diversified Financial Services 0.7% | ||||
| bBoulevard Acquisition Corp | United States | 4,071 | 45,839 | |
| ING Groep NV | Netherlands | 105,289 | 1,731,689 | |
| aMoody’s Corp | United States | 25,838 | 2,793,088 | |
| aMSCI Inc | United States | 10,925 | 677,896 | |
| 5,248,512 | ||||
| Diversified Telecommunication Services 0.2% | ||||
| Swisscom AG | Switzerland | 1,678 | 972,146 | |
| b,eTelecom Italia SpA | Italy | 398,676 | 488,657 | |
| Telecom Italia SpA, RSP | Italy | 137,677 | 136,089 | |
| 1,596,892 | ||||
| Electric Utilities 0.0%† | ||||
| Pepco Holdings Inc | United States | 13,140 | 358,065 | |
| Electrical Equipment 0.0%† | ||||
| bSolarCity Corp | United States | 1,204 | 72,384 | |
| Electronic Equipment, Instruments & Components 0.1% | ||||
| TE Connectivity Ltd | United States | 7,275 | 501,975 | |
| Energy Equipment & Services 0.6% | ||||
| aBaker Hughes Inc | United States | 44,979 | 2,899,346 | |
| a,bDresser-Rand Group Inc | United States | 20,983 | 1,775,162 | |
| Halliburton Co | United States | 991 | 44,992 | |
| 4,719,500 | ||||
| Food & Staples Retailing 0.8% | ||||
| aCostco Wholesale Corp | United States | 27,599 | 3,935,341 | |
| CVS Health Corp | United States | 8,621 | 882,618 | |
| The Kroger Co | United States | 21,695 | 1,579,396 | |
| 6,397,355 | ||||
22 Annual Report
franklintempleton.com
FRANKLIN ALTERNATIVE STRATEGIES FUNDS
CONSOLIDATED STATEMENT O F INVESTMENTS
| Franklin K2 Alternative Strategies Fund (continued) | ||||
| Country | Shares | Value | ||
| Common Stocks and Other Equity Interests (continued) | ||||
| Food Products 1.6% | ||||
| aKraft Foods Group Inc | United States | 50,899 | $ | 4,298,420 |
| bThe Hain Celestial Group Inc | United States | 7,517 | 475,601 | |
| The JM Smucker Co | United States | 12,000 | 1,422,600 | |
| Lindt & Spruengli AG | Switzerland | 44 | 2,767,059 | |
| Mead Johnson Nutrition Co., A | United States | 34,087 | 3,316,665 | |
| 12,280,345 | ||||
| Health Care Equipment & Supplies 1.2% | ||||
| aBecton Dickinson and Co | United States | 22,558 | 3,169,625 | |
| bDBV Technologies SA, ADR | France | 3,806 | 89,593 | |
| a,bDerma Sciences Inc | United States | 9,034 | 59,263 | |
| bGenMark Diagnostics Inc | United States | 17,456 | 160,071 | |
| bIDEXX Laboratories Inc | United States | 22,295 | 3,023,202 | |
| bInnocoll AG, ADR | Germany | 3,481 | 40,623 | |
| bInspireMD Inc | United Kingdom | 20,365 | 4,686 | |
| Medtronic PLC | United States | 34,130 | 2,604,802 | |
| bNevro Corp | United States | 555 | 28,211 | |
| bNovadaq Technologies Inc | Canada | 11,632 | 116,436 | |
| bTornier NV | United States | 2,648 | 70,384 | |
| 9,366,896 | ||||
| Health Care Providers & Services 1.5% | ||||
| bAcadia Healthcare Co. Inc | United States | 6,945 | 514,902 | |
| Aetna Inc | United States | 8,318 | 981,274 | |
| AmerisourceBergen Corp | United States | 4,114 | 463,072 | |
| a,bBrookdale Senior Living Inc | United States | 6,923 | 260,928 | |
| Celesio AG | Germany | 61,856 | 1,799,972 | |
| a,bCentene Corp | United States | 12,950 | 975,653 | |
| aCigna Corp | United States | 5,432 | 764,989 | |
| bCommunity Health Systems Inc | United States | 27,875 | 449 | |
| bDaVita HealthCare Partners Inc | United States | 5,405 | 452,831 | |
| bEnvision Healthcare Holdings Inc | United States | 8,078 | 298,482 | |
| a,bHCA Holdings Inc | United States | 7,845 | 641,956 | |
| Humana Inc | United States | 8,020 | 1,721,493 | |
| McKesson Corp | United States | 4,229 | 1,003,246 | |
| bMolina Healthcare Inc | United States | 4,254 | 309,436 | |
| Omnicare Inc | United States | 4,928 | 469,589 | |
| a,bPremier Inc., A | United States | 2,574 | 98,636 | |
| aUnitedHealth Group Inc | United States | 2,837 | 341,036 | |
| aUniversal Health Services Inc., B | United States | 4,343 | 562,766 | |
| 11,660,710 | ||||
| Health Care Technology 0.0%† | ||||
| bIMS Health Holdings Inc | United States | 10,530 | 313,373 | |
| Hotels, Restaurants & Leisure 2.4% | ||||
| Ainsworth Game Technology Ltd | Australia | 65,053 | 154,182 | |
| aBloomin’ Brands Inc | United States | 61,246 | 1,375,585 | |
| a,bBuffalo Wild Wings Inc | United States | 14,065 | 2,147,304 | |
| Carnival Corp | United States | 40,239 | 1,864,273 | |
| bChipotle Mexican Grill Inc | United States | 602 | 370,543 | |
| aDomino’s Pizza Inc | United States | 21,488 | 2,334,886 | |
franklintempleton.com
Annual Report
23
FRANKLIN ALTERNATIVE STRATEGIES FUNDS
CONSOLIDATED STATEMENT O F INVESTMENTS
| Franklin K2 Alternative Strategies Fund (continued) | ||||
| Country | Shares | Value | ||
| Common Stocks and Other Equity Interests (continued) | ||||
| Hotels, Restaurants & Leisure (continued) | ||||
| bHilton Worldwide Holdings Inc | United States | 27,641 | $ | 800,483 |
| McDonald’s Corp | United States | 14,385 | 1,379,953 | |
| bMGM Resorts International | United States | 52,527 | 1,053,166 | |
| aSonic Corp | United States | 71,288 | 2,148,620 | |
| aStarbucks Corp | United States | 39,987 | 2,077,725 | |
| Starwood Hotels & Resorts Worldwide Inc | United States | 19,384 | 1,604,220 | |
| Yum! Brands Inc | United States | 11,635 | 1,048,430 | |
| 18,359,370 | ||||
| Household Durables 0.4% | ||||
| a,bGoPro Inc | United States | 16,680 | 925,073 | |
| Lennar Corp., A | United States | 14,154 | 660,001 | |
| aThe Ryland Group Inc | United States | 35,219 | 1,481,663 | |
| bTempur Sealy International Inc | United States | 5,302 | 315,946 | |
| 3,382,683 | ||||
| Household Products 0.1% | ||||
| Church & Dwight Co. Inc | United States | 10,154 | 852,631 | |
| Industrial Conglomerates 0.3% | ||||
| Hutchison Whampoa Ltd | Hong Kong | 147,348 | 2,153,856 | |
| Insurance 0.1% | ||||
| PartnerRe Ltd | United States | 988 | 129,853 | |
| W.R. Berkley Corp | United States | 8,063 | 395,087 | |
| 524,940 | ||||
| Internet & Catalog Retail 0.5% | ||||
| a,bAmazon.com Inc | United States | 2,205 | 946,452 | |
| Expedia Inc | United States | 4,350 | 466,581 | |
| b,eNetflix Inc | United States | 460 | 287,068 | |
| bOrbitz Worldwide Inc | United States | 57,200 | 644,644 | |
| Travelport Worldwide Ltd | Bermuda | 6 | 92 | |
| a,bTripAdvisor Inc | United States | 6,240 | 475,862 | |
| bWayfair Inc., A | United States | 33,302 | 995,397 | |
| 3,816,096 | ||||
| Internet Software & Services 1.1% | ||||
| a,bAkamai Technologies Inc | United States | 14,154 | 1,079,526 | |
| a,b,eAlibaba Group Holding Ltd., ADR | China | 8,070 | 720,812 | |
| bBaidu Inc., ADR | China | 3,410 | 673,134 | |
| bBenefitfocus Inc | United States | 9,595 | 344,269 | |
| a,bCoStar Group Inc | United States | 3,795 | 792,813 | |
| bDealertrack Technologies Inc | United States | 3,020 | 125,934 | |
| a,beBay Inc | United States | 10,235 | 628,020 | |
| a,bGoogle Inc., A | United States | 645 | 351,731 | |
| a,bGoogle Inc., C | United States | 961 | 511,358 | |
| bGrubHub Inc | United States | 1,185 | 47,779 | |
| a,bHomeAway Inc | United States | 19,855 | 557,330 | |
| bMarketo Inc | United States | 9,090 | 271,155 | |
| bMYOB Group Ltd | Australia | 3,507 | 9,438 | |
| bQihoo 360 Technology Co. Ltd., ADR | China | 4,910 | 255,565 | |
| bTwitter Inc | United States | 2,520 | 92,408 | |
24 Annual Report
franklintempleton.com
FRANKLIN ALTERNATIVE STRATEGIES FUNDS
CONSOLIDATED STATEMENT O F INVESTMENTS
| Franklin K2 Alternative Strategies Fund (continued) | ||||
| Country | Shares | Value | ||
| Common Stocks and Other Equity Interests (continued) | ||||
| Internet Software & Services (continued) | ||||
| a,bVeriSign Inc | United States | 6,270 | $ | 396,201 |
| bXoom Corp | United States | 19,210 | 361,340 | |
| bYahoo! Inc | United States | 12,930 | 555,150 | |
| bZillow Group Inc., A | United States | 5,282 | 482,722 | |
| 8,256,685 | ||||
| IT Services 2.6% | ||||
| Accenture PLC, A | United States | 15,135 | 1,453,565 | |
| a,bAlliance Data Systems Corp | United States | 3,620 | 1,078,869 | |
| aAutomatic Data Processing Inc | United States | 12,355 | 1,056,476 | |
| bBlack Knight Financial Services Inc., A | United States | 4,299 | 118,566 | |
| a,bCardtronics Inc | United States | 22,410 | 817,965 | |
| a,bCognizant Technology Solutions Corp., A | United States | 12,820 | 829,710 | |
| a,bEPAM Systems Inc | United States | 6,285 | 451,954 | |
| bEuronet Worldwide Inc | United States | 1,911 | 114,278 | |
| EVERTEC Inc | United States | 34,301 | 762,511 | |
| a,bExlService Holdings Inc | United States | 60,075 | 2,156,693 | |
| bGartner Inc | United States | 2,560 | 223,949 | |
| bGenpact Ltd | United States | 93,295 | 2,098,205 | |
| aGlobal Payments Inc | United States | 7,790 | 813,120 | |
| aHeartland Payment Systems Inc | United States | 30,550 | 1,632,898 | |
| aMasterCard Inc., A | United States | 17,244 | 1,590,932 | |
| a,bVantiv Inc., A | United States | 21,200 | 848,000 | |
| a,bVeriFone Systems Inc | United States | 34,230 | 1,306,559 | |
| aVisa Inc., A | United States | 15,855 | 1,088,921 | |
| a,bWEX Inc | United States | 14,097 | 1,598,459 | |
| 20,041,630 | ||||
| Leisure Products 0.1% | ||||
| Brunswick Corp | United States | 14,668 | 748,655 | |
| bJAKKS Pacific Inc | United States | 1,023 | 7,856 | |
| 756,511 | ||||
| Life Sciences Tools & Services 0.4% | ||||
| bFluidigm Corp | United States | 8,735 | 206,496 | |
| a,bIllumina Inc | United States | 5,272 | 1,086,454 | |
| bSequenom Inc | United States | 11,695 | 39,178 | |
| aThermo Fisher Scientific Inc | United States | 9,156 | 1,186,892 | |
| a,bWuXi Pharmatech Cayman Inc., ADR | China | 15,791 | 679,329 | |
| 3,198,349 | ||||
| Machinery 0.1% | ||||
| MAN SE, ADR | Germany | 470 | 48,575 | |
| Pall Corp | United States | 7,155 | 890,368 | |
| 938,943 | ||||
| Marine 0.2% | ||||
| Irish Continental Group PLC | Ireland | 271,305 | 1,245,530 | |
| Media 2.8% | ||||
| b,eCharter Communications Inc., A | United States | 1,700 | 304,334 | |
| bCineplex Inc | Canada | 4,409 | 173,900 | |
| a,bDIRECTV | United States | 38,386 | 3,494,661 | |
franklintempleton.com
Annual Report
25
FRANKLIN ALTERNATIVE STRATEGIES FUNDS
CONSOLIDATED STATEMENT O F INVESTMENTS
| Franklin K2 Alternative Strategies Fund (continued) | ||||
| Country | Shares | Value | ||
| Common Stocks and Other Equity Interests (continued) | ||||
| Media (continued) | ||||
| a,bDISH Network Corp., A | United States | 35,843 | $ | 2,537,326 |
| bImax Corp | Canada | 5,780 | 233,165 | |
| a,bLiberty Broadband Corp., C | United States | 2,445 | 130,759 | |
| bLiberty Global PLC, A | United Kingdom | 54,383 | 3,128,654 | |
| bLiberty Global PLC, C | United Kingdom | 20,288 | 1,090,480 | |
| a,bLiberty Media Corp., A | United States | 6,336 | 242,764 | |
| a,bLiberty Media Corp., C | United States | 69,140 | 2,624,554 | |
| bMarkit Ltd | United States | 21,425 | 574,404 | |
| bNews Corp., A | United States | 10,021 | 151,818 | |
| bNews Corp., B | United States | 39,584 | 591,781 | |
| Sky PLC | United Kingdom | 14,422 | 232,549 | |
| Societe Television Francaise 1 | France | 23,161 | 391,104 | |
| a,eTime Warner Cable Inc | United States | 11,566 | 2,092,174 | |
| Twenty-First Century Fox Inc., A | United States | 8,900 | 299,040 | |
| aThe Walt Disney Co | United States | 29,365 | 3,241,015 | |
| 21,534,482 | ||||
| Metals & Mining 0.4% | ||||
| bCentury Aluminum Co | United States | 14,949 | 167,130 | |
| eThyssenKrupp AG | Germany | 95,847 | 2,539,077 | |
| 2,706,207 | ||||
| Multiline Retail 0.5% | ||||
| aFamily Dollar Stores Inc | United States | 35,962 | 2,787,774 | |
| Target Corp | United States | 10,387 | 823,897 | |
| 3,611,671 | ||||
| Oil, Gas & Consumable Fuels 0.3% | ||||
| Anadarko Petroleum Corp | United States | 2,338 | 195,480 | |
| Canadian Natural Resources Ltd | Canada | 1,329 | 40,986 | |
| bCheniere Energy Inc | United States | 17,750 | 1,345,983 | |
| Kinder Morgan Inc | United States | 6,776 | 281,136 | |
| aOccidental Petroleum Corp | United States | 8,790 | 687,290 | |
| Pioneer Natural Resources Co | United States | 262 | 38,732 | |
| Suncor Energy Inc | Canada | 1,317 | 38,496 | |
| 2,628,103 | ||||
| Paper & Forest Products 0.4% | ||||
| bCanfor Corp | Canada | 66,425 | 1,371,124 | |
| bLouisiana-Pacific Corp | United States | 74,740 | 1,352,047 | |
| 2,723,171 | ||||
| Personal Products 0.1% | ||||
| L’Oreal SA | France | 2,734 | 516,322 | |
| Pharmaceuticals 4.3% | ||||
| AbbVie Inc | United States | 23,254 | 1,548,484 | |
| bActavis PLC | United States | 24,878 | 7,632,819 | |
| bAerie Pharmaceuticals Inc | United States | 18,616 | 207,196 | |
| a,bAratana Therapeutics Inc | United States | 18,327 | 248,697 | |
| bAssembly Biosciences Inc | United States | 16,796 | 279,821 | |
| AstraZeneca PLC, ADR | United Kingdom | 14,737 | 995,484 | |
| aBristol-Myers Squibb Co | United States | 12,705 | 820,743 | |
26 Annual Report
franklintempleton.com
FRANKLIN ALTERNATIVE STRATEGIES FUNDS
CONSOLIDATED STATEMENT O F INVESTMENTS
| Franklin K2 Alternative Strategies Fund (continued) | ||||
| Country | Shares | Value | ||
| Common Stocks and Other Equity Interests (continued) | ||||
| Pharmaceuticals (continued) | ||||
| bDermira Inc | United States | 3,046 | $ | 45,690 |
| Eli Lilly & Co | United States | 10,856 | 856,538 | |
| bEndo International PLC | United States | 13,560 | 1,135,786 | |
| bFlamel Technologies SA, ADR | France | 9,109 | 167,150 | |
| bFlex Pharma Inc | United States | 2,571 | 45,892 | |
| bFoamix Pharmaceuticals Ltd | Israel | 7,776 | 97,122 | |
| bGW Pharmaceuticals PLC, ADR | United Kingdom | 2,739 | 312,547 | |
| a,bHospira Inc | United States | 18,332 | 1,620,916 | |
| bIntersect ENT Inc | United States | 2,631 | 62,460 | |
| Ipsen SA | France | 6,085 | 325,001 | |
| bJazz Pharmaceuticals PLC | United States | 2,221 | 398,336 | |
| a,bThe Medicines Co | United States | 11,382 | 322,794 | |
| b,eMylan NV | United States | 32,902 | 2,389,672 | |
| Novartis AG ADR | Switzerland | 3,267 | 335,619 | |
| Novo Nordisk AS, ADR | Denmark | 6,252 | 353,113 | |
| bOcular Therapeutix Inc | United States | 6,445 | 155,776 | |
| a,bPacira Pharmaceuticals Inc | United States | 9,413 | 736,191 | |
| Paratek Pharmaceuticals Inc | United States | 2,505 | 74,649 | |
| bPernix Therapeutics Holdings Inc | United States | 4,810 | 30,640 | |
| Perrigo Co. PLC | United States | 22,507 | 4,283,082 | |
| bRelypsa Inc | United States | 2,562 | 94,256 | |
| bRevance Therapeutics Inc | United States | 974 | 24,934 | |
| bSCYNEXIS Inc | United States | 3,803 | 32,858 | |
| Shire PLC, ADR | Ireland | 7,401 | 1,925,370 | |
| bSteadymed Ltd | Israel | 4,344 | 36,577 | |
| bTetraphase Pharmaceuticals Inc | United States | 11,648 | 499,466 | |
| Teva Pharmaceutical Industries Ltd., ADR | Israel | 6,348 | 381,515 | |
| bValeant Pharmaceuticals International Inc | United States | 3,824 | 913,057 | |
| a,bXenoPort Inc | United States | 5,656 | 33,710 | |
| aZoetis Inc | United States | 68,983 | 3,433,284 | |
| bZS Pharma Inc | United States | 1,244 | 72,774 | |
| 32,930,019 | ||||
| Professional Services 1.0% | ||||
| aEquifax Inc | United States | 12,370 | 1,241,082 | |
| Experian PLC | United Kingdom | 46,710 | 889,538 | |
| bFTI Consulting Inc | United States | 7,985 | 313,811 | |
| a,bHuron Consulting Group Inc | United States | 22,060 | 1,418,458 | |
| aManpowerGroup Inc | United States | 10,670 | 903,215 | |
| Nielsen NV | United States | 3,790 | 170,512 | |
| aRobert Half International Inc | United States | 9,165 | 516,631 | |
| SThree PLC | United Kingdom | 112,885 | 657,351 | |
| bTriNet Group Inc | United States | 7,480 | 223,876 | |
| a,bVerisk Analytics Inc., A | United States | 8,275 | 600,600 | |
| a,bWageWorks Inc | United States | 14,795 | 634,410 | |
| 7,569,484 | ||||
| Real Estate Investment Trusts (REITs) 0.4% | ||||
| Apollo Commercial Real Estate Finance Inc | United States | 13,833 | 237,513 | |
| a,bEquity Commonwealth | United States | 45,138 | 1,162,303 | |
| Excel Trust Inc | United States | 23,263 | 369,649 | |
| Federal Realty Investment Trust | United States | 105 | 14,119 | |
franklintempleton.com
Annual Report
27
FRANKLIN ALTERNATIVE STRATEGIES FUNDS
CONSOLIDATED STATEMENT O F INVESTMENTS
| Franklin K2 Alternative Strategies Fund (continued) | ||||
| Country | Shares | Value | ||
| Common Stocks and Other Equity Interests (continued) | ||||
| Real Estate Investment Trusts (REITs) (continued) | ||||
| Gramercy Property Trust Inc | United States | 5,688 | $ | 151,358 |
| NorthStar Realty Finance Corp | United States | 8,656 | 157,020 | |
| aSpirit Realty Capital Inc | United States | 85,757 | 925,318 | |
| 3,017,280 | ||||
| Road & Rail 0.7% | ||||
| DSV AS | Denmark | 6,665 | 231,758 | |
| a,bHertz Global Holdings Inc | United States | 64,138 | 1,275,705 | |
| aKansas City Southern | United States | 9,414 | 851,967 | |
| Ryder System Inc | United States | 3,660 | 335,439 | |
| aUnion Pacific Corp | United States | 29,726 | 2,999,650 | |
| 5,694,519 | ||||
| Semiconductors & Semiconductor Equipment 1.8% | ||||
| Altera Corp | United States | 48,884 | 2,387,983 | |
| bApplied Micro Circuits Corp | United States | 25,170 | 160,836 | |
| Avago Technologies Ltd | Singapore | 14,664 | 2,171,299 | |
| Broadcom Corp., A | United States | 28,941 | 1,645,296 | |
| aCypress Semiconductor Corp | United States | 28,935 | 397,278 | |
| bFirst Solar Inc | United States | 3,795 | 188,649 | |
| bFreescale Semiconductor Ltd | United States | 7,430 | 335,242 | |
| bNXP Semiconductors NV | Netherlands | 48,818 | 5,479,821 | |
| bSino-American Silicon Products Inc | Taiwan | 131,000 | 169,656 | |
| bSumco Corp | Japan | 32,300 | 489,776 | |
| bSunEdison Semiconductor Ltd | United States | 14,940 | 361,249 | |
| 13,787,085 | ||||
| Software 0.9% | ||||
| aActivision Blizzard Inc | United States | 9,415 | 237,823 | |
| bAdobe Systems Inc | United States | 3,905 | 308,846 | |
| bFleetMatics Group PLC | United States | 11,305 | 472,662 | |
| bGuidewire Software Inc | United States | 3,015 | 146,077 | |
| bHubSpot Inc | United States | 2,710 | 137,668 | |
| aIntuit Inc | United States | 22,498 | 2,343,167 | |
| aMicrosoft Corp | United States | 21,217 | 994,229 | |
| bRed Hat Inc | United States | 4,235 | 327,238 | |
| bSalesforce.com Inc | United States | 7,505 | 545,989 | |
| bTake-Two Interactive Software Inc | United States | 6,041 | 165,342 | |
| bUBISOFT Entertainment | France | 13,039 | 235,432 | |
| a,bVerint Systems Inc | United States | 10,510 | 679,682 | |
| 6,594,155 | ||||
| Specialty Retail 1.2% | ||||
| bANN Inc | United States | 2,400 | 112,200 | |
| bAutoNation Inc | United States | 10,538 | 657,677 | |
| a,bAutozone Inc | United States | 3,766 | 2,536,853 | |
| b,fGrandVision NV, 144A | Netherlands | 2,379 | 59,455 | |
| aThe Home Depot Inc | United States | 24,755 | 2,758,202 | |
| Inditex SA | Spain | 21,418 | 709,464 | |
| Lowe’s Cos. Inc | United States | 8,448 | 591,191 | |
| bMarineMax Inc | United States | 19,280 | 461,178 | |
| bO’Reilly Automotive Inc | United States | 3,627 | 796,235 | |
28 Annual Report
franklintempleton.com
FRANKLIN ALTERNATIVE STRATEGIES FUNDS
CONSOLIDATED STATEMENT O F INVESTMENTS
| Franklin K2 Alternative Strategies Fund (continued) | ||||
| Country | Shares | Value | ||
| Common Stocks and Other Equity Interests (continued) | ||||
| Specialty Retail (continued) | ||||
| Staples Inc | United States | 13,025 | $ | 214,457 |
| 8,896,912 | ||||
| Technology Hardware, Storage & Peripherals 0.9% | ||||
| aApple Inc | United States | 26,694 | 3,477,694 | |
| aHewlett-Packard Co | United States | 5,375 | 179,525 | |
| a,bNCR Corp | United States | 51,857 | 1,558,303 | |
| a,bNimble Storage Inc | United States | 27,750 | 718,170 | |
| bViolin Memory Inc | United States | 14,986 | 50,203 | |
| Western Digital Corp | United States | 5,730 | 557,873 | |
| 6,541,768 | ||||
| Textiles, Apparel & Luxury Goods 0.4% | ||||
| Moncler SpA | Italy | 30,131 | 573,167 | |
| aNIKE Inc., B | United States | 21,301 | 2,165,673 | |
| 2,738,840 | ||||
| Tobacco 0.5% | ||||
| Lorillard Inc | United States | 49,958 | 3,620,956 | |
| Trading Companies & Distributors 0.0%† | ||||
| bUnited Rentals Inc | United States | 1,484 | 131,942 | |
| Transportation Infrastructure 0.0%† | ||||
| BBA Aviation PLC | United Kingdom | 67,020 | 335,776 | |
| Total Common Stocks and Other Equity Interests | ||||
| (Cost $300,313,979) | 330,340,657 | |||
| Exchange Traded Funds 0.0%† | ||||
| iShares Core S&P Mid-Cap ETF | United States | 855 | 130,174 | |
| SPDR S&P Regional Banking ETF | United States | 3,787 | 159,584 | |
| Total Exchange Traded Funds (Cost $283,892) | 289,758 | |||
| Convertible Preferred Stocks 1.5% | ||||
| Capital Markets 0.1% | ||||
| fCowen Group Inc., cvt. pfd., 144A, Series A, 5.625% | United States | 525 | 562,144 | |
| Chemicals 0.0%† | ||||
| A. Schulman Inc., cvt. pfd., 6.00% | United States | 171 | 176,996 | |
| Diversified Telecommunication Services 0.1% | ||||
| Iridium Communications Inc., cvt. pfd., Series B, 6.75% | United States | 1,138 | 421,373 | |
| Food Products 0.4% | ||||
| Bunge Ltd., cvt. pfd., 4.875% | United States | 4,447 | 495,841 | |
| fPost Holdings Inc., cvt. pfd., 144A, | ||||
| a2.50% | United States | 20,337 | 1,779,487 | |
| 3.75% | United States | 2,879 | 290,865 | |
| Tyson Foods Inc., cvt. pfd., 4.75% | United States | 9,200 | 478,124 | |
| 3,044,317 | ||||
| Health Care Providers & Services 0.0%† | ||||
| Amsurg Corp., cvt. pfd., Series A-1, 5.25% | United States | 42 | 5,612 | |
| Metals & Mining 0.1% | ||||
| Alcoa Inc., cvt. pfd., Series 1, 5.375% | United States | 7,835 | 343,486 | |
franklintempleton.com
Annual Report
29
FRANKLIN ALTERNATIVE STRATEGIES FUNDS
CONSOLIDATED STATEMENT O F INVESTMENTS
| Franklin K2 Alternative Strategies Fund (continued) | ||||
| Country | Shares | Value | ||
| Convertible Preferred Stocks (continued) | ||||
| Metals & Mining (continued) | ||||
| ArcelorMittal, cvt. pfd., 6.00% | Luxembourg | 825 | $ | 14,306 |
| 357,792 | ||||
| Multi-Utilities 0.0%† | ||||
| Dominion Resources Inc., cvt. pfd., | ||||
| 6.375% | United States | 1,155 | 58,189 | |
| Series A, 6.125% | United States | 137 | 7,731 | |
| 65,920 | ||||
| Oil, Gas & Consumable Fuels 0.1% | ||||
| fChesapeake Energy Corp., cvt. pfd., 144A, 5.75% | United States | 17 | 13,940 | |
| aPetroQuest Energy Inc., cvt. pfd., Series B, 6.875% | United States | 11,430 | 244,316 | |
| aSanchez Energy Corp., cvt. pfd., Series B, 6.50% | United States | 8,167 | 288,704 | |
| aSandRidge Energy Inc., cvt. pfd., 7.00% | United States | 2,160 | 54,540 | |
| 601,500 | ||||
| Pharmaceuticals 0.3% | ||||
| Actavis PLC, cvt. pfd., Series A, 5.50% | United States | 2,469 | 2,617,066 | |
| Real Estate Investment Trusts (REITs) 0.2% | ||||
| iStar Financial Inc., cvt. pfd., Series J, 4.50% | United States | 240 | 14,450 | |
| aRamco-Gershenson Properties Trust, cvt. pfd., Series D, 7.25% | United States | 25,092 | 1,577,534 | |
| Weyerhaeuser Co., cvt. pfd., Series A, 6.375% | United States | 2,210 | 119,915 | |
| 1,711,899 | ||||
| Specialty Retail 0.1% | ||||
| fBarnes & Noble Inc., cvt. pfd., 144A, Series J, 7.75% | United States | 475 | 680,408 | |
| Tobacco 0.1% | ||||
| aUniversal Corp., cvt. pfd., 6.75% | United States | 955 | 1,118,185 | |
| Total Convertible Preferred Stocks (Cost $11,999,637) | 11,363,212 | |||
| Preferred Stocks 0.1% | ||||
| Banks 0.0%† | ||||
| National Bank of Greece SA, pfd., Series A, 9.00% | Greece | 1,363 | 12,539 | |
| Consumer Finance 0.0%† | ||||
| fAlly Financial Inc., pfd., 144A, Series G, 7.00% | United States | 202 | 205,030 | |
| Machinery 0.1% | ||||
| MAN SE, pfd., zero cpn | Germany | 3,542 | 359,024 | |
| Real Estate Investment Trusts (REITs) 0.0%† | ||||
| Crown Castle International Corp., pfd., Series A, 4.50% | United States | 326 | 33,529 | |
| Total Preferred Stocks (Cost $686,041) | 610,122 | |||
| Principal | ||||
| Amount* | ||||
| Convertible Bonds 9.9% | ||||
| Aerospace & Defense 0.1% | ||||
| aAAR Corp., senior note, Series B, 2.25%, 3/01/16 | United States | 635,000 | 662,384 | |
| Air Freight & Logistics 0.1% | ||||
| Atlas Air Worldwide Holdings Inc., senior note, 2.25%, 6/01/22 | United States | 720,000 | 720,000 | |
30 Annual Report
franklintempleton.com
FRANKLIN ALTERNATIVE STRATEGIES FUNDS
CONSOLIDATED STATEMENT O F INVESTMENTS
| Franklin K2 Alternative Strategies Fund (continued) | |||||
| Principal | |||||
| Country | Amount* | Value | |||
| Convertible Bonds (continued) | |||||
| Biotechnology 0.3% | |||||
| Acorda Therapeutics Inc., senior note, 1.75%, 6/15/21 | United States | 666,000 | $ | 655,177 | |
| BioMarin Pharmaceutical Inc., senior sub. note, | |||||
| 0.75%, 10/15/18 | United States | 8,000 | 11,790 | ||
| 1.50%, 10/15/20 | United States | 48,000 | 72,360 | ||
| Emergent Biosolutions Inc., senior note, 2.875%, 1/15/21 | United States | 50,000 | 61,500 | ||
| Exelixis Inc., senior note, 4.25%, 8/15/19 | United States | 690,000 | 573,563 | ||
| Gilead Sciences Inc., senior note, Series D, 1.625%, 5/01/16 | United States | 37,000 | 182,803 | ||
| fLigand Pharmaceuticals Inc., senior note, 144A, 0.75%, 8/15/19 | United States | 393,000 | 517,532 | ||
| PDL BioPharma Inc., senior note, 4.00%, 2/01/18 | United States | 495,000 | 479,222 | ||
| 2,553,947 | |||||
| Capital Markets 0.3% | |||||
| aCowen Group Inc., senior note, 3.00%, 3/15/19 | United States | 907,000 | 1,108,241 | ||
| aFXCM Inc., senior note, 2.25%, 6/15/18 | United States | 592,000 | 508,380 | ||
| a,fNew Mountain Finance Corp., senior note, 144A, 5.00%, 6/15/19 | United States | 725,000 | 743,125 | ||
| 2,359,746 | |||||
| Commercial Services & Supplies 0.1% | |||||
| Cenveo Inc., senior note, 7.00%, 5/15/17 | United States | 665,000 | 650,869 | ||
| Communications Equipment 0.2% | |||||
| fBrocade Communications Systems Inc., senior note, 144A, 1.375%, 1/01/20 | United States | 50,000 | 53,156 | ||
| fCiena Corp., senior note, 144A, 3.75%, 10/15/18 | United States | 29,000 | 40,582 | ||
| fInterDigital Inc., senior note, 144A, 1.50%, 3/01/20 | United States | 201,000 | 212,306 | ||
| a,fPalo Alto Networks Inc., senior note, zero cpn., 144A, 7/01/19 | United States | 744,000 | 1,189,005 | ||
| 1,495,049 | |||||
| Construction Materials 0.2% | |||||
| Cemex SAB de CV, sub. note, 3.75%, 3/15/18 | Mexico | 1,394,000 | 1,688,482 | ||
| Diversified Consumer Services 0.1% | |||||
| aAscent Capital Group Inc., senior note, 4.00%, 7/15/20 | United States | 545,000 | 448,603 | ||
| aCarriage Services Inc., sub. note, 2.75%, 3/15/21 | United States | 516,000 | 638,550 | ||
| 1,087,153 | |||||
| Diversified Telecommunication Services 0.1% | |||||
| hTelecom Italia Finance SA, sub. note, Series TIT, Reg S, 6.125%, 11/15/16 | Italy | 700,000 | EUR | 1,096,513 | |
| Electrical Equipment 0.1% | |||||
| fSolarCity Corp., senior note, 144A, 1.625%, 11/01/19 | United States | 605,000 | 596,303 | ||
| Electronic Equipment, Instruments & Components 0.2% | |||||
| Vishay Intertechnology Inc., senior bond, | |||||
| a2.25%, 11/15/40 | United States | 1,235,000 | 1,272,050 | ||
| 2.25%, 5/15/41 | United States | 485,000 | 400,125 | ||
| 1,672,175 | |||||
| Energy Equipment & Services 0.1% | |||||
| SEACOR Holdings Inc., senior bond, | |||||
| 2.50%, 12/15/27 | United States | 683,000 | 704,344 | ||
| 3.00%, 11/15/28 | United States | 216,000 | 195,480 | ||
| 899,824 | |||||
| Engineering and Construction 0.1% | |||||
| hFomento de Construcciones y Contratas SA, sub. note, Reg S, 6.50%, 10/30/20 | Spain | 450,000 | EUR | 503,723 | |
franklintempleton.com
Annual Report
31
FRANKLIN ALTERNATIVE STRATEGIES FUNDS
CONSOLIDATED STATEMENT O F INVESTMENTS
| Franklin K2 Alternative Strategies Fund (continued) | ||||
| Principal | ||||
| Country | Amount* | Value | ||
| Convertible Bonds (continued) | ||||
| Food Products 0.1% | ||||
| hOlam International Ltd., senior note, Reg S, 6.00%, 10/15/16 | Singapore | 500,000 | $ | 524,375 |
| Health Care Equipment & Supplies 0.5% | ||||
| Alere Inc., senior sub. note, 3.00%, 5/15/16 | United States | 454,000 | 558,420 | |
| Hologic Inc., senior bond, | ||||
| 2.00%, 12/15/37 | United States | 645,000 | 1,019,906 | |
| a12/15/43 | United States | 670,000 | 796,881 | |
| Insulet Corp., senior note, 2.00%, 6/15/19 | United States | 178,000 | 169,768 | |
| Quidel Corp., senior note, 3.25%, 12/15/20 | United States | 600,000 | 592,125 | |
| fWright Medical Group Inc., senior note, 144A, 2.00%, 2/15/20 | United States | 798,000 | 872,314 | |
| 4,009,414 | ||||
| Health Care Providers & Services 0.6% | ||||
| aBrookdale Senior Living Inc., senior note, 2.75%, 6/15/18 | United States | 708,000 | 990,315 | |
| HealthSouth Corp., senior sub. bond, 2.00%, 12/01/43 | United States | 496,000 | 603,880 | |
| Healthways Inc., senior note, 1.50%, 7/01/18 | United States | 475,000 | 483,016 | |
| aMolina Healthcare Inc., senior note, 1.125%, 1/15/20 | United States | 943,000 | 1,724,511 | |
| Omnicare Inc., senior bond, Series OCR, 3.25%, 12/15/35 | United States | 720,000 | 895,050 | |
| 4,696,772 | ||||
| Household Durables 0.4% | ||||
| Jarden Corp., | ||||
| senior sub. bond, 1.125%, 3/15/34 | United States | 95,000 | 112,991 | |
| senior note, 1.50%, 6/15/19 | United States | 561,000 | 798,022 | |
| asenior sub. note, 1.875%, 9/15/18 | United States | 1,180,000 | 2,031,075 | |
| K Hovnanian Enterprises Inc., senior note, 6.00%, 12/01/17 | United States | 315,000 | 334,861 | |
| fLennar Corp., senior note, 144A, 3.25%, 11/15/21 | United States | 15,000 | 30,169 | |
| 3,307,118 | ||||
| Insurance 0.1% | ||||
| AmTrust Financial Services Inc., senior bond, 2.75%, 12/15/44 | United States | 620,000 | 582,800 | |
| Internet & Catalog Retail 0.2% | ||||
| Priceline Group Inc., senior note, 1.00%, 3/15/18 | United States | 908,000 | 1,226,935 | |
| Vipshop Holdings Ltd., senior note, 1.50%, 3/15/19 | China | 339,000 | 470,574 | |
| 1,697,509 | ||||
| Internet Software & Services 0.5% | ||||
| fAOL Inc., senior note, 144A, 0.75%, 9/01/19 | United States | 460,000 | 491,050 | |
| aBlucora Inc., senior note, 4.25%, 4/01/19 | United States | 710,000 | 698,463 | |
| j2 Global Inc., 3.25%, 6/15/29 | United States | 611,000 | 711,815 | |
| a,fMercadoLibre Inc., senior note, 144A, 2.25%, 7/01/19 | Argentina | 707,000 | 921,309 | |
| fQihoo 360 Technology Co. Ltd., senior note, 144A, 0.50%, 8/15/20 | China | 305,000 | 268,400 | |
| aSINA Corp., senior note, 1.00%, 12/01/18 | China | 186,000 | 174,840 | |
| fTwitter Inc., senior note, 144A, | ||||
| 0.25%, 9/15/19 | United States | 184,000 | 168,015 | |
| 1.00%, 9/15/21 | United States | 252,000 | 228,690 | |
| VeriSign Inc., junior sub. bond, 4.136%, 8/15/37 | United States | 219,000 | 414,184 | |
| 4,076,766 | ||||
| Leisure Products 0.0%† | ||||
| fJAKKS Pacific Inc., senior note, 144A, 4.875%, 6/01/20 | United States | 285,000 | 276,628 | |
32 Annual Report
franklintempleton.com
FRANKLIN ALTERNATIVE STRATEGIES FUNDS
CONSOLIDATED STATEMENT O F INVESTMENTS
| Franklin K2 Alternative Strategies Fund (continued) | ||||
| Principal | ||||
| Country | Amount* | Value | ||
| Convertible Bonds (continued) | ||||
| Life Sciences Tools & Services 0.1% | ||||
| Sequenom Inc., senior note, 5.00%, 10/01/17 | United States | 615,000 | $ | 614,231 |
| Machinery 0.5% | ||||
| aAltra Industrial Motion Corp., senior bond, 2.75%, 3/01/31 | United States | 640,000 | 742,800 | |
| aNavistar International Corp., senior sub. note, 4.75%, 4/15/19 | United States | 705,000 | 639,787 | |
| aTrinity Industries Inc., senior bond, 3.875%, 6/01/36 | United States | 1,496,000 | 2,070,090 | |
| 3,452,677 | ||||
| Oil, Gas & Consumable Fuels 0.6% | ||||
| Aegean Marine Petroleum Network Inc., senior note, 4.00%, 11/01/18 | Greece | 450,000 | 531,844 | |
| aAlon USA Energy Inc., senior note, 3.00%, 9/15/18 | United States | 515,000 | 685,916 | |
| aAlpha Natural Resources Inc., senior note, 4.875%, 12/15/20 | United States | 620,000 | 83,312 | |
| aAmyris Inc., senior note, 6.50%, 5/15/19 | United States | 470,000 | 297,275 | |
| Green Plains Inc., senior note, 3.25%, 10/01/18 | United States | 165,000 | 274,312 | |
| Renewable Energy Group Inc., senior note, 2.75%, 6/15/19 | United States | 495,000 | 498,094 | |
| fScorpio Tankers Inc., senior note, 144A, 2.375%, 7/01/19 | Monaco | 262,000 | 276,574 | |
| hShip Finance International Ltd., senior note, Reg S, 3.75%, 2/10/16 | Norway | 500,000 | 510,500 | |
| aSolazyme Inc., senior sub. note, 5.00%, 10/01/19 | United States | 1,155,000 | 633,084 | |
| fWhiting Petroleum Corp., senior note, 144A, 1.25%, 4/01/20 | United States | 565,000 | 621,500 | |
| 4,412,411 | ||||
| Pharmaceuticals 0.2% | ||||
| ANI Pharmaceuticals Inc., senior note, 3.00%, 12/01/19 | United States | 494,000 | 513,760 | |
| Depomed Inc., senior note, 2.50%, 9/01/21 | United States | 247,000 | 312,146 | |
| Mylan Inc., senior note, 3.75%, 9/15/15 | United States | 67,000 | 364,857 | |
| Theravance Inc., senior bond, 2.125%, 1/15/23 | United States | 580,000 | 528,163 | |
| 1,718,926 | ||||
| Professional Services 0.1% | ||||
| 51job Inc., senior note, 3.25%, 4/15/19 | China | 442,000 | 442,000 | |
| Real Estate Investment Trusts (REITs) 1.4% | ||||
| American Realty Capital Properties Inc., senior note, 3.75%, 12/15/20 | United States | 719,000 | 687,997 | |
| fAmerican Residential Properties Inc., senior note, 144A, 3.25%, 11/15/18 | United States | 475,000 | 499,641 | |
| Apollo Commercial Real Estate Finance Inc., senior note, 5.50%, 3/15/19 | United States | 309,000 | 312,864 | |
| a,fCampus Crest Communities Inc., senior note, 144A, 4.75%, 10/15/18 | United States | 496,000 | 477,090 | |
| Colony Financial Inc., senior bond, 5.00%, 4/15/23 | United States | 349,000 | 395,024 | |
| fEmpire State Realty OP LP, senior note, 144A, 2.625%, 8/15/19 | United States | 660,000 | 690,937 | |
| fGPT Property Trust LP, senior note, 144A, 3.75%, 3/15/19 | United States | 1,040,000 | 1,225,900 | |
| fIAS Operating Partnership LP, 144A, 5.00%, 3/15/18 | United States | 585,000 | 567,450 | |
| a,fiStar Financial Inc., senior note, 144A, 1.50%, 11/15/16 | United States | 620,000 | 633,175 | |
| National Health Investors Inc., senior note, 3.25%, 4/01/21 | United States | 527,000 | 538,528 | |
| RAIT Financial Trust, senior bond, 4.00%, 10/01/33 | United States | 530,000 | 452,487 | |
| aRedwood Trust Inc., senior note, 4.625%, 4/15/18 | United States | 540,000 | 527,175 | |
| Resource Capital Corp., senior note, 8.00%, 1/15/20 | United States | 455,000 | 443,056 | |
| aSpirit Realty Capital Inc., senior note, | ||||
| 2.875%, 5/15/19 | United States | 1,253,000 | 1,220,115 | |
| 3.75%, 5/15/21 | United States | 223,000 | 216,172 | |
| Starwood Property Trust Inc., senior note, | ||||
| 3.75%, 10/15/17 | United States | 861,000 | 898,131 | |
| 4.00%, 1/15/19 | United States | 173,000 | 196,463 | |
franklintempleton.com
Annual Report
33
FRANKLIN ALTERNATIVE STRATEGIES FUNDS
CONSOLIDATED STATEMENT O F INVESTMENTS
| Franklin K2 Alternative Strategies Fund (continued) | ||||
| Principal | ||||
| Country | Amount* | Value | ||
| Convertible Bonds (continued) | ||||
| Real Estate Investment Trusts (REITs) (continued) | ||||
| a,fStarwood Waypoint Residential Trust, senior note, 144A, 3.00%, 7/01/19 | United States | 765,000 | $ | 737,751 |
| 10,719,956 | ||||
| Real Estate Management & Development 0.1% | ||||
| aForest City Enterprises Inc., senior note, 3.625%, 8/15/20 | United States | 470,000 | 527,281 | |
| Semiconductors & Semiconductor Equipment 0.6% | ||||
| Canadian Solar Inc., senior note, 4.25%, 2/15/19 | Canada | 90,000 | 94,500 | |
| aIntel Corp., junior sub. bond, 3.482%, 12/15/35 | United States | 515,000 | 668,535 | |
| Novellus Systems Inc., senior bond, 2.625%, 5/15/41 | United States | 15,000 | 36,084 | |
| aNVIDIA Corp., senior note, 1.00%, 12/01/18 | United States | 404,000 | 493,133 | |
| Photronics Inc., senior note, | ||||
| 3.25%, 4/01/16 | United States | 585,000 | 636,553 | |
| 3.25%, 4/01/19 | United States | 400,000 | 468,250 | |
| fSunEdison Inc., 144A, | ||||
| asenior note, 0.25%, 1/15/20 | United States | 690,000 | 845,681 | |
| senior note, 2.375%, 4/15/22 | United States | 110,000 | 149,325 | |
| senior note, 2.625%, 6/01/23 | United States | 279,000 | 289,288 | |
| fSunEdison Inc., 144A, | ||||
| senior bond, 3.375%, 6/01/25 | United States | 313,000 | 330,802 | |
| Xilinx Inc., senior note, 2.625%, 6/15/17 | United States | 432,000 | 715,230 | |
| 4,727,381 | ||||
| Software 1.2% | ||||
| Citrix Systems Inc., senior note, 0.50%, 4/15/19 | United States | 885,000 | 938,100 | |
| aElectronic Arts Inc., senior note, 0.75%, 7/15/16 | United States | 1,486,000 | 2,937,636 | |
| fFireEye Inc., senior bond, 144A, | ||||
| Series A, 1.00%, 6/01/35 | United States | 140,000 | 147,175 | |
| Series B, 1.625%, 6/01/35 | United States | 290,000 | 305,044 | |
| fInteractive Intelligence Group Inc., senior note, 144A, 1.25%, 6/01/20 | United States | 285,000 | 277,519 | |
| aNetSuite Inc., senior note, 0.25%, 6/01/18 | United States | 455,000 | 480,878 | |
| Nuance Communications Inc., senior bond, 2.75%, 11/01/31 | United States | 27,000 | 27,203 | |
| Proofpoint Inc., senior note, 1.25%, 12/15/18 | United States | 371,000 | 594,296 | |
| fRovi Corp., senior note, 144A, 0.50%, 3/01/20 | United States | 470,000 | 439,156 | |
| Take-Two Interactive Software Inc., senior note, | ||||
| 1.75%, 12/01/16 | United States | 522,000 | 776,801 | |
| a1.00%, 7/01/18 | United States | 811,000 | 1,125,262 | |
| fTiVo Inc., senior note, 144A, 4.00%, 3/15/16 | United States | 330,000 | 361,763 | |
| Workday Inc., senior note, 0.75%, 7/15/18 | United States | 705,000 | 814,275 | |
| 9,225,108 | ||||
| Technology Hardware, Storage & Peripherals 0.2% | ||||
| a,fElectronics For Imaging Inc., senior note, 144A, 0.75%, 9/01/19 | United States | 541,000 | 566,698 | |
| fViolin Memory Inc., senior note, 144A, 4.25%, 10/01/19 | United States | 720,000 | 675,000 | |
| 1,241,698 | ||||
| Textiles, Apparel & Luxury Goods 0.2% | ||||
| Iconix Brand Group Inc., senior sub. note, | ||||
| a1.50%, 3/15/18 | United States | 1,087,000 | 1,126,404 | |
| 2.50%, 6/01/16 | United States | 413,000 | 428,745 | |
| 1,555,149 | ||||
34 Annual Report
franklintempleton.com
FRANKLIN ALTERNATIVE STRATEGIES FUNDS
CONSOLIDATED STATEMENT O F INVESTMENTS
| Franklin K2 Alternative Strategies Fund (continued) | |||||
| Principal | |||||
| Country | Amount* | Value | |||
| Convertible Bonds (continued) | |||||
| Thrifts & Mortgage Finance 0.1% | |||||
| a,fMGIC Investment Corp., junior sub. bond, 144A, 9.00%, 4/01/63 | United States | 755,000 | $ | 982,916 | |
| Tobacco 0.1% | |||||
| Vector Group Ltd., senior note, 1.75%, 4/15/20 | United States | 825,000 | 885,844 | ||
| Trading Companies & Distributors 0.1% | |||||
| fKaman Corp., senior note, 144A, 3.25%, 11/15/17 | United States | 397,000 | 526,521 | ||
| Total Convertible Bonds (Cost $74,238,927) | 76,189,649 | ||||
| Corporate Bonds and Notes 13.8% | |||||
| Aerospace & Defense 0.4% | |||||
| fBombardier Inc., senior bond, 144A, 7.50%, 3/15/25 | Canada | 2,867,000 | 2,752,320 | ||
| fKLX Inc., senior note, 144A, 5.875%, 12/01/22 | United States | 50,000 | 50,813 | ||
| fMeccanica Holdings USA Inc., senior bond, 144A, 6.25%, 1/15/40 | Italy | 100,000 | 99,250 | ||
| iRockwell Collins Inc., senior note, FRN, 0.621%, 12/15/16 | United States | 40,000 | 40,051 | ||
| 2,942,434 | |||||
| Auto Components 0.1% | |||||
| fMidas Intermediate Holdco II LLC/Midas Intermediate Holdco II Finance Inc., | |||||
| senior note, 144A, 7.875%, 10/01/22 | United States | 105,000 | 106,050 | ||
| fTrinseo Materials Operating SCA / Trinseo Materials Finance Inc., senior note, | |||||
| 144A, 6.375%, 5/01/22 | United States | 100,000 | EUR | 113,125 | |
| fZF North America Capital Inc., senior note, 144A, 4.50%, 4/29/22 | Germany | 150,000 | 153,187 | ||
| 372,362 | |||||
| Automobiles 0.1% | |||||
| f,iDaimler Finance North America LLC, senior note, 144A, FRN, 0.615%, 3/10/17 | Germany | 150,000 | 150,196 | ||
| General Motors Co., senior bond, 5.20%, 4/01/45 | United States | 120,000 | 122,309 | ||
| f,iNissan Motor Acceptance Corp., senior note, 144A, FRN, 0.833%, 3/03/17 | Japan | 105,000 | 105,447 | ||
| iToyota Motor Credit Corp., senior note, FRN, 0.664%, 1/17/19 | Japan | 40,000 | 40,163 | ||
| 418,115 | |||||
| Banks 0.3% | |||||
| Bank of America Corp., | |||||
| isenior note, FRN, 1.315%, 1/15/19 | United States | 20,000 | 20,251 | ||
| sub. bond, Series L, 3.95%, 4/21/25 | United States | 245,000 | 242,757 | ||
| sub. bond, 4.20%, 8/26/24 | United States | 135,000 | 137,133 | ||
| fDresdner Funding Trust I, junior sub. bond, 144A, 8.151%, 6/30/31 | Germany | 169,000 | 213,363 | ||
| fIntesa Sanpaolo SpA, sub. bond, 144A, 5.017%, 6/26/24 | Italy | 400,000 | 401,259 | ||
| Royal Bank of Scotland Group PLC, sub. bond, 6.125%, 12/15/22 | United Kingdom | 350,000 | 385,923 | ||
| i,jSociete Generale SA, Perpetual, | |||||
| fjunior sub., FRN, 144A, 7.875% | France | 450,000 | 463,500 | ||
| hFRN, Reg S, 7.875% | France | 425,000 | 437,750 | ||
| 2,301,936 | |||||
| Beverages 0.0%† | |||||
| iAnheuser-Busch InBev NV, senior note, FRN, 0.467%, 1/27/17 | Belgium | 45,000 | 44,956 | ||
| iThe Coca-Cola Co., senior note, FRN, 0.378%, 11/01/16 | United States | 80,000 | 80,113 | ||
| 125,069 | |||||
| Biotechnology 0.0%† | |||||
| iAmgen Inc., senior note, FRN, 0.664%, 5/22/17 | United States | 125,000 | 125,218 | ||
franklintempleton.com
Annual Report
35
FRANKLIN ALTERNATIVE STRATEGIES FUNDS
CONSOLIDATED STATEMENT O F INVESTMENTS
| Franklin K2 Alternative Strategies Fund (continued) | ||||
| Principal | ||||
| Country | Amount* | Value | ||
| Corporate Bonds and Notes (continued) | ||||
| Building Products 0.0%† | ||||
| Masco Corp., senior bond, 4.45%, 4/01/25 | United States | 30,000 | $ | 30,862 |
| fNCI Building Systems Inc., senior note, 144A, 8.25%, 1/15/23 | United States | 50,000 | 53,625 | |
| Owens Corning, senior bond, 4.20%, 12/01/24 | United States | 40,000 | 40,586 | |
| 125,073 | ||||
| Capital Markets 0.1% | ||||
| Brixmor Operating Partnership LP, senior bond, 3.85%, 2/01/25 | United States | 200,000 | 198,667 | |
| Morgan Stanley, sub. bond, 4.35%, 9/08/26 | United States | 150,000 | 152,562 | |
| 351,229 | ||||
| Chemicals 0.1% | ||||
| fA. Schulman Inc., senior note, 144A, 6.875%, 6/01/23 | United States | 580,000 | 593,050 | |
| Albemarle Corp., senior bond, 4.15%, 12/01/24 | United States | 56,000 | 57,263 | |
| 650,313 | ||||
| Commercial Services & Supplies 0.5% | ||||
| fConstellis Holdings LLC / Constellis Finance Corp., secured note, 144A, 9.75%, | ||||
| 5/15/20 | United States | 290,000 | 288,187 | |
| fiPayment Inc., senior note, 144A, 9.50%, 12/15/19 | United States | 3,360,000 | 3,259,200 | |
| 3,547,387 | ||||
| Communications Equipment 0.4% | ||||
| fAvaya Inc., senior note, 144A, 7.00%, 4/01/19 | United States | 1,160,000 | 1,165,800 | |
| iCisco Systems Inc., senior note, FRN, 0.563%, 3/03/17 | United States | 100,000 | 100,358 | |
| f,gCommScope Inc., secured note, 144A, 4.375%, 6/15/20 | United States | 300,000 | 303,375 | |
| f,gCommScope Technologies Finance LLC, senior bond, 144A, 6.00%, 6/15/25 | United States | 615,000 | 624,225 | |
| fPlantronics Inc., senior note, 144A, 5.50%, 5/31/23 | United States | 837,000 | 851,647 | |
| 3,045,405 | ||||
| Construction Materials 0.2% | ||||
| fAtrium Windows & Doors Inc., secured note, 144A, 7.75%, 5/01/19 | United States | 75,000 | 62,250 | |
| fCemex Finance LLC, secured, first lien bond, 144A, 9.375%, 10/12/22 | Mexico | 200,000 | 226,750 | |
| fCemex SAB de CV, senior bond, 144A, 6.125%, 5/05/25 | Mexico | 365,000 | 369,197 | |
| a,fNorbord Inc., secured, first lien note, 144A, 6.25%, 4/15/23 | Canada | 372,000 | 379,101 | |
| fNWH Escrow Corp., senior note, 144A, 7.50%, 8/01/21 | United States | 720,000 | 684,000 | |
| 1,721,298 | ||||
| Consumer Durables & Apparel 0.3% | ||||
| aVisant Corp., senior note, 10.00%, 10/01/17 | United States | 2,548,000 | 2,159,430 | |
| Consumer Finance 0.1% | ||||
| Ally Financial Inc., | ||||
| senior note, 4.125%, 3/30/20 | United States | 290,000 | 290,725 | |
| senior bond, 8.00%, 3/15/20 | United States | 115,000 | 136,275 | |
| Springleaf Finance Corp., senior note, 5.25%, 12/15/19 | United States | 289,000 | 293,335 | |
| 720,335 | ||||
| Containers & Packaging 0.0%† | ||||
| Berry Plastics Corp., secured, second lien note, 5.125%, 7/15/23 | United States | 130,000 | 129,675 | |
| Cosmetic and Personal Care 0.0%† | ||||
| iThe Procter & Gamble Co., senior note, FRN, 0.359%, 11/04/16 | United States | 80,000 | 80,068 | |
36 Annual Report
franklintempleton.com
FRANKLIN ALTERNATIVE STRATEGIES FUNDS
CONSOLIDATED STATEMENT O F INVESTMENTS
| Franklin K2 Alternative Strategies Fund (continued) | ||||||
| Principal | ||||||
| Country | Amount* | Value | ||||
| Corporate Bonds and Notes (continued) | ||||||
| Diversified Consumer Services 0.2% | ||||||
| fSabre GLBL Inc., secured, 144A, 5.375%, 4/15/23 | United States | 300,000 | $ | 306,750 | ||
| The ServiceMaster Co., senior note, 7.00%, 8/15/20 | United States | 283,000 | 301,395 | |||
| fSotheby’s, senior bond, 144A, 5.25%, 10/01/22 | United States | 1,120,000 | 1,122,800 | |||
| 1,730,945 | ||||||
| Diversified Financial Services 1.2% | ||||||
| iCaterpillar Financial Services Corp., senior note, FRN, 0.513%, 3/03/17 | United States | 110,000 | 110,221 | |||
| fCorp. Financiera de Desarrollo SA, 144A, | ||||||
| senior note, 3.25%, 7/15/19 | Peru | 200,000 | 203,400 | |||
| sub. bond, 5.25% to 7/15/24, FRN thereafter, 7/15/29 | Peru | 200,000 | 207,700 | |||
| fFinanciera de Desarrollo Territorial SA Findeter, senior bond, 144A, 7.875%, | ||||||
| 8/12/24 | Colombia | 795,000,000 | COP | 314,890 | ||
| iFord Motor Credit Co. LLC, senior note, FRN, 1.054%, 1/17/17 | United States | 40,000 | 40,084 | |||
| General Electric Capital Corp., | ||||||
| jjunior sub. bond, 7.125% to 6/15/22, FRN thereafter, Perpetual | United States | 100,000 | 117,000 | |||
| isenior note, FRN, 0.507%, 1/14/16 | United States | 20,000 | 20,032 | |||
| General Motors Financial Co. Inc., senior note, 3.45%, 4/10/22 | United States | 365,000 | 359,552 | |||
| fGlobal Cash Access Inc., senior note, 144A, 10.00%, 1/15/22 | United States | 1,763,000 | 1,732,147 | |||
| f,iHyundai Capital Services Inc., senior note, 144A, FRN, 1.07%, 3/18/17 | South Korea | 200,000 | 200,830 | |||
| fLadder Capital Finance Holdings LLP, senior note, 144A, 5.875%, 8/01/21 | United States | 245,000 | 237,344 | |||
| f,i,jLBG Capital No.1 PLC, junior sub., FRN, 144A, 8.00%, Perpetual | United Kingdom | 600,000 | 666,750 | |||
| fQuicken Loans Inc., senior note, 144A, 5.75%, 5/01/25 | United States | 150,000 | 150,563 | |||
| a,fROC Finance LLC/ROC Finance 1 Corp., secured, second lien note, 144A, | ||||||
| 12.125%, 9/01/18 | United States | 4,106,000 | 4,437,046 | |||
| 8,797,559 | ||||||
| Diversified Telecommunication Services 1.2% | ||||||
| Frontier Communications Corp., senior bond, 9.00%, 8/15/31 | United States | 840,000 | 831,600 | |||
| Intelsat Jackson Holdings SA, senior bond, 5.50%, 8/01/23 | Luxembourg | 1,400,000 | 1,291,066 | |||
| Intelsat Luxembourg SA, 7.75%, 6/01/21 | Luxembourg | 420,000 | 380,625 | |||
| fLevel 3 Financing Inc., senior note, 144A, 5.125%, 5/01/23 | United States | 455,000 | 456,706 | |||
| Oi SA, | ||||||
| hsenior bond, Reg S, 5.75%, 2/10/22 | Brazil | 200,000 | 177,000 | |||
| fsenior note, 144A, 9.75%, 9/15/16 | Brazil | 300,000 | BRL | 87,798 | ||
| Telecom Italia Capital SA, senior bond, | ||||||
| 6.00%, 9/30/34 | Italy | 191,000 | 191,000 | |||
| 7.20%, 7/18/36 | Italy | 408,000 | 452,880 | |||
| 7.721%, 6/04/38 | Italy | 108,000 | 124,740 | |||
| iVerizon Communications Inc., senior note, FRN, 0.664%, 6/09/17 | United States | 125,000 | 124,886 | |||
| fWind Acquisition Finance SA, senior note, 144A, | ||||||
| 4.75%, 7/15/20 | Italy | 200,000 | 202,000 | |||
| 7.375%, 4/23/21 | Italy | 400,000 | 418,000 | |||
| Windstream Services LLC, | ||||||
| senior bond, 6.375%, 8/01/23 | United States | 3,772,000 | 3,182,625 | |||
| senior bond, 7.75%, 10/01/21 | United States | 705,000 | 669,750 | |||
| senior note, 7.75%, 10/15/20 | United States | 470,000 | 479,400 | |||
| 9,070,076 | ||||||
| Electric Utilities 0.1% | ||||||
| iDuke Energy Corp., senior note, FRN, 0.651%, 4/03/17 | United States | 100,000 | 100,205 | |||
franklintempleton.com
Annual Report
37
FRANKLIN ALTERNATIVE STRATEGIES FUNDS
CONSOLIDATED STATEMENT O F INVESTMENTS
| Franklin K2 Alternative Strategies Fund (continued) | |||||
| Principal | |||||
| Country | Amount* | Value | |||
| Corporate Bonds and Notes (continued) | |||||
| Electric Utilities (continued) | |||||
| iDuke Energy Progress Inc., secured note, FRN, 0.464%, 3/06/17 | United States | 50,000 | $ | 49,952 | |
| fEDP Finance BV, senior note, 144A, 4.125%, 1/15/20 | Portugal | 250,000 | 257,924 | ||
| fPPL Energy Supply LLC, senior bond, 144A, 6.50%, 6/01/25 | United States | 190,000 | 193,861 | ||
| 601,942 | |||||
| Electronic Equipment, Instruments & Components 0.0%† | |||||
| fKeysight Technologies Inc., senior bond, 144A, 4.55%, 10/30/24 | United States | 235,000 | 232,811 | ||
| Energy 0.0%† | |||||
| fEnel SpA, sub. bond, 8.75% to 9/24/23, FRN thereafter, 144A, 9/24/73 | Italy | 200,000 | 239,000 | ||
| Food & Staples Retailing 0.0%† | |||||
| a,fRite Aid Corp., senior note, 144A, 6.125%, 4/01/23 | United States | 266,000 | 277,638 | ||
| Food Products 0.3% | |||||
| Post Holdings Inc., senior note, 7.375%, 2/15/22 | United States | 1,001,000 | 1,028,107 | ||
| Tesco PLC, senior bond, | |||||
| 5.125%, 4/10/47 | United Kingdom | 600,000 | EUR | 688,083 | |
| 6.125%, 2/24/22 | United Kingdom | 150,000 | GBP | 255,039 | |
| 1,971,229 | |||||
| Health Care Equipment & Supplies 0.6% | |||||
| aUniversal Hospital Services Inc., senior note, 7.625%, 8/15/20 | United States | 4,708,000 | 4,384,325 | ||
| Health Care Providers & Services 0.1% | |||||
| aCommunity Health Systems Inc., senior note, 7.125%, 7/15/20 | United States | 350,000 | 374,063 | ||
| WellCare Health Plans Inc., senior note, 5.75%, 11/15/20 | United States | 560,000 | 591,150 | ||
| 965,213 | |||||
| Hotels, Restaurants & Leisure 1.5% | |||||
| Boyd Gaming Corp., senior note, 6.875%, 5/15/23 | United States | 434,000 | 443,765 | ||
| aCaesars Entertainment Resort Properties, secured, second lien note, 11.00%, | |||||
| 10/01/21 | United States | 1,640,000 | 1,536,352 | ||
| Choice Hotels International Inc., senior bond, 5.70%, 8/28/20 | United States | 125,000 | 137,188 | ||
| fGolden Nugget Escrow Inc., senior note, 144A, 8.50%, 12/01/21 | United States | 560,000 | 590,800 | ||
| fGreektown Holdings LLC/Greektown Mothership Corp., senior note, 144A, | |||||
| 8.875%, 3/15/19 | United States | 2,356,000 | 2,503,250 | ||
| MGM Resorts International, senior note, 6.00%, 3/15/23 | United States | 330,000 | 343,612 | ||
| f,kMohegan Tribal Gaming Authority, senior note, PIK, 144A, 11.00%, 9/15/18 | United States | 2,372,000 | 2,386,825 | ||
| a,fDownstream Development Authority of the Quapaw Tribe of Oklahoma, secured | |||||
| note, 144A, 10.50%, 7/01/19 | United States | 3,282,000 | 3,257,385 | ||
| 11,199,177 | |||||
| Household Durables 0.1% | |||||
| Sharp Corp., senior note, 1.604%, 9/13/19 | Japan | 100,000,000 | JPY | 618,408 | |
| Independent Power Producers & Energy Traders 0.0%† | |||||
| fTerraForm Power Operating LLC, senior note, 144A, 5.875%, 2/01/23 | United States | 120,000 | 124,200 | ||
| Insurance 0.1% | |||||
| hAssicurazioni Generali SpA, senior sub. bond, 7.75% to 12/12/22, FRN | |||||
| thereafter, 12/12/42, Reg S | Italy | 300,000 | EUR | 416,122 | |
| CNO Financial Group Inc., senior bond, 5.25%, 5/30/25 | United States | 170,000 | 176,800 | ||
38 Annual Report
franklintempleton.com
FRANKLIN ALTERNATIVE STRATEGIES FUNDS
CONSOLIDATED STATEMENT O F INVESTMENTS
| Franklin K2 Alternative Strategies Fund (continued) | ||||
| Principal | ||||
| Country | Amount* | Value | ||
| Corporate Bonds and Notes (continued) | ||||
| Insurance (continued) | ||||
| Genworth Holdings Inc., senior bond, | ||||
| 4.90%, 8/15/23 | United States | 30,000 | $ | 26,831 |
| 4.80%, 2/15/24 | United States | 45,000 | 38,813 | |
| Old Republic International Corp., senior bond, 4.875%, 10/01/24 | United States | 225,000 | 237,012 | |
| 895,578 | ||||
| Internet Software & Services 0.1% | ||||
| fBlue Coat Holdings Inc., senior note, 144A, 8.375%, 6/01/23 | United States | 330,000 | 334,125 | |
| Life Sciences Tools & Services 0.4% | ||||
| finVentiv Health Inc., senior note, 144A, 11.00%, 8/15/18 | United States | 3,059,500 | 3,013,608 | |
| Machinery 0.0%† | ||||
| iJohn Deere Capital Corp., senior note, FRN, 0.385%, 12/10/15 | United States | 80,000 | 80,059 | |
| Media 2.7% | ||||
| fAltice SA, senior note, 144A, 7.75%, 5/15/22 | Luxembourg | 877,000 | 887,962 | |
| f,gAltice U.S. Finance I Corp., secured, 144A, 5.375%, 7/15/23 | Luxembourg | 375,000 | 375,000 | |
| American Media Inc., secured, first lien note, 11.50%, 12/15/17 | United States | 3,710,000 | 3,904,775 | |
| fCCO Holdings LLC/CCO Holdings Capital Corp., senior note, 144A, 5.125%, | ||||
| 5/01/23 | United States | 185,000 | 186,619 | |
| iCharter Communications Operating LLC, senior secured note, first lien guaranteed, | ||||
| FRN, 3.00%, 7/01/20 | United States | 114,708 | 114,090 | |
| DISH DBS Corp., senior note, | ||||
| 5.875%, 7/15/22 | United States | 170,000 | 173,825 | |
| 5.875%, 11/15/24 | United States | 485,000 | 487,425 | |
| fDreamWorks Animation SKG Inc., senior note, 144A, 6.875%, 8/15/20 | United States | 822,000 | 826,110 | |
| a,fLee Enterprises Inc./IA, senior note, secured, 144A, 9.50%, 3/15/22 | United States | 2,003,000 | 2,049,319 | |
| The McClatchy Co., | ||||
| senior bond, 5.75%, 9/01/17 | United States | 324,000 | 340,605 | |
| senior note, secured, 9.00%, 12/15/22 | United States | 2,077,000 | 2,032,864 | |
| Postmedia Network Inc., secured, second lien note, 12.50%, 7/15/18 | Canada | 3,366,000 | 3,492,225 | |
| Time Warner Cable Inc., senior bond, | ||||
| 4.50%, 9/15/42 | United States | 570,000 | 493,972 | |
| 5.875%, 11/15/40 | United States | 507,000 | 513,056 | |
| aWideOpenWest Finance LLC/Capital Corp., senior note, 10.25%, 7/15/19 | United States | 4,603,000 | 4,930,964 | |
| 20,808,811 | ||||
| Metals & Mining 0.5% | ||||
| AK Steel Corp., | ||||
| senior bond, 7.625%, 5/15/20 | United States | 1,861,000 | 1,649,311 | |
| senior note, 7.625%, 10/01/21 | United States | 2,082,000 | 1,743,675 | |
| ArcelorMittal, senior bond, 7.75%, 10/15/39 | Luxembourg | 100,000 | 103,343 | |
| 3,496,329 | ||||
| Oil, Gas & Consumable Fuels 0.9% | ||||
| Antero Resources Corp., senior note, 5.125%, 12/01/22 | United States | 65,000 | 65,162 | |
| fBaytex Energy Corp., senior note, 144A, | ||||
| 5.125%, 6/01/21 | Canada | 10,000 | 9,775 | |
| 5.625%, 6/01/24 | Canada | 10,000 | 9,700 | |
| Bonanza Creek Energy Inc., senior note, | ||||
| 6.75%, 4/15/21 | United States | 15,000 | 14,588 | |
| 5.75%, 2/01/23 | United States | 55,000 | 51,150 | |
franklintempleton.com
Annual Report
39
FRANKLIN ALTERNATIVE STRATEGIES FUNDS
CONSOLIDATED STATEMENT O F INVESTMENTS
| Franklin K2 Alternative Strategies Fund (continued) | ||||
| Principal | ||||
| Country | Amount* | Value | ||
| Corporate Bonds and Notes (continued) | ||||
| Oil, Gas & Consumable Fuels (continued) | ||||
| iBP Capital Markets PLC, senior note, FRN, 0.696%, 11/07/16 | United Kingdom | 80,000 | $ | 80,102 |
| California Resources Corp., senior note, 6.00%, 11/15/24 | United States | 165,000 | 152,625 | |
| iCanadian Natural Resources Ltd., senior note, FRN, 0.648%, 3/30/16 | Canada | 100,000 | 99,873 | |
| Chesapeake Energy Corp., | ||||
| senior note, 4.875%, 4/15/22 | United States | 145,000 | 138,837 | |
| senior note, 5.375%, 6/15/21 | United States | 5,000 | 4,950 | |
| senior bond, 6.625%, 8/15/20 | United States | 5,000 | 5,275 | |
| iChevron Corp., senior note, FRN, 0.444%, 11/15/17 | United States | 145,000 | 145,143 | |
| Comstock Resources Inc., | ||||
| fsecured, 144A, 10.00%, 3/15/20 | United States | 696,000 | 669,465 | |
| senior note, 7.75%, 4/01/19 | United States | 122,000 | 58,560 | |
| Concho Resources Inc., senior bond, | ||||
| 5.50%, 10/01/22 | United States | 55,000 | 56,100 | |
| 5.50%, 4/01/23 | United States | 45,000 | 45,900 | |
| Continental Resources Inc., | ||||
| senior bond, 5.00%, 9/15/22 | United States | 25,000 | 24,969 | |
| senior note, 4.50%, 4/15/23 | United States | 15,000 | 14,777 | |
| senior note, 3.80%, 6/01/24 | United States | 50,000 | 46,407 | |
| Diamondback Energy Inc., senior note, 7.625%, 10/01/21 | United States | 150,000 | 162,000 | |
| EXCO Resources Inc., senior note, 7.50%, 9/15/18 | United States | 114,000 | 78,945 | |
| iExxon Mobil Corp., senior note, FRN, 0.311%, 3/15/17 | United States | 110,000 | 109,988 | |
| Forest Oil Corp., | ||||
| asenior bond, 7.25%, 6/15/19 | United States | 716,000 | 168,260 | |
| senior note, 7.50%, 9/15/20 | United States | 377,000 | 88,595 | |
| Halcon Resources Corp., | ||||
| fsecured, second lien senior note, 144A, 8.625%, 2/01/20 | United States | 25,000 | 25,438 | |
| senior note, 9.75%, 7/15/20 | United States | 370,000 | 271,950 | |
| MarkWest Energy Partners LP/MarkWest Energy Finance Corp., senior bond, | ||||
| 4.875%, 12/01/24 | United States | 300,000 | 304,500 | |
| fMatador Resources Co., senior note, 144A, 6.875%, 4/15/23 | United States | 32,000 | 33,040 | |
| fMEG Energy Corp., 144A, | ||||
| senior bond, 6.375%, 1/30/23 | Canada | 35,000 | 33,250 | |
| senior note, 6.50%, 3/15/21 | Canada | 35,000 | 34,125 | |
| senior bond, 7.00%, 3/31/24 | Canada | 75,000 | 72,750 | |
| Oasis Petroleum Inc., senior note, | ||||
| 7.25%, 2/01/19 | United States | 10,000 | 10,325 | |
| 6.875%, 3/15/22 | United States | 55,000 | 56,512 | |
| fPacific Rubiales Energy Corp., senior bond, 144A, | ||||
| 5.125%, 3/28/23 | Colombia | 100,000 | 81,000 | |
| 5.625%, 1/19/25 | Colombia | 310,000 | 249,550 | |
| fPBF Logistics LP / PBF Logistics Finance Corp., senior note, 144A, 6.875%, | ||||
| 5/15/23 | United States | 362,000 | 370,145 | |
| Petrobras Global Finance BV, senior bond, 5.625%, 5/20/43 | Brazil | 280,000 | 231,927 | |
| hPetroleos de Venezuela SA, senior bond, Reg S, 6.00%, 11/15/26 | Venezuela | 3,995,000 | 1,508,112 | |
| Rice Energy Inc., senior note, 6.25%, 5/01/22 | United States | 65,000 | 66,990 | |
| Rosetta Resources Inc., | ||||
| senior note, 5.625%, 5/01/21 | United States | 15,000 | 15,977 | |
| senior note, 5.875%, 6/01/22 | United States | 45,000 | 48,262 | |
| senior bond, 5.875%, 6/01/24 | United States | 5,000 | 5,419 | |
| fSabine Pass Liquefaction LLC, senior note, 144A, 5.625%, 3/01/25 | United States | 300,000 | 301,125 | |
40 Annual Report
franklintempleton.com
FRANKLIN ALTERNATIVE STRATEGIES FUNDS
CONSOLIDATED STATEMENT O F INVESTMENTS
| Franklin K2 Alternative Strategies Fund (continued) | |||||
| Principal | |||||
| Country | Amount* | Value | |||
| Corporate Bonds and Notes (continued) | |||||
| Oil, Gas & Consumable Fuels (continued) | |||||
| f,gSandRidge Energy Inc., senior note, 144A, 8.75%, 6/01/20 | United States | 92,000 | $ | 91,425 | |
| iShell International Finance BV, senior note, FRN, 0.484%, 11/15/16 | Netherlands | 80,000 | 80,184 | ||
| SM Energy Co., | |||||
| senior note, 6.50%, 11/15/21 | United States | 10,000 | 10,500 | ||
| fsenior note, 144A, 6.125%, 11/15/22 | United States | 88,000 | 92,180 | ||
| senior bond, 6.50%, 1/01/23 | United States | 25,000 | 26,125 | ||
| senior note, 5.00%, 1/15/24 | United States | 50,000 | 49,250 | ||
| Targa Resources Partners LP/Targa Resources Partners Finance Corp., | |||||
| fsenior note, 144A, 5.00%, 1/15/18 | United States | 105,000 | 108,937 | ||
| senior bond, 6.375%, 8/01/22 | United States | 25,000 | 26,563 | ||
| senior bond, 5.25%, 5/01/23 | United States | 15,000 | 15,300 | ||
| senior bond, 4.25%, 11/15/23 | United States | 5,000 | 4,838 | ||
| fUltra Petroleum Corp., 144A, | |||||
| senior note, 5.75%, 12/15/18 | United States | 20,000 | 19,450 | ||
| senior bond, 6.125%, 10/01/24 | United States | 50,000 | 46,188 | ||
| fWestern Refining Logistics LP/WNRL Finance Corp., senior bond, 144A, 7.50%, | |||||
| 2/15/23 | United States | 80,000 | 83,800 | ||
| Whiting Petroleum Corp., senior note, | |||||
| 5.00%, 3/15/19 | United States | 25,000 | 25,125 | ||
| 5.75%, 3/15/21 | United States | 125,000 | 127,812 | ||
| Whiting Petroleum Corp., senior note, | |||||
| 6.50%, 10/01/18 | United States | 145,000 | 148,987 | ||
| Williams Partners LP, senior bond, 4.00%, 9/15/25 | United States | 205,000 | 202,046 | ||
| 7,180,253 | |||||
| Paper & Forest Products 0.1% | |||||
| Resolute Forest Products Inc., senior note, 5.875%, 5/15/23 | United States | 985,000 | 913,588 | ||
| Pharmaceuticals 0.3% | |||||
| AbbVie Inc., senior bond, 3.60%, 5/14/25 | United States | 510,000 | 514,047 | ||
| fConcordia Healthcare Corp., senior note, 144A, 7.00%, 4/15/23 | Canada | 837,000 | 844,324 | ||
| fEndo Finance LLC & Endo Finco Inc., senior note, 144A, 5.375%, 1/15/23 | United States | 294,000 | 288,120 | ||
| iJohnson & Johnson, senior note, FRN, 0.356%, 11/28/16 | United States | 20,000 | 20,025 | ||
| iMerck & Co. Inc., senior note, FRN, 0.404%, 2/10/17 | United States | 165,000 | 165,127 | ||
| fValeant Pharmaceuticals International Inc., senior note, 144A, | |||||
| 4.50%, 5/15/23 | United States | 205,000 | EUR | 228,303 | |
| 5.50%, 3/01/23 | United States | 200,000 | 204,500 | ||
| 6.375%, 10/15/20 | United States | 70,000 | 74,856 | ||
| 2,339,302 | |||||
| Pipelines 0.0%† | |||||
| Regency Energy Partners LP/Regency Energy Finance Corp., senior note, 5.75%, | |||||
| 9/01/20 | United States | 140,000 | 154,700 | ||
| Professional Services 0.0%† | |||||
| fIHS Inc., senior note, 144A, 5.00%, 11/01/22 | United States | 50,000 | 50,625 | ||
| Verisk Analytics Inc., senior bond, 5.50%, 6/15/45 | United States | 210,000 | 214,513 | ||
| 265,138 | |||||
| Real Estate 0.0%† | |||||
| fRialto Holdings LLC/Rialto Corp., senior note, 144A, 7.00%, 12/01/18 | United States | 203,000 | 213,658 | ||
franklintempleton.com
Annual Report
41
FRANKLIN ALTERNATIVE STRATEGIES FUNDS
CONSOLIDATED STATEMENT O F INVESTMENTS
| Franklin K2 Alternative Strategies Fund (continued) | |||||
| Principal | |||||
| Country | Amount* | Value | |||
| Corporate Bonds and Notes (continued) | |||||
| Real Estate Investment Trusts (REITs) 0.2% | |||||
| ARC Properties Operating Partnership LP, senior note, 4.60%, 2/06/24 | United States | 523,000 | $ | 519,077 | |
| fCommunications Sales & Leasing Inc., senior note, 144A, 8.25%, 10/15/23 | United States | 840,000 | 858,900 | ||
| Healthcare Realty Trust Inc., senior bond, 3.875%, 5/01/25 | United States | 75,000 | 74,037 | ||
| iStar Financial Inc., senior note, 4.00%, 11/01/17 | United States | 245,000 | 242,244 | ||
| 1,694,258 | |||||
| Real Estate Management & Development 0.0%† | |||||
| fInterval Acquisition Corp., senior note, 144A, 5.625%, 4/15/23 | United States | 205,000 | 210,125 | ||
| Retailing 0.1% | |||||
| New Albertsons Inc., senior bond, | |||||
| 7.45%, 8/01/29 | United States | 760,000 | 741,000 | ||
| 8.00%, 5/01/31 | United States | 53,000 | 52,669 | ||
| 793,669 | |||||
| Semiconductors & Semiconductor Equipment 0.1% | |||||
| KLA-Tencor Corp., senior note, 4.65%, 11/01/24 | United States | 173,000 | 177,178 | ||
| fMicron Technology Inc., 144A, | |||||
| senior note, 5.25%, 1/15/24 | United States | 230,000 | 228,275 | ||
| senior bond, 5.625%, 1/15/26 | United States | 230,000 | 226,550 | ||
| 632,003 | |||||
| Software 0.1% | |||||
| fOpen Text Corp., senior note, 144A, 5.625%, 1/15/23 | Canada | 220,000 | 222,200 | ||
| iOracle Corp., senior note, FRN, 0.471%, 7/07/17 | United States | 135,000 | 135,317 | ||
| fRolta Americas LLC, senior note, 144A, 8.875%, 7/24/19 | India | 260,000 | 227,500 | ||
| 585,017 | |||||
| Textiles, Apparel & Luxury Goods 0.1% | |||||
| fEmpire Today LLC / Empire Today Finance Corp., secured, first lien note, 144A, | |||||
| 11.375%, 2/01/17 | United States | 1,248,000 | 1,048,320 | ||
| Trading Companies & Distributors 0.2% | |||||
| Air Lease Corp., | |||||
| senior note, 3.75%, 2/01/22 | United States | 90,000 | 90,814 | ||
| senior bond, 4.25%, 9/15/24 | United States | 170,000 | 172,550 | ||
| Aircastle Ltd., senior note, 5.50%, 2/15/22 | United States | 15,000 | 15,900 | ||
| fReal Alloy Holding Inc., senior note, 144A, 10.00%, 1/15/19 | United States | 1,405,000 | 1,429,588 | ||
| 1,708,852 | |||||
| Transportation 0.0%† | |||||
| iCanadian National Railway Co., senior note, FRN, 0.48%, 11/06/15 | Canada | 80,000 | 80,020 | ||
| Total Corporate Bonds and Notes (Cost $105,453,001) | 105,475,283 | ||||
| Corporate Notes in Reorganization 0.6% | |||||
| Commercial Services & Supplies 0.2% | |||||
| a,f,lAltegrity Inc., secured, first lien note, 144A, 7/01/19 | United States | 2,055,000 | 1,972,800 | ||
| Electric Utilities 0.4% | |||||
| f,lEnergy Future Intermediate Holding Co./EFIH Finance Inc., senior note, 144A, | |||||
| 12/01/18 | United States | 2,652,000 | 3,076,320 | ||
| Total Corporate Notes in Reorganization (Cost $5,006,020) | 5,049,120 | ||||
42 Annual Report
franklintempleton.com
FRANKLIN ALTERNATIVE STRATEGIES FUNDS
CONSOLIDATED STATEMENT O F INVESTMENTS
| Franklin K2 Alternative Strategies Fund (continued) | ||||
| Principal | ||||
| Country | Amount* | Value | ||
| i,mSenior Floating Rate Interests 0.6% | ||||
| Aerospace & Defense 0.1% | ||||
| Awas Aviation, Term Loan, 3.50%, 7/16/18 | United States | 17,507 | $ | 17,638 |
| TransDigm Group Inc., | ||||
| Term Loan D, 3.75%, 6/04/21 | United States | 126,592 | 126,641 | |
| Tranche C Term Loan, senior secured, first lien guaranteed, 3.75%, 2/28/20 | United States | 71,194 | 71,194 | |
| Term Loan E, 3.50%, 5/14/22 | United States | 94,186 | 93,725 | |
| 309,198 | ||||
| Air Freight & Logistics 0.0%† | ||||
| Goodpack Ltd., Term Loan, first lien, 4.75%, 9/10/21 | United States | 50,043 | 50,168 | |
| Auto Components 0.0%† | ||||
| Visteon Corp., Term Loan B, 3.50%, 4/08/21 | United States | 74,717 | 74,834 | |
| Building Materials 0.0%† | ||||
| Quikrete Holdings Inc., Term Loan, first lien, 4.00%, 9/26/20 | United States | 74,242 | 74,412 | |
| Building Products 0.0%† | ||||
| Continental Building Products Inc., Term Loan, first lien, 4.00%, 8/28/20 | United States | 54,193 | 54,278 | |
| Ply Gem Holdings Inc., Term Loan, 4.00%, 2/01/21 | United States | 8,510 | 8,508 | |
| 62,786 | ||||
| Chemicals 0.0%† | ||||
| The Chemours Co., Term Loan B, 3.75%, 6/30/15 | United States | 30,974 | 31,071 | |
| Axalta Coating Systems Dutch Holding B B.V. (Axalta Coating Systems U.S. | ||||
| Holdings Inc.), Refinanced Term Loan B, 3.75%, 2/01/20 | United States | 10,219 | 10,232 | |
| Emerald Performance Materials LLC, Term Loan, first lien, 4.50%, 7/18/21 | United States | 31,840 | 31,959 | |
| 73,262 | ||||
| Commercial Services & Supplies 0.0%† | ||||
| Onsite Rental Group Ltd., Term Loan B, 5.50%, 7/23/21 | United States | 118,392 | 117,356 | |
| Communications Equipment 0.0%† | ||||
| LTS Buyer LLC, senior secured, Term Loan B, first lien guaranteed, 4.00%, | ||||
| 4/13/20 | United States | 33,033 | 33,053 | |
| Containers & Packaging 0.0%† | ||||
| Ardagh Holdings USA Inc. (Ardagh Packaging Finance S.A), New Term Loan, | ||||
| 4.00%, 12/17/19 | United States | 20,974 | 21,053 | |
| FPC Holdings Inc., Initial Term Loan, senior secured, first lien, 5.25%, 11/27/19 | United States | 6,866 | 6,844 | |
| 27,897 | ||||
| Distributors 0.0%† | ||||
| American Tire Distributors Inc., Term Loan B, 5.25%, 9/01/21 | United States | 13,645 | 13,801 | |
| Diversified Consumer Services 0.0%† | ||||
| The ServiceMaster Co., Term Loan, 4.25%, 7/01/21 | United States | 111,730 | 112,159 | |
| Diversified Financial Services 0.0%† | ||||
| American Beacon Advisors Inc., Term Loan B, 5.50%, 3/06/22 | United States | 10,484 | 10,628 | |
| HarbourVest Partners L.P., New Term Loan, 3.25%, 2/04/21 | United States | 9,009 | 9,021 | |
| 19,649 | ||||
| Diversified Telecommunication Services 0.0%† | ||||
| Cable & Wireless, Term Loan B, 5.50%, 11/06/16 | United Kingdom | 80,545 | 80,670 | |
| Level 3 Financing Inc., Term Loan B, 3.50%, 5/31/22 | United States | 48,413 | 48,304 | |
franklintempleton.com
Annual Report
43
FRANKLIN ALTERNATIVE STRATEGIES FUNDS
CONSOLIDATED STATEMENT O F INVESTMENTS
| Franklin K2 Alternative Strategies Fund (continued) | |||||
| Principal | |||||
| Country | Amount* | Value | |||
| i,mSenior Floating Rate Interests (continued) | |||||
| Diversified Telecommunication Services (continued) | |||||
| Zayo Group Holdings Inc., Term Loan, 3.75%, 5/06/21 | United States | 56,797 | $ | 56,807 | |
| 185,781 | |||||
| Electrical Equipment 0.1% | |||||
| Generac Power Systems Inc., Term Loan B, 3.25%, 5/31/20 | United States | 272,490 | 272,524 | ||
| Food Products 0.0%† | |||||
| ARAMARK Corp., Term Loan F, senior secured, first lien guaranteed, 3.25%, | |||||
| 2/24/21 | United States | 89,100 | 89,285 | ||
| Reddy Ice Corp., Term Loan B, first lien, 6.75%, 4/01/19 | United States | 6,235 | 5,536 | ||
| 94,821 | |||||
| Health Care Equipment & Supplies 0.0%† | |||||
| Ortho-Clinical Diagnostics Inc., Term Loan B, 4.75%, 5/07/21 | United States | 55,580 | 54,984 | ||
| Sterigenics – Nordian Holdings LLC, Term Loan B, 4.25%, 5/08/22 | United States | 40,000 | 40,200 | ||
| 95,184 | |||||
| Health Care Providers & Services 0.0%† | |||||
| Community Health Systems, Term Loan H, 4.00%, 1/27/21 | United States | 20,000 | 20,084 | ||
| Health Care Technology 0.0%† | |||||
| IMS Health Holdings Inc., Dollar B Term Loan, 3.50%, 3/07/21 | United States | 16,830 | 16,875 | ||
| Hotels, Restaurants & Leisure 0.0%† | |||||
| Hilton Worldwide Finance LLC, senior secured, first lien guaranteed, 3.50%, | |||||
| 10/26/20 | United States | 51,338 | 51,484 | ||
| La Quinta Intermediate Holdings LLC, Initial Term Loan, 4.00%, 4/14/21 | United States | 96,329 | 96,691 | ||
| 148,175 | |||||
| Household Products 0.0%† | |||||
| Libbey Glass Inc., Initial Term Loan, 3.75%, 4/07/21 | United States | 7,657 | 7,669 | ||
| Independent Power Producers & Energy Traders 0.0%† | |||||
| Calpine Construction Finance Co. LP, | |||||
| Delayed Term Loan, 4.00%, 10/21/20 | United States | 6,583 | 6,601 | ||
| senior secured, first lien guaranteed, 3.00%, 5/03/20 | United States | 20,684 | 20,494 | ||
| 27,095 | |||||
| Industrial Conglomerates 0.0%† | |||||
| Crosby U.S. Acquisition Corp., 3.75%, 11/23/20 | United States | 19,750 | 18,787 | ||
| Insurance 0.0%† | |||||
| Asurion LLC, senior secured, first lien, Incremental Tranche B-1 Term Loan, 5.00%, | |||||
| 5/24/19 | United States | 53,022 | 53,309 | ||
| Hyperion Insurance Group Ltd., Term Loan B, 5.50%, 4/29/22 | United States | 45,000 | 45,393 | ||
| Sedgwick Claims Management Services Inc., Initial Term Loan, first lien, 3.75%, | |||||
| 3/01/21 | United States | 50,193 | 49,707 | ||
| 148,409 | |||||
| Investment Companies 0.0%† | |||||
| Grosvenor Capital Management Holdings, LLP, Initial Term Loan, 3.75%, 11/25/20 | United States | 9,703 | 9,678 | ||
| IT Services 0.0%† | |||||
| Aptean Inc., Term Loan, 5.25%, 2/26/20 | United States | 49,500 | 49,376 | ||
44 Annual Report
franklintempleton.com
FRANKLIN ALTERNATIVE STRATEGIES FUNDS
CONSOLIDATED STATEMENT O F INVESTMENTS
| Franklin K2 Alternative Strategies Fund (continued) | ||||
| Principal | ||||
| Country | Amount* | Value | ||
| i,mSenior Floating Rate Interests (continued) | ||||
| Leisure Products 0.0%† | ||||
| Bauer Performance Sports Ltd., Initial Term Loan B, 4.00%, 4/02/21 | United States | 11,580 | $ | 11,589 |
| SRAM LLC, Term Loan, senior secured, first lien guaranteed, 5.25%, 4/10/20 | United States | 35,231 | 35,246 | |
| 46,835 | ||||
| Machinery 0.0%† | ||||
| Dematic, New Incremental Term Loan, 4.25%, 12/28/19 | United States | 3,374 | 3,379 | |
| North American Lifting Holdings Inc., Initial Term Loan, 5.50%, 11/26/20 | United States | 15,817 | 15,382 | |
| Signode Industrial Group, Initial Term Loan B, 3.75%, 5/01/21 | United States | 53,362 | 53,445 | |
| 72,206 | ||||
| Media 0.1% | ||||
| Creative Artists, Term Loan B, 5.50%, 12/10/21 | United States | 54,388 | 55,000 | |
| Time Inc., Term Loan B, 4.25%, 4/17/21 | United States | 34,738 | 34,759 | |
| Townsquare Media Inc., Term Loan B, 4.25%, 4/01/22 | United States | 20,470 | 20,658 | |
| Virgin Media, Term Loan, 3.50%, 6/05/20 | United Kingdom | 138,031 | 137,955 | |
| The Weather Channel, Term Loan, 7.00%, 6/26/20 | United States | 250,000 | 230,625 | |
| William Morris Endeavor Entertainment LLC, Term Loan, first lien, 5.25%, | ||||
| 3/12/21 | United States | 52,603 | 52,655 | |
| 531,652 | ||||
| Metals & Mining 0.0%† | ||||
| ABC Supply, Term Loan B, 3.50%, 4/16/20 | United States | 64,509 | 64,596 | |
| Doncasters Finance U.S. Finance LLC, (Doncasters U.S. LLC), Term Loan B, | ||||
| 4.50%, 4/09/20 | United States | 10,898 | 10,925 | |
| 75,521 | ||||
| Miscellaneous Manufacturing 0.0%† | ||||
| Gates Global Inc., Term Loan B, 4.25%, 7/03/21 | United States | 33,830 | 33,730 | |
| Oil, Gas & Consumable Fuels 0.0%† | ||||
| Energy Transfer Partners LP, Term Loan C, 4.00%, 12/02/19 | United States | 39,998 | 40,086 | |
| Power Buyer LLC, senior secured, first lien, | ||||
| Delayed Draw Term Loan, 4.25%, 5/06/20 | United States | 3,417 | 3,417 | |
| Initial Term Loan, 4.25%, 5/06/20 | United States | 63,832 | 63,832 | |
| Western Refining Inc., Term Loan B, 4.25%, 11/12/20 | United States | 74,823 | 75,080 | |
| 182,415 | ||||
| Pharmaceuticals 0.1% | ||||
| Amneal Pharmaceuticals LLC, Term Loan B, senior secured, first lien guaranteed, | ||||
| 6.25%, 11/01/19 | United States | 19,643 | 19,774 | |
| JLL/Delta Dutch Newco B.V., Initial Dollar Term Loan, 4.25%, 3/11/21 | United States | 9,925 | 9,914 | |
| Mallinckrodt International Finance S.A., Initial Term Loan, 3.25%, 3/19/21 | United States | 86,279 | 86,326 | |
| Valeant Pharmaceuticals International, Inc., Term Loan B, 4.00%, 3/10/22 | United States | 135,928 | 136,484 | |
| 252,498 | ||||
| Pipelines 0.0%† | ||||
| Energy Transfer Equity, L.P., Term Loan, 3.25%, 12/02/19 | United States | 40,000 | 39,900 | |
| Southcross Energy Partners LP, senior secured, 5.25%, 8/04/21 | United States | 29,925 | 29,850 | |
| 69,750 | ||||
| Professional Services 0.0%† | ||||
| iQor Inc., Term Loan B, first lien, 6.00%, 4/01/21 | United States | 69,107 | 64,356 | |
franklintempleton.com
Annual Report
45
FRANKLIN ALTERNATIVE STRATEGIES FUNDS
CONSOLIDATED STATEMENT O F INVESTMENTS
| Franklin K2 Alternative Strategies Fund (continued) | ||||||
| Principal | ||||||
| Country | Amount* | Value | ||||
| i,mSenior Floating Rate Interests (continued) | ||||||
| Real Estate Investment Trusts (REITs) 0.0%† | ||||||
| Communications Sales & Leasing Inc., 5.00%, 10/08/22 | United States | 90,000 | $ | 89,933 | ||
| Real Estate Management & Development 0.1% | ||||||
| The Brickman Group Ltd. LLC, Initial Term Loan, 4.00%, 12/18/20 | United States | 6,913 | 6,919 | |||
| Realogy Group LLC/Realogy Co-Issuer Corp, Initial Term Loan B, 3.75%, | ||||||
| 3/05/20 | United States | 199,438 | 199,968 | |||
| 206,887 | ||||||
| Retailing 0.0%† | ||||||
| The Hillman Group, Term Loan B, 4.50%, 6/30/21 | United States | 41,433 | 41,795 | |||
| Talbots Inc., Term Loan, first lien, 5.50%, 3/14/20 | United States | 68,015 | 67,165 | |||
| 108,960 | ||||||
| Semiconductors & Semiconductor Equipment 0.0%† | ||||||
| Entegris Inc., Tranche B Term Loan, 3.50%, 3/25/21 | United States | 16,689 | 16,710 | |||
| NXP BV, Tranche D Term Loan, 3.25%, 1/22/20 | Netherlands | 9,850 | 9,838 | |||
| 26,548 | ||||||
| Software 0.1% | ||||||
| BMC Software Finance Inc., senior secured, Term Loan, first lien guaranteed, | ||||||
| 5.00%, 9/10/20 | United States | 69,210 | 68,133 | |||
| Infor (US) Inc. (Lawson Software Inc.), Tranche B-5 Term Loan, 3.75%, | ||||||
| 6/03/20 | United States | 64,513 | 64,367 | |||
| Micro Focus International PLC, Term Loan B, 5.25%, 10/07/21 | United Kingdom | 70,496 | 70,785 | |||
| Renaissance Learning Inc., Initial Term Loan, first lien, 4.50%, 4/09/21 | United States | 31,089 | 30,752 | |||
| Vertafore Inc., Term Loan B, 4.25%, 10/03/19 | United States | 74,425 | 74,741 | |||
| 308,778 | ||||||
| Specialty Retail 0.0%† | ||||||
| GNC Holdings Inc., Term Loan, 3.25%, 3/18/19 | United States | 99,915 | 99,322 | |||
| Trading Companies & Distributors 0.0%† | ||||||
| Hd Supply, Term Loan B, 4.00%, 6/28/18 | United States | 56,442 | 56,639 | |||
| Transportation 0.0%† | ||||||
| OSG Bulk Ships, Term Loan B, 5.25%, 8/05/19 | United States | 10,935 | 10,990 | |||
| Wireless Telecommunication Services 0.0%† | ||||||
| SBA Senior Finance II LLC, senior secured, 3.25%, 3/24/21 | United States | 154,361 | 154,007 | |||
| Total Senior Floating Rate Interests (Cost $4,416,202) | 4,454,060 | |||||
| Foreign Government and Agency Securities 2.2% | ||||||
| Argentina Boden Bonds, senior note, 7.00%, 10/03/15 | Argentina | 3,667,000 | 3,652,332 | |||
| hCyprus Government International Bond, Reg S, 3.875%, 5/06/22 | Cyprus | 2,254,000 | EUR | 2,512,696 | ||
| hGovernment of Hellenic Republic, | ||||||
| fsenior note, Reg S, 144A, 4.75%, 4/17/19 | Greece | 791,000 | EUR | 598,276 | ||
| senior bond, Series PSI, Reg S, 3.00%, 2/24/23 - 2/24/42 | Greece | 5,280,000 | EUR | 3,032,563 | ||
| hGovernment of Russia, senior, Reg S, 5.625%, 4/04/42 | Russia | 1,400,000 | 1,355,074 | |||
| Mexico Bonos, Series M, senior note, 4.75%, 6/14/18 | Mexico | 95,000 | n | MXN | 619,413 | |
| hPakistan Government International Bond, Reg S, 6.75%, 12/03/19 | Pakistan | 1,716,000 | 1,764,216 | |||
| hPerusahaan Penerbit SBSN Indonesia III, senior note, Reg S, 4.325%, | ||||||
| 5/28/25 | Indonesia | 754,000 | 754,377 | |||
| hRepublic of Iraq, senior bond, Reg S, 5.80%, 1/15/28 | Iraq | 2,910,000 | 2,418,559 | |||
| Total Foreign Government and Agency Securities | ||||||
| (Cost $16,712,279) | 16,707,506 | |||||
46 Annual Report
franklintempleton.com
FRANKLIN ALTERNATIVE STRATEGIES FUNDS
CONSOLIDATED STATEMENT O F INVESTMENTS
| Franklin K2 Alternative Strategies Fund (continued) | |||||
| Principal | |||||
| Country | Amount* | Value | |||
| Foreign Government and Agency Securities in | |||||
| Reorganization (Cost $4,613,079) 0.6% | |||||
| lArgentine Republic Government International Bond, senior bond, Series NY, 8.28%, | |||||
| 12/31/33 | Argentina | 4,459,883 | $ | 4,471,033 | |
| Asset-Backed Securities and Commercial | |||||
| Mortgage-Backed Securities 1.5% | |||||
| Airlines 0.1% | |||||
| fLatam Airlines, 2015-1 Pass Through Trust B, secured note, 144A, 4.50%, | |||||
| 11/15/23 | Chile | 980,000 | 973,875 | ||
| Commercial Mortgage-Backed Securities 0.1% | |||||
| f,iBLCP Hotel Trust 2014-CLRN, E, 144A, FRN, 3.856%, 8/15/29 | United States | 100,000 | 100,330 | ||
| f,iCOMM 2014-SAVA Mortgage Trust, 2014-C, 144A, FRN, 2.586%, 6/15/34 | United States | 100,000 | 100,097 | ||
| f,iGP Portfolio Trust 2014-GGP, A, 144A, FRN, 1.136%, 2/15/27 | United States | 89,435 | 89,301 | ||
| fHilton USA Trust 2013-HLT, CFX, 144A, 3.714%, 11/05/30 | United States | 100,000 | 101,523 | ||
| f,iSCG Trust 2013-SRP1, FRN, 144A, | |||||
| A, 1.586%, 11/15/26 | United States | 100,000 | 100,128 | ||
| C, 3.436%, 11/15/26 | United States | 100,000 | 100,471 | ||
| 591,850 | |||||
| Credit Cards 0.3% | |||||
| American Express Credit Account Master Trust, | |||||
| 0.98%, 5/15/19 | United States | 100,000 | 100,212 | ||
| iFRN, 0.456%, 1/15/20 | United States | 100,000 | 100,131 | ||
| Series 2014-3, 1.49%, 4/15/20 | United States | 100,000 | 100,800 | ||
| Series 2014-A, 1.26%, 1/15/20 | United States | 100,000 | 100,503 | ||
| iSeries 2014-A, FRN, 0.476%, 5/15/20 | United States | 100,000 | 100,112 | ||
| iBA Credit Card Trust, FRN, | |||||
| A, 0.456%, 9/16/19 | United States | 120,000 | 120,215 | ||
| A, 0.566%, 6/15/21 | United States | 100,000 | 100,159 | ||
| A3, 0.476%, 1/15/20 | United States | 100,000 | 100,131 | ||
| Capital One Multi-Asset Execution Trust, | |||||
| A2, 1.26%, 1/15/20 | United States | 40,000 | 40,214 | ||
| A3, 0.96%, 9/16/19 | United States | 100,000 | 100,185 | ||
| A5, 1.48%, 7/15/20 | United States | 90,000 | 90,642 | ||
| Citibank Credit Card Issuance Trust, | |||||
| i2013-A2, A2, FRN, 0.465%, 5/26/20 | United States | 125,000 | 125,092 | ||
| i2013-A7, A7, FRN, 0.612%, 9/10/20 | United States | 200,000 | 201,022 | ||
| 2013-A10, A10, 0.73%, 2/07/18 | United States | 100,000 | 100,140 | ||
| 2014-A2, A2, 1.02%, 2/22/19 | United States | 100,000 | 100,134 | ||
| i2014-A3, A3, FRN, 0.382%, 5/09/18 | United States | 100,000 | 100,010 | ||
| 2014-A4, A4, 1.23%, 4/24/19 | United States | 100,000 | 100,302 | ||
| i2014-A7, A7, FRN, 0.385%, 8/24/18 | United States | 100,000 | 100,026 | ||
| 2014-A8, A8, 1.73%, 4/09/20 | United States | 100,000 | 101,085 | ||
| iDiscover Card Execution Note Trust, A1, FRN, 0.536%, 8/17/20 | United States | 210,000 | 210,584 | ||
| iWorld Financial Network Credit Card Master Trust, Series 2015-A, FRN, 0.703%, | |||||
| 2/15/22, A | United States | 120,000 | 120,195 | ||
| 2,311,894 | |||||
| Diversified Financial Services 0.4% | |||||
| BMW Vehicle Owner Trust, | |||||
| 2013-A, 0.67%, 11/27/17 | United States | 57,471 | 57,532 | ||
| 2014-A, 0.97%, 11/26/18 | United States | 75,000 | 75,149 | ||
franklintempleton.com
Annual Report
47
FRANKLIN ALTERNATIVE STRATEGIES FUNDS
CONSOLIDATED STATEMENT O F INVESTMENTS
| Franklin K2 Alternative Strategies Fund (continued) | |||||
| Principal | |||||
| Country | Amount* | Value | |||
| Asset-Backed Securities and Commercial | |||||
| Mortgage-Backed Securities (continued) | |||||
| Diversified Financial Services (continued) | |||||
| f,iColony American Homes, FRN, 144A, | |||||
| 2014-2, 2A, 3.383%, 7/17/31 | United States | 100,000 | $ | 101,050 | |
| gSeries 2015-D, 2.337%, 7/17/32 | United States | 100,000 | 100,000 | ||
| Chase Issuance Trust, | |||||
| A8, 1.01%, 10/15/18 | United States | 100,000 | 100,320 | ||
| iA3, FRN, 0.386%, 5/15/18 | United States | 110,000 | 110,033 | ||
| iA5, FRN, 0.556%, 4/15/21 | United States | 120,000 | 120,158 | ||
| Chase Issuance Trust, | |||||
| Series 2014-A6, 1.26%, 7/15/19 | United States | 100,000 | 100,248 | ||
| iSeries 2014-A, FRN, 0.436%, 11/15/18 | United States | 85,000 | 85,052 | ||
| iSeries 2015-A, FRN, 0.506%, 2/18/20 | United States | 110,000 | 110,080 | ||
| Series 2015-A, 1.59%, 2/18/20 | United States | 135,000 | 136,085 | ||
| iChase Mortgage Finance Trust Series 2007-A1, Series 2007-11M1, FRN, 2.477%, | |||||
| 3/25/37 | United States | 122,686 | 114,727 | ||
| Ford Credit Auto Owner Trust, | |||||
| 2014-A3, 1.06%, 5/15/19 | United States | 55,000 | 55,154 | ||
| 2014-B, Series 2014-A3, 0.90%, 10/15/18 | United States | 120,000 | 120,211 | ||
| 2015-A3, 1.28%, 9/15/19, A | United States | 85,000 | 85,379 | ||
| f2014-2A, 144A, 2.31%, 4/15/26 | United States | 100,000 | 101,647 | ||
| Honda Auto Receivables 2013-4 Owner Trust, A3, 0.69%, 9/18/17 | United States | 40,000 | 40,027 | ||
| Honda Auto Receivables 2014 Owner Trust, A3, 0.77%, 3/19/18 | United States | 90,000 | 90,055 | ||
| Honda Auto Receivables 2014-3 Owner Trust, | |||||
| A3, 0.88%, 6/15/18 | United States | 45,000 | 45,042 | ||
| A4, 1.31%, 10/15/20 | United States | 30,000 | 30,109 | ||
| Honda Auto Receivables 2014-4 Owner Trust, A3, 0.99%, 9/17/18 | United States | 55,000 | 55,099 | ||
| Honda Auto Receivables 2015-1 Owner Trust, A3, 1.05%, 10/15/18 | United States | 60,000 | 60,100 | ||
| Honda Auto Receivables 2015-2 Owner Trust, Series 2015-A3, 1.04%, 2/21/19 | United States | 165,000 | 165,067 | ||
| Hyundai Auto Receivables 2014-4 Owner Trust, A3, 0.79%, 7/16/18 | United States | 110,000 | 110,060 | ||
| Hyundai Auto Receivables 2015-A Owner Trust, A3, 1.05%, 4/15/19 | United States | 55,000 | 55,039 | ||
| Hyundai Auto Receivables Trust 2015-B, Series 2015-A3, 1.12%, 11/15/19 | United States | 230,000 | 229,817 | ||
| iIndyMac Mortgage Loan Trust, Series 2005-A3, FRN, 4.447%, 8/25/35 | United States | 115,688 | 98,995 | ||
| iJP Morgan Alternative Loan 2006-A1 Trust, 3A1, FRN, 2.473%, 3/25/36 | United States | 96,430 | 84,205 | ||
| iJP Morgan Mortgage 2006-A1 Trust, 1A2, FRN, 2.411%, 2/25/36 | United States | 64,641 | 57,754 | ||
| iJP Morgan Mortgage 2003-A2 Trust, 3A1, FRN, 1.99%, 11/25/33 | United States | 23,445 | 23,181 | ||
| iJP Morgan Mortgage 2005-A1 Trust, Series 2005-6T1, FRN, 2.548%, 2/25/35 | United States | 40,975 | 40,936 | ||
| iJP Morgan Mortgage 2005-A3 Trust, 4A1, FRN, 2.663%, 6/25/35 | United States | 18,398 | 18,642 | ||
| iJP Morgan Mortgage 2006-A7 Trust, 2A4, FRN, 2.544%, 1/25/37 | United States | 48,308 | 44,653 | ||
| iJP Morgan Mortgage 2007-A1 Trust, 4A2, FRN, 2.489%, 7/25/35 | United States | 13,738 | 13,828 | ||
| JP Morgan Mortgage 2007-S1 Trust, 2A22, 5.75%, 3/25/37 | United States | 76,227 | 64,082 | ||
| iMerrill Lynch Mortgage Investors MLCC, 2006-1A, FRN, 2.476%, 2/25/36 | United States | 136,921 | 133,826 | ||
| Nissan Auto Lease Trust, 2014-B, 1.12%, 9/15/17 | United States | 45,000 | 45,028 | ||
| Nissan Auto Receivables 2013-C Owner Trust, A3, 0.67%, 8/15/18 | United States | 30,000 | 30,010 | ||
| iStructured Adjustable Rate Mortgage Loan Trust, FRN, | |||||
| Series 2004-7A3, 2.496%, 9/25/34 | United States | 56,199 | 56,182 | ||
| 1A, 2.363%, 6/25/34 | United States | 36,024 | 35,549 | ||
| Toyota Auto Receivables 2014-C Owner Trust, A3, 0.93%, 7/16/18 | United States | 40,000 | 40,080 | ||
| USAA Auto Owner Trust, A4, 0.57%, 8/15/17 | United States | 19,889 | 19,889 | ||
| 3,260,080 | |||||
48 Annual Report
franklintempleton.com
FRANKLIN ALTERNATIVE STRATEGIES FUNDS
CONSOLIDATED STATEMENT O F INVESTMENTS
| Franklin K2 Alternative Strategies Fund (continued) | ||||
| Principal | ||||
| Country | Amount* | Value | ||
| Asset-Backed Securities and Commercial | ||||
| Mortgage-Backed Securities (continued) | ||||
| Other ABS 0.2% | ||||
| iAlly Master Owner Trust, FRN, | ||||
| 1A1, 0.656%, 1/15/19 | United States | 100,000 | $ | 100,154 |
| 2A, 0.556%, 1/16/18 | United States | 135,000 | 135,011 | |
| f,iCAM Mortgage Trust 2014-2, 144A, FRN, 4.45%, 5/15/48 | United States | 73,378 | 73,710 | |
| Citicorp Mortgage Securities 2006-4 Trust, 1A2, 6.00%, 8/25/36 | United States | 35,501 | 36,183 | |
| fCLI Funding LLC, 2014-2A, 144A, 3.38%, 10/18/29 | United States | 94,167 | 95,227 | |
| f,iInvitation Homes Trust, B, 144A, FRN, 1.683%, 6/17/31 | United States | 100,000 | 100,242 | |
| iLehman XS Trust Series, 2006-4N, FRN, 0.405%, 4/25/46 | United States | 110,599 | 81,474 | |
| fOneMain Financial Issuance Trust 2015-1, Series 2015-A, 144A, 3.19%, 3/18/26 | United States | 150,000 | 151,236 | |
| fSierra Timeshare 2013-3 Receivables Funding LLC, A, 144A, 2.20%, 10/20/30 | United States | 88,263 | 88,917 | |
| fTAL Advantage V LLC, A, 144A, 3.55%, 11/20/38 | United States | 85,000 | 86,139 | |
| fUS Residential Opportunity Fund Trust, 144A, | ||||
| 3.721%, 1/27/35 | United States | 98,475 | 99,499 | |
| series 15-1III, A, 3.721%, 2/27/35 | United States | 97,359 | 97,944 | |
| fVOLT LLC, 144A, | ||||
| 2015-NPL1 A1, 3.625%, 10/25/57 | United States | 97,077 | 97,593 | |
| 2015-NPL2 A1, 3.375%, 2/25/55 | United States | 95,678 | 96,073 | |
| 2015-NPL4 A1, 3.50%, 2/25/55 | United States | 221,581 | 222,696 | |
| 1,562,098 | ||||
| Real Estate Investment Trusts (REITs) 0.1% | ||||
| fAmerican Homes 4 Rent, 144A, | ||||
| iSeries 2014-SFR1, FRN, 2.75%, 6/17/31 | United States | 100,000 | 98,534 | |
| Series 2014-SFR3, 6.418%, 12/17/36 | United States | 100,000 | 109,773 | |
| Series 2015-SFR1, 5.639%, 4/17/52 | United States | 110,000 | 116,508 | |
| iCitigroup Mortgage Loan 2005-11 Trust, A2A, FRN, 2.51%, 10/25/35 | United States | 50,763 | 50,348 | |
| iCitigroup Mortgage Loan 2005-2 Trust, 1A4, FRN, 2.615%, 5/25/35 | United States | 31,297 | 30,560 | |
| f,iCitigroup Mortgage Loan 2009-10 Trust, 6A2, 144A, FRN, 2.682%, 9/25/34 | United States | 120,000 | 109,124 | |
| f,iCitigroup Mortgage Loan Trust Inc., Series 2014-2A1, 144A, FRN, 0.321%, | ||||
| 8/25/36 | United States | 93,416 | 87,218 | |
| f,iCitigroup Mortgage Loan 2015-2 Trust, 1A1, 144A, FRN, 0.381%, 6/25/47 | United States | 106,373 | 98,700 | |
| 700,765 | ||||
| Thrifts & Mortgage Finance 0.0%† | ||||
| f,iCredit Suisse Mortgage Capital Certificates, Series 2015-A, 144A, FRN, 1.432%, | ||||
| 3/15/17 | United States | 110,000 | 110,287 | |
| Whole Loan Collateral CMO 0.3% | ||||
| iAdjustable Rate Mortgage 2004-4 Trust, 3A1, FRN, 2.686%, 3/25/35 | United States | 67,171 | 65,832 | |
| iAdjustable Rate Mortgage 2004-5 Trust, FRN, | ||||
| 5A1, 2.59%, 4/25/35 | United States | 18,900 | 18,529 | |
| 6A1, 2.532%, 4/25/35 | United States | 12,295 | 12,206 | |
| Countrywide Alternative Loan Trust, 2003-20CB, 2A1, 5.75%, 10/25/33 | United States | 31,112 | 33,005 | |
| Countrywide Alternative Loan Trust, 2003-9T1, A7, 5.50%, 7/25/33 | United States | 31,390 | 31,667 | |
| Countrywide Alternative Loan Trust, 2004-28CB, 5A1, 5.75%, 1/25/35 | United States | 12,865 | 13,118 | |
| Countrywide Alternative Loan Trust, 2004-J3, 1A1, 5.50%, 4/25/34 | United States | 65,411 | 67,815 | |
| iCountrywide Alternative Loan Trust, 2005-14, 2A1, FRN, 0.395%, 5/25/35 | United States | 70,175 | 58,318 | |
| Countrywide Alternative Loan Trust, 2005-J1, 2A1, 5.50%, 2/25/25 | United States | 14,150 | 14,556 | |
| Countrywide Alternative Loan Trust, 2004-27CB, A1, 6.00%, 12/25/34 | United States | 110,323 | 113,246 | |
| Countrywide Alternative Loan Trust, 2006-4CB, 2A2, 5.50%, 4/25/36 | United States | 147,151 | 143,675 | |
franklintempleton.com
Annual Report
49
FRANKLIN ALTERNATIVE STRATEGIES FUNDS
CONSOLIDATED STATEMENT O F INVESTMENTS
| Franklin K2 Alternative Strategies Fund (continued) | ||||
| Principal | ||||
| Country | Amount* | Value | ||
| Asset-Backed Securities and Commercial | ||||
| Mortgage-Backed Securities (continued) | ||||
| Whole Loan Collateral CMO (continued) | ||||
| Banc of America Alternative Loan 2003-8 Trust, 1CB1, 5.50%, 10/25/33 | United States | 14,888 | $ | 15,874 |
| Banc of America Alternative Loan 2004-9 Trust, 2CB1, 6.00%, 10/25/34 | United States | 15,276 | 15,865 | |
| Banc of America Alternative Loan 2005-6 Trust, CB7, 5.25%, 7/25/35 | United States | 30,969 | 28,027 | |
| Banc of America Funding 2005-5 Trust, 1A1, 5.50%, 9/25/35 | United States | 25,580 | 26,855 | |
| Banc of America Funding 2007-4 Trust, 5A1, 5.50%, 11/25/34 | United States | 34,390 | 33,791 | |
| iBanc of America Mortgage 2005-A Trust, 2A1, FRN, 2.668%, 2/25/35 | United States | 16,688 | 16,362 | |
| iBear Stearns ARM 2004-6 Trust, 2A1, FRN, 2.74%, 9/25/34 | United States | 102,232 | 98,760 | |
| iBear Stearns ARM 2004-9 Trust, 12A3, FRN, 2.781%, 11/25/34 | United States | 21,649 | 21,401 | |
| iBear Stearns ARM 2005-12 Trust, 11A1, FRN, 2.525%, 2/25/36 | United States | 30,446 | 24,070 | |
| iCHL Mortgage Pass-Through 2004-12 Trust, 8A1, FRN, 2.662%, 8/25/34 | United States | 23,022 | 21,761 | |
| iCHL Mortgage Pass-Through 2004-HYB4 Trust, 2A1, FRN, 2.449%, 9/20/34 | United States | 58,488 | 56,176 | |
| CHL Mortgage Pass-Through 2005-21 Trust, A17, 5.50%, 10/25/35 | United States | 24,833 | 23,425 | |
| CitiMortgage Alternative Loan 2007-A6 Trust, 1A11, 6.00%, 6/25/37 | United States | 19,918 | 17,769 | |
| Credit Suisse First Boston Mortgage Securities Corp., | ||||
| 2A1, 5.25%, 11/25/20 | United States | 85,308 | 86,230 | |
| i3A1, FRN, 2.625%, 5/25/34 | United States | 29,333 | 29,174 | |
| i4A1, FRN, 2.598%, 12/25/33 | United States | 6,733 | 6,697 | |
| 4A4, 5.75%, 11/25/33 | United States | 4,310 | 4,557 | |
| i7A1, FRN, 2.517%, 11/25/33 | United States | 10,912 | 10,541 | |
| Deutsche Alt-A Securities Inc. Mortgage Loan 2005-3 Trust, 4A4, 5.25%, 6/25/35 | United States | 8,463 | 8,562 | |
| iDeutsche Alt-A Securities Inc. Mortgage Loan 2005-5 Trust, 1A4, FRN, 5.50%, | ||||
| 11/25/35 | United States | 16,485 | 15,697 | |
| fFDIC 2013-N1 Trust, A, 144A, 4.50%, 10/25/18 | United States | 6,322 | 6,359 | |
| GMACM Mortgage Loan Trust 2003-J7, Series 2003-A7, 5.00%, 11/25/33 | United States | 62,121 | 62,570 | |
| GSR Mortgage Loan Trust 2005-4F, 6A1, 6.50%, 2/25/35 | United States | 54,467 | 55,277 | |
| iGSR Mortgage Loan Trust 2005-AR6, 4A5, FRN, 2.69%, 9/25/35 | United States | 55,021 | 55,567 | |
| iHarborview Mortgage Loan Trust, 1A, FRN, 0.556%, 10/19/33 | United States | 26,567 | 25,657 | |
| iMASTR Adjustable Rate Mortgages 2004-7 Trust, 3A1, FRN, 2.504%, 7/25/34 | United States | 76,393 | 76,477 | |
| MASTR Alternative Loan Trust 2004-12, 6A2, 5.25%, 12/25/34 | United States | 22,361 | 22,462 | |
| iMerrill Lynch Mortgage Investors MLCC, 2006-2 Trust, FRN, 2.135%, 5/25/36 | United States | 18,509 | 18,394 | |
| National City Mortgage Capital Trust, Series 2008-2A1, 6.00%, 3/25/38 | United States | 99,917 | 105,291 | |
| iNew York Mortgage 2006-1 Trust, 2A2, FRN, 2.603%, 5/25/36 | United States | 45,743 | 41,643 | |
| iProvident Funding Mortgage Loan 2005-2 Trust, 2A1A, FRN, 2.433%, 10/25/35 | United States | 14,337 | 14,290 | |
| RALI 2004-QS2 Trust, AI1, 5.50%, 2/25/34 | United States | 24,349 | 24,772 | |
| Structured Asset Securities Corp. Trust 2005-1, 7A7, 5.50%, 2/25/35 | United States | 26,831 | 27,480 | |
| iWaMu Mortgage Pass-Through Certificates Series 2005-AR7 Trust, A3, FRN, | ||||
| 2.368%, 8/25/35 | United States | 146,893 | 146,777 | |
| iWells Fargo Mortgage Backed Securities 2003-J Trust, 1A9, FRN, 2.615%, | ||||
| 10/25/33 | United States | 54,830 | 55,153 | |
| iWells Fargo Mortgage Backed Securities 2003-M Trust, MA1, FRN, 2.615%, | ||||
| 12/25/33 | United States | 43,710 | 43,867 | |
| iWells Fargo Mortgage Backed Securities 2004-A Trust, A1, FRN, 2.639%, 2/25/34 | United States | 46,127 | 46,273 | |
| Wells Fargo Mortgage Backed Securities 2005-16 Trust, A18, 6.00%, 1/25/36 | United States | 11,140 | 11,047 | |
| iWells Fargo Mortgage Backed Securities 2005-AR10 Trust, FRN, | ||||
| 2A2, 2.641%, 6/25/35 | United States | 62,305 | 63,525 | |
| 2A4, 2.641%, 6/25/35 | United States | 27,691 | 27,945 | |
| iWells Fargo Mortgage Backed Securities Trust, 04-O A1, FRN, 2.615%, 8/25/34 | United States | 19,547 | 19,475 | |
| 2,083,862 | ||||
| Total Asset-Backed Securities and Commercial Mortgage- | ||||
| Backed Securities (Cost $11,532,676) | 11,594,711 | |||
50 Annual Report
franklintempleton.com
FRANKLIN ALTERNATIVE STRATEGIES FUNDS
CONSOLIDATED STATEMENT O F INVESTMENTS
| Franklin K2 Alternative Strategies Fund (continued) | ||||
| Number of | ||||
| Country | Contracts | Value | ||
| Options Purchased 0.3% | ||||
| Calls – Exchange-Traded | ||||
| Airlines 0.0%† | ||||
| American Airlines Group Inc., June Strike Price, $52.50, Expires 6/19/15 | United States | 221 | $ | 884 |
| Delta Air Lines Inc., July Strike Price, $45.00, Expires 7/17/15 | United States | 113 | 14,464 | |
| Spirit Airlines Inc., June Strike Price, $75.00, Expires 6/19/15 | United States | 141 | 987 | |
| United Continental Holdings Inc., July Strike Price, $55.00, Expires 7/17/15 | United States | 111 | 32,634 | |
| United Continental Holdings Inc., July Strike Price, $60.00, Expires 7/17/15 | United States | 92 | 11,040 | |
| 60,009 | ||||
| Banks 0.0%† | ||||
| Citigroup Inc., January Strike Price, $55.00, Expires 1/15/16 | United States | 36 | 11,628 | |
| Commerzbank AG, June Strike Price, 11.50 EUR, Expires 6/19/15 | Germany | 57 | 4,570 | |
| 16,198 | ||||
| Diversified Telecommunication Services 0.0%† | ||||
| Telecom Italia SpA, September Strike Price, 1.10 EUR, Expires 9/18/15 | Italy | 329 | 33,171 | |
| Telecom Italia SpA, December Strike Price, 1.15 EUR, Expires 12/18/15 | Italy | 73 | 7,713 | |
| 40,884 | ||||
| Exchange Traded Funds 0.0%† | ||||
| iShares Russell 2000 ETF, June Strike Price, $124.50, Expires 6/05/15 | United States | 372 | 27,900 | |
| Food Products 0.0%† | ||||
| Kraft Foods Group Inc., June Strike Price, $67.50, Expires 6/19/15 | United States | 69 | 118,680 | |
| Health Care Equipment & Supplies 0.0%† | ||||
| Natus Medical Inc., July Strike Price, $40.00, Expires 7/17/15 | United States | 58 | 7,250 | |
| Health Care Providers & Services 0.0%† | ||||
| HCA Holdings Inc., July Strike Price, $87.50, Expires 7/17/15 | United States | 29 | 5,220 | |
| Internet Software & Services 0.1% | ||||
| eBay Inc., January Strike Price, $50.00, Expires 1/15/16 | United States | 229 | 287,395 | |
| Pandora Media Inc., September Strike Price, $24.00, Expires 9/18/15 | United States | 89 | 4,005 | |
| Twitter Inc., June Strike Price, $43.00, Expires 6/19/15 | United States | 57 | 456 | |
| 291,856 | ||||
| Machinery 0.0%† | ||||
| Spirax-Sarco Engineering PLC, June Strike Price, $2,150.00, Expires 6/19/15 | United States | 159 | 73,935 | |
| Media 0.1% | ||||
| Comcast Corp., October Strike Price, $62.50, Expires 10/16/15 | United States | 127 | 13,525 | |
| DISH Network Corp., June Strike Price, $70.00, Expires 6/19/15 | United States | 49 | 10,094 | |
| Time Warner Cable Inc., July Strike Price, $155.00, Expires 7/17/15 | United States | 136 | 357,000 | |
| 380,619 | ||||
| Metals & Mining 0.0%† | ||||
| United States Steel Corp., July Strike Price, $28.00, Expires 7/17/15 | United States | 49 | 2,205 | |
| Vale SA, ADR, September Strike Price, $8.00, Expires 9/18/15 | Brazil | 274 | 6,576 | |
| 8,781 | ||||
| Pharmaceuticals 0.0%† | ||||
| Mylan NV, July Strike Price, $70.00, Expires 7/17/15 | United States | 62 | 35,030 | |
| Mylan NV, June Strike Price, $80.00, Expires 6/19/15 | United States | 16 | 800 | |
| 35,830 | ||||
franklintempleton.com
Annual Report
51
FRANKLIN ALTERNATIVE STRATEGIES FUNDS
CONSOLIDATED STATEMENT O F INVESTMENTS
| Franklin K2 Alternative Strategies Fund (continued) | ||||||
| Number of | ||||||
| Country | Contracts | Value | ||||
| Options Purchased (continued) | ||||||
| Calls – Exchange-Traded (continued) | ||||||
| Semiconductors & Semiconductor Equipment 0.0%† | ||||||
| Applied Materials Inc., June Strike Price, $22.00, Expires | ||||||
| 6/19/15 | United States | 110 | $ | 440 | ||
| Software 0.0%† | ||||||
| TiVo Inc., January Strike Price, $12.00, Expires 1/15/16 | United States | 56 | 2,800 | |||
| Technology Hardware, Storage & Peripherals 0.0%† | ||||||
| EMC Corp., October Strike Price, $27.00, Expires | ||||||
| 10/16/15 | United States | 217 | 21,049 | |||
| NCR Corp., July Strike Price, $30.00, Expires 7/17/15 | United States | 24 | 3,000 | |||
| NCR Corp., January Strike Price, $35.00, Expires 1/15/16 | United States | 109 | 11,445 | |||
| SanDisk Corp., July Strike Price, $72.50, Expires 7/17/15 | United States | 67 | 9,179 | |||
| SanDisk Corp., July Strike Price, $75.00, Expires 7/17/15 | United States | 67 | 5,829 | |||
| 50,502 | ||||||
| Wireless Telecommunication Services 0.0%† | ||||||
| T-Mobile U.S. Inc., August Strike Price, $40.00, Expires | ||||||
| 8/21/15 | United States | 272 | 43,520 | |||
| Notional | ||||||
| Counterparty | Amount* | |||||
| Calls – Over-the-Counter | ||||||
| Currency Options 0.0%† | ||||||
| USD/KRW, November Strike Price, 1,113.00 KRW, | ||||||
| Expires 11/25/15 | South Korea | BOFA | 2,359,560,000 KRW | 59,611 | ||
| Payer Swaptions – Over-the-Counter | ||||||
| Interest Rate 0.0%† | ||||||
| Pay fixed 1 year 2.403%, receive float 3-month USD LIBOR, | ||||||
| Expires 11/05/15 | United States | DBFX | 1,240,000 | 20,574 | ||
| Pay fixed 10 year 2.39%, receive float 3-month USD LIBOR, | ||||||
| Expires 7/22/15 | United States | DBFX | 3,000,000 | 17,476 | ||
| 38,050 | ||||||
| Number of | ||||||
| Contracts | ||||||
| Puts – Exchange-Traded | ||||||
| Construction Materials 0.0%† | ||||||
| Cemex SAB de CV, ADR, July Strike Price, $6.73, | ||||||
| Expires 7/17/15 | Mexico | 57 | 267 | |||
| Diversified Financial Services 0.1% | ||||||
| Euro STOXX 50 Index, July Strike Price, 3,350.00 EUR, | ||||||
| Expires 7/17/15 | Germany | 62 | 30,642 | |||
| Euro STOXX 50 Index, July Strike Price, 3,450.00 EUR, | ||||||
| Expires 7/17/15 | Germany | 12 | 9,278 | |||
| Euro STOXX 50 Index, August Strike Price, 3,450.00 EUR, | ||||||
| Expires 8/21/15 | Germany | 41 | 45,526 | |||
| S&P 500 Index, June Strike Price, $2,000.00, | ||||||
| Expires 6/19/15 | United States | 73 | 33,580 | |||
| S&P 500 Index, June Strike Price, $2,050.00, | ||||||
| Expires 6/19/15 | United States | 53 | 53,212 | |||
52 Annual Report
franklintempleton.com
FRANKLIN ALTERNATIVE STRATEGIES FUNDS
CONSOLIDATED STATEMENT O F INVESTMENTS
| Franklin K2 Alternative Strategies Fund (continued) | ||||
| Number of | ||||
| Country | Contracts | Value | ||
| Options Purchased (continued) | ||||
| Puts – Exchange-Traded (continued) | ||||
| Diversified Financial Services (continued) | ||||
| S&P 500 Index, June Strike Price, $2,075.00, Expires 6/19/15 | United States | 22 | $ | 34,210 |
| S&P 500 Index, June Strike Price, $1,975.00, Expires 6/30/15 | United States | 140 | 71,120 | |
| S&P 500 Index, August Strike Price, $2,050.00, Expires 8/31/15 | United States | 56 | 213,360 | |
| 490,928 | ||||
| Diversified Telecommunication Services 0.0%† | ||||
| AT&T Inc., June Strike Price, $35.00, Expires 6/19/15 | United States | 293 | 23,440 | |
| Electric Utilities 0.0%† | ||||
| Pepco Holdings Inc., June Strike Price, $25.00, Expires 6/19/15 | United States | 85 | 255 | |
| Electrical Equipment 0.0%† | ||||
| Alstom SA, September Strike Price, 24.00 EUR, Expires 9/18/15 | France | 130 | 7,567 | |
| Exchange Traded Funds 0.0%† | ||||
| Amex Industrial Select SPDR Fund, December Strike Price, $53.00, | ||||
| Expires 12/18/15 | United States | 81 | 14,783 | |
| iShares U.S. Real Estate ETF, June Strike Price, $75.00, Expires 6/19/15 | United States | 304 | 34,352 | |
| 49,135 | ||||
| Interest Rate 0.0%† | ||||
| Eurodollar Future, September Strike Price, $99.50, Expires 9/14/15 | United States | 392 | 26,950 | |
| Internet & Catalog Retail 0.0%† | ||||
| Netflix Inc., July Strike Price, $400.00, Expires 7/17/15 | United States | 6 | 246 | |
| Netflix Inc., July Strike Price, $425.00, Expires 7/17/15 | United States | 5 | 345 | |
| Netflix Inc., July Strike Price, $450.00, Expires 7/17/15 | United States | 5 | 530 | |
| Netflix Inc., September Strike Price, $385.00, Expires 9/18/15 | United States | 12 | 1,008 | |
| Netflix Inc., September Strike Price, $550.00, Expires 9/18/15 | United States | 13 | 24,635 | |
| 26,764 | ||||
| Internet Software & Services 0.0%† | ||||
| Alibaba Group Holding Ltd., ADR, January Strike Price, $80.00, Expires 1/15/16 | China | 40 | 16,200 | |
| Machinery 0.0%† | ||||
| Spirax-Sarco Engineering PLC, June Strike Price, $2,080.00, Expires 6/05/15 | United States | 90 | 62,550 | |
| Media 0.0%† | ||||
| Charter Communications Inc., March Strike Price, $210.00, Expires 3/18/16 | United States | 29 | 118,900 | |
| Time Warner Cable Inc., October Strike Price, $155.00, Expires 10/16/15 | United States | 76 | 10,450 | |
| Vivendi SA, September Strike Price, 21.00 EUR, Expires 9/18/15 | France | 216 | 7,829 | |
| Vivendi SA, September Strike Price, 22.00 EUR, Expires 9/18/15 | France | 625 | 41,186 | |
| Vivendi SA, December Strike Price, 22.00 EUR, Expires 12/18/15 | France | 80 | 8,435 | |
| 186,800 | ||||
| Metals & Mining 0.0%† | ||||
| ThyssenKrupp AG, September Strike Price, 24.00 EUR, Expires 9/18/15 | Germany | 194 | 31,534 | |
| Oil, Gas & Consumable Fuels 0.0%† | ||||
| Scorpio Tankers Inc., ADR, July Strike Price, $7.50, Expires 7/17/15 | Monaco | 30 | 375 | |
| Vanguard Natural Resources LLC, October Strike Price, $17.00, | ||||
| Expires 10/16/15 | United States | 14 | 3,605 | |
| 3,980 | ||||
franklintempleton.com
Annual Report
53
FRANKLIN ALTERNATIVE STRATEGIES FUNDS
CONSOLIDATED STATEMENT O F INVESTMENTS
| Franklin K2 Alternative Strategies Fund (continued) | |||||||
| Number of | |||||||
| Country | Contracts | Value | |||||
| Options Purchased (continued) | |||||||
| Puts – Exchange-Traded (continued) | |||||||
| Pharmaceuticals 0.0%† | |||||||
| Mylan NV, October Strike Price, $65.00, Expires 10/16/15 | United States | 37 | $ | 9,990 | |||
| Real Estate Investment Trusts (REITs) 0.0%† | |||||||
| Spirit Realty Capital Inc., July Strike Price, $10.00, | |||||||
| Expires 7/17/15 | United States | 25 | 688 | ||||
| Specialty Retail 0.0%† | |||||||
| Office Depot Inc., January Strike Price, $8.00, | |||||||
| Expires 1/15/16 | United States | 151 | 6,040 | ||||
| Notional | |||||||
| Counterparty | Amount* | ||||||
| Puts – Over-the-Counter | |||||||
| Currency Options 0.0%† | |||||||
| INR/USD, August Strike Price, 61.50 INR, Expires 8/31/15 | India | CITI | 83,025,000 INR | 867 | |||
| INR/USD, July Strike Price, 61.50 INR, Expires 7/24/15 | India | BOFA | 49,200,000 INR | 293 | |||
| 1,160 | |||||||
| Receiver Swaptions – Over-the-Counter | |||||||
| Interest Rate 0.0%† | |||||||
| Receive fixed 1 year 4.20%, pay float 28 Day TIIE, | |||||||
| Expires 10/01/15 | Mexico | BOFA | 50,000,000 MXN | 9,231 | |||
| Receive fixed 1 year 4.26%, pay float 28 Day TIIE, | |||||||
| Expires 10/23/15 | Mexico | BOFA | 27,000,000 MXN | 5,261 | |||
| 14,492 | |||||||
| Total Options Purchased (Cost $2,625,104) | 2,220,825 | ||||||
| Total Investments before Short Term | |||||||
| Investments (Cost $537,880,837) | 568,765,936 | ||||||
| Principal | |||||||
| Amount* | |||||||
| Short Term Investments 0.1% | |||||||
| U.S. Government and Agency Securities 0.1% | |||||||
| a,oU.S. Treasury Bills, | |||||||
| 10/01/15 | United States | 200,000 | 199,997 | ||||
| 7/23/15 | United States | 200,000 | 200,000 | ||||
| Total Short Term Investments | |||||||
| (Cost $399,923) | 399,997 | ||||||
| Total Investments before Money Market Funds | |||||||
| and Repurchase Agreements | |||||||
| (Cost $538,280,760) | 569,165,933 | ||||||
| Shares | |||||||
| Money Market Funds (Cost $62,517,657) 8.2% | |||||||
| p,qDreyfus Government Cash Management, Institutional Shares, | |||||||
| 0.01% | United States | 62,517,657 | 62,517,657 | ||||
54 Annual Report
franklintempleton.com
FRANKLIN ALTERNATIVE STRATEGIES FUNDS
CONSOLIDATED STATEMENT O F INVESTMENTS
| Franklin K2 Alternative Strategies Fund (continued) | |||||||
| Principal | |||||||
| Country | Amount* | Value | |||||
| Repurchase Agreement (Cost $36,858,877) 4.8% | |||||||
| rJoint Repurchase Agreement, 0.068%, 6/01/15 | |||||||
| (Maturity Value $36,859,087), | United States | 36,858,877 | $ | 36,858,877 | |||
| BNP Paribas Securities Corp. (Maturity Value $6,611,414) | |||||||
| Credit Suisse Securities (USA) LLC (Maturity Value $9,917,306) | |||||||
| HSBC Securities (USA) Inc. (Maturity Value $13,884,081) | |||||||
| Merrill Lynch, Pierce, Fenner & Smith Inc. (Maturity Value $6,446,286) | |||||||
| Collateralized by oU.S. Government Agency Securities, Discount Notes, | |||||||
| 11/25/15 -12/11/15; U.S. Government Agency Securities, zero cpn., | |||||||
| 12/01/15 - 2/01/20; U.S. Government Agency Securities, Strips, 6/01/17 - | |||||||
| 1/15/26; and U.S. Treasury Notes, 0.75% - 3.50%, 12/31/17 - 5/15/20 (valued | |||||||
| at $37,612,689). | |||||||
| Total Investments (Cost $637,657,294) 87.4% | 668,542,467 | ||||||
| Options Written (0.1)% | (534,940 | ) | |||||
| Securities Sold Short (20.6)% | (157,632,275 | ) | |||||
| Other Assets, less Liabilities 33.3% | 254,619,449 | ||||||
| Net Assets 100.0% | $ | 764,994,701 | |||||
| Number of | |||||||
| Contracts | |||||||
| sOptions Written (0.1%) | |||||||
| Calls – Exchange-Traded | |||||||
| Air Freight & Logistics (0.0)%† | |||||||
| TNT Express NV, December Strike Price, 8.00 EUR, Expires 12/18/15 | Netherlands | 17 | (262 | ) | |||
| Airlines (0.0)%† | |||||||
| United Continental Holdings Inc., June Strike Price, $53.50, Expires 6/05/15 | United States | 6 | (1,086 | ) | |||
| Banks(0.0)%† | |||||||
| Commerzbank AG, June Strike Price, 13.00 EUR, Expires 6/19/15 | Germany | 90 | (593 | ) | |||
| Diversified Telecommunication Services (0.0)%† | |||||||
| Telecom Italia SpA, September Strike Price, 1.30 EUR, Expires 9/18/15 | Italy | 329 | (8,564 | ) | |||
| Telecom Italia SpA, December Strike Price, 1.35 EUR, Expires 12/18/15 | Italy | 73 | (2,910 | ) | |||
| (11,474 | ) | ||||||
| Internet & Catalog Retail (0.0)%† | |||||||
| Netflix Inc., September Strike Price, $720.00, Expires 9/18/15 | United States | 7 | (12,600 | ) | |||
| Internet Software & Services (0.0)%† | |||||||
| Alibaba Group Holding Ltd., ADR, January Strike Price, $100.00, | |||||||
| Expires 1/15/16 | China | 34 | (15,810 | ) | |||
| Media (0.1)% | |||||||
| Charter Communications Inc., March Strike Price, $210.00, Expires 3/18/16 | United States | 29 | (8,990 | ) | |||
| Time Warner Cable Inc., July Strike Price, $170.00, Expires 7/17/15 | United States | 161 | (204,470 | ) | |||
| Vivendi SA, September Strike Price, 25.00 EUR, Expires 9/18/15 | France | 216 | (9,964 | ) | |||
| Vivendi SA, September Strike Price, 26.00 EUR, Expires 9/18/15 | France | 625 | (15,101 | ) | |||
| Vivendi SA, December Strike Price, 26.00 EUR, Expires 12/18/15 | France | 80 | (4,569 | ) | |||
| (243,094 | ) | ||||||
| Metals & Mining (0.0)%† | |||||||
| ThyssenKrupp AG, September Strike Price, 30.00 EUR, Expires 9/18/15 | Germany | 194 | (3,196 | ) | |||
| Pharmaceuticals (0.0)%† | |||||||
| Mylan NV, June Strike Price, $75.00, Expires 6/19/15 | United States | 29 | (4,205 | ) | |||
| Mylan NV, July Strike Price, $75.00, Expires 7/17/15 | United States | 62 | (18,600 | ) | |||
| (22,805 | ) | ||||||
franklintempleton.com
Annual Report
55
FRANKLIN ALTERNATIVE STRATEGIES FUNDS
CONSOLIDATED STATEMENT O F INVESTMENTS
| Franklin K2 Alternative Strategies Fund (continued) | |||||||
| Notional | |||||||
| Country | Counterparty | Amount* | Value | ||||
| sOptions Written (continued) | |||||||
| Calls – Over-the-Counter | |||||||
| Currency Options (0.0%)† | |||||||
| USD/KRW, November Strike Price, 1,150.00 KRW, | |||||||
| Expires 11/25/15 | South Korea | BOFA | 2,438,000,000 | KRW | $ | (35,572 | ) |
| Receiver Swaptions – Over-the-Counter | |||||||
| Interest Rate (0.0%)† | |||||||
| Receive floating 28 Day TIIE, pay fixed 1 year 3.73%, | |||||||
| Expires 10/01/15 | Mexico | BOFA | 50,000,000 | MXN | (2,350 | ) | |
| Number of | |||||||
| Contracts | |||||||
| Puts – Exchange-Traded | |||||||
| Air Freight & Logistics (0.0%)† | |||||||
| TNT Express NV, June Strike Price, 7.60 EUR, | |||||||
| Expires 6/19/15 | Netherlands | 3 | (16 | ) | |||
| Airlines (0.0%)† | |||||||
| Spirit Airlines Inc., June Strike Price, $70.00, | |||||||
| Expires 6/19/15 | United States | 57 | (41,154 | ) | |||
| United Continental Holdings Inc., July Strike Price, $52.50, | |||||||
| Expires 7/17/15 | United States | 46 | (9,798 | ) | |||
| (50,952 | ) | ||||||
| Banks (0.0%)† | |||||||
| Citigroup Inc., January Strike Price, $47.00, | |||||||
| Expires 1/15/16 | United States | 36 | (4,608 | ) | |||
| Diversified Financial Services (0.0%)† | |||||||
| S&P 500 Index, August Strike Price, $1,850.00, | |||||||
| Expires 8/31/15 | United States | 56 | (60,200 | ) | |||
| Diversified Telecommunication Services (0.0%)† | |||||||
| Telecom Italia SpA, December Strike Price, 0.95 EUR, | |||||||
| Expires 12/18/15 | Italy | 73 | (3,688 | ) | |||
| Telecom Italia SpA, September Strike Price, 0.95 EUR, | |||||||
| Expires 9/18/15 | Italy | 329 | (9,431 | ) | |||
| (13,119 | ) | ||||||
| Health Care Equipment & Supplies (0.0%)† | |||||||
| Smith & Nephew PLC, June Strike Price, 11.00 GBP, | |||||||
| Expires 6/19/15 | United Kingdom | 1 | (153 | ) | |||
| Health Care Providers & Services (0.0%)† | |||||||
| HCA Holdings Inc., July Strike Price, $72.50, | |||||||
| Expires 7/17/15 | United States | 29 | (3,132 | ) | |||
| Internet Software & Services (0.0%)† | |||||||
| Twitter Inc., June Strike Price, $35.00, Expires 6/19/15 | United States | 57 | (2,451 | ) | |||
| Media (0.0%)† | |||||||
| Time Warner Cable Inc., October Strike Price, $130.00, | |||||||
| Expires 10/16/15 | United States | 44 | (1,320 | ) | |||
| Metals & Mining (0.0%)† | |||||||
| United States Steel Corp., July Strike Price, $24.00, | |||||||
| Expires 7/17/15 | United States | 29 | (3,625 | ) | |||
56 Annual Report
franklintempleton.com
FRANKLIN ALTERNATIVE STRATEGIES FUNDS
CONSOLIDATED STATEMENT O F INVESTMENTS
| Franklin K2 Alternative Strategies Fund (continued) | |||||
| Number of | |||||
| Country | Contracts | Value | |||
| sOptions Written (continued) | |||||
| Puts – Exchange-Traded (continued) | |||||
| Pharmaceuticals (0.0%)† | |||||
| Mylan NV, July Strike Price, $65.00, Expires 7/17/15 | United States | 6 | $ | (660 | ) |
| Software (0.0%)† | |||||
| TiVo Inc., January Strike Price, $10.00, Expires 1/15/16 | United States | 56 | (4,032 | ) | |
| Technology Hardware, Storage & Peripherals (0.0%)† | |||||
| EMC Corp., January Strike Price, $25.00, Expires 1/15/16 | United States | 144 | (18,432 | ) | |
| NCR Corp., January Strike Price, $25.00, Expires 1/15/16 | United States | 109 | (9,810 | ) | |
| SanDisk Corp., July Strike Price, $62.50, Expires 7/17/15 | United States | 67 | (4,690 | ) | |
| SanDisk Corp., July Strike Price, $65.00, Expires 7/17/15 | United States | 67 | (8,844 | ) | |
| (41,776 | ) | ||||
| Tobacco (0.0%)† | |||||
| Shinsei Bank Ltd., June Strike Price, 29.00 GBP, Expires 6/19/15 | Japan | 7 | (54 | ) | |
| Total Options Written | |||||
| (Premiums Received $432,836) | (534,940 | ) | |||
| Shares | |||||
| tSecurities Sold Short (20.6)% | |||||
| Common Stocks (8.4)% | |||||
| Aerospace & Defense (0.1)% | |||||
| AAR Corp | United States | 6,937 | (204,919 | ) | |
| Airbus Group NV | France | 2,167 | (147,561 | ) | |
| The Boeing Co | United States | 1,416 | (198,976 | ) | |
| Textron Inc | United States | 9,628 | (435,378 | ) | |
| (986,834 | ) | ||||
| Air Freight & Logistics (0.0)%† | |||||
| Atlas Air Worldwide Holdings Inc | United States | 2,927 | (159,463 | ) | |
| Airlines (0.2)% | |||||
| American Airlines Group Inc | United States | 13,439 | (569,411 | ) | |
| Norwegian Air Shuttle AS | Norway | 5,128 | (199,214 | ) | |
| Spirit Airlines Inc | United States | 1,667 | (105,971 | ) | |
| Virgin America Inc | United States | 21,878 | (622,210 | ) | |
| (1,496,806 | ) | ||||
| Biotechnology (0.3)% | |||||
| Acorda Therapeutics Inc | United States | 10,526 | (320,832 | ) | |
| Alexion Pharmaceuticals Inc | United States | 5,384 | (882,115 | ) | |
| Exelixis Inc | United States | 101,650 | (320,198 | ) | |
| Ligand Pharmaceuticals Inc., B | United States | 4,195 | (369,621 | ) | |
| PDL BioPharma Inc | United States | 4,085 | (27,288 | ) | |
| (1,920,054 | ) | ||||
| Capital Markets (0.1)% | |||||
| Cowen Group Inc | United States | 125,761 | (741,990 | ) | |
| Chemicals (0.0)%† | |||||
| CF Industries Holdings Inc | United States | 503 | (158,888 | ) | |
| A. Schulman Inc | United States | 2,532 | (108,293 | ) | |
| (267,181 | ) | ||||
franklintempleton.com
Annual Report
57
FRANKLIN ALTERNATIVE STRATEGIES FUNDS
CONSOLIDATED STATEMENT O F INVESTMENTS
| Franklin K2 Alternative Strategies Fund (continued) | |||||
| Country | Shares | Value | |||
| tSecurities Sold Short (continued) | |||||
| Common Stocks (continued) | |||||
| Commercial Services & Supplies (0.0)%† | |||||
| Cenveo Inc | United States | 52,407 | $ | (131,017 | ) |
| Communications Equipment (0.2)% | |||||
| InterDigital Inc | United States | 1,530 | (89,704 | ) | |
| Palo Alto Networks Inc | United States | 5,264 | (892,195 | ) | |
| ViaSat Inc | United States | 2,856 | (179,900 | ) | |
| (1,161,799 | ) | ||||
| Construction Materials (0.1)% | |||||
| Cemex SAB de CV, ADR | Mexico | 107,487 | (999,629 | ) | |
| Diversified Consumer Services (0.1)% | |||||
| Ascent Capital Group Inc | United States | 1,735 | (69,973 | ) | |
| Carriage Services Inc | United States | 9,699 | (241,311 | ) | |
| H&R Block Inc | United States | 4,266 | (135,360 | ) | |
| (446,644 | ) | ||||
| Diversified Telecommunication Services (0.2)% | |||||
| AT&T Inc | United States | 37,594 | (1,298,497 | ) | |
| Iridium Communications Inc | United States | 34,141 | (353,359 | ) | |
| Telecom Italia SpA | Italy | 104,114 | (127,613 | ) | |
| (1,779,469 | ) | ||||
| Electrical Equipment (0.0)%† | |||||
| SolarCity Corp | United States | 4,101 | (246,552 | ) | |
| Electronic Equipment, Instruments & Components (0.2)% | |||||
| Vishay Intertechnology Inc | United States | 85,855 | (1,117,832 | ) | |
| Energy Equipment & Services (0.4)% | |||||
| Core Laboratories NV | United States | 2,565 | (301,336 | ) | |
| Halliburton Co | United States | 50,330 | (2,284,982 | ) | |
| SEACOR Holdings Inc | United States | 4,742 | (332,509 | ) | |
| (2,918,827 | ) | ||||
| Food Products (0.4)% | |||||
| Archer-Daniels-Midland Co | United States | 7,790 | (411,701 | ) | |
| Bunge Ltd | United States | 3,625 | (335,530 | ) | |
| The JM Smucker Co | United States | 4,823 | (571,767 | ) | |
| Post Holdings Inc | United States | 36,719 | (1,588,464 | ) | |
| (2,907,462 | ) | ||||
| Health Care Equipment & Supplies (0.2)% | |||||
| Alere Inc | United States | 7,425 | (382,982 | ) | |
| Hologic Inc | United States | 26,777 | (957,813 | ) | |
| Insulet Corp | United States | 1,425 | (40,285 | ) | |
| Quidel Corp | United States | 4,922 | (106,660 | ) | |
| Wright Medical Group Inc | United States | 9,341 | (255,943 | ) | |
| (1,743,683 | ) | ||||
| Health Care Providers & Services (0.5)% | |||||
| Amsurg Corp | United States | 97 | (6,532 | ) | |
| Brookdale Senior Living Inc | United States | 18,943 | (713,962 | ) | |
| HCA Holdings Inc | United States | 1,666 | (136,329 | ) | |
58 Annual Report
franklintempleton.com
FRANKLIN ALTERNATIVE STRATEGIES FUNDS
CONSOLIDATED STATEMENT O F INVESTMENTS
| Franklin K2 Alternative Strategies Fund (continued) | |||||
| Country | Shares | Value | |||
| tSecurities Sold Short (continued) | |||||
| Common Stocks (continued) | |||||
| Health Care Providers & Services (continued) | |||||
| HealthSouth Corp | United States | 9,521 | $ | (410,926 | ) |
| Healthways Inc | United States | 8,482 | (128,587 | ) | |
| Molina Healthcare Inc | United States | 21,113 | (1,535,760 | ) | |
| Omnicare Inc | United States | 4,611 | (439,382 | ) | |
| (3,371,478 | ) | ||||
| Hotels, Restaurants & Leisure (0.0)%† | |||||
| The Cheesecake Factory Inc | United States | 3,190 | (164,508 | ) | |
| Household Durables (0.3)% | |||||
| Hovnanian Enterprises Inc | United States | 23,271 | (75,398 | ) | |
| Jarden Corp | United States | 46,246 | (2,453,813 | ) | |
| (2,529,211 | ) | ||||
| Household Products (0.1)% | |||||
| Kimberly-Clark Corp | United States | 2,713 | (295,337 | ) | |
| Industrial Conglomerates (0.0)%† | |||||
| CK Hutchison Holdings Ltd | Hong Kong | 12,535 | (195,616 | ) | |
| Insurance (0.0)%† | |||||
| AmTrust Financial Services Inc | United States | 2,870 | (172,717 | ) | |
| Axis Capital Holdings Ltd | Bermuda | 1,975 | (108,704 | ) | |
| (281,421 | ) | ||||
| Internet & Catalog Retail (0.2)% | |||||
| Priceline Group Inc | United States | 768 | (900,127 | ) | |
| Vipshop Holdings Ltd., ADR | China | 13,731 | (342,863 | ) | |
| (1,242,990 | ) | ||||
| Internet Software & Services (0.3)% | |||||
| AOL Inc | United States | 4,006 | (200,340 | ) | |
| Blucora Inc | United States | 175 | (2,776 | ) | |
| Blucora Inc | United States | 11,590 | (183,817 | ) | |
| j2 Global Inc | United States | 6,109 | (405,699 | ) | |
| MercadoLibre Inc | Argentina | 3,863 | (560,637 | ) | |
| Pandora Media Inc | United States | 21,132 | (394,534 | ) | |
| Qihoo 360 Technology Co. Ltd., ADR | China | 845 | (43,982 | ) | |
| Twitter Inc | United States | 2,953 | (108,287 | ) | |
| VeriSign Inc | United States | 6,198 | (391,652 | ) | |
| (2,291,724 | ) | ||||
| IT Services (0.0)%† | |||||
| International Business Machines Corp | United States | 876 | (148,613 | ) | |
| Leisure Products (0.0)%† | |||||
| JAKKS Pacific Inc | United States | 20,858 | (160,189 | ) | |
| Life Sciences Tools & Services (0.1)% | |||||
| Sequenom Inc | United States | 87,986 | (294,753 | ) | |
| Machinery (0.5)% | |||||
| Altra Industrial Motion Corp | United States | 15,582 | (428,505 | ) | |
| Caterpillar Inc | United States | 8,458 | (721,637 | ) | |
| Cummins Inc | United States | 2,609 | (353,650 | ) | |
franklintempleton.com
Annual Report
59
FRANKLIN ALTERNATIVE STRATEGIES FUNDS
CONSOLIDATED STATEMENT O F INVESTMENTS
| Franklin K2 Alternative Strategies Fund (continued) | |||||
| Country | Shares | Value | |||
| tSecurities Sold Short (continued) | |||||
| Common Stocks (continued) | |||||
| Machinery (continued) | |||||
| Deere & Co | United States | 3,514 | $ | (329,191 | ) |
| Navistar International Corp | United States | 5,904 | (156,338 | ) | |
| PACCAR Inc | United States | 4,104 | (260,850 | ) | |
| Trinity Industries Inc | United States | 44,984 | (1,349,070 | ) | |
| (3,599,241 | ) | ||||
| Media (0.4)% | |||||
| Charter Communications Inc., A | United States | 2,153 | (385,430 | ) | |
| Mediaset SpA | Italy | 28,734 | (138,415 | ) | |
| Sirius XM Holdings Inc | United States | 692,689 | (2,673,780 | ) | |
| (3,197,625 | ) | ||||
| Metals & Mining (0.0)%† | |||||
| Rio Tinto PLC, ADR | United Kingdom | 1,434 | (62,766 | ) | |
| Multiline Retail (0.1)% | |||||
| Dollar Tree Inc | United States | 8,929 | (669,586 | ) | |
| Macy’s Inc | United States | 4,298 | (287,751 | ) | |
| (957,337 | ) | ||||
| Oil, Gas & Consumable Fuels (0.3)% | |||||
| Aegean Marine Petroleum Network Inc | Greece | 8,791 | (125,008 | ) | |
| Alon USA Energy Inc | United States | 27,340 | (482,004 | ) | |
| Alpha Natural Resources Inc | United States | 43,157 | (21,453 | ) | |
| Amyris Inc | United States | 31,324 | (62,335 | ) | |
| Golar LNG Ltd | Bermuda | 6,185 | (293,849 | ) | |
| Green Plains Inc | United States | 16,550 | (543,833 | ) | |
| PetroQuest Energy Inc | United States | 15,625 | (27,031 | ) | |
| Pioneer Natural Resources Co | United States | 948 | (140,143 | ) | |
| Renewable Energy Group Inc | United States | 24,616 | (261,668 | ) | |
| Sanchez Energy Corp | United States | 15,126 | (152,470 | ) | |
| SandRidge Energy Inc | United States | 2,782 | (3,394 | ) | |
| Scorpio Tankers Inc | Monaco | 12,757 | (116,344 | ) | |
| Ship Finance International Ltd | Norway | 9,354 | (152,938 | ) | |
| Solazyme Inc | United States | 52,949 | (166,790 | ) | |
| (2,549,260 | ) | ||||
| Paper & Forest Products (0.0)%† | |||||
| International Paper Co | United States | 3,767 | (195,244 | ) | |
| Personal Products (0.0)%† | |||||
| Avon Products Inc | United States | 21,331 | (143,344 | ) | |
| Pharmaceuticals (0.5)% | |||||
| AbbVie Inc | United States | 23,253 | (1,548,417 | ) | |
| Actavis PLC | United States | 3,841 | (1,178,457 | ) | |
| ANI Pharmaceuticals Inc | United States | 4,481 | (225,753 | ) | |
| Depomed Inc | United States | 10,571 | (220,511 | ) | |
| Theravance Inc | United States | 19,315 | (326,424 | ) | |
| (3,499,562 | ) | ||||
| Professional Services (0.0)%† | |||||
| 51job Inc., ADR | China | 6,397 | (198,563 | ) | |
60 Annual Report
franklintempleton.com
FRANKLIN ALTERNATIVE STRATEGIES FUNDS
CONSOLIDATED STATEMENT O F INVESTMENTS
| Franklin K2 Alternative Strategies Fund (continued) | |||||
| Country | Shares | Value | |||
| tSecurities Sold Short (continued) | |||||
| Common Stocks (continued) | |||||
| Real Estate Investment Trusts (REITs) (0.8)% | |||||
| American Realty Capital Properties Inc | United States | 65,294 | $ | (579,158 | ) |
| Brandywine Realty Trust | United States | 28,335 | (398,957 | ) | |
| Campus Crest Communities Inc | United States | 3,948 | (22,346 | ) | |
| Colony Financial Inc | United States | 4,425 | (113,546 | ) | |
| Corporate Office Properties Trust | United States | 2,780 | (71,363 | ) | |
| Digital Realty Trust Inc | United States | 1,406 | (92,852 | ) | |
| Government Properties Income Trust | United States | 20,952 | (408,983 | ) | |
| Gramercy Property Trust Inc | United States | 23,366 | (621,769 | ) | |
| Health Care REIT Inc | United States | 4,355 | (305,982 | ) | |
| Iron Mountain Inc | United States | 2,086 | (76,076 | ) | |
| iStar Financial Inc | United States | 2,848 | (40,470 | ) | |
| Liberty Property Trust | United States | 4,799 | (167,677 | ) | |
| National Health Investors Inc | United States | 3,294 | (217,865 | ) | |
| NorthStar Realty Finance Corp | United States | 46,952 | (851,709 | ) | |
| Ramco-Gershenson Properties Trust | United States | 66,897 | (1,151,966 | ) | |
| Realty Income Corp | United States | 10,447 | (476,070 | ) | |
| Redwood Trust Inc | United States | 2,850 | (45,913 | ) | |
| Spirit Realty Capital Inc | United States | 24,353 | (262,769 | ) | |
| Starwood Property Trust Inc | United States | 9,836 | (234,982 | ) | |
| Ventas Inc | United States | 2,009 | (133,639 | ) | |
| (6,274,092 | ) | ||||
| Real Estate Management & Development (0.0)%† | |||||
| Cheung Kong Property Holdings Ltd | Hong Kong | 12,535 | (76,145 | ) | |
| Forest City Enterprises Inc | United States | 4,485 | (103,424 | ) | |
| (179,569 | ) | ||||
| Road & Rail (0.0)%† | |||||
| Knight Transportation Inc | United States | 5,004 | (143,114 | ) | |
| Semiconductors & Semiconductor Equipment (0.3)% | |||||
| Canadian Solar Inc | Canada | 1,223 | (39,943 | ) | |
| Intel Corp | United States | 9,174 | (316,136 | ) | |
| NVIDIA Corp | United States | 13,473 | (298,158 | ) | |
| Photronics Inc | United States | 51,780 | (522,460 | ) | |
| SunEdison Inc | United States | 18,894 | (566,253 | ) | |
| Xilinx Inc | United States | 12,466 | (591,138 | ) | |
| (2,334,088 | ) | ||||
| Software (0.8)% | |||||
| Citrix Systems Inc | United States | 2,405 | (156,349 | ) | |
| Electronic Arts Inc | United States | 46,723 | (2,932,102 | ) | |
| FireEye Inc | United States | 3,523 | (164,066 | ) | |
| Interactive Intelligence Group Inc | United States | 2,196 | (94,933 | ) | |
| NetSuite Inc | United States | 970 | (90,617 | ) | |
| Proofpoint Inc | United States | 7,982 | (471,976 | ) | |
| Take-Two Interactive Software Inc | United States | 53,078 | (1,452,745 | ) | |
| TiVo Inc | United States | 13,446 | (141,586 | ) | |
| Workday Inc | United States | 5,164 | (407,543 | ) | |
| (5,911,917 | ) | ||||
franklintempleton.com
Annual Report
61
FRANKLIN ALTERNATIVE STRATEGIES FUNDS
CONSOLIDATED STATEMENT O F INVESTMENTS
| Franklin K2 Alternative Strategies Fund (continued) | |||||
| Country | Shares | Value | |||
| tSecurities Sold Short (continued) | |||||
| Common Stocks (continued) | |||||
| Specialty Retail (0.1)% | |||||
| Ascena Retail Group Inc | United States | 1,632 | $ | (24,121 | ) |
| Barnes & Noble Inc | United States | 21,234 | (499,424 | ) | |
| Hennes & Mauritz AB, B | Sweden | 8,000 | (315,440 | ) | |
| Office Depot Inc | United States | 3,351 | (31,064 | ) | |
| (870,049 | ) | ||||
| Technology Hardware, Storage & Peripherals (0.1)% | |||||
| Electronics For Imaging Inc | United States | 6,173 | (266,859 | ) | |
| EMC Corp | United States | 2,051 | (54,023 | ) | |
| SanDisk Corp | United States | 609 | (41,644 | ) | |
| Violin Memory Inc | United States | 52,198 | (174,863 | ) | |
| (537,389 | ) | ||||
| Textiles, Apparel & Luxury Goods (0.1)% | |||||
| Adidas AG | Germany | 4,285 | (336,635 | ) | |
| Iconix Brand Group Inc | United States | 25,167 | (649,812 | ) | |
| (986,447 | ) | ||||
| Tobacco (0.3)% | |||||
| Reynolds American Inc | United States | 12,278 | (942,337 | ) | |
| Universal Corp | United States | 15,927 | (820,081 | ) | |
| Vector Group Ltd | United States | 6,630 | (146,589 | ) | |
| (1,909,007 | ) | ||||
| Trading Companies & Distributors (0.1)% | |||||
| Kaman Corp | United States | 9,167 | (388,314 | ) | |
| MSC Industrial Direct Co. Inc | United States | 1,936 | (134,300 | ) | |
| (522,614 | ) | ||||
| Total Common Stocks (Proceeds $63,107,022) | (64,072,310 | ) | |||
| Exchange Traded Funds (11.5)% | |||||
| Consumer Discretionary Select Sector SPDR Fund | United States | 2,147 | (163,816 | ) | |
| Consumer Staples Select Sector SPDR Fund | United States | 75,849 | (3,700,673 | ) | |
| Health Care Select Sector SPDR Fund | United States | 21,604 | (1,620,300 | ) | |
| iShares 20+ Year Treasury Bond ETF | United States | 7,892 | (968,664 | ) | |
| iShares Core S&P Small-Cap ETF | United States | 26,955 | (3,153,465 | ) | |
| iShares Global Utilities ETF | United States | 16,790 | (804,577 | ) | |
| iShares MSCI Emerging Markets ETF | United States | 33,578 | (1,380,727 | ) | |
| iShares MSCI Taiwan ETF | Taiwan | 139,465 | (2,278,858 | ) | |
| iShares Nasdaq Biotechnology ETF | United States | 3,643 | (1,329,804 | ) | |
| iShares North American Tech ETF | United States | 4,190 | (451,933 | ) | |
| iShares North American Tech-Software ETF | United States | 23,490 | (2,370,376 | ) | |
| iShares PHLX Semiconductor ETF | United States | 20,625 | (2,084,569 | ) | |
| iShares Russell 2000 ETF | United States | 51,550 | (6,388,076 | ) | |
| iShares Russell 2000 Growth ETF | United States | 19,845 | (3,024,378 | ) | |
| iShares Russell Mid-Cap Growth ETF | United States | 5,445 | (535,843 | ) | |
| iShares S&P Small-Cap 600 Growth ETF | United States | 5,445 | (703,167 | ) | |
| iShares STOXX Europe 600 UCITS ETF | Germany | 11,775 | (526,739 | ) | |
| iShares U.S. Consumer Goods ETF | United States | 6,630 | (706,095 | ) | |
| iShares U.S. Real Estate ETF | United States | 2,048 | (154,071 | ) | |
62 Annual Report
franklintempleton.com
FRANKLIN ALTERNATIVE STRATEGIES FUNDS
CONSOLIDATED STATEMENT O F INVESTMENTS
| Franklin K2 Alternative Strategies Fund (continued) | |||||
| Country | Shares | Value | |||
| tSecurities Sold Short (continued) | |||||
| Exchange Traded Funds (continued) | |||||
| iShares U.S. Technology ETF | United States | 28,805 | $ | (3,161,925 | ) |
| iShares U.S. Telecommunications ETF | United States | 27,275 | (819,341 | ) | |
| PowerShares Dynamic Retail Portfolio | United States | 31,045 | (1,197,406 | ) | |
| PowerShares Nasdaq Internet Portfolio | United States | 12,200 | (891,210 | ) | |
| PureFunds ISE Cyber Security ETF | United States | 57,120 | (1,741,589 | ) | |
| SPDR S&P 500 ETF Trust | United States | 210,385 | (44,418,585 | ) | |
| SPDR S&P Retail ETF | United States | 3,127 | (305,789 | ) | |
| SPDR S&P Transportation ETF | United States | 6,915 | (687,835 | ) | |
| Utilities Select Sector SPDR Fund | United States | 14,982 | (666,699 | ) | |
| Vanguard Consumer Staples ETF | United States | 8,570 | (1,088,476 | ) | |
| Vanguard Small-Cap Growth ETF | United States | 3,230 | (434,112 | ) | |
| Total Exchange Traded Funds (Proceeds $85,594,368) | (87,759,098 | ) | |||
| Principal | |||||
| Amount* | |||||
| Convertible Bonds and Notes (0.1)% | |||||
| Household Durables (0.0)%† | |||||
| The Ryland Group Inc., senior note, 0.25%, 6/01/19 | United States | 184,000 | (176,870 | ) | |
| Internet Software & Services (0.0)%† | |||||
| Yahoo! Inc., senior note, zero cpn., 12/01/18 | United States | 184,000 | (199,410 | ) | |
| IT Services (0.1)% | |||||
| fEuronet Worldwide Inc., senior bond, 144A, 1.50%, 10/01/44 | United States | 230,000 | (256,881 | ) | |
| Total Convertible Bonds and Notes (Proceeds $628,567) | (633,161 | ) | |||
| Corporate Notes (0.4)% | |||||
| Diversified Financial Services (0.1)% | |||||
| fAmerican Achievement Corp., senior note, 144A, 10.875%, 4/15/16 | United States | 515,000 | (502,769 | ) | |
| Hotels, Restaurants & Leisure (0.1)% | |||||
| Scientific Games International Inc., senior note, 10.00%, 12/01/22 | United States | 920,000 | (894,700 | ) | |
| Oil, Gas & Consumable Fuels (0.2)% | |||||
| California Resources Corp., senior note, 6.00%, 11/15/24 | United States | 1,436,000 | (1,328,300 | ) | |
| Clayton Williams Energy Inc., senior note, 7.75%, 4/01/19 | United States | 175,000 | (165,375 | ) | |
| EXCO Resources Inc., senior note, 7.50%, 9/15/18 | United States | 349,000 | (241,682 | ) | |
| (1,735,357 | ) | ||||
| Total Corporate Notes (Proceeds $3,090,290) | (3,132,826 | ) | |||
franklintempleton.com
Annual Report
63
FRANKLIN ALTERNATIVE STRATEGIES FUNDS
CONSOLIDATED STATEMENT O F INVESTMENTS
Franklin K2 Alternative Strategies Fund (continued)
| Principal | |||||
| Country | Amount* | Value | |||
| U.S. Government and Agency Securities (0.2)% | |||||
| U.S. Treasury Notes, | |||||
| 1.375%, 2/29/20 | United States | 1,513,000 | $ | (1,508,154 | ) |
| 2.125%, 5/15/25 | United States | 310,000 | (310,218 | ) | |
| 2.25%, 11/15/24 | United States | 214,000 | (216,508 | ) | |
| Total U.S. Government & Agency Securities | |||||
| (Proceeds $2,027,392) | (2,034,880 | ) | |||
| Total Securities Sold Short (Proceeds $154,447,639) | $ | (157,632,275 | ) |
*The principal/notional amount is stated in U.S. dollars unless otherwise indicated.
†Rounds to less than 0.1% of net assets.
aSecurity or a portion of the security has been pledged as collateral for securities sold short, open futures, forward, swap and written options contracts. At May 31, 2015, the
aggregate value of these securities and/or cash pledged as collateral was $278,939,272, representing 36.46% of net assets.
bNon-income producing.
cContingent distributions represent the right to receive additional distributions, if any, during the reorganization of the underlying company.
dSecurity has been deemed illiquid because it may not be able to be sold within seven days.
eA portion or all of the security is held in connection with written option contracts open at year end.
fSecurity was purchased pursuant to Rule 144A under the Securities Act of 1933 and may be sold in transactions exempt from registration only to qualified institutional buyers
or in public offering registered under the Securities Act of 1933. These securities have been deemed liquid under guidelines approved by the Trust’s Board of Trustees. At
May 31, 2015, the net value of these securities was $81,816,213, representing 10.70% of net assets.
gA portion or all of the security purchased on a delayed delivery basis. See Note 1(d).
hSecurity was purchased pursuant to Regulation S under the Securities Act of 1933, which exempts from registration securities offered and sold outside of the United States.
Such a security cannot be sold in the United States without either an effective registration statement filed pursuant to the Securities Act of 1933, or pursuant to an exemption
from registration. These securities have been deemed liquid under guidelines approved by the Trust’s Board of Trustees. At May 31, 2015, the aggregate value of these
securities was $17,609,856, representing 2.30% of net assets.
iThe coupon rate shown represents the rate at period end.
jPerpetual security with no stated maturity date.
kIncome may be received in additional securities and/or cash.
lSee Note 7 regarding credit risk and defaulted securities.
mSee Note 1(i) regarding senior floating rate interests.
nPrincipal amount is stated in 100 Mexican Peso Units.
oThe security is traded on a discount basis with no stated coupon rate.
pThe rate shown is the annualized seven-day yield at period end.
qA portion or all of the security is owned by K2 Holdings Investment Corp., a wholly-owned subsidiary of the Fund. See Note 1(h).
rSee Note 1(c) regarding joint repurchase agreement.
sSee Note 1(e) regarding written options.
tSee Note 1(g) regarding securities sold short.
64 Annual Report
franklintempleton.com
FRANKLIN ALTERNATIVE STRATEGIES FUNDS
CONSOLIDATED STATEMENT O F INVESTMENTS
| Franklin K2 Alternative Strategies Fund (continued) | ||||||||||
| At May 31, 2015, the Fund had the following futures contracts outstanding. See Note 1(e). | ||||||||||
| Futures Contracts | ||||||||||
| Number of | Notional | Expiration | Unrealized | Unrealized | ||||||
| Description | Type | Contracts | Value | Date | Appreciation | Depreciation | ||||
| Commodity Contractsa | ||||||||||
| Aluminum | Short | 72 | $ | 3,074,850 | 6/15/15 | $ | 178,027 | $ | — | |
| Aluminum | Long | 18 | 768,712 | 6/15/15 | — | (51,684 | ) | |||
| Aluminum | Short | 7 | 305,725 | 9/14/15 | 7,817 | — | ||||
| Brent Crude Oil | Long | 40 | 2,622,400 | 6/15/15 | 2,719 | — | ||||
| Cocoa | Long | 38 | 1,223,727 | 7/16/15 | 69,322 | — | ||||
| Coffee | Short | 50 | 2,411,250 | 9/18/15 | — | (29,348 | ) | |||
| Copper | Short | 42 | 6,310,762 | 6/15/15 | — | (105,348 | ) | |||
| Copper | Long | 42 | 6,310,762 | 6/15/15 | — | (315,003 | ) | |||
| Copper | Long | 11 | 1,654,537 | 9/14/15 | — | (72,944 | ) | |||
| Copper | Short | 4 | 601,650 | 9/14/15 | 20,851 | — | ||||
| Corn | Short | 101 | 1,775,075 | 7/14/15 | 50,113 | — | ||||
| Cotton | Short | 3 | 96,960 | 12/08/15 | — | (753 | ) | |||
| Gold 100 Oz | Short | 31 | 3,688,380 | 8/27/15 | 48,172 | — | ||||
| Kansas City Wheat | Short | 3 | 74,813 | 7/14/15 | 2,104 | — | ||||
| Low Sulfur Gas Oil | Long | 56 | 3,323,600 | 7/10/15 | — | (39,535 | ) | |||
| Natural Gas | Short | 58 | 1,532,360 | 6/26/15 | 134,652 | — | ||||
| NY Harbor Ultra-Low Sulfur Diesel | Long | 29 | 2,374,735 | 6/30/15 | 7,762 | — | ||||
| RBOB Gasoline | Long | 20 | 1,732,668 | 6/30/15 | 40,280 | — | ||||
| Silver | Long | 5 | 417,525 | 7/29/15 | 1,464 | — | ||||
| Soybeans | Short | 37 | 1,727,900 | 7/14/15 | 43,787 | — | ||||
| Soybean Meal | Short | 31 | 947,670 | 7/14/15 | 39,176 | — | ||||
| Soybean Oil | Short | 14 | 279,972 | 7/14/15 | — | (17,360 | ) | |||
| Sugar | Short | 56 | 770,202 | 9/30/15 | — | (5,158 | ) | |||
| Wheat | Short | 78 | 1,860,300 | 7/14/15 | 175,413 | — | ||||
| WTI Crude Oil | Short | 35 | 2,110,500 | 6/22/15 | 22,143 | — | ||||
| Zinc | Long | 72 | 3,929,400 | 6/15/15 | — | (126,078 | ) | |||
| Zinc | Short | 52 | 2,837,900 | 6/15/15 | — | (132,183 | ) | |||
| Zinc | Long | 11 | 602,388 | 9/14/15 | — | (10,537 | ) | |||
| 55,366,723 | 843,802 | (905,931 | ) | |||||||
| Equity Contracts | ||||||||||
| CAC40 10 Euroa | Long | 56 | 3,065,700 | 6/19/15 | 864 | — | ||||
| CAC40 10 Euro | Short | 8 | 437,957 | 6/19/15 | 12,513 | — | ||||
| DJIA Mini E-CBOT Indexa | Long | 56 | 5,042,520 | 6/19/15 | — | (52,728 | ) | |||
| Euro STOXX 50 Indexa | Long | 52 | 2,034,311 | 6/19/15 | — | (27,200 | ) | |||
| FTSE 100 Indexa | Long | 15 | 1,596,679 | 6/19/15 | 47,081 | — | ||||
| Hang Seng Indexa | Long | 21 | 3,678,551 | 6/29/15 | — | (126,820 | ) | |||
| Nasdaq 100 E-Mini Indexa | Long | 40 | 3,608,800 | 6/19/15 | 143,415 | — | ||||
| Nikkei 225 Indexa | Long | 48 | 3,977,602 | 6/11/15 | 337,505 | — | ||||
| Russell 2000 Mini Indexa | Long | 46 | 5,723,780 | 6/19/15 | 10,500 | — | ||||
| S&P 500 E-Mini Index | Short | 163 | 17,163,900 | 6/19/15 | — | (391,328 | ) | |||
| S&P 500 E-Mini Indexa | Long | 27 | 2,843,100 | 6/19/15 | — | (19,315 | ) | |||
| TOPIX Indexa | Long | 48 | 6,462,394 | 6/11/15 | 500,902 | — | ||||
| 55,635,294 | 1,052,780 | (617,391 | ) | |||||||
| Interest Rate Contracts | ||||||||||
| 3 Month Euribora | Long | 453 | 124,332,455 | 9/19/16 | — | (36,556 | ) | |||
| 90 Day Eurodollara | Long | 907 | 224,119,700 | 9/19/16 | 239,227 | — | ||||
| 90 Day Eurodollar | Short | 25 | 6,165,000 | 12/19/16 | — | (1,650 | ) | |||
| 90 Day Eurodollar | Short | 46 | 11,278,625 | 12/18/17 | 4,690 | — | ||||
| 90 Day Sterlinga | Short | 13 | 2,457,568 | 9/21/16 | — | (511 | ) | |||
| 90 Day Sterling | Short | 36 | 6,795,943 | 12/21/16 | 2,578 | — | ||||
| Australian 10 Yr. Bonda | Short | 68 | 6,680,551 | 6/15/15 | — | (100,584 | ) | |||
| Canadian 10 Yr. Bonda | Long | 29 | 3,285,703 | 9/21/15 | 49,841 | — | ||||
franklintempleton.com
Annual Report
65
FRANKLIN ALTERNATIVE STRATEGIES FUNDS
CONSOLIDATED STATEMENT O F INVESTMENTS
| Franklin K2 Alternative Strategies Fund (continued) | |||||||||||
| Futures Contracts (continued) | |||||||||||
| Number of | Notional Expiration | Unrealized | Unrealized | ||||||||
| Description | Type Contracts | Value | Date Appreciation | Depreciation | |||||||
| Interest Rate Contracts (continued) | |||||||||||
| Euro-Bunda | Long | 29 | $ | 4,950,544 | 6/08/15 | $ | 79,070 | $ | — | ||
| Long Gilta | Short | 46 | 8,282,081 | 9/28/15 | — | (57,373 | ) | ||||
| U.S. Treasury 10 Yr. Notea | Long | 20 | 2,553,750 | 9/21/15 | 20,285 | — | |||||
| U.S. Treasury Long Bonda | Short | 24 | 3,735,000 | 9/21/15 | — | (49,560 | ) | ||||
| 404,636,920 | 395,691 | (246,234 | ) | ||||||||
| Totals | $ | 515,638,937 | $ | 2,292,273 | $ | (1,769,556 | ) | ||||
| Net unrealized appreciation (depreciation) | $ | 522,717 | |||||||||
| aA portion or all of the contract is owned by K2 Holdings Investment Corp., a wholly-owned subsidiary of the Fund. See Note 1(h). | |||||||||||
| At May 31, 2015, the Fund had the following forward exchange contracts outstanding. See Note 1(e). | |||||||||||
| Forward Exchange Contracts | |||||||||||
| Contract | Settlement | Unrealized | Unrealized | ||||||||
| Currency | Counterpartya Type | Quantity | Amount* | Date | Appreciation | Depreciation | |||||
| OTC Forward Exchange Contracts | |||||||||||
| Canadian Dollar | BNYM | Buy | 32,803 | 26,337 | 6/01/15 | $ | 40 | $ | — | ||
| Australian Dollar | BNYM | Buy | 24,353 | 18,616 | 6/02/15 | 3 | — | ||||
| Brazilian Real | MLCO | Sell | 275,000 | 90,333 | 6/05/15 | 4,180 | — | ||||
| New Russian Ruble | MSCO | Buy | 77,888,258 | 1,506,324 | 6/05/15 | — | (22,288 | ) | |||
| New Russian Ruble | MSCO | Sell | 77,888,258 | 1,563,943 | 6/05/15 | 79,906 | — | ||||
| Mexican Peso | CSFB | Sell | 9,690,000 | 630,248 | 6/09/15 | 1,404 | — | ||||
| New Russian Ruble | MSCO | Buy | 37,155,496 | 698,937 | 6/15/15 | 6,324 | — | ||||
| New Russian Ruble | MSCO | Sell | 155,470,838 | 2,995,296 | 6/15/15 | 44,250 | — | ||||
| British Pound | BNYM | Buy | 535,000 | 788,930 | 6/17/15 | 29,288 | (625 | ) | |||
| British Pound | BNYM | Sell | 721,874 | 1,078,844 | 6/17/15 | 63 | (24,396 | ) | |||
| Euro | BNYM | Buy | 380,000 | 417,674 | 6/17/15 | 2,698 | (2,925 | ) | |||
| Euro | BNYM | Sell | 6,481,995 | 6,925,445 | 6/17/15 | 7,408 | (202,719 | ) | |||
| Euro | BOFA | Sell | 78,000 | 87,578 | 6/17/15 | 1,891 | — | ||||
| Euro | DBFX | Sell | 4,184,524 | 4,497,926 | 6/17/15 | 2,937 | (101,893 | ) | |||
| Euro | MLCO | Sell | 781,424 | 844,137 | 6/17/15 | — | (14,291 | ) | |||
| Euro | MSCO | Buy | 3,701,482 | 4,153,075 | 6/17/15 | — | (86,834 | ) | |||
| Euro | MSCO | Sell | 3,752,663 | 4,186,071 | 6/17/15 | 66,134 | (2,527 | ) | |||
| Euro | UBSW | Buy | 209,000 | 222,394 | 6/17/15 | 7,201 | — | ||||
| Euro | UBSW | Sell | 522,000 | 552,653 | 6/17/15 | — | (20,787 | ) | |||
| South African Rand | DBFX | Sell | 39,420,535 | 3,230,000 | 6/17/15 | — | (6,639 | ) | |||
| South African Rand | MSCO | Sell | 6,886,611 | 569,804 | 6/17/15 | 4,376 | — | ||||
| Swiss Franc | BNYM | Sell | 3,910,194 | 3,983,366 | 6/17/15 | 14,544 | (194,083 | ) | |||
| Euro | BZWS | Sell | 419,000 | 466,613 | 6/18/15 | 6,317 | — | ||||
| Euro | DBFX | Sell | 203,000 | 231,506 | 6/18/15 | 8,499 | — | ||||
| Australian Dollarb | MSCO | Buy | 10,409,000 | 8,095,038 | 6/19/15 | 316 | (145,200 | ) | |||
| Australian Dollarb | MSCO | Sell | 19,378,000 | 14,826,290 | 6/19/15 | 62,148 | (36,326 | ) | |||
| British Poundb | MSCO | Buy | 15,448,000 | 23,363,826 | 6/19/15 | 399,954 | (156,293 | ) | |||
| British Poundb | MSCO | Sell | 13,639,000 | 20,440,711 | 6/19/15 | 16,717 | (418,996 | ) | |||
| Canadian Dollarb | MSCO | Buy | 3,205,000 | 2,602,097 | 6/19/15 | 7,953 | (33,669 | ) | |||
| Canadian Dollarb | MSCO | Sell | 12,411,000 | 10,095,239 | 6/19/15 | 184,728 | (66,237 | ) | |||
| Colombian Peso | CITI | Sell | 780,000,000 | 326,900 | 6/19/15 | 19,279 | — | ||||
| Eurob | MSCO | Buy | 9,468,000 | 10,199,386 | 6/19/15 | 241,689 | (39,789 | ) | |||
| Eurob | MSCO | Sell | 7,825,000 | 8,542,744 | 6/19/15 | 59,567 | (113,155 | ) | |||
| Japanese Yenb | MSCO | Buy | 2,156,490,000 | 17,840,764 | 6/19/15 | — | (461,089 | ) | |||
| Japanese Yenb | MSCO | Sell | 2,833,825,000 | 23,566,004 | 6/19/15 | 727,522 | — | ||||
| Mexican Pesob | MSCO | Buy | 15,132,000 | 994,503 | 6/19/15 | 224 | (13,448 | ) | |||
66 Annual Report
franklintempleton.com
FRANKLIN ALTERNATIVE STRATEGIES FUNDS
CONSOLIDATED STATEMENT O F INVESTMENTS
| Franklin K2 Alternative Strategies Fund (continued) | |||||||||||
| Forward Exchange Contracts | |||||||||||
| Contract | Settlement | Unrealized | Unrealized | ||||||||
| Currency | Counterpartya Type | Quantity | Amount* | Date | Appreciation | Depreciation | |||||
| OTC Forward Exchange Contracts (continued) | |||||||||||
| Mexican Pesob | MSCO | Sell | 86,792,000 | 5,612,219 | 6/19/15 | $ | 10,388 | $ | (26,447 | ) | |
| New Zealand Dollarb | MSCO | Buy | 8,866,000 | 6,695,978 | 6/19/15 | — | (417,171 | ) | |||
| New Zealand Dollarb | MSCO | Sell | 15,144,000 | 11,190,031 | 6/19/15 | 465,212 | — | ||||
| Swiss Francb | MSCO | Buy | 18,045,000 | 18,920,646 | 6/19/15 | 401,691 | (109,772 | ) | |||
| Swiss Francb | MSCO | Sell | 9,942,000 | 10,045,755 | 6/19/15 | 6,722 | (546,243 | ) | |||
| Euro | CSFB | Sell | 385,000 | 428,808 | 6/26/15 | 5,818 | — | ||||
| Japanese Yen | DBFX | Sell | 179,800,000 | 1,479,288 | 6/26/15 | 30,090 | — | ||||
| Mexican Peso | CSFB | Sell | 102,600 | 6,721 | 6/26/15 | 71 | — | ||||
| South African Rand | CSFB | Sell | 11,700,000 | 979,334 | 6/26/15 | 20,154 | — | ||||
| Australian Dollar | CSFB | Sell | 1,025,000 | 798,413 | CAD | 6/29/15 | 15,959 | — | |||
| Canadian Dollar | CSFB | Buy | 982,852 | 798,413 | 6/29/15 | — | (8,466 | ) | |||
| Euro | BOFA | Sell | 1,025,000 | 1,131,267 | 6/29/15 | 5,081 | — | ||||
| Euro | DBFX | Sell | 100,000 | 110,210 | 6/29/15 | 338 | — | ||||
| Hungarian Forint | BOFA | Buy | 307,000,000 | 1,101,069 | 6/29/15 | — | (11,094 | ) | |||
| Japanese Yen | MLCO | Sell | 42,000,000 | 341,651 | 6/29/15 | 3,115 | — | ||||
| British Pound | BNYM | Sell | 312,000 | 477,026 | 6/30/15 | 268 | — | ||||
| British Pound | MSCO | Buy | 286,615 | 445,337 | 6/30/15 | — | (7,369 | ) | |||
| British Pound | MSCO | Sell | 1,316,987 | 1,980,455 | 6/30/15 | 4,038 | (36,032 | ) | |||
| Canadian Dollar | MSCO | Sell | 1,682,380 | 1,378,130 | 6/30/15 | 25,974 | — | ||||
| Euro | BNYM | Sell | 8,070,000 | 8,786,370 | 6/30/15 | — | (80,398 | ) | |||
| Euro | MSCO | Buy | 863,369 | 967,109 | 6/30/15 | — | (18,498 | ) | |||
| Euro | MSCO | Sell | 6,458,637 | 7,008,589 | 6/30/15 | 30,432 | (118,154 | ) | |||
| Hong Kong Dollar | BNYM | Sell | 13,934,000 | 1,796,032 | 6/30/15 | — | (929 | ) | |||
| Japanese Yen | BNYM | Sell | 95,957,000 | 774,847 | 6/30/15 | 1,384 | — | ||||
| Norweigian Krone | MSCO | Buy | 1,507,994 | 201,480 | 6/30/15 | — | (7,596 | ) | |||
| Swedish Krona | MSCO | Buy | 3,258,648 | 394,979 | 6/30/15 | — | (12,583 | ) | |||
| Swedish Krona | MSCO | Sell | 644,812 | 74,532 | 6/30/15 | — | (1,135 | ) | |||
| Totals Forward Exchange Contracts unrealized appreciation (depreciation) | $ | 3,034,295 | $ | (3,566,096 | ) | ||||||
| Net unrealized appreciation (depreciation) | $ | (531,801 | ) | ||||||||
*In U.S. dollars unless otherwise indicated.
aMay be comprised of multiple contracts with the same counterparty, currency and settlement date.
bA portion or all of the contract is owned by K2 Holdings Investment Corp., a wholly-owned subsidiary of the Fund. See Note 1(h).
| At May 31, 2015, the Fund had the following credit default swap contracts outstanding. See Note 1(e). | ||||||||||||||||||
| Credit Default Swap Contracts | ||||||||||||||||||
| Upfront | ||||||||||||||||||
| Periodic | Premiums | |||||||||||||||||
| Payment | Counterparty/ | Notional | Expiration | Paid | Unrealized | Unrealized | ||||||||||||
| Description | Rate | Exchange | Amounta | Date | (Received) | Appreciation | Depreciation | Value | Ratingb | |||||||||
| Centrally Cleared Swap Contracts | ||||||||||||||||||
| Contracts to Buy Protection | ||||||||||||||||||
| Traded Index | ||||||||||||||||||
| CDX 23 HY | 5.00 | % | ICE | 1,236,760 | 12/20/19 | $ | (81,567 | ) | $ | — | $ | (21,364 | ) | $ | (102,931 | ) | ||
| iTraxx Europe Crossover | 5.00 | % | ICE | 634,000 | EUR | 6/20/20 | (71,223 | ) | 3,977 | — | (67,246 | ) | ||||||
| Totals Centrally Cleared Swaps Contracts | $ | (152,790 | ) | $ | 3,977 | $ | (21,364 | ) | $ | (170,177 | ) | |||||||
franklintempleton.com
Annual Report
67
FRANKLIN ALTERNATIVE STRATEGIES FUNDS
CONSOLIDATED STATEMENT O F INVESTMENTS
| Franklin K2 Alternative Strategies Fund (continued) | |||||||||||||||||
| Credit Default Swap Contracts (continued) | |||||||||||||||||
| Upfront | |||||||||||||||||
| Periodic | Premiums | ||||||||||||||||
| Payment | Counterparty/ | Notional | Expiration | Paid | Unrealized | Unrealized | |||||||||||
| Description | Rate | Exchange | Amounta | Date (Received) | Appreciation | Depreciation | Value | Ratingb | |||||||||
| OTC Swaps | |||||||||||||||||
| Contract to Buy Protection | |||||||||||||||||
| Single Name | |||||||||||||||||
| Avon Products Inc | 5.00 | % | MSCS | 636,000 | 6/20/20 | $ | 32,868 | $ | 756 | $ | — | $ | 33,624 | ||||
| Government of Brazil | 1.00 | % | BOFA | 110,000 | 12/20/19 | 3,339 | 2,140 | — | 5,479 | ||||||||
| Government of Brazil | 1.00 | % | BOFA | 40,000 | 12/20/19 | 1,263 | 729 | — | 1,992 | ||||||||
| Government of Brazil | 1.00 | % | CITI | 80,000 | 12/20/19 | 2,099 | 1,886 | — | 3,985 | ||||||||
| Government of Brazil | 1.00 | % | BOFA | 50,000 | 12/20/19 | 1,250 | 1,241 | — | 2,491 | ||||||||
| Government of Russia | 1.00 | % | JPHQ | 2,829,000 | 6/20/20 | 177,198 | — | (5,852 | ) | 171,346 | |||||||
| Contract to Sell Protectionc | |||||||||||||||||
| Single Name | |||||||||||||||||
| Toys R US Inc | 5.00 | % | MSCS | 187,000 | 12/20/16 | (13,017 | ) | 1,533 | — | (11,484 | ) | CCC | |||||
| Toys R US Inc | 5.00 | % | MSCS | 111,000 | 12/20/16 | (8,048 | ) | 1,231 | — | (6,817 | ) | CCC | |||||
| Toys R US Inc | 5.00 | % | MSCS | 74,000 | 12/20/16 | (5,758 | ) | 1,213 | — | (4,545 | ) | CCC | |||||
| Transocean Ltd | 1.00 | % | MSCS | 150,000 | 12/20/19 | (19,507 | ) | — | (5,980 | ) | (25,487 | ) | BB+ | ||||
| Transocean Ltd | 1.00 | % | DBFX | 100,000 | 12/20/19 | (12,493 | ) | — | (4,498 | ) | (16,991 | ) | BB+ | ||||
| Transocean Ltd | 1.00 | % | MSCS | 150,000 | 12/20/19 | (25,481 | ) | — | (5 | ) | (25,486 | ) | BB+ | ||||
| Transocean Ltd | 1.00 | % | MSCS | 150,000 | 12/20/19 | (28,194 | ) | 2,707 | — | (25,487 | ) | BB+ | |||||
| Transocean Ltd | 1.00 | % | MSCS | 75,000 | 12/20/19 | (12,198 | ) | — | (545 | ) | (12,743 | ) | BB+ | ||||
| Transocean Ltd | 1.00 | % | BOFA | 75,000 | 12/20/19 | (8,514 | ) | — | (4,229 | ) | (12,743 | ) | BB+ | ||||
| Transocean Ltd | 1.00 | % | CITI | 300,000 | 12/20/19 | (46,816 | ) | — | (4,156 | ) | (50,972 | ) | BB+ | ||||
| Totals OTC Swaps Contracts | 37,991 | 13,436 | (25,265 | ) | 26,162 | ||||||||||||
| Totals Credit Default Swaps Contracts | 6,987,760 | $ | (117,818 | ) | $ | 17,413 | $ | (46,629 | ) | $ | (147,034 | ) | |||||
| Net unrealized appreciation (depreciation) | $ | (29,216 | ) | ||||||||||||||
See Notes 1(e) and 9 regarding derivative financial instruments and other derivative information, respectively.
aIn U.S. dollars unless otherwise indicated. For contracts to sell protection, the notional amount is equal to the maximum potential amount of the future payments and no
recourse provisions have been entered into in association with the contracts.
bBased on Standard and Poor’s (S&P) Rating for single name swaps and internal ratings for index swaps.
cThe Fund enters contracts to sell protection to create a long credit position. Performance triggers include default, bankruptcy or restructuring for single name swaps and fail-
ure to pay or bankruptcy of the underlying securities for traded index swaps.
| At May 31, 2015, the Fund had the following interest rate swap contracts outstanding. See Note 1(e). | |||||||||
| Interest Rate Swap Contracts | |||||||||
| Counterparty/ | Notional | Expiration | Unrealized | Unrealized | |||||
| Description | Exchange | Amount* | Date | Appreciation | Depreciation | ||||
| Centrally Cleared Swap Contracts | |||||||||
| Receive Floating rate 3 Month USD-LIBOR | |||||||||
| Pay Fixed rate 2.184% | CME | 1,300,000 | 5/05/25 | $ | — | $ | (2,107 | ) | |
| Totals Centrally Cleared Swap Contracts | — | (2,107 | ) | ||||||
| OTC Swap Contracts | |||||||||
| Receive Floating rate 3 Month ZAR-JIBAR-SAFEX | |||||||||
| Pay Fixed rate 7.95% | BZWS | 12,500,000 | ZAR | 5/05/25 | $ | 12,504 | $ | — | |
| Totals OTC Swap Contracts | 12,504 | — | |||||||
| Totals Interest Rate Swap Contracts | $ | 12,504 | $ | (2,107 | ) | ||||
| Net unrealized appreciation (depreciation) | $ | 10,397 | |||||||
| *In U.S. dollars unless otherwise indicated. | |||||||||
68 Annual Report
franklintempleton.com
FRANKLIN ALTERNATIVE STRATEGIES FUNDS
CONSOLIDATED STATEMENT O F INVESTMENTS
| Franklin K2 Alternative Strategies Fund (continued) | ||||||||||
| At May 31, 2015, the Fund had the following total return swap contracts outstanding. See Note 1(e). | ||||||||||
| Total Return Swap Contracts | ||||||||||
| Counter- | Expiration | Unrealized | Unrealized | |||||||
| Underlying Instrument | Financing Rate | party Notional Value* | Date | Appreciation | Depreciation | |||||
| Long | ||||||||||
| Amsurg Corp | LIBOR + 75 bps | DBFX | 203,401 | 6/30/15 | $ | 3,120 | $ | — | ||
| Health Care REIT Inc | LIBOR + 75 bps | DBFX | 861,881 | 6/30/15 | — | (18,622 | ) | |||
| Southwestern Energy Co | LIBOR + 75 bps | DBFX | 1,097,205 | 6/30/15 | — | (69,759 | ) | |||
| T-Mobile U.S. Inc | LIBOR + 75 bps | DBFX | 179,573 | 6/30/15 | 19,038 | — | ||||
| Aabar Investments PJSC | LIBOR + 100 bps | DBFX | 736,811 | EUR | 7/14/15 | 370 | — | |||
| Aabar Investments PJSC | LIBOR | DBFX | 321,688 | EUR | 7/14/15 | — | (2,815 | ) | ||
| Drillsearch Finance Pty Ltd | LIBOR + 75 bps | DBFX | 200,971 | 7/15/15 | 3,150 | — | ||||
| FF Group Finance Luxembourg | LIBOR + 75 bps | DBFX | 263,809 | EUR | 7/15/15 | — | (7,802 | ) | ||
| International Consolidated Airlines | ||||||||||
| Group SA | LIBOR + 75 bps | DBFX | 6,352,660 | EUR | 7/15/15 | — | (142,131 | ) | ||
| Inmarsat PLC | LIBOR + 75 bps | DBFX | 1,058,047 | 7/15/15 | — | (12,568 | ) | |||
| Paladin Energy Ltd | LIBOR + 75 bps | DBFX | 373,267 | 7/15/15 | 5,477 | — | ||||
| Solidium Oy | LIBOR + 75 bps | DBFX | 905,926 | EUR | 7/15/15 | — | (3,394 | ) | ||
| Acciona SA | LIBOR + 75 bps | DBFX | 1,676,253 | EUR | 7/17/15 | — | (35,173 | ) | ||
| alstria office REIT-AG | LIBOR + 75 bps | DBFX | 950,004 | EUR | 7/17/15 | — | (44,269 | ) | ||
| Carillion Finance Jersey Ltd | LIBOR + 75 bps | DBFX | 1,297,244 | GBP | 7/17/15 | — | (3,064 | ) | ||
| Deutsche Post AG | LIBOR + 75 bps | DBFX | 1,371,562 | EUR | 7/17/15 | 1,326 | — | |||
| Drillisch AG | LIBOR + 75 bps | DBFX | 3,383,927 | EUR | 7/17/15 | 45,154 | — | |||
| Deutsche Wohnen AG | LIBOR + 75 bps | DBFX | 848,101 | EUR | 7/17/15 | — | (57,638 | ) | ||
| Great Portland Estates Capital | ||||||||||
| Jersey Ltd | LIBOR + 75 bps | DBFX | 751,050 | GBP | 7/17/15 | — | (16,099 | ) | ||
| Helical Bar Jersey Ltd | LIBOR + 75 bps | DBFX | 315,623 | GBP | 7/17/15 | 9,488 | — | |||
| KUKA AG | LIBOR + 75 bps | DBFX | 368,188 | EUR | 7/17/15 | 28,166 | — | |||
| LEG Immobilien AG | LIBOR + 75 bps | DBFX | 415,190 | EUR | 7/17/15 | — | (20,329 | ) | ||
| Lotte Shopping Co. Ltd | LIBOR + 90 bps | DBFX | 387,882 | 7/17/15 | 1,766 | — | ||||
| RAG-Stiftung | LIBOR + 75 bps | DBFX | 903,300 | EUR | 7/17/15 | 3,524 | — | |||
| Unite Jersey Issuer Ltd | LIBOR + 75 bps | DBFX | 635,827 | GBP | 7/17/15 | 5,754 | — | |||
| Alcatel-Lucent | LIBOR + 75 bps | DBFX | 1,927,697 | EUR | 7/20/15 | 136,251 | — | |||
| Golar LNG Ltd | LIBOR + 75 bps | DBFX | 740,032 | 7/20/15 | 4,599 | — | ||||
| Ship Finance International Ltd | LIBOR + 75 bps | DBFX | 412,682 | 7/20/15 | 151 | — | ||||
| Hansteen Jersey Securities Ltd | LIBOR + 75 bps | DBFX | 2,447,123 | EUR | 7/30/15 | 136,202 | — | |||
| Marine Harvest | LIBOR + 40 bps | DBFX | 308,528 | EUR | 10/05/15 | — | (10,268 | ) | ||
| Commerzbank AG | EONIA + 65 bps | MSCS | 139,395 | EUR | 10/19/15 | — | — | |||
| Celesio AG | EONIA + 65 bps | MSCS | 393,636 | EUR | 10/19/15 | — | — | |||
| MAN SE | EONIA + 65 bps | MSCS | 1,984,475 | EUR | 10/19/15 | — | — | |||
| ThyssenKrupp AG | EONIA + 65 bps | MSCS | 194,287 | EUR | 10/19/15 | — | — | |||
| Alstom SA | EONIA + 65 bps | MSCS | 1,235,207 | EUR | 10/28/15 | — | — | |||
| Bollore SA | EONIA + 65 bps | MSCS | 573,763 | EUR | 10/28/15 | — | — | |||
| Jazztel PLC | EONIA + 65 bps | MSCS | 1,532,450 | EUR | 10/28/15 | — | — | |||
| Nokia OYJ | EONIA + 65 bps | MSCS | 72,411 | EUR | 10/28/15 | — | — | |||
| Telecom Italia SpA | EONIA + 65 bps | MSCS | 316,559 | EUR | 10/28/15 | — | — | |||
| TNT Express NV | EONIA + 65 bps | MSCS | 204,672 | EUR | 10/28/15 | — | — | |||
| Vivendi SA | EONIA + 65 bps | MSCS | 2,860,208 | EUR | 10/28/15 | — | — | |||
| World Duty Free SpA | EONIA + 65 bps | MSCS | 155,645 | EUR | 10/28/15 | — | — | |||
| BG Group PLC | SONIA + 65 bps | MSCS | 633,389 | GBP | 10/29/15 | — | — | |||
| CSR PLC | SONIA + 65 bps | MSCS | 589,500 | GBP | 10/29/15 | — | — | |||
| Kingfisher PLC | SONIA + 65 bps | MSCS | 722,958 | GBP | 10/29/15 | 20,457 | — | |||
| Rexam PLC | SONIA + 65 bps | MSCS | 104,343 | GBP | 10/29/15 | — | — | |||
| Smith & Nephew PLC | SONIA + 65 bps | MSCS | 585,127 | GBP | 10/29/15 | — | — | |||
| Spire Healthcare Group PLC | SONIA + 65 bps | MSCS | 73,494 | GBP | 10/29/15 | — | — | |||
| Telecity Group PLC | SONIA + 65 bps | MSCS | 578,612 | GBP | 10/29/15 | — | (76 | ) | ||
| ABC-Mart Inc | LIBOR + 85 bps | DBFX | 61,744,801 | JPY | 11/17/15 | 11,481 | — | |||
| Alps Electric Co Ltd | LIBOR + 85 bps | DBFX | 240,866,501 | JPY | 11/17/15 | 53,819 | — | |||
franklintempleton.com
Annual Report
69
FRANKLIN ALTERNATIVE STRATEGIES FUNDS
CONSOLIDATED STATEMENT O F INVESTMENTS
| Franklin K2 Alternative Strategies Fund (continued) | ||||||||||
| Total Return Swap Contracts (continued) | ||||||||||
| Counter- | Expiration | Unrealized | Unrealized | |||||||
| Underlying Instrument | Financing Rate | party Notional Value* | Date | Appreciation | Depreciation | |||||
| Long (continued) | ||||||||||
| EDION Corp | LIBOR + 85 bps | DBFX | 54,519,800 | JPY | 11/17/15 | $ | 29,407 | $ | — | |
| Maeda Corp | LIBOR + 85 bps | DBFX | 30,339,000 | JPY | 11/17/15 | 3,080 | — | |||
| Nagoya Railroad Co. Ltd | LIBOR + 85 bps | DBFX | 37,388,228 | JPY | 11/17/15 | 5,334 | — | |||
| OSG Corp | LIBOR + 85 bps | DBFX | 185,550,000 | JPY | 11/17/15 | 36,251 | — | |||
| Temp Holdings Co. Ltd | LIBOR + 85 bps | DBFX | 74,750,000 | JPY | 11/17/15 | 32,031 | — | |||
| LIXIL Group Corp | LIBOR + 85 bps | DBFX | 119,913,609 | JPY | 11/17/15 | — | (32,104 | ) | ||
| iiNET Ltd | RBACR + 255 bps | MSCS | 80,938 | AUD | 12/03/15 | — | — | |||
| Sirius Resources NL | RBACR + 255 bps | MSCS | 118,964 | AUD | 12/03/15 | — | — | |||
| The Yamagata Bank Ltd | LIBOR + 85 bps | DBFX | 998,503 | 12/18/15 | — | (3,847 | ) | |||
| The Gunma Bank Ltd | LIBOR + 85 bps | DBFX | 115,912 | 12/18/15 | — | (727 | ) | |||
| The Oita Bank Ltd | LIBOR + 85 bps | DBFX | 1,362,400 | 12/18/15 | 31,380 | — | ||||
| Yamaguchi Financial Group Inc | LIBOR + 85 bps | DBFX | 3,103,147 | 12/18/15 | — | (15,892 | ) | |||
| Acadia Realty Trust | FEDEF + 52 bps | MSCS | 43,211 | 12/22/15 | — | — | ||||
| AvalonBay Communities Inc | FEDEF + 52 bps | MSCS | 69,264 | 12/22/15 | — | — | ||||
| Boston Properties Inc | FEDEF + 52 bps | MSCS | 52,792 | 12/22/15 | — | — | ||||
| Equity Residential | FEDEF + 52 bps | MSCS | 51,504 | 12/22/15 | — | — | ||||
| Eagle Rock Energy Partners LP | FEDEF + 112 bps | MSCS | 13,138 | 12/22/15 | — | — | ||||
| Federal Realty Investment Trust | FEDEF + 52 bps | MSCS | 104,349 | 12/22/15 | — | — | ||||
| National Retail Properties Inc | FEDEF + 52 bps | MSCS | 76,896 | 12/22/15 | — | — | ||||
| Sunstone Hotel Investors Inc | FEDEF + 52 bps | MSCS | 76,102 | 12/22/15 | — | — | ||||
| Simon Property Group Inc | FEDEF + 52 bps | MSCS | 36,824 | 12/22/15 | — | — | ||||
| Spirit Realty Capital Inc | FEDEF + 52 bps | MSCS | 677,893 | 12/22/15 | — | — | ||||
| Olam International Ltd | LIBOR + 100 bps | DBFX | 741,669 | 1/08/16 | — | (2,470 | ) | |||
| APERAM SA | LIBOR + 75 bps | DBFX | 2,501,523 | 1/22/16 | — | (110,146 | ) | |||
| VInci SA | LIBOR + 50 bps | DBFX | 125,124 | EUR | 1/30/16 | — | (915 | ) | ||
| Biostime International Holdings Ltd | LIBOR + 100 bps | DBFX | 1,912,069 | HKD | 2/08/16 | 3,171 | — | |||
| Hengan International Group Co. Ltd | LIBOR + 100 bps | DBFX | 3,258,077 | HKD | 2/08/16 | — | (6,870 | ) | ||
| ACS Actividades Finance BV | LIBOR + 75 bps | DBFX | 1,585,863 | EUR | 2/09/16 | 14,117 | — | |||
| Acciona SA | LIBOR + 75 bps | DBFX | 349,450 | EUR | 2/09/16 | 32,912 | — | |||
| Ascent Capital Group Inc | LIBOR + 50 bps | DBFX | 100,874 | 2/09/16 | — | (21,294 | ) | |||
| Bunge Ltd | LIBOR + 50 bps | DBFX | 73,500 | 2/09/16 | 5,365 | — | ||||
| Colony Capital Inc | LIBOR + 50 bps | DBFX | 102,767 | 2/09/16 | 11,007 | — | ||||
| Green Plains Inc | LIBOR + 50 bps | DBFX | 290,973 | 2/09/16 | 134,196 | — | ||||
| DP World Ltd | LIBOR + 100 bps | DBFX | 225,108 | 2/10/16 | — | (4,630 | ) | |||
| Origin Enterprises PLC | LIBOR + 50 bps | DBFX | 208,767 | EUR | 2/11/16 | 4,981 | — | |||
| Arrow Global Group PLC | LIBOR + 50 bps | DBFX | 132,311 | GBP | 2/12/16 | 29,688 | — | |||
| Entertainment One Ltd | LIBOR + 50 bps | DBFX | 92,816 | GBP | 2/12/16 | — | (356 | ) | ||
| RPC Group PLC | LIBOR + 50 bps | DBFX | 50,214 | GBP | 2/12/16 | 3,623 | — | |||
| Savills PLC | LIBOR | DBFX | 8,337 | GBP | 2/12/16 | 2 | — | |||
| UBM PLC | LIBOR + 50 bps | DBFX | 93,624 | GBP | 2/12/16 | 3,533 | — | |||
| The Gabriel Finance LP | LIBOR + 75 bps | DBFX | 647,142 | EUR | 2/26/16 | 2,629 | — | |||
| PT Jersey Ltd | LIBOR + 75 bps | DBFX | 911,986 | EUR | 2/26/16 | — | (15,480 | ) | ||
| SABMiller PLC | LIBOR + 90 bps | MSCS | 914,625 | GBP | 2/26/16 | — | (50,997 | ) | ||
| Smith & Nephew PLC | SONIA + 65 bps | MSCS | 602,961 | GBP | 2/26/16 | 1,541 | — | |||
| Novion Property Group | LIBOR + 75 bps | DBFX | 2,076,455 | AUD | 3/08/16 | — | (34,760 | ) | ||
| Fonciere Des Regions | LIBOR + 75 bps | DBFX | 1,218,519 | EUR | 3/15/16 | — | (32,849 | ) | ||
| Orpar SA | LIBOR + 75 bps | DBFX | 203,903 | EUR | 3/15/16 | 73 | — | |||
| NV Bekaert SA | LIBOR + 75 bps | DBFX | 204,580 | EUR | 3/17/16 | — | (1,977 | ) | ||
| Nyrstar NV | LIBOR + 75 bps | DBFX | 592,789 | EUR | 3/17/16 | 594 | — | |||
| Premier Oil Finance Jersey Ltd | LIBOR + 75 bps | DBFX | 184,511 | 3/17/16 | — | (2,851 | ) | |||
| J Sainsbury PLC | LIBOR + 75 bps | DBFX | 329,414 | GBP | 3/17/16 | — | (14,243 | ) | ||
| OSIM International Ltd | LIBOR + 100 bps | DBFX | 235,938 | SGD | 3/18/16 | 1,438 | — | |||
| Melia Hotels International SA | LIBOR + 75 bps | DBFX | 819,567 | EUR | 4/25/16 | 5,179 | — | |||
| TPK Holding Co. Ltd | LIBOR + 90 bps | DBFX | 490,000 | 5/10/16 | 4,183 | — | ||||
| DIRECTV | LIBOR + 53 bps | MSCS | 2,721,374 | 8/03/16 | 116,337 | — | ||||
70 Annual Report
franklintempleton.com
FRANKLIN ALTERNATIVE STRATEGIES FUNDS
CONSOLIDATED STATEMENT O F INVESTMENTS
| Franklin K2 Alternative Strategies Fund (continued) | ||||||||||
| Total Return Swap Contracts (continued) | ||||||||||
| Counter- | Expiration | Unrealized | Unrealized | |||||||
| Underlying Instrument | Financing Rate | party �� Notional Value* | Date | Appreciation | Depreciation | |||||
| Long (continued) | ||||||||||
| Royal Dutch Shell PLC | LIBOR + 101 bps | MSCS | 497,686 | GBP | 1/18/17 | $ | — | $ | (33,915 | ) |
| Rolls-Royce Holdings PLC | LIBOR + 101 bps | MSCS | 833,256 | GBP | 1/18/17 | — | (868 | ) | ||
| Thomas Cook Group PLC | LIBOR + 101 bps | MSCS | 182,048 | GBP | 1/18/17 | — | (6,078 | ) | ||
| Wizz Air Holdings PLC | LIBOR + 101 bps | MSCS | 251,741 | GBP | 1/18/17 | 26,992 | — | |||
| Rolls-Royce Holdings PLC, C | LIBOR + 101 bps | MSCS | — | 1/18/17 | 12,766 | — | ||||
| Ryanair Holdings PLC | EURIB + 46 bps | MSCS | 376,761 | EUR | 4/12/17 | 3,676 | — | |||
| Liberty Global PLC | EONIA + 30 bps | MSCS | 592,571 | EUR | 4/13/17 | — | (176 | ) | ||
| Marriott International Inc | LIBOR + 68 bps | MSCS | 2,076,974 | 5/25/17 | — | (63,622 | ) | |||
| NVR Inc | LIBOR + 68 bps | MSCS | 2,316,813 | 5/25/17 | — | (21,697 | ) | |||
| Oshkosh Corp | LIBOR + 68 bps | MSCS | 2,123,147 | 5/25/17 | — | (173,727 | ) | |||
| Triumph Group Inc | LIBOR + 68 bps | MSCS | 1,983,598 | 5/25/17 | — | (69,188 | ) | |||
| United Continental Holdings Inc | LIBOR + 68 bps | MSCS | 1,436,749 | 5/25/17 | 16,220 | — | ||||
| Wyndham Worldwide Corp | LIBOR + 68 bps | MSCS | 1,622,590 | 5/25/17 | — | (25,940 | ) | |||
| Short | ||||||||||
| iBoxx USD Liquid High Yield Index | LIBOR - 19 bps | JPHQ | 4,584,000 | 6/22/15 | — | (13,756 | ) | |||
| Amsurg Corp | FEDEF - 35 bps | DBFX | 162,229 | 6/30/15 | — | (2,160 | ) | |||
| Health Care REIT Inc | FEDEF - 35 bps | DBFX | 515,487 | 6/30/15 | 15,268 | — | ||||
| Southwestern Energy Co | FEDEF - 35 bps | DBFX | 885,433 | 6/30/15 | 62,811 | — | ||||
| T-Mobile U.S. Inc | FEDEF - 35 bps | DBFX | 142,794 | 6/30/15 | — | (18,607 | ) | |||
| Acciona SA | LIBOR - 75 bps | DBFX | 925,202 | EUR | 7/15/15 | 26,998 | — | |||
| Iberdrola SA | LIBOR - 40 bps | DBFX | 661,875 | EUR | 7/15/15 | — | (11,845 | ) | ||
| Inmarsat PLC | LIBOR - 40 bps | DBFX | 235,699 | 7/15/15 | 4,628 | — | ||||
| Melia Hotels International SA | LIBOR - 25 bps | DBFX | 585,773 | EUR | 7/15/15 | — | (6,804 | ) | ||
| Hengan International Group Co. Ltd | LIBOR - 47 bps | DBFX | 290,400 | HKD | 7/17/15 | 2,976 | — | |||
| alstria office REIT-AG | LIBOR - 40 bps | DBFX | 718,667 | EUR | 7/17/15 | 58,370 | — | |||
| Deutsche Post AG | LIBOR - 35 bps | DBFX | 1,015,669 | EUR | 7/17/15 | 27,578 | — | |||
| Drillisch AG | LIBOR - 40 bps | DBFX | 2,938,937 | EUR | 7/17/15 | 73,328 | — | |||
| Deutsche Wohnen AG | LIBOR - 40 bps | DBFX | 588,924 | EUR | 7/17/15 | 52,901 | — | |||
| Evonik Industries AG | LIBOR - 40 bps | DBFX | 430,995 | EUR | 7/17/15 | — | (13,320 | ) | ||
| KUKA AG | LIBOR - 50 bps | DBFX | 311,423 | EUR | 7/17/15 | — | (28,878 | ) | ||
| LEG Immobilien AG | LIBOR - 40 bps | DBFX | 177,350 | EUR | 7/17/15 | 11,637 | — | |||
| Alcatel-Lucent | LIBOR - 40 bps | DBFX | 1,750,393 | EUR | 7/20/15 | — | (165,677 | ) | ||
| Fonciere Des Regions | LIBOR - 40 bps | DBFX | 616,584 | EUR | 7/20/15 | 17,153 | — | |||
| Hansteen Holdings PLC | LIBOR - 40 bps | DBFX | 2,103,929 | EUR | 7/20/15 | — | (124,483 | ) | ||
| Interna Consolida Airline GRP SA | LIBOR - 40 bps | DBFX | 5,839,306 | EUR | 7/20/15 | 124,095 | — | |||
| Playtech Ltd | LIBOR - 40 bps | DBFX | 506,417 | EUR | 7/20/15 | 5,913 | — | |||
| Marine Harvest ASA | LIBOR - 75 bps | DBFX | 595,470 | EUR | 9/17/15 | 6,289 | — | |||
| AT&T Inc | LIBOR - 14 bps | MSCS | 2,025,777 | 10/19/15 | — | (25,623 | ) | |||
| iShares Russell 2000 ETF | LIBOR - 88 bps | MSCS | 3,485,273 | 10/19/15 | 65,152 | — | ||||
| iShares US Real Estate ETF | LIBOR - 65 bps | MSCS | 3,445,295 | 10/19/15 | 131,696 | — | ||||
| Kone OYJ | EONIA - 88 bps | MSCS | 525,792 | EUR | 10/28/15 | — | — | |||
| Numericable-SFR SAS | EONIA - 88 bps | MSCS | 228,295 | EUR | 10/28/15 | — | — | |||
| iShares Core FTSE 100 UCITS ETF | SONIA - 62 bps | MSCS | 167,501 | GBP | 10/29/15 | — | (3,566 | ) | ||
| Royal Dutch Shell PLC | SONIA - 35 bps | MSCS | 489,685 | GBP | 10/29/15 | — | (11,350 | ) | ||
| Maeda Corp | LIBOR - 40 bps | DBFX | 17,340,000 | JPY | 11/18/15 | — | (3,560 | ) | ||
| Temp Holdings Co. Ltd | LIBOR - 40 bps | DBFX | 67,430,497 | JPY | 11/18/15 | — | (31,377 | ) | ||
| ABC-Mart Inc | LIBOR - 40 bps | DBFX | 59,136,000 | JPY | 11/18/15 | — | (10,881 | ) | ||
| EDION Corp | LIBOR - 40 bps | DBFX | 26,531,628 | JPY | 11/18/15 | — | (29,029 | ) | ||
| LIXIL Group Corp | LIBOR - 40 bps | DBFX | 17,539,788 | JPY | 11/18/15 | — | (372 | ) | ||
| OSG Corp | LIBOR - 40 bps | DBFX | 164,002,300 | JPY | 11/18/15 | — | (53,677 | ) | ||
| Alps Electric Co. Ltd | LIBOR - 40 bps | DBFX | 240,819,903 | JPY | 11/18/15 | — | (65,905 | ) | ||
| Yamaguchi Financial Group Inc | LIBOR - 40 bps | DBFX | 2,372,524 | 11/18/15 | 18,553 | — | ||||
| Nagoya Railroad Co. Ltd | LIBOR - 40 bps | DBFX | 23,508,854 | JPY | 11/18/15 | — | (12,362 | ) | ||
| The Gunma Bank Ltd | LIBOR - 40 bps | DBFX | 77,823 | 11/18/15 | 534 | — | ||||
| The Oita Bank Ltd | LIBOR - 40 bps | DBFX | 746,239 | 11/18/15 | — | (28,900 | ) | |||
franklintempleton.com
Annual Report
71
FRANKLIN ALTERNATIVE STRATEGIES FUNDS
CONSOLIDATED STATEMENT O F INVESTMENTS
| Franklin K2 Alternative Strategies Fund (continued) | ||||||||||
| Total Return Swap Contracts (continued) | ||||||||||
| Counter- | Expiration | Unrealized | Unrealized | |||||||
| Underlying Instrument | Financing Rate | party Notional Value* | Date Appreciation | Depreciation | ||||||
| Short (continued) | ||||||||||
| The Yamagata Bank Ltd | LIBOR - 50 bps | DBFX | 384,575 | 11/18/15 | $ | 7,465 | $ | — | ||
| Independence Group NL | RBACR - 22 bps | MSCS | 100,347 | AUD | 12/03/15 | — | — | |||
| Carillion PLC | LIBOR - 40 bps | DBFX | 439,112 | GBP | 1/11/16 | — | (27,320 | ) | ||
| Great Portland Estates PLC | LIBOR - 40 bps | DBFX | 475,734 | GBP | 1/11/16 | 11,188 | — | |||
| J Sainsbury PLC | LIBOR - 40 bps | DBFX | 30,855 | GBP | 1/11/16 | — | (971 | ) | ||
| The UNITE Group PLC | LIBOR - 40 bps | DBFX | 312,120 | GBP | 1/11/16 | — | (8,166 | ) | ||
| Aperam Ord | LIBOR - 40 bps | DBFX | 2,099,795 | 1/22/16 | 94,911 | — | ||||
| Acciona SA | LIBOR - 75 bps | DBFX | 233,949 | EUR | 2/09/16 | — | (2,056 | ) | ||
| H7 Basket | FEDEF - 18 bps | MSCS | 575,497 | 2/10/16 | 18 | — | ||||
| Federation Centres | BBSW - 40 bps | DBFX | 27,380 | AUD | 3/08/16 | 301 | — | |||
| Novion Property Group | BBSW - 40 bps | DBFX | 1,389,062 | AUD | 3/08/16 | 46,541 | — | |||
| NV Bekaert SA | LIBOR - 40 bps | DBFX | 36,288 | EUR | 3/17/16 | 646 | — | |||
| Nyrstar NV | LIBOR - 40 bps | DBFX | 283,847 | EUR | 3/17/16 | — | (318 | ) | ||
| UniCredit SpA | LIBOR - 40 bps | DBFX | 231,927 | EUR | 3/17/16 | — | (1,414 | ) | ||
| Drillsearch Energy Limited | LIBOR | DBFX | 33,626 | 4/20/16 | — | (1,527 | ) | |||
| FF Group | LIBOR - 80 bps | DBFX | 92,816 | EUR | 6/17/16 | 4,483 | — | |||
| America Movil SAB de CV | MXNIB - 50 bps | MSCS | 2,838,078 | MXN | 11/17/16 | 228 | — | |||
| Ball Corp | SONIA - 35 bps | MSCS | 39,614 | GBP | 1/18/17 | — | (177 | ) | ||
| Equinix Inc | SONIA - 35 bps | MSCS | 325,713 | GBP | 1/18/17 | — | (2,628 | ) | ||
| Totals OTC Swap Contracts | $ | 1,932,660 | $ | (1,898,335 | ) | |||||
| Net unrealized appreciation (depreciation) | $ | 34,325 | ||||||||
| *In U.S. dollars unless otherwise indicated. | ||||||||||
| See Abbreviations on page 93. | ||||||||||
72 Annual Report
franklintempleton.com
FRANKLIN ALTERNATIVE STRATEGIES FUNDS
Consolidated Financial Statements
Consolidated Statement of Assets and Liabilities
May 31, 2015
| Franklin K2 Alternative Strategies Fund | |||
| Assets: | |||
| Investments in securities: | |||
| Cost - Unaffiliated issuers | $ | 600,798,417 | |
| Cost - Repurchase agreements | 36,858,877 | ||
| Total cost of investments | $ | 637,657,294 | |
| Value - Unaffiliated issuers | $ | 631,683,590 | |
| Value - Repurchase agreements | 36,858,877 | ||
| Total value of investments | 668,542,467 | ||
| Cash | 136,796,623 | ||
| Restricted Cash (Note 1f) | 7,477 | ||
| Foreign currency, at value (cost $968,891) | 994,714 | ||
| Receivables: | |||
| Investment securities sold | 24,118,533 | ||
| Capital shares sold | 4,977,343 | ||
| Dividends and interest | 3,990,039 | ||
| Due from brokers | 129,050,809 | ||
| Variation margin | 237,231 | ||
| OTC swap contracts (premiums paid $222,539) | 218,017 | ||
| Unrealized appreciation on OTC forward exchange contracts | 3,034,295 | ||
| Unrealized appreciation on OTC swap contracts | 1,958,600 | ||
| Unrealized appreciation on unfunded loan commitments (Note 8) | 2,148 | ||
| Other assets | 263 | ||
| Total assets | 973,928,559 | ||
| Liabilities: | |||
| Payables: | |||
| Investment securities purchased | 34,771,422 | ||
| Capital shares redeemed | 653,484 | ||
| Management fees | 1,012,375 | ||
| Distribution fees | 73,671 | ||
| Transfer agent fees | 68,342 | ||
| OTC swap contracts (premiums received $208,377) | 180,026 | ||
| Options written, at value (premiums received $432,836) | 534,940 | ||
| Securities sold short, at value (proceeds $154,447,639) | 157,632,275 | ||
| Due to brokers | 8,196,510 | ||
| Unrealized depreciation on OTC forward exchange contracts | 3,566,096 | ||
| Unrealized depreciation on OTC swap contracts | 1,923,600 | ||
| Accrued expenses and other liabilities | 321,117 | ||
| Total liabilities | 208,933,858 | ||
| Net assets, at value | $ | 764,994,701 | |
| Net assets consist of: | |||
| Paid-in capital | $ | 728,167,871 | |
| Undistributed net investment income | 15,818,264 | ||
| Net unrealized appreciation (depreciation) | 27,629,304 | ||
| Accumulated net realized gain (loss) | (6,620,738 | ) | |
| Net assets, at value | $ | 764,994,701 | |
franklintempleton.com The accompanying notes are an integral part of these consolidated financial statements. | Annual Report 73
FRANKLIN ALTERNATIVE STRATEGIES FUNDS
CONSOLIDATED FINANCIAL STATEMENTS
Consolidated Statement of Assets and Liabilities (continued)
May 31, 2015
| Franklin K2 Alternative Strategies Fund | ||
| Class A: | ||
| Net assets, at value | $ | 148,991,310 |
| Shares outstanding | 13,351,231 | |
| Net asset value per sharea | $ | 11.16 |
| Maximum offering price per share (net asset value per share ÷ 94.25%) | $ | 11.84 |
| Class C: | ||
| Net assets, at value | $ | 37,937,383 |
| Shares outstanding | 3,421,276 | |
| Net asset value and maximum offering price per sharea | $ | 11.09 |
| Class R: | ||
| Net assets, at value | $ | 9,173,236 |
| Shares outstanding | 822,914 | |
| Net asset value and maximum offering price per share | $ | 11.15 |
| Class R6: | ||
| Net assets, at value | $ | 239,753,733 |
| Shares outstanding | 21,436,449 | |
| Net asset value and maximum offering price per share | $ | 11.18 |
| Advisor Class: | ||
| Net assets, at value | $ | 329,139,039 |
| Shares outstanding | 29,440,232 | |
| Net asset value and maximum offering price per share | $ | 11.18 |
| aRedemption price is equal to net asset value less contingent deferred sales charges, if applicable. | ||
74 Annual Report | The accompanying notes are an integral part of these consolidated financial statements. franklintempleton.com
FRANKLIN ALTERNATIVE STRATEGIES FUNDS
CONSOLIDATED FINANCIAL STATEMENTS
Consolidated Statement of Operations
for the year ended May 31, 2015
| Franklin K2 Alternative Strategies Fund | |||
| Investment income: | |||
| Dividends | $ | 3,408,611 | |
| Interest | 7,493,374 | ||
| Total investment income | 10,901,985 | ||
| Expenses: | |||
| Management fees (Note 3a) | 10,931,270 | ||
| Distribution fees: (Note 3c) | |||
| Class A | 363,923 | ||
| Class C | 265,772 | ||
| Class R | 59,772 | ||
| Transfer agent fees: (Note 3e) | |||
| Class A | 96,062 | ||
| Class C | 24,135 | ||
| Class R | 10,561 | ||
| Class R6 | 236 | ||
| Advisor Class | 144,476 | ||
| Custodian fees (Note 4) | 176,548 | ||
| Reports to shareholders | 71,652 | ||
| Registration and filing fees | 203,783 | ||
| Professional fees | 490,092 | ||
| Trustees’ fees and expenses | 397,352 | ||
| Amortization of offering costs | 88,573 | ||
| Dividends and interest on securities sold short | 2,194,822 | ||
| Security borrowing fees | 1,260,022 | ||
| Other | 98,690 | ||
| Total expenses | 16,877,741 | ||
| Expense reductions (Note 4) | (23,767 | ) | |
| Expenses waived/paid by affiliates (Note 3f) | (2,141,272 | ) | |
| Net expenses | 14,712,702 | ||
| Net investment income (loss) | (3,810,717 | ) | |
| Realized and unrealized gains (losses): | |||
| Net realized gain (loss) from: | |||
| Investments | 14,311,792 | ||
| Written options | 1,364,847 | ||
| Foreign currency transactions | 7,008,062 | ||
| Futures contracts | 9,701,723 | ||
| Securities sold short | (14,971,495 | ) | |
| Swap contracts | 1,412,092 | ||
| Net realized gain (loss) | 18,827,021 | ||
| Net change in unrealized appreciation (depreciation) on: | |||
| Investments | 17,733,617 | ||
| Translation of other assets and liabilities denominated in foreign currencies | (357,776 | ) | |
| Written options | (202,990 | ) | |
| Futures contracts | (582,004 | ) | |
| Swap contracts | (427,257 | ) | |
| Net change in unrealized appreciation (depreciation) | 16,163,590 | ||
| Net realized and unrealized gain (loss) | 34,990,611 | ||
| Net increase (decrease) in net assets resulting from operations | $ | 31,179,894 | |
franklintempleton.com The accompanying notes are an integral part of these consolidated financial statements. | Annual Report 75
| FRANKLIN ALTERNATIVE STRATEGIES FUNDS | ||||||
| CONSOLIDATED FINANCIAL STATEMENTS | ||||||
| Consolidated Statements of Changes in Net Assets | ||||||
| Franklin K2 Alternative Strategies Fund | ||||||
| Year Ended May 31, | ||||||
| 2015 | 2014 | a | ||||
| Increase (decrease) in net assets: | ||||||
| Operations: | ||||||
| Net investment income (loss) | $ | (3,810,717 | ) | $ | (459,321 | ) |
| Net realized gain (loss) | 18,827,021 | (1,124,386 | ) | |||
| Net change in unrealized appreciation (depreciation) | 16,163,590 | 11,465,714 | ||||
| Net increase (decrease) in net assets resulting from operations | 31,179,894 | 9,882,007 | ||||
| Distributions to shareholders from net investment income: | ||||||
| Class A | (612,244 | ) | (138,800 | ) | ||
| Class C | (65,590 | ) | (45,687 | ) | ||
| Class R | (45,777 | ) | (44,557 | ) | ||
| Class R6 | (1,926,596 | ) | (44,777 | ) | ||
| Advisor Class | (1,393,965 | ) | (141,968 | ) | ||
| Total distributions to shareholders | (4,044,172 | ) | (415,789 | ) | ||
| Capital share transactions: (Note 2) | ||||||
| Class A | 46,690,910 | 94,320,579 | ||||
| Class C | 20,037,814 | 15,942,860 | ||||
| Class R | (3,054,919 | ) | 11,001,000 | |||
| Class R6 | 13,262,210 | 212,200,195 | ||||
| Advisor Class | 265,636,309 | 52,355,803 | ||||
| Total capital share transactions | 342,572,324 | 385,820,437 | ||||
| Net increase (decrease) in net assets | 369,708,046 | 395,286,655 | ||||
| Net assets: | ||||||
| Beginning of year | 395,286,655 | — | ||||
| End of year | $ | 764,994,701 | $ | 395,286,655 | ||
| Undistributed net investment income included in net assets: | ||||||
| End of year | $ | 15,818,264 | $ | 2,861,747 | ||
| aFor the period October 11, 2013 (commencement of operations) to May 31, 2014. | ||||||
76 Annual Report | The accompanying notes are an integral part of these consolidated financial statements. franklintempleton.com
FRANKLIN ALTERNATIVE STRATEGIES FUNDS
Notes to Consolidated Financial Statements
Franklin K2 Alternative Strategies Fund
1. Organization and Significant Accounting Policies
Franklin Alternative Strategies Funds (Trust) is registered under the Investment Company Act of 1940 (1940 Act) as an open-end management investment company, consisting of two separate funds and applies the specialized accounting and reporting guidance in U.S. Generally Accepted Accounting Principles (U.S. GAAP). Franklin K2 Alternative Strategies Fund (Fund) is included in this report. The financial statements of the remaining fund in the Trust is presented separately. The Fund offers five classes of shares: Class A, Class C, Class R, Class R6 and Advisor Class. Each class of shares differs by its initial sales load, contingent deferred sales charges, voting rights on matters affecting a single class, its exchange privilege and fees primarily due to differing arrangements for distribution and transfer agent fees.
The following summarizes the Fund’s significant accounting policies.
a. Financial Instrument Valuation
The Fund’s investments in financial instruments are carried at fair value daily. Fair value is the price that would be received to sell an asset or paid to transfer a liability in an orderly transaction between market participants on the measurement date. The Fund calculates the net asset value (NAV) per share at the close of the New York Stock Exchange (NYSE), generally at 4 p.m. Eastern time (NYSE close) on each day the NYSE is open for trading. Under compliance policies and procedures approved by the Trust’s Board of Trustees (the Board), the Fund’s administrator has responsibility for oversight of valuation, including leading the cross-functional Valuation and Liquidity Oversight Committee (VLOC). The VLOC provides administration and oversight of the Fund’s valuation policies and procedures, which are approved annually by the Board. Among other things, these procedures allow the Fund to utilize independent pricing services, quotations from securities and financial instrument dealers, and other market sources to determine fair value.
Equity securities, exchange traded funds and derivative financial instruments (derivatives) listed on an exchange or on the NASDAQ National Market System are valued at the last quoted sale price or the official closing price of the day, respectively. Foreign equity securities are valued as of the close of trading on the foreign stock exchange on which the security is primarily traded or as of the NYSE close, whichever is earlier. The value is then converted into its U.S. dollar equivalent at the foreign exchange rate in effect at the NYSE close on the day that the value of the security is determined. Over-the-counter (OTC) securities are valued within the range of the most recent quoted bid and ask prices. Securities that trade in multiple markets or on multiple exchanges are valued according to the broadest and most representative market. Certain equity securities are valued based upon fundamental characteristics or relationships to similar securities. Investments in open-end mutual funds are valued at the closing NAV.
Debt securities generally trade in the OTC market rather than on a securities exchange. The Fund’s pricing services use multiple valuation techniques to determine fair value. In instances where sufficient market activity exists, the pricing services may utilize a market-based approach through which quotes from market makers are used to determine fair value. In instances where sufficient market activity may not exist or is limited, the pricing services also utilize proprietary valuation models which may consider market characteristics such as benchmark yield curves, credit spreads, estimated default rates, anticipated market interest rate volatility, coupon rates, anticipated timing of principal repayments, underlying collateral, and other unique security features in order to estimate the relevant cash flows, which are then discounted to calculate the fair value. Securities denominated in a foreign currency are converted into their U.S. dollar equivalent at the foreign exchange rate in effect at the NYSE close on the date that the values of the foreign debt securities are determined. Repurchase agreements are valued at cost, which approximates fair value.
Certain derivatives trade in the OTC market. The Fund’s pricing services use various techniques including industry standard option pricing models and proprietary discounted cash flow models to determine the fair value of those instruments. The Fund’s net benefit or obligation under the derivative contract, as measured by the fair value of the contract, is included in net assets.
The Fund has procedures to determine the fair value of financial instruments for which market prices are not reliable or readily available. Under these procedures, the VLOC convenes on a regular basis to review such financial instruments and considers a number of factors, including significant unobservable valuation inputs, when arriving at fair value. The VLOC primarily employs a market-based approach which may use related or comparable assets or liabilities, recent transactions, market multiples, book values, and other relevant information for the
franklintempleton.com
Annual Report
77
FRANKLIN ALTERNATIVE STRATEGIES FUNDS
NOTES TO CONSOLIDATED FINANCIAL STATEMENTS
Franklin K2 Alternative Strategies Fund (continued)
1. Organization and Significant Accounting
Policies (continued)
a. Financial Instrument Valuation (continued)
investment to determine the fair value of the investment. An income-based valuation approach may also be used in which the anticipated future cash flows of the investment are discounted to calculate fair value. Discounts may also be applied due to the nature or duration of any restrictions on the disposition of the investments. Due to the inherent uncertainty of valuations of such investments, the fair values may differ significantly from the values that would have been used had an active market existed. The VLOC employs various methods for calibrating these valuation approaches including a regular review of key inputs and assumptions, transactional back-testing or disposition analysis, and reviews of any related market activity.
Trading in securities on foreign securities stock exchanges and OTC markets may be completed before the daily NYSE close. In addition, trading in certain foreign markets may not take place on every NYSE business day. Occasionally, events occur between the time at which trading in a foreign security is completed and the close of the NYSE that might call into question the reliability of the value of a portfolio security held by the Fund. As a result, differences may arise between the value of the Fund’s portfolio securities as determined at the foreign market close and the latest indications of value at the close of the NYSE. In order to minimize the potential for these differences, the VLOC monitors price movements following the close of trading in foreign stock markets through a series of country specific market proxies (such as baskets of American Depositary Receipts, futures contracts and exchange traded funds). These price movements are measured against established trigger thresholds for each specific market proxy to assist in determining if an event has occurred that may call into question the reliability of the values of the foreign securities held by the Fund. If such an event occurs, the securities may be valued using fair value procedures, which may include the use of independent pricing services
When the last day of the reporting period is a non-business day, certain foreign markets may be open on those days that the NYSE is closed, which could result in differences between the value of the Fund’s portfolio securities on the last business day and the last calendar day of the reporting period. Any significant security valuation changes due to an open foreign market are adjusted and reflected by the Fund for financial reporting purposes.
b. Foreign Currency Translation
Portfolio securities and other assets and liabilities denominated in foreign currencies are translated into U.S. dollars based on the exchange rate of such currencies against U.S. dollars on the date of valuation. The Fund may enter into foreign currency exchange contracts to facilitate transactions denominated in a foreign currency. Purchases and sales of securities, income and expense items denominated in foreign currencies are translated into U.S. dollars at the exchange rate in effect on the transaction date. Portfolio securities and assets and liabilities denominated in foreign currencies contain risks that those currencies will decline in value relative to the U.S. dollar. Occasionally, events may impact the availability or reliability of foreign exchange rates used to convert the U.S. dollar equivalent value. If such an event occurs, the foreign exchange rate will be valued at fair value using procedures established and approved by the Board.
The Fund does not separately report the effect of changes in foreign exchange rates from changes in market prices on securities held. Such changes are included in net realized and unrealized gain or loss from investments in the Consolidated Statement of Operations.
Realized foreign exchange gains or losses arise from sales of foreign currencies, currency gains or losses realized between the trade and settlement dates on securities transactions and the difference between the recorded amounts of dividends, interest, and foreign withholding taxes and the dollar equivalent of the amounts actually received or paid. Net unrealized foreign exchange gains and losses arise from changes in foreign exchange rates on foreign denominated assets and liabilities other than investments in securities held at the end of the reporting period.
c. Joint Repurchase Agreement
The Fund enters into a joint repurchase agreement whereby its uninvested cash balance is deposited into a joint cash account with other funds managed by the investment manager or an affiliate of the investment manager and is used to invest in one or more repurchase agreements. The value and face amount of the joint repurchase agreement are allocated to the funds based on their pro-rata interest. A repurchase agreement is accounted for as a loan by the Fund to the seller, collateralized by securities which are delivered to the Fund’s custodian. The fair value, including accrued interest, of the initial collateralization is required to be at least 102% of the dollar amount invested by
78 Annual Report
franklintempleton.com
FRANKLIN ALTERNATIVE STRATEGIES FUNDS
NOTES TO CONSOLIDATED FINANCIAL STATEMENTS
Franklin K2 Alternative Strategies Fund (continued)
the funds, with the value of the underlying securities marked to market daily to maintain coverage of at least 100%. Repurchase agreements are subject to the terms of Master Repurchase Agreements (MRAs) with approved counterparties (sellers). The MRAs contain various provisions, including but not limited to events of default and maintenance of collateral for repurchase agreements. In the event of default by either the seller or the Fund, certain MRAs may permit the non-defaulting party to net and close-out all transactions, if any, traded under such agreements. The Fund may sell securities it holds as collateral and apply the proceeds towards the repurchase price and any other amounts owed by the seller to the Fund in the event of default by the seller. This could involve costs or delays in addition to a loss on the securities if their value falls below the repurchase price owed by the seller. The joint repurchase agreement held by the Fund at year end, as indicated in the Consolidated Statement of Investments, had been entered into on May 29, 2015.
d. Securities Purchased on a Delayed Delivery Basis
The Fund purchases securities on a delayed delivery basis, with payment and delivery scheduled for a future date. These transactions are subject to market fluctuations and are subject to the risk that the value at delivery may be more or less than the trade date purchase price. Although the Fund will generally purchase these securities with the intention of holding the securities, it may sell the securities before the settlement date. Sufficient assets have been segregated for these securities.
e. Derivative Financial Instruments
The Fund invested in derivatives in order to manage risk or gain exposure to various other investments or markets. Derivatives are financial contracts based on an underlying or notional amount, require no initial investment or an initial net investment that is smaller than would normally be required to have a similar response to changes in market factors, and require or permit net settlement. Derivatives contain various risks including the potential inability of the counterparty to fulfill their obligations under the terms of the contract, the potential for an illiquid secondary market, and/or the potential for market movements which expose the Fund to gains or losses in excess of the amounts shown in the Consolidated Statement of Assets and Liabilities. Realized gain and loss and unrealized appreciation and depreciation on these contracts for the period are included in the Consolidated Statement of Operations.
Derivative counterparty credit risk is managed through a formal evaluation of the creditworthiness of all potential counter-parties. The Fund attempts to reduce its exposure to counter-party credit risk on OTC derivatives, whenever possible, by entering into International Swaps and Derivatives Association (ISDA) master agreements with certain counterparties. These agreements contain various provisions, including but not limited to collateral requirements, events of default, or early termination. Termination events applicable to the counterparty include certain deteriorations in the credit quality of the counterparty. Termination events applicable to the Fund include failure of the Fund to maintain certain net asset levels and/or limit the decline in net assets over various periods of time. In the event of default or early termination, the ISDA master agreement gives the non-defaulting party the right to net and close-out all transactions traded, whether or not arising under the ISDA agreement, to one net amount payable by one counterparty to the other. However, absent an event of default or early termination, OTC derivative assets and liabilities are presented gross and not offset in the Consolidated Statement of Assets and Liabilities. Early termination by the counterparty may result in an immediate payment by the Fund of any net liability owed to that counterparty under the ISDA agreement.
Collateral requirements differ by type of derivative. Collateral or initial margin requirements are set by the broker or exchange clearing house for exchange traded and centrally cleared derivatives. Initial margin deposited is held at the exchange and can be in the form of cash and/or securities. For OTC derivatives traded under an ISDA master agreement, posting of collateral is required by either the Fund or the applicable coun-terparty if the total net exposure of all OTC derivatives with the applicable counterparty exceeds the minimum transfer amount, which typically ranges from $100,000 to $250,000, and can vary depending on the counterparty and the type of the agreement. Generally, collateral is determined at the close of fund business each day and any additional collateral required due to changes in derivative values may be delivered by the Fund or the counterparty within a few business days. Collateral pledged and/or received by the Fund for OTC derivatives, if any, is held in segregated accounts with the Fund’s custodian/counterparty broker and can be in the form of cash and/or securities. Unrestricted cash may be invested according to the Fund’s investment objectives.
franklintempleton.com
Annual Report
79
FRANKLIN ALTERNATIVE STRATEGIES FUNDS
NOTES TO CONSOLIDATED FINANCIAL STATEMENTS
Franklin K2 Alternative Strategies Fund (continued)
1. Organization and Significant Accounting
Policies (continued)
e. Derivative Financial Instruments (continued)
The Fund entered into exchange traded futures contracts primarily to manage and/or gain exposure to commodity price, interest rate and equity price risk. A futures contract is an agreement between the Fund and a counterparty to buy or sell an asset for a specified price on a future date. Required initial margins are pledged by the Fund, and the daily change in fair value is accounted for as a variation margin payable or receivable in the Consolidated Statement of Assets and Liabilities.
The Fund entered into OTC forward exchange contracts primarily to manage and/or gain exposure to certain foreign currencies. A forward exchange contract is an agreement between the Fund and a counterparty to buy or sell a foreign currency at a specific exchange rate on a future date.
The Fund entered into credit default swap contracts primarily to manage and/or gain exposure to credit risk. A credit default swap is an agreement between the Fund and a counterparty whereby the buyer of the contract receives credit protection and the seller of the contract guarantees the credit worthiness of a referenced debt obligation. These agreements may be privately negotiated in the over-the-counter market (“OTC credit default swaps”) or may be executed in a multilateral trade facility platform, such as a registered exchange (“centrally cleared credit default swaps”). The underlying referenced debt obligation may be a single issuer of corporate or sovereign debt, a credit index, or a tranche of a credit index. In the event of a default of the underlying referenced debt obligation, the buyer is entitled to receive the notional amount of the credit default swap contract from the seller in exchange for the referenced debt obligation, a net settlement amount equal to the notional amount of the credit default swap less the recovery value of the referenced debt obligation, or other agreed upon amount. For centrally cleared credit default swaps, required initial margins are pledged by the Fund, and the daily change in fair value is accounted for as a variation margin payable or receivable in the Consolidated Statement of Assets and Liabilities. Over the term of the contract, the buyer pays the seller a periodic stream of payments, provided that no event of default has occurred. Such periodic payments are accrued daily as an unrealized appreciation or depreciation until the payments are made, at which time they are realized. Payments received or paid to initiate a credit default swap contract are reflected in the Consolidated Statement of Assets and Liabilities and represent compensating factors between stated terms of the credit default swap agreement and prevailing market conditions (credit spreads and other relevant factors). These upfront payments are amortized over the term of the contract as a realized gain or loss in the Consolidated Statement of Operations.
The Fund entered into interest rate swap contracts primarily to manage interest rate risk. An interest rate swap is an agreement between the Fund and a counterparty to exchange cash flows based on the difference between two interest rates, applied to a notional amount. These agreements may be privately negotiated in the over-the-counter market (“OTC interest rate swaps”) or may be executed on a registered exchange (“centrally cleared interest rate swaps”). For centrally cleared interest rate swaps, required initial margins are pledged by the Fund, and the daily change in fair value is accounted for as a variation margin payable or receivable in the Consolidated Statement of Assets and Liabilities. Over the term of the contract, contractually required payments to be paid and to be received are accrued daily and recorded as unrealized appreciation and depreciation until the payments are made, at which time they are realized.
The Fund entered into OTC total return swap contracts primarily to manage and/or gain exposure to equity and credit price risk of an underlying instrument such as a stock, bond, index or basket of securities or indices. A total return swap is an agreement between the Fund and a counterparty to exchange a return linked to an underlying instrument for a floating or fixed rate payment, both based upon a notional amount. Over the term of the contract, contractually required payments to be paid or received are accrued daily and recorded as unrealized appreciation or depreciation until the payments are made, at which time they are recognized as realized gain or loss.
The Fund purchased or wrote exchange traded and/or OTC option contracts primarily to manage and/or gain exposure to equity price, interest rate and foreign exchange rate risk. An option is a contract entitling the holder to purchase or sell a specific amount of shares or units of an asset or notional amount of a swap (swaption), at a specified price. When an option is purchased or written, an amount equal to the premium paid or received is recorded as an asset or liability, respectively. Upon exercise of an option, the acquisition cost or sales proceeds of the underlying investment is adjusted by any premium received or paid. Upon expiration of an option, any premium received or paid is recorded as a realized gain or loss. Upon
80 Annual Report
franklintempleton.com
FRANKLIN ALTERNATIVE STRATEGIES FUNDS
NOTES TO CONSOLIDATED FINANCIAL STATEMENTS
Franklin K2 Alternative Strategies Fund (continued)
closing an option other than through expiration or exercise, the difference between the premium received or paid and the cost to close the position is recorded as a realized gain or loss.
See Notes 6 and 9 regarding investment transactions and other derivative information, respectively.
f. Restricted Cash
At May 31, 2015, the Fund received restricted cash in connection with investments in certain derivative securities. Restricted cash is held in a segregated account with the Fund’s custodian and is reflected in the Consolidated Statement of Assets and Liabilities.
g. Securities Sold Short
The Fund is engaged in selling securities short, which obligates the Fund to replace a borrowed security with the same security at current fair value. The Fund incurs a loss if the price of the security increases between the date of the short sale and the date on which the Fund replaces the borrowed security. The Fund realizes a gain if the price of the security declines between those dates. Gains are limited to the price at which the Fund sold the security short, while losses are potentially unlimited in size.
The Fund is required to establish a margin account with the broker lending the security sold short. While the short sale is outstanding, the broker retains the proceeds of the short sale to the extent necessary to meet margin requirements until the short position is closed out. A deposit must also be maintained with the Fund’s custodian/counterparty broker consisting of cash and/or securities having a value equal to a specified percentage of the value of the securities sold short. The Fund is obligated to pay fees for borrowing the securities sold short and is required to pay the counterparty any dividends and/or interest due on securities sold short. Such dividends and/or interest and any security borrowing fees are recorded as an expense to the Fund.
h. Investments in K2 Holdings Investment Corp. (K2 Subsidiary)
The Fund invests in certain financial instruments and commodity-linked derivative investments through its investment in the K2 Subsidiary. The K2 Subsidiary is a Cayman Islands exempted company with limited liability, is a wholly-owned subsidiary of the Fund, and is able to invest in certain financial instruments and commodity-linked derivative investments consistent with the investment objective of the Fund. At May 31, 2015, the K2 Subsidiary’s investments, as well as any other assets and liabilities of the K2 Subsidiary, are reflected in the Fund’s Consolidated Statement of Investments and Consolidated Statement of Assets and Liabilities. The financial statements have been consolidated and include the accounts of the Fund and the K2 Subsidiary. All intercompany transactions and balances have been eliminated. At May 31, 2015, the net assets of the K2 Subsidiary were $57,617,820, representing 7.53% of the Fund’s consolidated net assets. The Fund’s investment in the K2 Subsidiary is limited to 25% of consolidated assets.
i. Senior Floating Rate Interests
The Fund invests in senior secured corporate loans that pay interest at rates which are periodically reset by reference to a base lending rate plus a spread. These base lending rates are generally the prime rate offered by a designated U.S. bank or the London InterBank Offered Rate (LIBOR). Senior secured corporate loans often require prepayment of principal from excess cash flows or at the discretion of the borrower. As a result, actual maturity may be substantially less than the stated maturity. Senior secured corporate loans in which the Fund invests are generally readily marketable, but may be subject to certain restrictions on resale.
j. Income and Deferred Taxes
It is the Fund’s policy to qualify as a regulated investment company under the Internal Revenue Code. The Fund intends to distribute to shareholders substantially all of its taxable income and net realized gains to relieve it from federal income and excise taxes. As a result, no provision for U.S. federal income taxes is required.
The Fund may be subject to foreign taxation related to income received, capital gains on the sale of securities and certain foreign currency transactions in the foreign jurisdictions in which it invests. Foreign taxes, if any, are recorded based on the tax regulations and rates that exist in the foreign markets in which the Fund invests. When a capital gain tax is determined to apply the Fund records an estimated deferred tax liability in an amount that would be payable if the securities were disposed of on the valuation date.
The Fund recognizes the tax benefits of uncertain tax positions only when the position is “more likely than not” to be sustained
franklintempleton.com
Annual Report
81
FRANKLIN ALTERNATIVE STRATEGIES FUNDS
NOTES TO CONSOLIDATED FINANCIAL STATEMENTS
Franklin K2 Alternative Strategies Fund (continued)
1. Organization and Significant Accounting
Policies (continued)
j. Income and Deferred Taxes (continued)
upon examination by the tax authorities based on the technical merits of the tax position. As of May 31, 2015, and for all open tax years, the Fund has determined that no liability for unrecognized tax benefits is required in the Fund’s consolidated financial statements related to uncertain tax positions taken on a tax return (or expected to be taken on future tax returns). Open tax years are those that remain subject to examination and are based on each tax jurisdiction’s statute of limitation.
k. Security Transactions, Investment Income, Expenses and Distributions
Security transactions are accounted for on trade date. Realized gains and losses on security transactions are determined on a specific identification basis. Interest income and estimated expenses are accrued daily. Amortization of premium and accretion of discount on debt securities are included in interest income. Paydown gains and losses are recorded as an adjustment to interest income. Dividend income and dividends declared on securities sold short are recorded on the ex-dividend date except for certain dividends from foreign securities where the dividend rate is not available. In such cases, the dividend is recorded as soon as the information is received by the Fund. Distributions to shareholders are recorded on the ex-dividend date and are determined according to income tax regulations (tax basis). Distributable earnings determined on a tax basis may differ from earnings recorded in accordance with U.S. GAAP. These differences may be permanent or temporary. Permanent differences are reclassified among capital accounts to reflect their tax character. These reclassifications have no impact on net assets or the results of operations. Temporary differences are not reclassified, as they may reverse in subsequent periods.
Common expenses incurred by the Trust are allocated among the funds based on the ratio of net assets of each fund to the combined net assets of the Trust. Fund specific expenses are charged directly to the fund that incurred the expense.
Realized and unrealized gains and losses and net investment income, not including class specific expenses, are allocated daily to each class of shares based upon the relative proportion of net assets of each class. Differences in per share distributions, by class, are generally due to differences in class specific expenses.
l. Offering Costs
Offering costs are amortized on a straight line basis over twelve months.
m. Accounting Estimates
The preparation of financial statements in accordance with U.S. GAAP requires management to make estimates and assumptions that affect the reported amounts of assets and liabilities at the date of the financial statements and the amounts of income and expenses during the reporting period. Actual results could differ from those estimates.
n. Guarantees and Indemnifications
Under the Trust’s organizational documents, its officers and trustees are indemnified by the Trust against certain liabilities arising out of the performance of their duties to the Trust. Additionally, in the normal course of business, the Trust, on behalf of the Fund, enters into contracts with service providers that contain general indemnification clauses. The Trust’s maximum exposure under these arrangements is unknown as this would involve future claims that may be made against the Trust that have not yet occurred. Currently, the Trust expects the risk of loss to be remote.
82 Annual Report
franklintempleton.com
FRANKLIN ALTERNATIVE STRATEGIES FUNDS
NOTES TO CONSOLIDATED FINANCIAL STATEMENTS
Franklin K2 Alternative Strategies Fund (continued)
2. Shares of Beneficial Interest
At May 31, 2015, there were an unlimited number of shares authorized (without par value). Transactions in the Fund’s shares were as follows:
| Year Ended May 31, | |||||||||||||
| 2015 | 2014 | a | |||||||||||
| Shares | Amount | Shares | Amount | ||||||||||
| Class A Shares: | |||||||||||||
| Shares sold | 11,313,392 | $ | 123,061,270 | 9,202,567 | $ | 95,380,808 | |||||||
| Shares issued in reinvestment of distributions | 49,813 | 539,977 | 304 | 3,150 | |||||||||
| Shares redeemed | (7,114,359 | ) | (76,910,337 | ) | (100,486 | ) | (1,063,379 | ) | |||||
| Net increase (decrease) | 4,248,846 | $ | 46,690,910 | 9,102,385 | $ | 94,320,579 | |||||||
| Class C Shares: | |||||||||||||
| Shares sold | 3,173,984 | $ | 34,546,633 | 1,574,229 | $ | 16,010,580 | |||||||
| Shares issued in reinvestment of distributions | 3,444 | 37,196 | 109 | 1,130 | |||||||||
| Shares redeemed | (1,323,981 | ) | (14,546,015 | ) | (6,509 | ) | (68,850 | ) | |||||
| Net increase (decrease) | 1,853,447 | $ | 20,037,814 | 1,567,829 | $ | 15,942,860 | |||||||
| Class R Shares: | |||||||||||||
| Shares sold | 28,828 | $ | 310,648 | 1,097,561 | $ | 11,001,000 | |||||||
| Shares issued in reinvestment of distributions | 92 | 1,001 | — | — | |||||||||
| Shares redeemed | (303,567 | ) | (3,366,568 | ) | — | — | |||||||
| Net increase (decrease) | (274,647 | ) | $ | (3,054,919 | ) | 1,097,561 | $ | 11,001,000 | |||||
| Class R6 Shares: | |||||||||||||
| Shares sold | 3,740,127 | $ | 41,206,775 | 20,233,382 | $ | 212,310,195 | |||||||
| Shares issued in reinvestment of distributions | 167,937 | 1,822,117 | — | — | |||||||||
| Shares redeemed | (2,694,521 | ) | (29,766,682 | ) | (10,476 | ) | (110,000 | ) | |||||
| Net increase (decrease) | 1,213,543 | $ | 13,262,210 | 20,222,906 | $ | 212,200,195 | |||||||
| Advisor Class Shares: | |||||||||||||
| Shares sold | 30,206,978 | $ | 329,751,933 | 5,176,524 | $ | 52,893,512 | |||||||
| Shares issued in reinvestment of distributions | 106,628 | 1,156,912 | 610 | 6,315 | |||||||||
| Shares redeemed | (5,999,090 | ) | (65,272,536 | ) | (51,418 | ) | (544,024 | ) | |||||
| Net increase (decrease) | 24,314,516 | $ | 265,636,309 | 5,125,716 | $ | 52,355,803 | |||||||
| aFor the period October 11, 2013 (commencement of operations) to May 31, 2014. | |||||||||||||
3. Transactions with Affiliates
Franklin Resources, Inc. is the holding company for various subsidiaries that together are referred to as Franklin Templeton Investments. Certain officers and trustees of the Trust are also officers and/or directors of the following subsidiaries:
| Subsidiary | Affiliation | |
| K2/D&S Management Co., L.L.C. (K2 Advisors) | Investment manager | |
| Franklin Templeton Services, LLC (FT Services) | Administrative manager | |
| Franklin Templeton Distributors, Inc. (Distributors) | Principal underwriter | |
| Franklin Templeton Investor Services, LLC (Investor Services) | Transfer agent |
franklintempleton.com
Annual Report
83
FRANKLIN ALTERNATIVE STRATEGIES FUNDS
NOTES TO CONSOLIDATED FINANCIAL STATEMENTS
Franklin K2 Alternative Strategies Fund (continued)
3. Transactions with Affiliates (continued)
a. Management Fees
The Fund and K2 Subsidiary pay an investment management fee to K2 Advisors of 2.05% per year of the average daily net assets of the Fund and K2 Subsidiary. Management fees paid by the Fund are reduced on assets invested in the K2 Subsidiary, in an amount not to exceed the management fees paid by K2 Subsidiary.
Under each subadvisory agreement, the below entities provide subadvisory services to the Fund or K2 Subsidiary. The subadvisory fees are paid by K2 Advisors based on the Fund and K2 Subsidiary average daily net assets, and is not an additional expense of the Fund or K2 Subsidiary.
Subadvisors
Basso Capital Management, L.P.
Chatham Asset Management, LLC
Chilton Investment Company, LLC
EMSO Partners Limited
Graham Capital Management, L.P.
Impala Asset Management, LLC
Jennison Associates, LLC
Lazard Asset Management, LLC
Loomis Sayles & Company, L.P.
P. Schoenfeld Asset Management L.P.
Wellington Management Company, LLP
York Registered Holdings, L.P.
b. Administrative Fees
Under an agreement with K2 Advisors, FT Services provides administrative services to the Fund and K2 Subsidiary. The fee is paid by K2 Advisors based on the Fund and K2 Subsidiary average daily net assets, and is not an additional expense of the Fund or K2 Subsidiary.
c. Distribution Fees
The Board has adopted distribution plans for each share class, with the exception of Class R6 and Advisor Class shares, pursuant to Rule 12b-1 under the 1940 Act. Distribution fees are not charged on shares held by affiliates. Under the Fund’s Class A reimbursement distribution plan, the Fund reimburses Distributors for costs incurred in connection with the servicing, sale and distribution of the Fund’s shares up to the maximum annual plan rate. Under the Class A reimbursement distribution plan, costs exceeding the maximum for the current plan year cannot be reimbursed in subsequent periods. In addition, under the Fund’s Class C and R compensation distribution plans, the Fund pays Distributors for costs incurred in connection with the servicing, sale and distribution of the Fund’s shares up to the maximum annual plan rate for each class. The plan year, for purposes of monitoring compliance with the maximum annual plan rates, is February 1 through January 31 for each fund.
The maximum annual plan rates, based on the average daily net assets, for each class, are as follows:
| Class A | 0.30 | % |
| Class C | 1.00 | % |
| Class R | 0.50 | % |
84 Annual Report
franklintempleton.com
FRANKLIN ALTERNATIVE STRATEGIES FUNDS
NOTES TO CONSOLIDATED FINANCIAL STATEMENTS
Franklin K2 Alternative Strategies Fund (continued)
On May 18, 2015, the Board approved to set the current rate at 0.25% per year for Class A shares, effective August 1, 2015, until further notice and approval by the Board.
d. Sales Charges/Underwriting Agreements
Front-end sales charges and contingent deferred sales charges (CDSC) do not represent expenses of the Fund. These charges are deducted from the proceeds of sales of Fund shares prior to investment or from redemption proceeds prior to remittance, as applicable. Distributors has advised the Fund of the following commission transactions related to the sales and redemptions of the Fund’s shares for the year:
| Sales charges retained net of commissions paid to unaffiliated broker/dealers | $ | 154,464 |
| CDSC retained | $ | 8,166 |
e. Transfer Agent Fees
Each class of shares, except for Class R6, pays transfer agent fees to Investor Services for its performance of shareholder servicing obligations and reimburses Investor Services for out of pocket expenses incurred, including shareholding servicing fees paid to third parties. These fees are allocated daily based upon their relative proportion of such classes’ aggregate net assets. Class R6 pays Investor Services transfer agent fees specific to that class.
For the year ended May 31, 2015, the Fund paid transfer agent fees of $275,470, of which $76,958 was retained by Investor Services.
f. Waiver and Expense Reimbursements
K2 Advisors has contractually agreed in advance to waive or limit its fees and to assume as its own expense certain expenses otherwise payable by the Fund so that the expenses (excluding distribution fees, acquired fund fees and expenses on securities sold short) for each class of the Fund do not exceed 1.95%, and Class R6 does not exceed 1.88% based on the average net assets of each class (other than certain non-routine expenses or costs, including those relating to litigation, indemnification, reorganizations, and liquidations) until September 30, 2015. Prior to October 1, 2014, expenses were limited to 2.15%.
| g. Other Affiliated Transactions | |||
| At May 31, 2015, the shares of the Fund were owned by the following entities: | |||
| Percentage of | |||
| Outstanding | |||
| Shares | Shares | ||
| Franklin Moderate Allocation Fund | 7,660,177 | 11.19 | % |
| Franklin Conservative Allocation Fund | 4,833,646 | 7.06 | % |
| Franklin Growth Allocation Fund | 4,192,880 | 6.12 | % |
| Franklin Resources, Inc. | 794,865 | 1.16 | % |
| Franklin LifeSmart 2025 Retirement Target Fund | 692,387 | 1.01 | % |
| Franklin LifeSmart 2035 Retirement Target Fund | 563,739 | 0.82 | % |
| Franklin LifeSmart 2015 Retirement Target Fund | 442,778 | 0.65 | % |
| Franklin LifeSmart 2045 Retirement Target Fund | 363,986 | 0.53 | % |
| Franklin LifeSmart 2030 Retirement Target Fund | 129,396 | 0.19 | % |
| Franklin LifeSmart 2020 Retirement Target Fund | 120,392 | 0.18 | % |
| Franklin Multi-Asset Real Return Fund | 108,367 | 0.16 | % |
franklintempleton.com
Annual Report
85
FRANKLIN ALTERNATIVE STRATEGIES FUNDS
NOTES TO CONSOLIDATED FINANCIAL STATEMENTS
| Franklin K2 Alternative Strategies Fund (continued) | |||
| 3. Transactions with Affiliates (continued) | |||
| g. Other Affiliated Transactions (continued) | |||
| Percentage of | |||
| Outstanding | |||
| Shares | Shares | ||
| Franklin LifeSmart 2040 Retirement Target Fund | 98,987 | 0.14 | % |
| Franklin LifeSmart 2050 Retirement Target Fund | 74,497 | 0.11 | % |
| Franklin LifeSmart 2055 Retirement Target Fund | 5,352 | 0.01 | % |
| 20,081,449 | 29.33 | % | |
4. Expense Offset Arrangement
The Fund has entered into an arrangement with its custodian whereby credits realized as a result of uninvested cash balances are used to reduce a portion of the Fund’s custodian expenses. During the year ended May 31, 2015, the custodian fees were reduced as noted in the Consolidated Statement of Operations.
5. Income Taxes
For tax purposes, capital losses may be carried over to offset future capital gains, if any. At May 31, 2015, there were no capital loss carryforwards.
During the year ended May 31, 2015, the Fund utilized $1,029,640 of capital loss carryforwards.
The tax character of distributions paid during the years ended May 31, 2015 and 2014 was as follows:
| 2015 | 2014 | |||
| Distributions paid from ordinary income | $ | 4,044,172 | $ | 415,789 |
At May 31, 2015, the cost of investments, net unrealized appreciation (depreciation) and undistributed ordinary income for income tax purposes were as follows:
| Cost of investments | $ | 649,051,512 | |
| Unrealized appreciation | 32,448,432 | ||
| Unrealized depreciation | (12,957,477 | ) | |
| Net unrealized appreciation (depreciation) | $ | 19,490,955 | |
| Undistributed ordinary income | $ | 16,535,924 | |
| Undistributed long term capital gains | 4,565,362 | ||
| Distributable earnings | $ | 21,101,286 | |
Differences between income and/or capital gains as determined on a book basis and a tax basis are primarily due to differing treatments of foreign currency transactions, bond discounts and premiums, certain dividends on securities sold short, swaps, commodity-based derivatives, non-deductible expenses and futures.
6. Investment Transactions
Purchases and sales of investments and securities sold short (excluding short term securities) for the year ended May 31, 2015, aggregated $1,758,883,905 and $1,581,744,371, respectively.
86 Annual Report
franklintempleton.com
FRANKLIN ALTERNATIVE STRATEGIES FUNDS
NOTES TO CONSOLIDATED FINANCIAL STATEMENTS
| Franklin K2 Alternative Strategies Fund (continued) | |||||||||||
| Transactions in options written during the year ended May 31, 2015, were as follows: | |||||||||||
| Options | |||||||||||
| Swaptions | |||||||||||
| Number of | Notional | Notional | |||||||||
| Contracts | Amount | Premiums | Amount | Premiums | |||||||
| Options outstanding at May 31, 2014 | 1,802 | — | $ | 303,652 | — | $ | — | ||||
| Options written | 12,633 | 4,278,000,000 | KRW | 3,136,473 | 50,000,000 | MXN | 3,293 | ||||
| Options expired | (1,908 | ) | (1,840,000,000 | ) KRW | (759,687 | ) | — | — | |||
| Options exercised | (108 | ) | — | (10,946 | ) | — | — | ||||
| Options closed | (9,251 | ) | — | (2,239,949 | ) | — | — | ||||
| Options outstanding at May 31, 2015 | 3,168 | 2,438,000,000 | KRW | $ | 429,543 | 50,000,000 | MXN | $ | 3,293 | ||
See Notes 1(e) and 9 regarding derivative financial instruments and other derivative information, respectively.
See Abbreviations on page 93.
7. Credit Risk and Defaulted Securities
The Fund may purchase the pre-default or defaulted debt of distressed companies. Distressed companies are financially troubled and are about to be or are already involved in financial restructuring or bankruptcy. Risks associated with purchasing these securities include the possibility that the bankruptcy or other restructuring process takes longer than expected, or that distributions in restructuring are less than anticipated, either or both of which may result in unfavorable consequences to the Fund. If it becomes probable that the income on debt securities, including those of distressed companies, will not be collected, the Fund discontinues accruing income and recognizes an adjustment for uncollectible interest.
At May 31, 2015, the aggregate long value of distressed company securities for which interest recognition has been discontinued was $9,520,153, representing 1.24% of the Fund’s net assets. For information as to specific securities, see the accompanying Consolidated Statement of Investments.
8. Unfunded Loan Commitments
The Fund enters into certain credit agreements, all or a portion of which may be unfunded. The Fund is obligated to fund these loan commitments at the borrowers’ discretion. Funded portions of credit agreements are presented in the Consolidated Statement of Investments.
| At May 31, 2015, unfunded commitments were as follows: | ||
| Unfunded | ||
| Borrower | Commitment | |
| Calpine, Term Loan B-5, 2.75%, 5/27/22 | $ | 75,000 |
| Integra Telecom, Term Loan, 4.25%, 8/14/20 | 125,000 | |
| Milacron, Term Loan B, 3.50%, 9/28/20 | 25,000 | |
| PetSmart, Term Loan, 3.25%, 3/10/22 | 109,340 | |
| Presidio Holdings, Term Loan B, 4.25%, 2/02/22 | 190,000 | |
| Staples Inc., Term Loan B, 2.75%, 4/21/21 | 20,000 | |
| Virgin Media, Term Loan F, 2.75%, 6/30/23 | 138,031 | |
| $ | 682,371 | |
Unfunded loan commitments and funded portions of credit agreements are marked to market daily and any unrealized appreciation or depreciation is included in the Consolidated Statement of Assets and Liabilities and the Consolidated Statement of Operations.
franklintempleton.com
Annual Report
87
FRANKLIN ALTERNATIVE STRATEGIES FUNDS
NOTES TO CONSOLIDATED FINANCIAL STATEMENTS
Franklin K2 Alternative Strategies Fund (continued)
9. Other Derivative Information
At May 31, 2015, the Fund’s investments in derivative contracts are reflected in the Consolidated Statement of Assets and Liabilities as follows:
| Asset Derivatives | Liability Derivatives | |||||||
| Derivative Contracts | Consolidated Statement | Consolidated Statement | ||||||
| Not Accounted for as | of Assets and | of Assets and | ||||||
| Hedging Instruments | Liabilities Location | Fair Value | Liabilities Location | Fair Value | ||||
| Interest rate contracts | Investments in securities, at | $ | 79,492 | a | Options written, at value | $ | 2,350 | |
| value | ||||||||
| Variation margin | 395,691 | b | Variation margin | 248,341 | b | |||
| Unrealized appreciation on | 12,504 | |||||||
| OTC swap contracts | ||||||||
| Foreign exchange contracts | Investments in securities, at | 60,771 | a | Options written, at value | 35,572 | |||
| value | ||||||||
| Unrealized appreciation on | 3,034,295 | Unrealized depreciation on | 3,566,096 | |||||
| OTC forward exchange | OTC forward exchange | |||||||
| contracts | contracts | |||||||
| Credit contracts | Variation margin | 3,977 | b | Variation margin | 21,364 | b | ||
| OTC swap contracts (premium | 218,017 | OTC swap contracts | 180,026 | |||||
| paid) | (premium received) | |||||||
| Unrealized appreciation on | 13,436 | Unrealized depreciation on | 39,021 | |||||
| OTC swap contracts | OTC swap contracts | |||||||
| Equity contracts | Investments in securities, at | 2,080,562 | a | Options written, at value | 497,018 | |||
| value | ||||||||
| Variation margin | 1,052,780 | b | Variation margin | 617,391 | b | |||
| Unrealized appreciation on | 1,932,660 | Unrealized depreciation on | 1,884,579 | |||||
| OTC swap contracts | OTC swap contracts | |||||||
| Commodity contracts | Variation margin | 843,802 | b | Variation margin | 905,931 | b | ||
| Totals | $ | 9,727,987 | $ | 7,997,689 | ||||
aPurchased option contracts are included in investments in securities, at value in the Consolidated Statement of Assets and Liabilities.
bThis amount reflects the cumulative appreciation (depreciation) of futures contracts and centrally cleared swaps contracts as reported in the Consolidated Statement of
Investments. Only the variation margin receivable/payable at year end is separately reported within the Consolidated Statement of Assets and Liabilities. Prior variation margin
movements were recorded to cash upon receipt or payment.
For the year ended May 31, 2015, the effect of derivative contracts in the Fund’s Consolidated Statement of Operations was as
follows:
| Net Change in | ||||||||
| Unrealized | ||||||||
| Derivative Contracts | Net Realized | Appreciation | ||||||
| Not Accounted for as | Consolidated Statement of | Gain (Loss) | Consolidated Statement of | (Depreciation) | ||||
| Hedging Instruments | Operations Locations | for the Year | Operations Locations | for the Year | ||||
| Net realized gain (loss) from: | Net change in unrealized | |||||||
| appreciation (depreciation) on: | ||||||||
| Interest rate contracts | Investments | $ | (9,060 | )a | Investments | $ | (56,526 | )a |
| Written options | (8,089 | ) | Written options | 943 | ||||
| Futures contracts | 3,513,271 | Futures contracts | (503,553 | ) | ||||
| Swap contracts | 11,785 | Swap contracts | 10,397 |
88 Annual Report
franklintempleton.com
FRANKLIN ALTERNATIVE STRATEGIES FUNDS
NOTES TO CONSOLIDATED FINANCIAL STATEMENTS
| Franklin K2 Alternative Strategies Fund (continued) | ||||||||
| Net Change in | ||||||||
| Unrealized | ||||||||
| Derivative Contracts | Net Realized | Appreciation | ||||||
| Not Accounted for as | Consolidated Statement of | Gain (Loss) | Consolidated Statement of | (Depreciation) | ||||
| Hedging Instruments | Operations Locations | for the Year | Operations Locations | for the Year | ||||
| Foreign exchange contracts | Investments | $ | 183,301 | a | Investments | $ | (19,344 | )a |
| Written options | 6,080 | Written options | (1,832 | ) | ||||
| Foreign currency | 7,911,129 | b | Translation of other assets | (381,769 | )b | |||
| transactions | and liabilities denominated | |||||||
| in foreign currencies | ||||||||
| Credit contracts | Swap contracts | (602,866 | ) | Swap contracts | 107,585 | |||
| Equity contracts | Investments | (4,016,320 | )a | Investments | 111,398 | a | ||
| Written options | 1,366,856 | Written options | (202,101 | ) | ||||
| Futures contracts | 3,653,587 | Futures contracts | (46,943 | ) | ||||
| Swap contracts | 2,003,173 | Swap contracts | (545,239 | ) | ||||
| Commodity contracts | Futures contracts | 2,534,865 | Futures contracts | (31,508 | ) | |||
| Totals | $ | 16,547,712 | $ | (1,558,492 | ) | |||
aPurchased option contracts are included in net realized gain (loss) from investments and net change in unrealized appreciation (depreciation) on investments in the
Consolidated Statement of Operations.
bForward exchange contracts are included in net realized gain (loss) from foreign currency transactions and net change in unrealized appreciation (depreciation) on translation
of other assets and liabilities denominated in foreign currencies in the Consolidated Statement of Operations.
For the year ended May 31, 2015, the average month end fair value of derivatives represented 2.10% of average month end net
assets. The average month end number of open derivative contracts for the year was 682.
At May 31, 2015, the Fund’s OTC derivative assets and liabilities, are as follows:
| Gross and Net Amounts | ||||
| of Assets and Liabilities | ||||
| Presented in the | ||||
| Consolidated Statement of | ||||
| Assets and Liabilities | ||||
| Assetsa | Liabilitiesa | |||
| Derivatives | ||||
| Forward Exchange Contracts | $ | 3,034,295 | $ | 3,566,096 |
| Options Purchased | 113,313 | — | ||
| Options Written | — | 37,922 | ||
| Swap Contracts | 2,176,617 | 2,103,626 | ||
| Total | $ | 5,324,225 | $ | 5,707,644 |
aAbsent an event of default or early termination, OTC derivative assets and liabilities are presented gross and not offset in the Consolidated Statement of Assets and Liabilities.
franklintempleton.com
Annual Report
89
FRANKLIN ALTERNATIVE STRATEGIES FUNDS
NOTES TO CONSOLIDATED FINANCIAL STATEMENTS
Franklin K2 Alternative Strategies Fund (continued)
9. Other Derivative Information (continued)
At May 31, 2015, the Fund’s OTC derivative assets which may be offset against the Fund’s OTC derivative liabilities, and collateral received from the counterparty, is as follows:
| Amounts Not Offset in the Consolidated | |||||||||||
| Statement of Assets and Liabilities | |||||||||||
| Gross and Net | |||||||||||
| Amounts of Assets | Financial | ||||||||||
| Presented in the | Financial | Instruments | Cash | ||||||||
| Consolidated Statement of | Instruments | Collateral | Collateral | Net Amount (Not | |||||||
| Assets and Liabilities | Available for Offset | Receiveda | Received | less than zero) | |||||||
| Counterparty | |||||||||||
| BNYM | $ | 55,696 | $ | — | $ | — | $ | — | $ | 55,696 | |
| BOFA | 91,330 | (61,759 | ) | — | — | 29,571 | |||||
| BZWS | 18,821 | — | — | — | 18,821 | ||||||
| CITI | 24,131 | (24,131 | ) | — | — | — | |||||
| CSFB | 43,406 | — | — | — | 43,406 | ||||||
| DBFX | 1,617,491 | (1,520,474 | ) | — | — | 97,017 | |||||
| JPHQ | 177,198 | (19,608 | ) | — | — | 157,590 | |||||
| MLCO | 7,295 | — | — | — | 7,295 | ||||||
| MSCO | 261,434 | (261,434 | ) | — | — | — | |||||
| MSCOc | 2,584,831 | (2,583,835 | ) | — | — | 996 | |||||
| MSCS | 435,391 | (435,391 | ) | — | — | — | |||||
| UBSW | 7,201 | (7,201 | ) | — | — | — | |||||
| Total | $ | 5,324,225 | $ | (4,913,833 | ) | $ | — | $ | — | $ | 410,392 |
At May 31, 2015, the Fund’s OTC derivative liabilities which may be offset against the Fund’s OTC derivative assets and collateral pledged to the counterparty, is as follows:
| Amounts Not Offset in the Consolidated | |||||||||||||
| Statement of Assets and Liabilities | |||||||||||||
| Gross and Net | |||||||||||||
| Amounts of Liabilities | Financial | ||||||||||||
| Presented in the | Financial | Instruments | Cash | ||||||||||
| Consolidated Statement of | Instruments | Collateral | Collateral | Net Amount (Not | |||||||||
| Assets and Liabilities | Available for Offset | Pledgeda,b | Pledgeda | less than zero) | |||||||||
| Counterparty | |||||||||||||
| BNYM | $ | 506,075 | $ | — | $ | — | $ | — | $ | 506,075 | |||
| BOFA | 61,759 | (61,759 | ) | — | — | — | |||||||
| BZWS | — | — | — | — | — | ||||||||
| CITI | 50,972 | (24,131 | ) | — | — | 26,841 | |||||||
| CSFB | 8,466 | — | — | — | 8,466 | ||||||||
| DBFX | 1,520,474 | (1,520,474 | ) | — | — | — | |||||||
| JPHQ | 19,608 | (19,608 | ) | — | — | — | |||||||
| MLCO | 14,291 | — | — | — | 14,291 | ||||||||
| MSCO | 313,016 | (261,434 | ) | (51,582 | ) | — | — | ||||||
| MSCOc | 2,583,835 | (2,583,835 | ) | — | — | — | |||||||
| MSCS | 608,361 | (435,391 | ) | (172,970 | ) | — | — | ||||||
| UBSW | 20,787 | (7,201 | ) | — | — | 13,586 | |||||||
| Total | $ | 5,707,644 | $ | (4,913,833 | ) | $ | (224,552 | ) | $ | — | $ | 569,259 | |
aIn some instances, the collateral amounts disclosed in the table above were adjusted due to the requirement to limit collateral amounts to avoid the effect of over-
collateralization. Actual collateral received and/or pledged may be more than the amounts disclosed herein.
bSee the accompanying Consolidated Statement of Investments for securities pledged as collateral for derivatives.
cRepresents derivatives owned by the K2 Holdings Investment Corp., a wholly-owned subsidiary of the Fund. See Note 1(h).
90 Annual Report
franklintempleton.com
FRANKLIN ALTERNATIVE STRATEGIES FUNDS
NOTES TO CONSOLIDATED FINANCIAL STATEMENTS
Franklin K2 Alternative Strategies Fund (continued)
See Notes 1(e) and 6 regarding derivative financial instruments and investment transactions, respectively.
See Abbreviations on page 93.
10. Credit Facility
The Fund, together with other U.S. registered and foreign investment funds (collectively, Borrowers), managed by Franklin Temple-ton Investments, are borrowers in a joint syndicated senior unsecured credit facility totaling $2 billion (Global Credit Facility) which matures on February 12, 2016. This Global Credit Facility provides a source of funds to the Borrowers for temporary and emergency purposes, including the ability to meet future unanticipated or unusually large redemption requests. The Fund began participating in the Global Credit Facility on February 13, 2015.
Under the terms of the Global Credit Facility, the Fund shall, in addition to interest charged on any borrowings made by the Fund and other costs incurred by the Fund, pay its share of fees and expenses incurred in connection with the implementation and maintenance of the Global Credit Facility, based upon its relative share of the aggregate net assets of all of the Borrowers, including an annual commitment fee of 0.07% based upon the unused portion of the Global Credit Facility. These fees are reflected in other expenses in the Consolidated Statement of Operations. During the year ended May 31, 2015, the Fund did not use the Global Credit Facility.
11. Fair Value Measurements
The Fund follows a fair value hierarchy that distinguishes between market data obtained from independent sources (observable inputs) and the Fund’s own market assumptions (unobservable inputs). These inputs are used in determining the value of the Fund’s financial instruments and are summarized in the following fair value hierarchy:
- Level 1 – quoted prices in active markets for identical financial instruments
- Level 2 – other significant observable inputs (including quoted prices for similar financial instruments, interest rates, prepayment speed, credit risk, etc.)
- Level 3 – significant unobservable inputs (including the Fund’s own assumptions in determining the fair value of financial instruments)
The input levels are not necessarily an indication of the risk or liquidity associated with financial instruments at that level.
For movements between the levels within the fair value hierarchy, the Fund has adopted a policy of recognizing the transfers as of the date of the underlying event which caused the movement.
A summary of inputs used as of May 31, 2015, in valuing the Fund’s assets and liabilities carried at fair value, is as follows:
| Level 1 | Level 2 | Level 3 | Total | |||||
| Assets: | ||||||||
| Investments in Securities | ||||||||
| Common Stocks and Other Equity Interests | ||||||||
| Industrial Conglomerates | $ | — | $ | 2,153,856 | $ | — | $ | 2,153,856 |
| All Other Common Stocks and Other Equity Interestsa | 328,186,801 | — | —b | 328,186,801 | ||||
| Exchange Traded Funds | 289,758 | — | — | 289,758 | ||||
| Convertible Preferred Stocks | 4,257,248 | 7,105,964 | — | 11,363,212 | ||||
| Preferred Stocks | 405,092 | 205,030 | — | 610,122 | ||||
| Convertible Bonds | — | 76,189,649 | — | 76,189,649 | ||||
| Corporate Bonds and Notes | — | 105,475,283 | — | 105,475,283 | ||||
| Corporate Notes in Reorganization | — | 5,049,120 | — | 5,049,120 | ||||
| Senior Floating Rate Interests | — | 4,454,060 | — | 4,454,060 | ||||
franklintempleton.com
Annual Report
91
FRANKLIN ALTERNATIVE STRATEGIES FUNDS
NOTES TO CONSOLIDATED FINANCIAL STATEMENTS
| Franklin K2 Alternative Strategies Fund (continued) | ||||||||
| 11. Fair Value Measurements (continued) | ||||||||
| Level 1 | Level 2 | Level 3 | Total | |||||
| Assets: (continued) | ||||||||
| Foreign Government and Agency Securities | $ | — | $ | 16,707,506 | $ | — | $ | 16,707,506 |
| Foreign Government and Agency Securities in Reorganization | — | 4,471,033 | — | 4,471,033 | ||||
| Asset-Backed Securities and Commercial Mortgage-Backed | ||||||||
| Securities | — | 11,594,711 | — | 11,594,711 | ||||
| Options Purchased | 2,107,512 | 113,313 | — | 2,220,825 | ||||
| Short Term Investments | 62,917,654 | 36,858,877 | — | 99,776,531 | ||||
| Total Investments in Securities | $ | 398,164,065 | $ | 270,378,402 | $ | — | $ | 668,542,467 |
| Other Financial Instruments | ||||||||
| Futures Contracts | $ | 2,292,273 | $ | — | $ | — | $ | 2,292,273 |
| Forward Exchange Contracts | — | 3,034,295 | — | 3,034,295 | ||||
| Swaps Contracts | — | 1,949,811 | 12,766 | 1,962,577 | ||||
| Unfunded Loan Commitments | — | 2,148 | — | 2,148 | ||||
| Total Other Financial Instruments | $ | 2,292,273 | $ | 4,986,254 | $ | 12,766 | $ | 7,291,293 |
| Liabilities: | ||||||||
| Other Financial Instruments | ||||||||
| Options Written | $ | 497,018 | $ | 37,922 | $ | — | $ | 534,940 |
| Securities Sold Shorta | 151,755,263 | 5,800,867 | 76,145 | 157,632,275 | ||||
| Futures Contracts | 1,769,556 | — | — | 1,769,556 | ||||
| Forward Exchange Contracts | — | 3,566,096 | — | 3,566,096 | ||||
| Swaps Contracts | — | 1,947,071 | — | 1,947,071 | ||||
| Total Other Financial Instruments | $ | 154,021,837 | $ | 11,351,956 | $ | 76,145 | $ | 165,449,938 |
| aFor detailed categories, see the accompanying Consolidated Statement of Investments. | ||||||||
| bIncludes securities determined to have no value at May 31, 2015. | ||||||||
A reconciliation of assets in which Level 3 inputs are used in determining fair value is presented when there are significant Level 3 financial instruments at the end of the year.
12. New Accounting Pronouncements
In June 2014, the Financial Accounting Standards Board issued Accounting Standards Update (ASU) No. 2014-11, Transfers and Servicing (Topic 860), Repurchase-to-Maturity Transactions, Repurchase Financings, and Disclosures. The ASU changes the accounting for certain repurchase agreements and expands disclosure requirements related to repurchase agreements, securities lending, repurchase-to-maturity and similar transactions. The ASU is effective for interim and annual reporting periods beginning after December 15, 2014. Management has reviewed the requirements and believes the adoption of this ASU will not have a material impact on the financial statements.
13. Subsequent Events
The Fund has evaluated subsequent events through the issuance of the consolidated financial statements and determined that no events have occurred that require disclosure.
92 Annual Report
franklintempleton.com
FRANKLIN ALTERNATIVE STRATEGIES FUNDS
NOTES TO CONSOLIDATED FINANCIAL STATEMENTS
| Franklin K2 Alternative Strategies Fund (continued) | |||||
| Abbreviations | |||||
| Counterparty/Exchange | Currency | Selected Portfolio | |||
| BNYM | The Bank of New York Mellon | AUD | Australian Dollar | ABS | Asset Backed Security |
| BOFA | Bank of America Corp | BRL | Brazilian Real | ADR | American Depositary Receipt |
| BZWS | Barclays Bank PLC | CAD | Canadian Dollar | ARM | Adjustable Rate Mortgage |
| CITI | Citigroup, Inc. | COP | Colombian Peso | CMO | Collateralized Mortgage Obligation |
| CME | Chicago Mercantile Exchange | EUR | Euro | ETF | Exchange Traded Fund |
| CSFB | Credit Suisse First Boston | GBP | British Pound | FDIC | Federal Deposit Insurance Corporation |
| DBFX | Deutsche Bank AG | HKD | Hong Kong Dollar | FRN | Floating Rate Note |
| ICE | Intercontinental Exchange, Inc. | INR | Indian Rupee | FTSE | Financial Times Stock Exchange |
| JPHQ | JP Morgan Chase & Co. | JPY | Japanese Yen | PIK | Payment In-Kind |
| MLCO | Merrill Lynch & Co., Inc. | KRW | Korean Won | REIT | Real Estate Investment Trust |
| MSCO | Morgan Stanley & Co., Inc. | MXN | Mexican Peso | SPDR | Standard & Poor’s Depositary Receipt |
| MSCS | Morgan Stanley Capital Services | SGD | Singapore Dollar | ||
| UBSW | UBS AG | USD | United States Dollar | ||
| ZAR | South African Rand | ||||
franklintempleton.com
Annual Report
93
FRANKLIN ALTERNATIVE STRATEGIES FUNDS
Report of Independent Registered Public Accounting Firm
To the Board of Trustees of Franklin Alternative Strategies Funds and Shareholders of Franklin K2 Alternative Strategies Fund
We have audited the accompanying consolidated statement of assets and liabilities, including the consolidated statement of investments, of Franklin K2 Alternative Strategies Fund (the “Fund”) (one of the funds constituting Franklin Alternative Strategies Funds), as of May 31, 2015, and the related consolidated statement of operations for the year then ended, and the consolidated statement of changes in net assets and the consolidated financial highlights for each of the periods indicated therein. These consolidated financial statements and consolidated financial highlights are the responsibility of the Fund’s management. Our responsibility is to express an opinion on these consolidated financial statements and consolidated financial highlights based on our audits.
We conducted our audits in accordance with the standards of the Public Company Accounting Oversight Board (United States). Those standards require that we plan and perform the audit to obtain reasonable assurance about whether the financial statements and financial highlights are free of material misstatement. We were not engaged to perform an audit of the Fund’s internal control over financial reporting. Our audit included consideration of internal control over financial reporting as a basis for designing audit procedures that are appropriate in the circumstances, but not for the purpose of expressing an opinion on the effectiveness of the Fund’s internal control over financial reporting. Accordingly, we express no such opinion. An audit also includes examining, on a test basis, evidence supporting the amounts and disclosures in the financial statements and financial highlights, assessing the accounting principles used and significant estimates made by management, and evaluating the overall financial statement presentation. Our procedures included confirmation of securities owned as of May 31, 2015, by correspondence with the custodian and brokers or by other appropriate auditing procedures where replies from the brokers were not received. We believe that our audits provide a reasonable basis for our opinion.
In our opinion, the consolidated financial statements and consolidated financial highlights referred to above present fairly, in all material respects, the consolidated financial position of Franklin K2 Alternative Strategies Fund (one of the funds constituting Franklin Alternative Strategies Funds), at May 31, 2015, the consolidated results of its operations for the year then ended, and the consolidated changes in its net assets and the consolidated financial highlights for each of the periods indicated therein, in conformity with U.S. generally accepted accounting principles.

Boston, Massachusetts
July 23, 2015
| 94 | Annual Report |
FRANKLIN ALTERNATIVE STRATEGIES FUNDS
Tax Information (unaudited)
Under Section 854(b)(1)(A) of the Internal Revenue Code (Code), the Fund hereby reports 12.37% of the ordinary income dividends as income qualifying for the dividends received deduction for the fiscal year ended May 31, 2015.
Under Section 854(b)(1)(B) of the Code, the Fund hereby reports the maximum amount allowable but no less than $2,509,101 as qualified dividends for purposes of the maximum rate under Section 1(h)(11) of the Code for the fiscal year ended May 31, 2015. Distributions, including qualified dividend income, paid during calendar year 2015 will be reported to shareholders on Form 1099-DIV by mid-February 2016. Shareholders are advised to check with their tax advisors for information on the treatment of these amounts on their individual income tax returns.
Under Section 871(k)(1)(C) of the Code, the Fund hereby reports the maximum amount allowable but no less than $3,022,902 as interest related dividends for purposes of the tax imposed under Section 871(a)(1)(A) of the Code for the fiscal year ended May 31, 2015.
Annual Report
95
FRANKLIN ALTERNATIVE STRATEGIES FUNDS
Board Members and Officers
The name, year of birth and address of the officers and board members, as well as their affiliations, positions held with the Trust, principal occupations during at least the past five years and number of portfolios overseen in the Franklin Templeton Investments fund complex are shown below. Generally, each board member serves until that person’s successor is elected and qualified.
| Independent Board Members | ||||
| Number of Portfolios in | ||||
| Name, Year of Birth | Length of | Fund Complex Overseen | Other Directorships Held During | |
| and Address | Position | Time Served | by Board Member* | at Least the Past 5 Years |
| Edward I. Altman, Ph.D. (1941) | Trustee | Since 2011 | 17 | None |
| c/o Franklin Mutual Advisers, LLC | ||||
| 101 John F. Kennedy Parkway | ||||
| Short Hills, NJ 07078-2789 | ||||
| Principal Occupation During at Least the Past 5 Years: | ||||
| Max L. Heine Professor of Finance and Director of The Credit and Debt Markets Research Program, Salomon Center, Stern School of | ||||
| Business, New York University; editor and author of numerous financial publications; financial consultant; an adviser to numerous financial and | ||||
| publishing organizations; and formerly, Vice Director, Salomon Center, Stern School of Business, New York University. | ||||
| Ann Torre Bates (1958) | Trustee | Since 2011 | 43 | Navient Corporation (loan |
| c/o Franklin Mutual Advisers, LLC | management, servicing and asset | |||
| 101 John F. Kennedy Parkway | recovery) (2014-present), Ares Capital | |||
| Short Hills, NJ 07078-2789 | Corporation (specialty finance | |||
| company) (2010-present), United | ||||
| Natural Foods, Inc. (distributor of | ||||
| natural, organic and specialty foods) | ||||
| (2013-present), Allied Capital | ||||
| Corporation (financial services) | ||||
| (2003-2010) and SLM Corporation | ||||
| (Sallie Mae) (1997-2014). | ||||
| Principal Occupation During at Least the Past 5 Years: | ||||
| Director of various companies; and formerly, Executive Vice President and Chief Financial Officer, NHP Incorporated (manager of multifamily | ||||
| housing) (1995-1997); and Vice President and Treasurer, US Airways, Inc. (until 1995). | ||||
| Burton J. Greenwald (1929) | Vice | Vice Chairman | 17 | Franklin Templeton Emerging Markets |
| c/o Franklin Mutual Advisers, LLC | Chairman | since April 2015 | Debt Opportunities Fund PLC and | |
| 101 John F. Kennedy Parkway | and | and Trustee | Fiduciary International Ireland Limited | |
| Short Hills, NJ 07078-2789 | Trustee | since 2011 | (1999-2015). | |
| Principal Occupation During at Least the Past 5 Years: | ||||
| Managing Director, B.J. Greenwald Associates (management consultants to the financial services industry); and formerly, Chairman, | ||||
| Fiduciary Trust International Funds; Executive Vice President, L.F Rothschild Fund Management, Inc.; President and Director, Merit Mutual | ||||
| Funds; President, Underwriting Division and Director, National Securities & Research Corporation; Governor, Investment Company Institute; | ||||
| and Chairman, ICI Public Information Committee. | ||||
| Keith E. Mitchell (1954) | Trustee | Since 2011 | 17 | None |
| c/o Franklin Mutual Advisers, LLC | ||||
| 101 John F. Kennedy Parkway | ||||
| Short Hills, NJ 07078-2789 | ||||
| Principal Occupation During at Least the Past 5 Years: | ||||
| Director of various boards of asset management firms; and formerly, Managing Member, Mitchell, Hartley & Bechtel Advisers, LLC (formerly, | ||||
| Mitchell Advisers, LLC) (advisory firm) (2003-2015) and Managing Director, Putman Lovell NBF. | ||||
96 Annual Report
franklintempleton.com
FRANKLIN ALTERNATIVE STRATEGIES FUNDS
| Independent Board Members (continued) | ||||
| Number of Portfolios in | ||||
| Name, Year of Birth | Length of | Fund Complex Overseen | Other Directorships Held During | |
| and Address | Position | Time Served | by Board Member* | at Least the Past 5 Years |
| David W. Niemiec (1949) | Trustee | Since | 42 | Emeritus Corporation (assisted living) |
| c/o Franklin Mutual Advisers, LLC | April 2015 | (1999-2010) and OSI | ||
| 101 John F. Kennedy Parkway | Pharmaceuticals, Inc. (pharmaceutical | |||
| Short Hills, NJ 07078-2789 | products) (2006-2010). | |||
| Principal Occupation During at Least the Past 5 Years: | ||||
| Advisor, Saratoga Partners (private equity fund); and formerly, Managing Director, Saratoga Partners (1998-2001) and SBC Warburg Dillon | ||||
| Read (investment banking) (1997-1998); Vice Chairman, Dillon, Read & Co. Inc. (investment banking) (1991-1997); and Chief Financial | ||||
| Officer, Dillon, Read & Co. Inc. (1982-1997). | ||||
| Charles Rubens II (1930) | Trustee | Since 2011 | 17 | None |
| c/o Franklin Mutual Advisers, LLC | ||||
| 101 John F. Kennedy Parkway | ||||
| Short Hills, NJ 07078-2789 | ||||
| Principal Occupation During at Least the Past 5 Years: | ||||
| Private investor and president of non-profit organizations; and formerly, an executive of Time, Inc.; and Trustee of Colorado College. | ||||
| Jan Hopkins Trachtman (1947) | Trustee | Since 2011 | 17 | None |
| c/o Franklin Mutual Advisers, LLC | ||||
| 101 John F. Kennedy Parkway | ||||
| Short Hills, NJ 07078-2789 | ||||
| Principal Occupation During at Least the Past 5 Years: | ||||
| President and Founder, The Jan Hopkins Group (communications consulting firm); President, Economic Club of New York; serves on Advisory | ||||
| Board of Knight Bagehot Fellowship; and formerly, Anchor/Correspondent, CNN Financial News (until 2003); Managing Director and Head of | ||||
| Client Communications, Citigroup Private Bank (until 2005); Off-Air Reporter, ABC News’ World News Tonight and Editor, CBS Network News. | ||||
| Robert E. Wade (1946) | Trustee | Since 2011 | 43 | El Oro Ltd (investments) |
| c/o Franklin Mutual Advisers, LLC | and | (2003-present). | ||
| 101 John F. Kennedy Parkway | Chairman | |||
| Short Hills, NJ 07078-2789 | of the | |||
| Board | ||||
| Principal Occupation During at Least the Past 5 Years: | ||||
| Attorney at law engaged in private practice (1972-2008) and member of various boards. | ||||
| Gregory H. Williams (1943) | Trustee | Since | 16 | None |
| c/o Franklin Mutual Advisers, LLC | April 2015 | |||
| 101 John F. Kennedy Parkway | ||||
| Short Hills, NJ 07078-2789 | ||||
| Principal Occupation During at Least the Past 5 Years: | ||||
| Private investor; Consultant; and formerly, President, University of Cincinnati (2009-2012); President, The City College of New York | ||||
| (2001-2009); Dean, College of Law, Ohio State University (1993-2001); and Associate Vice President, Academic Affairs and Professor of Law, | ||||
| University of Iowa (1977-1993). | ||||
franklintempleton.com
Annual Report
97
FRANKLIN ALTERNATIVE STRATEGIES FUNDS
| Interested Board Members and Officers | ||||
| Number of Portfolios in | ||||
| Name, Year of Birth | Length of | Fund Complex Overseen | Other Directorships Held During | |
| and Address | Position | Time Served | by Board Member* | at Least the Past 5 Years |
| **Gregory E. Johnson (1961) | Trustee | Since 2011 | 162 | None |
| One Franklin Parkway | ||||
| San Mateo, CA 94403-1906 | ||||
| Principal Occupation During at Least the Past 5 Years: | ||||
| Chairman of the Board, Member – Office of the Chairman, Director, President and Chief Executive Officer, Franklin Resources, Inc.; officer | ||||
| and/or director or trustee, as the case may be, of some of the other subsidiaries of Franklin Resources, Inc. and of 46 of the investment | ||||
| companies in Franklin Templeton Investments; and Vice Chairman, Investment Company Institute. | ||||
| **Jennifer M. Johnson (1964) | Trustee | Since | 9 | None |
| One Franklin Parkway | April 2015 | |||
| San Mateo, CA 94403-1906 | ||||
| Principal Occupation During at Least the Past 5 Years: | ||||
| Chief Operating Officer and Executive Vice President, Franklin Resources Inc.; officer and/or director or trustee, as the case may be, of some | ||||
| of the other subsidiaries of Franklin Resources, Inc. and of three of the investment companies in Franklin Templeton Investments; and | ||||
| formerly, Executive Vice President of Operations and Technology, Franklin Resources Inc. (2005-2010); Senior Vice President, Franklin | ||||
| Resources Inc. (2003-2005). | ||||
| Alison E. Baur (1964) | Vice | Since 2012 | Not Applicable | Not Applicable |
| One Franklin Parkway | President | |||
| San Mateo, CA 94403-1906 | ||||
| Principal Occupation During at Least the Past 5 Years: | ||||
| Deputy General Counsel, Franklin Templeton Investments; and officer of some of the other subsidiaries of Franklin Resources, Inc. and of 46 | ||||
| of the investment companies in Franklin Templeton Investments. | ||||
| Laura F. Fergerson (1962) | Chief | Since 2011 | Not Applicable | Not Applicable |
| One Franklin Parkway | Executive | |||
| San Mateo, CA 94403-1906 | Officer – | |||
| Finance | ||||
| and | ||||
| Administration | ||||
| Principal Occupation During at Least the Past 5 Years: | ||||
| Senior Vice President, Franklin Templeton Services, LLC; Vice President, Franklin Advisers, Inc. and Franklin Templeton Institutional, LLC; | ||||
| and officer of 46 of the investment companies in Franklin Templeton Investments. | ||||
| Aliya S. Gordon (1973) | Vice | Since 2011 | Not Applicable | Not Applicable |
| One Franklin Parkway | President | |||
| San Mateo, CA 94403-1906 | ||||
| Principal Occupation During at Least the Past 5 Years: | ||||
| Senior Associate General Counsel, Franklin Templeton Investments; officer of 46 of the investment companies in Franklin Templeton | ||||
| Investments; and formerly, Litigation Associate, Steefel, Levitt & Weiss, LLP (2000-2004). | ||||
| Steven J. Gray (1955) | Secretary | Since 2011 | Not Applicable | Not Applicable |
| One Franklin Parkway | and Vice | |||
| San Mateo, CA 94403-1906 | President | |||
| Principal Occupation During at Least the Past 5 Years: | ||||
| Senior Associate General Counsel, Franklin Templeton Investments; Vice President, Franklin Templeton Distributors, Inc. and Franklin | ||||
| Alternative Strategies Advisers, LLC; and officer of 46 of the investment companies in Franklin Templeton Investments. | ||||
98 Annual Report
franklintempleton.com
FRANKLIN ALTERNATIVE STRATEGIES FUNDS
| Interested Board Members and Officers (continued) | ||||
| Number of Portfolios in | ||||
| Name, Year of Birth | Length of | Fund Complex Overseen | Other Directorships Held During | |
| and Address | Position | Time Served | by Board Member* | at Least the Past 5 Years |
| Selena L. Holmes (1965) | Vice | Since 2012 | Not Applicable | Not Applicable |
| 100 Fountain Parkway | President | |||
| St. Petersburg, FL 33716-1205 | – AML | |||
| Compliance | ||||
| Principal Occupation During at Least the Past 5 Years: | ||||
| Director, Global Compliance Monitoring; Chief Compliance Officer, Franklin Alternative Strategies Advisers, LLC; Vice President, Franklin | ||||
| Templeton Companies, LLC; and officer of 46 of the investment companies in Franklin Templeton Investments. | ||||
| Robert G. Kubilis (1973) | Treasurer, | Since | Not Applicable | Not Applicable |
| 300 S.E. 2nd Street | Chief | February 2015 | ||
| Fort Lauderdale, FL 33301-1923 | Financial | |||
| Officer | ||||
| and Chief | ||||
| Accounting | ||||
| Officer | ||||
| Principal Occupation During at Least the Past 5 Years: | ||||
| Treasurer, U.S. Fund Administration & Reporting, Franklin Templeton Investments; and officer of five of the investment companies in Franklin | ||||
| Templeton Investments. | ||||
| Kimberly H. Novotny (1972) | Vice | Since 2013 | Not Applicable | Not Applicable |
| 300 S.E. 2nd Street | President | |||
| Fort Lauderdale, FL 33301-1923 | ||||
| Principal Occupation During at Least the Past 5 Years: | ||||
| Associate General Counsel, Franklin Templeton Investments; Vice President and Secretary, Fiduciary Trust International of the South; Vice | ||||
| President, Templeton Investment Counsel, LLC; Assistant Secretary, Franklin Resources, Inc.; and officer of 46 of the investment companies | ||||
| in Franklin Templeton Investments. | ||||
| Robert C. Rosselot (1960) | Chief | Since 2013 | Not Applicable | Not Applicable |
| 300 S.E. 2nd Street | Compliance | |||
| Fort Lauderdale, FL 33301-1923 | Officer | |||
| Principal Occupation During at Least the Past 5 Years: | ||||
| Director, Global Compliance, Franklin Templeton Investments; Vice President, Franklin Templeton Companies, LLC; officer of 46 of the | ||||
| investment companies in Franklin Templeton Investments; and formerly, Senior Associate General Counsel, Franklin Templeton Investments | ||||
| (2007-2013); and Secretary and Vice President, Templeton Group of Funds (2004-2013). | ||||
| Karen L. Skidmore (1952) | Vice | Since 2011 | Not Applicable | Not Applicable |
| One Franklin Parkway | President | |||
| San Mateo, CA 94403-1906 | ||||
| Principal Occupation During at Least the Past 5 Years: | ||||
| Senior Associate General Counsel, Franklin Templeton Investments; and officer of 46 of the investment companies in Franklin Templeton | ||||
| Investments. | ||||
| Craig S. Tyle (1960) | Vice | Since 2011 | Not Applicable | Not Applicable |
| One Franklin Parkway | President | |||
| San Mateo, CA 94403-1906 | ||||
| Principal Occupation During at Least the Past 5 Years: | ||||
| General Counsel and Executive Vice President, Franklin Resources, Inc.; and officer of some of the other subsidiaries of Franklin Resources, | ||||
| Inc. and of 46 of the investment companies in Franklin Templeton Investments. | ||||
franklintempleton.com
Annual Report
99
FRANKLIN ALTERNATIVE STRATEGIES FUNDS
| Interested Board Members and Officers (continued) | ||||
| Number of Portfolios in | ||||
| Name, Year of Birth | Length of | Fund Complex Overseen | Other Directorships Held During | |
| and Address | Position | Time Served | by Board Member* | at Least the Past 5 Years |
| Lori A. Weber (1964) | Vice | Since 2012 | Not Applicable | Not Applicable |
| 300 S.E. 2nd Street | President | |||
| Fort Lauderdale, FL 33301-1923 | ||||
| Principal Occupation During at Least the Past 5 Years: | ||||
| Senior Associate General Counsel, Franklin Templeton Investments; Assistant Secretary, Franklin Resources, Inc.; Vice President and | ||||
| Secretary, Templeton Investment Counsel, LLC; Vice President, Fiduciary Trust International of the South; and officer of 46 of the investment | ||||
| companies in Franklin Templeton Investments. | ||||
| William Y. Yun (1959) | President | Since 2011 | Not Applicable | Not Applicable |
| 600 Fifth Avenue | and Chief | |||
| New York, NY 10020 | Executive | |||
| Officer – | ||||
| Investment | ||||
| Management | ||||
| Principal Occupation During at Least the Past 5 Years: | ||||
| Executive Vice President, Franklin Advisers, Inc. and Franklin Templeton Institutional, LLC; Executive Vice President – Alternative Strategies, | ||||
| Franklin Resources, Inc.; Chief Executive Officer, Franklin Alternative Strategies Advisers, LLC; and officer and/or director or trustee, as the | ||||
| case may be, of some of the other subsidiaries of Franklin Resources, Inc. and of one of the investment companies in Franklin Templeton | ||||
| Investments. | ||||
*We base the number of portfolios on each separate series of the U.S. registered investment companies within the Franklin Templeton Investments fund complex. These
portfolios have a common investment manager or affiliated investment managers.
**Gregory E. Johnson is considered to be an interested person of the Fund under the federal securities laws due to his position as an officer and director of Franklin
Resources, Inc. (Resources), which is the parent company of the Fund’s investment manager and distributor. Jennifer M. Johnson is considered to be an interested person of
the Fund under the federal securities laws due to her position as officer of Resources, which is the parent company of the Fund’s investment manager and distributor.
Note 1: Gregory E. Johnson and Jennifer M. Johnson are siblings.
Note 2: Officer information is current as of the date of this report. It is possible that after this date, information about officers may change.
Note 3: Effective April 7, 2015, Peter A. Langerman ceased to be a trustee of the Trust.
The Fund’s Board has determined that certain of the members of the Audit Committee, including Ann Torre Bates, are audit committee financial experts, and
“independent,” under those provisions of the Sarbanes-Oxley Act of 2002, and the rules and form amendments adopted by the Securities and Exchange
Commission, relating to audit committee financial experts.
The Statement of Information (SAI) include additional information about board members and is available, without charge, upon request. Shareholders may call
(800) DIAL BEN/342-5236 to request the SAI.
100 Annual Report franklintempleton.com
FRANKLIN ALTERNATIVE STRATEGIES FUNDS
Shareholder Information
Board Review of Investment Management Agreement and Sub-Advisory Agreements
The Board of Trustees (Board), including the independent trustees, at a Board meeting held on May 18, 2015, unanimously approved the renewal of the Fund’s investment management agreement with K2/D&S Management Co., L.L.C. (K2 Advisors), and of each sub-advisory agreement between K2 Advisors and each of Basso Capital Management, L.P. (Basso), Chatham Asset Management, LLC (Chatham), Chilton Investment Company, LLC (Chilton), Graham Capital Management, L.P. (Graham), Impala Asset Management, LLC (Impala), Jennison Associates, LLC (Jennison), Lazard Asset Management, LLC (Lazard), Loomis Sayles & Company, L.P. (Loomis), P. Schoenfeld Asset Management L.P. (PSAM), Wellington Management Company, LLP (Wellington) and York Registered Holdings, L.P. (together with Basso, Chatham, Chilton, Graham, Impala, Jennison, Lazard, Loomis, PSAM and Wellington, the Sub-Advisors).
Prior to a meeting of all of the trustees for the purpose of considering such approvals, the independent trustees participated in two other meetings held in connection with the renewal process (those trustees unable to attend in person were present by telephonic conference means). Throughout the process, the independent trustees received assistance and advice from and met separately with independent counsel. The independent trustees met with and interviewed officers of K2 Advisors and certain Sub-Advisors (including portfolio managers), the transfer agent and shareholder services group and the distributor. In approving the renewal of the investment management agreement and the sub-advisory agreements for the Fund, the Board, including the independent trustees, determined that the investment management fee structure was fair and reasonable and that continuance of the agreement was in the best interests of the Fund and its shareholders.
In making the foregoing approvals, the Board considered various materials related to the investment management agreement and the sub-advisory agreements including: (1) a copy of the investment management agreement and sub-advisory agreements; (2) information describing the nature, quality and extent of services that K2 Advisors and each Sub-Advisor provided, and is expected to provide, to the Fund, and the investment management fees and sub-advisory fees payable to K2 Advisors and each Sub-Advisor; (3) reports from K2 Advisors on the continued diligence conducted on each Sub-Advisor and the reasons for recommending renewal of each of the sub-advisory agreements, including, but not limited to, each Sub-Advisor’s background, experience, personnel, operations, policies, procedures and compliance functions; and (4) a report from the Fund’s Chief Compliance Officer regarding K2 Advisors’ and each Sub-Advisor’s compliance program and capabilities, including policies and procedures in place to address potential conflicts of interest, and the diligence undertaken by the Fund’s Chief Compliance Officer with respect thereto.
The Board also took into account information furnished throughout the year at regular Board meetings, as well as information specifically requested and furnished for the approval process, which culminated in the meetings referred to above for the specific purpose of considering such agreements. Information furnished throughout the year included, among others, reports on the Fund’s investment performance, expenses, portfolio composition, derivatives, asset segregation, portfolio turnover, Rule 12b-1 plans, distribution, shareholder servicing, legal and compliance matters, pricing of securities and sales and redemptions, and marketing support payments made to financial intermediaries, as well as a third-party survey of transfer agent fees charged funds within the Franklin Templeton Investments (FTI) complex in comparison with those charged other fund complexes deemed comparable. Also, related financial statements and other information about the scope and quality of services provided by K2 Advisors and its affiliates and enhancements to such services over the past year were provided. In addition, the trustees received periodic reports throughout the year and during the approval process relating to compliance with the Fund’s investment policies and restrictions. During the approval process, the independent trustees considered K2 Advisors’ methods of operation within the Franklin Templeton group and its activities on behalf of other clients.
The information obtained by the trustees during the renewal process also included a special report prepared by Lipper, Inc. (Lipper), an independent third-party analyst, comparing the Fund’s investment performance and expenses with those of other mutual funds deemed comparable to such Fund as selected by Lipper (Lipper Section 15(c) Report). The Board reviewed this information and its usefulness in the approval process with respect to matters such as comparative fees, expenses, expense ratios and performance. The Board considered K2 Advisors’ views that the peer group determined by Lipper for comparison purposes may not be an entirely appropriate representation of the Fund’s peer universe. K2 Advisors explained that the universe of funds that are managed using
franklintempleton.com
Annual Report
101
FRANKLIN ALTERNATIVE STRATEGIES FUNDS
FRANKLIN K2 ALTERNATIVE STRATEGIES FUND
SHAREHOLDER INFORMATION
Board Review of Investment Management Agreement and Sub-Advisory Agreements
(continued)
multi-manager, multi-strategy structures, like the Fund, is still evolving, and has presented challenges in identifying an appropriate set of peers for the Fund. It was noted by K2 Advisors that the peer group compiled by Lipper includes several single-manager funds which, due to their nature and relative simplicity, have lower expense ratios and are not very useful for comparison purposes. In addition, many of the sponsors of funds with multi-manager strategies that K2 Advisors considers to be peers were excluded from the peer group and K2 Advisors believes that the Fund’s expenses are consistent with those funds. It was noted that as more funds are launched that are managed similarly to the Fund, the peer group likely will become larger, and may also be subdivided so that a peer group is available that is comprised of funds that provide a more meaningful comparison. While noting the limitations of the Lipper Section 15(c) Report, the Board concluded that the Lipper Section 15(c) Report was helpful in the performance of its duties.
In addition, the trustees received a Profitability Study (Profitability Study) prepared by management discussing the profitability to FTI from its overall U.S. Fund operations, as well as on an individual fund-by-fund basis. Over the past year, the Board and counsel to the independent trustees continued to receive reports on management’s handling of recent regulatory inquiries and pending legal actions against K2 Advisors and its affiliates. The independent trustees were satisfied with the actions taken to date by management in response to such regulatory and legal matters. The independent trustees also received reports from the Trust’s Chief Compliance Officer on regulatory inquiries and pending legal actions against the Sub-Advisors applicable to the services provided by the Sub-Advisors to the Fund and noted that there were not any issues in this regard that should prevent the renewal of the sub-advisory agreements.
The trustees reviewed the personnel, operations, financial condition, and investment management capabilities, methodologies and resources of K2 Advisors and each Sub-Advisor, including each management team’s expertise in the management of other alternative strategies funds. As part of this review, particular attention was given to (1) the diligent risk management program of K2 Advisors and its parent, including those aspects of the program related to selecting and overseeing sub-advisors to the Fund and continual monitoring and management of counterparty credit risk and collateral, (2) each Sub-Advisor’s risk management program, and (3) derivatives and other complex instruments that are held and expected to be held by the Fund and how such instruments are used to carry out the Fund’s investment goals.
The Board also took into account, among other things, management’s efforts in establishing a global credit facility for the benefit of the Fund and other accounts managed by FTI to provide a source of cash for temporary and emergency purposes or to meet unusual redemption requests as well as the strong financial position of K2 Advisors’ parent company and its commitment to the mutual fund business. In addition, the Board received updates from management on the Securities and Exchange Commission’s (SEC) progress in implementing the rule-making requirements established by the Dodd-Frank Wall Street Reform and Consumer Protection Act (Dodd-Frank Act), which was enacted July 21, 2010, and K2 Advisors’ and its affiliates’ compliance with rules and regulations already promulgated by the SEC under such act.
In addition to the above and other matters considered by the trustees throughout the course of the year, the following sets forth some of the primary information and factors relevant to the Board’s decisions. This discussion of the information and factors considered by the Board (including the information and factors discussed above) is not intended to be exhaustive, but rather summarizes certain factors considered by the Board. In view of the wide variety of factors considered, the Board did not, unless otherwise noted, find it practicable to quantify or otherwise assign relative weights to the foregoing factors. In addition, individual trustees may have assigned different weights to various factors.
NATURE, EXTENT AND QUALITY OF SERVICES. The trustees reviewed the nature, extent and quality of the services provided, and to be provided, by K2 Advisors and each Sub-Advisor. In this regard, they reviewed the Fund’s investment goal and K2 Advisors’ and each Sub-Advisor’s investment strategy and sub-strategy, and K2 Advisors’ and each Sub-Advisor’s ability to implement such investment strategy and/or sub-strategy, including, but not limited to, K2 Advisors’ and each Sub-Advisor’s trading practices, investment decision processes and reputation.
102 Annual Report
franklintempleton.com
FRANKLIN ALTERNATIVE STRATEGIES FUNDS
FRANKLIN K2 ALTERNATIVE STRATEGIES FUND
SHAREHOLDER INFORMATION
The Board noted that the Fund employs a “manager of managers” structure, whereby K2 Advisors is responsible for selecting sub-advisors (subject to Board approval), allocating the Fund’s assets among them, and overseeing the sub-advisors’ day-to-day management of the Fund’s assets. The Board noted the responsibilities that K2 Advisors has as the Fund’s investment manager, including (1) due diligence on the Sub-Advisors and any potential new sub-advisors to the Fund, their respective trading strategies, risk management, operations and businesses, (2) ongoing oversight and monitoring of the day-today investment activities of Sub-Advisors and other service providers, including their respective compliance with the investment mandate and restrictions, compliance policies and procedures and federal securities laws, and K2 Advisors’ ongoing assessment of their performance, (3) portfolio construction with respect to the allocation of assets among Sub-Advisors, investment funds, cash and other investments, (4) risk management, (5) preparing quarterly reports to the Board, and (6) the implementation of Board directives as they relate to the Fund. The Trustees also considered the successful performance of K2 Advisors in managing the Fund and other investment products with similar investment strategies to the investment strategies of the Fund that are not subject to the Investment Company Act of 1940, as amended.
With respect to the sub-advisory services provided, and to be provided, by each Sub-Advisor, the Board noted the responsibilities that each Sub-Advisor has with respect to the portion of the Fund’s assets allocated to the Sub-Advisor by K2 Advisors (Sub-Advised Portion), including, among others, implementing the investment strategies with respect to the Sub-Advised Portion and ensuring compliance with the investment strategies, policies and limitations of the Sub-Advised Portion. The trustees considered the successful performance of each Sub-Advisor in managing the Fund and other investment products with similar investment strategies to the investment strategies of its Sub-Advised Portion of the Fund, including, with respect to certain Sub-Advisors, mutual funds with similar investment strategies. The Board considered K2 Advisors’ rationale for recommending the continued retention of each Sub-Advisor.
The trustees reviewed the Fund’s portfolio management teams at K2 Advisors and each Sub-Advisor, including each such team’s performance, staffing, skills and compensation program. With respect to portfolio manager compensation, management assured the trustees that the Fund’s long-term performance is a significant component of incentive-based compensation for K2 Advisors’ portfolio management team and noted that a portion of a K2 Advisors’ portfolio manager’s incentive-based compensation is paid in shares of predesignated funds from the portfolio manager’s fund management area. The trustees noted that the portfolio manager compensation program aligned the interests of the portfolio managers with that of Fund shareholders. During regular Board meetings and the aforementioned meetings of the independent trustees, the trustees considered periodic reports provided to them showing that K2 Advisors and the Sub-Advisors complied with the investment policies and restrictions of the Fund as well as other reports periodically furnished to the Board covering matters such as the compliance of portfolio managers and other management personnel with the code of ethics covering the investment management personnel, the adherence to fair value pricing procedures established by the Board and the accuracy of net asset value calculations. The Board noted the extent of the benefits provided to Fund shareholders from being part of the Franklin Templeton group, including the right to exchange investments between funds (same class) without a sales charge, the ability to reinvest Fund dividends into other funds and the right to combine holdings of other funds to obtain reduced sales charges.
The trustees considered various other products, portfolios and entities that are advised by K2 Advisors and each Sub-Advisor and the allocation of assets and expenses among and within them, as well as their relative fees and reasons for differences with respect thereto and any potential conflicts.
The Board also considered a report from the Trust’s Chief Compliance Officer regarding K2 Advisors’ and each Sub-Advisor’s compliance programs and capabilities as such programs and capabilities relate to the operations of the Fund and the monitoring and testing of such program undertaken by the Trust’s Chief Compliance Officer. The Board considered the selection and due diligence process employed by K2 Advisors in selecting and deciding to retain each Sub-Advisor as a sub-advisor to the Fund, including the due diligence undertaken with respect to the Sub-Advisor’s compliance and risk management capabilities. The trustees considered K2 Advisors’ significant efforts in developing and implementing compliance procedures established in accordance with Securities and Exchange Commission and other requirements.
The trustees also reviewed the nature, extent and quality of the services to be provided under the Fund’s other service
franklintempleton.com
Annual Report
103
FRANKLIN ALTERNATIVE STRATEGIES FUNDS
FRANKLIN K2 ALTERNATIVE STRATEGIES FUND
SHAREHOLDER INFORMATION
Board Review of Investment Management Agreement and Sub-Advisory Agreements
(continued)
agreements to determine that, on an overall basis, Fund shareholders were well served. In this connection, the Board also took into account transfer agent and shareholder services provided to Fund shareholders by an affiliate of K2 Advisors, noting continuing expenditures by management to increase and improve the scope of such services and favorable periodic reports on shareholder services conducted by independent third parties. While such considerations directly affected the trustees’ decision in renewing the Fund’s transfer agent and shareholder services agreement, the Board also considered these commitments as incidental benefits to Fund shareholders deriving from the investment management relationship.
Based on their review, the trustees were satisfied with the nature and quality of the overall services provided, and to be provided, by K2 Advisors and its affiliates and each Sub-Advisor to the Fund and its shareholders and were confident in the abilities of K2 Advisors and each Sub-Advisor to implement their respective investment strategy and/or sub-strategy and to provide quality services to the Fund and its shareholders.
INVESTMENT PERFORMANCE. As the Fund commenced operations in October 2013, the trustees reviewed the investment performance of the Fund and each Sub-Advisor for the one-year period ended December 31, 2014. As part of their review, they inquired of management regarding benchmark and hedging activities. Consideration was also given to performance in the context of available levels of cash, including as affected by net flows, during the periods. The trustees had meetings during the year, including the meetings referred to above held in connection with the renewal process, with the Fund’s portfolio managers to discuss performance and the management of the Fund and each Sub-Advisor.
In addition, attention in assessing performance was given to the Lipper Section 15(c) Report. That report showed the investment performance of the Fund (Class A shares) in comparison to other funds determined comparable by Lipper. The comparable funds to the Fund, as chosen by Lipper, included a representative class/fund from each retail portfolio in the alternative multi-strategy classification, excluding outliers. The Fund had total returns in the best performing quintile for the one-year period ended December 31, 2014. The Board was satisfied with such performance.
The trustees also compared Fund performance to other industry benchmarks, including measures of risk-adjusted performance of a fund, as part of their evaluation of investment performance. The trustees concluded that the Fund had performed well in comparison to its various benchmarks and in the context of the Fund’s objectives.
COMPARATIVE EXPENSES AND PROFITABILITY. The Board considered the cost of the services provided, and to be provided, by K2 Advisors and each Sub-Advisor and the profits realized by K2 Advisors and its affiliates from their relationships with the Fund. In considering the appropriateness of the management fee and other expenses charged to the Fund, the Board took into account various factors including investment performance and matters relating to Fund operations, including, but not limited to, the quality and experience of K2 Advisors personnel. The Board also reviewed and considered the investment management fees in light of the nature, extent and quality of the investment management services provided, and to be provided, by K2 Advisors and each Sub-Advisor, as more fully discussed above. The Board noted that the sub-advisory fees are paid by K2 Advisors to each Sub-Advisor and are not additional fees borne by the Fund. The Board also noted that the sub-advisory fees paid, and to be paid, by K2 Advisors to each Sub-Advisor were the product of arms-length negotiations between K2 Advisors and each Sub-Advisor. Furthermore, the Board took into account that information regarding Sub-Advisor profitability is not legally required to be provided and noted that, despite requests by K2 Advisors of such information, the Sub-Advisors had not provided profitability information. Accordingly, profitability information of the sub-advisors was given lesser weight than other factors. In addition, the Board considered the allocation of the investment management fee charged to the Fund between K2 Advisors and each Sub-Advisor in light of the nature, extent and quality of the investment management services provided, and to be provided, by K2 Advisors and each Sub-Advisor. As part of this discussion, the Board took into account the fee waiver and expense limitation arrangement in effect, and the amount of Fund expenses that were absorbed since inception of the Fund by K2 Advisors through such waivers and arrangements.
Consideration was also given to a comparative analysis in the Lipper Section 15(c) Report of the investment management fee and total expense ratio of the Fund in comparison with those of a group of other funds selected by Lipper as its appropriate Lipper expense group. Lipper expense data is based upon
104 Annual Report
franklintempleton.com
FRANKLIN ALTERNATIVE STRATEGIES FUNDS
FRANKLIN K2 ALTERNATIVE STRATEGIES FUND
SHAREHOLDER INFORMATION
information taken from the Fund’s most recent annual report, which reflects historical asset levels that may be quite different from those currently existing, particularly in a period of market volatility.
In reviewing comparative costs, emphasis was given to the Fund’s contractual management fee in comparison with the contractual management fee that would have been charged by other funds within its Lipper expense group assuming they were similar in size to the Fund, as well as the actual total expenses of the Fund in comparison with those of its Lipper expense group. The Lipper contractual management fee analysis includes administrative charges as being part of the management fee, and total expenses, for comparative consistency, are shown by Lip-per for Fund Class A shares. The Fund’s contractual management fee rate was in the second-most expensive quintile of its Lipper expense group and its total expenses were in the most expensive quintile of such group. The Board noted, however, that the Fund’s expense ratio was not the highest in its Lipper expense group. In light of the factors and limitations noted above with respect to the Lipper Section 15(c) Report and factors relating to the Fund’s operations, such as the quality and experience of K2 Advisors and the Sub-Advisors and the nature and quality of the services provided and to be provided by K2 Advisors and the Sub-Advisors, the Board found such comparative fees and expenses to be acceptable.
The trustees also reviewed the Profitability Study addressing profitability of Franklin Resources, Inc., from its overall U.S. fund business, as well as profitability to K2 Advisors and its affiliates, from providing investment management and other services to the Fund during the 12-month period ended September 30, 2014, the most recent fiscal year-end of Franklin Resources, Inc. The trustees reviewed the basis on which such reports are prepared and the cost allocation methodology utilized in the Profitability Study, it being recognized that allocation methodologies may each be reasonable while producing different results. In this respect, the Board noted that the reasonableness of the cost allocation methodologies was reviewed by independent accountants on an every other year basis.
The independent trustees met with management to discuss the Profitability Study. This included, among other things, a comparison of investment management income with investment management expenses of the Fund; comparison of underwriting revenues and expenses; the relative relationship of investment management and underwriting expenses; shareholder servicing profitability; economies of scale; and the relative contribution of the Fund to the profitability of K2 Advisors and its parent. In discussing the Profitability Study with the Board, K2 Advisors stated its belief that the costs incurred in establishing the infrastructure necessary to operate the type of mutual fund operations conducted by it and its affiliates may not be fully reflected in the expenses allocated to the Fund in determining its profitability.
The Board also took into account management’s expenditures in improving shareholder services provided to the Fund, as well as the need to meet additional regulatory and compliance requirements resulting from the Sarbanes-Oxley Act, the Dodd-Frank Act and recent SEC and other regulatory requirements. The trustees also considered the extent to which K2 Advisors and the Sub-Advisors may derive ancillary benefits from Fund operations, including those derived from the allocation of Fund brokerage and the use of commission dollars to pay for research and other similar services.
Based upon their consideration of all these factors, the trustees determined that the level of profits realized by K2 Advisors and its affiliates in providing services to the Fund was not excessive in view of the nature, quality and extent of services provided. In addition, the Board noted that shareholders are able to redeem their Fund shares at any time if shareholders believe that Fund fees and expenses are too high or if they are dissatisfied with the performance of the Fund.
ECONOMIES OF SCALE. The Board considered economies of scale realized by K2 Advisors and its affiliates and the Sub-Advisors as the Fund grows larger and the extent to which they are shared with Fund shareholders, as for example, in the level of the investment management fees charged, in the quality and efficiency of services rendered and in increased capital commitments benefiting the Fund directly or indirectly. Since the Fund had only commenced operations in October 2013, and among other considerations, the Board concluded that economies of scale were difficult to consider at that time.
Proxy Voting Policies and Procedures
The Fund’s investment manager has established Proxy Voting Policies and Procedures (Policies) that the Fund uses to determine how to vote proxies relating to portfolio securities. Shareholders may view the Fund’s complete Policies online at franklintempleton.com. Alternatively, shareholders may request
franklintempleton.com
Annual Report
105
FRANKLIN ALTERNATIVE STRATEGIES FUNDS
FRANKLIN K2 ALTERNATIVE STRATEGIES FUND
SHAREHOLDER INFORMATION
Proxy Voting Policies and Procedures (continued)
copies of the Policies free of charge by calling the Proxy Group collect at (954) 527-7678 or by sending a written request to: Franklin Templeton Companies, LLC, 300 S.E. 2nd Street, Fort Lauderdale, FL 33301, Attention: Proxy Group. Copies of the Fund’s proxy voting records are also made available online at franklintempleton.com and posted on the U.S. Securities and Exchange Commission’s website at sec.gov and reflect the most recent 12-month period ended June 30.
Quarterly Statement of Investments
The Fund files a complete statement of investments with the U.S. Securities and Exchange Commission for the first and third quarters for each fiscal year on Form N-Q. Shareholders may view the filed Form N-Q by visiting the Commission’s website at sec.gov. The filed form may also be viewed and copied at the Commission’s Public Reference Room in Washington, DC. Information regarding the operations of the Public Reference Room may be obtained by calling (800) SEC-0330.
Householding of Reports and Prospectuses
You will receive the Fund’s financial reports every six months as well as an annual updated summary prospectus (prospectus available upon request). To reduce Fund expenses, we try to identify related shareholders in a household and send only one copy of the financial reports and summary prospectus. This process, called “householding,” will continue indefinitely unless you instruct us otherwise. If you prefer not to have these documents householded, please call us at (800) 632-2301. At any time you may view current prospectuses/summary prospectuses and financial reports on our website. If you choose, you may receive these documents through electronic delivery.
106 Annual Report
franklintempleton.com
This page intentionally left blank.
This page intentionally left blank.
Franklin Templeton Investments
Gain From Our Perspective®
At Franklin Templeton Investments, we’re dedicated to one goal: delivering exceptional asset management for our clients. By bringing together multiple, world-class investment teams in a single firm, we’re able to offer specialized expertise across styles and asset classes, all supported by the strength and resources of one of the world’s largest asset managers. This has helped us to become a trusted partner to individual and institutional investors across the globe.
Focus on Investment Excellence
At the core of our firm, you’ll find multiple independent investment teams—each with a focused area of expertise—from traditional to alternative strategies and multi-asset solutions. And because our portfolio groups operate autonomously, their strategies can be combined to deliver true style and asset class diversification.
All of our investment teams share a common commitment to excellence grounded in rigorous, fundamental research and robust, disciplined risk management. Decade after decade, our consistent, research-driven processes have helped Franklin Templeton earn an impressive record of strong, long-term results.
Global Perspective Shaped by Local Expertise
In today’s complex and interconnected world, smart investing demands a global perspective. Franklin Templeton pioneered international investing over 60 years ago, and our expertise in emerging markets spans more than a quarter of a century. Today, our investment professionals are on the ground across the globe, spotting investment ideas and potential risks firsthand. These locally based teams bring in-depth understanding of local companies, economies and cultural nuances, and share their best thinking across our global research network.
Strength and Experience
Franklin Templeton is a global leader in asset management serving clients in over 150 countries.1 We run our business with the same prudence we apply to asset management, staying focused on delivering relevant investment solutions, strong long-term results and reliable, personal service. This approach, focused on putting clients first, has helped us to become one of the most trusted names in financial services.
1. As of 12/31/14. Clients are represented by the total number of shareholder accounts.
Not FDIC Insured | May Lose Value | No Bank Guarantee
| Contents | |
| Shareholder Letter | 1 |
| Annual Report | |
| Franklin Pelagos Commodities | |
| Strategy Fund | 3 |
| Performance Summary | 7 |
| Your Fund’s Expenses | 12 |
| Consolidated Financial Highlights and | |
| Consolidated Statement of | |
| Investments | 14 |
| Consolidated Financial Statements | 21 |
| Notes to Consolidated | |
| Financial Statements | 25 |
| Report of Independent Registered | |
| Public Accounting Firm | 35 |
| Board Members and Officers | 36 |
| Shareholder Information | 41 |
| franklintempleton.com | |
Annual Report
Franklin Pelagos Commodities Strategy Fund
This annual report for Franklin Pelagos Commodities Strategy Fund covers the fiscal year ended May 31, 2015.
Your Fund’s Goal and Main Investments
The Fund seeks long-term total return. It invests mainly in commodity-linked derivative instruments and securities of the U.S. government, its agencies and instrumentalities and other fixed income securities.
Performance Overview
The Fund’s Class A shares had a -24.58% cumulative total return for the 12 months under review. In comparison, the benchmark Bloomberg Commodity Index, which measures performance of exchange-traded futures contracts on physical commodities, had a -24.55% total return for the same period.1,2
Performance data represent past performance, which does not guarantee future results. Investment return and principal value will fluctuate, and you may have a gain or loss when you sell your shares. Current performance may differ from figures shown. Please visit franklintempleton.com or call (800) 342-5236 for most recent month-end performance.
What is a futures contract?
A futures contract is an agreement between the Fund and a counterparty made through a U.S. or foreign futures exchange to buy or sell an underlying instrument or asset at a specific price on a future date.
Economic and Market Overview
U.S. economic growth moderated during the 12 months under review, especially in the second half of the period. The economy grew for most of 2014, supported in some quarters by greater spending by consumers, businesses, and state and local governments, partially offset by the effects of a wider trade deficit and lower federal defense spending. In 2015’s first quarter, U.S. dollar strength, low energy prices and a labor dispute at West Coast ports led exports to decline. Lower business investment and state and local government spending also weighed on the economy, while increases in consumer spending and private inventory investment offered some support. Manufacturing and non-manufacturing activities increased during the period, and the unemployment rate declined from 6.3% in May 2014 to 5.5% at period-end.3 Housing market data were generally encouraging as home sales and prices rose amid declining mortgage rates. After a brief, winter slump, retail sales rebounded in the spring as strong employment gains led to broad-based improvement, especially for auto and gas sales. Inflation, as measured by the Consumer Price Index, remained subdued due to lower energy prices.
In October, the U.S. Federal Reserve Board (Fed) ended its expansion of its bond buying program and kept its target interest rate at 0%–0.25% while considering when it might be appropriate to raise it. In its April meeting, the Fed attributed the economy’s first-quarter slowdown to transitory factors. The Fed reiterated that it would raise interest rates when it saw further improvement in the labor market and was reasonably confident that inflation would move back to its 2% objective over the medium term.
Investor confidence grew during the period as corporate profits remained healthy, the Fed maintained its cautious tone on raising interest rates and China introduced more stimulus measures. The stock markets endured some sell-offs when many investors reacted to Greece’s debt negotiations, political instability and geopolitical tensions in certain regions, and relatively weak economic growth in Europe and Japan, as well as less robust growth in China. U.S. stocks rose overall for the 12 months under review, as measured by the Standard & Poor’s® 500 Index. Commodity prices generally declined for the period, as measured by the Bloomberg Commodity Index, as a moderating global economy and growing production led to excess supplies of oil and other commodities. In addition, U.S. dollar strength for most of the period exacerbated the impact of weakening supply-and-demand fundamentals.
1. Source: Morningstar.
2. Prior to 7/1/14, the index was known as the Dow Jones-UBS Commodity Index.
The index is unmanaged and includes reinvested dividends. One cannot invest directly in an index, and an index is not representative of the Fund’s portfolio.
3. Source: Bureau of Labor Statistics.
See www.franklintempletondatasources.com for additional data provider information.
The dollar value, number of shares or principal amount, and names of all portfolio holdings are listed in the Fund’s Consolidated Statement of Investments (SOI).
The Consolidated SOI begins on page 19.
franklintempleton.com
Annual Report
| 3
FRANKLIN PELAGOS COMMODITIES STRATEGY FUND
Investment Strategy
We utilize an actively managed fundamental and quantitative investment process to provide exposure to the commodities markets by investing in commodity-linked derivative instruments including commodity-linked total return swaps, commodity futures, commodity index futures and options on commodities and commodity index futures, which may provide exposure to foreign and emerging markets. By investing in these derivative instruments, we seek to gain exposure to the returns of real assets that trade in the commodities markets without direct investment in physical commodities. Real assets include such things as industrial and precious metals, gas, oil, livestock, agricultural or meat products and other items.
What is a swap agreement?
A swap agreement, such as a commodity-linked total return swap, is a contract between the Fund and a counterparty to exchange on a future date the returns, or differentials in rates of return, that would have been earned or realized if a notional amount were invested in specific instruments.
What is an option?
An option is a contract to buy or sell a specific financial product known as the option’s underlying instrument at a specific price. The buyer of an option has the right, but not the obligation, to buy or sell the underlying instrument at or until a specified expiration date. Conversely, the seller (“writer”) of an option who opens a transaction is obligated to buy or sell the underlying instrument should the option holder exercise that right.
| Portfolio Breakdown* | ||
| 5/31/15 | ||
| % of Consolidated | ||
| Net Assets | ||
| U.S. Treasury Bills | 47.7 | % |
| Federal Farm Credit Bank | 32.2 | % |
| U.S. Treasury Notes | 19.6 | % |
| Institutional Fiduciary Trust Money Market Portfolio | 1.4 | % |
| Federal Home Loan Bank | 0.6 | % |
| Other Assets, less Liabilities** | -1.5 | % |
*Figures are stated as a percentage of total and may not equal 100% or may be
negative due to rounding, use of any derivatives, unsettled trades or other factors.
**Includes unrealized appreciation/depreciation on open futures and swap contracts,
as well as other assets and liabilities. See supplementary commodity exposure
tables on page 5 for additional information related to the Fund’s economic exposure
to commodities.
Manager’s Discussion
During its fiscal year, the Fund obtained its commodities exposure through swaps on commodities indexes and through commodities futures and options on commodities futures. These exposures were supported with U.S. Treasury bills and other fixed income securities.
During the period under review, commodity returns were generally negative, with a few exceptions, driven by ample global supply as consumption growth for most commodities failed to keep pace with production growth. A rising U.S. dollar provided further headwinds to commodity prices. Energy markets faced robust U.S. production growth of crude oil and natural gas, while China’s increased industrial metals production dampened the country’s import demand. World production of key grains reached record levels during the period, and global precious metals production growth continued. A major detractor from the Fund’s absolute return was the Fund’s positioning in the energy sector, followed by agriculture. The Fund performed largely in line with the benchmark Bloomberg Commodity Index, as the Fund’s positioning in agriculture and livestock contributed relative to the index, while overall positioning in energy, precious metals and industrial metals detracted from relative performance.
Within the energy sector, despite U.S. production growth, the Organization of the Petroleum Exporting Countries chose in November not to slow production to help balance supply and demand, causing global petroleum markets to fall. Although geopolitical risk and a high rate of European weather-driven demand provided glimmers of price support at times during the period, the market grappled with global oversupply and a surge in U.S. crude oil inventories. Over the period, Fund positioning in crude oil products such as heating oil and gasoline contributed to absolute and relative returns, while positioning in crude oil detracted, with overall petroleum positioning detracting from returns. The U.S. natural gas market benefited from record-low winter temperatures in the northeast that somewhat tempered the effect of production growth. U.S. natural gas storage finished the latest withdrawal season (from November 2014 through March 2015) below five-year average levels, but not nearly at the prior season’s levels. Fund positioning in natural gas detracted from absolute and relative returns.
4 | Annual Report
franklintempleton.com
FRANKLIN PELAGOS COMMODITIES STRATEGY FUND
Chinese refined-copper consumption has grown to a level roughly equal to that of the rest of the world combined, and recent consumption growth has been met with domestic production growth. Although the Fund’s copper positioning detracted from absolute performance, it benefited relative performance.
China dominated world zinc-slab production growth during the period, with production in the rest of the world showing evidence of contraction, which provided support for zinc prices. However, Fund positioning in zinc detracted from relative performance. In the precious metals sector, total known exchange-traded fund holdings of gold and silver declined modestly, indicating lackluster investor support for the metals. Fund positioning in gold, silver and palladium over the period detracted from absolute and relative returns.
U.S. corn production reached a record level for the 12-month period, as did soybean production, with favorable 2014 summer weather enhancing crop yields. Wheat, which has a more diverse production base, had a record global crop yield resulting from increases in Russia and Asian countries. Fund positioning in cotton, soybean oil and corn provided positive contributions to absolute and relative returns over the period. Conversely, Fund positioning in wheat and winter wheat detracted from absolute and relative performance. Low feedlot placements and marketing costs supported live cattle prices, and the Fund’s positioning in live cattle contributed to absolute and relative returns for the period.
Fund Exposure to Commodities
The following table summarizes the Fund’s economic exposure to commodities derived through its investment in commodity-linked total return swap contracts. At May 31, 2015, the Fund’s exposure based on notional value represented 80.7% of consolidated net assets.
Commodity-Linked Total Return Swap Exposure*
| % of Consolidated | ||
| Net Assets | ||
| WTI Crude Oil | 18.1 | % |
| Gold | 13.1 | % |
| Heating Oil | 9.4 | % |
| Natural Gas | 8.8 | % |
| Copper | 7.6 | % |
| Soybeans | 7.1 | % |
| Soybean Meal | 5.5 | % |
| Soybean Oil | 4.8 | % |
| Sugar | 3.2 | % |
| Live Cattle | 3.1 | % |
*Figures are stated as a percentage of total and may not equal 100% or may be negative due to rounding, use of any derivatives, unsettled trades or other factors. The Fund’s exposure was calculated using the commodity sector weightings of the FP Custom Master Index multiplied by the Fund’s percentage notional exposure.
The following table summarizes the Fund’s economic exposure to commodities derived through its investment in futures contracts. At May 31, 2015, the Fund’s exposure based on notional value represented 18.3% of consolidated net assets.
| Commodity Futures Exposure* | ||
| % of Consolidated | ||
| Net Assets | ||
| Long | ||
| Gold | 6.6 | % |
| Sugar | 4.9 | % |
| Silver | 4.0 | % |
| Live Cattle | 2.8 | % |
*Figures are stated as a percentage of total and may not equal 100% or may be
negative due to rounding, use of any derivatives, unsettled trades or other factors.
franklintempleton.com
Annual Report
| 5
FRANKLIN PELAGOS COMMODITIES STRATEGY FUND
As fellow shareholders, we were disappointed with the Fund’s absolute performance in the recent challenging environment for commodities. However, we remain committed to our active investment process and long-term perspective, keeping in mind that volatility is not uncommon for commodities markets. Thank you for your continued participation in Franklin Pelagos Commodities Strategy Fund. We look forward to continuing to serve your financial needs.

The foregoing information reflects our analysis, opinions and portfolio holdings as of May 31, 2015, the end of the reporting period. The way we implement our main investment strategies and the resulting portfolio holdings may change depending on factors such as market and economic conditions. These opinions may not be relied upon as investment advice or an offer for a particular security. The information is not a complete analysis of every aspect of any market, country, industry, security or the Fund. Statements of fact are from sources considered reliable, but the investment manager makes no representation or warranty as to their completeness or accuracy. Although historical performance is no guarantee of future results, these insights may help you understand our investment management philosophy.
6 | Annual Report
franklintempleton.com
FRANKLIN PELAGOS COMMODITIES STRATEGY FUND
Performance Summary as of May 31, 2015
Your dividend income will vary depending on dividends or interest paid by securities in the Fund’s portfolio, adjusted for operating expenses of each class. Capital gain distributions are net profits realized from the sale of portfolio securities. The performance table and graphs do not reflect any taxes that a shareholder would pay on Fund dividends, capital gain distributions, if any, or any realized gains on the sale of Fund shares. Total return reflects reinvestment of the Fund’s dividends and capital gain distributions, if any, and any unrealized gains or losses.
| Net Asset Value | ||||||
| Share Class (Symbol) | 5/31/15 | 5/31/14 | Change | |||
| A (FLSQX) | $ | 7.12 | $ | 9.44 | -$ | 2.32 |
| C (FLSVX) | $ | 7.05 | $ | 9.41 | -$ | 2.36 |
| R (FLSWX) | $ | 7.10 | $ | 9.44 | -$ | 2.34 |
| R6 (FPELX) | $ | 7.16 | $ | 9.46 | -$ | 2.30 |
| Advisor (FSLPX) | $ | 7.25 | $ | 9.58 | -$ | 2.33 |
franklintempleton.com
Annual Report
| 7
FRANKLIN PELAGOS COMMODITIES STRATEGY FUND
PERFORMANCE SUMMARY
Performance as of 5/31/151
Cumulative total return excludes sales charges. Average annual total returns and value of $10,000 investment include maximum sales charges. Class A: 5.75% maximum initial sales charge; Class C: 1% contingent deferred sales charge in first year only;
Class R/R6/Advisor Class: no sales charges.
| Value of | Average Annual | Total Annual Operating Expenses6 | ||||||||||
| Cumulative | Average Annual | $ | 10,000 | Total Return | ||||||||
| Share Class | Total Return2 | Total Return3 | Investment4 | (6/30/15 | )5 | (with waiver) | (without waiver) | |||||
| A | 1.25 | % | 3.58 | % | ||||||||
| 1-Year | -24.58 | % | -28.94 | % | $ | 7,106 | -28.54 | % | ||||
| Since Inception (1/10/14) | -19.82 | % | -18.28 | % | $ | 7,558 | -16.65 | % | ||||
| C | 1.95 | % | 4.28 | % | ||||||||
| 1-Year | -25.08 | % | -25.83 | % | $ | 7,417 | -25.46 | % | ||||
| Since Inception (1/10/14) | -20.61 | % | -15.34 | % | $ | 7,939 | -13.88 | % | ||||
| R | 1.45 | % | 3.78 | % | ||||||||
| 1-Year | -24.79 | % | -24.79 | % | $ | 7,521 | -24.32 | % | ||||
| Since Inception (1/10/14) | -20.05 | % | -14.90 | % | $ | 7,995 | -13.39 | % | ||||
| R6 | 0.86 | % | 1.78 | % | ||||||||
| 1-Year | -24.31 | % | -24.31 | % | $ | 7,569 | -23.84 | % | ||||
| Since Inception (1/10/14) | -19.37 | % | -14.38 | % | $ | 8,063 | -12.90 | % | ||||
| Advisor | 0.95 | % | 3.28 | % | ||||||||
| 1-Year | -24.32 | % | -24.32 | % | $ | 7,568 | -23.94 | % | ||||
| 3-Year | -20.76 | % | -7.47 | % | $ | 7,924 | -8.69 | % | ||||
| Since Inception (12/7/11) | -27.50 | % | -8.82 | % | $ | 7,250 | -8.31 | % | ||||
Performance data represent past performance, which does not guarantee future results. Investment return and principal value will fluctuate, and you may have a gain or loss when you sell your shares. Current performance may differ from figures shown. For most recent month-end performance, go to franklintempleton.com or call (800) 342-5236.
8 | Annual Report
franklintempleton.com
FRANKLIN PELAGOS COMMODITIES STRATEGY FUND
PERFORMANCE SUMMARY
Total Return Index Comparison for a Hypothetical $10,000 Investment1
Total return represents the change in value of an investment over the periods shown. It includes any applicable maximum sales charge, Fund expenses, account fees and reinvested distributions. The unmanaged index includes reinvestment of any income or distributions. It differs from the Fund in composition and does not pay management fees or expenses. One cannot invest directly in an index.
franklintempleton.com
Annual Report
| 9
FRANKLIN PELAGOS COMMODITIES STRATEGY FUND
PERFORMANCE SUMMARY
Total Return Index Comparison for a Hypothetical $10,000 Investment1 (continued)
10 | Annual Report
franklintempleton.com
FRANKLIN PELAGOS COMMODITIES STRATEGY FUND
PERFORMANCE SUMMARY
Total Return Index Comparison for a Hypothetical $10,000 Investment1 (continued)
All investments involve risks, including possible loss of principal. Investing in physical commodities, either directly or through complex instruments such as commodity-linked total return swaps, commodity futures, commodity index futures and options on commodities and commodities index futures, presents unique risks, is speculative and can be extremely volatile. Market prices of commodities may fluctuate rapidly based on numerous factors, including: changes in supply and demand relationships; weather; agriculture; trade; domestic and foreign political and economic events and policies; diseases; pestilence; technological developments; and monetary and other governmental policies, action and inaction. Derivatives instruments involve costs and can create economic leverage in the Fund’s portfolio, which may result in significant volatility and cause the Fund to participate in losses (as well as gains) in an amount that significantly exceeds the Fund’s initial investment. The Fund may not achieve the anticipated benefits and may realize losses when a counterparty fails to perform as promised. Bond prices generally move in the opposite direction of interest rates. Thus, as prices of bonds in the Fund adjust to a rise in interest rates, the Fund’s share price may decline. Foreign investing carries additional risks such as currency and market volatility and political, social and economic instability, risks that are heightened in less developed or emerging market countries. The Fund is actively managed but there is no guarantee that the manager’s investment decisions will produce the desired results. The Fund’s prospectus also includes a description of the main investment risks.
Class C: Class R: Class R6: Advisor Class: | These shares have higher annual fees and expenses than Class A shares. Shares are available to certain eligible investors as described in the prospectus. These shares have higher annual fees and expenses than Class A shares. Shares are available to certain eligible investors as described in the prospectus. Shares are available to certain eligible investors as described in the prospectus. |
1. The Fund has an expense reduction contractually guaranteed through at least 9/30/15, a fee waiver related to the management fee paid by a subsidiary and a fee waiver
associated with any investment in a Franklin Templeton money fund, contractually guaranteed through at least its current fiscal year-end. Fund investment results reflect the
expense reduction and fee waivers, to the extent applicable; without these reductions, the results would have been lower.
2. Cumulative total return represents the change in value of an investment over the periods indicated.
3. Average annual total return represents the average annual change in value of an investment over the periods indicated.
4. These figures represent the value of a hypothetical $10,000 investment in the Fund over the periods indicated.
5. In accordance with SEC rules, we provide standardized average annual total return information through the latest calendar quarter.
6. Figures are as stated in the Fund’s current prospectus. In periods of market volatility, assets may decline significantly, causing total annual Fund operating expenses to
become higher than the figures shown.
7. Source: Morningstar. The Bloomberg Commodity Index comprises exchange-traded futures on physical commodities, which are weighted to account for economic
significance and market liquidity.
See www.franklintempletondatasources.com for additional data provider information.
franklintempleton.com
Annual Report
| 11
FRANKLIN PELAGOS COMMODITIES STRATEGY FUND
Your Fund’s Expenses
As a Fund shareholder, you can incur two types of costs:
- Transaction costs, including sales charges (loads) on Fund purchases; and
- Ongoing Fund costs, including management fees, distribu- tion and service (12b-1) fees, and other Fund expenses. All mutual funds have ongoing costs, sometimes referred to as operating expenses.
The following table shows ongoing costs of investing in the Fund and can help you understand these costs and compare them with those of other mutual funds. The table assumes a $1,000 investment held for the six months indicated.
Actual Fund Expenses
The first line (Actual) for each share class listed in the table provides actual account values and expenses. The “Ending Account Value” is derived from the Fund’s actual return, which includes the effect of Fund expenses.
You can estimate the expenses you paid during the period by following these steps. Of course, your account value and expenses will differ from those in this illustration:
| 1. | Divide your account value by $1,000. |
| If an account had an $8,600 value, then $8,600 ÷ $1,000 = 8.6. | |
| 2. | Multiply the result by the number under the heading “Expenses Paid During Period.” |
| If Expenses Paid During Period were $7.50, then 8.6 x $7.50 = $64.50. |
In this illustration, the estimated expenses paid this period are $64.50.
Hypothetical Example for Comparison with Other Funds
Information in the second line (Hypothetical) for each class in the table can help you compare ongoing costs of investing in the Fund with those of other mutual funds. This information may not be used to estimate the actual ending account balance or expenses you paid during the period. The hypothetical “Ending Account Value” is based on the actual expense ratio for each class and an assumed 5% annual rate of return before expenses, which does not represent the Fund’s actual return. The figure under the heading “Expenses Paid During Period” shows the hypothetical expenses your account would have incurred under this scenario. You can compare this figure with the 5% hypothetical examples that appear in shareholder reports of other funds.
Please note that expenses shown in the table are meant to highlight ongoing costs and do not reflect any transaction costs, such as sales charges. Therefore, the second line for each class is useful in comparing ongoing costs only, and will not help you compare total costs of owning different funds. In addition, if transaction costs were included, your total costs would have been higher. Please refer to the Fund prospectus for additional information on operating expenses.
12 | Annual Report
franklintempleton.com
FRANKLIN PELAGOS COMMODITIES STRATEGY FUND
YOUR FUND’S EXPENSES
| Beginning Account | Ending Account | Expenses Paid During | ||||
| Share Class | Value 12/1/14 | Value 5/31/15 | Period* 12/1/14–5/31/15 | |||
| A | ||||||
| Actual | $ | 1,000 | $ | 888.90 | $ | 5.89 |
| Hypothetical (5% return before expenses) | $ | 1,000 | $ | 1,018.70 | $ | 6.29 |
| C | ||||||
| Actual | $ | 1,000 | $ | 885.50 | $ | 9.17 |
| Hypothetical (5% return before expenses) | $ | 1,000 | $ | 1,015.21 | $ | 9.80 |
| R | ||||||
| Actual | $ | 1,000 | $ | 888.60 | $ | 6.83 |
| Hypothetical (5% return before expenses) | $ | 1,000 | $ | 1,017.70 | $ | 7.29 |
| R6 | ||||||
| Actual | $ | 1,000 | $ | 890.50 | $ | 4.05 |
| Hypothetical (5% return before expenses) | $ | 1,000 | $ | 1,020.64 | $ | 4.33 |
| Advisor | ||||||
| Actual | $ | 1,000 | $ | 890.70 | $ | 4.48 |
| Hypothetical (5% return before expenses) | $ | 1,000 | $ | 1,020.19 | $ | 4.78 |
*Expenses are calculated using the most recent six-month expense ratio, net of expense waivers, annualized for each class (A: 1.25%; C: 1.95%;
R: 1.45%; R6: 0.86%; and Advisor: 0.95%), multiplied by the average account value over the period, multiplied by 182/365 to reflect the one-half
year period.
franklintempleton.com
Annual Report
| 13
| FRANKLIN ALTERNATIVE STRATEGIES FUNDS | ||||||
| Consolidated Financial Highlights | ||||||
| Franklin Pelagos Commodities Strategy Fund | ||||||
| Year Ended May 31, | ||||||
| 2015 | 2014 | a | ||||
| Class A | ||||||
| Per share operating performance | ||||||
| (for a share outstanding throughout the year) | ||||||
| Net asset value, beginning of year | $ | 9.44 | $ | 8.88 | ||
| Income from investment operationsb: | ||||||
| Net investment income (loss)c | (0.09 | ) | (0.08 | ) | ||
| Net realized and unrealized gains (losses) | (2.23 | ) | 0.64 | |||
| Total from investment operations | (2.32 | ) | 0.56 | |||
| Net asset value, end of year | $ | 7.12 | $ | 9.44 | ||
| Total returnd | (24.58 | )% | 6.31 | % | ||
| Ratios to average net assetse | ||||||
| Expenses before waiver, payments by affiliates and expense reduction | 2.05 | % | 3.38 | % | ||
| Expenses net of waiver, payments by affiliates and expense reductionf | 1.25 | % | 1.25 | % | ||
| Net investment income (loss) | (0.94 | )% | (0.94 | )% | ||
| Supplemental data | ||||||
| Net assets, end of year (000’s) | $ | 2,080 | $ | 601 | ||
| Portfolio turnover rate | 62.10 | % | 34.28 | % | ||
aFor the period January 10, 2014 (commencement of operations) to May 31, 2014.
bThe amount shown for a share outstanding throughout the period may not correlate with the Consolidated Statement of Operations for the period due to the timing of sales
and repurchases of the Fund’s shares in relation to income earned and/or fluctuating fair value of the investments of the Fund.
cBased on average daily shares outstanding.
dTotal return does not reflect sales commissions or contingent deferred sales charges, if applicable, and is not annualized for periods less than one year.
eRatios are annualized for periods less than one year.
fBenefit of expense reduction rounds to less than 0.01%.
14 | Annual Report | The accompanying notes are an integral part of these consolidated financial statements. franklintempleton.com
FRANKLIN ALTERNATIVE STRATEGIES FUNDS
CONSOLIDATED FINANCIAL HIGHLIGHTS
| Franklin Pelagos Commodities Strategy Fund (continued) | ||||||
| Year Ended May 31, | ||||||
| 2015 | 2014 | a | ||||
| Class C | ||||||
| Per share operating performance | ||||||
| (for a share outstanding throughout the year) | ||||||
| Net asset value, beginning of year | $ | 9.41 | $ | 8.88 | ||
| Income from investment operationsb: | ||||||
| Net investment income (loss)c | (0.15 | ) | (0.09 | ) | ||
| Net realized and unrealized gains (losses) | (2.21 | ) | 0.62 | |||
| Total from investment operations | (2.36 | ) | 0.53 | |||
| Net asset value, end of year | $ | 7.05 | $ | 9.41 | ||
| Total returnd | (25.08 | )% | 5.97 | % | ||
| Ratios to average net assetse | ||||||
| Expenses before waiver, payments by affiliates and expense reduction | 2.75 | % | 4.08 | % | ||
| Expenses net of waiver, payments by affiliates and expense reductionf | 1.95 | % | 1.95 | % | ||
| Net investment income (loss) | (1.64 | )% | (1.64 | )% | ||
| Supplemental data | ||||||
| Net assets, end of year (000’s) | $ | 377 | $ | 60 | ||
| Portfolio turnover rate | 62.10 | % | 34.28 | % | ||
aFor the period January 10, 2014 (commencement of operations) to May 31, 2014.
bThe amount shown for a share outstanding throughout the period may not correlate with the Consolidated Statement of Operations for the period due to the timing of sales
and repurchases of the Fund’s shares in relation to income earned and/or fluctuating fair value of the investments of the Fund.
cBased on average daily shares outstanding.
dTotal return does not reflect sales commissions or contingent deferred sales charges, if applicable, and is not annualized for periods less than one year.
eRatios are annualized for periods less than one year.
fBenefit of expense reduction rounds to less than 0.01%.
franklintempleton.com The accompanying notes are an integral part of these consolidated financial statements. | Annual Report | 15
FRANKLIN ALTERNATIVE STRATEGIES FUNDS
CONSOLIDATED FINANCIAL HIGHLIGHTS
| Franklin Pelagos Commodities Strategy Fund (continued) | ||||||
| Year Ended May 31, | ||||||
| 2015 | 2014 | a | ||||
| Class R | ||||||
| Per share operating performance | ||||||
| (for a share outstanding throughout the year) | ||||||
| Net asset value, beginning of year | $ | 9.44 | $ | 8.88 | ||
| Income from investment operationsb: | ||||||
| Net investment income (loss)c | (0.10 | ) | (0.06 | ) | ||
| Net realized and unrealized gains (losses) | (2.24 | ) | 0.62 | |||
| Total from investment operations | (2.34 | ) | 0.56 | |||
| Net asset value, end of year | $ | 7.10 | $ | 9.44 | ||
| Total returnd | (24.79 | )% | 6.31 | % | ||
| Ratios to average net assetse | ||||||
| Expenses before waiver, payments by affiliates and expense reduction | 2.27 | % | 3.58 | % | ||
| Expenses net of waiver, payments by affiliates and expense reductionf | 1.47 | % | 1.45 | % | ||
| Net investment income (loss) | (1.16 | )% | (1.14 | )% | ||
| Supplemental data | ||||||
| Net assets, end of year (000’s) | $ | 4 | $ | 5 | ||
| Portfolio turnover rate | 62.10 | % | 34.28 | % | ||
aFor the period January 10, 2014 (commencement of operations) to May 31, 2014.
bThe amount shown for a share outstanding throughout the period may not correlate with the Consolidated Statement of Operations for the period due to the timing of sales
and repurchases of the Fund’s shares in relation to income earned and/or fluctuating fair value of the investments of the Fund.
cBased on average daily shares outstanding.
dTotal return is not annualized for periods less than one year.
eRatios are annualized for periods less than one year.
fBenefit of expense reduction rounds to less than 0.01%.
16 | Annual Report | The accompanying notes are an integral part of these consolidated financial statements. franklintempleton.com
| FRANKLIN ALTERNATIVE STRATEGIES FUNDS | ||||||
| CONSOLIDATED FINANCIAL HIGHLIGHTS | ||||||
| Franklin Pelagos Commodities Strategy Fund (continued) | ||||||
| Year Ended May 31, | ||||||
| 2015 | 2014 | a | ||||
| Class R6 | ||||||
| Per share operating performance | ||||||
| (for a share outstanding throughout the year) | ||||||
| Net asset value, beginning of year | $ | 9.46 | $ | 8.88 | ||
| Income from investment operationsb: | ||||||
| Net investment income (loss)c | (0.04 | ) | (0.03 | ) | ||
| Net realized and unrealized gains (losses) | (2.26 | ) | 0.61 | |||
| Total from investment operations | (2.30 | ) | 0.58 | |||
| Net asset value, end of year | $ | 7.16 | $ | 9.46 | ||
| Total returnd | (24.31 | )% | 6.53 | % | ||
| Ratios to average net assetse | ||||||
| Expenses before waiver, payments by affiliates and expense reduction | 1.53 | % | 1.58 | % | ||
| Expenses net of waiver, payments by affiliates and expense reductionf | 0.86 | % | 0.86 | % | ||
| Net investment income (loss) | (0.55 | )% | (0.55 | )% | ||
| Supplemental data | ||||||
| Net assets, end of year (000’s) | $ | 53,068 | $ | 67,732 | ||
| Portfolio turnover rate | 62.10 | % | 34.28 | % | ||
aFor the period January 10, 2014 (commencement of operations) to May 31, 2014.
bThe amount shown for a share outstanding throughout the period may not correlate with the Consolidated Statement of Operations for the period due to the timing of sales
and repurchases of the Fund’s shares in relation to income earned and/or fluctuating fair value of the investments of the Fund.
cBased on average daily shares outstanding.
dTotal return is not annualized for periods less than one year.
eRatios are annualized for periods less than one year.
fBenefit of expense reduction rounds to less than 0.01%.
franklintempleton.com The accompanying notes are an integral part of these consolidated financial statements. | Annual Report | 17
FRANKLIN ALTERNATIVE STRATEGIES FUNDS
CONSOLIDATED FINANCIAL HIGHLIGHTS
| Franklin Pelagos Commodities Strategy Fund (continued) | ||||||||||||
| Year Ended May 31, | ||||||||||||
| 2015 | 2014 | 2013 | 2012 | a | ||||||||
| Advisor Class | ||||||||||||
| Per share operating performance | ||||||||||||
| (for a share outstanding throughout the year) | ||||||||||||
| Net asset value, beginning of year | $ | 9.58 | $ | 9.43 | $ | 9.15 | $ | 10.00 | ||||
| Income from investment operationsb: | ||||||||||||
| Net investment income (loss)c | (0.07 | ) | (0.05 | ) | (0.08 | ) | (0.05 | ) | ||||
| Net realized and unrealized gains (losses) | (2.26 | ) | 0.20 | 0.36 | (0.80 | ) | ||||||
| Total from investment operations | (2.33 | ) | 0.15 | 0.28 | (0.85 | ) | ||||||
| Less distributions from net investment income | — | — | (—)d | — | ||||||||
| Net asset value, end of year | $ | 7.25 | $ | 9.58 | $ | 9.43 | $ | 9.15 | ||||
| Total returne | (24.32 | )% | 1.59 | % | 3.06 | % | (8.50 | )% | ||||
| Ratios to average net assetsf | ||||||||||||
| Expenses before waiver, payments by affiliates and expense reduction | 1.75 | % | 1.88 | % | 1.14 | % | 5.08 | % | ||||
| Expenses net of waiver, payments by affiliates and expense reduction | 0.95 | %g | 1.04 | %g | 1.10 | % | 1.10 | % | ||||
| Net investment income (loss) | (0.64 | )% | (0.70 | )% | (0.76 | )% | (1.07 | )% | ||||
| Supplemental data | ||||||||||||
| Net assets, end of year (000’s) | $ | 248 | $ | 126 | $ | 107,853 | $ | 14,374 | ||||
| Portfolio turnover rate | 62.10 | % | 34.28 | % | 21.47 | % | —%h | |||||
aFor the period December 7, 2011 (commencement of operations) to May 31, 2012.
bThe amount shown for a share outstanding throughout the period may not correlate with the Consolidated Statement of Operations for the period due to the timing of sales
and repurchases of the Fund’s shares in relation to income earned and/or fluctuating fair value of the investments of the Fund.
cBased on average daily shares outstanding.
dAmount rounds to less than $0.01 per share.
eTotal return is not annualized for periods less than one year.
fRatios are annualized for periods less than one year.
gBenefit of expense reduction rounds to less than 0.01%.
hFor the period there were no purchases or sales of investments (other than short term securities).
18 | Annual Report | The accompanying notes are an integral part of these consolidated financial statements. franklintempleton.com
FRANKLIN ALTERNATIVE STRATEGIES FUNDS
| Consolidated Statement of Investments, May 31, 2015 | |||||
| Franklin Pelagos Commodities Strategy Fund | |||||
| Principal | |||||
| Amount | Value | ||||
| U.S. Government and Agency Securities 51.8% | |||||
| FFCB, 0.89%, 10/23/17 | $ | 18,000,000 | $ | 17,977,860 | |
| U.S. Treasury Notes, 0.25%, 2/29/16 | 11,000,000 | 10,928,757 | |||
| Total U.S. Government and Agency Securities (Cost $28,995,431) | 28,906,617 | ||||
| Number of | |||||
| Contracts | |||||
| Options Purchased (Cost $76,609) 0.0%† | |||||
| Puts — Exchange-Traded | |||||
| aWTI Crude Oil Future, June Strike Price $35, Expires 6/17/15 | 205 | 2,050 | |||
| Total Investments before Short Term Investments (Cost $29,072,040) | 28,908,667 | ||||
| Principal | |||||
| Amount | |||||
| Short Term Investments 49.7% | |||||
| U.S. Government and Agency Securities 48.3% | |||||
| aFHLB, 6/01/15 | $ | 320,000 | 320,000 | ||
| bU.S. Treasury Bills, | |||||
| a,c6/25/15 | 10,900,000 | 10,899,967 | |||
| 7/23/15 | 11,200,000 | 11,200,000 | |||
| 2/04/16 | 1,500,000 | 1,498,760 | |||
| a3/03/16 | 3,000,000 | 2,996,031 | |||
| Total U.S. Government and Agency Securities (Cost $26,911,507) | 26,914,758 | ||||
| Shares | |||||
| Money Market Funds (Cost $787,280) 1.4% | |||||
| d,eInstitutional Fiduciary Trust Money Market Portfolio | 787,280 | 787,280 | |||
| Total Investments (Cost $56,770,827) 101.5% | 56,610,705 | ||||
| fOther Assets, less Liabilities (1.5)% | (834,438 | ) | |||
| Net Assets 100.0% | $ | 55,776,267 | |||
†Rounds to less than 0.1% of net assets.
aA portion or all of the security is owned by FPC Holdings Corp., a wholly-owned subsidiary of the Fund. See Note 1(c).
bThe security is traded on a discount basis with no stated coupon rate.
cSecurity or a portion of the security has been pledged as collateral for open futures contracts. At May 31, 2015, the value of this security and/or cash pledged as collateral
was $1,664,983, representing 2.99% of net assets.
dNon-income producing.
eSee Note 3(f) regarding investments in Institutional Fiduciary Trust Money Market Portfolio.
fIncludes unrealized appreciation/depreciation on open commodity futures and swap contracts, as well as other assets and liabilities.
franklintempleton.com
Annual Report
| 19
| FRANKLIN ALTERNATIVE STRATEGIES FUNDS | |||||||||||||
| CONSOLIDATED STATEMENT OF INVESTMENTS | |||||||||||||
| Franklin Pelagos Commodities Strategy Fund (continued) | |||||||||||||
| At May 31, 2015, the Fund had the following futures contracts outstanding. See Note 1(b). | |||||||||||||
| Futures Contractsa | |||||||||||||
| Number of | Notional | Expiration | Unrealized | Unrealized | |||||||||
| Description | Type | Contracts | Value | Date | Appreciation | Depreciation | |||||||
| Commodity Contracts | |||||||||||||
| Gold | Long | 31 | $ | 3,688,380 | 8/27/15 | $ | 2,384 | $ | — | ||||
| Live Cattle | Long | 26 | 1,573,260 | 8/31/15 | — | (18,551 | ) | ||||||
| Silver | Long | 27 | 2,254,635 | 7/29/15 | 6,126 | — | |||||||
| Sugar | Long | 202 | 2,710,355 | 6/30/15 | 5,457 | — | |||||||
| Totals | $ | 10,226,630 | $ | 13,967 | $ | (18,551 | ) | ||||||
| Net unrealized appreciation (depreciation) | $ | (4,584 | ) | ||||||||||
| At May 31, 2015, the Fund had the following commodity-linked total return swap contracts outstanding. See Note 1(b). | |||||||||||||
| Commodity-Linked Total Return Swap Contractsa | |||||||||||||
| Pays | Notional | Expiration | Unrealized | Unrealized | |||||||||
| Underlying Instrument | Fixed Rate | Counterparty | Value | Date | Appreciation | Depreciation | |||||||
| OTC Swap Contracts | |||||||||||||
| Long | |||||||||||||
| FP Custom Master Indexb | 0.22 | % | MSCS | $ | 45,013,693 | 7/1/15 | $ | 613,693 | $ | — | |||
| Net unrealized appreciation (depreciation) | $ | 613,693 | |||||||||||
aA portion or all of the contract is owned by FPC Holdings Corp., a wholly-owned subsidiary of the Fund. See Note 1(c).
bRepresents a custom index comprised of a basket of underlying instruments. Additional information regarding the custom basket’s underlying instruments and their
respective values and fees are as follows:
| Notional | Unrealized | Unrealized | |||||
| Underlying Instruments | Valuec | Appreciation | Depreciation | ||||
| Bloomberg Commodity Copper Subindex | $ | 4,276,301 | $ | — | $ | (60,279 | ) |
| Bloomberg Commodity Gold Subindex | 7,292,218 | 5,920 | — | ||||
| Bloomberg Commodity Heating Oil Subindex 3 Month Forward | 5,266,602 | 198,968 | — | ||||
| Bloomberg Commodity Live Cattle Subindex | 1,710,520 | — | (16,324 | ) | |||
| Bloomberg Commodity Natural Gas Subindex 3 Month Forward | 4,906,493 | — | (100,559 | ) | |||
| Bloomberg Commodity Soybean Meal Subindex | 3,060,931 | 8,860 | — | ||||
| Bloomberg Commodity Soybean Oil Subindex | 2,655,808 | 103,720 | — | ||||
| Bloomberg Commodity Soybeans Subindex | 3,961,205 | 33,685 | — | ||||
| Bloomberg Commodity Sugar Subindex | 1,800,548 | 5,917 | — | ||||
| Bloomberg Commodity WTI Crude Oil Subindex 3 Month Forward | 10,083,067 | 433,785 | — | ||||
| Total custom index | $ | 45,013,693 | $ | 790,855 | $ | (177,162 | ) |
| Net unrealized appreciation (depreciation) | $ | 613,693 |
cNotional value represents the fair value of each underlying instrument (including the financing rate fee which is calculated based on the custom swap contract's original
notional value of $45,013,693, allocated to each underlying instrument on a pro-rata basis).
See Abbreviations on page 34.
20 | Annual Report | The accompanying notes are an integral part of these consolidated financial statements. franklintempleton.com
FRANKLIN ALTERNATIVE STRATEGIES FUNDS
Consolidated Financial Statements
Consolidated Statement of Assets and Liabilities
May 31, 2015
| Franklin Pelagos Commodities Strategy Fund | |||
| Assets: | |||
| Investments in securities: | |||
| Cost - Unaffiliated issuers | $ | 55,983,547 | |
| Cost - Sweep Money Fund (Note 3f) | 787,280 | ||
| Total cost of investments | $ | 56,770,827 | |
| Value - Unaffiliated issuers | $ | 55,823,425 | |
| Value - Sweep Money Fund (Note 3f) | 787,280 | ||
| Total value of investments | 56,610,705 | ||
| Cash | 157,937 | ||
| Receivables: | |||
| Capital shares sold | 10,512 | ||
| Interest | 23,340 | ||
| Affiliates | 3,243 | ||
| Variation margin | 1,135 | ||
| Unrealized appreciation on OTC swap contracts | 613,693 | ||
| Other assets | 20 | ||
| Total assets | 57,420,585 | ||
| Liabilities: | |||
| Payables: | |||
| Capital shares redeemed | 7,510 | ||
| Management fees | 5,260 | ||
| Distribution fees | 853 | ||
| Due to brokers | 1,577,006 | ||
| Accrued expenses and other liabilities | 53,689 | ||
| Total liabilities | 1,644,318 | ||
| Net assets, at value | $ | 55,776,267 | |
| Net assets consist of: | |||
| Paid-in capital | $ | 55,613,970 | |
| Accumulated net investment loss | (98,308 | ) | |
| Net unrealized appreciation (depreciation) | 448,987 | ||
| Accumulated net realized gain (loss) | (188,382 | ) | |
| Net assets, at value | $ | 55,776,267 | |
franklintempleton.com The accompanying notes are an integral part of these consolidated financial statements. | Annual Report | 21
| FRANKLIN ALTERNATIVE STRATEGIES FUNDS | ||
| CONSOLIDATED FINANCIAL STATEMENTS | ||
| Consolidated Statement of Assets and Liabilities (continued) | ||
| May 31, 2015 | ||
| Franklin Pelagos Commodities Strategy Fund | ||
| Class A: | ||
| Net assets, at value | $ | 2,079,673 |
| Shares outstanding | 291,956 | |
| Net asset value per sharea | $ | 7.12 |
| Maximum offering price per share (net asset value per share ÷ 94.25%) | $ | 7.55 |
| Class C: | ||
| Net assets, at value | $ | 376,704 |
| Shares outstanding | 53,465 | |
| Net asset value and maximum offering price per sharea | $ | 7.05 |
| Class R: | ||
| Net assets, at value | $ | 4,000 |
| Shares outstanding | 563 | |
| Net asset value and maximum offering price per share | $ | 7.10 |
| Class R6: | ||
| Net assets, at value | $ | 53,068,059 |
| Shares outstanding | 7,411,482 | |
| Net asset value and maximum offering price per share | $ | 7.16 |
| Advisor Class: | ||
| Net assets, at value | $ | 247,831 |
| Shares outstanding | 34,194 | |
| Net asset value and maximum offering price per share | $ | 7.25 |
| aRedemption price is equal to net asset value less contingent deferred sales charges, if applicable. | |
| 22 | Annual Report | The accompanying notes are an integral part of these consolidated financial statements. | franklintempleton.com |
FRANKLIN ALTERNATIVE STRATEGIES FUNDS
CONSOLIDATED FINANCIAL STATEMENTS
Consolidated Statement of Operations
for the year ended May 31, 2015
| Franklin Pelagos Commodities Strategy Fund | |||
| Investment income: | |||
| Interest | $ | 187,548 | |
| Expenses: | |||
| Management fees (Note 3a) | 519,807 | ||
| Distribution fees: (Note 3c) | |||
| Class A | 3,778 | ||
| Class C | 1,622 | ||
| Class R | 24 | ||
| Transfer agent fees: (Note 3e) | |||
| Class A | 2,781 | ||
| Class C | 350 | ||
| Class R | 10 | ||
| Class R6 | 2,812 | ||
| Advisor Class | 339 | ||
| Custodian fees (Note 4) | 711 | ||
| Reports to shareholders | 19,002 | ||
| Registration and filing fees | 75,719 | ||
| Professional fees | 84,562 | ||
| Trustees' fees and expenses | 60,311 | ||
| Amortization of offering costs | 168,415 | ||
| Other | 5,694 | ||
| Total expenses | 945,937 | ||
| Expense reductions (Note 4) | (130 | ) | |
| Expenses waived/paid by affiliates (Notes 3f and 3g) | (410,612 | ) | |
| Net expenses | 535,195 | ||
| Net investment income (loss) | (347,647 | ) | |
| Realized and unrealized gains (losses): | |||
| Net realized gain (loss) from: | |||
| Investments | (9,497 | ) | |
| Written options | (21,720 | ) | |
| Futures contracts | (3,149,212 | ) | |
| Swap contracts | (14,649,254 | ) | |
| Net realized gain (loss) | (17,829,683 | ) | |
| Net change in unrealized appreciation (depreciation) on: | |||
| Investments | (153,728 | ) | |
| Futures contracts | 70,720 | ||
| Swap contracts | 985,661 | ||
| Net change in unrealized appreciation (depreciation) | 902,653 | ||
| Net realized and unrealized gain (loss) | (16,927,030 | ) | |
| Net increase (decrease) in net assets resulting from operations | $ | (17,274,677 | ) |
franklintempleton.com The accompanying notes are an integral part of these consolidated financial statements. | Annual Report | 23
| FRANKLIN ALTERNATIVE STRATEGIES FUNDS | ||||||
| CONSOLIDATED FINANCIAL STATEMENTS | ||||||
| Consolidated Statements of Changes in Net Assets | ||||||
| Franklin Pelagos Commodities Strategy Fund | ||||||
| Year Ended May 31, | ||||||
| 2015 | 2014 | |||||
| Increase (decrease) in net assets: | ||||||
| Operations: | ||||||
| Net investment income (loss) | $ | (347,647 | ) | $ | (607,541 | ) |
| Net realized gain (loss) | (17,829,683 | ) | (1,896,955 | ) | ||
| Net change in unrealized appreciation (depreciation) | 902,653 | 812,201 | ||||
| Net increase (decrease) in net assets resulting from operations | (17,274,677 | ) | (1,692,295 | ) | ||
| Capital share transactions: (Note 2) | ||||||
| Class A | 1,790,679 | 603,708 | ||||
| Class C | 355,889 | 60,381 | ||||
| Class R | — | 5,000 | ||||
| Class R6 | 2,216,679 | 63,196,459 | ||||
| Advisor Class | 163,257 | (101,501,673 | ) | |||
| Total capital share transactions | 4,526,504 | (37,636,125 | ) | |||
| Net increase (decrease) in net assets | (12,748,173 | ) | (39,328,420 | ) | ||
| Net assets: | ||||||
| Beginning of year | 68,524,440 | 107,852,860 | ||||
| End of year | $ | 55,776,267 | $ | 68,524,440 | ||
| Accumulated net investment loss included in net assets: | ||||||
| End of year | $ | (98,308 | ) | $ | (669,898 | ) |
24 | Annual Report | The accompanying notes are an integral part of these consolidated financial statements. franklintempleton.com
FRANKLIN ALTERNATIVE STRATEGIES FUNDS
Notes to Consolidated Financial Statements
Franklin Pelagos Commodities Strategy Fund
1. Organization and Significant Accounting Policies
Franklin Alternative Strategies Funds (Trust) is registered under the Investment Company Act of 1940 (1940 Act) as an open-end management investment company, consisting of two separate funds and applies the specialized accounting and reporting guidance in U.S. Generally Accepted Accounting Principles (U.S. GAAP). Franklin Pelagos Commodities Strategy Fund (Fund) is included in this report. The financial statements of the remaining fund in the Trust is presented separately. The Fund offers five classes of shares: Class A, Class C, Class R, Class R6 and Advisor Class. Each class of shares differs by its initial sales load, contingent deferred sales charges, voting rights on matters affecting a single class, its exchange privilege and fees primarily due to differing arrangements for distribution and transfer agent fees.
The following summarizes the Fund’s significant accounting policies.
a. Financial Instrument Valuation
The Fund’s investments in financial instruments are carried at fair value daily. Fair value is the price that would be received to sell an asset or paid to transfer a liability in an orderly transaction between market participants on the measurement date. The Fund calculates the net asset value (NAV) per share at the close of the New York Stock Exchange (NYSE), generally at 4 p.m. Eastern time (NYSE close) on each day the NYSE is open for trading. Under compliance policies and procedures approved by the Trust’s Board of Trustees (the Board), the Fund’s administrator has responsibility for oversight of valuation, including leading the cross-functional Valuation and Liquidity Oversight Committee (VLOC). The VLOC provides administration and oversight of the Fund’s valuation policies and procedures, which are approved annually by the Board. Among other things, these procedures allow the Fund to utilize independent pricing services, quotations from securities and financial instrument dealers, and other market sources to determine fair value.
Debt securities generally trade in the over-the-counter (OTC) market rather than on a securities exchange. The Fund’s pricing services use multiple valuation techniques to determine fair value. In instances where sufficient market activity exists, the pricing services may utilize a market-based approach through which quotes from market makers are used to determine fair value. In instances where sufficient market activity may not exist or is limited, the pricing services also utilize proprietary valuation models which may consider market characteristics such as benchmark yield curves, credit spreads, estimated default rates, anticipated market interest rate volatility, coupon rates, anticipated timing of principal repayments, underlying collateral, and other unique security features in order to estimate the relevant cash flows, which are then discounted to calculate the fair value. Investments in open-end mutual funds are valued at the closing NAV.
Derivative financial instruments (derivatives) listed on an exchange are valued at the official closing price of the day. Certain derivatives trade in the OTC market. The Fund’s pricing services use various techniques including industry standard option pricing models and proprietary discounted cash flow models to determine the fair value of those instruments. The Fund’s net benefit or obligation under the derivative contract, as measured by the fair value of the contract, is included in net assets.
The Fund has procedures to determine the fair value of financial instruments for which market prices are not reliable or readily available. Under these procedures, the VLOC convenes on a regular basis to review such financial instruments and considers a number of factors, including significant unobservable valuation inputs, when arriving at fair value. The VLOC primarily employs a market-based approach which may use related or comparable assets or liabilities, recent transactions, market multiples, book values, and other relevant information for the investment to determine the fair value of the investment. An income-based valuation approach may also be used in which the anticipated future cash flows of the investment are discounted to calculate fair value. Discounts may also be applied due to the nature or duration of any restrictions on the disposition of the investments. Due to the inherent uncertainty of valuations of such investments, the fair values may differ significantly from the values that would have been used had an active market existed. The VLOC employs various methods for calibrating these valuation approaches including a regular review of key inputs and assumptions, transactional back-testing or disposition analysis, and reviews of any related market activity.
b. Derivative Financial Instruments
The Fund invested in derivatives in order to manage risk or gain exposure to various other investments or markets. Derivatives are financial contracts based on an underlying or notional amount, require no initial investment or an initial net investment that is smaller than would normally be required to
franklintempleton.com
Annual Report
| 25
FRANKLIN ALTERNATIVE STRATEGIES FUNDS
NOTES TO CONSOLIDATED FINANCIAL STATEMENTS
Franklin Pelagos Commodities Strategy Fund (continued)
1. Organization and Significant Accounting
Policies (continued)
b. Derivative Financial Instruments (continued)
have a similar response to changes in market factors, and require or permit net settlement. Derivatives contain various risks including the potential inability of the counterparty to fulfill their obligations under the terms of the contract, the potential for an illiquid secondary market, and/or the potential for market movements which expose the Fund to gains or losses in excess of the amounts shown in the Consolidated Statement of Assets and Liabilities. Realized gain and loss and unrealized appreciation and depreciation on these contracts for the period are included in the Consolidated Statement of Operations.
Derivative counterparty credit risk is managed through a formal evaluation of the creditworthiness of all potential counterparties. The Fund attempts to reduce its exposure to counterparty credit risk on OTC derivatives, whenever possible, by entering into International Swaps and Derivatives Association (ISDA) master agreements with certain counterparties. These agreements contain various provisions, including but not limited to collateral requirements, events of default, or early termination. Termination events applicable to the counterparty include certain deteriorations in the credit quality of the counterparty. Termination events applicable to the Fund include failure of the Fund to maintain certain net asset levels and/or limit the decline in net assets over various periods of time. In the event of default or early termination, the ISDA master agreement gives the non-defaulting party the right to net and close-out all transactions traded, whether or not arising under the ISDA agreement, to one net amount payable by one counterparty to the other. However, absent an event of default or early termination, OTC derivative assets and liabilities are presented gross and not offset in the Consolidated Statement of Assets and Liabilities. Early termination by the counterparty may result in an immediate payment by the Fund of any net liability owed to that counterparty under the ISDA agreement.
Collateral requirements differ by type of derivative. Collateral or initial margin requirements are set by the broker or exchange clearing house for exchange traded and centrally cleared derivatives. Initial margin deposited is held at the exchange and can be in the form of cash and/or securities. For OTC derivatives traded under an ISDA master agreement, posting of collateral is required by either the Fund or the applicable counterparty if the total net exposure of all OTC derivatives with the applicable counterparty exceeds the minimum transfer amount, which typically ranges from $100,000 to $250,000, and can vary depending on the counterparty and the type of the agreement. Generally, collateral is determined at the close of fund business each day and any additional collateral required due to changes in derivative values may be delivered by the Fund or the coun-terparty within a few business days. Collateral pledged and/or received by the Fund for OTC derivatives, if any, is held in segregated accounts with the Fund’s custodian/counterparty broker and can be in the form of cash and/or securities. Unrestricted cash may be invested according to the Fund’s investment objectives.
The Fund entered into exchange traded futures contracts primarily to gain exposure to commodity price risk. A futures contract is an agreement between the Fund and a counterparty to buy or sell an asset for a specified price on a future date. Required initial margins are pledged by the Fund, and the daily change in fair value is accounted for as a variation margin payable or receivable in the Consolidated Statement of Assets and Liabilities.
The Fund entered into OTC commodity-linked total return swap contracts primarily to gain exposure to commodity price risk of an underlying instrument such as a stock, bond, index or basket of securities or indices. A total return swap is an agreement between the Fund and a counterparty to exchange a return linked to an underlying instrument for a floating or fixed rate payment, both based upon a notional amount. Over the term of the contract, contractually required payments to be paid or received are accrued daily and recorded as unrealized appreciation or depreciation until the payments are made, at which time they are recognized as realized gain or loss.
The Fund purchased or wrote exchange traded option contracts primarily to manage and/or gain exposure to commodity price risk. An option is a contract entitling the holder to purchase or sell a specific amount of shares or units of an asset or notional amount of a swap (swaption), at a specified price. When an option is purchased or written, an amount equal to the premium paid or received is recorded as an asset or liability, respectively. Upon exercise of an option, the acquisition cost or sales proceeds of the underlying investment is adjusted by any premium received or paid. Upon expiration of an option, any premium received or paid is recorded as a realized gain or loss. Upon closing an option other than through expiration or exercise, the difference between the premium received or paid and the cost to close the position is recorded as a realized gain or loss.
See Notes 6 and 7 regarding investment transactions and other derivative information, respectively.
26 | Annual Report
franklintempleton.com
FRANKLIN ALTERNATIVE STRATEGIES FUNDS
NOTES TO CONSOLIDATED FINANCIAL STATEMENTS
Franklin Pelagos Commodities Strategy Fund (continued)
c. Investments in FPC Holdings Corp. (FP Subsidiary)
The Fund invests in certain financial instruments and commodity-linked derivative investments through its investment in the FP Subsidiary. The FP Subsidiary is a Cayman Islands exempted company with limited liability, is a wholly-owned subsidiary of the Fund, and is able to invest in certain financial instruments and commodity-linked derivative investments consistent with the investment objective of the Fund. At May 31, 2015, the FP Subsidiary’s investments, as well as any other assets and liabilities of the FP Subsidiary are reflected in the Fund’s Consolidated Statement of Investments and Consolidated Statement of Assets and Liabilities. The financial statements have been consolidated and include the accounts of the Fund and the FP Subsidiary. All intercompany transactions and balances have been eliminated. At May 31, 2015, the net assets of the FP Subsidiary were $13,403,266, representing 24.03% of the Fund’s consolidated net assets. The Fund’s investment in the FP Subsidiary is limited to 25% of consolidated assets.
d. Income Taxes
It is the Fund’s policy to qualify as a regulated investment company under the Internal Revenue Code. The Fund intends to distribute to shareholders substantially all of its taxable income and net realized gains to relieve it from federal income and excise taxes. As a result, no provision for U.S. federal income taxes is required.
The Fund recognizes the tax benefits of uncertain tax positions only when the position is “more likely than not” to be sustained upon examination by the tax authorities based on the technical merits of the tax position. As of May 31, 2015, and for all open tax years, the Fund has determined that no liability for unrecognized tax benefits is required in the Fund’s consolidated financial statements related to uncertain tax positions taken on a tax return (or expected to be taken on future tax returns). Open tax years are those that remain subject to examination and are based on each tax jurisdiction’s statute of limitation.
e. Security Transactions, Investment Income, Expenses and Distributions
Security transactions are accounted for on trade date. Realized gains and losses on security transactions are determined on a specific identification basis. Interest income and estimated expenses are accrued daily. Amortization of premium and accretion of discount on debt securities are included in interest income. Distributions to shareholders are recorded on the ex-dividend date and are determined according to income tax regulations (tax basis). Distributable earnings determined on a tax basis may differ from earnings recorded in accordance with U.S. GAAP. These differences may be permanent or temporary. Permanent differences are reclassified among capital accounts to reflect their tax character. These reclassifications have no impact on net assets or the results of operations. Temporary differences are not reclassified, as they may reverse in subsequent periods.
Common expenses incurred by the Trust are allocated among the funds based on the ratio of net assets of each fund to the combined net assets of the Trust. Fund specific expenses are charged directly to the fund that incurred the expense.
Realized and unrealized gains and losses and net investment income, not including class specific expenses, are allocated daily to each class of shares based upon the relative proportion of net assets of each class. Differences in per share distributions, by class, are generally due to differences in class specific expenses.
f. Offering Costs
Offering costs are amortized on a straight line basis over twelve months.
g. Accounting Estimates
The preparation of financial statements in accordance with U.S. GAAP requires management to make estimates and assumptions that affect the reported amounts of assets and liabilities at the date of the financial statements and the amounts of income and expenses during the reporting period. Actual results could differ from those estimates.
h. Guarantees and Indemnifications
Under the Trust’s organizational documents, its officers and trustees are indemnified by the Trust against certain liabilities arising out of the performance of their duties to the Trust. Additionally, in the normal course of business, the Trust, on behalf of the Fund, enters into contracts with service providers that contain general indemnification clauses. The Trust’s maximum exposure under these arrangements is unknown as this would involve future claims that may be made against the Trust that have not yet occurred. Currently, the Trust expects the risk of loss to be remote.
franklintempleton.com
Annual Report
| 27
FRANKLIN ALTERNATIVE STRATEGIES FUNDS
NOTES TO CONSOLIDATED FINANCIAL STATEMENTS
Franklin Pelagos Commodities Strategy Fund (continued)
2. Shares of Beneficial Interest
At May 31, 2015, there were an unlimited number of shares authorized (without par value). Transactions in the Fund’s shares were
as follows:
| Year Ended May 31, | |||||||||||
| 2015 | 2014 | ||||||||||
| Shares | Amount | Shares | Amount | ||||||||
| Class A Sharesa: | |||||||||||
| Shares sold | 320,203 | $ | 2,539,217 | 75,514 | $ | 718,445 | |||||
| Shares redeemed | (91,847 | ) | (748,538 | ) | (11,914 | ) | (114,737 | ) | |||
| Net increase (decrease) | 228,356 | $ | 1,790,679 | 63,600 | $ | 603,708 | |||||
| Class C Sharesa: | |||||||||||
| Shares sold | 50,914 | $ | 386,347 | 8,075 | $ | 76,224 | |||||
| Shares redeemed | (3,870 | ) | (30,458 | ) | (1,654 | ) | (15,843 | ) | |||
| Net increase (decrease) | 47,044 | $ | 355,889 | 6,421 | $ | 60,381 | |||||
| Class R Sharesa: | |||||||||||
| Shares sold | 564 | $ | 5,009 | ||||||||
| Shares redeemed | (1 | ) | (9 | ) | |||||||
| Net increase (decrease) | 563 | $ | 5,000 | ||||||||
| Class R6 Sharesa: | |||||||||||
| Shares soldb | 394,647 | $ | 3,320,920 | 11,748,644 | $ | 104,424,968 | |||||
| Shares redeemed | (145,850 | ) | (1,104,241 | ) | (4,585,959 | ) | (41,228,509 | ) | |||
| Net increase (decrease) | 248,797 | $ | 2,216,679 | 7,162,685 | $ | 63,196,459 | |||||
| Advisor Class Shares: | |||||||||||
| Shares sold | 34,562 | $ | 277,151 | 2,392,658 | $ | 21,918,861 | |||||
| Shares redeemedb | (13,531 | ) | (113,894 | ) | (13,817,865 | ) | (123,420,534 | ) | |||
| Net increase (decrease) | 21,031 | $ | 163,257 | (11,425,207 | ) | $ | (101,501,673 | ) | |||
aFor the period January 10, 2014 (commencement of operations) to May 31, 2014.
bEffective January 10, 2014 a portion of Advisor Class shares were exchanged into Class R6.
3. Transactions with Affiliates
Franklin Resources, Inc. is the holding company for various subsidiaries that together are referred to as Franklin Templeton Investments. Certain officers and trustees of the Trust are also officers and/or directors of the following subsidiaries:
| Subsidiary | Affiliation |
| Franklin Alternative Strategies Advisers, LLC (FASA) | |
| (formerly Pelagos Capital Management, LLC) | Investment manager |
| Franklin Templeton Services, LLC (FT Services) | Administrative manager |
| Franklin Templeton Distributors, Inc. (Distributors) | Principal underwriter |
| Franklin Templeton Investor Services, LLC (Investor Services) | Transfer agent |
a. Management Fees
The Fund and FP Subsidiary pay an investment management fee to FASA of 0.85% per year of the average daily net assets of the Fund and FP Subsidiary. Management fees paid by the Fund are reduced on assets invested in the FP Subsidiary, in an amount not to exceed the management fees paid by the FP Subsidiary.
28 | Annual Report franklintempleton.com
FRANKLIN ALTERNATIVE STRATEGIES FUNDS
NOTES TO CONSOLIDATED FINANCIAL STATEMENTS
Franklin Pelagos Commodities Strategy Fund (continued)
b. Administrative Fees
Under an agreement with FASA, FT Services provides administrative services to the Fund and FP Subsidiary. The fee is paid by FASA based on the Fund and FP Subsidiary average daily net assets, and is not an additional expense of the Fund or FP Subsidiary.
c. Distribution Fees
The Board has adopted distribution plans for each share class, with the exception of Class R6 and Advisor Class shares, pursuant to Rule 12b-1 under the 1940 Act. Distribution fees are not charged on shares held by affiliates. Under the Fund’s Class A reimbursement distribution plan, the Fund reimburses Distributors for costs incurred in connection with the servicing, sale and distribution of the Fund’s shares up to the maximum annual plan rate. Under the Class A reimbursement distribution plan, costs exceeding the maximum for the current plan year cannot be reimbursed in subsequent periods. In addition, under the Fund’s Class C and R compensation distribution plans, the Fund pays Distributors for costs incurred in connection with the servicing, sale and distribution of the Fund’s shares up to the maximum annual plan rate for each class. The plan year, for purposes of monitoring compliance with the maximum annual plan rates, is February 1 through January 31 for each fund.
The maximum annual plan rates, based on the average daily net assets, for each class, are as follows:
| Class A | 0.30 | % |
| Class C | 1.00 | % |
| Class R | 0.50 | % |
On May 18, 2015, the Board approved to set the current rate at 0.25% per year for Class A shares, effective August 1, 2015, until further notice and approval by the Board.
d. Sales Charges/Underwriting Agreements
Front-end sales charges and contingent deferred sales charges (CDSC) do not represent expenses of the Fund. These charges are deducted from the proceeds of sales of Fund shares prior to investment or from redemption proceeds prior to remittance, as applicable. Distributors has advised the Fund of the following commission transactions related to the sales and redemptions of the Fund’s shares for the year:
| Sales charges retained net of commissions paid to unaffiliated broker/dealers | $ | 5,956 |
| CDSC retained | $ | 67 |
e. Transfer Agent Fees
Each class of shares, except for Class R6, pays transfer agent fees to Investor Services for its performance of shareholder servicing obligations and reimburses Investor Services for out of pocket expenses incurred, including shareholding servicing fees paid to third parties. These fees are allocated daily based upon their relative proportion of such classes’ aggregate net assets. Class R6 pays Investor Services transfer agent fees specific to that class.
For the year ended May 31, 2015, the Fund paid transfer agent fees of $6,292, of which $4,420 was retained by Investor Services.
f. Investments in Institutional Fiduciary Trust Money Market Portfolio
The Fund invests in Institutional Fiduciary Trust Money Market Portfolio (Sweep Money Fund), an affiliated open-end management investment company. Management fees paid by the Fund are waived on assets invested in the Sweep Money Fund, as noted in the Consolidated Statement of Operations, in an amount not to exceed the management and administrative fees paid directly or indirectly by the Sweep Money Fund. Prior to June 1, 2013, the waiver was accounted for as a reduction to management fees.
franklintempleton.com
Annual Report
| 29
FRANKLIN ALTERNATIVE STRATEGIES FUNDS
NOTES TO CONSOLIDATED FINANCIAL STATEMENTS
Franklin Pelagos Commodities Strategy Fund (continued)
3. Transactions with Affiliates (continued)
g. Waiver and Expense Reimbursements
FASA has contractually agreed in advance to waive or limit its fees and to assume as its own expense certain expenses otherwise payable by the Fund so that the expenses (excluding distribution fees, acquired fund fees and expenses) for each class of the Fund do not exceed 0.95%, and Class R6 does not exceed 0.86% based on the average net assets of each class (other than certain non-routine expenses or costs, including those relating to litigation, indemnification, reorganizations, and liquidations) until September 30, 2015.
| h. Other Affiliated Transactions | |||
| At May 31, 2015, the shares of the Fund were owned by the following entities: | |||
| Percentage of | |||
| Shares | Outstanding Shares | ||
| Franklin Moderate Allocation Fund | 3,091,053 | 39.67 | % |
| Franklin Conservative Allocation Fund | 1,876,164 | 24.08 | % |
| Franklin Growth Allocation Fund | 1,700,201 | 21.82 | % |
| Franklin Multi-Asset Real Return Fund | 228,663 | 2.93 | % |
| Franklin LifeSmart 2025 Retirement Target Fund | 140,124 | 1.80 | % |
| Franklin LifeSmart 2035 Retirement Target Fund | 112,156 | 1.44 | % |
| Franklin LifeSmart 2015 Retirement Target Fund | 90,466 | 1.16 | % |
| Franklin LifeSmart 2045 Retirement Target Fund | 74,055 | 0.95 | % |
| Franklin LifeSmart 2030 Retirement Target Fund | 32,965 | 0.42 | % |
| Franklin LifeSmart 2020 Retirement Target Fund | 26,200 | 0.34 | % |
| Franklin LifeSmart 2040 Retirement Target Fund | 21,043 | 0.27 | % |
| Franklin LifeSmart 2050 Retirement Target Fund | 17,195 | 0.22 | % |
| Franklin LifeSmart 2055 Retirement Target Fund | 1,197 | 0.02 | % |
| Franklin Resources, Inc | 563 | 0.01 | % |
| 7,412,045 | 95.13 | % | |
4. Expense Offset Arrangement
The Fund has entered into an arrangement with its custodian whereby credits realized as a result of uninvested cash balances are used to reduce a portion of the Fund’s custodian expenses. During the year ended May 31, 2015, the custodian fees were reduced as noted in the Consolidated Statement of Operations.
5. Income Taxes
For tax purposes, capital losses may be carried over to offset future capital gains, if any. At May 31, 2015, the Fund had long-term capital loss carryforwards of $188,382.
During the year ended May 31, 2015, the Fund utilized $6,567 of capital loss carryforwards.
For tax purposes, the Fund may elect to defer any portion of a late-year ordinary loss to the first day of the following fiscal year.
At May 31, 2015, the Fund deferred late-year ordinary losses of $34,354.
30 | Annual Report
franklintempleton.com
FRANKLIN ALTERNATIVE STRATEGIES FUNDS
NOTES TO CONSOLIDATED FINANCIAL STATEMENTS
| Franklin Pelagos Commodities Strategy Fund (continued) | |||||||||||||
| At May 31, 2015, the cost of investments and net unrealized appreciation (depreciation) for income tax purposes were as follows: | |||||||||||||
| Cost of investments | $ | 56,763,367 | |||||||||||
| Unrealized appreciation | $ | 3,249 | |||||||||||
| Unrealized depreciation | (155,911 | ) | |||||||||||
| Net unrealized appreciation (depreciation) | $ | (152,662 | ) | ||||||||||
| Differences between income and/or capital gains as determined on a book basis and a tax basis are primarily due to differing | |||||||||||||
| treatments of bond discounts and premiums and non-deductible expenses. | |||||||||||||
| 6. Investment Transactions | |||||||||||||
| Purchases and sales of investments (excluding short term securities) for the year ended May 31, 2015, aggregated $18,000,000 and | |||||||||||||
| $29,300,165, respectively. | |||||||||||||
| Transactions in options written during the year ended May 31, 2015, were as follows: | |||||||||||||
| Number of | |||||||||||||
| Contracts | Premiums | ||||||||||||
| Options outstanding at June 1, 2014 | — | $ | — | ||||||||||
| Options written | 163 | 110,917 | |||||||||||
| Options expired | (88 | ) | (59,074 | ) | |||||||||
| Options exercised | — | — | |||||||||||
| Options closed | (75 | ) | (51,843 | ) | |||||||||
| Options outstanding at May 31, 2015 | — | $ | — | ||||||||||
| See Notes 1(b) and 7 regarding derivative financial instruments and other derivative information, respectively. | |||||||||||||
| 7. Other Derivative Information | |||||||||||||
| At May 31, 2015, the Fund’s investments in derivative contracts are reflected in the Consolidated Statement of Assets and | |||||||||||||
| Liabilities as follows: | |||||||||||||
| Asset Derivatives | Liability Derivatives | ||||||||||||
| Derivative Contracts | |||||||||||||
| Not Accounted for as | Consolidated Statement of | Consolidated Statement of | |||||||||||
| Hedging Instruments | Assets and Liabilities Location | Fair Value | Assets and Liabilities Location | Fair Value | |||||||||
| Commodity contracts | Investments in securities, at value | $ | 2,050 | a | |||||||||
| Variation margin | 13,967 | b | Variation margin | $ | 18,551 | b | |||||||
| Unrealized appreciation on OTC | |||||||||||||
| swap contracts | 613,693 | ||||||||||||
| Totals | $ | 629,710 | $ | 18,551 | |||||||||
| aPurchased option contracts are included in investments in securities, at value in the Consolidated Statement of Assets and Liabilities. | |||||||||||||
| bThis amount reflects the cumulative appreciation (depreciation) of futures contracts as reported in the Consolidated Statement of Investments. Only the variation margin | |||||||||||||
| receivable/payable at year end is separately reported within the Consolidated Statement of Assets and Liabilities. Prior variation margin movements were recorded to cash | |||||||||||||
| upon receipt or payment. | |||||||||||||
franklintempleton.com
Annual Report
| 31
FRANKLIN ALTERNATIVE STRATEGIES FUNDS
NOTES TO CONSOLIDATED FINANCIAL STATEMENTS
Franklin Pelagos Commodities Strategy Fund (continued)
7. Other Derivative Information (continued)
For the year ended May 31, 2015, the effect of derivative contracts in the Fund’s Consolidated Statement of Operations was as follows:
| Net Change in | |||||||||||
| Net Realized | Unrealized | ||||||||||
| Derivative Contracts | Consolidated | Gain (Loss) | Consolidated | Appreciation | |||||||
| Not Accounted for as | Statement of | for the | Statement of | (Depreciation) | |||||||
| Hedging Instruments | Operations Locations | Year | Operations Locations | for the Year | |||||||
| Commodity contracts | Investments | $ | (12,206 | ) | Investments | $ | (74,559 | )a | |||
| Written options | (21,720 | ) | |||||||||
| Futures contracts | (3,149,212 | ) | Futures contracts | 70,720 | |||||||
| Swap contracts | (14,649,254 | ) | Swap contracts | 985,661 | |||||||
| Totals | $ | (17,832,392 | ) | $ | 981,822 | ||||||
| aPurchased option contracts are included in net change in unrealized appreciation (depreciation) on investments in the Consolidated Statement of Operations. | |||||||||||
| For the year ended May 31, 2015, the average month end fair value of derivatives represented 1.53% of average month end net | |||||||||||
| assets. The average month end number of open derivative contracts for the year was 8. | |||||||||||
| At May 31, 2015, the Fund’s OTC derivative assets and liabilities, are as follows: | |||||||||||
| Gross and Net Amounts | |||||||||||
| of Assets and Liabilities Presented in the | |||||||||||
| Consolidated Statement of Assets and Liabilities | |||||||||||
| Assetsa | Liabilitiesa | ||||||||||
| Derivatives | |||||||||||
| Swap Contracts | $ | 613,693 | $ | — | |||||||
| aAbsent event of default or early termination, OTC derivative assets and liabilities are presented gross and not offset in the Consolidated Statement of Assets and Liabilities. | |||||||||||
| At May 31, 2015, the Fund’s OTC derivative assets which may be offset against the Fund’s OTC derivative liabilities and | |||||||||||
| collateral received from the counterparty, is as follows: | |||||||||||
| Amounts Not Offset in the | |||||||||||
| Consolidated Statement of Assets and Liabilities | |||||||||||
| Gross and | |||||||||||
| Net Amounts of | Financial | Financial | |||||||||
| Assets Presented in the | Instruments | Instruments | Cash | Net Amount | |||||||
| Consolidated Statement of | Available for | Collateral | Collateral | (Not less | |||||||
| Assets and Liabilities | Offset | Received | Received | than zero) | |||||||
| Counterparty | |||||||||||
| MSCS | $ | 613,693 | $ | — | $ | — | $ — | $ | 613,693 | ||
32 | Annual Report
franklintempleton.com
FRANKLIN ALTERNATIVE STRATEGIES FUNDS
NOTES TO CONSOLIDATED FINANCIAL STATEMENTS
Franklin Pelagos Commodities Strategy Fund (continued)
At May 31, 2015, the Fund’s OTC derivative liabilities which may be offset against the Fund’s OTC derivative assets and collateral pledged to the counterparty, is as follows:
| Amounts Not Offset in the | |||||
| Consolidated Statement of Assets and Liabilities | |||||
| Gross and | |||||
| Net Amounts of | Financial | Financial | |||
| Liabilities Presented in the | Instruments | Instruments | Cash | Net Amount | |
| Consolidated Statement of | Available for | Collateral | Collateral | (Not less | |
| Assets and Liabilities | Offset | Pledged | Pledged | than zero) | |
| Counterparty | |||||
| MSCS | $ — | $ — | $ — | $ — | $ — |
See Notes 1(b) and 6 regarding derivative financial instruments and investment transactions, respectively.
See Abbreviations on page 34.
8. Credit Facility
The Fund, together with other U.S. registered and foreign investment funds (collectively, Borrowers), managed by Franklin Templeton Investments, are borrowers in a joint syndicated senior unsecured credit facility totaling $2 billion (Global Credit Facility) which matures on February 12, 2016. This Global Credit Facility provides a source of funds to the Borrowers for temporary and emergency purposes, including the ability to meet future unanticipated or unusually large redemption requests.
Under the terms of the Global Credit Facility, the Fund shall, in addition to interest charged on any borrowings made by the Fund and other costs incurred by the Fund, pay its share of fees and expenses incurred in connection with the implementation and maintenance of the Global Credit Facility, based upon its relative share of the aggregate net assets of all of the Borrowers, including an annual commitment fee of 0.07% based upon the unused portion of the Global Credit Facility. These fees are reflected in other expenses in the Consolidated Statement of Operations. During the year ended May 31, 2015, the Fund did not use the Global Credit Facility.
9. Fair Value Measurements
The Fund follows a fair value hierarchy that distinguishes between market data obtained from independent sources (observable inputs) and the Fund’s own market assumptions (unobservable inputs). These inputs are used in determining the value of the Fund’s financial instruments and are summarized in the following fair value hierarchy:
- Level 1 – quoted prices in active markets for identical financial instruments
- Level 2 – other significant observable inputs (including quoted prices for similar financial instruments, interest rates, prepayment speed, credit risk, etc.)
- Level 3 – significant unobservable inputs (including the Fund’s own assumptions in determining the fair value of financial instruments)
The input levels are not necessarily an indication of the risk or liquidity associated with financial instruments at that level.
franklintempleton.com
Annual Report
| 33
FRANKLIN ALTERNATIVE STRATEGIES FUNDS
NOTES TO CONSOLIDATED FINANCIAL STATEMENTS
Franklin Pelagos Commodities Strategy Fund (continued)
9. Fair Value Measurements (continued)
For movements between the levels within the fair value hierarchy, the Fund has adopted a policy of recognizing the transfers as of the date of the underlying event which caused the movement.
A summary of inputs used as of May 31, 2015, in valuing the Fund’s assets and liabilities carried at fair value, is as follows:
| Level 1 | Level 2 | Level 3 | Total | |||||
| Assets: | ||||||||
| Investments in Securities | ||||||||
| U.S. Government and Agency Securities | $ | — | $ | 28,906,617 | $ | — | $ | 28,906,617 |
| Options Purchased | 2,050 | — | — | 2,050 | ||||
| Short Term Investments | 27,382,038 | 320,000 | — | 27,702,038 | ||||
| Total Investments in Securities | $ | 27,384,088 | $ | 29,226,617 | $ | — | $ | 56,610,705 |
| Other Financial Instruments | ||||||||
| Futures Contracts | $ | 13,967 | $ | — | $ | — | $ | 13,967 |
| Swap Contracts | — | 613,693 | — | 613,693 | ||||
| Total Other Financial Instruments | $ $ | 13,967 | $ | 613,693 | $ | — | $ | 627,660 |
| Liabilities: | ||||||||
| Other Financial Instruments | ||||||||
| Futures Contracts | $ | 18,551 | $ | — | $ | — | $ | 18,551 |
A reconciliation of assets in which Level 3 inputs are used in determining fair value is presented when there are significant Level 3 financial instruments at the end of the year.
10. Subsequent Events
The Fund has evaluated subsequent events through the issuance of the consolidated financial statements and determined that no events have occurred that require disclosure.
| Abbreviations | ||
| Counterparty | Selected Portfolio | |
| MSCS Morgan Stanley Capital Services, LLC | FFCB | Federal Farm Credit Bank |
| FHLB | Federal Home Loan Bank | |
34 | Annual Report
franklintempleton.com
FRANKLIN PELAGOS COMMODITIES STRATEGY FUND
Report of Independent Registered Public Accounting Firm
To the Board of Trustees of Franklin Alternative Strategies Funds and Shareholders of the Franklin Pelagos Commodities Strategy Fund:
We have audited the accompanying consolidated statement of assets and liabilities, including the consolidated statement of investments, of the Franklin Pelagos Commodities Strategy Fund (the “Fund”) (one of the funds constituting Franklin Alternative Strategies Funds), as of May 31, 2015, and the related consolidated statement of operations for the year then ended, the consolidated statements of changes in net assets for each of the two years in the period then ended and the consolidated financial highlights for each of the periods indicated therein. These consolidated financial statements and consolidated financial highlights are the responsibility of the Fund’s management. Our responsibility is to express an opinion on these consolidated financial statements and consolidated financial highlights based on our audits.
We conducted our audits in accordance with the standards of the Public Company Accounting Oversight Board (United States). Those standards require that we plan and perform the audit to obtain reasonable assurance about whether the financial statements and financial highlights are free of material misstatement. We were not engaged to perform an audit of the Fund’s internal control over financial reporting. Our audits included consideration of internal control over financial reporting as a basis for designing audit procedures that are appropriate in the circumstances, but not for the purpose of expressing an opinion on the effectiveness of the Fund’s internal control over financial reporting. Accordingly, we express no such opinion. An audit also includes examining, on a test basis, evidence supporting the amounts and disclosures in the financial statements and financial highlights, assessing the accounting principles used and significant estimates made by management, and evaluating the overall financial statement presentation. Our procedures included confirmation of securities owned as of May 31, 2015, by correspondence with the custodian and brokers. We believe that our audits provide a reasonable basis for our opinion.
In our opinion, the consolidated financial statements and consolidated financial highlights referred to above present fairly, in all material respects, the consolidated financial position of the Franklin Pelagos Commodities Strategy Fund (one of the funds constituting Franklin Alternative Strategies Funds) at May 31, 2015, the consolidated results of its operations for the year then ended, the consolidated changes in its net assets for each of the two years in the period then ended and the consolidated financial highlights for each of the periods indicated therein, in conformity with U.S. generally accepted accounting principles.
Boston, Massachusetts
July 23, 2015

franklintempleton.com
Annual Report
| 35
FRANKLIN ALTERNATIVE STRATEGIES FUNDS
| Board Members and Officers | ||||
| The name, year of birth and address of the officers and board members, as well as their affiliations, positions held with the Trust, | ||||
| principal occupations during at least the past five years and number of portfolios overseen in the Franklin Templeton Investments | ||||
| fund complex are shown below. Generally, each board member serves until that person’s successor is elected and qualified. | ||||
| Independent Board Members | ||||
| Number of Portfolios in | ||||
| Name, Year of Birth | Length of | Fund Complex Overseen | Other Directorships Held | |
| and Address | Position | Time Served | by Board Member* | During at Least the Past 5 Years |
| Edward I. Altman, Ph.D. (1941) | Trustee | Since 2011 | 17 | None |
| c/o Franklin Mutual Advisers, LLC | ||||
| 101 John F. Kennedy Parkway | ||||
| Short Hills, NJ 07078-2789 | ||||
| Principal Occupation During at Least the Past 5 Years: | ||||
| Max L. Heine Professor of Finance and Director of The Credit and Debt Markets Research Program, Salomon Center, Stern School of | ||||
| Business, New York University; editor and author of numerous financial publications; financial consultant; an adviser to numerous financial | ||||
| and publishing organizations; and formerly, Vice Director, Salomon Center, Stern School of Business, New York University. | ||||
| Ann Torre Bates (1958) | Trustee | Since 2011 | 43 | Navient Corporation (loan |
| c/o Franklin Mutual Advisers, LLC | management, servicing and asset | |||
| 101 John F. Kennedy Parkway | recovery) (2014-present), Ares | |||
| Short Hills, NJ 07078-2789 | Capital Corporation (specialty finance | |||
| company) (2010-present), United | ||||
| Natural Foods, Inc. (distributor of | ||||
| natural, organic and specialty foods) | ||||
| (2013-present), Allied Capital | ||||
| Corporation (financial services) | ||||
| (2003-2010) and SLM Corporation | ||||
| (Sallie Mae) (1997-2014). | ||||
| Principal Occupation During at Least the Past 5 Years: | ||||
| Director of various companies; and formerly, Executive Vice President and Chief Financial Officer, NHP Incorporated (manager of multifamily | ||||
| housing) (1995-1997); and Vice President and Treasurer, US Airways, Inc. (until 1995). | ||||
| Burton J. Greenwald (1929) | Vice Chairman | Vice Chairman | 17 | Franklin Templeton Emerging Markets |
| c/o Franklin Mutual Advisers, LLC and Trustee | since April 2015 | Debt Opportunities Fund PLC and | ||
| 101 John F. Kennedy Parkway | and Trustee | Fiduciary International Ireland Limited | ||
| Short Hills, NJ 07078-2789 | since 2011 | (1999-2015). | ||
| Principal Occupation During at Least the Past 5 Years: | ||||
| Managing Director, B.J. Greenwald Associates (management consultants to the financial services industry); and formerly, Chairman, | ||||
| Fiduciary Trust International Funds; Executive Vice President, L.F Rothschild Fund Management, Inc.; President and Director, Merit Mutual | ||||
| Funds; President, Underwriting Division and Director, National Securities & Research Corporation; Governor, Investment Company Institute; | ||||
| and Chairman, ICI Public Information Committee. | ||||
| Keith E. Mitchell (1954) | Trustee | Since 2011 | 17 | None |
| c/o Franklin Mutual Advisers, LLC | ||||
| 101 John F. Kennedy Parkway | ||||
| Short Hills, NJ 07078-2789 | ||||
| Principal Occupation During at Least the Past 5 Years: | ||||
| Director of various boards of asset management firms; and formerly, Managing Member, Mitchell, Hartley & Bechtel Advisers, LLC (formerly, | ||||
| Mitchell Advisers, LLC) (advisory firm) (2003-2015) and Managing Director, Putman Lovell NBF. | ||||
| David W. Niemiec (1949) | Trustee | Since | 42 | Emeritus Corporation (assisted |
| c/o Franklin Mutual Advisers, LLC | April 2015 | living) (1999-2010) and OSI | ||
| 101 John F. Kennedy Parkway | Pharmaceuticals, Inc. (pharmaceutical | |||
| Short Hills, NJ 07078-2789 | products) (2006-2010). | |||
| Principal Occupation During at Least the Past 5 Years: | ||||
| Advisor, Saratoga Partners (private equity fund); and formerly, Managing Director, Saratoga Partners (1998-2001) and SBC Warburg Dillon | ||||
| Read (investment banking) (1997-1998); Vice Chairman, Dillon, Read & Co. Inc. (investment banking) (1991-1997); and Chief Financial | ||||
| Officer, Dillon, Read & Co. Inc. (1982-1997). | ||||
36 | Annual Report
franklintempleton.com
FRANKLIN ALTERNATIVE STRATEGIES FUNDS
| Independent Board Members (continued) | ||||
| Number of Portfolios in | ||||
| Name, Year of Birth | Length of | Fund Complex Overseen | Other Directorships Held | |
| and Address | Position | Time Served | by Board Member* | During at Least the Past 5 Years |
| Charles Rubens II (1930) | Trustee | Since 2011 | 17 | None |
| c/o Franklin Mutual Advisers, LLC | ||||
| 101 John F. Kennedy Parkway | ||||
| Short Hills, NJ 07078-2789 | ||||
| Principal Occupation During at Least the Past 5 Years: | ||||
| Private investor and president of non-profit organizations; and formerly, an executive of Time, Inc.; and Trustee of Colorado College. | ||||
| Jan Hopkins Trachtman (1947) | Trustee | Since 2011 | 17 | None |
| c/o Franklin Mutual Advisers, LLC | ||||
| 101 John F. Kennedy Parkway | ||||
| Short Hills, NJ 07078-2789 | ||||
| Principal Occupation During at Least the Past 5 Years: | ||||
| President and Founder, The Jan Hopkins Group (communications consulting firm); President, Economic Club of New York; serves on Advisory | ||||
| Board of Knight Bagehot Fellowship; and formerly, Anchor/Correspondent, CNN Financial News (until 2003); Managing Director and Head of | ||||
| Client Communications, Citigroup Private Bank (until 2005); Off-Air Reporter, ABC News’ World News Tonight and Editor, CBS Network News. | ||||
| Robert E. Wade (1946) | Trustee and | Since 2011 | 43 | El Oro Ltd (investments) |
| c/o Franklin Mutual Advisers, LLC Chairman of | (2003-present). | |||
| 101 John F. Kennedy Parkway | the Board | |||
| Short Hills, NJ 07078-2789 | ||||
| Principal Occupation During at Least the Past 5 Years: | ||||
| Attorney at law engaged in private practice (1972-2008) and member of various boards. | ||||
| Gregory H. Williams (1943) | Trustee | Since | 16 | None |
| c/o Franklin Mutual Advisers, LLC | April 2015 | |||
| 101 John F. Kennedy Parkway | ||||
| Short Hills, NJ 07078-2789 | ||||
| Principal Occupation During at Least the Past 5 Years: | ||||
| Private investor; Consultant; and formerly, President, University of Cincinnati (2009-2012); President, The City College of New York | ||||
| (2001-2009); Dean, College of Law, Ohio State University (1993-2001); and Associate Vice President, Academic Affairs and Professor of | ||||
| Law, University of Iowa (1977-1993). | ||||
| Interested Board Members and Officers | ||||
| Number of Portfolios in | ||||
| Name, Year of Birth | Length of | Fund Complex Overseen | Other Directorships Held | |
| and Address | Position | Time Served | by Board Member* | During at Least the Past 5 Years |
| **Gregory E. Johnson (1961) | Trustee | Since 2011 | 162 | None |
| One Franklin Parkway | ||||
| San Mateo, CA 94403-1906 | ||||
| Principal Occupation During at Least the Past 5 Years: | ||||
| Chairman of the Board, Member – Office of the Chairman, Director, President and Chief Executive Officer, Franklin Resources, Inc.; officer | ||||
| and/or director or trustee, as the case may be, of some of the other subsidiaries of Franklin Resources, Inc. and of 46 of the investment | ||||
| companies in Franklin Templeton Investments; and Vice Chairman, Investment Company Institute. | ||||
| **Jennifer M. Johnson (1964) Trustee | Since | 9 | None | |
| One Franklin Parkway | April 2015 | |||
| San Mateo, CA 94403-1906 | ||||
| Principal Occupation During at Least the Past 5 Years: | ||||
| Chief Operating Officer and Executive Vice President, Franklin Resources Inc.; officer and/or director or trustee, as the case may be, of some | ||||
| of the other subsidiaries of Franklin Resources, Inc. and of three of the investment companies in Franklin Templeton Investments; and formerly, | ||||
| Executive Vice President of Operations and Technology, Franklin Resources Inc. (2005-2010); Senior Vice President, Franklin Resources Inc. | ||||
| (2003-2005). | ||||
franklintempleton.com
Annual Report
| 37
| FRANKLIN ALTERNATIVE STRATEGIES FUNDS | ||||
| Interested Board Members and Officers (continued) | ||||
| Number of Portfolios in | ||||
| Name, Year of Birth | Length of | Fund Complex Overseen | Other Directorships Held | |
| and Address | Position | Time Served | by Board Member* | During at Least the Past 5 Years |
| Alison E. Baur (1964) | Vice President | Since 2012 | Not Applicable | Not Applicable |
| One Franklin Parkway | ||||
| San Mateo, CA 94403-1906 | ||||
| Principal Occupation During at Least the Past 5 Years: | ||||
| Deputy General Counsel, Franklin Templeton Investments; and officer of some of the other subsidiaries of Franklin Resources, Inc. and of 46 | ||||
| of the investment companies in Franklin Templeton Investments. | ||||
| Laura F. Fergerson (1962) | Chief Executive Since 2011 | Not Applicable | Not Applicable | |
| One Franklin Parkway | Officer – | |||
| San Mateo, CA 94403-1906 | Finance and | |||
| Administration | ||||
| Principal Occupation During at Least the Past 5 Years: | ||||
| Senior Vice President, Franklin Templeton Services, LLC; Vice President, Franklin Advisers, Inc. and Franklin Templeton Institutional, LLC.; | ||||
| and officer of 46 of the investment companies in Franklin Templeton Investments. | ||||
| Aliya S. Gordon (1973) | Vice President | Since 2011 | Not Applicable | Not Applicable |
| One Franklin Parkway | ||||
| San Mateo, CA 94403-1906 | ||||
| Principal Occupation During at Least the Past 5 Years: | ||||
| Senior Associate General Counsel, Franklin Templeton Investments; officer of 46 of the investment companies in Franklin Templeton | ||||
| Investments; and formerly, Litigation Associate, Steefel, Levitt & Weiss, LLP (2000-2004). | ||||
| Steven J. Gray (1955) | Secretary and | Since 2011 | Not Applicable | Not Applicable |
| One Franklin Parkway | Vice President | |||
| San Mateo, CA 94403-1906 | ||||
| Principal Occupation During at Least the Past 5 Years: | ||||
| Senior Associate General Counsel, Franklin Templeton Investments; Vice President, Franklin Templeton Distributors, Inc. and Franklin | ||||
| Alternative Strategies Advisers, LLC; and officer of 46 of the investment companies in Franklin Templeton Investments. | ||||
| Selena L. Holmes (1965) | Vice President | Since 2012 | Not Applicable | Not Applicable |
| 100 Fountain Parkway | – AML | |||
| St. Petersburg, FL 33716-1205 | Compliance | |||
| Principal Occupation During at Least the Past 5 Years: | ||||
| Director, Global Compliance Monitoring; Chief Compliance Officer, Franklin Alternative Strategies Advisers, LLC; Vice President, Franklin | ||||
| Templeton Companies, LLC; and officer of 46 of the investment companies in Franklin Templeton Investments. | ||||
| Robert G. Kubilis (1973) | Treasurer, | Since | Not Applicable | Not Applicable |
| 300 S.E. 2nd Street | Chief Financial | February 2015 | ||
| Fort Lauderdale, FL 33301-1923 | Officer and | |||
| Chief | ||||
| Accounting | ||||
| Officer | ||||
| Principal Occupation During at Least the Past 5 Years: | ||||
| Treasurer, U.S. Fund Administration & Reporting, Franklin Templeton Investments; and officer of five of the investment companies in Franklin | ||||
| Templeton Investments. | ||||
38 | Annual Report
franklintempleton.com
FRANKLIN ALTERNATIVE STRATEGIES FUNDS
| Interested Board Members and Officers (continued) | ||||
| Number of Portfolios in | ||||
| Name, Year of Birth | Length of | Fund Complex Overseen | Other Directorships Held | |
| and Address | Position | Time Served | by Board Member* | During at Least the Past 5 Years |
| Kimberly H. Novotny (1972) | Vice President | Since 2013 | Not Applicable | Not Applicable |
| 300 S.E. 2nd Street | ||||
| Fort Lauderdale, FL 33301-1923 | ||||
| Principal Occupation During at Least the Past 5 Years: | ||||
| Associate General Counsel, Franklin Templeton Investments; Vice President and Secretary, Fiduciary Trust International of the South; Vice | ||||
| President, Templeton Investment Counsel, LLC; Assistant Secretary, Franklin Resources, Inc.; and officer of 46 of the investment companies | ||||
| in Franklin Templeton Investments. | ||||
| Robert C. Rosselot (1960) | Chief | Since 2013 | Not Applicable | Not Applicable |
| 300 S.E. 2nd Street | Compliance | |||
| Fort Lauderdale, FL 33301-1923 | Officer | |||
| Principal Occupation During at Least the Past 5 Years: | ||||
| Director, Global Compliance, Franklin Templeton Investments; Vice President, Franklin Templeton Companies, LLC; officer of 46 of the | ||||
| investment companies in Franklin Templeton Investments; and formerly, Senior Associate General Counsel, Franklin Templeton Investments | ||||
| (2007-2013); and Secretary and Vice President, Templeton Group of Funds (2004-2013). | ||||
| Karen L. Skidmore (1952) | Vice President | Since 2011 | Not Applicable | Not Applicable |
| One Franklin Parkway | ||||
| San Mateo, CA 94403-1906 | ||||
| Principal Occupation During at Least the Past 5 Years: | ||||
| Senior Associate General Counsel, Franklin Templeton Investments; and officer of 46 of the investment companies in Franklin Templeton | ||||
| Investments. | ||||
| Craig S. Tyle (1960) | Vice President | Since 2011 | Not Applicable | Not Applicable |
| One Franklin Parkway | ||||
| San Mateo, CA 94403-1906 | ||||
| Principal Occupation During at Least the Past 5 Years: | ||||
| General Counsel and Executive Vice President, Franklin Resources, Inc.; and officer of some of the other subsidiaries of Franklin Resources, | ||||
| Inc. and of 46 of the investment companies in Franklin Templeton Investments. | ||||
| Lori A. Weber (1964) | Vice President | Since 2011 | Not Applicable | Not Applicable |
| 300 S.E. 2nd Street | ||||
| Fort Lauderdale, FL 33301-1923 | ||||
| Principal Occupation During at Least the Past 5 Years: | ||||
| Senior Associate General Counsel, Franklin Templeton Investments; Assistant Secretary, Franklin Resources, Inc.; Vice President and | ||||
| Secretary, Templeton Investment Counsel, LLC; Vice President, Fiduciary Trust International of the South; and officer of 46 of the investment | ||||
| companies in Franklin Templeton Investments. | ||||
franklintempleton.com
Annual Report
| 39
FRANKLIN ALTERNATIVE STRATEGIES FUNDS
| Interested Board Members and Officers (continued) | ||||
| Number of Portfolios in | ||||
| Name, Year of Birth | Length of | Fund Complex Overseen | Other Directorships Held | |
| and Address | Position | Time Served | by Board Member* | During at Least the Past 5 Years |
| William Y. Yun (1959) | President and | Since 2011 | Not Applicable | Not Applicable |
| 600 Fifth Avenue | Chief Executive | |||
| New York, NY 10020 | Officer – | |||
| Investment | ||||
| Management | ||||
| Principal Occupation During at Least the Past 5 Years: | ||||
| Executive Vice President, Franklin Advisers, Inc. and Franklin Templeton Institutional, LLC; Executive Vice President – Alternative Strategies, | ||||
| Franklin Resources, Inc.; Chief Executive Officer, Franklin Alternative Strategies Advisers, LLC; and officer and/or director or trustee, as the | ||||
| case may be, of some of the other subsidiaries of Franklin Resources, Inc. and of one of the investment companies in Franklin Templeton | ||||
| Investments. | ||||
*We base the number of portfolios on each separate series of the U.S. registered investment companies within the Franklin Templeton Investments fund complex.
These portfolios have a common investment manager or affiliated investment managers.
**Gregory E. Johnson is considered to be an interested person of the Fund under the federal securities laws due to his position as an officer and director of Franklin
Resources, Inc. (Resources), which is the parent company of the Fund’s investment manager and distributor. Jennifer M. Johnson is considered to be an interested person
of the Fund under the federal securities laws due to her position as officer of Resources, which is the parent company of the Fund’s investment manager and distributor.
Note 1: Gregory E. Johnson and Jennifer M. Johnson are siblings.
Note 2: Officer information is current as of the date of this report. It is possible that after this date, information about officers may change.
Note 3: Effective April 7, 2015, Peter A. Langerman ceased to be a trustee of the Trust.
The Fund’s Board has determined that certain of the members of the Audit Committee, including Ann Torre Bates, are audit committee financial experts, and
“independent,” under those provisions of the Sarbanes-Oxley Act of 2002, and the rules and form amendments adopted by the Securities and Exchange
Commission, relating to audit committee financial experts.
The Statement of Information (SAI) include additional information about board members and is available, without charge, upon request. Shareholders may call
(800) DIAL BEN/342-5236 to request the SAI.
40 | Annual Report
franklintempleton.com
FRANKLIN ALTERNATIVE STRATEGIES FUNDS
FRANKLIN PELAGOS COMMODITIES STRATEGY FUND
Shareholder Information
Board Review of Investment Management Agreement
The Board of Trustees (Board), including the independent trustees, at an in-person meeting held on May 18, 2015, unanimously approved the renewal of the Fund’s investment management agreement. Prior to a meeting of all of the trustees for the purpose of considering such renewal, the independent trustees held two meetings dedicated to the renewal process (those trustees unable to attend in person were present by telephonic conference means). Throughout the process, the independent trustees received assistance and advice from and met separately with independent counsel. The independent trustees met with and interviewed officers of the investment manager (including portfolio managers), the transfer agent and shareholder services group and the distributor. In approving the renewal of the agreement, the Board, including the independent trustees, determined that the existing investment management fee structure was fair and reasonable and that continuance of the agreement was in the best interests of the Fund and its shareholders.
In reaching their decision on the agreement, the trustees took into account information furnished throughout the year at regular Board meetings, as well as information specifically requested and furnished for the renewal process, which culminated in the meetings referred to above for the specific purpose of considering such agreement. Information furnished included, among others, reports on the Fund’s investment performance, expenses, portfolio composition, derivatives, asset segregation, portfolio turnover, distribution, shareholder servicing, legal and compliance matters, pricing of securities, sales and redemptions, and marketing support payments made to financial intermediaries, as well as a third-party survey of transfer agent fees charged to funds within the Franklin Templeton Investments (FTI) complex in comparison with those charged to other fund complexes deemed comparable. Also, related financial statements and other information about the scope and quality of services provided by the investment manager and its affiliates and enhancements to such services over the past year were provided. In addition, the trustees received periodic reports throughout the year and during the renewal process relating to compliance with the Fund’s investment policies and restrictions. During the renewal process, the independent trustees considered the investment manager’s methods of operation within the Franklin Templeton group and its activities on behalf of other clients.
The information obtained by the trustees during the renewal process also included a special report prepared by Lipper, Inc. (Lipper), an independent third-party analyst, comparing the Fund’s investment performance and expenses with those of other mutual funds deemed comparable to such Fund as selected by Lipper (Lipper Section 15(c) Report). The trustees reviewed the Lipper Section 15(c) Report and its usefulness in the renewal process with respect to matters such as comparative fees, expenses, expense ratios and performance. They concluded that the report was a reliable resource in the performance of their duties.
In addition, the trustees received a Profitability Study (Profitability Study) prepared by management discussing the profitability to FTI from its overall U.S. fund operations, as well as on an individual fund-by-fund basis. Over the past year, the Board and counsel to the independent trustees continued to receive reports on management’s handling of recent regulatory inquiries and pending legal actions against the investment manager and its affiliates. The independent trustees were satisfied with the actions taken to date by management in response to such regulatory and legal matters.
Particular attention was given to the diligent risk management program of the investment manager, including continual monitoring and management of counterparty credit risk and collateral, and attention given to derivatives and other complex instruments that are held and expected to be held by the Fund and how such instruments are used to carry out the Fund’s investment objectives. The Board also took into account, among other things, management’s efforts in establishing a global credit facility for the benefit of the Fund and other accounts managed by FTI to provide a source of cash for temporary and emergency purposes or to meet unusual redemption requests as well as the strong financial position of the investment manager’s parent company and its commitment to the mutual fund business. In addition, the Board received updates from management on the SEC’s progress in implementing the rule-making requirements established by the Dodd-Frank Wall Street Reform and Consumer Protection Act (Dodd-Frank Act), which was enacted July 21, 2010, and the compliance of the investment manager with rules and regulations already promulgated by the SEC under such act, as well as the compliance of the investment manager with new rules and regulations promulgated by the U.S. Commodity Futures Trading Commission.
In addition to the above and other matters considered by the trustees throughout the course of the year, the following discussion relates to certain primary factors relevant to the Board’s
franklintempleton.com
Annual Report
| 41
FRANKLIN ALTERNATIVE STRATEGIES FUNDS FRANKLIN PELAGOS COMMODITIES STRATEGY FUND SHAREHOLDER INFORMATION
Board Review of Investment Management
Agreement (continued) decision. This discussion of the information and factors considered by the Board (including the information and factors discussed above) is not intended to be exhaustive, but rather summarizes certain factors considered by the Board. In view of the wide variety of factors considered, the Board did not, unless otherwise noted, find it practicable to quantify or otherwise assign relative weights to the foregoing factors. In addition, individual trustees may have assigned different weights to various factors.
NATURE, EXTENT AND QUALITY OF SERVICES. The trustees reviewed the nature, extent and quality of the services provided, and to be provided, by the investment manager. In this regard, they reviewed the Fund’s actively managed fundamental and quantitative investment philosophy and process and the investment manager’s ability to implement such philosophy and process, including, but not limited to, the investment manager’s trading practices and investment decision processes and efforts to ensure compliance with the Fund’s investment goals, policies and limitations. The Board also considered the investment management services that the investment manager provides to the Cayman Islands-based company, which is wholly owned by the Fund (Cayman Subsidiary).
The trustees reviewed the Fund’s portfolio management team, including its performance, staffing, skills and compensation program. With respect to portfolio manager compensation, management assured the trustees that the Fund’s long-term performance is a significant component of incentive-based compensation and noted that a portion of a portfolio manager’s incentive-based compensation is paid in shares of predesignated funds from the portfolio manager’s fund management area. The trustees noted that the portfolio manager compensation program aligned the interests of the portfolio managers with that of shareholders of the Fund. The trustees considered various other products, portfolios and entities that are advised by the investment manager and the allocation of assets and expenses among and within them, as well as their relative fees and reasons for differences with respect thereto and any potential conflicts.
During regular Board meetings and the aforementioned meetings of the independent trustees, the trustees considered periodic reports provided to them showing that the investment manager complied with the investment policies and restrictions of the Fund as well as other reports periodically furnished to the Board covering matters such as the compliance of portfolio managers and other management personnel with the code of ethics covering the investment management personnel, the adherence to fair value pricing procedures established by the Board and the accuracy of net asset value calculations. The Board noted the extent of the benefits provided to Fund shareholders from being part of the Franklin Templeton group, including the right to exchange investments between funds (same class) without a sales charge, the ability to reinvest Fund dividends into other funds and the right to combine holdings of other funds to obtain reduced sales charges.
The Board considered the investment manager’s significant efforts in developing and implementing compliance procedures established in accordance with SEC and other requirements. The Board also considered the nature, extent and quality of the services to be provided under the Fund’s other service agreements with affiliates of the investment manager and considered whether, on an overall basis, Fund shareholders were well served. In this connection, the Board also took into account transfer agent and shareholder services provided to Fund shareholders by an affiliate of the investment manager, noting continuing expenditures by management to increase and improve the scope of such services and favorable periodic reports on shareholder services conducted by independent third parties. While such considerations directly affected the trustees’ decision in renewing the Fund’s transfer agent and shareholder services agreement, the Board also considered these commitments as incidental benefits to Fund shareholders deriving from the investment management relationship.
Based on their review, the trustees were satisfied with the nature and quality of the overall services provided, and to be provided, by the investment manager and its affiliates to the Fund and its shareholders and were confident in the abilities of the management team to continue to implement the Fund’s actively managed fundamental and quantitative investment philosophy and process and to provide quality services to the Fund and its shareholders.
42 | Annual Report
franklintempleton.com
FRANKLIN ALTERNATIVE STRATEGIES FUNDS
FRANKLIN PELAGOS COMMODITIES STRATEGY FUND
SHAREHOLDER INFORMATION
INVESTMENT PERFORMANCE. As the Fund commenced operations in December 2011, the trustees reviewed the investment performance of the Fund for the one-, two- and three-year periods ended December 31, 2014. As part of their review, they inquired of management regarding benchmark and hedging activities. Consideration was also given to performance in the context of available levels of cash, including as affected by net flows, during the periods. The trustees had meetings during the year, including the meetings referred to above held in connection with the renewal process, with the Fund’s portfolio managers to discuss performance and the management of the Fund.
In addition, attention in assessing performance was given to the Lipper Section 15(c) Report. That report showed the investment performance of the Fund (Class A shares) in comparison to other funds determined comparable by Lipper.
The comparable funds to the Fund, as chosen by Lipper, included all retail and institutional commodities general funds. The Fund had total returns in the second-lowest performing quintile for the one-year period ended December 31, 2014, and had annualized total returns for the two- and three-year periods in the middle performing quintile. The Board discussed with management the reasons for the relative underperformance for the one-year period ended December 31, 2014, and efforts being undertaken to address such relative underperformance. While noting such discussions, the Board found such comparative performance to be acceptable.
COMPARATIVE EXPENSES AND PROFITABILITY. The trustees considered the cost of the services provided and to be provided and the losses incurred by the investment manager and its affiliates from their respective relationships with the Fund. As part of the approval process, they explored with management the trends in expense ratios over the past three fiscal years and the reasons for any increases in the Fund’s expense ratios (or components thereof). The Board considered the extent to which the investment manager may derive ancillary benefits from Fund operations. In considering the appropriateness of the management fee and other expenses charged to the Fund, the Board took into account various factors including investment performance and matters relating to Fund operations, including, but not limited to, the quality and experience of its portfolio managers and research staff. As part of this discussion, the Board took into account the fee waiver and expense limitation arrangement in effect. The Board also considered the investment management services that the investment manager provides to the Cayman Subsidiary and the related fee waivers that were in place. The Board considered the nature of the services provided by the investment manager to the other mutual fund it subadvises with similar investment objectives as the Fund, the fees that it charges for such services and any potential conflicts.
Consideration was also given to a comparative analysis in the Lipper Section 15(c) Report of the investment management fee and total expense ratio of the Fund in comparison with those of a group of other funds selected by Lipper as its appropriate Lipper expense group. Lipper expense data is based upon information taken from the Fund’s most recent annual report, which reflects historical asset levels that may be quite different from those currently existing, particularly in a period of market volatility. While recognizing such inherent limitation and the fact that expense ratios generally increase as assets decline and decrease as assets grow, the Board believed the independent analysis conducted by Lipper to be an appropriate measure of comparative expenses. In reviewing comparative costs, emphasis was given to the Fund’s contractual management fee in comparison with the contractual management fee that would have been charged by other funds within its Lipper expense group assuming they were similar in size to the Fund, as well as the actual total expenses of the Fund in comparison with those of its Lipper expense group. The Lipper contractual management fee analysis includes administrative charges as being part of the management fee, and total expenses, for comparative consistency, are shown by Lipper for Fund Class A shares. The Fund’s contractual management fee rate was in the least expensive quintile of its Lipper expense group and its total expenses (including Rule 12b-1 fees) were in the second-least expensive quintile of such group. The Board was satisfied with such comparative fees and expenses.
The trustees also reviewed the Profitability Study addressing profitability of Franklin Resources, Inc., from its overall U.S. fund business, as well as profitability to the Fund’s investment manager and its affiliates, from providing investment management and other services to the Fund during the 12-month period ended September 30, 2014, the most recent fiscal year-end of Franklin Resources, Inc. The trustees reviewed the basis on which such reports are prepared and the cost allocation
franklintempleton.com
Annual Report
| 43
FRANKLIN ALTERNATIVE STRATEGIES FUNDS
FRANKLIN PELAGOS COMMODITIES STRATEGY FUND
SHAREHOLDER INFORMATION
Board Review of Investment Management
Agreement (continued) methodology utilized in the Profitability Study, it being recognized that allocation methodologies may each be reasonable while producing different results. In this respect, the Board noted that the reasonableness of the cost allocation methodologies was reviewed by independent accountants on an every other year basis.
The independent trustees met with management to discuss the Profitability Study. This included, among other things, a comparison of investment management income with investment management expenses of the Fund; comparison of underwriting revenues and expenses; the relative relationship of investment management and underwriting expenses; shareholder servicing profitability; economies of scale; and the relative contribution of the Fund to the profitability of the investment manager and its parent. In discussing the Profitability Study with the Board, the investment manager stated its belief that the costs incurred in establishing the infrastructure necessary to operate the type of mutual fund operations conducted by it and its affiliates may not be fully reflected in the expenses allocated to the Fund in determining its profitability. The Board also took into account management’s expenditures in improving shareholder services provided to the Fund, as well as the need to meet additional regulatory and compliance requirements resulting from the Sarbanes-Oxley Act, the Dodd-Frank Act and recent SEC and other regulatory requirements. The trustees also considered the extent to which the investment manager may derive ancillary benefits from Fund operations.
ECONOMIES OF SCALE. The Board considered economies of scale realized by the investment manager and its affiliates as the Fund grows larger and the extent to which they are shared with Fund shareholders, as for example, in the level of the investment management fees charged, in the quality and efficiency of services rendered and in increased capital commitments benefiting the Fund directly or indirectly. Since the Fund had only commenced operations in December 2011, and due to the limited size of assets under management, the Board concluded that economies of scale were difficult to consider at that time.
Proxy Voting Policies and Procedures
The Fund’s investment manager has established Proxy Voting Policies and Procedures (Policies) that the Fund uses to determine how to vote proxies relating to portfolio securities. Alternatively, shareholders may request copies of the Policies free of charge by calling the Proxy Group collect at (954) 527-7678 or by sending a written request to: Franklin Templeton Companies, LLC, 300 S.E. 2nd Street, Fort Lauderdale, FL 33301, Attention: Proxy Group. Copies of the Fund’s proxy voting records are posted on the U.S. Securities and Exchange Commission’s website at sec.gov and reflect the most recent 12-month period ended June 30.
Quarterly Statement of Investments
The Fund files a complete statement of investments with the U.S. Securities and Exchange Commission for the first and third quarters for each fiscal year on Form N-Q. Shareholders may view the filed Form N-Q by visiting the Commission’s website at sec.gov. The filed form may also be viewed and copied at the Commission’s Public Reference Room in Washington, DC. Information regarding the operations of the Public Reference Room may be obtained by calling (800) SEC-0330.
Householding of Reports and Prospectuses
You will receive the Fund’s financial reports every six months as well as an annual updated summary prospectus (prospectus available upon request). To reduce Fund expenses, we try to identify related shareholders in a household and send only one copy of the financial reports and summary prospectus. This process, called “householding,” will continue indefinitely unless you instruct us otherwise. If you prefer not to have these documents householded, please call us at (800) 632-2301. At any time you may view current prospectuses/summary prospectuses and financial reports on our website. If you choose, you may receive these documents through electronic delivery.
44 | Annual Report
franklintempleton.com
Item 2. Code of Ethics.
(a) The Registrant has adopted a code of ethics that applies to its principal executive officers and principal financial and accounting officer.
(c) N/A
(d) N/A
(f) Pursuant to Item 12(a)(1), the Registrant is attaching as an exhibit a copy of its code of ethics that applies to its principal executive officers and principal financial and accounting officer.
Item 3. Audit Committee Financial Expert.
(a)(1) The Registrant has an audit committee financial expert serving on its audit committee.
(2) The audit committee financial expert is Ann Torre Bates and she is “independent” as defined under the relevant Securities and Exchange Commission Rules and Releases.
Item 4. Principal Accountant Fees and Services.
(a) Audit Fees
The aggregate fees paid to the principal accountant for professional services rendered by the principal accountant for the audit of the registrant’s annual financial statements or for services that are normally provided by the principal accountant in connection with statutory and regulatory filings or engagements were $157,500 for the fiscal year ended May 31, 2015 and $142,925 for the fiscal year ended May 31, 2014.
(b) Audit-Related Fees
There were no fees paid to the principal accountant for assurance and related services rendered by the principal accountant to the registrant that are reasonably related to the performance of the audit of the registrant's financial statements and are not reported under paragraph (a) of Item 4.
There were no fees paid to the principal accountant for assurance and related services rendered by the principal accountant to the registrant's investment adviser and any entity controlling, controlled by or under common control with the investment adviser that provides ongoing services to the registrant that are reasonably related to the performance of the audit of their financial statements.
(c) Tax Fees
The aggregate fees paid to the principal accountant for professional services rendered by the principal accountant to the registrant for tax compliance, tax advice and tax planning were $3,103 for the fiscal year ended May 31, 2015 and $0 for the fiscal year ended May 31, 2014. The services for which these fees were paid include identifying passive foreign investment companies to manage exposure to tax liabilities.
The aggregate fees paid to the principal accountant for professional services rendered by the principal accountant to the registrant’s investment adviser and any entity controlling, controlled by or under common control with the investment adviser that provides ongoing services to the registrant for tax compliance, tax advice and tax planning were $77,000 for the fiscal year ended May 31, 2015 and $77,000 for the fiscal year ended May 31, 2014. The services for which these fees were paid included technical tax consultation for withholding tax report to foreign governments, application of local country tax laws and tax advice.
(d) All Other Fees
There were no fees paid to the principal accountant for products and services rendered by the principal accountant to the registrant not reported in paragraphs (a)-(c) of Item 4.
There were no fees paid to the principal accountant for products and services rendered by the principal accountant to the registrant’s investment adviser and any entity controlling, controlled by or under common control with the investment adviser that provides ongoing services to the registrant other than the services reported in paragraphs (a)-(c) of Item 4.
(e) (1) The registrant’s audit committee is directly responsible for approving the services to be provided by the auditors, including:
(i) pre-approval of all audit and audit related services;
(ii) pre-approval of all non-audit related services to be provided to the Fund by the auditors;
(iii) pre-approval of all non-audit related services to be provided to the registrant by the auditors to the registrant’s investment adviser or to any entity that controls, is controlled by or is under common control with the registrant’s investment adviser and that provides ongoing services to the registrant where the non-audit services relate directly to the operations or financial reporting of the registrant; and
(iv) establishment by the audit committee, if deemed necessary or appropriate, as an alternative to committee pre-approval of services to be provided by the auditors, as required by paragraphs (ii) and (iii) above, of policies and procedures to permit such services to be pre-approved by other means, such as through establishment of guidelines or by action of a designated member or members of the committee; provided the policies and procedures are detailed as to the particular service and the committee is informed of each service and such policies and procedures do not include delegation of audit committee responsibilities, as contemplated under the Securities Exchange Act of 1934, to management; subject, in the case of (ii) through (iv), to any waivers, exceptions or exemptions that may be available under applicable law or rules.
(e) (2) None of the services provided to the registrant described in paragraphs (b)-(d) of Item 4 were approved by the audit committee pursuant to paragraph (c)(7)(i)(C) of Rule 2-01 of regulation S-X.
(f) No disclosures are required by this Item 4(f).
(g) The aggregate non-audit fees paid to the principal accountant for services rendered by the principal accountant to the registrant and the registrant’s investment adviser and any entity controlling, controlled by or under common control with the investment adviser that provides ongoing services to the registrant were $80,103 for the fiscal year ended May 31, 2015 and $77,000 for the fiscal year ended May 31, 2014.
(h) The registrant’s audit committee of the board has considered whether the provision of non-audit services that were rendered to the registrant’s investment adviser (not including any sub-adviser whose role is primarily portfolio management and is subcontracted with or overseen by another investment adviser), and any entity controlling, controlled by, or under common control with the investment adviser that provides ongoing services to the registrant that were not pre-approved pursuant to paragraph (c)(7)(ii) of Rule 2-01 of Regulation S-X is compatible with maintaining the principal accountant’s independence.
Item 5. Audit Committee of Listed Registrants. N/A
Item 6. Schedule of Investments. N/A
Item 7. Disclosure of Proxy Voting Policies and Procedures for Closed-
End Management Investment Companies. N/A
Item 8. Portfolio Managers of Closed-End Management Investment
Companies. N/A
Item 9. Purchases of Equity Securities by Closed-End Management
Investment Company and Affiliated Purchasers. N/A
Item 10. Submission of Matters to a Vote of Security Holders.
There have been no changes to the procedures by which shareholders may recommend nominees to the Registrant's Board of Trustees that would require disclosure herein.
Item 11. Controls and Procedures.
(a) Evaluation of Disclosure Controls and Procedures. The Registrant maintains disclosure controls and procedures that are designed to ensure that information required to be disclosed in the Registrant’s filings under the Securities Exchange Act of 1934 and the Investment Company Act of 1940 is recorded, processed, summarized and reported within the periods specified in the rules and forms of the Securities and Exchange Commission. Such information is accumulated and communicated to the Registrant’s management, including its principal executive officer and principal financial officer, as appropriate, to allow timely decisions regarding required disclosure. The Registrant’s management, including the principal executive officer and the principal financial officer, recognizes that any set of controls and procedures, no matter how well designed and operated, can provide only reasonable assurance of achieving the desired control objectives.
Within 90 days prior to the filing date of this Shareholder Report on Form N-CSR, the Registrant had carried out an evaluation, under the supervision and with the participation of the Registrant’s management, including the Registrant’s principal executive officer and the Registrant’s principal financial officer, of the effectiveness of the design and operation of the Registrant’s disclosure controls and procedures. Based on such evaluation, the Registrant’s principal executive officer and principal financial officer concluded that the Registrant’s disclosure controls and procedures are effective.
(b) Changes in Internal Controls. There have been no changes in the Registrant’s internal controls or in other factors that could materially affect the internal controls over financial reporting subsequent to the date of their evaluation in connection with the preparation of this Shareholder Report on Form N-CSR.
Item 12. Exhibits.
(a) (1) Code of Ethics
(a)(2) Certifications pursuant to Section 302 of the Sarbanes-Oxley Act of 2002 of Laura F. Fergerson, Chief Executive Officer - Finance and Administration, and Robert G. Kubilis, Chief Financial Officer and Chief Accounting Officer
(b) Certifications pursuant to Section 906 of the Sarbanes-Oxley Act of 2002 of Laura F. Fergerson, Chief Executive Officer - Finance and Administration, and Robert G. Kubilis, Chief Financial Officer and Chief Accounting Officer
SIGNATURES
Pursuant to the requirements of the Securities Exchange Act of 1934 and the Investment Company Act of 1940, the registrant has duly caused this report to be signed on its behalf by the undersigned, thereunto duly authorized.
FRANKLIN ALTERATIVE STRATEGIES FUNDS
By /s/ Laura F. Fergerson
Laura F. Fergerson
Chief Executive Officer –
Finance and Administration
Date July 27, 2015
Pursuant to the requirements of the Securities Exchange Act of 1934 and the Investment Company Act of 1940, this report has been signed below by the following persons on behalf of the registrant and in the capacities and on the dates indicated.
By /s/ Laura F. Fergerson
Laura F. Fergerson
Chief Executive Officer –
Finance and Administration
Date July 27, 2015
By /s/ Robert G. Kubilis
Robert G. Kubilis
Chief Financial Officer and
Chief Accounting Officer
Date July 27, 2015