UNITED STATES
SECURITIES AND EXCHANGE COMMISSION
Washington, D.C. 20549
Form 10-K
| x | ANNUAL REPORT PURSUANT TO SECTION 13 OR 15(d) OF THE SECURITIES EXCHANGE ACT OF 1934 |
For the fiscal year ended December 31, 2012
OR
| ¨ | TRANSITION REPORT PURSUANT TO SECTION 13 OR 15(d) OF THE SECURITIES EXCHANGE ACT OF 1934 |
For the transition period from to
COMMISSION FILE NO.: 333-178458
Northern Tier Energy LLC
(Exact name of registrant as specified in its charter)
| | |
| Delaware | | 27-3005162 |
(State or other jurisdiction of incorporation or organization) | | (I.R.S. Employer Identification No.) |
38C Grove Street, Suite 100
Ridgefield, Connecticut 06877
(Address of principal executive offices and Zip Code)
(203) 244-6550
(Registrant’s telephone number including area code)
Securities registered pursuant to Section 12(b) of the Act:
| | |
Title of each class | | Name of each exchange on which registered |
N/A | | N/A |
Securities registered pursuant to Section 12(g) of the Act: None
Indicate by check mark if the registrant is a well-known seasoned issuer, as defined in Rule 405 of the Securities Act. ¨ Yes x No
Indicate by check mark if the registrant is not required to file reports pursuant to Section 13 or Section 15(d) of the Act. x Yes ¨ No
Indicate by check mark whether the registrant (1) has filed all reports required to be filed by Section 13 or 15(d) of the Securities Exchange Act of 1934 during the preceding 12 months (or for such shorter period that the registrant was required to file such reports), and (2) has been subject to such filing requirements for the past 90 days. x Yes ¨ No
Indicate by check mark whether the registrant has submitted electronically and posted on its corporate Web site, if any, every Interactive Data File required to be submitted and posted pursuant to Rule 405 of Regulation S-T (§ 232.405 of this chapter) during the preceding 12 months (or for such shorter period that the registrant was required to submit and post such files). x Yes ¨ No
Indicate by check mark if disclosure of delinquent filers pursuant to Item 405 of Regulation S-K is not contained herein, and will not be contained, to the best of registrant’s knowledge, in definitive proxy or information statements incorporated by reference in Part III of this Form 10-K or any amendment to this Form 10-K. ¨
Indicate by check mark whether the registrant is a large accelerated filer, an accelerated filer, a non-accelerated filer, or a smaller reporting company. See the definitions of “large accelerated filer,” “accelerated filer,” and “smaller reporting company” in Rule 12b-2 of the Exchange Act. (Check one)
| | | | | | |
| Large Accelerated Filer | | ¨ | | Accelerated Filer | | ¨ |
| | | |
| Non-Accelerated Filer | | x | | Smaller Reporting Company | | ¨ |
Indicate by check mark whether the registrant is a shell company (as defined in Rule 12b-2 of the Exchange Act). ¨ Yes x No
As of June 29, 2012, the last business day of the registrant’s most recently completed second fiscal quarter, the registrant’s equity was not listed on any domestic exchange or over-the-counter market.
As of March 28, 2013, the outstanding membership interest in Northern Tier Energy LLC was directly and indirectly held by Northern Tier Energy LP.
Northern Tier Energy LLC meets the conditions set forth in General Instructions (I)(1)(a) and (b) of Form 10-K and is therefore filing this form with the reduced disclosures format.
DOCUMENTS INCORPORATED BY REFERENCE: None
NORTHERN TIER ENERGY LLC
FORM 10-K FOR THE YEAR ENDED DECEMBER 31, 2012
TABLE OF CONTENTS
i
CAUTIONARY NOTICE REGARDING FORWARD-LOOKING STATEMENTS
This Annual Report on Form 10-K contains statements that may constitute forward-looking statements. You can identify these statements by forward-looking words such as “anticipate,” “believe,” “could,” “estimate,” “expect,” “intend,” “may,” “plan,” “potential,” “should,” “will,” “would,” or similar words. You should read statements that contain these words carefully because they discuss our current plans, strategies, prospects, and expectations concerning our business, operating results, financial condition, and other similar matters. While we believe that these forward-looking statements are reasonable as and when made, there may be events in the future that we are not able to predict accurately or control, and there can be no assurance that future developments affecting our business will be those that we anticipate. Our forward-looking statements involve significant risks and uncertainties (some of which are beyond our control) and assumptions that could cause actual results to differ materially from our historical experience and our present expectations or projections. Known material factors that could cause our actual results to differ from those in the forward-looking statements are those described in Part I, “Item 1A. Risk Factors.”
Readers are cautioned not to place undue reliance on forward-looking statements, which speak only as of the date hereof. We undertake no obligation to publicly update or revise any forward-looking statements after the date they are made, whether as a result of new information, future events or otherwise.
ii
GLOSSARY FOR SELECTED TERMS
“3:2:1 crack spread” refers to the approximate refining margin resulting from processing three barrels of crude oil to produce two barrels of gasoline and one barrel of distillate;
“Barrel” refers to a common unit of measure in the oil industry, which equates to 42 gallons;
“Barrels per stream day” as defined by the EIA, represents the maximum number of barrels of input that a distillation facility can process within a 24-hour period when running at full capacity under optimal crude and product slate conditions with no allowance for downtime;
“Blendstocks” refers to various compounds that are combined with gasoline or diesel from the crude oil refining process to make finished gasoline and diesel; these may include natural gasoline, fluid catalytic cracking unit or FCCU gasoline, ethanol, reformate or butane, among others;
“Bpd” refers to an abbreviation for barrels per calendar day, which is defined by the EIA as the amount of input that a distillation facility can process under usual operating conditions reduced for regular limitations that may delay, interrupt, or slow down production such as downtime due to such conditions as mechanical problems, repairs, and slowdowns;
“Catalyst” refers to a substance that alters, accelerates, or instigates chemical changes, but is neither produced, consumed nor altered in the process;
“Coke” refers to a coal-like substance that is produced during the refining process;
“Complexity” refers to the number, type and capacity of processing units at a refinery, measured by an index, which is often used as a measure of a refinery’s ability to process lower cost crude oils into higher value light refined products, including transportation fuels, such as gasoline and distillates;
“Crack spread” refers to a simplified calculation that measures the difference between the price for light products and crude oil;
“Distillates” refers to primarily diesel, kerosene and jet fuel;
“EIA” refers to the Energy Information Administration. An independent agency within the U.S. Department of Energy that develops surveys, collects energy data, and analyzes and models energy issues;
“Ethanol” refers to a clear, colorless, flammable oxygenated hydrocarbon. Ethanol is typically produced chemically from ethylene, or biologically from fermentation of various sugars from carbohydrates found in agricultural crops and cellulosic residues from crops or wood. It is used in the United States as a gasoline octane enhancer and oxygenate;
“Feedstocks” refers to petroleum products, such as crude oil, that are processed and blended into refined products;
“Group 3 3:2:1 crack spread” refers to the 3:2:1 crack spread calculated using the market value of PADD II Group 3 conventional gasoline and ultra low sulfur diesel against the market value of NYMEX WTI;
“Light products” refers to the group of refined products with lower boiling temperatures, including gasoline and distillates;
“Mechanical availability” refers to unit rate capacity less lost capacity due to unplanned downtime less downtime due to planned maintenance divided by unit rated capacity less downtime due to planned maintenance;
“OSHA Recordable Rate” means the injury frequency rate reported by the Company to OSHA, which is equal to the number of recordable injures in a particular period multiplied by 200,000 and divided by the total hours worked in such period, including both employees and contractors;
“PADD II” refers to the Petroleum Administration for Defense District II region of the United States, which covers Illinois, Indiana, Iowa, Kansas, Kentucky, Michigan, Minnesota, Missouri, Nebraska, North Dakota, South Dakota, Ohio, Oklahoma, Tennessee and Wisconsin;
“Refined products” refers to petroleum products, such as gasoline, diesel and jet fuel, which are produced by a refinery;
“Sour crude oil” refers to a crude oil that is relatively high in sulfur content, requiring additional processing to remove the sulfur. Sour crude oil is typically less expensive than sweet crude oil;
iii
“Sweet crude oil” refers to a crude oil that is relatively low in sulfur content, requiring less processing to remove the sulfur. Sweet crude oil is typically more expensive than sour crude oil;
“Throughput” refers to the volume processed through a unit or a refinery;
“Turnaround” refers to a periodically required standard procedure to refurbish and maintain a refinery that involves the shutdown and inspection of major processing units and occurs every three to four years on industry average;
“Upper Great Plains” refers to a portion of the PADD II region and includes Minnesota, North Dakota, South Dakota and Wisconsin;
“WTI” refers to West Texas Intermediate crude oil, a light, sweet crude oil, characterized by an American Petroleum Institute gravity, or API gravity, between 39 and 41 and a sulfur content of approximately 0.4 weight percent that is used as a benchmark for other crude oils; and
“Yield” refers to the percentage of refined products that is produced from crude oil and other feedstocks.
iv
PART I
| Items 1 and | 2. Business and Properties. |
Overview
We are an independent downstream energy company with refining, retail and pipeline operations that serves the PADD II region of the United States. We are an indirect wholly-owned subsidiary of Northern Tier Energy LP (“NTE LP”). NTE LP completed its initial public offering (“IPO”) on July 31, 2012. We operate our assets in two business segments: the refining business and the retail business. For the year ended December 31, 2012, we had total revenues of approximately $4.7 billion, operating income of $572.4 million, net income of $199.0 million and Adjusted EBITDA of $739.7 million. For the year ended December 31, 2011, we had total revenues of $4.3 billion, operating income of $422.6 million, net income of $28.3 million and Adjusted EBITDA of $430.7 million. A definition and reconciliation of Adjusted EBITDA to net income is included herein under the caption “Item 7. Management’s Discussion and Analysis of Financial Condition and Results of Operations—Adjusted EBITDA.”
Refining Segment
Our refining segment primarily consists of an 81,500 barrels per calendar day (“bpd”) (84,500 barrels per stream day) refinery located in St. Paul Park, Minnesota. Our refinery has a complexity index of 11.5, which refers to the ability of a refinery to produce finished products based on its investment intensity and cost relative to other refineries. Our refinery’s complexity allows us to process a variety of light, heavy, sweet and sour crudes into higher value refined products.
We are one of only two refineries in Minnesota and one of four refineries in the Upper Great Plains area within the PADD II region. The PADD II region covers Illinois, Indiana, Iowa, Kansas, Kentucky, Michigan, Minnesota, Missouri, Nebraska, North Dakota, South Dakota, Ohio, Oklahoma, Tennessee and Wisconsin. Our strategic location allows us direct access, primarily via the Minnesota Pipeline, to what we believe are abundant supplies of advantageously priced crude oils. Of the crude oil processed at our refinery in the years ended December 31, 2012 and 2011, approximately 47% and 51%, respectively, was Canadian crude oil and the remainder was primarily comprised of light sweet crude oil from the Bakken Shale in North Dakota. Many of these crude oils have historically priced at a discount to the NYMEX WTI. Further, over the past twelve months, NYMEX WTI has traded at an additional discount relative to waterborne crude oils.
We expect to continue to benefit from our access to these growing crude oil supplies. By 2030, according to the Canadian Association of Petroleum Producers (“CAPP”), total Canadian crude oil production is expected to grow to 6.2 million bpd from 2011 production of 3.0 million bpd. Crude oil production from the Bakken Shale in North Dakota has also increased significantly, helping to grow crude oil production in North Dakota from approximately 98,000 bpd in 2005 to approximately 769,000 bpd as of December 2012, and is expected to continue to grow due to improvements in unconventional resource production techniques.
Our location also allows us to distribute our refined products throughout the midwestern United States. Our refinery produces a broad slate of refined products including gasoline, diesel, jet fuel and asphalt, which are then marketed to resellers and consumers primarily in the PADD II region. Approximately 80% and 79% of our total refinery production for the years ended December 31, 2012 and 2011, respectively, was comprised of higher value, light refined products, including gasoline and distillates.
We also own various storage and transportation assets, including a light products terminal, a heavy products terminal, storage tanks, rail loading/unloading facilities and a Mississippi river dock. Approximately 78% and 83% of our gasoline and diesel volumes for the years ended December 31, 2012 and 2011, respectively, were sold via our light products terminal to our company-operated and franchised SuperAmerica branded convenience stores, Marathon branded convenience stores and other resellers. We have a contract with Marathon to supply substantially all of the gasoline and diesel requirements for the independently owned and operated Marathon branded convenience stores in our marketing area. Beginning in December 2012, we initiated a crude oil transportation business in North Dakota to allow us to purchase crude oil at the wellhead in the Bakken Shale while limiting the impact of rising trucking costs for crude oil in North Dakota.
1
Our refining business also includes our 17% interest in the Minnesota Pipe Line Company, which owns and operates the Minnesota Pipeline, a 455,000 bpd crude oil pipeline system that transports crude oil (primarily from Western Canada and North Dakota) for approximately 300 miles from the Enbridge pipeline hub at Clearbrook, Minnesota to our refinery. The Minnesota Pipeline has historically transported the majority of the crude oil used and processed in our refinery.
Retail Segment
As of December 31, 2012, our retail segment operated 166 convenience stores under the SuperAmerica brand and also supported 70 franchised convenience stores, which are also operated under the SuperAmerica brand. These convenience stores are located primarily in Minnesota and Wisconsin and sell various grades of gasoline and diesel, tobacco products and immediately consumable items such as beverages, prepared food and a large variety of snacks and prepackaged items. Our refinery supplied substantially all of the gasoline and diesel sold in our company-operated and franchised convenience stores for the years ended December 31, 2012 and 2011.
We also own and operate SuperMom’s Bakery, which prepares and distributes baked goods and other prepared food items for sale in our company-operated and franchised convenience stores and other third party locations.
Refining Industry Overview
Crude oil refining is the process of separating the hydrocarbons present in crude oil for the purpose of converting them into marketable finished, or refined, petroleum products such as gasoline, diesel, jet fuel, asphalt and other products. Refining is primarily a margin-based business where both the feedstock (primarily crude oil) and the refined products are commodities with fluctuating prices. In order to increase profitability, it is important for a refinery to maximize the yields of high value finished products and to minimize the costs of feedstock and operating expenses.
According to the EIA, as of January 1, 2012, there were 134 oil refineries operating in the United States, with the 14 smallest each having a refining capacity of 14,000 bpd or less, and the 10 largest having capacities ranging from 327,000 bpd to 560,500 bpd.
High capital costs, historical excess capacity and environmental regulatory requirements have limited the construction of new refineries in the United States over the past 30 years. According to the EIA, domestic operating refining capacity has increased approximately 4% between January 1982 and January 2012 from 16.1 million bpd to 16.7 million bpd. Much of this increase in capacity is generally the result of efficiency measures and moderate expansions at various refineries, known as “capacity creep,” but some significant expansions at existing refineries have occurred as well. During this same time period, more than 110 generally smaller and less efficient refineries that had limited access to a wide variety of crude oils or were unable to profitably process feedstock into a marketable product mix were closed.
According to the EIA, total demand for refined products in PADD II, which is the region in which we operate, has represented approximately 26% of total U.S. refined products demand from 2007 to 2011. Within PADD II, refined product production capacity is currently insufficient to meet demand. For example, according to the EIA, due to product supply shortfalls within PADD II, net receipts of gasoline, distillate (inclusive of jet fuel and kerosene) and jet fuel/kerosene from domestic sources outside of PADD II comprised approximately 17%, 14% and 14%, respectively, of demand for these products. Refining capacity in the PADD II region has decreased approximately 3% between January 1982 and January 2012 from approximately 3.8 million bpd to approximately 3.6 million bpd, while more than 25 refineries in the PADD II region have ceased operations. The refined product volumes that are necessary to satisfy the demand in excess of PADD II production are primarily sourced from domestic refineries located outside of PADD II, specifically from the U.S. Gulf Coast.
2
The following tables illustrate the balance of certain refined products in PADD II from 2005—2011:
PADD II Gasoline Balance (mbpd)
| | | | | | | | | | | | | | | | | | | | | | | | | | | | |
| | | 2005 | | | 2006 | | | 2007 | | | 2008 | | | 2009 | | | 2010 | | | 2011 | |
Production by Refineries Within PADD II | | | 1,816 | | | | 1,796 | | | | 1,769 | | | | 1,713 | | | | 1,778 | | | | 1,807 | | | | 1,837 | |
Net Receipts of Products from Domestic Sources Outside PADD II | | | 673 | | | | 691 | | | | 673 | | | | 594 | | | | 550 | | | | 482 | | | | 417 | |
Ethanol | | | 136 | | | | 138 | | | | 179 | | | | 243 | | | | 222 | | | | 231 | | | | 225 | |
Exports to Non-U.S. Sources | | | 0 | | | | (2 | ) | | | (11 | ) | | | (19 | ) | | | (1 | ) | | | (5 | ) | | | (8 | ) |
Imports from Non-U.S. Sources | | | 2 | | | | 1 | | | | 2 | | | | 1 | | | | 1 | | | | 3 | | | | 3 | |
Other | | | (1 | ) | | | 5 | | | | 7 | | | | 12 | | | | (15 | ) | | | 8 | | | | (11 | ) |
| | | | | | | | | | | | | | | | | | | | | | | | | | | | |
Total | | | 2,626 | | | | 2,629 | | | | 2,619 | | | | 2,544 | | | | 2,535 | | | | 2,526 | | | | 2,463 | |
| | | | | | | | | | | | | | | | | | | | | | | | | | | | |
PADD II Distillate Balance (mbpd)
| | | | | | | | | | | | | | | | | | | | | | | | | | | | |
| | | 2005 | | | 2006 | | | 2007 | | | 2008 | | | 2009 | | | 2010 | | | 2011 | |
Production by Refineries Within PADD II | | | 908 | | | | 914 | | | | 927 | | | | 987 | | | | 898 | | | | 963 | | | | 989 | |
Net Receipts of Products from Domestic Sources Outside PADD II | | | 344 | | | | 332 | | | | 336 | | | | 249 | | | | 180 | | | | 195 | | | | 155 | |
Exports to Non-U.S. Sources | | | (9 | ) | | | (2 | ) | | | (6 | ) | | | (12 | ) | | | (6 | ) | | | (3 | ) | | | (5 | ) |
Imports from Non-U.S. Sources | | | 4 | | | | 6 | | | | 6 | | | | 5 | | | | 4 | | | | 6 | | | | 2 | |
Other | | | 2 | | | | 5 | | | | (8 | ) | | | (7 | ) | | | 1 | | | | 1 | | | | (3 | ) |
| | | | | | | | | | | | | | | | | | | | | | | | | | | | |
Total | | | 1,249 | | | | 1,255 | | | | 1,255 | | | | 1,222 | | | | 1,077 | | | | 1,162 | | | | 1,138 | |
| | | | | | | | | | | | | | | | | | | | | | | | | | | | |
PADD II Jet Fuel/Kerosene Balance (mbpd)
| | | | | | | | | | | | | | | | | | | | | | | | | | | | |
| | | 2005 | | | 2006 | | | 2007 | | | 2008 | | | 2009 | | | 2010 | | | 2011 | |
Production by Refineries Within PADD II | | | 230 | | | | 220 | | | | 202 | | | | 209 | | | | 208 | | | | 219 | | | | 229 | |
Net Receipts of Products from Domestic Sources Outside PADD II | | | 145 | | | | 119 | | | | 115 | | | | 74 | | | | 49 | | | | 41 | | | | 36 | |
Exports to Non-U.S. Sources | | | (1 | ) | | | (4 | ) | | | (7 | ) | | | (10 | ) | | | (5 | ) | | | (4 | ) | | | (7 | ) |
Imports from Non-U.S. Sources | | | 0 | | | | 0 | | | | 0 | | | | 0 | | | | 0 | | | | 0 | | | | 0 | |
Other | | | (3 | ) | | | 2 | | | | 1 | | | | 2 | | | | (4 | ) | | | (1 | ) | | | (2 | ) |
| | | | | | | | | | | | | | | | | | | | | | | | | | | | |
Total | | | 371 | | | | 337 | | | | 311 | | | | 275 | | | | 248 | | | | 255 | | | | 256 | |
| | | | | | | | | | | | | | | | | | | | | | | | | | | | |
Source: EIA; see “Market and Industry Data and Forecasts.”
Our Refining Business
Our refinery occupies approximately 170 acres along the Mississippi River in the southeast of St. Paul Park, Minnesota and was originally built in 1939. The refinery was acquired by Ashland Oil, Inc. in 1970 from Northwestern Refining, was jointly owned by Ashland Oil, Inc. and Marathon from 1998 through 2005 and became fully owned by Marathon in 2005. Our refinery is an 81,500 bpd (84,500 barrels per stream day) cracking facility with operations including crude fractionation, catalytic cracking, hydrotreating, reforming, alkylation, sulfur recovery and a hydrogen plant. A major refinery improvement and expansion project was completed in 1993 to enable the refinery to produce environmentally compatible low sulfur fuels. In 2006, the gas oil hydrotreater was revamped at a capital cost of approximately $24 million, which enables us to produce ultra low sulfur diesel. The fluid catalytic cracking unit was expanded in 2007 for a total capital cost of approximately $37 million, which improved gasoline yield and increased capacity from 27,100 bpd to 28,500 bpd. We completed a multi-year boiler replacement project, which entailed $19.9 million of capital expenditures over the project life, $12.7 million during the period from 2008 through November 30, 2010 and $7.2 million during the period from December 1, 2010 through December 31, 2011. Our refining capital expenditures in the year ended December 31, 2012 were $24.2 million.
3
A refinery’s location can have an important impact on its refining margins because location can influence access to feedstocks and efficient distribution for refined products. There are five regions in the United States, the PADDs, that have historically experienced varying levels of refining profitability due to regional market conditions. Refiners located in the U.S. Gulf Coast region operate in a highly competitive market due to the fact that this region (“PADD III”) accounts for approximately 39% of the total number of operable U.S. refineries as of January 2012 and approximately 47% of the country’s refining capacity as of January 2012. Our refinery is located in the strategically advantageous PADD II region. In recent years, demand for refined products in the PADD II region has exceeded regional capacity, resulting in a need for imports from other regions, specifically from the U.S. Gulf Coast region. Our inland location means that foreign and coastal domestic refiners seeking to access our marketing area would incur additional transportation costs. This favorable supply/demand imbalance has allowed our refinery to generate higher refining margins, compared to the U.S. Gulf Coast 3:2:1 crack spread. We have realized, on average, a premium of $4.14 per barrel, inclusive of refined product and crude differentials, relative to the benchmark Group 3 3:2:1 crack spread over the past five years through December 31, 2012 assuming a comparable rate of two barrels of Group 3 gasoline and one barrel of Group 3 distillate for every three barrels of WTI crude oil.
The refinery is an integrated refining operation with significant storage and transportation assets. Our transportation assets include our 17% interest in the Minnesota Pipe Line Company, an eight-bay light product terminal located approximately two miles from the refinery, a seven-bay heavy product loading rack located on the refinery property, rail facilities for shipping liquefied petroleum gas (“LPG”) and asphalt and receiving butane, isobutane and ethanol and a barge dock on the Mississippi River used primarily for shipping vacuum residue and slurry. As of December 31, 2012, our storage assets included 84 hydrocarbon storage tanks with a total capacity of 3.7 million barrels, 0.8 million barrels of crude oil storage and 2.9 million barrels of feedstock and product storage.
4
Process Summary
Our refinery is an 81,500 bpd (84,500 barrels per stream day) cracking facility with operations including crude fractionation, catalytic cracking, hydrotreating, reforming, alkylation, sulfur recovery and a hydrogen plant. We have significant redundancy in our refining assets, which include two crude oil distillation and vacuum towers, two reformers, two sulfur recovery units and five hydrotreating units. This redundancy allows us to continue to receive and process crude oil even if one tower goes out of service and also allows for increased maintenance flexibility as a redundant unit may be used without having to shut down the entire refinery in the case of a major unit turnaround. During the year ended December 31, 2012 and the year ended December 31, 2011, the refinery processed 81,779 bpd and 77,452 bpd of crude oil, respectively, and 2,072 bpd and 3,698 bpd of other charge and blendstocks, respectively. The facility processes a mix of light sweet, synthetic and heavy sour crude oils, predominately from Canada and North Dakota, into products such as gasoline, diesel, jet fuel, asphalt, kerosene, propane, LPG, propylene and sulfur. Our refinery utilization rates, using standard industry methodologies for utilization measurement, have been 80%, 75% and 72% for the years ended December 31, 2012 and 2011 and for the period from December 1, 2010 to December 31, 2010, respectively. Please see below for a simplified process flow diagram of the major refining units at our refinery.
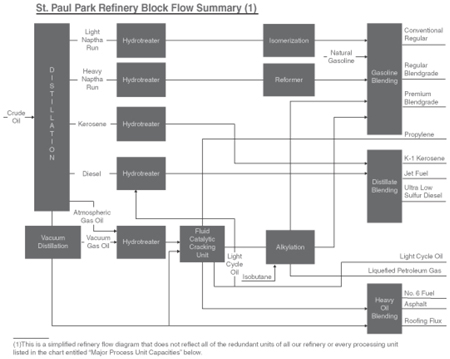
5
The following table summarizes our refinery’s major process unit capacities as of December 31, 2012. Unit capacities are shown in barrels per stream day.
| | | | | | | | |
Process Unit | | Capacity | | | % of Crude Oil Capacity | |
No. 1 Crude Oil Unit | | | 37,000 | | | | 44 | % |
No. 2 Crude Oil Unit | | | 47,500 | | | | 56 | % |
Vacuum Distillation Unit #1 | | | 19,000 | | | | 22 | % |
Vacuum Distillation Unit #2 | | | 22,500 | | | | 27 | % |
Catalytic Reforming Unit #1 | | | 13,500 | | | | 16 | % |
Catalytic Reforming Unit #2 | | | 9,000 | | | | 11 | % |
Fluid Catalytic Cracking Unit | | | 28,500 | | | | 34 | % |
HF Alkylation Unit | | | 5,500 | | | | 7 | % |
C4/C5/C6 Isom Unit | | | 8,500 | | | | 10 | % |
Isom Desulfurizer | | | 8,500 | | | | 10 | % |
Naphtha Hydrotreater #1 | | | 13,500 | | | | 16 | % |
Naphtha Hydrotreater #2 | | | 9,500 | | | | 11 | % |
Kerosene Hydrotreater | | | 7,800 | | | | 9 | % |
Distillate Hydrotreater | | | 24,900 | | | | 29 | % |
Gas Oil Hydrotreater | | | 29,500 | | | | 35 | % |
Hydrogen Plant (MSCF/D) | | | 8,000 | | | | — | |
Sulfur Recovery Units (Long Tons/day) | | | 100 | | | | — | |
TailGas Recovery Units (Long Tons/day) | | | 4 | | | | — | |
The complexity of a refinery refers to the number, type and capacity of processing units at the refinery and is measured by its complexity. Our refinery has a complexity index of 11.5. Our refinery’s complexity allows us to process lower cost crude oils into higher value light refined products or transportation fuels (gasoline and distillates), which comprised approximately 80% and 79% of our total refinery production for the years ended December 31, 2012 and 2011, respectively.
Raw Material Supply
The primary input for our refinery is crude oil, which represented approximately 98%, 95% and 92% of our total refinery throughput volumes for the years ended December 31, 2012, 2011 and 2010, respectively. We processed 81,779 bpd, 77,452 bpd and 74,142 bpd of crude oil for the years ended December 31, 2012, 2011 and 2010, respectively. The following table describes the historical feedstocks for our refinery:
| | | | | | | | | | | | | | | | | | | | | | | | |
| | | Year Ended December 31, | |
| | | 2012 | | | % | | | 2011 | | | % | | | 2010 | | | % | |
| | | (bpd) | |
Refinery Throughput Crude Oil Feedstocks by Location: | | | | | | | | | | | | | | | | | | | | | | | | |
Canadian and Other International | | | 38,332 | | | | 47 | % | | | 39,295 | | | | 51 | % | | | 41,156 | | | | 56 | % |
Domestic | | | 43,447 | | | | 53 | % | | | 38,157 | | | | 49 | % | | | 32,986 | | | | 44 | % |
| | | | | | | | | | | | | | | | | | | | | | | | |
Total Crude Oil | | | 81,779 | | | | 100 | % | | | 77,452 | | | | 100 | % | | | 74,142 | | | | 100 | % |
| | | | | | | | | | | | | | | | | | | | | | | | |
Crude Oil Feedstocks by Type: | | | | | | | | | | | | | | | | | | | | | | | | |
Light and Intermediate(1) | | | 60,326 | | | | 74 | % | | | 56,722 | | | | 73 | % | | | 55,782 | | | | 75 | % |
Heavy(1) | | | 21,453 | | | | 26 | % | | | 20,730 | | | | 27 | % | | | 18,360 | | | | 25 | % |
| | | | | | | | | | | | | | | | | | | | | | | | |
Total Crude Oil | | | 81,779 | | | | 100 | % | | | 77,452 | | | | 100 | % | | | 74,142 | | | | 100 | % |
| | | | | | | | | | | | | | | | | | | | | | | | |
Other Feedstocks/ Blendstocks(2): | | | | | | | | | | | | | | | | | | | | | | | | |
Natural Gasoline | | | 145 | | | | 7 | % | | | 1,910 | | | | 52 | % | | | 3,839 | | | | 64 | % |
Butanes | | | 1,294 | | | | 62 | % | | | 1,236 | | | | 33 | % | | | 1,242 | | | | 21 | % |
Gasoil | | | 58 | | | | 3 | % | | | 0 | | | | 0 | % | | | 446 | | | | 7 | % |
Other | | | 575 | | | | 28 | % | | | 552 | | | | 15 | % | | | 488 | | | | 8 | % |
| | | | | | | | | | | | | | | | | | | | | | | | |
Total Other Feedstocks/ Blendstocks | | | 2,072 | | | | 100 | % | | | 3,698 | | | | 100 | % | | | 6,015 | | | | 100 | % |
| | | | | | | | | | | | | | | | | | | | | | | | |
Total Inputs | | | 83,851 | | | | | | | | 81,150 | | | | | | | | 80,157 | | | | | |
6
| (1) | Crude oil is classified as light, intermediate or heavy, according to its measured American Petroleum Institute, or API, gravity. API gravity, which is expressed in degrees, is a scale developed for measuring the relative density of various petroleum liquids. It also serves as an approximate measure of crude oil’s value, as the higher the API gravity, the richer the yield in high value refined oil products, such as gasoline, diesel and jet fuel. For purposes of categorizing our crude oil feedstocks by type, light crude oil has an API gravity of 33 degrees or more, intermediate crude oil has API gravity between 28 and 33 degrees, and heavy crude has an API gravity of 28 degrees or less. |
| (2) | Other Feedstocks/Blendstocks includes only feedstocks/blendstocks that are used at the refinery, and does not include ethanol and biodiesel. Although we also purchase ethanol and biodiesel to supplement the fuels produced at the refinery, we do not include these in the table as those items are blended at the terminal located adjacent to the refinery or at terminals on the Magellan Pipe Line system. |
Of the crude oil processed at our refinery for the years ended December 31, 2012 and 2011, approximately 47% and 51%, respectively, was Canadian crude oil and the remainder was comprised of mostly light sweet crude oil from North Dakota. There is an abundant supply of Canadian crude oil, according to the EIA. Canada exported approximately 2.2 million bpd of crude oil into the United States in 2011, making it the largest exporter to the United States and representing 25% of all U.S. imports from foreign sources. By 2030, according to CAPP, total Canadian crude oil production is expected to grow to 6.2 million bpd from 2011 production of 3.0 million bpd. Additionally, U.S. demand for western Canadian oil supply is expected to reach 3.7 million bpd by 2020.
Crude production from North Dakota has increased significantly from approximately 98,000 bpd in 2005 to approximately 769,000 bpd as of December 2012, according to the EIA. The chart below shows crude oil bpd production in North Dakota, and illustrates the rapid increase in production attributable to the Bakken Shale. We believe production from the Bakken Shale will continue to increase due to continued growth in unconventional production.
North Dakota Crude Oil Production (thousands of BPD)
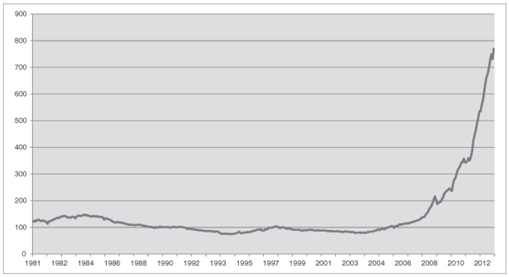
Source: EIA; see “Market and Industry Data and Forecasts.”
Crude Oil Supply
In March 2012, we entered into an amended and restated crude oil supply and logistics agreement with JPM CCC pursuant to which J.P. Morgan Commodities Canada Corporation (“JPM CCC”) assists us in the purchase of most of the crude oil requirements of our refinery. Once we identify cargos of crude oil and pricing terms that meet our requirements, we notify JPM CCC, which then provides, for a fee, credit, transportation and other logistical services for delivery of the crude oil to the Cottage Grove, Minnesota, storage tanks, which are approximately two miles from our refinery. Title to the crude oil passes from JPM CCC to us as the crude oil enters our refinery from the storage tanks located at Cottage Grove. The Cottage Grove storage tanks are leased by JPM CCC from us for the duration of the crude oil supply and logistics agreement. We believe our crude oil supply and logistics agreement significantly
7
reduces the investment that we are required to maintain in crude inventories and allows us to take title to, and price our crude oil, at the refinery, as opposed to the crude oil origination point. We also benefit from the reduction in the time we are exposed to market fluctuations before the finished product output is sold.
The approximately 455,000 bpd Minnesota Pipeline system is the primary supply route for crude oil to our refinery and has transported a significant majority of our crude oil since its major expansion in 2008. The Minnesota Pipeline extends from Clearbrook, Minnesota to the refinery and receives crude oil from Western Canada and North Dakota through connections with various Enbridge pipelines. The Minnesota Pipeline is an interstate crude oil pipeline regulated by the Federal Energy Regulatory Commission (“FERC”) pursuant to the Interstate Commerce Act (“ICA”). Access to capacity on the Minnesota Pipeline is governed by the pipeline’s tariff, which is filed with FERC and must comply with the applicable provisions of the ICA. Pursuant to the rules and regulations applicable to the Minnesota Pipeline, if nominations are received for more crude oil than the pipeline can transport in a given month, capacity is pro-rated based on each shipper’s relative use of the line over the preceding twelve-month period ending the month prior to the month the excess nominations were received, with further reductions as necessary to accommodate new shippers. For the years ended December 31, 2012 and 2011, our shipments comprised approximately 24% of the total volumes shipped on the Minnesota Pipeline. Our 17% interest in the Minnesota Pipe Line Company mitigates the impact of tariff rate increases on the pipeline, as we receive a pro rata share of tariffs. See “—Pipeline Assets” for more information regarding the Minnesota Pipeline system.
In addition to the Minnesota Pipeline, the refinery is also capable of receiving crude oil from the Wood River Pipeline (owned and operated by affiliates of Koch Industries, Inc.). The Wood River Pipeline extends from Wood River, Illinois to a connection with the Minnesota Pipeline near Pine Bend, Minnesota, allowing for deliveries to the refinery and providing the refinery with access to crude supply from the Cushing, Oklahoma area via the Ozark Pipeline and to crude supply from the U.S. Gulf Coast and foreign markets via Capline and Capwood pipelines.
Below is a map illustrating the pipelines that provide the refinery with access to its crude oil supply:

Other Feedstocks/Blendstocks
The refinery also purchases ethanol and biodiesel, as well as conventional petroleum based blendstocks such as natural gasoline to supplement the fuels produced at the refinery. We purchase ethanol for blending with gasoline to meet the oxygenated fuel mandate levels of the United States Environmental Protection Agency (“EPA”). The state of Minnesota has a current mandate for all gasoline power motor vehicles for 10% ethanol blending in gasoline or the maximum amount of ethanol allowed under federal law, whichever is greater. The same legislation will require 20% ethanol blending in gasoline or the maximum amount of ethanol allowed under federal law, whichever is greater, effective August 30, 2013. Federal law currently allows a maximum of 15% ethanol for cars and light trucks manufactured since 2001, and 10% ethanol for all other vehicles. In addition, there is a biodiesel mandate in Minnesota
8
requiring the blending of diesel with 5% bio-fuel. If certain preconditions are met, the minimum biodiesel content in diesel sold in the state was to increase to 10% beginning on May 1, 2012, and to 20% beginning on May 1, 2015. The increase to 10% did not occur on May 1, 2012, because the Minnesota Commissioners of Agriculture, Commerce and Pollution Control did not certify that all statutory pre-conditions were satisfied by the statutory deadline, but instead jointly recommended delaying the increase to 10% by one year, to May 1, 2013. We purchase ethanol and biodiesel blendstocks pursuant to month-to-month agreements with market related pricing provisions and receive those volumes primarily via truck. We purchase natural gasoline blendstock from third parties that is delivered to us via third party pipeline.
Refined Products—Production, Sales and Transportation
On average over the last three fiscal years, the refinery produced approximately 82,548 bpd of refined products, of which 49% was gasoline, 30% were distillates (including ultra low sulfur diesel and jet fuel), 12% was asphalt and the remainder was made up of propane, heavy fuel and other specialty products. The following table identifies the product yield of our refinery for each of the periods indicated.
| | | | | | | | | | | | |
| | | Year Ended December 31, | |
| | | 2012 | | | 2011 | | | 2010 | |
Refinery product yields (bpd): | | | | | | | | | | | | |
Gasoline | | | 40,825 | | | | 40,240 | | | | 41,199 | |
Distillate | | | 27,113 | | | | 24,841 | | | | 22,546 | |
Asphalt | | | 11,434 | | | | 9,888 | | | | 9,495 | |
Other | | | 5,158 | | | | 7,110 | | | | 7,794 | |
| | | | | | | | | | | | |
Total Production | | | 84,530 | | | | 82,079 | | | | 81,034 | |
| | | | | | | | | | | | |
For the years ended December 31, 2012, 2011 and 2010, gasoline accounted for 52%, 54%, and 51% of our total revenue for the refining business for such periods, respectively, and distillates accounted for 35%, 33%, and 28% of our total revenue for the refining business for such periods, respectively.
Approximately 78% and 90% of the refinery business’s gasoline and diesel volumes were sold within the state of Minnesota for the years ended December 31, 2012 and 2011, respectively, with the remainder being sold within Iowa, Nebraska, Oklahoma, South and North Dakota and Wisconsin. Our refinery supplied substantially all of the gasoline and diesel sold in our company-operated or franchised convenience stores for the years ended December 31, 2012 and 2011, as well as supplied the independently owned and operated Marathon branded stores in our marketing area.
Primary distribution for the fuels is through our light products terminal, which is equipped with an eight-bay, bottom-loading truck rack and located adjacent to the refinery. Approximately 78% and 83% of our gasoline and diesel volumes for the years ended December 31, 2012 and 2011, respectively, were sold through this light products terminal to our company-operated or franchised SuperAmerica convenience stores, Marathon branded convenience stores and other resellers throughout our market area. Light refined products, which include gasoline and distillates, are distributed from the refinery through a pipeline and terminal system owned by Magellan, which has facilities throughout the Upper Great Plains. Asphalt and heavy fuel oil are transported from the refinery via truck from our seven-bay heavy products terminal and via rail and barge through our rail facilities and Mississippi River barge dock and are sold to a broad customer base. See “—Refining Operations Customers” below.
Refining Operations Suppliers
The primary input for our refinery is crude oil, which represented approximately 98% and 95% of our total refinery throughput volumes for the years ended December 31, 2012 and 2011, respectively. JPM CCC assists us in the purchase of most of the crude oil requirements of our refinery and provides transportation and other logistical services for delivery of the crude oil to our storage tanks at Cottage Grove, Minnesota, which are approximately two miles from our refinery. We also purchase ethanol and biodiesel, as well as conventional petroleum based blendstocks such as natural gasoline to supplement the fuels produced at the refinery. For more information, see “—Crude Oil Supply” and “—Other Feedstocks/Blendstocks.”
Refining Operations Customers
Our refinery supplies substantially all of the gasoline and diesel sold in our company-operated and franchised convenience stores, as well as substantially all of the gasoline and diesel sold in independently owned and operated Marathon branded stores in our marketing area. For the years ended December 31, 2012 and 2011, Marathon branded stores accounted for approximately 8% and 9%, respectively, of our refined product sales volumes. For more information about the risks associated with our commercial relationship with Marathon, see “Item 1A. Risk Factors—General Business and Industry Risks—Our arrangements with Marathon expose us to Marathon related credit and performance risk.”
9
Asphalt and heavy fuel oil are sold to a broad customer base, including asphalt paving contractors, government entities (states, counties, cities and townships), and asphalt roofing shingle manufacturers.
Turnaround and Refinery Reliability
Periodically, we have planned maintenance turnarounds at our refinery, which require the temporary shutdown of certain operating units. The refinery generally undergoes a major facility turnaround every five to six years, and the last full plant turnaround was completed in 2007. The length of the turnaround is contingent upon the scope of work to be completed. A major turnaround of either the fluid catalytic cracking unit or alkylation unit, two of the main refinery units, generally takes two to four weeks to complete, and is planned and accomplished in a manner that allows for reduced production during maintenance instead of a complete shutdown. We completed a partial turnaround in April 2011, during which we replaced a catalyst in the distillate and gas oil hydrotreaters and conducted basic maintenance on the No. 1 crude unit. At the end of March 2012, we started a planned turnaround of the alkylation unit that was completed in early May 2012. We are currently planning a major plant turnaround to occur during April 2013 and another partial turnaround for our fluid catalytic cracking unit during October 2013, for which we have budgeted aggregate spending of approximately $55 to $60 million. The refinery is currently expected to have reduced throughputs during the months of April and October 2013 to complete the turnarounds.
Seasonality
Our refining business experiences seasonal effects, as the demand for gasoline products is generally higher during summer months than during winter months due to seasonal increases in highway traffic. Demand for diesel during winter months also decreases due to declines in agricultural work. As a result, our results of operations related to our refinery business for the first and fourth calendar quarters are generally lower than for those for the second and third calendar quarters. In addition, unseasonably cool weather in summer months and/or unseasonably warm weather in winter months in the markets in which we sell our refined products can impact the demand for gasoline and diesel.
Seasonal fluctuations in traffic also affect sales of motor fuels and merchandise in our convenience stores. Weather conditions in our operating area also have a significant effect on our retail operating results. Customers are more likely to purchase higher profit margin items at our convenience stores, such as fast foods, fountain drinks and other beverages and more gasoline during the spring and summer months, thereby typically generating higher revenues and gross margins for us in these periods. Unfavorable weather conditions during these months and a resulting lack of the expected seasonal upswings in traffic and sales could impact the demand for such higher profit margin items in those months.
Pipeline Assets
We own 17% of the outstanding common interests of the Minnesota Pipe Line Company and a 17% interest in MPL Investments, Inc. (“MPL Investments”) which owns 100% of the preferred interests of the Minnesota Pipe Line Company. The Minnesota Pipe Line Company owns the Minnesota Pipeline, a crude oil pipeline system in Minnesota that transports crude oil to the St. Paul area and which supplies most of our crude oil input. The remaining interests in the Minnesota Pipe Line Company are held by a subsidiary of Koch Industries, Inc., the owner of the only other refinery in Minnesota, with a 74.16% interest, and TROF, Inc. with an 8.84% interest. The Minnesota Pipeline system is also operated by a subsidiary of Koch Industries, Inc. Because we do not operate the Minnesota Pipeline or control the board of managers of the Minnesota Pipe Line Company, we do not control how the Minnesota Pipeline tariff is applied, including the tariff provisions governing the allocation of capacity, or control the decision-making with respect to tariff changes for the pipeline.
The Minnesota Pipeline system has multiple lines that run approximately 300 miles from Clearbrook in Clearwater County, Minnesota to Dakota County, Minnesota, transporting crude oil received through the Enbridge pipeline connections at Clearbrook from Western Canada and North Dakota to our refinery and Koch Industries’ Flint Hills Resources refinery in Minnesota. The system consists of a 24” pipeline, two parallel 16” pipelines and a partial third 16” pipeline with a combined capacity of approximately 455,000 bpd with further expansion capability to 640,000 bpd with the construction of an additional compressor station.
We also own an 8.6 mile 8” products pipeline, referred to as the Aranco Pipeline, which is leased to Magellan pursuant to an amended and restated agreement dated February 28, 2013, and used to ship refined products. The Aranco Pipeline extends from the refinery to a pipeline operated by Magellan as part of its products pipeline system. The Aranco Pipeline is operated by Magellan as part of their products system. The current annual lease amount is $750,000. The initial term of the lease agreement is for three years, subject to one-year auto renewals, and both parties have the right to terminate upon notice at least 180 days prior to the expiration of the then-current initial or renewal term. In addition, we own the Cottage Grove pipelines, which are 16” and 12” pipelines extending from the Cottage Grove tank farm, which is used to house the Cottage Grove storage tanks, to the refinery.
10
Our Retail Business
We have a retail-marketing network of 236 convenience stores, as of December 31, 2012, located throughout Minnesota, Wisconsin and South Dakota, of which we operate 166 stores and support 70 franchised stores, as set forth by location in the table below. All of our company-operated and franchised convenience stores are operated under the SuperAmerica brand. We also own and operate SuperMom’s Bakery, which prepares and distributes baked goods and other prepared items for sale in our retail outlets and for other third parties. Substantially all of the fuel gallons sold at the convenience stores for the years ended December 31, 2012 and 2011 was supplied by our refining business.
In December 2010, we entered into a lease arrangement with Realty Income Properties 3 LLC (“Realty Income”), pursuant to which we leased 135 SuperAmerica convenience stores and one support facility over a 15-year initial term at an aggregate annual rent fixed for five years at an annual rate of $20.3 million, with consumer price index-based rent increases thereafter. The stores covered under the lease are located in Minnesota and Wisconsin, and average approximately 3,500 leasable square feet on approximately 1.14 acres. In addition, the individual locations have, on average, 6.5 multi-pump gasoline dispensers, and are seasoned stores with long-term operating histories. Additionally, 30 of our other company-operated properties are leased pursuant to a combination of ground leases and real property leases with third parties and one company-operated property is owned by us.
The table below sets forth our company-operated and franchised stores by state as of December 31, 2012.
| | | | | | | | | | | | |
Location | | Company-
Operated | | | Franchised | | | Total | |
Minnesota | | | 159 | | | | 64 | | | | 223 | |
Wisconsin | | | 6 | | | | 5 | | | | 11 | |
South Dakota | | | 1 | | | | 1 | | | | 2 | |
| | | | | | | | | | | | |
Total | | | 166 | | | | 70 | | | | 236 | |
| | | | | | | | | | | | |
Below is a map illustrating the locations of our convenience stores as of December 31, 2012:
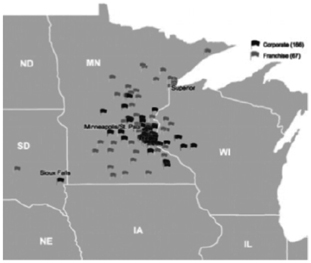
Of our company-operated sites, approximately 80% are open 24 hours per day and the remaining sites are open at least 16 hours per day. Our average store size is approximately 3,400 square feet with approximately 95% of our stores being 2,400 or more square feet. Our convenience stores typically offer tobacco products and immediately consumable items such as beverages and a large variety of snacks and prepackaged items. A significant number of the sites also offer state sanctioned lottery games, ATM services, money orders and car washes. We also provide support to 70 franchised convenience stores, selling gasoline, merchandise, and other services through SuperAmerica Franchising LLC (“SAF”). SAF has license agreements in place with each franchisee that, among other things, cover the term of the franchise (generally 10 years), set forth the monthly royalty payments to be paid by franchisees to SAF, authorize the use of proprietary marks and provide for consultation services for the construction and opening of stores. Franchisees are required to pay to SAF an initial license fee (generally, $10,000 for licensees located in Minnesota and Wisconsin and $2,000 for licensees located in South Dakota) and a royalty fee for all products and merchandise sold at the convenience store, including motor fuel, along with a separate diesel royalty fee. The license agreements also require that, if a franchise store is located within our
11
distribution area, then the franchise store must purchase a high minimum percentage (often 85% to 100%) of its motor fuel supply, including gasoline and distillate, from us. However, if a franchise store is not located within our distribution area, then the franchise store is not required to purchase any portion of its motor fuel supply from us. As of December 31, 2012, 35 of the 70 existing franchise stores are located within our distribution area and, thus, are required to purchase a high minimum percentage of their motor fuel supply from us.
Annual sales of refined products through our 166 owned and leased convenience stores averaged 327 million gallons over the period 2012-2010. The demand for gasoline is seasonal in nature, with higher demand during the summer months. 24% of the retail segment’s revenues were generated from non-fuel sales, including items like cigarettes, beer, milk, food, general merchandise, car wash and other commission-based revenue for the year ended December 31, 2012. The following table summarizes the results of our retail business for the periods indicated.
| | | | | | | | | | | | |
| | | Year Ended December 31, | |
| | | 2012 | | | 2011 | | | 2010 | |
Company-operated | | | | | | | | | | | | |
Fuel gallons sold (in millions) | | | 312.4 | | | | 324.0 | | | | 345.1 | |
Retail fuel margin ($/gallon)(1) | | $ | 0.18 | | | $ | 0.21 | | | $ | 0.17 | |
Merchandise sales ($ in millions) | | $ | 340.1 | | | $ | 340.3 | | | $ | 336.4 | |
Merchandise margin(%)(2) | | | 25.7 | % | | | 25.4 | % | | | 26.1 | % |
Number of outlets at year end | | | 166 | | | | 166 | | | | 166 | |
Franchised Stores | | | | | | | | | | | | |
Fuel gallons sold (in millions) | | | 45.4 | | | | 51.5 | | | | 52.4 | |
Royalty income (in millions) | | $ | 2.1 | | | $ | 1.7 | | | $ | 1.6 | |
Number of outlets at year end | | | 70 | | | | 67 | | | | 67 | |
| (1) | Retail fuel margin per gallon is calculated by dividing retail fuel gross margin by the fuel gallons sold at company-operated stores. Retail fuel gross margin is a non-GAAP performance measure that we believe is important to investors in evaluating our retail performance. Our calculation of retail fuel gross margin may differ from similar calculations of other companies in our industry, thereby limiting its usefulness as a comparative measure. For a reconciliation of retail fuel gross margin to retail segment operating income, the most directly comparable GAAP measure, see “Item 7. Management’s Discussion and Analysis of Financial Condition and Results of Operations—Results of Operations—Other Non-GAAP Performance Measures.” |
| (2) | Merchandise margin is expressed as a percentage of the merchandise sales, calculated by subtracting the costs of merchandise from the merchandise sales, and then dividing by merchandise sales. Merchandise margin is a non-GAAP performance measure that we believe is important to investors in evaluating our retail performance. Our calculation of merchandise margin may differ from similar calculations of other companies in our industry, thereby limiting its usefulness as a comparative measure. Merchandise margin includes all non-fuel sales at our company-operated stores including items like cigarettes, beer, milk, food, general merchandise, car wash and other commission-based revenue. For a reconciliation of merchandise margin to retail segment operating income, the most directly comparable GAAP measure, see “Item 7. Management’s Discussion and Analysis of Financial Condition and Results of Operations—Results of Operations—Other Non-GAAP Performance Measures.” |
Retail Operations Suppliers
Our refinery supplies substantially all of the gasoline and diesel sold in our company-operated and franchised convenience stores. We also own and operate SuperMom’s Bakery, which prepares and distributes baked goods and other prepared food items for sale in our SuperAmerica company-operated and franchised convenience stores and other third party locations.
Eby-Brown has been the primary supplier of general retail merchandise, including most tobacco and grocery items, for all our company-operated and franchised convenience stores since 1993. For the years ended December 31, 2012 and 2011, our retail business purchased approximately 76% and 75%, respectively, of its convenience store inside merchandise requirements from Eby-Brown. Our retail business also purchases a variety of merchandise, including soda, beer, bread, dairy products, ice cream and snack foods, directly from a number of third-party manufacturers and their wholesalers. All merchandise is delivered directly to our stores by Eby-Brown, other third-party vendors or our SuperMom’s Bakery business. We do not maintain additional product inventories other than what is in our stores and at SuperMom’s Bakery. For information about the risks associated with our commercial relationship with Eby-Brown, see “Item 1A. Risk Factors—Risks Related to Our Business and Industry—Risks Primarily Related to Our Retail Business—Our retail business depends on one principal supplier for a substantial portion of its merchandise inventory. A change of merchandise suppliers, a disruption in merchandise supply, a significant change in our relationship with our principal merchandise supplier or material changes in the payment terms or availability of trade credit provided by our merchandise suppliers could have a material adverse effect on our retail business and results of operations or liquidity.”
12
Retail Operations Customers
Our retail customers primarily include retail end-users, motorists and commercial drivers. We have a retail-marketing network of 236 convenience stores, as of December 31, 2012, located throughout Minnesota, Wisconsin and South Dakota, of which we operate 166 stores and support 70 franchised stores.
Competition
Petroleum refining and marketing is highly competitive. With respect to our wholesale gasoline and distillate sales and marketing, we compete directly with Koch Industries’ Flint Hills Resources Refinery in Pine Bend, Minnesota, as well as the other refiners in the PADD II region and, to a lesser extent, major U.S. and foreign refiners. In addition, we compete with producers and marketers in other industries that supply alternative forms of energy and fuels to satisfy the requirements of our industrial, commercial and individual customers. Certain of our competitors have larger, more complex refineries, and may be able to realize lower per-barrel costs or higher margins per barrel of throughput. Many of our principal competitors are integrated, multinational oil companies that are substantially larger and more recognized than we are. Unlike these competitors, we obtain substantially all of our feedstocks from unaffiliated sources. Because of their integrated operations and larger capitalization, these companies may be more flexible in responding to volatile industry or market conditions, such as shortages of crude oil supply and other feedstocks or intense price fluctuations. The principal competitive factors affecting our refining segment are costs of crude oil and other feedstocks, refinery efficiency, refinery product mix and costs of product distribution and transportation. We have no crude oil reserves and are not engaged in the exploration or production of crude oil. We believe that we will be able to obtain adequate crude oil and other feedstocks at generally competitive prices for the foreseeable future.
Our major retail competitors include Holiday and Kwik Trip. The principal competitive factors affecting our retail segment are location of stores, product price and quality, appearance and cleanliness of stores and brand identification. We expect to continue to face competition from large, integrated oil companies, as well as from other convenience stores that sell motor fuels. Increasingly, grocery and dry goods retailers such as Wal-Mart are entering the motor fuel retailing business. Many of these competitors are substantially larger than we are. In addition, these retailers may use promotional pricing or discounts, both at the pump and in the store, to encourage in-store merchandise sales. Our convenience stores compete in large part based on their ability to offer convenience to customers. Consequently, changes in traffic patterns and the type, number and location of competing stores could result in the loss of customers and reduced sale and profitability at affected stores.
Insurance and Risk Management
Our operations are subject to significant hazards and risks inherent in refining operations and in transporting and storing crude oil, intermediate products and refined products. Our property damage and business interruption coverage at the refinery has a maximum loss limit of $1 billion combined, with no sublimit for business interruption. Our business interruption coverage is for 24 months from the date of the loss, subject to a deductible of 60 days with a minimum loss of $15 million. Our property damage insurance has a deductible of $1 million. In addition, we have a full suite of insurance covering workers compensation, general products liability, directors’ and officers’ liability, environmental liability, safety and other applicable risk management programs. See also “Item 1A. Risk Factors—General Business and Industry Risks—Our insurance policies may be inadequate or expensive.”
Environmental Regulations
Refining Operations
Our refinery operations are subject to stringent and complex federal, state and local laws and regulations governing the discharge of materials into the environment or otherwise relating to environmental protection. These laws and regulations may obligate us to obtain and renew permits to conduct regulated activities; incur significant capital expenditures to install pollution control equipment; restrict the manner in which we may release materials into the environment; require remedial activities to mitigate pollution from former or current operations; apply specific health and safety criteria addressing worker protection; and impose substantial liabilities on us for pollution resulting from our operations. Certain of these environmental laws impose joint and several, strict liability for costs required to remediate and restore sites where petroleum hydrocarbons, wastes or other materials have been released or disposed. Failure to comply with environmental laws and regulations may result in the triggering of administrative, civil and criminal measures, including the assessment of monetary penalties, the imposition of remedial obligations, and the issuance of injunctions limiting or prohibiting some or all of our operations.
The clear trend in environmental regulation is to place more restrictions and limitations on activities that may affect the environment and any changes in environmental laws and regulations that result in more restrictive and costly emission limits, operational controls, fuel specifications, waste handling, disposal or remediation requirements could have a material adverse effect on our operations and financial position. In the event of future increases in costs, we may be unable to pass on those increases to our customers. There can be no assurance that our future environmental compliance expenditures will not become material.
13
Air Emissions
Our operations are subject to the federal Clean Air Act, as amended, and comparable state and local laws and regulations. Under the Clean Air Act, facilities that emit regulated pollutants, including volatile organic compounds, particulates, carbon monoxide, sulfur dioxide, nitrogen oxides or hazardous air pollutants, face increasingly stringent regulations, including requirements to install various levels of control technology on sources of pollutants. For example, the EPA published final amendments to the New Source Performance Standards (NSPS) for petroleum refineries on September 12, 2012 to be effective November 13, 2012. These amendments include standards for emissions of nitrogen oxides from process heaters and work practice standards and monitoring requirements for flares. To comply with the amendments, we plan to install and operate a continuous emissions monitoring system for nitrogen oxides on a process heater. We have already installed and will operate additional instrumentation on our flare. We anticipate the total cost for these two projects will be approximately $700,000 to be spent from 2012 through 2014. We continue to evaluate the regulation and amended standards, as may be applicable to the operations at our refinery. We cannot currently predict what additional costs that we may have to incur, if any, to comply with the amended NSPS. The costs could be material, but the time frame for compliance may extend over a number of years or upon changes or modifications to our refinery. In addition, the petroleum refining sector is subject to stringent new regulations adopted by the EPA, that impose maximum achievable control technology (“MACT”) requirements on refinery equipment emitting certain listed hazardous air pollutants. Air permits are required for our refining operations that result in the emission of regulated air contaminants. These permits incorporate stringent control technology requirements and are subject to extensive review and periodic renewal.
Over the past decade, the EPA has pursued a National Petroleum Refinery Initiative, which is a coordinated, integrated compliance and enforcement strategy to address federal Clean Air Act compliance issues at the nation’s largest petroleum refineries. In connection with the initiative, Marathon (which previously owned the St. Paul Park Refinery) entered into an environmental settlement agreement with the EPA, the U.S. Department of Justice and the state of Minnesota in May 2001 (the “2001 Consent Decree”), pursuant to which pollution control equipment was installed to significantly reduce emissions from stacks, wastewater vents, valves and flares at the refinery, and which imposes additional, and in some cases more stringent, standards and requirements on the refinery beyond applicable regulatory requirements. We are currently participating in negotiations with the EPA, the Minnesota Pollution Control Authority (“MPCA”) and Marathon concerning termination of the 2001 Consent Decree as to our refinery. The EPA and the MPCA have proposed that the MPCA issue an amended Title V Air Permit to the refinery that incorporates the emission limits and requirements of the 2001 Consent Decree into the permit before (or coincidental with) terminating the 2001 Consent Decree as to our refinery. We submitted an application to the MPCA in June 2012 to make the proposed amendments to the Title V Air Permit, and the MPCA is currently evaluating our amendment application. The MPCA released a draft amended Title V Air Permit for public comment on February 22, 2013. The public comment period closed on March 25, 2013. If the MPCA issues an amended Title V Air Permit incorporating the 2001 Consent Decree requirements, we anticipate that the EPA and MPCA will file a motion with the court to terminate the 2001 Consent Decree as to our refinery. Alternatively, the EPA and MPCA may propose to first modify the 2001 Consent Decree to add our subsidiary as a named party and then move to terminate the decree as to our refinery. Negotiations regarding termination of the 2001 Consent Decree are ongoing.
In August 2012, the EPA issued an Enforcement Alert announcing that it is devoting significant resources to a new enforcement initiative targeting flares used in the petroleum refining and chemical manufacturing industries. Through the initiative, the EPA seeks to improve the operation of flares by, among other things, requiring enhanced monitoring and control systems and work practice standards. The EPA has already entered into flaring consent decrees with two refiners and will likely pursue similar consent decrees with additional refiners. In April 2012, EPA personnel visited our refinery to conduct a flare inspection. On August 14, 2012, we received a request for information from the EPA regarding the flare at our refinery. We responded on September 27, 2012. To date, the EPA has not alleged that we have violated any requirements applicable to our flare or requested that we enter into a flaring consent decree. Some of the additional flare instrumentation that we anticipate the EPA would require under a flaring consent decree has already been installed on our flare and will be put into operation to comply with the EPA’s recent amendments to the NSPS for petroleum refineries, as discussed above. We cannot currently predict the costs that we may have to incur if we were to enter into a flaring consent decree with the EPA, but they could be material.
The refinery is obligated to comply with the conditions of its Title V Permit as well as emissions limitations and other requirements imposed under the Clean Air Act and similar state and local laws and regulations. These requirements are complex and stringent. Any failure to comply with such requirements may result in fines, penalties, and corrective action orders. Such fines, penalties, and corrective action orders could reduce the profitability of our refining operations.
Fuel Quality Requirements
Pursuant to the Energy Policy Act of 2005 and the Energy Independence and Securing Act of 2007, the EPA has issued Renewable Fuels Standards (“RFS”) implementing mandates to blend renewable fuels into petroleum fuels produced and sold in the United States. We are subject to RFS. Under the RFS, the EPA establishes a volume of renewable fuels that obligated refineries must blend into their finished petroleum fuels. The obligated volume increases annually over time until 2022. Our refinery currently generates a surplus of renewable identification number credits (“RINS”) under the RFS for some fuel categories, but we must
14
purchase RINS on the open market for other fuel categories. We must also purchase waiver credits for cellulosic biofuels from the EPA. In the future, we may be required to purchase additional RINS on the open market and waiver credits from the EPA to comply with the RFS. We cannot currently predict the future prices of RINS or waiver credits, but the costs to obtain the necessary number of RINS and waiver credits could be material.
Minnesota law currently requires that all diesel sold in the state for combustion in internal combustion engines must contain at least 5% biodiesel. Under this statute, if certain preconditions are met, the minimum biodiesel content in diesel sold in the state was to increase to 10% beginning on May 1, 2012, and to 20% beginning on May 1, 2015. The increase to 10% did not occur on May 1, 2012, because the Minnesota commissioners of agriculture, commerce, and pollution control did not certify that all statutory pre-conditions were satisfied by the statutory deadlines, but instead jointly recommended delaying the increase to 10% by one year, to May 1, 2013. We recently completed installing a new tank at our refinery to store biodiesel to enable us to comply with this mandate at a total cost of approximately $3 million dollars. Minnesota law also currently requires, with limited exceptions, that all gasoline sold or offered for sale in the state must contain the maximum amount of ethanol allowed under federal law for use in all gasoline powered motor vehicles. Federal law currently allows a maximum of 15% ethanol for cars and light trucks manufactured since 2001, and 10% ethanol for all other vehicles. Fuels produced at our refinery are currently blended with the appropriate amounts of ethanol or biodiesel to ensure that they comply with applicable federal and state renewable fuel standards. Blending renewable fuels into our finished petroleum fuels to comply with these requirements will displace an increasing volume of a refinery’s product pool.
We also are required to meet the new Mobile Source Air Toxics (“MSAT II”) regulations to reduce the benzene content of gasoline. Under the MSAT II regulations, benzene in the finished gasoline pool was required to be reduced to an annual average of 0.62 volume percent by January 1, 2011 with or without the use of benzene credits and compliance was required to be demonstrated by January 1, 2012. Beginning on July 1, 2012, we must also maintain an annual average of 1.30 volume percent benzene without the use of benzene credits. A refinery may generate benzene credits by making reductions in the benzene content of the gasoline that it produces beyond what is required by the applicable regulations. These credits may be utilized by the refinery that generates them for future compliance, or they may be sold to other refineries. In 2012, our refinery’s average benzene content was less than 0.62%. Our refinery’s average benzene content for future years, however, could exceed the 0.62% limit. If that occurs, we anticipate using benzene credits we have accumulated in prior years and benzene credits purchased on the open market in order to comply with MSAT II requirements. We would also consider operational changes to lower the benzene content of the gasoline we produce. We cannot predict the costs associated with implementing such operational changes, but they could be material. We may be required to purchase additional benzene credits to meet our compliance obligations in the future. The cost for purchase of credits is variable and market driven. If the market price of credits increases in the future, the costs to obtain the necessary number of benzene credits could become material.
We are also subject to other fuel quality requirements under federal and state law, including federal standards governing the maximum sulfur content of gasoline and diesel fuel manufactured at the refinery. If we fail to comply with any of these fuel quality requirements, we could be subject to fines, penalties and corrective action orders. Moreover, fuel quality standards could change in the future requiring us to incur significant costs to ensure that the fuels we produce continue to comply with all applicable requirements. For example, the EPA has announced that it plans to propose new “Tier 3” motor vehicle emission and fuel standards sometime in 2013. It has been reported that these new Tier 3 regulations may, among other things, lower the maximum average sulfur content of gasoline from 30 parts per million to 10 parts per million. If the Tier 3 regulations are eventually implemented and lower the maximum allowable content of sulfur or other constituents in fuels that we produce, we may at some point in the future be required to make significant capital expenditures and/or incur materially increased operating costs to comply with the new standards.
Climate Change
In response to certain scientific studies suggesting that emissions of greenhouse gases (“GHGs”) including carbon dioxide and methane, are contributing to the warming of the Earth’s atmosphere and other climatic conditions, both houses of Congress have actively considered legislation to reduce emissions of GHGs, and almost one-half of the states have already taken legal measures to reduce emissions of GHGs, primarily through the planned development of GHG emission inventories and/or regional GHG cap and trade programs. Most of these cap and trade programs work by requiring either major sources of emissions or major producers of fuels to acquire and surrender emission allowances, with the number of allowances available for purchase reduced each year until the overall GHG emission reduction goal is achieved. These allowances would be expected to escalate significantly in cost over time. Although it is not possible at this time to predict if or when Congress may pass climate change legislation, any future federal laws that may be adopted to address GHG emissions would likely require us to incur increased operating costs and could adversely affect demand for the refined petroleum products we produce.
In addition, on December 15, 2009, the EPA published its findings that emissions of GHGs present an endangerment to public health and the environment. These findings allow the EPA to adopt and implement regulations that would restrict emissions of GHGs under existing provisions of the federal Clean Air Act. The EPA has adopted two sets of regulations under the Clean Air Act. The first limits emissions of GHGs from motor vehicles beginning with the 2012 model year. The EPA has asserted that these final motor vehicle GHG emission standards trigger Clean Air Act construction and operating permit requirements for stationary sources,
15
commencing when the motor vehicle standards took effect on January 2, 2011. On June 3, 2010, the EPA published its final rule to address the permitting of GHG emissions from stationary sources under the Prevention of Significant Deterioration (“PSD”) and Title V permitting programs. This rule “tailors” these permitting programs to apply to certain stationary sources of GHG emissions in a multi-step process, with the largest sources first subject to permitting. Facilities required to obtain PSD permits for their GHG emissions also will be required to reduce those emissions according to “best available control technology” standards (“BACT”) for GHG that have yet to be fully developed. The EPA issued guidance in November 2010 to industry and permitting authorities on how to determine BACT for GHG emissions from new and modified sources. In addition, on October 30, 2009, the EPA published a final rule requiring the reporting of GHG emissions from specified large GHG emission sources in the United States, including refineries, on an annual basis, beginning in 2011 for emissions occurring after January 1, 2010. We have been monitoring GHG emissions, and submitted our first annual report on these emissions to EPA in September 2011. Additionally, in December 2010, the EPA reached a settlement agreement with numerous parties pursuant to which it agreed to promulgate NSPS for GHG emissions from petroleum refineries by December 2011. To date, however, the EPA has not proposed the NSPS for GHG emissions from petroleum refineries, and we cannot predict the requirements of these rules. The adoption of any regulations that require reporting of GHGs or otherwise limit emissions of GHGs from our refinery could require us to incur significant costs and expenses or changes in operations and such requirements also could adversely affect demand for the refined petroleum products that we produce.
Hazardous Substances and Wastes
The Comprehensive Environmental Response, Compensation and Liability Act, as amended (“CERCLA”), also known as the “Superfund” law, and comparable state and local laws impose liability without regard to fault or the legality of the original conduct, on certain classes of persons who are considered to be responsible for the release of a hazardous substance into the environment. Such classes of persons include the current and past owners and operators of sites where a hazardous substance was released, and companies that disposed or arranged for disposal of hazardous substances at offsite locations, such as landfills. Under CERCLA, these “responsible persons” may be subject to joint and several, strict liability for the costs of cleaning up the hazardous substances that have been released into the environment, for damages to natural resources, for costs incurred by third parties and for the costs of certain environmental and health studies. It is not uncommon for neighboring landowners and other third parties to file claims for personal injury and property damage allegedly caused by the release of hazardous substances into the environment. In the course of our operations, we generate wastes or handle substances that may be regulated as hazardous substances, and we could become subject to liability under CERCLA and comparable state laws.
We also may incur liability under the Resource Conservation and Recovery Act (“RCRA”), and comparable state and local laws, which impose requirements related to the handling, storage, treatment and disposal of solid and hazardous wastes. In the course of our operations, we generate petroleum product wastes and ordinary industrial wastes, such as paint wastes, waste solvents and waste oils that may be regulated as hazardous wastes. In addition, our operations also generate solid wastes, which are regulated under RCRA and state law.
Our refinery site has been used for refining activities for many years. Although prior owners and operators may have used operating and waste disposal practices that were standard in the industry at the time, petroleum hydrocarbons and various wastes have been released on or under our refinery site. There has been remediation of soil and groundwater contamination beneath the refinery for many years, and we are required to continue to monitor and perform corrective actions for this contamination until the applicable regulatory standards have been achieved. This remediation is being overseen by the MPCA pursuant to a compliance agreement entered into by the former owner and the agency in 2007. Based on current investigative and remedial activities, we believe that the contamination can be controlled or remedied without having a material adverse effect on our financial condition. However, such costs are often unpredictable, and there can be no assurance that future costs will not become material. We currently anticipate that we will incur costs of approximately $405,000 in 2013 and an additional $1.7 million through the year 2023 in connection with continued monitoring and remediation of this contamination at the refinery.
Water Discharges
The Federal Water Pollution Control Act of 1972, as amended, also known as the Clean Water Act, and analogous state laws impose restrictions and stringent controls on the discharge of pollutants, including oil, into federal and state waters. Such discharges are prohibited, except in accordance with the terms of a permit issued by the EPA or the MPCA. Any unpermitted release of pollutants, including crude oil as well as refined products, could result in penalties, as well as significant remedial obligations. The spill prevention, control, and countermeasure requirements of federal and state laws require containment, such as berms or similar structures, to help prevent the contamination of navigable waters in the event of a petroleum hydrocarbon tank spill, rupture or leak.
The refinery’s wastewater treatment plant utilizes two lagoons. Prior to our ownership of the refinery, Marathon reported to us and to the MPCA several instances in which concentrations of benzene in the wastewater flowing into the first lagoon exceeded the level that could potentially subject the lagoon to regulation as a hazardous waste unit. Between December 2010 and March 2011, we experienced three exceedances of benzene discharges into the first lagoon. We have reported these three instances to the MPCA, and the refinery has engaged in discussions with the MPCA regarding the implications and appropriate responses to these instances. If the
16
benzene level was exceeded, the refinery could be subject to fines and penalties, and if no exemption from hazardous waste regulation applies, the refinery may be required to incur additional capital and operating costs and expenses. The MPCA initiated enforcement against Marathon relating to the instances of potentially excessive concentrations of benzene entering the lagoon that occurred during its period of ownership and against us for the three events between December 2010 and March 2011. Marathon settled with the State of Minnesota in November 2011. The MPCA enforcement against us remains pending. There can be no assurance that any fines, penalties, costs and expenses that we may incur will not become material. Under the agreements that we entered into with Marathon at the time of the acquisitions, we have the ability to seek reimbursement from Marathon on certain capital costs and expenses that we may incur in connection with any such enforcement action. In September 2012 we experienced one additional benzene exceedance that we promptly reported to the MPCA. On November 28, 2012, the MPCA requested additional information from us regarding the September 2012 benzene exceedance. We responded to the MPCA’s request on December 5, 2012. The refinery has engaged in discussions with the MPCA regarding the implications and appropriate responses to this incident. The MPCA has not initiated any formal enforcement action to date with respect to this event. If the MPCA initiates enforcement related to this event, there can be no assurance that any fines, penalties, costs and expenses that we may incur will not become material.
Environmental Capital and Maintenance Projects
A number of capital projects are planned for continued environmental compliance at our refinery. For example, in April of 2010, the MPCA issued a new permit that will govern stormwater discharges at the refinery. This new permit included a new effluent standard for total suspended solids (“TSS”). We spent $665,000 in 2012 and plan to spend approximately $830,000 in 2013 in order that the refinery will comply with the TSS standard by the end of 2013, within the time allowed by the permit. We plan to spend approximately $300,000 over the next four years on a number of additional, smaller capital projects at the refinery related to environmental compliance. Additionally, we are currently implementing upgrades to the refinery’s wastewater treatment plant, including changes to the process used to treat the wastewater, construction of new tanks, closure of one of the existing lagoons, and dredging and disposal of sludge that has accumulated in one of the lagoons. We spent approximately $11.6 million in 2011 and 2012, and we estimate that we may spend an additional $31.0 million in 2013 and 2014 to complete these waste water treatment plant upgrades. Pursuant to the agreements entered into in connection with the Marathon Acquisition, we believe that Marathon is required to reimburse us for a portion of the costs and expenses incurred in these wastewater treatment plant upgrades. In October 2012, we made a claim to Marathon for reimbursement in the amount of $2.6 million and are in discussions with Marathon with respect to that claim.
Health, Safety and Maintenance
We are subject to the requirements of the federal Occupational Safety and Health Act (“OSHA”) and comparable state occupational safety laws. These laws and the implementing regulations strictly govern the protection of the health and safety of employees. In addition, OSHA’s hazard communication standard requires that information be maintained about hazardous materials used or produced in our operations and that this information be available to employees and contractors and, where required, to state and local government authorities and to local residents. We provide all required information to employees and contractors on how to avoid or protect against exposure to hazardous materials present in our operations. Also, we maintain safety, training and maintenance programs as part of our ongoing efforts to ensure compliance with applicable laws and regulations. We believe that the refinery is in substantial compliance with OSHA and similar state laws, including general industry standards, recordkeeping and reporting, hazard communication and process safety management. The refinery is currently in the process of installing Safety Instrumented Systems to enhance its safety program. The estimated cost for 2013 is $6.2 million. Additionally, the refinery spent $2.3 million in 2012 and plans to spend approximately $8.0 million in 2013 plus an additional $13.5 million in 2014 through 2017 to replace relief valves to enhance overall safety. Furthermore, the refinery has budgeted approximately $5.9 million in 2013 and an additional $13.9 million for 2014 through 2017 for additional safety and process safety management projects.
Pipelines
We own three pipelines: (1) the “Aranco Pipeline,” which connects the refinery to a pipeline owned by Magellan, (2) a 16” pipeline connecting the refinery to the Cottage Grove tank farm and (3) a 12” pipeline connecting the refinery to the Cottage Grove tank farm. Potential environmental liabilities associated with pipeline operation include costs incurred for remediating spills or releases and maintaining the integrity of the pipeline to prevent such spills and releases. Under a lease agreement, Magellan operates the Aranco Pipeline and, as between the parties, bears the responsibility and costs for any leaks or spills from the Aranco Pipeline, as well as for general maintenance activities. If a government action or order is adopted after February 28, 2013 that requires any portion of the Aranco Pipeline to be relocated, lowered, adjusted or encased, we are responsible for the associated costs. The term of the agreement will also be extended to enable Magellan to recoup the cost of any other repairs, replacements, inspections, improvements or modifications in excess of $500,000 that are required as a result of a government action or order adopted after February 28, 2013.
We also own an equity interest in the Minnesota Pipe Line Company, which owns and operates the pipeline that provides the primary supply of crude oil to the refinery. Between the parties, the Minnesota Pipe Line Company bears the responsibility and costs for any leaks or spills from the pipeline, as well as for maintenance activities.
17
Retail Business
Our retail business operates convenience stores with fuel stations in Minnesota, Wisconsin, and South Dakota. Each retail station has underground fuel storage tanks, which are subject to federal, state and local regulations. Complying with these underground storage tank regulations can be costly. The operation of underground storage tanks also poses environmental risks, including the potential for fuel releases and soil and groundwater contamination. We are currently completing the investigation and remediation of reported leaks from underground storage tanks at a number of our convenience stores. We currently anticipate that the known contamination at these stores can be remediated for approximately $225,000 through the end of 2013, and an additional cost of approximately $80,000 through the end of 2015. It is possible that we may identify more leaks or contamination in the future that could result in fines or civil liability for us, as well as remediation obligations and expenses. States, including Minnesota, have established funds to reimburse some expenses associated with remediating leaks from underground storage tanks, but such state reimbursement funds may not cover all remediation costs.
Other Government Regulation
Our transportation activities are subject to regulation by multiple governmental agencies. Projected expenditures related to the Minnesota Pipeline reflect the recurring costs resulting from compliance with these regulations, and these costs may increase due to future acquisitions, changes in regulation, changes in use, ongoing expenditures to maintain reliability and efficiency or discovery of existing but unknown compliance issues. Further, the regulatory burden on the industry increases the cost of doing business and affects profitability. Additional proposals and proceedings that affect the oil industry are regularly considered by Congress, the states, FERC and the courts. We cannot predict when or whether any such proposals may become effective or what impact such proposals may have.
The ICA and its implementing regulations give FERC authority to regulate the rates and the terms and conditions of service of interstate common carrier oil pipelines, such as the Minnesota Pipeline. The ICA and its implementing regulations require that tariff rates and terms and conditions of service of interstate common carrier oil pipelines be just and reasonable and not unduly discriminatory or preferential. The ICA also requires that oil pipeline tariffs setting forth transportation rates and the rules and regulations governing transportation services be filed with FERC.
In October 1992, Congress passed the Energy Policy Act of 1992 (“EPAct”), which, among other things, required FERC to issue rules to establish a simplified and generally applicable ratemaking methodology for petroleum pipelines and to streamline procedures in petroleum pipeline proceedings. FERC responded to this mandate by establishing a methodology for petroleum pipelines to change their rates within prescribed ceiling levels that are tied to an inflation index. Pipelines are allowed to raise their rates to the rate ceiling level generated by application of the index. If the methodology reduces the ceiling level such that it is lower than a pipeline’s filed rate, the pipeline must reduce its rate to conform with the lower ceiling unless doing so would reduce a rate “grandfathered” by EPAct to below the grandfathered level. A pipeline must, as a general rule, use the indexing methodology to change its rates. FERC, however, retained cost-of-service ratemaking, market based rates, agreement with an unaffiliated shipper, and settlement as alternatives to the indexing approach that may be used in certain specified circumstances. The Minnesota Pipeline currently uses the indexing methodology to set its tariff rates. In order for the Minnesota Pipeline to increase rates beyond the maximum allowed by the indexing methodology, it must file a cost-of-service justification, obtain approval from an unaffiliated party that intends to ship on the pipeline (with respect to initial rates for any new service), obtain approval from all current shippers (i.e., settlement), or obtain prior approval to file market-based rates. We do not control the board of managers of the Minnesota Pipe Line Company and thus do not control the decision-making with respect to tariff changes for the Minnesota Pipeline.
FERC’s indexing methodology is subject to review every five years. In an order issued in December 2010, FERC announced that, effective July 1, 2011, the index would equal the change in the producer price index for finished goods plus 2.65% (previously, the index was equal to the change in the producer price index for finished goods plus 1.3%). This index is to be in effect through July 2016. The current or any revised indexing formula could hamper our ability to recover our costs because: (1) the indexing methodology is tied to an inflation index; (2) it is not based on pipeline-specific costs; and (3) it could be reduced in comparison to the current formula. Further, shippers may protest rate increases made within the ceiling levels, but such protests must show that the portion of the rate increase resulting from application of the index is substantially in excess of the pipeline’s increase in costs from the previous year. Shippers may also file complaints against index-based rates, but such complaints must either meet the foregoing standard for protests or show that the pipeline is substantially over-recovering its cost of service and that application of the index substantially exacerbates that over-recovery. In addition, due to the common carrier regulatory obligation applicable to interstate oil pipelines, in the event there are nominations in excess of capacity, capacity must be prorated among shippers in an equitable manner in accordance with the tariff then in effect. Therefore, nominations by new shippers or increased nominations by existing shippers may reduce the capacity available to us.
18
The EPAct deemed petroleum pipeline rates in effect for the 365-day period ending on the date of enactment of the EPAct that had not been subject to complaint, protest or investigation during that 365-day period to be just and reasonable under the ICA (“grandfathered”). There are grandfathered rates underlying Minnesota Pipeline’s current rates. Absent a successful challenge against the grandfathered rates, these rates act as a floor below which the pipeline’s rates cannot be lowered. Generally, shippers challenging grandfathered rates must show that a substantial change has occurred since the enactment of the EPAct in either the economic circumstances of the oil pipeline, or in the nature of the services provided, that were a basis for the rate. The EPAct places no such limit on challenges to a provision of an oil pipeline tariff as unduly discriminatory or preferential. If a shipper were to successfully challenge the grandfathered portion of the Minnesota Pipeline’s rates, the Minnesota Pipeline would no longer benefit from the floor provided by these grandfathered rates, which could adversely affect the Minnesota Pipe Line Company’s financial position, cash flows and results of operations.
Under certain circumstances, including a change in FERC’s ratemaking methodology for oil pipelines or a protest or complaint filed by a shipper, FERC could limit the Minnesota Pipe Line Company’s ability to set rates based on its costs, could order it to reduce its rates, and/or could require the payment of refunds and/or reparations to shippers. Rate regulation or a successful challenge to the rates the Minnesota Pipeline charges could adversely affect its financial position, cash flows, or results of operations. Conversely, reduced rates on the Minnesota Pipeline will reduce the rates we are charged as a shipper for transportation of crude oil on the Minnesota Pipeline into our refinery. If FERC found the Minnesota Pipeline’s terms of service to be contrary to statutory requirements, FERC could impose conditions it considers appropriate and/or impose penalties. Further, FERC could declare non-jurisdictional facilities to be common carrier facilities and require that common carrier access be provided or otherwise alter the terms of service and/or rates of such facilities, to the extent applicable.
The Aranco Pipeline, currently leased to and operated by Magellan, is part of Magellan’s interstate pipeline system and, as a result, we are not required to maintain a tariff with respect to the Aranco Pipeline. If this lease were to be terminated and the pipeline were used to transport crude oil or petroleum products in interstate commerce, the Aranco Pipeline would be subject to the interstate common carrier regulatory regime discussed above in the context of the Minnesota Pipeline and we would be required to comply with such regulation in order to operate the Aranco Pipeline. In addition, if the 16” and/or 12” pipelines connecting the refinery to the Cottage Grove tank farm were to provide interstate crude oil or petroleum product transportation service, they would be subject to the same interstate common carrier regulatory regime discussed above.
The Federal Trade Commission, FERC and the Commodity Futures Trading Commission hold statutory authority to monitor certain segments of the physical and futures energy commodities markets. These agencies have imposed broad regulations prohibiting fraud and manipulation of such markets. With regard to our physical sales of oil or other energy commodities, and any related hedging activities that we undertake, we are required to observe the market-related regulations enforced by these agencies, which hold substantial enforcement authority. Failure to comply with such regulations, as interpreted and enforced, could have a material adverse effect on our business, results of operations, and financial condition.
Our petroleum pipeline facilities are also subject to regulation by the U.S. Department of Transportation with respect to their design, installation, testing, construction, operation, replacement and management. We are also subject to the requirements of the Federal Occupational Safety and Health Act and other comparable federal and state statutes that address employee health and safety. Compliance costs associated with these regulations can potentially be significant, particularly if higher industry and regulatory safety standards are imposed in the future.
Intellectual Property
We hold and use certain trade secret and confidential information related specifically to our refining operations. In addition, we are party to various process license agreements that allow us to use certain intellectual property rights of third parties in our refining operations pursuant to fully-paid up licenses. We do not own any patents relating to the refining business but license a limited number of patents from Marathon based on the previous use of such patents in our refining operations.
Employees
As of December 31, 2012, we employed 2,893 people, including 409 employees associated with the operations of our refining business and 2,398 employees associated with the operations of our retail business. Our future success will depend partially on our ability to attract, retain and motivate qualified personnel. We are party to collective bargaining agreements covering approximately 180 of our 409 employees associated with the operations of our refining business and 23 of our 2,398 employees associated with the operations of our retail business. The collective bargaining agreements covering the employees associated with our refining and retail businesses expire in December 2013 and August 2014, respectively. We consider our relations with our employees to be satisfactory.
19
Available Information
We make available free of charge on our internet website at www.ntenergy.com our annual reports on Form 10-K, our quarterly reports on Form 10-Q, our current reports on Form 8-K and any amendments to those reports, as soon as reasonably practicable after we electronically file such material with, or furnish it to, the Securities and Exchange Commission (the “SEC”). Information contained on our website is not incorporated by reference into this Form 10-K and you should not consider such information as part of this report.
On January 14, 2013, we filed a Form 15 with the SEC. Upon the filing of the Form 15, our obligation to file periodic and other reports with the SEC, including reports on Form 10-Q and Form 8-K, and future reports on Form 10-K, was immediately suspended.
20
If any of the following risks were actually to occur, our business, financial condition or results of operations could be materially adversely affected.Other risks are also described in “Item 1. Business” and “Item 7A. Quantitative and Qualitative Disclosures About Market Risk.”
Risks Related to Our Business and Industry
We may have capital needs for which our internally generated cash flows and other sources of liquidity may not be adequate.
If we cannot generate sufficient cash flows or otherwise secure sufficient liquidity to support our short-term and long-term capital requirements, we may not be able to meet our payment obligations, comply with certain deadlines related to environmental regulations and standards or pursue our business strategies, any of which could have a material adverse effect on our results of operations or liquidity. We have substantial short-term capital needs and may have substantial long-term capital needs. Our short-term working capital needs are primarily related to financing our refined product inventory and accounts receivable. Our long-term needs for cash include those to support ongoing capital expenditures for equipment maintenance and upgrades during turnarounds at our refinery and to complete our routine and normally scheduled maintenance, regulatory and security expenditures. We are currently planning a major plant turnaround to occur during April 2013 and another partial turnaround for our fluid catalytic cracking unit during October 2013, for which we have budgeted aggregate spending of approximately $55 to $60 million. The refinery is currently expected to have reduced throughputs during the months of April and October 2013 to complete the turnarounds. In addition, from time to time, we are required to spend significant amounts for repairs when one or more processing units experiences temporary shutdowns. We continue to utilize significant capital to upgrade equipment, improve facilities, and reduce operational, safety and environmental risks. We may incur substantial compliance costs in connection with any new environmental, health and safety regulations. In addition, the board of directors of the general partner of NTE LP, our parent company has adopted a distribution policy pursuant to which they will distribute an amount equal to the available cash NTE LP generates, including the cash we generate, each quarter to their unitholders. As a result, we will need to rely on external financing sources, including commercial bank borrowings and the issuance of debt and equity securities, to fund our growth. Our liquidity will affect our ability to satisfy any of these needs.
Our liquidity may be adversely affected by a reduction in third party credit.
We rely on third party credit for approximately 50% of our crude oil and other feedstock purchases. We purchase the remaining crude oil and other feedstocks daily on terms via a crude oil supply and logistics agreement with JPM CCC, which provides logistical and administrative support to us for both the crude oil we source from them as well as the crude oil we source from our suppliers. For crude oil purchased on third party credit terms, we pay for both domestic crude oil purchases and Canadian crude oil purchases during the month following delivery. If our suppliers who sell crude oil and other feedstocks to us on trade credit were to reduce or eliminate our credit lines, we would be required to fund our purchases through our revolving credit facility or our crude oil supply and logistics agreement with JPM CCC, which would have a negative impact on liquidity.
Our arrangements with Marathon expose us to Marathon-related credit and performance risk.
We have a contract with Marathon under which we supply substantially all of the gasoline and diesel requirements for the independently owned and operated Marathon branded stores in our marketing area. Marathon has indemnification obligations to us pursuant to the agreements entered into in connection with the Marathon Acquisition. Marathon’s indemnification obligations resulting from any breach of representations and warranties generally are limited by an indemnification deductible of $25 million and an indemnification ceiling of $100 million and are guaranteed by Marathon Petroleum.
Marathon Petroleum has guaranteed the performance of all of Marathon’s obligations under all of the acquisition agreements entered into in connection with the Marathon Acquisition discussed above. Nevertheless, relying on Marathon’s ability to honor its fuel requirement purchase obligations and indemnity obligations, and on Marathon Petroleum’s ability to honor its guaranty obligations, exposes us to Marathon’s and Marathon Petroleum’s respective credit and business risks. There can be no assurance that claims resulting from any breach of Marathon’s representations and warranties under the acquisition agreements entered into in connection with the Marathon Acquisition will not exceed the $100 million indemnification ceiling. Moreover, selling products to Marathon under the supply contract can expose us to Marathon’s credit and general business risks. An adverse change in Marathon’s or Marathon Petroleum’s business, results of operations or financial condition could adversely affect their respective ability to perform each of these obligations, which could consequently have a material adverse effect on our business, results of operations or liquidity and, as a result, our ability to satisfy our debt obligations.
21
Our historical financial statements may not be indicative of future performance.
The historical financial statements for periods prior to December 1, 2010 presented in this report reflect carve-out financial statements of several operating units of Marathon, which, except for certain assets that were not acquired (e.g., cash other than in-store cash at our convenience stores and receivables and assets sold to third parties) and certain liabilities (e.g., accounts payable, payroll and benefits payable and deferred taxes) that were not assumed in connection with the Marathon Acquisition, represent the assets and liabilities that were transferred to us upon the closing of the Marathon Acquisition. We now own the assets and operate them as a standalone business. Prior to the closing of the Marathon Acquisition, we had no history of operating these assets, and they were never operated as a standalone business, thus the historical results presented in the financial statements for the periods prior to the Marathon Acquisition are not necessarily comparable to our financial statements following the Marathon Acquisition or indicative of the results for any future period. Additionally, we entered into certain arrangements at the closing of the Marathon Acquisition, including our crude oil supply and logistics agreement with JPM CCC and a lease arrangement with Realty Income, that resulted in our working capital needs and operating costs varying from those affecting the assets that we acquired from Marathon. The pre-Marathon Acquisition historical financial information reflects intercompany allocations of expenses which may not be indicative of the actual expenses that would have been incurred had the combined businesses been operating as a company independent from Marathon for the periods presented. In addition, our results of operations for periods subsequent to the closing of NTE LP’s initial public offering may not be comparable to our results of operations for periods prior to the closing of NTE LP’s initial public offering as a result of certain transactions undertaken in connection with NTE LP’s initial public offering. See “Item 7. Management’s Discussion and Analysis of Financial Condition and Results of Operations—Comparability of Historical Results” for a discussion of factors that affect comparability. As a result, it is difficult to evaluate our historical results of operations to assess our future prospects and viability.
Competition from companies having greater financial and other resources than we do could materially and adversely affect our business and results of operations.
Our refining operations compete with domestic refiners and marketers in the PADD II region of the United States, as well as with domestic refiners in other PADD regions and foreign refiners that import products into the United States. In addition, we compete with producers and marketers in other industries that supply alternative forms of energy and fuels to satisfy the requirements of our industrial, commercial and individual customers. Certain of our competitors have larger, more complex refineries, and may be able to realize lower per-barrel costs or higher margins per barrel of throughput. Several of our principal competitors are integrated national or international oil companies that are larger and have substantially greater resources than we do and have access to proprietary sources of controlled crude oil production. Unlike these competitors, we obtain substantially all of our feedstocks from unaffiliated sources. Because of their integrated operations and larger capitalization, these companies may be more flexible in responding to volatile industry or market conditions, such as shortages of crude oil supply and other feedstocks or intense price fluctuations.
Newer or upgraded refineries will often be more efficient than our refinery, which may put us at a competitive disadvantage. While we have taken significant measures to maintain and upgrade units in our refinery by installing new equipment and repairing equipment to improve our operations, these actions involve significant uncertainties, since upgraded equipment may not perform at expected throughput levels, the yield and product quality of new equipment may differ from design specifications and modifications may be needed to correct equipment that does not perform as expected. Any of these risks associated with new equipment, redesigned older equipment or repaired equipment could lead to lower revenues or higher costs or otherwise have an adverse effect on future results of operations and financial condition and our ability to satisfy our debt obligations. Over time, our refinery may become obsolete, or be unable to compete, because of the construction of new, more efficient facilities by our competitors.
Our retail operations compete with numerous convenience stores, gasoline service stations, supermarket chains, drug stores, fast food operations and other retail outlets. Increasingly, national high-volume grocery and dry-goods retailers are entering the gasoline retailing business. Many of these competitors are substantially larger than we are. Because of their diversity, integration of operations and greater resources, these companies may be better able to withstand volatile market conditions or levels of low or no profitability. In addition, these retailers may use promotional pricing or discounts, both at the pump and in the store, to encourage in-store merchandise sales. These activities by our competitors could adversely affect our profit margins. Additionally, our convenience stores could lose market share, relating to both gasoline and merchandise, to these and other retailers, which could adversely affect our business, results of operations and cash flows. Our convenience stores compete in large part based on their ability to offer convenience to customers. Consequently, changes in traffic patterns and the type, number and location of competing stores could result in the loss of customers and reduced sales and profitability at affected stores, and adversely affect our ability to satisfy our debt obligations.
Difficult conditions in the U.S. and worldwide economies, and potential further deteriorating conditions in the United States and globally, may materially adversely affect our business, results of operations and financial condition.
Continued volatility and disruption in worldwide capital and credit markets and potential further deteriorating conditions in the United States and globally could affect our revenues and earnings negatively and could have a material adverse effect on our business, results of operations, financial condition and our ability to satisfy our debt obligations. We are indirectly exposed to risks faced by our suppliers, customers and other business partners. The impact on these constituencies of the risks posed by continued economic turmoil
22
have included, or can include, interruptions or delays in the performance by counterparties to our contracts, reductions and delays in customer purchases, delays in or the inability of customers to obtain financing to purchase our products and the inability of customers to pay for our products. All of these events may significantly adversely impact our business, results of operations and financial condition and, as a result, our ability to satisfy our debt obligations.
The geographic concentration of our refinery and retail assets creates a significant exposure to the risks of the local economy and other local adverse conditions. The location of our refinery also creates the risk of significantly increased transportation costs should the supply/demand balance change in our region such that regional supply exceeds regional demand for refined products.
As our refinery and a significant number of our stores are located in Minnesota, Wisconsin and South Dakota, we primarily market our refined and retail products in a single, relatively limited geographic area. As a result, we are more susceptible to regional economic conditions than the operations of more geographically diversified competitors, and any unforeseen events or circumstances that affect our operating area could also materially adversely affect our revenues and our ability to satisfy our debt obligations. These factors include, among other things, changes in the economy, weather conditions, demographics and population.
Should the supply/demand balance shift in our region as a result of changes in the local economy discussed above, an increase in refining capacity or other reasons, resulting in supply in the PADD II region exceeding demand, we would have to deliver refined products to customers outside of the region and thus incur considerably higher transportation costs, resulting in lower refining margins, if any. Changes in market conditions could have a material adverse effect on our business, financial condition and results of operations and, as a result, our ability to satisfy our debt obligations.
Our operating results are seasonal and generally significantly lower in the first and fourth quarters of the year for our refining business and in the first quarter of the year for our retail business. We depend on favorable weather conditions in the spring and summer months.
Demand for gasoline is generally higher during the summer months than during the winter months due to seasonal increases in highway traffic. Decreased demand during the winter months can lead to lower gasoline prices. As a result, the operating results of our refining business for the first and fourth calendar quarters are generally significantly lower than those for the second and third calendar quarters of each year.
Seasonal fluctuations in traffic also affect sales of motor fuels and merchandise in our retail fuel and convenience stores. As a result, the operating results of our retail business are generally lower for the first quarter of the year. Weather conditions in our operating area also have a significant effect on our retail operating results. Customers are more likely to purchase higher profit margin items at our retail fuel and convenience stores, such as fast foods, fountain drinks and other beverages, and more gasoline during the spring and summer months, thereby typically generating higher revenues and gross margins for us in these periods. Unfavorable weather conditions during these months and a resulting lack of the expected seasonal upswings in traffic and sales could have a material adverse effect on our business, financial condition and results of operations.
Weather conditions and natural disasters could materially and adversely affect our business and operating results.
The effects of weather conditions and natural disasters can lead to volatility in the costs and availability of energy and raw materials or negatively impact our operations or those of our customers and suppliers, which could have a significant adverse effect on our business and results of operations and, as a result, our ability to satisfy our debt obligations.
We may not be able to successfully execute our strategy of growth within the refining and retail industry through acquisitions.
A component of our growth strategy is to selectively consider accretive acquisitions within the refining industry and retail market based on sustainable performance of the targeted assets through the refining cycle, access to advantageous crude oil supplies, attractive demand and supply market fundamentals, access to distribution and logistics infrastructure and potential operating synergies. Our ability to do so will be dependent upon a number of factors, including our ability to identify acceptable acquisition candidates, consummate acquisitions on favorable terms, successfully integrate acquired assets and obtain financing to fund acquisitions and to support our growth and many other factors beyond our control. Risks associated with acquisitions include those relating to:
| | • | | diversion of management time and attention from our existing business; |
| | • | | challenges in managing the increased scope, geographic diversity and complexity of operations; |
23
| | • | | difficulties in integrating the financial, technological and management standards, processes, procedures and controls of an acquired business with those of our existing operations; |
| | • | | liability for known or unknown environmental conditions or other contingent liabilities not covered by indemnification or insurance; |
| | • | | greater than anticipated expenditures required for compliance with environmental, safety or other regulatory standards or for investments to improve operating results; |
| | • | | our inability to offer competitive terms to our franchisees to grow our franchise business; |
| | • | | difficulties in achieving anticipated operational improvements; and |
| | • | | incurrence of additional indebtedness to finance acquisitions or capital expenditures relating to acquired assets. |
We may not be successful in acquiring additional assets, and any acquisitions that we do consummate may not produce the anticipated benefits or may have adverse effects on our business and operating results.
Our business may suffer if any of the executive officers or other key employees discontinues employment with us. Furthermore, a shortage of skilled labor or disruptions in our labor force may make it difficult for us to maintain labor productivity.
Our future success depends to a large extent on the services of the executive officers and other key employees and on our continuing ability to recruit, train and retain highly qualified employees in all areas of our operations, including accounting, business operations, finance and other key back-office and mid-office personnel. Furthermore, our operations require skilled and experienced employees with proficiency in multiple tasks. The competition for these employees is intense, and the loss of these executives or employees could harm our business. If any of these executives or other key personnel resign or become unable to continue in their present roles and are not adequately replaced, our business could be materially adversely affected. We do not maintain, nor do we plan to obtain, any insurance against the loss of any of these individuals.
Our operations could be disrupted if our information systems fail, causing increased expenses and loss of sales.
Our business is highly dependent on financial, accounting and other data processing systems and other communications and information systems, including our enterprise resource planning tools. We process a large number of transactions on a daily basis and rely upon the proper functioning of computer systems. If a key system were to fail or experience unscheduled downtime for any reason, even if only for a short period, our operations and financial results could be affected adversely. Our systems could also be damaged or interrupted by a security breach, fire, flood, power loss, telecommunications failure or similar event. Our formal disaster recovery plan may not prevent delays or other complications that could arise from an information systems failure. Further, our business interruption insurance may not compensate us adequately for losses that may occur.
We may incur significant liability under, or costs and capital expenditures to comply with, environmental, health and safety regulations, which are complex and change frequently.
Our refinery, pipelines and retail operations are subject to federal, state and local laws regulating, among other things, the generation, storage, handling, use and transportation of petroleum and hazardous substances, the emission and discharge of materials into the environment, waste management, characteristics and composition of gasoline and diesel and other matters otherwise relating to the protection of the environment. Our operations are also subject to various laws and regulations relating to occupational health and safety. Compliance with the complex array of federal, state and local laws relating to the protection of the environment, health and safety is difficult and likely will require us to make significant expenditures. Moreover, our business is inherently subject to accidental spills, discharges or other releases of petroleum or hazardous substances into the environment including at neighboring areas or third party storage, treatment or disposal facilities. For example, we have performed remediation of known soil and groundwater contamination beneath certain of our retail locations primarily as a result of leaking underground storage tanks, and we will continue to perform remediation of this known contamination until the appropriate regulatory standards have been achieved. Certain environmental laws impose joint and several liability without regard to fault or the legality of the original conduct in connection with the investigation and cleanup of such spills, discharges or releases. As such, we may be required to pay more than our fair share of such investigation or cleanup. We may not be able to operate in compliance with all applicable environmental, health and safety laws, regulations and permits at all times. Violations of applicable legal or regulatory requirements could result in substantial fines, criminal sanctions, permit revocations, injunctions and/or facility shutdowns. We may also be required to make significant capital expenditures or incur increased operating costs or change operations to achieve compliance with applicable standards.
We cannot predict the extent to which additional environmental, health and safety legislation or regulations will be enacted or become effective in the future or how existing or future laws or regulations will be administered or interpreted with respect to our operations. Many of these laws and regulations are becoming increasingly stringent, and the cost of compliance with these requirements can be expected to increase over time. For example, on September 12, 2012, the EPA published final amendments to the NSPS for petroleum refineries to be effective November 13, 2012. These amendments include standards for emissions of nitrogen
24
oxides from process heaters and work practice standards and monitoring requirements for flares. To comply with the amendments, we plan to install and operate a continuous emissions monitoring system for nitrogen oxides on a process heater. We have already installed and will operate additional instrumentation on our flare. We anticipate the total cost for these two projects will be approximately $700,000 to be spent in 2012 through 2014. We continue to evaluate the regulation and amended standards, as may be applicable to the operations at our refinery. We cannot currently predict what additional costs that we may have to incur, if any, to comply with the amended NSPS, but the costs could be material. In addition, the EPA has announced that it plans to propose new “Tier 3” motor vehicle emission and fuel standards sometime in 2013. It has been reported that these new Tier 3 regulations may, among other things, lower the maximum average sulfur content of gasoline from 30 parts per million to 10 parts per million. If the Tier 3 regulations are eventually implemented and lower the maximum allowable content of sulfur or other constituents in fuels that we produce, we may at some point in the future be required to make significant capital expenditures and/or incur materially increased operating costs to comply with the new standards. Expenditures or costs for environmental, health and safety compliance could have a material adverse effect on our results of operations, financial condition and profitability and, as a result, our ability to satisfy our debt obligations.
We could incur significant costs in cleaning up contamination at our refinery, terminal and convenience stores.
Our refinery site has been used for refining activities for many years. Petroleum hydrocarbons and various substances have been released on or under our refinery site. Marathon performed remediation of known soil and groundwater contamination beneath the refinery for many years, and we will continue to perform remediation of this known contamination until the appropriate regulatory standards have been achieved. These remediation efforts are being overseen by the MPCA pursuant to a remediation settlement agreement entered into by the former owner and the MPCA in 2007. Releases of petroleum hydrocarbons have also occurred at several of our convenience stores, and we have performed and will continue to perform remediation of this known contamination until the applicable regulatory standards are met. Costs for such remediation activities are often unpredictable, and there can be no assurance that the future costs will not be material. It is possible that we may identify additional contamination in the future, which could result in additional remediation obligations and expenses, including fines and penalties.
We are subject to strict laws and regulations regarding employee and business process safety, and failure to comply with these laws and regulations could have a material adverse effect on our results of operations and financial condition.
We are subject to the requirements of OSHA and comparable state statutes that regulate the protection of the health and safety of workers. In addition, OSHA requires that we maintain information about hazardous materials used or produced in our operations and that we provide this information to employees, state and local governmental authorities, and local residents. Failure to comply with OSHA requirements, including general industry standards, process safety standards and control of occupational exposure to regulated substances, could subject us to significant fines or cause us to spend significant amounts on compliance, which could have a material adverse effect on our results of operations, financial condition and the cash flows of the business and, as a result, our ability to satisfy our debt obligations.
Compliance with and changes in tax laws could adversely affect our performance.
We are subject to extensive tax liabilities, including federal, state and transactional taxes such as excise, sales/use, payroll, franchise, withholding and ad valorem taxes. New tax laws and regulations and changes in existing tax laws and regulations are continuously being enacted or proposed that could result in increased expenditures for tax liabilities in the future. Certain of these liabilities are subject to periodic audits by the respective taxing authority, which could increase our tax liabilities. Subsequent changes to our tax liabilities as a result of these audits may also subject us to interest and penalties. Any such changes in our tax liabilities could adversely affect our ability to satisfy our debt obligations.
Our insurance policies may be inadequate or expensive.
Our insurance coverage does not cover all potential losses, costs or liabilities. We could suffer losses for uninsurable or uninsured risks or in amounts in excess of our existing insurance coverage. Our ability to obtain and maintain adequate insurance may be affected by conditions in the insurance market over which we have no control. In addition, if we experience insurable events, our annual premiums could increase further or insurance may not be available at all or if it is available, on limited coverage items. The occurrence of an event that is not fully covered by insurance or the loss of insurance coverage could have a material adverse effect on our business, financial condition, and results of operations and, as a result, our ability to satisfy our debt obligations.
25
Increased costs of capital could adversely affect our business.
Our business and operating results can be harmed by factors such as the availability, terms and cost of capital, increases in interest rates or a reduction in credit rating. Changes in any one or more of these factors could cause our cost of doing business to increase, limit our access to capital, limit our ability to pursue acquisition opportunities, reduce our cash flows and place us at a competitive disadvantage. Recent and continuing disruptions and volatility in the global financial markets may lead to an increase in interest rates or a contraction in credit availability impacting our ability to finance our operations.
Additionally, as with other yield-oriented securities, we expect that NTE LP’s unit price will be impacted by the level of its quarterly cash distributions and implied distribution yield. The distribution yield is often used by investors to compare and rank related yield-oriented securities for investment decision-making purposes. Therefore, changes in interest rates may affect the yield requirements of investors who invest in NTE LP’s common units, and a rising interest rate environment could have a material adverse impact on NTE LP’s unit price and our ability to issue additional equity to fund our operations or to make acquisitions or to incur debt as well as increasing our interest costs.
We require continued access to capital. In particular, the board of directors of NTE LP’s general partner has adopted a distribution policy pursuant to which it will distribute an amount equal to the available cash it generates each quarter to its unitholders. As a result, NTE LP will need to rely on external financing sources to fund our growth. A significant reduction in the availability of credit to our parent, NTE LP, could materially and adversely affect our ability to achieve our planned growth and operating results.
Risks Primarily Related to Our Refining Business
The price volatility of crude oil, other feedstocks, refined products and fuel and utility services may have a material adverse effect on our earnings, cash flows and liquidity and our ability to satisfy our debt obligations.
Our refining and retail earnings, cash flows and liquidity from operations depend primarily on the margin above operating expenses (including the cost of refinery feedstocks, such as crude oil and natural gas liquids that are processed and blended into refined products) at which we are able to sell refined products. Refining is primarily a margin-based business and, to increase earnings, it is important to maximize the yields of high value finished products while minimizing the costs of feedstock and operating expenses. When the margin between refined product prices and crude oil and other feedstock costs contracts, our earnings and cash flows are negatively affected. Refining margins historically have been volatile, and are likely to continue to be volatile, as a result of a
26
variety of factors, including fluctuations in the prices of crude oil, other feedstocks, refined products and fuel and utility services. For example, from January 2005 to December 2012, the price for NYMEX WTI crude oil fluctuated between $33.87 and $145.29 per barrel, while the price for U.S. Gulf Coast conventional gasoline fluctuated between $39.16 per barrel and $140.88 per barrel. While an increase or decrease in the price of crude oil may result in a similar increase or decrease in prices for refined products, there may be a time lag in the realization of the similar increase or decrease in prices for refined products. The effect of changes in crude oil prices on our refining margins therefore depends in part on how quickly and how fully refined product prices adjust to reflect these changes.
In addition, the nature of our business requires us to maintain substantial refined product inventories. Because refined products are commodities, we have no control over the changing market value of these inventories. Our refined product inventory is valued at the lower of cost or market value under the last-in, first-out (“LIFO”) inventory valuation methodology. If the market value of our refined product inventory were to decline to an amount less than our LIFO cost, we would record a write-down of inventory and a non-cash charge to cost of sales.
Prices of crude oil, other feedstocks and refined products depend on numerous factors beyond our control, including the supply of and demand for crude oil, other feedstocks, gasoline, diesel, asphalt and other refined products. Such supply and demand are affected by, among other things:
| | • | | changes in global and local economic conditions; |
| | • | | domestic and foreign demand for fuel products, especially in the United States, China and India; |
| | • | | worldwide political conditions, particularly in significant oil producing regions such as the Middle East, West Africa and Latin America; |
| | • | | the level of foreign and domestic production of crude oil and refined products and the volume of crude oil, feedstock and refined products imported into the United States; |
| | • | | availability of and access to transportation infrastructure; |
| | • | | utilization rates of U.S. refineries; |
| | • | | the ability of the members of the Organization of Petroleum Exporting Countries to affect oil prices and maintain production controls; |
| | • | | development and marketing of alternative and competing fuels; |
| | • | | commodities speculation; |
| | • | | natural disasters (such as hurricanes and tornadoes), accidents, interruptions in transportation, inclement weather or other events that can cause unscheduled shutdowns or otherwise adversely affect our refineries; |
| | • | | federal and state government regulations and taxes; and |
| | • | | local factors, including market conditions, weather conditions and the level of operations of other refineries and pipelines in our markets. |
Our direct operating expense structure also impacts our earnings. Our major direct operating expenses include employee and contract labor, maintenance and energy costs. Our predominant variable direct operating cost is energy, which is comprised primarily of fuel and other utility services. The volatility in costs of fuel, principally natural gas, and other utility services, principally electricity, used by our refinery and other operations affect our operating costs. Fuel and utility prices have been, and will continue to be, affected by factors outside our control, such as supply and demand for fuel and utility services in both local and regional markets. Natural gas prices have historically been volatile and, typically, electricity prices fluctuate with natural gas prices. Future increases in fuel and utility prices may have a negative effect on our earnings and cash flows. Fuel and other utility services costs constituted approximately 13.0% and 13.3% of our total direct operating expenses for the years ended December 31, 2012 and 2011, respectively.
Volatility in refined product prices also affects our borrowing base under our revolving credit facility. A decline in prices of our refined products reduces the value of our refined product inventory collateral, which, in turn, may reduce the amount available for us to borrow under our revolving credit facility.
Our results of operations are affected by crude oil differentials, which may fluctuate substantially.
Our results of operations are affected by crude oil differentials, which may fluctuate substantially. Since 2010, refined product prices have been more correlated to prices of Brent than to NYMEX WTI, the traditional U.S. crude oil benchmark, as the discount to which a barrel of NYMEX WTI traded relative to a barrel of Brent has widened significantly relative to historical levels. This differential has also been very volatile as a result of various continuing geopolitical events as well as logistical and infrastructure constraints to move crude oil from Cushing, Oklahoma into the U.S. Gulf Coast. Between December 1, 2010 and December 31, 2012, the discount at which a barrel of NYMEX WTI traded relative to a barrel of Brent increased from $2.12 to $19.29. The widening of this price differential benefited refineries, such as ours, that are capable of sourcing and utilizing crude oil that is priced more in line
27
with NYMEX WTI. The refinery not only realized relatively lower feedstock costs but also was able to sell refined products at prices that had been pushed upward by higher Brent prices. A significant narrowing of this differential may have a material adverse effect on our results of operations and ability to pay distributions to our unitholders.
The dangers inherent in our operations could cause disruptions and could expose us to potentially significant losses, costs or liabilities and reduce our liquidity. We are particularly vulnerable to disruptions in our operations because all of our refining operations are conducted at a single facility.
Our operations are subject to significant hazards and risks inherent in refining operations and in transporting and storing crude oil, intermediate products and refined products. These hazards and risks include, but are not limited to, natural disasters, fires, explosions, pipeline ruptures and spills, third party interference and mechanical failure of equipment at our facilities, any of which could result in production and distribution difficulties and disruptions, pollution (such as oil spills, etc.), personal injury or wrongful death claims and other damage to our properties and the property of others. For example, in December 2007, a fuel oil tank roof caught on fire at our refinery when an operator was attempting to thaw a level gauge. The tank’s roof was destroyed and the operator was fatally injured during the fire.
There is also risk of mechanical failure and equipment shutdowns both in the normal course of operations and following unforeseen events. In such situations, undamaged refinery processing units may be dependent on, or interact with, damaged process units and, accordingly, are also subject to being shut down. For example, on May 6, 2012, our refinery experienced a temporary shutdown due to a power outage that appears to have originated from outside the plant as a result of high winds and thunderstorms. In the case of such a shutdown, the refinery must initiate a standard start-up process, and such process typically lasts several days. We were able to resume normal operations on May 13, 2012. Because all of our refining operations are conducted at a single refinery, any of such events at our refinery could significantly disrupt our production and distribution of refined products, including the supply of our refined products to our convenience stores, which receive substantially all of their supply of gasoline and diesel from the refinery. Any disruption in our ability to supply our convenience stores would increase the cost of purchasing refined products for our retail business. Any sustained disruption would have a material adverse effect on our business, financial condition, results of operations and cash flows and, as a result, our ability to satisfy our debt obligations.
We are subject to interruptions of supply and distribution as a result of our reliance on pipelines for transportation of crude oil, blendstocks and refined products.
Our refinery receives most of its crude oil and delivers a portion of its refined products through pipelines. The Minnesota Pipeline system is the primary supply route for crude oil and has transported substantially all of the crude oil used at our refinery. We also distribute a portion of our transportation fuels through pipelines owned and operated by Magellan Pipeline Company, L.P. (“Magellan”), including the Aranco Pipeline, which Magellan leases from us. We could experience an interruption of supply or delivery, or an increased cost of receiving crude oil and delivering refined products to market, if the ability of these pipelines to transport crude oil, blendstocks or refined products is disrupted because of accidents, weather interruptions, governmental regulation, terrorism, other third party action or any of the types of events described in the preceding risk factor. For example, there was a leak in 2006 prior to the completion of the expansion of the Minnesota Pipeline, and the refinery was temporarily shut off from any receipts from the Minnesota Pipeline other than crude oil that was already in the tanks at Cottage Grove, Minnesota. At that time, the only alternative to receive crude oil was the Wood River Pipeline, a pipeline extending from Wood River, Illinois to a connection with the Minnesota Pipeline near Pine Bend, Minnesota, which had limited capacity to meet the refinery’s needs. While the refinery can receive crude oil deliveries from the Wood River Pipeline if the Minnesota Pipeline system experiences another disruption, this would result in an increase in the cost of crude oil and therefore lower refining margins.
In addition, due to the common carrier regulatory obligation applicable to interstate oil pipelines, capacity must be prorated among shippers in an equitable manner in accordance with the tariff then in effect in the event there are nominations in excess of capacity. Therefore, nominations by new shippers or increased nominations by existing shippers may reduce the capacity available to us. Any prolonged interruption in the operation or curtailment of available capacity of the pipelines that we rely upon for transportation of crude oil and refined products could have a material adverse effect on our business, financial condition, results of operations and cash flows and, as a result, our ability to satisfy our debt obligations.
28
We must make substantial capital expenditures on our operating facilities to maintain their reliability and efficiency. If we are unable to complete capital projects at their expected costs and/or in a timely manner, or if the market conditions assumed in our project economics deteriorate, our financial condition, results of operations or cash flows, and our ability to satisfy our debt obligations, could be materially and adversely affected.
Delays or cost increases related to the engineering, procurement and construction of new facilities (or improvements and repairs to our existing facilities and equipment) could have a material adverse effect on our business, financial condition or results of operations, and our ability to satisfy our debt obligations. Such delays or cost increases may arise as a result of unpredictable factors in the marketplace, many of which are beyond our control, including:
| | • | | denial or delay in issuing regulatory approvals and/or permits; |
| | • | | unplanned increases in the cost of construction materials or labor; |
| | • | | disruptions in transportation of modular components and/or construction materials; |
| | • | | severe adverse weather conditions, natural disasters or other events (such as equipment malfunctions, explosions, fires or spills) affecting our facilities, or those of our vendors and suppliers; |
| | • | | shortages of sufficiently skilled labor, or labor disagreements resulting in unplanned work stoppages; |
| | • | | market-related increases in a project’s debt or equity financing costs; and/or |
| | • | | nonperformance or force majeure by, or disputes with, our vendors, suppliers, contractors or sub-contractors. |
Our refinery consists of many processing units, a number of which have been in operation for many years. Equipment, even if properly maintained, may require significant capital expenditures and expenses to keep it operating at optimum efficiency. For example, as part of installing safety instrumentation systems throughout the refinery to improve operational and safety performance, approximately $17 million was spent from 2006 through December 2012, and we have budgeted $6.2 million for additional related expenditures through 2013 to complete the instrumentation project. One or more of the units may require unscheduled downtime for unanticipated maintenance or repairs that may be more frequent than our scheduled turnarounds for such units. Scheduled and unscheduled maintenance could reduce our revenues during the period of time that the units are not operating. We are currently planning a major plant turnaround to occur during April 2013 and another partial turnaround for our fluid catalytic cracking unit during October 2013, for which we have budgeted aggregate spending of approximately $55 to $60 million. The refinery is currently expected to have reduced throughputs during the months of April and October 2013 to complete the turnarounds. We do not intend to reserve cash to pay distributions during periods of scheduled or unscheduled maintenance, though we do intend to reserve for turnaround expenses.
Any one or more of these occurrences could have a significant impact on our business. If we were unable to make up the delays or to recover the related costs, or if market conditions change, it could materially and adversely affect our financial position, results of operations or cash flows and, as a result, our ability to satisfy our debt obligations.
A portion of our workforce is unionized, and we may face labor disruptions that would interfere with our operations.
Approximately 180 of our employees associated with the operations of our refining business are covered by a collective bargaining agreement that expires in December 2013. In addition, 23 of our employees associated with the operations of our retail business are covered by a collective bargaining agreement that expires in August 2014. We may not be able to renegotiate our collective bargaining agreements on satisfactory terms or at all when such agreements expire. A failure to do so may increase our costs associated with our workforce. Other employees of ours who are not presently represented by a union may become so represented in the future as well. In 2006, the unionized refinery employees conducted a strike when Marathon sought to revise certain working terms and conditions. Another work stoppage resulting from, among other things, a dispute over a term or condition of a collective bargaining agreement that covers employees who work at our refinery or in our retail business, could cause disruptions in our business and negatively impact our results of operations and ability to satisfy our debt obligations. In August 2012, we locked out the unionized drivers at the Supermom’s bakery for six days when the parties were unable to come to terms on a new union contract.
Product liability claims and litigation could adversely affect our business and results of operations.
Product liability is a significant commercial risk. Substantial damage awards have been made in certain jurisdictions against manufacturers and resellers based upon claims for injuries caused by the use of or exposure to various products. Failure of our products to meet required specifications could result in product liability claims from our shippers and customers arising from contaminated or off-specification commingled pipelines and storage tanks and/or defective quality fuels. There can be no assurance that product liability claims against us would not have a material adverse effect on our business or results of operations or on our ability to satisfy our debt obligations.
29
Laws and regulations restricting emissions of GHGs could force us to incur increased capital and operating costs and could have a material adverse effect on our results of operations and financial condition.
In December 2009, the EPA determined that emissions of carbon dioxide, methane and other GHGs endanger public health and the environment because emissions of such gases are, according to the EPA, contributing to warming of the earth’s atmosphere and other climatic changes. Based on these findings, the EPA has begun adopting and implementing regulations to restrict emissions of GHGs under existing provisions of the federal Clean Air Act, as amended (“CAA”). The EPA adopted two sets of rules effective January 2, 2011 regulating GHG emissions under the CAA, one of which requires a reduction in emissions of GHGs from motor vehicles and the other of which regulates emissions of GHGs from certain large stationary sources. While the EPA’s rules relating to emissions of GHGs from large stationary sources are currently subject to a number of legal challenges, the federal courts have thus far declined to issue any injunctions to prevent the EPA from implementing or requiring state environmental agencies to implement the rules. The EPA has also implemented rules requiring the reporting of GHG emissions from specified large GHG emission sources in the United States, including petroleum refineries, on an annual basis, for emissions occurring after January 1, 2010. Additionally, in December 2010, the EPA reached a settlement agreement with numerous parties pursuant to which it agreed to promulgate NSPS for GHG emissions from petroleum refineries by December 2011. To date, however, the EPA has not proposed the NSPS for GHG emissions from petroleum refineries, and we cannot predict the requirements of these rules. We may be required to make significant capital expenditures and/or incur materially increased operating costs to comply with the GHG NSPS once it is finalized by the EPA.
In addition, the U.S. Congress has from time to time considered adopting legislation to reduce emissions of GHGs, and almost one-half of the states have already taken legal measures to reduce emissions of GHGs primarily through the planned development of GHG emission inventories and/or regional GHG cap and trade programs. These cap and trade programs generally work by requiring major sources of emissions, such as electric power plants, or major producers of fuels, such as refineries and gas processing plants, to acquire and on an annual basis surrender emission allowances. The number of allowances available for purchase is reduced over time in an effort to achieve the overall GHG emission reduction goal. Minnesota is a participant in the Midwest Regional GHG Reduction Accord, a non-binding resolution that could lead to the creation of a regional GHG cap-and-trade program if the Minnesota legislature and the legislatures of other participating states enact implementing legislation.
The adoption of legislation or regulatory programs to reduce emissions of GHGs could require us to incur increased operating costs, such as costs to purchase and operate emissions control systems, to acquire emissions allowances or comply with new regulatory or reporting requirements. Any such legislation or regulatory programs could also increase the cost of consuming, and thereby reduce demand for, the refined products that we produce. Consequently, legislation and regulatory programs to reduce emissions of GHGs could have an adverse effect on our business, financial condition and results of operations and, as a result, our ability to satisfy our debt obligations.
In addition, some scientists have concluded that increasing concentrations of GHGs in the earth’s atmosphere may produce climate changes that have significant physical effects, such as increased frequency and severity of storms, droughts, floods and other climatic events. If any such events were to occur, they could have an adverse effect on our business, financial condition and results of operations and, as a result, our ability to satisfy our debt obligations.
Renewable fuels mandates may reduce demand for the petroleum fuels we produce, which could have a material adverse effect on our results of operations and financial condition, and our ability to satisfy our debt obligations.
Pursuant to the Energy Policy Act of 2005 and the Energy Independence and Security Act of 2007, the EPA has issued RFS implementing mandates to blend renewable fuels into the petroleum fuels produced and sold in the United States. Under RFS, the volume of renewable fuels that obligated refineries like us must blend into their finished petroleum fuels increases annually over time until 2022. We currently purchase RINS for some fuel categories on the open market, as well as waiver credits for cellulosic biofuels from the EPA, in order to comply with the RFS. In the future, we may be required to purchase additional RINS on the open market and waiver credits from the EPA to comply with the RFS. We cannot currently predict the future prices of RINS or waiver credits, but the costs to obtain the necessary number of RINS and waiver credits could be material. Additionally, Minnesota law currently requires that all diesel sold in the state for use in internal combustion engines must contain at least 5% biodiesel. Under this statute, if certain preconditions are met, the minimum biodiesel content in diesel sold in the state was to increase to 10% beginning on May 1, 2012, and to 20% beginning on May 1, 2015. The increase to 10% did not occur on May 1, 2012, because the Minnesota commissioners of agriculture, commerce, and pollution control did not certify that all statutory pre-conditions were satisfied by the statutory deadline, but instead jointly recommended delaying the increase to 10% by one year, to May 1, 2013. Minnesota law also currently requires, with limited exceptions, that all gasoline sold or offered for sale in the state must contain the maximum amount of ethanol allowed under federal law for use in all gasoline-powered motor vehicles. On October 13, 2010, the EPA granted a partial waiver raising the maximum amount of ethanol allowed under federal law from 10% to 15% for cars and light trucks manufactured since 2007, and on January 21, 2011, the EPA extended the maximum allowable ethanol content of 15% to apply to cars and light trucks manufactured since 2001. The maximum amount allowed under federal law currently remains at 10% ethanol for all other vehicles. The EPA required that fuel and fuel additive manufacturers take certain steps before introducing gasoline containing 15% ethanol (“E15”) into the market, including developing and obtaining EPA approval of a plan to minimize the potential for E15 to be used in vehicles and
30
engines not covered by the partial waiver. The EPA has taken several recent actions to authorize the introduction of E15 into the market, including approving, on June 15, 2012, the first plans to minimize the potential for E15 to be used in vehicles and engines not covered by the partial waiver. Existing laws and regulations could change, and the minimum volumes of renewable fuels that must be blended with refined petroleum fuels may increase. Because we do not produce renewable fuels, increasing the volume of renewable fuels that must be blended into our products displaces an increasing volume of our refinery’s product pool, potentially resulting in lower earnings and materially adversely affecting our ability to satisfy our debt obligations.
Our pipeline interests are subject to federal and/or state rate regulation, which could reduce our profitability.
Our pipeline transportation activities are subject to regulation by multiple governmental agencies, and compliance with such regulation increases our cost of doing business and affects our profitability. Additional proposals and proceedings that affect the oil industry are regularly considered by Congress, the states, FERC and the courts. We cannot predict when or whether any such proposals may become effective or what impact such proposals may have. Projected expenditures related to the Minnesota Pipeline reflect the recurring costs resulting from compliance with these regulations, and these costs may increase due to future acquisitions, changes in regulation, changes in use, ongoing expenditures to maintain reliability and efficiency or discovery of existing but unknown compliance issues. In addition, if the current lease with Magellan of the Aranco Pipeline were terminated and we were to operate the Aranco Pipeline or, if the Cottage Grove pipelines were required to comply with these regulations, we would incur similar costs.
The Minnesota Pipeline is a common carrier pipeline providing interstate transportation service, which is subject to regulation by FERC under the ICA. The ICA requires that tariff rates for interstate petroleum pipelines transportation service be just and reasonable and that the rates and terms of service of such pipelines not be unduly discriminatory or unduly preferential. The tariff rates are generally set by the board of managers of the Minnesota Pipe Line Company, which we do not control. Because we currently do not operate the Minnesota Pipeline or control the board of managers of the Minnesota Pipe Line Company, we do not control how the Minnesota Pipeline’s tariff is applied, including the tariff provisions governing the allocation of capacity, or control of decision-making with respect to tariff changes for the pipeline.
FERC can investigate the pipeline’s rates and certain terms of service on its own initiative. In addition, shippers may file with FERC protests against new tariff rates and/or terms and conditions of service or complaints against existing tariff rates and/or terms and conditions of services. Under certain circumstances, FERC could limit the Minnesota Pipe Line Company’s ability to set rates based on its costs, or could order the Minnesota Pipe Line Company to reduce its rates and could require the payment of reparations to complaining shippers for up to two years prior to the complaint or refunds to all shippers in the context of a protest proceeding. If it found the Minnesota Pipeline’s rates or terms of service to be contrary to statutory requirements, FERC could impose conditions it considers appropriate and/or impose penalties. Further, FERC could declare pipeline-related facilities to be common carrier facilities and require that common carrier access be provided or otherwise alter the terms of service and/or rates of such facilities, to the extent applicable. Rate regulation or a successful challenge to the rates the Minnesota Pipeline charges could adversely affect its financial position, cash flows, or results of operations and, thus, our financial position, cash flows or results of operations. Conversely, reduced rates on the Minnesota Pipeline would reduce the rates for transportation of crude oil into our refinery.
FERC currently allows petroleum pipelines to change their rates within prescribed ceiling levels tied to an inflation index. The Minnesota Pipeline currently bases its rates on the indexing methodology. If the Minnesota Pipeline were to attempt to increase rates beyond the maximum allowed by the indexing methodology, it would be required to file a cost-of-service justification, obtain approval from an unaffiliated party that intends to ship on the pipeline (with respect to initial rates for any new service), obtain approval from all current shippers (i.e., settlement), or obtain prior approval to file market-based rates. FERC’s indexing methodology is subject to review every five years. In an order issued in December 2010, FERC announced that, effective July 1, 2011, the index would equal the change in the producer price index for finished goods plus 2.65% (previously, the index was equal to the change in the producer price index for finished goods plus 1.3%). This index is to be in effect through July 2016. If the increases in the index are not sufficient to fully reflect actual increases to our costs, our financial condition could be adversely affected. If the index results in a rate increase that is substantially in excess of the pipeline’s actual cost increases, or it results in a rate decrease that is substantially less than the pipeline’s actual cost decrease, the rates may be protested, and, if such protests are successful, result in the lowering of the pipeline’s rates below the indexed level. FERC’s rate-making methodologies may limit the pipeline’s ability to set rates based on our true costs and may delay or limit the use of rates that reflect increased costs of providing transportation service.
If we were to operate the Aranco Pipeline to provide transportation of crude oil or petroleum products in interstate commerce, we would expect to also be regulated by FERC as an interstate oil pipeline and the Aranco Pipeline would be subject to the same regulatory risks discussed above.
31
Terrorist attacks and other acts of violence or war may affect the market for our units, the industry in which we conduct our operations and our results of operations and our ability to satisfy our debt obligations.
Terrorist attacks may harm our results of operations. We cannot provide assurance that there will not be further terrorist attacks against the United States or U.S. businesses. Such attacks or armed conflicts may directly impact our refinery, properties or the securities markets in general. More generally, any of these events could cause consumer confidence and spending to decrease or result in increased volatility in the United States and worldwide financial markets and economy. Adverse economic conditions could harm the demand for our products or the securities markets in general, which could harm our operating results and ability to satisfy our debt obligations.
While we have insurance that provides some coverage against terrorist attacks, such insurance has become increasingly expensive and difficult to obtain. As a result, insurance providers may not continue to offer this coverage to us on terms that we consider affordable, or at all.
Some of our operations are conducted with partners, which may decrease our ability to manage risks associated with those operations.
We sometimes enter into arrangements to conduct certain business operations, such as pipeline transportation, with partners in order to share risks associated with those operations. However, these arrangements may also decrease our ability to manage risks and costs associated with those operations, particularly where we are not the operator. We could have limited influence over and control of the behaviors and performance of these operations. This could affect our operational performance, financial position and reputation.
We own 17% of the outstanding common interests of the Minnesota Pipe Line Company and 17% of the outstanding preferred shares of MPL Investments, which owns 100% of the preferred units of the Minnesota Pipe Line Company. The Minnesota Pipe Line Company owns the Minnesota Pipeline, a crude oil pipeline system in Minnesota that transports crude oil to the Twin Cities area and which consistently transports most of our crude oil input. The remaining interests in the Minnesota Pipe Line Company are held by a subsidiary of Koch Industries, Inc., which operates the system and is an affiliate of the only other refinery owner in Minnesota, with a 74.16% interest, and TROF Inc., with an 8.84% interest. For more information about the economic effect of our investments in the Minnesota Pipe Line Company and MPL Investments, see “Item 7. Management’s Discussion and Analysis of Financial Condition and Results of Operations—Critical Accounting Policies and Estimates” and “—Results of Operations.” Because our investments in the Minnesota Pipe Line Company and MPL Investments are limited, we do not have significant influence over or control of the performance of the Minnesota Pipe Line Company’s operations, which could impact our operational performance, financial position and reputation.
If we are unable to obtain our crude oil supply without the benefit of the crude oil supply and logistics agreement with JPM CCC or similar agreement, our exposure to the risks associated with volatile crude oil prices may increase.
Our supply and logistics agreement with JPM CCC allows us to price all crude oil processed at the refinery one day after it is received at the plant. This arrangement minimizes the amount of in-transit inventory and reduces our exposure to fluctuations in crude oil prices. In excess of 90% of the crude oil delivered at the refinery is handled through our agreement with JPM CCC independent of whether crude oil is sourced from our suppliers or from JPM CCC directly. If we are unable to obtain our crude oil supply through the crude oil supply and logistics agreement or similar agreement, our exposure to crude oil pricing risks may increase as the number of days between when we pay for the crude oil and when the crude oil is delivered to us increases. Such increased exposure could negatively impact our liquidity position due to our increased working capital needs as a result of the increase in the value of crude oil inventory we would have to carry on our balance sheet and, therefore, could adversely affect our ability to satisfy our debt obligations.
Our suppliers source a substantial amount of our crude oil from the Bakken Shale of North Dakota and may experience interruptions of supply from that region.
Our suppliers source a substantial amount of our crude oil from the Bakken Shale of North Dakota. As a result, we may be disproportionately exposed to the impact of delays or interruptions of supply from that region caused by transportation capacity constraints, curtailment of production, unavailability of equipment, facilities, personnel or services, significant governmental regulation, natural disasters, adverse weather conditions, plant closures for scheduled maintenance or interruption of transportation of oil or natural gas produced from the wells in that area.
Our commodity derivative contracts may limit our potential gains, exacerbate potential losses and involve other risks.
We may enter into commodity derivatives contracts to mitigate our crack spread risk with respect to a portion of our expected gasoline and diesel production. We enter into these arrangements with the intent to secure a minimum fixed cash flow stream on the volume of products hedged during the hedge term. However, our hedging arrangements may fail to fully achieve these objectives for a variety of reasons, including our failure to have adequate hedging contracts, if any, in effect at any particular time and the failure of our hedging arrangements to produce the anticipated results. We may not be able to procure adequate hedging arrangements due to a
32
variety of factors. Moreover, while intended to reduce the adverse effects of fluctuations in crude oil and refined product prices, such transactions may limit our ability to benefit from favorable changes in margins. In addition, our hedging activities may expose us to the risk of financial loss in certain circumstances, including instances in which:
| | • | | the volumes of our actual use of crude oil or production of the applicable refined products is less than the volumes subject to the hedging arrangement; |
| | • | | accidents, interruptions in feedstock transportation, inclement weather or other events cause unscheduled shutdowns or otherwise adversely affect our refinery, or those of our suppliers or customers; |
| | • | | the counterparties to our futures contracts fail to perform under the contracts; or |
| | • | | a sudden, unexpected event materially impacts the commodity or crack spread subject to the hedging arrangement. |
As a result, the effectiveness of our risk mitigation strategy could have a material adverse impact on our financial results and our ability to satisfy our debt obligations. See “Item 7A. Quantitative and Qualitative Disclosure About Market Risk.”
In addition, these risk mitigation activities involve basis risk. Basis risk in a hedging arrangement occurs when the price of the commodity we hedge is more or less variable than the index upon which the hedged commodity is based, thereby making the hedge less effective. For example, a NYMEX index used for hedging certain volumes of crude oil or refined products may have more or less variability than the cost or price for such crude oil or refined products. We currently have no plans to hedge the basis risk inherent in our derivatives contracts.
Our commodity derivative activities could result in period-to-period earnings volatility.
We do not apply hedge accounting to our commodity derivative contracts and, as a result, unrealized gains and losses are charged to our earnings based on the increase or decrease in the market value of the unsettled position. These gains and losses are reflected in our income statement in periods that differ from when the underlying hedged items (i.e., gross margins) are reflected in our income statement. Such derivative gains or losses in earnings may produce significant period-to-period earnings volatility that is not necessarily reflective of our underlying operational performance.
Derivatives regulation included in current financial reform legislation could impede our ability to manage business and financial risks by restricting our use of derivative instruments as hedges against fluctuating commodity prices.
The U.S. Congress adopted the Dodd-Frank Wall Street Reform and Consumer Protection Act in 2010 (the “Dodd-Frank Act”). This comprehensive financial reform legislation establishes federal oversight and regulation of the over-the-counter derivatives market and entities, such as us, that participate in that market. The legislation was signed into law by the President on July 21, 2010 and requires the Commodity Futures Trading Commission (“CFTC”) and the SEC to promulgate rules and regulations implementing the new legislation within 360 days from the date of enactment. In December 2011, the CFTC extended temporary exemptive relief from the deadline for certain regulations applicable to swaps until no later than July 16, 2012. The CFTC has since adopted regulations to set position limits for certain futures and option contracts in the major energy markets. The CFTC has also proposed to establish minimum capital requirements, although it is not possible at this time to predict whether or when the CFTC will adopt these rules as proposed or include comparable provisions in its rulemaking under the Dodd-Frank Act. The Dodd-Frank Act may also require compliance with margin requirements and with certain clearing and trade-execution requirements in connection with certain derivative activities, although the application of those provisions is uncertain at this time. The legislation may also require the counterparties to our commodity derivative contracts to spinoff some of their derivatives activities to a separate entity, which may not be as creditworthy as the current counterparty, or cause the entity to comply with the capital requirements, which could result in increased costs to counterparties such as us.
The Dodd-Frank Act and any new regulations could significantly increase the cost of some commodity derivative contracts (including through requirements to post collateral, which could adversely affect our available liquidity), materially alter the terms of some commodity derivative contracts, reduce the availability of some derivatives to protect against risks we encounter, reduce our ability to monetize or restructure our existing commodity derivative contracts and potentially increase our exposure to less creditworthy counterparties. If we reduce our use of derivatives as a result of the Dodd-Frank Act and any new regulations, our results of operations may become more volatile and our cash flows may be less predictable, which could adversely affect our ability to satisfy our debt obligations or plan for and fund capital expenditures. Increased volatility may make us less attractive to certain types of investors. Finally, the Dodd-Frank Act was intended, in part, to reduce the volatility of oil and natural gas prices, which some legislators attributed to speculative trading in derivatives and commodity instruments related to oil and natural gas. If the Dodd-Frank Act and any new regulations result in lower commodity prices, our revenues could be adversely affected. Any of these consequences could adversely affect our business, financial condition and results of operations and therefore could have an adverse effect on our ability to satisfy our debt obligations.
33
Risks Primarily Related to Our Retail Business
Our retail business depends on one principal supplier for a substantial portion of its merchandise inventory. A change of merchandise suppliers, a disruption in merchandise supply, a significant change in our relationship with our principal merchandise supplier or material changes in the payment terms or availability of trade credit provided by our merchandise suppliers could have a material adverse effect on our retail business and results of operations or liquidity.
Eby-Brown Company (“Eby-Brown”) is a wholesale grocer that has been the primary supplier of general merchandise, including most tobacco and grocery items, for all our retail stores since 1993. For the years ended December 31, 2012 and 2011, our retail business purchased approximately 76% and 75%, respectively, of its convenience store inside merchandise requirements from Eby-Brown. Our retail business also purchases a variety of merchandise, including soda, beer, bread, dairy products, ice cream and snack foods, directly from a number of manufacturers and their wholesalers. A change of merchandise suppliers, a disruption in merchandise supply or a significant change in our relationship with Eby-Brown could have a material adverse effect on our retail business and results of operations. In addition, our retail business is impacted by the availability of trade credit to fund merchandise purchases. Any material changes in the payments terms, including payment discounts, or availability of trade credit provided by our merchandise suppliers could adversely affect our liquidity or results of operations and, as a result, our ability to satisfy our debt obligations.
If the locations of our current convenience stores become unattractive to customers and attractive alternative locations are not available for a reasonable price, then our ability to maintain and grow our retail business will be adversely affected.
We believe that the success of any retail store depends in substantial part on its location. There can be no assurance that the locations of our retail stores will continue to be attractive to customers as demographic patterns change. Neighborhood or economic conditions where retail stores are located could decline in the future, resulting in potentially reduced sales in these locations. If we cannot obtain desirable locations at reasonable prices, our ability to maintain and grow our retail business could be adversely affected, which could have an adverse effect on our business, financial condition or results of operations and, as a result, our ability to satisfy our debt obligations.
The growth of our retail business depends in part on our ability to open and profitably operate new convenience stores and to successfully integrate acquired sites and businesses in the future.
We may not be able to open new convenience stores and any new stores we open may be unprofitable. Additionally, acquiring sites and businesses in the future involves risks that could cause our actual growth or operating results to be lower than expected. If these events were to occur, each would have a material adverse impact on our financial results. There are several factors that could affect our ability to open and profitably operate new stores or to successfully integrate acquired sites and businesses. These factors include:
| | • | | competition in targeted market areas; |
| | • | | difficulties during the acquisition process in discovering certain liabilities of the businesses that we acquire; |
| | • | | the inability to identify and acquire suitable sites or to negotiate acceptable leases for such sites; |
| | • | | difficulties associated with the growth of our financial controls, information systems, management resources and human resources needed to support our future growth; |
| | • | | difficulties with hiring, training and retaining skilled personnel, including store managers; |
| | • | | difficulties in adapting distribution and other operational and management systems to an expanded network of stores; |
| | • | | the potential inability to obtain adequate financing to fund our expansion; |
| | • | | limitations on investments contained in our revolving credit facility and other debt instruments; |
| | • | | difficulties in obtaining governmental and other third-party consents, permits and licenses needed to operate additional stores; |
| | • | | difficulties in obtaining any cost savings, accretion and financial improvements anticipated from future acquired stores or their integration; and |
| | • | | challenges associated with the consummation and integration of any future acquisition. |
Our retail store franchisees are independent business operators that could take actions that harm our brand, reputation or goodwill, which could adversely affect our business, results of operations, financial condition or cash flows.
Our retail store franchisees are independent business operators, not employees, and, as such, we cannot control their operations. These franchisees could hire and fail to train unqualified sales associates and other employees, or operate the franchised retail stores in a manner inconsistent with our operating standards. If our retail store franchisees provide diminished quality of service to customers, or if they engage or are accused of engaging in unlawful or tortious acts, such as sexual harassment or discriminatory practices in violation of applicable laws, then our brand, reputation or goodwill could be harmed, which could have an adverse effect on our business, results of operations, financial condition or cash flows and, as a result, our ability to satisfy our debt obligations.
34
Additionally, as independent business operators, our retail store franchisees could occasionally disagree with us or with our strategies regarding our retail business or with our interpretation of the rights and obligations set forth under our retail franchise agreement. This could lead to disputes with our retail store franchisees, which we expect to occur from time to time in the future as we continue to offer and sell retail store franchises. To the extent we have such disputes, the attention of our management and our retail store franchisees could be diverted, which could have an adverse effect on our business, results of operations, financial condition or cash flows and, as a result, our ability to satisfy our debt obligations.
Credit and debit card data loss, litigation and/or liability could significantly harm our reputation and adversely impact our business.
In connection with credit and debit card sales at our retail stores, we transmit confidential credit and debit card information securely over public networks. Third parties may have the technology or know-how to breach the security of this customer information, and our security measures may not effectively prohibit others from obtaining improper access to this information. If a person is able to circumvent our security measures, he or she could destroy or steal valuable information or disrupt our operations. Any security breach could expose us to risks of data loss, litigation and liability and could seriously disrupt our operations and any resulting negative publicity could significantly harm our reputation.
Our failure or inability to enforce our current and future trademarks and trade names could adversely affect our efforts to establish brand equity and expand our retail franchising business.
Our ability to successfully expand our retail franchising business will depend on our ability to establish brand equity through the use of our current and future trademarks, service marks, trade dress and other proprietary intellectual property, including our name and logos. Some or all of these intellectual property rights may not be enforceable, even if registered, against any prior users of similar intellectual property or our competitors who seek to use similar intellectual property in areas where we operate or intend to conduct operations. If we fail to enforce any of our intellectual property rights, then we may be unable to capitalize on our efforts to establish brand equity.
We could encounter claims from prior users of similar intellectual property in areas where we operate or intend to conduct operations, which could result in additional expenditures and divert our management’s time and attention from our operations. Conversely, competing businesses, including any of our former retail store franchisees, could infringe on our intellectual property, which would necessarily require us to defend our intellectual property possibly at a significant cost to us.
Our retail business is vulnerable to changes in consumer preferences, economic conditions and other trends and factors that could harm our business, results of operations, financial condition or cash flows.
Our retail business is affected by consumer preferences, national, regional and local economic conditions, demographic trends and consumer confidence in the economy. Factors such as traffic patterns, weather conditions, local demographics and the number and locations of competing retail service stations and convenience stores also affect the performance of our retail stores. In addition, we cannot ensure that our retail customers will continue to frequent our retail stores or that we will be able to find new retail store franchisees or encourage our existing retail store franchisees to grow their franchised business or renew their franchise rights. Adverse changes in any of these trends or factors could reduce our retail customer traffic or sales, or impose limits on our pricing, which could adversely affect our business, results of operations, financial condition or cash flows and, as a result, our ability to satisfy our debt obligations.
We face the risk of litigation in connection with our retail operations.
We are from time to time the subject of complaints or litigation from our consumers alleging illness, injury or other health or operational concerns. Adverse publicity resulting from these allegations may materially adversely affect us and our brand, regardless of whether the allegations are valid or whether we are liable. In addition, employee claims against us based on, among other things, discrimination, harassment or wrongful termination, or labor code violations may divert financial and management resources that would otherwise be used to benefit our future performance. There is also a risk of litigation from our franchisees. We have been subject to a variety of these and other claims from time to time and a significant increase in the number of these claims or the number that are successful could materially adversely affect our business, prospects, financial condition, operating results or cash flows and, as a result, our ability to satisfy our debt obligations.
Failure of our retail business to comply with state and local laws regulating the sale of alcohol and tobacco products could result in the loss of necessary licenses and the imposition of fines and penalties on us, which could have a material adverse effect on our business, liquidity and results of operations.
State and local laws regulate the sale of alcohol and tobacco products. In certain areas where our stores are located, state or local laws limit the hours of operation for the sale of alcohol, or prohibit the sale of alcohol, and permit the sale of alcohol and tobacco products only to persons older than a certain age. State and local regulatory agencies have the authority to approve, revoke, suspend or deny applications for, and renewals of, permits and licenses relating to the sale of alcohol and tobacco products and to issue fines to
35
stores for the improper sale of alcohol and tobacco products. Most jurisdictions, in their permit and license applications, require an applicant to disclose past denials, suspensions, or revocations of permits or licenses relating to the sale of alcohol and tobacco products in any jurisdiction. Thus, if we experience a denial, suspension, or revocation in one jurisdiction, then it could have an adverse effect on our ability to obtain permits and licenses relating to the sale of alcohol and tobacco products in other jurisdictions. In addition, the failure of our retail business to comply with state and local laws regulating the sale of alcohol and tobacco products could result in the loss of necessary licenses and the imposition of fines and penalties on us. Such a loss or imposition could have a material adverse effect on our business, liquidity and results of operations and, as a result, our ability to satisfy our debt obligations.
Risks Relating to the Notes
Our significant debt obligations could limit our flexibility in managing our business and expose us to risks.
We have a significant amount of indebtedness. As of December 31, 2012, we had $275 million of total indebtedness, representing our 7.125% senior secured notes due 2020, and had availability under our $300 million senior secured asset-based revolving credit facility, which is subject to a borrowing base (the “ABL Facility”) of $168.4 million (which is net of $36.5 million in outstanding letters of credit). In addition, we are permitted under our ABL Facility, our hedge agreement with J. Aron & Company and our hedge agreement with Macquarie Bank Limited (together the “Hedge Agreements”) and the indenture governing the notes to incur additional debt, subject to certain limitations. Our high degree of leverage may have important consequences to you, including the following:
| | • | | we may have difficulty satisfying our obligations under the notes or other indebtedness, and if we fail to comply with these requirements, an event of default could result; |
| | • | | we may be required to dedicate a substantial portion of our cash flow from operations to required payments on indebtedness, thereby reducing the availability of cash flow for working capital, capital expenditures and other general corporate activities; |
| | • | | covenants relating to our debt may limit our ability to obtain additional financing for working capital, capital expenditures and other general corporate activities; |
| | • | | covenants relating to our debt may limit our flexibility in planning for, or reacting to, changes in our business and the industry in which we operate; |
| | • | | we may be more vulnerable than our competitors to the impact of economic downturns and adverse developments in our business; and |
| | • | | we may be placed at a competitive disadvantage against any less leveraged competitors. |
The occurrence of any one of these events could have a material adverse effect on our business, financial condition, results of operations, prospects and ability to satisfy our obligations under the notes.
We may incur additional indebtedness, which could increase our risk exposure from debt.
Subject to restrictions in the indenture governing the notes, in the Hedge Agreements and under our ABL Facility, we may incur additional indebtedness, which could increase the risks associated with our already substantial indebtedness. Any borrowings under our ABL Facility are secured by first-priority liens on the (i) inventory, (ii) accounts receivable, (iii) investment property, general intangibles (excluding trademarks, trade names and other intellectual property), books and records, documents and instruments and supporting obligations, deposit accounts and other bank and securities accounts (with certain exceptions), and cash and cash equivalents, in each case, relating to the items in clauses (i) and (ii), and (iv) certain other related assets, in each case owned or hereinafter acquired by the issuers and each of the subsidiary guarantors (the “ABL Priority Collateral”), and second-priority liens on substantially all present and hereinafter acquired tangible and intangible assets of the issuers and each of the subsidiary guarantors , other than the ABL Priority Collateral (the “Note Priority Collateral”). The terms of the indenture governing the notes and the Hedge Agreements permit us to incur additional debt, including additional secured debt. If we incur any additional debt secured by liens that rank equally with those securing the notes, including any hedge agreements that are designated as pari passu hedge agreements with the notes, the holders of that debt will be entitled to share ratably with you in any proceeds distributed in connection with any insolvency, liquidation, reorganization, dissolution or other winding-up of us.
We may not be able to generate sufficient cash flows to meet our debt service obligations, including the notes, and may be forced to take other actions to satisfy our obligations under our indebtedness, which may not be successful.
Our ability to make scheduled payments on, or to refinance, our obligations with respect to our indebtedness, including the notes, will depend on our financial and operating performance, which in turn will be affected by general economic conditions and by financial, competitive, regulatory and other factors beyond our control. We cannot assure you that our business will generate sufficient cash flows from operations or that future sources of capital will be available to us in an amount sufficient to enable us to service our indebtedness, including the notes, or to fund our other liquidity needs. If we are unable to generate sufficient cash flows to satisfy our debt obligations, we may have to undertake alternative financing plans, such as refinancing or restructuring our debt, selling assets, reducing or delaying capital investments or seeking to raise additional capital. We cannot assure you that any refinancing would be possible, that any assets could be sold or, if sold, of the timing of the sales and the amount of proceeds that may be realized from those sales, or that additional financing could be obtained on acceptable terms, if at all. The ABL Facility and the indenture governing the notes restrict our ability to dispose of assets and use the proceeds from the disposition. Our inability to generate sufficient cash flows to satisfy our debt obligations, or to refinance our indebtedness on commercially reasonable terms, would materially and adversely affect our financial condition and results of operations and our ability to satisfy our obligations under the notes.
36
If we cannot make scheduled payments on our debt, we will be in default and holders of the notes could declare all outstanding principal and interest to be due and payable, the lenders under the ABL Facility could terminate their commitments to loan money, our secured lenders could foreclose against the assets securing their borrowings and we could be forced into bankruptcy or liquidation. All of these events could result in your losing your investment in the notes.
Restrictive covenants in our ABL Facility, the Hedge Agreements and the indenture governing the notes may restrict our ability to pursue our business strategies.
Our ABL Facility and the indenture governing the notes contain a number of restrictive covenants that impose significant operating and financial restrictions on us and may limit our ability to engage in acts that may be in our long-term best interest, including restrictions on our ability, among other things, to:
| | • | | incur, assume or guarantee additional debt or issue redeemable stock or preferred stock; |
| | • | | pay dividends on or make distributions in respect of capital stock or make certain other restricted payments or investments; |
| | • | | prepay, redeem, or repurchase certain debt; |
| | • | | enter into agreements that restrict distributions from restricted subsidiaries; |
| | • | | sell or otherwise dispose of assets, including capital stock of subsidiaries; |
| | • | | enter into new lines of business; |
| | • | | enter into transactions with affiliates; and |
| | • | | merge, consolidate or sell substantially all of our assets. |
Certain of these covenants will cease to apply to the notes at all times when the notes have investment grade ratings from both Moody’s Investors Service, Inc. and Standard & Poor’s Rating Services.
As of December 31, 2012, our availability under the ABL facility was $168.4 million (which is net of $36.5 million in outstanding letters of credit). The borrowing base is calculated on a monthly (or more frequent under certain circumstances) valuation of our inventory, accounts receivable and certain cash balances. As a result, our access to credit under the ABL Facility is potentially subject to significant fluctuation, depending on the value of the borrowing base-eligible assets as of any measurement date. In addition, under the ABL Facility, if our excess availability falls below the greater of 15% of the borrowing base (not to exceed 15% of the commitments) and $22.5 million, we will be required to satisfy and maintain a fixed charge coverage ratio not less than 1.0 to 1.0. Our ability to meet the required fixed charge coverage ratio can be affected by events beyond our control, and we may not meet this ratio. Moreover, the ABL Facility provides the lenders discretion to impose reserves or availability blocks, which could materially impair the amount of borrowings that would otherwise be available to us. The impact of taking any such actions could materially and adversely impair our ability to make interest payments on the notes. The inability to borrow under the ABL Facility may adversely affect our liquidity, financial position and results of operations.
A breach of the covenants under the indenture governing the notes or under the credit agreement governing the ABL Facility could result in an event of default under the applicable indebtedness. Such default may allow the creditors to accelerate the related debt and may result in the acceleration of any other debt to which a cross-acceleration or cross-default provision applies. In addition, an event of default under our ABL Facility would permit the lenders under the ABL Facility to terminate all commitments to extend further credit under that facility. Furthermore, if we were unable to repay the amounts due and payable under our ABL Facility, those creditors could proceed against the collateral granted to them to secure that indebtedness. In the event our lenders or noteholders accelerate the repayment of our borrowings, we may not have sufficient assets to repay that indebtedness. As a result of these restrictions, we may be:
| | • | | limited in how we conduct our business; |
| | • | | unable to raise additional debt or equity financing to operate during general economic or business downturns; or |
| | • | | unable to compete effectively or to take advantage of new business opportunities. |
In addition, the Hedge Agreements contains a number of restrictive covenants that limit our ability to, among other things, incur, assume or guarantee funded debt that is secured by a lien that ranks in priority with respect to the benefit of liens on the collateral securing the notes; and sell all or any portion of the refinery, including the related equipment and facilities and light products terminal located at the refinery and the Cottage Grove, Minnesota storage tanks, if such a sale would materially and adversely alter the
37
operations or value of the refinery, taken as a whole. A breach of any of the covenants under the Hedge Agreements could result in an event of default. Such default allows J. Aron & Company and Macquarie Bank Limited to terminate all outstanding transactions governed by the Hedge Agreement. If we are unable to find a replacement crack spread hedge counterparty, such a termination will limit our capacity to hedge our crack spread risk with respect to significant percentages of the refinery’s projected monthly production of some or all of its refined products.
These restrictions may affect our ability to grow in accordance with our plans.
Certain of our assets are excluded from the collateral.
Certain of our assets are excluded from the collateral securing the notes as described under “Liquidity and Capital Resources—Description of Our Indebtedness—2020 Secured Notes,” including certain non-material owned real property (particularly all of our convenience stores and SuperMom’s Bakery subject to the sale-leaseback arrangement) and all leased real property, as well as other typical exclusions, such as motor vehicles, capital stock of non-wholly owned subsidiaries if the pledge of such capital stock would violate a contractual obligation, or a contract, license or other asset if the grant of a lien would violate such contract, license or a debt obligation with respect to such asset. In addition, the pledge of a portion of the capital stock of subsidiaries that secures the notes is automatically released under certain circumstances as described in the immediately succeeding risk factors.
If an event of default occurs and the notes are accelerated, the notes and the note guarantees will rank equally with the holders of other unsubordinated and unsecured indebtedness of the relevant entity with respect to such excluded assets. To the extent the claims of the noteholders exceed the value of the assets securing the notes and the note guarantees and other liabilities, claims related to the excluded assets will rank equally with the claims of the holders of any other unsecured indebtedness. As a result, if the value of the assets pledged as security for the notes is less than the value of the claims of the holders of the notes, those claims may not be satisfied in full before the claims of our unsecured creditors are paid.
The pledge of the capital stock of our subsidiaries that secure the notes is automatically released for so long as such pledge would require the filing of separate financial statements with the SEC for that subsidiary.
The notes are secured by a pledge of the stock of our subsidiaries held by the issuers or the subsidiary guarantors. Under the SEC regulations in effect as of the issue date of the notes, if the aggregate principal amount, par value or book value as carried by the issuers or market value (whichever is greatest) of the capital stock or other securities of a subsidiary pledged as part of the collateral is equal to or greater than 20% of the aggregate principal amount of the notes then outstanding, such a subsidiary would be required to provide separate financial statements to the SEC in filings the issuer makes with the SEC. Therefore, the indenture and the collateral documents provide that any capital stock and other securities of any of our subsidiaries will be excluded from the collateral for so long as, and to the extent that, the pledge of such capital stock or other securities to secure the notes would require that subsidiary to file separate financial statements with the SEC pursuant to Rule 3-16 of Regulation S-X or another similar rule. Therefore, holders of the notes could lose a portion or all of their security interest in the capital stock or other securities of those subsidiaries during that period. A portion of the capital stock of each of St. Paul Park Refining Co. LLC and Northern Tier Retail LLC has been released from the pledge as collateral as a result of the filing of this registration statement for the exchange offer. See “Liquidity and Capital Resources—Description of Our Indebtedness—2020 Secured Notes.” Notwithstanding the foregoing, any such capital stock that is excluded as collateral securing the notes will not be excluded from the collateral securing the ABL Facility and certain of our hedging arrangements. As a result, the notes are effectively subordinated to the ABL Facility (which would otherwise be junior in priority with respect to the value of such capital stock) and to certain of our hedging arrangements to the extent of the value of such capital stock excluded from the collateral securing the notes. It may be more difficult, costly and time-consuming for holders of the notes to foreclose on the assets of a subsidiary than to foreclose on its capital stock or other securities, so the proceeds realized upon any such foreclosure could be significantly less than those that would have been received upon any sale of the capital stock or other securities of such subsidiary.
There may not be sufficient collateral to pay all or any of the notes.
The collateral securing the notes is subject to first-priority liens, subject to permitted liens, in favor of the lenders under our ABL Facility with respect to the ABL Priority Collateral, although the holders of the notes will have first-priority liens in their favor with respect to the Note Priority Collateral, subject to permitted liens. As a result, upon any distribution to our creditors, liquidation, reorganization or similar proceedings, or following acceleration of our indebtedness or an event of default under our indebtedness, the lenders under our ABL Facility will be entitled to be repaid in full from the proceeds of the ABL Priority Collateral securing the indebtedness to them before any payment is made to you from the proceeds of that collateral. On the other hand, holders of the notes (together with lenders under certain hedging obligations) will be entitled to be repaid in full from the proceeds of our Note Priority Collateral before any payment is made to the lenders under our ABL Facility from the proceeds of that collateral.
The fair market value of the collateral securing the notes is subject to fluctuations based on factors that include, among others, the condition of our industry, the ability to sell the collateral in an orderly sale, general economic conditions, the availability of buyers and other factors. The amount to be received upon a sale of the collateral would be dependent on numerous factors, including, but not limited to, the actual fair market value of the collateral at such time and the timing and the manner of the sale. By its nature, portions
38
of the collateral may be illiquid and may have no readily ascertainable market value. Accordingly, there can be no assurance that the collateral can be sold in a short period of time or in an orderly manner. In the event of a foreclosure, liquidation, reorganization, bankruptcy or other insolvency proceeding, we cannot assure you that the proceeds from any sale or liquidation of the collateral will be sufficient to pay our obligations under the notes. In addition, in the event of any such proceeding, the ability of the holders of the notes to realize upon any of the collateral may be subject to bankruptcy and insolvency law limitations. See “Liquidity and Capital Resources—Description of Our Indebtedness—2020 Secured Notes.”
In addition, the security interest of the trustee, as collateral agent for the notes, is subject to practical problems generally associated with the realization of security interests in collateral. For example, the trustee, as collateral agent for the notes, may need to obtain the consent of a third party to obtain or enforce a security interest in a contract. We cannot assure you that the collateral agent will be able to obtain any such consent. We also cannot assure you that the consents of any third parties will be given when required to facilitate a foreclosure on such assets. Also, certain items included in the collateral may not be transferable (by their terms or pursuant to applicable law) and therefore the trustee may not be able to realize value from such items in the event of a foreclosure. Accordingly, the trustee, as collateral agent for the notes, may not have the ability to foreclose upon those assets and the value of the collateral may significantly decrease.
The ABL Priority Collateral securing the notes will be subject to any and all exceptions, defects, encumbrances, liens and other imperfections as may be accepted by the administrative agent under the ABL Facility and any creditors that have the benefit of first liens on the collateral securing the notes from time to time, whether on or after the date the notes are issued. The existence of any such exceptions, defects, encumbrances, liens and other imperfections could adversely affect the value of the collateral securing the notes, as well as the ability of the trustee, as collateral agent for the notes, to realize or foreclose on such collateral.
Other secured obligations, including indebtedness under our ABL Facility, are effectively senior to the notes to the extent of the value of the collateral securing such obligations on a first-priority basis.
Borrowings under our ABL Facility, as well as certain other obligations to the lenders under our ABL Facility and their affiliates, are collateralized by a first-priority lien, subject to permitted liens, in the ABL Priority Collateral. See “Description of Other Indebtedness.” In addition, the indenture governing the notes permits us to incur additional indebtedness secured on a first-priority basis by such assets in the future. The first-priority liens in the collateral securing indebtedness under our ABL Facility and any such future indebtedness are higher in priority as to such collateral than the security interests securing the notes and the note guarantees on a second-priority basis. The notes and the related guarantees are secured, subject to permitted liens, by a second-priority lien in ABL Priority Collateral. Holders of the indebtedness under our ABL Facility and any other obligations collateralized by a first-priority lien in the ABL Priority Collateral will be entitled to receive proceeds from the realization of value of such collateral to repay such indebtedness and such other obligations in full before the holders of the notes will be entitled to any recovery from such collateral. As a result, holders of the notes will only be entitled to receive proceeds from the realization of value of the ABL Priority Collateral after all indebtedness under our ABL Facility and such other obligations secured by first-priority liens on such assets are repaid in full. Therefore, the notes are effectively junior in right of payment to indebtedness under our ABL Facility and any other obligations collateralized by a higher-priority lien in our assets, to the extent of the realizable value of such collateral. Accordingly, if there is a default, the value of that collateral may not be sufficient to repay the first lien creditors and the holders of the notes.
The rights of holders of the notes to the collateral in which they have a second-priority lien are materially limited by the ABL intercreditor agreement.
The rights of the holders of the notes with respect to the ABL Priority Collateral securing the notes on a second-priority basis are limited pursuant to the terms of an intercreditor agreement with the lenders under our ABL Facility.
Under the intercreditor agreement, any actions that may be taken in respect of that collateral (including the ability to commence enforcement proceedings against that collateral and to control the conduct of such proceedings, and to approve amendments to, and waivers of past defaults under, the collateral documents) will be at the direction of the lenders under our ABL Facility. Under those circumstances, the collateral agent on behalf of the holders of the notes, with limited exceptions, will not have the ability to control or direct such actions, even if the rights of the holders of the notes are adversely affected. Additionally, under the ABL intercreditor agreement, the rights of the holders of the notes to take actions with respect to the Note Priority Collateral, such as selling it, may be required to be exercised in such a way as they do not interfere with or impair the ability of the holders of the first-priority lien on the ABL Priority Collateral to realize upon the ABL Priority Collateral.
Under the terms of the collateral trust and intercreditor agreement, the holders of the notes may not control actions with respect to the Note Priority Collateral.
The rights of the holders with respect to the Note Priority Collateral are subject to the collateral trust and intercreditor agreement among all holders of indebtedness secured on a pari passu basis by the collateral, including the counterparties under the Hedge Agreements.
39
Under the collateral trust and intercreditor agreement, any actions that may be taken with respect to the collateral, including the ability to cause the commencement of enforcement proceedings against the collateral, will be at the direction of the holders of a majority of the indebtedness secured on a pari passu basis. Initially, the trustee for the notes (at the direction of the holders of a majority in principal amount of the notes) will have the right to direct any such actions. However, if we incur additional pari passu debt in the future, the holders of such debt may have the ability to direct any such actions, and the holders of the notes may not have the right to direct any such actions. In addition, in such circumstances, the trustee and the holders of the notes may have no right following the filing of a bankruptcy petition to object to any debtor-in-possession financing or the use of collateral to secure that financing if the holders of such pari passu debt have consented to it, subject to conditions and limited exceptions. After such a filing, the value of the collateral could materially deteriorate, and the holders of the notes would be unable to raise an objection.
There are circumstances other than repayment or discharge of the notes under which the collateral securing the notes and the note guarantees will be released automatically, without your consent or the consent of the trustee or the collateral agent, and you may not realize any payment upon disposition of such collateral.
Under various circumstances, collateral securing the notes will be released automatically, including:
| | • | | in whole or in part, as applicable, with respect to collateral that has been taken by eminent domain, condemnation or other similar circumstances; |
| | • | | in part, a sale, transfer or other disposal of such collateral in a transaction not prohibited under the indenture and the collateral documents; |
| | • | | in part, with respect to collateral held by a subsidiary guarantor, upon the release of the subsidiary guarantor from its guarantee in accordance with the indenture; |
| | • | | in whole, upon satisfaction and discharge of the indenture or upon a legal defeasance or a covenant defeasance as described under “Description of Notes;” |
| | • | | in whole or in part, as applicable, with the consent of holders holding 66 2/3% or more of the principal amount of the notes (including without limitation consents obtained in connection with a tender offer or exchange offer for, or purchase of, the notes) outstanding; and |
| | • | | in part, in accordance with the applicable provisions of the collateral documents and the intercreditor agreements. |
In addition, the note guarantee of a subsidiary guarantor will be automatically released in certain situations, including in connection with a sale of that subsidiary guarantor, if the transaction is in accordance with the indenture governing the notes and the obligations of the guarantor under our ABL Facility and any of our other indebtedness also terminate upon that transaction.
The indenture governing the notes also permits us to designate one or more of our restricted subsidiaries that is a guarantor of the notes as an unrestricted subsidiary. If we designate a subsidiary guarantor as an unrestricted subsidiary for purposes of the indenture, all of the liens on any collateral owned by that subsidiary or any of its subsidiaries and any guarantees of the notes by that subsidiary or any of its subsidiaries will be released under the indenture but not necessarily under our ABL Facility. Designation of an unrestricted subsidiary will reduce the aggregate value of the collateral securing the notes to the extent that liens on the assets of the unrestricted subsidiary and its subsidiaries are released. In addition, the creditors of the unrestricted subsidiary and its subsidiaries will have a senior claim on the assets of such unrestricted subsidiary and its subsidiaries. There will also be various releases in accordance with the provisions of the collateral trust and intercreditor agreement and ABL intercreditor agreement. See “Liquidity and Capital Resources—Description of Our Indebtedness—2020 Secured Notes.”
We will in most cases have control over the collateral, and the sale of particular assets by us could reduce the pool of assets securing the notes and the note guarantees.
The collateral documents allow us to remain in possession of, retain exclusive control over, freely operate, and collect, invest and dispose of any income from, the collateral securing the notes and the note guarantees. These rights may adversely affect the value of the collateral at any time. For example, so long as no default or event of default under the indenture governing the notes would result therefrom, we may, among other things, without any release or consent by the indenture trustee, conduct ordinary course activities with respect to the collateral, such as selling, abandoning or otherwise disposing of the collateral and making ordinary course cash payments (including repayments of indebtedness).
The collateral is subject to casualty risks and potential environmental liabilities.
We maintain insurance or otherwise insure against hazards in a manner appropriate and customary for our business. There are, however, certain losses that may be either uninsurable or not economically insurable, in whole or in part. Insurance proceeds may not compensate us fully for our losses. If there is a complete or partial loss of any of the pledged collateral, the insurance proceeds may not be sufficient to satisfy all of the secured obligations, including the notes and the note guarantees.
40
Moreover, the collateral agent may need to evaluate the impact of potential liabilities before determining to foreclose on collateral consisting of real property because secured creditors that hold a security interest in real property may be held liable under environmental laws for the costs of remediating or preventing the release or threatened release of hazardous substances at that real property. Consequently, the collateral agent may decline to foreclose on that collateral or exercise remedies available in respect thereof if it does not receive indemnification to its satisfaction from the holders of the notes.
Your rights in the collateral may be adversely affected by the failure to perfect security interests in certain collateral acquired in the future.
Applicable law requires that certain property and rights acquired after the grant of a general security interest can only be perfected at the time such property and rights are acquired and identified. The trustee and the collateral agent for the notes have no obligation to monitor, and we may fail to inform the trustee or the collateral agent of, the future acquisition of property and rights that constitute collateral, and the necessary action may not be taken to properly perfect the security interest in such after-acquired collateral. The collateral agent for the notes also has no obligation to monitor the perfection of any security interest in favor of the notes against third parties.
Rights of holders of the notes in the collateral may be adversely affected by the failure to create or perfect security interests in certain collateral on a timely basis, and a failure to create or perfect those security interests on a timely basis or at all may result in a default under the indenture and other agreements governing the notes.
The notes and the note guarantees are secured by first priority liens, subject to permitted liens, on Note Priority Collateral and second-priority liens, subject to permitted liens, in the ABL Priority Collateral.
If we or any subsidiary guarantor were to become subject to a bankruptcy proceeding, any liens recorded or perfected after the issue date of the notes would face a greater risk of being invalidated than if they had been recorded or perfected on the issue date. Liens recorded or perfected after the issue date may be treated under bankruptcy law as if they were delivered to secure previously existing indebtedness. In bankruptcy proceedings commenced within 90 days of lien perfection, a lien given to secure previously existing debt is materially more likely to be avoided as a preference by the bankruptcy court than if delivered and promptly recorded on the issue date. Accordingly, if we or a subsidiary guarantor were to file for bankruptcy protection and the liens had been perfected less than 90 days before commencement of such bankruptcy proceeding, the liens securing the notes may be especially subject to challenge as a result of having been perfected after the issue date. To the extent that this challenge succeeded, you would lose the benefit of the security that the collateral was intended to provide.
In addition, a failure, for any reason that is not permitted or contemplated under the security agreement and related documents, to perfect the security interest in the properties included in the collateral package may result in a default under the indenture and other agreements governing the notes.
In the event of our bankruptcy, the ability of the holders of the notes to realize upon the collateral will be subject to certain bankruptcy law limitations.
The ability of holders of the notes to realize upon the collateral will be subject to certain bankruptcy law limitations in the event of our bankruptcy. Under applicable federal bankruptcy laws, upon the commencement of a bankruptcy case, an automatic stay goes into effect, which, among other things, stays:
| | • | | the commencement or continuation of any action or proceeding against the debtor that was or could have been commenced before the commencement of the bankruptcy case to recover a claim against the debtor that arose before the commencement of the bankruptcy case; |
| | • | | any act to obtain possession of, or control over, property of the bankruptcy estate or the debtor; |
| | • | | any act to create, perfect or enforce any lien against property of the bankruptcy estate; and |
| | • | | any act to collect or recover a claim against the debtor that arose before the commencement of the bankruptcy case. |
Thus, upon the commencement of a bankruptcy case, secured creditors are prohibited from repossessing their collateral from a debtor, or from disposing of that collateral repossessed from such a debtor, without bankruptcy court approval. Moreover, applicable federal bankruptcy laws generally permit the debtor to continue to use, sell or lease collateral in the ordinary course of its business even though the debtor is in default under the applicable debt instruments. Upon request from a secured creditor, the bankruptcy court will prohibit or condition the use, sale or lease of collateral as is necessary to provide “adequate protection” of the secured creditor’s interest in the collateral. The meaning of the term “adequate protection” may vary according to the circumstances but is intended generally to protect the value of the secured creditor’s interest in the collateral at the commencement of the bankruptcy case and may include cash payments or the granting of additional security, if and at such times as the court in its discretion determines any diminution in the value of the collateral occurs as a result of the debtor’s use, sale or lease of the collateral during the pendency of the bankruptcy case. In view of the lack of a precise definition of the term “adequate protection” and the broad discretionary powers of a
41
U.S. bankruptcy court, we cannot predict whether payments under the notes would be made following commencement of and during a bankruptcy case, whether or when the trustee or collateral agent under the indenture governing the notes could foreclose upon or sell the collateral or whether or to what extent holders of notes would be compensated for any delay in payment or loss of value as a result of the use, sale or lease of their collateral through the requirement of “adequate protection.” A creditor may seek relief from the stay from the bankruptcy court to take any of the acts described above that would otherwise be prohibited by the automatic stay. The U.S. bankruptcy court has broad discretionary powers in determining whether to grant a creditor relief from the stay.
In the event of a bankruptcy of us or any of the subsidiary guarantors, holders of the notes may be deemed to have an unsecured claim to the extent that our obligations in respect of the notes exceed the value of the collateral available to secure the notes.
In any bankruptcy proceeding with respect to the issuers or any of the subsidiary guarantors, it is possible that the bankruptcy trustee, the debtor-in-possession or competing creditors will assert that the value of the collateral with respect to the notes is less than the then-current principal amount outstanding under the notes on the date of the bankruptcy filing. Upon a finding by the bankruptcy court that the notes are under-collateralized, the claims in the bankruptcy proceeding with respect to the notes would be bifurcated between a secured claim up to the value of the collateral and an unsecured claim for any deficiency. As a result, the claim of the holders of the notes could be unsecured in whole or in part.
Other consequences of a finding of under-collateralization would be, among other things, a lack of entitlement on the part of the notes to receive post-petition interest and a lack of entitlement to receive other “adequate protection” under federal bankruptcy laws with respect to the unsecured portion of the notes. In addition, if any payments of post-petition interest had been made at the time of such a finding of under-collateralization, those payments could be recharacterized by the bankruptcy court as a reduction of the principal amount of the notes.
Any future pledge of collateral in favor of the holders of the notes might be voidable in bankruptcy.
Any future pledge of collateral in favor of the holders of the notes, including pursuant to security documents delivered after the date of the indenture governing the notes, might be voidable by the pledgor (as debtor-in-possession) or by its trustee in bankruptcy if certain events or circumstances exist or occur, including, under the U.S. bankruptcy code, if the pledgor is insolvent at the time of the pledge, the pledge permits the holders of the notes to receive a greater recovery than what the holders of the notes would receive in a liquidation under Chapter 7 of the U.S. bankruptcy code if the pledge had not been given and a bankruptcy proceeding in respect of the pledgor is commenced within 90 days following the pledge, or, in certain circumstances, a longer period.
The value of the collateral securing the notes may not be sufficient to secure post-petition interest.
In the event of a bankruptcy, liquidation, dissolution, reorganization or similar proceeding against us, holders of the notes will only be entitled to post-petition interest under the U.S. bankruptcy code to the extent that the value of their security interest in the collateral is greater than their pre-bankruptcy claim. Holders of the notes that have a security interest in the collateral with a value equal to or less than their pre-bankruptcy claim will not be entitled to post-petition interest under the U.S. bankruptcy code. The value of the holders’ interest in the collateral may not equal or exceed the principal amount of the notes. See “—There may not be sufficient collateral to pay all or any of the notes” above.
Our variable rate indebtedness subjects us to interest rate risk, which could cause our debt service obligations to increase significantly.
We are subject to interest rate risk in connection with borrowings under the ABL Facility, which bears interest at variable rates. Interest rate changes will not affect the market value of any debt incurred under such facility, but could impact the amount of our interest payments, and accordingly, our future earnings and cash flows, assuming other factors are held constant. We currently do not have any interest rate hedging arrangements with respect to the ABL Facility. In the future, we may enter into interest rate swaps that involve the exchange of floating for fixed rate interest payments in order to reduce interest rate volatility. However, we may not maintain interest rate swaps with respect to all of our variable rate indebtedness, and any swaps we enter into may not fully mitigate our interest rate risk.
The collateral securing the notes may be diluted under certain circumstances.
The collateral that secures the notes also secures our obligations under the Hedge Agreements and the ABL Facility (including certain hedging obligations and cash management obligations incurred with lenders under the ABL Facility and their affiliates). The collateral may also secure additional senior indebtedness, including additional secured notes, that we incur in the future, subject to restrictions on our ability to incur debts and liens under the Hedge Agreements, ABL Facility and the indenture governing the notes. Your rights to the collateral would be diluted by any increase in the indebtedness secured by the collateral on a pari passu or priority basis.
42
The waiver in the ABL intercreditor agreement of rights of marshaling may adversely affect the recovery rates of holders of the notes in a bankruptcy or other insolvency proceeding or foreclosure scenario.
The notes and the note guarantees are secured on a second-priority lien basis by the ABL Priority Collateral. The ABL intercreditor agreement provides that, at any time holders of the notes hold a lien on the collateral where a higher priority lien on such collateral exists, the trustee under the indenture governing the notes and the notes collateral agent may not assert or enforce any right of marshaling accorded to a junior lienholder, as against the holder of such indebtedness secured by higher priority liens in the collateral. Without this waiver of the right of marshaling, holders of such indebtedness secured by higher priority liens in the collateral may be required to liquidate collateral on which the notes did not have a lien, if any, prior to liquidating the collateral on which the notes have a lien, thereby maximizing the proceeds of the collateral that would be available to repay obligations under the notes. As a result of this waiver, the proceeds of sales of the collateral could be applied to repay any indebtedness secured by higher priority liens in the collateral before applying proceeds of other collateral securing such indebtedness, and the holders of the notes may recover less than they would have if such proceeds were applied in the order most favorable to the holders of the notes.
The notes will be structurally subordinated to all obligations of our future subsidiaries that do not become guarantors of the notes.
The notes are guaranteed by each of our material wholly owned domestic subsidiaries and each of our existing and subsequently acquired or organized subsidiaries that are borrowers under or that guarantee the ABL Facility or that, in the future, guarantee our indebtedness or indebtedness of another subsidiary guarantor. All of our current wholly owned subsidiaries guarantee the notes, except for the co-issuer. Except for such subsidiary guarantors of the notes, our subsidiaries have no obligation, contingent or otherwise, to pay amounts due under the notes or to make any funds available to pay those amounts, whether by dividend, distribution, loan or other payment. Further, even if the subsidiary is a guarantor, it may not be able to, or may not be permitted to, make distributions to enable us to make payments in respect of our indebtedness, including the notes. Each subsidiary is a distinct legal entity and, under such circumstances, legal and contractual restrictions may limit our ability to obtain cash from them. Although the indenture governing the notes and the agreements that govern certain of our other indebtedness limit the ability of certain subsidiaries to incur consensual restrictions on their ability to pay dividends or make other intercompany payments to us, these limitations are subject to certain qualifications and exceptions. In the event that we do not receive distributions from our subsidiaries, we may be unable to make the required principal and interest payments on our indebtedness, including the notes. The notes are structurally subordinated to all indebtedness and other obligations of any non-guarantor subsidiary such that, in the event of insolvency, liquidation, reorganization, dissolution or other winding up of any subsidiary that is not a guarantor, all of such subsidiary’s creditors (including trade creditors and preferred equity interest holders, if any) would be entitled to payment in full out of such subsidiary’s assets before we would be entitled to any payment.
In addition, the indenture governing the notes permits subsidiaries to incur additional indebtedness subject to some limitations and does not contain any limitation on the amount of other liabilities, such as trade payables, that may be incurred by these subsidiaries.
In addition, our subsidiaries that provide, or will provide, guarantees of the notes will be automatically released from those guarantees upon the occurrence of certain events, including the following:
| | • | | the designation of that subsidiary guarantor as an unrestricted subsidiary; |
| | • | | the release or discharge of any guarantee or indebtedness that resulted in the creation of the guarantee of the notes by such subsidiary guarantor; or |
| | • | | the sale or other disposition, including the sale of substantially all the assets, of that subsidiary guarantor. |
If any subsidiary guarantee is released, holders of the notes will not have a claim as a creditor against that subsidiary and the indebtedness and other liabilities, including trade payables and preferred stock, if any, whether secured or unsecured, of that subsidiary will be effectively senior to the claim of any holders of the notes. See “Liquidity and Capital Resources—Description of Our Indebtedness—2020 Secured Notes.”
We may not be able to repurchase the notes upon a change of control.
If a change of control (as defined in the indenture governing the notes) occurs in the future, we will be required to make an offer to repurchase all the outstanding notes at a premium, plus any accrued and unpaid interest to the date of repurchase. In such a situation, we may not have enough funds to pay for all of the notes that are tendered under any such offer. In addition, our ABL Facility will restrict us from repurchasing the notes upon a change of control or otherwise. The source of funds for any repurchase of the notes and repayment of borrowings under our ABL Facility will be our available cash or cash generated from our subsidiaries’ operations or other sources, including borrowings, sales of assets or sales of equity. We may not be able to repurchase the notes upon a change of control because we may not have sufficient financial resources to repurchase all of the notes that are tendered upon a change of control and repay our other indebtedness that will become due. We may require additional financing from third parties to fund any such repurchases, and we cannot assure you that we would be able to obtain financing on satisfactory terms or at all. Further, our ability to repurchase the notes may be limited by law. In order to avoid the obligations to repurchase the notes and events of default
43
and potential breaches of the credit agreement governing our ABL Facility, we may have to avoid certain change of control transactions that would otherwise be beneficial to us. A change of control may also result in an event of default under our ABL Facility and agreements governing any future indebtedness and may result in the acceleration of such indebtedness.
In addition, certain important corporate events, such as leveraged recapitalizations, may not, under the indenture governing the notes, constitute a “change of control” that would require us to repurchase the notes, notwithstanding the fact that such corporate events could increase the level of our indebtedness or otherwise adversely affect our capital structure, credit ratings or the value of the notes. See “Liquidity and Capital Resources—Description of Our Indebtedness—2020 Secured Notes.”
In addition, in a recent decision, the Chancery Court of Delaware raised the possibility that a change of control put right occurring as a result of a failure to have “continuing directors” comprising a majority of a board of directors might be unenforceable on public policy grounds.
Holders of the notes may not be able to determine when a change of control giving rise to their right to have the notes repurchased has occurred following a sale of “substantially all” of our assets.
The definition of change of control in the indenture governing the notes includes a phrase relating to the sale of “all or substantially all” of our assets. There is no precise established definition of the phrase “substantially all” under applicable law. Accordingly, the ability of a holder of notes to require us to repurchase its notes as a result of a sale of less than all our assets to another person may be uncertain.
Federal and state fraudulent transfer laws may permit a court to void the notes and the note guarantees and/or the grant of collateral under certain circumstances, and, if that occurs, you may not receive any payments on the notes.
Federal and state fraudulent transfer and conveyance statutes may apply to the issuance of the notes and the incurrence of the guarantees of such notes. Under federal bankruptcy law and comparable provisions of state fraudulent transfer or conveyance laws, which may vary from state to state, the notes or the guarantees thereof (or the grant of collateral securing any such obligations) could be voided as a fraudulent transfer or conveyance if the issuers or any of the subsidiary guarantors, as applicable, (a) issued the notes or incurred the note guarantees with the intent of hindering, delaying or defrauding creditors, or (b) received less than reasonably equivalent value or fair consideration in return for either issuing the notes or incurring the note guarantees and, in the case of (b) only, one of the following is also true at the time thereof:
| | • | | the issuers or any of the subsidiary guarantors, as applicable, were insolvent or rendered insolvent by reason of the issuance of the notes or the incurrence of the guarantees; |
| | • | | the issuance of the notes or the incurrence of the note guarantees left us or any of the subsidiary guarantors, as applicable, with an unreasonably small amount of capital or assets to carry on the business; |
| | • | | the issuers or any of the subsidiary guarantors intended to, or believed that the issuers or such subsidiary guarantor would, incur debts beyond our or such subsidiary guarantor’s ability to pay as they mature; or |
| | • | | the issuers or any of the subsidiary guarantors were a defendant in an action for money damages, or had a judgment for money damages docketed against us or the subsidiary guarantor if, in either case, the judgment is unsatisfied after final judgment. |
As a general matter, value is given for a transfer or an obligation if, in exchange for the transfer or obligation, property is transferred or a valid antecedent debt is secured or satisfied. A court would likely find that a subsidiary guarantor did not receive reasonably equivalent value or fair consideration for its note guarantee, to the extent the subsidiary guarantor did not obtain a reasonably equivalent benefit directly or indirectly from the issuance of the notes.
We cannot be certain as to the standards a court would use to determine whether or not we or the subsidiary guarantors were insolvent at the relevant time or, regardless of the standard that a court uses, whether the notes or the note guarantees would be subordinated to our or any of our subsidiary guarantors’ other debt. In general, however, a court would deem an entity insolvent if:
| | • | | the sum of its debts, including contingent and unliquidated liabilities, was greater than the fair saleable value of all of its assets; |
| | • | | the present fair saleable value of its assets was less than the amount that would be required to pay its probable liability on its existing debts, including contingent liabilities, as they become absolute and mature; or |
| | • | | it could not pay its debts as they became due. |
If a court were to find that the issuance of the notes, the incurrence of a note guarantee or the grant of security was a fraudulent transfer or conveyance, the court could void the payment obligations under the notes or that note guarantee or void the grant of collateral or subordinate the notes or that note guarantee to presently existing and future indebtedness of ours or of the related subsidiary guarantor, or require the holders of the notes to repay any amounts received with respect to that note guarantee. In the event
44
of a finding that a fraudulent transfer or conveyance occurred, you may not receive any repayment on the notes. Further, the voidance of the notes could result in an event of default with respect to our and our subsidiaries’ other debt that could result in acceleration of that debt.
Finally, as a court of equity, the bankruptcy court may subordinate the claims in respect of the notes to other claims against us under the principle of equitable subordination, if the court determines that: (a) the holder of notes engaged in some type of inequitable conduct; (b) that inequitable conduct resulted in injury to our other creditors or conferred an unfair advantage upon the holders of notes; and (c) equitable subordination is not inconsistent with the provisions of the U.S. bankruptcy code.
A lowering or withdrawal of the ratings assigned to our debt securities by rating agencies may increase our future borrowing costs and reduce our access to capital.
Our debt currently has a non-investment grade rating, and any rating assigned could be lowered or withdrawn entirely by a rating agency if, in that rating agency’s judgment, future circumstances relating to the basis of the rating, such as adverse changes, so warrant. Consequently, real or anticipated changes in our credit ratings will generally affect the market value of the notes. Credit ratings are not recommendations to purchase, hold or sell the notes. Additionally, credit ratings may not reflect the potential effect of risks relating to the structure or marketing of the notes. Any downgrade by a rating agency could decrease earnings and result in higher borrowing costs. Any future lowering of our rating likely would make it more difficult or more expensive for us to obtain additional debt financing. If any credit rating initially assigned to the notes is subsequently lowered or withdrawn for any reason, you may not be able to resell your notes without a substantial discount.
We are controlled by ACON Refining and TPG Refining, and their interests as equity holders may conflict with your interests as a holder of the notes.
ACON Refining and TPG Refining indirectly beneficially own a substantial majority of our parent’s equity. ACON Refining and TPG Refining have significant influence over our operations and have representatives on our board of directors. The interests of our equity holders may not in all cases be aligned with your interests as a holder of the notes. For example, if we encounter financial difficulties or are unable to pay our debts as they mature, the interests of our equity holders might conflict with your interests as a noteholder. In that situation, for example, the holders of the notes might want us to raise additional equity from our equity holders or other investors to reduce our leverage and pay our debts, while our equity holders might not want to increase their investment in us or have their ownership diluted and instead choose to take other actions, such as selling our assets. In addition, our equity holders may have an interest in pursuing acquisitions, divestitures, financings or other transactions that, in their judgment, could enhance their equity investments including acquiring businesses that compete directly or indirectly with us.
45
| Item 1B. | Unresolved Staff Comments. |
None
| Item 3. | Legal Proceedings. |
We are not currently a party to any legal proceedings that, if determined adversely against us, individually or in the aggregate, would have a material adverse effect on our financial position, results of operations or cash flows. Marathon, however, is a named defendant in certain lawsuits, investigations and claims arising in the ordinary course of conducting the business relating to the assets we acquired from Marathon, including certain environmental claims and employee-related matters. For a discussion of certain environmental settlements and consent decrees relating to the assets we acquired from Marathon, see “Item 1. Business—Environmental Regulations.” While the outcome of these lawsuits, investigations and claims against Marathon cannot be predicted with certainty, we do not expect these matters to have a material adverse impact on our business, results of operations, cash flows or financial condition. We have not assumed any liabilities arising out of these lawsuits, investigations and claims against Marathon. Marathon also has indemnification obligations to us pursuant to the agreements entered into in connection with the Marathon Acquisition. Marathon’s indemnification obligation resulting from any breach of representations and warranties generally are limited by an indemnification deductible of $25 million and an indemnification ceiling of $100 million and are guaranteed by Marathon Petroleum. In addition, from time to time, we are involved in lawsuits, investigations and claims arising out of our operations in the ordinary course of business.
| Item 4. | Mine Safety Disclosures |
Not applicable.
PART II
| Item 5. | Market for Registrant’s Common Equity and Related Unitholder Matters. |
Our membership interest is held 99.99% by Northern Tier Energy LP (“NTE LP”) and 0.01% by Northern Tier Energy Holdings LLC.
46
| Item 6. | Selected Financial Data. |
Set forth below is our summary historical consolidated financial data for the years ended December 31, 2012 and 2011 and for the period from June 23, 2010 (inception date) through December 31, 2010. Also set forth below is summary historical combined financial data for the eleven months ended November 30, 2010 and the years ended December 31, 2009 and 2008, which data represents a carve-out financial statement presentation of several operating units of Marathon, which we refer to as Predecessor. This information may not be indicative of our future results of operations, financial position and cash flows and should be read in conjunction with the consolidated financial statements and notes thereto and “Item 7. Management’s Discussion and Analysis of Financial Condition and Results of Operations” presented elsewhere in this Annual Report on Form 10-K. We believe that the assumptions underlying the preparation of our historical consolidated financial statements are reasonable.
| | | | | | | | | | | | | | | | | | | | | | | | | | |
| | | Successor | | | | | Predecessor | |
| | | Year Ended
December 31, | | | June 23, 2010
(inception date)
to December 31,
2010 | | | | | Eleven Months
Ended
November 30,
2010 | | | Year Ended
December 31, | |
| | | 2012 | | | 2011 | | | | | | | 2009 | | | 2008 | |
Consolidated and combined statements of operations data(in millions): | | | | | | | | | | | | | | | | | | | | | | | | | | |
Revenue | | $ | 4,653.9 | | | $ | 4,280.8 | | | $ | 344.9 | | | | | $ | 3,195.2 | | | $ | 2,940.5 | | | $ | 4,122.4 | |
Costs, expenses and other: | | | | | | | | | | | | | | | | | | | | | | | | | | |
Cost of sales | | | 3,584.9 | | | | 3,512.4 | | | | 307.5 | | | | | | 2,697.9 | | | | 2,507.9 | | | | 3,659.0 | |
Direct operating expenses | | | 254.1 | | | | 257.9 | | | | 21.4 | | | | | | 227.0 | | | | 238.3 | | | | 252.7 | |
Turnaround and related expenses | | | 26.1 | | | | 22.6 | | | | — | | | | | | 9.5 | | | | 0.6 | | | | 3.7 | |
Depreciation and amortization | | | 33.2 | | | | 29.5 | | | | 2.2 | | | | | | 37.3 | | | | 40.2 | | | | 39.2 | |
Selling, general and administrative | | | 88.3 | | | | 88.7 | | | | 6.4 | | | | | | 59.6 | | | | 64.7 | | | | 67.7 | |
Formation costs | | | — | | | | 7.4 | | | | 3.6 | | | | | | — | | | | — | | | | — | |
Contingent consideration loss (income) | | | 104.3 | | | | (55.8 | ) | | | — | | | | | | — | | | | — | | | | — | |
Other (income) expense, net | | | (9.4 | ) | | | (4.5 | ) | | | 0.1 | | | | | | (5.4 | ) | | | (1.1 | ) | | | 1.2 | |
| | | | | | | | | | | | | | | | | | | | | | | | | | |
Operating income | | | 572.4 | | | | 422.6 | | | | 3.7 | | | | | | 169.3 | | | | 89.9 | | | | 98.9 | |
Realized losses from derivative activities | | | (339.4 | ) | | | (310.3 | ) | | | — | | | | | | — | | | | — | | | | — | |
Unrealized (losses) gains from derivative activities | | | 68.0 | | | | (41.9 | ) | | | (27.1 | ) | | | | | (40.9 | ) | | | — | | | | — | |
Bargain purchase gain | | | — | | | | — | | | | 51.4 | | | | | | — | | | | — | | | | — | |
Interest expense, net | | | (42.2 | ) | | | (42.1 | ) | | | (3.2 | ) | | | | | (0.3 | ) | | | (0.4 | ) | | | (0.5 | ) |
Loss on early extinguishment of debt | | | (50.0 | ) | | | — | | | | — | | | | | | — | | | | — | | | | — | |
| | | | | | | | | | | | | | | | | | | | | | | | | | |
Income before income taxes | | | 208.8 | | | | 28.3 | | | | 24.8 | | | | | | 128.1 | | | | 89.5 | | | | 98.4 | |
Income tax provision | | | (9.8 | ) | | | — | | | | — | | | | | | (67.1 | ) | | | (34.8 | ) | | | (39.8 | ) |
| | | | | | | | | | | | | | | | | | | | | | | | | | |
Net income | | $ | 199.0 | | | $ | 28.3 | | | $ | 24.8 | | | | | $ | 61.0 | | | $ | 54.7 | | | $ | 58.6 | |
| | | | | | | | | | | | | | | | | | | | | | | | | | |
47
| | | | | | | | | | | | | | | | | | | | | | | | | | |
| | | Successor | | | | | Predecessor | |
| | | Year Ended
December 31, | | | June 23, 2010
(inception date)
to December 31,
2010 | | | | | Eleven Months
Ended
November 30,
2010 | | | Year Ended
December 31, | |
| | | 2012 | | | 2011 | | | | | | 2009 | | | 2008 | |
Consolidated and combined statements of cash flow data(in millions): | | | | | | | | | | | | | | | | | | | | | | | | | | |
Cash provided by (used in): | | | | | | | | | | | | | | | | | | | | | | | | | | |
Operating activities | | $ | 308.5 | | | $ | 209.3 | | | $ | — | | | | | $ | 145.4 | | | $ | 129.4 | | | $ | 47.1 | |
Investing activities | | | (28.7 | ) | | | (156.3 | ) | | | (363.3 | ) | | | | | (29.3 | ) | | | (25.0 | ) | | | (84.6 | ) |
Financing activities | | | (130.4 | ) | | | (2.3 | ) | | | 436.1 | | | | | | (115.4 | ) | | | (103.9 | ) | | | 34.5 | |
Capital expenditures | | | (30.9 | ) | | | (45.9 | ) | | | (2.5 | ) | | | | | (29.8 | ) | | | (29.0 | ) | | | (45.0 | ) |
| | | | | | | | | | | | | | | | | | | | | | | | | | |
| | | Successor | | | | | Predecessor | |
| | | December 31, | | | | | November 30,
2010 | | | December 31, | |
| | | 2012 | | | 2011 | | | 2010 | | | | | | 2009 | | | 2008 | |
Consolidated and combined balance sheet data(in millions): | | | | | | | | | | | | | | | | | | | | | | | | | | |
Cash and cash equivalents | | $ | 272.9 | | | $ | 123.5 | | | $ | 72.8 | | | | | $ | 6.7 | | | $ | 6.0 | | | $ | 5.5 | |
Total assets | | | 1,136.8 | | | | 998.8 | | | | 930.6 | | | | | | 717.8 | | | | 710.1 | | | | 708.2 | |
Total long-term debt | | | 282.5 | | | | 301.9 | | | | 314.5 | | | | | | — | | | | — | | | | — | |
Total liabilities | | | 653.0 | | | | 686.6 | | | | 645.6 | | | | | | 405.4 | | | | 343.9 | | | | 292.7 | |
Total equity | | | 483.8 | | | | 312.2 | | | | 285.0 | | | | | | 312.4 | | | | 366.2 | | | | 415.5 | |
48
| Item 7. | Management’s Discussion and Analysis of Financial Condition and Results of Operations. |
The following discussion and analysis of our financial condition and results of operations should be read in conjunction with our financial statements and related notes included elsewhere in this Annual Report on Form 10-K. The following discussion contains “forward-looking statements” that reflect our future plans, estimates, beliefs and expected performance. Our actual results may differ materially from those currently anticipated and expressed in such forward-looking statements as a result of a number of factors, including those we discuss under “Item 1A. Risk Factors” elsewhere in this report. We caution that assumptions, expectations, projections, intentions or beliefs about future events may, and often do, vary from actual results and the differences can be material. See “Cautionary Note Regarding Forward-Looking Statements.”
Overview
We are an independent downstream energy company with refining, retail and pipeline operations that serves the PADD II region of the United States. We are an indirect wholly-owned subsidiary of NTE LP. We operate our assets in two business segments: the refining business and the retail business. For the year ended December 31, 2012, we had total revenues of $4.7 billion, operating income of $572.4 million, net income of $199.0 million and Adjusted EBITDA of $739.7 million. For the year ended December 31, 2011, we had total revenues of $4.3 billion, operating income of $422.6 million, net income of $28.3 million and Adjusted EBITDA of $430.7 million. A definition and reconciliation of Adjusted EBITDA to net income is included herein under the caption “Adjusted EBITDA.”
Refining Business
Our refining business primarily consists of an 81,500 bpd (84,500 barrels per stream day) refinery located in St. Paul Park, Minnesota. Our refinery has a complexity index of 11.5, which refers to the number, type and capacity of processing units at the refinery. We are one of only two refineries in Minnesota and one of four refineries in the Upper Great Plains area within the PADD II region. Our refinery’s complexity allows us to process a variety of light, heavy, sweet and sour crudes, many of which have historically priced at a discount to the NYMEX WTI price benchmark, meaning we can process lower cost crude oils into higher value refined products. The PADD II region covers Illinois, Indiana, Iowa, Kansas, Kentucky, Michigan, Minnesota, Missouri, Nebraska, North Dakota, South Dakota, Ohio, Oklahoma, Tennessee and Wisconsin. Our strategic location allows us direct access, primarily via the Minnesota Pipeline, to sources of crude oil from Western Canada and North Dakota, as well as the ability to distribute our refined products throughout the midwestern United States. Our refinery produces a broad slate of refined products including gasoline, diesel, jet fuel and asphalt, which are then marketed to resellers and consumers primarily in the PADD II region. Approximately 80% and 79% of our total refinery production for the year ended December 31, 2012 and the year ended December 31, 2011, respectively, was comprised of higher value, light refined products, including gasoline and distillates. Our refinery utilization rates, using standard industry methodologies for utilization measurement, have been 80%, 75% and 72% for the years ended December 31, 2012 and 2011 and for the period from December 1, 2010 to December 31, 2010, respectively.
We also own various storage and transportation assets, including a light products terminal, a heavy products terminal, storage tanks, rail loading/unloading facilities and a Mississippi river dock. Approximately 78% and 83% of our gasoline and diesel volumes for the years ended December 31, 2012 and 2011, respectively, were sold via our light products terminal located at the refinery to our company-operated and franchised SuperAmerica branded convenience stores, Marathon branded convenience stores and other resellers. We have a contract with Marathon to supply substantially all of the gasoline and diesel requirements for the independently owned and operated Marathon branded convenience stores in our marketing area.
Our refining business also includes our 17% interest in the Minnesota Pipe Line Company and MPL Investments, which owns and operates the Minnesota Pipeline, a 455,000 bpd crude oil pipeline system that transports crude oil (primarily from Western Canada and North Dakota) for approximately 300 miles from the Enbridge pipeline hub at Clearbrook, Minnesota to our refinery. The Minnesota Pipeline has historically transported the majority of the crude oil used and processed in our refinery.
49
Retail Business
As of December 31, 2012, our retail business operated 166 convenience stores under the SuperAmerica brand and also supported 70 franchised convenience stores, which are also operated under the SuperAmerica brand. These convenience stores are located primarily in Minnesota and Wisconsin and sell various grades of gasoline and diesel, tobacco products and immediately consumable items such as beverages, prepared food and a large variety of snacks and prepackaged items. Our refinery supplied substantially all of the gasoline and diesel sold in our company-operated and franchised convenience stores for the years ended December 31, 2012 and 2011.
We also own and operate SuperMom’s Bakery, which prepares and distributes baked goods and other prepared food items for sale in our company-operated and franchised convenience stores and other third party locations.
Outlook
Transportation fuels demand in the Upper Great Plains of the PADD II region currently exceeds supply from local refineries. Therefore, demand is fulfilled by products that are imported into the region mostly via pipeline from other parts of the Midwest, the Rocky Mountains and the U.S. Gulf Coast. Overall refined product demand declined in 2008 as a result of prevailing economic conditions and began to improve in the first quarter of 2010. While there continues to be a significant global macroeconomic risk that may affect the pace of growth in the United States, we have experienced continued strong overall product demand in our geographic area of operations.
Our operating performance has benefited from the widening of the price relationship between the traditional crude oil pricing benchmark, NYMEX WTI, and the international waterborne crude oil pricing benchmark, Brent. We purchase crude oil which is priced based off NYMEX WTI. Refined products prices are set by global markets and are typically priced off Brent. Therefore, we have enjoyed a benefit during the years ended December 31, 2012 and 2011 from the overall widening of the price differential between our cost of crude oil and the price of the products we sell. The widening differential may have been attributable to several factors, including geopolitical events in the Middle East, the suspension of crude oil exports from Libya, new U.N. sanctions on Iran’s oil exports, and limited pipeline and other infrastructure to transport crude oil from Cushing, Oklahoma, where NYMEX WTI is settled, to alternative markets. Please see “Item 1A. Risk Factors—Risks Primarily Related to Our Refining Business—Our results of operations are affected by crude oil differentials, which may fluctuate substantially.”
Comparability of Historical Results
Marathon Acquisition and Related Transactions
We commenced operations in December 2010 through the acquisition of our St. Paul Park, Minnesota refinery, a 17% interest in the Minnesota Pipe Line Company (“MPL”) and in MPL Investments, our convenience stores and related assets (the “Marathon Assets”) from Marathon for $554 million (the “Marathon Acquisition”), which included cash and the issuance to Marathon of $80 million of a non-controlling preferred membership interest in Northern Tier Holdings LLC.
Prior to the Marathon Acquisition, the business was operated as several operating units of Marathon, and participated in Marathon’s centralized cash management programs. All cash receipts were remitted to and all cash disbursements were funded by Marathon. Following the Marathon Acquisition, we operate as a standalone company, and our results of operations may not be comparable to the historical results of operations for the periods presented, primarily for the reasons described below:
| | • | | In connection with the Marathon Acquisition, we entered into a contingent consideration and margin support arrangements with Marathon under which we could have received margin support payments of up to $60 million from MPC or could have paid MPC net earn-out payments of up to $125 million over the term of the arrangements, depending on our Adjusted EBITDA as defined in the arrangements. On May 4, 2012, we entered into a settlement agreement with Marathon under which Marathon received $40 million of the net proceeds from NTE LP’s initial public offering, and Northern Tier Holdings LLC redeemed Marathon’s existing preferred interest with a portion of the net proceeds from NTE LP’s initial public offering which were contributed to us by NTE LP and issued Marathon a new $45 million preferred interest in Northern Tier Holdings LLC in consideration for relinquishing all claims with respect to earn-out payments under the contingent consideration agreement. We also agreed, pursuant to the settlement agreement, to relinquish all claims to margin support payments under the contingent consideration agreement. |
| | • | | In connection with the Marathon Acquisition, certain additional transactions were consummated, and we entered into certain agreements with respect to our operations, including the following: |
| | • | | 2017 Secured Notes. We issued $290 million of the 10.5% senior secured notes due December 1, 2017 (“2017 Secured Notes”). The net proceeds from the sale of the 2017 Secured Notes were used to fund part of the Marathon Acquisition. On November 14, 2012, we completed a tender offer for the 2017 Secured Notes. See “2020 Secured Notes Offering and Tender Offer.” |
50
| | • | | Asset-Based Revolving Credit Facility. We entered into a $300 million senior secured asset-based revolving credit facility, which is subject to a borrowing base. We did not draw on the revolving credit facility to fund the Marathon Acquisition, other than to the extent utilized through the issuance of letters of credit. The revolving credit facility, as subsequently amended, is available through July 17, 2017. See “Liquidity and Capital Resources—Description of Our Indebtedness—Senior Secured Asset-Based Revolving Credit Facility.” |
| | • | | Sale Leaseback Arrangement. Marathon sold certain real property interests, including the land underlying 135 of the SuperAmerica convenience stores associated with our retail business and SuperMom’s Bakery, to Realty Income, a third party equity real estate investment trust. In connection with the closing of the Marathon Acquisition, Realty Income leased those properties to us on a long-term basis. |
| | • | | Crude Oil Inventory Purchase Agreement. JPM CCC purchased substantially all of the crude oil inventory associated with operations of the refinery directly from Marathon pursuant to an inventory purchase agreement with Marathon. |
| | • | | Crude Oil Supply and Logistics Agreement. In December 2010, we entered into a crude oil supply and logistics agreement with JPM CCC, which agreement was amended and restated in March 2012. JPM CCC assists us in the purchase of most of the crude oil requirements of our refinery and provides transportation and other logistical services for delivery of the crude oil to our storage tanks at Cottage Grove, Minnesota, which are approximately two miles from our refinery. We pay the price of the crude oil plus certain agreed fees and expenses. We believe this crude oil supply and logistics agreement significantly reduces our need to maintain crude oil inventories and allows us to take title to and price our crude oil at the refinery, as opposed to the crude oil origination point, reducing the time we are exposed to market fluctuations before the finished product output is sold. For more information, see “Item 1. Business—Crude Oil Supply.” |
| | • | | Transition Services Agreement. Marathon agreed to provide us with administrative and support services pursuant to a transition services agreement, including finance and accounting, human resources and information systems services, as well as support services in connection with our transition from being a part of Marathon’s systems and infrastructure to having our own systems and infrastructure. Marathon is no longer providing any transition services under the agreement. |
| | • | | The Marathon Acquisition has been accounted for under the purchase method of accounting for business combinations which requires that the assets acquired and liabilities assumed be adjusted to their estimated fair value at the date of the acquisition. This treatment changed the accounting basis for the assets acquired and liabilities assumed from Marathon as of December 1, 2010. |
| | • | | In October 2010, at our request, Marathon initiated a crack spread derivative strategy to mitigate refining margin risk on a portion of the business’s 2011 and 2012 projected refinery production. In connection with the Marathon Acquisition, we assumed all corresponding rights and obligations for derivative instruments executed pursuant to this strategy. We incurred $339.4 million and $310.3 million of realized losses and $68.0 million of unrealized gains and $41.9 million of unrealized losses for the years ended December 31, 2012 and 2011, respectively, related to these derivative activities. |
Predecessor Carve-Out Financial Statements
As described in the financial statements and notes thereto included elsewhere in this Annual Report on Form 10-K, this report includes financial statements for the eleven months ended November 30, 2010 for the St. Paul Park Refinery and Retail Marketing Business, representing a carve-out financial statement presentation of several operating units of Marathon (the “Predecessor Financial Statements”). All significant intercompany accounts and transactions have been eliminated in the Predecessor Financial Statements.
The Predecessor Financial Statements were prepared to reflect the way we have operated our business subsequent to the Marathon Acquisition, which is in two segments: the refining segment and the retail segment. Except for certain assets that were not acquired (e.g., cash other than in-store cash at our convenience stores, receivables and assets sold to third parties pursuant to a sale-leaseback arrangement between us, Speedway SuperAmerica LLC, an affiliate of Marathon, and Realty Income, a third party equity real estate investment trust, and a crude oil supply and logistics purchase agreement with JPM CCC) and certain liabilities (e.g., accounts payable, payroll and benefits payable and deferred taxes) that were not assumed in connection with the Marathon Acquisition, the Predecessor Financial Statements represent the Marathon Assets. In addition, the Predecessor Financial Statements include allocations of selling, general and administrative costs and other overhead costs of Marathon Oil and its affiliates that are attributable to the operations of the Marathon Assets. We believe the assumptions, allocations and methodologies underlying the Predecessor Financial Statements are reasonable. However, the Predecessor Financial Statements do not include all of the actual expenses that would have been incurred had the Marathon Assets been operated on a standalone basis during the periods presented and do not reflect the Marathon Assets’ combined results of operations, financial position and cash flows had they been operated on a standalone basis during the periods presented.
51
The IPO Transactions
Our results of operations for periods subsequent to the closing of NTE LP’s initial public offering may not be comparable to our results of operations for periods prior to the closing of NTE LP’s initial public offering as a result of certain aspects of NTE LP’s initial public offering, including the following:
| | • | | We expect that our general and administrative expenses will increase as a result of our initial public offering. Specifically, we will incur certain expenses relating to being a publicly traded partnership, including Exchange Act reporting expenses; expenses associated with Sarbanes-Oxley Act compliance; expenses associated with our listing on the NYSE; independent auditors fees and expenses associated with tax return and Schedule K-1 preparation and distribution; legal fees, investor relations expenses; transfer agent fees; director and officer liability insurance costs; and director compensation. |
| | • | | We and our subsidiaries have historically not been subject to federal income and certain state income taxes. After consummation of NTE LP’s initial public offering, Northern Tier Retail Holdings LLC, one of our subsidiaries through which we conduct our retail business, and Northern Tier Energy Holdings LLC elected to be treated as corporations for federal income tax purposes, subjecting these subsidiaries to corporate-level tax. As a result of the elections by Northern Tier Retail Holdings LLC and Northern Tier Energy Holdings LLC to be treated as corporations for federal income tax purposes, for periods following such elections, our financial statements will include a tax provision on income attributable to these subsidiaries. Giving effect to such elections, we recorded an $8.0 million tax charge to recognize the net deferred tax asset and liability position as of the date of the elections. |
| | • | | In 2010, we entered into a management services agreement with ACON Management and TPG Management pursuant to which they provided us with ongoing management, advisory and consulting services in exchange for management fees. This management services agreement terminated in connection with the closing of NTE LP’s initial public offering. |
2020 Secured Notes Offering and Tender Offer
Our results of operations for periods subsequent to the completion of our 2020 Secured Notes offering and tender offer may not be comparable to our results of operations for periods prior to the refinancing.
On November 8, 2012, we completed a private placement of $275 million in aggregate principal amount of the 2020 Secured Notes. We used the net proceeds of the offering and cash on hand of $31 million (i) to repurchase our outstanding 2017 Secured Notes that were tendered pursuant to our previously announced tender offer and (ii) to satisfy and discharge any remaining 2017 Secured Notes outstanding (which notes were called for redemption after the closing of the tender offer) and to pay related fees and expenses. The repurchase of the 2017 Secured Notes resulted in an after-tax charge of $50.0 million in the year ended December 31, 2012.
Major Influences on Results of Operations
Refining
Our earnings and cash flows from our refining business segment are primarily affected by the relationship between refined product prices and the prices for crude oil and other feedstocks. Refining is primarily a margin-based business, and in order to increase profitability, it is important for the refinery to maximize the yields of high value finished products and to minimize the costs of feedstock and operating expenses. Feedstocks are petroleum products, such as crude oil and natural gas liquids that are processed and blended into refined products. The cost to acquire feedstocks and the price for which refined products are ultimately sold depend on several factors, many of which are beyond our control, including the supply of, and demand for, crude oil, gasoline and other refined products, which depend on changes in domestic and foreign economies, weather conditions, domestic and foreign political affairs, production levels, availability of and access to transportation infrastructure, the availability of imports, the marketing of competitive fuel, and the extent of government regulation, among other factors.
Feedstock and refined product prices are also affected by other factors, such as product pipeline capacity, local market conditions and the operating levels of competing refineries. Crude oil costs and the prices of refined products have historically been subject to wide fluctuations. An expansion or upgrade of our competitors’ facilities, price volatility, international political and economic developments and other factors beyond our control are likely to continue to play an important role in refining industry economics. These factors can impact, among other things, the level of inventories in the market, resulting in price volatility and a negative impact on product margins. Moreover, the refining industry typically experiences seasonal fluctuations in demand for refined products, such as increases in the demand for gasoline during the summer driving season and for home heating oil during the winter, primarily in the Northeast. In addition to current market conditions, there are long-term factors that may impact the demand for refined products. These factors include mandated renewable fuels standards, proposed climate change laws and regulations, and increased mileage standards for vehicles.
52
In order to assess our operating performance, we compare our refinery gross product margin against an industry refining margin benchmark. The industry refining margin benchmark we use is referred to as Group 3 3:2:1 crack spread, which is calculated by assuming that three barrels of benchmark light sweet crude oil is converted into two barrels of reformulated gasoline and one barrel of ultra low sulfur diesel. Because we calculate the benchmark refining margin using the market value of PADD II Group 3 conventional gasoline and ultra low-sulfur diesel against the market value of NYMEX WTI, we refer to the benchmark as the Group 3 3:2:1 crack spread. The Group 3 3:2:1 crack spread is expressed in dollars per barrel and is a proxy for the per barrel margin that a sweet crude oil refinery would earn assuming it produced and sold at PADD II Group 3 prices the benchmark production of gasoline and ultra low sulfur diesel.
Our direct operating expense structure is also important to our profitability. Major direct operating expenses include employee and contract labor, maintenance and energy. Our predominant variable direct operating cost is energy, which is comprised primarily of fuel and other utility services. The costs of fuel, principally natural gas, and other utility services, principally electricity, used by our refinery and other operations have historically been volatile.
Consistent, safe and reliable operations at our refinery are key to our financial performance and results of operations. Unplanned downtime at our refinery may result in lost margin opportunity, increased maintenance expense and a temporary increase in working capital investment and related inventory position. We seek to mitigate the financial impact of planned downtime, such as major turnaround maintenance, through a diligent planning process that takes into account the margin environment, the availability of resources to perform needed maintenance, contractual commitments, feedstock logistics and other factors. Periodically, we have planned maintenance turnarounds at our refinery, which are expensed as incurred. The refinery generally undergoes a major facility turnaround every five to six years, and the last full plant turnaround was completed in 2007. The length of the turnaround is contingent upon the scope of work to be completed. A major turnaround of either of the two main refinery units (fluid catalytic cracking unit and alkylation unit) generally takes two to four weeks to complete, and is planned and accomplished in a manner that allows for reduced production during maintenance instead of a complete shutdown. We completed a partial turnaround in April 2011, principally to replace a catalyst in the distillate and gas oil hydrotreaters, and to conduct basic maintenance on the No. 1 crude unit. During 2012 the planned partial turnaround of the alkylation unit that was completed according to schedule in mid May 2012 and the planned partial turnaround of the No. 1 reformer unit, which was completed on schedule in November 2012. We are currently planning a major plant turnaround to occur during April 2013 and another partial turnaround for our fluid catalytic cracking unit during October 2013, for which we have budgeted aggregate spending of approximately $55 to $60 million. The refinery is currently expected to have reduced throughputs during the months of April and October 2013 to complete the turnarounds.
Because petroleum feedstocks and products are essentially commodities, we have no control over the changing market. Therefore, the lower the target inventory we are able to maintain, the lesser is the impact of commodity price volatility on our petroleum product inventory position. Our inventory of crude oil and refined products is valued at the lower of cost or market value under the LIFO cost flow assumption. For periods in which the market price declines below our LIFO cost basis, we are subject to significant fluctuations in the recorded value of our inventory and related cost of products sold. Since 2009, we have experienced LIFO liquidations based upon permanent decreased levels in our inventories. These LIFO liquidations resulted in decreased cost of sales and increased income from operations of $4.1 million, $2.1 million and $2.1 million for the year ended December 31, 2011, the Successor Period ended December 31, 2010 and the eleven months ended November 30, 2010, respectively. There were no such liquidations in the year ended December 31, 2012.
At the closing of the Marathon Acquisition, we entered into a crude oil supply and logistics agreement with JPM CCC pursuant to which JPM CCC assists us in the purchase of most of the crude oil requirements of our refinery and provides transportation and other logistical services for delivery of the crude oil to our storage tanks in Cottage Grove, Minnesota. In March 2012, we amended and restated the crude oil supply and logistics agreement with JPM CCC. We pay JPM CCC the price of the crude oil plus certain agreed fees and expenses. We believe this crude oil supply and logistics agreement significantly reduces our crude inventories and allows us to take title to and price our crude oil at the refinery, as opposed to the crude oil origination point, reducing the time we are exposed to market fluctuations before the finished product output is sold.
In addition, we may hedge a portion of our gasoline and distillate production with the purpose of ensuring we can meet our fixed cost obligations, service our outstanding debt and other liabilities and meet our capital expenditure obligations. We have entered into agreements that govern all cash-settled commodity transactions that we enter into with J. Aron & Company and Macquarie Bank Limited for the purpose of managing our risk with respect to the crack spread created by the purchase of crude oil for future delivery and the sale of refined products, including gasoline, diesel, jet fuel and heating fuel, for future delivery. As market conditions permit, we have the capacity to hedge our crack spread risk with respect to a portion of the refinery’s projected monthly production of these refined products. Consistent with that policy, as of December 31, 2012, we had hedged approximately five million barrels of future gasoline and diesel production related to 2013 production. We intend to hedge significantly less than what we hedged at the time of the Marathon Acquisition on an ongoing basis. Consequently, we plan to increase our exposure to the gross refining margins that we would realize at our refinery on an unhedged basis over time.
53
Our refining business experiences seasonal effects. Demand for gasoline is generally higher during the summer months than during the winter months due to seasonal increases in highway traffic. Decreased demand during the winter months can lower gasoline prices. As a result, our operating results of our refining business for the first and fourth calendar quarters are generally lower than those for the second and third calendar quarters of each year.
Retail
Our earnings and cash flows from our retail business segment are primarily affected by the volumes and margins of gasoline and diesel sold, and by the sales and margins of merchandise sold at our convenience stores. Seasonal fluctuations in traffic also affect sales of motor fuels and merchandise in our convenience stores. As a result, the operating results of our retail segment are generally lower for the first quarter of the year. Weather conditions in our operating area also have a significant effect on our retail operating results. Customers are more likely to purchase higher profit margin items at our convenience stores, such as fast foods, fountain drinks and other beverages and more gasoline during the spring and summer months, thereby typically generating higher revenues and gross margins for us in these periods. Margins for transportation fuel sales are equal to the sales price (which includes the motor fuel taxes) less the delivered cost of the fuel and motor fuel taxes, and are measured on a cents per gallon basis. Fuel margins are impacted by local supply, demand and competition.
Margins for retail merchandise sold are equal to retail merchandise sales less the delivered cost of the merchandise, net of any supplier discounts and inventory shrinkage, and are measured as a percentage of merchandise sales. Merchandise sales are impacted by convenience or location, branding and competition. Franchisees are required to pay us an initial license fee (generally, $10,000 for licensees located in Minnesota and Wisconsin and $2,000 for licensees located in South Dakota) and a royalty fee for all products and merchandise sold at the convenience store, including motor fuel and diesel. The initial term of the license is generally 10 years, which is renewable by the licensee for a renewal term of 10 years, subject to the licensee satisfying certain conditions. The license agreements also require that, if a franchise store is located within our distribution area, then the franchise store must purchase a high minimum percentage (often 85% to 100%) of its motor fuel supply, including gasoline and distillate, from us. However, if a franchise store is not located within our distribution area, then the franchise store is not required to purchase any portion of its motor fuel supply from us. As of December 31, 2012, 35 of the 70 existing franchise stores are located within our distribution area and, thus, required to purchase a high minimum percentage of their motor fuel supply from us.
Results of Operations
We operate our business in two segments: the refining segment and the retail segment. Each of these segments is organized and managed based upon the nature of the products and services they offer. Through the refining segment, we operate the St. Paul Park, Minnesota, refinery, terminal and related assets, and through the retail segment, we operate 166 convenience stores primarily in Minnesota. The retail segment also includes the operations of SuperMom’s Bakery and SuperAmerica Franchising LLC, our wholly owned subsidiary (“SAF”), through which we conduct our franchising operations.
In this “Results of Operations” section, we first review our business on a combined and consolidated basis, and then separately review the results of operations of each of the refining segment and the retail segment. Detailed explanations of the period over period changes in our results of operations are contained in the discussion of individual segments. For partial year periods that do not have a corresponding period of the same duration, comparisons are made on a run rate basis comparing the partial period results with the prior year’s average monthly results for the corresponding period of time.
We refer to our financial statement line items in the explanation of our period over period changes in results of operations. Below are general definitions of what those line items include and represent.
Revenue. Revenue primarily includes the sale of refined products and crude oil in our refining segment and sales of fuel and merchandise to retail consumers in our retail segment. All sales are recorded net of customer discounts and rebates and inclusive of federal and state excise taxes. Refining revenue includes intersegment sales of refined products to the retail segment. For purposes of presenting sales on a combined basis, such intersegment transactions are eliminated. Retail revenue primarily includes sales of fuel and merchandise to customers inclusive of related excise taxes and net of any applicable discounts. Also included in retail revenue is royalty income, revenues from car wash operations and SuperMom’s Bakery sales to third parties.
Cost of sales. Refining cost of sales primarily include costs of crude and refinery feedstocks purchased, ethanol and other refined products purchased and excise taxes paid to various government authorities. Retail cost of sales consists of cost of fuel, merchandise and other products, costs of sales for SuperMom’s Bakery merchandise sales to third parties and excise taxes paid to various government authorities. Retail cost of sales includes intersegment purchases of refined products from the refining segment. For purposes of presenting cost of sales on a combined and consolidated basis, such intersegment transactions are eliminated.
54
Direct operating expenses. Direct operating expenses include the operating expenses of the refinery and costs of operating the convenience stores and the bakery. Refining direct operating expenses primarily include direct costs of labor, maintenance materials and services, chemicals and catalysts, utilities and other direct operating expenses of the refinery. Retail direct operating expenses consist primarily of salaries, labor and benefits, bankcard processing fees, contracted services, repair and maintenance, utilities and rent expense.
Turnaround and related expenses. Turnaround and related expenses represent the costs of required major maintenance projects on refinery processing units. A turnaround is a standard industry operation to refurbish and maintain a refinery and usually requires the shutdown and inspection of major processing units. Processing units require major maintenance every five to six years.
Depreciation and amortization. Depreciation and amortization represents an allocation to expense within the statement of operations of the carrying value of capital and intangible assets. The value is allocated based on the straight-line method over the estimated useful life of the related asset.
Selling, general and administrative. Selling, general and administrative expenses primarily include corporate costs, administrative expenses, shared service costs and marketing expenses.
Formation costs. Formation costs represent costs incurred for the creation of Northern Tier Energy LLC and its subsidiaries. No such costs existed for periods prior to the Marathon Acquisition.
Contingent consideration (income) expense. Contingent consideration (income) expense relates to changes in the estimated fair value of our margin support and earn-out arrangements with Marathon. No such arrangement existed for periods prior to December 1, 2010.
Other (income) expense, net. Other (income) expense, net primarily represents (income) expense from our equity method investment in Minnesota Pipe Line and dividend income from our cost method investment in Minnesota Pipe Line Company, LLC.
Gain (loss) from derivative activities. Gain (loss) from derivative activities primarily includes impacts from our crack spread risk mitigation strategy initiated in October 2010 in anticipation of the Marathon Acquisition to mitigate market price risk. Included in gain (loss) from derivative activities are realized gains or losses related to settled contracts during the period and unrealized gains or losses on outstanding derivatives to partially hedge the crack spread margins for our refining business. The offsetting benefits related to these outstanding derivative liabilities should be realized over future periods as improved crack spreads are realized. Going forward, we plan to hedge a lesser amount of our production than we hedged at the time of the Marathon Acquisition.
Bargain purchase gain. Bargain purchase gain represents the excess of the estimated fair value of the net assets acquired in the Marathon Acquisition over the total purchase consideration.
Interest expense, net. Interest expense, net subsequent to December 1, 2010 relates primarily to interest incurred on our senior secured notes as well as commitment fees and interest on the revolving credit facility and the normal amortization of deferred financing costs.
The historical financial data presented below are not necessarily indicative of the results to be expected for any future period. The historical financial data for the eleven months ended November 30, 2010 do not reflect the consummation of the Marathon Acquisition or our capital structure following the Marathon Acquisition. See “Predecessor Carve-Out Financial Statements.”
55
Consolidated and Combined Financial Data
| | | | | | | | | | | | | | | | | | |
| | | Successor | | | | | Predecessor | |
| | | Year Ended December 31, | | | June 23, 2010
(inception date)
to December 31,
2010 | | | | | Eleven Months
Ended
November 30,
2010 | |
(in millions) | | 2012 | | | 2011 | | | | |
Revenue | | $ | 4,653.9 | | | $ | 4,280.8 | | | $ | 344.9 | | | | | $ | 3,195.2 | |
Costs, expenses and other: | | | | | | | | | | | | | | | | | | |
Cost of sales | | | 3,584.9 | | | | 3,512.4 | | | | 307.5 | | | | | | 2,697.9 | |
Direct operating expenses | | | 254.1 | | | | 257.9 | | | | 21.4 | | | | | | 227.0 | |
Turnaround and related expenses | | | 26.1 | | | | 22.6 | | | | — | | | | | | 9.5 | |
Depreciation and amortization | | | 33.2 | | | | 29.5 | | | | 2.2 | | | | | | 37.3 | |
Selling, general and administrative | | | 88.3 | | | | 88.7 | | | | 6.4 | | | | | | 59.6 | |
Formation costs | | | — | | | | 7.4 | | | | 3.6 | | | | | | — | |
Contingent consideration loss (income) | | | 104.3 | | | | (55.8 | ) | | | — | | | | | | — | |
Other (income) expense, net | | | (9.4 | ) | | | (4.5 | ) | | | 0.1 | | | | | | (5.4 | ) |
| | | | | | | | | | | | | | | | | | |
Operating income | | | 572.4 | | | | 422.6 | | | | 3.7 | | | | | | 169.3 | |
Realized losses from derivative activities | | | (339.4 | ) | | | (310.3 | ) | | | — | | | | | | — | |
Unrealized (losses) gains from derivative activities | | | 68.0 | | | | (41.9 | ) | | | (27.1 | ) | | | | | (40.9 | ) |
Bargain purchase gain | | | — | | | | — | | | | 51.4 | | | | | | — | |
Interest expense, net | | | (42.2 | ) | | | (42.1 | ) | | | (3.2 | ) | | | | | (0.3 | ) |
Loss on early extinguishment of debt | | | (50.0 | ) | | | — | | | | — | | | | | | — | |
| | | | | | | | | | | | | | | | | | |
Income before income taxes | | | 208.8 | | | | 28.3 | | | | 24.8 | | | | | | 128.1 | |
Income tax provision | | | (9.8 | ) | | | — | | | | — | | | | | | (67.1 | ) |
| | | | | | | | | | | | | | | | | | |
Net income | | $ | 199.0 | | | $ | 28.3 | | | $ | 24.8 | | | | | $ | 61.0 | |
| | | | | | | | | | | | | | | | | | |
Year Ended December 31, 2012 Compared to the Year Ended December 31, 2011
Revenue. Revenue for the year ended December 31, 2012 was $4,653.9 million compared to $4,280.8 million for the year ended December 31, 2011, an increase of 8.7%. Refining segment revenue increased 10.7% and retail segment revenue decreased 2.5% compared to the year ended December 31, 2011. The refining segment benefited from higher sales volumes and higher average market prices for refined products. Retail revenue decreased primarily due to lower fuel sales volumes caused by reduced market demand and road construction projects impacting our retail stores. Excise taxes included in revenue totaled $300.1 million and $242.9 million for the years ended December 31, 2012 and 2011, respectively.
Cost of sales. Cost of sales totaled $3,584.9 million for the year ended December 31, 2012 compared to $3,512.4 million for the year ended December 31, 2011, an increase of 2.1%, due to the impact of increased refining throughput, partially offset by lower priced crude oil as a result of improved crude differentials in the year ended December 31, 2012. Excise taxes included in cost of sales were $300.1 million and $242.9 million for the years ended December 31, 2012 and 2011, respectively.
Direct operating expenses. Direct operating expenses totaled $254.1 million for the year ended December 31, 2012 compared to $257.9 million for the year ended December 31, 2011, a decrease of 1.5%, due primarily to lower operating expenses at our retail stores and reduced utility expenses at the refinery, which were driven by lower natural gas costs, partially offset by costs recognized in the year ended December 31, 2012 related to environmental compliance projects at our refinery’s wastewater treatment plant and the impact of increased volumes on variable costs at our refinery.
Turnaround and related expenses. Turnaround and related expenses totaled $26.1 million for the year ended December 31, 2012 compared to $22.6 million for the year ended December 31, 2011. Both periods include costs related to planned, partial turnarounds. The 2012 partial turnarounds include the alkylation unit, which was completed according to schedule in mid-May, and the No. 1 reformer unit, which was completed in November 2012. The 2011 partial turnaround was principally to replace catalyst in the distillate and gas oil hydrotreaters and to conduct basic maintenance on the No. 1 crude unit.
56
Depreciation and amortization. Depreciation and amortization was $33.2 million for the year ended December 31, 2012 compared to $29.5 million for the year ended December 31, 2011, an increase of 12.5%. This increase was due to depreciation of assets placed in service primarily related to our refinery and our systems implementation project.
Selling, general and administrative expenses. Selling, general and administrative expenses were $88.3 million for the year ended December 31, 2012 compared to $88.7 million for the year ended December 31, 2011. This decrease of 0.5% from the prior-year period relates primarily to lower administrative costs as the year ended December 31, 2012 did not include transition services fees to utilize Marathon systems. This reduction is partially offset by higher administrative costs in the first six months of 2012 related to post go-live systems support during the process optimization phase of our standalone systems implementation.
Formation costs. Formation costs for the year ended December 31, 2012 and 2011 were less than $0.1 million and $7.4 million, respectively. All of the costs are attributable to the Marathon Acquisition.
Contingent consideration loss (income). Contingent consideration loss was $104.3 million for the year ended December 31, 2012 compared to contingent consideration income of $55.8 million for the year ended December 31, 2011. The contingent consideration losses relate to the margin support and earn-out agreements entered into with Marathon at the time of the Marathon Acquisition. The 2012 charge of $104.3 million includes the impact of the final valuation adjustment to arrive at the agreed settlement amount which was contingent upon NTE LP’s IPO. The contingent consideration income in the 2011 period relates to changes in the financial performance estimates as of December 31, 2011 for the then remaining period of performance.
Other (income) expense, net. Other income, net was $9.4 million for the year ended December 31, 2012 compared to $4.5 million for the year ended December 31, 2011. This change is driven primarily by increases in equity income from our investment in MPL.
Gains (losses) from derivative activities. For the year ended December 31, 2012, we had realized losses of $339.4 million related to settled contracts compared to $310.3 million in the prior-year period. Offsetting benefits related to these losses were recognized through improved operating margins. We incurred unrealized gains on outstanding derivatives of $68.0 million for the year ended December 31, 2012 compared to unrealized losses of $41.9 million during the year ended December 31, 2011. These derivatives were entered into to partially hedge the crack spreads for our refining business.
Interest expense, net. Interest expense, net was $42.2 million for the year ended December 31, 2012 and $42.1 million for the year ended December 31, 2011. These interest charges relate primarily to our senior secured notes as well as commitment fees and interest on the ABL facility and the amortization of deferred financing costs.
Loss on early extinguishment of debt. Loss on early extinguishment of debt for the year ended December 31, 2012 relates to the premiums paid and deferred financing costs written off related to the extinguishment of our senior secured notes due 2017 during the fourth quarter of 2012.
Income tax provision. The income tax provision for the year ended December 31, 2012 was $9.8 million compared to less than $0.1 million for the year ended December 31, 2011. Prior to August 1, 2012, we operated as a pass-through entity for federal tax purposes and, as such, only state taxes were recognized. Effective on August 1, 2012 our retail business became a tax paying entity for federal and state income taxes. The 2012 provision relates primarily to the recognition of an $8.0 million net deferred tax liability on the effective date of the conversion of our retail business to a tax paying entity.
Net income. Our net income was $199.0 million for the year ended December 31, 2012 compared to $28.3 million for the year ended December 31, 2011. This improvement of $170.7 million was primarily attributable to a $319.1 million increase in operating income for our refining segment due to improved refining gross margins in the year ended December 31, 2012 and reduced losses from derivative activities of $80.8 million. These improvements were partially offset by a $50.0 million loss on early extinguishment of debt and change of $160.1 million from our contingent consideration arrangement that negatively impacted net income in the year ended December 31, 2012.
57
Segment Financial Data
The segment financial data for the refining segment discussed below under “—Refining Segment” include intersegment sales of refined products to the retail segment. Similarly, the segment financial data for the retail segment discussed below under “—Retail Segment” contain intersegment purchases of refined products from the refining segment. For purposes of presenting our combined and consolidated results, such intersegment transactions are eliminated, as shown in the following tables.
| | | | | | | | | | | | | | | | |
| | | Successor | |
| | | Year Ended December 31, 2012 | |
(in millions) | | Refining | | | Retail | | | Other/Elim | | | Consolidated | |
Revenue: | | | | | | | | | | | | | | | | |
Sales and other revenue | | $ | 3,171.5 | | | $ | 1,482.4 | | | $ | — | | | $ | 4,653.9 | |
Intersegment sales | | | 1,041.1 | | | | — | | | | (1,041.1 | ) | | | — | |
| | | | | | | | | | | | | | | | |
Segment revenue | | $ | 4,212.6 | | | $ | 1,482.4 | | | $ | (1,041.1 | ) | | $ | 4,653.9 | |
| | | | | | | | | | | | | | | | |
Cost of sales: | | | | | | | | | | | | | | | | |
Cost of sales | | $ | 3,303.7 | | | $ | 281.2 | | | $ | — | | | $ | 3,584.9 | |
Intersegment purchases | | | — | | | | 1,041.1 | | | | (1,041.1 | ) | | | — | |
| | | | | | | | | | | | | | | | |
Segment cost of sales | | $ | 3,303.7 | | | $ | 1,322.3 | | | $ | (1,041.1 | ) | | $ | 3,584.9 | |
| | | | | | | | | | | | | | | | |
| | | | | | | | | | | | | | | | |
| | | Successor | |
| | | Year Ended December 31, 2011 | |
(in millions) | | Refining | | | Retail | | | Other/Elim | | | Consolidated | |
Revenue: | | | | | | | | | | | | | | | | |
Sales and other revenue | | $ | 2,761.0 | | | $ | 1,519.8 | | | $ | — | | | $ | 4,280.8 | |
Intersegment sales | | | 1,043.1 | | | | — | | | | (1,043.1 | ) | | | — | |
| | | | | | | | | | | | | | | | |
Segment revenue | | $ | 3,804.1 | | | $ | 1,519.8 | | | $ | (1,043.1 | ) | | $ | 4,280.8 | |
| | | | | | | | | | | | | | | | |
Cost of sales: | | | | | | | | | | | | | | | | |
Cost of sales | | $ | 3,208.5 | | | $ | 303.9 | | | $ | — | | | $ | 3,512.4 | |
Intersegment purchases | | | — | | | | 1,043.1 | | | | (1,043.1 | ) | | | — | |
| | | | | | | | | | | | | | | | |
Segment cost of sales | | $ | 3,208.5 | | | $ | 1,347.0 | | | $ | (1,043.1 | ) | | $ | 3,512.4 | |
| | | | | | | | | | | | | | | | |
58
| | | | | | | | | | | | | | | | |
| | | Successor | |
| | | June 23, 2010 (inception date) to December 31, 2010 | |
| | | Refining | | | Retail | | | Other/Elim | | | Consolidated | |
| | | (in millions) | |
Revenue: | | | | | | | | | | | | | | | | |
Sales and other revenue | | $ | 242.0 | | | $ | 102.9 | | | $ | — | | | $ | 344.9 | |
Intersegment sales | | | 70.2 | | | | — | | | | (70.2 | ) | | | — | |
| | | | | | | | | | | | | | | | |
Segment revenue | | $ | 312.2 | | | $ | 102.9 | | | $ | (70.2 | ) | | $ | 344.9 | |
| | | | | | | | | | | | | | | | |
Cost of sales: | | | | | | | | | | | | | | | | |
Cost of sales | | $ | 287.2 | | | $ | 20.2 | | | $ | 0.1 | | | $ | 307.5 | |
Intersegment purchases | | | — | | | | 70.2 | | | | (70.2 | ) | | | — | |
| | | | | | | | | | | | | | | | |
Segment cost of sales | | $ | 287.2 | | | $ | 90.4 | | | $ | (70.1 | ) | | $ | 307.5 | |
| | | | | | | | | | | | | | | | |
| |
| | | Predecessor | |
| | | Eleven Months Ended November 30, 2010 | |
| | | Refining | | | Retail | | | Other | | | Combined | |
| | | (in millions) | |
Revenue: | | | | | | | | | | | | | | | | |
Sales and other revenue | | $ | 1,988.4 | | | $ | 1,206.8 | | | $ | — | | | $ | 3,195.2 | |
Intersegment sales | | | 811.4 | | | | — | | | | (811.4 | ) | | | — | |
| | | | | | | | | | | | | | | | |
Segment revenue | | $ | 2,799.8 | | | $ | 1,206.8 | | | $ | (811.4 | ) | | $ | 3,195.2 | |
| | | | | | | | | | | | | | | | |
Cost of sales: | | | | | | | | | | | | | | | | |
Cost of sales | | $ | 2,455.9 | | | $ | 242.0 | | | $ | — | | | $ | 2,697.9 | |
Intersegment purchases | | | — | | | | 811.4 | | | | (811.4 | ) | | | — | |
| | | | | | | | | | | | | | | | |
Segment cost of sales | | $ | 2,455.9 | | | $ | 1,053.4 | | | $ | (811.4 | ) | | $ | 2,697.9 | |
| | | | | | | | | | | | | | | | |
59
Refining Segment
| | | | | | | | | | | | | | | | | | |
| | | Successor | | | | | Predecessor | |
| | | Year Ended December 31, | | | June 23, 2010
(inception date)
to December 31,
2010 | | | | | Eleven Months
Ended
November 30,
2010 | |
(in millions) | | 2012 | | | 2011 | | | | |
Revenue | | $ | 4,212.6 | | | $ | 3,804.1 | | | $ | 312.2 | | | | | $ | 2,799.8 | |
Costs, expenses and other: | | | | | | | | | | | | | | | | | | |
Cost of sales | | | 3,303.7 | | | | 3,208.5 | | | | 287.2 | | | | | | 2,455.9 | |
Direct operating expenses | | | 136.3 | | | | 131.3 | | | | 11.2 | | | | | | 132.2 | |
Turnaround and related expenses | | | 26.1 | | | | 22.6 | | | | — | | | | | | 9.5 | |
Depreciation and amortization | | | 25.2 | | | | 21.5 | | | | 1.7 | | | | | | 24.9 | |
Selling, general and administrative | | | 26.7 | | | | 38.6 | | | | 3.1 | �� | | | | | 40.0 | |
Other income, net | | | (12.7 | ) | | | (6.6 | ) | | | (0.1 | ) | | | | | (5.5 | ) |
| | | | | | | | | | | | | | | | | | |
Operating income | | $ | 707.3 | | | $ | 388.2 | | | $ | 9.1 | | | | | $ | 142.8 | |
| | | | | | | | | | | | | | | | | | |
Key Operating Statistics | | | | | | | | | | | | | | | | | | |
Total refinery production (bpd)(1) | | | 84,530 | | | | 82,079 | | | | 81,853 | | | | | | 80,958 | |
Total refinery throughput (bpd) | | | 83,851 | | | | 81,150 | | | | 81,136 | | | | | | 80,066 | |
Refined products sold (bpd)(2) | | | 89,162 | | | | 86,038 | | | | 95,122 | | | | | | 86,682 | |
Per barrel of throughput: | | | | | | | | | | | | | | | | | | |
Refining gross margin(3) | | $ | 29.62 | | | $ | 20.11 | | | $ | 9.94 | | | | | $ | 12.86 | |
Direct operating expenses(4) | | $ | 4.44 | | | $ | 4.43 | | | $ | 4.45 | | | | | $ | 4.94 | |
Per barrel of refined products sold: | | | | | | | | | | | | | | | | | | |
Refining gross margin(3) | | $ | 27.85 | | | $ | 18.97 | | | $ | 8.48 | | | | | $ | 11.88 | |
Direct operating expenses(4) | | $ | 4.18 | | | $ | 4.18 | | | $ | 3.80 | | | | | $ | 4.56 | |
Refinery product yields (bpd): | | | | | | | | | | | | | | | | | | |
Gasoline | | | 40,825 | | | | 40,240 | | | | 42,485 | | | | | | 41,080 | |
Distillate(5) | | | 27,113 | | | | 24,841 | | | | 26,258 | | | | | | 22,201 | |
Asphalt | | | 11,434 | | | | 9,888 | | | | 9,099 | | | | | | 9,532 | |
Other(6) | | | 5,158 | | | | 7,110 | | | | 4,011 | | | | | | 8,145 | |
| | | | | | | | | | | | | | | | | | |
Total | | | 84,530 | | | | 82,079 | | | | 81,853 | | | | | | 80,958 | |
| | | | | | | | | | | | | | | | | | |
Refinery throughput (bpd): | | | | | | | | | | | | | | | | | | |
Crude oil | | | 81,779 | | | | 77,452 | | | | 74,649 | | | | | | 74,095 | |
Other feedstocks(7) | | | 2,072 | | | | 3,698 | | | | 6,487 | | | | | | 5,971 | |
| | | | | | | | | | | | | | | | | | |
Total | | | 83,851 | | | | 81,150 | | | | 81,136 | | | | | | 80,066 | |
| | | | | | | | | | | | | | | | | | |
Market Statistics: | | | | | | | | | | | | | | | | | | |
Crude Oil Average Pricing: | | | | | | | | | | | | | | | | | | |
West Texas Intermediate ($/barrel) | | $ | 93.81 | | | $ | 95.11 | | | $ | 89.23 | | | | | $ | 78.69 | |
PADD II / Group 3 Average Pricing: | | | | | | | | | | | | | | | | | | |
Unleaded 87 Gasoline ($/barrel) | | $ | 119.40 | | | $ | 117.60 | | | $ | 96.97 | | | | | $ | 86.86 | |
Ultra Low Sulfur Diesel ($/barrel) | | $ | 129.02 | | | $ | 126.26 | | | $ | 103.38 | | | | | $ | 90.38 | |
| (1) | Excludes fuel and coke on catalyst, which are used in our refining process. Also excludes purchased refined products. |
| (2) | Includes produced and purchased refined products, including ethanol and biodiesel. |
| (3) | Refining gross product margin per barrel is a per barrel measurement calculated by subtracting refining costs of sales from total refining revenues and dividing the difference by the total throughput or total refined products sold for the respective periods presented. Refining gross product margin is a non-GAAP performance measure that we believe is important to investors in evaluating our refinery performance as a general indication of the amount above our cost of products that we are able to sell refined products. Each of the components used in this calculation (revenues and cost of sales) can be reconciled directly to our statements of operations. Our calculation of refining gross product margin may differ from similar calculations of other |
60
| | companies in our industry, thereby limiting its usefulness as a comparative measure. For a reconciliation of refining gross product margin to the most directly comparable GAAP measure, see “Results of Operations—Other Non-GAAP Performance Measures.” |
| (4) | Direct operating expenses per barrel is calculated by dividing direct operating expenses by the total barrels of throughput or total barrels of refined products sold for the respective periods presented. |
| (5) | Distillate includes diesel, jet fuel and kerosene. |
| (6) | Other refinery products include propane, propylene, liquid sulfur, light cycle oil and No. 6 fuel oil, among others. None of these products, by itself, contributes significantly to overall refinery product yields. |
| (7) | Other feedstocks include gas oil, natural gasoline, normal butane and isobutane, among others. None of these feedstocks, by itself, contributes significantly to overall refinery throughput. |
Year Ended December 31, 2012 Compared to the Year Ended December 31, 2011
Revenue. Revenue for the year ended December 31, 2012 was $4,212.6 million compared to $3,804.1 million for the year ended December 31, 2011, an increase of 10.7%. This increase was primarily due to a 3.9% increase in sales volumes for refined products, increased sales of crude oil and higher market prices for distillate and asphalt in the year ended December 31, 2012. The higher refined product volumes are primarily attributable to higher throughput from our refinery due to increased productivity. Excise taxes included in revenue were $290.8 million and $232.8 million for the year ended December 31, 2012 and 2011, respectively.
Cost of sales. Cost of sales totaled $3,303.7 million for the year ended December 31, 2012 compared to $3,208.5 million for the year ended December 31, 2011, a 3.0% increase. This increase was primarily due to the impact of increased sales volumes, partially offset by lower raw material costs, driven principally by improved crude differentials in the year ended December 31, 2012. Excise taxes included in cost of sales were $290.8 million and $232.8 million for the year ended December 31, 2012 and 2011, respectively. Refining gross product margin per barrel of throughput was $29.62 for the year ended December 31, 2012 compared to $20.11 for the year ended December 31, 2011, an increase of $9.51, or 47.3%, which is mostly attributable to improved crack spreads and improved crude differentials in the year ended December 31, 2012.
Direct operating expenses. Direct operating expenses totaled $136.3 million for the year ended December 31, 2012 compared to $131.3 million for the year ended December 31, 2011, a 3.8% increase. This increase was due primarily to the impact of increased volumes on variable costs at our refinery and costs recognized in 2012 related to environmental compliance projects at our refinery’s wastewater treatment plant, offset by lower utility expenses at the refinery, which resulted from decreases in natural gas prices during the year ended December 31, 2012.
Turnaround and related expenses. Turnaround and related expenses totaled $26.1 million for the year ended December 31, 2012 compared to $22.6 million for the year ended December 31, 2011. Both periods include costs related to planned, partial turnarounds. The 2012 turnarounds include the alkylation unit, which was completed according to schedule in mid-May, and the No. 1 reformer unit, which was completed in November 2012. The 2011 turnaround was principally to replace catalyst in the distillate and gas oil hydrotreaters and to conduct basic maintenance on the No. 1 crude unit and was completed in April 2011.
Depreciation and amortization. Depreciation and amortization was $25.2 million for the year ended December 31, 2012 compared to $21.5 million for the year ended December 31, 2011, an increase of 17.2%. This increase was due to increased assets placed in service as a result of our capital expenditures, the most significant of which was our boiler replacement project which was placed in service in the fourth quarter of 2011.
Selling, general and administrative expenses. Selling, general and administrative expenses were $26.7 million and $38.6 million for the year ended December 31, 2012 and 2011, respectively, a decrease of 30.8%. This decrease was due to the termination of our transition services agreement with Marathon in the fourth quarter of 2011, as a result of which we did not incur expenses related to the agreement in the year ended December 31, 2012.
Other income, net. Other income, net was $12.7 million for the year ended December 31, 2012 compared to $6.6 million for the year ended December 31, 2011. This increase is driven primarily by an increase in equity income from our investment in MPL, which increased its tariff rates in the third quarter of 2011.
Operating income. Income from operations was $707.3 million for the year ended December 31, 2012 compared to $388.2 million for the year ended December 31, 2011. This increase from the prior-year period of $319.1 million is primarily due to favorable crack spreads, crude differentials and higher throughput rates during the 2012 period.
61
Retail Segment
| | | | | | | | | | | | | | | | | | |
| | | Successor | | | | | Predecessor | |
| | | Year Ended December 31, | | | June 23, 2010
(inception date)
to December 31,
2010 | | | | | Eleven Months
Ended
November 30,
2010 | |
(in millions) | | 2012 | | | 2011 | | | | |
Revenue | | $ | 1,482.4 | | | $ | 1,519.8 | | | $ | 102.9 | | | | | $ | 1,206.8 | |
Costs, expenses and other: | | | | | | | | | | | | | | | | | | |
Cost of sales | | | 1,322.3 | | | | 1,347.0 | | | | 90.4 | | | | | | 1,053.4 | |
Direct operating expenses | | | 118.8 | | | | 126.6 | | | | 10.2 | | | | | | 94.9 | |
Depreciation and amortization | | | 7.5 | | | | 7.2 | | | | 0.5 | | | | | | 12.4 | |
Selling, general and administrative | | | 25.1 | | | | 25.0 | | | | 1.3 | | | | | | 19.6 | |
| | | | | | | | | | | | | | | | | | |
Operating income | | $ | 8.7 | | | $ | 14.0 | | | $ | 0.5 | | | | | $ | 26.5 | |
| | | | | | | | | | | | | | | | | | |
Operating data: | | | | | | | | | | | | | | | | | | |
Company-owned stores: | | | | | | | | | | | | | | | | | | |
Fuel gallons sold (in millions) | | | 312.4 | | | | 324.0 | | | | 29.1 | | | | | | 316.0 | |
Fuel margin per gallon (1) | | $ | 0.18 | | | $ | 0.21 | | | $ | 0.16 | | | | | $ | 0.17 | �� |
Merchandise sales (in millions) | | $ | 340.4 | | | $ | 340.3 | | | $ | 26.8 | | | | | $ | 309.8 | |
Merchandise margin % (2) | | | 25.4 | % | | | 25.4 | % | | | 24.1 | % | | | | | 26.3 | % |
Number of stores at period end | | | 166 | | | | 166 | | | | 166 | | | | | | 166 | |
Franchisee stores: | | | | | | | | | | | | | | | | | | |
Fuel gallons sold (in millions) | | | 45.4 | | | | 51.5 | | | | 4.1 | | | | | | 48.3 | |
Royalty income (in millions) | | $ | 2.1 | | | $ | 1.7 | | | $ | 0.1 | | | | | $ | 1.5 | |
Number of stores at period end | | | 70 | | | | 67 | | | | 67 | | | | | | 67 | |
Market Statistics: | | | | | | | | | | | | | | | | | | |
PADD II gasoline prices ($/gallon) | | $ | 3.61 | | | $ | 3.53 | | | $ | 3.00 | | | | | $ | 2.76 | |
| (1) | Retail fuel margin per gallon is calculated by dividing retail fuel gross margin by the fuel gallons sold at company-operated stores. Retail fuel gross margin is a non-GAAP performance measure that we believe is important to investors in evaluating our retail performance. Our calculation of retail fuel gross margin may differ from similar calculations of other companies in our industry, thereby limiting its usefulness as a comparative measure. For a reconciliation of retail fuel gross margin to retail segment operating income, the most directly comparable GAAP measure, see “Results of Operations—Other Non-GAAP Performance Measures.” |
| (2) | Merchandise margin is expressed as a percentage of merchandise sales and is calculated by subtracting costs of merchandise from merchandise sales for company-operated stores, and then dividing by merchandise sales. Merchandise margin is a non-GAAP performance measure that we believe is important to investors in evaluating our retail performance. Our calculation of merchandise margin may differ from similar calculations of other companies in our industry, thereby limiting its usefulness as a comparative measure. Merchandise margin includes all non-fuel sales at our company-operated stores including items like cigarettes, beer, milk, food, general merchandise, car wash and other commission-based revenue. For a reconciliation of merchandise margin to retail segment operating income, the most directly comparable GAAP measure, see “Results of Operations—Other Non-GAAP Performance Measures.” |
Year Ended December 31, 2012 Compared to the Year Ended December 31, 2011
Revenue. Revenue for the year ended December 31, 2012 was $1,482.4 million compared to $1,519.8 million for the year ended December 31, 2011, a decrease of 2.5%. This decrease was primarily due to a reduction in fuel sales driven primarily by lower sales volumes. We experienced a 3.6% decrease in fuel gallons sold in our retail segment compared to the prior year. The volume reduction in the 2012 period is primarily due to lower retail market demand for gasoline and road construction projects impacting our retail stores. Excise taxes included in revenue were $9.3 million for the year ended December 31, 2012 and $10.1 million for the year ended December 31, 2011.
Cost of sales. Cost of sales totaled $1,322.3 million for the year ended December 31, 2012 and $1,347.0 million for the year ended December 31, 2011, a decrease of 1.8%. Excise taxes included in cost of sales were $9.3 million for the year ended December 31, 2012 and $10.1 million for the year ended December 31, 2011. For company-operated stores, retail fuel margin per
62
gallon was $0.18 for the year ended December 31, 2012 compared to $0.21 per gallon for the year ended December 31, 2011. This reduction in fuel margin per gallon relates to a spike in competitive pricing actions in the local market that occurred during the third quarter of 2012 in response to reduced volume levels across the local market.
Direct operating expenses. Direct operating expenses totaled $118.8 million for the year ended December 31, 2012 compared to $126.6 million for the year ended December 31, 2011, a decrease of 6.2% from the 2011 period due to reductions in convenience store operating costs as a result of cost reduction efforts, primarily related to store personnel and contractor costs.
Depreciation and amortization. Depreciation and amortization was $7.5 million for the year ended December 31, 2012 compared to $7.2 million for the year ended December 31, 2011, an increase of 4.2%. The increase is due to increased depreciation from capital expenditures at our stores and for our new systems infrastructure, offset by a change in the treatment for certain sale leaseback assets. During 2011, our continuing involvement ended for a subset of our retail stores which did not meet the criteria for sale leaseback treatment at the time of the Marathon Acquisition. As such, the related fair value of the assets for these stores was removed from the consolidated balance sheet and was no longer depreciated.
Selling, general and administrative expenses. Selling, general and administrative expenses were $25.1 million and $25.0 million for the year ended December 31, 2012 and 2011, respectively. The slight increase relates to higher professional service fees and personnel costs, offset by lower back office costs in 2012 period. In the year ended December 31, 2011, our back office costs were higher as we developed our stand-alone infrastructure while continuing to pay transition services fees to utilize the Speedway LLC back office infrastructure.
Operating income. Operating income was $8.7 million for the year ended December 31, 2012 compared to $14.0 million for the year ended December 31, 2011, a reduction of $5.3 million. The reduction is primarily attributable to lower fuel margins per gallon and lower fuel volumes partially offset by higher merchandise gross margin and lower operating expenses during the year ended December 31, 2012.
63
Adjusted EBITDA
Our management uses Adjusted EBITDA as a measure of operating performance to assist in comparing performance from period to period on a consistent basis and to readily view operating trends, as a measure for planning and forecasting overall expectations and for evaluating actual results against such expectations, and in communications with our board of directors, creditors, analysts and investors concerning our financial performance. We also believe Adjusted EBITDA may be used by some investors to assess the ability of our assets to generate sufficient cash flow to make distributions to our unitholders. The revolving credit facility and other contractual obligations also include similar measures as a basis for certain covenants under those agreements which may differ from the Adjusted EBITDA definition described below.
Adjusted EBITDA is not a presentation made in accordance with GAAP and our computation of Adjusted EBITDA may vary from others in our industry. In addition, Adjusted EBITDA contains some, but not all, adjustments that are taken into account in the calculation of the components of various covenants in the agreements governing the notes, the revolving credit facility, earn-out, margin support and management services. Adjusted EBITDA should not be considered as an alternative to operating earnings or net (loss) earnings as measures of operating performance. In addition, Adjusted EBITDA is not presented as and should not be considered an alternative to cash flows from operations as a measure of liquidity. Adjusted EBITDA is defined as EBITDA before turnaround and related expenses, stock-based compensation expense, gains (losses) from derivative activities, contingent consideration, formation costs, bargain purchase gain and adjustments to reflect proportionate EBITDA from the Minnesota Pipeline operations. Other companies, including companies in our industry, may calculate Adjusted EBITDA differently than we do, limiting its usefulness as a comparative measure. Adjusted EBITDA also has limitations as an analytical tool and should not be considered in isolation, or as a substitute for analysis of our results as reported under GAAP. Some of these limitations include that Adjusted EBITDA:
| | • | | does not reflect our cash expenditures, or future requirements, for capital expenditures or contractual commitments; |
| | • | | does not reflect changes in, or cash requirements for, our working capital needs; |
| | • | | does not reflect our interest expense, or the cash requirements necessary to service interest or principal payments, on our debt; |
| | • | | does not reflect the equity income in our Minnesota Pipe Line investment, but includes 17% of the calculated EBITDA of Minnesota Pipe Line; |
| | • | | does not reflect realized and unrealized gains and losses from derivative activities, which may have a substantial impact on our cash flow; |
| | • | | does not reflect certain other non-cash income and expenses; and |
| | • | | excludes income taxes that may represent a reduction in available cash. |
64
The following tables reconcile net income (loss) as reflected in the results of operations tables and segment footnote disclosures to Adjusted EBITDA for the periods presented:
| | | | | | | | | | | | | | | | |
| | | Successor | |
| | | Year Ended December 31, 2012 | |
(in millions) | | Refining | | | Retail | | | Other | | | Total | |
Net income (loss) | | $ | 707.3 | | | $ | 8.7 | | | $ | (517.0 | ) | | $ | 199.0 | |
Adjustments: | | | | | | | | | | | | | | | | |
Interest expense | | | — | | | | — | | | | 42.2 | | | | 42.2 | |
Income tax provision | | | — | | | | — | | | | 9.8 | | | | 9.8 | |
Depreciation and amortization | | | 25.2 | | | | 7.5 | | | | 0.5 | | | | 33.2 | |
| | | | | | | | | | | | | | | | |
EBITDA subtotal | | | 732.5 | | | | 16.2 | | | | (464.5 | ) | | | 284.2 | |
Minnesota Pipe Line proportionate EBITDA | | | 2.8 | | | | — | | | | — | | | | 2.8 | |
Turnaround and related expenses | | | 26.1 | | | | — | | | | — | | | | 26.1 | |
Equity-based compensation expense | | | — | | | | — | | | | 0.9 | | | | 0.9 | |
Unrealized gains on derivative activities | | | — | | | | — | | | | (68.0 | ) | | | (68.0 | ) |
Contingent consideration loss | | | — | | | | — | | | | 104.3 | | | | 104.3 | |
Loss on early extinguishment of debt | | | — | | | | — | | | | 50.0 | | | | 50.0 | |
Realized losses on derivative activities | | | — | | | | — | | | | 339.4 | | | | 339.4 | |
| | | | | | | | | | | | | | | | |
Adjusted EBITDA | | $ | 761.4 | | | $ | 16.2 | | | $ | (37.9 | ) | | $ | 739.7 | |
| | | | | | | | | | | | | | | | |
65
| | | | | | | | | | | | | | | | |
| | | Successor | |
| | | Year Ended December 31, 2011 | |
| | | Refining | | | Retail | | | Other | | | Total | |
| | | (in millions) | |
Net income (loss) | | $ | 388.2 | | | $ | 14.0 | | | $ | (373.9 | ) | | $ | 28.3 | |
Adjustments: | | | | | | | | | | | | | | | | |
Interest expense | | | — | | | | — | | | | 42.1 | | | | 42.1 | |
Depreciation and amortization | | | 21.5 | | | | 7.2 | | | | 0.8 | | | | 29.5 | |
| | | | | | | | | | | | | | | | |
EBITDA subtotal | | | 409.7 | | | | 21.2 | | | | (331.0 | ) | | | 99.9 | |
Minnesota Pipe Line proportionate EBITDA | | | 2.8 | | | | — | | | | — | | | | 2.8 | |
Turnaround and related expenses | | | 22.6 | | | | — | | | | — | | | | 22.6 | |
Equity-based compensation expense | | | — | | | | — | | | | 1.6 | | | | 1.6 | |
Unrealized losses on derivative activities | | | — | | | | — | | | | 41.9 | | | | 41.9 | |
Contingent consideration income | | | — | | | | — | | | | (55.8 | ) | | | (55.8 | ) |
Formation costs | | | — | | | | — | | | | 7.4 | | | | 7.4 | |
Realized losses on derivative activities | | | — | | | | — | | | | 310.3 | | | | 310.3 | |
| | | | | | | | | | | | | | | | |
Adjusted EBITDA | | $ | 435.1 | | | $ | 21.2 | | | $ | (25.6 | ) | | $ | 430.7 | |
| | | | | | | | | | | | | | | | |
| |
| | | Successor | |
| | | June 23, 2010 (inception date) to December 31, 2010 | |
| | | Refining | | | Retail | | | Other | | | Total | |
| | | (in millions) | |
Net income (loss) | | $ | 9.1 | | | $ | 0.5 | | | $ | 15.2 | | | $ | 24.8 | |
Adjustments: | | | | | | | | | | | | | | | | |
Interest expense | | | — | | | | — | | | | 3.2 | | | | 3.2 | |
Depreciation and amortization | | | 1.7 | | | | 0.5 | | | | — | | | | 2.2 | |
| | | | | | | | | | | | | | | | |
EBITDA subtotal | | | 10.8 | | | | 1.0 | | | | 18.4 | | | | 30.2 | |
Minnesota Pipeline proportionate EBITDA | | | 0.3 | | | | — | | | | — | | | | 0.3 | |
Stock-based compensation expense | | | — | | | | — | | | | 0.1 | | | | 0.1 | |
Unrealized losses on derivative activities | | | — | | | | — | | | | 27.1 | | | | 27.1 | |
Formation costs | | | — | | | | — | | | | 3.6 | | | | 3.6 | |
Bargain purchase gain | | | — | | | | — | | | | (51.4 | ) | | | (51.4 | ) |
| | | | | | | | | | | | | | | | |
Adjusted EBITDA | | $ | 11.1 | | | $ | 1.0 | | | $ | (2.2 | ) | | $ | 9.9 | |
| | | | | | | | | | | | | | | | |
| |
| | | Predecessor | |
| | | Eleven Months Ended November 30, 2010 | |
| | | Refining | | | Retail | | | Other | | | Total | |
| | | (in millions) | |
Net income (loss) | | $ | 142.8 | | | $ | 26.5 | | | $ | (108.3 | ) | | $ | 61.0 | |
Adjustments: | | | | | | | | | | | | | | | | |
Interest expense | | | — | | | | — | | | | 0.3 | | | | 0.3 | |
Income tax provision | | | — | | | | — | | | | 67.1 | | | | 67.1 | |
Depreciation and amortization | | | 24.9 | | | | 12.4 | | | | — | | | | 37.3 | |
| | | | | | | | | | | | | | | | |
EBITDA subtotal | | | 167.7 | | | | 38.9 | | | | (40.9 | ) | | | 165.7 | |
Minnesota Pipeline proportionate EBITDA | | | 3.7 | | | | — | | | | — | | | | 3.7 | |
Turnaround and related expenses | | | 9.5 | | | | — | | | | — | | | | 9.5 | |
Stock-based compensation expense | | | 0.3 | | | | — | | | | — | | | | 0.3 | |
Unrealized losses on derivative activities | | | — | | | | — | | | | 40.9 | | | | 40.9 | |
| | | | | | | | | | | | | | | | |
Adjusted EBITDA | | $ | 181.2 | | | $ | 38.9 | | | $ | — | | | $ | 220.1 | |
| | | | | | | | | | | | | | | | |
66
Other Non-GAAP Performance Measures
Refining gross product margin per barrel, retail fuel gross margin and merchandise margin are non-GAAP performance measures that we believe are important to investors in analyzing our segment performance.
Refining gross product margin per barrel is a financial measurement calculated by subtracting refining costs of sales from total refining revenues and dividing the difference by the total throughput or total refined products sold for the respective periods presented. Refining gross product margin is a non-GAAP performance measure that we believe is important to investors in evaluating our refining performance as a general indication of the amount above our cost of products that we are able to sell refined products. Each of the components used in these calculations (revenues and cost of sales) can be reconciled directly to our statements of operations. Our calculation of refining gross product margin may differ from similar calculations of other companies in our industry, thereby limiting its usefulness as a comparative measure.
The following table shows the reconciliation of refining gross product margin to refining revenue for the periods indicated:
| | | | | | | | | | | | | | | | | | |
| | | Successor | | | | | Predecessor | |
| | | Year Ended December 31, | | | June 23, 2010
(inception date)
to December 31, | | | | | Eleven Months
Ended
November 30, | |
(in millions) | | 2012 | | | 2011 | | | 2010 | | | | | 2010 | |
Refining revenue | | $ | 4,212.6 | | | $ | 3,804.1 | | | $ | 312.2 | | | | | $ | 2,799.8 | |
Refining cost of sales | | | 3,303.7 | | | | 3,208.5 | | | | 287.2 | | | | | | 2,455.9 | |
| | | | | | | | | | | | | | | | | | |
Refining gross product margin | | $ | 908.9 | | | $ | 595.6 | | | $ | 25.0 | | | | | $ | 343.9 | |
| | | | | | | | | | | | | | | | | | |
Retail fuel gross margin and merchandise margin are non-GAAP measures that we believe are important to investors in evaluating our retail segment’s operating results as these measures provide an indication of our performance on significant product categories within the segment. Our calculation of retail fuel gross margin and merchandise margin may differ from similar calculations of other companies in our industry, thereby limiting their usefulness as comparative measures.
The following table shows the reconciliation of retail gross margin to retail segment operating income for the periods indicated:
| | | | | | | | | | | | | | | | | | |
| | | Successor | | | | | Predecessor | |
| | | Year Ended December 31, | | | June 23, 2010
(inception date)
to December 31, | | | | | Eleven Months
Ended
November 30, | |
(in millions) | | 2012 | | | 2011 | | | 2010 | | | | | 2010 | |
Retail gross margin: | | | | | | | | | | | | | | | | | | |
Fuel margin | | $ | 56.1 | | | $ | 66.5 | | | $ | 4.7 | | | | | $ | 54.3 | |
Merchandise margin | | | 86.3 | | | | 86.3 | | | | 6.5 | | | | | | 81.4 | |
Other margin | | | 17.7 | | | | 20.0 | | | | 1.3 | | | | | | 17.7 | |
| | | | | | | | | | | | | | | | | | |
Retail gross margin | | | 160.1 | | | | 172.8 | | | | 12.5 | | | | | | 153.4 | |
Expenses: | | | | | | | | | | | | | | | | | | |
Direct operating expenses | | | 118.8 | | | | 126.6 | | | | 10.2 | | | | | | 94.9 | |
Depreciation and amortization | | | 7.5 | | | | 7.2 | | | | 0.5 | | | | | | 12.4 | |
Selling, general and administrative | | | 25.1 | | | | 25.0 | | | | 1.3 | | | | | | 19.6 | |
| | | | | | | | | | | | | | | | | | |
Retail segment operating income | | $ | 8.7 | | | $ | 14.0 | | | $ | 0.5 | | | | | $ | 26.5 | |
| | | | | | | | | | | | | | | | | | |
Liquidity and Capital Resources
Our primary sources of liquidity have traditionally been cash generated from our operating activities and borrowings under our revolving credit facility. Our ability to generate sufficient cash flows from our operating activities will continue to be primarily dependent on producing or purchasing and selling sufficient quantities of refined products and merchandise at margins sufficient to cover fixed and variable expenses. For discussions on our refinery gross product margin per barrel and retail fuel margin per gallon and merchandise margin for company-operated stores, see “Results of Operations—Refining Segment” and “Results of Operations—Retail Segment,” and for discussions on factors that affect our results of operations, see “Major Influences on Results of Operations.” For more information on our revolving credit facility, see “Description of Our Indebtedness—Senior Secured Asset-Based Revolving Credit Facility.”
67
On July 31, 2012, NTE LP, our parent, closed its initial public offering (“IPO”) of 18,687,500 common units. The net proceeds from the IPO of approximately $230 million, after deducting the underwriting discount and other offering costs of approximately $15 million were contributed by NTE LP to us. We used these proceeds and cash on hand of approximately $56 million to: (i) distribute approximately $124 million to Northern Tier Holdings LLC, of which approximately $92 million was used to redeem Marathon’s existing preferred interest in Northern Tier Holdings LLC and $32 million was distributed to ACON Refining, TPG Refining and entities in which our President and Chief Executive Officer holds an ownership interest, (ii) pay $92 million to J. Aron & Company, an affiliate of Goldman, Sachs & Co., related to deferred payment obligations from the early extinguishment of derivatives, (iii) pay $40 million to Marathon, which represents the cash component of a settlement agreement entered into with Marathon in satisfaction of a contingent consideration arrangement that was part of the Marathon Acquisition, and (iv) redeem $29 million of the 2017 Secured Notes at a redemption price of 103% of the principal amount thereof, plus accrued interest, for an estimated $31 million.
On November 8, 2012, we completed a private placement of the 2020 Secured Notes. We used the net proceeds of the offering and cash on hand of $31 million (i) to repurchase our outstanding 2017 Secured Notes that were tendered pursuant to our previously announced tender offer and (ii) to satisfy and discharge any remaining 2017 Secured Notes outstanding (which notes were called for redemption after the closing of the tender offer) and to pay related fees and expenses. The 2020 Indenture has substantially the same covenants as the 2017 Indenture, except that under the 2020 Indenture we may distribute all of our available cash (as defined in the 2020 Indenture) to our unitholders if we maintain a fixed charge coverage ratio of 1.75 to 1.
Based on current and anticipated levels of operations and conditions in our industry and markets, we believe that cash on hand, together with cash flows from operations and borrowings available to us under our revolving credit facility, will be adequate to meet our ordinary course working capital, capital expenditures, debt service and other cash requirements for at least the next twelve months.
We may use a variety of derivative instruments to enhance the stability of our cash flows. In general, we may attempt to mitigate risks related to the variability of our future cash flow and profitability resulting from changes in applicable commodity prices or interest rates so that we can maintain cash flows sufficient to meet debt service, required capital expenditures and similar requirements. See “Item 7A. Quantitative and Qualitative Disclosures About Market Risk.” During the first quarter of fiscal 2012, we settled contracts covering approximately three million barrels of our remaining 2012 gasoline and diesel production and recognized a loss of approximately $44.6 million. In addition, during the second quarter of 2012, we reset the price of our contracts for the period of July 2012 through December 2012 and recognized a loss of approximately $92.2 million. We used $92 million of NTE LP’s contribution to us of the net proceeds from its initial public offering to settle the majority of these deferred derivative obligations. The remainder of these deferred losses will be paid through the end of 2013. As of December 31, 2012, $28.9 million of this liability remains and is included in current liabilities and $0.9 million remains in long-term liabilities.
Cash Flows
The following table sets forth our cash flows for the periods indicated:
| | | | | | | | | | | | | | | | | | |
| | | Successor | | | | | Predecessor | |
| | | Year Ended December 31, | | | June 23, 2010
(inception date)
to December 31,
2010 | | | | | Eleven Months
Ended
November 30,
2010 | |
(in millions) | | 2012 | | | 2011 | | | | |
Net cash provided by operating activities | | $ | 308.5 | | | $ | 209.3 | | | $ | — | | | | | $ | 145.4 | |
Net cash used in investing activities | | | (28.7 | ) | | | (156.3 | ) | | | (363.3 | ) | | | | | (29.3 | ) |
Net cash provided by (used in) financing activities | | | (130.4 | ) | | | (2.3 | ) | | | 436.1 | | | | | | (115.4 | ) |
| | | | | | | | | | | | | | | | | | |
Net increase in cash and cash equivalents | | | 149.4 | | | | 50.7 | | | | 72.8 | | | | | | 0.7 | |
Cash and cash equivalents at beginning of period | | | 123.5 | | | | 72.8 | | | | — | | | | | | 6.0 | |
| | | | | | | | | | | | | | | | | | |
Cash and cash equivalents at end of period | | $ | 272.9 | | | $ | 123.5 | | | $ | 72.8 | | | | | $ | 6.7 | |
| | | | | | | | | | | | | | | | | | |
Net Cash Provided By Operating Activities. Net cash provided by operating activities for the year ended December 31, 2012 was $308.5 million. The most significant providers of cash were our net income ($199.0 million) adjusted for non-cash adjustments, such as depreciation and amortization expense ($33.2 million), deferred income taxes ($9.8 million), loss on extinguishment of debt ($50.0 million) and contingent consideration loss ($104.3 million). Additionally, cash was provided by increases in accounts payable and accrued expenses ($34.5 million). Offsetting these impacts were unrealized gains from derivative activities ($68.0 million) and increases in accounts receivable ($47.7 million).
Net cash provided by operating activities for the year ended December 31, 2011 was $209.3 million. The most significant providers of cash were our net income ($28.3 million) adjusted for non-cash adjustments, such as depreciation and amortization expense ($29.5 million), unrealized losses from derivative activities ($41.9 million) and non-cash contingent consideration income ($55.8 million). Additionally, cash was provided by decreases in accounts receivable ($18.3 million) and increases in accounts payable and accrued expenses ($146.4 million).
68
Net cash used in operating activities for the 2010 Successor Period was less than $0.1 million. The most significant providers of cash were net income ($24.8 million) and adjustments to reconcile net income to net cash provided from operating activities, such as depreciation and amortization ($2.2 million), unrealized losses from derivative activities ($27.1 million), changes in inventories ($38.6 million) and changes in accounts payable and accrued expenses ($86.4 million). These increases in cash were offset by a net cash outflow from changes in current receivables ($100.2 million), changes in other current assets ($27.7 million) and an adjustment for non-cash bargain purchase gain ($51.4 million).
Net cash provided by operating for the eleven months ended November 30, 2010 was $145.4 million. The most significant providers of cash were net income ($61.0 million) and adjustments to reconcile net income to net cash provided from operating activities, such as depreciation and amortization ($37.3 million), unrealized losses from derivative activities ($40.9 million) and changes in accounts payable and accrued expenses ($23.8 million). These increases in cash were partially offset by a net cash outflow from changes in current receivables ($16.3 million).
Changes in accounts payable and receivable and accrued expenses described above primarily relate to the changes in our total revenue, costs and expenses for such period discussed above under “Results of Operations.” Other factors affecting these changes were not material.
Net Cash Used In Investing Activities. Net cash used in investing activities for the year ended December 31, 2012 was $28.7 million, relating primarily to capital expenditures of $30.9 million. Capital spending for the year ended December 31, 2012 primarily included safety related enhancements and facility improvements at the refinery and retail store locations.
Net cash used in investing activities for the year ended December 31, 2011 was $156.3 million, relating primarily to capital expenditures ($45.9 million) and cash paid to Marathon Oil with respect to a payable related to the Marathon Acquisition ($112.8 million). Capital spending for the year ended December 31, 2011 primarily included a multi-year boiler replacement project at the refinery, safety related enhancements and facility improvements at the refinery and the implementation of our new information and accounting systems.
Net cash used in investing activities for the 2010 Successor Period was $363.3 million, primarily relating to net cash paid for the Marathon Acquisition ($360.8 million).
Net cash used in investing activities for the eleven months ended November 30, 2010 was $29.3 million, primarily relating to capital expenditures ($29.8 million). Capital spending for the eleven months ended November 30, 2010 primarily included ongoing expenditures related to the revamp of the No. 2 crude unit, the multi-year boiler replacement project at the refinery, safety related enhancements and facility improvements at the refinery.
Net Cash Provided By (Used In) Financing Activities. Net cash used in financing activities for the year ended December 31, 2012 was $130.4 million. The contribution of the net proceeds from the NTE LP initial public offering of $230.4 million was the primary source of cash from financing activities. Out of the contribution we received, we repaid $29.0 million of the 2017 Secured Notes and distributed $124.2 million to Northern Tier Holdings LLC. Additionally, during the second quarter of 2012 we made an equity distribution in the amount of $40 million to Northern Tier Holdings LLC. During the fourth quarter of 2012 we refinanced our senior secured notes, retiring our 2017 Secured Notes for their face value of $290 million plus early extinguishment premiums of $39.5 million and we received gross proceeds of $275 million related to the our 2020 Secured Notes. These proceeds were offset by related offering costs of $6.1 million. Additionally, in the fourth quarter of 2012, we issued our initial distribution to unitholders of $136.0 million.
Net cash used in financing activities was $2.3 million for the year ended December 31, 2011, representing tax distributions to our parent. Net cash from financing activities for the 2010 Successor Period were $436.1 million representing borrowings from the 2017 Secured Notes ($290.0 million) and investments from members ($180.2 million) offset by financing costs related to the establishment of our credit facilities ($34.1 million).
Net cash used in financing activities for the eleven months ended November 30, 2010 was $115.4 million representing net distributions to Marathon.
Working Capital
Working capital at December 31, 2012 was $248.0 million, consisting of $599.5 million in total current assets and $351.5 million in total current liabilities. Working capital at December 31, 2012 was impacted by the short-term derivative liability for unrealized losses of $43.7 million related to our crack spread risk management program. The offsetting benefits related to these unrealized losses should be realized over future periods as improved crack spread margins are realized.
Working capital at December 31, 2011 was $77.4 million, consisting of $425.0 million in total current assets and $347.6 million in total current liabilities. The working capital at December 31, 2011 was impacted by the short-term derivative liability for unrealized losses of $109.9 million related to our crack spread risk management program. The offsetting benefits related to these unrealized losses should be realized over future periods as improved crack spread margins are realized.
69
At the closing of the Marathon Acquisition, we entered into a crude oil and supply and logistics agreement with JPM CCC pursuant to which JPM CCC assists us in the purchase of the crude oil requirements of our refinery and provides transportation and other logistical services for delivery of the crude oil to our storage tanks at Cottage Grove, Minnesota, which are approximately two miles from our refinery. In March 2012, we amended and restated the crude oil supply and logistics agreement with JPM CCC. Upon delivery of the crude oil to us we pay JPM CCC the price of the crude oil plus certain agreed fees and expenses. We believe this crude oil supply and logistics agreement significantly reduces our crude inventories and allows us to take title to and price our crude oil at the refinery, as opposed to the crude oil origination point, reducing the time we are exposed to market fluctuations before the finished product output is sold.
Capital Spending
Capital spending was $30.9 million for the year ended December 31, 2012, which primarily included spending to replace or maintain equipment at the refinery, as well as to make safety enhancements. We currently expect to spend approximately $50 to $60 million for non-discretionary capital projects in 2013, including approximately $20-30 million to upgrade our waste water treatment facility. The remaining non-discretionary projects relate to the ongoing replacement spending also referred to as maintenance capital. We also expect to spend approximately $35-40 million on discretionary projects which we estimate will have a payback of less than eighteen months. Included in these discretionary projects is a project for which we expect to spend approximately $29 million to achieve a 10% capacity expansion at our refinery that will also improve distillate recovery by 2-3%.
Capital spending for the year ended December 31, 2011 primarily included a multi-year boiler replacement project at the refinery, safety related enhancements and facility improvements at the refinery and the implementation of our new information and accounting systems. We completed a multi-year boiler replacement project, which entailed $19.9 million of capital expenditures over the project life, $12.7 million during the period from 2008 through November 30, 2010 and $7.2 million during the period from December 1, 2010 through December 31, 2011.
Contractual Obligations and Commitments
We have the following contractual obligations and commitments as of December 31, 2012:
| | | | | | | | | | | | | | | | | | | | |
| | | Less than
1 year | | | 1-3
years | | | 3-5
years | | | More than
5 years | | | Total | |
Long-term debt(1) | | $ | 21.1 | | | $ | 42.2 | | | $ | 41.5 | | | $ | 331.3 | | | $ | 436.1 | |
Lease obligations(2) | | | 23.5 | | | | 46.0 | | | | 43.8 | | | | 163.8 | | | | 277.1 | |
Capital expenditures(3) | | | 36.1 | | | | | | | | | | | | | | | | 36.1 | |
Environmental remediation costs | | | 2.0 | | | | 1.1 | | | | 0.7 | | | | 7.0 | | | | 10.8 | |
| (1) | Long-term debt represents (i) the repayment of the $275 million of the 2020 Secured Notes at their 2020 maturity date, (ii) cash interest payments for the 2020 Secured Notes through the 2020 maturity date and (iii) commitment fees of 0.5% on an assumed $300 million undrawn balance under our revolving credit facility with a maturity date of 2017. |
| (2) | Lease obligations represent payments for a variety of facilities and equipment under lease, including existing real property leases and payments pursuant to our lease arrangement with Realty Income, office equipment and vehicles, including trucks to transport crude oil, as well as rail tracks for storage of rail tank cars near the refinery and numerous rail tank cars. |
| (3) | Capital expenditures represent our contractual commitments to acquire property, plant and equipment. |
Off-Balance Sheet Arrangements
In connection with the closing of the Marathon Acquisition, we entered into a lease arrangement with Realty Income, pursuant to which we leased 135 SuperAmerica convenience stores and one support facility over a 15-year initial term at an aggregate annual rent fixed for five years at an annual rate of $20.3 million, with consumer price index-based rent increases thereafter.
Description of Our Indebtedness
Senior Secured Asset-Based Revolving Credit Facility
At the closing of the Marathon Acquisition, we and certain of our subsidiaries (the “ABL Borrowers”) entered into an asset-backed lending facility with JP Morgan Chase Bank, N.A. as administrative agent and collateral agent (the “ABL Agent”), Bank of America, N.A., as syndication agent, and lenders party thereto. On July 17, 2012, we entered into an amendment of this asset-backed lending facility. Our revolving credit facility provides for revolving credit financing through July 17, 2017 in an aggregate principal amount of up to $300 million (of which $150 million may be utilized for the issuance of letters of credit and up to $30 million may be short-term borrowings upon same-day notice, referred to as swingline loans) and may be increased up to a maximum aggregate principal amount of $450 million, subject to borrowing base availability and lender approval. Availability under our revolving credit facility at any time will be the lesser of (a) the aggregate commitments under our revolving credit facility and (b) the borrowing base, less any outstanding borrowings and letters of credit. The borrowing base is calculated based on a percentage of eligible accounts receivable, petroleum inventory and other assets.
70
Borrowings under our revolving credit facility bear interest, at our option, at either (a) an alternative base rate, plus an applicable margin (ranging between 1.00% and 1.50%) or (b) a LIBOR rate plus an applicable margin (ranging between 2.00% and 2.50%). The alternative base rate is the greater of (a) the prime rate, (b) the Federal Funds Effective Rate plus 50 basis points, or (c) the one-month LIBOR rate plus 100 basis points and a spread of up to 150 basis points based upon percentage utilization of this facility. In addition to paying interest on outstanding borrowings, we are also required to pay an annual commitment fee ranging from 0.375% to 0.500% and letter of credit fees.
As of December 31, 2012 and 2011, the availability under our revolving credit facility was $131.9 million and $108.0 million, respectively. This availability is net of $36.5 million and $61.6 million in outstanding letters of credit as of December 31, 2012 and 2011, respectively. We had no borrowings under our revolving credit facility at either December 31, 2012 or 2011.
In order to borrow under our revolving credit facility, if the amount available under our revolving credit facility is less than the greater of (i) 12.5% of the lesser of (x) the $300 million commitment amount and (y) the then-applicable borrowing base and (ii) $22.5 million, the ABL Borrowers must comply with a minimum fixed charge coverage ratio of at least 1.0 to 1.0. As of December 31, 2012, the most recent determination date, the fixed charge coverage ratio was 7.9 to 1.0.
Our revolving credit facility contains a negative covenant restricting the ABL Borrowers’ ability to incur additional debt, subject to certain exceptions, including, but not limited to, the following:
| | • | | indebtedness existing under our revolving credit facility or that was existing as of December 1, 2010, as set forth in our revolving credit facility; |
| | • | | intercompany indebtedness, provided that such indebtedness would be permitted as an investment under our revolving credit facility, such indebtedness is evidenced by an intercompany note in the specified form or such indebtedness was in existence as of December 1, 2010 and such indebtedness is evidenced by an intercompany note; |
| | • | | certain guarantees by the ABL Borrowers and their affiliates; |
| | • | | indebtedness incurred exclusively to finance the acquisition, lease, construction, repair, renovations, replacement, expansion or improvement of any fixed or capital assets or otherwise incurred in respect of capital expenditures, not to exceed the greater of (i) $20 million and (ii) 2.5% of the ABL Borrowers’ total assets (in each case determined as of the date of incurrence); |
| | • | | the extension, refinancing, refunding, replacement or renewal of any permitted indebtedness, subject to certain exceptions, as described in our revolving credit facility; |
| | • | | indebtedness incurred by us, or any of our subsidiaries, with respect to letters of credit, bank guarantees, bankers’ acceptances, warehouse receipts, or similar instruments issued or created in the ordinary course of business, provided that upon the drawing of such letters of credit or the incurrence of such indebtedness, such obligations are reimbursed within 30 days following such drawing or incurrence; |
| | • | | indebtedness of an entity that becomes a subsidiary after December 1, 2010 and indebtedness acquired or assumed in connection with acquisitions permitted under our revolving credit facility, so long as (i) such indebtedness exists at the time such entity becomes a subsidiary or at the time of such permitted acquisition and is not created in contemplation of or in connection with a permitted acquisition and (ii) such indebtedness is not guaranteed by us or our subsidiaries; |
| | • | | indebtedness of any of our subsidiaries issued or incurred to finance acquisitions permitted under our revolving credit facility, subject to certain exceptions as described in our revolving credit facility; |
| | • | | indebtedness and guarantees with respect to the 2020 Secured Notes in an aggregate principal amount that is not in excess of $275 million; |
| | • | | other indebtedness in an aggregate principal amount not exceeding $50 million; and |
| | • | | unsecured subordinated indebtedness of ours or any subsidiary and any other unsecured indebtedness so long as at the time of any such incurrence and after giving pro forma effect to such incurrence, there is excess availability under our revolving credit facility equal to or in excess of the greater of (a) 17.5% of the lesser of (x) the revolving credit commitment under our revolving credit facility and (y) the borrowing base under our revolving credit facility and (b) $26.25 million. |
In addition, our revolving credit facility contains negative covenants that restrict the ABL Borrowers ability to, among other things, incur certain additional debt, grant certain liens, enter into certain guarantees, enter into certain mergers, make certain loans and investments, dispose of certain assets, prepay certain debt, make cash distributions, modify certain material agreements or organizational documents, or change the business we conduct.
71
Our revolving credit facility also contains certain customary representations and warranties, affirmative covenants and events of default. Events of default include, among other things, payment defaults, breach of representations and warranties, covenant defaults, cross-defaults and cross-acceleration to certain indebtedness, certain events of bankruptcy, certain events under ERISA, material judgments, actual or asserted failure of any guaranty or security document supporting our revolving credit facility to be in full force and effect, and change of control. If such an event of default occurs, the lenders under our revolving credit facility would be entitled to take various actions, including the acceleration of amounts due under our revolving credit facility and all actions permitted to be taken by a secured creditor.
2020 Secured Notes
On November 8, 2012, we and Northern Tier Finance Corporation (together the “Notes Issuers”), privately placed $275 million in aggregate principal amount of 7.125% senior secured notes due 2020. The proceeds from the offering of the 2020 Secured Notes and cash on hand of $31 million were used to repurchase the 2017 Secured Notes tendered pursuant to the tender offer for the 2017 Secured Notes and to satisfy and discharge any remaining 2017 Secured Notes outstanding after completion of the tender offer and to pay related fees and expenses. Deutsche Bank Trust Company Americas acts as trustee for the 2020 Secured Notes.
The Notes Issuers’ obligations under the 2020 Secured Notes are fully and unconditionally guaranteed, jointly and severally, on a senior unsecured basis by Northern Tier Energy LP and on a senior secured basis by (i) all of our restricted subsidiaries that borrow, or guarantee obligations, under our senior secured asset-backed revolving credit facility or any other indebtedness of ours or of our subsidiaries that guarantees the 2020 Secured Notes and (ii) all other of our subsidiaries. The 2020 Secured Notes and the subsidiary note guarantees are secured, subject to permitted liens, on a pari passu basis with certain hedging agreements by (a) a first-priority security interest in substantially all present and hereinafter acquired tangible and intangible assets of the Notes Issuers and each of the subsidiary guarantors in which liens have been granted in relation to the 2020 Secured Notes (other than those items described in clause (b) below) (the “Notes Priority Collateral”), and (b) a second-priority security interest in the (i) inventory, (ii) accounts receivable, (iii) investment property, general intangibles, deposit accounts, cash and cash equivalents and other assets to the extent related to the assets described in clauses (i) and (ii), (iv) books and records relating to the foregoing and (v) all proceeds of and supporting obligations, including letter of credit rights, with respect to the foregoing, and all collateral security and guarantees of any person with respect to the foregoing (the “ABL Priority Collateral”), in each case owned or hereinafter acquired by the Notes Issuers and each of the subsidiary guarantors.
The 2020 Secured Notes are the Notes Issuers’ general senior secured obligations that are effectively subordinated to the Notes Issuers’ obligations under our revolving credit facility to the extent of the value of the ABL Priority Collateral that secures such obligations on a first-priority basis, effectively senior to the Notes Issuers’ obligations under our revolving credit facility to the extent of the Notes Priority Collateral that secures the 2020 Secured Notes on a first-priority basis, structurally subordinated to any existing and future indebtedness and claims of holders of preferred stock and other liabilities of the Notes Issuers’ direct or indirect subsidiaries that are not guarantors of the 2020 Secured Notes (other than Northern Tier Finance Corporation), and pari passu in right of payment with all of the Notes Issuers’ existing and future indebtedness that is not subordinated. The 2020 Secured Notes rank effectively senior to all of the Notes Issuers’ existing and future unsecured indebtedness to the extent of the value of the collateral, effectively equal to the obligations under certain hedge agreements and any future indebtedness which is permitted to be secured on a pari passu basis with the 2020 Secured Notes to the extent of the value of the collateral and senior in right of payment to any future subordinated indebtedness of the Notes Issuers.
At any time prior to November 15, 2015, the Notes Issuers may, on any one or more occasions, upon not less than 30 nor more than 60 days’ notice, redeem up to 35% of the aggregate principal amount of 2020 Secured Notes issued under the indenture (together with any additional notes) at a redemption price of 107.125% of the principal amount thereof, plus accrued and unpaid interest thereon to, but excluding, the applicable redemption date, with all or a portion of the net cash proceeds of one or more qualified equity offerings; provided that (1) at least 65% of the aggregate principal amount of the 2020 Secured Notes issued under the indenture (including any additional notes) remains outstanding immediately after the occurrence of such redemption (excluding notes held by the Notes Issuers and their subsidiaries); and (2) the redemption must occur within 90 days of the date of the closing of such qualified equity offering.
At any time prior to November 15, 2015, the Notes Issuers may, on any one or more occasions, redeem all or a part of the 2020 Secured Notes, upon not less than 30 nor more than 60 days’ notice, at a redemption price equal to 100% of the principal amount of the 2020 Secured Notes redeemed, plus an applicable make-whole premium as of, and accrued and unpaid interest to, but excluding, the date of redemption, subject to the rights of holders of the 2020 Secured Notes on the relevant record date to receive interest due on the relevant interest payment date.
Except pursuant to the preceding paragraphs, the 2020 Secured Notes will not be redeemable at the Notes Issuers’ option prior to November 15, 2015.
72
On or after November 15, 2015, the Notes Issuers may redeem all or a part of the 2020 Secured Notes, upon not less than 30 nor more than 60 days’ notice, at the redemption prices (expressed as percentages of principal amount) set forth below plus accrued and unpaid interest thereon to, but excluding, the applicable redemption date, if redeemed during the 12-month period beginning on November 15 of the years indicated below, subject to the rights of holders of the 2020 Secured Notes on the relevant record date to receive interest on the relevant interest payment date:
| | | | |
Year | | Percentage | |
2015 | | | 105.344 | % |
2016 | | | 103.563 | % |
2017 | | | 101.781 | % |
2018 and thereafter | | | 100.000 | % |
The indenture governing the 2020 Secured Notes contains certain covenants that, among other things, limit our ability and the ability of our restricted subsidiaries to, subject to certain exceptions:
| | • | | incur, assume or guarantee additional debt or issue redeemable stock and preferred stock if our fixed charge coverage ratio, after giving effect to the issuance, assumption or guarantee of such additional debt or the issuance of such redeemable stock or preferred stock, for the most recently ended four full fiscal quarters would have been less than 2.0 to 1.0; |
| | • | | declare or pay dividends on or make any other payment or distribution on account of our or any of our restricted subsidiaries’ equity interests; |
| | • | | make any payment with respect to, or purchase, repurchase, redeem, defease or otherwise acquire or retire for value our equity interests; |
| | • | | purchase, repurchase, redeem, defease or otherwise acquire or retire for value or give any irrevocable notice of redemption with respect to certain subordinated debt; |
| | • | | make certain investments, loans and advances; |
| | • | | sell, lease or transfer any of our property or assets; |
| | • | | merge, consolidate, lease or sell substantially all of our assets; |
| | • | | create, incur, assume or otherwise cause or suffer to exist or become effective any lien; |
| | • | | conduct any business or enter into or permit to exist any contract or transaction with any affiliate involving aggregate payments or consideration in excess of $5.0 million; |
| | • | | suffer a change of control; |
| | • | | enter into new lines of business; and |
| | • | | enter into agreements that restrict distributions from certain subsidiaries. |
The 2020 Secured Notes also provide for events of default which, if any of them occurs, would permit or require the principal of and accrued interest on such notes to become or to be declared to be due and payable.
Inflation
Inflation in the United States has been relatively low in recent years and did not have a material impact on our results of operations for the years ended December 31, 2012 and 2011, the period from inception (June 23, 2010) to December 31, 2010 and the eleven months ended November 30, 2010. Although the impact of inflation has been insignificant in recent years, it is still a factor in the United States economy.
Critical Accounting Policies and Estimates
The discussion and analysis of our financial condition and results of operations are based upon our consolidated financial statements, which have been prepared in accordance with accounting principles generally accepted in the United States. The preparation of our financial statements requires us to make estimates and assumptions that affect the reported amounts of assets, liabilities, revenues and expenses and related disclosure of contingent assets and liabilities. Certain accounting policies involve judgments and uncertainties to such an extent that there is reasonable likelihood that materially different amounts could have been reported under different conditions, or if different assumptions had been used. We evaluate our estimates and assumptions on a regular basis. We base our estimates on historical experience and various other assumptions that are believed to be reasonable under the circumstances, the results of which form the basis for making judgments about the carrying values of assets and liabilities that are not readily apparent from other sources. Actual results may differ from these estimates and assumptions used in preparation of our consolidated financial statements. We provide expanded discussion of our more significant accounting policies, estimates and
73
judgments below. We believe these accounting policies reflect our more significant estimates and assumptions used in preparation of our consolidated financial statements. See Note 2 to our audited financial statements for a discussion of additional accounting policies and estimates made by management.
Contingent Consideration and Margin Support Arrangements
We entered into a contingent consideration agreement with Marathon as part of the Marathon Acquisition. This agreement would have required us to make earn-out payments to Marathon if the Agreement Adjusted EBITDA exceeded $165 million, less, among other things, any rental expense accrued pursuant to the sale leaseback arrangement with Realty Income, during any year in each of the eight years following the Marathon Acquisition. Agreement Adjusted EBITDA adjusts for, among other items, (i) any unrealized gains or losses relating to derivative activities, (ii) any gains or losses generated by the liquidation of any LIFO inventory layers, (iii) any losses related to lower of cost or market inventory adjustments, and (iv) any gains on the sale of property, plant or equipment and certain other assets. Specifically, we would have been required to pay Marathon 40% of the amount by which Agreement Adjusted EBITDA exceeded the specified threshold, not to exceed $125 million over the eight years following the Marathon Acquisition. The Marathon Acquisition agreements also included a margin support component that would have required Marathon to pay us up to $30 million per year to the extent the Agreement Adjusted EBITDA had been $145 million, less, among other things, any rental expense accrued pursuant to the sale leaseback arrangement with Realty Income, in either of the twelve-month periods ending November 30, 2011 or 2012 up to a maximum of $60 million. Any such payments made by Marathon would have increased the amount that we would have been required to pay Marathon over the earn-out period. Subsequent fair value adjustments to these collective contingent consideration arrangements (earn-out arrangement and margin support arrangement) would have been recorded in the statement of operations based on quarterly remeasurements. These subsequent fair value adjustments would have been made based on our estimates of the Agreement Adjusted EBITDA expected over the earn-out period. As such, there were inherent risks related to the accuracy of such estimates. See Note 14 to our audited financial statements for further information on our fair value measurements.
On May 4, 2012, we entered into a settlement agreement with Marathon under the terms of which Marathon received $40 million of the net proceeds from NTE LP’s initial public offering, which NTE LP contributed to us, and Northern Tier Holdings LLC redeemed Marathon’s existing preferred interest with a portion of the contributed net proceeds from NTE LP’s initial public offering and issued Marathon a new $45 million preferred interest in Northern Tier Holdings LLC, in consideration for relinquishing all claims with respect to earn-out payments under the contingent consideration agreement. We also agreed, pursuant to the settlement agreement, to relinquish all claims to margin support payments under the contingent consideration agreement.
Investment in the Minnesota Pipe Line Company and MPL Investments
Our 17% common interest in the Minnesota Pipe Line Company is accounted for using the equity method of accounting and carried at our share of net assets in accordance with the Financial Accounting Standards Board, or the FASB, Accounting Standards Codification paragraph 323-30-35-3. Income from equity method investment represents our proportionate share of net (loss) earnings attributed to common owners generated by the Minnesota Pipe Line Company.
The equity method investment is assessed for impairment whenever changes in the facts and circumstances indicate a loss in value has occurred. When the loss is deemed to be other than temporary, the carrying value of the equity method investment is written down to fair value, and the amount of the write-down is included in net (loss) earnings.
The investment in MPL Investments, over which we do not have significant influence and whose stock does not have a readily determinable fair value, is carried at cost. MPL Investments owns all of the preferred membership units of the Minnesota Pipe Line Company. Dividends received from MPL Investments are recorded as return of capital from cost method investment and in other income.
Inventories
Inventories are carried at the lower of cost or net realizable value. Cost of inventories is determined primarily under the LIFO method. The refining segment has a LIFO pool for crude oil and refinery feedstocks and a separate LIFO pool for refined products. The retail segment has a LIFO pool for refined products for inventory held by the retail stores. We maintain other inventories in the retail segment whose cost is primarily determined using the first-in, first-out (“FIFO”) method.
Intangible Assets
Intangible assets primarily include a retail marketing trade name, franchise agreements, refinery licensed technology agreements and refinery permits and plans. The marketing trade name has an indefinite life and therefore is not amortized, but rather is tested for impairment annually and when events or changes in circumstances indicate that the fair value of the intangible asset has been reduced below carrying value. The other intangibles are amortized on a straight-line basis over the expected remaining lives of the related contracts, as applicable, which range from 8 to 15 years. Amortized intangible assets are reviewed for impairment whenever events or
74
changes in circumstances indicate that the carrying amount of an asset may not be recoverable. If the sum of the expected undiscounted future cash flows from the use of the asset and its eventual disposition is less than the carrying amount of the asset, an impairment loss is recognized based on the fair value of the asset.
Major Maintenance Activities
We incur costs for planned major refinery maintenance, referred to as “turnarounds.” These types of costs include contractor repair services, materials and supplies, equipment rentals and labor costs. Such costs are expensed in the period incurred.
Environmental Costs
Environmental expenditures are capitalized if the costs mitigate or prevent future contamination or if the costs improve environmental safety or efficiency of the existing assets. We provide for remediation costs and penalties when the responsibility to remediate is probable and the amount of associated costs can be reasonably estimated. The timing of remediation accruals coincides with completion of a feasibility study or the commitment to a formal plan of action. Remediation liabilities are accrued based on estimates of known environmental exposure and are discounted when the estimated amounts are reasonably fixed and determinable. If recoveries of remediation costs from third parties are probable, a receivable is recorded and is discounted when the estimated amount is reasonably fixed and determinable.
Asset Retirement Obligations
The fair value of asset retirement obligations is recognized in the period in which the obligations are incurred if a reasonable estimate of fair value can be made. A conditional asset retirement obligation for removal and disposal of fire-retardant material from certain refining assets has been recognized. The amounts recorded for this obligation is based on the most probable current cost projections. Asset retirement obligations have not been recognized for the removal of materials and equipment from or the closure of certain refinery, pipeline, terminal and retail marketing assets because the fair value cannot be reasonably estimated since the settlement dates of the obligations are indeterminable.
Current inflation rates and credit-adjusted-risk-free interest rates are used to estimate the fair value of asset retirement obligations. Depreciation of capitalized asset retirement costs and accretion of asset retirement obligations are recorded over time. Depreciation is determined on a straight-line basis, while accretion escalates over the lives of the assets.
Derivative Financial Instruments
We are exposed to earnings and cash flow volatility based on the timing and change in refined product prices versus crude oil prices. To manage these risks, we may use derivative instruments associated with the purchase or sale of crude oil and refined products. Crack spread option contracts may be used to hedge the volatility of refining margins. We also may use futures contracts to manage price risks associated with inventory quantities above or below target levels. We have not designated any derivative instruments as hedges for accounting purposes and we do not enter into derivative contracts for speculative purposes. All derivative instruments are recorded in the consolidated balance sheet at fair value and are classified depending on the maturity date of the underlying contracts. Changes in the fair value of its contracts are accounted for by marking them to market and recognizing any resulting gains or losses in its statements of operations. These gains or losses are reported within operating activities on the consolidated statement of cash flows.
Income Taxes
Effective August 1, 2012, Northern Tier Retail Holdings LLC elected to be treated as a corporation for income tax purposes in order to preserve the master limited partnership tax status of Northern Tier Energy LP. As such, we recorded deferred tax assets and deferred tax liabilities as of the election date. Additionally, we recorded deferred income tax charges for the period from August 1, 2012 through December 31, 2012 at the Northern Tier Retail Holdings LLC level. Prior to August 1, 2012, all of our income was derived from subsidiaries which were limited liability companies and were therefore pass-through entities for federal income tax purposes. As a result, we did not incur federal income taxes prior to this date. Prior to the Marathon Acquisition, our taxable income was historically included in the consolidated U.S. federal income tax returns of Marathon and also in a number of state income tax returns, which were filed as consolidated returns.
Prior to the Marathon Acquisition, the provision for income taxes was computed as if we were a standalone tax-paying entity and as if we paid the amount of our current federal and state tax liabilities to Marathon in each period. As such, the accrual and payment of the current federal and state tax liabilities is recorded within the net investment in the combined financial statements in the period incurred.
Prior to the Marathon Acquisition, deferred tax assets and liabilities were recognized based on temporary differences between the financial statement carrying amounts of our assets and liabilities and their tax bases as reported in Marathon’s tax filings with the
75
respective taxing authorities. The realization of deferred tax assets was assessed periodically based on several interrelated factors. These factors included the expectation to generate sufficient future taxable income in order to utilize tax credits and operating loss carry-forwards.
Recent Accounting Pronouncements
In July 2012, the FASB issued Accounting Standards Update (“ASU”) No. 2012-02, “Intangibles—Goodwill and other” (“ASU 2012-02”). ASU 2012-02 provides guidance on annual impairment testing of indefinite-lived intangible assets. The standards update allows an entity to first assess qualitative factors to determine if it is more likely than not that the fair value of an indefinite-lived intangible asset is less than its carrying amount. If based on its qualitative assessment an entity concludes it is more likely than not that the fair value of an indefinite-lived intangible asset is less than its carrying amount, quantitative impairment testing is required. However, if an entity concludes otherwise, quantitative impairment testing is not required. The standards update is effective for annual and interim impairment tests performed for fiscal years beginning after September 15, 2012, with early adoption permitted. We believe that the adoption of ASU 2012-02 will not have a material impact on our consolidated financial statements.
In December 2011, the FASB issued ASU No. 2011-11, “Disclosures about Offsetting Assets and Liabilities” (“ASU 2011-11”) and in January 2013 issued ASU No. 2013-01 “Clarifying the Scope of Disclosures About Offsetting Assets and Liabilities.” These standards retain the existing offsetting requirements and enhances the disclosure requirements to allow investors to better compare financial statements prepared under U.S. GAAP with those prepared under IFRS. This new guidance is to be applied retrospectively. ASU 2011-11 will be effective for our quarterly and annual financial statements beginning with the first quarter of 2013. We believe that the adoption of ASU 2011-11 will not have a material impact on our consolidated financial statements.
| Item 7A. | Quantitative and Qualitative Disclosures About Market Risk. |
We are exposed to various market risks, including changes in commodity prices and interest rates. We may use financial instruments such as puts, calls, swaps, forward agreements and other financial instruments to mitigate the effects of the identified risks. In general, we may attempt to mitigate risks related to the variability of our future cash flow and profitability resulting from changes in applicable commodity prices or interest rates so that we can maintain cash flows sufficient to meet debt service, required capital expenditures and similar requirements.
Commodity Price Risk
As a refiner of petroleum products, we have exposure to market pricing for products sold in the future. In order to realize value from our processing capacity, we must achieve a positive spread between the cost of raw materials and the value of finished products (i.e., refinery gross product margin or crack spread). The physical commodities that comprise our raw materials and finished goods are typically bought and sold at a spot or index price that can be highly variable. The timing, direction and overall change in refined product prices versus crude oil prices will impact profit margins and could have a significant impact on our earnings and cash flows. Assuming all other factors remained constant, a $1 per barrel change in our average refinery gross product margin, based on our average refinery throughput for the year ended December 31, 2012 of 83,851 bpd, would result in a change of $30.7 million in our overall gross margin.
The prices of crude oil, refined products and other commodities are subject to fluctuations in response to changes in supply, demand, market uncertainty and a variety of additional factors that are beyond our control. We monitor these risks and, where appropriate under our risk mitigation policy, we will seek to reduce the volatility of our cash flows by hedging an operationally reasonable volume of our gasoline and diesel production. We enter into derivative transactions designed to mitigate the impact of commodity price fluctuations on our business by locking in or fixing a percentage of the anticipated or planned gross margin in future periods. We will not enter into financial instruments for purposes of speculating on commodity prices. However, we may execute derivative financial instruments pursuant to our hedging policy that are not considered to be hedges within the applicable accounting guidelines.
In addition, the crude oil supply and logistics agreement with JPM CCC allows us to take title to, and price, our crude oil at the refinery, as opposed to the crude oil origination point, reducing the time we are exposed to market fluctuations before the finished refined products are sold. Furthermore, this agreement enables us to mitigate potential working capital fluctuations relating to crude oil price volatility.
Basis Risk
The effectiveness of our risk mitigation strategies is dependent upon the correlation of the price index utilized for the hedging activity and the cash or spot price of the physical commodity for which price risk is being mitigated. Basis risk is a term we use to define that relationship. Basis risk can exist due to several factors, for example the location differences between the derivative instrument and the underlying physical commodity. Our selection of the appropriate index to utilize in a hedging strategy is a prime
76
consideration in our basis risk exposure. In hedging NYMEX or U.S. Gulf Coast (or any other relevant benchmark) crack spreads, we experience location basis as the settlement price of NYMEX refined products (related more to New York Harbor cash markets) or U.S. Gulf Coast refined products (related more to U.S. Gulf Coast cash markets) may be different than the prices of refined products in our Upper Great Plains pricing area. The risk associated with not hedging the basis when using NYMEX or U.S. Gulf Coast forward contracts to fix future margins is if the crack spread increases based on prices traded on NYMEX or U.S. Gulf Coast while pricing in our market remains flat or decreases, then we would be in a position to lose money on the derivative position while not earning an offsetting additional margin on the physical position based on the pricing in our market. Assuming all other factors remained constant, a $1 per barrel change in our gasoline and distillate basis would result in an annual change of $14.9 million and $9.9 million in our gross product margin on gasoline and distillate sales, respectively, based on our average refinery production for the year ended December 31, 2012 of 40,825 bpd and 27,113 bpd, respectively.
Commodities Price and Basis Risk Management Activities
We have entered into agreements that govern all cash-settled commodity transactions that we enter into with J. Aron & Company and Macquarie Bank Limited for the purpose of managing our risk with respect to the crack spread created by the purchase of crude oil for future delivery and the sale of refined petroleum products, including gasoline, diesel, jet fuel and heating fuel, for future delivery. Under the agreements, as market conditions permit, we have the capacity to mitigate our crack spread risk with respect to reasonable percentages of the refinery’s projected monthly production of some or all of these refined products. As of December 31, 2012, we have hedged approximately five million barrels of future gasoline and diesel production under commodity derivatives contracts that are either exchange-traded contracts in the form of futures contracts or over-the-counter contracts in the form of commodity price swaps that reference benchmark indices such as NYMEX or U.S. Gulf Coast. Our hedge positions for 2011 and 2012 production were established at the time of the Marathon Acquisition, and our plan is to hedge a lesser amount of the production than we hedged at the time of the acquisition. Consequently, we plan to increase our exposure to the gross refining margins that we would realize at our refinery on an unhedged basis over time.
Our open positions at December 31, 2012 will expire at various times during 2013. We prepared a sensitivity analysis to estimate our exposure to market risk associated with our derivative instruments. This analysis may differ from actual results. Based on our open positions of five million barrels, a $1.00 per barrel change in quoted market prices of our derivative instruments, assuming all other factors remain constant, could change the fair value of our derivative instruments and our net (loss) earnings by approximately $5 million.
We may enter into additional futures derivatives contracts at times when we believe market conditions or other circumstances suggest that it is prudent to do so. Although we have historically been hedged at higher levels of expected production, we intend to hedge significantly less than what we hedged at the time of the Marathon Acquisition on an ongoing basis. We may use commodity derivatives contracts such as puts, calls, swaps, forward agreements and other financial instruments to mitigate the effects of the identified risks; however, it is our plan to hedge a lesser amount of production than we historically have, which will increase our exposure to the gross refining margins that we would realize at our refinery on an unhedged basis. Additionally, we may take advantage of opportunities to modify our derivative portfolio to change the percentage of our hedged refined product volumes when circumstances suggest that it is prudent to do so.
Interest Rate Risk
As of December 31, 2012 and 2011, the availability under our revolving credit facility was $131.9 million and $108.0 million, respectively. This availability is net of $36.5 million and $61.6 million in outstanding letters of credit as of December 31, 2012 and 2011, respectively. We had no borrowings under our revolving credit facility at December 31, 2012 or 2011. Borrowings under our revolving credit facility bear interest, at our election, at either an alternative base rate, plus an applicable margin (which ranges between 1.00% and 1.50% pursuant to a grid based on average excess availability) or a LIBOR rate, plus an applicable margin (which ranges between 2.00% and 2.50% pursuant to a grid based on average excess availability). See “Item 7. Management’s Discussion and Analysis of Financial Condition and Results of Operations—Liquidity and Capital Resources—Description of Our Indebtedness—Senior Secured Asset-Based Revolving Credit Facility.”
We have interest rate exposure on a portion of the cost of crude oil payable to JPM CCC for the crude oil inventory that they purchase for delivery to our refinery under the crude oil supply and logistics agreement. This exposure is offset with the credits we receive from JPM CCC for the trade terms granted by suppliers to them on crude oil purchases intended for our refinery. Our interest rate exposure is the spread between 3-months and 1-month LIBOR. A widening of the spread between these two rates may result in a higher cost of crude oil to us.
Credit Risk
We are subject to risk of losses resulting from nonpayment or nonperformance by our wholesale refining customers. We will continue to closely monitor the creditworthiness of customers to whom we grant credit and establish credit limits in accordance with our credit policy.
77
| Item 8. | Financial Statements and Supplementary Data. |
NORTHERN TIER ENERGY LLC
Index to Financial Statements
Northern Tier Energy LLC (Successor) and St. Paul Park Refinery and Retail Marketing Business (Predecessor)
Consolidated Financial Statements for the Years Ended December 31, 2012 and 2011 and from June 23, 2010 (inception date) to December 31, 2010 and Combined Financial Statements for the Eleven Months Ended November 30, 2010
78
Report of Independent Registered Public Accounting Firm
To the Board of Directors of Northern Tier Energy LLC:
In our opinion, the accompanying consolidated balance sheets and the related consolidated and combined statements of operations and comprehensive income, cash flows and member’s interest and net investment present fairly, in all material respects, the financial position of Northern Tier Energy LLC and its subsidiaries at December 31, 2012 and 2011, and the results of their operations and their cash flows for the years ended December 31, 2012 and 2011 and for the period from June 23, 2010 (date of inception) to December 31, 2010 in conformity with accounting principles generally accepted in the United States of America. These financial statements are the responsibility of the Company’s management. Our responsibility is to express an opinion on these financial statements based on our audits. We conducted our audits of these statements in accordance with the standards of the Public Company Accounting Oversight Board (United States). Those standards require that we plan and perform the audit to obtain reasonable assurance about whether the financial statements are free of material misstatement. An audit includes examining, on a test basis, evidence supporting the amounts and disclosures in the financial statements, assessing the accounting principles used and significant estimates made by management, and evaluating the overall financial statement presentation. We believe that our audits provide a reasonable basis for our opinion.
|
/s/ PricewaterhouseCoopers LLP |
|
| PricewaterhouseCoopers LLP |
| Houston, Texas |
| April 1, 2013 |
79
Report of Independent Registered Public Accounting Firm
To Marathon Oil Corporation:
In our opinion, the accompanying combined statements of operations and comprehensive income, cash flows and net investment present fairly, in all material respects, the results of operations and cash flows of the St. Paul Refinery & Retail Marketing Business, a component of Marathon Oil Corporation, for the eleven month period ended November 30, 2010 in conformity with accounting principles generally accepted in the United States of America. These combined financial statements are the responsibility of management. Our responsibility is to express an opinion on these combined financial statements based on our audit. We conducted our audit of these statements in accordance with the standards of the Public Company Accounting Oversight Board (United States). Those standards require that we plan and perform the audit to obtain reasonable assurance about whether the financial statements are free of material misstatement. An audit includes examining, on a test basis, evidence supporting the amounts and disclosures in the financial statements, assessing the accounting principles used and significant estimates made by management, and evaluating the overall financial statement presentation. We believe that our audit provides a reasonable basis for our opinion.
|
/s/ PricewaterhouseCoopers LLP |
|
| PricewaterhouseCoopers LLP |
| Houston, Texas |
April 12, 2011, except for the change in the composition of reportable segments discussed in Note 21 to the combined financial statements, as to which the date is December 12, 2011.
80
NORTHERN TIER ENERGY LLC
CONSOLIDATED BALANCE SHEETS
(in millions, except unit data)
| | | | | | | | |
| | | December 31,
2012 | | | December 31,
2011 | |
ASSETS | | | | | | | | |
CURRENT ASSETS | | | | | | | | |
Cash and cash equivalents | | $ | 272.9 | | | $ | 123.5 | |
Receivables, less allowance for doubtful accounts | | | 129.3 | | | | 81.9 | |
Inventories | | | 162.4 | | | | 154.1 | |
Other current assets | | | 34.9 | | | | 65.5 | |
| | | | | | | | |
Total current assets | | | 599.5 | | | | 425.0 | |
NON-CURRENT ASSETS | | | | | | | | |
Equity method investment | | | 87.5 | | | | 89.9 | |
Property, plant and equipment, net | | | 386.0 | | | | 391.2 | |
Intangible assets | | | 35.4 | | | | 35.4 | |
Other assets | | | 29.8 | | | | 57.3 | |
| | | | | | | | |
Total Assets | | $ | 1,138.2 | | | $ | 998.8 | |
| | | | | | | | |
LIABILITIES AND EQUITY | | | | | | | | |
CURRENT LIABILITIES | | | | | | | | |
Accounts payable | | $ | 230.4 | | | $ | 207.4 | |
Accrued liabilities | | | 77.4 | | | | 30.3 | |
Derivative liability | | | 43.7 | | | | 109.9 | |
| | | | | | | | |
Total current liabilities | | | 351.5 | | | | 347.6 | |
NON-CURRENT LIABILITIES | | | | | | | | |
Long-term debt | | | 275.0 | | | | 290.0 | |
Lease financing obligation | | | 7.5 | | | | 11.9 | |
Other liabilities | | | 19.0 | | | | 37.1 | |
| | | | | | | | |
Total liabilities | | | 653.0 | | | | 686.6 | |
| | | | | | | | |
Commitments and contingencies | | | | | | | | |
EQUITY | | | | | | | | |
Accumulated other comprehensive loss | | | (2.5 | ) | | | (0.4 | ) |
Member’s interest | | | 487.7 | | | | 312.6 | |
| | | | | | | | |
Total equity | | | 485.2 | | | | 312.2 | |
| | | | | | | | |
Total Liabilities and Equity | | $ | 1,138.2 | | | $ | 998.8 | |
| | | | | | | | |
81
NORTHERN TIER ENERGY LLC
CONSOLIDATED AND COMBINED STATEMENTS OF OPERATIONS
AND COMPREHENSIVE INCOME
(in millions, except unit and per unit data)
| | | | | | | | | | | | | | | | | | |
| | | Successor | | | | | Predecessor | |
| | | December 31,
2012 | | | December 31,
2011 | | | June 23, 2010
(inception date) to
December 31,
2010 | | | | | Eleven Months
Ended
November 30,
2010 | |
REVENUE(a) | | $ | 4,653.9 | | | $ | 4,280.8 | | | $ | 344.9 | | | | | $ | 3,195.2 | |
COSTS, EXPENSES AND OTHER | | | | | | | | | | | | | | | | | | |
Cost of sales(a) | | | 3,584.9 | | | | 3,512.4 | | | | 307.5 | | | | | | 2,697.9 | |
Direct operating expenses | | | 254.1 | | | | 257.9 | | | | 21.4 | | | | | | 227.0 | |
Turnaround and related expenses | | | 26.1 | | | | 22.6 | | | | — | | | | | | 9.5 | |
Depreciation and amortization | | | 33.2 | | | | 29.5 | | | | 2.2 | | | | | | 37.3 | |
Selling, general and administrative | | | 88.3 | | | | 88.7 | | | | 6.4 | | | | | | 59.6 | |
Formation costs | | | — | | | | 7.4 | | | | 3.6 | | | | | | — | |
Contingent consideration loss (income) | | | 104.3 | | | | (55.8 | ) | | | — | | | | | | — | |
Other (income) expense, net | | | (9.4 | ) | | | (4.5 | ) | | | 0.1 | | | | | | (5.4 | ) |
| | | | | | | | | | | | | | | | | | |
OPERATING INCOME | | | 572.4 | | | | 422.6 | | | | 3.7 | | | | | | 169.3 | |
Realized losses from derivative activities | | | (339.4 | ) | | | (310.3 | ) | | | — | | | | | | — | |
Unrealized gains (losses) from derivative activities | | | 68.0 | | | | (41.9 | ) | | | (27.1 | ) | | | | | (40.9 | ) |
Bargain purchase gain | | | — | | | | — | | | | 51.4 | | | | | | — | |
Interest expense, net | | | (42.2 | ) | | | (42.1 | ) | | | (3.2 | ) | | | | | (0.3 | ) |
Loss on early extinguishment of debt | | | (50.0 | ) | | | — | | | | — | | | | | | — | |
| | | | | | | | | | | | | | | | | | |
INCOME BEFORE INCOME TAXES | | | 208.8 | | | | 28.3 | | | | 24.8 | | | | | | 128.1 | |
Income tax provision | | | (9.8 | ) | | | — | | | | — | | | | | | (67.1 | ) |
| | | | | | | | | | | | | | | | | | |
NET INCOME | | | 199.0 | | | | 28.3 | | | | 24.8 | | | | | | 61.0 | |
| | | | | | | | | | | | | | | | | | |
OTHER COMPREHENSIVE LOSS, NET OF TAX | | | (2.1 | ) | | | (0.4 | ) | | | — | | | | | | — | |
| | | | | | | | | | | | | | | | | | |
COMPREHENSIVE INCOME | | $ | 196.9 | | | $ | 27.9 | | | $ | 24.8 | | | | | $ | 61.0 | |
| | | | | | | | | | | | | | | | | | |
SUPPLEMENTAL INFORMATION: | | | | | | | | | | | | | | | | | | |
(a) Excise taxes included in revenue and cost of sales | | $ | 300.1 | | | $ | 242.9 | | | $ | 25.1 | | | | | $ | 271.8 | |
82
NORTHERN TIER ENERGY LLC
CONSOLIDATED AND COMBINED STATEMENTS OF CASH FLOWS
(in millions)
| | | | | | | | | | | | | | | | | | |
| | | Successor | | | | | Predecessor | |
Increase (decrease) in cash | | December 31,
2012 | | | December 31,
2011 | | | June 23, 2010
(inception date)
December 31,
2010 | | | | | Eleven Months
Ended
November 30,
2010 | |
CASH FLOWS FROM OPERATING ACTIVITIES | | | | | | | | | | | | | | | | | | |
Net income | | $ | 199.0 | | | $ | 28.3 | | | $ | 24.8 | | | | | $ | 61.0 | |
Adjustments to reconcile net income to net cash provided by operating activities: | | | | | | | | | | | | | | | | | | |
Depreciation and amortization | | | 33.2 | | | | 29.5 | | | | 2.2 | | | | | | 37.3 | |
Non-cash interest expense | | | 7.5 | | | | 3.9 | | | | 0.3 | | | | | | — | |
Equity-based compensation expense | | | 0.9 | | | | 1.6 | | | | 0.1 | | | | | | 0.3 | |
Loss on extinguishment of debt | | | 50.0 | | | | — | | | | — | | | | | | — | |
Bargain purchase gain | | | — | | | | — | | | | (51.4 | ) | | | | | — | |
Deferred income taxes | | | 9.8 | | | | — | | | | — | | | | | | (0.8 | ) |
Equity method investment, net | | | — | | | | — | | | | 0.6 | | | | | | 0.6 | |
Contingent consideration loss (income) | | | 104.3 | | | | (55.8 | ) | | | — | | | | | | — | |
Unrealized (gains) losses from derivative activities | | | (68.0 | ) | | | 41.9 | | | | 27.1 | | | | | | 40.9 | |
Changes in assets and liabilities, net: | | | | | | | | | | | | | | | | | | |
Accounts receivable | | | (47.7 | ) | | | 18.3 | | | | (100.2 | ) | | | | | (16.3 | ) |
Inventories | | | (8.3 | ) | | | 2.3 | | | | 38.6 | | | | | | 2.5 | |
Other current assets | | | 5.6 | | | | (6.8 | ) | | | (27.7 | ) | | | | | — | |
Accounts payable and accrued expenses | | | 29.9 | | | | 146.4 | | | | 86.4 | | | | | | 23.8 | |
Receivables from and payables to related parties | | | — | | | | — | | | | — | | | | | | (1.2 | ) |
Other, net | | | (7.7 | ) | | | (0.3 | ) | | | (0.8 | ) | | | | | (2.7 | ) |
| | | | | | | | | | | | | | | | | | |
Net cash provided by operating activities | | | 308.5 | | | | 209.3 | | | | — | | | | | | 145.4 | |
| | | | | | | | | | | | | | | | | | |
CASH FLOWS FROM INVESTING ACTIVITIES | | | | | | | | | | | | | | | | | | |
Capital expenditures | | | (30.9 | ) | | | (45.9 | ) | | | (2.5 | ) | | | | | (29.8 | ) |
Acquisition, net of cash acquired | | | — | | | | (112.8 | ) | | | (360.8 | ) | | | | | — | |
Disposals of assets | | | — | | | | — | | | | — | | | | | | 0.4 | |
Return of capital from investments | | | 2.2 | | | | 2.4 | | | | — | | | | | | 0.1 | |
| | | | | | | | | | | | | | | | | | |
Net cash used in investing activities | | | (28.7 | ) | | | (156.3 | ) | | | (363.3 | ) | | | | | (29.3 | ) |
| | | | | | | | | | | | | | | | | | |
CASH FLOWS FROM FINANCING ACTIVITIES | | | | | | | | | | | | | | | | | | |
Borrowings from senior secured notes | | | 275.0 | | | | — | | | | 290.0 | | | | | | — | |
Repayments of senior secured notes | | | (290.0 | ) | | | — | | | | — | | | | | | — | |
Premiums paid to extinguish debt | | | (39.5 | ) | | | — | | | | — | | | | | | — | |
Borrowings from revolving credit arrangement | | | — | | | | 95.0 | | | | — | | | | | | — | |
Repayments of revolving credit arrangement | | | — | | | | (95.0 | ) | | | — | | | | | | — | |
Financing costs | | | (6.1 | ) | | | — | | | | (34.1 | ) | | | | | — | |
Cash contributions from parent | | | 230.4 | | | | — | | | | 180.2 | | | | | | — | |
Equity distributions | | | (300.2 | ) | | | (2.3 | ) | | | — | | | | | | — | |
Distributions to Marathon, net | | | — | | | | — | | | | — | | | | | | (115.4 | ) |
| | | | | | | | | | | | | | | | | | |
Net cash (used in) provided by financing activities | | | (130.4 | ) | | | (2.3 | ) | | | 436.1 | | | | | | (115.4 | ) |
| | | | | | | | | | | | | | | | | | |
CASH AND CASH EQUIVALENTS | | | | | | | | | | | | | | | | | | |
Change in cash and cash equivalents | | | 149.4 | | | | 50.7 | | | | 72.8 | | | | | | 0.7 | |
Cash and cash equivalents at beginning of period | | | 123.5 | | | | 72.8 | | | | — | | | | | | 6.0 | |
| | | | | | | | | | | | | | | | | | |
Cash and cash equivalents at end of period | | $ | 272.9 | | | $ | 123.5 | | | $ | 72.8 | | | | | $ | 6.7 | |
| | | | | | | | | | | | | | | | | | |
83
NORTHERN TIER ENERGY LLC
CONSOLIDATED AND COMBINED STATEMENTS OF
MEMBER’S INTEREST AND NET INVESTMENT
(in millions, except unit data)
| | | | | | | | | | | | | | | | |
| | | | | | | | | Accumulated
Other
Comprehensive
Income | | | Total | |
| | | Net
Investment | | | Member’s
Interest | | | |
Balance at January 1, 2010 (Predecessor) | | $ | 366.2 | | | $ | — | | | $ | — | | | $ | 366.2 | |
Net earnings | | | 61.0 | | | | — | | | | — | | | | 61.0 | |
Distributions to Marathon, net | | | (114.8 | ) | | | — | | | | — | | | | (114.8 | ) |
| | | | | | | | | | | | | | | | |
Balance at November 30, 2010 (Predecessor) | | $ | 312.4 | | | $ | — | | | $ | — | | | $ | 312.4 | |
| | | | | | | | | | | | | | | | |
Balance at June 23, 2010 (Successor Inception Date) | | $ | — | | | $ | — | | | $ | — | | | $ | — | |
Net earnings | | | — | | | | 24.8 | | | | — | | | | 24.8 | |
Capital contribution | | | — | | | | 260.1 | | | | — | | | | 260.1 | |
Equity-based compensation | | | — | | | | 0.1 | | | | — | | | | 0.1 | |
| | | | | | | | | | | | | | | | |
Balance at December 31, 2010 | | | — | | | | 285.0 | | | | — | | | | 285.0 | |
| | | | | | | | | | | | | | | | |
Net earnings | | | — | | | | 28.3 | | | | — | | | | 28.3 | |
Capital distributions | | | — | | | | (2.3 | ) | | | — | | | | (2.3 | ) |
Other comprehensive loss | | | — | | | | — | | | | (0.4 | ) | | | (0.4 | ) |
Equity-based compensation | | | — | | | | 1.6 | | | | — | | | | 1.6 | |
| | | | | | | | | | | | | | | | |
Balance at December 31, 2011 | | | — | | | | 312.6 | | | | (0.4 | ) | | | 312.2 | |
| | | | | | | | | | | | | | | | |
Net earnings | | | — | | | | 199.0 | | | | — | | | | 199.0 | |
Capital distributions | | | — | | | | (300.2 | ) | | | — | | | | (300.2 | ) |
Capital contribution from parent | | | — | | | | 275.4 | | | | — | | | | 275.4 | |
Other comprehensive loss | | | — | | | | — | | | | (2.1 | ) | | | (2.1 | ) |
Equity-based compensation | | | — | | | | 0.9 | | | | — | | | | 0.9 | |
| | | | | | | | | | | | | | | | |
Balance at December 31, 2012 | | $ | — | | | $ | 487.7 | | | $ | (2.5 | ) | | $ | 485.2 | |
| | | | | | | | | | | | | | | | |
84
NORTHERN TIER ENERGY LLC
NOTES TO CONSOLIDATED FINANCIAL STATEMENTS
1. DESCRIPTION OF THE BUSINESS AND BASIS OF PRESENTATION
Description of the Business
Northern Tier Energy LLC (“NTE LLC” or the “Company”) is an independent downstream energy company with refining, retail and pipeline operations that serve the Petroleum Administration for Defense District II (“PADD II”) region of the United States. Northern Tier Energy LP (“NTE LP”) indirectly holds 100% of the membership interest in NTE LLC and was organized in such a way as to be treated as a master limited partnership for tax purposes. NTE LLC was a wholly-owned subsidiary of Northern Tier Holdings LLC (“NT Holdings”) until July 31, 2012. On July 31, 2012, NT Holdings contributed all of its membership interests in NTE LLC to NTE LP in connection with the closing of the underwritten initial public offering (“IPO”) of NTE LP (see Note 3). NT Holdings is a wholly-owned subsidiary of Northern Tier Investors LLC (“NT Investors”). NT Investors, NT Holdings and NTE LLC were formed by ACON Refining Partners L.L.C. and TPG Refining L.P. and certain members of management (collectively, the “Investors”) during 2010. The St. Paul Park Refinery and Retail Marketing Business (the “Predecessor”) was formerly owned and operated by subsidiaries of Marathon Oil Corporation (“Marathon Oil”). These subsidiaries, Marathon Petroleum Company, LP (“MPC LP”), Speedway LLC (“Speedway”) and MPL Investments LLC, are together referred to as “MPC” or “Marathon” and are now subsidiaries of Marathon Petroleum Corporation (“Marathon Petroleum”). Marathon Petroleum was a wholly-owned subsidiary of Marathon Oil until June 30, 2011. Effective December 1, 2010, NTE LLC acquired the business from Marathon for approximately $608 million (the “Marathon Acquisition,” see Note 5).
NTE LLC includes the operations of St. Paul Park Refining Co. LLC (“SPPR”) and Northern Tier Retail Holdings LLC (“NTRH”). NTRH is the parent company of Northern Tier Retail LLC (“NTR”) and Northern Tier Bakery LLC (“NTB”). NTR is the parent company of SuperAmerica Franchising LLC (“SAF”). In connection with the IPO of NTE LP (see Note 3), NTE LLC contributed all of its membership interests in NTR, NTB and SAF to NTRH in exchange for all of the membership interests in NTRH. Effective August 1, 2012, NTRH elected to be treated as a corporation for income tax purposes in order to preserve the master limited partnership tax status of NTE LP. SPPR has a 17% interest in MPL Investments Inc. (“MPLI”) and a 17% interest in Minnesota Pipe Line Company, LLC (“MPL”). MPLI owns 100% of the preferred interest in MPL which owns and operates a 455,000 barrel per day (“bpd”) crude oil pipeline in Minnesota (see Note 2).
SPPR, which is located in St. Paul Park, Minnesota, has total crude oil throughput capacity of 84,500 barrels per stream day. Refining operations include crude fractionation, catalytic cracking, hydrotreating, reforming, alkylation, sulfur recovery and a hydrogen plant. The refinery processes predominately North Dakota and Canadian crude oils into products such as gasoline, diesel, jet fuel, kerosene, asphalt, propane, propylene and sulfur. The refined products are sold to markets primarily located in the Upper Great Plains of the United States.
As of December 31, 2012, NTR operates 166 convenience stores under the SuperAmerica brand and SAF supports 70 franchised stores which also utilize the SuperAmerica brand. These 236 SuperAmerica stores are primarily located in Minnesota and Wisconsin and sell gasoline, merchandise, and in some locations, diesel fuel. There is a wide range of merchandise sold at the stores including prepared foods, beverages and non-food items. The merchandise sold includes a significant number of proprietary items. NTB prepares and distributes food products under the SuperMom’s Bakery brand primarily to SuperAmerica branded retail outlets.
Basis of Presentation
The accompanying consolidated and combined financial statements present separately the financial position, results of operations, cash flows and changes in equity for both the Company and the Predecessor. In connection with the Acquisition, further described in Note 5, a new accounting basis was established for the Company as of the acquisition date based upon the fair value of the assets acquired and liabilities assumed, in accordance with the guidance for business combinations. Financial information for the pre- and post-acquisition periods has been separated by a line on the face of the consolidated and combined financial statements to highlight the fact that the financial information for such periods have been prepared under two different historical-cost bases of accounting. For all periods prior to the closing of the Acquisition, the accompanying combined financial statements reflect all revenues, expenses and cash flows directly attributable to the Predecessor.
2. SUMMARY OF PRINCIPAL ACCOUNTING POLICIES
Principles of Consolidation and Combination
NTE LLC was formed on June 23, 2010. The Marathon Acquisition agreement was entered into on October 6, 2010 and closed on December 1, 2010. Accordingly, the accompanying financial statements present the consolidated accounts of such acquired businesses. All significant intercompany accounts have been eliminated in these consolidated financial statements.
85
The Company’s common equity interest in MPL is accounted for using the equity method of accounting in accordance with the Financial Accounting Standards Board’s (“FASB”) Accounting Standards Codification (“ASC”) Topic 323. Equity income from MPL represents the Company’s proportionate share of net income available to common equity owners generated by MPL. See Note 8 for further information on the Company’s equity method investment.
MPLI owns all of the preferred membership units of MPL. This investment in MPLI, which provides the Company no significant influence over MPLI, is accounted for as a cost method investment. The investment in MPLI is carried at a cost of $6.9 million as of December 31, 2012 and 2011 and is included in other assets within the consolidated balance sheets.
The equity and cost method investments are assessed for impairment whenever changes in facts or circumstances indicate a loss in value has occurred. When the loss is deemed to be other than temporary, the carrying value of the investment is written down to fair value, and the amount of the write-down is included in net income.
Use of Estimates
The preparation of financial statements in accordance with GAAP requires management to make estimates and assumptions that affect the reported amounts of assets and liabilities and the disclosure of contingent assets and liabilities as of the date of the consolidated financial statements and the reported amounts of revenues and expenses during the respective reporting periods. Actual results could differ from those estimates. In addition, significant estimates were used in accounting for the Marathon Acquisition under the purchase method of accounting.
Operating Segments
The Company has two reportable operating segments; Refining and Retail (see Note 21 for further information on the Company’s operating segments). The Refining and Retail operating segments consist of the following:
| | • | | Refining—operates the St. Paul Park, Minnesota refinery, terminal and related assets, and includes the Company’s interest in MPL and MPLI, and |
| | • | | Retail—operates 166 convenience stores primarily in Minnesota and Wisconsin. The retail segment also includes the operations of NTB and SAF. |
Cash and Cash Equivalents
The Company considers all highly liquid investments with maturities of three months or less from the date of purchase to be cash equivalents.
Property, Plant and Equipment
Property, plant and equipment is recorded at cost and depreciated on a straight-line basis over the estimated useful lives of the assets. Such assets are reviewed for impairment whenever events or changes in circumstances indicate that the carrying amount of an asset may not be recoverable. If the sum of the expected undiscounted future cash flows from the use of the asset and its eventual disposition is less than the carrying amount of the asset, an impairment loss is recognized based on the fair value of the asset.
When property, plant and equipment depreciated on an individual basis is sold or otherwise disposed of, any gains or losses are reported in net income. Gains on the disposal of property, plant and equipment are recognized when earned, which is generally at the time of closing. If a loss on disposal is expected, such losses are generally recognized when the assets are classified as held for sale.
Expenditures for routine maintenance and repair costs are expensed when incurred. Refinery process units require periodic major maintenance and repairs that are commonly referred to as “turnarounds.” The required frequency of the maintenance varies by unit, but generally is every two to six years depending on the processing unit involved. Turnaround costs are expensed as incurred.
Derivative Financial Instruments
The Company is exposed to earnings and cash flow volatility based on the timing and change in refined product prices and crude oil prices. To manage these risks, the Company may use derivative instruments associated with the purchase or sale of crude oil and refined products. Crack spread option and swap contracts are used to hedge the volatility of refining margins. The Company also may use futures contracts to manage price risks associated with inventory quantities above or below target levels. The Company does not enter into derivative contracts for speculative purposes. All derivative instruments are recorded in the consolidated balance sheet at fair value and are classified depending on the maturity date of the underlying contracts. Changes in the fair value of its contracts are accounted for by marking them to market and recognizing any resulting gains or losses in net income. These gains and losses are reported as operating activities within the consolidated statements of cash flows.
86
Revenue Recognition
Revenues are recognized when products are shipped or services are provided to customers, title is transferred, the sales price is fixed or determinable and collectability is reasonably assured. Revenues are recorded net of discounts granted to customers. Shipping and other transportation costs billed to customers are presented on a gross basis in revenues and cost of sales.
Rebates from vendors are recognized as a reduction of cost of sales when the initiating transaction occurs. Incentives that are derived from contractual provisions are accrued based on past experience and recognized in cost of sales.
Excise Taxes
The Company (and previously, the Predecessor) is required by various governmental authorities, including federal and state, to collect and remit taxes on certain products. Such taxes are presented on a gross basis in revenue and cost of sales in the consolidated statements of operations. These taxes totaled $300.1 million, $242.9 million, $25.1 million and $271.8 million for the years ended December 31, 2012 and 2011, the period from June 23, 2010 (inception date) to December 31, 2010 (the “Successor Period”) and the eleven months ending November 30, 2010, respectively.
Refined Product Exchanges
The Company (and previously, the Predecessor) enters into exchange contracts whereby it agrees to deliver a particular quantity and quality of refined products at a specified location and date to a particular counterparty and to receive from the same counterparty a particular quantity and quality of refined products at a specified location on the same or another specified date. The exchange receipts and deliveries are nonmonetary transactions, with the exception of associated grade or location differentials that are settled in cash. These transactions are not recorded as revenue because they involve the exchange of refined product inventories held for sale in the ordinary course of business to facilitate sales to customers. The exchange transactions are recognized at the carrying amount of the inventory transferred plus or minus any cash settlement due to grade or location differentials.
Advertising
The Company (and previously, the Predecessor) expenses the costs of advertising as incurred. Advertising expense was $1.5 million and $1.0 million for the years ended December 31, 2012 and 2011, respectively. Advertising expense was less than $0.1 million for the Successor Period ended December 31, 2010 and $2.6 million for the eleven months ended November 30, 2010.
Receivables and Allowance for Doubtful Accounts
Receivables of the Company (and previously, the Predecessor) primarily consist of customer accounts receivable. The accounts receivable are due from a diverse base including companies in the petroleum industry, airlines and governmental entities. The allowance for doubtful accounts is reviewed quarterly for collectability. All customer receivables are recorded at the invoiced amounts and generally do not bear interest. When it becomes probable the receivable will not be collected, the balances for customer receivables are charged directly to bad debt expense. The allowance for doubtful accounts was less than $0.1 million as of December 31, 2012 and 2011.
Inventories
Inventories are carried at the lower of cost or market value. Cost of inventories is determined primarily under the last-in, first-out (“LIFO”) method. However, the Company (and previously, the Predecessor) maintains some inventories whose cost is primarily determined using the first-in, first-out method. The Company has LIFO pools for crude oil and other feedstocks and for refined products in its Refining segment and a LIFO pool for refined products inventory held by the retail stores in its Retail segment.
Internal-Use Software Development Costs
The Company capitalizes certain external computer software costs incurred during the application development stage. The application development stage generally includes software design and configuration, coding, testing and installation activities. Training and maintenance costs are expensed as incurred, while upgrades and enhancements are capitalized if it is probable that such expenditures will result in additional functionality. Capitalized software costs are depreciated over the estimated useful life of the underlying project on a straight-line basis, generally not exceeding five years.
Intangible Assets
Intangible assets primarily include a retail marketing trade name and franchise agreements. These assets have an indefinite life and therefore are not amortized, but rather are tested for impairment annually and when events or changes in circumstances indicate that the fair value of the intangible asset has been reduced below carrying value.
87
Financing Costs
Financing origination fees on our senior secured notes, revolving credit facility and sales-leaseback transaction are deferred and classified within other assets on the consolidated balance sheets. Amortization is provided on a straight-line basis over the term of the agreement, which approximates the effective interest method.
Environmental Costs
Environmental expenditures are capitalized if the costs mitigate or prevent future contamination or if the costs improve environmental safety or efficiency of the existing assets. The Company (and previously, the Predecessor) provides for remediation costs and penalties when the responsibility to remediate is probable and the amount of associated costs can be reasonably estimated. The timing of remediation accruals coincides with completion of a feasibility study or the commitment to a formal plan of action. Remediation liabilities are accrued based on estimates of known environmental exposure and are discounted when the estimated amounts are reasonably fixed and determinable. If recoveries of remediation costs from third parties are probable, a receivable is recorded and is discounted to net present value when the estimated amount is reasonably fixed and determinable.
Asset Retirement Obligations
The fair value of asset retirement obligations is recognized in the period in which the obligations are incurred if a reasonable estimate of fair value can be made. Conditional asset retirement obligations for removal and disposal of fire-retardant material from certain refining assets have been recognized. The amounts recorded for such obligations are based on the most probable current cost projections. Asset retirement obligations have not been recognized for the removal of materials and equipment from or the closure of certain refinery, pipeline, terminal and retail marketing assets because the fair value cannot be reasonably estimated since the settlement dates of the obligations are indeterminable.
Current inflation rates and credit-adjusted-risk-free interest rates are used to estimate the fair value of asset retirement obligations. Depreciation of capitalized asset retirement costs and accretion of asset retirement obligations are recorded over time. Depreciation is determined on a straight-line basis, while accretion escalates over the lives of the assets.
Employee Benefit Plans
The Predecessor’s employees participated in various employee benefit plans of Marathon. These plans include qualified, non-contributory defined benefit retirement plans, employee savings plans, employee and retiree medical and life insurance plans, dental plans and other such benefits. For the purposes of the combined financial statements, the Predecessor was considered to be participating in multi-employer benefit plans of Marathon. As a participant in multi-employer benefit plans, the Predecessor recognized as expense in each period the required allocations from Marathon, and it did not recognize any employee benefit plan liabilities.
Subsequent to the Acquisition, the majority of the Predecessor’s employees still participated in the employee benefit plans of Marathon under a transition services agreement. See Note 5 for a further description of this transition services agreement.
Any employee not covered under an employee benefit plan of Marathon participates in retirement plans, medical and life insurance plans, dental plans and other such benefits sponsored by the Company (see Note 17).
Equity-Based Compensation
The Company recognizes compensation expense for equity-based awards issued over the requisite service period. Equity-based compensation costs are measured at the date of grant, based on the fair value of the award. The Company recognized equity-based compensation expense of $0.9 million, $1.6 million and $0.1 million for the years ended December 31, 2012 and 2011 and the Successor Period ended December 31, 2010, respectively.
Net Investment
The net investment within the consolidated and combined statements of partners’ capital, member’s interest and net investment, represents a net balance reflecting Marathon’s initial investment in the Predecessor and subsequent adjustments resulting from the operations of the Predecessor and various transactions between the Predecessor and Marathon. The balance is the result of the Predecessor’s participation in Marathon’s centralized cash management programs under which the Predecessor’s cash receipts were remitted to and all cash disbursements were funded by Marathon. Other transactions affecting the net investment include general, administrative and overhead costs incurred by Marathon that are allocated to the Predecessor. There are no terms of settlement or interest charges associated with the net investment balance.
88
Comprehensive Income
The Company has unrecognized prior service cost related to its defined benefit cash balance plan as of December 31, 2012 and 2011 and unrecognized actuarial losses and prior service cost related to its retiree benefits plan as of December 31, 2012 (see Note 17). The accumulated unrecognized costs related to these plans amount to $2.5 million and $0.4 million at December 31, 2012 and 2011, respectively. These costs of $2.1 million and $0.4 million were recognized directly to equity as an element of other comprehensive income in the years ended December 31, 2012 and 2011, respectively. The Predecessor reported no comprehensive income in the period presented.
Concentrations of Risk
The Predecessor was exposed to related party risk as a portion of both sales revenues and costs were derived from transactions with Marathon Oil’s subsidiaries and affiliates. Sales to related parties for the eleven months ended November 30, 2010 were 7% of total sales. Purchases from related parties for the eleven months ended November 30, 2010 were 45% of total costs and expenses.
The Company (and previously, the Predecessor) is exposed to credit risk in the event of nonpayment by customers. The creditworthiness of customers is subject to continuing review. No single non-related party customer accounts for more than 10% of annual revenues.
Crude oil is the principal raw material for the Company and the majority of the crude oil processed is delivered to the refinery through a pipeline that is owned by MPL, a related party. A prolonged disruption of that pipeline’s operations would materially impact the Company’s ability to economically obtain raw materials.
The Company (and previously, the Predecessor) is exposed to concentrated geographical risk as most of its operations are conducted in the Upper Great Plains of the United States.
Income Taxes
The Company recognizes and measures its uncertain tax positions based on the rules under ASC Topic 740, “Income Taxes.” Subsequent to the Marathon Acquisition date, all of the Successor’s income was derived through subsidiaries which were limited liability companies and were therefore pass-through entities for federal income tax purposes. As a result, the Successor did not incur federal income taxes prior to August 1, 2012. Subsequent to the IPO of NTE LP on July 31, 2012, NTE LP is treated as a master limited partnership for tax purposes. Effective August 1, 2012, NTRH elected to be treated as a corporation for income tax purposes in order to preserve the master limited partnership tax status of NTE LP. As such, the Company has recorded deferred tax assets and deferred tax liabilities as of the election date. Additionally, the Company recorded current period income taxes for the period from August 1, 2012 through December 31, 2012 (see Note 6) at the NTRH level.
Reclassification
Certain reclassifications have been made to the prior-year financial information in order to conform to the Company’s current presentation.
Accounting Developments
In December 2011, the FASB issued ASU No. 2011-11, “Disclosures about Offsetting Assets and Liabilities” (“ASU 2011-11”) and in January 2013 issued ASU No. 2013-01 “Clarifying the Scope of Disclosures About Offsetting Assets and Liabilities.” These standards retain the existing offsetting requirements and enhance the disclosure requirements to allow investors to better compare financial statements prepared under GAAP with those prepared under IFRS. This new guidance is to be applied retrospectively. ASU 2011-11 will be effective for the Company’s quarterly and annual financial statements beginning with the first quarter 2013 reporting. The Company believes that the adoption of ASU 2011-11 and ASU 2013-01 will not have a material impact on its consolidated financial statements.
In July 2012, the FASB issued ASU No. 2012-02, “Intangibles—Goodwill and other” (“ASU 2012-02”). ASU 2012-02 provides guidance on annual impairment testing of indefinite-lived intangible assets. The standards update allows an entity to first assess qualitative factors to determine if it is more likely than not that the fair value of an indefinite-lived intangible asset is less than its carrying amount. If based on its qualitative assessment an entity concludes it is more likely than not that the fair value of an indefinite-lived intangible asset is less than its carrying amount, quantitative impairment testing is required. However, if an entity concludes otherwise, quantitative impairment testing is not required. The standards update is effective for annual and interim impairment tests performed for fiscal years beginning after September 15, 2012, with early adoption permitted. The Company believes that the adoption of ASU 2012-02 will not have a material impact on its consolidated financial statements.
89
3. INITIAL PUBLIC OFFERING OF NORTHERN TIER ENERGY LP
On July 25, 2012, our parent, NTE LP, priced 16,250,000 common units in its IPO at $14.00 per unit, and on July 26, 2012, NTE LP common units began trading on the New York Stock Exchange (ticker symbol: NTI). NTE LP closed its IPO of 18,687,500 common units, which included 2,437,500 common units issued pursuant to the underwriters’ exercise of their option to purchase additional common units, on July 31, 2012.
The net proceeds from the IPO of approximately $230 million, after deducting the underwriting discount and other offering costs of approximately $15 million were contributed by NTE LP to the Company. These net proceeds along with approximately $56 million of cash on hand were used to: (i) distribute approximately $124 million to NT Holdings, of which approximately $92 million was used to redeem Marathon’s existing preferred interest in NT Holdings and $32 million was distributed to ACON Refining Partners L.L.C., TPG Refining L.P. and entities in which certain members of the Company’s management team hold an ownership interest, (ii) pay $92 million to J. Aron & Company, an affiliate of Goldman, Sachs & Co., related to deferred payment obligations from the early extinguishment of derivatives (see Note 11), (iii) pay $40 million to Marathon, which represents the cash component of a settlement agreement entered into with Marathon in satisfaction of a contingent consideration arrangement that was part of the Marathon Acquisition (see Note 5), and (iv) redeem $29 million of the Company’s senior secured notes at a redemption price of 103% of the principal amount thereof, plus accrued interest, for an estimated $31 million.
In connection with the closing of the IPO the following transactions and events occurred in July, 2012:
| | • | | The settlement agreement with Marathon with respect to the contingent consideration arrangements that were entered into in connection with the Marathon Acquisition became effective (see Note 5); |
| | • | | The Company’s management services agreement with ACON Refining Partners L.L.C and TPG Refining L.P. (see Note 4) was terminated; |
| | • | | NT Holdings contributed all of its membership interests in NTE LLC to NTE LP in exchange for 54,844,500 common units and 18,383,000 PIK units; |
| | • | | NTE LP issued 18,687,500 common units to the public, representing a 20.3% limited partner interest; and |
| | • | | NTRH elected to be treated as a corporation for federal income tax purposes, subjecting it to corporate-level tax. |
4. RELATED PARTY TRANSACTIONS
The Investors, which include ACON Investments L.L.C. and TPG Refining, L.P., are related parties of the Company. MPL is also a related party of the Company. Subsequent to the Acquisition (see Note 5), the Company entered into a crude oil supply and logistics agreement with a third party and no longer has direct transactions with MPL.
Related parties for the Predecessor include the following:
| | • | | Marathon Oil Company (“MOC”), which is a wholly-owned subsidiary of Marathon Oil. MOC purchases or produces crude oil in the United States that is used at MPC’s refineries. |
| | • | | MPC LP, which changed its name from Marathon Petroleum Company LLC on October 1, 2010, was a wholly-owned subsidiary of Marathon Oil. MPC LP refines, markets and transports crude oil and petroleum products, primarily in the Midwest, Upper Great Plains, Gulf Coast and southeastern regions of the United States. |
| | • | | Marathon Petroleum Trading Canada LLC (“MP Trading Canada”), which was a wholly-owned subsidiary of MPC LP. MP Trading Canada purchases crude oil in Canada to be used at MPC LP’s refineries. |
| | • | | MPL, in which Marathon owned (and now the Company owns) a 17 percent interest. MPL owns and operates a crude oil pipeline running from Clearbrook, Minnesota to Pine Bend, Minnesota. |
| | • | | Speedway was a wholly-owned subsidiary of Marathon Oil. Under the Predecessor, Speedway was the owner of the SuperAmerica branded convenience stores that were sold to NTR as part of the Acquisition. |
Predecessor revenues from related parties for the eleven months ended November 30, 2010 were $210.1 million and represented sales to MPC LP. Related party sales to MPC LP consisted primarily of sales of refined products. Refined product sales to MPC LP were recorded at intercompany transfer prices that were market-based prices.
90
Predecessor purchases from related parties were as follows:
| | | | |
(in millions) | | Eleven Months
Ended November 30,
2010 | |
MOC | | $ | 276.9 | |
MPL LP | | | 67.5 | |
MP Trading Canada | | | 992.3 | |
Minnesota Pipe Line | | | 25.3 | |
Speedway | | | 16.3 | |
| | | | |
Total | | $ | 1,378.3 | |
| | | | |
Related party purchases from MOC and MP Trading Canada consisted primarily of crude oil. Purchases from MOC were recorded at contracted prices that were market-based. Purchases from MP Trading Canada were recorded at contracted prices based on MP Trading Canada’s acquisition cost, plus an administrative fee. Related party purchases from MPC LP consisted primarily of purchases of refined products and refinery feedstocks, certain general and administrative costs, and costs associated with the Refining segment participating in MPC LP’s multi-employer benefit plans. Refined product and refinery feedstock purchases from MPC LP were recorded at intercompany transfer prices that were market-based prices. Related party purchases from MPL consisted primarily of crude oil transportation services which were based on published tariffs. Related party purchases from Speedway consisted of certain overhead costs and costs associated with the Retail segment participating in Speedway’s multi-employer benefit plans.
MPC LP and Speedway provided certain services to the Predecessor such as marketing, crude acquisition, engineering, human resources, insurance, treasury, accounting, tax, legal, procurement and information technology services. Charges for these services were allocated based on usage or other methods, such as headcount, capital employed or store count, which management believes to be reasonable. Related party purchases reflect charges for these services of $26.5 million for the eleven months ended November 30, 2010. The allocation methods included in the combined income statements were consistently applied.
For the purposes of the combined financial statements, the Predecessor was considered to participate in multi-employer benefit plans of MPC LP and Speedway. The Predecessor’s allocated share of MPC LP and Speedway’s employee benefit plan expenses, including costs related to stock-based compensation plans, is included in related party purchases and was $21.5 million for the eleven months ended November 30, 2010. Expenses for employee benefit plans other than stock-based compensation plans were allocated to the Predecessor primarily as a percentage of salary and wage expense. For the stock-based compensation plans, the Predecessor was charged with the expenses directly attributed to its employees which were $0.3 million for the eleven months ended November 30, 2010.
Upon completion of the Marathon Acquisition, the Company entered into a management services agreement with the Investors pursuant to which they provided the Company with ongoing management, advisory and consulting services. This management services agreement was terminated in conjunction with the IPO of NTE LP as of July 31, 2012. While this agreement was in effect, the Investors also received quarterly management fees equal to 1% of the Company’s “Adjusted EBITDA” (as defined in the agreement) for the previous quarter (subject to a minimum annual fee of $2 million), as well as reimbursements for out-of-pocket expenses incurred by them in connection with providing such management services. The Company recognized management fees relating to these services of $3.1 million and $2.1 million for the years ending December 31, 2012 and 2011, respectively. As a result of the NTE LP IPO, the Company was required to pay the Investors a specified success fee of $7.5 million that is a part of the IPO offering costs discussed in Note 3.
Included in other assets within the consolidated balance sheet as of December 31, 2012 is a $1.4 million receivable from NTE LP.
5. MARATHON ACQUISITION
As previously described in Note 1, effective December 1, 2010, the Company acquired the business from MPC for $608 million. The Marathon Acquisition was accounted for by the purchase method of accounting for business combinations. The $608 million purchase price included $361 million paid in cash as of December 31, 2010, $80 million satisfied by issuing MPC a perpetual payment in kind preferred interest in NT Holdings and $54 million representing the estimated fair value of earn-out payments as of the acquisition date. The residual purchase price of $113 million was paid during the three months ended March 31, 2011. Upon the closing of the NTE LP IPO, MPC’s perpetual payment in kind preferred interest in NT Holdings was redeemed at par plus accrued dividends for a total of approximately $92 million.
The cash component of the purchase price along with acquisition related costs were financed by an approximately $180 million cash investment by the Investors and aggregate borrowings of $290 million. See Note 12 for a description of the Company’s financing arrangements.
91
Concurrent with the Marathon Acquisition, the following transactions also occurred:
| | • | | Certain Marathon assets (including real property interests and land related to 135 of the SuperAmerica convenience stores and the SuperMom’s bakery) were sold to a third party equity real estate investment trust. In connection with the closing of the Marathon Acquisition, the Company is leasing these properties from the real estate investment trust on a long-term basis. |
| | • | | A third-party purchased substantially all of the crude oil inventory associated with operations of the refinery directly from Marathon. |
The Marathon Acquisition included contingent consideration arrangements under which the Company could have received margin support payments of up to $60 million from MPC or could have paid MPC net earn-out payments of up to $125 million over the term of the arrangements, depending on the Company’s Adjusted EBITDA as defined in the arrangements. On May 4, 2012, NTE LLC entered into a settlement agreement with MPC regarding the contingent consideration. The settlement agreement was contingent upon the consummation of the IPO of NTE LP, which occurred on July 31, 2012 (see Note 3). Pursuant to this settlement agreement, MPC received $40 million of the net proceeds from the IPO of NTE LP and NT Holdings issued MPC a new $45 million perpetual payment in kind preferred interest in NT Holdings in consideration for relinquishing all claims with respect to earn-out payments under the contingent consideration agreement. This preferred interest in NT Holding will not be dilutive to NTE LP unitholders. The Company also agreed, pursuant to the settlement agreement, to relinquish all claims to margin support payments under the margin support agreement. Upon the consummation of the NTE LP IPO, the Company reversed the amounts recorded for the margin support and earn-out arrangements and recorded a liability of $85 million representing the amount of the settlement agreement. The net impact of these adjustments resulted in a charge of $104.3 million recognized during the year ended December 31, 2012.
MPC agreed to provide the Company with administrative and support services subsequent to the Marathon Acquisition pursuant to a transition services agreement, including finance and accounting, human resources, and information systems services, as well as support services generally for a period of up to eighteen months in connection with the transition from being a part of MPC’s systems and infrastructure to having its own systems and infrastructure. The transition services agreement required the Company to pay MPC for the provision of the transition services, as well as to reimburse MPC for compensation paid to MPC employees providing such transition services. In addition, under the agreement, Marathon provided support services for the operation of the refining and retail business segments, using the employees that were ultimately expected to be transitioned to the Company. The Company was obligated to reimburse MPC for the compensation paid to MPC employees providing such operations services, plus the agreed burden rates. For the year ended December 31, 2011, the Company recognized expenses of approximately $14.0 million related to administrative and support services. The Company also paid $6.7 million in December 2010 of which $6.1 million and $0.6 million was amortized to expense during the year ended December 31, 2011 and the Successor Period ended December 31, 2010, respectively, as these services were incurred. The majority of transition services were completed as of December 31, 2011 and, as such, the year ended December 31, 2012 includes less than $0.1 million of transition service charges from MPC.
6. INCOME TAXES
For the period subsequent to the Acquisition and prior to the election by NTRH to be taxed as a corporation on August 1, 2012, the Company and all its subsidiaries were pass through entities for federal income tax purposes. As a result, there were no federal income taxes incurred during that period. For the years ended December 31, 2012 and 2011 and the Successor Period ended December 31, 2010, the Company incurred state income taxes of less than $0.1 million during each of those periods.
For all periods prior to the Acquisition, the taxable results of the Predecessor were included in the consolidated U.S. federal and various state and local tax returns of Marathon Oil. Also, in certain state, local and foreign jurisdictions, the Predecessor filed on a stand-alone basis. The tax provisions for the period prior to the closing of the Acquisition have been prepared assuming the Predecessor was a stand-alone taxpayer for the period presented.
On July 31, 2012, NTRH was established as the parent company of NTR and NTB. NTRH elected to be taxed as a corporation for federal and state income tax purposes effective August 1, 2012. Prior to that, no provision for federal income tax was calculated on earnings of the Company or its subsidiaries as all entities were non-taxable.
On August 1, 2012, the Company recorded an $8.0 million tax charge to recognize its deferred tax asset and liability positions as of NTRH’s election to be taxed as a corporation. As of NTRH’s election date, the Company recorded a current deferred tax asset of $2.2 million, included in other current assets, and a non-current deferred tax liability of $10.2 million, included in other liabilities.
92
The income tax provision in the accompanying consolidated financial statements consists of the following:
| | | | | | | | | | | | | | | | | | |
| | | Sucessor | | | | | Predecessor | |
(in millions) | | Year Ended
December 31,
2012 | | | Year Ended
December 31,
2011 | | | June 23, 2010
(inception date) to
December 31, 2010 | | | | | Eleven Months Ended
November 30, 2010 | |
Current tax expense | | $ | — | | | $ | — | | | $ | — | | | | | $ | 67.9 | |
Deferred tax expense | | | 9.8 | | | | — | | | | — | | | | | | (0.8 | ) |
| | | | | | | | | | | | | | | | | | |
Total tax expense | | $ | 9.8 | | | $ | — | | | $ | — | | | | | $ | 67.1 | |
| | | | | | | | | | | | | | | | | | |
The Company’s effective tax rate was 4.7%, 0.0% and 0.0% for the years ended December 31, 2012 and 2011 and the Successor Period ended December 31, 2010, respectively, as compared to the Company’s consolidated federal and state expected statutory tax rate of 40.4%. The Company’s effective tax rate for the year ended December 31, 2012 is lower than the statutory rate primarily due to the fact that only the retail operations of the Company are taxable entities. This lowering of the effective tax rate is partially offset by the impact of the opening deferred tax charge of $8.0 million as of the effective date of NTRH electing to be treated as a taxable entity. The Company’s effective tax rate for the year ended December 31, 2011 and for the Successor Period ended December 31, 2010 is zero due to the fact that the Company acted as a pass through entity for income tax purposes during those periods. The Predecessor’s effective tax rate for the eleven months ended November 30, 2010 was 52.4% as compared to the combined federal and state expected statutory tax rate of 35.0%. The Predecessor’s effective tax rate for the eleven months ended November 30, 2010 was higher than the statutory rate primarily due to a valuation allowance on a capital loss carryforward due to limitation on unrealized derivative losses and the non-deductible portion of state and local income taxes.
The following is a reconciliation of the income tax expense to income taxes computed by applying the applicable statutory federal income tax rate to income before income taxes for the applicable periods:
| | | | | | | | | | | | | | | | | | |
| | | Sucessor | | | | | Predecessor | |
(in millions) | | Year Ended
December 31,
2012 | | | Year Ended
December 31,
2011 | | | June 23, 2010
(inception date) to
December 31, 2010 | | | | | Eleven Months
Ended
November 30, 2010 | |
Federal statutory rate applied to income before taxes | | $ | 72.6 | | | $ | 9.9 | | | $ | 8.7 | | | | | $ | 44.8 | |
Taxes on earnings attributable to flow-through entities | | | (71.6 | ) | | | (9.9 | ) | | | (8.7 | ) | | | | | — | |
State and local income taxes, net of federal income tax effects | | | — | | | | — | | | | — | | | | | | 10.7 | |
Initial charge upon NTRH’s election to be treated as a corporation | | | 8.0 | | | | — | | | | — | | | | | | — | |
Domestic manufacturing deductions | | | — | | | | — | | | | — | | | | | | (2.6 | ) |
Valuation allowance for capital loss carryforward | | | — | | | | — | | | | — | | | | | | 14.3 | |
Dividend received deduction | | | — | | | | — | | | | — | | | | | | (0.2 | ) |
Other, net | | | 0.8 | | | | — | | | | — | | | | | | 0.1 | |
| | | | | | | | | | | | | | | | | | |
Income tax expense | | $ | 9.8 | | | $ | — | | | $ | — | | | | | $ | 67.1 | |
| | | | | | | | | | | | | | | | | | |
As a result of the Company’s analysis, management has determined that the Company does not have any material uncertain tax positions. As of December 31, 2012, the Company had tax loss carryforwards of approximately $2.1 million. These tax loss carryforwards will expire in 2032. The Company is subject to U.S. federal and state income tax examinations for tax years from its date of inception.
93
The net deferred tax assets (liabilities) as of December 31, 2012 and 2011 consisted of the following components:
| | | | | | | | |
| | | December 31, | |
(in millions) | | 2012 | | | 2011 | |
Deferred tax liabilities: | | | | | | | | |
Accelerated depreciation | | $ | (2.9 | ) | | $ | — | |
Intangible assets | | | (12.2 | ) | | | — | |
| | | | | | | | |
Deferred tax liabilities | | | (15.1 | ) | | | — | |
| | | | | | | | |
Deferred tax assets: | | | | | | | | |
Lease financing obligations | | | 2.7 | | | | — | |
Customer loyalty accrual | | | 1.1 | | | | — | |
Net operating loss carryforwards | | | 0.8 | | | | — | |
Other | | | 0.7 | | | | — | |
| | | | | | | | |
Deferred tax assets | | | 5.3 | | | | — | |
| | | | | | | | |
Total deferred taxes, net | | $ | (9.8 | ) | | $ | — | |
| | | | | | | | |
The net deferred tax assets (liabilities) are included in the December 31, 2012 balance sheet as components of other current assets and other liabilities.
7. Inventories
| | | | | | | | |
(in millions) | | December 31,
2012 | | | December 31,
2011 | |
Crude oil and refinery feedstocks | | $ | 9.7 | | | $ | 9.1 | |
Refined products | | | 117.0 | | | | 109.1 | |
Merchandise | | | 20.8 | | | | 21.1 | |
Supplies and sundry items | | | 14.9 | | | | 14.8 | |
| | | | | | | | |
Total | | $ | 162.4 | | | $ | 154.1 | |
| | | | | | | | |
The LIFO method accounted for 78% and 77% of total inventory value at December 31, 2012 and 2011, respectively. Current acquisition costs were estimated to be $20.0 million more than the LIFO inventory value at December 31, 2011.
During 2011, reductions in quantities of crude oil and refinery feedstocks inventory resulted in a liquidation of LIFO inventory quantities acquired at lower costs in prior years. The 2011 LIFO liquidation resulted in a decrease in cost of sales of approximately $4.1 million. As a result of LIFO inventory liquidations in prior periods, cost of sales decreased and income from operations increased by $2.1 million and $2.1 million for the Successor Period ended December 31, 2010, and the eleven months ended November 30, 2010, respectively.
8. Equity Method Investment
The Company (and previously, the Predecessor) has a 17% common equity interest in MPL. The carrying value of this equity method investment was $87.5 million and $89.9 million at December 31, 2012 and 2011, respectively.
Summarized financial information for MPL is as follows:
| | | | | | | | | | | | | | | | | | |
| | | Successor | | | | | Predecessor | |
(in millions) | | Year Ended
December 31, 2012 | | | Year Ended
December 31, 2011 | | | One Month ended
December 31, 2010 | | | | | Eleven Months
Ended
November 30, 2010 | |
Revenues | | $ | 153.6 | | | $ | 115.6 | | | $ | 8.7 | | | | | $ | 101.6 | |
Operating costs and expenses | | | 52.7 | | | | 53.8 | | | | 7.4 | | | | | | 36.8 | |
Income from operations | | | 82.1 | | | | 43.2 | | | | 1.3 | | | | | | 42.4 | |
Net income | | | 82.1 | | | | 43.2 | | | | 1.3 | | | | | | 42.4 | |
Net income available to common shareholders | | | 72.4 | | | | 33.5 | | | | 0.5 | | | | | | 33.6 | |
94
| | | | | | | | |
(in millions) | | December 31, 2012 | | | December 31, 2011 | |
Balance sheet data: | | | | | | | | |
Current assets | | $ | 13.0 | | | $ | 12.1 | |
Noncurrent assets | | | 477.3 | | | | 492.8 | |
| | | | | | | | |
Total assets | | $ | 490.3 | | | $ | 504.9 | |
| | | | | | | | |
Current liabilities | | $ | 14.6 | | | $ | 16.6 | |
Noncurrent liabilities | | | — | | | | 0.1 | |
| | | | | | | | |
Total liabilities | | $ | 14.6 | | | $ | 16.7 | |
| | | | | | | | |
Members capital | | $ | 475.7 | | | $ | 488.2 | |
| | | | | | | | |
As of December 31, 2012 and 2011 the carrying amount of the equity method investment was $6.7 million and $6.9 million higher than the underlying net assets of the investee, respectively. The Company is amortizing this difference over the remaining life of MPL’s primary asset (the fixed asset life of the pipeline).
Distributions received from MPL were $14.5 million for the year ended December 31, 2012, $8.0 million for the year ended December 31, 2011, $0.7 million for the Successor Period ended December 31, 2010 and $6.0 million for the eleven months ended November 30, 2010. Equity income from MPL was $12.3 million for the year ended December 31, 2012, $5.7 million for the year ended December 31, 2011, $0.1 million for the Successor Period ended December 31, 2010 and $5.4 million for the eleven months ended November 30, 2010.
9. PROPERTY, PLANT AND EQUIPMENT
Major classes of property, plant and equipment consisted of the following:
| | | | | | | | | | | | |
(in millions) | | Estimated
Useful Lives | | | December 31,
2012 | | | December 31,
2011 | |
Land | | | | | | $ | 8.9 | | | $ | 8.7 | |
Retail stores and equipment | | | 2 - 22 years | | | | 49.1 | | | | 50.4 | |
Refinery and equipment | | | 5 - 24 years | | | | 330.4 | | | | 310.4 | |
Buildings and building improvements | | | 25 years | | | | 8.3 | | | | 6.7 | |
Software | | | 5 years | | | | 17.8 | | | | 14.7 | |
Vehicles | | | 5 years | | | | 2.9 | | | | 1.0 | |
Other equipment | | | 2 - 7 years | | | | 6.1 | | | | 1.9 | |
Precious metals | | | | | | | 10.5 | | | | 10.5 | |
Assets under construction | | | | | | | 14.3 | | | | 17.4 | |
| | | | | | | | | | | | |
| | | | | | | 448.3 | | | | 421.7 | |
Less: accumulated depreciation | | | | | | | 62.3 | | | | 30.5 | |
| | | | | | | | | | | | |
Property, plant and equipment, net | | | | | | $ | 386.0 | | | $ | 391.2 | |
| | | | | | | | | | | | |
Property, plant & equipment, net includes gross assets acquired under capital leases of $7.9 million and $12.5 million at December 31, 2012 and 2011, respectively, with related accumulated depreciation of $0.7 million and $1.4 million, respectively. The Company had depreciation expense related to capitalized software of $3.2 million and $0.7 million in the years ended December 31, 2012 and 2011, respectively.
10. INTANGIBLE ASSETS
Intangible assets are comprised of franchise rights amounting to $19.8 million and trademarks amounting to $15.6 million at both December 31, 2012 and 2011. These assets have an indefinite life and therefore are not amortized, but rather are tested for impairment annually or sooner if events or changes in circumstances indicate that the fair value of the intangible asset has been reduced below carrying value.
11. DERIVATIVES
The Company is subject to crude oil and refined product market price fluctuations caused by supply conditions, weather, economic conditions and other factors. In October 2010, at the request of the Company, MPC initiated a strategy to mitigate refining margin risk on a portion of the business’s 2011 and 2012 projected refining production. In connection with the Marathon Acquisition, derivative
95
instruments executed pursuant to this strategy, along with all corresponding rights and obligations, were assumed by the Company. The Company also may periodically use futures contracts to manage price risks associated with inventory quantities above or below target levels.
Under its risk mitigation strategy, the Company may buy or sell an amount equal to a fixed price times a certain number of barrels, and to buy or sell in return an amount equal to a specified variable price times the same amount of barrels. Physical volumes are not exchanged and these contracts are net settled with cash. The contracts are not being accounted for as hedges for financial reporting purposes. The Company recognizes all derivative instruments as either assets or liabilities at fair value on the balance sheet and any related net gain or loss is recorded as a gain or loss in the derivative activity captions on the consolidated statements of operations. Observable quoted prices for similar assets or liabilities in active markets (Level 2 as described in Note 14) are considered to determine the fair values for the purpose of marking to market the derivative instruments at each period end. At December 31, 2012 and 2011, the Company had open commodity derivative instruments consisting of crude oil futures to buy 5 million and 17 million barrels, respectively, and refined products futures and swaps to sell 5 million and 17 million barrels, respectively, primarily to mitigate the volatility of refining margins through 2012 and 2013.
All derivative contracts are marked to market at period end and the resulting gains and losses are recognized in earnings. Recognized gains and losses on derivatives were as follows:
| | | | | | | | | | | | | | | | | | |
| | | Successor | | | | | Predecessor | |
(in millions) | | Year Ended
December 31,
2012 | | | Year Ended
December 31,
2011 | | | June 23, 2010
(inception date) to
December 31,
2010 | | | | | Eleven Months
Ended
November 30,
2010 | |
Unrealized gain (loss) | | $ | 68.0 | | | $ | (41.9 | ) | | $ | (27.1 | ) | | | | $ | (40.9 | ) |
Realized loss | | | (339.4 | ) | | | (310.3 | ) | | | — | | | | | | — | |
| | | | | | | | | | | | | | | | | | |
Total recognized loss | | $ | (271.4 | ) | | $ | (352.2 | ) | | $ | (27.1 | ) | | | | $ | (40.9 | ) |
| | | | | | | | | | | | | | | | | | |
During the first and second quarter of 2012, the Company entered into arrangements to settle or re-price a portion of its existing derivative instruments ahead of their respective expiration dates. The Company incurred $136.8 million of realized losses related to these early extinguishments (included in the above table under realized loss). The cash payments for the early extinguishment of these derivative instruments were deferred at the time of settlement. In August 2012, the Company paid $92 million related to these early settlements with a portion of the proceeds from the IPO (see Note 3). The remainder of these losses came due beginning in September 2012 and ending in January 2014. The early extinguishments were treated as a current period loss as of the date of extinguishment. Interest accrues on the remaining deferred loss liabilities at a weighted average interest rate of 7.1%. Interest expense related to these liabilities for the year ended December 31, 2012 was $2.5 million. The deferred payment obligations related to these early extinguishment losses are included in the December 31, 2012 balance sheet as $28.9 million within accrued liabilities and $0.9 million in other liabilities, respectively.
The following table summarizes the fair value amounts of the Company’s outstanding derivative instruments by location on the balance sheet as of December 31, 2012 and 2011:
| | | | | | | | | | |
(in millions) | | Balance Sheet Classification | | December 31, 2012 | | | December 31, 2011 | |
Commodity swaps and futures | | Other current assets | | $ | 2.1 | | | $ | — | |
Commodity swaps and futures | | Derivative liability | | | (43.7 | ) | | | (109.9 | ) |
| | | | | | | | | | |
Net liability position | | | | $ | (41.6 | ) | | $ | (109.9 | ) |
| | | | | | | | | | |
The Company is exposed to credit risk in the event of nonperformance by its counterparty on these derivative instruments. The counterparties are large financial institutions with credit ratings of at least BBB by Standard and Poor’s and A3 by Moody’s. In the event of default, the Company would potentially be subject to losses on a derivative instrument’s mark-to-market gains. The Company does not expect nonperformance on any of its derivative instruments.
The Company is not subject to any margin calls for these crack spread derivatives and the counterparty does not have the right to demand any additional collateral. Any outstanding collateral is released to the Company upon settlement of the related derivative instrument.
96
12. DEBT
During the year ended December 31, 2012, the Company redeemed the $290 million outstanding of its 10.50% Senior Secured Notes due December 1, 2017 (“2017 Secured Notes”), completed a $275 million private placement of its 7.125% Senior Secured Notes due November 15, 2020 (“2020 Secured Notes”) and amended its $300 million secured asset-based revolving credit facility established at inception (“Initial ABL Facility”). The 2017 Senior Secured Notes and Initial ABL Facility were entered into in connection with the Marathon Acquisition.
2020 Secured Notes
On November 8, 2012, the Company privately placed $275 million in aggregate principal amount of 7.125% senior secured notes due 2020. The 2020 Secured Notes were guaranteed, jointly and severally, on a senior secured basis by all of the Company’s existing and future direct and indirect subsidiaries; however, not on a full and unconditional basis as a result of subsidiaries being able to be released as guarantors under certain customary circumstances for such arrangements. A subsidiary guarantee can be released under customary circumstances, including (a) the sale of the subsidiary, (b) the subsidiary is declared “unrestricted,” (c) the legal or covenant defeasance or satisfaction and discharge of the indenture, or (d) liquidation or dissolution of the subsidiary. The 2020 Secured Notes and the subsidiary note guarantees are secured on a pari passu basis with certain hedging agreements by a first-priority security interest in substantially all present and hereinafter acquired tangible and intangible assets of the Company and each of the subsidiary guarantors and by a second-priority security interest in the inventory, accounts receivable, investment property, general intangibles, deposit accounts and cash and cash equivalents collateralized by the ABL facility. The obligations under the 2020 Secured Notes are also fully and unconditionally guaranteed on a senior unsecured basis by NTE LP. The Company is required to make interest payments on May 15 and November 15 of each year, which commence on May 15, 2013. There are no scheduled principal payments required prior to the notes maturing on November 15, 2020.
At any time prior to the maturity date of the notes, the Company may, at its option, redeem all or any portion of the notes for the outstanding principal amount plus unpaid interest and a make-whole premium as defined in the indenture. If the Company experiences a change in control or makes certain asset dispositions, as defined under the indenture, the Company may be required to repurchase all or part of the notes plus unpaid interest and, in certain cases, pay a redemption premium.
The 2020 Secured Notes contain certain covenants that, among other things, limit the ability, subject to certain exceptions, of the Company to incur additional debt or issue preferred stock, to purchase, redeem or otherwise acquire or retire our equity interests, to make certain investments, loans and advances, to sell, lease or transfer any of our property or assets, to merge, consolidate, lease or sell substantially all of the Company’s assets, to suffer a change of control and to enter into new lines of business.
ABL Facility
On July 17, 2012, the Company entered into an amendment of its Initial ABL Facility. The amendment to the Initial ABL Facility (the “Amended ABL Facility”) is a $300 million secured asset-based revolving credit facility. The amendment, among other things, (i) changed the amount by which the aggregate principal amount of the revolving credit facility can be increased from $100 million to $150 million for a maximum aggregate principal amount of $450 million subject to borrowing base availability and lender approval, (ii) reduced the rates at which borrowings under the revolving credit facility bear interest, and (iii) extended the maturity of the revolving credit facility from December 1, 2015 to July 17, 2017.
The amendment to the revolving credit facility removed the requirement that the Company satisfy a pro forma minimum fixed charge coverage test in connection with consummating certain transactions, including the making of certain Restricted Payments and Permitted Payments (each as defined in the Amended ABL Facility). In connection with the removal of this requirement, the Amended ABL Facility also revised the springing financial covenant to provide that, if the amount available under the revolving credit facility is less than the greater of (i) 12.5% (changed from 15%) of the lesser of (x) the $300 million commitment amount and (y) the then-applicable borrowing base and (ii) $22.5 million, the Company must comply with a minimum Fixed Charge Coverage Ratio (as defined in the Amended ABL Facility) of at least 1.0 to 1.0. Other covenants that were common to both the Initial ABL Facility and the Amended ABL Facility include, but are not limited to: restrictions, subject to certain exceptions, on the ability of the Company and its subsidiaries to sell or otherwise dispose of assets, incur additional indebtedness or issue preferred stock, pay dividends and distributions or repurchase capital stock, create liens on assets, make investments, loans or advances, make certain acquisitions, engage in mergers or consolidations, and engage in certain transactions with affiliates.
In connection with this amendment, the Company recognized a one-time, non-cash charge to interest expense of approximately $3.5 million during 2012 related to the write-off of previously capitalized deferred financing costs.
Borrowings under the Amended ABL Facility bear interest, at the Company’s option, at either (a) an alternative base rate, plus an applicable margin (ranging between 1.00% and1.50%) or (b) a LIBOR rate plus applicable margin (ranging between 2.00% and 2.50%). The alternate base rate is the greater of (a) the prime rate, (b) the Federal Funds Effective rate plus 50 basis points, or (c) the one-month LIBOR rate plus 100 basis points and a spread of up to 225 basis points based upon percentage utilization of this facility. In addition to paying interest on outstanding borrowings, the Company is also required to pay an annual commitment fee ranging from 0.375% to 0.500% and letter of credit fees.
97
As of December 31, 2012, the borrowing base under the Amended ABL Facility was $168.4 million and availability under the Amended ABL Facility was $131.9 million (which is net of $36.5 million in outstanding letters of credit). The Company had no borrowings under the Amended ABL Facility at December 31, 2012 or under the Initial ABL Facility at December 31, 2011.
2017 Secured Notes
The 2017 Secured Notes were guaranteed, jointly and severally, on a senior secured basis by all of the Company’s existing and future direct and indirect subsidiaries; however, not on a full and unconditional basis as a result of subsidiaries being able to be released as guarantors under certain customary circumstances for such arrangements. A subsidiary guarantee can be released under customary circumstances, including (a) the sale of the subsidiary, (b) the subsidiary is declared “unrestricted,” (c) the legal or covenant defeasance or satisfaction and discharge of the indenture, or (d) liquidation or dissolution of the subsidiary. The Company was required to make interest payments on June 1 and December 1 of each year, which commenced on June 1, 2011. There were no scheduled principal payments required prior to the notes maturing on December 1, 2017. Borrowings bore interest at 10.50%.
At any time prior to the maturity date of the notes, the Company could, at its option, redeem all or any portion of the notes for the outstanding principal amount plus unpaid interest and a make-whole premium as defined in the indenture.
During the year ended December 31, 2012, the Company redeemed the 2017 Secured Notes in multiple transactions, $29 million of the principal amount at a redemption price of $103.0 of the principal thereof out of the proceeds from the NTE LP IPO that were contributed by NTE LP to the Company (see note 3), $258 million of the principal amount at a weighted average redemption price of $114.9 of the principal thereof with proceeds from the concurrent issuance of the 2020 Secured Notes and the remaining $3 million of the principal amount at a redemption price of $103.0 of the principal thereof just subsequent to the second anniversary of the original issuance date. Due to these early redemptions, the Company recognized a non-cash charge of $10.5 million to write off the unamortized deferred financing cost on these bonds and redemption premiums of $39.5 million. The total loss on the early redemptions of $50.0 million is included in the Loss on early extinguishment of debt caption on the statement of operations.
13. MEMBER’S INTEREST
Prior to July 31, 2012, NT Holdings held the sole membership interest in the Company. During the second quarter of 2012 and the third quarter of 2011, the Company made distributions of $40.0 million and $2.5 million, respectively, to NT Holdings. Subsequent to July 31, 2012, NTE LP held the sole membership interest in NTE LLC (see Note 3). In the third quarter of 2012, NTE LP contributed the net proceeds of its IPO to NTE LLC. Subsequently, NTE LLC distributed $124.2 million to NTE LP who, in turn, distributed that amount to NT Holdings of which approximately $92 million was used to redeem MPC’s existing perpetual payment in kind preferred interest in NT Holdings.
During the fourth quarter of 2012, the Company distributed $136 million to NTE LP who in turn paid cash distributions of $1.48 per unit to its common unitholders of record as of November 21, 2012. This distribution was related to cash generated by the Company in the third quarter of 2012. On February 11, 2013, NTE LP declared a quarterly distribution of $1.27 per unit to its common unitholders of record as of February 21, 2013. This distribution of $117 million in aggregate is based on available cash generated during the fourth quarter of 2012 by the Company and will be paid via a distribution of cash from the Company to NTE LP.
14. FAIR VALUE MEASUREMENTS
As defined in accounting guidance, fair value is the price that would be received for the sale of an asset or paid to transfer a liability in an orderly transaction between market participants at the measurement date. Accounting guidance describes three approaches to measuring the fair value of assets and liabilities: the market approach, the income approach and the cost approach, each of which includes multiple valuation techniques. The market approach uses prices and other relevant information generated by market transactions involving identical or comparable assets or liabilities. The income approach uses valuation techniques to measure fair value by converting future amounts, such as cash flows or earnings, into a single present value amount using current market expectations about those future amounts. The cost approach is based on the amount that would currently be required to replace the service capacity of an asset. This is often referred to as current replacement cost. The cost approach assumes that the fair value would not exceed what it would cost a market participant to acquire or construct a substitute asset of comparable utility, adjusted for obsolescence.
98
Accounting guidance does not prescribe which valuation technique should be used when measuring fair value and does not prioritize among the techniques. Accounting guidance establishes a fair value hierarchy that prioritizes the inputs used in applying the various valuation techniques. Inputs broadly refer to the assumptions that market participants use to make pricing decisions, including assumptions about risk. Level 1 inputs are given the highest priority in the fair value hierarchy while Level 3 inputs are given the lowest priority. The three levels of the fair value hierarchy are as follows:
| | • | | Level 1—Observable inputs that reflect unadjusted quoted prices for identical assets or liabilities in active markets as of the reporting date. Active markets are those in which transactions for the asset or liability occur in sufficient frequency and volume to provide pricing information on an ongoing basis. |
| | • | | Level 2—Observable market-based inputs or unobservable inputs that are corroborated by market data. These are inputs other than quoted prices in active markets included in Level 1, which are either directly or indirectly observable as of the reporting date. |
| | • | | Level 3—Unobservable inputs that are not corroborated by market data and may be used with internally developed methodologies that result in management’s best estimate of fair value. |
The Company uses a market or income approach for recurring fair value measurements and endeavors to use the best information available. Accordingly, valuation techniques that maximize the use of observable inputs are favored. The assessment of the significance of a particular input to the fair value measurement requires judgment and may affect the placement of assets and liabilities within the levels of the fair value hierarchy.
The Company’s current asset and liability accounts contain certain financial instruments, the most significant of which are trade accounts receivables and trade payables. The Company believes the carrying values of its current assets and liabilities approximate fair value. The Company’s fair value assessment incorporates a variety of considerations, including the short-term duration of the instruments, the Company’s historical incurrence of insignificant bad debt expense and the Company’s expectation of future insignificant bad debt expense, which includes an evaluation of counterparty credit risk.
The following table provides the assets and liabilities carried at fair value measured on a recurring basis at December 31, 2012 and 2011:
| | | | | | | | | | | | | | | | |
(in millions) | | Balance at
December 31, 2012 | | | Quoted
prices in
active
markets
(Level 1) | | | Significant
other
observable
inputs
(Level 2) | | | Unobservable
inputs
(Level 3) | |
ASSETS | | | | | | | | | | | | | | | | |
Cash and cash equivalents | | $ | 272.9 | | | $ | 272.9 | | | $ | — | | | $ | — | |
Other current assets | | | | | | | | | | | | | | | | |
Derivative asset - current | | | 2.1 | | | | — | | | | 2.1 | | | | — | |
| | | | | | | | | | | | | | | | |
| | $ | 275.0 | | | $ | 272.9 | | | $ | 2.1 | | | $ | — | |
| | | | | | | | | | | | | | | | |
LIABILITIES | | | | | | | | | | | | | | | | |
Derivative liability - current | | $ | 43.7 | | | $ | — | | | $ | 43.7 | | | $ | — | |
| | | | | | | | | | | | | | | | |
| | $ | 43.7 | | | $ | — | �� | | $ | 43.7 | | | $ | — | |
| | | | | | | | | | | | | | | | |
| | | | | | | | | | | | | | | | |
(in millions) | | Balance at
December 31, 2011 | | | Quoted
prices in
active
markets
(Level 1) | | | Significant
other
observable
inputs
(Level 2) | | | Unobservable
inputs
(Level 3) | |
ASSETS | | | | | | | | | | | | | | | | |
Cash and cash equivalents | | $ | 123.5 | | | $ | 123.5 | | | $ | — | | | $ | — | |
Other assets | | | | | | | | | | | | | | | | |
Contingent consideration - margin support | | | 20.2 | | | | — | | | | — | | | | 20.2 | |
| | | | | | | | | | | | | | | | |
| | $ | 143.7 | | | $ | 123.5 | | | $ | — | | | $ | 20.2 | |
| | | | | | | | | | | | | | | | |
LIABILITIES | | | | | | | | | | | | | | | | |
Derivative liability - current | | $ | 109.9 | | | $ | — | | | $ | 109.9 | | | $ | — | |
Other liabilities | | | | | | | | | | | | | | | | |
Contingent consideration - earn-out | | | 30.9 | | | | — | | | | — | | | | 30.9 | |
| | | | | | | | | | | | | | | | |
| | $ | 140.8 | | | $ | — | | | $ | 109.9 | | | $ | 30.9 | |
| | | | | | | | | | | | | | | | |
99
As of December 31, 2012, the Company had no Level 3 fair value assets or liabilities. In conjunction with the NTE LP IPO (see Note 3), the Company terminated the contingent consideration arrangements (margin support and earn-out) with MPC and settled all outstanding assets and liabilities by paying MPC $40 million in cash, by NT Holdings issuing a $45 million perpetual payment in kind preferred interest in NT Holdings to MPC and by the Company forgiving the $30 million margin support receivable owed by MPC to the Company. The Company recorded $104.3 million of contingent consideration losses during the year ended December 31, 2012 related to the changes in value and settlement of these arrangements.
Prior to the settlement, the Company determined the fair value of its contingent consideration arrangements based on a probability-weighted income approach derived from financial performance estimates. The impacts of changes in the fair value of these arrangements were recorded in the statements of operations as contingent consideration (loss) income. These contingent consideration arrangements were reported at fair value using Level 3 inputs due to such arrangements not having observable market prices. The fair value of the arrangements was determined based on a Monte Carlo simulation prepared by a third party service provider using management projections of future period EBITDA levels.
Changes in the fair value of the Company’s Level 3 contingent consideration arrangements during the years ended December 31, 2012 and 2011 were due to updated financial performance estimates and are as follows:
| | | | | | | | | | | | |
(in millions) | | Margin
Support | | | Earnout | | | Net
Impact | |
Fair Value at December 31, 2010 | | $ | 17.3 | | | $ | (53.8 | ) | | $ | (36.5 | ) |
Transfer to Receivable from MPC (included in other current assets) | | | (30.0 | ) | | | — | | | | (30.0 | ) |
Change in fair value of remaining years | | | 32.9 | | | | 22.9 | | | | 55.8 | |
| | | | | | | | | | | | |
Fair Value at December 31, 2011 | | $ | 20.2 | | | $ | (30.9 | ) | | $ | (10.7 | ) |
| | | | | | | | | | | | |
Change in fair value of remaining years | | | (20.2 | ) | | | (84.1 | ) | | | (104.3 | ) |
Settlement of contingent consideration agreements | | | — | | | | 115.0 | | | | 115.0 | |
| | | | | | | | | | | | |
Fair Value at December 31, 2012 | | $ | — | | | $ | — | | | $ | — | |
| | | | | | | | | | | | |
The significant unobservable inputs used in the fair value measurement of the Company’s Level 3 instruments were the management projections of EBITDA. In developing these management projections, the Company used the forward market prices for various crude oil types, other feedstocks and refined products and applied its historical operating performance metrics against those forward market prices to develop its projected future EBITDA. Significant increases (decreases) in the projected future EBITDA levels would have resulted in significantly higher (lower) fair value measurements.
Assets not recorded at fair value on a recurring basis, such as property, plant and equipment, intangible assets and cost method investments, are recognized at fair value when they are impaired. During the years ended December 31, 2012 and 2011 and the eleven months ended November 30, 2010, there were no adjustments to the fair value of such assets. The Company recorded assets acquired and liabilities assumed in the Marathon Acquisition at fair value.
The carrying value of debt, which is reported on the Company’s consolidated balance sheets, reflects the cash proceeds received upon its issuance, net of subsequent repayments. The fair value of the 2017 and 2020 (collectively) Secured Notes disclosed below was determined based on quoted prices in active markets (Level 1).
| | | | | | | | | | | | | | | | |
| | | December 31, 2012 | | | December 31, 2011 | |
(in millions) | | Carrying
Amount | | | Fair
Value | | | Carrying
Amount | | | Fair
Value | |
Secured Notes | | $ | 275.0 | | | $ | 282.9 | | | $ | 290.0 | | | $ | 316.5 | |
100
15. ASSET RETIREMENT OBLIGATIONS
The following table summarizes the changes in asset retirement obligations:
| | | | | | | | | | | | | | | | | | |
| | | Successor | | | | | Predecessor | |
(in millions) | | Year Ended
December 31, 2012 | | | Year Ended
December 31, 2011 | | | June 23, 2010
(inception date) to
December 31, 2010 | | | | | Eleven Months
Ended
November 30, 2010 | |
Asset retirement obligation balance at beginning of period | | $ | 1.5 | | | $ | 2.1 | | | $ | 2.1 | | | | | $ | 3.3 | |
Revisions of previous estimates | | | 0.2 | | | | (0.9 | ) | | | — | | | | | | — | |
Accretion expense | | | 0.2 | | | | 0.3 | | | | — | | | | | | 0.2 | |
Liabilities settled | | | — | | | | — | | | | — | | | | | | (0.1 | ) |
| | | | | | | | | | | | | | | | | | |
Asset retirement obligation balance at end of period | | $ | 1.9 | | | $ | 1.5 | | | $ | 2.1 | | | | | $ | 3.4 | |
| | | | | | | | | | | | | | | | | | |
As a result of the Acquisition, the asset retirement obligation of the Predecessor was adjusted to a fair value of $2.1 million.
16. EQUITY-BASED COMPENSATION
The Company and its affiliates maintain two distinct equity-based compensation plans designed to encourage employees and directors of the Company and its affiliates to achieve superior performance. The initial plan (the “NT Investor Plan”) is sponsored by members of NT Investors, the parent company of NT Holdings, and granted profit unit interests in NT Investors. The second plan is maintained by the general partner of NTE LP and is referred to as the 2012 Long-Term Incentive Plan (“LTIP”). All equity-based compensation expense related to both plans is recognized by the Company.
NT Investor Plan
The NT Investor Plan is an equity participation plan which provides for the award of profit interest units in NT Investors to certain employees and independent non-employee directors of the Company. Approximately 29 million profit interest units in NT Investors are reserved for issuance under the plan. The exercise price for a profit interest unit shall not be less than 100% of the fair market value of NT Investors equity units on the date of grant. Profit interest units vest in annual installments over a period of five years from the date of grant and expire ten years after the date of grant. Upon NT Investors meeting certain thresholds of distributions from NTE LLC and NTE LP, profit interest unit vesting will accelerate. Continued employment in any subsidiary of NT Investors is a condition of vesting and, as such, compensation expense is recognized in the Company’s financial statements over the vesting period based upon the fair value of the award on the date of grant. This compensation expense is a non-cash expense of the Company. The NT Investor Plan awards are satisfied by cash distributions made to NT Holdings and will not dilute the Company’s available cash. No further awards are planned to be issued from the NT Investor Plan. During the first quarter of 2013, distributions to NT Holdings exceeded the predefined distribution threshold and all profit interest units vested (see Note 22).
A summary of the NT Investor Plan’s profit interest unit activity is set forth below:
| | | | | | | | | | | | |
| | | Number of
NT Investor
Profit Units
(in millions) | | | Weighted
Average
Exercise
Price | | | Weighted
Average
Remaining
Contractual
Term | |
Outstanding at inception | | $ | — | | | $ | — | | | | | |
Granted | | | 22.7 | | | | 1.78 | | | | | |
| | | | | | | | | | | | |
Outstanding at December 31, 2010 | | | 22.7 | | | | 1.78 | | | | 9.9 | |
Granted | | | 3.5 | | | | 2.23 | | | | | |
Cancelled | | | (2.0 | ) | | | (1.38 | ) | | | | |
| | | | | | | | | | | | |
Outstanding at December 31, 2011 | | | 24.2 | | | | 1.87 | | | | 9.2 | |
Granted | | | 1.5 | | | | 2.57 | | | | | |
Cancelled | | | (6.2 | ) | | | (1.78 | ) | | | | |
| | | | | | | | | | | | |
Outstanding at December 31, 2012 | | $ | 19.5 | | | $ | 1.96 | | | | 8.1 | |
| | | | | | | | | | | | |
101
The estimated weighted average fair value as of the grant date for NT Investor Plan profit interest units granted during the year ended December 31, 2012, the year ended December 31, 2011 and the Successor Period ended December 31, 2010 were $0.88 and $0.57 and $0.30, respectively, based upon the following assumptions:
| | | | | | | | | | |
| | | 2012 | | | 2011 | | 2010 | |
Expected life (years) | | | 6.5 | | | 5.75 - 6.5 | | | 6.5 | |
Expected volatility | | | 55.5 | % | | 40.6% - 49.6% | | | 40.6 | % |
Expected dividend yield | | | 0.0 | % | | 0.0% | | | 0.0 | % |
Risk-free interest rate | | | 1.4 | % | | 2.5% - 2.7% | | | 2.7 | % |
The weighted average expected life for the grants was calculated using the simplified method, which defines the expected life as the average of the contractual term of the options and the weighted average vesting period. The expected volatility for the grants was based primarily on the historical volatility of a representative group of peer companies for a period consistent with the expected life of the awards.
For the years ended December 31, 2012 and 2011 and the Successor Period ended December 31, 2010, the Company recognized $0.9 million, $1.6 million and $0.1 million, respectively, of compensation costs related to profit interest units. As of December 31, 2012 and 2011, the total unrecognized compensation cost for NT Investor Plan profit interest units was $5.3 million and $7.0 million, respectively.
LTIP
Approximately 9.2 million NTE LP common units are reserved for issuance under the LTIP. The LTIP was created concurrent with NTE LP’s IPO and permits the award of unit options, restricted units, phantom units, unit appreciation rights and other awards to employees of NTE LLC that derive their value from the market price of NTE LP’s common units. As of December 31, 2012, 6,112 restricted common units of NTE LP with a fair value of $0.2 million on the grant date had been awarded to certain employees. These restricted units generally vest over a three year period from the anniversary date of the awards. These restricted unitholders are entitled to receive cash distributions and participate in voting on an equal basis with unrestricted common unitholders.
17. EMPLOYEE BENEFIT PLANS
Defined Contribution Plans
During 2011, the Company began sponsoring qualified defined contribution plans (collectively, the “Retirement Savings Plans”) for eligible employees. Eligibility is based upon a minimum age requirement and a minimum level of service. Participants may make contributions for a percentage of their annual compensation subject to Internal Revenue Service limits. The Company provides a matching contribution at the rate of 100% of up to between 4.5% and 7.0% (depending on the participant group) of a participant’s contribution. The Company also provides a non-elective fixed annual contribution of 2.0% to 3.5% of eligible compensation depending on the participant group. Total Company contributions to the Retirement Savings Plans were $3.7 million and $0.6 million for the years ended December 31, 2012 and 2011, respectively.
Defined Benefit Plans
During 2011, the Company also began to sponsor a defined benefit cash balance pension plan (the “Cash Balance Plan”) for eligible employees. Company contributions are made to the cash account of the participants equal to 5.0% of eligible compensation. Participants’ cash accounts also receive interest credits each year based upon the average thirty year United States Treasury bond rate published in September preceding the respective plan year. Participants become fully vested in their accounts after three years of service.
During 2012, the Company began to sponsor a plan to provide retirees with health care benefits prior to age 65 (the “Retiree Medical Plan”) for eligible employees. Eligible employees may participate in the Company’s health care benefits after retirement subject to cost-sharing features. To be eligible for the Retiree Medical Plan employees must have completed at least 10 years of service with the Company, inclusive of year of service with the Predecessor, and be between the ages of 55 and 65 years old.
Funded Status and Net Period Benefit Costs
The changes to the benefit obligation, fair value of plan assets and funded status of the Cash Balance Plan and the Retiree Medical Plan (the “Plans”) for the years ended December 31, 2012 and 2011 were as follows:
102
| | | | | | | | | | | | |
| | | Cash Balance Plan | | | Retiree Medical Plan | |
| | | Years Ended December 31, | | | Year Ended
December 31, 2012 | |
(in millions) | | 2012 | | | 2011 | | |
Change in benefit obligation: | | | | | | | | | | | | |
Benefit obligation at beginning of year | | $ | 0.5 | | | $ | — | | | $ | — | |
Service cost | | | 1.7 | | | | 0.1 | | | | 0.1 | |
Interest cost | | | 0.1 | | | | — | | | | 0.1 | |
Actuarial loss | | | — | | | | — | | | | 0.8 | |
Plan amendments | | | — | | | | 0.4 | | | | 1.4 | |
| | | | | | | | | | | | |
Benefit obligation at end of year | | $ | 2.3 | | | $ | 0.5 | | | $ | 2.4 | |
| | | | | | | | | | | | |
Change in plan assets: | | | | | | | | | | | | |
Fair value of plan assets at beginning of year | | $ | 0.1 | | | $ | — | | | $ | — | |
Employer contributions | | | 2.1 | | | | 0.1 | | | | — | |
Benefits paid | | | (0.1 | ) | | | — | | | | — | |
| | | | | | | | | | | | |
Fair value of plan assets at end of year | | $ | 2.1 | | | $ | 0.1 | | | $ | — | |
| | | | | | | | | | | | |
Reconciliation of funded status: | | | | | | | | | | | | |
Fair value of plan assets at end of year | | $ | 2.1 | | | $ | 0.1 | | | $ | — | |
Benefit obligation at end of year | | | 2.3 | | | | 0.5 | | | | 2.4 | |
| | | | | | | | | | | | |
Funded status at end of year | | $ | (0.2 | ) | | $ | (0.4 | ) | | $ | (2.4 | ) |
| | | | | | | | | | | | |
At December 31, 2012 and 2011, the projected benefit obligations exceeded the fair value of the Plans’ assets by $2.6 million and $0.4 million, respectively. This unfunded obligation is classified in other liabilities on the consolidated balance sheets.
The components of net periodic benefit cost and other amounts recognized in equity related to the Plans for the years ended December 31, 2012 and 2011 were as follows:
| | | | | | | | | | | | |
| | | Cash Balance Plan | | | Retiree Medical Plan | |
| | | Years Ended December 31, | | | Year Ended
December 31, 2012 | |
(in millions) | | 2012 | | | 2011 | | |
Components of net periodic benefit cost: | | | | | | | | | | | | |
Service cost | | $ | 1.7 | | | $ | 0.1 | | | $ | 0.1 | |
Amortization of prior service cost | | | — | | | | — | | | | 0.1 | |
Interest cost | | | 0.1 | | | | — | | | | 0.1 | |
| | | | | | | | | | | | |
Net periodic benefit cost | | $ | 1.8 | | | $ | 0.1 | | | $ | 0.3 | |
| | | | | | | | | | | | |
Changes recognized in other comprehensive loss: | | | | | | | | | | | | |
Prior service cost | | $ | (0.1 | ) | | $ | 0.4 | | | $ | 1.3 | |
Actuarial loss | | | — | | | | — | | | | 0.8 | |
Experience loss | | | 0.1 | | | | — | | | | — | |
| | | | | | | | | | | | |
Total changes recognized in other comprehensive loss | | $ | — | | | $ | 0.4 | | | $ | 2.1 | |
| | | | | | | | | | | | |
Assumptions
The weighted average assumptions used to determine the Company’s benefit obligations are as follows:
| | | | | | | | | | | | |
| | | Cash Balance Plan | | | Retiree Medical Plan | |
| | | Years Ended December 31, | | | Year Ended
December 31, 2012 | |
| | | 2012 | | | 2011 | | |
Discount rate | | | 4.00 | % | | | 4.75 | % | | | 4.00 | % |
Rate of compensation increase | | | 4.00 | % | | | 4.00 | % | | | N/A | |
Health care cost trend rate: | | | | | | | | | | | | |
Initial rate | | | N/A | | | | N/A | | | | 7.50 | % |
Ultimate rate | | | N/A | | | | N/A | | | | 5.00 | % |
Years to ultimate | | | N/A | | | | N/A | | | | 5 | |
103
The weighted average assumptions used to determine the net periodic benefit cost are as follows:
| | | | | | | | | | | | |
| | | Cash Balance Plan | | | Retiree Medical Plan | |
| | | Years Ended December 31, | | | Year Ended
December 31, 2012 | |
| | | 2012 | | | 2011 | | |
Discount rate | | | 4.75 | % | | | 5.00 | % | | | 4.75 | % |
Expected long-term rate of return on plan assets | | | 4.50 | % | | | 4.50 | % | | | N/A | |
Rate of compensation increase | | | 4.00 | % | | | 4.00 | % | | | N/A | |
Health care cost trend rate: | | | | | | | | | | | | |
Initial rate | | | N/A | | | | N/A | | | | 7.50 | % |
Ultimate rate | | | N/A | | | | N/A | | | | 5.00 | % |
Years to ultimate | | | N/A | | | | N/A | | | | 5 | |
The assumptions used in the determination of the Company’s obligations and benefit cost are based upon management’s best estimates as of the annual measurement date. The discount rate utilized was based upon bond portfolio curves over a duration similar to the Cash Balance Plan’s and Retiree Medical Plan’s respective expected future cash flows as of the measurement date. The expected long-term rate of return on plan assets is the weighted average rate of earnings expected of the funds invested or to be invested based upon the targeted investment strategy for the plan. The assumed average rate of compensation increase is the average annual compensation increase expected over the remaining employment periods for the participating employees.
Contributions, Plan Assets and Estimated Future Benefit Payments
Employer contributions to the Cash Balance Plan of $2.1 million and $0.1 million were made during the year ended December 31, 2012 and 2011, respectively. These contributions were invested into equity and bond mutual funds and money market funds which are deemed Level 1 assets as described in Note 14. The Company expects funding requirements of approximately $2.2 million during the year ended December 31, 2013.
At December 31, 2012, anticipated benefit payments to participants from the Plans in future years are as follows:
| | | | | | | | |
(in millions) | | Cash Balance Plan | | | Retiree Medical Plan | |
2013 | | $ | 0.1 | | | $ | — | |
2014 | | | 0.1 | | | | — | |
2015 | | | 0.3 | | | | — | |
2016 | | | 0.3 | | | | 0.1 | |
2017 | | | 0.4 | | | | 0.1 | |
2018 - 2022 | | | 4.2 | | | | 0.7 | |
18. SUPPLEMENTAL CASH FLOW INFORMATION
Supplemental cash flow information is as follows:
| | | | | | | | | | | | | | | | | | |
| | | Successor | | | | | Predecessor | |
(in millions) | | December 31,
2012 | | | December 31,
2011 | | | June 23, 2010
(inception date) to
December 31,
2010 | | | | | Eleven Months
Ended
November 30,
2010 | |
Net cash from operating activities included: | | | | | | | | | | | | | | | | | | |
Interest paid | | $ | 32.9 | | | $ | 37.9 | | | $ | — | | | | | $ | — | |
Income taxes paid | | | — | | | | — | | | | — | | | | | | 67.9 | |
Noncash investing and financing activities include: | | | | | | | | | | | | | | | | | | |
Capital expenditures included in accounts payable | | | 1.2 | | | | — | | | | — | | | | | | — | |
PP&E recognized (derecognized) in sale leaseback | | $ | (4.7 | ) | | $ | (12.1 | ) | | $ | 24.5 | | | | | $ | — | |
Acquisition consideration funded by Investors | | | — | | | | — | | | | 80.0 | | | | | | — | |
PP&E contributions by Marathon | | | — | | | | — | | | | — | | | | | | 0.6 | |
19. LEASING ARRANGEMENTS
As described in Note 5, concurrent with the Marathon Acquisition, certain Marathon assets (including real property interests and land related to 135 of the SuperAmerica convenience stores and the SuperMom’s bakery) were sold to a third party equity real estate investment trust. In connection with the closing of the Marathon Acquisition, the Company has assumed the leasing of these properties from the real estate investment trust on a long-term basis.
104
In accordance with ASC Topic 840-40 “Sale Leaseback Transactions,” the Company determined that subsequent to the sale, it had a continuing involvement for a portion of these property interests due to potential environmental obligations or due to subleasing arrangements. For these respective properties, the fair value of the assets and the related financing obligation will remain on the Company’s consolidated balance sheet until the end of the lease term or until the continuing involvement is resolved. The assets are included in property, plant and equipment and are being depreciated over their remaining useful lives. The lease payments relating to these property interests are recognized as interest expense. Subsequent to the initial transaction, the Company’s continuing involvement ended for a subset of these stores and, as such, the related fair value of the assets and the financing obligation for these stores have been removed from the Company’s consolidated balance sheet.
The remainder of properties sold to the third party real estate investment trust are treated as operating leases. The Company also leases a variety of facilities and equipment under other operating leases, including land and building space, office equipment, vehicles, including trucks to transport crude oil, rail tracks for storage of rail tank cars near the refinery and numerous rail tank cars.
Future minimum commitments for operating lease obligations having an initial or remaining non-cancelable lease terms in excess of one year are as follows:
| | | | |
(in million) | | | |
2013 | | $ | 23.5 | |
2014 | | | 23.3 | |
2015 | | | 22.7 | |
2016 | | | 22.2 | |
2017 | | | 21.6 | |
Thereafter | | | 163.8 | |
| | | | |
Total noncancelable operating lease payments | | $ | 277.1 | |
| | | | |
Rental expense was $23.5 million, $24.2 million, $2.2 million and $5.3 million for the years ended December 31, 2012 and 2011, the Successor Period ended December 31, 2010 and the eleven month period ended November 30, 2010, respectively.
20. COMMITMENTS AND CONTINGENCIES
The Company is the subject of, or party to, contingencies and commitments involving a variety of matters. Certain of these matters are discussed below. The ultimate resolution of these contingencies could, individually or in the aggregate, be material to the Company’s consolidated financial statements. However, management believes that the Company will remain a viable and competitive enterprise even though it is possible that these contingencies could be resolved unfavorably.
Environmental Matters
The Company is subject to federal, state, local and foreign laws and regulations relating to the environment. These laws generally provide for control of pollutants released into the environment and require responsible parties to undertake remediation of hazardous waste disposal sites. Penalties may be imposed for noncompliance. At December 31, 2012 and 2011, liabilities for remediation totaled $3.0 million and $4.7 million, respectively. These liabilities are expected to be settled over at least the next 10 years. It is not presently possible to estimate the ultimate amount of all remediation costs that might be incurred or the penalties that may be imposed. Furthermore, environmental remediation costs may vary from estimates because of changes in laws, regulations and their interpretation; additional information on the extent and nature of site contamination; and improvements in technology. Receivables for recoverable costs from the state, under programs to assist companies in clean-up efforts related to underground storage tanks at retail marketing outlets, and others were $0.3 million and $0.2 million at December 31, 2012 and 2011, respectively.
Franchise Agreements
In the normal course of its business, SAF enters into ten-year license agreements with the operators of franchised SuperAmerica brand retail outlets. These agreements obligate SAF or its affiliates to provide certain services including information technology support, maintenance, credit card processing and signage for specified monthly fees.
Guarantees
Certain agreements related to assets sold in the normal course of business contain performance and general guarantees, including guarantees regarding inaccuracies in representations, warranties, covenants and agreements, and environmental and general indemnifications that require the Company to perform upon the occurrence of a triggering event or condition. These guarantees and indemnifications were part of the normal course of selling assets. The Company has assumed these guarantees and indemnifications upon the Marathon Acquisition. However, in certain cases, MPC LP has also provided an indemnification in favor of the Company.
105
The Company is not typically able to calculate the maximum potential amount of future payments that could be made under such contractual provisions because of the variability inherent in the guarantees and indemnities. Most often, the nature of the guarantees and indemnities is such that there is no appropriate method for quantifying the exposure because the Company has little or no past experience associated with the underlying triggering event upon which a reasonable prediction of the outcome can be based. The Company is not currently making any payments relating to such guarantees or indemnifications.
106
21. SEGMENT INFORMATION
The Company has two reportable operating segments: Refining and Retail. Each of these segments is organized and managed based upon the nature of the products and services they offer. The segment disclosures reflect management’s current organizational structure. The Company’s interest in MPLI and Minnesota Pipe Line were previously presented within the “Other” segment by the Predecessor. Additionally, the Company’s presentation of certain sales to franchisees is different from the Predecessor’s practice. All Predecessor period information has been recast to conform to the current presentation. Operating results for the Company’s operating segments are as follows:
| | | | | | | | | | | | | | | | |
(in millions) | | Refining | | | Retail | | | Other | | | Total | |
Year ended December 31, 2012 | | | | | | | | | | | | | | | | |
Revenues | | | | | | | | | | | | | | | | |
Customer | | $ | 3,171.5 | | | $ | 1,482.4 | | | $ | — | | | $ | 4,653.9 | |
Intersegment | | | 1,041.1 | | | | — | | | | — | | | | 1,041.1 | |
| | | | | | | | | | | | | | | | |
Segment revenues | | | 4,212.6 | | | | 1,482.4 | | | | — | | | | 5,695.0 | |
Elimination of intersegment revenues | | | — | | | | — | | | | (1,041.1 | ) | | | (1,041.1 | ) |
| | | | | | | | | | | | | | | | |
Total revenues | | $ | 4,212.6 | | | $ | 1,482.4 | | | $ | (1,041.1 | ) | | $ | 4,653.9 | |
| | | | | | | | | | | | | | | | |
Income (loss) from operations | | $ | 707.3 | | | $ | 8.7 | | | $ | (143.6 | ) | | $ | 572.4 | |
Income from equity method investment | | $ | 12.3 | | | $ | — | | | $ | — | | | $ | 12.3 | |
Depreciation and amortization | | $ | 25.4 | | | $ | 6.6 | | | $ | 1.2 | | | $ | 33.2 | |
Capital expenditures | | $ | 24.2 | | | $ | 4.6 | | | $ | 2.1 | | | $ | 30.9 | |
| | | | |
(in millions) | | Refining | | | Retail | | | Other | | | Total | |
Year ended December 31, 2011 | | | | | | | | | | | | | | | | |
Revenues | | | | | | | | | | | | | | | | |
Customer | | $ | 2,761.0 | | | $ | 1,519.8 | | | $ | — | | | $ | 4,280.8 | |
Intersegment | | | 1,043.1 | | | | — | | | | — | | | | 1,043.1 | |
| | | | | | | | | | | | | | | | |
Segment revenues | | | 3,804.1 | | | | 1,519.8 | | | | — | | | | 5,323.9 | |
Elimination of intersegment revenues | | | — | | | | — | | | | (1,043.1 | ) | | | (1,043.1 | ) |
| | | | | | | | | | | | | | | | |
Total revenues | | $ | 3,804.1 | | | $ | 1,519.8 | | | $ | (1,043.1 | ) | | $ | 4,280.8 | |
| | | | | | | | | | | | | | | | |
Income from operations | | $ | 388.2 | | | $ | 14.0 | | | $ | 20.4 | | | $ | 422.6 | |
Income from equity method investment | | $ | 5.7 | | | $ | — | | | $ | — | | | $ | 5.7 | |
Depreciation and amortization | | $ | 21.5 | | | $ | 7.2 | | | $ | 0.8 | | | $ | 29.5 | |
Capital expenditures | | $ | 33.9 | | | $ | 9.2 | | | $ | 2.8 | | | $ | 45.9 | |
| | | | |
(in millions) | | Refining | | | Retail | | | Other | | | Total | |
Period ended December 31, 2010 (Successor) | | | | | | | | | | | | | | | | |
Revenues | | | | | | | | | | | | | | | | |
Customer | | $ | 242.0 | | | $ | 102.9 | | | $ | — | | | $ | 344.9 | |
Intersegment | | | 70.2 | | | | — | | | | — | | | | 70.2 | |
| | | | | | | | | | | | | | | | |
Segment revenues | | | 312.2 | | | | 102.9 | | | | — | | | | 415.1 | |
Elimination of intersegment revenues | | | — | | | | — | | | | (70.2 | ) | | | (70.2 | ) |
| | | | | | | | | | | | | | | | |
Total revenues | | $ | 312.2 | | | $ | 102.9 | | | $ | (70.2 | ) | | $ | 344.9 | |
| | | | | | | | | | | | | | | | |
Income (loss) from operations | | $ | 9.1 | | | $ | 0.5 | | | $ | (5.9 | ) | | $ | 3.7 | |
Income from equity method investment | | $ | 0.1 | | | $ | — | | | $ | — | | | $ | 0.1 | |
Depreciation and amortization | | $ | 1.7 | | | $ | 0.5 | | | $ | — | | | $ | 2.2 | |
Capital expenditures | | $ | 2.5 | | | $ | — | | | $ | — | | | $ | 2.5 | |
107
| | | | | | | | | | | | | | | | |
(in millions) | | Refining | | | Retail | | | Other | | | Total | |
Eleven months ended November 30, 2010 (Predecessor) | | | | | | | | | | | | | | | | |
Revenues | | | | | | | | | | | | | | | | |
Customer | | $ | 1,778.3 | | | $ | 1,206.8 | | | $ | — | | | $ | 2,985.1 | |
Intersegment | | | 811.4 | | | | — | | | | — | | | | 811.4 | |
Related parties | | | 210.1 | | | | — | | | | — | | | | 210.1 | |
| | | | | | | | | | | | | | | | |
Segment revenues | | | 2,799.8 | | | | 1,206.8 | | | | — | | | | 4,006.6 | |
Elimination of intersegment revenues | | | — | | | | — | | | | (811.4 | ) | | | (811.4 | ) |
| | | | | | | | | | | | | | | | |
Total revenues | | $ | 2,799.8 | | | $ | 1,206.8 | | | $ | (811.4 | ) | | $ | 3,195.2 | |
| | | | | | | | | | | | | | | | |
Income from operations | | $ | 142.8 | | | $ | 26.5 | | | $ | — | | | $ | 169.3 | |
Income from equity method investment | | $ | 5.4 | | | $ | — | | | $ | — | | | $ | 5.4 | |
Depreciation and amortization | | $ | 24.9 | | | $ | 12.4 | | | $ | — | | | $ | 37.3 | |
Capital expenditures | | $ | 29.4 | | | $ | 0.4 | | | $ | — | | | $ | 29.8 | |
Intersegment sales from the Refining segment to the Retail segment consist primarily of sales of refined products which are recorded based on contractual prices that are market based. Revenues from external customers are nearly all in the United States.
Total assets by segment were as follows:
| | | | | | | | | | | | | | | | |
(in millions) | | Refining | | | Retail | | | Corporate/Other | | | Total | |
At December 31, 2012 | | $ | 706.1 | | | $ | 134.7 | | | $ | 297.4 | | | $ | 1,138.2 | |
| | | | | | | | | | | | | | | | |
At December 31, 2011 | | $ | 646.5 | | | $ | 130.2 | | | $ | 222.1 | | | $ | 998.8 | |
| | | | | | | | | | | | | | | | |
Total assets for the Refining and Retail segments exclude all intercompany balances. All cash and cash equivalents are included as Corporate/Other assets. All property, plant and equipment are located in the United States.
22. SUBSEQUENT EVENTS
During the first quarter of 2013, NT Holdings successfully completed a secondary offering of units of NTE LP to the public. Including the overallotment exercised by the underwriters, NT Holdings sold 12.3 million common units of NTE LP at a public offering price of $24.46 per unit. The Company did not receive any proceeds from this offering. All proceeds of this offering were received by NT Holdings. As a result of this secondary offering, a predefined threshold of distributions within the NT Investor Plan was exceeded and vesting accelerated on all outstanding profit units in the NT Investor Plan. As such, a non-cash charge of $5.3 million will be reflected in the first quarter of 2013 related to the profit units becoming fully vested.
Supplementary Quarterly Financial Information (Unaudited)
| | | | | | | | | | | | | | | | | | | | |
(in millions, except per unit data) | | First
Quarter | | | Second
Quarter | | | Third
Quarter | | | Fourth
Quarter | | | Total | |
2012 | | | | | | | | | | | | | | | | | | | | |
Revenue | | $ | 999.1 | | | $ | 1,155.2 | | | $ | 1,263.5 | | | $ | 1,236.1 | | | $ | 4,653.9 | |
Operating income | | | 2.7 | | | | 225.7 | | | | 199.4 | | | | 144.6 | | | | 572.4 | |
Net income | | | (193.6 | ) | | | 246.6 | | | | 61.1 | | | | 84.9 | | | | 199.0 | |
2011 | | | | | | | | | | | | | | | | | | | | |
Revenue | | $ | 940.2 | | | $ | 1,092.3 | | | $ | 1,159.5 | | | $ | 1,088.8 | | | $ | 4,280.8 | |
Operating income | | | 100.7 | | | | 80.7 | | | | 165.7 | | | | 75.5 | | | | 422.6 | |
Net income | | | (224.5 | ) | | | (42.1 | ) | | | 2.2 | | | | 292.7 | | | | 28.3 | |
108
| Item 9. | Changes in and Disagreements with Accountants on Accounting and Financial Disclosure. |
None.
| Item 9A. | Controls and Procedures. |
Evaluation of Disclosure Controls and Procedures
As required by Rule 13a-15(b) under the Exchange Act, we have evaluated, under the supervision and with the participation of our management, including our principal executive officer and principal financial officer, the effectiveness of the design and operation of our disclosure controls and procedures (as defined in Rules 13a-15(e) and 15d-15(e) under the Exchange Act) as of the end of the period covered by this report. Our disclosure controls and procedures are designed to provide reasonable assurance that the information required to be disclosed by us in reports that we file or submit under the Exchange Act is accumulated and communicated to our management, including our principal executive officer and principal financial officer, as appropriate, to allow timely decisions regarding required disclosure and is recorded, processed, summarized and reported within the time periods specified in the rules and forms of the SEC. Based upon that evaluation, our principal executive officer and principal financial officer concluded that our disclosure controls and procedures were effective as of the end of the period covered by this report at the reasonable assurance level.
Management’s Report on Internal Control Over Financial Reporting
This report does not include a report of management’s assessment regarding internal control over financial reporting due to a transition period established by the rules of the SEC for newly public companies.
Attestation Report of the Registered Public Accounting Firm
This report does not include an attestation report of our independent registered public accounting firm due to a transition period established by the rules of the SEC for newly public companies.
Change in Internal Control Over Financial Reporting
There have been no changes in our internal controls over financial reporting (as defined in Rule 13a-15(f) under the Exchange Act) during our last fiscal quarter that have materially affected, or are reasonably likely to materially affect, our internal controls over financial reporting.
| Item 9B. | Other Information. |
None.
109
PART III
| Item 10. | Directors, Executive Officers and Corporate Governance. |
Item 10 is not presented herein as the registrant meets the requirements set forth in the General Instructions (I)(1)(a) and (b).
110
| Item 11. | Executive Compensation. |
Item 11 is not presented herein as the registrant meets the requirements set forth in the General Instructions (I)(1)(a) and (b).
111
| Item 12. | Security Ownership of Certain Beneficial Owners and Management and Related Unitholder Matters. |
Item 12 is not presented herein as the registrant meets the requirements set forth in the General Instructions (I)(1)(a) and (b).
112
| Item 13. | Certain Relationships and Related Transactions and Director Independence. |
Item 13 is not presented herein as the registrant meets the requirements set forth in the General Instructions (I)(1)(a) and (b).
113
| Item 14. | Principal Accounting Fees and Services. |
We have engaged PricewaterhouseCoopers LLP as our independent registered public accounting firm. The following table presents fees for the audit of the Partnership’s annual consolidated financial statements for the last two fiscal years and for other services provided by PricewaterhouseCoopers LLP:
| | | | | | | | |
Thousands | | 2012 | | | 2011 | |
Audit fees | | $ | 903 | | | $ | 441 | |
All other fees | | | — | | | | 3 | |
| | | | | | | | |
Total | | $ | 903 | | | $ | 444 | |
| | | | | | | | |
Audit Committee Approval of Audit and Non-Audit Services
Our Audit Committee has adopted a Pre-Approval Policy with respect to services that may be performed by PricewaterhouseCoopers LLP. This policy lists specific audit-related services as well as any other services that PricewaterhouseCoopers LLP is authorized to perform and sets out specific dollar limits for each specific service, which may not be exceeded without additional Audit Committee authorization. The Audit Committee receives quarterly reports on the status of expenditures pursuant to that Pre-Approval Policy. The Audit Committee reviews the policy at least annually in order to approve services and limits for the current year. Any service that is not clearly enumerated in the policy must receive specific pre-approval by the Audit Committee or by its Chairperson, to whom such authority has been conditionally delegated, prior to engagement. During 2012, all fees reported above were approved in accordance with the Pre-Approval Policy.
The Audit Committee has approved the appointment of PricewaterhouseCoopers LLP as independent registered public accounting firm to conduct the audit of the Partnership’s consolidated financial statements for the year ending December 31, 2013.
114
PART IV
| Item 15. | Exhibits and Financial Statement Schedules |
(a)The following documents are filed as part of this Report:
| | (1) | Reports of Independent Registered Public Accounting Firm |
Consolidated Balance Sheets as of December 31, 2012 and 2011
Consolidated and Combined Statements of Operations and Comprehensive Income for the Years Ended December 31, 2012 and 2011 and the period from June 23, 2010 (inception date) to December 31, 2010 and the eleven months ended November 30, 2010
Consolidated and Combined Statements of Cash Flows for the Years Ended December 31, 2012 and 2011 and the period from June 23, 2010 (inception date) to December 31, 2010 and the eleven months ended November 30, 2010
Consolidated and Combined Statements of Equity for the Years Ended December 31, 2012 and 2011 and the period from June 23, 2010 (inception date) to December 31, 2010 and the eleven months ended November 30, 2010
Notes to Consolidated and Combined Financial Statements
The following documents are filed or furnished as part of this annual report on Form 10-K. The Company will furnish a copy of any exhibit listed to requesting stockholders upon payment of the Company’s reasonable expenses in furnishing those materials.
| | |
Exhibit
Number | | Description |
| |
| 2.1 | | Formation Agreement, dated October 6, 2010, by and among Marathon Petroleum Company LP, Speedway SuperAmerica LLC and Northern Tier Investors, LLC (Incorporated by reference to Exhibit 2.1 to the Registration Statement on Form S-1, File No. 333-178457, filed on December 13, 2011). |
| |
| 2.2 | | St. Paul Park Refining Co. LLC Contribution Agreement, dated October 6, 2010, by and among Marathon Petroleum Company LP, St. Paul Park Refining Co. LLC and Northern Tier Investors, LLC (Incorporated by reference to Exhibit 2.2 to the Registration Statement on Form S-1, File No. 333-178457, filed on December 13, 2011). |
| |
| 2.3 | | Northern Tier Retail LLC Contribution Agreement, dated October 6, 2010, by and among Speedway SuperAmerica LLC, Northern Tier Retail LLC and Northern Tier Investors, LLC (Incorporated by reference to Exhibit 2.3 to the Registration Statement on Form S-1, File No. 333-178457, filed on December 13, 2011). |
| |
| 2.4 | | Northern Tier Bakery LLC Contribution Agreement, dated October 6, 2010, by and among Speedway SuperAmerica LLC, SuperMom’s LLC, Northern Tier Retail LLC and Northern Tier Investors, LLC (Incorporated by reference to Exhibit 2.4 to the Registration Statement on Form S-1, File No. 333-178457, filed on December 13, 2011). |
| |
| 3.1 | | Certificate of Limited Partnership of Northern Tier Energy LP (Incorporated by reference to Exhibit 3.1 to the Registration Statement on Form S-1, File No. 333-178457, filed on July 2, 2012). |
| |
| 3.2 | | First Amended and Restated Agreement of Limited Partnership of Northern Tier Energy LP, dated July 31, 2012 (Incorporated by reference to Exhibit 3.1 to our Current Report on Form 8-K, File No. 001-35612, filed on August 2, 2012). |
| |
| 4.1 | | Indenture, dated as of November 8, 2012, by and among Northern Tier Energy LLC, Northern Tier Finance Corporation, Northern Tier Energy LP, the subsidiary guarantors parties thereto and Deutsche Bank Trust Company Americas (Incorporated by reference to Exhibit 4.1 to our Current Report on Form 8-K, File No. 001-35612, filed on November 13, 2012). |
| |
| 4.2 | | Supplemental Indenture, dated as of November 2, 2012, by and among Northern Tier Energy LLC, Northern Tier Finance Corporation, the subsidiary guarantors party thereto and Deutsche Bank Trust Company Americas, as trustee and collateral agent (Incorporated by reference to our Current Report on Form 8-K, File No. 001-35162, filed on November 6, 2012). |
| |
| 4.3 | | Registration Rights Agreement, dated as of November 8, 2012, by and among Northern Tier Energy LLC, Northern Tier Finance Corporation, Northern Tier Energy LP, the subsidiary guarantors parties thereto and Deutsche Bank Trust Company Americas (Incorporated by reference to Exhibit 4.2 to our Current Report on Form 8-K, File No. 001-35612, filed on November 13, 2012). |
115
| | |
Exhibit
Number | | Description |
| |
| 10.1 | | Transaction Agreement, dated July 25, 2012 by and among Northern Tier Holdings LLC, Northern Tier Energy GP LLC, Northern Tier Energy LLC, Northern Tier Energy Holdings LLC, Northern Tier Retail Holdings LLC and Northern Tier Energy LP (Incorporated by reference to Exhibit 10.1 to our Current Report on Form 8-K, File No. 001-35612, filed on July 30, 2012). |
| |
| 10.2 | | Amended and Restated Registration Rights Agreement, dated July 31, 2012, by and among TPG Refining, L.P., ACON Refining Partners, L.L.C., NTI Management Company, L.P., NTR Partners LLC, NTR Partners II LLC, Northern Tier Investors, LLC, Northern Tier Holdings LLC and Northern Tier Energy LP (Incorporated by reference to Exhibit 4.1 to our Current Report on Form 8-K, File No. 001-35612, filed on August 2, 2012). |
| |
| 10.3 | | Credit Agreement, dated December 1, 2010, by and among the financial institutions party thereto, J.P. Morgan Chase Bank, N.A., Bank of America, N.A., Macquarie Capital (USA) Inc., Royal Bank of Canada and SunTrust Bank, St. Paul Park Refining Co. LLC, Northern Tier Bakery LLC, Northern Tier Retail LLC, SuperAmerica Franchising LLC, Northern Tier Energy LLC and each other subsidiary of Northern Tier Energy LLC from time to time party thereto (Incorporated by reference to Exhibit 10.5 to the Registration Statement on Form S-1, File No. 333-178457, filed on December 13, 2011). |
| |
| 10.4(c) | | Employment Agreement between Northern Tier Energy LLC and Mario Rodriguez (Incorporated by reference to Exhibit 10.6 to the Registration Statement on Form S-1, File No. 333-178457, filed on December 13, 2011). |
| |
| 10.5(c) | | Employment Agreement between Northern Tier Energy LLC and Hank Kuchta (Incorporated by reference to Exhibit 10.7 to the Registration Statement on Form S-1, File No. 333-178457, filed on December 13, 2011). |
| |
| 10.6(c) | | Offer Letter between Northern Tier Energy LLC and Dave Bonczek, dated February 7, 2011 (Incorporated by reference to Exhibit 10.9 to the Registration Statement on Form S-1, File No. 333-178457, filed on December 13, 2011). |
| |
| 10.7(c) | | Offer Letter between Northern Tier Energy LLC and Greg Mullins, dated December 1, 2010 (Incorporated by reference to Exhibit 10.8 to the Registration Statement on Form S-1, File No. 333-178457, filed on July 2, 2012). |
| |
| 10.8 | | Amended and Restated Management Services Agreement, dated as of January 1, 2012, by and among Northern Tier Energy, LLC, TPG VI Management, LLC and ACON Funds Management L.L.C. (Incorporated by reference to Exhibit 10.11 to the Registration Statement on Form S-1, File No. 333-178457, filed on February 10, 2012). |
| |
| 10.9(c) | | Northern Tier Energy LP 2012 Long-Term Incentive Plan (Incorporated by reference to our Current Report on Form 8-K, File No. 001-35612, filed on July 30, 2012). |
| |
| †10.10 | | Amended and Restated Crude Oil Supply Agreement dated March 29, 2012, by and between J.P. Morgan Commodities Canada Corporation and St. Paul Park Refining Co. LLC. (Incorporated by reference to Exhibit 10.9 to Northern Tier Energy LLC’s Registration Statement on Form S-4, File No. 333-178458, filed on April 20, 2012). |
| |
| 10.11 | | Settlement Agreement and Release dated May 4, 2012, by and between Northern Tier Energy LLC and Marathon Petroleum Company LP. (Incorporated by reference to Exhibit 10.14 to the Registration Statement on Form S-1, File No. 333-178457, filed on May 7, 2012). |
| |
| 10.12 | | First Amendment to the Credit Agreement, dated as of July 17, 2012, by and among the financial institutions party thereto, as the lenders, J.P. Morgan Chase Bank, N.A., as administrative agent and collateral agent, Bank of America, N.A., as syndication agent, and Macquarie Capital (USA) Inc. and SunTrust Bank, as co-documentation agents, and Northern Tier Energy LLC and certain subsidiaries of Northern Tier Energy LLC party thereto (Incorporated by reference to Exhibit 10.13 to the Registration Statement on Form S-1, File No. 333-178457, filed on July 18, 2012). |
| |
| 10.13(c) | | Separation Agreement and General Release dated December 21, 2012, between Mario E. Rodriguéz and Northern Tier Energy LLC (Incorporated by reference to Exhibit 10.1 to our Current Report on Form 8-K, File No. 001-35612, filed on December 21, 2012). |
| |
| 10.14(c) | | Form of Restricted Unit Agreement (Incorporated by reference to Exhibit 10.1 to our Current Report on Form 8-K, File No. 001-35612, filed on December 17, 2012). |
116
| | |
Exhibit
Number | | Description |
| |
| 31.1(a) | | Certification of Hank Kuchta, President and Chief Executive Officer of Northern Tier Energy LLC for the December 31, 2012 Annual Report on Form 10-K, pursuant to Section 302 of the Sarbanes-Oxley Act of 2002. |
| |
| 31.2(a) | | Certification of David Bonczek, Chief Financial Officer of Northern Tier Energy LLC, for the December 31, 2012 Annual Report on Form 10-K, pursuant to Section 302 of the Sarbanes-Oxley Act of 2002. |
| |
| 32.1(b) | | Certification of Hank Kuchta, President and Chief Executive Officer of Northern Tier Energy LLC for the December 31, 2012 Annual Report on Form 10-K, pursuant to Section 906 of the Sarbanes-Oxley Act of 2002. |
| |
| 32.2(b) | | Certification of David Bonczek, Chief Financial Officer of Northern Tier Energy LLC for the December 31, 2012 Annual Report on Form 10-K, pursuant to Section 906 of the Sarbanes-Oxley Act of 2002. |
| |
| 101.INS(b) | | XBRL Instance Document. |
| |
| 101.SCH(b) | | XBRL Taxonomy Extension Schema Document. |
| |
| 101.CAL(b) | | XBRL Taxonomy Extension Calculation Linkbase Document. |
| |
| 101.DEF(b) | | XBRL Taxonomy Extension Definition Linkbase Document. |
| |
| 101.LAB(b) | | XBRL Taxonomy Extension Label Linkbase Document. |
| |
| 101.PRE(b) | | XBRL Taxonomy Extension Presentation Linkbase Document. |
| (c) | Denotes management contract, compensatory plan or arrangement |
| † | Certain portions have been omitted pursuant to a confidential treatment request granted on May 14, 2012. Omitted information has been separately filed with the Securities and Exchange Commission. |
117
SIGNATURES
Pursuant to the requirements of Section 13 or 15(d) of the Securities Exchange Act of 1934, the registrant has duly caused this report to be signed on its behalf by the undersigned, thereunto duly authorized.
| | |
| Northern Tier Energy LLC |
| |
| By: | | /s/ Hank Kuchta |
| Name: | | Hank Kuchta |
| Title: | | President, Chief Executive Officer and Director of Northern Tier Energy LLC |
Pursuant to the requirements of the Securities Exchange Act of 1934, this report has been signed by the following persons on behalf of the registrant and in the capacities and on the dates indicated:
| | | | |
Signature | | Title | | Date |
| | |
/s/ HANK KUCHTA Hank Kuchta | | President, Chief Executive Officer and
Director of Northern Tier Energy LLC | | April 1, 2013 |
| | |
/s/ DAVID BONCZEK David Bonczek | | Chief Financial Officer of Northern Tier Energy LLC (Principal Financial Officer and Principal Accounting
Officer) | | April 1, 2013 |
| | |
/s/ DAN F. SMITH Dan F. Smith | | Director and Executive Chairman of
Northern Tier Energy LLC | | April 1, 2013 |
| | |
/s/ BERNARD W. ARONSON Bernard W. Aronson | | Director of Northern Tier Energy LLC | | April 1, 2013 |
| | |
/s/ JONATHAN GINNS Jonathan Ginns | | Director of Northern Tier Energy LLC | | April 1, 2013 |
| | |
/s/ THOMAS HOFMANN Thomas Hofmann | | Director of Northern Tier Energy LLC | | April 1, 2013 |
| | |
/s/ SCOTT D. JOSEY Scott D. Josey | | Director of Northern Tier Energy LLC | | April 1, 2013 |
| | |
/s/ ERIC LIAW Eric Liaw | | Director of Northern Tier Energy LLC | | April 1, 2013 |
| | |
/s/ MICHAEL MACDOUGALL Michael MacDougall | | Director of Northern Tier Energy LLC | | April 1, 2013 |
118
EXHIBIT INDEX
The exhibits below are numbered in accordance with the Exhibit Table of Item 601 of Regulation S-K.
| | |
Exhibit
Number | | Description |
| |
| 2.1 | | Formation Agreement, dated October 6, 2010, by and among Marathon Petroleum Company LP, Speedway SuperAmerica LLC and Northern Tier Investors, LLC (Incorporated by reference to Exhibit 2.1 to the Registration Statement on Form S-1, File No. 333-178457, filed on December 13, 2011). |
| |
| 2.2 | | St. Paul Park Refining Co. LLC Contribution Agreement, dated October 6, 2010, by and among Marathon Petroleum Company LP, St. Paul Park Refining Co. LLC and Northern Tier Investors, LLC (Incorporated by reference to Exhibit 2.2 to the Registration Statement on Form S-1, File No. 333-178457, filed on December 13, 2011). |
| |
| 2.3 | | Northern Tier Retail LLC Contribution Agreement, dated October 6, 2010, by and among Speedway SuperAmerica LLC, Northern Tier Retail LLC and Northern Tier Investors, LLC (Incorporated by reference to Exhibit 2.3 to the Registration Statement on Form S-1, File No. 333-178457, filed on December 13, 2011). |
| |
| 2.4 | | Northern Tier Bakery LLC Contribution Agreement, dated October 6, 2010, by and among Speedway SuperAmerica LLC, SuperMom’s LLC, Northern Tier Retail LLC and Northern Tier Investors, LLC (Incorporated by reference to Exhibit 2.4 to the Registration Statement on Form S-1, File No. 333-178457, filed on December 13, 2011). |
| |
| 3.1 | | Certificate of Limited Partnership of Northern Tier Energy LP (Incorporated by reference to Exhibit 3.1 to the Registration Statement on Form S-1, File No. 333-178457, filed on July 2, 2012). |
| |
| 3.2 | | First Amended and Restated Agreement of Limited Partnership of Northern Tier Energy LP, dated July 31, 2012 (Incorporated by reference to Exhibit 3.1 to our Current Report on Form 8-K, File No. 001-35612, filed on August 2, 2012). |
| |
| 4.1 | | Indenture, dated as of November 8, 2012, by and among Northern Tier Energy LLC, Northern Tier Finance Corporation, Northern Tier Energy LP, the subsidiary guarantors parties thereto and Deutsche Bank Trust Company Americas (Incorporated by reference to Exhibit 4.1 to our Current Report on Form 8-K, File No. 001-35612, filed on November 13, 2012). |
| |
| 4.2 | | Supplemental Indenture, dated as of November 2, 2012, by and among Northern Tier Energy LLC, Northern Tier Finance Corporation, the subsidiary guarantors party thereto and Deutsche Bank Trust Company Americas, as trustee and collateral agent (Incorporated by reference to our Current Report on Form 8-K, File No. 001-35162, filed on November 6, 2012). |
| |
| 4.3 | | Registration Rights Agreement, dated as of November 8, 2012, by and among Northern Tier Energy LLC, Northern Tier Finance Corporation, Northern Tier Energy LP, the subsidiary guarantors parties thereto and Deutsche Bank Trust Company Americas (Incorporated by reference to Exhibit 4.2 to our Current Report on Form 8-K, File No. 001-35612, filed on November 13, 2012). |
| |
| 10.1 | | Transaction Agreement, dated July 25, 2012 by and among Northern Tier Holdings LLC, Northern Tier Energy GP LLC, Northern Tier Energy LLC, Northern Tier Energy Holdings LLC, Northern Tier Retail Holdings LLC and Northern Tier Energy LP (Incorporated by reference to Exhibit 10.1 to our Current Report on Form 8-K, File No. 001-35612, filed on July 30, 2012). |
| |
| 10.2 | | Amended and Restated Registration Rights Agreement, dated July 31, 2012, by and among TPG Refining, L.P., ACON Refining Partners, L.L.C., NTI Management Company, L.P., NTR Partners LLC, NTR Partners II LLC, Northern Tier Investors, LLC, Northern Tier Holdings LLC and Northern Tier Energy LP (Incorporated by reference to Exhibit 4.1 to our Current Report on Form 8-K, File No. 001-35612, filed on August 2, 2012). |
| |
| 10.3 | | Credit Agreement, dated December 1, 2010, by and among the financial institutions party thereto, J.P. Morgan Chase Bank, N.A., Bank of America, N.A., Macquarie Capital (USA) Inc., Royal Bank of Canada and SunTrust Bank, St. Paul Park Refining Co. LLC, Northern Tier Bakery LLC, Northern Tier Retail LLC, SuperAmerica Franchising LLC, Northern Tier Energy LLC and each other subsidiary of Northern Tier Energy LLC from time to time party thereto (Incorporated by reference to Exhibit 10.5 to the Registration Statement on Form S-1, File No. 333-178457, filed on December 13, 2011). |
| |
| 10.4(c) | | Employment Agreement between Northern Tier Energy LLC and Mario Rodriguez (Incorporated by reference to Exhibit 10.6 to the Registration Statement on Form S-1, File No. 333-178457, filed on December 13, 2011). |
119
| | |
Exhibit
Number | | Description |
| |
| 10.5(c) | | Employment Agreement between Northern Tier Energy LLC and Hank Kuchta (Incorporated by reference to Exhibit 10.7 to the Registration Statement on Form S-1, File No. 333-178457, filed on December 13, 2011). |
| |
| 10.6(c) | | Offer Letter between Northern Tier Energy LLC and Dave Bonczek, dated February 7, 2011 (Incorporated by reference to Exhibit 10.9 to the Registration Statement on Form S-1, File No. 333-178457, filed on December 13, 2011). |
| |
| 10.7(c) | | Offer Letter between Northern Tier Energy LLC and Greg Mullins, dated December 1, 2010 (Incorporated by reference to Exhibit 10.8 to the Registration Statement on Form S-1, File No. 333-178457, filed on July 2, 2012). |
| |
| 10.8 | | Amended and Restated Management Services Agreement, dated as of January 1, 2012, by and among Northern Tier Energy, LLC, TPG VI Management, LLC and ACON Funds Management L.L.C. (Incorporated by reference to Exhibit 10.11 to the Registration Statement on Form S-1, File No. 333-178457, filed on February 10, 2012). |
| |
| 10.9(c) | | Northern Tier Energy LP 2012 Long-Term Incentive Plan (Incorporated by reference to our Current Report on Form 8-K, File No. 001-35612, filed on July 30, 2012). |
| |
| †10.10 | | Amended and Restated Crude Oil Supply Agreement dated March 29, 2012, by and between J.P. Morgan Commodities Canada Corporation and St. Paul Park Refining Co. LLC. (Incorporated by reference to Exhibit 10.9 to Northern Tier Energy LLC’s Registration Statement on Form S-4, File No. 333-178458, filed on April 20, 2012). |
| |
| 10.11 | | Settlement Agreement and Release dated May 4, 2012, by and between Northern Tier Energy LLC and Marathon Petroleum Company LP. (Incorporated by reference to Exhibit 10.14 to the Registration Statement on Form S-1, File No. 333-178457, filed on May 7, 2012). |
| |
| 10.12 | | First Amendment to the Credit Agreement, dated as of July 17, 2012, by and among the financial institutions party thereto, as the lenders, J.P. Morgan Chase Bank, N.A., as administrative agent and collateral agent, Bank of America, N.A., as syndication agent, and Macquarie Capital (USA) Inc. and SunTrust Bank, as co-documentation agents, and Northern Tier Energy LLC and certain subsidiaries of Northern Tier Energy LLC party thereto (Incorporated by reference to Exhibit 10.13 to the Registration Statement on Form S-1, File No. 333-178457, filed on July 18, 2012). |
| |
| 10.13(c) | | Separation Agreement and General Release dated December 21, 2012, between Mario E. Rodriguéz and Northern Tier Energy LLC (Incorporated by reference to Exhibit 10.1 to our Current Report on Form 8-K, File No. 001-35612, filed on December 21, 2012). |
| |
| 10.14(c) | | Form of Restricted Unit Agreement (Incorporated by reference to Exhibit 10.1 to our Current Report on Form 8-K, File No. 001-35612, filed on December 17, 2012). |
| |
| 31.1(a) | | Certification of Hank Kuchta, President and Chief Executive Officer of Northern Tier Energy LLC for the December 31, 2012 Annual Report on Form 10-K, pursuant to Section 302 of the Sarbanes-Oxley Act of 2002. |
| |
| 31.2(a) | | Certification of David Bonczek, Chief Financial Officer of Northern Tier Energy LLC for the December 31, 2012 Annual Report on Form 10-K, pursuant to Section 302 of the Sarbanes-Oxley Act of 2002. |
| |
| 32.1(b) | | Certification of Hank Kuchta, President and Chief Executive Officer of Northern Tier Energy LLC for the December 31, 2012 Annual Report on Form 10-K, pursuant to Section 906 of the Sarbanes-Oxley Act of 2002. |
| |
| 32.2(b) | | Certification of David Bonczek, Chief Financial Officer of Northern Tier Energy LLC for the December 31, 2012 Annual Report on Form 10-K, pursuant to Section 906 of the Sarbanes-Oxley Act of 2002. |
| |
| 101.INS(b) | | XBRL Instance Document. |
| |
| 101.SCH(b) | | XBRL Taxonomy Extension Schema Document. |
| |
| 101.CAL(b) | | XBRL Taxonomy Extension Calculation Linkbase Document. |
120
| | |
Exhibit
Number | | Description |
| |
| 101.DEF(b) | | XBRL Taxonomy Extension Definition Linkbase Document. |
| |
| 101.LAB(b) | | XBRL Taxonomy Extension Label Linkbase Document. |
| |
| 101.PRE(b) | | XBRL Taxonomy Extension Presentation Linkbase Document. |
| (c) | Denotes management contract, compensatory plan or arrangement. |
| † | Certain portions have been omitted pursuant to a confidential treatment request granted on May 14, 2012. Omitted information has been separately filed with the Securities and Exchange Commission. |
121