united states
securities and exchange commission
washington, d.c. 20549
form n-csr
certified shareholder report of registered management
investment companies
Investment Company Act file number 811-22655
Northern Lights Fund Trust III
(Exact name of registrant as specified in charter)
225 Pictoria Drive, Ste 450, Cincinatti, Ohio 45246
(Address of principal executive offices) (Zip code)
The Corporation Trust Company
1209 Orange Street Wilmington, DE 19801
(Name and address of agent for service)
Registrant's telephone number, including area code: 631-490-4300
Date of fiscal year end: 9/30
Date of reporting period: 9/30/22
Item 1. Reports to Stockholders.

Class I Shares – LSEIX
Annual Report
September 30, 2022
1-855-233-8300
www.persimmonfunds.com.
Distributed by Northern Lights Distributors, LLC
Member FINRA

Dear Fellow Shareholders:
We are pleased to provide you with the fiscal year-end update for the Persimmon Long Short Fund. The past year has seen the world’s economies attempt to transition to a post pandemic state. Unfortunately, the transition has been marked by a series of unforeseen events and policy missteps that has upended the growth trajectory of the recovery.
At the beginning of the fiscal year the world’s supply chains were strained as economies reopened and undue stress was placed across a just-in-time logistics system ill equipped to handle disruptions. Delays and shortages created a domino effect compounding themselves throughout the globe. Inflation was starting to pop up due to supply chain issues as shortages resulted in competition for scarce products. Used car lots ran empty and to secure a home, buyers were bidding ten of thousands of dollars above the asking price and waiving all contingencies. Throughout this period of turmoil, the Federal Reserve continued their emergency response program of buying treasuries and mortgages, all while talking down the developments in the economy as being contained to supply issues that would be resolved and ultimately prove to be transitory. The buying program continued through March 9th, 2022, injecting liquidity into a system that was in dire need of a liquidity drain.
March marked a change in policy as the Fed not only ended the QE program but also announced the path of tightening that would accompany the first rise in the Fed Funds target rate, moving the world out of the zero-rate environment we had experienced since the onset of the pandemic. No longer would liquidity be abundant and borrowing be cheap. The geopolitical landscape was thrown into complete disarray when Russia invaded Ukraine. War is a humanitarian crisis, but it also requires an analysis of the economic impact that results. For decades Europe has had a tenuous relationship with Russia centered around the supply of oil and natural gas. Ukraine is a key cog in this energy relationship serving as the largest conduit into Europe. In addition to facilitating the flow of energy, Ukraine is the breadbasket of Europe and exporter of metals and minerals. Supply issues were magnified with these additional disruptions and compounded by a war premium further spiraling inflation.
Inflation is as much a psychological phenomenon as it is a logistics issue. Goods based inflation started to abate over the summer giving hopes that peak inflation was behind us, but under the surface there was a rotation away from goods-based inflation into services. Service inflation speaks more to the psychological side of the phenomenon as a barber or a tax preparer, for example, does not have direct cost of goods that are rising but increases the cost of their services in response to the prevailing market environment and their belief of what will occur in the coming months. Goods based inflation can be transitory and as it abates it tends to deflate, where prices that have run up will typically revert towards the starting levels as supply and demand come back into balance. Services inflation is sticky and tends to stay in the economy setting a higher price level. The rise of this sticky inflation will stress consumers as prices rise and pressure companies’ margins as they are unable to fully pass along their costs.
The market continued to discount the risks of a systemic change in the investing landscape, lifting markets into 2022. The first quarter of the year did little to change the narrative as the shift from QE to QT was initially well digested. The markets ended the first six months of the fiscal year in essentially the same place they had started but the opportunistic tone in the markets materially shifted in concert with the rise of sticky inflation. As inflation persisted the Fed was forced to respond with ever aggressive policies to break the psychological compounding effects from taking root in the economy. March through September was defined by the continued rise in the Fed’s terminal rate and the pace of rate increases. Each rise in expectation of how far the Fed would need to raise rates was met with a selloff in the equity markets. Pricing within the stock market was extremely stretched as we entered 2022, with pockets of the market being traded at greater valuations than prior to the dot com crash and the Global Financial Crisis. Rising rates resulted in pricing and exuberance being pulled out of the market. The areas of the market that had
1777 Sentry Parkway West, VEVA 14, Suite 102, Blue Bell, PA 19422
484-572-0500 ● www.dakotawm.com
1
experienced the greatest rise in pricing, such as pre-profitability tech companies and the crypto space, were the first wave to collapse as risk appetite for these investments waned. As markets progressed through the tightening cycle pricing was adjusted across not only the highflyers but the market as a whole resulting in a multiple compression bear market.
The past year exhibited wide dispersion in performance across market segments. The Russell 1000 Value index outperformed the Russell 1000 Growth Index by approximately 10% (-13.24% vs -23.25%). While the drawdowns in the large cap space resulted in a bear market, returns in the high growth and high multiple tech space were far worse. The Nasdaq Next Gen 100 index, a proxy for smaller growth companies, lost 32.5% of its value during the trailing year.
The Persimmon Long Short Fund was able to mitigate a substantial portion of the market selloff of the past year falling by 6.34%, about 40% of the S&P 500 downside. The objective of the fund is to deliver risk managed S&P 500 exposure. To meet this objective, the fund remains singularly focused on mitigating large drawdown events. The past year has delivered market sell offs that have been intertwined with bear market rallies of more than 10%. The fund has retained a negative exposure bias due to the ongoing headwinds in the market but has been able to significantly contribute when the market has turned higher. The Fed is nearing the end of their projected rate hiking cycle but still has some work to do throughout the rest of 2022 and into the first quarter of 2023. While the fund has accomplished the main objective of protecting capital and limiting the magnitude of the drawdown to date we continue to remain focused on the risk of the potential for further economic slowdown and a resulting equity market selloff. Capital preservation is the primary focus at this point in the cycle, however, we continue to balance the potential for the market to have bottomed and look for signs that we can add significant exposure back into the portfolio for a sustained rally.
You have entrusted us with your capital with the belief that over the long run the Fund will effectively manage market exposure at the appropriate time. We continue to evolve our process and have placed a new emphasis on monetizing the hedges to reduce the pain during choppy markets where small pull backs do not turn into larger corrections or bear markets.
The following table summarizes returns of the Fund alongside the S&P 500 and the HFRX Equity Hedge Index:
| As of September 30th | YTD | 1 Year | 5 Year | Inception to Date* |
| Fund – LSEIX | -12.48% | -6.34% | 1.91% | 3.02% |
| HFRX Equity Hedge Index | -4.81% | -2.29% | 2.84% | 3.18% |
| S&P 500 TR | -23.83% | -15.43% | 8.72% | 10.65% |
| * | Inception Date 01/01/2013 |
Returns greater than one year are annualized
We thank you for your continued support and encourage you to reach out to us with any questions you may have.
Sincerely,
The Dakota Wealth Investment Team
1777 Sentry Parkway West, VEVA 14, Suite 102, Blue Bell, PA 19422
484-572-0500 ● www.dakotawm.com
2
The above table contains the Fund returns as of the last quarter end. Performance is based on the return of the Institutional class shares (LSEIX). The maximum sales charge (load) for Class A is 5.00%. The performance data quoted here represents past performance. For more current performance information, please call toll free 855 233 8300 or visit our website, www.persimmonfunds.com. Current performance may be lower or higher than the performance data quoted above. Past performance is no guarantee of future results. The investment return and principal value of an investment in the investment adviser has contractually agreed to reduce its fees and/or absorb expenses until at least January 31, 2022, to ensure that net annual, operating expenses of the Class I Shares will not exceed 1.99% respectively, subject to the possible recoupment from the Fund in future years. Without these waivers, the Class I shares total annual operating expenses would be 2.07%. Please review the Fund prospectus for more information regarding the Fund’s fees and expenses, including other share classes.
PROSPECTUS OFFERING
Investors should carefully consider the investment objectives, risks, charges and expenses of the Persimmon Long Short Fund. This and other important information about the Fund is contained in the prospectus, which can be obtained at www.persimmonfunds.com or by calling 855-233-8300. The prospectus should be read carefully before investing. The Persimmon Long Short Fund is distributed by Northern Lights Distributors, LLC, member FINRA.
Dakota Wealth Management, LP is not affiliated with Northern Lights Distributors, LLC.
RISK DISCLOSURE
Mutual Funds involve risk including the possible loss of principal.
The Fund will invest a percentage of its assets in derivatives and options contracts. The use of such investments and the resulting high portfolio turn-over, may expose the Fund to additional risks that it would not be subject to, if it invested directly in the securities of the underlying those derivatives. The Fund may experience losses that exceed those experienced by funds that do not use options and derivatives.
The Fund may invest in high yield or junk bonds which present a greater risk than bonds of higher quality. Other risks include credit risks and investments in fixed income securities that may be subject to default, prepayment and interest rate changes. The Fund may also invest in U.S treasury obligations and securities issued by federal agencies and U.S. government sponsorship.
Investments in foreign securities and emerging markets involve risks not generally associated with investments in securities of U.S. companies including currency rate changes, sovereign debt risk, political, social, and economic conditions, accurate company information, foreign control on investment and market operations including banks and security depositories. These risks may be greater in emerging markets and less developed countries.
ETNs and ETFs are subject to investment strategy risks and expenses which are indirectly paid by the Fund. The value of small or medium capitalization equities and issuers may be subject to more erratic market movements than those of larger more established companies and issuers. Furthermore, the use short positions can magnify the potential for gain or loss and amplify the effects of market volatility on the Fund’s share price.
1777 Sentry Parkway West, VEVA 14, Suite 102, Blue Bell, PA 19422
484-572-0500 ● www.dakotawm.com
3
DEFINITIONS
Indices presented are for comparison purposes only. They may not hold substantially similar securities to the Fund, and thus, little correlation may exist. The S&P 500 index measures the return of 500 widely held securities that currently trade in the US. Index performance returns do not reflect any management fees, transaction costs or expenses. HFRXEH (HFRX Equity Hedge) is a daily index of Long/Short Equity Hedge Fund Returns provided by Hedge Fund Research (hedgefundresearch.com). Index performance returns do not reflect any management fees, transaction costs or expenses. Indices are unmanaged and one may not invest directly in an index.
7162-NLD-10272022
1777 Sentry Parkway West, VEVA 14, Suite 102, Blue Bell, PA 19422
484-572-0500 ● www.dakotawm.com
4
Persimmon Long/Short Fund
Portfolio Review (Unaudited)
September 30, 2022
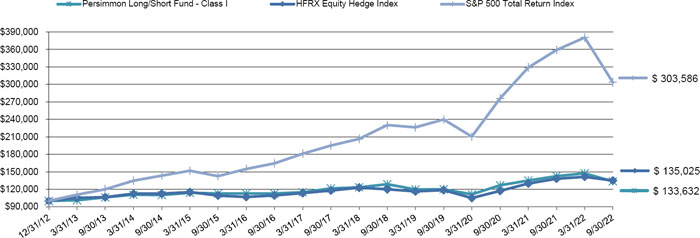
The Fund’s performance figures* for the year ended September 30, 2022, as compared to its benchmark:
| Annualized | |||
| Annualized | Annualized | Since Inception | |
| One Year | Five Years | (12/31/2012) | |
| Persimmon Long Short Fund - Class I | (6.34)% | 1.91% | 3.02% |
| HFRX Equity Hedge Index ** | (2.27)% | 2.84% | 3.18% |
| S&P 500 Total Return Index *** | (15.47)% | 9.24% | 12.07% |
Comparison of the Change in Value of a $100,000 Investment
| * | The performance data quoted is historical. Past performance is no guarantee of future results. Current performance may be higher or lower than the performance data quoted. The principal value and investment return of an investment will fluctuate so that your shares, when redeemed, may be worth more or less than their original cost. Total returns are calculated using the traded net asset value on September 30, 2022. The returns shown do not reflect the deduction of taxes that a shareholder would pay on Fund distributions or on the redemptions of Fund shares. Returns greater than 1 year are annualized. The total anual gross operating expenses as stated in the fee table of the Fund’s prospectus dated February 1, 2022 are 2.06% for Class I Shares. Redemptions made within 60 days of purchase may be assessed a redemption fee of 1.00%. The Advisor has contractually agreed to reduce its fees and/or absorb expenses of the Fund, until at least January 31, 2023, to ensure that Total Annual Fund Operating Expenses (exclusive of any front-end or contingent deferred loads, brokerage fees and commissions, acquired fund fees and expenses; borrowing costs (such as interest and dividend expenses on securities sold short); taxes; expenses incurred in connection with any merger or reorganization; and extraordinary expenses (such as litigation expenses, which may include indemnification of Fund officers and Trustees, and contractual indemnification of Fund service providers (other than the Advisor)) will not exceed 1.99% of the daily average net assets attributable to Class I shares. The Advisor may seek reimbursement only for fees waived or expenses paid by it during the prior three years; provided, however, that such fees and expenses may only be reimbursed to the extent they were waived or paid after the date of the waiver agreement (or any similar agreement). Reimbursements will only be sought if total expenses remain below the expenses limitation in place now or at the time of waiver or reimbursement. The Board may terminate this expense reimbursement arrangement at any time. For performance information current to the most recent month-end, please call 1-855-233-8300. |
| ** | HFRX Equity Hedge Index is a daily index of Long/Short Equity Hedge Fund Returns provided by Hedge Fund Research (hedgefundresearch.com). Index performance returns do not reflect any management fees, transaction costs or expenses. You cannot invest directly in an index. |
| *** | The S&P 500 Total Return Index is an unmanaged composite of 500 large capitalization companies and includes the reinvestment of dividends. This index is widely used by professional investors as a performance benchmark for large-cap stocks. You cannot invest directly in an index. |
| Asset Class | % of Net Assets | |||
| Common Stocks | 78.0 | % | ||
| Short-Term Investment | 6.8 | % | ||
| Exchanged-Traded Fund | 2.3 | % | ||
| Other Assets In Excess of Liabilities + | 12.9 | % | ||
| Total | 100.0 | % | ||
| + | Includes unrealized appreciation/(depreciation) on open futures contracts. |
Please refer to the Schedule of Investments in this annual report for a detailed listing of the Fund’s holdings.
5
| PERSIMMON LONG/SHORT FUND |
| SCHEDULE OF INVESTMENTS |
| September 30, 2022 |
| Shares | Fair Value | |||||||
| COMMON STOCKS — 78.0% | ||||||||
| ADVERTISING & MARKETING - 0.1% | ||||||||
| 383 | Interpublic Group of Companies, Inc. (The) | $ | 9,805 | |||||
| 230 | Omnicom Group, Inc. | 14,511 | ||||||
| 24,316 | ||||||||
| AEROSPACE & DEFENSE - 1.3% | ||||||||
| 558 | Boeing Company(a) | 67,563 | ||||||
| 240 | General Dynamics Corporation | 50,921 | ||||||
| 364 | Howmet Aerospace, Inc. | 11,259 | ||||||
| 48 | Huntington Ingalls Industries, Inc. | 10,632 | ||||||
| 234 | L3Harris Technologies, Inc. | 48,632 | ||||||
| 230 | Lockheed Martin Corporation | 88,846 | ||||||
| 174 | Northrop Grumman Corporation | 81,836 | ||||||
| 1,536 | Raytheon Technologies Corporation | 125,736 | ||||||
| 45 | Teledyne Technologies, Inc.(a) | 15,186 | ||||||
| 253 | Textron, Inc. | 14,740 | ||||||
| 46 | TransDigm Group, Inc. | 24,142 | ||||||
| 539,493 | ||||||||
| APPAREL & TEXTILE PRODUCTS - 0.4% | ||||||||
| 340 | Hanesbrands, Inc. | 2,366 | ||||||
| 1,239 | NIKE, Inc., Class B | 102,987 | ||||||
| 75 | PVH Corporation | 3,360 | ||||||
| 52 | Ralph Lauren Corporation | 4,416 | ||||||
| 310 | Tapestry, Inc. | 8,813 | ||||||
| 234 | Under Armour, Inc., Class A(a) | 1,556 | ||||||
| 244 | Under Armour, Inc., Class C(a) | 1,454 | ||||||
| 344 | VF Corporation | 10,289 | ||||||
| 135,241 | ||||||||
| ASSET MANAGEMENT - 0.6% | ||||||||
| 109 | Ameriprise Financial, Inc. | 27,463 | ||||||
| 120 | BlackRock, Inc. | 66,034 | ||||||
| 1,157 | Charles Schwab Corporation (The) | 83,153 | ||||||
| 264 | Franklin Resources, Inc. | 5,681 | ||||||
| 392 | Invesco Ltd. | 5,370 | ||||||
| 186 | Raymond James Financial, Inc. | 18,381 | ||||||
See accompanying notes to financial statements.
6
| PERSIMMON LONG/SHORT FUND |
| SCHEDULE OF INVESTMENTS (Continued) |
| September 30, 2022 |
| Shares | Fair Value | |||||||
| COMMON STOCKS — 78.0% (Continued) | ||||||||
| ASSET MANAGEMENT - 0.6% (Continued) | ||||||||
| 217 | T Rowe Price Group, Inc. | $ | 22,787 | |||||
| 228,869 | ||||||||
| AUTOMOTIVE - 1.9% | ||||||||
| 235 | Aptiv plc(a) | 18,379 | ||||||
| 198 | BorgWarner, Inc. | 6,217 | ||||||
| 3,772 | Ford Motor Company | 42,246 | ||||||
| 1,149 | General Motors Company | 36,871 | ||||||
| 2,295 | Tesla, Inc.(a) | 608,750 | ||||||
| 712,463 | ||||||||
| BANKING - 3.0% | ||||||||
| 7,503 | Bank of America Corporation | 226,591 | ||||||
| 2,039 | Citigroup, Inc. | 84,965 | ||||||
| 442 | Citizens Financial Group, Inc. | 15,187 | ||||||
| 147 | Comerica, Inc. | 10,452 | ||||||
| 730 | Fifth Third Bancorp | 23,331 | ||||||
| 183 | First Republic Bank | 23,891 | ||||||
| 1,082 | Huntington Bancshares, Inc. | 14,261 | ||||||
| 2,980 | JPMorgan Chase & Company | 311,409 | ||||||
| 1,054 | KeyCorporation | 16,885 | ||||||
| 194 | M&T Bank Corporation | 34,206 | ||||||
| 442 | PNC Financial Services Group, Inc. (The) | 66,044 | ||||||
| 975 | Regions Financial Corporation | 19,568 | ||||||
| 49 | SVB Financial Group(a) | 16,453 | ||||||
| 1,321 | Truist Financial Corporation | 57,516 | ||||||
| 1,389 | US Bancorp | 56,004 | ||||||
| 3,798 | Wells Fargo & Company | 152,756 | ||||||
| 173 | Zions Bancorp NA | 8,799 | ||||||
| 1,138,318 | ||||||||
| BEVERAGES - 1.4% | ||||||||
| 175 | Brown-Forman Corporation, Class B | 11,650 | ||||||
| 3,879 | Coca-Cola Company (The) | 217,302 | ||||||
| 162 | Constellation Brands, Inc., Class A | 37,208 | ||||||
| 179 | Molson Coors Beverage Company, Class B | 8,590 | ||||||
| 395 | Monster Beverage Corporation(a) | 34,349 | ||||||
See accompanying notes to financial statements.
7
| PERSIMMON LONG/SHORT FUND |
| SCHEDULE OF INVESTMENTS (Continued) |
| September 30, 2022 |
| Shares | Fair Value | |||||||
| COMMON STOCKS — 78.0% (Continued) | ||||||||
| BEVERAGES - 1.4% (Continued) | ||||||||
| 1,355 | PepsiCo, Inc. | $ | 221,217 | |||||
| 530,316 | ||||||||
| BIOTECH & PHARMA - 5.2% | ||||||||
| 1,693 | AbbVie, Inc. | 227,218 | ||||||
| 577 | Amgen, Inc. | 130,056 | ||||||
| 452 | AstraZeneca plc - ADR | 24,788 | ||||||
| 155 | Biogen, Inc.(a) | 41,385 | ||||||
| 2,195 | Bristol-Myers Squibb Company | 156,043 | ||||||
| 762 | Eli Lilly and Company | 246,393 | ||||||
| 1,166 | Gilead Sciences, Inc. | 71,931 | ||||||
| 232 | Incyte Corporation(a) | 15,460 | ||||||
| 2,708 | Johnson & Johnson | 442,378 | ||||||
| 2,403 | Merck & Company, Inc. | 206,946 | ||||||
| 240 | Organon & Company | 5,616 | ||||||
| 136 | Perrigo Company plc | 4,850 | ||||||
| 5,243 | Pfizer, Inc. | 229,434 | ||||||
| 80 | Regeneron Pharmaceuticals, Inc.(a) | 55,110 | ||||||
| 258 | Vertex Pharmaceuticals, Inc.(a) | 74,701 | ||||||
| 718 | Viatris, Inc. | 6,117 | ||||||
| 359 | Zoetis, Inc. | 53,236 | ||||||
| 1,991,662 | ||||||||
| CABLE & SATELLITE - 0.5% | ||||||||
| 140 | Charter Communications, Inc., Class A(a) | 42,469 | ||||||
| 4,450 | Comcast Corporation, Class A | 130,519 | ||||||
| 216 | DISH Network Corporation, Class A(a) | 2,987 | ||||||
| 175,975 | ||||||||
| CHEMICALS - 1.4% | ||||||||
| 224 | Air Products and Chemicals, Inc. | 52,132 | ||||||
| 103 | Albemarle Corporation | 27,237 | ||||||
| 92 | Avery Dennison Corporation | 14,968 | ||||||
| 119 | Celanese Corporation - Series A | 10,750 | ||||||
| 239 | CF Industries Holdings, Inc. | 23,004 | ||||||
| 764 | Corteva, Inc. | 43,663 | ||||||
| 723 | Dow, Inc. | 31,761 | ||||||
See accompanying notes to financial statements.
8
| PERSIMMON LONG/SHORT FUND |
| SCHEDULE OF INVESTMENTS (Continued) |
| September 30, 2022 |
| Shares | Fair Value | |||||||
| COMMON STOCKS — 78.0% (Continued) | ||||||||
| CHEMICALS - 1.4% (Continued) | ||||||||
| 676 | DuPont de Nemours, Inc. | $ | 34,070 | |||||
| 126 | Eastman Chemical Company | 8,952 | ||||||
| 244 | Ecolab, Inc. | 35,238 | ||||||
| 132 | FMC Corporation | 13,952 | ||||||
| 101 | International Flavors & Fragrances, Inc. | 9,174 | ||||||
| 506 | Linde plc | 136,414 | ||||||
| 228 | LyondellBasell Industries N.V., Class A | 17,164 | ||||||
| 362 | Mosaic Company (The) | 17,495 | ||||||
| 241 | PPG Industries, Inc. | 26,676 | ||||||
| 252 | Sherwin-Williams Company (The) | 51,597 | ||||||
| 554,247 | ||||||||
| COMMERCIAL SUPPORT SERVICES - 0.4% | ||||||||
| 74 | Cintas Corporation | 28,726 | ||||||
| 211 | Republic Services, Inc. | 28,704 | ||||||
| 114 | Robert Half International, Inc. | 8,721 | ||||||
| 210 | Rollins, Inc. | 7,283 | ||||||
| 410 | Waste Management, Inc. | 65,686 | ||||||
| 139,120 | ||||||||
| CONSTRUCTION MATERIALS - 0.1% | ||||||||
| 67 | Martin Marietta Materials, Inc. | 21,580 | ||||||
| 143 | Vulcan Materials Company | 22,553 | ||||||
| 44,133 | ||||||||
| CONTAINERS & PACKAGING - 0.2% | ||||||||
| 1,530 | Amcor PLC | 16,417 | ||||||
| 345 | Ball Corporation | 16,671 | ||||||
| 392 | International Paper Company | 12,426 | ||||||
| 94 | Packaging Corp of America | 10,555 | ||||||
| 158 | Sealed Air Corporation | 7,033 | ||||||
| 314 | Westrock Company | 9,699 | ||||||
| 72,801 | ||||||||
| DATA CENTER REIT - 0.2% | ||||||||
| 206 | Digital Realty Trust, Inc. | 20,431 | ||||||
| 82 | Equinix, Inc. | 46,645 | ||||||
| 67,076 | ||||||||
See accompanying notes to financial statements.
9
| PERSIMMON LONG/SHORT FUND |
| SCHEDULE OF INVESTMENTS (Continued) |
| September 30, 2022 |
| Shares | Fair Value | |||||||
| COMMON STOCKS — 78.0% (Continued) | ||||||||
| DIVERSIFIED INDUSTRIALS - 1.1% | ||||||||
| 582 | 3M Company | $ | 64,311 | |||||
| 151 | Dover Corporation | 17,604 | ||||||
| 364 | Eaton Corp plc | 48,543 | ||||||
| 611 | Emerson Electric Company | 44,737 | ||||||
| 1,155 | General Electric Company | 71,506 | ||||||
| 728 | Honeywell International, Inc. | 121,555 | ||||||
| 296 | Illinois Tool Works, Inc. | 53,472 | ||||||
| 154 | Pentair PLC | 6,257 | ||||||
| 427,985 | ||||||||
| E-COMMERCE DISCRETIONARY - 2.6% | ||||||||
| 8,300 | Amazon.com, Inc.(a) (e) | 937,901 | ||||||
| 740 | eBay, Inc. | 27,239 | ||||||
| 120 | Etsy, Inc.(a) | 12,016 | ||||||
| 977,156 | ||||||||
| ELECTRIC UTILITIES - 2.3% | ||||||||
| 691 | AES Corporation (The) | 15,617 | ||||||
| 279 | Alliant Energy Corporation | 14,784 | ||||||
| 277 | Ameren Corporation | 22,312 | ||||||
| 540 | American Electric Power Company, Inc. | 46,683 | ||||||
| 521 | CenterPoint Energy, Inc. | 14,682 | ||||||
| 327 | CMS Energy Corporation | 19,044 | ||||||
| 298 | Consolidated Edison, Inc. | 25,556 | ||||||
| 341 | Constellation Energy Corporation | 28,368 | ||||||
| 745 | Dominion Energy, Inc. | 51,487 | ||||||
| 204 | DTE Energy Company | 23,470 | ||||||
| 685 | Duke Energy Corporation | 63,719 | ||||||
| 399 | Edison International | 22,575 | ||||||
| 214 | Entergy Corporation | 21,535 | ||||||
| 241 | Evergy, Inc. | 14,315 | ||||||
| 382 | Eversource Energy | 29,781 | ||||||
| 1,024 | Exelon Corp. | 38,359 | ||||||
| 621 | FirstEnergy Corporation | 22,977 | ||||||
| 1,908 | NextEra Energy, Inc. | 149,607 | ||||||
| 238 | NRG Energy, Inc. | 9,108 | ||||||
See accompanying notes to financial statements.
10
| PERSIMMON LONG/SHORT FUND |
| SCHEDULE OF INVESTMENTS (Continued) |
| September 30, 2022 |
| Shares | Fair Value | |||||||
| COMMON STOCKS — 78.0% (Continued) | ||||||||
| ELECTRIC UTILITIES - 2.3% (Continued) | ||||||||
| 108 | Pinnacle West Capital Corporation | $ | 6,967 | |||||
| 815 | PPL Corporation | 20,660 | ||||||
| 561 | Public Service Enterprise Group, Inc. | 31,545 | ||||||
| 311 | Sempra Energy | 46,631 | ||||||
| 1,131 | Southern Company (The) | 76,909 | ||||||
| 346 | WEC Energy Group, Inc. | 30,943 | ||||||
| 574 | Xcel Energy, Inc. | 36,736 | ||||||
| 884,370 | ||||||||
| ELECTRICAL EQUIPMENT - 0.9% | ||||||||
| 140 | A O Smith Corporation | 6,801 | ||||||
| 96 | Allegion plc | 8,609 | ||||||
| 218 | AMETEK, Inc. | 24,723 | ||||||
| 584 | Amphenol Corporation, Class A | 39,105 | ||||||
| 729 | Carrier Global Corporation | 25,923 | ||||||
| 316 | Fortive Corporation | 18,423 | ||||||
| 810 | Johnson Controls International plc | 39,869 | ||||||
| 193 | Keysight Technologies, Inc.(a) | 30,370 | ||||||
| 397 | Otis Worldwide Corporation | 25,329 | ||||||
| 103 | Rockwell Automation, Inc. | 22,156 | ||||||
| 95 | Roper Technologies, Inc. | 34,166 | ||||||
| 321 | TE Connectivity Ltd. | 35,426 | ||||||
| 249 | Trane Technologies PLC | 36,058 | ||||||
| 126 | Vontier Corporation | 2,105 | ||||||
| 349,063 | ||||||||
| ENGINEERING & CONSTRUCTION - 0.1% | ||||||||
| 134 | Jacobs Solutions, Inc. | 14,538 | ||||||
| 155 | Quanta Services, Inc. | 19,745 | ||||||
| 86 | Technip Energies N.V. - ADR | 965 | ||||||
| 35,248 | ||||||||
| ENTERTAINMENT CONTENT - 0.9% | ||||||||
| 831 | Activision Blizzard, Inc. | 61,777 | ||||||
| 319 | Electronic Arts, Inc. | 36,911 | ||||||
| 339 | Fox Corporation, Class A | 10,401 | ||||||
| 154 | Fox Corporation - Class B, CLASS B | 4,389 | ||||||
See accompanying notes to financial statements.
11
| PERSIMMON LONG/SHORT FUND |
| SCHEDULE OF INVESTMENTS (Continued) |
| September 30, 2022 |
| Shares | Fair Value | |||||||
| COMMON STOCKS — 78.0% (Continued) | ||||||||
| ENTERTAINMENT CONTENT - 0.9% (Continued) | ||||||||
| 459 | Paramount Global, Class B | $ | 8,739 | |||||
| 122 | Take-Two Interactive Software, Inc.(a) | 13,298 | ||||||
| 1,908 | Walt Disney Company (The)(a) | 179,982 | ||||||
| 2,212 | Warner Bros Discovery, Inc.(a) | 25,438 | ||||||
| 340,935 | ||||||||
| FOOD - 0.8% | ||||||||
| 177 | Campbell Soup Company | 8,340 | ||||||
| 524 | Conagra Brands, Inc. | 17,098 | ||||||
| 649 | General Mills, Inc. | 49,720 | ||||||
| 168 | Hershey Company (The) | 37,039 | ||||||
| 279 | Hormel Foods Corporation | 12,678 | ||||||
| 118 | J M Smucker Company (The) | 16,214 | ||||||
| 269 | Kellogg Company | 18,739 | ||||||
| 635 | Kraft Heinz Company (The) | 21,177 | ||||||
| 139 | Lamb Weston Holdings, Inc. | 10,756 | ||||||
| 262 | McCormick & Company, Inc. | 18,673 | ||||||
| 1,397 | Mondelez International, Inc., Class A | 76,597 | ||||||
| 321 | Tyson Foods, Inc., Class A | 21,164 | ||||||
| 308,195 | ||||||||
| FORESTRY, PAPER & WOOD PRODUCTS - 0.0%(b) | ||||||||
| 35 | Sylvamo Corporation | 1,187 | ||||||
| GAS & WATER UTILITIES - 0.1% | ||||||||
| 201 | American Water Works Company, Inc. | 26,162 | ||||||
| 132 | Atmos Energy Corporation | 13,444 | ||||||
| 372 | NiSource, Inc. | 9,371 | ||||||
| 48,977 | ||||||||
| HEALTH CARE FACILITIES & SERVICES - 3.1% | ||||||||
| 157 | AmerisourceBergen Corporation | 21,247 | ||||||
| 252 | Anthem, Inc. | 114,468 | ||||||
| 291 | Cardinal Health, Inc. | 19,404 | ||||||
| 164 | Catalent, Inc.(a) | 11,867 | ||||||
| 657 | Centene Corporation(a) | 51,121 | ||||||
| 325 | Cigna Corporation | 90,178 | ||||||
See accompanying notes to financial statements.
12
| PERSIMMON LONG/SHORT FUND |
| SCHEDULE OF INVESTMENTS (Continued) |
| September 30, 2022 |
| Shares | Fair Value | |||||||
| COMMON STOCKS — 78.0% (Continued) | ||||||||
| HEALTH CARE FACILITIES & SERVICES - 3.1% (Continued) | ||||||||
| 1,386 | CVS Health Corporation | $ | 132,183 | |||||
| 88 | DaVita, Inc.(a) | 7,284 | ||||||
| 257 | HCA Healthcare, Inc. | 47,234 | ||||||
| 142 | Henry Schein, Inc.(a) | 9,339 | ||||||
| 135 | Humana, Inc. | 65,501 | ||||||
| 174 | IQVIA Holdings, Inc.(a) | 31,518 | ||||||
| 95 | Laboratory Corp of America Holdings | 19,457 | ||||||
| 190 | McKesson Corporation | 64,575 | ||||||
| 130 | Quest Diagnostics, Inc. | 15,950 | ||||||
| 918 | UnitedHealth Group, Inc. | 463,626 | ||||||
| 76 | Universal Health Services, Inc., Class B | 6,702 | ||||||
| 1,171,654 | ||||||||
| HEALTH CARE REIT - 0.1% | ||||||||
| 527 | Healthpeak Properties, Inc. | 12,079 | ||||||
| 373 | Ventas, Inc. | 14,983 | ||||||
| 410 | Welltower, Inc. | 26,371 | ||||||
| 53,433 | ||||||||
| HOME & OFFICE PRODUCTS - 0.0%(b) | ||||||||
| 137 | Leggett & Platt, Inc. | 4,551 | ||||||
| 421 | Newell Brands, Inc. | 5,848 | ||||||
| 58 | Whirlpool Corporation | 7,819 | ||||||
| 18,218 | ||||||||
| HOME CONSTRUCTION - 0.2% | ||||||||
| 274 | DR Horton, Inc. | 18,454 | ||||||
| 109 | Fortune Brands Home & Security, Inc. | 5,852 | ||||||
| 287 | Lennar Corporation, Class A | 21,396 | ||||||
| 287 | Masco Corporation | 13,400 | ||||||
| 64 | Mohawk Industries, Inc.(a) | 5,836 | ||||||
| 3 | NVR, Inc.(a) | 11,961 | ||||||
| 213 | PulteGroup, Inc. | 7,988 | ||||||
| 84,887 | ||||||||
| HOTEL REITS - 0.0%(b) | ||||||||
| 699 | Host Hotels & Resorts, Inc. | 11,100 | ||||||
See accompanying notes to financial statements.
13
| PERSIMMON LONG/SHORT FUND |
| SCHEDULE OF INVESTMENTS (Continued) |
| September 30, 2022 |
| Shares | Fair Value | |||||||
| COMMON STOCKS — 78.0% (Continued) | ||||||||
| HOUSEHOLD PRODUCTS - 1.3% | ||||||||
| 272 | Church & Dwight Company, Inc. | $ | 19,432 | |||||
| 139 | Clorox Company (The) | 17,846 | ||||||
| 826 | Colgate-Palmolive Company | 58,027 | ||||||
| 222 | Estee Lauder Companies, Inc. (The), Class A | 47,930 | ||||||
| 314 | Kimberly-Clark Corporation | 35,338 | ||||||
| 2,385 | Procter & Gamble Company (The) | 301,105 | ||||||
| 479,678 | ||||||||
| INDUSTRIAL REIT - 0.2% | ||||||||
| 364 | Duke Realty Corporation | 17,545 | ||||||
| 694 | Prologis, Inc. | 70,510 | ||||||
| 88,055 | ||||||||
| INDUSTRIAL SUPPORT SERVICES - 0.2% | ||||||||
| 550 | Fastenal Company | 25,322 | ||||||
| 66 | United Rentals, Inc.(a) | 17,828 | ||||||
| 41 | WW Grainger, Inc. | 20,057 | ||||||
| 63,207 | ||||||||
| INFRASTRUCTURE REIT - 0.6% | ||||||||
| 408 | American Tower Corporation | 87,598 | ||||||
| 401 | Crown Castle, Inc. | 57,965 | ||||||
| 110 | SBA Communications Corp., A | 31,312 | ||||||
| 176,875 | ||||||||
| INSTITUTIONAL FINANCIAL SERVICES - 1.2% | ||||||||
| 922 | Bank of New York Mellon Corporation (The) | 35,515 | ||||||
| 118 | Cboe Global Markets, Inc. | 13,850 | ||||||
| 387 | CME Group, Inc. | 68,549 | ||||||
| 326 | Goldman Sachs Group, Inc. (The) | 95,534 | ||||||
| 588 | Intercontinental Exchange, Inc. | 53,126 | ||||||
| 1,418 | Morgan Stanley | 112,037 | ||||||
| 351 | Nasdaq, Inc. | 19,895 | ||||||
| 231 | Northern Trust Corporation | 19,764 | ||||||
| 384 | State Street Corporation | 23,351 | ||||||
| 441,621 | ||||||||
| INSURANCE - 3.4% | ||||||||
| 795 | Aflac, Inc. | 44,679 | ||||||
See accompanying notes to financial statements.
14
| PERSIMMON LONG/SHORT FUND |
| SCHEDULE OF INVESTMENTS (Continued) |
| September 30, 2022 |
| Shares | Fair Value | |||||||
| COMMON STOCKS — 78.0% (Continued) | ||||||||
| INSURANCE - 3.4% (Continued) | ||||||||
| 356 | Allstate Corporation (The) | $ | 44,333 | |||||
| 753 | American International Group, Inc. | 35,752 | ||||||
| 220 | Aon plc, CLASS A | 58,931 | ||||||
| 164 | Arthur J Gallagher & Company | 28,080 | ||||||
| 67 | Assurant, Inc. | 9,733 | ||||||
| 2,072 | Berkshire Hathaway, Inc., Class B(a) | 553,266 | ||||||
| 464 | Chubb Ltd. | 84,392 | ||||||
| 237 | Cincinnati Financial Corporation | 21,228 | ||||||
| 38 | Everest Re Group Ltd. | 9,973 | ||||||
| 111 | Globe Life, Inc. | 11,067 | ||||||
| 396 | Hartford Financial Services Group, Inc. (The) | 24,528 | ||||||
| 173 | Lincoln National Corporation | 7,596 | ||||||
| 259 | Loews Corporation | 12,909 | ||||||
| 532 | Marsh & McLennan Companies, Inc. | 79,422 | ||||||
| 806 | MetLife, Inc. | 48,989 | ||||||
| 227 | Principal Financial Group, Inc. | 16,378 | ||||||
| 652 | Progressive Corporation (The) | 75,769 | ||||||
| 407 | Prudential Financial, Inc. | 34,912 | ||||||
| 293 | Travelers Companies, Inc. (The) | 44,888 | ||||||
| 226 | Unum Group | 8,769 | ||||||
| 219 | W R Berkley Corporation | 14,143 | ||||||
| 134 | Willis Towers Watson plc | 26,926 | ||||||
| 1,296,663 | ||||||||
| INTERNET MEDIA & SERVICES - 4.2% | ||||||||
| 5,680 | Alphabet, Inc., Class A(a) (e) | 543,291 | ||||||
| 5,460 | Alphabet, Inc., Class C(a) (e) | 524,979 | ||||||
| 41 | Booking Holdings, Inc.(a) | 67,372 | ||||||
| 121 | Expedia Group, Inc.(a) | 11,336 | ||||||
| 2,304 | Meta Platforms, Inc., Class A(a) | 312,607 | ||||||
| 463 | Netflix, Inc.(a) | 109,009 | ||||||
| 730 | Twitter, Inc.(a) | 32,003 | ||||||
| 96 | VeriSign, Inc.(a) | 16,675 | ||||||
| 1,617,272 | ||||||||
See accompanying notes to financial statements.
15
| PERSIMMON LONG/SHORT FUND |
| SCHEDULE OF INVESTMENTS (Continued) |
| September 30, 2022 |
| Shares | Fair Value | |||||||
| COMMON STOCKS — 78.0% (Continued) | ||||||||
| LEISURE FACILITIES & SERVICES - 1.3% | ||||||||
| 369 | Carnival Corporation(a) | $ | 2,594 | |||||
| 23 | Chipotle Mexican Grill, Inc.(a) | 34,563 | ||||||
| 113 | Darden Restaurants, Inc. | 14,274 | ||||||
| 38 | Domino’s Pizza, Inc. | 11,788 | ||||||
| 284 | Hilton Worldwide Holdings, Inc. | 34,256 | ||||||
| 343 | Las Vegas Sands Corporation(a) | 12,869 | ||||||
| 127 | Live Nation Entertainment, Inc.(a) | 9,657 | ||||||
| 258 | Marriott International, Inc., Class A | 36,156 | ||||||
| 707 | McDonald’s Corporation | 163,134 | ||||||
| 475 | MGM Resorts International | 14,117 | ||||||
| 210 | Norwegian Cruise Line Holdings Ltd.(a) | 2,386 | ||||||
| 166 | Royal Caribbean Cruises Ltd.(a) | 6,291 | ||||||
| 1,246 | Starbucks Corporation | 104,988 | ||||||
| 92 | Wynn Resorts Ltd.(a) | 5,799 | ||||||
| 319 | Yum! Brands, Inc. | 33,922 | ||||||
| 486,794 | ||||||||
| LEISURE PRODUCTS - 0.0%(b) | ||||||||
| 146 | Hasbro, Inc. | 9,843 | ||||||
| MACHINERY - 0.8% | ||||||||
| 581 | Caterpillar, Inc. | 95,330 | ||||||
| 323 | Deere & Company | 107,846 | ||||||
| 140 | Flowserve Corporation | 3,402 | ||||||
| 73 | IDEX Corporation | 14,589 | ||||||
| 342 | Ingersoll Rand, Inc. | 14,795 | ||||||
| 109 | Parker-Hannifin Corporation | 26,412 | ||||||
| 51 | Snap-on, Inc. | 10,269 | ||||||
| 136 | Stanley Black & Decker, Inc. | 10,229 | ||||||
| 186 | Xylem, Inc. | 16,249 | ||||||
| 299,121 | ||||||||
| MEDICAL EQUIPMENT & DEVICES - 3.4% | ||||||||
| 1,715 | Abbott Laboratories | 165,943 | ||||||
| 44 | ABIOMED, Inc.(a) | 10,809 | ||||||
| 299 | Agilent Technologies, Inc. | 36,343 | ||||||
See accompanying notes to financial statements.
16
| PERSIMMON LONG/SHORT FUND |
| SCHEDULE OF INVESTMENTS (Continued) |
| September 30, 2022 |
| Shares | Fair Value | |||||||
| COMMON STOCKS — 78.0% (Continued) | ||||||||
| MEDICAL EQUIPMENT & DEVICES - 3.4% (Continued) | ||||||||
| 70 | Align Technology, Inc.(a) | $ | 14,498 | |||||
| 487 | Baxter International, Inc. | 26,230 | ||||||
| 297 | Becton Dickinson and Company | 66,181 | ||||||
| 21 | Bio-Rad Laboratories, Inc., Class A(a) | 8,760 | ||||||
| 1,472 | Boston Scientific Corporation(a) | 57,011 | ||||||
| 48 | Cooper Companies, Inc. (The) | 12,667 | ||||||
| 615 | Danaher Corporation | 158,848 | ||||||
| 214 | DENTSPLY SIRONA, Inc. | 6,067 | ||||||
| 376 | DexCom, Inc.(a) | 30,283 | ||||||
| 681 | Edwards Lifesciences Corporation(a) | 56,271 | ||||||
| 59 | Embecta Corporation | 1,699 | ||||||
| 249 | Hologic, Inc.(a) | 16,065 | ||||||
| 79 | IDEXX Laboratories, Inc.(a) | 25,738 | ||||||
| 157 | Illumina, Inc.(a) | 29,954 | ||||||
| 342 | Intuitive Surgical, Inc.(a) | 64,104 | ||||||
| 1,329 | Medtronic plc | 107,317 | ||||||
| 23 | Mettler-Toledo International, Inc.(a) | 24,935 | ||||||
| 111 | PerkinElmer, Inc. | 13,357 | ||||||
| 139 | ResMed, Inc. | 30,344 | ||||||
| 83 | STERIS plc | 13,801 | ||||||
| 335 | Stryker Corporation | 67,851 | ||||||
| 45 | Teleflex, Inc. | 9,066 | ||||||
| 395 | Thermo Fisher Scientific, Inc. | 200,340 | ||||||
| 61 | Waters Corporation(a) | 16,441 | ||||||
| 74 | West Pharmaceutical Services, Inc. | 18,210 | ||||||
| 204 | Zimmer Biomet Holdings, Inc. | 21,328 | ||||||
| 20 | Zimvie, Inc.(a) | 197 | ||||||
| 1,310,658 | ||||||||
| METALS & MINING - 0.2% | ||||||||
| 1,337 | Freeport-McMoRan, Inc. | 36,540 | ||||||
| 880 | Newmont Corporation | 36,987 | ||||||
| 73,527 | ||||||||
See accompanying notes to financial statements.
17
| PERSIMMON LONG/SHORT FUND |
| SCHEDULE OF INVESTMENTS (Continued) |
| September 30, 2022 |
| Shares | Fair Value | |||||||
| COMMON STOCKS — 78.0% (Continued) | ||||||||
| MULTI ASSET CLASS REIT - 0.0%(b) | ||||||||
| 154 | Vornado Realty Trust | $ | 3,567 | |||||
| OFFICE REIT - 0.0%(b) | ||||||||
| 118 | Alexandria Real Estate Equities, Inc. | 16,542 | ||||||
| 139 | Boston Properties, Inc. | 10,421 | ||||||
| 32 | Orion Office REIT, Inc. | 280 | ||||||
| 68 | SL Green Realty Corporation | 2,731 | ||||||
| 29,974 | ||||||||
| OIL & GAS PRODUCERS - 3.4% | ||||||||
| 372 | APA Corporation | 12,719 | ||||||
| 1,850 | Chevron Corporation | 265,790 | ||||||
| 1,271 | ConocoPhillips | 130,074 | ||||||
| 411 | Coterra Energy, Inc. | 10,735 | ||||||
| 376 | Devon Energy Corporation | 22,609 | ||||||
| 160 | Diamondback Energy, Inc. | 19,274 | ||||||
| 102 | DT Midstream, Inc. | 5,293 | ||||||
| 573 | EOG Resources, Inc. | 64,021 | ||||||
| 4,422 | Exxon Mobil Corporation | 386,084 | ||||||
| 270 | Hess Corporation | 29,427 | ||||||
| 152 | HF Sinclair Corporation | 8,184 | ||||||
| 1,871 | Kinder Morgan, Inc. | 31,133 | ||||||
| 777 | Marathon Oil Corporation | 17,545 | ||||||
| 637 | Marathon Petroleum Corporation | 63,273 | ||||||
| 850 | Occidental Petroleum Corporation | 52,233 | ||||||
| 436 | ONEOK, Inc. | 22,341 | ||||||
| 424 | Phillips 66 | 34,225 | ||||||
| 162 | Pioneer Natural Resources Company | 35,078 | ||||||
| 398 | Valero Energy Corporation | 42,526 | ||||||
| 1,200 | Williams Companies, Inc. (The) | 34,356 | ||||||
| 1,286,920 | ||||||||
| OIL & GAS SERVICES & EQUIPMENT - 0.2% | ||||||||
| 649 | Baker Hughes Company | 13,603 | ||||||
| 865 | Halliburton Company | 21,296 | ||||||
| 390 | NOV, Inc. | 6,310 | ||||||
See accompanying notes to financial statements.
18
| PERSIMMON LONG/SHORT FUND |
| SCHEDULE OF INVESTMENTS (Continued) |
| September 30, 2022 |
| Shares | Fair Value | |||||||
| COMMON STOCKS — 78.0% (Continued) | ||||||||
| OIL & GAS SERVICES & EQUIPMENT - 0.2% (Continued) | ||||||||
| 1,377 | Schlumberger N.V. | $ | 49,435 | |||||
| 431 | TechnipFMC plc(a) | 3,646 | ||||||
| 94,290 | ||||||||
| PUBLISHING & BROADCASTING - 0.0%(b) | ||||||||
| 306 | News Corporation, CLASS A - NON-VOTING | 4,624 | ||||||
| 101 | News Corporation, Class B | 1,557 | ||||||
| 6,181 | ||||||||
| REAL ESTATE SERVICES - 0.1% | ||||||||
| 330 | CBRE Group, Inc., Class A(a) | 22,278 | ||||||
| RESIDENTIAL REIT - 0.2% | ||||||||
| 137 | AvalonBay Communities, Inc. | 25,234 | ||||||
| 334 | Equity Residential | 22,451 | ||||||
| 64 | Essex Property Trust, Inc. | 15,503 | ||||||
| 117 | Mid-America Apartment Communities, Inc. | 18,143 | ||||||
| 311 | UDR, Inc. | 12,972 | ||||||
| 94,303 | ||||||||
| RETAIL - CONSUMER STAPLES - 1.5% | ||||||||
| 392 | Costco Wholesale Corporation | 185,130 | ||||||
| 225 | Dollar General Corporation | 53,969 | ||||||
| 247 | Dollar Tree, Inc.(a) | 33,617 | ||||||
| 900 | Kroger Company (The) | 39,375 | ||||||
| 455 | Target Corporation | 67,517 | ||||||
| 881 | Walgreens Boots Alliance, Inc. | 27,663 | ||||||
| 1,263 | Walmart, Inc. | 163,811 | ||||||
| 571,082 | ||||||||
| RETAIL - DISCRETIONARY - 1.9% | ||||||||
| 63 | Advance Auto Parts, Inc. | 9,849 | ||||||
| 23 | AutoZone, Inc.(a) | 49,264 | ||||||
| 216 | Bath & Body Works, Inc. | 7,042 | ||||||
| 213 | Best Buy Company, Inc. | 13,491 | ||||||
| 152 | CarMax, Inc.(a) | 10,035 | ||||||
| 226 | Gap, Inc. (The) | 1,855 | ||||||
| 149 | Genuine Parts Company | 22,249 | ||||||
See accompanying notes to financial statements.
19
| PERSIMMON LONG/SHORT FUND |
| SCHEDULE OF INVESTMENTS (Continued) |
| September 30, 2022 |
| Shares | Fair Value | |||||||
| COMMON STOCKS — 78.0% (Continued) | ||||||||
| RETAIL - DISCRETIONARY - 1.9% (Continued) | ||||||||
| 1,006 | Home Depot, Inc. (The) | $ | 277,596 | |||||
| 767 | Lowe’s Companies, Inc. | 144,050 | ||||||
| 75 | O’Reilly Automotive, Inc.(a) | 52,751 | ||||||
| 356 | Ross Stores, Inc. | 30,000 | ||||||
| 1,188 | TJX Companies, Inc. (The) | 73,799 | ||||||
| 114 | Tractor Supply Company | 21,190 | ||||||
| 61 | Ulta Beauty, Inc.(a) | 24,473 | ||||||
| 72 | Victoria’s Secret & Company(a) | 2,097 | ||||||
| 739,741 | ||||||||
| RETAIL REIT - 0.2% | ||||||||
| 69 | Federal Realty Investment Trust | 6,218 | ||||||
| 425 | Kimco Realty Corporation | 7,824 | ||||||
| 329 | Realty Income Corporation | 19,148 | ||||||
| 155 | Regency Centers Corporation | 8,347 | ||||||
| 323 | Simon Property Group, Inc. | 28,989 | ||||||
| 70,526 | ||||||||
| SELF-STORAGE REIT - 0.2% | ||||||||
| 123 | Extra Space Storage, Inc. | 21,243 | ||||||
| 151 | Public Storage | 44,214 | ||||||
| 65,457 | ||||||||
| SEMICONDUCTORS - 3.3% | ||||||||
| 909 | Advanced Micro Devices, Inc.(a) | 57,594 | ||||||
| 531 | Analog Devices, Inc. | 73,990 | ||||||
| 984 | Applied Materials, Inc. | 80,619 | ||||||
| 410 | Broadcom, Inc. | 182,044 | ||||||
| 3,816 | Intel Corporation | 98,338 | ||||||
| 37 | IPG Photonics Corporation(a) | 3,121 | ||||||
| 153 | KLA Corporation | 46,302 | ||||||
| 135 | Lam Research Corporation | 49,410 | ||||||
| 432 | Microchip Technology, Inc. | 26,365 | ||||||
| 942 | Micron Technology, Inc. | 47,194 | ||||||
| 2,356 | NVIDIA Corporation | 285,996 | ||||||
| 111 | Qorvo, Inc.(a) | 8,815 | ||||||
| 1,140 | QUALCOMM, Inc. | 128,797 | ||||||
See accompanying notes to financial statements.
20
| PERSIMMON LONG/SHORT FUND |
| SCHEDULE OF INVESTMENTS (Continued) |
| September 30, 2022 |
| Shares | Fair Value | |||||||
| COMMON STOCKS — 78.0% (Continued) | ||||||||
| SEMICONDUCTORS - 3.3% (Continued) | ||||||||
| 161 | Skyworks Solutions, Inc. | $ | 13,728 | |||||
| 161 | Teradyne, Inc. | 12,099 | ||||||
| 899 | Texas Instruments, Inc. | 139,147 | ||||||
| 1,253,559 | ||||||||
| SOFTWARE - 6.5% | ||||||||
| 441 | Adobe, Inc.(a) | 121,363 | ||||||
| 150 | Akamai Technologies, Inc.(a) | 12,048 | ||||||
| 83 | ANSYS, Inc.(a) | 18,401 | ||||||
| 224 | Autodesk, Inc.(a) | 41,843 | ||||||
| 261 | Cadence Design Systems, Inc.(a) | 42,655 | ||||||
| 650 | Fortinet, Inc.(a) | 31,935 | ||||||
| 246 | Intuit, Inc. | 95,281 | ||||||
| 7,444 | Microsoft Corporation(e) | 1,733,707 | ||||||
| 581 | NortonLifeLock, Inc. | 11,701 | ||||||
| 2,082 | Oracle Corporation | 127,148 | ||||||
| 771 | Salesforce, Inc.(a) | 110,901 | ||||||
| 169 | ServiceNow, Inc.(a) | 63,816 | ||||||
| 135 | Synopsys, Inc.(a) | 41,244 | ||||||
| 40 | Tyler Technologies, Inc.(a) | 13,900 | ||||||
| 2,465,943 | ||||||||
| SPECIALTY FINANCE - 0.4% | ||||||||
| 643 | American Express Company | 86,747 | ||||||
| 431 | Capital One Financial Corporation | 39,725 | ||||||
| 286 | Discover Financial Services | 26,003 | ||||||
| 541 | Synchrony Financial | 15,251 | ||||||
| 167,726 | ||||||||
| SPECIALTY REITS - 0.0%(b) | ||||||||
| 316 | Iron Mountain, Inc. | 13,895 | ||||||
| STEEL - 0.1% | ||||||||
| 304 | Nucor Corporation | 32,525 | ||||||
| TECHNOLOGY HARDWARE - 7.0% | ||||||||
| 16,418 | Apple, Inc.(e) | 2,268,967 | ||||||
See accompanying notes to financial statements.
21
| PERSIMMON LONG/SHORT FUND |
| SCHEDULE OF INVESTMENTS (Continued) |
| September 30, 2022 |
| Shares | Fair Value | |||||||
| COMMON STOCKS — 78.0% (Continued) | ||||||||
| TECHNOLOGY HARDWARE - 7.0% (Continued) | ||||||||
| 204 | Arista Networks, Inc.(a) | $ | 23,030 | |||||
| 4,461 | Cisco Systems, Inc. | 178,440 | ||||||
| 752 | Corning, Inc. | 21,823 | ||||||
| 61 | F5, Inc.(a) | 8,829 | ||||||
| 149 | Garmin Ltd. | 11,966 | ||||||
| 1,288 | Hewlett Packard Enterprise Company | 15,430 | ||||||
| 1,352 | HP, Inc. | 33,692 | ||||||
| 342 | Juniper Networks, Inc. | 8,933 | ||||||
| 161 | Motorola Solutions, Inc. | 36,059 | ||||||
| 217 | NetApp, Inc. | 13,421 | ||||||
| 217 | Seagate Technology Holdings plc | 11,551 | ||||||
| 302 | Western Digital Corporation(a) | 9,830 | ||||||
| 165 | Xerox Holdings Corporation | 2,158 | ||||||
| 51 | Zebra Technologies Corporation, Class A(a) | 13,363 | ||||||
| 2,657,492 | ||||||||
| TECHNOLOGY SERVICES - 4.0% | ||||||||
| 643 | Accenture plc, Class A | 165,443 | ||||||
| 435 | Automatic Data Processing, Inc. | 98,393 | ||||||
| 115 | Broadridge Financial Solutions, Inc. | 16,597 | ||||||
| 142 | CDW Corporation/DE | 22,163 | ||||||
| 524 | Cognizant Technology Solutions Corporation, Class A | 30,099 | ||||||
| 249 | DXC Technology Company(a) | 6,096 | ||||||
| 114 | Equifax, Inc. | 19,543 | ||||||
| 615 | Fidelity National Information Services, Inc. | 46,476 | ||||||
| 568 | Fiserv, Inc.(a) | 53,148 | ||||||
| 82 | FleetCor Technologies, Inc.(a) | 14,446 | ||||||
| 88 | Gartner, Inc.(a) | 24,349 | ||||||
| 280 | Global Payments, Inc. | 30,254 | ||||||
| 897 | International Business Machines Corporation | 106,572 | ||||||
| 80 | Jack Henry & Associates, Inc. | 14,582 | ||||||
| 179 | Kyndryl Holdings, Inc.(a) | 1,480 | ||||||
| 124 | Leidos Holdings, Inc. | 10,846 | ||||||
| 39 | MarketAxess Holdings, Inc. | 8,677 | ||||||
| 855 | Mastercard, Inc., Class A | 243,110 | ||||||
See accompanying notes to financial statements.
22
| PERSIMMON LONG/SHORT FUND |
| SCHEDULE OF INVESTMENTS (Continued) |
| September 30, 2022 |
| Shares | Fair Value | |||||||
| COMMON STOCKS — 78.0% (Continued) | ||||||||
| TECHNOLOGY SERVICES - 4.0% (Continued) | ||||||||
| 166 | Moody’s Corporation | $ | 40,356 | |||||
| 83 | MSCI, Inc. | 35,009 | ||||||
| 344 | Nielsen Holdings plc | 9,536 | ||||||
| 311 | Paychex, Inc. | 34,897 | ||||||
| 1,093 | PayPal Holdings, Inc.(a) | 94,075 | ||||||
| 293 | S&P Global, Inc. | 89,468 | ||||||
| 170 | Verisk Analytics, Inc. | 28,990 | ||||||
| 1,637 | Visa, Inc., Class A | 290,812 | ||||||
| 411 | Western Union Company (The) | 5,549 | ||||||
| 1,540,966 | ||||||||
| TELECOMMUNICATIONS - 0.8% | ||||||||
| 7,017 | AT&T, Inc. | 107,641 | ||||||
| 1,036 | Lumen Technologies, Inc. | 7,542 | ||||||
| 424 | T-Mobile US, Inc.(a) | 56,888 | ||||||
| 3,977 | Verizon Communications, Inc. | 151,007 | ||||||
| 323,078 | ||||||||
| TIMBER REIT - 0.1% | ||||||||
| 729 | Weyerhaeuser Company | 20,820 | ||||||
| TOBACCO & CANNABIS - 0.5% | ||||||||
| 1,895 | Altria Group, Inc. | 76,520 | ||||||
| 1,586 | Philip Morris International, Inc. | 131,654 | ||||||
| 208,174 | ||||||||
| TRANSPORTATION & LOGISTICS - 1.4% | ||||||||
| 124 | Alaska Air Group, Inc.(a) | 4,855 | ||||||
| 442 | American Airlines Group, Inc.(a) | 5,322 | ||||||
| 282 | Canadian Pacific Railway Ltd. | 18,815 | ||||||
| 134 | CH Robinson Worldwide, Inc. | 12,906 | ||||||
| 2,331 | CSX Corporation | 62,098 | ||||||
| 620 | Delta Air Lines, Inc.(a) | 17,397 | ||||||
| 179 | Expeditors International of Washington, Inc. | 15,807 | ||||||
| 221 | FedEx Corporation | 32,812 | ||||||
| 89 | JB Hunt Transport Services, Inc. | 13,921 | ||||||
| 253 | Norfolk Southern Corporation | 53,041 | ||||||
See accompanying notes to financial statements.
23
| PERSIMMON LONG/SHORT FUND |
| SCHEDULE OF INVESTMENTS (Continued) |
| September 30, 2022 |
| Shares | Fair Value | |||||||
| COMMON STOCKS — 78.0% (Continued) | ||||||||
| TRANSPORTATION & LOGISTICS - 1.4% (Continued) | ||||||||
| 94 | Old Dominion Freight Line, Inc. | $ | 23,384 | |||||
| 534 | Southwest Airlines Company(a) | 16,469 | ||||||
| 646 | Union Pacific Corporation | 125,854 | ||||||
| 244 | United Airlines Holdings, Inc.(a) | 7,937 | ||||||
| 706 | United Parcel Service, Inc., Class B | 114,047 | ||||||
| 524,665 | ||||||||
| TRANSPORTATION EQUIPMENT - 0.2% | ||||||||
| 149 | Cummins, Inc. | 30,323 | ||||||
| 356 | PACCAR, Inc. | 29,794 | ||||||
| 178 | Westinghouse Air Brake Technologies Corporation | 14,480 | ||||||
| 74,597 | ||||||||
| WHOLESALE - CONSUMER STAPLES - 0.2% | ||||||||
| 612 | Archer-Daniels-Midland Company | 49,236 | ||||||
| 526 | Sysco Corporation | 37,193 | ||||||
| 86,429 | ||||||||
| WHOLESALE - DISCRETIONARY - 0.1% | ||||||||
| 176 | Copart, Inc.(a) | 18,727 | ||||||
| 268 | LKQ Corporation | 12,636 | ||||||
| 39 | Pool Corporation | 12,410 | ||||||
| 43,773 | ||||||||
| TOTAL COMMON STOCKS (Cost $23,553,071) | 29,807,713 | |||||||
| Shares | Fair Value | |||||||
| EXCHANGE-TRADED FUND — 2.3% | ||||||||
| EQUITY - 2.3% | ||||||||
| 2,478 | SPDR S&P 500 ETF Trust | 885,092 | ||||||
| TOTAL EXCHANGE-TRADED FUND (Cost $597,882) | 885,092 | |||||||
See accompanying notes to financial statements.
24
| PERSIMMON LONG/SHORT FUND |
| SCHEDULE OF INVESTMENTS (Continued) |
| September 30, 2022 |
| Shares | Fair Value | |||||||
| SHORT-TERM INVESTMENT — 6.8% | ||||||||
| MONEY MARKET FUND - 6.8% | ||||||||
| 2,604,440 | First American Government Obligations Fund Class X, Class X, 2.77%(c) (Cost $2,604,440) | $ | 2,604,440 | |||||
| TOTAL INVESTMENTS - 87.1% (Cost $26,755,393) | $ | 33,297,245 | ||||||
| OTHER ASSETS IN EXCESS OF LIABILITIES - 12.9% | 4,920,992 | |||||||
| NET ASSETS - 100.0% | $ | 38,218,237 | ||||||
| OPEN FUTURES CONTRACTS | |||||||||||||||
| Number of | Value and Unrealized | ||||||||||||||
| Contracts | Open Short Futures Contracts | Expiration | Notional Amount(d) | Appreciation | |||||||||||
| 90 | CME E-Mini Standard & Poor’s 500 Index Future | 12/16/2022 | $ | 16,206,750 | $ | 1,569,325 | |||||||||
| TOTAL FUTURES CONTRACTS | |||||||||||||||
| ADR | - American Depositary Receipt |
| ETF | - Exchange-Traded Fund |
| LTD | - Limited Company |
| MSCI | - Morgan Stanley Capital International |
| PLC | - Public Limited Company |
| REIT | - Real Estate Investment Trust |
| SPDR | - Standard & Poor’s Depositary Receipt |
| (a) | Non-income producing security. |
| (b) | Percentage rounds to less than 0.1%. |
| (c) | Rate disclosed is the seven day effective yield as of September 30, 2022. |
| (d) | The amounts shown are the underlying reference notional amounts to stock exchange indices and equities upon which the fair value of the futures contracts held by the Fund are based. Notional values do not represent the current fair value of, and are not necessarily indicative of the future cash flows of the Fund’s futures contracts. Further, the underlying price changes in relation to the variables specified by the notional values affects the fair value of these derivative financial instruments. The notional values as set forth within this schedule do not purport to represent economic value at risk to the Fund. |
| (e) | Securities pledged as collateral. As of September 30, 2022 securities pledged as collateral had a market value of $6,008,846. |
See accompanying notes to financial statements.
25
| Persimmon Long/Short Fund |
| STATEMENT OF ASSETS AND LIABILITIES |
| September 30, 2022 |
| ASSETS | ||||
| Investment securities, at cost | $ | 26,755,393 | ||
| Investment securities, at fair value | $ | 33,297,245 | ||
| Segregated cash at broker | 3,555,190 | |||
| Dividends and interest receivable | 32,275 | |||
| Unrealized appreciation on futures contracts | 1,569,325 | |||
| Prepaid expenses | 7,516 | |||
| TOTAL ASSETS | 38,461,551 | |||
| LIABILITIES | ||||
| Investment advisory fees payable, net | 85,746 | |||
| Payable for Fund shares redeemed | 105,669 | |||
| Payable to related parties | 14,188 | |||
| Accrued expenses and other liabilities | 37,711 | |||
| TOTAL LIABILITIES | 243,314 | |||
| NET ASSETS | $ | 38,218,237 | ||
| COMPOSITION OF NET ASSETS: | ||||
| Paid in capital | $ | 32,254,120 | ||
| Accumulated Earnings | 5,964,117 | |||
| NET ASSETS | $ | 38,218,237 | ||
| NET ASSET VALUE PER SHARE: | ||||
| Class I Shares: | ||||
| Net Assets | $ | 38,218,237 | ||
| Shares of beneficial interest outstanding ($0 par value, unlimited shares authorized) | 3,448,243 | |||
| Net asset value (Net Assets ÷ Shares Outstanding), offering price and redemption price per share (a) | $ | 11.08 |
| (a) | The Fund will impose a 1.00% redemption fee for any redemptions of Fund shares occurring within 60 days of purchase. |
See accompanying notes to financial statements.
26
| Persimmon Long/Short Fund |
| STATEMENT OF OPERATIONS |
| For the Year Ended September 30, 2022 |
| INVESTMENT INCOME | ||||
| Dividends | $ | 571,358 | ||
| Interest | 18,609 | |||
| TOTAL INVESTMENT INCOME | 589,967 | |||
| EXPENSES | ||||
| Advisory fees | 514,459 | |||
| Administrative services fees | 65,331 | |||
| Broker margin interest expense | 37,671 | |||
| Transfer agent fees | 28,744 | |||
| Accounting services fees | 26,254 | |||
| Compliance officer fees | 24,148 | |||
| Audit fees | 20,467 | |||
| Printing and postage expenses | 18,461 | |||
| Trustees fees and expenses | 15,534 | |||
| Legal fees | 12,922 | |||
| Registration fees | 11,647 | |||
| Custodian fees | 6,390 | |||
| Third party administrative services fees | 365 | |||
| Insurance expense | 63 | |||
| Other expenses | 2,661 | |||
| TOTAL EXPENSES | 785,117 | |||
| NET INVESTMENT LOSS | (195,150 | ) | ||
| NET REALIZED AND UNREALIZED GAIN (LOSS) ON INVESTMENTS | ||||
| Net realized gain from: | ||||
| Investments | 15,242 | |||
| Futures contracts | 2,091,379 | |||
| Net Realized Gain | 2,106,621 | |||
| Net change in unrealized appreciation (depreciation) on: | ||||
| Investments | (5,897,346 | ) | ||
| Futures contracts | 1,190,725 | |||
| Net Change in Unrealized Depreciation | (4,706,621 | ) | ||
| NET REALIZED AND UNREALIZED LOSS ON INVESTMENTS | (2,600,000 | ) | ||
| NET DECREASE IN NET ASSETS RESULTING FROM OPERATIONS | $ | (2,795,150 | ) |
See accompanying notes to financial statements.
27
| Persimmon Long/Short Fund |
| STATEMENTS OF CHANGES IN NET ASSETS |
| For the | For the | |||||||
| Year Ended | Year Ended | |||||||
| September 30, 2022 | September 30, 2021 | |||||||
| FROM OPERATIONS | ||||||||
| Net investment loss | $ | (195,150 | ) | $ | (256,072 | ) | ||
| Net realized gain (loss) from investments and futures contracts | 2,106,621 | (3,108,459 | ) | |||||
| Net change in unrealized appreciation (depreciation) on investments and futures contracts | (4,706,621 | ) | 7,596,676 | |||||
| Net increase (decrease) in net assets resulting from operations | (2,795,150 | ) | 4,232,145 | |||||
| SHARES OF BENEFICIAL INTEREST | ||||||||
| Proceeds from shares sold: | ||||||||
| Class I | 5,830,012 | 863,436 | ||||||
| Payments for shares redeemed: | ||||||||
| Class I | (2,195,104 | ) | (992,314 | ) | ||||
| Net increase (decrease) from shares of beneficial interest transactions | 3,634,908 | (128,878 | ) | |||||
| NET INCREASE IN NET ASSETS | 839,758 | 4,103,267 | ||||||
| NET ASSETS | ||||||||
| Beginning of Year | 37,378,479 | 33,275,212 | ||||||
| End of Year | $ | 38,218,237 | $ | 37,378,479 | ||||
| SHARE ACTIVITY | ||||||||
| Class I: | ||||||||
| Shares Sold | 472,952 | 79,553 | ||||||
| Shares Redeemed | (186,652 | ) | (87,820 | ) | ||||
| Net increase (decrease) in shares of beneficial interest outstanding | 286,300 | (8,267 | ) | |||||
See accompanying notes to financial statements.
28
| Persimmon Long/Short Fund |
| FINANCIAL HIGHLIGHTS |
Per Share Data and Ratios for a Share of Beneficial Interest Outstanding Throughout Each Year
| Class I | ||||||||||||||||||||
| Year Ended | Year Ended | Year Ended | Year Ended | Year Ended | ||||||||||||||||
| September 30, 2022 | September 30, 2021 | September 30, 2020 | September 30, 2019 | September 30, 2018 | ||||||||||||||||
| Net asset value, beginning of year | $ | 11.82 | $ | 10.50 | $ | 10.08 | $ | 11.18 | $ | 11.23 | ||||||||||
| Income (loss) from investment operations: | ||||||||||||||||||||
| Net investment loss (1) | (0.06 | ) | (0.08 | ) | (0.10 | ) | (0.13 | ) | (0.31 | ) | ||||||||||
| Net realized and unrealized gain (loss) (2) | (0.68 | ) | 1.40 | 0.64 | (0.63 | ) | 0.93 | |||||||||||||
| Total from investment operations | (0.74 | ) | 1.32 | 0.54 | (0.76 | ) | 0.62 | |||||||||||||
| Less distributions from: | ||||||||||||||||||||
| Net realized gains | — | — | (0.12 | ) | (0.34 | ) | (0.67 | ) | ||||||||||||
| Total distributions | — | — | (0.12 | ) | (0.34 | ) | (0.67 | ) | ||||||||||||
| Net asset value, end of year | $ | 11.08 | $ | 11.82 | $ | 10.50 | $ | 10.08 | $ | 11.18 | ||||||||||
| Total return (3) | (6.26 | )% (8) | 12.57 | % (8) | 5.47 | % | (6.72 | )% | 5.80 | % | ||||||||||
| Net assets, at end of year (000s) | $ | 38,218 | $ | 37,378 | $ | 33,275 | $ | 28,549 | $ | 31,633 | ||||||||||
| Ratios/Supplemental Data: | ||||||||||||||||||||
| Ratio of gross expenses to average net assets before fee waiver/recapture (4)(6)(7) | 1.91 | % | 2.07 | % | 2.44 | % | 2.85 | % | 3.88 | % | ||||||||||
| Ratio of net expenses to average net assets after fee waiver/recapture (6)(7) | 1.91 | % | 2.15 | % | 2.57 | % | 2.90 | % | 3.69 | % | ||||||||||
| Ratio of net investment loss to average net assets before fee waiver/recapture (5)(7) | (0.47 | )% | (0.62 | )% | (0.85 | )% | (1.20 | )% | (2.96 | )% | ||||||||||
| Ratio of net investment loss to average net assets after fee waiver/recapture (5)(7) | (0.47 | )% | (0.70 | )% | (0.98 | )% | (1.24 | )% | (2.78 | )% | ||||||||||
| Portfolio Turnover Rate | 0 | % | 6 | % | 227 | % | 326 | % | 263 | % | ||||||||||
| (1) | Per share amounts calculated using the average shares method, which more appropriately presents the per share data for the year. |
| (2) | Realized and unrealized gains (loss) per share in this caption are balancing amounts necessary to reconcile the change in net assets value per share for the period, and may not reconcile with aggregate gains and losses in the Statement of Operations due to timing of share transactions during the year. |
| (3) | Total returns shown exclude the effect of applicable sales charges and redemption fees and assumes reinvestment of all distributions, if any. Total returns would have been lower absent the fee waiver. |
| (4) | Represents the ratio of expenses to average net assets absent fee waivers and/or fees recaptured by the advisor. |
| (5) | Recognition of net investment loss by the Fund is affected by the timing of the declaration of dividends by the underlying investment companies in which the Fund invests. |
| (6) | Excluding interest expense and dividends on securities sold short, the following ratios would have been: |
| Gross expenses to average net assets | 1.82 | % | 2.01 | % | 2.36 | % | 2.53 | % | 2.93 | % | ||||||||||
| Net expenses to average net assets | 1.82 | % | 2.09 | % | 2.49 | % | 2.58 | % | 2.75 | % |
| (7) | Ratio does not include the expenses of other investment companies in which the Fund invests. |
| (8) | Includes adjustments in accordance with accounting principles generally accepted in the United States and, consequently, the net asset value for financial reporting purposes and the returns based upon those net asset values may differ from the net asset values and returns for shareholder transactions. |
.
See accompanying notes to financial statements.
29
| Persimmon Long/Short Fund |
| NOTES TO FINANCIAL STATEMENTS |
| September 30, 2022 |
| 1. | ORGANIZATION |
The Persimmon Long/Short Fund (the “Fund”) is a diversified series of shares of beneficial interest of Northern Lights Fund Trust III (the “Trust”), a statutory trust organized under the laws of the State of Delaware on December 5, 2011, and registered under the Investment Company Act of 1940, as amended (the “1940 Act”), as an open-end management investment company. The Fund commenced operations on December 31, 2012. The Fund seeks long-term capital appreciation.
The Fund offers Class I shares. Effective May 25, 2016, sales and operations of Class A shares of the Fund were suspended. A principal of the investment advisor solely held the Class A shares for the period from October 1, 2015 to May 25, 2016. The Fund may recommence offering and operation of Class A shares of the Fund in the future. Class I shares of the Fund are sold at Net Asset Value (“NAV”) without an initial sales charge and are not subject to 12b-1 distribution fees. Class I shares are subject to a 1.00% redemption fee on redemptions made within 60 days of the original purchase.
| 2. | SUMMARY OF SIGNIFICANT ACCOUNTING POLICIES |
All investments in securities are recorded at their estimated fair values. The following is a summary of significant accounting policies followed by the Fund in preparation of its financial statements. The policies are in conformity with U.S. generally accepted accounting principles (“GAAP”). The preparation of the financial statements requires management to make estimates and assumptions that affect the reported amounts of assets and liabilities and disclosure of contingent assets and liabilities at the date of the financial statements and the reported amounts of income and expenses for the period ended. Actual results could differ from those estimates. The Fund is an investment company and accordingly follows the investment company accounting and reporting guidance of the Financial Accounting Standards Board (“FASB”) Accounting Standards Codification Topic 946 “Financial Services – Investment Companies,” including FASB Accounting Standards Update (“ASU”) 2013-08.
Securities Valuation – Securities listed on an exchange are valued at the last reported sale price at the close of the regular trading session of the exchange on the business day the value is being determined, or in the case of securities listed on NASDAQ at the NASDAQ Official Closing Price (“NOCP”). If the NOCP is not available, such securities shall be valued at the last sale price on the day of valuation, or if there has been no sale on such day, at the mean between the current bid and ask prices. Option contracts listed on a securities exchange or board of trade (not including Index Options contracts) for which market quotations are readily available shall be valued at the last quoted sales price or, in the absence of a sale, at the mean between the current bid and ask prices on the valuation date. Index Options listed on a securities exchange or board of trade for which market quotations are readily available shall be valued at the mean between the current bid and ask prices on the valuation date. The independent pricing service does not distinguish between smaller-sized bond positions known as “odd lots” and larger institutional-sized bond positions known as “round lots”. The Fund may fair value a particular bond if the advisor does not believe that the round lot value provided by the independent pricing service reflects fair value of the Fund’s holding. Investments in open-end investment companies are valued at net asset value. Short-term debt obligations having 60 days or less remaining until maturity, at time of purchase may be valued at amortized cost, which approximates fair value.
The Fund may hold securities, such as private investments, interests in commodity pools, other non-traded securities or temporarily illiquid securities, for which market quotations are not readily available or are determined to be unreliable. These securities will be valued using the “fair value” procedures approved by the Board. The Board has delegated execution of these procedures to the Adviser as its valuation designee (the “Valuation Designee”). The Board may also enlist third party consultants such a valuation specialist at a public accounting firm, valuation consultant or financial officer of a security issuer on an as-needed basis to assist the Valuation Designee in determining a security-specific fair value. The Board is responsible for reviewing and approving fair value methodologies utilized by the Valuation Designee, which approval shall be based upon whether the Valuation Designee followed the valuation procedures established by the Board.
Valuation of Fund of Funds – The Fund may invest in portfolios of open-end or closed-end investment companies (the “Underlying Funds”). The Underlying Funds value securities in their portfolios for which market quotations are readily available at their market values (generally the last reported sale price) and all other securities and assets at their fair value to the methods established by the board of directors of the Underlying Funds.
30
| Persimmon Long/Short Fund |
| NOTES TO FINANCIAL STATEMENTS (Continued) |
| September 30, 2022 |
Open-end investment companies are valued at their respective net asset values as reported by such investment companies. The shares of many closed-end investment companies, after their initial public offering, frequently trade at a price per share, which is different than the net asset value per share. The difference represents a market premium or market discount of such shares. There can be no assurances that the market discount or market premium on shares of any closed-end investment company purchased by the Fund will not change.
Fair Valuation Process – The applicable investments are valued by the Valuation Designee pursuant to valuation procedures established by the Board. For example, fair value determinations are required for the following securities: (i) securities for which market quotations are insufficient or not readily available on a particular business day (including securities for which there is a short and temporary lapse in the provision of a price by the regular pricing source); (ii) securities for which, in the judgment of the Valuation Designee, the prices or values available do not represent the fair value of the instrument; factors which may cause the Valuation Designee to make such a judgment include, but are not limited to, the following: only a bid price or an asked price is available; the spread between bid and asked prices is substantial; the frequency of sales; the thinness of the market; the size of reported trades; and actions of the securities markets, such as the suspension or limitation of trading; (iii) securities determined to be illiquid; and (iv) securities with respect to which an event that will affect the value thereof has occurred (a “significant event”) since the closing prices were established on the principal exchange on which they are traded, but prior to a Fund’s calculation of its net asset value. Specifically, interests in commodity pools or managed futures pools are valued on a daily basis by reference to the closing market prices of each futures contract or other asset held by a pool, as adjusted for pool expenses. Restricted or illiquid securities, such as private investments or non-traded securities are valued based upon the current bid for the security from two or more independent dealers or other parties reasonably familiar with the facts and circumstances of the security (who should take into consideration all relevant factors as may be appropriate under the circumstances). If a current bid from such independent dealers or other independent parties is unavailable, the Valuation Designee shall determine, the fair value of such security using the following factors: (i) the type of security; (ii) the cost at date of purchase; (iii) the size and nature of the Fund’s holdings; (iv) the discount from market value of unrestricted securities of the same class at the time of purchase and subsequent thereto; (v) information as to any transactions or offers with respect to the security; (vi) the nature and duration of restrictions on disposition of the security and the existence of any registration rights; (vii) how the yield of the security compares to similar securities of companies of similar or equal creditworthiness; (viii) the level of recent trades of similar or comparable securities; (ix) the liquidity characteristics of the security; (x) current market conditions; and (xi) the market value of any securities into which the security is convertible or exchangeable.
The Fund utilizes various methods to measure the fair value of all of its investments on a recurring basis. GAAP establishes a fair value hierarchy and specifies that a valuation technique used to measure fair value shall minimize the use of unobservable inputs. The objective of a fair value measurement is to determine the price that would be received to sell an asset or paid to transfer a liability in an orderly transaction between market participants (i.e., the exit price at the measurement date). The fair value hierarchy gives the highest priority to quoted prices in active markets for identical assets or liabilities (Level 1) and the lowest priority to unobservable inputs (Level 3). The three levels of the fair value hierarchy under U.S. GAAP are described below:
Level 1 – Unadjusted quoted prices in active markets for identical assets and liabilities that the Fund has the ability to access at the measurement date.
Level 2 – Observable inputs other than quoted prices included in Level 1 that are observable for the asset or liability, either directly or indirectly. These inputs may include quoted prices for the identical instrument in an inactive market, prices for similar instruments, interest rates, prepayment speeds, credit risk, yield curves, default rates and similar data.
Level 3 – Unobservable inputs for the asset or liability, to the extent relevant observable inputs are not available; representing the Fund’s own assumptions about the assumptions a market participant would use in valuing the asset or liability, and would be based on the best information available and may require significant management judgment or estimation.
The availability of observable inputs can vary from security to security and is affected by a wide variety of factors, including, for example, the type of security, whether the security is new and not yet established in the marketplace, the liquidity of markets, and other characteristics particular to the security. To the extent that valuation is based on models or inputs that are less observable or unobservable in the market, the determination of fair value requires more judgment. Accordingly, the degree of judgment exercised in determining fair value is greatest for instruments categorized in Level 3.
The inputs used to measure fair value may fall into different levels of the fair value hierarchy. In such cases, for disclosure purposes, the level in the fair value hierarchy within which the fair value measurement falls in its entirety, is determined
31
| Persimmon Long/Short Fund |
| NOTES TO FINANCIAL STATEMENTS (Continued) |
| September 30, 2022 |
based on the lowest level input that is significant to the fair value measurement in its entirety.
The inputs or methodology used for valuing securities are not necessarily an indication of the risk associated with investing in those securities. The following tables summarize the inputs used as of September 30, 2022 for the Fund’s assets and liabilities measured at fair value:
| Assets | Level 1 | Level 2 | Level 3 | Total | ||||||||||||
| Investments * | ||||||||||||||||
| Common Stocks | $ | 29,807,713 | $ | — | $ | — | $ | 29,807,713 | ||||||||
| Exchange-Traded Fund | 885,092 | — | — | 885,092 | ||||||||||||
| Short-Term Investment | 2,604,440 | — | — | 2,604,440 | ||||||||||||
| Total | $ | 33,297,245 | $ | — | $ | — | $ | 33,297,245 | ||||||||
| Derivatives* | ||||||||||||||||
| Futures Contracts | $ | 1,569,325 | $ | — | $ | — | $ | 1,569,325 | ||||||||
| Total | $ | 1,569,325 | $ | — | $ | — | $ | 1,569,325 | ||||||||
| * | Refer to the Schedule of Investments for industry classification. |
The Fund did not hold any Level 3 securities during the year. The were no transfers between levels during the year.
Security Transactions and Related Income – Security transactions are accounted for on a trade date basis. Interest income is recognized on an accrual basis. Dividend income is recorded on the ex-dividend date. Realized gains or losses from sales of securities are determined by comparing the identified cost of the security lot sold with the net sales proceeds.
Futures Contracts – The Fund may purchase or sell futures contracts to gain exposure to, or hedge against, changes in the value of equities, interest rates, foreign currencies or commodities. Initial margin deposits required upon entering into futures contracts are satisfied by the segregation of specific securities or cash as collateral for the account of the broker (the Fund’s agent in acquiring the futures position). During the period the futures contracts are open, changes in the value of the contracts are recognized as unrealized gains or losses by “marking to market” on a daily basis to reflect the market value of the contracts at the end of each day’s trading. Variation margin payments are received or made depending upon whether unrealized gains or losses are incurred. When the contracts are closed, the Fund recognizes a realized gain or loss equal to the difference between the proceeds from, or cost of, the closing transaction and the Fund’s basis in the contract. If the Fund was unable to liquidate a futures contract and/or enter into an offsetting closing transaction, the Fund would continue to be subject to market risk with respect to the value of the contracts and continue to be required to maintain the margin deposits on the futures contracts. The Fund segregates liquid securities having a value at least equal to the amount of the current obligation under any open futures contract. Risks may exceed amounts recognized in the statement of assets and liabilities. With futures, there is minimal counterparty credit risk to the Fund since futures are exchange traded and the exchange’s clearinghouse, as counterparty to all exchange traded futures, guarantees the futures against default.
Short Sales – A “short sale” is a transaction in which the Fund sells a security it does not own but has borrowed in anticipation that the market price of that security will decline. The Fund is obligated to replace the security borrowed by purchasing it on the open market at a later date. If the price of the security sold short increases between the time of the short sale and the time the Fund replaces the borrowed security, the Fund will incur a loss. Conversely, if the price declines upon replacing the borrowed security, the Fund will realize a gain.
Option Transactions – Options are derivative financial instruments that give the buyer, in exchange for a premium payment, the right, but not the obligation, to either purchase from (call option) or sell to (put option) the writer a specified underlying instrument at a specified price on or before a specified date. The Fund enters into option contracts to meet the requirements of its trading activities.
The risk in writing a call option is that the Fund may incur a loss if the market price of the security increases and the option is exercised. The risk in writing a put option is that the Fund may incur a loss if the market price of the security decreases and the option is exercised. The risk in buying an option is that the Fund pays a premium whether or not the option is exercised. The Fund also has the additional risk of not being able to enter into a closing transaction if a liquid secondary market does not exist.
Put options are purchased to hedge against a decline in the value of securities held in the Fund’s portfolio. If such a decline occurs, the put options will permit the Fund to sell the securities underlying such options at the exercise price, or to close out
32
| Persimmon Long/Short Fund |
| NOTES TO FINANCIAL STATEMENTS (Continued) |
| September 30, 2022 |
the options at a profit. The Fund may purchase call options as a temporary substitute for the purchase of individual securities, which then could be purchased in orderly fashion. The premium paid for a put or call option plus any transaction costs will reduce the benefit, if any, realized by the Fund upon exercise of the option, and, unless the price of the underlying security rises or declines sufficiently, the option may expire worthless to the Fund. In addition, in the event that the price of the security in connection with which an option was purchased moves in a direction favorable to the Fund, the benefits realized by the Fund as a result of such favorable movement will be reduced by the amount of the premium paid for the option and related transaction costs. Written and purchased options are non-income producing securities. With purchased options, there is minimal counterparty credit risk to the Fund since these options are exchange traded and the exchange’s clearinghouse, as counterparty to all exchange traded options, guarantees against a possible default. The Fund did not trade any options during the period October 1, 2021 through September 30, 2022.
Segregated Cash at Broker – The Fund, as of September 30, 2022, has $3,555,190 of cash on hand at the prime broker representing the proceeds of securities sold short. Withdrawal of these amounts is restricted based on the level of short trading in the Fund.
Dividends and Distributions to Shareholders – Dividends from net investment income are declared and distributed annually. Distributable net realized capital gains are declared and distributed annually. Dividends from net investment income and distributions from net realized gains are recorded on the ex-dividend date and determined in accordance with federal income tax regulations, which may differ from GAAP. These “book/tax” differences are considered either temporary (i.e., deferred losses, capital loss carry forwards) or permanent in nature. To the extent these differences are permanent in nature, such amounts are reclassified within the composition of net assets based on their federal tax-basis treatment; temporary differences do not require reclassification.
Federal Income Taxes – It is the Fund’s policy to continue to qualify as a regulated investment company by complying with the provisions of the Internal Revenue Code, as amended, that are applicable to regulated investment companies and to distribute substantially all of its taxable income and net realized gains to shareholders. In addition, the Fund intends to distribute in each calendar year substantially all of its net investment income, capital gains and certain other amounts, if any, such that the Fund should not be subject to federal excise tax. Therefore, no federal income or excise tax provision has been recorded.
The Fund recognizes the tax benefits of uncertain tax positions only where the position is “more likely than not” to be sustained assuming examination by tax authorities. Management has analyzed the Fund’s tax positions, and has concluded that no liability for unrecognized tax benefits should be recorded related to uncertain tax positions expected to be taken on returns filed for open tax years 2019-2021 or expected to be taken in the Fund’s 2022 returns. The Fund identifies its major tax jurisdictions as U.S. federal, Ohio, and foreign jurisdictions where the Fund makes significant investments; however the Fund is not aware of any tax positions for which it is reasonably possible that the total amounts of unrecognized tax benefits will change materially in the next twelve months.
Expenses – Expenses of the Trust that are directly identifiable to a specific fund are charged to that fund. Expenses, which are not readily identifiable to a specific fund, are allocated in such a manner as deemed equitable, taking into consideration the nature and type of expense and the relative sizes of the funds in the Trust.
Indemnification – The Trust indemnifies its officers and trustees for certain liabilities that may arise from the performance of their duties to the Trust. Additionally, in the normal course of business, the Fund enters into contracts that contain a variety of representations and warranties and which provide general indemnities. The Fund’s maximum exposure under these arrangements is unknown, as this would involve future claims that may be made against the Fund that have not yet occurred. However, based on experience, the risk of loss due to these warranties and indemnities appears to be remote.
| 3. | INVESTMENT TRANSACTIONS AND ASSOCIATED RISKS |
For the year ended September 30, 2022, cost of purchases and proceeds from sales of portfolio securities, other than short sales and short-term investments amounted to $918 and $40,142, respectively.
33
| Persimmon Long/Short Fund |
| NOTES TO FINANCIAL STATEMENTS (Continued) |
| September 30, 2022 |
Impact of Derivatives on the Statement of Assets and Liabilities and Statement of Operations
The derivative instruments outstanding, as of September 30, 2022, as disclosed in the Schedule of Investments and Statement of Assets and Liabilities, and the amounts of realized and changes in unrealized gains and losses on derivative instruments during the period, as disclosed in the Statement of Operations, serve as indicators of the volume of derivative activity for the Fund.
The following is a summary of the location of derivative investments on the Fund’s Statement of Assets and Liabilities for the year ended September 30, 2022:
| Derivative | Risk Type | Statement of Assets and Liabilities | Fair Value | |||||
| Futures contracts | Equity | Unrealized appreciation futures contracts | $ | 1,569,325 | ||||
The following is a summary of the location of derivative investments on the Fund’s Statement of Operations for the year ended September 30, 2022:
| Derivative Investment Type | Location of Gain/Loss on Derivative |
| Equity | Net realized gain on futures contracts |
| Net change in unrealized appreciation on futures contracts |
The following is a summary of the Fund’s derivative investments activity recognized in the Statement of Operations categorized by primary risk exposure for the year ended September 30, 2022:
| Change in unrealized | ||||||||||
| Realized gain on | appreciation on futures | |||||||||
| Derivative Investment Type | Primary Risk Exposure | futures contracts | contracts | |||||||
| Future contracts | Equity | $ | 2,091,379 | $ | 1,190,725 | |||||
There were no offsetting arrangements as of September 30, 2022.
| 4. | INVESTMENT ADVISORY AGREEMENT AND TRANSACTIONS WITH RELATED PARTIES |
Dakota Wealth Management, LLC. serves as the Fund’s investment advisor (the “Advisor”). Pursuant to an advisory agreement with the Trust, on behalf of the Fund, the Advisor, under the oversight of the Board, directs the daily operations of the Fund and supervises the performance of administrative and professional services provided by others. As compensation for its services and the related expenses borne by the Advisor, the Fund pays the Advisor a management fee computed and accrued daily and paid monthly, at an annual rate of 1.25% of the average daily net assets.. For the year ended of September 30, 2022, the advisory fees incurred by the Fund amounted to $514,459.
The Advisor has contractually agreed to reduce its fees and/or absorb expenses of the Fund, until at least January 31, 2023, to ensure that Total Annual Fund Operating Expenses (exclusive of any front-end or contingent deferred loads, brokerage fees and commissions, acquired fund fees and expenses; borrowing costs (such as interest and dividend expenses on securities sold short); taxes; expenses incurred in connection with any merger or reorganization; and extraordinary expenses (such as litigation expenses, which may include indemnification of Fund officers and Trustees, and contractual indemnification of Fund service providers (other than the Advisor) will not exceed 1.99% of the daily average net assets attributable to Class I shares. The Advisor may seek reimbursement only for fees waived or expenses paid by it during the prior three years; provided, however, that such fees and expenses may only be reimbursed to the extent they were waived or paid after the date of the waiver agreement (or any similar agreement). Reimbursements will only be sought if total expenses remain below the expenses limitation in place now or at the time of waiver or reimbursement. The Board may terminate this expense reimbursement arrangement at any time. For the year ended of September 30, 2022, the Advisor did not recapture or reimburse any expenses. There are no future amounts eligible for recapture in future periods.
34
| Persimmon Long/Short Fund |
| NOTES TO FINANCIAL STATEMENTS (Continued) |
| September 30, 2022 |
Northern Lights Distributors, LLC (the “Distributor) acts as the Fund’s principal underwriter in the continuous public offering of the Fund’s Class I shares. During the year ended of September 30, 2022, the Distributor did not receive any underwriting commissions for sales of Class I shares.
In addition, certain affiliates of the Distributor provide ancillary services to the Fund as follows:
Ultimus Fund Solutions, LLC (“UFS”)
UFS, an affiliate of the Distributor, provides administration, fund accounting, and transfer agent services to the Trust. Pursuant to separate servicing agreements with UFS, the Fund pays UFS customary fees for providing administration, fund accounting and transfer agency services to the Fund. Certain officers of the Trust are also officers of UFS, and are not paid any fees directly by the Fund for serving in such capacities.
Northern Lights Compliance Services, LLC (“NLCS”)
NLCS, an affiliate of UFS and the Distributor, provides a chief compliance officer to the Trust, as well as related compliance services, pursuant to a consulting agreement between NLCS and the Trust. Under the terms of such agreement, NLCS receives customary fees from the Fund.
Blu Giant, LLC (“Blu Giant”)
Blu Giant, an affiliate of UFS and the Distributor, provides EDGAR conversion and filing services as well as print management services for the Fund on an ad-hoc basis. For the provision of these services, Blu Giant receives customary fees from the Fund.
| 5. | AGGREGATE UNREALIZED APPRECIATION AND DEPRECIATION – TAX BASIS |
The identified cost of investments in securities owned by the Fund for federal income tax purposes, and its respective gross unrealized appreciation and depreciation at September 30, 2022, are as follows:
| Cost for Federal Tax purposes | $ | 26,740,324 | ||
| Unrealized Appreciation | 9,295,147 | |||
| Unrealized Depreciation | (2,738,226 | ) | ||
| Tax Net Unrealized Appreciation | $ | 6,556,921 |
| 6. | DISTRIBUTIONS TO SHAREHOLDERS AND TAX COMPONENTS OF CAPITAL |
The tax character of fund distributions paid for the years ended September 30, 2022 and September 30, 2021 was as follows:
| Fiscal Year Ended | Fiscal Year Ended | |||||||
| September 30, 2022 | September 30, 2021 | |||||||
| Ordinary Income | $ | — | $ | — | ||||
| Long-Term Capital Gain | — | — | ||||||
| Return of Capital | — | — | ||||||
| $ | — | $ | — | |||||
As of September 30, 2022, the components of accumulated earnings/(deficit) on a tax basis were as follows:
| Undistributed | Undistributed | Post October Loss | Capital Loss | Other | Unrealized | Total | ||||||||||||||||||||
| Ordinary | Long-Term | and | Carry | Book/Tax | Appreciation/ | Accumulated | ||||||||||||||||||||
| Income | Gains | Late Year Loss | Forwards | Differences | (Depreciation) | Earnings/(Deficits) | ||||||||||||||||||||
| $ | — | $ | — | $ | (151,779 | ) | $ | (441,025 | ) | $ | — | $ | 6,556,921 | $ | 5,964,117 | |||||||||||
35
| Persimmon Long/Short Fund |
| NOTES TO FINANCIAL STATEMENTS (Continued) |
| September 30, 2022 |
The difference between book basis and tax basis accumulated net investment losses, accumulated net realized gain (loss), and unrealized appreciation from investments is primarily attributable to the tax deferral of losses on wash sales, mark-to-market on open Section 1256 futures contracts, adjustments for real estate investment trusts and C-Corporation return of capital distributions.
Late year losses incurred after December 31 within the fiscal year are deemed to arise on the first business day of the following fiscal year for tax purposes. The Fund incurred and elected to defer such late year losses of $151,779.
At September 30, 2022, the Fund had capital loss carry forwards (“CLCF”) for federal income tax purposes available to offset future capital gains, as follows:
| Non-Expiring | Non-Expiring | |||||||||||||
| Short-Term | Long-Term | Total | CLCF Utilized | |||||||||||
| $ | 403,532 | $ | 37,493 | $ | 441,025 | $ | 94,276 | |||||||
Permanent book and tax differences, primarily attributable to the book/tax basis treatment of net operating losses and tax adjustments for prior year tax returns, resulted in reclassification for the year ended September 30, 2022 as follows:
| Accumulated | ||||||
| Paid in Capital | Earnings | |||||
| $ | (243,029 | ) | $ | 243,029 | ||
| 7. | CONTROL OWNERSHIP |
The beneficial ownership, either directly or indirectly, of 25% or more of the outstanding shares of a fund creates a presumption of control of the fund under Section 2(a)(9) of the 1940 Act. As of September 30, 2022, Charles Schwab was the record owner of 27.33% of the outstanding shares and Pershing was the record owners of 72.67%.
| 8. | NEW ACCOUNTING PRONOUNCEMENTS |
In October 2020, the Securities and Exchange Commission (the “SEC”) adopted new regulations governing the use of derivatives by registered investment companies (“Rule 18f-4”). Rule 18f-4 imposes limits on the amount of derivatives a fund can enter into, eliminates the asset segregation framework currently used by funds to comply with Section 18 of the 1940 Act, treats derivatives as senior securities and requires funds whose use of derivatives is more than a limited specified exposure amount to establish and maintain a comprehensive derivatives risk management program and appoint a derivatives risk manager.
| 9. | SUBSEQUENT EVENTS |
Subsequent events after the date of the Statement of Assets and Liabilities have been evaluated through the date the financial statements were issued. Management has determined that no events or transactions occurred requiring adjustment or disclosure in the financial statements.
36
Report of Independent Registered Public Accounting Firm
To the Shareholders of Persimmon Long/Short Fund and
the Board of Trustees of Northern Lights Fund Trust III
Opinion on the Financial Statements
We have audited the accompanying statement of assets and liabilities of Persimmon Long/Short Fund (the Fund), including the schedule of investments, as of September 30, 2022, the related statement of operations for the year then ended, the statements of changes in net assets for each of the two years in the period then ended, and the related notes to the financial statements (collectively, the financial statements), and the financial highlights for each of the five years in the period then ended. In our opinion, the financial statements and financial highlights present fairly, in all material respects, the financial position of the Fund as of September 30, 2022, the results of its operations for the year then ended, the changes in net assets for each of the two years in the period then ended, and the financial highlights for each of the five years in the period then ended, in conformity with accounting principles generally accepted in the United States of America.
Basis for Opinion
These financial statements are the responsibility of the Fund’s management. Our responsibility is to express an opinion on the Fund’s financial statements and financial highlights based on our audit. We are a public accounting firm registered with the Public Company Accounting Oversight Board (United States) (PCAOB) and are required to be independent with respect to the Fund in accordance with U.S. federal securities laws and the applicable rules and regulations of the Securities and Exchange Commission and the PCAOB.
We conducted our audit in accordance with the standards of the PCAOB. Those standards require that we plan and perform the audit to obtain reasonable assurance about whether the financial statements are free of material misstatement, whether due to error or fraud. The Fund is not required to have, nor were we engaged to perform, an audit of its internal control over financial reporting. As part of our audit, we are required to obtain an understanding of internal control over financial reporting but not for the purpose of expressing an opinion on the effectiveness of the Fund’s internal control over financial reporting. Accordingly, we express no such opinion.
Our audit included performing procedures to assess the risks of material misstatement of the financial statements, whether due to error or fraud, and performing procedures that respond to those risks. Such procedures included examining, on a test basis, evidence regarding the amounts and disclosures in the financial statements. Our procedures included confirmation of investments owned as of September 30, 2022, by correspondence with the custodians and brokers. Our audit also included evaluating the accounting principles used and significant estimates made by management, as well as evaluating the overall presentation of the financial statements. We believe that our audit provides a reasonable basis for our opinion.
/s/ RSM US LLP
We have served as the auditor of the Fund since 2017.
Denver, Colorado
November 29, 2022
37
| Persimmon Long/Short Fund |
| EXPENSE EXAMPLES |
| September 30, 2022 |
As a shareholder of the Persimmon Long/Short Fund, you incur two types of costs: (1) transaction costs, including redemption fees; and (2) ongoing costs, including management fees; distribution and/or service (12b-1) fees; and other Fund expenses. This example is intended to help you understand your ongoing costs (in dollars) of investing in the Persimmon Long Short/Fund and to compare these costs with the ongoing costs of investing in other mutual funds.
The example is based on an investment of $1,000 invested at the beginning of the period and held for the period beginning April 1, 2022 and ended September 30, 2022.
Table 1. Actual Expenses
Table 1 “Actual Expenses” provides information about actual account values and actual expenses. You may use the information below, together with the amount you invested, to estimate the expenses that you paid over the period. Simply divide your account value by $1,000 (for example, an $8,600 account value divided by $1,000 = 8.6), then multiply the result by the number provided under the heading “Expenses Paid During Period”.
Table 2. Hypothetical Expenses
Table 2 “Hypothetical Expenses” provides information about hypothetical account values and hypothetical expenses based on the Persimmon Long Short/Fund’s actual expense ratio and an assumed rate of return of 5% per year before expenses, which is not the Fund’s actual return. The hypothetical account values and expenses may not be used to estimate the actual ending account balances or expenses you paid for the period. You may use this information to compare this 5% hypothetical example with the 5% hypothetical examples that appear in the shareholder reports of other funds.
Please note that the expenses shown in the table are meant to highlight your ongoing costs only and do not reflect any transactional costs, such as sales charges (loads), or redemption fees. Therefore, the table is useful in comparing ongoing costs only, and will not help you determine the relative total costs of owning different funds. In addition, if these transactional costs were included, your costs would have been higher.
| Annualized | Beginning | Ending Account | Expenses Paid During | |||||||||||
| Expense Ratio ** | Account Value | Value | Period | |||||||||||
| Actual Expenses | 4/1/2022 - 9/30/2022 | 4/1/2022 | 9/30/2022 | 4/1/2022 - 9/30/2022 | ||||||||||
| Class I | 1.82% | $1,000.00 | $906.70 | $8.68 | ||||||||||
| Annualized | Beginning | Ending Account | Expenses Paid During | |||||||||||
| Expense Ratio ** | Account Value | Value | Period * | |||||||||||
| Hypothetical Expenses | 4/1/2022 - 9/30/2022 | 4/1/2022 | 9/30/2022 | 4/1/2022 - 9/30/2022 | ||||||||||
| Class I | 1.82% | $1,000.00 | $1,015.96 | $9.18 |
| * | Expenses are equal to the Fund’s annualized expense ratio, multiplied by the number of days in the period (183) divided by the number of days in the fiscal year (365). |
| ** | Annualized expense ratio does not include interest expense or dividend expense. |
38
| Persimmon Long/Short Fund |
| SUPPLEMENTAL INFORMATION (Unaudited) |
| September 30, 2022 |
The Trustees and officers of the Trust, together with information as to their principal business occupations during the past five years and other information, are shown below. Unless otherwise noted, the address of each Trustee and officer is 225 Pictoria Drive, Suite 450, Cincinnati, Ohio 45246.
| Independent Trustees | |||||
| Name, Address, Year of Birth | Position(s) Held with Registrant | Length of Service and Term | Principal Occupation(s) During Past 5 Years | Number of Funds Overseen In The Fund Complex* | Other Directorships Held During Past 5 Years** |
| Patricia Luscombe 1961 | Trustee | Since January 2015, Indefinite | Managing Director of the Valuations and Opinions Group, Lincoln International LLC (since August 2007). | 1 | Northern Lights Fund Trust III (for series not affiliated with the Fund since 2015); Monetta Mutual Funds (since November 2015). |
| John V. Palancia 1954 | Trustee, Chairman | Trustee, since February 2012, Indefinite; Chairman of the Board since May 2014. | Retired (since 2011); formerly, Director of Global Futures Operations Control, Merrill Lynch, Pierce, Fenner & Smith, Inc. (1975-2011). | 1 | Northern Lights Fund Trust III (for series not affiliated with the Fund since 2012); Northern Lights Fund Trust (since 2011); Northern Lights Variable Trust (since 2011); Alternative Strategies Fund (since 2012). |
| Mark H. Taylor 1964 | Trustee, Chairman of the Audit Committee | Since February 2012, Indefinite | Director, Lynn Pippenger School of Accountancy, Muma College of Business, University of South Florida (since August 2019); Chair, Department of Accountancy and Andrew D. Braden Professor of Accounting and Auditing, Weatherhead School of Management, Case Western Reserve University (2009-2019); President, American Accounting Association (since August 2022); Vice President-Finance, American Accounting Association (2017-2020); President, Auditing Section of the American Accounting Association (2012-2015); AICPA Auditing Standards Board Member (2009-2012); Academic Fellow, United States Securities and Exchange Commission (2005-2006). | 1 | Northern Lights Fund Trust III (for series not affiliated with the Fund since 2012); Northern Lights Fund Trust (since 2007); Northern Lights Variable Trust (since 2007); Alternative Strategies Fund (since June 2010). |
| Jeffery D. Young 1956 | Trustee | Since January 2015, Indefinite | Co-owner and Vice President, Latin America Agriculture Development Corp. (since May 2015); President, Celeritas Rail Consulting (since June 2014); Asst. Vice President - Transportation Systems, Union Pacific Railroad Company (June 1976 to April 2014). | 1 | Northern Lights Fund Trust III (for series not affiliated with the Fund since 2015). |
| * | As of September 30, 2022, the Trust was comprised of 32 active portfolios managed by 16 unaffiliated investment advisers. The term “Fund Complex” applies only to the Fund. The Fund does not hold itself out as related to any other series within the Trust for investment purposes, nor does it share the same investment adviser with any other series. |
| ** | Only includes directorships held within the past 5 years in a company with a class of securities registered pursuant to Section 12 of the Securities Exchange Act of 1934 or subject to the requirements of Section 15(d) of the Securities Exchange Act of 1934, or any company registered as an investment company under the 1940 Act. |
09/30/22-NLFT III-v2
39
| Persimmon Long/Short Fund |
| SUPPLEMENTAL INFORMATION (Unaudited) (Continued) |
| September 30, 2022 |
Officers of the Trust
| Name, Address, Year of Birth | Position(s) Held with Registrant | Length of Service and Term | Principal Occupation(s) During Past 5 Years |
| Eric Kane 1981 | President | Since August 2022, indefinite | Vice President and Senior Managing Counsel, Ultimus Fund Solutions, LLC (since 2022); Vice President and Managing Counsel, Ultimus Fund Solutions, LLC (2020-2022); Vice President and Counsel, Gemini Fund Services, LLC (2017-2020); Assistant Vice President, Gemini Fund Services, LLC (2014- 2017). |
| Brian Curley 1970 | Treasurer | Since February 2013, indefinite | Vice President, Ultimus Fund Solutions, LLC (since 2020); Vice President, Gemini Fund Services, LLC (2015-2020). |
| Viktoriya Pallino 1995 | Secretary | Since August 2022, indefinite | Legal Administrator II, Ultimus Fund Solutions, LLC (since 2021); Legal Administrator I, Ultimus Fund Solutions, LLC (2019-2021); Legal Administration Associate, Gemini Fund Services, LLC (2017-2019). |
| William Kimme 1962 | Chief Compliance Officer | Since February 2012, indefinite | Senior Compliance Officer of Northern Lights Compliance Services, LLC (since 2011). |
The Fund’s Statement of Additional Information includes additional information about the Trustees and is available free of charge, upon request, by calling toll-free at 1-855-233-8300.
09/30/22-NLFT III-v2
40
PRIVACY NOTICE
Rev. February 2014
| FACTS | WHAT DOES NORTHERN LIGHTS FUND TRUST III DO WITH YOUR PERSONAL INFORMATION? | |||
| Why? | Financial companies choose how they share your personal information. Federal law gives consumers the right to limit some but not all sharing. Federal law also requires us to tell you how we collect, share, and protect your personal information. Please read this notice carefully to understand what we do. | |||
| What? | The types of personal information we collect and share depend on the product or service you have with us. This information can include: | |||
| ■ | Social Security number | ■ | Purchase History | |
| ■ | Assets | ■ | Account Balances | |
| ■ | Retirement Assets | ■ | Account Transactions | |
| ■ | Transaction History | ■ | Wire Transfer Instructions | |
| ■ | Checking Account Information | |||
| When you are no longer our customer, we continue to share your information as described in this notice. | ||||
| How? | All financial companies need to share customers’ personal information to run their everyday business. In the section below, we list the reasons financial companies can share their customers’ personal information; the reasons Northern Lights Fund Trust III chooses to share; and whether you can limit this sharing. | |||
| Reasons we can share your personal information | Does Northern Lights Fund Trust III share? | Can you limit this sharing? |
For our everyday business purposes – such as to process your transactions, maintain your account(s), respond to court orders and legal investigations, or report to credit bureaus | Yes | No |
For our marketing purposes – to offer our products and services to you | No | We don’t share |
| For joint marketing with other financial companies | No | We don’t share |
For our affiliates’ everyday business purposes – information about your transactions and experiences | No | We don’t share |
For our affiliates’ everyday business purposes – information about your creditworthiness | No | We don’t share |
| For nonaffiliates to market to you | No | We don’t share |
| Questions? | Call (402) 493-4603 | ||||
41
| Who we are | |||||
Who is providing this notice?
| Northern Lights Fund Trust III | ||||
| What we do | |||||
| How does Northern Lights Fund Trust III protect my personal information? | To protect your personal information from unauthorized access and use, we use security measures that comply with federal law. These measures include computer safeguards and secured files and buildings.
Our service providers are held accountable for adhering to strict policies and procedures to prevent any misuse of your nonpublic personal information. | ||||
| How does Northern Lights Fund Trust III collect my personal information? | We collect your personal information, for example, when you
■ Open an account
■ Provide account information
■ Give us your contact information
■ Make deposits or withdrawals from your account
■ Make a wire transfer
■ Tell us where to send the money
■ Tells us who receives the money
■ Show your government-issued ID
■ Show your driver’s license
We also collect your personal information from other companies. | ||||
| Why can’t I limit all sharing? | Federal law gives you the right to limit only ■ Sharing for affiliates’ everyday business purposes – information about your creditworthiness ■ Affiliates from using your information to market to you
■ Sharing for nonaffiliates to market to you
State laws and individual companies may give you additional rights to limit sharing. | ||||
| Definitions | |||||
| Affiliates | Companies related by common ownership or control. They can be financial and nonfinancial companies.
■ Northern Lights Fund Trust III does not share with our affiliates. | ||||
| Nonaffiliates | Companies not related by common ownership or control. They can be financial and nonfinancial companies ■ Northern Lights Fund Trust III does not share with nonaffiliates so they can market to you. | ||||
| Joint marketing | A formal agreement between nonaffiliated financial companies that together market financial products or services to you.
■ Northern Lights Fund Trust III doesn’t jointly market. | ||||
42
PROXY VOTING POLICY
Information regarding how the Fund voted proxies relating to portfolio securities for the most recent twelve month period ended June 30 as well as a description of the policies and procedures that the Fund uses to determine how to vote proxies is available without charge, upon request, by calling 1-855-233-8300 or by referring to the Security and Exchange Commission’s (“SEC”) website at http://www.sec.gov.
PORTFOLIO HOLDINGS
The Fund files its complete schedule of portfolio holdings with the SEC for the first and third quarters of each fiscal year on Form N-PORT. Form N-PORT is available on the SEC’s website at http://www.sec.gov. The information on Form N-PORT is available without charge, upon request, by calling 1-855-233-8300.
| INVESTMENT ADVISOR |
| Dakota Wealth Management |
| 1777 Sentry Parkway West |
| VEVA 14, Suite 102 |
| Blue Bell, PA 19422 |
| ADMINISTRATOR |
| Ultimus Fund Solutions, LLC |
| 225 Pictoria Drive, Suite 450 |
| Cincinnati, OH 45246 |
| Persimmon-A22 |
Item 2. Code of Ethics.
(a) As of the end of the period covered by this report, the registrant has adopted a code of ethics that applies to the registrant's principal executive officer, principal financial officer, principal accounting officer or controller, or persons performing similar functions, regardless of whether these individuals are employed by the registrant or a third party.
(b) For purposes of this item, “code of ethics” means written standards that are reasonably designed to deter wrongdoing and to promote:
| (1) | Honest and ethical conduct, including the ethical handling of actual or apparent conflicts of interest between personal and professional relationships; |
| (2) | Full, fair, accurate, timely, and understandable disclosure in reports and documents that a registrant files with, or submits to, the Commission and in other public communications made by the registrant; |
(3) Compliance with applicable governmental laws, rules, and regulations;
| (4) | The prompt internal reporting of violations of the code to an appropriate person or persons identified in the code; and |
(5) Accountability for adherence to the code.
(c) Amendments: During the period covered by the report, there have not been any amendments to the provisions of the code of ethics.
(d) Waivers: During the period covered by the report, the registrant has not granted any express or implicit waivers from the provisions of the code of ethics.
(e) The Code of Ethics is not posted on Registrant’ website.
(f) A copy of the Code of Ethics is attached as an exhibit.
Item 3. Audit Committee Financial Expert.
(a)(1)ii The Registrant’s board of trustees has determined that Mark H. Taylor is an audit committee financial expert, as defined in Item 3 of Form N-CSR. Mr. Taylor is independent for purposes of this Item 3.
(a)(2) Not applicable.
(a)(3) In this regard, no member of the audit committee was identified as having all of the required technical attributes identified in instruction 2 (b) to item 3 of Form N-CSR to qualify as an “audit committee financial expert,” whether through the type of specialized education or experience required by that instruction. At this time, the board believes the experience provided by each member of the audit committee collectively offers the fund adequate oversight by its audit committee given the fund’s level of financial complexity. The board will from time to time reexamine such belief.
Item 4. Principal Accountant Fees and Services.
| (a) | Audit Fees |
2022 - $16,500
2021 – $16,000
| (b) | Audit-Related Fees |
2022 - None
2021 – None
| (c) | Tax Fees |
2022 - $3,575
2021 – $3,400
Preparation of Federal & State income tax returns, assistance with calculation of required income, capital gain and excise distributions and preparation of Federal excise tax returns.
| (d) | All Other Fees |
2022 - None
2021 - None
| (e) | (1) Audit Committee’s Pre-Approval Policies |
The registrant’s Audit Committee is required to pre-approve all audit services and, when appropriate, any non-audit services (including audit-related, tax and all other services) to the registrant. The registrant’s Audit Committee also is required to pre-approve, when appropriate, any non-audit services (including audit-related, tax and all other services) to its adviser, or any entity controlling, controlled by or under common control with the adviser that provides ongoing services to the registrant, to the extent that the services may be determined to have an impact on the operations or financial reporting of the registrant. Services are reviewed on an engagement by engagement basis by the Audit Committee.
| (2) | Percentages of Services Approved by the Audit Committee |
| 2022 | 2021 | |||||||
| Audit-Related Fees: | 0.00 | % | 0.00 | % | ||||
| Tax Fees: | 0.00 | % | 0.00 | % | ||||
| All Other Fees: | 0.00 | % | 0.00 | % | ||||
| (f) | During the audit of registrant's financial statements for the most recent fiscal year, less than 50 percent of the hours expended on the principal accountant's engagement were attributed to work performed by persons other than the principal accountant's full-time, permanent employees. |
| (g) | The aggregate non-audit fees billed by the registrant's accountant for services rendered to the registrant, and rendered to the registrant's investment adviser (not including any sub-adviser whose role is primarily portfolio management and is subcontracted with or overseen by another investment adviser), and any entity controlling, controlled by, or under common control with the adviser that provides ongoing services to the registrant: |
2022 - $3,575
2021 - $3,400
(h) The registrant's audit committee has considered whether the provision of non-audit services to the registrant's investment adviser (not including any sub-adviser whose role is primarily portfolio management and is subcontracted with or overseen by another investment adviser), and any entity controlling, controlled by, or under common control with the investment adviser that provides ongoing services to the registrant, that were not pre-approved pursuant to paragraph (c)(7)(ii) of Rule 2-01 of Regulation S-X, is compatible with maintaining the principal accountant's independence.
Item 5. Audit Committee of Listed Companies. Not applicable to open-end investment companies.
Item 6. Schedule of Investments. Schedule of investments in securities of unaffiliated issuers is included under Item 1.
Item 7. Disclosure of Proxy Voting Policies and Procedures for Closed-End Funds. Not applicable to open-end investment companies.
Item 8. Portfolio Managers of Closed-End Management Investment Companies. Not applicable to open-end investment companies.
Item 9. Purchases of Equity Securities by Closed-End Funds. Not applicable to open-end investment companies.
Item 10. Submission of Matters to a Vote of Security Holders. None
Item 11. Controls and Procedures.
(a) Based on an evaluation of the Registrant’s disclosure controls and procedures as of a date within 90 days of filing date of this Form N-CSR, the principal executive officer and principal financial officer of the Registrant have concluded that the disclosure controls and procedures of the Registrant are reasonably designed to ensure that the information required in filings on Form N-CSR is recorded, processed, summarized, and reported by the filing date, including that information required to be disclosed is accumulated and communicated to the Registrant’s management, including the Registrant’s principal executive officer and principal financial officer, as appropriate to allow timely decisions regarding required disclosure.
(b) There were no significant changes in the Registrant’s internal control over financial reporting that occurred during the period covered by this report that have materially affected, or are reasonably likely to materially affect, the Registrant’s internal control over financial reporting.
Item 12. Disclosure of Securities Lending Activities for Closed-End Management Investment Companies. Not applicable.
Item 13. Exhibits.
(a)(1) Code of Ethics filed herewith.
(a)(3) Not applicable.
SIGNATURES
Pursuant to the requirements of the Securities Exchange Act of 1934 and the Investment Company Act of 1940, the registrant has duly caused this report to be signed on its behalf by the undersigned, thereunto duly authorized.
(Registrant) Northern Lights Fund Trust III
By (Signature and Title)
/s/ Eric Kane
Eric Kane, Principal Executive Officer/President
Date 12/08/22
Pursuant to the requirements of the Securities Exchange Act of 1934 and the Investment Company Act of 1940, this report has been signed below by the following persons on behalf of the registrant and in the capacities and on the dates indicated.
By (Signature and Title)
/s/ Eric Kane
Eric Kane, Principal Executive Officer/President
Date 12/08/22
By (Signature and Title)
/s/ Brian Curley
Brian Curley, Principal Financial Officer/Treasurer
Date 12/08/22