As filed with the U.S. Securities and Exchange Commission on November 7, 2022
UNITED STATES
SECURITIES AND EXCHANGE COMMISSION
Washington, D.C. 20549
SECURITIES AND EXCHANGE COMMISSION
Washington, D.C. 20549
FORM N-CSR
CERTIFIED SHAREHOLDER REPORT OF REGISTERED
MANAGEMENT INVESTMENT COMPANIES
Investment Company Act file number 811-22668
ETF Series Solutions
(Exact name of registrant as specified in charter)
(Exact name of registrant as specified in charter)
615 East Michigan Street
Milwaukee, WI 53202
(Address of principal executive offices) (Zip code)
(Address of principal executive offices) (Zip code)
Kristina R. Nelson
ETF Series Solutions
615 East Michigan Street
Milwaukee, WI 53202
(Name and address of agent for service)
(Name and address of agent for service)
(414) 516-1645
Registrant's telephone number, including area code
Date of fiscal year end: August 31
Date of reporting period: August 31, 2022
Item 1. Reports to Stockholders.
| (a) |
Annual Report
August 31, 2022
VIDENT INTERNATIONAL EQUITY FUND
Ticker: VIDI
VIDENT CORE U.S. EQUITY FUND
Ticker: VUSE
VIDENT CORE U.S. BOND STRATEGY ETF
Ticker: VBND
VIDENT FUNDS
TABLE OF CONTENTS
| Page | |
| Letters to Shareholders | 1 |
| Performance Summary | 9 |
| Portfolio Allocation | 15 |
| Schedules of Investments | 18 |
| Statements of Assets and Liabilities | 49 |
| Statement of Operations | 50 |
| Statements of Changes in Net Assets | 51 |
| Financial Highlights | 54 |
| Notes to Financial Statements | 57 |
| Report of Independent Registered Public Accounting Firm | 72 |
| Trustees and Officers | 73 |
| Expense Examples | 75 |
| Approval of Sub-Advisory Agreement & Board Considerations | 77 |
| Review of Liquidity Risk Management Program | 80 |
| Federal Tax Information | 81 |
| Information About Portfolio Holdings | 83 |
| Information About Proxy Voting | 83 |
| Frequency Distribution of Premium and Discounts | 83 |
VIDENT INTERNATIONAL EQUITY FUND
Dear Shareholders,
On behalf of the entire team, we want to express our appreciation for the confidence you have placed in the Vident International Equity Fund (“VIDI” or the “Fund”). The following information pertains to the fiscal period of September 1, 2021 through August 31, 2022 (the “current fiscal period”). The Fund seeks to track the total return performance, before fees and expenses, of the Vident Core International Equity Index™ (the “Index”). This index strategy seeks to provide investors with a well-diversified set of global equities exposures across countries, regions and stocks, emphasizing countries with more favorable conditions for investment as well as economic and financial market resilience. The Index also seeks to enhance investors’ stock exposures, systematically selecting higher quality stocks that Vident believes to have favorable valuations and favorable price momentum.
The Fund had negative performance during the current fiscal period. The market price for VIDI decreased -15.41% and the NAV decreased -15.77%, while the Morningstar Global Markets ex-US Large-Mid Cap Index, a broad market index, detracted -19.34% over the same period. The Fund’s Index fell -14.57%. Meanwhile, outstanding shares ended the period at 15,400,000.
The largest positive contributor to return was Equinor ASA (EQNR NO), adding 0.35% to the return of the Fund, gaining 88.24% with an average weighting of 0.66%. The second largest contributor to return was Orient Overseas International, Ltd. (316 HK), adding 0.29% to the return of the Fund, gaining 45.44% with an average weighting of 0.60%. The third largest contributor to return was United Tractors Tbk PT (UNTR IJ), adding 0.28% to the return of the Fund, gaining 69.35% with an average weighting of 0.59%.
The largest negative contributor to return was Top Glove Corporation Bhd (TOPG MK), detracting -0.51% from the return of the Fund, declining -76.90% with an average weighting of 0.33%. The security contributing second-most negatively was PJSC Gazprom (OGZD LI), detracting -0.48% from the return of the Fund, and declining -93.00% with an average weighting of 0.30%. The third largest negative contributor to return was Hartalega Holdings Berhad (HART MK), detracting -0.46% from the return of the Fund, and declining -72.54% with an average weight of 0.23%.
The best performing security in the Fund was Minerva SA (BEEF3 BZ), gaining 97.22% and contributing 0.03% to the return of the Fund. The second-best performing security for the period was Rheinmetall AG (RHM GR), gaining 89.70% and contributing 0.23% to the return of the Fund. The third-best performing security was Equinor ASA (EQNR NO), gaining 88.24% for the period and contributing 0.35% to the return of the Fund.
The worst performing security in the Fund was Magnit PJSC (MGNT LI), declining -99.91% and reducing the return of the Fund by 0.10%. The second-worst performing
1
VIDENT INTERNATIONAL EQUITY FUND
security in the Fund was Severstal PJSC (SVST LI), declining -99.71% and reducing the return of the LUKOIL PJSC Fund by -0.11%. The third-worst performing security in the Fund was (LKOD LI), declining -99.11% and reducing the return of the Fund by -0.19%. These securities, along with four other Russian securities, were marked to zero following the outset of the Russian invasion of Ukraine and subsequent Russian market closures and U.S. sanctions against Russia in early 2022. Collectively, these securities reduced the return of the Fund by -1.36%.
Vident believes the Fund’s negative performance is consistent with relevant market conditions observed in the general low performance of international markets compared to domestic markets. Market conditions such as the dollar strengthening relative to currencies of other investible markets in the Fund’s universe contributed to low performance. Additionally, relevant attributes in the Index’s approach that likely explain its performance, include an underweight to China and in the Index’s stock-picking approach which uses value, quality, and momentum.
Vident believes VIDI’s rules-based index strategy will remain competitive in the international investment landscape and given market environment. Vident wishes to express our sincerest appreciation for your confidence and commitment to VIDI. We will continue to strive to ensure the satisfaction of our shareholders.
Sincerely,
Deborah K. Kimery, CFA
Chief Executive Officer, Vident Advisory, LLC
2
VIDENT CORE U.S. EQUITY FUND
Dear Shareholders,
On behalf of the entire team, we want to express our appreciation for the confidence you have placed in the Vident Core U.S. Equity Fund (“VUSE” or the “Fund”). The following information pertains to the fiscal period of September 1, 2021 through August 31, 2022 (the “current fiscal period”). The Fund seeks to track the total return performance, before fees and expenses, of the Vident Core U.S. Stock Index™ (the “Index”). This index strategy represents a portfolio of U.S. equities that adhere to higher standards of corporate governance and accounting, as measured by numerous research metrics. This research is integrated into a systematic and structured selection process that seeks to provide an index of higher quality U.S. companies across small, medium and large-capitalization ranges. The Index also seeks to mitigate some of the risks often associated with market capitalization-weighted indices, including issuer concentration.
The Fund had negative performance during the current fiscal period. The market price for VUSE decreased -6.69% and the NAV decreased -6.66%, while the S&P 500 Index, a broad market index, detracted -11.23% over the same period. The Fund’s Index fell -6.56%. Meanwhile, outstanding shares ended the period at 11,300,000.
The largest positive contributor to return was Chord Energy Corporation (CHRD US), adding 0.41% to the return of the Fund, gaining 97.46% with an average weighting of 0.59%. The second largest contributor to return was Marathon Oil Corporation (MRO US), adding 0.39% to the return of the Fund, gaining 120.70% with an average weighting of 0.59%. The third largest contributor to return was Ovintiv, Inc. (OVV US), adding 0.35% to the return of the Fund, gaining 98.53% with an average weighting of 0.61%.
The largest negative contributor to return was DISH Network Corporation – Class A (DISH US), detracting -0.35% from the return of the Fund, declining -60.20% with an average weighting of 0.41%. The security contributing second-most negatively was Fulgent Genetics, Inc. (FLGT US), detracting -0.28% from the return of the Fund, and declining -52.36% with an average weighting of 0.46%. The third largest negative contributor to return was PROG Holdings, Inc. (PRG US), detracting -0.26% from the return of the Fund, and declining -61.07% with an average weight of 0.28%.
The best performing security in the Fund was Marathon Oil Corporation (MRO US), gaining 120.70% and contributing 0.39% to the return of the Fund. The second-best performing security for the period was Antero Resources Corporation (AR US), gaining 102.97% and contributing 0.08% to the return of the Fund. The third-best performing security was Ovintiv, Inc. (OVV US), gaining 98.53% for the period and contributing 0.35% to the return of the Fund.
3
VIDENT CORE U.S. EQUITY FUND
The worst performing security in the Fund was PROG Holdings, Inc. (PRG US), declining -61.07% and reducing the return of the Fund by -0.26%. The second-worst performing security in the Fund was Kyndryl Holdings, Inc. (KD US), declining -60.50% and reducing the return of the Fund by -0.01%. The third-worst performing security in the Fund was DISH Network Corporation – Class A, declining -60.20% and reducing the return of the Fund by -0.35%.
Vident believes the Fund’s performance is consistent with relevant market conditions and the general negative performance of domestic equity markets. Relevant contributors are likely the Index’s value factors, as value funds generally outperformed growth funds during the period. In addition, the Index’s all-cap (opposed to market-cap) approach resulted in relatively higher exposures to mid-cap and lower exposures to large-cap companies. During the period, mid-cap tended to outperform large cap. These dynamics are consistent both in the slowing economic growth and rising interest rate trends during the period.
Vident believes VUSE’s rules-based index strategy will remain competitive in the U.S. equities investment landscape and given market environment. Vident wishes to express our sincerest appreciation for your confidence and commitment to the Fund. We will continue to strive to ensure the satisfaction of our shareholders.
Sincerely,
Deborah K. Kimery, CFA
Chief Executive Officer, Vident Advisory, LLC
4
VIDENT CORE U.S. BOND STRATEGY ETF
Dear Shareholders,
On behalf of the entire team, we want to express our appreciation for the confidence you have placed in the Vident Core US Bond Strategy ETF (“VBND” or the “Fund”). The following information pertains to the fiscal period of September 1, 2021 through August 31, 2022 (the “current fiscal period”). The Fund seeks to track the total return performance, before fees and expenses, of the Vident Core U.S. Bond Index™ (the “Index”). This Index seeks to diversify interest rate and credit risks through the application of time-tested principles. In addition to diversifying across fixed income sectors, the strategy seeks to improve corporate bond exposures by screening for companies with stronger leadership, governance and creditworthiness factors.
The Fund had negative performance during the current fiscal period. The market price for VBND decreased -12.37% and the NAV decreased -12.41%, while the FTSE US Broad Investment Grade Bond Index, a broad market index, decreased -11.76% over the same period. The Fund’s Index fell -11.94%. Meanwhile, outstanding shares ended the period at 8,500,000.
The largest positive contributor to return was Fannie Mae/Freddie Mac (UMBS) (FNCL 3 8/22), adding 0.05% to the return of the Fund, gaining 2.30% with an average weighting of 0.10%. The second largest contributor to return was Fannie Mae/Freddie Mac (UMBS) (FNCL 3.5 8/22), adding 0.03% to the return of the Fund, gaining 2.15% with an average weighting of 0.07%. The third largest contributor to return was Fannie Mae/Freddie Mac (UMBS) (FNCL 4 8/22), adding 0.01% to the return of the Fund, gaining 1.72% with an average weighting of 0.04%.
The largest negative contributor to return was United States Treasury Note/Bond (T 37/8⅞ 08/15/40), detracting -0.57% from the return of the Fund, declining -10.84% with an average weighting of 2.60%. The security contributing second-most negatively was United States Treasury Note/Bond (T 51/4 11/15/28), detracting -0.41% from the return of the Fund, and declining -7.67% with an average weighting of 4.86%. The third largest negative contributor to return was United States Treasury Note/Bond (T 61/4 05/15/30), detracting -0.30% from the return of the Fund, and declining -9.22% with an average weight of 2.69%.
The best performing security in the Fund was Ginnie Mae (GNSF 3 7/22), gaining 2.43% and contributing 0.01% to the return of the Fund. The second-best performing security for the period was Ginnie Mae (G2SF 3 7/22), gaining 2.40% and contributing 0.01% to the return of the Fund. The third-best performing security was Fannie Mae/Freddie Mac (UMBS) (FNCL 3 8/22), gaining 2.30% for the period and contributing 0.05% to the return of the Fund.
The worst performing security in the Fund was Corning, Inc. (GLW 5.45 11/15/2079), declining -31.61% and reducing the return of the Fund by -0.06%. The second-worst
5
VIDENT CORE U.S. BOND STRATEGY ETF
performing security in the Fund was Owens Corning (OC 4.3 07/15/47), declining -27.54% and reducing the return of the Fund by -0.09%. The third-worst performing security in the Fund was Kohl’s Corporation (KSS 33/8 05/01/31), declining -26.84% and reducing the return of the Fund by -0.08%.
Vident believes the Fund’s performance is consistent with relevant market conditions including slowing economic growth and the general negative performance of domestic fixed income markets, driven by U.S. Federal Reserve tightening and rising rates during the period. Contributors to performance include the Index’s mid-range duration targets and its momentum signaling investment technique to determine allocations to high yield and Treasury Inflation-Protected Securities bonds or TIPS.
Vident believes VBND’s rules-based index strategy will remain competitive in the fixed income investment landscape and given market environments. Vident wishes to express our sincerest appreciation for your confidence and commitment to VBND. We will continue to strive to ensure the satisfaction of our shareholders.
Sincerely,
Deborah K. Kimery, CFA
Chief Executive Officer, Vident Advisory, LLC
6
VIDENT FUNDS
Past performance is no guarantee of future results.
Opinions expressed are subject to change, are not guaranteed and should not be considered investment advice or recommendations to buy or sell any security. Fund holdings are subject to change and are not recommendations to buy or sell any security. For more complete information regarding performance and holdings, please refer to the schedules of investments on pages 18-48.
Investments involve risk. Principal loss is possible. The Funds have the same risks as the underlying securities traded on the exchange throughout the day at market price. Redemptions are limited and often commissions are charged on each trade. Investments in foreign securities involve political, economic and currency risks, greater volatility and differences in accounting methods. These risks are greater for investments in emerging markets. A fund that concentrates its investments in the securities of a particular industry or geographic area may be more volatile than a fund that invests in a broader range of industries. VIDI and VBND may invest in illiquid or thinly traded securities which involve additional risks such as limited liquidity and greater volatility. VBND may make investments in debt securities. The Fund’s investments in high yield securities expose it to a substantial degree of credit risk. These investments are considered speculative under traditional investment standards. Debt issuers and other counterparties may not honor their obligations or may have their debt downgraded by ratings agencies. An increase in interest rates may cause the value of fixed-income securities held by the Fund to decline. During periods of rising interest rates, certain debt obligations will be paid off substantially more slowly than originally anticipated and the value of those securities may fall sharply, resulting in a decline in the Fund’s income and potentially in the value of the Fund’s investments. VBND may also invest in asset backed and mortgage backed securities which include additional risks that investors should be aware of such as credit risk, prepayment risk, possible illiquidity and default, as well as increased susceptibility to adverse economic developments. The performance of the Funds may diverge from that of the Indices. Because the Funds employ a representative sampling strategy and may also invest up to 20% of their assets in securities that are not included in the Indices, the Funds may experience tracking error to a greater extent than a fund that seeks to replicate an index. The Funds are not actively managed and may be affected by a general decline in market segments related to the Indices. The Funds invest in securities included in, or representative of securities included in, the Indices, regardless of their investment merits. Small and medium-capitalization companies tend to have more limited liquidity and greater price volatility than large-capitalization companies. Unlike mutual funds, ETFs may trade at a premium or discount to their net asset value.
The Vident Core International Equity IndexTM (Bloomberg Symbol: VIEQX) is a strategy seeking to balance risk across developed and emerging countries and emphasize those with favorable conditions for growth. The Vident Core U.S. Stock IndexTM (Bloomberg Symbol: VCUSX) is a strategy which seeks to apply principles-based reasoning, expressed through innovative risk design to address the risks and opportunities of U.S. equity investing. The Vident Core U.S. Bond IndexTM (Bloomberg Symbol: VUBDX) is a strategy which seeks to diversify and improve interest rate and credit risks of traditional U.S. core bonds.
The Morningstar Global ex-US Large-Mid Index measures the performance of Global Markets Ex-US equity markets targeting the top 90% of stocks by market capitalization. This Index does not incorporate Environmental, Social, or Governance (ESG) criteria.
The Morningstar Global Markets ex-US Index measures the performance of the stocks located in the developed and emerging countries across the world (excluding the United States) as defined by Morningstar. Stocks in the index are weighted by their float capital, which removes corporate cross ownership, government holdings and other locked-in shares. This Index does not incorporate Environmental, Social, or Governance (ESG) criteria.
7
VIDENT FUNDS
The S&P 500 Index measures the performance of 500 widely held stocks in US equity market. Standard and Poor’s chooses member companies for the index based on market size, liquidity and industry group representation. Included are the stocks of industrial, financial, utility, and transportation companies. Since mid 1989, this composition has been more flexible and the number of issues in each sector has varied. It is market capitalization-weighted.
The Morningstar U.S. Market Total Return Index measures the performance of US securities and targets 97% market capitalization coverage of the investable universe. It is a diversified broad market index. This Index does not incorporate Environmental, Social, or Governance (ESG) criteria.
The FTSE Broad Investment Grade Bond Index measures the performance of US Dollar-denominated bonds issued in the US investment-grade bond market. Introduced in 1985, the index covers US Treasury, government sponsored, collateralized, and corporate debt providing a reliable representation of the US investment-grade bond market. Sub-indexes are available in any combination of asset class, maturity, and rating.
It is not possible to invest directly in an index.
Diversification does not assure a profit or protect against loss in a declining market.
Must be preceded or accompanied by a Prospectus.
8
VIDENT INTERNATIONAL EQUITY FUND
PERFORMANCE SUMMARY
(Unaudited)
Growth of $10,000
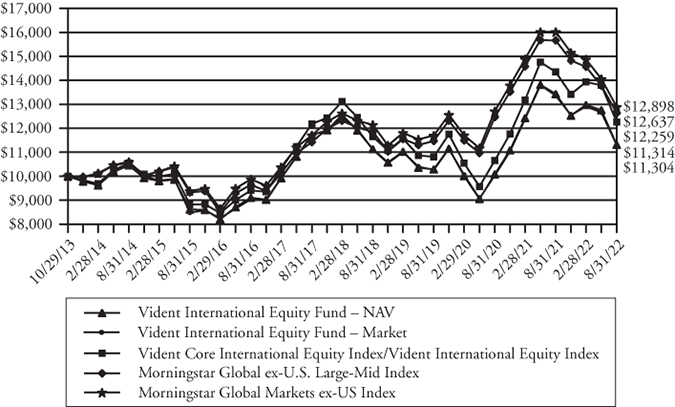
This chart illustrates the performance of a hypothetical $10,000 investment made on October 29, 2013, and is not intended to imply any future performance. The returns shown do not reflect the deduction of taxes that a shareholder would pay on Fund distributions or the redemption of Fund shares. The chart assumes reinvestment of capital gains and dividends. It is not possible to invest directly in an index.
9
VIDENT INTERNATIONAL EQUITY FUND
PERFORMANCE SUMMARY
(Unaudited) (Continued)
| Average Annual Returns | One | Three | Five | Since |
August 31, 2022 | Year | Years | Years | Inception(1) |
| Vident International | ||||
| Equity Fund – NAV | -15.77% | 3.23% | -0.70% | 1.41% |
| Vident International | ||||
| Equity Fund – Market | -15.41% | 3.25% | -0.73% | 1.40% |
| Vident Core International | ||||
| Equity Index/Vident | ||||
International Equity Index(2)(3) | -14.57% | 4.29% | 0.12% | 2.33% |
| Morningstar Global ex-U.S. | ||||
Large-Mid Index(2)(4) | -19.34% | 3.27% | 2.04% | 2.68% |
| Morningstar Global Markets | ||||
ex-US Index(2)(5) | -19.51% | 3.32% | 1.96% | 2.92% |
The Performance data quoted is historical. Past performance is no guarantee of future results. Current performance may be higher or lower than the performance data quoted. The principal value and investment return of an investment will fluctuate so that your shares, when redeemed, may be worth more or less than their original cost. The returns shown do not reflect the deduction of taxes that a shareholder would pay on Fund distributions or on the redemptions of Fund shares. The total operating expenses as stated in the fee table to the Fund’s prospectus dated December 31, 2021, is 0.61%. For performance information current to the most recent month-end, please call 1-800-617-0004.
(1) | Inception date is October 29, 2013. |
(2) | Indexes are unmanaged statistical composites and their returns do not include fees an investor would pay to purchase the securities they represent. Such costs would lower performance. It is not possible to invest directly in an index. |
(3) | Effective January 6, 2016, the Fund’s investment objective changed to track the performance, before fees and expenses, of the Vident Core International Equity Index. Prior to January 6, 2016, the Fund’s investment objective was to track the price and total return performance, before fees and expenses, of the Vident International Equity Index. Performance shown for periods beginning January 6, 2016 is that of the Vident Core International Equity Index, and performance shown for periods prior to January 6, 2016 is that of the Vident International Equity Index. |
(4) | Morningstar Global ex-U.S. Large-Mid Index measures the performance of Global Markets Ex-U.S. equity markets targeting the top 90% of stocks by market capitalization. |
(5) | Morningstar Global Markets ex-US Index provides exposure to the top 97% market capitalization in each of two economic segments, developed markets, excluding the United States, and emerging markets. |
10
VIDENT CORE U.S. EQUITY FUND
PERFORMANCE SUMMARY
(Unaudited)
Growth of $10,000
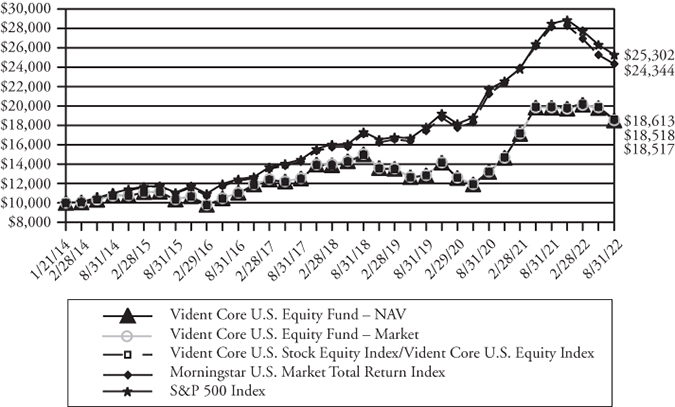
This chart illustrates the performance of a hypothetical $10,000 investment made on January 21, 2014, and is not intended to imply any future performance. The returns shown do not reflect the deduction of taxes that a shareholder would pay on Fund distributions or the redemption of Fund shares. The chart assumes reinvestment of capital gains and dividends. It is not possible to invest directly in an index.
11
VIDENT CORE U.S. EQUITY FUND
PERFORMANCE SUMMARY
(Unaudited) (Continued)
| Average Annual Returns | One | Three | Five | Since |
August 31, 2022 | Year | Years | Years | Inception(1) |
| Vident Core U.S. | ||||
| Equity Fund – NAV | -6.66% | 12.95% | 8.13% | 7.42% |
| Vident Core U.S. | ||||
| Equity Fund – Market | -6.69% | 12.97% | 8.10% | 7.42% |
| Vident Core U.S. Stock | ||||
| Equity Index/Vident Core | ||||
U.S. Equity Index(2)(3) | -6.56% | 13.20% | 8.37% | 7.48% |
| Morningstar U.S. Market | ||||
Total Return Index(2)(4) | -13.52% | 11.77% | 11.31% | 10.89% |
S&P 500 Index(2)(5) | -11.23% | 12.39% | 11.82% | 11.39% |
The performance data quoted is historical. Past performance is no guarantee of future results. Current performance may be higher or lower than the performance data quoted. The principal value and investment return of an investment will fluctuate so that your shares, when redeemed, may be worth more or less than their original cost. The returns shown do not reflect the deduction of taxes that a shareholder would pay on Fund distributions or on the redemptions of Fund shares. The total operating expenses as stated in the fee table to the Fund’s prospectus dated December 31, 2021, is 0.50%. For performance information current to the most recent month-end, please call 1-800-617-0004.
(1) | Inception date is January 21, 2014. |
(2) | Indexes are unmanaged statistical composites and their returns do not include fees an investor would pay to purchase the securities they represent. Such costs would lower performance. It is not possible to invest directly in an index. |
(3) | Effective January 6, 2016, the Fund’s investment objective changed to track the performance, before fees and expenses, of the Vident Core U.S. Stock Index. Prior to January 6, 2016, the Fund’s investment objective was to track the price and total return performance, before fees and expenses, of the Vident Core U.S. Equity Index. Performance shown for periods beginning January 6, 2016 is that of the Vident Core U.S. Stock Index, and performance shown for periods prior to January 6, 2016 is that of the Vident Core U.S. Equity Index. |
(4) | Morningstar U.S. Market Total Return Index is a diversified broad market index that targets 97% market capitalization coverage of the investable universe. |
(5) | The Standard & Poor’s 500 Index (S&P 500) is an unmanaged index containing common stocks of 500 industrial, transportation, utility, and financial companies, regarded as generally representative of the U.S. stock market. The index return reflects the reinvestment of income dividends and capital gain distributions, if any, but does not reflect fees, brokerage commissions, or other expenses of investing. |
12
VIDENT CORE U.S. BOND STRATEGY ETF
PERFORMANCE SUMMARY
(Unaudited)
Growth of $10,000
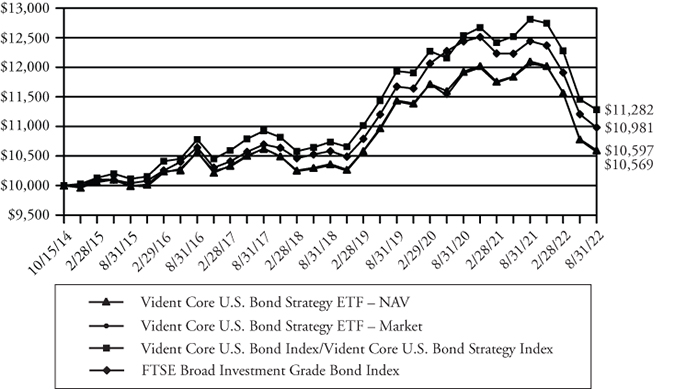
This chart illustrates the performance of a hypothetical $10,000 investment made on October 15, 2014, and is not intended to imply any future performance. The returns shown do not reflect the deduction of taxes that a shareholder would pay on Fund distributions or the redemption of Fund shares. The chart assumes reinvestment of capital gains and dividends. It is not possible to invest directly in an index.
13
VIDENT CORE U.S. BOND STRATEGY ETF
PERFORMANCE SUMMARY
(Unaudited) (Continued)
| Average Annual Returns | One | Three | Five | Since |
August 31, 2022 | Year | Years | Years | Inception(1) |
| Vident Core U.S. Bond | ||||
| Strategy ETF – NAV | -12.41% | -2.51% | -0.04% | 0.74% |
| Vident Core U.S. Bond | ||||
| Strategy ETF – Market | -12.37% | -2.55% | -0.11% | 0.71% |
| Vident Core U.S. Bond | ||||
| Index/Vident Core U.S. | ||||
Bond Strategy Index(2)(3) | -11.94% | -1.86% | 0.65% | 1.54% |
| FTSE Broad Investment | ||||
Grade Bond Index(2)(4) | -11.76% | -2.02% | 0.53% | 1.19% |
The performance data quoted is historical. Past performance is no guarantee of future results. Current performance may be higher or lower than the performance data quoted. The principal value and investment return of an investment will fluctuate so that your shares, when redeemed, may be worth more or less than their original cost. The returns shown do not reflect the deduction of taxes that a shareholder would pay on Fund distributions or on the redemptions of Fund shares. The total operating expenses as stated in the fee table to the Fund’s prospectus dated December 31, 2021, is 0.41%. For performance information current to the most recent month-end, please call 1-800-617-0004.
(1) | Inception date is October 15, 2014. |
(2) | Indexes are unmanaged statistical composites and their returns do not include fees an investor would pay to purchase the securities they represent. Such costs would lower performance. It is not possible to invest directly in an index. |
(3) | Effective January 6, 2016, the Fund’s investment objective changed to track the performance, before fees and expenses, of the Vident Core U.S. Bond Index. Prior to January 6, 2016, the Fund’s investment objective was to track the price and total return performance, before fees and expenses, of the Vident Core U.S. Bond Strategy Index. Performance shown for periods beginning January 6, 2016 is that of the Vident Core U.S. Bond Index, and performance shown for periods prior to January 6, 2016 is that of the Vident Core U.S. Bond Strategy Index. |
(4) | FTSE Broad Investment Grade Bond Index tracks the performance of the U.S. Dollar-denominated bonds issued in the U.S. investment-grade bond market. |
14
VIDENT INTERNATIONAL EQUITY FUND
PORTFOLIO ALLOCATION
As of August 31, 2022 (Unaudited)
| Percentage of | |
| Country | Net Assets |
| Taiwan | 7.6% |
| Republic of Korea | 7.5% |
| Norway | 7.1% |
| China | 6.6% |
| Hong Kong | 6.6% |
| Brazil | 5.5% |
| Germany | 5.3% |
| Australia | 5.3% |
| Singapore | 5.3% |
| Sweden | 5.0% |
| Canada | 3.9% |
| United Kingdom | 3.8% |
| Japan | 3.6% |
| Denmark | 3.2% |
| Switzerland | 3.2% |
| Israel | 2.6% |
| Chile | 2.4% |
| South Africa | 1.9% |
| Indonesia | 1.8% |
| Thailand | 1.7% |
| Netherlands | 1.4% |
| Ireland | 1.3% |
| Poland | 1.3% |
| Malaysia | 1.0% |
| Finland | 0.9% |
| France | 0.9% |
| Italy | 0.9% |
| Spain | 0.6% |
| Mexico | 0.5% |
| Belgium | 0.2% |
| Austria | 0.1% |
| Russian Federation | 0.0% |
| Short-Term Investments | 0.2% |
| Investments Purchased | |
| with Proceeds from | |
| Securities Lending | 2.9% |
| Liabilities in Excess | |
| of Other Assets | (2.1)% |
| Total | 100.0% |
15
VIDENT CORE U.S. EQUITY FUND
PORTFOLIO ALLOCATION
As of August 31, 2022 (Unaudited)
| Percentage of | |
| Sector | Net Assets |
| Information Technology | 21.5% |
| Financials | 13.3% |
| Consumer Discretionary | 12.9% |
| Health Care | 12.3% |
| Industrials | 9.6% |
| Consumer Staples | 8.3% |
| Communication Services | 7.0% |
| Energy | 5.9% |
| Materials | 3.8% |
| Utilities | 2.8% |
| Real Estate | 2.3% |
| Short-Term Investments | 0.2% |
| Investments Purchased with Proceeds from Securities Lending | 22.0% |
| Liabilities in Excess of Other Assets | (21.9)% |
| Total | 100.0% |
16
VIDENT CORE U.S. BOND STRATEGY ETF
PORTFOLIO ALLOCATION
As of August 31, 2022 (Unaudited)
| Percentage of | |
| Asset Type | Net Assets |
| U.S. Government Notes/Bonds | 61.6% |
| Corporate Bonds | 24.8% |
| Mortgage Backed Securities – U.S. Government Agency | 11.3% |
| U.S. Government Agency Issues | 1.7% |
| Short-Term Investments | 7.0% |
| Investments Purchased with Proceeds from Securities Lending | 2.9% |
| Liabilities in Excess of Other Assets | (9.3)% |
| Total | 100.0% |
17
VIDENT INTERNATIONAL EQUITY FUND
SCHEDULE OF INVESTMENTS
August 31, 2022
| Shares | Security Description | Value | |||||
| COMMON STOCKS – 95.1% | |||||||
| Australia – 5.3% | |||||||
| 285,421 | AGL Energy, Ltd. | $ | 1,502,751 | ||||
| 1,284,439 | Beach Energy, Ltd. | 1,505,739 | |||||
| 236,233 | Bendigo & Adelaide Bank, Ltd. (a) | 1,464,027 | |||||
| 126,819 | BlueScope Steel, Ltd. | 1,453,652 | |||||
| 362,840 | Harvey Norman Holdings, Ltd. (a) | 1,052,193 | |||||
| 510,178 | Healius, Ltd. | 1,301,082 | |||||
| 56,823 | JB Hi-Fi, Ltd. (a) | 1,585,082 | |||||
| 568,808 | Metcash, Ltd. (a) | 1,606,582 | |||||
| 214,722 | QBE Insurance Group, Ltd. | 1,776,740 | |||||
| 25,486 | Rio Tinto, Ltd. | 1,651,100 | |||||
| 69,995 | Sonic Healthcare, Ltd. | 1,631,496 | |||||
| 2,463,484 | Tabcorp Holdings, Ltd. (a) | 1,621,291 | |||||
| 18,151,735 | |||||||
| Austria – 0.1% | |||||||
| 3,715 | OMV AG | 150,471 | |||||
| 2,554 | Voestalpine AG | 51,672 | |||||
| 202,143 | |||||||
| Belgium – 0.2% | |||||||
| 54,787 | Proximus SADP | 698,555 | |||||
| Brazil – 2.8% | |||||||
| 309,202 | Cia Brasileira de Distribuicao | 1,285,507 | |||||
| 242,851 | EDP – Energias do Brasil SA | 1,063,088 | |||||
| 293,768 | JBS SA | 1,677,783 | |||||
| 451,749 | Marfrig Global Foods SA | 1,150,953 | |||||
| 104,629 | Minerva SA | 311,403 | |||||
| 200,046 | Telefonica Brasil SA | 1,622,840 | |||||
| 734,311 | TIM SA | 1,688,022 | |||||
| 59,002 | Vale SA | 740,344 | |||||
| 9,539,940 | |||||||
| Canada – 3.9% | |||||||
| 38,057 | Canfor Corporation (b) | 748,877 | |||||
| 21,515 | Celestica, Inc. (b) | 222,609 | |||||
| 231,873 | Crescent Point Energy Corporation | 1,767,022 | |||||
| 3,125 | Fairfax Financial Holdings, Ltd. | 1,562,357 | |||||
| 19,567 | Great-West Lifeco, Inc. | 460,936 | |||||
The accompanying notes are an integral part of these financial statements.
18
VIDENT INTERNATIONAL EQUITY FUND
SCHEDULE OF INVESTMENTS
August 31, 2022 (Continued)
| Shares | Security Description | Value | |||||
| COMMON STOCKS – 95.1% (Continued) | |||||||
| Canada – 3.9% (Continued) | |||||||
| 26,825 | iA Financial Corporation, Inc. | $ | 1,445,101 | ||||
| 32,026 | Interfor Corporation (b) | 790,134 | |||||
| 18,254 | Loblaw Companies, Ltd. | 1,617,854 | |||||
| 96,159 | Manulife Financial Corporation | 1,668,244 | |||||
| 83,620 | Resolute Forest Products, Inc. (b) | 1,694,141 | |||||
| 13,340 | West Fraser Timber Company, Ltd. | 1,196,892 | |||||
| 13,174,167 | |||||||
| Chile – 1.8% | |||||||
| 7,325,977 | Banco de Chile | 697,880 | |||||
| 1,291,375 | Cencosud SA | 1,812,786 | |||||
| 17,695,755 | Enel Americas SA | 1,925,003 | |||||
| 685,857 | Falabella SA | 1,622,821 | |||||
| 6,058,490 | |||||||
| China – 6.6% | |||||||
| 60,890 | 360 DigiTech, Inc. – ADR | 973,022 | |||||
| 1,135,000 | China Life Insurance Company, Ltd. – Class H | 1,631,169 | |||||
| 3,708,000 | China Petroleum & Chemical Corporation – Class H | 1,752,700 | |||||
| 605,500 | China Shenhua Energy Company, Ltd. – Class H | 1,905,483 | |||||
| 13,048,000 | China Tower Corporation, Ltd. – Class H (c) | 1,629,161 | |||||
| 3,927,000 | COFCO Joycome Foods, Ltd. (d) | 1,505,988 | |||||
| 1,167,500 | COSCO SHIPPING Holdings | ||||||
| Company, Ltd. – Class H | 1,752,250 | ||||||
| 322,000 | CSPC Pharmaceutical Group, Ltd. | 327,791 | |||||
| 28,417 | Daqo New Energy Corporation – ADR (b) | 1,894,561 | |||||
| 1,774,000 | Lenovo Group, Ltd. (a) | 1,469,133 | |||||
| 712,500 | New China Life Insurance | ||||||
| Company, Ltd. – Class H | 1,679,386 | ||||||
| 1,296,000 | PetroChina Company, Ltd. – Class H | 612,594 | |||||
| 1,624,000 | PICC Property & Casualty | ||||||
| Company, Ltd. – Class H | 1,758,729 | ||||||
| 478,000 | Sinopharm Group Company, Ltd. – Class H | 1,064,543 | |||||
| 5,665,000 | The People’s Insurance Company | ||||||
| Group of China, Ltd. – Class H | 1,753,881 | ||||||
| 70,955 | Vipshop Holdings, Ltd. – ADR (b) | 823,788 | |||||
| 22,534,179 | |||||||
The accompanying notes are an integral part of these financial statements.
19
VIDENT INTERNATIONAL EQUITY FUND
SCHEDULE OF INVESTMENTS
August 31, 2022 (Continued)
| Shares | Security Description | Value | |||||
| COMMON STOCKS – 95.1% (Continued) | |||||||
| Denmark – 3.2% | |||||||
| 685 | AP Moller – Maersk AS – Class B | $ | 1,644,360 | ||||
| 13,360 | Carlsberg AS – Class B | 1,744,533 | |||||
| 67,453 | FLSmidth & Company AS | 1,876,861 | |||||
| 342,228 | H Lundbeck AS (b) | 1,344,842 | |||||
| 8,911 | Novo Nordisk AS – Class B | 954,797 | |||||
| 24,263 | Pandora AS | 1,466,678 | |||||
| 77,851 | Tryg AS | 1,764,628 | |||||
| 10,796,699 | |||||||
| Finland – 0.9% | |||||||
| 333,929 | Nokia OYJ | 1,682,942 | |||||
| 140,875 | Nokian Renkaat OYJ | 1,468,983 | |||||
| 3,151,925 | |||||||
| France – 0.9% | |||||||
| 30,327 | Cie de Saint-Gobain | 1,230,487 | |||||
| 143,140 | Electricite de France SA | 1,717,858 | |||||
| 2,948,345 | |||||||
| Germany – 4.7% | |||||||
| 9,643 | Allianz SE | 1,634,640 | |||||
| 11,034 | Aurubis AG | 670,375 | |||||
| 28,741 | Bayer AG | 1,520,168 | |||||
| 18,961 | Bayerische Motoren Werke AG | 1,400,797 | |||||
| 201,409 | Deutsche Bank AG | 1,685,632 | |||||
| 46,352 | Freenet AG | 1,011,421 | |||||
| 18,795 | Fresenius SE & Company KGaA | 466,057 | |||||
| 28,819 | HUGO BOSS AG | 1,576,456 | |||||
| 82,537 | K+S AG | 1,883,990 | |||||
| 30,335 | Mercedes-Benz Group AG | 1,711,850 | |||||
| 6,989 | Muenchener Rueckversicherungs-Gesellschaft | ||||||
| AG in Muenchen | 1,674,020 | ||||||
| 9,917 | RWE AG | 379,735 | |||||
| 22,305 | Suedzucker AG | 306,378 | |||||
| 15,921,519 | |||||||
| Hong Kong – 6.6% | |||||||
| 208,700 | ASMPT, Ltd. | 1,623,312 | |||||
| 606,500 | China Overseas Land & Investment, Ltd. | 1,638,176 | |||||
The accompanying notes are an integral part of these financial statements.
20
VIDENT INTERNATIONAL EQUITY FUND
SCHEDULE OF INVESTMENTS
August 31, 2022 (Continued)
| Shares | Security Description | Value | |||||
| COMMON STOCKS – 95.1% (Continued) | |||||||
| Hong Kong – 6.6% (Continued) | |||||||
| 1,650,000 | China Resources Cement Holdings, Ltd. (a) | $ | 1,019,576 | ||||
| 1,596,000 | China Taiping Insurance Holdings Company, Ltd. | 1,634,869 | |||||
| 3,792,000 | China Traditional Chinese Medicine | ||||||
| Holdings Company, Ltd. | 1,642,636 | ||||||
| 239,500 | CK Asset Holdings, Ltd. | 1,620,295 | |||||
| 256,000 | CK Hutchison Holdings, Ltd. | 1,655,274 | |||||
| 551,000 | Kingboard Holdings, Ltd. | 1,744,504 | |||||
| 2,286,000 | Kunlun Energy Company, Ltd. | 1,995,082 | |||||
| 53,000 | Orient Overseas International, Ltd. | 1,484,217 | |||||
| 4,071,000 | Pacific Basin Shipping, Ltd. | 1,452,289 | |||||
| 1,158,000 | Sino Land Company, Ltd. | 1,696,682 | |||||
| 2,264,000 | WH Group, Ltd. (c) | 1,546,091 | |||||
| 832,000 | Xinyi Glass Holdings, Ltd. | 1,543,401 | |||||
| 22,296,404 | |||||||
| Indonesia – 1.8% | |||||||
| 8,302,800 | Adaro Energy Tbk PT | 1,980,253 | |||||
| 4,236,500 | Astra International Tbk PT | 1,990,877 | |||||
| 53,700 | Indo Tambangraya Megah Tbk PT | 142,187 | |||||
| 831,500 | United Tractors Tbk PT | 1,896,330 | |||||
| 6,009,647 | |||||||
| Ireland – 1.3% | |||||||
| 296,405 | Bank of Ireland Group plc | 1,836,585 | |||||
| 18,071 | DCC plc | 1,043,593 | |||||
| 41,119 | Perrigo Company plc | 1,538,673 | |||||
| 4,418,851 | |||||||
| Israel – 2.6% | |||||||
| 1,031,633 | Bezeq The Israeli Telecommunication | ||||||
| Corporation, Ltd. (a) | 1,746,034 | ||||||
| 13,281 | Check Point Software Technologies, Ltd. (b) | 1,596,907 | |||||
| 12,870 | Delek Group, Ltd. (b) | 2,241,693 | |||||
| 27,907 | Plus500, Ltd. | 551,386 | |||||
| 148,604 | Teva Pharmaceutical Industries, Ltd. (a)(b) | 1,337,523 | |||||
| 36,493 | ZIM Integrated Shipping Services, Ltd. (a) | 1,317,032 | |||||
| 8,790,575 | |||||||
The accompanying notes are an integral part of these financial statements.
21
VIDENT INTERNATIONAL EQUITY FUND
SCHEDULE OF INVESTMENTS
August 31, 2022 (Continued)
| Shares | Security Description | Value | |||||
| COMMON STOCKS – 95.1% (Continued) | |||||||
| Italy – 0.9% | |||||||
| 115,602 | Assicurazioni Generali SpA | $ | 1,701,807 | ||||
| 136,383 | Leonardo SpA | 1,119,886 | |||||
| 119,592 | UnipolSai Assicurazioni SpA | 266,487 | |||||
| 3,088,180 | |||||||
| Japan – 3.6% | |||||||
| 82,500 | GungHo Online Entertainment, Inc. | 1,377,132 | |||||
| 72,000 | H.U. Group Holdings, Inc. (a) | 1,472,462 | |||||
| 209,600 | Mazda Motor Corporation | 1,861,263 | |||||
| 87,900 | NGK Spark Plug Company, Ltd. | 1,817,287 | |||||
| 45,100 | Nippon Electric Glass Company, Ltd. | 856,290 | |||||
| 218,500 | Nisshinbo Holdings, Inc. | 1,705,443 | |||||
| 17,700 | Shimamura Company, Ltd. | 1,613,908 | |||||
| 100,700 | Toppan, Inc. (a) | 1,591,587 | |||||
| 12,295,372 | |||||||
| Malaysia – 1.0% | |||||||
| 2,692,300 | Hartalega Holdings Bhd | 998,597 | |||||
| 306,800 | MISC Bhd | 486,712 | |||||
| 1,810,400 | Sime Darby Plantation Bhd | 1,804,130 | |||||
| 3,289,439 | |||||||
| Mexico – 0.5% | |||||||
| 253,519 | Arca Continental SAB de CV | 1,718,867 | |||||
| Netherlands – 1.4% | |||||||
| 59,522 | Koninklijke Ahold Delhaize NV | 1,639,955 | |||||
| 130,884 | Stellantis NV | 1,757,526 | |||||
| 69,701 | uniQure NV (b) | 1,361,958 | |||||
| 4,759,439 | |||||||
| Norway – 7.1% | |||||||
| 52,505 | Aker BP ASA | 1,839,552 | |||||
| 1,284,219 | DNO ASA | 1,824,588 | |||||
| 49,378 | Equinor ASA | 1,904,139 | |||||
| 83,416 | Gjensidige Forsikring ASA | 1,697,882 | |||||
| 50,185 | Kongsberg Gruppen ASA | 1,719,331 | |||||
| 229,364 | Leroy Seafood Group ASA | 1,539,239 | |||||
| 77,752 | Mowi ASA | 1,600,614 | |||||
The accompanying notes are an integral part of these financial statements.
22
VIDENT INTERNATIONAL EQUITY FUND
SCHEDULE OF INVESTMENTS
August 31, 2022 (Continued)
| Shares | Security Description | Value | |||||
| COMMON STOCKS – 95.1% (Continued) | |||||||
| Norway – 7.1% (Continued) | |||||||
| 752,007 | MPC Container Ships ASA | $ | 1,560,974 | ||||
| 282,093 | Norsk Hydro ASA | 1,947,106 | |||||
| 205,701 | Orkla ASA | 1,729,073 | |||||
| 189,999 | Storebrand ASA | 1,528,163 | |||||
| 145,870 | Telenor ASA | 1,602,135 | |||||
| 121,561 | TGS ASA | 1,858,175 | |||||
| 48,695 | Var Energi ASA | 211,283 | |||||
| 41,458 | Yara International ASA | 1,760,393 | |||||
| 24,322,647 | |||||||
| Poland – 1.3% | |||||||
| 11,212 | Bank Polska Kasa Opieki SA | 155,785 | |||||
| 76,878 | KGHM Polska Miedz SA | 1,449,910 | |||||
| 102,015 | Polski Koncern Naftowy ORLEN SA | 1,325,706 | |||||
| 262,375 | Powszechny Zaklad Ubezpieczen SA (a) | 1,574,530 | |||||
| 4,505,931 | |||||||
| Republic of Korea – 7.5% | |||||||
| 76,623 | Daeduck Electronics Company, Ltd. | 1,698,532 | |||||
| 416,125 | Daewoo Engineering & Construction | ||||||
| Company, Ltd. (b) | 1,617,771 | ||||||
| 37,929 | DB Insurance Company, Ltd. | 1,692,917 | |||||
| 55,448 | GS Holdings Corporation | 1,908,998 | |||||
| 51,494 | Hankook Tire & Technology Company, Ltd. | 1,461,028 | |||||
| 69,140 | Hyundai Marine & Fire Insurance Company, Ltd. | 1,628,283 | |||||
| 9,375 | Hyundai Mobis Company, Ltd. | 1,506,953 | |||||
| 27,051 | Kia Corporation | 1,634,123 | |||||
| 60,422 | KT Corporation | 1,680,459 | |||||
| 27,117 | KT&G Corporation | 1,686,766 | |||||
| 274 | LG Innotek Company, Ltd. | 70,469 | |||||
| 183,227 | LG Uplus Corporation | 1,575,351 | |||||
| 8,031 | NongShim Company, Ltd. | 1,801,279 | |||||
| 2,472 | Samsung Fire & Marine Insurance Company, Ltd. | 360,390 | |||||
| 51,178 | SD Biosensor, Inc. | 1,344,927 | |||||
| 43,143 | SK Telecom Company, Ltd. | 1,680,498 | |||||
| 70,744 | SL Corporation | 2,033,649 | |||||
| 25,382,393 | |||||||
The accompanying notes are an integral part of these financial statements.
23
VIDENT INTERNATIONAL EQUITY FUND
SCHEDULE OF INVESTMENTS
August 31, 2022 (Continued)
| Shares | Security Description | Value | |||||
| COMMON STOCKS – 95.1% (Continued) | |||||||
| Russian Federation – 0.0% (e) | |||||||
| 285,161 | Gazprom PJSC – ADR (f)(g) | $ | 0 | ||||
| 10,998 | LUKOIL PJSC – ADR (f)(g) | 0 | |||||
| 32,030 | Magnit PJSC – GDR (d)(f)(g) | 0 | |||||
| 19,494 | Novolipetsk Steel PJSC – GDR (d)(f)(g) | 0 | |||||
| 143,584 | Rosneft Oil Company PJSC – GDR (d)(f)(g) | 0 | |||||
| 24,074 | Severstal PAO – GDR (d)(f)(g) | 0 | |||||
| 20,302 | Tatneft PJSC – ADR (f)(g) | 0 | |||||
| 0 | |||||||
| Singapore – 5.3% | |||||||
| 64,400 | City Developments, Ltd. | 375,294 | |||||
| 984,400 | ComfortDelGro Corporation, Ltd. | 994,914 | |||||
| 2,216,200 | Genting Singapore, Ltd. | 1,231,134 | |||||
| 85,600 | Jardine Cycle & Carriage, Ltd. | 2,016,211 | |||||
| 362,200 | Keppel Corporation, Ltd. | 1,887,459 | |||||
| 166,500 | NETLINK NBN MANAGEMENT PTE, Ltd. (d) | 111,589 | |||||
| 204,400 | Oversea-Chinese Banking Corporation, Ltd. | 1,771,340 | |||||
| 444,300 | Sembcorp Industries, Ltd. | 1,079,619 | |||||
| 573,300 | Singapore Technologies Engineering, Ltd. | 1,532,800 | |||||
| 897,000 | Singapore Telecommunications, Ltd. | 1,684,567 | |||||
| 85,019 | United Overseas Bank, Ltd. | 1,665,522 | |||||
| 152,900 | UOL Group, Ltd. | 758,417 | |||||
| 96,300 | Venture Corporation, Ltd. | 1,262,509 | |||||
| 587,600 | Wilmar International, Ltd. | 1,701,601 | |||||
| 18,072,976 | |||||||
| South Africa – 1.9% | |||||||
| 147,807 | Exxaro Resources, Ltd. | 1,893,245 | |||||
| 535,941 | Harmony Gold Mining Company, Ltd. | 1,357,115 | |||||
| 38,797 | Kumba Iron Ore, Ltd. | 866,129 | |||||
| 190,439 | Old Mutual, Ltd. | 113,630 | |||||
| 309,208 | Sibanye Stillwater, Ltd. | 698,260 | |||||
| 564,128 | Telkom SA SOC, Ltd. (b) | 1,454,969 | |||||
| 6,383,348 | |||||||
The accompanying notes are an integral part of these financial statements.
24
VIDENT INTERNATIONAL EQUITY FUND
SCHEDULE OF INVESTMENTS
August 31, 2022 (Continued)
| Shares | Security Description | Value | |||||
| COMMON STOCKS – 95.1% (Continued) | |||||||
| Spain – 0.6% | |||||||
| 78,047 | Mapfre SA | $ | 129,728 | ||||
| 40,017 | Repsol SA | 522,505 | |||||
| 371,183 | Telefonica SA | 1,536,269 | |||||
| 2,188,502 | |||||||
| Sweden – 5.0% | |||||||
| 18,559 | Axfood AB | 561,138 | |||||
| 55,428 | Boliden AB | 1,790,825 | |||||
| 9,172 | Investor AB | 145,517 | |||||
| 46,841 | Saab AB – Class B | 1,571,755 | |||||
| 191,498 | Securitas AB – Class B | 1,685,676 | |||||
| 347,318 | SSAB AB – Class A | 1,682,164 | |||||
| 80,469 | Swedish Orphan Biovitrum AB (b) | 1,782,945 | |||||
| 150,697 | Tele2 AB – Class B | 1,609,967 | |||||
| 232,960 | Telefonaktiebolaget LM Ericsson – Class B | 1,752,253 | |||||
| 467,662 | Telia Company AB | 1,652,809 | |||||
| 73,146 | Trelleborg AB – Class B | 1,529,887 | |||||
| 223,340 | Volvo Car AB – Class B (b) | 1,365,255 | |||||
| 17,130,191 | |||||||
| Switzerland – 3.2% | |||||||
| 10,643 | Baloise Holding AG | 1,542,006 | |||||
| 9,057 | Chubb, Ltd. | 1,712,226 | |||||
| 88,106 | Ferrexpo plc | 152,755 | |||||
| 8,912 | Helvetia Holding AG | 987,128 | |||||
| 19,973 | Novartis AG | 1,619,410 | |||||
| 5,891 | Swatch Group AG | 1,438,419 | |||||
| 18,905 | Swiss Re AG | 1,475,673 | |||||
| 38,211 | UBS Group AG | 608,040 | |||||
| 3,317 | Zurich Insurance Group AG | 1,475,393 | |||||
| 11,011,050 | |||||||
| Taiwan – 7.6% | |||||||
| 3,510,000 | AU Corporation | 1,931,581 | |||||
| 613,000 | Chicony Electronics Company, Ltd. | 1,643,394 | |||||
| 1,037,000 | Compeq Manufacturing Company, Ltd. | 1,795,479 | |||||
| 550,000 | Evergreen Marine Corporation Taiwan, Ltd. | 1,595,564 | |||||
| 91,000 | Gigabyte Technology Company, Ltd. | 256,818 | |||||
The accompanying notes are an integral part of these financial statements.
25
VIDENT INTERNATIONAL EQUITY FUND
SCHEDULE OF INVESTMENTS
August 31, 2022 (Continued)
| Shares | Security Description | Value | |||||
| COMMON STOCKS – 95.1% (Continued) | |||||||
| Taiwan – 7.6% (Continued) | |||||||
| 4,924,000 | HannStar Display Corporation | $ | 1,933,201 | ||||
| 477,000 | Hon Hai Precision Industry Company, Ltd. | 1,708,189 | |||||
| 4,590,000 | Innolux Corporation | 1,824,690 | |||||
| 805,000 | Lite-On Technology Corporation | 1,740,255 | |||||
| 1,574,000 | Macronix International Company, Ltd. | 1,703,928 | |||||
| 173,000 | Novatek Microelectronics Corporation | 1,497,676 | |||||
| 823,000 | Pegatron Corporation | 1,719,681 | |||||
| 557,000 | Powertech Technology, Inc. | 1,562,802 | |||||
| 580,000 | Radiant Opto-Electronics Corporation | 1,915,072 | |||||
| 2,210,000 | Winbond Electronics Corporation | 1,611,893 | |||||
| 583,000 | Yang Ming Marine Transport Corporation | 1,511,251 | |||||
| 25,951,474 | |||||||
| Thailand – 1.7% | |||||||
| 3,119,300 | Bangkok Chain Hospital pcl – NVDR | 1,599,751 | |||||
| 1,677,800 | Regional Container Lines pcl – NVDR (a) | 1,495,468 | |||||
| 2,358,700 | Sri Trang Agro-Industry pcl – NVDR | 1,461,957 | |||||
| 2,742,900 | Sri Trang Gloves Thailand pcl – NVDR | 1,068,198 | |||||
| 5,625,374 | |||||||
| United Kingdom – 3.8% | |||||||
| 30,708 | Anglo American plc | 994,419 | |||||
| 353,976 | Aviva plc – Class B | 1,724,572 | |||||
| 99,215 | BT Group plc | 173,978 | |||||
| 1,591,095 | Centrica plc (b) | 1,402,252 | |||||
| 267,263 | HSBC Holdings plc | 1,644,504 | |||||
| 318,908 | J Sainsbury plc | 754,781 | |||||
| 51,487 | Janus Henderson Group plc (a) | 1,204,796 | |||||
| 375,703 | Kingfisher plc | 1,014,669 | |||||
| 394,520 | M&G plc | 898,619 | |||||
| 18,814 | Rio Tinto plc | 1,044,468 | |||||
| 220,698 | Royal Mail plc | 707,497 | |||||
| 1,090,642 | Vodafone Group plc | 1,468,065 | |||||
| 13,032,620 | |||||||
| TOTAL COMMON STOCKS (Cost $351,708,075) | 323,450,977 | ||||||
The accompanying notes are an integral part of these financial statements.
26
VIDENT INTERNATIONAL EQUITY FUND
SCHEDULE OF INVESTMENTS
August 31, 2022 (Continued)
| Shares | Security Description | Value |
| PREFERRED STOCKS – 3.9% | |||||||
| Brazil – 2.7% | |||||||
| 858,497 | Cia Energetica de Minas Gerais | $ | 2,014,925 | ||||
| 1,326,938 | Cia Paranaense de Energia – Class B | 1,782,569 | |||||
| 382,300 | Gerdau SA | 1,735,513 | |||||
| 806,700 | Metalurgica Gerdau SA | 1,549,250 | |||||
| 302,632 | Petroleo Brasileiro SA | 1,941,611 | |||||
| 9,023,868 | |||||||
| Chile – 0.6% | |||||||
| 966,992 | Embotelladora Andina SA – Class B | 1,989,343 | |||||
| Germany – 0.6% | |||||||
| 44,696 | Schaeffler AG | 233,485 | |||||
| 12,677 | Volkswagen AG | 1,811,910 | |||||
| 2,045,395 | |||||||
| TOTAL PREFERRED STOCKS (Cost $13,499,621) | 13,058,606 | ||||||
| Principal | |||||||
| Amount | |||||||
| SHORT-TERM INVESTMENTS – 0.2% | |||||||
| Money Market Deposit Account – 0.2% | |||||||
| $ | 694,369 | U.S. Bank Money Market | |||||
| Deposit Account, 1.60% (h) | 694,369 | ||||||
| TOTAL SHORT-TERM INVESTMENTS | |||||||
| (Cost $694,369) | 694,369 | ||||||
| Units | |||||||
| INVESTMENTS PURCHASED WITH PROCEEDS | |||||||
| FROM SECURITIES LENDING – 2.9% | |||||||
| Private Funds – 0.4% | |||||||
| 1,440,050 | Mount Vernon Liquid Assets | ||||||
| Portfolio, LLC, 2.47% (i)(j) | 1,440,050 | ||||||
| 1,440,050 | |||||||
The accompanying notes are an integral part of these financial statements.
27
VIDENT INTERNATIONAL EQUITY FUND
SCHEDULE OF INVESTMENTS
August 31, 2022 (Continued)
| Principal | |||||||
| Amount | Security Description | Value | |||||
| Repurchase Agreements – 2.5% | |||||||
| $ | 1,998,120 | Bank of America Securities, Inc. – 2.300%, dated 8/31/22, | |||||
| matures 9/1/22, repurchase price $1,998,246 | |||||||
| (collateralized by various U.S. Government mortgage | |||||||
| backed securities: Total Value $2,038,082) | $ | 1,998,120 | |||||
| 1,998,120 | Daiwa Capital Markets – 2.300%, dated 8/31/22, | ||||||
| matures 9/1/22, repurchase price $1,998,246 | |||||||
| (collateralized by various U.S. Government Treasury | |||||||
| bills, notes, bonds, and mortgage backed securities: | |||||||
| Total Value $2,038,082) | 1,998,120 | ||||||
| 591,741 | HSBC Securities U.S.A., Inc. – 2.260%, dated 8/31/22, | ||||||
| matures 9/1/22, repurchase price $591,778 (collateralized | |||||||
| by various U.S. Government Treasury bills, notes, and | |||||||
| bonds: Total Value $603,576) | 591,741 | ||||||
| 1,998,120 | MUFG Securities America, Inc. – 2.300%, dated 8/31/22, | ||||||
| matures 9/1/22, repurchase price $1,998,246 | |||||||
| (collateralized by various U.S. Government mortgage | |||||||
| backed securities: Total Value $2,038,083) | 1,998,120 | ||||||
| 1,998,120 | RBC Dominion Securities, Inc. – 2.300%, dated 8/31/22, | ||||||
| matures 9/1/22, repurchase price $1,998,246 | |||||||
| (collateralized by various U.S. Government Treasury | |||||||
| bills, notes, bonds, and mortgage backed securities: | |||||||
| Total Value $2,038,082) | 1,998,120 | ||||||
| 8,584,221 | |||||||
| TOTAL INVESTMENTS PURCHASED WITH | |||||||
| PROCEEDS FROM SECURITIES LENDING | |||||||
| (Cost $10,024,271) (k) | 10,024,271 | ||||||
| TOTAL INVESTMENTS – 102.1% | |||||||
| (Cost $375,926,336) | 347,228,223 | ||||||
| Liabilities in Excess of Other Assets – (2.1)% | (7,154,444 | ) | |||||
| NET ASSETS – 100.0% | $ | 340,073,779 | |||||
Percentages are stated as a percent of net assets.
| (a) | All or portion of this security is out on loan as of August 31, 2022. Total value of securities out on loan is $13,325,169 or 3.9% of net assets. | |
| (b) | Non-income producing security. | |
| (c) | Security exempt from registration under Rule 144(a) and Regulation S of the Securities Act of 1933. Such securities are treated as liquid securities, according to the Fund’s liquidity guidelines. At August 31, 2022, the value of these securities amounted to $3,175,252 or 0.9% of net assets. |
The accompanying notes are an integral part of these financial statements.
28
VIDENT INTERNATIONAL EQUITY FUND
SCHEDULE OF INVESTMENTS
August 31, 2022 (Continued)
| (d) | Security exempt from registration under Regulation S of the Securities Act of 1933. Such securities are treated as liquid securities, according to the Fund’s liquidity guidelines. At August 31, 2022, the value of these securities amounted to $1,617,577 or 0.5% of net assets. | |
| (e) | Represents less than 0.05% of net assets. | |
| (f) | Value determined using significant unobservable inputs. Classified as Level 3 in the fair value hierarchy. | |
| (g) | These securities have been deemed illiquid according to the Fund’s liquidity guidelines. The value of these securities is $0, which represents 0.00% of net assets. | |
| (h) | The Money Market Deposit Account (the “MMDA”) is a short-term investment vehicle in which the Fund holds cash balances. The MMDA will bear interest at a variable rate that is determined based on conditions and may change daily and by any amount. The rate shown is as of August 31, 2022. | |
| (i) | Rate shown is the annualized seven-day yield as of August 31, 2022. | |
| (j) | Privately offered liquidity fund. See Note 2 in Notes to Financial Statements. | |
| (k) | Investment purchased with cash proceeds from securities lending. As of August 31, 2022, total cash collateral has a value of $10,024,271. Additionally, total non-cash collateral has a value of $4,026,049. |
ADR – American Depositary Receipt
GDR – Global Depositary Receipt
NVDR – Non-Voting Depositary Receipt
The accompanying notes are an integral part of these financial statements.
29
VIDENT CORE U.S. EQUITY FUND
SCHEDULE OF INVESTMENTS
August 31, 2022
| Shares | Security Description | Value | |||||
| COMMON STOCKS – 99.7% | |||||||
| Communication Services – 7.0% | |||||||
| 125,588 | AT&T, Inc. | $ | 2,202,813 | ||||
| 54,235 | Comcast Corporation – Class A | 1,962,765 | |||||
| 66,932 | DISH Network Corporation – Class A (a)(b) | 1,161,270 | |||||
| 65,700 | Fox Corporation – Class A (a) | 2,245,626 | |||||
| 90,136 | Frontier Communications Parent, Inc. (b) | 2,321,903 | |||||
| 78,301 | Interpublic Group of Companies, Inc. (a) | 2,164,240 | |||||
| 32,410 | John Wiley & Sons, Inc. – Class A | 1,491,832 | |||||
| 219,081 | Lumen Technologies, Inc. (a) | 2,182,047 | |||||
| 136,850 | News Corporation – Class A | 2,315,502 | |||||
| 12,648 | Nexstar Media Group, Inc. (a) | 2,419,815 | |||||
| 33,503 | Omnicom Group, Inc. | 2,241,351 | |||||
| 111,756 | Telephone & Data Systems, Inc. | 1,818,270 | |||||
| 17,435 | T-Mobile US, Inc. (b) | 2,509,942 | |||||
| 21,766 | United States Cellular Corporation (b) | 622,290 | |||||
| 51,981 | Verizon Communications, Inc. | 2,173,326 | |||||
| 75,898 | Yelp, Inc. (b) | 2,593,435 | |||||
| 32,426,427 | |||||||
| Consumer Discretionary – 12.9% | |||||||
| 52,371 | Abercrombie & Fitch Company – Class A (a)(b) | 753,619 | |||||
| 53,169 | Academy Sports & Outdoors, Inc. (a) | 2,290,520 | |||||
| 13,791 | Asbury Automotive Group, Inc. (a)(b) | 2,406,254 | |||||
| 19,735 | AutoNation, Inc. (b) | 2,458,981 | |||||
| 20,817 | Dick’s Sporting Goods, Inc. (a) | 2,214,304 | |||||
| 10,290 | Dillards, Inc. – Class A (a) | 3,048,310 | |||||
| 2,060 | Graham Holdings Company – Class B | 1,164,786 | |||||
| 17,032 | Grand Canyon Education, Inc. (b) | 1,386,064 | |||||
| 13,251 | Group 1 Automotive, Inc. (a) | 2,366,496 | |||||
| 113,700 | Laureate Education, Inc. | 1,252,974 | |||||
| 27,799 | Lennar Corporation – Class A (a) | 2,153,033 | |||||
| 8,732 | Lithia Motors, Inc. (a) | 2,317,822 | |||||
| 43,453 | LKQ Corporation | 2,312,569 | |||||
| 126,274 | Macy’s, Inc. | 2,187,066 | |||||
| 41,213 | MarineMax, Inc. (a)(b) | 1,497,680 | |||||
| 15,667 | Mohawk Industries, Inc. (a)(b) | 1,729,010 | |||||
| 8,602 | Murphy USA, Inc. (a) | 2,496,042 | |||||
| 85,380 | Perdoceo Education Corporation (b) | 988,700 | |||||
The accompanying notes are an integral part of these financial statements.
30
VIDENT CORE U.S. EQUITY FUND
SCHEDULE OF INVESTMENTS
August 31, 2022 (Continued)
| Shares | Security Description | Value | |||||
| COMMON STOCKS – 99.7% (Continued) | |||||||
| Consumer Discretionary – 12.9% (Continued) | |||||||
| 50,303 | PulteGroup, Inc. | $ | 2,045,320 | ||||
| 34,691 | Sonic Automotive, Inc. – Class A (a) | 1,845,214 | |||||
| 22,615 | Strategic Education, Inc. (a) | 1,463,190 | |||||
| 54,728 | Stride, Inc. (a)(b) | 2,087,326 | |||||
| 20,348 | Sturm, Ruger & Company, Inc. | 1,063,183 | |||||
| 83,369 | Taylor Morrison Home Corporation (b) | 2,093,396 | |||||
| 27,364 | Thor Industries, Inc. (a) | 2,216,758 | |||||
| 44,262 | Toll Brothers, Inc. | 1,938,233 | |||||
| 106,221 | Tri Pointe Homes, Inc. (b) | 1,840,810 | |||||
| 63,099 | Vista Outdoor, Inc. (a)(b) | 1,774,344 | |||||
| 12,124 | Whirlpool Corporation (a) | 1,898,618 | |||||
| 16,828 | Williams-Sonoma, Inc. (a) | 2,503,165 | |||||
| 39,174 | Winnebago Industries, Inc. (a) | 2,255,639 | |||||
| 60,049,426 | |||||||
| Consumer Staples – 8.3% | |||||||
| 87,170 | Albertsons Companies, Inc. – Class A | 2,398,047 | |||||
| 31,295 | Archer-Daniels-Midland Company | 2,750,517 | |||||
| 25,362 | Bunge, Ltd. | 2,515,149 | |||||
| 11,624 | Casey’s General Stores, Inc. (a) | 2,484,862 | |||||
| 48,244 | Edgewell Personal Care Company | 1,879,586 | |||||
| 22,383 | Fresh Del Monte Produce, Inc. | 611,951 | |||||
| 14,773 | Ingles Markets, Inc. – Class A | 1,293,081 | |||||
| 26,471 | Ingredion, Inc. | 2,304,830 | |||||
| 17,741 | JM Smucker Company | 2,483,563 | |||||
| 60,284 | Kraft Heinz Company | 2,254,622 | |||||
| 49,960 | Kroger Company (a) | 2,395,082 | |||||
| 39,892 | Molson Coors Beverage Company – Class B | 2,061,220 | |||||
| 5,337 | Nu Skin Enterprises, Inc. – Class A | 218,497 | |||||
| 33,371 | Pilgrim’s Pride Corporation (b) | 950,072 | |||||
| 27,264 | Post Holdings, Inc. (b) | 2,419,953 | |||||
| 14,221 | PriceSmart, Inc. | 899,763 | |||||
| 59,773 | SpartanNash Company (a) | 1,818,892 | |||||
| 83,672 | Sprouts Farmers Market, Inc. (a)(b) | 2,418,121 | |||||
| 28,145 | Tyson Foods, Inc. – Class A | 2,121,570 | |||||
| 6,295 | United Natural Foods, Inc. (b) | 277,484 | |||||
| 25,434 | Universal Corporation | 1,298,151 | |||||
| 8,717 | USANA Health Sciences, Inc. (b) | 562,421 | |||||
| 38,417,434 | |||||||
The accompanying notes are an integral part of these financial statements.
31
VIDENT CORE U.S. EQUITY FUND
SCHEDULE OF INVESTMENTS
August 31, 2022 (Continued)
| Shares | Security Description | Value | |||||
| COMMON STOCKS – 99.7% (Continued) | |||||||
| Energy – 5.9% | |||||||
| 16,984 | Arch Resources, Inc. (a) | $ | 2,472,531 | ||||
| 7,198 | Chesapeake Energy Corporation (a) | 723,327 | |||||
| 16,021 | Chevron Corporation | 2,532,279 | |||||
| 20,420 | Chord Energy Corporation (a) | 2,890,451 | |||||
| 125,910 | CNX Resources Corporation (a)(b) | 2,224,830 | |||||
| 26,527 | Exxon Mobil Corporation | 2,535,716 | |||||
| 106,190 | Marathon Oil Corporation | 2,717,402 | |||||
| 51,925 | Ovintiv, Inc. | 2,759,294 | |||||
| 87,373 | PBF Energy, Inc. – Class A (b) | 2,984,662 | |||||
| 39,294 | PDC Energy, Inc. | 2,668,456 | |||||
| 110,311 | Peabody Energy Corporation (a)(b) | 2,720,269 | |||||
| 27,229,217 | |||||||
| Financials – 13.3% | |||||||
| 41,001 | Aflac, Inc. | 2,436,279 | |||||
| 19,879 | Allstate Corporation | 2,395,420 | |||||
| 17,511 | American Financial Group, Inc. | 2,235,804 | |||||
| 44,220 | American International Group, Inc. | 2,288,385 | |||||
| 13,609 | Assurant, Inc. | 2,156,890 | |||||
| 23,773 | Bread Financial Holdings, Inc. | 913,596 | |||||
| 32,610 | Coinbase Global, Inc. – Class A (a)(b) | 2,178,348 | |||||
| 49,222 | Cowen, Inc. – Class A (a) | 1,892,586 | |||||
| 30,198 | Donnelley Financial Solutions, Inc. (b) | 1,281,905 | |||||
| 31,628 | Encore Capital Group, Inc. (a)(b) | 1,729,419 | |||||
| 28,347 | Enova International, Inc. (b) | 990,444 | |||||
| 19,324 | Evercore, Inc. – Class A | 1,810,466 | |||||
| 29,309 | Federated Hermes, Inc. | 998,265 | |||||
| 16,714 | Hanover Insurance Group, Inc. | 2,162,624 | |||||
| 36,213 | Hartford Financial Services Group, Inc. | 2,328,858 | |||||
| 40,492 | Loews Corporation | 2,239,613 | |||||
| 1,822 | Markel Corporation (b) | 2,175,668 | |||||
| 43,967 | Mercury General Corporation | 1,402,547 | |||||
| 37,970 | MetLife, Inc. | 2,442,610 | |||||
| 57,105 | Mr Cooper Group, Inc. (b) | 2,415,542 | |||||
| 14,157 | Piper Sandler Companies | 1,621,968 | |||||
| 24,163 | Prudential Financial, Inc. | 2,313,607 | |||||
| 20,113 | Reinsurance Group of America, Inc. | 2,521,366 | |||||
The accompanying notes are an integral part of these financial statements.
32
VIDENT CORE U.S. EQUITY FUND
SCHEDULE OF INVESTMENTS
August 31, 2022 (Continued)
| Shares | Security Description | Value | |||||
| COMMON STOCKS – 99.7% (Continued) | |||||||
| Financials – 13.3% (Continued) | |||||||
| 20,076 | Selective Insurance Group, Inc. | $ | 1,594,436 | ||||
| 26,424 | Stewart Information Services Corporation (a) | 1,338,111 | |||||
| 32,864 | Stifel Financial Corporation (a) | 1,949,164 | |||||
| 52,306 | Synchrony Financial | 1,713,022 | |||||
| 14,769 | Travelers Companies, Inc. | 2,387,261 | |||||
| 765 | UMB Financial Corporation | 68,445 | |||||
| 72,033 | Unum Group | 2,726,449 | |||||
| 103,793 | Virtu Financial, Inc. – Class A | 2,383,087 | |||||
| 36,865 | W.R. Berkley Corporation | 2,388,852 | |||||
| 61,481,037 | |||||||
| Health Care – 12.3% | |||||||
| 20,937 | AMN Healthcare Services, Inc. (b) | 2,148,974 | |||||
| 25,403 | Centene Corporation (b) | 2,279,665 | |||||
| 8,582 | Cigna Corporation | 2,432,568 | |||||
| 24,555 | CVS Health Corporation | 2,410,073 | |||||
| 5,026 | Elevance Health, Inc. | 2,438,163 | |||||
| 110,449 | Exelixis, Inc. (b) | 1,959,365 | |||||
| 37,077 | Fulgent Genetics, Inc. (a)(b) | 1,611,737 | |||||
| 37,985 | Gilead Sciences, Inc. | 2,410,908 | |||||
| 29,985 | Henry Schein, Inc. (b) | 2,201,199 | |||||
| 32,751 | Hologic, Inc. (b) | 2,212,658 | |||||
| 4,704 | Humana, Inc. | 2,266,293 | |||||
| 122,204 | Ironwood Pharmaceuticals, Inc. (a)(b) | 1,314,915 | |||||
| 9,376 | Laboratory Corporation of America Holdings | 2,112,132 | |||||
| 6,987 | McKesson Corporation | 2,564,229 | |||||
| 70,694 | Meridian Bioscience, Inc. (a)(b) | 2,303,917 | |||||
| 14,122 | Moderna, Inc. (b) | 1,867,917 | |||||
| 7,658 | Molina Healthcare, Inc. (b) | 2,583,579 | |||||
| 45,087 | Pfizer, Inc. | 2,039,285 | |||||
| 31,386 | Prestige Consumer Healthcare, Inc. (b) | 1,587,504 | |||||
| 17,632 | Quest Diagnostics, Inc. (a) | 2,209,466 | |||||
| 22,374 | QuidelOrtho Corporation (b) | 1,773,363 | |||||
| 3,942 | Regeneron Pharmaceuticals, Inc. (b) | 2,290,539 | |||||
| 69,874 | REGENXBIO, Inc. (b) | 2,061,283 | |||||
| 10,245 | United Therapeutics Corporation (b) | 2,321,722 | |||||
| 20,773 | Universal Health Services, Inc. – Class B (a) | 2,032,430 | |||||
The accompanying notes are an integral part of these financial statements.
33
VIDENT CORE U.S. EQUITY FUND
SCHEDULE OF INVESTMENTS
August 31, 2022 (Continued)
| Shares | Security Description | Value | |||||
| COMMON STOCKS – 99.7% (Continued) | |||||||
| Health Care – 12.3% (Continued) | |||||||
| 184,605 | Viatris, Inc. | $ | 1,762,978 | ||||
| 79,731 | Vir Biotechnology, Inc. (a)(b) | 1,893,611 | |||||
| 57,090,473 | |||||||
| Industrials – 9.6% | |||||||
| 28,450 | ArcBest Corporation (a) | 2,291,079 | |||||
| 26,023 | Atkore, Inc. (a)(b) | 2,196,601 | |||||
| 33,176 | Atlas Air Worldwide Holdings, Inc. (a)(b) | 3,314,946 | |||||
| 36,068 | Boise Cascade Company | 2,248,118 | |||||
| 35,243 | Builders FirstSource, Inc. (b) | 2,065,592 | |||||
| 8,071 | CACI International, Inc. – Class A (b) | 2,266,902 | |||||
| 107,384 | CoreCivic, Inc. (b) | 1,023,370 | |||||
| 3,032 | Deluxe Corporation | 58,336 | |||||
| 21,131 | Encore Wire Corporation (a) | 2,749,143 | |||||
| 1,373 | FedEx Corporation | 289,442 | |||||
| 45,895 | GMS, Inc. (b) | 2,212,139 | |||||
| 45,138 | Knight-Swift Transportation Holdings, Inc. (a) | 2,279,920 | |||||
| 12,437 | Korn Ferry | 757,662 | |||||
| 21,688 | ManpowerGroup, Inc. | 1,590,164 | |||||
| 27,303 | Matson, Inc. | 2,011,139 | |||||
| 77,597 | MDU Resources Group, Inc. | 2,339,550 | |||||
| 35,300 | Mueller Industries, Inc. (a) | 2,229,901 | |||||
| 14,459 | MYR Group, Inc. (b) | 1,343,819 | |||||
| 27,489 | Owens Corning | 2,246,676 | |||||
| 22,785 | Rush Enterprises, Inc. – Class A | 1,072,262 | |||||
| 76,738 | Schneider National, Inc. – Class B (a) | 1,754,231 | |||||
| 19,828 | Science Applications International Corporation | 1,805,736 | |||||
| 27,104 | UFP Industries, Inc. | 2,151,787 | |||||
| 53,895 | Werner Enterprises, Inc. (a) | 2,144,482 | |||||
| 44,442,997 | |||||||
| Information Technology – 21.5% | |||||||
| 58,467 | Alpha & Omega Semiconductor, Ltd. (a)(b) | 2,260,334 | |||||
| 26,623 | Amdocs, Ltd. | 2,275,468 | |||||
| 122,685 | Amkor Technology, Inc. | 2,469,649 | |||||
| 50,620 | Avnet, Inc. (a) | 2,221,712 | |||||
| 36,285 | Axcelis Technologies, Inc. (b) | 2,428,918 | |||||
The accompanying notes are an integral part of these financial statements.
34
VIDENT CORE U.S. EQUITY FUND
SCHEDULE OF INVESTMENTS
August 31, 2022 (Continued)
| Shares | Security Description | Value | |||||
| COMMON STOCKS – 99.7% (Continued) | |||||||
| Information Technology – 21.5% (Continued) | |||||||
| 37,137 | Belden, Inc. | $ | 2,431,731 | ||||
| 15,194 | Ciena Corporation (b) | 770,944 | |||||
| 51,931 | Cisco Systems, Inc. | 2,322,354 | |||||
| 33,418 | Cognizant Technology Solutions Corporation – Class A | 2,111,015 | |||||
| 49,974 | Cohu, Inc. (a)(b) | 1,340,802 | |||||
| 13,353 | Concentrix Corporation | 1,679,540 | |||||
| 174,051 | Conduent, Inc. (b) | 711,869 | |||||
| 67,214 | Corning, Inc. | 2,306,785 | |||||
| 21,733 | CSG Systems International, Inc. | 1,257,254 | |||||
| 30,624 | Diodes, Inc. (b) | 2,179,510 | |||||
| 101,748 | Dropbox, Inc. – Class A (b) | 2,176,390 | |||||
| 74,522 | DXC Technology Company (b) | 1,846,655 | |||||
| 16,087 | ExlService Holdings, Inc. (a)(b) | 2,697,951 | |||||
| 23,308 | Fidelity National Information Services, Inc. | 2,129,652 | |||||
| 31,826 | First Solar, Inc. (b) | 4,059,406 | |||||
| 151,489 | Flex, Ltd. (b) | 2,698,019 | |||||
| 167,773 | Hewlett Packard Enterprise Company | 2,281,713 | |||||
| 71,158 | HP, Inc. | 2,042,946 | |||||
| 58,937 | Intel Corporation | 1,881,269 | |||||
| 36,726 | InterDigital, Inc. | 1,842,176 | |||||
| 18,011 | International Business Machines Corporation | 2,313,513 | |||||
| 42,123 | Jabil, Inc. | 2,540,017 | |||||
| 80,744 | Juniper Networks, Inc. (a) | 2,294,745 | |||||
| 76,971 | Knowles Corporation (b) | 1,166,111 | |||||
| 47,243 | Kulicke and Soffa Industries, Inc. (a) | 1,986,096 | |||||
| 221,678 | Kyndryl Holdings, Inc. (b) | 2,309,885 | |||||
| 24,255 | Lumentum Holdings, Inc. (a)(b) | 2,026,505 | |||||
| 31,316 | Methode Electronics, Inc. (a) | 1,267,045 | |||||
| 37,692 | Micron Technology, Inc. | 2,130,729 | |||||
| 21,064 | MKS Instruments, Inc. | 2,098,185 | |||||
| 69,292 | NetScout Systems, Inc. (b) | 2,199,328 | |||||
| 38,845 | ON Semiconductor Corporation (b) | 2,671,371 | |||||
| 10,942 | OSI Systems, Inc. (b) | 911,688 | |||||
| 106,513 | Photronics, Inc. (b) | 1,789,418 | |||||
| 16,585 | Plexus Corporation (a)(b) | 1,554,512 | |||||
| 22,137 | Qorvo, Inc. (b) | 1,987,460 | |||||
The accompanying notes are an integral part of these financial statements.
35
VIDENT CORE U.S. EQUITY FUND
SCHEDULE OF INVESTMENTS
August 31, 2022 (Continued)
| Shares | Security Description | Value | |||||
| COMMON STOCKS – 99.7% (Continued) | |||||||
| Information Technology – 21.5% (Continued) | |||||||
| 53,379 | Sanmina Corporation (b) | $ | 2,589,949 | ||||
| 60,219 | Teradata Corporation (b) | 1,981,205 | |||||
| 94,466 | TTM Technologies, Inc. (b) | 1,485,950 | |||||
| 119,518 | Vishay Intertechnology, Inc. | 2,350,919 | |||||
| 48,924 | Western Digital Corporation (b) | 2,067,528 | |||||
| 138,087 | Western Union Company | 2,046,449 | |||||
| 145,265 | Xerox Holdings Corporation (a) | 2,414,304 | |||||
| 63,576 | Xperi Holding Corporation | 1,011,494 | |||||
| 99,618,468 | |||||||
| Materials – 3.8% | |||||||
| 17,245 | Alpha Metallurgical Resources, Inc. | 2,710,052 | |||||
| 27,219 | CF Industries Holdings, Inc. | 2,816,078 | |||||
| 65,376 | Commercial Metals Company | 2,648,382 | |||||
| 48,490 | Mosaic Company (a) | 2,612,156 | |||||
| 19,275 | Nucor Corporation | 2,562,418 | |||||
| 12,782 | Reliance Steel & Aluminum Company | 2,402,760 | |||||
| 60,100 | Warrior Met Coal, Inc. | 1,956,255 | |||||
| 17,708,101 | |||||||
| Real Estate – 2.3% | |||||||
| 185,912 | Anywhere Real Estate, Inc. (b) | 1,816,360 | |||||
| 28,065 | CBRE Group, Inc. – Class A (b) | 2,216,012 | |||||
| 12,550 | Jones Lang LaSalle, Inc. (b) | 2,171,150 | |||||
| 49,363 | PotlatchDeltic Corporation (a) | 2,291,431 | |||||
| 65,041 | Weyerhaeuser Company | 2,221,801 | |||||
| 10,716,754 | |||||||
| Utilities – 2.8% | |||||||
| 52,477 | Exelon Corporation | 2,304,265 | |||||
| 25,094 | Hawaiian Electric Industries, Inc. | 981,677 | |||||
| 35,055 | National Fuel Gas Company | 2,498,370 | |||||
| 64,890 | NRG Energy, Inc. (a) | 2,678,659 | |||||
| 56,024 | UGI Corporation (a) | 2,212,948 | |||||
| 100,440 | Vistra Energy Corporation | 2,485,890 | |||||
| 13,161,809 | |||||||
| TOTAL COMMON STOCKS (Cost $439,637,474) | 462,342,143 | ||||||
The accompanying notes are an integral part of these financial statements.
36
VIDENT CORE U.S. EQUITY FUND
SCHEDULE OF INVESTMENTS
August 31, 2022 (Continued)
| Principal | |||||||
| Amount | Security Description | Value | |||||
| SHORT-TERM INVESTMENTS – 0.2% | |||||||
| Money Market Deposit Account – 0.2% | |||||||
| $ | 808,847 | U.S. Bank Money Market | |||||
| Deposit Account, 1.60% (c) | $ | 808,847 | |||||
| TOTAL SHORT-TERM INVESTMENTS | |||||||
| (Cost $808,847) | 808,847 | ||||||
| Units | |||||||
| INVESTMENTS PURCHASED WITH PROCEEDS | |||||||
| FROM SECURITIES LENDING – 22.0% | |||||||
| Private Funds – 22.0% | |||||||
| 102,086,625 | Mount Vernon Liquid Assets | ||||||
| Portfolio, LLC, 2.47% (d)(e) | 102,086,625 | ||||||
| TOTAL INVESTMENTS PURCHASED WITH | |||||||
| PROCEEDS FROM SECURITIES LENDING | |||||||
| (Cost $102,086,625) | 102,086,625 | ||||||
| TOTAL INVESTMENTS – 121.9% | |||||||
| (Cost $542,532,946) | 565,237,615 | ||||||
| Liabilities in Excess of Other Assets – (21.9)% | (101,469,244 | ) | |||||
| NET ASSETS – 100.0% | $ | 463,768,371 | |||||
Percentages are stated as a percent of net assets.
| (a) | All or portion of this security is out on loan as of August 31, 2022. Total value of securities out on loan is $98,708,378 or 21.3% of net assets. | |
| (b) | Non-income producing security. | |
| (c) | The Money Market Deposit Account (the “MMDA”) is a short-term investment vehicle in which the Fund holds cash balances. The MMDA will bear interest at a variable rate that is determined based on conditions and may change daily and by any amount. The rate shown is as of August 31, 2022. | |
| (d) | Rate shown is the annualized seven-day yield as of August 31, 2022. | |
| (e) | Privately offered liquidity fund. See Note 2 in Notes to Financial Statements. |
The Global Industry Classification Standard (GICS®) was developed by and/or is the exclusive property of MSCI, Inc. (“MSCI”) and Standard & Poor’s Financial Services LLC (“S&P”). GICS® is a service mark of MSCI and S&P and has been licensed for use by the Fund’s Administrator, U.S. Bancorp Fund Services.
The accompanying notes are an integral part of these financial statements.
37
VIDENT CORE U.S. BOND STRATEGY ETF
SCHEDULE OF INVESTMENTS
August 31, 2022
| Principal | |||||||
| Amount | Security Description | Value | |||||
| CORPORATE BONDS – 24.8% | |||||||
| Communication Services – 0.9% | |||||||
| Discovery Communications LLC | |||||||
| $ | 990,000 | 06/01/2040, 6.350% | $ | 950,949 | |||
| Hughes Satellite Systems Corporation | |||||||
| 1,120,000 | 08/01/2026, 5.250% | 1,068,469 | |||||
| Magallanes, Inc. | |||||||
| 120,000 | 03/15/2062, 5.391% (a) | 96,848 | |||||
| Paramount Global | |||||||
| 1,190,000 | 02/28/2057, 6.250% (b)(c) | 1,100,750 | |||||
| 3,217,016 | |||||||
| Consumer Discretionary – 2.0% | |||||||
| Dick’s Sporting Goods, Inc. | |||||||
| 1,640,000 | 01/15/2052, 4.100% | 1,102,252 | |||||
| Hasbro, Inc. | |||||||
| 960,000 | 03/15/2040, 6.350% | 998,141 | |||||
| Kohl’s Corporation | |||||||
| 1,580,000 | 05/01/2031, 3.375% | 1,135,980 | |||||
| Lear Corporation | |||||||
| 960,000 | 09/15/2027, 3.800% (b) | 909,190 | |||||
| 210,000 | 05/15/2049, 5.250% | 185,378 | |||||
| MDC Holdings, Inc. | |||||||
| 1,330,000 | 01/15/2043, 6.000% | 1,092,210 | |||||
| Mohawk Industries, Inc. | |||||||
| 1,280,000 | 05/15/2030, 3.625% (b) | 1,145,162 | |||||
| Newell Brands, Inc. | |||||||
| 1,310,000 | 04/01/2046, 5.750% | 1,076,276 | |||||
| 7,644,589 | |||||||
| Consumer Staples – 0.6% | |||||||
| Altria Group, Inc. | |||||||
| 1,200,000 | 01/31/2044, 5.375% (b) | 1,064,892 | |||||
| Kraft Heinz Foods Company | |||||||
| 105,000 | 01/26/2039, 6.875% | 115,719 | |||||
| 890,000 | 02/09/2040, 6.500% | 957,314 | |||||
| 2,137,925 | |||||||
The accompanying notes are an integral part of these financial statements.
38
VIDENT CORE U.S. BOND STRATEGY ETF
SCHEDULE OF INVESTMENTS
August 31, 2022 (Continued)
| Principal | |||||||
| Amount | Security Description | Value | |||||
| CORPORATE BONDS – 24.8% (Continued) | |||||||
| Energy – 4.8% | |||||||
| Continental Resources, Inc. | |||||||
| $ | 1,390,000 | 06/01/2044, 4.900% | $ | 1,092,554 | |||
| Devon Energy Corporation | |||||||
| 930,000 | 09/30/2031, 7.875% | 1,077,648 | |||||
| Energy Transfer LP | |||||||
| 1,030,000 | 07/01/2038, 7.500% | 1,119,581 | |||||
| Enterprise Products Operating LLC | |||||||
| 1,480,000 | 02/15/2078, 5.375% (c) | 1,220,286 | |||||
| EQT Corporation | |||||||
| 1,020,000 | 02/01/2030, 7.000% | 1,092,848 | |||||
| Halliburton Company | |||||||
| 860,000 | 09/15/2039, 7.450% | 1,000,100 | |||||
| Hess Corporation | |||||||
| 1,050,000 | 01/15/2040, 6.000% | 1,074,180 | |||||
| Magellan Midstream Partners LP | |||||||
| 1,080,000 | 10/15/2043, 5.150% | 1,000,060 | |||||
| Marathon Oil Corporation | |||||||
| 945,000 | 10/01/2037, 6.600% (b) | 997,141 | |||||
| Marathon Petroleum Corporation | |||||||
| 945,000 | 03/01/2041, 6.500% | 1,024,517 | |||||
| ONEOK Partners LP | |||||||
| 800,000 | 10/01/2036, 6.650% | 826,538 | |||||
| 170,000 | 10/15/2037, 6.850% | 178,213 | |||||
| 105,000 | 02/01/2041, 6.125% | 101,882 | |||||
| Ovintiv, Inc. | |||||||
| 920,000 | 11/01/2031, 7.375% | 1,006,452 | |||||
| Phillips 66 Company | |||||||
| 930,000 | 10/01/2046, 4.900% (a) | 880,381 | |||||
| Plains All American Pipeline LP / PAA Finance Corp. | |||||||
| 1,305,000 | 02/15/2045, 4.900% | 1,061,945 | |||||
| Targa Resources Partners LP / Targa Resources | |||||||
| Partners Finance Corporation | |||||||
| 1,100,000 | 01/15/2029, 6.875% | 1,125,672 | |||||
| Valero Energy Corporation | |||||||
| 1,000,000 | 06/15/2037, 6.625% (b) | 1,090,274 | |||||
| Western Midstream Operating LP | |||||||
| 1,290,000 | 02/01/2050, 5.250% | 1,118,695 | |||||
| 18,088,967 | |||||||
The accompanying notes are an integral part of these financial statements.
39
VIDENT CORE U.S. BOND STRATEGY ETF
SCHEDULE OF INVESTMENTS
August 31, 2022 (Continued)
| Principal | |||||||
| Amount | Security Description | Value | |||||
| CORPORATE BONDS – 24.8% (Continued) | |||||||
| Financials – 6.1% | |||||||
| Allstate Corporation | |||||||
| $ | 1,100,000 | 05/15/2067, 6.500% (c) | $ | 1,120,430 | |||
| Ally Financial, Inc. | |||||||
| 990,000 | 11/01/2031, 8.000% (b) | 1,105,383 | |||||
| American Equity Investment Life Holding Company | |||||||
| 1,255,000 | 06/15/2027, 5.000% | 1,232,351 | |||||
| American International Group, Inc. | |||||||
| 1,200,000 | 04/01/2048, 5.750% (b)(c) | 1,140,087 | |||||
| Ares Capital Corporation | |||||||
| 1,400,000 | 11/15/2031, 3.200% | 1,095,836 | |||||
| Blackstone Secured Lending Fund | |||||||
| 1,430,000 | 09/30/2028, 2.850% | 1,141,493 | |||||
| Brighthouse Financial, Inc. | |||||||
| 1,580,000 | 06/22/2047, 4.700% (b) | 1,253,939 | |||||
| Enstar Group, Ltd. | |||||||
| 1,120,000 | 06/01/2029, 4.950% | 1,058,713 | |||||
| Fifth Third Bancorp | |||||||
| 810,000 | 03/01/2038, 8.250% | 1,048,509 | |||||
| GLP Capital LP / GLP Financing II, Inc. | |||||||
| 1,090,000 | 06/01/2028, 5.750% | 1,082,620 | |||||
| Jackson Financial, Inc. | |||||||
| 1,680,000 | 11/23/2051, 4.000% (a) | 1,161,265 | |||||
| Legg Mason, Inc. | |||||||
| 930,000 | 01/15/2044, 5.625% | 967,727 | |||||
| Lincoln National Corporation | |||||||
| 820,000 | 06/15/2040, 7.000% | 928,139 | |||||
| Markel Corporation | |||||||
| 1,000,000 | 04/05/2046, 5.000% | 941,565 | |||||
| MetLife, Inc. | |||||||
| 810,000 | 08/01/2069, 10.750% | 1,102,436 | |||||
| Owl Rock Capital Corporation | |||||||
| 1,380,000 | 06/11/2028, 2.875% | 1,120,428 | |||||
| Prudential Financial, Inc. | |||||||
| 1,205,000 | 09/15/2048, 5.700% (c) | 1,183,629 | |||||
| Regions Bank | |||||||
| 888,000 | 06/26/2037, 6.450% | 993,728 | |||||
| Synchrony Financial | |||||||
| 1,170,000 | 08/04/2026, 3.700% (b) | 1,099,049 | |||||
The accompanying notes are an integral part of these financial statements.
40
VIDENT CORE U.S. BOND STRATEGY ETF
SCHEDULE OF INVESTMENTS
August 31, 2022 (Continued)
| Principal | |||||||
| Amount | Security Description | Value | |||||
| CORPORATE BONDS – 24.8% (Continued) | |||||||
| Financials – 6.1% (Continued) | |||||||
| Unum Group | |||||||
| $ | 1,160,000 | 08/15/2042, 5.750% | $ | 1,079,184 | |||
| Western Alliance Bancorp | |||||||
| 1,330,000 | 06/15/2031, 3.000% (c) | 1,181,656 | |||||
| 23,038,167 | |||||||
| Health Care – 0.8% | |||||||
| Cardinal Health, Inc. | |||||||
| 1,345,000 | 06/15/2047, 4.368% (b) | 1,150,394 | |||||
| Centene Corporation | |||||||
| 1,140,000 | 12/15/2029, 4.625% | 1,075,533 | |||||
| HCA, Inc. | |||||||
| 960,000 | 06/15/2047, 5.500% | 890,575 | |||||
| 3,116,502 | |||||||
| Industrials – 1.7% | |||||||
| Air Lease Corporation | |||||||
| 1,280,000 | 10/01/2028, 4.625% | 1,208,031 | |||||
| BNSF Funding Trust I | |||||||
| 1,240,000 | 12/15/2055, 6.613% (c) | 1,224,623 | |||||
| FedEx Corporation | |||||||
| 1,015,000 | 01/15/2044, 5.100% | 984,926 | |||||
| Flowserve Corporation | |||||||
| 1,310,000 | 10/01/2030, 3.500% | 1,125,872 | |||||
| Kirby Corporation | |||||||
| 1,170,000 | 03/01/2028, 4.200% | 1,087,780 | |||||
| Owens Corning | |||||||
| 1,130,000 | 07/15/2047, 4.300% | 923,427 | |||||
| 6,554,659 | |||||||
| Information Technology – 2.2% | |||||||
| Broadcom, Inc. | |||||||
| 1,105,000 | 04/15/2030, 5.000% | 1,079,925 | |||||
| Corning, Inc. | |||||||
| 685,000 | 11/15/2079, 5.450% | 626,725 | |||||
| Dell International LLC / EMC Corporation | |||||||
| 880,000 | 07/15/2046, 8.350% | 1,069,562 | |||||
The accompanying notes are an integral part of these financial statements.
41
VIDENT CORE U.S. BOND STRATEGY ETF
SCHEDULE OF INVESTMENTS
August 31, 2022 (Continued)
| Principal | |||||||
| Amount | Security Description | Value | |||||
| CORPORATE BONDS – 24.8% (Continued) | |||||||
| Information Technology – 2.2% (Continued) | |||||||
| HP, Inc. | |||||||
| $ | 995,000 | 09/15/2041, 6.000% (b) | $ | 974,778 | |||
| Jabil, Inc. | |||||||
| 220,000 | 01/12/2028, 3.950% | 207,865 | |||||
| Kyndryl Holdings, Inc. | |||||||
| 1,780,000 | 10/15/2041, 4.100% (a) | 1,101,395 | |||||
| Micron Technology, Inc. | |||||||
| 1,070,000 | 02/06/2029, 5.327% | 1,058,207 | |||||
| Vontier Corporation | |||||||
| 1,510,000 | 04/01/2031, 2.950% | 1,163,682 | |||||
| Western Digital Corporation | |||||||
| 1,520,000 | 02/01/2032, 3.100% | 1,146,703 | |||||
| 8,428,842 | |||||||
| Materials – 1.1% | |||||||
| Dow Chemical Company | |||||||
| 650,000 | 05/15/2039, 9.400% | 902,441 | |||||
| Freeport-McMoRan, Inc. | |||||||
| 1,190,000 | 03/15/2043, 5.450% (b) | 1,075,035 | |||||
| Martin Marietta Materials, Inc. | |||||||
| 205,000 | 12/15/2047, 4.250% | 172,922 | |||||
| Mosaic Company | |||||||
| 950,000 | 11/15/2043, 5.625% | 944,241 | |||||
| Vulcan Materials Company | |||||||
| 1,040,000 | 06/15/2047, 4.500% | 921,418 | |||||
| 4,016,057 | |||||||
| Real Estate – 1.8% | |||||||
| Brixmor Operating Partnership LP | |||||||
| 1,255,000 | 07/01/2030, 4.050% (b) | 1,119,553 | |||||
| EPR Properties | |||||||
| 1,400,000 | 08/15/2029, 3.750% | 1,181,247 | |||||
| MPT Operating Partnership LP / MPT | |||||||
| Finance Corporation | |||||||
| 1,210,000 | 08/01/2029, 4.625% (b) | 1,032,295 | |||||
| Omega Healthcare Investors, Inc. | |||||||
| 1,210,000 | 01/15/2026, 5.250% | 1,201,975 | |||||
The accompanying notes are an integral part of these financial statements.
42
VIDENT CORE U.S. BOND STRATEGY ETF
SCHEDULE OF INVESTMENTS
August 31, 2022 (Continued)
| Principal | |||||||
| Amount | Security Description | Value | |||||
| CORPORATE BONDS – 24.8% (Continued) | |||||||
| Real Estate – 1.8% (Continued) | |||||||
| Sabra Health Care LP | |||||||
| $ | 1,580,000 | 12/01/2031, 3.200% | $ | 1,255,615 | |||
| Simon Property Group LP | |||||||
| 850,000 | 02/01/2040, 6.750% | 962,576 | |||||
| 6,753,261 | |||||||
| Utilities – 2.8% | |||||||
| American Electric Power Company, Inc. | |||||||
| 1,320,000 | 02/15/2062, 3.875% (c) | 1,125,269 | |||||
| CMS Energy Corporation | |||||||
| 1,350,000 | 06/01/2050, 4.750% (c) | 1,242,000 | |||||
| Dominion Energy, Inc. | |||||||
| 1,150,000 | 10/01/2054, 5.750% (c) | 1,106,429 | |||||
| Duke Energy Corporation | |||||||
| 1,450,000 | 01/15/2082, 3.250% (c) | 1,160,631 | |||||
| Edison International | |||||||
| 1,280,000 | 03/15/2028, 4.125% | 1,210,753 | |||||
| National Fuel Gas Company | |||||||
| 1,100,000 | 01/15/2026, 5.500% (b) | 1,113,287 | |||||
| NextEra Energy Capital Holdings, Inc. | |||||||
| 1,180,000 | 12/01/2077, 4.800% (c) | 983,578 | |||||
| 160,000 | 03/15/2082, 3.800% (c) | 135,002 | |||||
| Sempra Energy | |||||||
| 1,400,000 | 04/01/2052, 4.125% (c) | 1,182,923 | |||||
| Southern Company | |||||||
| 1,380,000 | 09/15/2051, 3.750% (c) | 1,197,151 | |||||
| 10,457,023 | |||||||
| TOTAL CORPORATE BONDS | |||||||
| (Cost $104,582,924) | 93,453,008 | ||||||
| MORTGAGE BACKED SECURITIES – | |||||||
| U.S. GOVERNMENT AGENCY – 11.3% | |||||||
| Federal Home Loan Banks | |||||||
| 300,000 | 09/13/2024, 2.875% | 296,798 | |||||
| 230,000 | 12/13/2024, 2.750% | 226,399 | |||||
| 310,000 | 08/15/2024, 1.500% | 299,120 | |||||
| 225,000 | 12/20/2024, 1.000% | 213,135 | |||||
The accompanying notes are an integral part of these financial statements.
43
VIDENT CORE U.S. BOND STRATEGY ETF
SCHEDULE OF INVESTMENTS
August 31, 2022 (Continued)
| Principal | |||||||
| Amount | Security Description | Value | |||||
| MORTGAGE BACKED SECURITIES – | |||||||
| U.S. GOVERNMENT AGENCY – 11.3% (Continued) | |||||||
| Federal Home Loan Banks (Continued) | |||||||
| $ | 180,000 | 03/14/2025, 2.375% | $ | 175,255 | |||
| 235,000 | 04/14/2025, 0.500% | 217,474 | |||||
| 305,000 | 09/04/2025, 0.375% | 278,198 | |||||
| 115,000 | 12/21/2026, 1.250% | 105,457 | |||||
| 115,000 | 06/09/2028, 3.250% | 114,666 | |||||
| 40,000 | 07/15/2036, 5.500% | 47,940 | |||||
| 1,974,442 | |||||||
| Federal Home Loan Mortgage Corporation | |||||||
| 195,000 | 02/12/2025, 1.500% | 186,153 | |||||
| 125,000 | 07/21/2025, 0.375% | 114,448 | |||||
| 240,000 | 09/23/2025, 0.375% | 218,812 | |||||
| 20,000 | 09/15/2029, 6.750% | 24,271 | |||||
| 120,000 | 03/15/2031, 6.750% | 149,257 | |||||
| 692,941 | |||||||
| Federal National Mortgage Association | |||||||
| 300,000 | 09/06/2024, 2.625% | 295,127 | |||||
| 275,000 | 10/15/2024, 1.625% | 264,646 | |||||
| 220,000 | 01/07/2025, 1.625% | 211,139 | |||||
| 230,000 | 04/22/2025, 0.625% | 213,144 | |||||
| 100,000 | 06/17/2025, 0.500% | 92,006 | |||||
| 130,000 | 08/25/2025, 0.375% | 118,692 | |||||
| 520,000 | 11/07/2025, 0.500% | 473,701 | |||||
| 285,000 | 04/24/2026, 2.125% | 272,288 | |||||
| 190,000 | 09/24/2026, 1.875% | 179,089 | |||||
| 30,000 | 01/15/2030, 7.125% | 37,403 | |||||
| 125,000 | 05/15/2030, 7.250% | 157,594 | |||||
| 115,000 | 11/15/2030, 6.625% | 141,131 | |||||
| 1,500,000 | 09/01/2040, 4.000% (d) | 1,466,719 | |||||
| 2,210,000 | 09/15/2041, 3.500% (d) | 2,110,369 | |||||
| 2,395,000 | 09/15/2041, 4.500% (d) | 2,385,358 | |||||
| 7,000,000 | 09/15/2041, 5.000% (d) | 7,075,937 | |||||
| 2,140,000 | 09/15/2042, 3.000% (d) | 1,983,930 | |||||
| 3,220,488 | 04/01/2052, 4.000% | 3,153,995 | |||||
| 3,922,794 | 05/01/2052, 4.000% | 3,843,016 | |||||
| 3,937,481 | 06/01/2052, 4.000% | 3,856,224 | |||||
| 28,331,508 | |||||||
The accompanying notes are an integral part of these financial statements.
44
VIDENT CORE U.S. BOND STRATEGY ETF
SCHEDULE OF INVESTMENTS
August 31, 2022 (Continued)
| Principal | |||||||
| Amount | Security Description | Value | |||||
| MORTGAGE BACKED SECURITIES – | |||||||
| U.S. GOVERNMENT AGENCY – 11.3% (Continued) | |||||||
| Government National Mortgage Association | |||||||
| $ | 1,200,000 | 09/01/2040, 4.500% (d) | $ | 1,213,778 | |||
| 2,400,000 | 09/15/2040, 4.000% (d) | 2,385,750 | |||||
| 1,430,000 | 09/15/2041, 4.000% (d) | 1,411,511 | |||||
| 2,245,000 | 09/15/2041, 4.500% (d) | 2,249,291 | |||||
| 1,200,000 | 09/15/2042, 3.000% (d) | 1,128,094 | |||||
| 1,200,000 | 09/15/2042, 3.500% (d) | 1,157,902 | |||||
| 1,200,000 | 09/15/2042, 3.500% (d) | 1,159,026 | |||||
| 1,200,000 | 09/01/2043, 3.000% (d) | 1,125,609 | |||||
| 11,830,961 | |||||||
| TOTAL MORTGAGE BACKED SECURITIES – | |||||||
| U.S. GOVERNMENT AGENCY | |||||||
| (Cost $43,638,491) | 42,829,852 | ||||||
| U.S. GOVERNMENT AGENCY ISSUES – 1.7% | |||||||
| Financials – 0.2% | |||||||
| Federal Farm Credit Banks Funding Corporation | |||||||
| 240,000 | 11/18/2024, 0.875% | 226,902 | |||||
| 210,000 | 01/06/2025, 1.125% | 198,947 | |||||
| 200,000 | 02/14/2025, 1.750% | 192,011 | |||||
| 617,860 | |||||||
| Utilities – 1.5% | |||||||
| Tennessee Valley Authority | |||||||
| 145,000 | 09/15/2024, 2.875% | 143,090 | |||||
| 425,000 | 05/15/2025, 0.750% | 394,023 | |||||
| 450,000 | 11/01/2025, 6.750% | 492,085 | |||||
| 455,000 | 02/01/2027, 2.875% | 444,713 | |||||
| 730,000 | 04/01/2036, 5.880% | 873,618 | |||||
| 920,000 | 01/15/2038, 6.150% | 1,122,297 | |||||
| 1,050,000 | 09/15/2039, 5.250% | 1,188,889 | |||||
| 690,000 | 12/15/2042, 3.500% | 623,625 | |||||
| 190,000 | 04/01/2056, 5.375% | 230,857 | |||||
| 5,513,197 | |||||||
| TOTAL U.S. GOVERNMENT AGENCY ISSUES | |||||||
| (Cost $6,665,665) | 6,131,057 | ||||||
The accompanying notes are an integral part of these financial statements.
45
VIDENT CORE U.S. BOND STRATEGY ETF
SCHEDULE OF INVESTMENTS
August 31, 2022 (Continued)
| Principal | |||||||
| Amount | Security Description | Value | |||||
| U.S. GOVERNMENT NOTES/BONDS – 61.6% | |||||||
| U.S. Treasury Bonds – 26.0% | |||||||
| United States Treasury Bonds | |||||||
| $ | 9,870,000 | 02/15/2026, 6.000% | $ | 10,682,733 | |||
| 11,865,000 | 11/15/2027, 6.125% | 13,425,526 | |||||
| 3,230,000 | 08/15/2041, 1.750% | 2,412,154 | |||||
| 11,745,000 | 08/15/2042, 2.750% | 10,370,009 | |||||
| 9,880,000 | 11/15/2042, 2.750% | 8,705,206 | |||||
| 13,995,000 | 02/15/2043, 3.125% | 13,071,658 | |||||
| 16,425,000 | 05/15/2043, 2.875% | 14,714,490 | |||||
| 575,000 | 08/15/2043, 3.625% | 580,615 | |||||
| 2,325,000 | 11/15/2043, 3.750% | 2,392,071 | |||||
| 3,305,000 | 02/15/2044, 3.625% | 3,331,208 | |||||
| 1,105,000 | 05/15/2044, 3.375% | 1,071,332 | |||||
| 8,165,000 | 08/15/2044, 3.125% | 7,588,666 | |||||
| 9,015,000 | 11/15/2044, 3.000% | 8,195,551 | |||||
| 2,010,000 | 02/15/2045, 2.500% | 1,670,498 | |||||
| 98,211,717 | |||||||
| U.S. Treasury Notes – 35.6% | |||||||
| United States Treasury Notes | |||||||
| 10,945,000 | 08/15/2024, 0.375% | 10,315,663 | |||||
| 10,950,000 | 08/31/2024, 1.250% | 10,492,752 | |||||
| 17,240,000 | 08/31/2024, 1.875% | 16,728,861 | |||||
| 13,880,000 | 09/15/2024, 0.375% | 13,046,658 | |||||
| 2,500,000 | 09/30/2024, 1.500% | 2,403,564 | |||||
| 6,790,000 | 10/15/2024, 0.625% | 6,401,166 | |||||
| 820,000 | 10/31/2024, 2.250% | 799,884 | |||||
| 3,655,000 | 11/30/2024, 1.500% | 3,502,375 | |||||
| 1,435,000 | 12/31/2024, 1.750% | 1,381,216 | |||||
| 4,155,000 | 01/15/2025, 1.125% | 3,935,564 | |||||
| 3,835,000 | 01/31/2025, 1.375% | 3,651,414 | |||||
| 11,240,000 | 01/31/2025, 2.500% | 10,992,808 | |||||
| 12,980,000 | 02/15/2025, 1.500% | 12,382,717 | |||||
| 5,410,000 | 03/15/2025, 1.750% | 5,187,683 | |||||
| 2,135,000 | 03/31/2025, 0.500% | 1,980,379 | |||||
| 350,000 | 04/15/2025, 2.625% | 342,672 | |||||
| 3,475,000 | 04/30/2025, 0.375% | 3,203,923 | |||||
| 6,855,000 | 04/30/2025, 2.875% | 6,750,568 | |||||
The accompanying notes are an integral part of these financial statements.
46
VIDENT CORE U.S. BOND STRATEGY ETF
SCHEDULE OF INVESTMENTS
August 31, 2022 (Continued)
| Principal | |||||||
| Amount | Security Description | Value | |||||
| U.S. GOVERNMENT NOTES/BONDS – 61.6% (Continued) | |||||||
| U.S. Treasury Notes – 35.6% (Continued) | |||||||
| United States Treasury Notes (Continued) | |||||||
| $ | 820,000 | 05/15/2025, 2.125% | $ | 791,748 | |||
| 6,240,000 | 05/31/2025, 2.875% | 6,142,744 | |||||
| 895,000 | 04/30/2027, 0.500% | 786,307 | |||||
| 3,655,000 | 05/15/2027, 2.375% | 3,501,376 | |||||
| 3,800,000 | 08/15/2027, 2.250% | 3,615,195 | |||||
| 6,570,000 | 11/15/2027, 2.250% | 6,236,111 | |||||
| 134,573,348 | |||||||
| TOTAL U.S. GOVERNMENT NOTES/BONDS | |||||||
| (Cost $241,415,179) | 232,785,065 | ||||||
| SHORT-TERM INVESTMENTS – 7.0% | |||||||
| Money Market Deposit Account – 7.0% | |||||||
| 26,630,706 | U.S. Bank Money Market | ||||||
| Deposit Account, 1.60% (e)(f) | 26,630,706 | ||||||
| TOTAL SHORT-TERM INVESTMENTS | |||||||
| (Cost $26,630,706) | 26,630,706 | ||||||
| Units | |||||||
| INVESTMENTS PURCHASED WITH PROCEEDS | |||||||
| FROM SECURITIES LENDING – 2.9% | |||||||
| Private Funds – 2.9% | |||||||
| 10,918,203 | Mount Vernon Liquid Assets | ||||||
| Portfolio, LLC, 2.47% (g)(h) | 10,918,203 | ||||||
| TOTAL INVESTMENTS PURCHASED WITH | |||||||
| PROCEEDS FROM SECURITIES LENDING | |||||||
| (Cost $10,918,203) | 10,918,203 | ||||||
| TOTAL INVESTMENTS – 109.3% | |||||||
| (Cost $433,851,168) | 412,747,891 | ||||||
| Liabilities in Excess of Other Assets – (9.3)% | (35,072,658 | ) | |||||
| NET ASSETS – 100.0% | $ | 377,675,233 | |||||
Percentages are stated as a percent of net assets.
| (a) | Security exempt from registration under Rule 144(a) of the Securities Act of 1933. Such securities are treated as liquid securities, according to the Fund’s liquidity guidelines. At August 31, 2022, the value of these securities amounted to $3,239,889 or 0.9% of net assets. |
The accompanying notes are an integral part of these financial statements.
47
VIDENT CORE U.S. BOND STRATEGY ETF
SCHEDULE OF INVESTMENTS
August 31, 2022 (Continued)
| (b) | All or portion of this security is out on loan as of August 31, 2022. Total value of securities out on loan is $10,631,699 or 2.8% of net assets. | |
| (c) | Variable or Floating Rate Security based on a reference index and spread. Certain securities are fixed to variable and currently in the fixed phase. Rate disclosed is the rate in effect as of August 31, 2022. | |
| (d) | Security purchased on a forward-commitment basis (“TBA commitment”). On August 31, 2022, the total value of TBA commitments was $26,853,274 or 7.1% of net assets. See Note 2 in Notes to Financial Statements. | |
| (e) | The Money Market Deposit Account (the “MMDA”) is a short-term investment vehicle in which the Fund holds cash balances. The MMDA will bear interest at a variable rate that is determined based on conditions and may change daily and by any amount. The rate shown is as of August 31, 2022. | |
| (f) | All or a portion of this security has been pledged as collateral in connection with TBA commitments. At August 31, 2022, the value of securities pledged amounted to $26,630,706. In addition, the Fund held cash collateral in the amount of $1,200,000. | |
| (g) | Rate shown is the annualized seven-day yield as of August 31, 2022. | |
| (h) | Privately offered liquidity fund. See Note 2 in Notes to Financial Statements. |
The Global Industry Classification Standard (GICS®) was developed by and/or is the exclusive property of MSCI, Inc. (“MSCI”) and Standard & Poor’s Financial Services LLC (“S&P”). GICS® is a service mark of MSCI and S&P and has been licensed for use by the Fund’s Administrator, U.S. Bancorp Global Fund Services.
The accompanying notes are an integral part of these financial statements.
48
VIDENT FUNDS
STATEMENTS OF ASSETS AND LIABILITIES
August 31, 2022
| Vident | Vident | Vident | ||||||||||
| International | Core U.S. | Core U.S. Bond | ||||||||||
| Equity Fund | Equity Fund | Strategy ETF | ||||||||||
| ASSETS | ||||||||||||
Investments in securities, at value*+ | $ | 347,228,223 | $ | 565,237,615 | $ | 412,747,891 | ||||||
| Cash held as collateral | ||||||||||||
| for TBA commitments | — | — | 1,200,000 | |||||||||
| Foreign currency, at value* | 10 | — | — | |||||||||
| Receivable for securities sold | — | — | 92,882 | |||||||||
| Dividends and interest receivable | 1,904,437 | 807,765 | 2,530,787 | |||||||||
| Dividend tax reclaim receivable | 1,243,547 | — | — | |||||||||
| Securities lending income receivable | 12,111 | 14,009 | 1,391 | |||||||||
| Total assets | 350,388,328 | 566,059,389 | 416,572,951 | |||||||||
| LIABILITIES | ||||||||||||
| Collateral received for | ||||||||||||
| securities loaned (Note 4) | 10,024,271 | 102,086,625 | 10,918,203 | |||||||||
| Payable for securities purchased | 109,333 | — | 27,847,975 | |||||||||
| Management fees payable | 180,945 | 204,393 | 131,540 | |||||||||
| Total liabilities | 10,314,549 | 102,291,018 | 38,897,718 | |||||||||
| NET ASSETS | $ | 340,073,779 | $ | 463,768,371 | $ | 377,675,233 | ||||||
| NET ASSETS CONSIST OF: | ||||||||||||
| Paid-in capital | $ | 516,861,679 | $ | 473,665,793 | $ | 428,001,391 | ||||||
| Total distributable earnings | ||||||||||||
| (accumulated deficit) | (176,787,900 | ) | (9,897,422 | ) | (50,326,158 | ) | ||||||
| Net assets | $ | 340,073,779 | $ | 463,768,371 | $ | 377,675,233 | ||||||
| Net asset value: | ||||||||||||
| Net assets | $ | 340,073,779 | $ | 463,768,371 | $ | 377,675,233 | ||||||
| Shares outstanding^ | 15,400,000 | 11,300,000 | 8,500,000 | |||||||||
| Net asset value, offering and | ||||||||||||
| redemption price per share | $ | 22.08 | $ | 41.04 | $ | 44.43 | ||||||
| * Identified Cost: | ||||||||||||
| Investments in Securities | $ | 375,926,336 | $ | 542,532,946 | $ | 433,851,168 | ||||||
| Foreign Currency | 10 | — | — | |||||||||
+ Includes loaned securities | ||||||||||||
| with a value of | $ | 13,325,169 | $ | 98,708,378 | $ | 10,631,699 | ||||||
^ No par value, unlimited number of shares authorized.
The accompanying notes are an integral part of these financial statements.
49
VIDENT FUNDS
STATEMENTS OF OPERATIONS
For the Year Ended August 31, 2022
| Vident | Vident | Vident | ||||||||||
| International | Core U.S. | Core U.S. Bond | ||||||||||
| Equity Fund | Equity Fund | Strategy ETF | ||||||||||
| INVESTMENT INCOME | ||||||||||||
| Dividends^ | $ | 22,307,393 | $ | 8,621,669 | $ | — | ||||||
| Non-cash dividends | 1,820,816 | — | — | |||||||||
| Securities lending income, | ||||||||||||
| net (Note 4) | 228,603 | 121,056 | 29,002 | |||||||||
| Interest | 3,846 | 2,625 | 8,575,535 | |||||||||
| Total investment income | 24,360,658 | 8,745,350 | 8,604,537 | |||||||||
| EXPENSES | ||||||||||||
| Management fees | 2,549,776 | 2,285,277 | 1,626,266 | |||||||||
| Total expenses | 2,549,776 | 2,285,277 | 1,626,266 | |||||||||
| Fees waived by adviser (Note 3) | (30,853 | ) | (29,448 | ) | (27,988 | ) | ||||||
| Net expenses | 2,518,923 | 2,255,829 | 1,598,278 | |||||||||
| Net investment income (loss) | 21,841,735 | 6,489,521 | 7,006,259 | |||||||||
| REALIZED AND UNREALIZED | ||||||||||||
| GAIN (LOSS) ON INVESTMENTS | ||||||||||||
| Net realized gain (loss) on: | ||||||||||||
| Investments in securities | (8,985,551 | ) | 25,064,709 | (31,030,589 | ) | |||||||
| Foreign currency | (205,792 | ) | — | — | ||||||||
| Change in unrealized | ||||||||||||
| appreciation (depreciation) on: | ||||||||||||
| Investments in securities | (81,338,855 | ) | (64,409,430 | ) | (28,597,208 | ) | ||||||
| Foreign currency and translation | ||||||||||||
| of other assets and liabilities | ||||||||||||
| in foreign currency | (181,194 | ) | — | — | ||||||||
| Net realized and unrealized | ||||||||||||
| gain (loss) on investments | (90,711,392 | ) | (39,344,721 | ) | (59,627,797 | ) | ||||||
| Net increase (decrease) in net assets | ||||||||||||
| resulting from operations | $ | (68,869,657 | ) | $ | (32,855,200 | ) | $ | (52,621,538 | ) | |||
| ^ Net of foreign withholding taxes | $ | 2,621,612 | $ | — | $ | — | ||||||
The accompanying notes are an integral part of these financial statements.
50
VIDENT INTERNATIONAL EQUITY FUND
STATEMENTS OF CHANGES IN NET ASSETS
| Year Ended | Year Ended | |||||||
| August 31, 2022 | August 31, 2021 | |||||||
| OPERATIONS | ||||||||
| Net investment income (loss) | $ | 21,841,735 | $ | 14,606,062 | ||||
| Net realized gain (loss) on investments | ||||||||
| and foreign currency | (9,191,343 | ) | 47,203,947 | |||||
| Change in unrealized appreciation | ||||||||
| (depreciation) on investments | ||||||||
| and foreign currency | (81,520,049 | ) | 72,325,084 | |||||
| Net increase (decrease) in net assets | ||||||||
| resulting from operations | (68,869,657 | ) | 134,135,093 | |||||
| DISTRIBUTIONS TO SHAREHOLDERS | ||||||||
| Net distributions to shareholders | (23,767,573 | ) | (15,901,505 | ) | ||||
| Total distributions to shareholders | (23,767,573 | ) | (15,901,505 | ) | ||||
| CAPITAL SHARE TRANSACTIONS | ||||||||
| Proceeds from shares sold | — | — | ||||||
| Payments for shares redeemed | (53,776,620 | ) | (69,124,880 | ) | ||||
| Transaction fees (Note 7) | 34,627 | 43,214 | ||||||
| Net increase (decrease) in | ||||||||
| net assets derived from | ||||||||
capital share transactions(a) | (53,741,993 | ) | (69,081,666 | ) | ||||
| Net increase (decrease) in net assets | $ | (146,379,223 | ) | $ | 49,151,922 | |||
| NET ASSETS | ||||||||
| Beginning of year | $ | 486,453,002 | $ | 437,301,080 | ||||
| End of year | $ | 340,073,779 | $ | 486,453,002 | ||||
| (a) | A summary of capital share transactions is as follows: |
| Shares | Shares | ||||||||
| Shares sold | — | — | |||||||
| Shares redeemed | (2,100,000 | ) | (2,800,000 | ) | |||||
| Net increase (decrease) | (2,100,000 | ) | (2,800,000 | ) | |||||
The accompanying notes are an integral part of these financial statements.
51
VIDENT CORE U.S. EQUITY FUND
STATEMENTS OF CHANGES IN NET ASSETS
| Year Ended | Year Ended | |||||||
| August 31, 2022 | August 31, 2021 | |||||||
| OPERATIONS | ||||||||
| Net investment income (loss) | $ | 6,489,521 | $ | 4,647,775 | ||||
| Net realized gain (loss) on investments | 25,064,709 | 64,389,498 | ||||||
| Change in unrealized appreciation | ||||||||
| (depreciation) on investments | (64,409,430 | ) | 84,452,844 | |||||
| Net increase (decrease) in net assets | ||||||||
| resulting from operations | (32,855,200 | ) | 153,490,117 | |||||
| DISTRIBUTIONS TO SHAREHOLDERS | ||||||||
| Net distributions to shareholders | (6,205,670 | ) | (4,772,720 | ) | ||||
| Total distributions to shareholders | (6,205,670 | ) | (4,772,720 | ) | ||||
| CAPITAL SHARE TRANSACTIONS | ||||||||
| Proceeds from shares sold | 78,759,520 | 43,785,000 | ||||||
| Payments for shares redeemed | (3,904,120 | ) | (94,885,470 | ) | ||||
| Transaction fees (Note 7) | 8 | — | ||||||
| Net increase (decrease) in | ||||||||
| net assets derived from | ||||||||
capital share transactions(a) | 74,855,408 | (51,100,470 | ) | |||||
| Net increase (decrease) in net assets | $ | 35,794,538 | $ | 97,616,927 | ||||
| NET ASSETS | ||||||||
| Beginning of year | $ | 427,973,833 | $ | 330,356,906 | ||||
| End of year | $ | 463,768,371 | $ | 427,973,833 | ||||
| (a) | A summary of capital share transactions is as follows: |
| Shares | Shares | ||||||||
| Shares sold | 1,800,000 | 1,000,000 | |||||||
| Shares redeemed | (100,000 | ) | (2,400,000 | ) | |||||
| Net increase (decrease) | 1,700,000 | (1,400,000 | ) | ||||||
The accompanying notes are an integral part of these financial statements.
52
VIDENT CORE U.S. BOND STRATEGY ETF
STATEMENTS OF CHANGES IN NET ASSETS
| Year Ended | Year Ended | |||||||
| August 31, 2022 | August 31, 2021 | |||||||
| OPERATIONS | ||||||||
| Net investment income (loss) | $ | 7,006,259 | $ | 6,263,390 | ||||
| Net realized gain (loss) on investments | (31,030,589 | ) | 9,034,635 | |||||
| Change in unrealized appreciation | ||||||||
| (depreciation) on investments | (28,597,208 | ) | (9,262,591 | ) | ||||
| Net increase (decrease) in net assets | ||||||||
| resulting from operations | (52,621,538 | ) | 6,035,434 | |||||
| DISTRIBUTIONS TO SHAREHOLDERS | ||||||||
| Net distributions to shareholders | (9,405,859 | ) | (6,192,618 | ) | ||||
| Total distributions to shareholders | (9,405,859 | ) | (6,192,618 | ) | ||||
| CAPITAL SHARE TRANSACTIONS | ||||||||
| Proceeds from shares sold | 46,663,710 | 20,576,910 | ||||||
| Payments for shares redeemed | (22,645,050 | ) | (5,243,670 | ) | ||||
| Transaction fees (Note 7) | 10,572 | 2,901 | ||||||
| Net increase (decrease) in | ||||||||
| net assets derived from | ||||||||
capital share transactions(a) | 24,029,232 | 15,336,141 | ||||||
| Net increase (decrease) in net assets | $ | (37,998,165 | ) | $ | 15,178,957 | |||
| NET ASSETS | ||||||||
| Beginning of year | $ | 415,673,398 | $ | 400,494,441 | ||||
| End of year | $ | 377,675,233 | $ | 415,673,398 | ||||
| (a) | A summary of capital share transactions is as follows: |
| Shares | Shares | ||||||||
| Shares sold | 1,000,000 | 400,000 | |||||||
| Shares redeemed | (500,000 | ) | (100,000 | ) | |||||
| Net increase (decrease) | 500,000 | 300,000 | |||||||
The accompanying notes are an integral part of these financial statements.
53
VIDENT INTERNATIONAL EQUITY FUND
FINANCIAL HIGHLIGHTS
For a capital share outstanding throughout each year
| Year Ended August 31, | ||||||||||||||||||||
| 2022 | 2021 | 2020 | 2019 | 2018 | ||||||||||||||||
| Net asset value, beginning of year | $ | 27.80 | $ | 21.54 | $ | 22.59 | $ | 25.19 | $ | 27.16 | ||||||||||
| INCOME (LOSS) FROM | ||||||||||||||||||||
| INVESTMENT OPERATIONS: | ||||||||||||||||||||
Net investment income (loss)(1) | 1.34 | 0.78 | 0.51 | 0.74 | 0.60 | |||||||||||||||
| Net realized and unrealized | ||||||||||||||||||||
gain (loss) on investments(4) | (5.60 | ) | 6.34 | (0.93 | ) | (2.64 | ) | (1.91 | ) | |||||||||||
| Total from | ||||||||||||||||||||
| investment operations | (4.26 | ) | 7.12 | (0.42 | ) | (1.90 | ) | (1.31 | ) | |||||||||||
| DISTRIBUTIONS | ||||||||||||||||||||
| TO SHAREHOLDERS: | ||||||||||||||||||||
| Distributions from: | ||||||||||||||||||||
| Net investment income | (1.46 | ) | (0.86 | ) | (0.64 | ) | (0.70 | ) | (0.66 | ) | ||||||||||
| Total distributions | ||||||||||||||||||||
| to shareholders | (1.46 | ) | (0.86 | ) | (0.64 | ) | (0.70 | ) | (0.66 | ) | ||||||||||
| CAPITAL SHARE | ||||||||||||||||||||
| TRANSACTIONS: | ||||||||||||||||||||
| Transaction fees (Note 7) | — | (2) | — | (2) | 0.01 | — | (2) | — | (2) | |||||||||||
| Net asset value, end of year | $ | 22.08 | $ | 27.80 | $ | 21.54 | $ | 22.59 | $ | 25.19 | ||||||||||
| Total return | -15.77 | % | 33.22 | % | -1.98 | % | -7.61 | % | -4.97 | % | ||||||||||
| SUPPLEMENTAL DATA: | ||||||||||||||||||||
| Net assets at end of year (000’s) | $ | 340,074 | $ | 486,453 | $ | 437,301 | $ | 569,345 | $ | 609,628 | ||||||||||
| RATIOS TO AVERAGE | ||||||||||||||||||||
| NET ASSETS: | ||||||||||||||||||||
| Expenses to average | ||||||||||||||||||||
| net assets (before | ||||||||||||||||||||
| management fees waived) | 0.61 | % | 0.61 | % | 0.61 | % | 0.61 | % | 0.64 | % | ||||||||||
| Expenses to average | ||||||||||||||||||||
| net assets (after | ||||||||||||||||||||
| management fees waived) | 0.60 | % | 0.59 | % | 0.60 | % | 0.61 | % | 0.63 | % | ||||||||||
| Net investment income (loss) | ||||||||||||||||||||
| to average net assets (before | ||||||||||||||||||||
| management fees waived) | 5.22 | % | 3.02 | % | 2.29 | % | 3.09 | % | 2.18 | % | ||||||||||
| Net investment income (loss) | ||||||||||||||||||||
| to average net assets (after | ||||||||||||||||||||
| management fees waived) | 5.23 | % | 3.04 | % | 2.30 | % | 3.09 | % | 2.19 | % | ||||||||||
Portfolio turnover rate(3) | 70 | % | 74 | % | 79 | % | 76 | % | 66 | % | ||||||||||
| (1) | Calculated based on average shares outstanding during the period. |
| (2) | Less than $0.005. |
| (3) | Excludes the impact of in-kind transactions. |
| (4) | Realized and unrealized gains and losses per share in this caption are balancing amounts necessary to reconcile the change in net asset value per share for the period, and may not reconcile with the aggregate gains and losses in the Statements of Operations due to share transactions for the period. |
The accompanying notes are an integral part of these financial statements.
54
VIDENT CORE U.S. EQUITY FUND
FINANCIAL HIGHLIGHTS
For a capital share outstanding throughout each year
| Year Ended August 31, | ||||||||||||||||||||
| 2022 | 2021 | 2020 | 2019 | 2018 | ||||||||||||||||
| Net asset value, beginning of year | $ | 44.58 | $ | 30.03 | $ | 29.72 | $ | 35.33 | $ | 29.83 | ||||||||||
| INCOME (LOSS) FROM | ||||||||||||||||||||
| INVESTMENT OPERATIONS: | ||||||||||||||||||||
Net investment income (loss)(1) | 0.62 | 0.46 | 0.45 | 0.49 | 0.40 | |||||||||||||||
| Net realized and unrealized | ||||||||||||||||||||
gain (loss) on investments(4) | (3.56 | ) | 14.56 | 0.33 | (5.60 | ) | 5.52 | |||||||||||||
| Total from | ||||||||||||||||||||
| investment operations | (2.94 | ) | 15.02 | 0.78 | (5.11 | ) | 5.92 | |||||||||||||
| DISTRIBUTIONS | ||||||||||||||||||||
| TO SHAREHOLDERS: | ||||||||||||||||||||
| Distributions from: | ||||||||||||||||||||
| Net investment income | (0.60 | ) | (0.47 | ) | (0.47 | ) | (0.50 | ) | (0.42 | ) | ||||||||||
| Total distributions | ||||||||||||||||||||
| to shareholders | (0.60 | ) | (0.47 | ) | (0.47 | ) | (0.50 | ) | (0.42 | ) | ||||||||||
| CAPITAL SHARE | ||||||||||||||||||||
| TRANSACTIONS: | ||||||||||||||||||||
| Transaction fees (Note 7) | — | (2) | — | — | — | (2) | — | |||||||||||||
| Net asset value, end of year | $ | 41.04 | $ | 44.58 | $ | 30.03 | $ | 29.72 | $ | 35.33 | ||||||||||
| Total return | -6.66 | % | 50.29 | % | 2.70 | % | -14.49 | % | 19.95 | % | ||||||||||
| SUPPLEMENTAL DATA: | ||||||||||||||||||||
| Net assets at end of year (000’s) | $ | 463,768 | $ | 427,974 | $ | 330,357 | $ | 478,413 | $ | 671,355 | ||||||||||
| RATIOS TO AVERAGE | ||||||||||||||||||||
| NET ASSETS: | ||||||||||||||||||||
| Expenses to average | ||||||||||||||||||||
| net assets (before | ||||||||||||||||||||
| management fees waived) | 0.50 | % | 0.50 | % | 0.50 | % | 0.50 | % | 0.52 | % | ||||||||||
| Expenses to average | ||||||||||||||||||||
| net assets (after | ||||||||||||||||||||
| management fees waived) | 0.49 | % | 0.48 | % | 0.49 | % | 0.50 | % | 0.51 | % | ||||||||||
| Net investment income (loss) | ||||||||||||||||||||
| to average net assets (before | ||||||||||||||||||||
| management fees waived) | 1.41 | % | 1.17 | % | 1.53 | % | 1.56 | % | 1.20 | % | ||||||||||
| Net investment income (loss) | ||||||||||||||||||||
| to average net assets (after | ||||||||||||||||||||
| management fees waived) | 1.42 | % | 1.19 | % | 1.54 | % | 1.56 | % | 1.21 | % | ||||||||||
Portfolio turnover rate(3) | 63 | % | 65 | % | 66 | % | 71 | % | 63 | % | ||||||||||
| (1) | Calculated based on average shares outstanding during the period. |
| (2) | Less than $0.005. |
| (3) | Excludes the impact of in-kind transactions. |
| (4) | Realized and unrealized gains and losses per share in this caption are balancing amounts necessary to reconcile the change in net asset value per share for the period, and may not reconcile with the aggregate gains and losses in the Statements of Operations due to share transactions for the period. |
The accompanying notes are an integral part of these financial statements.
55
VIDENT CORE U.S. BOND STRATEGY ETF
FINANCIAL HIGHLIGHTS
For a capital share outstanding throughout each year
| Year Ended August 31, | ||||||||||||||||||||
| 2022 | 2021 | 2020 | 2019 | 2018 | ||||||||||||||||
| Net asset value, beginning of year | $ | 51.96 | $ | 52.01 | $ | 51.22 | $ | 47.93 | $ | 50.26 | ||||||||||
| INCOME (LOSS) FROM | ||||||||||||||||||||
| INVESTMENT OPERATIONS: | ||||||||||||||||||||
Net investment income (loss)(1) | 0.85 | 0.80 | 1.23 | 1.50 | 1.17 | |||||||||||||||
| Net realized and unrealized | ||||||||||||||||||||
gain (loss) on investments(4) | (7.23 | ) | (0.05 | ) | 0.88 | 3.34 | (2.39 | ) | ||||||||||||
| Total from | ||||||||||||||||||||
| investment operations | (6.38 | ) | 0.75 | 2.11 | 4.84 | (1.22 | ) | |||||||||||||
| DISTRIBUTIONS | ||||||||||||||||||||
| TO SHAREHOLDERS: | ||||||||||||||||||||
| Distributions from: | ||||||||||||||||||||
| Net investment income | (1.05 | ) | (0.80 | ) | (1.33 | ) | (1.56 | ) | (1.11 | ) | ||||||||||
| Realized gains | (0.10 | ) | — | — | — | — | ||||||||||||||
| Total distributions | ||||||||||||||||||||
| to shareholders | (1.15 | ) | (0.80 | ) | (1.33 | ) | (1.56 | ) | (1.11 | ) | ||||||||||
| CAPITAL SHARE | ||||||||||||||||||||
| TRANSACTIONS: | ||||||||||||||||||||
| Transaction fees (Note 7) | — | (2) | — | (2) | 0.01 | 0.01 | — | (2) | ||||||||||||
| Net asset value, end of year | $ | 44.43 | $ | 51.96 | $ | 52.01 | $ | 51.22 | $ | 47.93 | ||||||||||
| Total return | -12.41 | % | 1.46 | % | 4.26 | % | 10.37 | % | -2.42 | % | ||||||||||
| SUPPLEMENTAL DATA: | ||||||||||||||||||||
| Net assets at end of year (000’s) | $ | 377,675 | $ | 415,673 | $ | 400,494 | $ | 486,612 | $ | 536,796 | ||||||||||
| RATIOS TO AVERAGE | ||||||||||||||||||||
| NET ASSETS: | ||||||||||||||||||||
| Expenses to average | ||||||||||||||||||||
| net assets (before | ||||||||||||||||||||
| management fees waived) | 0.41 | % | 0.41 | % | 0.41 | % | 0.41 | % | 0.43 | % | ||||||||||
| Expenses to average | ||||||||||||||||||||
| net assets (after | ||||||||||||||||||||
| management fees waived) | 0.40 | % | 0.39 | % | 0.40 | % | 0.41 | % | 0.42 | % | ||||||||||
| Net investment income (loss) | ||||||||||||||||||||
| to average net assets (before | ||||||||||||||||||||
| management fees waived) | 1.76 | % | 1.53 | % | 2.42 | % | 3.11 | % | 2.42 | % | ||||||||||
| Net investment income (loss) | ||||||||||||||||||||
| to average net assets (after | ||||||||||||||||||||
| management fees waived) | 1.77 | % | 1.55 | % | 2.43 | % | 3.11 | % | 2.43 | % | ||||||||||
Portfolio turnover rate(3) | 247 | % | 238 | % | 247 | % | 384 | % | 324 | % | ||||||||||
| (1) | Calculated based on average shares outstanding during the period. |
| (2) | Less than $0.005. |
| (3) | Excludes the impact of in-kind transactions. |
| (4) | Realized and unrealized gains and losses per share in this caption are balancing amounts necessary to reconcile the change in net asset value per share for the period, and may not reconcile with the aggregate gains and losses in the Statements of Operations due to share transactions for the period. |
The accompanying notes are an integral part of these financial statements.
56
VIDENT FUNDS
NOTES TO FINANCIAL STATEMENTS
August 31, 2022
NOTE 1 – ORGANIZATION
Vident International Equity Fund, Vident Core U.S. Equity Fund and Vident Core U.S. Bond Strategy ETF (individually each a “Fund” or collectively the “Funds”) are diversified series of ETF Series Solutions (“ESS” or the “Trust”), an open-end management investment company consisting of multiple investment series, organized as a Delaware statutory trust on February 9, 2012. The Trust is registered with the U.S. Securities and Exchange Commission (“SEC”) under the Investment Company Act of 1940, as amended (the “1940 Act”), as an open-end management investment company and the offering of the Funds’ shares is registered under the Securities Act of 1933, as amended (the “Securities Act”). The investment objectives of the Funds are to seek to track the performance, before fees and expenses, of the Vident Core International Equity Index, the Vident Core U.S. Stock Index and the Vident Core U.S. Bond Index, respectively. Vident International Equity Fund commenced operations on October 29, 2013; Vident Core U.S. Equity Fund commenced operations on January 21, 2014; and Vident Core U.S. Bond Strategy ETF commenced operations on October 15, 2014.
The end of the reporting period for the Funds is August 31, 2022, and the period covered by these Notes to Financial Statements is the fiscal year ended August 31, 2022 (the “current fiscal period”).
NOTE 2 – SIGNIFICANT ACCOUNTING POLICIES
The Funds are investment companies and accordingly follow the investment company accounting and reporting guidance of the Financial Accounting Standards Board (“FASB”) Accounting Standards Codification (“ASC”) Topic 946 Financial Services – Investment Companies.
The following is a summary of significant accounting policies consistently followed by the Funds. These policies are in conformity with accounting principles generally accepted in the United States of America (“U.S. GAAP”).
| A. | Security Valuation. All equity securities, including domestic and foreign common stocks, preferred stocks, and exchange traded funds that are traded on a national securities exchange, except those listed on the Nasdaq Global Market®, Nasdaq Global SelectMarket® and Nasdaq Capital Market® exchanges (collectively “Nasdaq”), are valued at the last reported sale price on the exchange on which the security is principally traded. Securities traded on Nasdaq will be valued at the Nasdaq Official Closing Price (“NOCP”). If, on a particular day, an exchange traded or Nasdaq security does not trade, then the mean between the most recent quoted bid and asked prices will be used. All equity securities that are not traded on a listed exchange are valued at the last sale price in the over-the-counter market. If a non-exchange traded security does not trade on a particular day, then the mean between the last quoted closing bid and asked price will be used. Prices denominated in foreign currencies are converted to U.S. dollar equivalents at the current exchange rate, which approximates fair value. |
57
VIDENT FUNDS
NOTES TO FINANCIAL STATEMENTS
August 31, 2022 (Continued)
| Investments in mutual funds, including money market funds, are valued at their net asset value (“NAV”) per share. | |
| Debt securities, including short-term debt instruments, are valued in accordance with prices provided by a pricing service. Pricing services may use various valuation methodologies such as the mean between the bid and asked prices, matrix pricing and other analytical pricing models as well as market transactions and dealer quotations. | |
| Units of Mount Vernon Liquid Assets Portfolio, LLC are not traded on an exchange and are valued at the investment company’s NAV per share as provided by its administrator. These shares are generally classified as Level 2 instruments. | |
| Deposit accounts are valued at acquisition cost, which approximates fair value. | |
| Securities for which quotations are not readily available are valued at their respective fair values in accordance with pricing procedures adopted by the Funds’ Board of Trustees (the “Board”). When a security is “fair valued,” consideration is given to the facts and circumstances relevant to the particular situation, including a review of various factors set forth in the pricing procedures adopted by the Board. The use of fair value pricing by the Funds may cause the NAV of the shares to differ significantly from the NAV that would be calculated without regard to such considerations. | |
| As described above, the Funds utilize various methods to measure the fair value of their investments on a recurring basis. U.S. GAAP establishes a hierarchy that prioritizes inputs to valuations methods. The three levels of inputs are: |
| Level 1 – | Unadjusted quoted prices in active markets for identical assets or liabilities that the Funds have the ability to access. | |
| Level 2 – | Observable inputs other than quoted prices included in Level 1 that are observable for the asset or liability, either directly or indirectly. These inputs may include quoted prices for the identical instrument on an inactive market, prices for similar instruments, interest rates, prepayment speeds, credit risk, yield curves, default rates and similar data. | |
| Level 3 – | Unobservable inputs for the asset or liability, to the extent relevant inputs are not available; representing the Funds’ own assumptions about the assumptions a market participant would use in valuing the asset or liability, and would be based on the best information available. |
| The availability of observable inputs can vary from security to security and is affected by a wide variety of factors, including, for example, the type of security, whether the security is new and not yet established in the marketplace, the liquidity of markets, and other characteristics particular to the security. To the extent that valuation is based on models or inputs that are less observable or unobservable in the market, the determination of fair value requires more judgment. Accordingly, the degree of judgment exercised in determining fair value is greatest for instruments categorized in Level 3. |
58
VIDENT FUNDS
NOTES TO FINANCIAL STATEMENTS
August 31, 2022 (Continued)
| The inputs used to measure fair value may fall into different levels of the fair value hierarchy. In such cases, for disclosure purposes, the level in the fair value hierarchy within which the fair value measurement falls in its entirety, is determined based on the lowest level input that is significant to the fair value measurement in its entirety. | |
| The following is a summary of the inputs used to value the Funds’ investments as of the end of the current fiscal period: |
| Vident International Equity Fund | |||||||||||||||||
Assets^ | Level 1 | Level 2 | Level 3 | Total | |||||||||||||
| Common Stocks | $ | 323,450,977 | $ | — | $ | 0 | (a) | $ | 323,450,977 | ||||||||
| Preferred Stocks | 13,058,606 | — | — | 13,058,606 | |||||||||||||
| Short-Term Investments | 694,369 | — | — | 694,369 | |||||||||||||
| Investments Purchased | |||||||||||||||||
| with Proceeds from | |||||||||||||||||
| Securities Lending | — | 10,024,271 | — | 10,024,271 | |||||||||||||
| Total Investments | |||||||||||||||||
| in Securities | $ | 337,203,952 | $ | 10,024,271 | $ | 0 | $ | 347,228,223 | |||||||||
| (a) | Represents less than $0.50. | |||
| ^ | See Schedule of Investments for country breakouts. | |||
| Vident Core U.S. Equity Fund | |||||||||||||||||
Assets^ | Level 1 | Level 2 | Level 3 | Total | |||||||||||||
| Common Stocks | $ | 462,342,143 | $ | — | $ | — | $ | 462,342,143 | |||||||||
| Short-Term Investments | 808,847 | — | — | 808,847 | |||||||||||||
| Investments Purchased | |||||||||||||||||
| with Proceeds from | |||||||||||||||||
| Securities Lending | — | 102,086,625 | — | 102,086,625 | |||||||||||||
| Total Investments | |||||||||||||||||
| in Securities | $ | 463,150,990 | $ | 102,086,625 | $ | — | $ | 565,237,615 | |||||||||
| ^ | See Schedule of Investments for sector breakouts. |
59
VIDENT FUNDS
NOTES TO FINANCIAL STATEMENTS
August 31, 2022 (Continued)
| Vident Core U.S. Bond Strategy ETF | |||||||||||||||||
Description^ | Level 1 | Level 2 | Level 3 | Total | |||||||||||||
| Corporate Bonds | $ | — | $ | 93,453,008 | $ | — | $ | 93,453,008 | |||||||||
| Mortgage Backed | |||||||||||||||||
| Securities – U.S. | |||||||||||||||||
| Government Agency | — | 42,829,852 | — | 42,829,852 | |||||||||||||
| U.S. Government | |||||||||||||||||
| Agency Issues | — | 6,131,057 | — | 6,131,057 | |||||||||||||
| U.S. Government | |||||||||||||||||
| Notes/Bonds | — | 232,785,065 | — | 232,785,065 | |||||||||||||
| Short-Term Investments | 26,630,706 | — | — | 26,630,706 | |||||||||||||
| Investments Purchased | |||||||||||||||||
| with Proceeds from | |||||||||||||||||
| Securities Lending | — | 10,918,203 | — | 10,918,203 | |||||||||||||
| Total Investments | |||||||||||||||||
| in Securities | $ | 26,630,706 | $ | 386,117,185 | $ | — | $ | 412,747,891 | |||||||||
| ^ | See Schedule of Investments for sector breakouts. |
| During the current fiscal period, the Vident Core U.S. Equity Fund and Vident Core U.S. Bond Strategy ETF did not recognize any transfers into or out of Level 3. The Vident International Equity Fund held securities valued at $0 that were recognized as transfers in to Level 3. The transfer occurred due to a halt in trading of Russian securities as a result of the ongoing Ukrainian/Russian conflict and the restrictions to the Russian foreign exchange. The Level 3 securities recognized $(7,014,285) as change in unrealized appreciation (depreciation) included in net change in unrealized appreciation (depreciation) on investments in the Statements of Operations. | |
| B. | Foreign Currency. Investment securities and other assets and liabilities denominated in foreign currencies are translated into U.S. dollar amounts at the date of valuation. Purchases and sales of investment securities and income and expense items denominated in foreign currencies are translated into U.S. dollar amounts on the respective dates of such transactions. The Funds do not isolate that portion of the results of operations resulting from changes in foreign exchange rates on investments and currency gains or losses realized between the trade and settlement dates on securities transactions from the fluctuations arising from changes in market prices of securities held. Such fluctuations are included with the net realized and unrealized gain or loss from investments. The Funds report net realized foreign exchange gains or losses that arise from sales of foreign currencies, currency gains or losses realized between the trade and settlement dates on foreign currency transactions, and the difference between the amounts of dividends, interest, and foreign withholding taxes recorded on the Funds’ books and the U.S. dollar equivalent of the amounts actually received or paid. Net unrealized foreign exchange gains and losses arise from changes in the values of assets and liabilities, other than investments in securities at fiscal period end, resulting from changes in exchange rates. |
60
VIDENT FUNDS
NOTES TO FINANCIAL STATEMENTS
August 31, 2022 (Continued)
| C. | Securities Purchased or Sold on a Forward-Commitment Basis. Vident Core U.S. Bond Strategy ETF may enter into TBA commitments, Mortgage Dollar Roll Transactions or other purchase and sale transactions that specify forward delivery of a financial security. TBA commitments are forward agreements for the purchase or sale of mortgage-backed pass-through securities for a fixed price, with payment and delivery on an agreed upon future settlement date. Most commitments in mortgage-backed pass-through securities occur for future delivery in which the exact mortgage pools to be delivered are not specified until a few days prior to settlement. The specific securities to be delivered are not identified at the trade date. However, delivered securities must follow general trade parameters, including issuer, rate and mortgage terms. When entering into TBA commitments, the Fund may take possession of or deliver the underlying mortgage-backed pass-through securities but can extend the settlement or roll the transaction. In order to better define contractual rights and to secure rights that will help the Fund mitigate counterparty risk, TBA commitments may be entered into by a Fund under Master Securities Forward Transaction Agreements (each, an “MSFTA”). An MSFTA typically contains, among other things, collateral posting terms and netting provisions in the event of default and/or termination event. The collateral requirements are typically calculated by netting the mark-to-market amount for each transaction under such agreement and comparing that amount to the value of the collateral currently pledged by a Fund and the counterparty. Cash collateral that has been pledged to cover the obligations of the Trust or cash collateral received from the counterparty, if any, is reported separately on the Statements of Assets and Liabilities as cash held as collateral for TBA commitments or cash received as collateral for TBA commitments, respectively. Noncash collateral pledged by the Fund, if any, is noted in the Schedule of Investments. In connection with this ability, the Fund may enter into mortgage “dollar rolls” in which a Fund sells TBA mortgage-backed securities and simultaneously contracts to repurchase substantially similar (i.e., same type, coupon and maturity) securities on a specific future date at an agreed upon price. During the period between the sale and repurchase, a Fund is not entitled to receive interest and principal payments on the securities sold. Mortgage dollar roll transactions are treated as purchases and sales and the Fund realizes gains and losses on these transactions. |
| The value of TBA commitments on the Statements of Assets and Liabilities for the Vident Core U.S. Bond Strategy ETF as of the end of the current fiscal period is as follows: |
| Statement of Assets and Liabilities – Values of TBA Commitments as of the end of the current fiscal period |
| Liabilities | |||
Location | Value | ||
| TBA Commitments – | Payable for | ||
| Credit/interest rate risk | Securities Purchased | $27,461,057 | |
61
VIDENT FUNDS
NOTES TO FINANCIAL STATEMENTS
August 31, 2022 (Continued)
| The effect of TBA Commitments on the Statement of Operations for the current fiscal period |
| Amount of Realized Gain (Loss) on TBA | Change in Unrealized Appreciation | ||||
| Commitments Recognized in Income | (Depreciation) Recognized in Income | ||||
| Investments | Investments | ||||
| in Securities | in Securities | ||||
| TBA Commitments | ($3,081,141) | TBA Commitments | ($539,673) | ||
| The average monthly value of TBA Commitments during the current fiscal period was $35,018,422. | |
| OFFSETTING ASSETS AND LIABILITIES | |
| The Vident Core U.S. Bond Strategy ETF is subject to various MSFTAs, which govern the terms of certain transactions with select counterparties. The MSFTAs allow the Fund to close out and net its total exposure to a counterparty in the event of a default with respect to all the transactions governed under a single agreement with a counterparty. The MSFTAs also specify collateral posting arrangements at prearranged exposure levels. Under the MSFTAs, collateral is routinely transferred if the total net exposure to certain transactions (net of existing collateral already in place) governed under the relevant MSFTAs with a counterparty in a given account exceeds a specified threshold depending on the counterparty and type of MSFTAs. | |
| The following is a summary of the Assets and Liabilities subject to offsetting in the Fund as of the end of the current fiscal period. |
| Liabilities | Gross Amounts not offset | ||||||||||||||||||||||||
| in the Statement of | |||||||||||||||||||||||||
| Assets and Liabilities | |||||||||||||||||||||||||
| Net | |||||||||||||||||||||||||
| Gross | Amounts | ||||||||||||||||||||||||
| Amounts | Presented | ||||||||||||||||||||||||
| Gross | Offset in the | in the | |||||||||||||||||||||||
| Amounts of | Statement of | Statement of | |||||||||||||||||||||||
| Description/ | Recognized | Assets and | Assets and | Financial | Collateral | Net | |||||||||||||||||||
| Counterparty | Liabilities | Liabilities | Liabilities | Instruments | Pledged | Amount | |||||||||||||||||||
| TBA Commitments | |||||||||||||||||||||||||
| Goldman Sachs | |||||||||||||||||||||||||
| & Co. LLC | $ | 15,458,947 | $ | — | $ | 15,458,947 | $ | (15,058,947 | ) | $ | (400,000 | ) | $ | — | |||||||||||
| Wells Fargo | |||||||||||||||||||||||||
| Securities, LLC | 12,002,110 | — | 12,002,110 | (11,202,110 | ) | (800,000 | ) | — | |||||||||||||||||
| $ | 27,461,057 | $ | — | $ | 27,461,057 | $ | (26,261,057 | ) | $ | (1,200,000 | ) | $ | — | ||||||||||||
| In some instances, the collateral amounts disclosed in the tables were adjusted due to the requirement to limit the collateral amounts to avoid the effect of overcollateralization. Actual collateral received/pledged may be more than the amounts disclosed herein. | |
| D. | Federal Income Taxes. The Funds’ policy is to comply with the provisions of Subchapter M of the Internal Revenue Code of 1986, as amended, applicable to regulated investment companies and to distribute substantially all of their net |
62
VIDENT FUNDS
NOTES TO FINANCIAL STATEMENTS
August 31, 2022 (Continued)
| investment income and net capital gains to shareholders. Therefore, no federal income tax provision is required. Each Fund plans to file U.S. Federal and various state and local tax returns. | |
| Each Fund recognizes the tax benefits of uncertain tax positions only when the position is more likely than not to be sustained. Management has analyzed each Fund’s uncertain tax positions and concluded that no liability for unrecognized tax benefits should be recorded related to uncertain tax positions. Management is not aware of any tax positions for which it is reasonably possible that the total amounts of unrecognized tax benefits will change materially in the next 12 months. Income and capital gain distributions are determined in accordance with federal income tax regulations, which may differ from U.S. GAAP. The Funds recognize interest and penalties, if any, related to unrecognized tax benefits on uncertain tax positions as income tax expenses in the Statements of Operations. During the current fiscal period, the Funds did not incur any interest or penalties. | |
| E. | Security Transactions and Investment Income. Investment securities transactions are accounted for on the trade date. Gains and losses realized from sales of securities are determined on a specific identification basis. Dividend income is recorded on the ex-dividend date. Non-cash dividends included in dividend income or separately disclosed, if any, are recorded at fair value of the security received. Withholding taxes on foreign dividends and foreign taxes on capital gains have been provided for in accordance with the Funds’ understanding of the applicable tax rules and regulations. Interest income is recorded on an accrual basis. Discounts and premiums on securities purchased are accreted and amortized using the effective yield method. Paydown gains and losses on mortgage-related and other asset-backed securities are recorded as components of interest income on the Statements of Operations. |
| Distributions received from the Funds’ investments in real estate investment trusts (“REIT”) may be characterized as ordinary income, net capital gain, or a return of capital. The proper characterization of REIT distributions is generally not known until after the end of each calendar year. As such, the Funds must use estimates in reporting the character of their income and distributions received during the current calendar year for financial statement purposes. The actual character of distributions to the Funds’ shareholders will be reflected on the Form 1099 received by shareholders after the end of the calendar year. Due to the nature of REIT investments, a portion of the distributions received by a Fund’s shareholders may represent a return of capital. | |
| F. | Distributions to Shareholders. Distributions to shareholders from net investment income for the Funds are declared and paid at least on a quarterly basis and distributions from net realized gains on securities are normally declared and paid on an annual basis. Distributions are recorded on the ex-dividend date. |
63
VIDENT FUNDS
NOTES TO FINANCIAL STATEMENTS
August 31, 2022 (Continued)
| G. | Use of Estimates. The preparation of financial statements in conformity with U.S. GAAP requires management to make estimates and assumptions that affect the reported amounts of assets and liabilities and disclosure of contingent assets and liabilities at the date of the financial statements, as well as the reported amounts of revenues and expenses during the current fiscal period. Actual results could differ from those estimates. |
| H. | Share Valuation. The NAV per share of each Fund is calculated by dividing the sum of the value of the securities held by the Fund, plus cash and other assets, minus all liabilities (including estimated accrued expenses) by the total number of shares outstanding for the Fund, rounded to the nearest cent. The Funds’ shares will not be priced on the days on which the New York Stock Exchange, Inc. (“NYSE”) is closed for trading. The offering and redemption price per share for each Fund is equal to the Fund’s NAV per share. |
| I. | Guarantees and Indemnifications. In the normal course of business, the Funds enter into contracts with service providers that contain general indemnification clauses. Each Fund’s maximum exposure under these arrangements is unknown as this would involve future claims that may be made against the Funds that have not yet occurred. However, based on experience, the Funds expect the risk of loss to be remote. |
| J. | Reclassification of Capital Accounts. U.S. GAAP requires that certain components of net assets relating to permanent differences be reclassified between financial and tax reporting. These reclassifications have no effect on net assets or NAV per share. The permanent differences are primarily due to differing book and tax treatments for in-kind transactions. For the fiscal year ended August 31, 2022 the following table shows the reclassifications made: |
| Distributable Earnings | |||||||||
| (Accumulated Deficit) | Paid-In Capital | ||||||||
| Vident International Equity Fund | $ | (4,033,544 | ) | $ | 4,033,544 | ||||
| Vident Core U.S. Equity Fund | $ | (697,709 | ) | $ | 697,709 | ||||
| Vident Core U.S. Bond Strategy ETF | $ | 1,381,888 | $ | (1,381,888 | ) | ||||
| During the fiscal year ended August 31, 2022, the Funds realized the following net capital gains/(losses) resulting from in-kind redemptions, in which shareholders exchanged Fund shares for securities held by the Fund rather than for cash. Because such gains/(losses) are not taxable to the Funds, and gains are not distributed to shareholders, they have been reclassified from distributable earnings (accumulated deficit) to paid-in capital. |
| Vident International Equity Fund | $ | 4,033,544 | |||
| Vident Core U.S. Equity Fund | $ | 697,709 | |||
| Vident Core U.S. Bond Strategy ETF | $ | (1,381,888 | ) |
| K. | Subsequent Events. In preparing these financial statements, management has evaluated events and transactions for potential recognition or disclosure through the |
64
VIDENT FUNDS
NOTES TO FINANCIAL STATEMENTS
August 31, 2022 (Continued)
| date the financial statements were issued. There were no events or transactions that occurred during the period subsequent to the end of the current fiscal period that materially impacted the amounts or disclosures in the Funds’ Financial Statements. |
NOTE 3 – COMMITMENTS AND OTHER RELATED PARTY TRANSACTIONS
Vident Advisory, LLC (the “Adviser”) serves as the investment adviser to the Funds, and is a wholly-owned subsidiary of Vident Financial, LLC, the Index Provider (“Vident Financial”). Pursuant to an Investment Advisory Agreement (“Advisory Agreement”) between the Trust, on behalf of the Funds, and the Adviser, the Adviser provides investment advice to the Funds and oversees the day-to-day operations of the Funds, subject to the direction and control of the Board and the officers of the Trust. Under the Advisory Agreement, the Adviser has agreed to pay all expenses incurred by the Funds except for the fee paid to the Adviser pursuant to this Agreement, interest charges on any borrowings, dividends and other expenses on securities sold short, taxes, brokerage commissions and other expenses incurred in placing orders for the purchase and sale of securities and other investment instruments, acquired fund fees and expenses, accrued deferred tax liability, extraordinary expenses, and distribution fees and expenses paid by the Trust under any distribution plan adopted pursuant to Rule 12b-1 under the 1940 Act (collectively, “Excluded Expenses”). The Adviser may delegate its responsibility to pay some or all expenses incurred by the Funds, except for Excluded Expenses, to one or more third parties, including but not limited to, Vident Investment Advisory, LLC (the “Sub-Adviser”) a wholly-owned subsidiary of Vident Financial. For its services, the Sub-Adviser is paid a fee by the Adviser, which is calculated daily and paid monthly, at an annual rate based on the average daily net assets of each Fund. For services provided to the Funds, Vident International Equity Fund pays the Adviser 0.61%, Vident Core U.S. Equity Fund pays the Adviser 0.50%, and Vident Core U.S. Bond Strategy ETF pays the Adviser 0.41% at an annual rate based on each Fund’s average daily net assets, calculated daily and paid monthly. Effective February 1, 2020, the Adviser contractually waived 0.02% of its adviser fee from each of the Funds until December 31, 2021. Fees waived under this waiver are not subject to recoupment by the Adviser.
U.S. Bancorp Fund Services, LLC (“Fund Services” or “Administrator”), doing business as U.S. Bank Global Fund Services, acts as the Funds’ Administrator and, in that capacity, performs various administrative and accounting services for the Funds. The Administrator prepares various federal and state regulatory filings, reports and returns for the Funds, including regulatory compliance monitoring and financial reporting; prepares reports and materials to be supplied to the Board; monitors the activities of the Funds’ Custodian, transfer agent and accountants. Fund Services also serves as the transfer agent and fund accountant to the Funds. U.S. Bank N.A. (the “Custodian”), an affiliate of Fund Services, serves as the Funds’ Custodian.
ALPS Distributors, Inc. (the “Distributor”) acts as the Funds’ principal underwriter in a continuous public offering of the Funds’ shares.
65
VIDENT FUNDS
NOTES TO FINANCIAL STATEMENTS
August 31, 2022 (Continued)
The Custodian and Bank of New York Mellon (“BNY” or the “Sub-Custodian”) (together the “Securities Lending Agents”) act as Vident International Equity Fund’s securities lending agents. The Custodian acts as securities lending agent (the “Securities Lending Agent”) for the Vident Core U.S. Equity Fund and Vident Core U.S. Bond Strategy ETF.
A Trustee and all officers of the Trust are affiliated with the Administrator and Custodian.
NOTE 4 – SECURITIES LENDING
The Funds may lend up to 331⁄3% of the value of the securities in their portfolios to brokers, dealers and financial institutions (but not individuals) under terms of participation in a securities lending programs administered by the Securities Lending Agents. The securities lending agreements require that loans are collateralized at all times in an amount equal to at least 102% of the value of any domestic loaned securities at the time of the loan, plus accrued interest. The use of loans of foreign securities, which are denominated and payable in U.S. dollars, shall be collateralized in an amount equal to 105% of the value of any loaned securities at the time of the loan plus accrued interest. The Funds receive compensation in the form of fees and earn interest on the non-cash and cash collateral. The amount of fees depends on a number of factors including the type of security and length of the loan. The Funds continue to receive interest payments or dividends on the securities loaned during the borrowing period. Gain or loss in the value of securities loaned that may occur during the term of the loan will be for the account of the Funds. The Funds have the right under the terms of the securities lending agreements to recall the securities from the borrower on demand.
The securities lending agreements provide that, in the event of a borrower’s material default, the Securities Lending Agents shall take all actions the Securities Lending Agents deem appropriate to liquidate the collateral, purchase replacement securities at the Securities Lending Agents’ expense, or pay the Fund an amount equal to the market value of the loaned securities, subject to certain limitations which are set forth in detail in the securities lending agreements between the Funds and the Securities Lending Agents.
As of the end of the current fiscal period, the Funds had loaned securities that were collateralized by cash equivalents. The cash collateral is invested by the Securities Lending Agents in accordance with approved investment guidelines. Those guidelines require the cash collateral to be invested in readily marketable, high quality, short-term obligations; however, such investments are subject to risk of payment delays or default on the part of the issuer or counterparty or otherwise may not generate sufficient interest to support the costs associated with securities lending. The Funds could also experience delays in recovering their securities and possible loss of income or value if the borrower fails to return the borrowed securities, although the Funds are indemnified from this risk by contract with the Securities Lending Agents.
66
VIDENT FUNDS
NOTES TO FINANCIAL STATEMENTS
August 31, 2022 (Continued)
As of the end of the current fiscal period, the values of the securities on loan and payable for collateral due to the Securities Lending Agents were as follows:
| Value of | Payable for Collateral | |||||||
| Securities | Received (excludes | |||||||
Fund | on Loan | non-cash collateral) | ||||||
| Vident International Equity Fund | $ | 13,325,169 | $ | 10,024,271 | ||||
| Vident Core U.S. Equity Fund | $ | 98,708,378 | $ | 102,086,625 | ||||
| Vident Core U.S. Bond Strategy ETF | $ | 10,631,699 | $ | 10,918,203 | ||||
The cash collateral is invested in a private fund and repurchase agreements (Vident International Equity Fund only) with selected commercial banks and broker dealers, under which the Fund acquires U.S. Government obligations, as collateral subject to an obligation of the counterparty to repurchase and the Fund to resell the securities at an agreed upon time and price. The Fund, through the Sub-Custodian, receives delivery of the underlying securities collateralizing repurchase agreements. The Fund requires the Sub-Custodian to take possession of all securities held as collateral for repurchase agreements. The Fund and the counterparties are permitted to sell, re-pledge, or use the collateral associated with the transaction and it is the Fund’s policy that the fair value of the collateral be at least equal to 102% of the repurchase price. The value of the related collateral that the Fund received for repurchase agreements exceeded the value of the repurchase agreements at the end of the current fiscal period. The Schedule of Investments for the Fund includes the investments purchased with particular cash collateral holdings as of the end of the current fiscal period. Non-cash collateral received by Vident International Equity Fund was in the form of U.S. Treasury obligations with a value of $4,026,049.
The interest income earned by the Funds on non-cash collateral and investments of cash collateral received from borrowers for the securities loaned to them (“Securities Lending Income”) is reflected in the Funds’ Statements of Operations. Net fees and interest income earned on collateral investments and recognized by the Funds during the current fiscal period, were as follows:
Fund | Fees and Interest Earned | ||||
| Vident International Equity Fund | $ | 228,603 | |||
| Vident Core U.S. Equity Fund | $ | 121,056 | |||
| Vident Core U.S. Bond Strategy ETF | $ | 29,002 | |||
67
VIDENT FUNDS
NOTES TO FINANCIAL STATEMENTS
August 31, 2022 (Continued)
SECURED BORROWINGS
The following represents gross obligations for secured borrowings by the type of collateral pledged and remaining time to maturity.
Vident International Equity Fund
| Remaining Contractual Maturity of the Agreements | ||||||||||||||||||||
| Securities | Overnight | Greater | ||||||||||||||||||
| Lending | and | Up to | 30-90 | than | ||||||||||||||||
Transactions | Continuous | 30 Days | Days | 90 Days | Total | |||||||||||||||
| Repurchase agreements | ||||||||||||||||||||
| collateralized by various | ||||||||||||||||||||
| U.S. government | ||||||||||||||||||||
| obligations | $ | 8,584,221 | $ | — | $ | — | $ | — | $ | 8,584,221 | ||||||||||
Private Funds(a) | $ | 1,440,050 | $ | — | $ | — | $ | — | $ | 1,440,050 | ||||||||||
| U.S. Treasury | ||||||||||||||||||||
| obligations | $ | — | $ | — | $ | — | $ | 4,026,049 | $ | 4,026,049 | ||||||||||
| Total Borrowings | $ | 10,024,271 | $ | — | $ | — | $ | 4,026,049 | $ | 14,050,320 | ||||||||||
Vident Core U.S Equity Fund
| Remaining Contractual Maturity of the Agreements | ||||||||||||||||||||
| Securities | Overnight | Greater | ||||||||||||||||||
| Lending | and | Up to | 30-90 | than | ||||||||||||||||
Transactions | Continuous | 30 Days | Days | 90 Days | Total | |||||||||||||||
Private Funds(a) | $ | 102,086,625 | $ | — | $ | — | $ | — | $ | 102,086,625 | ||||||||||
| Total Borrowings | $ | 102,086,625 | $ | — | $ | — | $ | — | $ | 102,086,625 | ||||||||||
Vident Core U.S Bond Strategy ETF
| Remaining Contractual Maturity of the Agreements | ||||||||||||||||||||
| Securities | Overnight | Greater | ||||||||||||||||||
| Lending | and | Up to | 30-90 | than | ||||||||||||||||
Transactions | Continuous | 30 Days | Days | 90 Days | Total | |||||||||||||||
Private Funds(a) | $ | 10,918,203 | $ | — | $ | — | $ | — | $ | 10,918,203 | ||||||||||
| Total Borrowings | $ | 10,918,203 | $ | — | $ | — | $ | — | $ | 10,918,203 | ||||||||||
(a) | The cash collateral received was invested in the Mount Vernon Liquid Assets Portfolio, LLC as shown on the Schedule of Investments, a short-term investment portfolio with an overnight and continuous maturity. The investment objective is to seek to maximize current income to the extent consistent with the preservation of capital and liquidity and maintain a stable NAV of $1.00 per unit. |
Due to the absence of a master netting agreement related to the Funds’ participation in securities lending, no additional offsetting disclosures have been made on behalf of the Funds.
68
VIDENT FUNDS
NOTES TO FINANCIAL STATEMENTS
August 31, 2022 (Continued)
NOTE 5 – PURCHASES AND SALES OF SECURITIES
During the current fiscal period, purchases and sales of securities by the Funds, excluding short-term securities and in-kind transactions, were as follows:
| Purchases | Sales | |||||||
| Vident International Equity Fund | $ | 290,546,115 | $ | 306,996,421 | ||||
| Vident Core U.S. Equity Fund | $ | 284,347,920 | $ | 283,577,301 | ||||
| Vident Core U.S. Bond Strategy ETF | $ | 980,223,236 | $ | 977,626,329 | ||||
During the current fiscal period, in-kind transactions associated with creations and redemptions were as follows:
| In-Kind Purchases | In-Kind Sales | |||||||
| Vident International Equity Fund | $ | — | $ | 38,545,612 | ||||
| Vident Core U.S. Equity Fund | $ | 78,470,334 | $ | 3,894,309 | ||||
| Vident Core U.S. Bond Strategy ETF | $ | 41,789,693 | $ | 20,265,395 | ||||
There were no purchases or sales of U.S. Government securities in Vident International Equity Fund or Vident Core U.S. Equity Fund during the current fiscal period. Included in the amounts for Vident Core U.S. Bond Strategy ETF there were $764,043,521 of purchases and $750,478,337 of sales of U.S. Government securities during the current fiscal period.
NOTE 6 – INCOME TAX INFORMATION
The components of distributable earnings (accumulated deficit) and cost basis of investments and net unrealized appreciation (depreciation) for federal income tax purposes as of August 31, 2022, were as follows:
| Vident | Vident | Vident | ||||||||||
| International | Core U.S. | Core U.S. Bond | ||||||||||
| Equity Fund | Equity Fund | Strategy ETF | ||||||||||
| Tax cost of investments | $ | 378,608,649 | $ | 543,866,838 | $ | 434,047,042 | ||||||
| Gross tax unrealized appreciation | $ | 20,156,454 | $ | 58,297,752 | $ | 139,714 | ||||||
| Gross tax unrealized depreciation | (51,664,642 | ) | (36,926,975 | ) | (21,438,865 | ) | ||||||
| Net tax unrealized | ||||||||||||
| appreciation/ (depreciation) | (31,508,188 | ) | 21,370,777 | (21,299,151 | ) | |||||||
| Undistributed ordinary income | 5,125,231 | 1,218,360 | 502,506 | |||||||||
| Undistributed long-term capital gain | — | — | — | |||||||||
| Other accumulated gain/(loss) | (150,404,943 | ) | (32,486,559 | ) | (29,529,513 | ) | ||||||
| Distributable earnings/ | ||||||||||||
| (accumulated deficit) | $ | (176,787,900 | ) | $ | (9,897,422 | ) | $ | (50,326,158 | ) | |||
The differences between book and tax-basis cost are attributable to the realization for tax purposes of unrealized gains on investments in passive foreign investment companies and wash sales. A regulated investment company may elect for any taxable year to treat
69
VIDENT FUNDS
NOTES TO FINANCIAL STATEMENTS
August 31, 2022 (Continued)
any portion of any qualified late year loss as arising on the first day of the next taxable year. Qualified late year losses are certain capital and ordinary losses which occur during the portion of the Funds’ taxable year subsequent to October 31 and December 31, respectively. For the taxable year ended August 31, 2022, the Funds did not elect to defer any post- October capital losses or late-year ordinary losses.
As of August 31, 2022, the Funds had the following capital loss carryforwards available for federal income tax purposes, with an indefinite expiration:
| Short-Term | Long-Term | |||||||
| Vident International Equity Fund | $ | (139,495,696 | ) | $ | (10,895,577 | ) | ||
| Vident Core U.S. Equity Fund | $ | (32,486,559 | ) | $ | — | |||
| Vident Core U.S. Bond Strategy ETF | $ | (18,261,395 | ) | $ | (11,268,118 | ) | ||
During the fiscal year ended August 31, 2022, the Funds utilized the following capital loss carryforward that was available as of August 31, 2021:
| Short-Term | Long-Term | |||||||
| Vident International Equity Fund | $ | — | $ | 7,068,276 | ||||
| Vident Core U.S. Equity Fund | $ | 24,713,791 | $ | — | ||||
| Vident Core U.S. Bond Strategy ETF | $ | — | $ | — | ||||
The tax character of distributions paid by the Funds during the fiscal year ended August 31, 2022, was as follows:
| Ordinary Income | Capital Gains | |||||||
| Vident International Equity Fund | $ | 23,767,573 | $ | — | ||||
| Vident Core U.S. Equity Fund | $ | 6,205,670 | $ | — | ||||
| Vident Core U.S. Bond Strategy ETF | $ | 8,604,885 | $ | 800,974 | ||||
The tax character of distributions paid by the Funds during the fiscal year ended August 31, 2021, was as follows:
| Ordinary Income | Capital Gains | |||||||
| Vident International Equity Fund | $ | 15,901,505 | $ | — | ||||
| Vident Core U.S. Equity Fund | $ | 4,772,720 | $ | — | ||||
| Vident Core U.S. Bond Strategy ETF | $ | 6,192,618 | $ | — | ||||
NOTE 7 – SHARE TRANSACTIONS
Shares of the Funds are listed and traded on New York Stock Exchange Arca, Inc. (“NYSE Arca”). Market prices for the shares may be different from their NAV. The Funds issue and redeem shares on a continuous basis at NAV generally in blocks of 100,000 shares. The general blocks of shares issued or redeemed are called “Creation Units.” Creation Units are issued and redeemed principally in-kind for securities included in a specified universe. Once created, shares generally trade in the secondary market at market prices that change throughout the day. Except when aggregated in Creation Units, shares are not redeemable securities of a Fund. Creation Units of a Fund
70
VIDENT FUNDS
NOTES TO FINANCIAL STATEMENTS
August 31, 2022 (Continued)
may only be purchased or redeemed by certain financial institutions (“Authorized Participants”). An Authorized Participant is either (i) a broker-dealer or other participant in the clearing process through the Continuous Net Settlement System of the National Securities Clearing Corporation or (ii) a Depository Trust Company participant and, in each case, must have executed a Participant Agreement with the Distributor. Most retail investors do not qualify as Authorized Participants nor have the resources to buy and sell whole Creation Units.
Therefore, they are unable to purchase or redeem the shares directly from a Fund. Rather, most retail investors may purchase shares in the secondary market with the assistance of a broker and are subject to customary brokerage commissions or fees.
The Funds each currently offer one class of shares, which have no front-end sales loads, no deferred sales charges, and no redemption fees. A fixed transaction fee is imposed for the transfer and other transaction costs associated with the purchase or sale of Creation Units. Vident International Equity Fund charges $5,000; Vident Core U.S. Equity Fund and Vident Core U.S. Bond Strategy ETF each charge $750 for the standard fixed transaction fee, payable to the Custodian. The fixed transaction fee may be waived on transaction orders if the Funds’ Custodian has determined to waive some or all of the costs associated with the order, or another party, such as the Adviser, has agreed to pay such fee. In addition, a variable fee payable to each Fund may be charged on all cash transactions or substitutes for Creation Units of up to a maximum of 2% in Vident International Equity Fund and Vident Core U.S. Equity Fund and up to a maximum of 3% in Vident Core U.S. Bond Strategy ETF as a percentage of the value of the Creation Units subject to the transaction.
Variable fees are imposed to compensate the Funds for the transaction costs associated with the cash transactions fees. Variable fees received by each Fund, if any, are displayed in the Capital Share Transactions sections of the Statements of Changes in Net Assets. Each Fund may issue an unlimited number of shares of beneficial interest, with no par value. Shares of each Fund have equal rights and privileges.
NOTE 8 – RISKS
COVID-19 Risk. The global outbreak of COVID-19 has disrupted economic markets and the prolonged economic impact is uncertain. The operational and financial performance of the issuers of securities in which the Funds invest depends on future developments, including the duration and spread of the outbreak, and such uncertainty may in turn impact the value of the Funds’ investments.
Russia/Ukraine Conflict Risk (Vident International Equity Fund Only). On February 24, 2022, Russia commenced a military attack on Ukraine. The outbreak of hostilities between the two countries could result in more widespread conflict and could have a severe adverse effect on the region and the markets. In addition, sanctions imposed on
71
VIDENT FUNDS
NOTES TO FINANCIAL STATEMENTS
August 31, 2022 (Continued)
Russia by the United States and other countries, and any sanctions imposed in the future could have a significant adverse impact on the Russian economy and related markets. The price and liquidity of investments may fluctuate widely as a result of the conflict and related events. How long such conflict and related events will last and whether it will escalate further cannot be predicted, nor its effect on the Fund.
NOTE 9 – BENEFICIAL OWNERSHIP
The beneficial ownership, either directly or indirectly, of 25% or more of the voting securities of a fund creates a presumption of control of a fund, under section 2(a)(9) of the 1940 Act. As of the end of the current fiscal period, Ronald Blue Trust, Inc., as a beneficial shareholder, owned greater than 25% of the outstanding shares of each Fund.
72
VIDENT FUNDS
REPORT OF INDEPENDENT REGISTERED
PUBLIC ACCOUNTING FIRM
To the Shareholders of Vident Funds and
Board of Trustees of ETF Series Solutions
Opinion on the Financial Statements
We have audited the accompanying statements of assets and liabilities, including the schedules of investments, of Vident International Equity Fund, Vident Core U.S. Equity Fund, and Vident Core U.S. Bond Strategy ETF (the “Funds”), each a series of ETF Series Solutions, as of August 31, 2022, the related statements of operations for the year then ended, the statements of changes in net assets for each of the two years in the period then ended, the related notes, and the financial highlights for each of the five years in the period then ended (collectively referred to as the “financial statements”). In our opinion, the financial statements present fairly, in all material respects, the financial position of each of the Funds as of August 31, 2022, the results of their operations for the year then ended, the changes in net assets for each of the two years in the period then ended, and the financial highlights for each of the five years in the period then ended, in conformity with accounting principles generally accepted in the United States of America.
Basis for Opinion
These financial statements are the responsibility of the Funds’ management. Our responsibility is to express an opinion on the Funds’ financial statements based on our audits. We are a public accounting firm registered with the Public Company Accounting Oversight Board (United States) (“PCAOB”) and are required to be independent with respect to the Funds in accordance with the U.S. federal securities laws and the applicable rules and regulations of the Securities and Exchange Commission and the PCAOB.
We conducted our audits in accordance with the standards of the PCAOB. Those standards require that we plan and perform the audit to obtain reasonable assurance about whether the financial statements are free of material misstatement whether due to error or fraud.
Our audits included performing procedures to assess the risks of material misstatement of the financial statements, whether due to error or fraud, and performing procedures that respond to those risks. Such procedures included examining, on a test basis, evidence regarding the amounts and disclosures in the financial statements. Our procedures included confirmation of securities owned as of August 31, 2022, by correspondence with the custodian and brokers; when replies were not received from brokers, we performed other auditing procedures. Our audits also included evaluating the accounting principles used and significant estimates made by management, as well as evaluating the overall presentation of the financial statements. We believe that our audits provide a reasonable basis for our opinion.
We have served as the auditor of one or more of Vident Advisory, LLC’s investment companies since 2013.

COHEN & COMPANY, LTD.
Milwaukee, Wisconsin
October 27, 2022
73
VIDENT FUNDS
TRUSTEES AND OFFICERS
(Unaudited)
Additional information about each Trustee of the Trust is set forth below. The address of each Trustee of the Trust is c/o U.S. Bank Global Fund Services, 615 E. Michigan Street, Milwaukee, WI 53202.
| Term of | Number of | Other | |||
| Position | Office | Portfolios | Directorships | ||
| Held | and | in Fund | Held by | ||
| Name | with | Length | Complex | Trustee | |
| and Year | the | of Time | Principal Occupation(s) | Overseen | During Past |
of Birth | Trust | Served | During Past Five Years | by Trustee | Five Years |
| Independent Trustees | |||||
| Leonard M. | Lead | Indefinite | Retired; formerly Chief | 54 | Independent |
| Rush, CPA | Indepen- | term; | Financial Officer, | Trustee, | |
| Born: 1946 | dent | since 2012 | Robert W. Baird | Managed | |
| Trustee | & Co. Incorporated | Portfolio Series | |||
| and Audit | (wealth management | (34 portfolios) | |||
| Committee | firm) (2000–2011). | (since 2011). | |||
| Chairman | |||||
| David A. Massart | Trustee | Indefinite | Partner and Managing | 54 | Independent |
| Born: 1967 | term; | Director, Beacon Pointe | Trustee, | ||
| since 2012 | Advisors, LLC (since 2022); | Managed | |||
| Co-Founder, President, and | Portfolio Series | ||||
| Chief Investment Strategist, | (34 portfolios) | ||||
| Next Generation Wealth | (since 2011). | ||||
| Management, Inc. | |||||
| (2005–2021). | |||||
| Janet D. Olsen | Trustee | Indefinite | Retired; formerly Managing | 54 | Independent |
| Born: 1956 | term; | Director and General | Trustee, | ||
| since 2018 | Counsel, Artisan Partners | PPM Funds | |||
| Limited Partnership | (2 portfolios) | ||||
| (investment adviser) | (since 2018). | ||||
| (2000–2013); Executive | |||||
| Vice President and General | |||||
| Counsel, Artisan Partners | |||||
| Asset Management Inc. | |||||
| (2012–2013); Vice President | |||||
| and General Counsel, Artisan | |||||
| Funds, Inc. (investment | |||||
| company) (2001–2012). | |||||
| Interested Trustee | |||||
| Michael A. Castino | Trustee | Indefinite | Senior Vice President, U.S. | 54 | None |
| Born: 1967 | and | term; | Bancorp Fund Services, LLC | ||
| Chairman | Trustee | (since 2013); Managing Director | |||
| since 2014; | of Index Services, Zacks | ||||
| Chairman | Investment Management | ||||
| since 2013 | (2011–2013). |
74
VIDENT FUNDS
TRUSTEES AND OFFICERS
(Unaudited) (Continued)
The officers of the Trust conduct and supervise its daily business. The address of each officer of the Trust is c/o U.S. Bank Global Fund Services, 615 E. Michigan Street, Milwaukee, WI 53202. Additional information about the Trust’s officers is as follows:
| Term of | |||
| Position(s) | Office | ||
| Held | and | ||
| Name | with | Length | |
| and Year | the | of Time | |
of Birth | Trust | Served | Principal Occupation(s) During Past Five Years |
| Kristina R. Nelson | President | Indefinite | Senior Vice President, U.S. Bancorp Fund Services, LLC |
| Born: 1982 | term; | (since 2020); Vice President, U.S. Bancorp Fund Services, | |
| since 2019 | LLC (2014–2020). | ||
| Alyssa M. Bernard | Vice | Indefinite | Vice President, U.S. Bancorp Fund Services, LLC |
| Born: 1988 | President | term; | (since 2021); Assistant Vice President, U.S. Bancorp Fund |
| since 2021 | Services, LLC (2018–2021); Attorney, Waddell & Reed | ||
| Financial, Inc. (2017–2018). | |||
| Cynthia L. Andrae | Chief | Indefinite | Vice President, U.S. Bancorp Fund Services, LLC |
| Born: 1971 | Compliance | term; | (since 2019); Compliance Officer, U.S. Bancorp Fund |
| Officer and | since 2022 | Services, LLC (2015-2019). | |
| Anti-Money | (other roles | ||
| Laundering | since 2021) | ||
| Officer | |||
| Kristen M. Weitzel | Treasurer | Indefinite | Vice President, U.S. Bancorp Fund Services, LLC |
| Born: 1977 | term; | (since 2015); Assistant Vice President, U.S. Bancorp Fund | |
| since 2014 | Services, LLC (2011–2015). | ||
| (other roles | |||
| since 2013) | |||
| Isabella K. Zoller | Secretary | Indefinite | Assistant Vice President, U.S. Bancorp Fund Services, LLC |
| Born: 1994 | term; | (since 2021); Regulatory Administration Attorney, U.S. | |
| since 2021 | Bancorp Fund Services, LLC (since 2019); Regulatory | ||
| (other roles | Administration Intern, U.S. Bancorp Fund Services, LLC | ||
| since 2020) | (2018–2019); Law Student (2016–2019). | ||
| Elizabeth A. | Assistant | Indefinite | Vice President, U.S. Bancorp Fund Services, LLC |
| Winske | Treasurer | term; | (since 2020); Assistant Vice President, U.S. Bancorp Fund |
| Born: 1983 | since 2017 | Services, LLC (2016–2020). | |
| Jason E. Shlensky | Assistant | Indefinite | Assistant Vice President, U.S. Bancorp Fund Services, LLC |
| Born: 1987 | Treasurer | term; | (since 2019); Officer, U.S. Bancorp Fund Services, LLC |
| since 2019 | (2014–2019). | ||
| Jessica L. Vorbeck | Assistant | Indefinite | Officer, U.S. Bancorp Fund Services, LLC (since 2018; |
| Born: 1984 | Treasurer | term; | 2014–2017). |
| since 2020 |
The Statement of Additional Information (“SAI”) includes additional information about the Trustees and is available without charge, upon request, by calling toll free (800) 617-0004, by accessing the SEC’s website at www.sec.gov, or by accessing the Fund’s website at www.videntfunds.com.
75
VIDENT FUNDS
EXPENSE EXAMPLES
For the Six-Months Ended August 31, 2022 (Unaudited)
As a shareholder of the Funds, you incur two types of costs: (1) transaction costs, including brokerage commissions on purchases and sales of Fund shares, and (2) ongoing costs, including management fees and other Fund expenses. This example is intended to help you understand your ongoing costs (in dollars) of investing in the Funds and to compare these costs with the ongoing costs of investing in other funds. The example is based on an investment of $1,000 invested at the beginning of the period and held for the entire period as indicated below in the Expense Example Table.
Actual Expenses
The first line of the table provides information about actual account values based on actual returns and actual expenses. You may use the information in this line, together with the amount you invested, to estimate the expenses that you paid over the period. Simply divide your account value by $1,000 (for example, an $8,600 account value divided by $1,000 = 8.6), then, multiply the result by the number in the first line under the heading entitled “Expenses Paid During the Period” to estimate the expenses you paid on your account during this period.
Hypothetical Example for Comparison Purposes
The second line of the table provides information about hypothetical account values based on a hypothetical return and hypothetical expenses based on the Funds’ actual expense ratio and an assumed rate of return of 5% per year before expenses, which is not the Funds’ actual returns. The hypothetical account values and expenses may not be used to estimate the actual ending account balance or expenses you paid for the period. You may use this information to compare the ongoing costs of investing in the Funds and other funds. To do so, compare this 5% hypothetical example with the 5% hypothetical examples that appear in the shareholder reports of the other funds. Please note that the expenses shown in the table are meant to highlight your ongoing costs only and do not reflect any transactional costs, such as brokerage commissions paid on purchases and sales of Fund shares. Therefore, the second line of the table is useful in comparing ongoing costs only and will not help you determine the relative total costs of owning different funds. If these transactional costs were included, your costs would have been higher.
76
VIDENT FUNDS
EXPENSE EXAMPLES
For the Six-Months Ended August 31, 2022 (Unaudited) (Continued)
Vident International Equity Fund
| Beginning | Ending | Expenses | |
| Account Value | Account Value | Paid During | |
March 1, 2022 | August 31, 2022 | the Period(a) | |
| Actual | $1,000.00 | $ 871.90 | $2.88 |
| Hypothetical | |||
| (5% annual return | |||
| before expenses) | $1,000.00 | $1,022.13 | $3.11 |
| Vident Core U.S. Equity Fund | |||
| Beginning | Ending | Expenses | |
| Account Value | Account Value | Paid During | |
March 1, 2022 | August 31, 2022 | the Period(b) | |
| Actual | $1,000.00 | $ 919.50 | $2.42 |
| Hypothetical | |||
| (5% annual return | |||
| before expenses) | $1,000.00 | $1,022.68 | $2.55 |
| Vident Core U.S. Bond Strategy ETF | |||
| Beginning | Ending | Expenses | |
| Account Value | Account Value | Paid During | |
March 1, 2022 | August 31, 2022 | the Period(c) | |
| Actual | $1,000.00 | $ 916.10 | $1.98 |
| Hypothetical | |||
| (5% annual return | |||
| before expenses) | $1,000.00 | $1,023.14 | $2.09 |
(a) | The dollar amounts shown as expenses paid during the period are equal to the annualized net expense ratio, 0.61%, multiplied by the average account value during the period, multiplied by 184/365, to reflect the period. See Note 3. |
(b) | The dollar amounts shown as expenses paid during the period are equal to the annualized net expense ratio, 0.50%, multiplied by the average account value during the period, multiplied by 184/365, to reflect the period. See Note 3. |
(c) | The dollar amounts shown as expenses paid during the period are equal to the annualized net expense ratio, 0.41%, multiplied by the average account value during the period, multiplied by 184/365, to reflect the period. See Note 3. |
77
VIDENT FUNDS
APPROVAL OF SUB-ADVISORY AGREEMENT &
BOARD CONSIDERATIONS
Pursuant to Section 15(c) of the Investment Company Act of 1940 (the “1940 Act”), at a meeting held on April 20-21, 2022 (the “Meeting”), the Board of Trustees (the “Board”) of ETF Series Solutions (the “Trust”) approved the continuance of the Investment Sub-Advisory Agreement (the “Sub-Advisory Agreement”) by and among Vident Advisory, LLC (the “Adviser”), Vident Investment Advisory, LLC (the “Sub-Adviser”), and the Trust, on behalf of the Vident Core U.S. Bond Strategy ETF, Vident Core U.S. Equity Strategy ETF, and Vident International Equity ETF (each, a “Fund” and, collectively, the “Funds”).
Prior to the Meeting, the Board, including the Trustees who are not parties to the Sub-Advisory Agreement or “interested persons” of any party thereto, as defined in the 1940 Act (the “Independent Trustees”), reviewed written materials (the “Materials”), including information from the Sub-Adviser regarding, among other things: (i) the nature, extent, and quality of the services provided by the Sub-Adviser; (ii) the historical performance of each Fund; (iii) the cost of the services provided and the profits realized by the Sub-Adviser from services rendered to each applicable Fund; (iv) the extent to which any economies of scale realized by the Sub-Adviser in connection with its services to each Fund are shared with its respective Fund shareholders; (v) any other financial benefits to the Sub-Adviser and its affiliates resulting from services rendered to the Funds; and (vi) other factors the Board deemed to be relevant.
The Board also considered that the Sub-Adviser, along with other service providers of the Funds, had provided written updates on the firm over the course of the year with respect to its role as investment sub-adviser to the Funds, and the Board considered that information alongside the Mater Materials in its consideration of whether the Sub-Advisory Agreement should be continued. Additionally, representatives from the Sub-Adviser provided an oral overview of the services provided to each Fund by the Sub-Adviser and additional information about the Sub-Adviser’s personnel and business operations. The Board then discussed the Materials and oral presentations that it had received and any other information that the Board received at the Meeting and deliberated on the approval of continuation of the Sub-Advisory Agreement in light of this information.
Approval of the Continuation of the Sub-Advisory Agreement with the Sub-Adviser
Nature, Extent, and Quality of Services Provided. The Trustees considered the scope of services provided under the Sub-Advisory Agreement, noting that the Sub-Adviser had provided and would continue to provide investment management services to the Funds. In considering the nature, extent, and quality of the services provided by the Sub-Adviser, the Board considered the quality of the Sub-Adviser’s compliance program and past reports from the Trust’s Chief Compliance Officer (“CCO”) regarding the CCO’s review of the Sub-Adviser’s compliance program. The Board also considered its previous experience with the Sub-Adviser providing investment management services to
78
VIDENT FUNDS
APPROVAL OF SUB-ADVISORY AGREEMENT &
BOARD CONSIDERATIONS (Continued)
the Funds, as well as other series of the Trust. The Board noted that it had received a copy of the Sub-Adviser’s registration form and financial statements, as well as the Sub-Adviser’s response to a detailed series of questions that included, among other things, information about the Sub-Adviser’s decision-making process, the background and experience of the firm’s key personnel, and the firm’s compliance policies, marketing practices, and brokerage information.
The Board noted the responsibilities that the Sub-Adviser has as each Fund’s investment sub-adviser, including: responsibility for the general management of the day-to-day investment and reinvestment of the assets of each Fund; determining the daily baskets of deposit securities and cash components; executing portfolio security trades for purchases and redemptions of each Fund’s shares conducted on a cash-in-lieu basis; oversight of general portfolio compliance with applicable securities laws, regulations, and investment restrictions; responsibility for quarterly reporting to the Board; and implementation of Board directives as they relate to the Funds. The Board also considered the Sub-Adviser’s affiliation with the Adviser as well as its resources and capacity with respect to portfolio management, compliance, and operations given the number of funds for which it provides sub-advisory services.
Historical Performance. The Board noted that information regarding each Fund’s performance for various time periods had been included in the Materials. The Board considered each Fund’s past investment performance, including for periods ended December 31, 2021. Because each Fund is designed to track the performance of an index, the Board considered, among other things, the extent to which each such Fund tracked its respective index before fees and expenses. The Board noted that, for the time periods reviewed, each Fund generally performed in-line with its underlying index, except that for the one-year period the Vident International Equity Fund underperformed its underlying index as a result of the costs associated with rebalancing the Fund’s portfolio in response to rebalancings of the Fund’s underlying index.
Cost of Services Provided and Economies of Scale. The Board reviewed the sub-advisory fees paid by the Adviser to the Sub-Adviser for its services to the Funds. The Board considered that the fees paid to the Sub-Adviser are paid by the Adviser, which is an affiliate of the Sub-Adviser. The Board further determined that the fees reflected an appropriate allocation of the advisory fee paid to each firm given the work performed by each firm and noted that the fees were generally in line with those charged by the Sub-Adviser in connection with other funds managed by the Sub-Adviser. The Board also evaluated the compensation and benefits received by the Sub-Adviser from its relationship with the Funds, taking into account analyses of the Sub-Adviser’s profitability with respect to each Fund at various Fund asset levels.
The Board expressed the view that it currently appeared that the Sub-Adviser might realize economies of scale in managing the Funds as assets grow in size. The Board
79
VIDENT FUNDS
APPROVAL OF SUB-ADVISORY AGREEMENT &
BOARD CONSIDERATIONS (Continued)
further noted that because each Fund pays the Adviser a unified fee, any benefits from breakpoints in the sub-advisory fee schedule would accrue to the Adviser, rather than such Fund’s respective shareholders. Consequently, the Board determined that it would monitor fees as the Funds grow to determine whether economies of scale were being effectively shared with the Funds and their shareholders.
Conclusion. No single factor was determinative of the Board’s decision to approve the continuation of the Sub-Advisory Agreement; rather, the Board based its determination on the total mix of information available to it. Based on a consideration of all the factors in their totality, the Board, including the Independent Trustees, unanimously determined that the Sub-Advisory Agreement, including the compensation payable under the agreement, was fair and reasonable to each Fund. The Board, including the Independent Trustees, unanimously determined that the approval of the continuation of the Sub-Advisory Agreement was in the best interests of each Fund and its respective shareholders.
80
VIDENT FUNDS
REVIEW OF LIQUIDITY RISK MANAGEMENT PROGRAM
(Unaudited)
Pursuant to Rule 22e-4 under the Investment Company Act of 1940, the Trust, on behalf of the series of the Trust covered by this shareholder report (the “Series”), has adopted a liquidity risk management program to govern the Trust’s approach to managing liquidity risk. Rule 22e-4 seeks to promote effective liquidity risk management, thereby reducing the risk that a fund will be unable to meet its redemption obligations and mitigating dilution of the interests of fund shareholders. The Trust’s liquidity risk management program is tailored to reflect the Series’ particular risks, but not to eliminate all adverse impacts of liquidity risk, which would be incompatible with the nature of such Series.
The investment adviser to the Series has adopted and implemented its own written liquidity risk management program (the “Program”) tailored specifically to assess and manage the liquidity risk of the Series.
At a recent meeting of the Board of Trustees of the Trust, the Trustees received a report pertaining to the operation, adequacy, and effectiveness of implementation of the Program for the period ended December 31, 2021. The report concluded that the Program is reasonably designed to assess and manage the Series’ liquidity risk and has operated adequately and effectively to manage such risk. The report reflected that there were no liquidity events that impacted the Series’ ability to timely meet redemptions without dilution to existing shareholders. The report further noted that no material changes have been made to the Program since its implementation.
There can be no assurance that the Program will achieve its objectives in the future. Please refer to the prospectus for more information regarding the Series’ exposure to liquidity risk and other principal risks to which an investment in the Series may be subject.
81
VIDENT FUNDS
FEDERAL TAX INFORMATION
(Unaudited)
QUALIFIED DIVIDEND INCOME
For the year ended August 31, 2022, certain dividends paid by the Funds may be subject to a maximum tax rate of 15%, as provided for by the Jobs and Growth Tax Relief Reconciliation Act of 2003. The percentage of dividends declared from ordinary income designated as qualified dividend income was as follows:
| Vident International Equity Fund | 64.80% | |
| Vident Core U.S. Equity Fund | 100.00% | |
| Vident Core U.S. Bond Strategy ETF | 0.00% |
DIVIDENDS RECEIVED DEDUCTION
For corporate shareholders, the percent of ordinary income distributions qualifying for the corporate dividends received deduction for the fiscal year ended August 31, 2022 was as follows:
| Vident International Equity Fund | 0.09% | |
| Vident Core U.S. Equity Fund | 100.00% | |
| Vident Core U.S. Bond Strategy ETF | 0.00% |
SHORT-TERM CAPITAL GAIN
For the year ended August 31, 2022, the percentage of taxable ordinary income distributions that are designated as short-term capital gain distributions under Internal Revenue Section 871(k)(2)(C) for each Fund were as follows:
| Vident International Equity Fund | 0.00% | |
| Vident Core U.S. Equity Fund | 0.00% | |
| Vident Core U.S. Bond Strategy ETF | 0.00% |
82
VIDENT FUNDS
FEDERAL TAX INFORMATION
(Unaudited) (Continued)
FOREIGN TAX CREDIT PASS THROUGH
Pursuant to Section 853 of the Internal Revenue code, the Funds designated the following amounts as foreign taxes paid for the year ended August 31, 2022. Foreign taxes paid for purposes of Section 853 may be less than actual foreign taxes paid for financial statement purposes.
| Portion of | ||||||||||||
| Ordinary Income | ||||||||||||
| Distribution | ||||||||||||
| Creditable | Per | Derived from | ||||||||||
| Foreign Taxes | Share | Foreign | ||||||||||
| Paid | Amount | Sourced Income | ||||||||||
| Vident International Equity Fund | $ | 2,611,991 | $ | 0.16960981 | 98.45 | % | ||||||
| Vident Core U.S. Equity Fund | — | — | — | |||||||||
| Vident Core U.S. Bond Strategy ETF | — | — | — | |||||||||
Foreign taxes paid or withheld should be included in taxable income with an offsetting deduction from gross income or as a credit for taxes paid to foreign governments.
Above figures may differ from those cited elsewhere in this report due to difference in the calculation of income and gains under GAAP purposes and Internal Revenue Service purposes.
Shareholders are strongly advised to consult their own tax advisers with respect to the tax consequences of their investments in the Funds.
83
VIDENT FUNDS
INFORMATION ABOUT PORTFOLIO HOLDINGS
(Unaudited)
The Funds file their complete schedules of portfolio holdings for their first and third fiscal quarters with the SEC on Part F of Form N-PORT. The Funds’ Part F of Form N-PORT is available without charge, upon request, by calling toll-free at (800) 617-0004. Furthermore, you may obtain the Part F of Form N-PORT on the SEC’s website at www.sec.gov. Each Fund’s portfolio holdings are posted on their website at www.videntfunds.com daily.
INFORMATION ABOUT PROXY VOTING
(Unaudited)
A description of the policies and procedures the Funds use to determine how to vote proxies relating to portfolio securities is provided in the SAI. The SAI is available without charge, upon request, by calling toll-free at (800) 617-0004, by accessing the SEC’s website at www.sec.gov, or by accessing the website at www.videntfunds.com.
Information regarding how the Funds voted proxies relating to portfolio securities during the period ending June 30 is available by calling toll-free at (800) 617-0004 or by accessing the SEC’s website at www.sec.gov.
FREQUENCY DISTRIBUTION OF PREMIUMS AND DISCOUNTS
(Unaudited)
Information regarding how often shares of the Funds trade on the exchange at a price above (i.e., at a premium) or below (i.e., at a discount) the NAV of the Funds is available, without charge, on the Funds’ website at www.videntfunds.com.
84
(This Page Intentionally Left Blank.)
Adviser
Vident Advisory, LLC
1125 Sanctuary Parkway, Suite 515
Alpharetta, Georgia 30009
Sub-Adviser
Vident Investment Advisory, LLC
1125 Sanctuary Parkway, Suite 515
Alpharetta, Georgia 30009
Index Provider
Vident Financial, LLC
1125 Sanctuary Parkway, Suite 515
Alpharetta, Georgia 30009
Distributor
ALPS Distributors, Inc.
1290 Broadway, Suite 1000
Denver, Colorado 80203
Custodian
U.S. Bank National Association
1555 North Rivercenter Drive, Suite 302
Milwaukee, Wisconsin 53212
Transfer Agent
U.S. Bancorp Fund Services, LLC
615 East Michigan Street
Milwaukee, Wisconsin 53202
Independent Registered Public
Accounting Firm
Cohen & Company, Ltd.
342 North Water Street, Suite 830
Milwaukee, Wisconsin 53202
Legal Counsel
Morgan, Lewis & Bockius LLP
1111 Pennsylvania Avenue NW
Washington, DC 20004-2541
| Vident International Equity Fund | Vident Core U.S. Equity Fund | ||
| Symbol – VIDI | Symbol – VUSE | ||
| CUSIP – 26922A404 | CUSIP – 26922A503 |
Vident Core U.S. Bond Strategy ETF
Symbol – VBND
CUSIP – 26922A602
| (b) | Not applicable. |
Item 2. Code of Ethics.
The registrant has adopted a code of ethics that applies to the registrant’s principal executive officer and principal financial officer. The registrant has not made any substantive amendments to its code of ethics during the period covered by this report. The registrant has not granted any waivers from any provisions of the code of ethics during the period covered by this report.
A copy of the registrant’s Code of Ethics is filed herewith.
Item 3. Audit Committee Financial Expert.
The registrant’s board of trustees has determined that there is at least one audit committee financial expert serving on its audit committee. Mr. Leonard Rush is the “audit committee financial expert” and is considered to be “independent” as each term is defined in Item 3 of Form N‑CSR.
Item 4. Principal Accountant Fees and Services.
The registrant has engaged its principal accountant to perform audit services, audit-related services, tax services and other services during the past two fiscal years. “Audit services” refer to performing an audit of the registrant's annual financial statements or services that are normally provided by the accountant in connection with statutory and regulatory filings or engagements for those fiscal years. “Audit-related services” refer to the assurance and related services by the principal accountant that are reasonably related to the performance of the audit. “Tax services” refer to professional services rendered by the principal accountant for tax compliance, tax advice, and tax planning. There were no “Other services” provided by the principal accountant. The following table details the aggregate fees billed or expected to be billed for each of the last two fiscal years for audit fees, audit-related fees, tax fees and other fees by the principal accountant.
Vident International Equity Fund
| FYE 8/31/2022 | FYE 8/31/2021 | |
Audit Fees | $16,000 | $16,000 |
Audit-Related Fees | $0 | $0 |
Tax Fees | $ 3,500 | $ 3,500 |
All Other Fees | $0 | $0 |
Vident Core U.S. Equity Fund
| FYE 8/31/2022 | FYE 8/31/2021 | |
Audit Fees | $14,500 | $14,500 |
Audit-Related Fees | $0 | $0 |
Tax Fees | $ 3,500 | $ 3,500 |
All Other Fees | $0 | $0 |
Vident Core U.S. Bond Strategy ETF
| FYE 8/31/2022 | FYE 8/31/2021 | |
Audit Fees | $16,000 | $16,000 |
Audit-Related Fees | $0 | $0 |
Tax Fees | $ 3,500 | $ 3,500 |
All Other Fees | $0 | $0 |
The audit committee has adopted pre-approval policies and procedures that require the audit committee to pre‑approve all audit and non‑audit services of the registrant, including services provided to any entity affiliated with the registrant.
The percentage of fees billed by Cohen & Company, Ltd. applicable to non-audit services pursuant to waiver of pre-approval requirement were as follows:
Vident International Equity Fund
| FYE 8/31/2022 | FYE 8/31/2021 | |
Audit-Related Fees | 0% | 0% |
Tax Fees | 0% | 0% |
All Other Fees | 0% | 0% |
Vident Core U.S. Equity Fund
| FYE 8/31/2022 | FYE 8/31/2021 | |
Audit-Related Fees | 0% | 0% |
Tax Fees | 0% | 0% |
All Other Fees | 0% | 0% |
Vident Core U.S. Bond Strategy ETF
| FYE 8/31/2022 | FYE 8/31/2021 | |
Audit-Related Fees | 0% | 0% |
Tax Fees | 0% | 0% |
All Other Fees | 0% | 0% |
All of the principal accountant’s hours spent on auditing the registrant’s financial statements were attributed to work performed by full‑time permanent employees of the principal accountant.
The following table indicates the non-audit fees billed or expected to be billed by the registrant’s accountant for services to the registrant and to the registrant’s investment adviser (and any other controlling entity, etc.—not sub-adviser) for the last two years.
Vident International Equity Fund
Non-Audit Related Fees | FYE 8/31/2022 | FYE 8/31/2021 |
Registrant | N/A | N/A |
Registrant’s Investment Adviser | N/A | N/A |
Vident Core U.S. Equity Fund
Non-Audit Related Fees | FYE 8/31/2022 | FYE 8/31/2021 |
Registrant | N/A | N/A |
Registrant’s Investment Adviser | N/A | N/A |
Vident Core U.S. Bond Strategy ETF
Non-Audit Related Fees | FYE 8/31/2022 | FYE 8/31/2021 |
Registrant | N/A | N/A |
Registrant’s Investment Adviser | N/A | N/A |
The audit committee of the board of trustees has considered whether the provision of non-audit services that were rendered to the registrant’s investment adviser is compatible with maintaining the principal accountant’s independence and has concluded that the provision of such non-audit services by the accountant has not compromised the accountant’s independence.
The registrant has not been identified by the U.S. Securities and Exchange Commission as having filed an annual report issued by a registered public accounting firm branch or office that is located in a foreign jurisdiction where the Public Company Accounting Oversight Board is unable to inspect or completely investigate because of a position taken by an authority in that jurisdiction.
The registrant is not a foreign issuer.
Item 5. Audit Committee of Listed Registrants.
| (a) | The registrant is an issuer as defined in Rule 10A-3 under the Securities Exchange Act of 1934, (the “Act”) and has a separately-designated standing audit committee established in accordance with Section 3(a)(58)(A) of the Act. The independent members of the committee are as follows: Leonard M. Rush, David A. Massart, and Janet D. Olsen. |
| (b) | Not applicable. |
Item 6. Investments.
Schedule of Investments is included as part of the report to shareholders filed under Item 1 of this Form.
Item 7. Disclosure of Proxy Voting Policies and Procedures for Closed-End Management Investment Companies.
Not applicable to open-end investment companies.
Item 8. Portfolio Managers of Closed-End Management Investment Companies.
Not applicable to open-end investment companies.
Item 9. Purchases of Equity Securities by Closed‑End Management Investment Company and Affiliated Purchasers.
Not applicable to open-end investment companies.
Item 10. Submission of Matters to a Vote of Security Holders.
There have been no material changes to the procedures by which shareholders may recommend nominees to the registrant’s board of trustees.
Item 11. Controls and Procedures.
| (a) | The Registrant’s President (principal executive officer) and Treasurer (principal financial officer) have reviewed the Registrant's disclosure controls and procedures (as defined in Rule 30a-3(c) under the Investment Company Act of 1940 (the “Act”)) as of a date within 90 days of the filing of this report, as required by Rule 30a-3(b) under the Act and Rules 13a-15(b) or 15d‑15(b) under the Securities Exchange Act of 1934. Based on their review, such officers have concluded that the disclosure controls and procedures are effective in ensuring that information required to be disclosed in this report is appropriately recorded, processed, summarized and reported and made known to them by others within the Registrant and by the Registrant’s service provider. |
| (b) | There were no changes in the Registrant's internal control over financial reporting (as defined in Rule 30a-3(d) under the Act) that occurred during the period covered by this report that has materially affected, or is reasonably likely to materially affect, the Registrant's internal control over financial reporting. |
Item 12. Disclosure of Securities Lending Activities for Closed-End Management Investment Companies.
Not applicable to open-end investment companies.
Item 13. Exhibits.
(3) Any written solicitation to purchase securities under Rule 23c‑1 under the Act sent or given during the period covered by the report by or on behalf of the registrant to 10 or more persons. Not applicable to open-end investment companies.
(4) Change in registrant’s independent public accountant. There was no change in the registrant’s independent public accountant for the period covered by this report.
SIGNATURES
Pursuant to the requirements of the Securities Exchange Act of 1934 and the Investment Company Act of 1940, the registrant has duly caused this report to be signed on its behalf by the undersigned, thereunto duly authorized.
(Registrant) ETF Series Solutions
By (Signature and Title /s/ Kristina R. Nelson
Kristina R. Nelson, President (principal executive officer)
Date 11/4/2022
Pursuant to the requirements of the Securities Exchange Act of 1934 and the Investment Company Act of 1940, this report has been signed below by the following persons on behalf of the registrant and in the capacities and on the dates indicated.
By (Signature and Title)* /s/ Kristina R. Nelson
Kristina R. Nelson, President (principal executive officer)
Date 11/4/2022
By (Signature and Title)* /s/ Kristen M. Weitzel
Kristen M. Weitzel, Treasurer (principal financial officer)
Date 11/4/2022
* Print the name and title of each signing officer under his or her signature.