united states
securities and exchange commission
washington, d.c. 20549
form n-csr
certified shareholder report of registered management
investment companies
Investment Company Act file number 811-22680
Ultimus Managers Trust
(Exact name of registrant as specified in charter)
225 Pictoria Drive, Suite 450 Cincinnati, Ohio 45246
(Address of principal executive offices) (Zip code)
Khimmara Greer
Ultimus Fund Solutions, LLC 225 Pictoria Drive, Suite 450 Cincinnati, OH 45246
(Name and address of agent for service)
Registrant's telephone number, including area code: (513) 587-3400
Date of fiscal year end: 10/31
Date of reporting period: 10/31/2022
Form N-CSR is to be used by management investment companies to file reports with the Commission not later than 10 days after the transmission to stockholders of any report that is required to be transmitted to stockholders under Rule 30e-1 under the Investment Company Act of 1940 (17 CFR 270.30e-1). The Commission may use the information provided on Form N-CSR in its regulatory, disclosure review, inspection, and policymaking roles.
A registrant is required to disclose the information specified by Form N-CSR, and the Commission will make this information public. A registrant is not required to respond to the collection of information contained in Form N-CSR unless the Form displays a currently valid Office of Management and Budget ("OMB") control number. Please direct comments concerning the accuracy of the information collection burden estimate and any suggestions for reducing the burden to the Secretary, Securities and Exchange Commission, 450 Fifth Street, NW, Washington, DC 20549-0609. The OMB has reviewed this collection of information under the clearance requirements of 44 U.S.C. § 3507.
Item 1. Reports to Stockholders.
| (a) |
| WESTWOOD FUNDS |
| TABLE OF CONTENTS |
| Shareholder Letter | 1 |
| Schedules of Investments | |
| Westwood Quality Value Fund | 24 |
| Westwood Quality MidCap Fund | 26 |
| Westwood Quality SMidCap Fund | 28 |
| Westwood Quality SmallCap Fund | 30 |
| Westwood Quality AllCap Fund | 32 |
| Westwood Total Return Fund | 34 |
| Westwood Income Opportunity Fund | 39 |
| Westwood High Income Fund | 45 |
| Westwood Alternative Income Fund | 51 |
| Westwood SmallCap Growth Fund | 58 |
| Statements of Assets and Liabilities | 61 |
| Statements of Operations | 64 |
| Statements of Changes in Net Assets | 67 |
| Financial Highlights | 76 |
| Notes to Financial Statements | 86 |
| Report of Independent Registered Public Accounting Firm | 108 |
| About Your Funds’ Expenses | 110 |
| Other Information | 115 |
| Other Federal Tax Information | 115 |
| Trustees and Officers of Ultimus Managers Trust | 117 |
| WESTWOOD FUNDS (Unaudited) |
October 31, 2022
Dear Shareholders,
The previous 12 months can be summed up in three words: “massive economic change.” Over the last year, both the stock and bond markets as well as investors “psyches” have all executed an about-face. At the same time, the American economy went from ultra-low interest rates and a healthy economic backdrop to investors gauging just how deep a potential recession will be in 2023. The Federal Reserve remains in the driver’s seat, but the car (economic growth) may be running low on fuel as roads are expected to remain bumpy with a range of potential outcomes next year. The good news is that consumers remain resilient, and this environment is precisely where our strategies typically seek to outperform, given the emphasis on quality for our Value products and our bottom-up, tactical approach across our Multi-Asset suite.
Where Are We Now?
This time last year, risk was on and growing inflation risks were deemed almost necessary to keep the economy firing as most bet above-trend price pressures to be transitory and would fade with the pandemic. Unfortunately, that post-pandemic bullish momentum was stifled abruptly by a series of near-simultaneous events that flipped the risk switch quickly to “off.” As stocks began their wide-ranging selloff soon after the start of the year, Russia’s invasion of Ukraine not only introduced a grey swan into the mix but added to already fragile supply chain stress and quickly worsened global inflation as critical commodity prices, namely food and energy, soared. Growing inflationary fears, abnormally strong consumer data and a resilient labor market have also forced the Fed to enact one of the most aggressive rate hike trajectories in history, driving rates from nearly 0% in January to 3.8% in November.
This series of events and quick-shifting investor sentiment battered the S&P 500 early in the year. High-valuation growth stocks, largely tech names, took the worst of the blow, but all major stock indexes had breached the widely accepted, deep correction level of 20% or more. Equities were able to recover more than half of that correction by mid-August, only to fall further by mid-October. Above-average market volatility persisted throughout the last 12 months.
Stocks, Bonds and Commodities
Investors continued to exit riskier interest rate sensitive securities and moved into more safe-haven investments such as utilities, value stocks and short-term money market funds. The surging U.S. dollar is also contributing to earnings stress as a large portion of S&P 500 revenues are derived outside our borders. This means that foreign earnings reported domestically will be worth less, further reducing earning growth potential.
Stocks have again recovered some of their ground since October, but it’s critical that investors acknowledge the headwinds that America faces and adjust their approach to the markets with a different set of tactics that may have been applied over the last decade or so.
There is no doubt the current environment is certainly atypical and, in many ways, unprecedented. The effects of the Fed’s hawkish actions are being felt across the economy, from a (quiet) housing correction to swaths of layoffs now beginning in what’s been a relatively resilient labor market. Corporate earnings in the most recent third quarter showed a continued deterioration of growth, with the earnings expansion rate just around 2%, the lowest reported by the S&P 500 since Q3 2020. The forward 12-month P/E ratio for the S&P 500 is around 17, which is below the five-year average (18.5) but is very close to the 10-year average (17.1).
In fixed income, government bond yields across all time periods trended higher (prices fell) for much of the year as interest rate trajectories steepened. From a global perspective, the losses in government bonds during the first half of 2022 were some of the deepest in history; corporate bond prices also logged losses not seen in decades while yields obviously soared. Though the early portion of the third quarter offered some reprieve, corporate bonds
1
| WESTWOOD FUNDS (Unaudited) |
continued their march lower as the period ended. We believe there are opportunities in corporate bonds but remain neutral with a focus on higher-quality and investment grade selections in our multi-asset funds.
One inflationary respite could come from materials as traders continued to sell wide swaths of commodities such as gold, silver, lumber, metals and more as demand fears and a strengthening dollar added pressure. We see these trends continuing, except for oil and natural gas, which are likely to remain elevated and volatile due to complex logistical challenges related to the Russia-Ukraine war and demand for heat and electricity going into winter.
Global Markets: Risk Off
In Europe, many of the same headwinds as seen in the U.S. are mounting, such as supply chain disruptions and rising prices from energy to food and more, plus the region is facing an energy crisis related to the Russia-Ukraine conflict. The European Central Bank has also been raising its key borrowing rates but is slowing its pace as the bloc’s economies have weakened sharply. Asian markets are dealing with their own set of unique, varied challenges that add a level of murkiness to global growth estimates for the coming year.
Domestically, the Fed has some tough decisions to make as data still shows near-record-low unemployment and 40-year highs in inflation. The reality is that a greater level of uncertainty prevails, and investors continue to scour data, seeking hard-to-find clues on where the economy and markets are headed from here. Increased chatter and the growing probability of a current or coming recession increased dramatically during the back half of the year as data continues to support continued above-trend inflation. The latest comments and forward guidance from the Fed and Chairman Powell specifically, also suggested that a recession will be necessary to get the Fed’s inflation target back to 2%.
For investors, the main market stressor is not just inflationary impacts, but also the combative actions being taken to control it, which have already severely affected and will continue to impact consumers and corporate earnings. The Consumer Price Index has begun to slow, but still remains extremely high. Energy price declines in the back half of the year contributed heavily to the reductions, but food and other even more durable prices remain elevated.
The Russia-Ukraine war remains a wildcard that continues to complicate the task and effectiveness of central banks’ actions. The war’s effects add to logistical troubles, corporate earnings (as many western companies have withdrawn from doing business in Russia) and food supply and costs. We believe that the conflict is likely to be drawn out, driving headline risk and continued disturbances, both temporary and permanent, in global trade and logistics.
The Road Ahead
The current market environment continues to produce dislocations with respect to valuation and increased levels of fundamental skepticism that play to our strength. Now, more than ever, highly tactical and active investment approaches, with high conviction active selections and tactical balanced allocations, will be needed to help reduce volatility and produce alpha. As it has for over 30 years, our investment process continues to seek out mispriced opportunities where fundamental analysis can uncover value being missed in the current market environment while maintaining a strong culture of risk management with a focus on limiting potential downside risks.
Investors will need to rethink high-level strategy and tactics to best capture alpha in what’s likely to be more of a range-bound broad market in equities and bonds. Washington has few arrows in its quiver to address current market risks as any further stimulus is likely to stoke inflation, which is the one thing that MUST be quelled. We see a continued slowdown in earnings growth for the S&P 500 and expect continued volatility for both equities and fixed income in the coming months as effects of the Fed’s bellicose stance toward inflation and subsequent economy-slowing actions are realized, along with an increased number of market participants adjusting forecasts to account for those effects.
2
| WESTWOOD FUNDS (Unaudited) |
We believe that interest rates are in the process of peaking and bonds are beginning to find a bottom, providing attractive opportunities across our Multi-Asset suite. Following the September meeting, the Fed supported our interest rate targets. The median Federal Open Market Committee (FOMC) member thinks the Fed’s target policy rate range will still be 4.50% to 4.75% (terminal rate) by the end of next year, implying that the Fed doesn’t plan to deliver any rate cuts until 2024. With that, we see two- to five -year yields rising, while the longer duration 10-year is likely to remain range bound, effectively flattening the curve as tightening impacts growth outlooks.
As economic growth decelerates and the probability of a recession increases, high quality characteristics, which are a key feature across our fund complex, are likely to be an important driver of excess returns. We also continue to like companies that maintain pricing power to manage through an inflationary environment and have the ability to reduce the impact of input costs or to pass those costs on to their customers. In summary, we continue to stick to our knitting and serving our investors during challenging market periods like we are in today.
Thank you for your trust.
Sincerely,
The Investment Team
The Westwood Funds
The information contained herein represents the views of the manager at a specific point in time and is based on information believed to be reliable. No representation or warranty is made concerning the accuracy or completeness of any data compiled herein. Any statements non-factual in nature constitute only current opinion, which is subject to change. Any statements concerning financial market trends are based on current market conditions, which will fluctuate. Past performance is not indicative of future results. All information provided herein is for informational purposes only and is not intended to be, and should not be interpreted as, an offer, solicitation, or recommendation to buy or sell or otherwise invest in any of the securities/sectors/countries that may be mentioned. Investing involves risk, including possible loss of principal. A discussion of each fund’s performance during the annual period ended October 31, 2022, is presented below.
Westwood Quality Value Fund
The performance of the Westwood Quality Value Fund for the periods ended October 31, 2022, was as follows:
| 2022 | ||
| 6 Months | Fiscal Year | |
| Westwood Quality Value Fund – Institutional Shares (WHGLX) | -0.40% | -4.37% |
| Westwood Quality Value Fund – A Shares (WWLAX)* | -0.47% | -4.64% |
| Westwood Quality Value Fund – C Shares (WWLCX) | -0.89% | -5.36% |
| Russell 1000 Value Index | -3.19% | -7.00% |
| * | Without sales charge |
The performance data quoted represents past performance. Past performance does not guarantee future results. The investment return and principal value of an investment will fluctuate so that an investor’s shares, when redeemed, may be worth more or less than their original cost and current performance may be lower or higher than the performance quoted. The Adviser has contractually agreed to waive fees and reimburse expenses until March 1, 2024. In the absence of current fee waivers, total return and yield would have been reduced.
3
| WESTWOOD FUNDS (Unaudited) |
Positive stock selection and allocation in Health Care, Commercial Services and Consumer Discretionary were the top three contributors to relative performance that beat the benchmark in the 12-month period. Global crude supply shortages and increasing demand helped drive oil and fuel prices higher, and in turn generated alpha in our energy-related holdings such as ConocoPhillips, Chevron, Valero Energy and EOG Resources. McKesson continued to benefit from strong health care demand and saw Q4 revenues for its U.S. Pharmaceutical and Specialty Solutions jump 14% year over year, and its fourth-quarter earnings results beat consensus estimates, rising 38% year over year. UnitedHealthcare was also a standout both in the portfolio and among its industry peers as the company reported $15.35 billion in profit through the first three reported quarters of 2022. Its Optum subsidiary has been a significant growth engine for the company throughout the year.
Negative stock selection in Industrials and Information Technology and Consumer Staples were detractors from relative performance. Vertiv Holdings, which is focused on IT/data infrastructure, experienced heavy selling after its fourth-quarter earnings report lagged consensus estimates, while Teradyne, Inc. failed to impress investors (despite fairly strong earnings) with its weaker-than-expected outlook. Meta Platforms struggled as the company overspent on its metaverse vision while other revenue streams slowed. Shares of Alphabet also fell late in the period as investors shifted away from growth stocks as rate-hike trajectories sharpened.
Westwood Quality MidCap Fund
The performance of the Westwood Quality MidCap Fund for the period ended October 31, 2022, was as follows:
| 2022 | ||
| Fiscal Year/Since | ||
| 6 Months | Inception* | |
| Westwood Quality MidCap Fund – Institutional Shares (WWMCX) | -1.03% | -3.60% |
| Russell MidCap Value Total Return Index | -5.61% | -7.36% |
| * | Fiscal Year or Since Inception, whichever is shorter |
WWMCX Inception Date: 11/30/2021
The performance data quoted represents past performance. Past performance does not guarantee future results. The investment return and principal value of an investment will fluctuate so that an investor’s shares, when redeemed, may be worth more or less than their original cost and current performance may be lower or higher than the performance quoted. The Adviser has contractually agreed to waive fees and reimburse expenses until March 1, 2024.
Tactical allocation was the key to overall success for the Fund’s standout 3.76% outperformance relative to the benchmark in the period. Relative performance was aided most by positive allocation to the Energy sector, favorable stock selection within the Health Care sector and a blend of both benefits in Consumer Staples. McKesson was our best-performing position as the company continued to benefit from strong health care demand and saw Q4 revenues for its U.S. Pharmaceutical and Specialty Solutions jump 14% year over year, and its fourth-quarter earnings results beat consensus estimates, rising 38% year over year. Three of the top five contributors to return all were scattered throughout different segments of the Energy sector. Holdings included Diamondback Energy, Devon Energy and Valero Energy — all benefiting as global crude and natural gas supply remained tight amid the ongoing Russia-Ukraine war, while demand for refined fuel-oils and liquefied natural gas helped drive oil and fuel prices higher… all adding to positive earnings and stock price growth in many of our energy-related holdings. Profitability in downstream (delivery to retail customers) has also been, on average, increasing as refiners, marketers and resellers of distillates have seen consumer demand stable even as retail prices rise to record levels.
Portfolio performance detractors were led by unfavorable selection in Materials as well as unfavorable selection and overallocation to Materials. Popular consumer delivery company 1-800-FLOWERS.COM saw its revenue drop 1% in its fiscal third quarter as consumers shifted spending in a post-COVID-19 era, while American broadband
4
| WESTWOOD FUNDS (Unaudited) |
provider Cable One saw its shares decline as its stable earnings growth did not meet investors’ expectations; growing competition is also a concern. Automated test equipment maker, Teradyne, Inc., also failed to impress investors, as its three fairly strong earnings reports, which came in better than consensus estimates, were offset by its weaker-than-expected outlook and semiconductor sector risks.
Westwood Quality SMidCap Fund
The performance of the Westwood Quality SMidCap Fund for the periods ended October 31, 2022, was as follows:
| 2022 | ||
| 6 Months | Fiscal Year | |
| Westwood Quality SMidCap Fund – Institutional Shares (WHGMX) | 0.62% | -9.64% |
| Westwood Quality SMidCap Fund – Ultra Shares (WWSMX) | 0.70% | -9.41% |
| Russell 2500 Value Index | -4.18% | -10.66% |
The performance data quoted represents past performance. Past performance does not guarantee future results. The investment return and principal value of an investment will fluctuate so that an investor’s shares, when redeemed, may be worth more or less than their original cost and current performance may be lower or higher than the performance quoted. The Adviser has contractually agreed to waive fees and reimburse expenses until March 1, 2024.
Positive allocation and stock selection in Information Technology and Real Estate combined with stock selection prowess in Materials and Industrials all aided relative performance, allowing the Fund to outperform the benchmark. By remaining underweight and hyper targeted in the Information Technology sector, we were able to produce near positive returns in a sector that struggled for much of the year. Ironically, our top-performing positions were Diamondback Energy and PDC Energy, which both benefited from elevated crude and natural gas prices, and increased production demands domestically. First Horizon Corporation was also a top contributor to performance as the regional bank remained isolated from many of the global risks that its larger peers had to endure. The bank was able to focus on consumer lending and leverage rising rates to add to profitability.
Negative stock selection in Commercial Services, Financials and Consumer Discretionary were the largest detractors from relative performance. Popular consumer delivery company 1-800-FLOWERS.COM was our top detractor as the company experienced back-to-back earnings misses as consumers shifted spending and explored alternatives in a post-COVID-19 era. Automotive parts maker Holley Inc. saw its shares struggle as it continued to grapple with increased input costs and logistical snares, while Radius Global Infrastructure, a top international aggregator of rental streams, experienced volatility in share price (and earnings results) later in the period as the sector as a whole struggled (the company did deliver a positive earnings beat just after this reporting period ended). Investment banking firm Perella Weinberg disappointed investors as a reduction in domestic mergers and acquisition activity added concerns about near-term future growth weighed on shares.
5
| WESTWOOD FUNDS (Unaudited) |
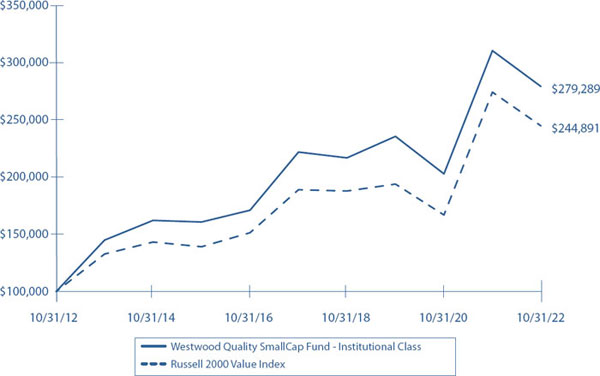
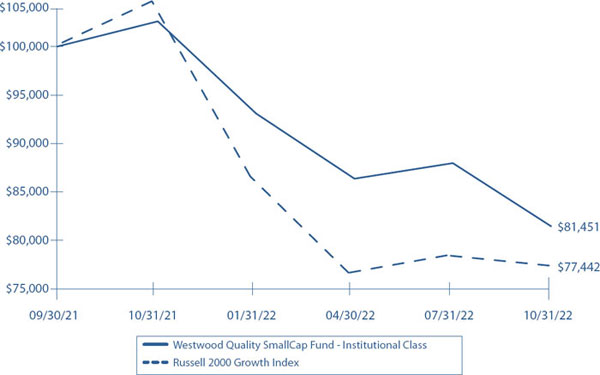
Westwood Quality SmallCap Fund
The performance of the Westwood Quality SmallCap Fund for the periods ended October 31, 2022, was as follows:
| 2022 | ||
| 6 Months | Fiscal Year | |
| Westwood Quality SmallCap Fund – Institutional Shares (WHGSX) | 2.50% | -10.08% |
| Westwood Quality SmallCap Fund – A Shares (WHGAX)* | 2.45% | -10.15% |
| Westwood Quality SmallCap Fund – C Shares (WHGCX) | 2.08% | -10.84% |
| Westwood Quality SmallCap Fund – Ultra Shares (WWSYX) | 2.60% | -9.91% |
| Russell 2000 Value Index | -1.35% | -10.73% |
| * | Without sales charge |
The performance data quoted represents past performance. Past performance does not guarantee future results. The investment return and principal value of an investment will fluctuate so that an investor’s shares, when redeemed, may be worth more or less than their original cost and current performance may be lower or higher than the performance quoted. The Adviser has contractually agreed to waive fees and reimburse expenses until March 1, 2024. In the absence of current fee waivers, total return and yield would have been reduced.
Clever allocation was the key to success for the Fund’s outperformance relative to the benchmark in the period. Positive stock selection in Industrials, Materials and Energy were the top sectors adding to relative performance. Our holdings in PDC Energy contributed to returns as energy prices rose due to global supply shortages, stable demand and improved margins. HVAC provider Comfort Systems USA was also a key contributor as demand for product remained strong and backlogs increased; on a same -store basis, backlog increased from $1.94 billion as of Sept. 30, 2021 to $3.04 billion as of Sept. 30, 2022. In the face of rising price pressure, Twinkie maker Hostess Brands was still able to beat analyst estimates, fueled by demonstrable consumption momentum across its sweet baked goods and cookies portfolio, year-over-year pricing and favorable investor sentiment toward staples. South Jersey Industries also drew added attraction from investors who continued to move into the Utility sector as a volatility shelter, while the company was also able to capture profits amid a rising energy cost landscape.
Financials, Consumer Discretionary and Information Technologies were the three detractors from relative performance due mainly to allocation risk, while the Financials sector underperformed mainly due to unfavorable stock selection. From a position standpoint, REPAY shares were our largest detractor during the period as future earnings growth and increasing competition both weighed heavily on shares and sentiment. Triumph Bancorp shares struggled despite a rising rate environment on concerns around consumer health. In the third quarter, the company announced a strategic reorganization of its executive management team to better align with future growth priorities. Radius Global Infrastructure, a top international aggregator of rental streams, also experienced volatility in its share price (and earnings results) later in the period as the sector as a whole struggled (the company did deliver a positive earnings beat just after this reporting period ended).
6
| WESTWOOD FUNDS (Unaudited) |
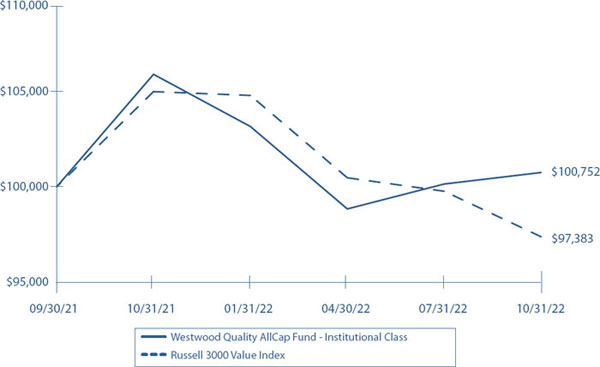
Westwood Quality AllCap Fund
The performance of the Westwood Quality AllCap Fund for the periods ended October 31, 2022, was as follows:
| 2022 | ||
| 6 Months | Fiscal Year | |
| Westwood Quality AllCap Fund – Institutional Shares (WQAIX) | 1.93% | -4.86% |
| Westwood Quality AllCap Fund – Ultra Shares (WQAUX) | 1.83% | -4.81% |
| Russell 3000 Value Index | -3.08% | -7.25% |
The performance data quoted represents past performance. Past performance does not guarantee future results. The investment return and principal value of an investment will fluctuate so that an investor’s shares, when redeemed, may be worth more or less than their original cost and current performance may be lower or higher than the performance quoted. The Adviser has contractually agreed to waive fees and reimburse expenses until March. 1, 2024. In the absence of current fee waivers, total return and yield would have been reduced.
Overall, the Fund handily outperformed the benchmark over the one-year period, returning -4.86% versus -7.25% for the Russell 3000 Index. Relative performance was aided by positive stock selection and heavier exposure within the Materials and Health Care sectors, along with reduced exposure to the volatile Information Technology space. Top individual contributors included McKesson, who continued to benefit from strong health care demand and saw Q4 revenues for its U.S. Pharmaceutical and Specialty Solutions jump 14% year over year, with its fiscal fourth-quarter earnings results beating consensus estimates, rising 38% year over year. Though the energy sector was volatile and bifurcated, surging energy prices at the wholesale and retail levels helped fuel performance in hydrocarbon exploration companies Pioneer Natural Resources and Devon Energy, rounding out our top three equity positions.
Unfavorable selection and allocation in Industrials, Energy, Financials and Consumer Staples sectors detracted from relative fund performance. Top individual detractors included Radius Global Infrastructure, a top international aggregator of rental streams, which experienced volatility in share price (and earnings results) later in the period as the sector as a whole struggled (the company did deliver positive earnings beat just after this reporting period ended). Betting big on the metaverse, Meta Platforms’ shares lagged as the company overspent on its vision while other revenue streams slowed. And as car inventories grew, and auto demand waned from pandemic highs, IAA Inc. failed to gain investors’ attention as earnings failed to meet consensus expectations.
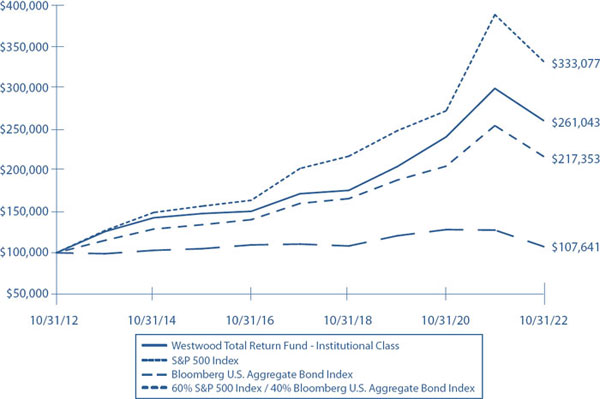
Westwood Total Return Fund
The performance of the Westwood Total Return Fund for the periods ended October 31, 2022, was as follows:
| 2022 | ||
| 6 Months | Fiscal Year | |
| Westwood Total Return Fund – Institutional Shares (WLVIX) | -4.49% | -13.05% |
| Westwood Total Return Fund – A Shares (WWTAX)* | -4.74% | -13.41% |
| Westwood Total Return Fund – C Shares (WTOCX) | -5.10% | -14.10% |
| 60% S&P 500 Index / 40% Bloomberg Barclays US Aggregate Bond Index | -5.50% | -14.73% |
| * | Without sales charge |
The performance data quoted represents past performance. Past performance does not guarantee future results. The investment return and principal value of an investment will fluctuate so that an investor’s shares, when redeemed, may be worth more or less than their original cost and current performance may be lower or higher than the performance quoted.
7
| WESTWOOD FUNDS (Unaudited) |
The Adviser has contractually agreed to waive fees and reimburse expenses until March 1, 2024. In the absence of current fee waivers, total return and yield would have been reduced. As of Nov. 1, 2019, the Fund began following the Sensible FeesTM (fulcrum fee) framework.
Over the last year, the Fund provided a positive return relative to its blended benchmark, driven in large part by targeted asset allocations in Energy combined with advantageous stock selection in Consumer Discretionary and Health Care. Within the Energy sector, shares of Devon Energy Corp. and Energy Transfer LP rose on the strength of higher natural gas and oil prices, and expectations of a colder-than-normal winter while the Russia-Ukraine war waged on. Our positions in Consumer Discretionary were a net positive for the Fund as we remained underweight the sector compared to the benchmark, and hyper selective with our holdings, such as McDonald’s, which is benefiting from an increasingly frugal consumer. Finally, our Health Care holdings in Amgen Inc., Gilead Sciences, Inc. and Bristol Myers Squibb all performed extremely well in the period, rising on strong results as the industry flourished and consolidated. Our fixed income positions, which were greatly reduced during the period, ended up being a neutral performance driver, while our higher-than-normal cash balances were extremely helpful.
Investment grade bonds tend to outperform high yield bonds during rising rate, slowing economic phases, given the additional credit risk on high yield paper. Several short-term bonds held by the Fund, including those issued by Conmed Corporation, Workday, Inc. and MongoDB, Inc. were fairly significant detractors to returns in the period. Other equity positions were detrimental to total return as well. Positions in the Financials sector struggled as the Fed began to raise short-term interest rates, increasing the cost of capital for businesses, while slowing down lending and other financial activity. Shares of banks like JP Morgan Chase, Citigroup and Truist Financial Corp. were among the laggards for the period. The Fund also experienced weakness in the Consumer Staples sector with Amazon a key detractor, while the Information Technology sector stocks such as Microsoft and Alphabet struggled in the latter part of the year.
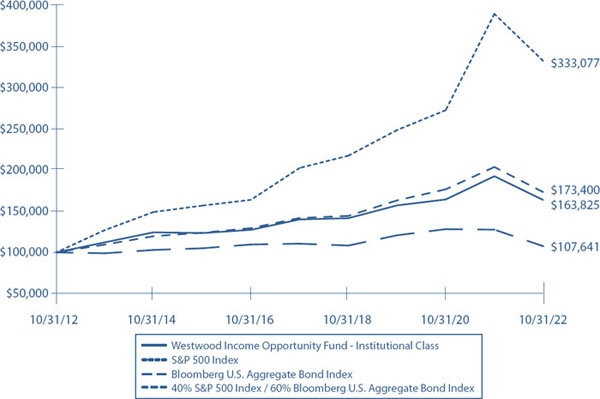
Westwood Income Opportunity Fund
The performance of the Westwood Income Opportunity Fund for the periods ended October 31, 2020, was as follows:
| 2022 | ||
| 6 Months | Fiscal Year | |
| Westwood Income Opportunity Fund – Institutional Shares (WHGIX) | -6.72% | -14.97% |
| Westwood Income Opportunity Fund – A Shares (WWIAX)* | -6.85% | -15.21% |
| Westwood Income Opportunity Fund – C Shares (WWICX) | -7.16% | -15.75% |
| Bloomberg Barclays US Aggregate Bond Index | -6.86% | -15.68% |
| S&P 500 Index | -5.50% | -14.61% |
| 40% S&P 500 Index / 60% Bloomberg Barclays US Aggregate Bond Index | -6.09% | -14.94% |
| * | Without sales charge |
The performance data quoted represents past performance. Past performance does not guarantee future results. The investment return and principal value of an investment will fluctuate so that an investor’s shares, when redeemed, may be worth more or less than their original cost and current performance may be lower or higher than the performance quoted. The Adviser has contractually agreed to waive fees and reimburse expenses until March 1, 2024. In the absence of current fee waivers, total return and yield would have been reduced.
The Fund declined by -14.97% in the period, compared with -14.94% in the blended benchmark, primarily due to higher levels of exposure in fixed income. This was offset by positive contributions from equity holdings across the Health Care and Energy sectors. The Fund’s equity exposure overall continued to be reduced during the period, with
8
| WESTWOOD FUNDS (Unaudited) |
proceeds redeployed into investment grade debt instruments, including treasuries, along with continued exposure to dislocated markets such as convertible bonds, mortgage-backed securities and investment grade corporate bonds.
The Fund’s top performers included varied Energy and Health Care-related equity positions, along with a well-timed exit of gold-miner Newmont Corporation. Energy stocks were supported by higher oil and natural gas prices combined with healthy demand, leading to higher gasoline prices for consumers. Exxon Mobil and Baker Hughes Co. each handle a different portion of the energy value chain — Exxon Mobil is an integrated oil company while Baker Hughes is involved in oilfield services — and all performed well during the period. Energy Transfer LP, a midstream player, was also one of our top performers in the period.
Bristol Myers Squibb Company, Amgen Inc. and Gilead Sciences, Inc. rounded out the top-performing positions. Bristol Myers has delivered a banner year in terms of earnings growth despite the patent expiration of Revlimid, and its late 2019 acquisition of Celgene is truly paying off as the company has had a string of very successful product rollouts, with more planned. Amgen, a biopharma company, has seen demand for its drugs rise, leading to strong earnings trends throughout the period. Gilead, a similar, but smaller biopharma, focused on research, has experienced similar trends.
With the Federal Reserve steadfast in its aggressive tightening program, equity markets have trended lower for much of the year, with shares of financial and tech companies hit hardest. Our positions in shares and debt of finance firms such as PayPal Holdings, JP Morgan Chase & Co. and Annaly Capital Management were detractors to performance, as investors began to price in slower future earnings and loan growth due to higher interest rates. Investment bank Moelis & Co. also struggled, given the likely impact of higher interest rates on their business, including mergers and acquisitions, initial public offerings and other activities. On the tech side, Meta Platforms and Microsoft both experienced pressure to grow revenues and combat a tougher consumer climate and negative impacts on discounted cash flow as rates rise. A stronger dollar and decline in gold prices also contributed to underperformance in Barrick Gold position.
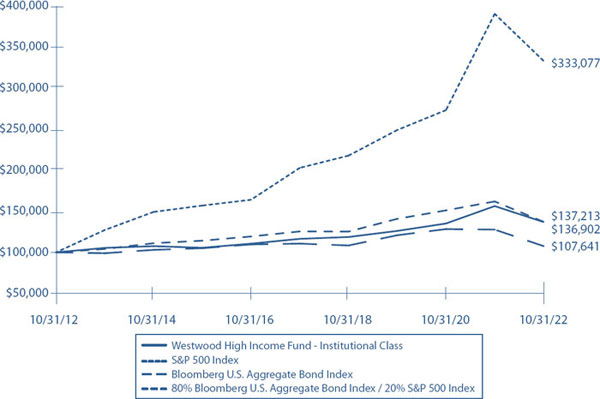
Westwood High Income Fund
The performance of the Westwood High Income Fund for the periods ended October 31, 2022, was as follows:
| 2022 | ||
| 6 Months | Fiscal Year | |
| Westwood High Income Fund – Institutional Shares (WHGHX) | -5.39% | -12.38% |
| Westwood High Income Fund – A Shares (WSDAX)* | -5.48% | -12.54% |
| Westwood High Income Fund – C Shares (WWHCX) | -5.93% | -13.32% |
| 80% Bloomberg Barclays US Aggregate Bond Index / 20% S&P 500 Index | -6.44% | -15.26% |
| * | Without sales charge |
The performance data quoted represents past performance. Past performance does not guarantee future results. The investment return and principal value of an investment will fluctuate so that an investor’s shares, when redeemed, may be worth more or less than their original cost and current performance may be lower or higher than the performance quoted. The Adviser has contractually agreed to waive fees and reimburse expenses until March 1, 2024. As of Nov. 1, 2019, the Fund began following the Sensible FeesTM (fulcrum fee) framework.
The Fund declined by -12.38% during the period versus -15.26% for the blended benchmark. Returns were driven in large part by increased allocation and tactical stock selection in equities, with a modest benefit coming from a partial move to cash and allocation to fixed income, primarily high-yield bonds. Our exposure to stocks was beneficial, as
9
| WESTWOOD FUNDS (Unaudited) |
our stock portfolio produced a small gain for the period. On a relative basis, our overweight equity exposure and stock selection was responsible for substantially all our outperformance compared to our blended benchmark.
Within the portfolio, our top contributors included a mining company, two health care companies and two energy firms. EOG Resources, which develops, produces and markets oil and natural gas, continued to fare well amid rising oil and natural gas prices, expanding production and maintaining tight controls on costs. Newmont Corp., a mining company that focuses on gold but also mines industrial material such as copper and lead, gained over 50% during the period, driven in large part by increased earnings from higher gold and copper prices. Bristol Myers Squibb and Amgen, Inc. both advanced on largely company-specific news; Amgen continues to see positive results in their oncology drug pipeline, leading to strong earnings growth. Last, Nine Energy Services, a leading completion services provider, focused on unconventional oil and gas resource development, saw its shares and convertibles soar in the period as its products and services saw heavy demand.
The investment grade bond portion of the Fund was the primary detractor to returns in the period, though it was difficult to pin the problem on a single security. Our exposure to BBB-rated securities continued to underperform as interest rates continued to rise. Given the inverted yield curve and current rate/economic climate, investors exited longer-dated bonds and moved toward the short end of the yield curve, causing prices of bonds on the long end to decline. We typically pursue a barbell strategy, holding equal amounts on the long and short end of the curve, so that price increases on short-dated securities (less than five years to maturity) will balance out price declines on long-dated securities (10 or more years to maturity) over time. We continued to shorten our duration exposure during the period to reduce interest rate risk.
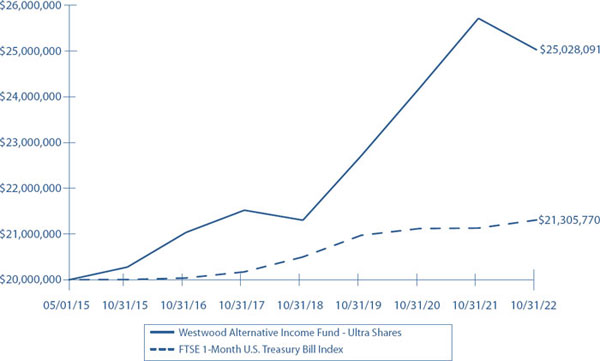
Westwood Alternative Income Fund
The performance of the Westwood Alternative Income Fund for the periods ended October 31, 2022, was as follows:
| 2022 | ||
| 6 Months | Fiscal Year | |
| Westwood Alternative Income Fund – Institutional Shares (WMNIX) | -0.74% | -2.88% |
| Westwood Alternative Income Fund – A Shares (WMNAX)* | -0.72% | -2.88% |
| Westwood Alternative Income Fund – C Shares (WWACX) | -1.12% | -3.59% |
| Westwood Alternative Income Fund – Ultra Shares (WMNUX) | -0.60% | -2.69% |
| FTSE 1-Month Treasury Bill | 0.81% | 0.84% |
| * | Without sales charge |
The performance data quoted represents past performance. Past performance does not guarantee future results. The investment return and principal value of an investment will fluctuate so that an investor’s shares, when redeemed, may be worth more or less than their original cost and current performance may be lower or higher than the performance quoted. The Adviser has contractually agreed to waive fees and reimburse expenses until March 1, 2024. As of Nov. 1, 2019, the Fund began following the Sensible FeesTM (fulcrum fee) framework.
The markets have been on a rollercoaster over the last 12 months. The combination global supply issues, rising energy costs, the war in Ukraine and the U.S. Federal Reserve’s penchant for staving off inflation in the U.S. has global investors confused about where best to put money to work. Both fixed income and equity investors have been subjected to bouts of extreme volatility and double-digit negative returns. Although 2021 finished on a positive note, December would prove be the high-water mark for both equity and fixed income returns. Although U.S. inflation-related economic releases began to move higher by the second quarter of 2021, the numbers were not materially worrisome. By the end of the third quarter and the beginning of the early fourth quarter, things changed. Core CPI and core PPI continued their ascent to levels not experienced since the early 1980s. Equities and fixed income finally
10
| WESTWOOD FUNDS (Unaudited) |
took notice. Starting early January 2022, U.S. Treasury rates began moving higher, investment grade and high yield spreads moved wider and U.S. equity markets showed signs of weakness starting in mid-January 2022.
As inflation-related economic reports showed no signs of abating, the U.S. Federal Reserve took action. The target fed funds rate, which began the year at near-zero levels, was lifted aggressively to the levels seen today, approximately 3.75%. As a result of the Fed pulling the punch bowl of cheap money from the market, equities and fixed income marched lower. Although the path of decline has been more volatile for equities, the absolute change for equities and fixed income is nearly the same. The 12-month decline for the S&P 500 starting Nov. 1, 2021 was 14.63% and over the same period, the Bloomberg U.S. Aggregate Index was down 15.68%. 2022 marks only the third time since 1926 that both equities and bonds have experienced combined negative returns; 1931 and 1969 were the other two years.
The Fed has admitted they were wrong with regard to inflationary pressures being transitory and are now playing catch-up. One of the biggest questions that has the markets on edge is how far will the Fed go to tamp down inflation? Will they succeed? Will they overshoot and push the U.S. economy into recession? Will the draining of liquidity be effective in fighting the cost-push inflation that we are experiencing? These are all questions that the market is dealing with in typical fashion — sell first and ask questions later.
We believe that we are well positioned in the Alternative Income Fund as the strategy seeks to profit from market swings and lack of conviction. The portfolio holds short- dated convertibles and fixed income securities that have limited sensitivity to rising rates and declining equities. At the same time, we are long equity volatility that has sprung to life.
Within the fixed income yield book, our holdings performed in line as both investment grade and high yield sold off. Credit spreads did widen as risk asset liquidity became scarce, but we were positioned in higher grade and low duration names.
The convertible arbitrage strategy held up well relative to other asset classes as the long volatility component offset the negative rate and liquidity pressures. Convertible valuations declined as the hunt for liquidity impacted all asset classes. Gamma trading opportunities added value as the equity markets have made several attempts to rebound only to end lower. Activity in the primary market has come to a halt following the lead of the high yield market.
Macro tail hedges added value as both the equity markets were risk off and rates were higher across the curve. We continue to monitor and systematically adjust these positions for maximum Fund flexibility, and as a means of capital preservation during periods of market volatility.
Westwood SmallCap Growth Fund
The performance of the Westwood SmallCap Growth Fund for the periods ended October 31, 2022, was as follows:
| 2022 | ||
| 6 Months | Fiscal Year | |
| Westwood SmallCap Growth Fund – Institutional Shares (WSCIX) | -5.69% | -20.61% |
| Russell 2000 Growth Index | 1.02% | -26.02% |
The performance data quoted represents past performance. Past performance does not guarantee future results. The investment return and principal value of an investment will fluctuate so that an investor’s shares, when redeemed, may be worth more or less than their original cost and current performance may be lower or higher than the performance quoted. The Adviser has contractually agreed to waive fees and reimburse expenses until March 1, 2024. In the absence of current fee waivers, total return and yield would have been reduced.
11
| WESTWOOD FUNDS (Unaudited) |
The Fund handily beat its benchmark, ending the period down -20.61%, while the Russell 2000 was off -26.02%. Strong relative performance was aided by positive stock selection within Health Care and Financials and Real Estate. Top individual contributors included Krystal Biotech, as shares remained strong following the successful completion of the GEM-3 pivotal trial. The company is expected to earn FDA approval for VYJUVEK™ in 2023; the drug is used to treat dystrophic epidermolysis bullosa. Rare-disease-focused, commercial-stage biotech company Catalyst Pharmaceuticals received FDA widened approval of the supplemental New Drug Application for FIRDAPSE®, expanding the indicated age range to include pediatric patients age 6 and older. And finally, niche dining concept company First Watch Restaurant Group rounded out our top three performers as its earnings resilience continued to satiate investors and analysts alike.
Unfavorable selection in Information Technology, Industrials and Energy were the key detractors from relative performance. Top individual detractors included semiconductor cleaning company ACM Research, Inc. which obviously felt the effects of a slowing global market in silicon chips. Niche medical device company Tactile Systems failed to meet investors’ earnings expectations early in the period but regained some revenue and earnings momentum in the latter part of the year; investors remain cautious given the current macro-economic environment. Rounding out the top three detractors was outdoor equipment maker Clarus Corporation, which saw its shares tumble mid-August as insider selling drove shares lower, triggering pressure on a leveraged fund manager that was forced to sell to meet margin requirements. The company recently reported earnings results that were below consensus estimates, while management also lowered the full-year guidance for both sales and earnings per share.
To determine if this Fund is an appropriate investment for you, carefully consider the Fund’s investment objectives, risk factors, charges and expenses before investing. This and other information can be found in the Fund’s prospectus, which may be obtained by calling 1.877.386.3944. Read the prospectus carefully before investing or sending money.
Past performance is not predictive of future performance. Investment results and principal value will fluctuate so that shares, when redeemed, may be worth more or less than their original cost. Current performance may be higher or lower than the performance data quoted. Performance data current to the most recent month end are available by calling 1-877-386-3944.
An investor should consider the investment objectives, risks, charges and expenses of each Fund carefully before investing. The Funds’ prospectus contains this and other important information. To obtain a copy of the Funds’ prospectus please visit the Funds’ website at www.westwoodfunds.com or call 1-877-386-3944 and a copy will be sent to you free of charge. Please read the prospectus carefully before you invest. The Funds are distributed by Ultimus Fund Distributors, LLC.
The Letter to Shareholders seeks to describe some of the Adviser’s current opinions and views of the financial markets. Although the Adviser believes it has a reasonable basis for any opinions or views expressed, actual results may differ, sometimes significantly so, from those expected or expressed. The securities held by the Funds that are discussed in the Letter to Shareholders were held during the period covered by this Report. They do not comprise the entire investment portfolios of the Funds, may be sold at any time, and may no longer be held by the Funds. For a complete list of securities held by the Funds as of October 31, 2022, please see the Schedules of Investments section of this Report. The opinions of the Funds’ adviser with respect to those securities may change at any time.
Statements in the Letter to Shareholders that reflect projections or expectations for future financial or economic performance of the Funds and the market in general and statements of the Funds’ plans and objectives for future operations are forward-looking statements. No assurance can be given that actual results or events will not differ materially from those projected, estimated, assumed, or anticipated in any such forward-looking statements. Important factors that could result in such differences, in addition to factors noted with such forward-looking statements include, without limitation, general economic conditions, such as inflation, recession, and interest rates. Past performance is not a guarantee of future results.
12
| WESTWOOD FUNDS (Unaudited) |
Definition of the Comparative Indices & Key Terms
Alpha is the measure of risk-adjusted performance.
Bloomberg Barclays U.S. Aggregate Bond Index is a broad-based flagship benchmark that measures the investment grade, US dollar-denominated, fixed-rate taxable bond market.
Compound Annual Growth Rate: The rate of return that would be required for an investment to grow from its beginning balance to its ending balance, assuming the profits are reinvested at the end of each year of the investment’s lifespan.
FTSE 1-Month Treasury Bill Index is a market value-weighted index of public obligations of the U.S. Treasury bills with maturities of one month. The Index reflects no deduction for fees, expenses or taxes.
Gamma is the rate of change for delta with respect to the underlying asset’s price. Gamma is an important measure of the convexity of a derivative’s value, in relation to the underlying assets.
Russell 1000 Value Index measures the performance of the large-cap value segment of the U.S. equity universe. It includes those Russell 1000 companies with lower price-to-book ratios and lower expected and historical growth rates.
Russell 2000 Growth Index is an unmanaged index that measures the performance of those Russell 2000 Index companies with higher price-to-book ratios and higher forecasted growth values.
Russell 2000 Value Index is a broadly diversified index predominantly made up of value stocks of small U.S. companies.
Russell 2500 Value Index measures the performance of the small to mid-cap value segment of the U.S. equity universe. It includes those Russell 2500 companies with lower price-to-book ratio and lower forecasted growth values.
Russell 3000 Value Index is a market-capitalization weighted equity index maintained by the Russell Investment Group and based on the Russell 3000 Index, which measures how U.S. stocks in the equity value segment perform by including only value stocks.
S&P 500 Index is an unmanaged capitalization-weighted index of 500 stocks designed to measure performance of the broad domestic stock market through changes in the aggregate market value of 500 stocks representing all major industries.
13
| WESTWOOD QUALITY VALUE FUND (UNAUDITED) |
Growth of $100,000 Investment (a) | ||||
| Average Annual Total Returns (b) (for the periods ended October 31, 2022) | ||||
| Since Inception | ||||
| 1 Year | 5 Year | 10 Year | (3/31/20) | |
| Institutional Shares | -4.37% | 8.45% | 10.95% | N/A |
| A Class Shares with sales charge | -7.50% | 7.50% | 10.34% | N/A |
| A Class Shares without sales charge | -4.64% | 8.17% | 10.68% | N/A |
| C Class Shares | -5.36% | N/A | N/A | 17.34% |
| Russell 1000 Value Index | -7.00% | 7.21% | 10.30% | 19.71% |
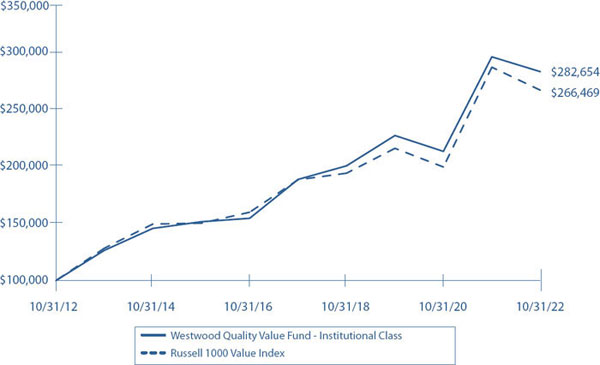
| (a) | The graph is based on Institutional Shares. Performance for A Class Shares would have been lower because it is subject to a maximum front-end sales charge of 3.00% and additional annual distribution expenses of 0.25%. Performance for C Class Shares would vary due to differences in fee structures. |
| (b) | The Fund’s total returns do not reflect the deduction of taxes a shareholder would pay on Fund distributions or the redemption of Fund shares. If the Adviser had not limited certain expenses, the Fund’s total return would have been lower. |
The performance data quoted herein represents past performance and the return and value of an investment in the Fund will fluctuate so that, when redeemed, may be worth less than its original cost. Past performance is no guarantee of future performance and should not be considered as a representation of the future results of the Fund. There are no assurances that the Fund will meet its stated objectives. The Fund’s holdings and allocations are subject to change because it is actively managed and should not be considered recommendations to buy individual securities. The Fund’s performance assumes the reinvestment of all dividends and all capital gains. Index returns assume reinvestment of dividends and, unlike the Fund’s returns, do not reflect any fees or expenses. If such fees and expenses were included in the index returns, the performance would have been lower. Please note that one cannot invest directly in an unmanaged index.
14
| WESTWOOD QUALITY MIDCAP FUND (UNAUDITED) |
| Growth of $100,000 Investment (a) | |
| Total Returns (a) | |
| (for the period ended October 31, 2022) | |
| Since Inception | |
| (11/30/21) | |
| Institutional Shares | -3.60% |
| Russell Midcap Value Index | -7.36% |
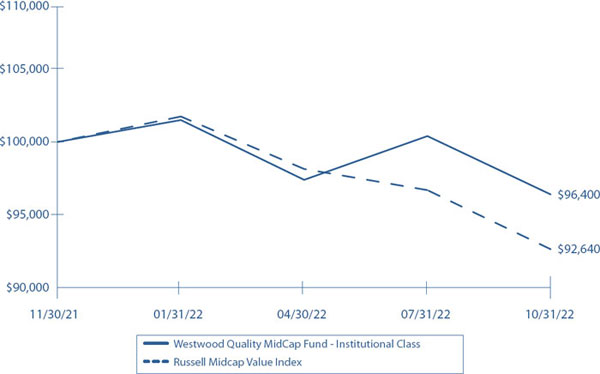
| (a) | The Fund’s total return does not reflect the deduction of taxes a shareholder would pay on Fund distributions or the redemption of Fund shares. If the Adviser had not limited certain expenses, the Fund’s total return would have been lower. Total returns for less than one year are not annualized. |
The performance data quoted herein represents past performance and the return and value of an investment in the Fund will fluctuate so that, when redeemed, may be worth less than its original cost. Past performance is no guarantee of future performance and should not be considered as a representation of the future results of the Fund. There are no assurances that the Fund will meet its stated objectives. The Fund’s holdings and allocations are subject to change because it is actively managed and should not be considered recommendations to buy individual securities. The Fund’s performance assumes the reinvestment of all dividends and all capital gains. Index returns assume reinvestment of dividends and, unlike the Fund’s returns, do not reflect any fees or expenses. If such fees and expenses were included in the index returns, the performance would have been lower. Please note that one cannot invest directly in an unmanaged index.
15
| WESTWOOD QUALITY SMIDCAP FUND (UNAUDITED) |
| Growth of $100,000 Investment (a) | ||||
| Average Annual Total Returns (b) (for the periods ended October 31, 2022) | ||||
| Since Inception | ||||
| 1 Year | 5 Year | 10 Year | (7/31/20) | |
| Institutional Shares | -9.64% | 5.90% | 8.67% | N/A |
| Ultra Shares | -9.41% | N/A | N/A | 14.48% |
| Russell 2500 Value Index | -10.66% | 5.77% | 9.55% | 18.02% |
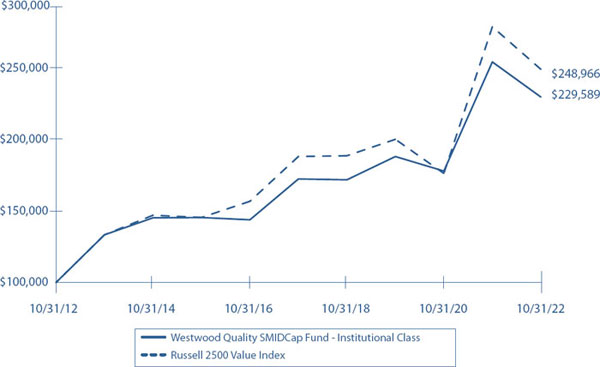
| (a) | The graph is based on Institutional Shares. Performance for Ultra Shares would vary due to differences in fee structures. |
| (b) | The Fund’s total returns do not reflect the deduction of taxes a shareholder would pay on Fund distributions or the redemption of Fund shares. If the Adviser had not limited certain expenses, the Fund’s total return would have been lower. |
The performance data quoted herein represents past performance and the return and value of an investment in the Fund will fluctuate so that, when redeemed, may be worth less than its original cost. Past performance is no guarantee of future performance and should not be considered as a representation of the future results of the Fund. There are no assurances that the Fund will meet its stated objectives. The Fund’s holdings and allocations are subject to change because it is actively managed and should not be considered recommendations to buy individual securities. The Fund’s performance assumes the reinvestment of all dividends and all capital gains. Index returns assume reinvestment of dividends and, unlike the Fund’s returns, do not reflect any fees or expenses. If such fees and expenses were included in the index returns, the performance would have been lower. Please note that one cannot invest directly in an unmanaged index.
16
| WESTWOOD QUALITY SMALLCAP FUND (UNAUDITED) |
| Growth of $100,000 Investment (a) | |||||
| Average Annual Total Returns (b) (for the periods ended October 31, 2022) | |||||
| Since Inception | Since Inception | ||||
| 1 Year | 5 Year | 10 Year | (9/3/19) | (3/31/20) | |
| Institutional Shares | -10.08% | 4.70% | 10.82% | N/A | N/A |
| A Class Shares with sales charge | -13.73% | N/A | N/A | 6.51% | N/A |
| A Class Shares without sales charge | -10.15% | N/A | N/A | 7.90% | N/A |
| C Class Shares | -10.84% | N/A | N/A | 7.14% | N/A |
| Ultra Shares | -9.91% | N/A | N/A | N/A | 22.91% |
| Russell 2000 Value Index | -10.73% | 5.31% | 9.37% | 10.65% | 26.92% |
| (a) | The graph is based on Institutional Shares. Performance for A Class Shares would have been lower because it is subject to a maximum front-end sales charge of 4.00% and additional annual distribution expenses of 0.25%. Performance for C Class Shares and Ultra Shares would vary due to differences in fee structures. |
| (b) | The Fund’s total returns do not reflect the deduction of taxes a shareholder would pay on Fund distributions or the redemption of Fund shares. If the Adviser had not limited certain expenses, the Fund’s total return would have been lower. |
The performance data quoted herein represents past performance and the return and value of an investment in the Fund will fluctuate so that, when redeemed, may be worth less than its original cost. Past performance is no guarantee of future performance and should not be considered as a representation of the future results of the Fund. There are no assurances that the Fund will meet its stated objectives. The Fund’s holdings and allocations are subject to change because it is actively managed and should not be considered recommendations to buy individual securities. The Fund’s performance assumes the reinvestment of all dividends and all capital gains. Index returns assume reinvestment of dividends and, unlike the Fund’s returns, do not reflect any fees or expenses. If such fees and expenses were included in the index returns, the performance would have been lower. Please note that one cannot invest directly in an unmanaged index.
17
| WESTWOOD QUALITY ALLCAP FUND (UNAUDITED) |
| Growth of $100,000 Investment (a) | ||
| Average Annual Total Returns (b) (for the periods ended October 31, 2022) | ||
| Since Inception | ||
| 1 Year | (9/30/21) | |
| Institutional Shares | -4.86% | 0.69% |
| Ultra Shares | -4.81% | 0.74% |
| Russell 3000 Value Index | -7.25% | -2.41% |
| (a) | The graph is based on Institutional Shares. Performance for Ultra Shares would vary due to differences in fee structures. |
| (b) | The Fund’s total returns do not reflect the deduction of taxes a shareholder would pay on Fund distributions or the redemption of Fund shares. If the Adviser had not limited certain expenses, the Fund’s total return would have been lower. |
The performance data quoted herein represents past performance and the return and value of an investment in the Fund will fluctuate so that, when redeemed, may be worth less than its original cost. Past performance is no guarantee of future performance and should not be considered as a representation of the future results of the Fund. There are no assurances that the Fund will meet its stated objectives. The Fund’s holdings and allocations are subject to change because it is actively managed and should not be considered recommendations to buy individual securities. The Fund’s performance assumes the reinvestment of all dividends and all capital gains. Index returns assume reinvestment of dividends and, unlike the Fund’s returns, do not reflect any fees or expenses. If such fees and expenses were included in the index returns, the performance would have been lower. Please note that one cannot invest directly in an unmanaged index.
18
| WESTWOOD TOTAL RETURN FUND (UNAUDITED) |
| Growth of $100,000 Investment (a) | ||||
| Average Annual Total Returns (b) (for the periods ended October 31, 2022) | ||||
| Since Inception | ||||
| 1 Year | 5 Year | 10 Year | (3/31/20) | |
| Institutional Shares | -13.05% | 8.71% | 10.07% | N/A |
| A Class Shares with sales charge | -16.04% | N/A | N/A | 10.52% |
| A Class Shares without sales charge | -13.41% | N/A | N/A | 11.82% |
| C Class Shares | -14.10% | N/A | N/A | 11.16% |
| S&P 500 Index | -14.61% | 10.44% | 12.79% | 18.75% |
| Bloomberg U.S. Aggregate Bond Index | -15.68% | -0.54% | 0.74% | -5.46% |
| 60% S&P 500 Index / 40% Bloomberg U.S. Aggregate Bond Index | -14.73% | 6.30% | 8.07% | 8.79% |
| (a) | The graph is based on Institutional Shares. Performance for A Class Shares would have been lower because it is subject to a maximum front-end sales charge of 3.00% and additional annual distribution expenses of 0.25%. Performance for C Class Shares would vary due to differences in fee structures. |
| (b) | The Fund’s total returns do not reflect the deduction of taxes a shareholder would pay on Fund distributions or the redemption of Fund shares. If the Adviser had not limited certain expenses, the Fund’s total return would have been lower. |
The performance data quoted herein represents past performance and the return and value of an investment in the Fund will fluctuate so that, when redeemed, may be worth less than its original cost. Past performance is no guarantee of future performance and should not be considered as a representation of the future results of the Fund. There are no assurances that the Fund will meet its stated objectives. The Fund’s holdings and allocations are subject to change because it is actively managed and should not be considered recommendations to buy individual securities. The Fund’s performance assumes the reinvestment of all dividends and all capital gains. Index returns assume reinvestment of dividends and, unlike the Fund’s returns, do not reflect any fees or expenses. If such fees and expenses were included in the index returns, the performance would have been lower. Please note that one cannot invest directly in an unmanaged index.
19
| WESTWOOD INCOME OPPORTUNITY FUND (UNAUDITED) |
| Growth of $100,000 Investment (a) | ||||
| Average Annual Total Returns (b) (for the periods ended October 31, 2022) | ||||
| Since Inception | ||||
| 1 Year | 5 Year | 10 Year | (9/3/19) | |
| Institutional Shares | -14.97% | 3.17% | 5.06% | N/A |
| A Class Shares with sales charge | -17.75% | 2.27% | 4.47% | N/A |
| A Class Shares without sales charge | -15.21% | 2.90% | 4.79% | N/A |
| C Class Shares | -15.75% | N/A | N/A | 0.76% |
| Bloomberg U.S. Aggregate Bond Index | -15.68% | -0.54% | 0.74% | -3.71% |
| S&P 500 Index | -14.61% | 10.44% | 12.79% | 11.31% |
| 40% S&P 500 Index / 60% Bloomberg U.S. Aggregate Bond Index | -14.94% | 4.10% | 5.66% | 2.46% |
| (a) | The graph is based on Institutional Shares. Performance for A Class Shares would have been lower because it is subject to a maximum front-end sales charge of 3.00% and additional annual distribution expenses of 0.25%. Performance for C Class Shares would vary due to differences in fee structures. |
| (b) | The Fund’s total returns do not reflect the deduction of taxes a shareholder would pay on Fund distributions or the redemption of Fund shares. If the Adviser had not limited certain expenses, the Fund’s total return would have been lower. |
The performance data quoted herein represents past performance and the return and value of an investment in the Fund will fluctuate so that, when redeemed, may be worth less than its original cost. Past performance is no guarantee of future performance and should not be considered as a representation of the future results of the Fund. There are no assurances that the Fund will meet its stated objectives. The Fund’s holdings and allocations are subject to change because it is actively managed and should not be considered recommendations to buy individual securities. The Fund’s performance assumes the reinvestment of all dividends and all capital gains. Index returns assume reinvestment of dividends and, unlike the Fund’s returns, do not reflect any fees or expenses. If such fees and expenses were included in the index returns, the performance would have been lower. Please note that one cannot invest directly in an unmanaged index.
20
| WESTWOOD HIGH INCOME FUND (UNAUDITED) |
| Growth of $100,000 Investment (a) | |||||
| Average Annual Total Returns (b) (for the periods ended October 31, 2022) | |||||
| Since Inception | Since Inception | ||||
| 1 Year | 5 Year | 10 Year | (6/28/13) | (3/31/20) | |
| Institutional Shares | -12.38% | 3.30% | 3.19% | N/A | N/A |
| A Class Shares with sales charge | -15.15% | 2.48% | N/A | 2.66% | N/A |
| A Class Shares without sales charge | -12.54% | 3.11% | N/A | 3.00% | N/A |
| C Class Shares | -13.32% | N/A | N/A | N/A | 6.93% |
| Bloomberg U.S. Aggregate Bond Index | -15.68% | -0.54% | 0.74% | 1.06% | -5.46% |
| S&P 500 Index | -14.61% | 10.44% | 12.79% | 12.00% | 18.75% |
| 80% Bloomberg U.S. Aggregate Bond Index / 20% S&P 500 Index | -15.26% | 1.81% | 3.21% | 3.34% | -0.81% |
| (a) | The graph is based on Institutional Shares. Performance for A Class Shares would have been lower because it is subject to a maximum front-end sales charge of 3.00% and additional annual distribution expenses of 0.25%. Performance for C Class Shares would vary due to differences in fee structures. |
| (b) | The Fund’s total returns do not reflect the deduction of taxes a shareholder would pay on Fund distributions or the redemption of Fund shares. If the Adviser had not limited certain expenses, the Fund’s total return would have been lower. |
The performance data quoted herein represents past performance and the return and value of an investment in the Fund will fluctuate so that, when redeemed, may be worth less than its original cost. Past performance is no guarantee of future performance and should not be considered as a representation of the future results of the Fund. There are no assurances that the Fund will meet its stated objectives. The Fund’s holdings and allocations are subject to change because it is actively managed and should not be considered recommendations to buy individual securities. The Fund’s performance assumes the reinvestment of all dividends and all capital gains. Index returns assume reinvestment of dividends and, unlike the Fund’s returns, do not reflect any fees or expenses. If such fees and expenses were included in the index returns, the performance would have been lower. Please note that one cannot invest directly in an unmanaged index.
21
| WESTWOOD ALTERNATIVE INCOME FUND (UNAUDITED) |
| Growth of $20,000,000 Investment (a) | ||||
| Average Annual Total Returns (b) (for the periods ended October 31, 2022) | ||||
| Since Inception | Since Inception | |||
| 1 Year | 5 Year | (5/1/15) | (3/31/20) | |
| Institutional Shares | -2.88% | 2.96% | 2.93% | N/A |
| Ultra Shares | -2.69% | 3.06% | 3.03% | N/A |
| A Class Shares with sales charge | -5.80% | N/A | N/A | 2.72% |
| A Class Shares without sales charge | -2.88% | N/A | N/A | 3.93% |
| C Class Shares | -3.59% | N/A | N/A | 3.36% |
| FTSE 1-Month U.S. Treasury Bill Index | 0.84% | 1.10% | 0.85% | 0.36% |
| (a) | The graph is based on Ultra Shares. Performance for Institutional Shares and Class C Shares would vary due to differences in fee structures. Performance for A Class Shares would have been lower because it is subject to a maximum front-end sales charge of 3.00% and additional annual distribution expenses of 0.25%. |
| (b) | The Fund’s total returns do not reflect the deduction of taxes a shareholder would pay on Fund distributions or the redemption of Fund shares. If the Adviser had not limited certain expenses, the Fund’s total return would have been lower. |
The performance data quoted herein represents past performance and the return and value of an investment in the Fund will fluctuate so that, when redeemed, may be worth less than its original cost. Past performance is no guarantee of future performance and should not be considered as a representation of the future results of the Fund. There are no assurances that the Fund will meet its stated objectives. The Fund’s holdings and allocations are subject to change because it is actively managed and should not be considered recommendations to buy individual securities. The Fund’s performance assumes the reinvestment of all dividends and all capital gains. Index returns assume reinvestment of dividends and, unlike the Fund’s returns, do not reflect any fees or expenses. If such fees and expenses were included in the index returns, the performance would have been lower. Please note that one cannot invest directly in an unmanaged index.
22
| WESTWOOD SMALLCAP GROWTH FUND (UNAUDITED) |
| Growth of $100,000 Investment | ||
| Average Annual Total Returns (a) (for the periods ended October 31, 2022) | ||
| Since Inception | ||
| 1 Year | (9/30/21) | |
| Institutional Shares | -20.61% | -17.23% |
| Russell 2000 Growth Index | -26.02% | -20.99% |
| (a) | The Fund’s total returns do not reflect the deduction of taxes a shareholder would pay on Fund distributions or the redemption of Fund shares. If the Adviser had not limited certain expenses, the Fund’s total return would have been lower. Total returns for less than one year are not annualized. |
The performance data quoted herein represents past performance and the return and value of an investment in the Fund will fluctuate so that, when redeemed, may be worth less than its original cost. Past performance is no guarantee of future performance and should not be considered as a representation of the future results of the Fund. There are no assurances that the Fund will meet its stated objectives. The Fund’s holdings and allocations are subject to change because it is actively managed and should not be considered recommendations to buy individual securities. The Fund’s performance assumes the reinvestment of all dividends and all capital gains. Index returns assume reinvestment of dividends and, unlike the Fund’s returns, do not reflect any fees or expenses. If such fees and expenses were included in the index returns, the performance would have been lower. Please note that one cannot invest directly in an unmanaged index.
23
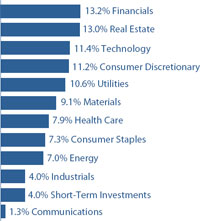
| WESTWOOD QUALITY VALUE FUND |
| OCTOBER 31, 2022 |
| Sector Weightings (Unaudited)† |
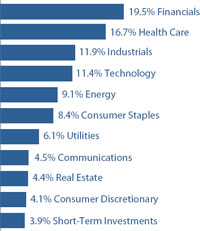
| † | Percentages are based on total investments. |
| SCHEDULE OF INVESTMENTS |
| COMMON STOCKS — 96.3% |
| Shares | Value | |||||||
| Communications — 4.5% | ||||||||
| Internet Media & Services — 1.9% | ||||||||
| Alphabet, Inc. - Class A (a) | 50,505 | $ | 4,773,227 | |||||
| Telecommunications — 2.6% | ||||||||
| AT&T, Inc. | 354,133 | 6,455,845 | ||||||
| Consumer Discretionary — 4.1% | ||||||||
| Retail - Discretionary — 4.1% | ||||||||
| Home Depot, Inc. (The) | 16,964 | 5,023,549 | ||||||
| O’Reilly Automotive, Inc. (a) | 6,217 | 5,204,686 | ||||||
| 10,228,235 | ||||||||
| Consumer Staples — 8.4% | ||||||||
| Beverages — 2.1% | ||||||||
| PepsiCo, Inc. | 28,786 | 5,226,962 | ||||||
| Food — 1.9% | ||||||||
| McCormick & Company, Inc. | 60,608 | 4,766,213 | ||||||
| Retail - Consumer Staples — 4.4% | ||||||||
| Dollar General Corporation | 19,417 | 4,952,306 | ||||||
| Walmart, Inc. | 43,236 | 6,153,780 | ||||||
| 11,106,086 | ||||||||
| Energy — 9.1% | ||||||||
| Oil & Gas Producers — 9.1% | ||||||||
| Chevron Corporation | 36,230 | 6,554,007 | ||||||
| ConocoPhillips | 42,291 | 5,332,472 | ||||||
| Devon Energy Corporation | 34,160 | 2,642,276 | ||||||
| COMMON STOCKS — continued |
| Shares | Value | |||||||
| Energy — continued | ||||||||
| Oil & Gas Producers — Continued | ||||||||
| EOG Resources, Inc. | 38,995 | $ | 5,323,597 | |||||
| Valero Energy Corporation | 23,394 | 2,937,117 | ||||||
| 22,789,469 | ||||||||
| Financials — 19.6% | ||||||||
| Asset Management — 3.7% | ||||||||
| Blackstone, Inc. | 48,031 | 4,377,545 | ||||||
| Charles Schwab Corporation (The) | 60,565 | 4,825,214 | ||||||
| 9,202,759 | ||||||||
| Banking — 7.9% | ||||||||
| Bank of America Corporation | 236,013 | 8,505,909 | ||||||
| JPMorgan Chase & Company | 59,723 | 7,517,931 | ||||||
| Western Alliance Bancorp | 57,206 | 3,842,527 | ||||||
| 19,866,367 | ||||||||
| Institutional Financial Services — 2.1% | ||||||||
| Goldman Sachs Group, Inc. (The) | 15,387 | 5,300,975 | ||||||
| Insurance — 5.9% | ||||||||
| American International Group, Inc. | 91,457 | 5,213,049 | ||||||
| Arthur J. Gallagher & Company | 26,047 | 4,872,873 | ||||||
| Berkshire Hathaway, Inc. - Class B (a) | 16,346 | 4,823,541 | ||||||
| 14,909,463 | ||||||||
| Health Care — 16.7% | ||||||||
| Biotech & Pharma — 5.8% | ||||||||
| Gilead Sciences, Inc. | 77,321 | 6,066,606 | ||||||
| Johnson & Johnson | 49,580 | 8,625,432 | ||||||
| 14,692,038 | ||||||||
| Health Care Facilities & Services — 5.7% | ||||||||
| CVS Health Corporation | 51,697 | 4,895,706 | ||||||
| McKesson Corporation | 8,699 | 3,387,130 | ||||||
| UnitedHealth Group, Inc. | 10,910 | 6,056,686 | ||||||
| 14,339,522 | ||||||||
| Medical Equipment & Devices — 5.2% | ||||||||
| Becton, Dickinson and Company | 27,588 | 6,509,940 | ||||||
| Danaher Corporation | 25,564 | 6,433,692 | ||||||
| 12,943,632 | ||||||||
| Industrials — 11.9% | ||||||||
| Aerospace & Defense — 2.2% | ||||||||
| L3Harris Technologies, Inc. | 22,709 | 5,597,087 | ||||||
| Diversified Industrials — 5.4% | ||||||||
| Eaton Corporation plc | 52,338 | 7,854,364 | ||||||
| Honeywell International, Inc. | 27,376 | 5,585,251 | ||||||
| 13,439,615 | ||||||||
| Electrical Equipment — 2.0% | ||||||||
| Fortive Corporation | 78,375 | 5,008,163 | ||||||
The accompanying notes are an integral part of the financial statements.
24
| WESTWOOD QUALITY VALUE FUND |
| OCTOBER 31, 2022 |
| COMMON STOCKS — continued |
| Shares | Value | |||||||
| Industrials — continued | ||||||||
| Transportation & Logistics — 2.3% | ||||||||
| Union Pacific Corporation | 29,606 | $ | 5,836,527 | |||||
| Real Estate — 4.4% | ||||||||
| REITs — 4.4% | ||||||||
| Alexandria Real Estate Equities, Inc. | 28,667 | 4,165,315 | ||||||
| Prologis, Inc. | 41,790 | 4,628,242 | ||||||
| VICI Properties, Inc. | 75,233 | 2,408,961 | ||||||
| 11,202,518 | ||||||||
| Technology — 11.5% | ||||||||
| Semiconductors — 4.2% | ||||||||
| ASML Holding N.V. - ADR | 9,540 | 4,506,887 | ||||||
| Microchip Technology, Inc. | 97,949 | 6,047,371 | ||||||
| 10,554,258 | ||||||||
| Software — 2.8% | ||||||||
| Microsoft Corporation | 30,628 | 7,109,678 | ||||||
| Technology Services — 4.5% | ||||||||
| CACI International, Inc. - Class A (a) | 19,478 | 5,921,896 | ||||||
| Visa, Inc. - Class A | 25,179 | 5,216,082 | ||||||
| 11,137,978 | ||||||||
| Utilities — 6.1% | ||||||||
| Electric Utilities — 6.1% | ||||||||
| DTE Energy Company | 39,309 | 4,406,932 | ||||||
| NextEra Energy, Inc. | 59,815 | 4,635,662 | ||||||
| WEC Energy Group, Inc. | 69,011 | 6,302,775 | ||||||
| 15,345,369 | ||||||||
| Total Common Stocks | ||||||||
| (Cost $198,207,763) | $ | 241,831,986 | ||||||
| MONEY MARKET FUND — 3.9% |
| Shares | Value | |||||||
| SEI Daily Income Trust, Government Fund - Class F, 2.67% (b) (Cost $9,895,111) | 9,895,111 | $ | 9,895,111 | |||||
| Investments at Value — 100.2% | ||||||||
| (Cost $208,102,874) | $ | 251,727,097 | ||||||
| Liabilities in Excess of Other Assets — (0.2%) | (466,137 | ) | ||||||
| Net Assets — 100.0% | $ | 251,260,960 | ||||||
ADR - American Depositary Receipt
N.V. - Naamloze Vennootschap
plc - Public Limited Company
| (a) | Non-income producing security. |
| (b) | The rate shown is the 7-day effective yield as of October 31, 2022. |
The accompanying notes are an integral part of the financial statements.
25
| WESTWOOD QUALITY MIDCAP FUND |
| OCTOBER 31, 2022 |
| Sector Weightings (Unaudited)† |
| † | Percentages are based on total investments. |
| SCHEDULE OF INVESTMENTS |
| COMMON STOCKS — 96.9% |
| Shares | Value | |||||||
| Communications — 1.3% | ||||||||
| Cable & Satellite — 1.3% | ||||||||
| Cable One, Inc. | 8 | $ | 6,876 | |||||
| Consumer Discretionary — 11.3% | ||||||||
| Home Construction — 4.6% | ||||||||
| Armstrong World Industries, Inc. | 131 | 9,900 | ||||||
| Masonite International Corporation (a) | 78 | 5,579 | ||||||
| PulteGroup, Inc. | 216 | 8,638 | ||||||
| 24,117 | ||||||||
| Leisure Facilities & Services — 2.0% | ||||||||
| Texas Roadhouse, Inc. | 107 | 10,587 | ||||||
| Retail - Discretionary — 4.7% | ||||||||
| Bath & Body Works, Inc. | 302 | 10,081 | ||||||
| O’Reilly Automotive, Inc. (a) | 18 | 15,069 | ||||||
| 25,150 | ||||||||
| Consumer Staples — 7.3% | ||||||||
| Beverages — 1.0% | ||||||||
| Constellation Brands, Inc. - Class A | 22 | 5,436 | ||||||
| Food — 4.7% | ||||||||
| Hostess Brands, Inc. (a) | 324 | 8,580 | ||||||
| McCormick & Company, Inc. | 210 | 16,514 | ||||||
| 25,094 | ||||||||
| Retail - Consumer Staples — 1.6% | ||||||||
| BJ’s Wholesale Club Holdings, Inc. (a) | 108 | 8,359 | ||||||
| COMMON STOCKS — continued |
| Shares | Value | |||||||
| Energy — 7.0% | ||||||||
| Oil & Gas Producers — 7.0% | ||||||||
| Diamondback Energy, Inc. | 89 | $ | 13,983 | |||||
| PDC Energy, Inc. | 178 | 12,841 | ||||||
| Valero Energy Corporation | 83 | 10,420 | ||||||
| 37,244 | ||||||||
| Financials — 13.4% | ||||||||
| Banking — 7.0% | ||||||||
| Atlantic Union Bankshares Corporation | 231 | 7,979 | ||||||
| Cullen/Frost Bankers, Inc. | 73 | 11,319 | ||||||
| First Republic Bank | 84 | 10,088 | ||||||
| Pinnacle Financial Partners, Inc. | 91 | 7,552 | ||||||
| 36,938 | ||||||||
| Institutional Financial Services — 1.4% | ||||||||
| Intercontinental Exchange, Inc. | 76 | 7,263 | ||||||
| Insurance — 5.0% | ||||||||
| Arch Capital Group Ltd. (a) | 95 | 5,462 | ||||||
| Arthur J. Gallagher & Company | 69 | 12,909 | ||||||
| Ryan Specialty Holdings, Inc. - Class A (a) | 183 | 8,208 | ||||||
| 26,579 | ||||||||
| Health Care — 8.1% | ||||||||
| Health Care Facilities & Services — 5.2% | ||||||||
| Centene Corporation (a) | 148 | 12,599 | ||||||
| McKesson Corporation | 39 | 15,186 | ||||||
| 27,785 | ||||||||
| Medical Equipment & Devices — 2.9% | ||||||||
| Cooper Companies, Inc. (The) | 37 | 10,115 | ||||||
| ICU Medical, Inc. (a) | 34 | 5,046 | ||||||
| 15,161 | ||||||||
| Industrials — 4.0% | ||||||||
| Electrical Equipment — 2.1% | ||||||||
| Fortive Corporation | 177 | 11,310 | ||||||
| Machinery — 1.9% | ||||||||
| Middleby Corporation (The) (a) | 72 | 10,070 | ||||||
| Materials — 9.2% | ||||||||
| Chemicals — 5.6% | ||||||||
| Axalta Coating Systems Ltd. (a) | 332 | 7,742 | ||||||
| CF Industries Holdings, Inc. | 101 | 10,733 | ||||||
| Univar Solutions, Inc. (a) | 438 | 11,160 | ||||||
| 29,635 | ||||||||
| Construction Materials — 1.5% | ||||||||
| Eagle Materials, Inc. | 66 | 8,072 | ||||||
The accompanying notes are an integral part of the financial statements.
26
| WESTWOOD QUALITY MIDCAP FUND |
| OCTOBER 31, 2022 |
| COMMON STOCKS — continued |
| Shares | Value | |||||||
| Materials — continued | ||||||||
| Containers & Packaging — 2.1% | ||||||||
| WestRock Company | 318 | $ | 10,831 | |||||
| Real Estate — 13.1% | ||||||||
| REITs — 13.1% | ||||||||
| Alexandria Real Estate Equities, Inc. | 90 | 13,077 | ||||||
| Americold Realty Trust | 416 | 10,088 | ||||||
| First Industrial Realty Trust, Inc. | 216 | 10,288 | ||||||
| National Storage Affiliates Trust | 136 | 5,802 | ||||||
| Realty Income Corporation | 171 | 10,648 | ||||||
| Ventas, Inc. | 234 | 9,156 | ||||||
| VICI Properties, Inc. | 328 | 10,503 | ||||||
| 69,562 | ||||||||
| Technology — 11.5% | ||||||||
| Semiconductors — 4.3% | ||||||||
| Microchip Technology, Inc. | 182 | 11,237 | ||||||
| Rambus, Inc. (a) | 383 | 11,551 | ||||||
| 22,788 | ||||||||
| Software — 2.3% | ||||||||
| Tyler Technologies, Inc. (a) | 38 | 12,287 | ||||||
| Technology Services — 4.9% | ||||||||
| CACI International, Inc. - Class A (a) | 46 | 13,985 | ||||||
| Science Applications International Corporation | 109 | 11,809 | ||||||
| 25,794 | ||||||||
| Utilities — 10.7% | ||||||||
| Electric Utilities — 10.7% | ||||||||
| Alliant Energy Corporation | 253 | 13,199 | ||||||
| CMS Energy Corporation | 238 | 13,578 | ||||||
| DTE Energy Company | 126 | 14,126 | ||||||
| Evergy, Inc. | 254 | 15,527 | ||||||
| 56,430 | ||||||||
| Total Common Stocks | ||||||||
| (Cost $522,355) | $ | 513,368 | ||||||
| MONEY MARKET FUND — 4.0% |
| Shares | Value | |||||||
| First American Treasury Obligations Fund - Class X, 3.06% (b) (Cost $21,368) | 21,368 | $ | 21,368 | |||||
| Investments at Value — 100.9% | ||||||||
| (Cost $543,723) | $ | 534,736 | ||||||
| Liabilities in Excess of Other Assets — (0.9%) | (4,978 | ) | ||||||
| Net Assets — 100.0% | $ | 529,758 | ||||||
| (a) | Non-income producing security. |
| (b) | The rate shown is the 7-day effective yield as of October 31, 2022. |
The accompanying notes are an integral part of the financial statements.
27
| WESTWOOD QUALITY SMIDCAP FUND |
| OCTOBER 31, 2022 |
| Sector Weightings (Unaudited)† |
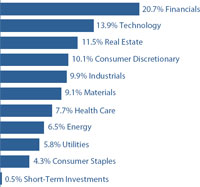
| † | Percentages are based on total investments. |
| SCHEDULE OF INVESTMENTS |
| COMMON STOCKS — 99.6% |
| Shares | Value | |||||||
| Consumer Discretionary — 10.1% | ||||||||
| Automotive — 0.6% | ||||||||
| Holley, Inc. (a) | 454,989 | $ | 1,810,856 | |||||
| Home Construction — 1.8% | ||||||||
| Armstrong World Industries, Inc. | 70,809 | 5,351,036 | ||||||
| Leisure Facilities & Services — 3.5% | ||||||||
| Papa John’s International, Inc. | 55,818 | 4,054,061 | ||||||
| Texas Roadhouse, Inc. | 60,767 | 6,012,895 | ||||||
| 10,066,956 | ||||||||
| Leisure Products — 0.9% | ||||||||
| Topgolf Callaway Brands | ||||||||
| Corporation (a) | 135,146 | 2,529,933 | ||||||
| Retail - Discretionary — 3.3% | ||||||||
| Academy Sports & Outdoors, Inc. | 74,105 | 3,262,843 | ||||||
| Advance Auto Parts, Inc. | 33,470 | 6,356,623 | ||||||
| 9,619,466 | ||||||||
| Consumer Staples — 4.3% | ||||||||
| Food — 4.3% | ||||||||
| Hostess Brands, Inc. (a) | 236,538 | 6,263,526 | ||||||
| J & J Snack Foods Corporation | 41,593 | 6,139,543 | ||||||
| 12,403,069 | ||||||||
| Energy — 6.5% | ||||||||
| Oil & Gas Producers — 6.5% | ||||||||
| Diamondback Energy, Inc. | 41,653 | 6,544,103 | ||||||
| Magnolia Oil & Gas Corporation - Class A | 240,337 | 6,171,854 | ||||||
| COMMON STOCKS — continued |
| Shares | Value | |||||||
| Energy — continued | ||||||||
| Oil & Gas Producers — continued | ||||||||
| PDC Energy, Inc. | 86,429 | $ | 6,234,988 | |||||
| 18,950,945 | ||||||||
| Financials — 20.7% | ||||||||
| Asset Management — 1.2% | ||||||||
| LPL Financial Holdings, Inc. | 13,206 | 3,376,114 | ||||||
| Banking — 12.3% | ||||||||
| Atlantic Union Bankshares | ||||||||
| Corporation | 177,619 | 6,134,960 | ||||||
| Cullen/Frost Bankers, Inc. | 49,436 | 7,665,052 | ||||||
| Pinnacle Financial Partners, Inc. | 63,710 | 5,287,293 | ||||||
| Seacoast Banking Corporation of Florida | 85,704 | 2,648,253 | ||||||
| Texas Capital Bancshares, Inc. (a) | 88,716 | 5,322,960 | ||||||
| Triumph Bancorp, Inc. (a) | 46,456 | 2,392,484 | ||||||
| Wintrust Financial Corporation | 68,380 | 6,401,736 | ||||||
| 35,852,738 | ||||||||
| Institutional Financial Services — 1.6% | ||||||||
| Perella Weinberg Partners | 602,209 | 4,745,407 | ||||||
| Insurance — 5.6% | ||||||||
| BRP Group, Inc. - Class A (a) | 99,954 | 2,833,696 | ||||||
| International General Insurance Holdings Ltd. | 374,497 | 2,842,432 | ||||||
| RenaissanceRe Holdings Ltd. | 29,425 | 4,551,459 | ||||||
| Voya Financial, Inc. | 85,928 | 5,874,038 | ||||||
| 16,101,625 | ||||||||
| Health Care — 7.8% | ||||||||
| Health Care Facilities & Services — 1.0% | ||||||||
| Premier, Inc. - Class A | 81,095 | 2,828,594 | ||||||
| Medical Equipment & Devices — 6.8% | ||||||||
| Cooper Companies, Inc. (The) | 19,279 | 5,270,686 | ||||||
| Integer Holdings Corporation (a) | 96,844 | 6,036,287 | ||||||
| Integra LifeSciences Holdings Corporation (a) | 63,449 | 3,188,312 | ||||||
| Merit Medical Systems, Inc. (a) | 75,872 | 5,217,717 | ||||||
| 19,713,002 | ||||||||
| Industrials — 9.9% | ||||||||
| Aerospace & Defense — 2.1% | ||||||||
| Moog, Inc. - Class A | 73,784 | 6,253,194 | ||||||
| Electrical Equipment — 3.6% | ||||||||
| Hubbell, Inc. | 24,339 | 5,780,026 | ||||||
| Veritiv Holdings Company | 317,345 | 4,541,207 | ||||||
| 10,321,233 | ||||||||
The accompanying notes are an integral part of the financial statements.
28
| WESTWOOD QUALITY SMIDCAP FUND |
| OCTOBER 31, 2022 |
| COMMON STOCKS — continued |
| Shares | Value | |||||||
| Industrials — continued | ||||||||
| Machinery — 4.2% | ||||||||
| AGCO Corporation | 27,553 | $ | 3,421,256 | |||||
| Albany International Corporation - Class A | 64,402 | 5,900,511 | ||||||
| Middleby Corporation (The) (a) | 20,437 | 2,858,319 | ||||||
| 12,180,086 | ||||||||
| Materials — 9.1% | ||||||||
| Chemicals — 3.5% | ||||||||
| Axalta Coating Systems Ltd. (a) | 117,070 | 2,730,073 | ||||||
| Ecovyst, Inc. (a) | 759,055 | 7,552,597 | ||||||
| 10,282,670 | ||||||||
| Construction Materials — 2.0% | ||||||||
| Eagle Materials, Inc. | 48,011 | 5,872,225 | ||||||
| Containers & Packaging — 1.5% | ||||||||
| WestRock Company | 124,559 | 4,242,479 | ||||||
| Metals & Mining — 2.1% | ||||||||
| Encore Wire Corporation | 24,455 | 3,364,764 | ||||||
| Livent Corporation (a) | 86,323 | 2,725,217 | ||||||
| 6,089,981 | ||||||||
| Real Estate — 11.5% | ||||||||
| Real Estate Owners & Developers — 1.5% | ||||||||
| Radius Global Infrastructure, Inc. - Class A (a) | 469,358 | 4,388,497 | ||||||
| REITs — 10.0% | ||||||||
| Americold Realty Trust | 192,874 | 4,677,195 | ||||||
| Corporate Office Properties Trust | 328,843 | 8,763,666 | ||||||
| First Industrial Realty Trust, Inc. | 170,839 | 8,137,062 | ||||||
| National Retail Properties, Inc. | 182,213 | 7,658,412 | ||||||
| 29,236,335 | ||||||||
| Technology — 13.9% | ||||||||
| Semiconductors — 4.2% | ||||||||
| Lattice Semiconductor Corporation (a) | 111,364 | 5,402,268 | ||||||
| Rambus, Inc. (a) | 231,426 | 6,979,808 | ||||||
| 12,382,076 | ||||||||
| Software — 0.9% | ||||||||
| Tyler Technologies, Inc. (a) | 7,781 | 2,515,831 | ||||||
| Technology Hardware — 4.2% | ||||||||
| ADTRAN Holdings, Inc. | 275,561 | 6,189,100 | ||||||
| Viavi Solutions, Inc. (a) | 396,763 | 5,991,121 | ||||||
| 12,180,221 | ||||||||
| COMMON STOCKS — continued |
| Shares | Value | |||||||
| Technology — continued | ||||||||
| Technology Services — 4.6% | ||||||||
| CACI International, Inc. - Class A (a) | 21,049 | $ | 6,399,528 | |||||
| Science Applications International Corporation | 63,460 | 6,875,256 | ||||||
| 13,274,784 | ||||||||
| Utilities — 5.8% | ||||||||
| Electric Utilities — 5.8% | ||||||||
| Alliant Energy Corporation | 111,065 | 5,794,261 | ||||||
| IDACORP, Inc. | 53,810 | 5,633,907 | ||||||
| NorthWestern Corporation | 102,438 | 5,411,799 | ||||||
| 16,839,967 | ||||||||
| Total Common Stocks | ||||||||
| (Cost $272,635,262) | $ | 289,409,320 | ||||||
| MONEY MARKET FUND — 0.5% | ||||||||
| SEI Daily Income Trust, Government Fund - Class F, 2.67% (b) (Cost $1,347,238) | 1,347,238 | $ | 1,347,238 | |||||
| Investments at Value — 100.1% | ||||||||
| (Cost $273,982,500) | $ | 290,756,558 | ||||||
| Liabilities in Excess of Other Assets — (0.1%) | (261,811 | ) | ||||||
| Net Assets — 100.0% | $ | 290,494,747 | ||||||
| (a) | Non-income producing security. |
| (b) | The rate shown is the 7-day effective yield as of October 31, 2022. |
The accompanying notes are an integral part of the financial statements.
29
| WESTWOOD QUALITY SMALLCAP FUND |
| OCTOBER 31, 2022 |
| Sector Weightings (Unaudited)† |
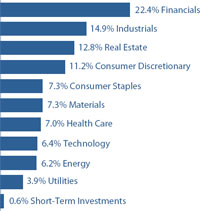
| † | Percentages are based on total investments. |
| SCHEDULE OF INVESTMENTS |
| COMMON STOCKS — 99.4% |
| Shares | Value | |||||||
| Consumer Discretionary — 11.2% | ||||||||
| Automotive — 1.1% | ||||||||
| Methode Electronics, Inc. | 266,377 | $ | 10,982,724 | |||||
| Home Construction — 3.7% | ||||||||
| Century Communities, Inc. | 439,759 | 19,573,673 | ||||||
| Masonite International Corporation (a) | 243,774 | 17,437,154 | ||||||
| 37,010,827 | ||||||||
| Leisure Facilities & Services — 3.1% | ||||||||
| Chuy’s Holdings, Inc. (a) | 366,822 | 10,747,885 | ||||||
| Papa John’s International, Inc. | 269,894 | 19,602,401 | ||||||
| 30,350,286 | ||||||||
| Retail - Discretionary — 3.3% | ||||||||
| Academy Sports & Outdoors, Inc. | 313,452 | 13,801,292 | ||||||
| Monro, Inc. | 385,562 | 18,410,585 | ||||||
| 32,211,877 | ||||||||
| Consumer Staples — 7.4% | ||||||||
| Beverages — 1.0% | ||||||||
| Duckhorn Portfolio, Inc. (The) (a) | 682,865 | 9,983,486 | ||||||
| Food — 4.3% | ||||||||
| Hostess Brands, Inc. (a) | 769,772 | 20,383,563 | ||||||
| J & J Snack Foods Corporation | 145,117 | 21,420,720 | ||||||
| 41,804,283 | ||||||||
| Household Products — 2.1% | ||||||||
| Central Garden & Pet Company - Class A (a) | 537,104 | 21,022,251 | ||||||
| COMMON STOCKS — continued |
| Shares | Value | |||||||
| Energy — 6.2% | ||||||||
| Oil & Gas Producers — 6.2% | ||||||||
| Brigham Minerals, Inc. - Class A | 734,603 | $ | 22,772,693 | |||||
| Chord Energy Corporation | 127,858 | 19,573,781 | ||||||
| Northern Oil and Gas, Inc. | 554,256 | 18,922,300 | ||||||
| 61,268,774 | ||||||||
| Financials — 22.4% | ||||||||
| Banking — 17.0% | ||||||||
| Atlantic Union Bankshares Corporation | 586,984 | 20,274,427 | ||||||
| City Holding Company | 199,314 | 20,100,817 | ||||||
| Columbia Banking System, Inc. | 592,977 | 19,846,940 | ||||||
| Provident Financial Services, Inc. | 463,737 | 10,396,984 | ||||||
| Renasant Corporation | 532,030 | 21,478,051 | ||||||
| Sandy Spring Bancorp, Inc. | 544,684 | 19,303,601 | ||||||
| Seacoast Banking Corporation of Florida | 609,182 | 18,823,724 | ||||||
| Triumph Bancorp, Inc. (a) | 332,861 | 17,142,342 | ||||||
| Veritex Holdings, Inc. | 671,230 | 21,197,443 | ||||||
| 168,564,329 | ||||||||
| Institutional Financial Services — 4.1% | ||||||||
| Moelis & Company - Class A | 439,924 | 18,679,173 | ||||||
| Piper Sandler Companies | 168,633 | 21,579,965 | ||||||
| 40,259,138 | ||||||||
| Insurance — 1.3% | ||||||||
| AMERISAFE, Inc. | 220,216 | 12,862,816 | ||||||
| Health Care — 7.0% | ||||||||
| Health Care Facilities & Services — 1.9% | ||||||||
| Patterson Companies, Inc. | 738,872 | 19,188,506 | ||||||
| Medical Equipment & Devices — 5.1% | ||||||||
| Avanos Medical, Inc. (a) | 420,425 | 9,312,414 | ||||||
| CONMED Corporation | 227,554 | 18,142,880 | ||||||
| Merit Medical Systems, Inc. (a) | 334,880 | 23,029,698 | ||||||
| 50,484,992 | ||||||||
| Industrials — 14.9% | ||||||||
| Aerospace & Defense — 2.2% | ||||||||
| Moog, Inc. - Class A | 265,537 | 22,504,261 | ||||||
| Engineering & Construction — 2.5% | ||||||||
| Comfort Systems USA, Inc. | 199,197 | 24,557,006 | ||||||
| Industrial Intermediate Products — 1.0% | ||||||||
| AZZ, Inc. | 247,256 | 9,939,691 | ||||||
| Machinery — 9.2% | ||||||||
| Alamo Group, Inc. | 124,357 | 18,912,213 | ||||||
The accompanying notes are an integral part of the financial statements.
30
| WESTWOOD QUALITY SMALLCAP FUND |
| OCTOBER 31, 2022 |
| COMMON STOCKS — continued |
| Shares | Value | |||||||
| Industrials — continued | ||||||||
| Machinery — continued | ||||||||
| Albany International Corporation - Class A | 210,212 | $ | 19,259,623 | |||||
| Altra Industrial Motion Corporation | 494,028 | 29,710,844 | ||||||
| Federal Signal Corporation | 490,986 | 22,904,497 | ||||||
| 90,787,177 | ||||||||
| Materials — 7.3% | ||||||||
| Chemicals — 4.2% | ||||||||
| Ecovyst, Inc. (a) | 975,045 | 9,701,698 | ||||||
| Innospec, Inc. | 118,152 | 11,814,018 | ||||||
| Stepan Company | 188,018 | 19,636,600 | ||||||
| 41,152,316 | ||||||||
| Forestry, Paper & Wood Products — 0.9% | ||||||||
| UFP Industries, Inc. | 129,709 | 9,239,172 | ||||||
| Metals & Mining — 2.2% | ||||||||
| Encore Wire Corporation | 85,347 | 11,742,894 | ||||||
| Livent Corporation (a) | 324,294 | 10,237,961 | ||||||
| 21,980,855 | ||||||||
| Real Estate — 12.7% | ||||||||
| Real Estate Owners & Developers — 1.5% | ||||||||
| Radius Global Infrastructure, Inc. - Class A (a) | 1,577,029 | 14,745,221 | ||||||
| REITs — 11.2% | ||||||||
| Community Healthcare Trust, Inc. | 125,561 | 4,344,411 | ||||||
| Corporate Office Properties Trust | 751,798 | 20,035,417 | ||||||
| Easterly Government Properties, Inc. | 604,588 | 10,513,785 | ||||||
| Four Corners Property Trust, Inc. | 769,790 | 19,722,020 | ||||||
| Plymouth Industrial REIT, Inc. | 982,896 | 18,124,602 | ||||||
| PotlatchDeltic Corporation | 218,822 | 9,735,391 | ||||||
| Sunstone Hotel Investors, Inc. | 967,606 | 10,788,807 | ||||||
| Urban Edge Properties | 1,330,486 | 18,786,462 | ||||||
| 112,050,895 | ||||||||
| Technology — 6.4% | ||||||||
| Semiconductors — 2.3% | ||||||||
| Rambus, Inc. (a) | 755,492 | 22,785,639 | ||||||
| Technology Hardware — 3.2% | ||||||||
| ADTRAN Holdings, Inc. | 470,711 | 10,572,169 | ||||||
| Viavi Solutions, Inc. (a) | 1,354,063 | 20,446,351 | ||||||
| 31,018,520 | ||||||||
| Technology Services — 0.9% | ||||||||
| Repay Holdings Corporation (a) | 1,504,685 | 9,163,532 | ||||||
| COMMON STOCKS — continued |
| Shares | Value | |||||||
| Utilities — 3.9% | ||||||||
| Electric Utilities — 3.9% | ||||||||
| Avista Corporation | 473,104 | $ | 19,411,457 | |||||
| NorthWestern Corporation | 359,033 | 18,967,713 | ||||||
| 38,379,170 | ||||||||
| Total Common Stocks | ||||||||
| (Cost $905,033,313) | $ | 984,297,744 | ||||||
| MONEY MARKET FUND — 0.6% | ||||||||
| SEI Daily Income Trust, Government Fund - Class F, 2.67% (b) (Cost $5,665,233) | 5,665,233 | $ | 5,665,233 | |||||
| Investments at Value — 100.0% | ||||||||
| (Cost $910,698,546) | $ | 989,962,977 | ||||||
| Liabilities in Excess of Other Assets — 0.0% (c) | (426,298 | ) | ||||||
| Net Assets — 100.0% | $ | 989,536,679 | ||||||
| (a) | Non-income producing security. |
| (b) | The rate shown is the 7-day effective yield as of October 31, 2022. |
| (c) | Percentage rounds to less than 0.1%. |
The accompanying notes are an integral part of the financial statements.
31
| WESTWOOD QUALITY ALLCAP FUND |
| OCTOBER 31, 2022 |
| Sector Weightings (Unaudited)† |
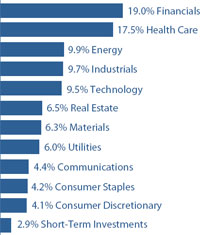
| † | Percentages are based on total investments. |
| SCHEDULE OF INVESTMENTS |
| COMMON STOCKS — 96.2% |
| Shares | Value | |||||||
| Communications — 4.3% | ||||||||
| Internet Media & Services — 1.2% | ||||||||
| Alphabet, Inc. - Class A (a) | 2,900 | $ | 274,079 | |||||
| Telecommunications — 3.1% | ||||||||
| AT&T, Inc. | 24,990 | 455,567 | ||||||
| T-Mobile US, Inc. (a) | 1,537 | 232,948 | ||||||
| 688,515 | ||||||||
| Consumer Discretionary — 4.1% | ||||||||
| Leisure Facilities & Services — 1.8% | ||||||||
| Papa John’s International, Inc. | 5,607 | 407,236 | ||||||
| Retail - Discretionary — 2.3% | ||||||||
| O’Reilly Automotive, Inc. (a) | 604 | 505,651 | ||||||
| Consumer Staples — 4.1% | ||||||||
| Beverages — 2.1% | ||||||||
| PepsiCo, Inc. | 2,559 | 464,663 | ||||||
| Retail - Consumer Staples — 2.0% | ||||||||
| Walmart, Inc. | 3,205 | 456,168 | ||||||
| Energy — 9.8% | ||||||||
| Oil & Gas Producers — 9.8% | ||||||||
| Chevron Corporation | 3,660 | 662,094 | ||||||
| Diamondback Energy, Inc. | 3,201 | 502,909 | ||||||
| PDC Energy, Inc. | 7,668 | 553,170 | ||||||
| Pioneer Natural Resources Company | 1,850 | 474,358 | ||||||
| 2,192,531 | ||||||||
| COMMON STOCKS — continued |
| Shares | Value | |||||||
| Financials — 18.9% | ||||||||
| Banking — 7.7% | ||||||||
| Atlantic Union Bankshares Corporation | 8,913 | $ | 307,855 | |||||
| Bank of America Corporation | 14,651 | 528,022 | ||||||
| JPMorgan Chase & Company | 4,189 | 527,311 | ||||||
| Pinnacle Financial Partners, Inc. | 4,361 | 361,920 | ||||||
| 1,725,108 | ||||||||
| Institutional Financial Services — 2.0% | ||||||||
| Perella Weinberg Partners | 56,180 | 442,698 | ||||||
| Insurance — 9.2% | ||||||||
| AMERISAFE, Inc. | 5,418 | 316,466 | ||||||
| Arthur J. Gallagher & Company | 2,303 | 430,845 | ||||||
| Berkshire Hathaway, Inc. - Class B (a) | 2,048 | 604,344 | ||||||
| Chubb Ltd. | 2,171 | 466,526 | ||||||
| International General Insurance Holdings Ltd. | 29,246 | 221,977 | ||||||
| 2,040,158 | ||||||||
| Health Care — 17.3% | ||||||||
| Biotech & Pharma — 5.5% | ||||||||
| Gilead Sciences, Inc. | 7,146 | 560,675 | ||||||
| Johnson & Johnson | 3,851 | 669,959 | ||||||
| 1,230,634 | ||||||||
| Health Care Facilities & Services — 6.5% | ||||||||
| CVS Health Corporation | 4,376 | 414,407 | ||||||
| McKesson Corporation | 1,290 | 502,287 | ||||||
| UnitedHealth Group, Inc. | 984 | 546,268 | ||||||
| 1,462,962 | ||||||||
| Medical Equipment & Devices — 5.3% | ||||||||
| Becton, Dickinson and Company | 1,659 | 391,474 | ||||||
| Cooper Companies, Inc. (The) | 1,439 | 393,408 | ||||||
| Danaher Corporation | 1,556 | 391,599 | ||||||
| 1,176,481 | ||||||||
| Industrials — 9.6% | ||||||||
| Aerospace & Defense — 2.0% | ||||||||
| L3Harris Technologies, Inc. | 1,834 | 452,026 | ||||||
| Electrical Equipment — 4.1% | ||||||||
| Fortive Corporation | 6,546 | 418,290 | ||||||
| Veritiv Holdings Company | 33,887 | 484,923 | ||||||
| 903,213 | ||||||||
| Machinery — 2.0% | ||||||||
| Albany International Corporation - Class A | 4,794 | 439,226 | ||||||
| Transportation & Logistics — 1.5% | ||||||||
| Norfolk Southern Corporation | 1,488 | 339,368 | ||||||
The accompanying notes are an integral part of the financial statements.
32
| WESTWOOD QUALITY ALLCAP FUND |
| OCTOBER 31, 2022 |
| COMMON STOCKS — continued |
| Shares | Value | |||||||
| Materials — 6.2% | ||||||||
| Chemicals — 6.2% | ||||||||
| Albemarle Corporation | 716 | $ | 200,387 | |||||
| Axalta Coating Systems Ltd. (a) | 9,550 | 222,706 | ||||||
| Corteva, Inc. | 7,397 | 483,320 | ||||||
| Ecovyst, Inc. (a) | 48,414 | 481,719 | ||||||
| 1,388,132 | ||||||||
| Real Estate — 6.5% | ||||||||
| Real Estate Owners & Developers — 1.5% | ||||||||
| Radius Global Infrastructure, Inc. - Class A (a) | 35,610 | 332,954 | ||||||
| REITs — 5.0% | ||||||||
| Alexandria Real Estate Equities, Inc. | 3,488 | 506,806 | ||||||
| Americold Realty Trust | 15,581 | 377,839 | ||||||
| Prologis, Inc. | 2,005 | 222,054 | ||||||
| 1,106,699 | ||||||||
| Technology — 9.4% | ||||||||
| Semiconductors — 5.9% | ||||||||
| ASML Holding N.V. - ADR | 884 | 417,619 | ||||||
| Lattice Semiconductor Corporation (a) | 6,467 | 313,714 | ||||||
| Rambus, Inc. (a) | 19,251 | 580,610 | ||||||
| 1,311,943 | ||||||||
| Software — 1.4% | ||||||||
| Microsoft Corporation | 1,306 | 303,162 | ||||||
| Technology Services — 2.1% | ||||||||
| CACI International, Inc. - Class A (a) | 1,564 | 475,503 | ||||||
| Utilities — 6.0% | ||||||||
| Electric Utilities — 6.0% | ||||||||
| CMS Energy Corporation | 8,686 | 495,536 | ||||||
| DTE Energy Company | 3,482 | 390,367 | ||||||
| WEC Energy Group, Inc. | 4,904 | 447,883 | ||||||
| 1,333,786 | ||||||||
| Total Common Stocks | ||||||||
| (Cost $21,029,518) | $ | 21,452,896 | ||||||
| MONEY MARKET FUND — 2.9% |
| Shares | Value | |||||||
| First American Treasury Obligations Fund - Class X, 3.06% (b) (Cost $644,981) | 644,981 | $ | 644,981 | |||||
| Investments at Value — 99.1% | ||||||||
| (Cost $21,674,499) | $ | 22,097,877 | ||||||
| Other Assets in Excess of Liabilities — 0.9% | 204,711 | |||||||
| Net Assets — 100.0% | $ | 22,302,588 | ||||||
ADR - American Depositary Receipt
N.V. - Naamloze Vennootschap
| (a) | Non-income producing security. |
| (b) | The rate shown is the 7-day effective yield as of October 31, 2022. |
The accompanying notes are an integral part of the financial statements.
33
| WESTWOOD TOTAL RETURN FUND |
| OCTOBER 31, 2022 |
| Sector Weightings (Unaudited)† |
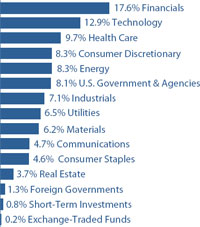
| † | Percentages are based on total investments. |
| SCHEDULE OF INVESTMENTS |
| U.S. GOVERNMENT & AGENCIES — 8.1% |
| Coupon | Maturity | Par Value | Value | |||||||||
| U.S. Treasury Bonds — 1.9% | ||||||||||||
| U.S. Treasury Bonds | 2.250% | 02/15/52 | $ | 500,000 | $ | 333,516 | ||||||
| U.S. Treasury Bonds | 2.875% | 05/15/52 | 2,600,000 | 2,007,281 | ||||||||
| 2,340,797 | ||||||||||||
| U.S. Treasury Notes — 6.2% | ||||||||||||
| U.S. Treasury Notes | 3.000% | 07/31/24 | 1,950,000 | 1,897,441 | ||||||||
| U.S. Treasury Notes | 4.250% | 09/30/24 | 3,200,000 | 3,182,750 | ||||||||
| U.S. Treasury Notes | 4.125% | 09/30/27 | 2,100,000 | 2,087,859 | ||||||||
| U.S. Treasury Notes | 2.750% | 08/15/32 | 600,000 | 536,344 | ||||||||
| 7,704,394 | ||||||||||||
| Total U.S. Government & Agencies | ||||||||||||
| (Cost $10,469,357) | $ | 10,045,191 | ||||||||||
| CONVERTIBLE BONDS — 3.9% | ||||||||||||
| Consumer Staples — 0.4% | ||||||||||||
| Tilray, Inc. | 5.000% | 10/01/23 | $ | 500,000 | $ | 481,809 | ||||||
| Health Care — 0.7% | ||||||||||||
| CONMED Corporation | 2.625% | 02/01/24 | 810,000 | 876,420 | ||||||||
| Real Estate — 1.0% | ||||||||||||
| Radius Global Infrastructure, Inc., 144A | 2.500% | 09/15/26 | 1,500,000 | 1,199,250 | ||||||||
| Technology — 1.8% | ||||||||||||
| Akamai Technologies, Inc. | 0.125% | 05/01/25 | 985,000 | 1,056,412 | ||||||||
| Ziff Davis, Inc., 144A | 1.750% | 11/01/26 | 1,182,000 | 1,144,767 | ||||||||
| 2,201,179 | ||||||||||||
| Total Convertible Bonds | ||||||||||||
| (Cost $5,166,398) | $ | 4,758,658 | ||||||||||
The accompanying notes are an integral part of the financial statements.
34
| WESTWOOD TOTAL RETURN FUND |
| OCTOBER 31, 2022 |
| Coupon | Maturity | Par Value | Value | |||||||||
| CORPORATE BONDS — 31.7% | ||||||||||||
| Communications — 1.8% | ||||||||||||
| América Móvil S.A.B. de C.V., 144A | 5.375% | 04/04/32 | $ | 465,000 | $ | 394,088 | ||||||
| Expedia Group, Inc. | 0.000% | 02/15/26 | 345,000 | 296,437 | ||||||||
| Magellanes, Inc., 144A | 4.279% | 03/15/32 | 742,000 | 598,917 | ||||||||
| Netflix, Inc. | 6.375% | 05/15/29 | 665,000 | 678,220 | ||||||||
| T-Mobile USA, Inc. | 3.375% | 04/15/29 | 325,000 | 281,611 | ||||||||
| 2,249,273 | ||||||||||||
| Consumer Discretionary — 3.9% | ||||||||||||
| At Home Group, Inc., 144A | 4.875% | 07/15/28 | 1,000,000 | 715,939 | ||||||||
| Brunswick Corporation | 2.400% | 08/18/31 | 671,000 | 466,630 | ||||||||
| Cinemark USA, Inc., 144A | 5.875% | 03/15/26 | 750,000 | 635,925 | ||||||||
| Darden Restaurants, Inc. | 4.550% | 02/15/48 | 690,000 | 487,650 | ||||||||
| Ford Motor Credit Company, LLC | 4.271% | 01/09/27 | 485,000 | 437,902 | ||||||||
| General Motors Financial Company, Inc. | 2.350% | 01/08/31 | 550,000 | 402,282 | ||||||||
| Lowe’s Companies, Inc. | 5.625% | 04/15/53 | 420,000 | 376,727 | ||||||||
| Marriott International, Inc. | 4.625% | 06/15/30 | 167,000 | 149,655 | ||||||||
| Royal Caribbean Cruises Ltd., 144A | 9.250% | 01/15/29 | 1,110,000 | 1,125,712 | ||||||||
| 4,798,422 | ||||||||||||
| Consumer Staples — 1.3% | ||||||||||||
| Rite Aid Corporation, 144A | 7.500% | 07/01/25 | 749,000 | 521,791 | ||||||||
| Vector Group Ltd., 144A | 5.750% | 02/01/29 | 700,000 | 612,500 | ||||||||
| Viterra Finance B.V., 144A | 2.000% | 04/21/26 | 627,000 | 529,220 | ||||||||
| 1,663,511 | ||||||||||||
| Energy — 2.6% | ||||||||||||
| Diamondback Energy, Inc. | 4.400% | 03/24/51 | 900,000 | 672,013 | ||||||||
| MPLX LP | 4.950% | 09/01/32 | 850,000 | 768,199 | ||||||||
| NGL Energy Operating, LLC, 144A | 7.500% | 02/01/26 | 825,000 | 745,439 | ||||||||
| Petróleos Mexicanos | 6.700% | 02/16/32 | 1,345,000 | 1,017,156 | ||||||||
| Range Resources Corporation | 8.250% | 01/15/29 | 50,000 | 51,964 | ||||||||
| 3,254,771 | ||||||||||||
| Financials — 7.2% | ||||||||||||
| AerCap Ireland Capital Ltd. | 3.300% | 01/30/32 | 691,000 | 516,699 | ||||||||
| AerCap Ireland Capital Ltd. | 3.850% | 10/29/41 | 646,000 | 428,038 | ||||||||
| Aircastle Ltd., 144A | 5.250% | 08/11/25 | 510,000 | 476,877 | ||||||||
| Apollo Management Holdings, L.P., 144A | 4.872% | 02/15/29 | 480,000 | 441,868 | ||||||||
| Ares Capital Corporation, 144A | 3.875% | 01/15/26 | 1,625,000 | 1,455,945 | ||||||||
| Avolon Holdings Funding Ltd., 144A | 2.750% | 02/21/28 | 1,500,000 | 1,148,144 | ||||||||
| Bank of America Corporation (3MO LIBOR + 131) (a) | 4.271% | 07/23/29 | 470,000 | 426,415 | ||||||||
| Compass Group Diversified Holdings, LLC, 144A | 5.250% | 04/15/29 | 1,121,000 | 964,060 | ||||||||
| Credit Suisse Group AG, 144A (SOFR + 392) (a) | 6.537% | 08/12/33 | 752,000 | 654,041 | ||||||||
| HSBC Holdings plc (SOFR + 287) (a) | 5.402% | 08/11/33 | 965,000 | 835,885 | ||||||||
| NatWest Group plc | 5.516% | 09/30/28 | 900,000 | 837,785 | ||||||||
| UBS Group AG, 144A (Yield of U.S. T-Note 0.625% 07/26 + 85) (a) | 1.494% | 08/10/27 | 865,000 | 712,673 | ||||||||
| 8,898,430 | ||||||||||||
The accompanying notes are an integral part of the financial statements.
35
| WESTWOOD TOTAL RETURN FUND |
| OCTOBER 31, 2022 |
| Coupon | Maturity | Par Value | Value | |||||||||
| CORPORATE BONDS — continued | ||||||||||||
| Health Care — 1.9% | ||||||||||||
| Bausch Health Companies, Inc., 144A | 5.500% | 11/01/25 | $ | 1,000,000 | $ | 802,500 | ||||||
| Community Health Systems, Inc., 144A | 5.250% | 05/15/30 | 1,400,000 | 969,500 | ||||||||
| Royalty Pharma plc | 3.550% | 09/02/50 | 875,000 | 532,201 | ||||||||
| 2,304,201 | ||||||||||||
| Industrials — 3.4% | ||||||||||||
| AAdvantage Loyalty IP Ltd., 144A | 5.500% | 04/20/26 | 250,000 | 238,566 | ||||||||
| Alarm.com Holdings, Inc. | 0.000% | 01/15/26 | 575,000 | 468,280 | ||||||||
| American Airlines Pass Through Trust, Series 2021-1B | 3.950% | 07/11/30 | 880,000 | 687,858 | ||||||||
| AP Moller - Maersk A/S, 144A | 4.500% | 06/20/29 | 600,000 | 543,746 | ||||||||
| Deluxe Corporation, 144A | 8.000% | 06/01/29 | 1,000,000 | 840,000 | ||||||||
| GEO Group, Inc. (The) | 10.500% | 06/30/28 | 500,000 | 500,000 | ||||||||
| Triton Container International Ltd., 144A | 0.800% | 08/01/23 | 965,000 | 923,941 | ||||||||
| 4,202,391 | ||||||||||||
| Materials — 2.9% | ||||||||||||
| Cabot Corporation | 4.000% | 07/01/29 | 395,000 | 341,927 | ||||||||
| FMC Corporation | 4.500% | 10/01/49 | 366,000 | 270,675 | ||||||||
| Glencore Funding, LLC, 144A | 3.875% | 04/27/51 | 202,000 | 130,992 | ||||||||
| Livent Corporation | 4.125% | 07/15/25 | 460,000 | 1,703,150 | ||||||||
| SSR Mining, Inc. | 2.500% | 04/01/39 | 1,155,000 | 1,203,510 | ||||||||
| 3,650,254 | ||||||||||||
| Real Estate — 0.9% | ||||||||||||
| Iron Mountain, Inc., 144A | 5.000% | 07/15/28 | 730,000 | 653,058 | ||||||||
| Kimco Realty Corporation | 4.600% | 02/01/33 | 575,000 | 508,385 | ||||||||
| 1,161,443 | ||||||||||||
| Technology — 3.5% | ||||||||||||
| DXC Technology Company | 1.800% | 09/15/26 | 671,000 | 576,208 | ||||||||
| Kyndryl Holdings, Inc., 144A | 2.050% | 10/15/26 | 336,000 | 262,692 | ||||||||
| MongoDB, Inc. | 0.250% | 01/15/26 | 550,000 | 618,200 | ||||||||
| MPH Acquisition Holdings, LLC, 144A | 5.500% | 09/01/28 | 1,100,000 | 949,550 | ||||||||
| NICE Ltd. | 0.000% | 09/15/25 | 1,040,000 | 969,280 | ||||||||
| Oracle Corporation | 2.875% | 03/25/31 | 116,000 | 91,495 | ||||||||
| Picard Midco, Inc., 144A | 6.500% | 03/31/29 | 1,000,000 | 868,994 | ||||||||
| 4,336,419 | ||||||||||||
| Utilities — 2.3% | ||||||||||||
| Berkshire Hathaway Energy Company, 144A | 4.600% | 05/01/53 | 1,500,000 | 1,227,046 | ||||||||
| Consolidated Edison Company of New York, Inc. | 3.850% | 06/15/46 | 1,069,000 | 773,873 | ||||||||
| Piedmont Natural Gas Company, Inc. | 5.050% | 05/15/52 | 1,000,000 | 837,737 | ||||||||
| 2,838,656 | ||||||||||||
| Total Corporate Bonds | ||||||||||||
| (Cost $44,054,330) | $ | 39,357,771 | ||||||||||
| FOREIGN GOVERNMENTS — 1.3% | ||||||||||||
| Chile Government International Bond | 3.500% | 01/31/34 | $ | 1,000,000 | $ | 808,882 | ||||||
| Republic of South Africa Government | 5.875% | 04/20/32 | 885,000 | 756,073 | ||||||||
| Total Foreign Governments | ||||||||||||
| (Cost $1,884,317) | $ | 1,564,955 | ||||||||||
The accompanying notes are an integral part of the financial statements.
36
| WESTWOOD TOTAL RETURN FUND |
| OCTOBER 31, 2022 |
| COMMON STOCKS — 48.8% |
| Shares | Value | |||||||
| Communications — 1.4% | ||||||||
| Entertainment Content — 1.4% | ||||||||
| Activision Blizzard, Inc. | 23,994 | $ | 1,746,763 | |||||
| Consumer Discretionary — 4.3% | ||||||||
| Automotive — 0.8% | ||||||||
| Harley-Davidson, Inc. | 23,944 | 1,029,592 | ||||||
| E-Commerce Discretionary — 0.5% | ||||||||
| Amazon.com, Inc. (b) | 6,510 | 666,884 | ||||||
| Home Construction — 0.7% | ||||||||
| Toll Brothers, Inc. | 18,738 | 807,233 | ||||||
| Leisure Facilities & Services — 1.2% | ||||||||
| McDonald’s Corporation | 5,665 | 1,544,619 | ||||||
| Retail - Discretionary — 1.1% | ||||||||
| Home Depot, Inc. (The) | 4,511 | 1,335,843 | ||||||
| Consumer Staples — 2.9% | ||||||||
| Retail - Consumer Staples — 2.1% | ||||||||
| Costco Wholesale Corporation | 2,328 | 1,167,492 | ||||||
| Walmart, Inc. | 9,832 | 1,399,389 | ||||||
| 2,566,881 | ||||||||
| Tobacco & Cannabis — 0.8% | ||||||||
| Altria Group, Inc. | 21,444 | 992,214 | ||||||
| Energy — 5.6% | ||||||||
| Oil & Gas Producers — 4.9% | ||||||||
| Devon Energy Corporation | 31,928 | 2,469,631 | ||||||
| Energy Transfer, L.P. | 211,260 | 2,697,790 | ||||||
| EOG Resources, Inc. | 6,531 | 891,612 | ||||||
| 6,059,033 | ||||||||
| Renewable Energy — 0.7% | ||||||||
| Atlantica Sustainable Infrastructure plc | 31,870 | 883,118 | ||||||
| Financials — 10.4% | ||||||||
| Asset Management — 2.0% | ||||||||
| Blackstone, Inc. | 12,121 | 1,104,708 | ||||||
| Charles Schwab Corporation (The) | 17,226 | 1,372,395 | ||||||
| 2,477,103 | ||||||||
| Banking — 5.2% | ||||||||
| JPMorgan Chase & Company | 19,631 | 2,471,150 | ||||||
| Texas Capital Bancshares, Inc. (b) | 31,517 | 1,891,020 | ||||||
| Truist Financial Corporation | 24,153 | 1,081,813 | ||||||
| COMMON STOCKS — continued |
| Shares | Value | |||||||
| Financials — continued | ||||||||
| Banking — continued | ||||||||
| Wells Fargo & Company | 20,945 | $ | 963,261 | |||||
| 6,407,244 | ||||||||
| Institutional Financial Services — 0.6% | ||||||||
| Moelis & Company - Class A | 17,407 | 739,101 | ||||||
| Insurance — 0.9% | ||||||||
| Chubb Ltd. | 4,902 | 1,053,391 | ||||||
| Specialty Finance — 1.7% | ||||||||
| Annaly Capital Management, Inc. | 51,196 | 949,686 | ||||||
| MGIC Investment Corporation | 88,847 | 1,212,761 | ||||||
| 2,162,447 | ||||||||
| Health Care — 5.8% | ||||||||
| Biotech & Pharma — 5.2% | ||||||||
| Amgen, Inc. | 6,779 | 1,832,703 | ||||||
| Bristol-Myers Squibb Company | 24,367 | 1,887,711 | ||||||
| Gilead Sciences, Inc. | 26,210 | 2,056,437 | ||||||
| Johnson & Johnson | 3,969 | 690,487 | ||||||
| 6,467,338 | ||||||||
| Medical Equipment & Devices — 0.6% | ||||||||
| Medtronic plc | 8,468 | 739,595 | ||||||
| Industrials — 3.6% | ||||||||
| Aerospace & Defense — 0.9% | ||||||||
| Moog, Inc. - Class A | 13,785 | 1,168,279 | ||||||
| Diversified Industrials — 0.8% | ||||||||
| Honeywell International, Inc. | 5,101 | 1,040,706 | ||||||
| Machinery — 1.0% | ||||||||
| Deere & Company | 3,119 | 1,234,562 | ||||||
| Transportation & Logistics — 0.9% | ||||||||
| Union Pacific Corporation | 5,397 | 1,063,965 | ||||||
| Materials — 3.2% | ||||||||
| Chemicals — 0.7% | ||||||||
| Dow, Inc. | 17,467 | 816,408 | ||||||
| Metals & Mining — 2.5% | ||||||||
| Barrick Gold Corporation | 51,297 | 770,994 | ||||||
| Freeport-McMoRan, Inc. | 46,278 | 1,466,550 | ||||||
| Glencore plc - ADR | 79,268 | 907,618 | ||||||
| 3,145,162 | ||||||||
The accompanying notes are an integral part of the financial statements.
37
| WESTWOOD TOTAL RETURN FUND |
| OCTOBER 31, 2022 |
| COMMON STOCKS — continued |
| Shares | Value | |||||||
| Real Estate — 1.7% | ||||||||
| REITs — 1.7% | ||||||||
| Simon Property Group, Inc. | 12,738 | $ | 1,388,187 | |||||
| VICI Properties, Inc. | 24,105 | 771,842 | ||||||
| 2,160,029 | ||||||||
| Technology — 7.5% | ||||||||
| Semiconductors — 0.7% | ||||||||
| NVIDIA Corporation | 6,693 | 903,354 | ||||||
| Software — 2.3% | ||||||||
| Microsoft Corporation | 9,049 | 2,100,545 | ||||||
| Workday, Inc. - Class A (b) | 4,522 | 704,618 | ||||||
| 2,805,163 | ||||||||
| Technology Hardware — 3.8% | ||||||||
| Apple, Inc. | 30,451 | 4,669,356 | ||||||
| Technology Services — 0.7% | ||||||||
| International Business Machines Corporation | 6,694 | 925,713 | ||||||
| Utilities — 2.4% | ||||||||
| Electric Utilities — 2.4% | ||||||||
| CMS Energy Corporation | 10,231 | 583,679 | ||||||
| NextEra Energy Partners, L.P. | 20,334 | 1,506,139 | ||||||
| WEC Energy Group, Inc. | 9,076 | 828,911 | ||||||
| 2,918,729 | ||||||||
| Total Common Stocks | ||||||||
| (Cost $54,589,759) | $ | 60,529,825 | ||||||
| EXCHANGE-TRADED FUNDS — 0.2% | ||||||||
| JPMorgan Nasdaq Equity Premium Income ETF (Cost $283,222) | 6,089 | $ | 262,558 | |||||
| PREFERRED STOCKS — 4.5% | ||||||||
| Communications — 1.4% | ||||||||
| Telecommunications — 1.4% | ||||||||
| 2020 Cash Mandatory Exchangeable Trust, 5.250%,144A (b) | 1,425 | $ | 1,769,850 | |||||
| Health Care — 1.3% | ||||||||
| Medical Equipment & Devices — 1.3% | ||||||||
| Boston Scientific Corporation, 5.500% - Series A | 14,200 | 1,562,568 | ||||||
| PREFERRED STOCKS — continued |
| Shares | Value | |||||||
| Utilities — 1.8% | ||||||||
| Electric Utilities — 1.8% | ||||||||
| AES Corporation (The), 6.875% | 12,250 | $ | 1,206,747 | |||||
| American Electric Power Company, Inc., 6.125% | 21,450 | 1,066,494 | ||||||
| 2,273,241 | ||||||||
| Total Preferred Stocks | ||||||||
| (Cost $5,307,270) | $ | 5,605,659 | ||||||
| MONEY MARKET FUND — 0.8% | ||||||||
| SEI Daily Income Trust, Government Fund - Class F, 2.67% (c) (Cost $1,028,165) | 1,028,165 | $ | 1,028,165 | |||||
| Investments at Value — 99.3% | ||||||||
| (Cost $122,782,818) | $ | 123,152,782 | ||||||
| Other Assets in Excess of Liabilities — 0.7% | 892,544 | |||||||
| Net Assets — 100.0% | $ | 124,045,326 | ||||||
144A - Security was purchased in a transaction exempt from registration in compliance with Rule 144A of the Securities Act of 1933. This security may be resold in transactions exempt from registration, normally to qualified institutional buyers. The total value of such securities is $24,257,591 as of October 31, 2022, representing 19.6% of net assets.
A/S - Aktieselskab
ADR - American Depositary Receipt
AG - Aktiengesellschaft
B.V. - Besloten Vennootschap
LIBOR - London Interbank Offered Rate
plc - Public Limited Company
SOFR - Secured Overnight Financing Rate
S.A.B. de C.V. - Societe Anonima Bursatil de Capital Variable
T-Note - U.S. Treasury Note
| (a) | Variable rate security. Interest rate resets periodically. The rate shown is the effective interest rate as of October 31, 2022. For securities based on a published reference rate and spread, the reference rate and spread (in basis points) are indicated parenthetically. |
| (b) | Non-income producing security. |
| (c) | The rate shown is the 7-day effective yield as of October 31, 2022. |
The accompanying notes are an integral part of the financial statements.
38
| WESTWOOD INCOME OPPORTUNITY FUND |
| OCTOBER 31, 2022 |
| Sector Weightings (Unaudited)† |
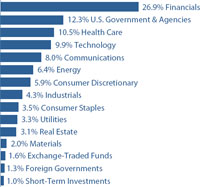
| † | Percentages are based on total investments. |
| SCHEDULE OF INVESTMENTS |
| U.S. GOVERNMENT & AGENCIES — 12.3% |
| Coupon | Maturity | Par Value | Value | |||||||||
| U.S. Treasury Bonds — 2.5% | ||||||||||||
| U.S. Treasury Bonds | 1.875% | 11/15/51 | $ | 6,753,000 | $ | 4,090,841 | ||||||
| U.S. Treasury Bonds | 2.250% | 02/15/52 | 11,108,000 | 7,409,383 | ||||||||
| U.S. Treasury Bonds | 2.875% | 05/15/52 | 6,000,000 | 4,632,187 | ||||||||
| 16,132,411 | ||||||||||||
| U.S. Treasury Notes — 9.8% | ||||||||||||
| U.S. Treasury Notes | 4.250% | 09/30/24 | 32,000,000 | 31,827,500 | ||||||||
| U.S. Treasury Notes | 2.875% | 06/15/25 | 7,000,000 | 6,726,289 | ||||||||
| U.S. Treasury Notes | 2.500% | 03/31/27 | 9,735,000 | 9,029,593 | ||||||||
| U.S. Treasury Notes | 2.625% | 05/31/27 | 5,000,000 | 4,658,984 | ||||||||
| U.S. Treasury Notes | 3.250% | 06/30/27 | 3,000,000 | 2,869,688 | ||||||||
| U.S. Treasury Notes | 4.125% | 09/30/27 | 5,000,000 | 4,971,094 | ||||||||
| U.S. Treasury Notes | 1.625% | 08/15/29 | 576,000 | 490,702 | ||||||||
| 2.750% | 08/15/32 | 3,150,000 | 2,815,805 | |||||||||
| 63,389,655 | ||||||||||||
| Total U.S. Government & Agencies | ||||||||||||
| (Cost $84,553,493) | $ | 79,522,066 | ||||||||||
| CONVERTIBLE BONDS — 2.0% | ||||||||||||
| Communications — 0.3% | ||||||||||||
| Snap, Inc. | 0.125% | 03/01/28 | $ | 3,439,000 | $ | 2,257,704 | ||||||
| Health Care — 0.7% | ||||||||||||
| Exact Sciences Corporation | 0.375% | 03/15/27 | 6,523,000 | 4,602,792 | ||||||||
| Technology — 1.0% | ||||||||||||
| Akamai Technologies, Inc. | 0.125% | 05/01/25 | 5,733,000 | 6,148,642 | ||||||||
| Total Convertible Bonds | ||||||||||||
| (Cost $16,668,000) | $ | 13,009,138 | ||||||||||
The accompanying notes are an integral part of the financial statements.
39
| WESTWOOD INCOME OPPORTUNITY FUND |
| OCTOBER 31, 2022 |
| CORPORATE BONDS — 41.7% |
| Coupon | Maturity | Par Value | Value | |||||||||
| Communications — 3.7% | ||||||||||||
| América Móvil S.A.B. de C.V., 144A | 5.375% | 04/04/32 | $ | 3,050,000 | $ | 2,584,875 | ||||||
| Charter Communications Operating, LLC | 3.500% | 03/01/42 | 3,230,000 | 2,009,917 | ||||||||
| Comcast Corporation | 0.250% | 05/20/27 | 3,000,000 | 2,568,785 | ||||||||
| DISH DBS Corporation | 5.875% | 11/15/24 | 4,300,000 | 3,970,620 | ||||||||
| Magallanes Inc., 144A | 4.054% | 03/15/29 | 2,630,000 | 2,233,945 | ||||||||
| Magallanes, Inc., 144A | 4.279% | 03/15/32 | 4,568,000 | 3,687,136 | ||||||||
| Time Warner Cable, Inc. | 4.500% | 09/15/42 | 3,475,000 | 2,366,170 | ||||||||
| Vodafone Group plc | 4.875% | 06/19/49 | 5,627,000 | 4,337,996 | ||||||||
| 23,759,444 | ||||||||||||
| Consumer Discretionary — 3.7% | ||||||||||||
| AutoNation, Inc. | 3.850% | 03/01/32 | 3,280,000 | 2,549,825 | ||||||||
| Brunswick Corporation | 2.400% | 08/18/31 | 4,145,000 | 2,882,537 | ||||||||
| Lowe’s Companies, Inc. | 5.625% | 04/15/53 | 2,555,000 | 2,291,759 | ||||||||
| Marriott International, Inc. | 4.625% | 06/15/30 | 1,581,000 | 1,416,791 | ||||||||
| Ross Stores, Inc. | 4.600% | 04/15/25 | 6,085,000 | 5,956,391 | ||||||||
| Royal Caribbean Cruises Ltd., 144A | 9.250% | 01/15/29 | 3,540,000 | 3,590,109 | ||||||||
| Thor Industries, Inc., 144A | 4.000% | 10/15/29 | 2,760,000 | 2,232,233 | ||||||||
| Whirlpool Corporation | 4.750% | 02/26/29 | 3,540,000 | 3,292,916 | ||||||||
| 24,212,561 | ||||||||||||
| Consumer Staples — 2.5% | ||||||||||||
| 7-Eleven, Inc., 144A | 0.950% | 02/10/26 | 2,170,000 | 1,865,908 | ||||||||
| BAT Capital Corporation | 7.750% | 10/19/32 | 3,576,000 | 3,652,994 | ||||||||
| Smithfield Foods, Inc., 144A | 3.000% | 10/15/30 | 2,799,000 | 2,125,200 | ||||||||
| Vector Group Ltd., 144A | 5.750% | 02/01/29 | 3,727,000 | 3,261,125 | ||||||||
| Viterra Finance B.V., 144A | 2.000% | 04/21/26 | 4,528,000 | 3,821,868 | ||||||||
| Viterra Finance B.V., 144A | 4.900% | 04/21/27 | 1,869,000 | 1,707,173 | ||||||||
| 16,434,268 | ||||||||||||
| Energy — 2.1% | ||||||||||||
| BP Capital Markets America, Inc. | 3.543% | 04/06/27 | 4,159,000 | 3,867,446 | ||||||||
| Diamondback Energy, Inc. | 3.125% | 03/24/31 | 1,159,000 | 946,217 | ||||||||
| NGL Energy Operating, LLC, 144A | 7.500% | 02/01/26 | 3,313,000 | 2,993,504 | ||||||||
| Petróleos Mexicanos | 6.700% | 02/16/32 | 6,515,000 | 4,926,969 | ||||||||
| Schlumberger Finance Canada Ltd. | 1.400% | 09/17/25 | 1,001,000 | 905,576 | ||||||||
| 13,639,712 | ||||||||||||
| Financials — 19.2% | ||||||||||||
| AerCap Ireland Capital Ltd. | 6.500% | 07/15/25 | 1,184,000 | 1,165,107 | ||||||||
| AerCap Ireland Capital Ltd. | 3.300% | 01/30/32 | 3,939,000 | 2,945,406 | ||||||||
| AerCap Ireland Capital Ltd. | 3.850% | 10/29/41 | 3,927,000 | 2,602,022 | ||||||||
| Aircastle Ltd., 144A | 5.250% | 08/11/25 | 4,209,000 | 3,935,638 | ||||||||
| Ally Financial, Inc. | 1.450% | 10/02/23 | 382,000 | 366,345 | ||||||||
| Apollo Management Holdings, L.P., 144A | 4.872% | 02/15/29 | 4,325,000 | 3,981,413 | ||||||||
| Bank of America Corporation | 3.311% | 04/22/42 | 8,650,000 | 5,966,005 | ||||||||
| Bank of America Corporation (SOFR + 96) (a) | 1.734% | 07/22/27 | 4,280,000 | 3,663,396 | ||||||||
| Barclays plc | 4.375% | 01/12/26 | 9,743,000 | 9,043,147 | ||||||||
| Berkshire Hathaway Finance Corporation | 2.850% | 10/15/50 | 6,491,000 | 3,938,156 | ||||||||
| BNP Paribas S.A., 144A (b) | 4.625% | 02/25/31 | 4,146,000 | 2,897,017 | ||||||||
The accompanying notes are an integral part of the financial statements.
40
| WESTWOOD INCOME OPPORTUNITY FUND |
| OCTOBER 31, 2022 |
| CORPORATE BONDS — continued |
| Coupon | Maturity | Par Value | Value | |||||||||
| Financials — continued | ||||||||||||
| Capital One Financial Corporation (Yield of U.S. T-Note 1.625% 02/31 + 112) (a) | 2.359% | 07/29/32 | $ | 4,520,000 | $ | 3,108,780 | ||||||
| Compass Group Diversified Holdings, LLC, 144A | 5.250% | 04/15/29 | 5,893,000 | 5,067,980 | ||||||||
| Corebridge Financial, Inc., 144A | 3.500% | 04/04/25 | 2,259,000 | 2,128,250 | ||||||||
| Credit Suisse Group AG, 144A (a) | 6.537% | 08/12/33 | 4,418,000 | 3,842,488 | ||||||||
| Goldman Sachs Group, Inc. (The) | 3.615% | 03/15/28 | 4,234,000 | 3,814,900 | ||||||||
| Goldman Sachs Group, Inc. (The) (SOFR + 128.1) (a) | 2.615% | 04/22/32 | 822,000 | 627,109 | ||||||||
| Hercules Capital, Inc. | 2.625% | 09/16/26 | 3,959,000 | 3,224,604 | ||||||||
| HSBC Holdings plc (SOFR + 287) (a) | 5.402% | 08/11/33 | 5,793,000 | 5,017,909 | ||||||||
| JPMorgan Chase & Company | 3.650% | 12/31/49 | 6,940,000 | 5,742,503 | ||||||||
| JPMorgan Chase & Company | 1.561% | 12/10/25 | 3,170,000 | 2,890,071 | ||||||||
| Mitsubishi UFJ Financial Group, Inc. (Yield of U.S. T-Note with a constant maturity of 1 year + 55) (a) | 0.953% | 07/19/25 | 5,075,000 | 4,656,856 | ||||||||
| Morgan Stanley | 1.512% | 07/20/27 | 6,715,000 | 5,682,101 | ||||||||
| Morgan Stanley (SOFR + 262) (a) | 5.297% | 04/20/37 | 4,138,000 | 3,666,382 | ||||||||
| NatWest Group plc | 5.516% | 09/30/28 | 5,300,000 | 4,933,622 | ||||||||
| Nomura Holdings, Inc. | 2.679% | 07/16/30 | 2,331,000 | 1,752,516 | ||||||||
| PNC Financial Services Group, Inc. (The) | 3.400% | 12/31/49 | 4,880,000 | 3,641,700 | ||||||||
| Royal Bank of Canada | 1.600% | 01/21/25 | 1,800,000 | 1,661,960 | ||||||||
| UBS Group AG, 144A (Yield of U.S. T-Note 0.625% 07/26 + 85) (a) | 1.494% | 08/10/27 | 7,975,000 | 6,570,603 | ||||||||
| Unum Group | 4.125% | 06/15/51 | 5,315,000 | 3,332,764 | ||||||||
| US Bancorp | 3.700% | 12/31/49 | 3,675,000 | 2,846,288 | ||||||||
| Wells Fargo & Company (Yield of U.S. T-Note with a constant maturity of 5 years + 345.3) (a)(b) | 3.900% | 12/31/49 | 6,699,000 | 5,687,451 | ||||||||
| Westpac Banking Corporation | 3.133% | 11/18/41 | 6,479,000 | 3,962,578 | ||||||||
| 124,363,067 | ||||||||||||
| Health Care — 2.6% | ||||||||||||
| Amgen, Inc. | 4.663% | 06/15/51 | 6,000,000 | 4,934,263 | ||||||||
| Bausch Health Companies, Inc., 144A | 6.125% | 02/01/27 | 4,177,000 | 2,742,548 | ||||||||
| Community Health Systems, Inc., 144A | 5.250% | 05/15/30 | 5,575,000 | 3,860,687 | ||||||||
| HCA, Inc., 144A | 4.625% | 03/15/52 | 5,571,000 | 4,087,052 | ||||||||
| Royalty Pharma plc | 3.550% | 09/02/50 | 1,915,000 | 1,164,759 | ||||||||
| 16,789,309 | ||||||||||||
| Industrials — 0.9% | ||||||||||||
| Delta Air Lines, Inc. | 7.375% | 01/15/26 | 557,000 | 568,691 | ||||||||
| Flowserve Corporation | 3.500% | 10/01/30 | 1,867,000 | 1,489,991 | ||||||||
| Sempra Infrastructure, 144A | 3.250% | 01/15/32 | 5,198,000 | 4,064,542 | ||||||||
| 6,123,224 | ||||||||||||
| Materials — 0.1% | ||||||||||||
| Glencore Funding, LLC, 144A | 3.875% | 04/27/51 | 1,342,000 | 870,254 | ||||||||
| Real Estate — 1.9% | ||||||||||||
| American Tower Corporation | 2.950% | 01/15/51 | 2,070,000 | 1,172,387 | ||||||||
| Kimco Realty Corporation | 4.600% | 02/01/33 | 4,600,000 | 4,067,082 | ||||||||
| Sabra Health Care, L.P. | 3.200% | 12/01/31 | 3,313,000 | 2,385,709 | ||||||||
| Simon Property Group, L.P. | 2.650% | 02/01/32 | 4,104,000 | 3,115,936 | ||||||||
| Vornado Realty, L.P. | 3.400% | 06/01/31 | 1,757,000 | 1,302,858 | ||||||||
| 12,043,972 | ||||||||||||
The accompanying notes are an integral part of the financial statements.
41
| WESTWOOD INCOME OPPORTUNITY FUND |
| OCTOBER 31, 2022 |
| CORPORATE BONDS — continued |
| Coupon | Maturity | Par Value | Value | |||||||||
| Technology — 3.7% | ||||||||||||
| Dell International, LLC | 8.350% | 07/15/46 | $ | 3,980,000 | $ | 4,216,986 | ||||||
| DXC Technology Company | 1.800% | 09/15/26 | 4,104,000 | 3,524,228 | ||||||||
| Jabil, Inc. | 1.700% | 04/15/26 | 2,909,000 | 2,521,714 | ||||||||
| Kyndryl Holdings, Inc. 144A | 2.050% | 10/15/26 | 2,124,000 | 1,660,587 | ||||||||
| Microchip Technology, Inc. | 2.670% | 09/01/23 | 1,266,000 | 1,234,897 | ||||||||
| Micron Technology, Inc. | 2.703% | 04/15/32 | 188,000 | 137,597 | ||||||||
| NXP USA, Inc. | 5.000% | 01/15/33 | 4,350,000 | 3,897,942 | ||||||||
| Oracle Corporation | 2.875% | 03/25/31 | 779,000 | 614,436 | ||||||||
| Picard Midco, Inc., 144A | 6.500% | 03/31/29 | 3,675,000 | 3,193,554 | ||||||||
| VMware, Inc. | 4.700% | 05/15/30 | 2,911,000 | 2,626,552 | ||||||||
| 23,628,493 | ||||||||||||
| Utilities — 1.3% | ||||||||||||
| NextEra Energy Capital Holdings, Inc. | 2.440% | 01/15/32 | 1,313,000 | 1,012,445 | ||||||||
| Pacific Gas and Electric Company | 4.950% | 07/01/50 | 4,895,000 | 3,635,089 | ||||||||
| Piedmont Natural Gas Company, Inc. | 5.050% | 05/15/52 | 4,166,000 | 3,490,013 | ||||||||
| 8,137,547 | ||||||||||||
| Total Corporate Bonds | ||||||||||||
| (Cost $319,200,733) | $ | 270,001,851 | ||||||||||
| FOREIGN GOVERNMENTS — 1.3% | ||||||||||||
| Chile Government International Bond | 2.750% | 01/31/27 | $ | 266,000 | $ | 239,499 | ||||||
| Chile Government International Bond | 4.340% | 03/07/42 | 270,000 | 208,403 | ||||||||
| Mexico Government International Bond | 2.659% | 05/24/31 | 890,000 | 691,081 | ||||||||
| Mexico Government International Bond | 4.875% | 05/19/33 | 482,000 | 425,761 | ||||||||
| Mexico Government International Bond | 3.500% | 02/12/34 | 1,018,000 | 781,781 | ||||||||
| Mexico Government International Bond | 3.771% | 05/24/61 | 835,000 | 489,378 | ||||||||
| Panama Government International Bond | 3.870% | 07/23/60 | 508,000 | 295,986 | ||||||||
| Peruvian Government International Bond | 2.783% | 01/23/31 | 735,000 | 579,962 | ||||||||
| Peruvian Government International Bond | 3.300% | 03/11/41 | 749,000 | 504,973 | ||||||||
| Saudi Government International Bond, 144A | 2.250% | 02/02/33 | 5,835,000 | 4,478,362 | ||||||||
| Total Foreign Governments | ||||||||||||
| (Cost $11,556,211) | $ | 8,695,186 | ||||||||||
The accompanying notes are an integral part of the financial statements.
42
| WESTWOOD INCOME OPPORTUNITY FUND |
| OCTOBER 31, 2022 |
| COMMON STOCKS — 34.2% |
| Shares | Value | |||||||
| Communications — 2.7% | ||||||||
| Entertainment Content — 1.5% | ||||||||
| Activision Blizzard, Inc. | 127,767 | $ | 9,301,437 | |||||
| Internet Media & Services — 0.4% | ||||||||
| Meta Platforms, Inc. - Class A (c) | 30,185 | 2,812,035 | ||||||
| Telecommunications — 0.8% | ||||||||
| AT&T, Inc. | 291,652 | 5,316,816 | ||||||
| Consumer Discretionary — 2.1% | ||||||||
| Home Construction — 0.9% | ||||||||
| Toll Brothers, Inc. | 133,335 | 5,744,072 | ||||||
| Retail - Discretionary — 1.2% | ||||||||
| Home Depot, Inc. (The) | 26,838 | 7,947,537 | ||||||
| Consumer Staples — 0.9% | ||||||||
| Retail - Consumer Staples — 0.9% | ||||||||
| Walmart, Inc. | 42,857 | 6,099,837 | ||||||
| Energy — 4.2% | ||||||||
| Oil & Gas Producers — 3.1% | ||||||||
| Energy Transfer, L.P. | 935,672 | 11,948,531 | ||||||
| EOG Resources, Inc. | 59,029 | 8,058,639 | ||||||
| 20,007,170 | ||||||||
| Oil & Gas Services & Equipment — 0.7% | ||||||||
| Baker Hughes Company | 163,719 | 4,528,468 | ||||||
| Renewable Energy — 0.4% | ||||||||
| Atlantica Sustainable Infrastructure plc | 103,880 | 2,878,515 | ||||||
| Financials — 6.8% | ||||||||
| Asset Management — 1.9% | ||||||||
| Blackstone, Inc. | 52,373 | 4,773,275 | ||||||
| Charles Schwab Corporation (The) | 92,107 | 7,338,165 | ||||||
| 12,111,440 | ||||||||
| Banking — 2.7% | ||||||||
| Bank of America Corporation | 196,286 | 7,074,147 | ||||||
| JPMorgan Chase & Company | 83,727 | 10,539,555 | ||||||
| 17,613,702 | ||||||||
| Institutional Financial Services — 0.7% | ||||||||
| Moelis & Company - Class A | 103,710 | 4,403,527 | ||||||
| Specialty Finance — 1.5% | ||||||||
| Annaly Capital Management, Inc. | 236,545 | 4,387,909 | ||||||
| MGIC Investment Corporation | 382,309 | 5,218,518 | ||||||
| 9,606,427 | ||||||||
| COMMON STOCKS — continued |
| Shares | Value | |||||||
| Health Care — 5.8% | ||||||||
| Biotech & Pharma — 4.4% | ||||||||
| Amgen, Inc. | 30,983 | $ | 8,376,254 | |||||
| Bristol-Myers Squibb Company | 167,042 | 12,940,744 | ||||||
| Gilead Sciences, Inc. | 86,979 | 6,824,372 | ||||||
| �� | 28,141,370 | |||||||
| Medical Equipment & Devices — 1.4% | ||||||||
| Becton, Dickinson and Company | 18,356 | 4,331,465 | ||||||
| Medtronic plc | 56,756 | 4,957,069 | ||||||
| 9,288,534 | ||||||||
| Industrials — 3.4% | ||||||||
| Aerospace & Defense — 0.8% | ||||||||
| Lockheed Martin Corporation | 9,945 | 4,840,033 | ||||||
| Diversified Industrials — 1.0% | ||||||||
| Honeywell International, Inc. | 32,719 | 6,675,330 | ||||||
| Machinery — 0.8% | ||||||||
| Deere & Company | 12,899 | 5,105,682 | ||||||
| Transportation & Logistics — 0.8% | ||||||||
| Union Pacific Corporation | 26,821 | 5,287,492 | ||||||
| Materials — 1.8% | ||||||||
| Metals & Mining — 1.8% | ||||||||
| Barrick Gold Corporation | 424,236 | 6,376,267 | ||||||
| Freeport-McMoRan, Inc. | 174,110 | 5,517,546 | ||||||
| 11,893,813 | ||||||||
| Real Estate — 1.2% | ||||||||
| REITs — 1.2% | ||||||||
| Simon Property Group, Inc. | 40,173 | 4,378,054 | ||||||
| VICI Properties, Inc. | 102,117 | 3,269,786 | ||||||
| 7,647,840 | ||||||||
| Technology — 5.3% | ||||||||
| Semiconductors — 0.6% | ||||||||
| NVIDIA Corporation | 29,531 | 3,985,799 | ||||||
| Software — 1.5% | ||||||||
| Microsoft Corporation | 42,435 | 9,850,437 | ||||||
| Technology Hardware — 2.2% | ||||||||
| Apple, Inc. | 93,610 | 14,354,157 | ||||||
| Technology Services — 1.0% | ||||||||
| International Business Machines Corporation | 44,781 | 6,192,765 | ||||||
| Total Common Stocks | ||||||||
| (Cost $192,737,271) | $ | 221,634,235 | ||||||
The accompanying notes are an integral part of the financial statements.
43
| WESTWOOD INCOME OPPORTUNITY FUND |
| OCTOBER 31, 2022 |
| EXCHANGE-TRADED FUNDS — 1.6% |
| Shares | Value | |||||||
| Global X Nasdaq 100 Covered Call ETF | 549,506 | $ | 8,869,027 | |||||
| JPMorgan Nasdaq Equity Premium Income ETF | 29,407 | 1,268,030 | ||||||
| Total Exchange-Traded Funds | ||||||||
| (Cost $12,358,496) | $ | 10,137,057 | ||||||
| PREFERRED STOCKS — 5.5% | ||||||||
| Communications — 1.3% | ||||||||
| Telecommunications — 1.3% | ||||||||
| 2020 Cash Mandatory Exchangeable Trust, 5.250%, 144A (c) | 6,575 | $ | 8,166,150 | |||||
| Financials — 0.8% | ||||||||
| Banking — 0.8% | ||||||||
| Truist Financial Corporation, 5.500% | 5,483,000 | 5,318,510 | ||||||
| Health Care — 1.4% | ||||||||
| Medical Equipment & Devices — 1.4% | ||||||||
| Boston Scientific Corporation, 5.500% - Series A | 82,775 | 9,108,561 | ||||||
| Utilities — 2.0% | ||||||||
| Electric Utilities — 2.0% | ||||||||
| AES Corporation (The), 6.875% | 60,310 | 5,941,138 | ||||||
| American Electric Power Company, Inc., 6.125% | 146,780 | 7,297,902 | ||||||
| 13,239,040 | ||||||||
| Total Preferred Stocks | ||||||||
| (Cost $34,355,613) | $ | 35,832,261 | ||||||
| MONEY MARKET FUND — 1.0% |
| Shares | Value | |||||||
| SEI Daily Income Trust, Government Fund - Class F, 2.67% (d) (Cost $6,697,461) | 6,697,461 | $ | 6,697,461 | |||||
| Investments at Value — 99.6% | ||||||||
| (Cost $678,127,278) | $ | 645,529,255 | ||||||
| Other Assets in Excess of Liabilities — 0.4% | 2,282,143 | |||||||
| Net Assets — 100.0% | $ | 647,811,398 | ||||||
144A - Security was purchased in a transaction exempt from registration in compliance with Rule 144A of the Securities Act of 1933. This security may be resold in transactions exempt from registration, normally to qualified institutional buyers. The total value of such securities is $91,650,201 as of October 31, 2022, representing 14.1% of net assets.
AG - Aktiengesellschaft
B.V. - Besloten Vennootschap
plc - Public Limited Company
S.A. - Societe Anonyme
S.A.B. de C.V. - Societe Anonima Bursatil de Capital Variable
SOFR - Secured Overnight Financing Rate.
T-Note - U.S. Treasury Note
| (a) | Variable rate security. Interest rate resets periodically. The rate shown is the effective interest rate as of October 31, 2022. For securities based on a published reference rate and spread, the reference rate and spread (in basis points) are indicated parenthetically. |
| (b) | Security has a perpetual maturity date. |
| (c) | Non-income producing security. |
| (d) | The rate shown is the 7-day effective yield as of October 31, 2022. |
The accompanying notes are an integral part of the financial statements.
44
| WESTWOOD HIGH INCOME FUND |
| OCTOBER 31, 2022 |
| Sector Weightings (Unaudited)† |
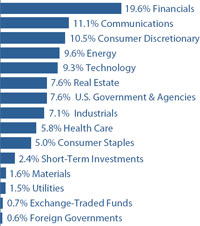
| † | Percentages are based on total investments. |
| SCHEDULE OF INVESTMENTS |
| U.S. GOVERNMENT & AGENCIES — 7.5% |
| Coupon | Maturity | Par Value | Value | |||||||||
| U.S. Treasury Bonds — 1.3% | ||||||||||||
| U.S. Treasury Bonds | 2.250% | 02/15/52 | $ | 625,000 | $ | 416,895 | ||||||
| U.S. Treasury Bonds | 3.000% | 08/15/52 | 1,150,000 | 915,687 | ||||||||
| 1,332,582 | ||||||||||||
| U.S. Treasury Bills — 4.0% | ||||||||||||
| U.S. Treasury Bill | 0.000% | 02/16/23 | 4,025,000 | 3,976,121 | ||||||||
| U.S. Treasury Notes — 2.2% | ||||||||||||
| U.S. Treasury Notes | 2.500% | 05/31/24 | 900,000 | 870,610 | ||||||||
| U.S. Treasury Notes | 2.875% | 05/15/32 | 1,000,000 | 905,156 | ||||||||
| U.S. Treasury Notes | 2.750% | 08/15/32 | 445,000 | 397,788 | ||||||||
| 2,173,554 | ||||||||||||
| Total U.S. Government & Agencies | ||||||||||||
| (Cost $7,814,221) | $ | 7,482,257 | ||||||||||
| CONVERTIBLE BONDS — 1.1% | ||||||||||||
| Consumer Staples — 0.3% | ||||||||||||
| Tilray, Inc. | 5.000% | 10/01/23 | $ | 250,000 | $ | 240,905 | ||||||
| Real Estate — 0.8% | ||||||||||||
| Radius Global Infrastructure, Inc., 144A | 2.500% | 09/15/26 | 1,000,000 | 799,500 | ||||||||
| Total Convertible Bonds | ||||||||||||
| (Cost $1,246,028) | $ | 1,040,405 | ||||||||||
| CORPORATE BONDS — 67.0% | ||||||||||||
| Communications — 8.7% | ||||||||||||
| América Móvil S.A.B. de C.V., 144A | 5.375% | 04/04/32 | $ | 360,000 | $ | 305,100 | ||||||
| Charter Communications Operating LLC | 2.300% | 02/01/32 | 1,400,000 | 997,737 | ||||||||
The accompanying notes are an integral part of the financial statements.
45
| WESTWOOD HIGH INCOME FUND |
| OCTOBER 31, 2022 |
| CORPORATE BONDS — continued |
| Coupon | Maturity | Par Value | Value | |||||||||
| Communications — continued | ||||||||||||
| CSC Holdings, LLC, 144A | 6.500% | 02/01/29 | $ | 1,000,000 | $ | 942,500 | ||||||
| DISH DBS Corporation | 5.875% | 11/15/24 | 1,250,000 | 1,154,250 | ||||||||
| Liberty Media Corporation, 144A | 2.750% | 12/01/49 | 955,000 | 876,690 | ||||||||
| Lumen Technologies, Inc., Series P | 7.600% | 09/15/39 | 1,125,000 | 742,500 | ||||||||
| Magellanes, Inc., 144A | 4.279% | 03/15/32 | 600,000 | 484,300 | ||||||||
| Telesat Canada / Telesat LLC, 144A | 4.875% | 06/01/27 | 1,500,000 | 659,550 | ||||||||
| T-Mobile USA, Inc. | 2.550% | 02/15/31 | 1,250,000 | 987,783 | ||||||||
| Vodafone Group plc | 4.875% | 06/19/49 | 500,000 | 385,463 | ||||||||
| Zayo Group Holdings, Inc., 144A | 4.000% | 03/01/27 | 1,465,000 | 1,116,393 | ||||||||
| 8,652,266 | ||||||||||||
| Consumer Discretionary — 9.0% | ||||||||||||
| At Home Group, Inc., 144A | 4.875% | 07/15/28 | 1,250,000 | 894,923 | ||||||||
| Brunswick Corporation | 2.400% | 08/18/31 | 414,000 | 287,906 | ||||||||
| Cinemark USA, Inc., 144A | 5.875% | 03/15/26 | 1,000,000 | 847,900 | ||||||||
| Darden Restaurants, Inc. | 4.550% | 02/15/48 | 790,000 | 558,324 | ||||||||
| Ford Motor Credit Company, LLC | 4.271% | 01/09/27 | 1,000,000 | 902,890 | ||||||||
| G-III Apparel Group Ltd., 144A | 7.875% | 08/15/25 | 1,250,000 | 1,184,375 | ||||||||
| Lowe’s Cos., Inc. | 5.625% | 04/15/53 | 325,000 | 291,515 | ||||||||
| Nordstrom, Inc. | 2.300% | 04/08/24 | 325,000 | 305,008 | ||||||||
| Odeon Finco PLC, 144A | 12.750% | 11/01/27 | 1,000,000 | 893,640 | ||||||||
| Royal Caribbean Cruises Ltd., 144A | 9.250% | 01/15/29 | 1,070,000 | 1,085,146 | ||||||||
| Scientific Games International, Inc., 144A | 8.625% | 07/01/25 | 850,000 | 873,819 | ||||||||
| Thor Industries, Inc., 144A | 4.000% | 10/15/29 | 1,000,000 | 808,780 | ||||||||
| 8,934,226 | ||||||||||||
| Consumer Staples — 3.3% | ||||||||||||
| B&G Foods, Inc. | 5.250% | 04/01/25 | 1,000,000 | 908,770 | ||||||||
| BAT Capital Corporation | 7.750% | 10/19/32 | 552,000 | 563,885 | ||||||||
| Rite Aid Corporation, 144A | 7.500% | 07/01/25 | 749,000 | 521,791 | ||||||||
| Vector Group Ltd., 144A | 5.750% | 02/01/29 | 1,000,000 | 875,000 | ||||||||
| Viterra Finance B.V., 144A | 2.000% | 04/21/26 | 428,000 | 361,254 | ||||||||
| 3,230,700 | ||||||||||||
| Energy — 6.4% | ||||||||||||
| CNX Midstream Partners, L.P., 144A | 4.750% | 04/15/30 | 1,250,000 | 1,028,125 | ||||||||
| Crestwood Midstream Partners, L.P., 144A | 6.000% | 02/01/29 | 1,000,000 | 935,100 | ||||||||
| International Petroleum Corporation of Sweden | 7.250% | 02/01/27 | 700,000 | 641,571 | ||||||||
| NGL Energy Operating, LLC, 144A | 7.500% | 02/01/26 | 1,100,000 | 993,919 | ||||||||
| Nine Energy Service, Inc. | 8.750% | 11/01/23 | 500,000 | 436,205 | ||||||||
| Northern Oil and Gas, Inc., 144A | 8.125% | 03/01/28 | 1,100,000 | 1,067,000 | ||||||||
| Petróleos Mexicanos | 6.700% | 02/16/32 | 940,000 | 710,875 | ||||||||
| Summit Midstream Holdings, LLC, 144A | 8.500% | 10/15/26 | 500,000 | 480,000 | ||||||||
| 6,292,795 | ||||||||||||
| Financials — 15.6% | ||||||||||||
| AerCap Ireland Capital Ltd. | 3.300% | 01/30/32 | 650,000 | 486,041 | ||||||||
| AerCap Ireland Capital Ltd. | 3.850% | 10/29/41 | 458,000 | 303,470 | ||||||||
| Aircastle Ltd., 144A | 5.250% | 08/11/25 | 435,000 | 406,748 | ||||||||
| Apollo Commercial Real Estate Finance, Inc. | 5.375% | 10/15/23 | 850,000 | 824,500 | ||||||||
| Apollo Commercial Real Estate Finance, Inc., 144A | 4.625% | 06/15/29 | 1,000,000 | 787,500 | ||||||||
The accompanying notes are an integral part of the financial statements.
46
| WESTWOOD HIGH INCOME FUND |
| OCTOBER 31, 2022 |
| CORPORATE BONDS — continued |
| Coupon | Maturity | Par Value | Value | |||||||||
| Financials — continued | ||||||||||||
| Ares Capital Corporation, 144A | 3.875% | 01/15/26 | $ | 1,225,000 | $ | 1,097,558 | ||||||
| Bank of America Corporation (3MO LIBOR + 131) (a) | 4.271% | 07/23/29 | 605,000 | 548,896 | ||||||||
| Blackstone Private Credit Fund, 144A | 7.050% | 09/29/25 | 1,000,000 | 990,895 | ||||||||
| Chubb INA Holdings, Inc. | 2.850% | 12/15/51 | 500,000 | 303,312 | ||||||||
| Compass Group Diversified Holdings, LLC, 144A | 5.250% | 04/15/29 | 1,423,000 | 1,223,780 | ||||||||
| Credit Suisse Group AG, 144A (SOFR + 392) (a) | 6.537% | 08/12/33 | 634,000 | 551,412 | ||||||||
| Hercules Capital, Inc. | 2.625% | 09/16/26 | 422,000 | 343,719 | ||||||||
| HSBC Holdings plc (SOFR + 287) (a) | 5.402% | 08/11/33 | 811,000 | 702,490 | ||||||||
| Icahn Enterprises, L.P./Icahn Enterprises Holdings, L.P. | 5.250% | 05/15/27 | 1,075,000 | 990,494 | ||||||||
| Jackson Financial, Inc. | 4.000% | 11/23/51 | 500,000 | 299,512 | ||||||||
| Morgan Stanley (SOFR + 262) (a) | 5.297% | 04/20/37 | 529,000 | 468,708 | ||||||||
| NatWest Group plc | 5.516% | 09/30/28 | 800,000 | 744,698 | ||||||||
| Nomura Holdings, Inc. | 2.329% | 01/22/27 | 885,000 | 754,781 | ||||||||
| Owl Rock Capital Corporation | 3.400% | 07/15/26 | 1,250,000 | 1,064,910 | ||||||||
| Penske Truck Leasing Company, 144A | 4.400% | 07/01/27 | 500,000 | 466,270 | ||||||||
| Prospect Capital Corporation | 3.364% | 11/15/26 | 710,000 | 574,807 | ||||||||
| UBS Group AG, 144A (Yield of U.S. T-Note 0.625% 07/26 + 85) (a) | 1.494% | 08/10/27 | 610,000 | 502,579 | ||||||||
| Unum Group | 4.125% | 06/15/51 | 750,000 | 470,286 | ||||||||
| Westpac Banking Corporation | 3.133% | 11/18/41 | 850,000 | 519,863 | ||||||||
| 15,427,229 | ||||||||||||
| Health Care — 3.2% | ||||||||||||
| Amgen, Inc. | 4.663% | 06/15/51 | 585,000 | 481,091 | ||||||||
| Bausch Health Companies, Inc., 144A | 6.125% | 02/01/27 | 1,112,000 | 730,121 | ||||||||
| CHS/Community Health Systems, Inc., 144A | 5.250% | 05/15/30 | 600,000 | 415,500 | ||||||||
| HCA, Inc. | 3.500% | 07/15/51 | 552,000 | 342,387 | ||||||||
| Par Pharmaceutical, Inc., 144A | 7.500% | 04/01/27 | 750,000 | 573,309 | ||||||||
| Royalty Pharma plc | 3.550% | 09/02/50 | 1,000,000 | 608,229 | ||||||||
| 3,150,637 | ||||||||||||
| Industrials — 6.4% | ||||||||||||
| American Airlines Pass Through Trust, Series 2021-1B | 3.950% | 07/11/30 | 595,000 | 465,086 | ||||||||
| Boeing Company (The) | 5.805% | 05/01/50 | 1,000,000 | 856,948 | ||||||||
| Bombardier, Inc. | 7.125% | 06/15/26 | 1,000,000 | 946,627 | ||||||||
| CoreCivic, Inc. | 8.250% | 04/15/26 | 1,000,000 | 1,014,288 | ||||||||
| Deluxe Corporation, 144A | 8.000% | 06/01/29 | 1,000,000 | 840,000 | ||||||||
| GEO Group, Inc. (The) | 10.500% | 06/30/28 | 500,000 | 500,000 | ||||||||
| Sempra Infrastructure, 144A | 3.250% | 01/15/32 | 658,000 | 514,519 | ||||||||
| Sotheby’s, 144A | 7.375% | 10/15/27 | 1,225,000 | 1,194,191 | ||||||||
| 6,331,659 | ||||||||||||
| Materials — 0.6% | ||||||||||||
| Axalta Coating Systems, LLC, 144A | 4.750% | 06/15/27 | 700,000 | 638,616 | ||||||||
| Real Estate — 5.4% | ||||||||||||
| American Tower Corporation | 2.950% | 01/15/51 | 225,000 | 127,433 | ||||||||
| Brixmor Operating Partnership, L.P. | 4.050% | 07/01/30 | 475,000 | 394,695 | ||||||||
| GLP Capital, L.P./GLP Financing II, Inc. | 3.250% | 01/15/32 | 1,000,000 | 745,410 | ||||||||
| Host Hotels & Resorts, Inc. | 3.500% | 09/15/30 | 375,000 | 294,008 | ||||||||
The accompanying notes are an integral part of the financial statements.
47
| WESTWOOD HIGH INCOME FUND |
| OCTOBER 31, 2022 |
| CORPORATE BONDS — continued |
| Coupon | Maturity | Par Value | Value | |||||||||
| Real Estate — continued | ||||||||||||
| Iron Mountain, Inc., 144A | 5.000% | 07/15/28 | $ | 1,020,000 | $ | 912,492 | ||||||
| New Residential Investment Corporation, 144A | 6.250% | 10/15/25 | 1,000,000 | 870,285 | ||||||||
| Sabra Health Care, L.P. | 3.200% | 12/01/31 | 750,000 | 540,079 | ||||||||
| Service Properties Trust | 7.500% | 09/15/25 | 1,000,000 | 975,000 | ||||||||
| Simon Property Group, L.P. | 2.650% | 02/01/32 | 512,000 | 388,733 | ||||||||
| Vornado Realty, L.P. | 3.400% | 06/01/31 | 181,000 | 134,216 | ||||||||
| 5,382,351 | ||||||||||||
| Technology — 6.9% | ||||||||||||
| Broadcom, Inc., 144A | 3.500% | 02/15/41 | 1,000,000 | 656,983 | ||||||||
| CommScope Finance, LLC, 144A | 6.000% | 03/01/26 | 940,000 | 913,699 | ||||||||
| Dell International, LLC | 8.350% | 07/15/46 | 800,000 | 847,635 | ||||||||
| DXC Technology Company | 1.800% | 09/15/26 | 420,000 | 360,666 | ||||||||
| NXP B.V. | 2.500% | 05/11/31 | 1,000,000 | 751,814 | ||||||||
| NXP USA, Inc. | 5.000% | 01/15/33 | 570,000 | 510,765 | ||||||||
| Oracle Corporation | 2.950% | 04/01/30 | 1,175,000 | 954,764 | ||||||||
| Picard Midco, Inc., 144A | 6.500% | 03/31/29 | 1,125,000 | 977,619 | ||||||||
| VMware, Inc. | 4.650% | 05/15/27 | 957,000 | 904,710 | ||||||||
| 6,878,655 | ||||||||||||
| Utilities — 1.5% | ||||||||||||
| Consolidated Edison Company of New York, Inc. | 3.850% | 06/15/46 | 1,069,000 | 773,873 | ||||||||
| Pacific Gas and Electric Company | 4.950% | 07/01/50 | 1,000,000 | 742,613 | ||||||||
| 1,516,486 | ||||||||||||
| Total Corporate Bonds | ||||||||||||
| (Cost $79,261,463) | $ | 66,435,620 | ||||||||||
| FOREIGN GOVERNMENTS — 0.6% | ||||||||||||
| Republic of South Africa Government | ||||||||||||
| (Cost $695,000) | 5.875% | 04/20/32 | $ | 695,000 | $ | 593,752 | ||||||
| COMMON STOCKS — 19.7% |
| Shares | Value | |||||||
| Communications — 1.8% | ||||||||
| Entertainment Content — 1.2% | ||||||||
| Activision Blizzard, Inc. | 16,148 | $ | 1,175,574 | |||||
| Telecommunications — 0.6% | ||||||||
| AT&T, Inc. | 31,677 | 577,472 | ||||||
| Consumer Discretionary — 1.4% | ||||||||
| Retail - Discretionary — 1.4% | ||||||||
| Home Depot, Inc. (The) | 2,754 | 815,542 | ||||||
| TJX Companies, Inc. (The) | 8,077 | 582,352 | ||||||
| 1,397,894 | ||||||||
| Consumer Staples — 1.5% | ||||||||
| Retail - Consumer Staples — 0.9% | ||||||||
| Walmart, Inc. | 6,017 | 856,400 | ||||||
| COMMON STOCKS — continued |
| Shares | Value | |||||||
| Consumer Staples - continued | ||||||||
| Tobacco & Cannabis — 0.6% | ||||||||
| Altria Group, Inc. | 12,819 | $ | 593,135 | |||||
| Energy — 3.2% | ||||||||
| Oil & Gas Producers — 2.9% | ||||||||
| Devon Energy Corporation | 8,141 | 629,706 | ||||||
| Energy Transfer, L.P. | 36,128 | 461,355 | ||||||
| Enterprise Products Partners, L.P. | 21,344 | 538,936 | ||||||
| EOG Resources, Inc. | 8,983 | 1,226,359 | ||||||
| 2,856,356 | ||||||||
| Renewable Energy — 0.3% | ||||||||
| Atlantica Sustainable Infrastructure plc | 11,942 | 330,913 | ||||||
The accompanying notes are an integral part of the financial statements.
48
| WESTWOOD HIGH INCOME FUND |
| OCTOBER 31, 2022 |
| COMMON STOCKS — continued |
| Shares | Value | |||||||
| Financials — 3.9% | ||||||||
| Asset Management — 0.7% | ||||||||
| Blackstone, Inc. | 7,668 | $ | 698,861 | |||||
| Banking — 2.0% | ||||||||
| Bank of America Corporation | 21,645 | 780,086 | ||||||
| Sumitomo Mitsui Financial Group, Inc. - ADR | 95,181 | 533,014 | ||||||
| Truist Financial Corporation | 14,923 | 668,401 | ||||||
| 1,981,501 | ||||||||
| Institutional Financial Services — 0.5% | ||||||||
| Moelis & Company - Class A | 12,290 | 521,833 | ||||||
| Specialty Finance — 0.7% | ||||||||
| Annaly Capital Management, Inc. | 17,376 | 322,325 | ||||||
| MGIC Investment Corporation | 27,303 | 372,686 | ||||||
| 695,011 | ||||||||
| Health Care — 2.6% | ||||||||
| Biotech & Pharma — 2.6% | ||||||||
| Amgen, Inc. | 3,311 | 895,129 | ||||||
| Bristol-Myers Squibb Company | 11,932 | 924,372 | ||||||
| Gilead Sciences, Inc. | 9,786 | 767,810 | ||||||
| 2,587,311 | ||||||||
| Industrials — 0.7% | ||||||||
| Aerospace & Defense — 0.7% | ||||||||
| Moog, Inc. - Class A | 7,873 | 667,237 | ||||||
| Materials — 1.0% | ||||||||
| Containers & Packaging — 0.3% | ||||||||
| WestRock Company | 8,148 | 277,521 | ||||||
| Metals & Mining — 0.7% | ||||||||
| Barrick Gold Corporation | 24,261 | 364,643 | ||||||
| Freeport-McMoRan, Inc. | 9,414 | 298,329 | ||||||
| 662,972 | ||||||||
| Real Estate — 1.3% | ||||||||
| REITs — 1.3% | ||||||||
| National Retail Properties, Inc. | 14,448 | 607,249 | ||||||
| VICI Properties, Inc. | 22,346 | 715,519 | ||||||
| 1,322,768 | ||||||||
| Technology — 2.3% | ||||||||
| Semiconductors — 0.3% | ||||||||
| NVIDIA Corporation | 2,068 | 279,118 | ||||||
| Software — 0.5% | ||||||||
| Microsoft Corporation | 2,164 | 502,329 | ||||||
| COMMON STOCKS — continued |
| Shares | Value | |||||||
| Technology — continued | ||||||||
| Technology Hardware — 1.5% | ||||||||
| Apple, Inc. | 6,959 | $ | 1,067,093 | |||||
| Cisco Systems, Inc. | 9,709 | 441,080 | ||||||
| 1,508,173 | ||||||||
| Total Common Stocks | ||||||||
| (Cost $18,120,372) | $ | 19,492,379 | ||||||
| EXCHANGE-TRADED FUNDS — 0.7% | ||||||||
| JPMorgan Nasdaq Equity Premium Income ETF (Cost $783,109) | 16,795 | $ | 724,200 | |||||
| PREFERRED STOCKS — 0.6% | ||||||||
| Communications — 0.6% | ||||||||
| Telecommunications — 0.6% | ||||||||
| 2020 Cash Mandatory Exchangeable Trust, 5.250%, 144A (b) (Cost $533,411) | 465 | $ | 577,530 | |||||
The accompanying notes are an integral part of the financial statements.
49
| WESTWOOD HIGH INCOME FUND |
| OCTOBER 31, 2022 |
| MONEY MARKET FUND — 2.4% |
| Shares | Value | |||||||
| SEI Daily Income Trust, Government Fund - Class F, 2.67% (c) (Cost $2,369,948) | 2,369,948 | $ | 2,369,948 | |||||
| Investments at Value — 99.6% | ||||||||
| (Cost $110,823,552) | $ | 98,716,091 | ||||||
| Other Assets in Excess of Liabilities — 0.4% | 441,000 | |||||||
| Net Assets — 100.0% | $ | 99,157,091 | ||||||
144A - Security was purchased in a transaction exempt from registration in compliance with Rule 144A of the Securities Act of 1933. This security may be resold in transactions exempt from registration, normally to qualified institutional buyers. The total value of such securities is $33,876,411 as of October 31, 2022, representing 34.2% of net assets.
ADR - American Depositary Receipt
AG - Aktiengesellschaft
B.V. - Besloten Vennootschap
LIBOR - London Interbank Offered Rate
plc - Public Limited Company
S.A.B. de C.V. - Societe Anonima Bursatil de Capital Variable
SOFR - Secured Overnight Financing Rate
T-Note - U.S. Treasury Note
| (a) | Variable rate security. Interest rate resets periodically. The rate shown is the effective interest rate as of October 31, 2022. For securities based on a published reference rate and spread, the reference rate and spread (in basis points) are indicated parenthetically. |
| (b) | Non-income producing security. |
| (c) | The rate shown is the 7-day effective yield as of October 31, 2022. |
The accompanying notes are an integral part of the financial statements.
50
| WESTWOOD ALTERNATIVE INCOME FUND |
| OCTOBER 31, 2022 |
| Sector Weightings (Unaudited)† |
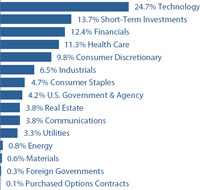
| † | Percentages are based on total investments. |
| SCHEDULE OF INVESTMENTS |
| U.S. GOVERNMENT & AGENCIES — 4.5% |
| Coupon | Maturity | Par Value | Value | |||||||||
| U.S. Treasury Notes — 4.5% | ||||||||||||
| U.S. Treasury Notes | 2.625% | 02/28/23 | $ | 3,000,000 | $ | 2,984,165 | ||||||
| U.S. Treasury Notes | 4.250% | 09/30/24 | 4,000,000 | 3,978,438 | ||||||||
| Total U.S. Government & Agencies | ||||||||||||
| (Cost $6,982,217) | $ | 6,962,603 | ||||||||||
| CONVERTIBLE BONDS — 64.8% | ||||||||||||
| Communications — 3.9% | ||||||||||||
| Airbnb, Inc. | 0.000% | 03/15/26 | $ | 2,500,000 | $ | 2,091,250 | ||||||
| Liberty Media Corp - Liberty Formula One, 144A | 2.250% | 08/15/27 | 2,500,000 | 2,298,750 | ||||||||
| Lyft, Inc. | 1.500% | 05/15/25 | 2,000,000 | 1,759,000 | ||||||||
| 6,149,000 | ||||||||||||
| Consumer Discretionary — 8.3% | ||||||||||||
| Burlington Stores, Inc. | 2.250% | 04/15/25 | 3,000,000 | 3,037,500 | ||||||||
| Chegg, Inc. | 0.125% | 03/15/25 | 1,500,000 | 1,298,250 | ||||||||
| Etsy, Inc. * | 0.125% | 10/01/26 | 2,500,000 | 3,202,500 | ||||||||
| Ford Motor Company | 0.000% | 03/15/26 | 4,000,000 | 4,020,000 | ||||||||
| Huazhu Group Ltd. | 3.000% | 05/01/26 | 785,000 | 743,788 | ||||||||
| Patrick Industries, Inc., 144A | 1.750% | 12/01/28 | 1,000,000 | 726,500 | ||||||||
| 13,028,538 | ||||||||||||
| Consumer Staples — 4.4% | ||||||||||||
| MGP Ingredients, Inc., 144A | 1.875% | 11/15/41 | 2,000,000 | 2,581,200 | ||||||||
| Post Holdings, Inc., 144A | 2.500% | 08/15/27 | 2,000,000 | 2,078,000 | ||||||||
| Tilray, Inc. * | 5.000% | 10/01/23 | 2,275,000 | 2,192,231 | ||||||||
| 6,851,431 | ||||||||||||
| Financials — 5.3% | ||||||||||||
| Avolon Holdings Funding Ltd., 144A | 4.250% | 04/15/26 | 250,000 | 218,486 | ||||||||
| Granite Point Mortgage Trust, Inc., 144A | 5.625% | 12/01/22 | 4,500,000 | 4,452,987 | ||||||||
| KKR Group Finance Company X, LLC, 144A | 3.250% | 12/15/51 | 500,000 | 303,831 | ||||||||
The accompanying notes are an integral part of the financial statements.
51
| WESTWOOD ALTERNATIVE INCOME FUND |
| OCTOBER 31, 2022 |
| CONVERTIBLE BONDS — continued |
| Coupon | Maturity | Par Value | Value | |||||||||
| Financials — continued | ||||||||||||
| KKR Real Estate Finance Trust, Inc. | 6.125% | 05/15/23 | $ | 3,250,000 | $ | 3,224,000 | ||||||
| 8,199,304 | ||||||||||||
| Health Care — 11.4% | ||||||||||||
| Alnylam Pharmaceuticals, Inc., 144A | 1.000% | 09/15/27 | 3,000,000 | 3,006,000 | ||||||||
| Halozyme Therapeutics, Inc., 144A | 1.000% | 08/15/28 | 3,250,000 | 3,408,438 | ||||||||
| Illumina, Inc. | 0.000% | 08/15/23 | 4,000,000 | 3,858,321 | ||||||||
| Jazz Investments I Ltd. | 2.000% | 06/15/26 | 1,000,000 | 1,116,875 | ||||||||
| Ligand Pharmaceuticals, Inc *. | 0.750% | 05/15/23 | 4,000,000 | 3,872,499 | ||||||||
| NuVasive, Inc. | 0.375% | 03/15/25 | 3,000,000 | 2,595,000 | ||||||||
| 17,857,133 | ||||||||||||
| Industrials — 5.0% | ||||||||||||
| American Airlines Group, Inc. | 6.500% | 07/01/25 | 3,500,000 | 3,921,750 | ||||||||
| Camtek Ltd., 144A | 0.000% | 12/01/26 | 1,400,000 | 1,059,800 | ||||||||
| SFL Corporation Ltd. | 4.875% | 05/01/23 | 2,838,000 | 2,847,933 | ||||||||
| 7,829,483 | ||||||||||||
| Real Estate — 3.0% | ||||||||||||
| DigitalBridge Group, Inc. | 5.000% | 04/15/23 | 3,709,000 | 3,676,546 | ||||||||
| Integra LifeSciences Holdings Corporation | 0.500% | 08/15/25 | 1,000,000 | 928,000 | ||||||||
| 4,604,546 | ||||||||||||
| Technology — 22.1% | ||||||||||||
| Akamai Technologies, Inc. | 0.125% | 05/01/25 | 2,000,000 | 2,145,000 | ||||||||
| Bentley Systems, Inc. | 0.125% | 01/15/26 | 2,400,000 | 2,101,200 | ||||||||
| Bill.com Holdings Inc. | 0.000% | 04/01/27 | 2,391,000 | 1,884,108 | ||||||||
| Coupa Software, Inc. | 0.125% | 06/15/25 | 3,000,000 | 2,554,559 | ||||||||
| Jamf Holding Corporation | 0.125% | 09/01/26 | 1,250,000 | 1,023,125 | ||||||||
| Lumentum Holdings, Inc. | 2.000% | 02/15/25 | 3,500,000 | 3,591,000 | ||||||||
| NextGen Healthcare, Inc., 144A | 3.750% | 11/15/27 | 500,000 | 525,197 | ||||||||
| ON Semiconductor Corporation | 0.000% | 05/01/27 | 3,500,000 | 4,583,250 | ||||||||
| Splunk, Inc. | 1.125% | 06/15/27 | 3,750,000 | 3,187,500 | ||||||||
| Vishay Intertechnology, Inc. | 2.250% | 06/15/25 | 4,280,000 | 4,102,867 | ||||||||
| Wolfspeed, Inc. | 0.250% | 02/15/28 | 3,000,000 | 2,742,000 | ||||||||
| Workiva, Inc. | 1.125% | 08/15/26 | 3,000,000 | 3,509,999 | ||||||||
| Ziff Davis, Inc., 144A | 1.750% | 11/01/26 | 2,500,000 | 2,421,250 | ||||||||
| 34,371,055 | ||||||||||||
| Utilities — 1.5% | ||||||||||||
| Ormat Technologies, Inc. | 2.500% | 07/15/27 | 2,000,000 | 2,370,000 | ||||||||
| Total Convertible Bonds | ||||||||||||
| (Cost $103,979,781) | $ | 101,260,490 | ||||||||||
| CORPORATE BONDS — 21.0% | ||||||||||||
| Consumer Discretionary — 1.9% | ||||||||||||
| Royal Caribbean Cruises Ltd., 144A | 6.000% | 08/15/25 | $ | 1,500,000 | $ | 1,952,250 | ||||||
| Royal Caribbean Cruises Ltd., 144A | 9.250% | 01/15/29 | 1,070,000 | 1,085,146 | ||||||||
| 3,037,396 | ||||||||||||
The accompanying notes are an integral part of the financial statements.
52
| WESTWOOD ALTERNATIVE INCOME FUND |
| OCTOBER 31, 2022 |
| CORPORATE BONDS — continued |
| Coupon | Maturity | Par Value | Value | |||||||||
| Consumer Staples — 0.6% | ||||||||||||
| Vector Group Ltd., 144A | 5.750% | 02/01/29 | $ | 1,000,000 | $ | 875,000 | ||||||
| Energy — 0.8% | ||||||||||||
| NGL Energy Operating, LLC, 144A | 7.500% | 02/01/26 | 925,000 | 835,796 | ||||||||
| Phillips 66 | 0.900% | 02/15/24 | 500,000 | 472,988 | ||||||||
| 1,308,784 | ||||||||||||
| Financials — 7.8% | ||||||||||||
| Aircastle Ltd., 144A | 5.250% | 08/11/25 | 1,200,000 | 1,122,064 | ||||||||
| Apollo Commercial Real Estate Finance, Inc. | 5.375% | 10/15/23 | 3,000,000 | 2,910,000 | ||||||||
| Compass Group Diversified Holdings, LLC, 144A | 5.250% | 04/15/29 | 1,000,000 | 860,000 | ||||||||
| Corebridge Financial, Inc., 144A | 3.500% | 04/04/25 | 1,200,000 | 1,130,544 | ||||||||
| Goldman Sachs Group, Inc. (SOFR + 53.8) (a) | 0.627% | 11/17/23 | 1,000,000 | 997,426 | ||||||||
| Mitsubishi UFJ Financial Group | 4.788% | 07/18/25 | 1,100,000 | 1,079,016 | ||||||||
| PennyMac Mortgage Investment Trust | 5.500% | 11/01/24 | 3,500,000 | 3,152,188 | ||||||||
| Royal Bank of Canada | 1.600% | 01/21/25 | 1,000,000 | 923,311 | ||||||||
| 12,174,549 | ||||||||||||
| Health Care — 0.5% | ||||||||||||
| Ascendis Pharma A/S | 2.250% | 04/01/28 | 750,000 | 733,575 | ||||||||
| Industrials — 1.8% | ||||||||||||
| Alarm.com Holdings, Inc. | 0.000% | 01/15/26 | 3,500,000 | 2,850,400 | ||||||||
| Materials — 0.6% | ||||||||||||
| Celanese US Holdings, LLC | 5.900% | 07/05/24 | 1,000,000 | 982,424 | ||||||||
| Real Estate — 1.1% | ||||||||||||
| Iron Mountain, Inc., 144A | 5.000% | 07/15/28 | 1,000,000 | 894,600 | ||||||||
| Vici Properties Note, 144A | 5.625% | 05/01/24 | 750,000 | 740,445 | ||||||||
| 1,635,045 | ||||||||||||
| Technology — 4.0% | ||||||||||||
| Dell International LLC / EMC Corporation | 6.020% | 06/15/26 | 750,000 | 748,453 | ||||||||
| Micron Technology, Inc. | 2.703% | 04/15/32 | 60,000 | 43,914 | ||||||||
| MongoDB, Inc. | 0.250% | 01/15/26 | 1,855,000 | 2,085,020 | ||||||||
| Picard Midco, Inc., 144A | 6.500% | 03/31/29 | 825,000 | 716,920 | ||||||||
| Progress Software Corporation | 1.000% | 04/15/26 | 2,500,000 | 2,572,500 | ||||||||
| 6,166,807 | ||||||||||||
| Utilities — 1.9% | ||||||||||||
| American Electric Power | 0.750% | 11/01/23 | 2,750,000 | 2,623,599 | ||||||||
| NextEra Energy Capital Holdings, Inc. | 0.650% | 03/01/23 | 400,000 | 394,422 | ||||||||
| 3,018,021 | ||||||||||||
| Total Corporate Bonds | ||||||||||||
| (Cost $33,929,890) | $ | 32,782,001 | ||||||||||
The accompanying notes are an integral part of the financial statements.
53
| WESTWOOD ALTERNATIVE INCOME FUND |
| OCTOBER 31, 2022 |
| FOREIGN GOVERNMENTS — 0.3% |
| Coupon | Maturity | Par Value | Value | |||||||||
| Mexico Government International Bond | 3.771% | 05/24/61 | $ | 235,000 | $ | 137,729 | ||||||
| Peruvian Government International Bond | 2.783% | 01/23/31 | 235,000 | 185,430 | ||||||||
| Peruvian Government International Bond | 3.300% | 03/11/41 | 240,000 | 161,807 | ||||||||
| Total Foreign Governments | ||||||||||||
| (Cost $702,634) | $ | 484,966 | ||||||||||
| PURCHASED OPTION CONTRACTS — 0.0%^ | ||||||||||||||||
| Strike Price | Contracts | Notional Value | Value | |||||||||||||
| Put Option Contracts — 0.0% ^** | ||||||||||||||||
| S&P Dow Jones Index, 12/30/22 (Cost $295,654) | $ | 3,500.00 | 20 | $ | 7,743,960 | $ | 83,680 | |||||||||
| MONEY MARKET FUND — 14.4% |
| Shares | Value | |||||||
| SEI Daily Income Trust, Government Fund - Class F, 2.67% (b) (Cost $22,545,345) | 22,545,345 | $ | 22,545,345 | |||||
| Investments at Value — 105.0% | ||||||||
| (Cost $168,435,521) | $ | 164,119,085 | ||||||
| Liabilities in Excess of Other Assets — (5.0%) | (7,883,262 | ) | ||||||
| Net Assets — 100.0% | $ | 156,235,823 | ||||||
| ^ | Rounds to less than 0.01% |
| * | All or part of this security has been pledged as collateral for derivative instruments held by the Fund. |
144A - Security was purchased in a transaction exempt from registration in compliance with Rule 144A of the Securities Act of 1933. This security may be resold in transactions exempt from registration, normally to qualified institutional buyers. The total value of such securities is $33,293,204 as of October 31, 2022, representing 21.3% of net assets.
A/S - Aktieselskab
SOFR - Secured Overnight Financing Rate.
| (a) | Variable rate security. Interest rate resets periodically. The rate shown is the effective interest rate as of October 31, 2022. For securities based on a published reference rate and spread, the reference rate and spread (in basis points) are indicated parenthetically. Certain variable rate securities are not based on a published reference rate and spread but are determined by the issuer or agent and are based on current market conditions. These securities, therefore, do not indicate a reference rate and spread. |
| (b) | The rate shown is the 7-day effective yield as of October 31, 2022. |
| ** | The average monthly value of purchased options contracts sold during the year ended October 31, 2022 was $8,402,857. |
The accompanying notes are an integral part of the financial statements.
54
| WESTWOOD ALTERNATIVE INCOME FUND |
| OCTOBER 31, 2022 |
A list of open OTC swap agreements as of October 31, 2022, is as follows:
| Total Return Swap Agreements |
| Net Unrealized | ||||||||||||||||
| Number of | Notional | Termination | Appreciation / | |||||||||||||
| Shares | Reference Entity | Amount | Interest Rate Receivable (a) | Date | Counterparty | (Depreciation) | ||||||||||
| Short Positions | ||||||||||||||||
| (4,200) | Airbnb, Inc. | $ | (489,300 | ) | 2.72% OBFR 3.07% minus 35bp | 5/17/2023 | BNP Paribas | $ | 40,722 | |||||||
| (23,150) | Akamai Technologies, Inc. | (1,910,801 | ) | 2.72% OBFR 3.07% minus 35bp | 5/17/2023 | BNP Paribas | (132,306 | ) | ||||||||
| (8,300) | Alarm.com Holdings, Inc. | (519,165 | ) | 2.72% OBFR 3.07% minus 35bp | 5/17/2023 | BNP Paribas | 31,281 | |||||||||
| (6,800) | Alnylam Pharmaceuticals, Inc. | (1,349,893 | ) | 2.72% OBFR 3.07% minus 35bp | 5/17/2023 | BNP Paribas | (59,475 | ) | ||||||||
| (167,600) | American Airlines Group, Inc. | (2,324,859 | ) | 2.72% OBFR 3.07% minus 35bp | 5/17/2023 | BNP Paribas | (49,601 | ) | ||||||||
| (2,700) | Ascendis Pharma A/S | (302,562 | ) | 2.72% OBFR 3.07% minus 35bp | 5/17/2023 | BNP Paribas | (7,664 | ) | ||||||||
| (18,300) | Bentley Systems, Inc. | (603,547 | ) | 2.72% OBFR 3.07% minus 35bp | 5/17/2023 | BNP Paribas | (41,530 | ) | ||||||||
| (2,200) | Bill.com Holdings, Inc. | (296,692 | ) | 2.72% OBFR 3.07% minus 35bp | 5/17/2023 | BNP Paribas | 3,982 | |||||||||
| (6,150) | Burlington Stores, Inc. | (732,691 | ) | 2.72% OBFR 3.07% minus 35bp | 5/17/2023 | BNP Paribas | (145,849 | ) | ||||||||
| (11,300) | Camtek Ltd. | (250,634 | ) | 2.72% OBFR 3.07% minus 35bp | 5/17/2023 | BNP Paribas | (9,327 | ) | ||||||||
| (5,800) | Chegg, Inc. | (126,208 | ) | 2.72% OBFR 3.07% minus 35bp | 5/17/2023 | BNP Paribas | 1,388 | |||||||||
| (6,600) | Coupa Software, Inc. | (348,568 | ) | 2.72% OBFR 3.07% minus 35bp | 5/17/2023 | BNP Paribas | (2,536 | ) | ||||||||
| (22,500) | Etsy, Inc. | (2,207,700 | ) | 2.72% OBFR 3.07% minus 35bp | 5/17/2023 | BNP Paribas | 96,727 | |||||||||
| (142,600) | Ford Motor Company | (1,686,958 | ) | 2.72% OBFR 3.07% minus 35bp | 5/17/2023 | BNP Paribas | (218,074 | ) | ||||||||
| (42,200) | Halozyme Therapeutics, Inc. | (1,899,251 | ) | 2.72% OBFR 3.07% minus 35bp | 5/17/2023 | BNP Paribas | (116,609 | ) | ||||||||
| (10,700) | Huazhu Group Ltd. | (342,400 | ) | 2.72% OBFR 3.07% minus 35bp | 5/17/2023 | BNP Paribas | 52,954 | |||||||||
| (14,200) | Integra Lifesciences Holdings Corporation | (624,090 | ) | 2.72% OBFR 3.07% minus 35bp | 5/17/2023 | BNP Paribas | (88,894 | ) | ||||||||
| (13,300) | Jamf Holding Corporation | (283,822 | ) | 2.72% OBFR 3.07% minus 35bp | 5/17/2023 | BNP Paribas | (30,732 | ) | ||||||||
| (6,400) | Jazz Pharmaceuticals plc | (868,032 | ) | 2.72% OBFR 3.07% minus 35bp | 5/17/2023 | BNP Paribas | (51,437 | ) | ||||||||
| (7,372) | KKR Real Estate Finance Trust, Inc. | (128,936 | ) | 2.72% OBFR 3.07% minus 35bp | 5/17/2023 | BNP Paribas | 633 | |||||||||
| (17,400) | Liberty Media Corp | (1,033,560 | ) | 2.72% OBFR 3.07% minus 35bp | 5/17/2023 | BNP Paribas | 29,995 | |||||||||
| (16,500) | Live Nation Entertainment, Inc. | (1,287,495 | ) | 2.72% OBFR 3.07% minus 35bp | 5/17/2023 | BNP Paribas | (24,903 | ) | ||||||||
| (4,200) | Lumentum Holdings, Inc. | (292,950 | ) | 2.72% OBFR 3.07% minus 35bp | 5/17/2023 | BNP Paribas | (19,474 | ) | ||||||||
| (31,100) | Lyft, Inc. | (393,726 | ) | 2.72% OBFR 3.07% minus 35bp | 5/17/2023 | BNP Paribas | (61,221 | ) | ||||||||
| (15,100) | MGP Ingredients, Inc. | (1,527,214 | ) | 2.72% OBFR 3.07% minus 35bp | 5/17/2023 | BNP Paribas | (163,356 | ) | ||||||||
| (5,100) | MongoDB, Inc. | (969,204 | ) | 2.72% OBFR 3.07% minus 35bp | 5/17/2023 | BNP Paribas | 36,630 | |||||||||
| (11,700) | NextGen Healthcare, Inc. | (222,206 | ) | 2.72% OBFR 3.07% minus 35bp | 5/17/2023 | BNP Paribas | (12,262 | ) | ||||||||
| (9,600) | NuVasive, Inc. | (403,680 | ) | 2.72% OBFR 3.07% minus 35bp | 5/17/2023 | BNP Paribas | (19,602 | ) | ||||||||
| (47,600) | ON Semiconductor Corporation | (2,846,005 | ) | 2.72% OBFR 3.07% minus 35bp | 5/17/2023 | BNP Paribas | (75,483 | ) | ||||||||
| (16,400) | Ormat Technologies, Inc. | (1,407,940 | ) | 2.72% OBFR 3.07% minus 35bp | 5/17/2023 | BNP Paribas | (71,909 | ) | ||||||||
| (5,600) | Patrick Industries, Inc. | (251,012 | ) | 2.72% OBFR 3.07% minus 35bp | 5/17/2023 | BNP Paribas | (4,736 | ) | ||||||||
| (12,800) | Post Holdings, Inc. | (1,134,848 | ) | 2.72% OBFR 3.07% minus 35bp | 5/17/2023 | BNP Paribas | (21,499 | ) | ||||||||
| (24,000) | Progress Software Corporation | (1,115,280 | ) | 2.72% OBFR 3.07% minus 35bp | 5/17/2023 | BNP Paribas | (108,429 | ) | ||||||||
| (22,500) | Royal Caribbean Cruises Ltd. | (1,059,075 | ) | 2.72% OBFR 3.07% minus 35bp | 5/17/2023 | BNP Paribas | (141,015 | ) | ||||||||
| (46,500) | SFL Corporation Ltd. | (444,777 | ) | 2.72% OBFR 3.07% minus 35bp | 5/17/2023 | BNP Paribas | (29,119 | ) | ||||||||
| (5,200) | Splunk, Inc. | (385,008 | ) | 2.72% OBFR 3.07% minus 35bp | 5/17/2023 | BNP Paribas | (46,815 | ) | ||||||||
| (47,400) | Vishay Intertechnology, Inc. | (895,386 | ) | 2.72% OBFR 3.07% minus 35bp | 5/17/2023 | BNP Paribas | (94,936 | ) | ||||||||
| (17,650) | Wolfspeed, Inc. | (1,803,477 | ) | 2.72% OBFR 3.07% minus 35bp | 5/17/2023 | BNP Paribas | 415,175 | |||||||||
The accompanying notes are an integral part of the financial statements.
55
| WESTWOOD ALTERNATIVE INCOME FUND |
| OCTOBER 31, 2022 |
| Total Return Swap Agreements |
| Net Unrealized | ||||||||||||||||
| Number of | Notional | Termination | Appreciation / | |||||||||||||
| Shares | Reference Entity | Amount | Interest Rate Receivable (a) | Date | Counterparty | (Depreciation) | ||||||||||
| (26,600) | Workiva, Inc. | $ | (2,015,804 | ) | 2.72% OBFR 3.07% minus 35bp | 5/17/2023 | BNP Paribas | $ | (53,359 | ) | ||||||
| (14,800) | Ziff Davis, Inc. | (1,098,160 | ) | 2.72% OBFR 3.07% minus 35bp | 5/17/2023 | BNP Paribas | (46,216 | ) | ||||||||
| Total Short Positions | $ | (1,238,881 | ) | |||||||||||||
| Net Unrealized | ||||||||||||||||
| Notional | Termination | Appreciation / | ||||||||||||||
| Par Value | Reference Entity | Amount | Interest Rate Payable (a) | Date | Counterparty | (Depreciation) | ||||||||||
| Long Positions | ||||||||||||||||
| 1,000,000 | Airbnb, Inc., 0.0%, 3/15/2026 | $ | 848,354 | 4.17% OBFR 3.07% plus 110bp | 5/17/2023 | BNP Paribas | $ | (13,033 | ) | |||||||
| 2,000,000 | Akamai Technologies, Inc., 0.125%, 5/1/2025 | 2,086,159 | 4.17% OBFR 3.07% plus 110bp | 5/17/2023 | BNP Paribas | 57,190 | ||||||||||
| 2,000,000 | Integra Lifesciences Holdings Corporation, 0.05%, 8/15/2025 | 1,765,415 | 4.17% OBFR 3.07% plus 110bp | 5/17/2023 | BNP Paribas | 90,242 | ||||||||||
| 2,000,000 | Jazz Pharmaceuticals plc, 1.5%, 8/15/2024 | 1,909,547 | 4.17% OBFR 3.07% plus 110bp | 5/17/2023 | BNP Paribas | 6,632 | ||||||||||
| 700,000 | Lumentum Holdings, Inc., 0.5% 12/15/2026 | 665,650 | 4.17% OBFR 3.07% plus 110bp | 5/17/2023 | BNP Paribas | 18,997 | ||||||||||
| 1,500,000 | Lyft, Inc., 1.5%, 5/15/2025 | 1,289,105 | 4.17% OBFR 3.07% plus 110bp | 5/17/2023 | BNP Paribas | 38,728 | ||||||||||
| Total Long Positions | $ | 198,756 | ||||||||||||||
| Unrealized appreciation on swap agreements | $ | 921,275 | ||||||||||||||
| Unrealized depreciation on swap agreements | (1,961,400 | ) | ||||||||||||||
| Net unrealized depreciation on swap agreements | $ | (1,040,125 | ) | |||||||||||||
| (a) | Payment Frequency is monthly. |
OTC - Over the Counter
OBFR - Overnight Banking Funding Rate
The average monthly notional value for Swap Agreements - appreciation for the year ended October 31, 2022 was $17,036,558.
The average monthly notional value for Swap Agreements - depreciation for the year ended October 31, 2022 was $(51,135,734).
The accompanying notes are an integral part of the financial statements.
56
| WESTWOOD ALTERNATIVE INCOME FUND |
| OCTOBER 31, 2022 |
A list of the open futures contracts held by the Fund at October 31, 2022, is as follows:
| SCHEDULE OF FUTURES CONTRACTS SOLD SHORT |
| Value/ | ||||||||||||
| Expiration | Notional | Unrealized | ||||||||||
| FUTURES CONTRACTS SOLD SHORT^ | Contracts | Date | Value | Appreciation | ||||||||
| Futures | ||||||||||||
| 10-Year U.S. Treasury Note Future | (2) | 12/20/22 | $ | (221,188 | ) | $ | 13,437 | |||||
| 5-Year U.S. Treasury Note Future | (2) | 12/30/22 | (213,188 | ) | 9,218 | |||||||
| U.S. Treasury Long Bond Future | (4) | 12/20/22 | (482,000 | ) | 61,000 | |||||||
| Total Futures Contracts Sold Short | $ | (916,376 | ) | $ | 83,655 | |||||||
| ^ | Cash has been pledged as collateral for futures contracts held by the Fund. |
The average monthly notional value of futures sold short during the year ended October 31, 2022 was $1,048,314.
The accompanying notes are an integral part of the financial statements.
57
| WESTWOOD SMALLCAP GROWTH FUND |
| OCTOBER 31, 2022 |
| Sector Weightings (Unaudited)† |
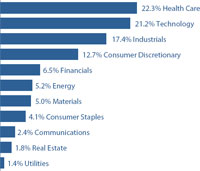
| † | Percentages are based on total investments. |
| SCHEDULE OF INVESTMENTS |
| COMMON STOCKS — 99.8% |
| Shares | Value | |||||||
| Communications — 2.4% | ||||||||
| Publishing & Broadcasting — 0.3% | ||||||||
| John Wiley & Sons, Inc. - Class A | 1,383 | $ | 58,348 | |||||
| Telecommunications — 2.1% | ||||||||
| Cogent Communications Holdings, Inc. | 8,790 | 461,563 | ||||||
| Consumer Discretionary — 12.7% | ||||||||
| Automotive — 1.8% | ||||||||
| Dorman Products, Inc. (a) | 5,019 | 409,651 | ||||||
| E-Commerce Discretionary — 0.2% | ||||||||
| PetMed Express, Inc. | 2,608 | 55,602 | ||||||
| Home Construction — 3.1% | ||||||||
| Interface, Inc. | 5,229 | 59,140 | ||||||
| KB Home | 1,922 | 55,392 | ||||||
| Masonite International Corporation (a) | 744 | 53,218 | ||||||
| MDC Holdings, Inc. | 1,830 | 55,742 | ||||||
| PGT Innovations, Inc. (a) | 19,235 | 409,898 | ||||||
| Tri Pointe Homes, Inc. (a) | 3,412 | 57,151 | ||||||
| 690,541 | ||||||||
| Leisure Facilities & Services — 3.0% | ||||||||
| Cracker Barrel Old Country Store, Inc. | 1,554 | 177,498 | ||||||
| RCI Hospitality Holdings, Inc. | 5,783 | 488,259 | ||||||
| 665,757 | ||||||||
| COMMON STOCKS — continued |
| Shares | Value | |||||||
| Consumer Discretionary — continued | ||||||||
| Leisure Products — 4.0% | ||||||||
| Clarus Corporation | �� | 33,550 | $ | 406,291 | ||||
| Funko, Inc. - Class A (a) | 20,348 | 420,186 | ||||||
| Sturm, Ruger & Company, Inc. | 986 | 55,344 | ||||||
| 881,821 | ||||||||
| Retail - Discretionary — 0.3% | ||||||||
| Guess?, Inc. | 3,439 | 58,394 | ||||||
| Wholesale - Discretionary — 0.3% | ||||||||
| ePlus, Inc. (a) | 1,236 | 60,218 | ||||||
| Consumer Staples — 4.1% | ||||||||
| Beverages — 2.3% | ||||||||
| Coca-Cola Consolidated, Inc. | 1,021 | 497,237 | ||||||
| Food — 1.5% | �� | |||||||
| John B. Sanfilippo & Son, Inc. | 2,862 | 238,719 | ||||||
| Phibro Animal Health Corporation - Class A | 3,768 | 55,352 | ||||||
| USANA Health Sciences, Inc. (a) | 901 | 47,312 | ||||||
| 341,383 | ||||||||
| Retail - Consumer Staples — 0.3% | ||||||||
| PriceSmart, Inc. | 911 | 58,277 | ||||||
| Energy — 5.2% | ||||||||
| Oil & Gas Producers — 2.6% | ||||||||
| Delek US Holdings, Inc. | 1,810 | 53,684 | ||||||
| Murphy Oil Corporation | 1,182 | 57,339 | ||||||
| SM Energy Company | 1,156 | 51,997 | ||||||
| Talos Energy, Inc. (a) | 2,407 | 51,221 | ||||||
| Tellurian, Inc. (a) | 132,423 | 357,542 | ||||||
| 571,783 | ||||||||
| Oil & Gas Services & Equipment — 2.4% | ||||||||
| Patterson-UTI Energy, Inc. | 30,016 | 529,783 | ||||||
| Renewable Energy — 0.2% | ||||||||
| EnerSys | 883 | 58,534 | ||||||
| Financials — 6.5% | ||||||||
| Banking — 4.1% | ||||||||
| Axos Financial, Inc. (a) | 8,976 | 349,705 | ||||||
| Bank of N.T. Butterfield & Son Ltd. (The) (a) | 1,506 | 52,017 | ||||||
| Pathward Financial, Inc. | 1,389 | 58,380 | ||||||
| Triumph Bancorp, Inc. (a) | 7,778 | 400,567 | ||||||
| Westamerica BanCorporation | 974 | 61,099 | ||||||
| 921,768 | ||||||||
The accompanying notes are an integral part of the financial statements.
58
| WESTWOOD SMALLCAP GROWTH FUND |
| OCTOBER 31, 2022 |
| COMMON STOCKS — continued |
| Shares | Value | |||||||
| Financials— continued | ||||||||
| Specialty Finance — 2.4% | ||||||||
| FirstCash Holdings, Inc. | 5,326 | $ | 524,344 | |||||
| Health Care — 22.2% | ||||||||
| Biotech & Pharma — 13.2% | ||||||||
| Alpine Immune Sciences, Inc. (a) | 64,306 | 380,049 | ||||||
| Aurinia Pharmaceuticals, Inc. (a) | 58,488 | 475,507 | ||||||
| Catalyst Pharmaceutical Partners, Inc. (a) | 34,998 | 485,422 | ||||||
| Crinetics Pharmaceuticals, Inc. (a) | 23,450 | 432,887 | ||||||
| Eagle Pharmaceuticals, Inc. (a) | 1,889 | 59,447 | ||||||
| Ligand Pharmaceuticals, Inc. (a) | 2,296 | 201,244 | ||||||
| Morphic Holding, Inc. (a) | 15,563 | 435,920 | ||||||
| NGM Biopharmaceuticals, Inc. (a) | 4,383 | 23,405 | ||||||
| Pacira BioSciences, Inc. (a) | 8,326 | 430,954 | ||||||
| 2,924,835 | ||||||||
| Health Care Facilities & Services — 3.5% | ||||||||
| Addus HomeCare Corporation (a) | 507 | 51,927 | ||||||
| Agiliti, Inc. (a) | 25,500 | 445,485 | ||||||
| Ensign Group, Inc. (The) | 628 | 56,382 | ||||||
| Owens & Minor, Inc. | 3,437 | 58,429 | ||||||
| Patterson Companies, Inc. | 2,011 | 52,226 | ||||||
| RadNet, Inc. (a) | 2,873 | 54,932 | ||||||
| U.S. Physical Therapy, Inc. | 674 | 59,851 | ||||||
| 779,232 | ||||||||
| Medical Equipment & Devices — 5.5% | ||||||||
| Atrion Corporation | 89 | 53,428 | ||||||
| CONMED Corporation | 685 | 54,615 | ||||||
| Inogen, Inc. (a) | 2,481 | 56,219 | ||||||
| Meridian Bioscience, Inc. (a) | 13,806 | 441,378 | ||||||
| Merit Medical Systems, Inc. (a) | 8,290 | 570,103 | ||||||
| Utah Medical Products, Inc. | 613 | 54,894 | ||||||
| 1,230,637 | ||||||||
| Industrials — 17.3% | ||||||||
| Commercial Support Services — 5.4% | ||||||||
| Barrett Business Services, Inc. | 645 | 56,257 | ||||||
| Brady Corporation - Class A | 1,242 | 56,822 | ||||||
| CBIZ, Inc. (a) | 10,189 | 505,782 | ||||||
| CRA International, Inc. | 4,623 | 474,967 | ||||||
| Hackett Group, Inc. (The) | 2,693 | 58,815 | ||||||
| National Research Corporation | 1,317 | 53,641 | ||||||
| 1,206,284 | ||||||||
| Electrical Equipment — 0.8% | ||||||||
| Advanced Energy Industries, Inc. | 725 | 57,021 | ||||||
| Belden, Inc. | 847 | 58,976 | ||||||
| OSI Systems, Inc. (a) | 726 | 59,663 | ||||||
| 175,660 | ||||||||
| COMMON STOCKS — continued |
| Shares | Value | |||||||
| Industrials — continued | ||||||||
| Engineering & Construction — 6.2% | ||||||||
| EMCOR Group, Inc. | 2,920 | $ | 412,012 | |||||
| IES Holdings, Inc. (a) | 13,500 | 446,040 | ||||||
| MYR Group, Inc. (a) | 5,168 | 452,252 | ||||||
| Primoris Services Corporation | 3,059 | 61,761 | ||||||
| 1,372,065 | ||||||||
| Machinery — 2.6% | ||||||||
| Alamo Group, Inc. | 3,084 | 469,015 | ||||||
| Hillenbrand, Inc. | 1,372 | 60,615 | ||||||
| Tennant Company | 905 | 52,716 | ||||||
| 582,346 | ||||||||
| Transportation & Logistics — 2.3% | ||||||||
| Golar LNG Ltd. (a) | 16,550 | 460,421 | ||||||
| Werner Enterprises, Inc. | 1,318 | 51,666 | ||||||
| 512,087 | ||||||||
| Materials — 5.0% | ||||||||
| Chemicals — 4.5% | ||||||||
| Ingevity Corporation (a) | 7,424 | 499,413 | ||||||
| Mativ Holdings, Inc. | 2,277 | 54,056 | ||||||
| Stepan Company | 4,230 | 441,781 | ||||||
| 995,250 | ||||||||
| Containers & Packaging — 0.2% | ||||||||
| Greif, Inc. - Class A | 878 | 58,132 | ||||||
| Steel — 0.3% | ||||||||
| Northwest Pipe Company (a) | 1,732 | 58,871 | ||||||
| Real Estate — 1.8% | ||||||||
| REITs — 1.8% | ||||||||
| PotlatchDeltic Corporation | 1,208 | 53,744 | ||||||
| Tanger Factory Outlet Centers, Inc. | 19,096 | 343,919 | ||||||
| 397,663 | ||||||||
| Technology — 21.2% | ||||||||
| Semiconductors — 6.2% | ||||||||
| CEVA, Inc. (a) | 17,215 | 476,167 | ||||||
| CTS Corporation | 10,653 | 421,007 | ||||||
| Diodes, Inc. (a) | 5,880 | 421,420 | ||||||
| Ultra Clean Holdings, Inc. (a) | 2,058 | 64,024 | ||||||
| 1,382,618 | ||||||||
| Software — 7.2% | ||||||||
| ACI Worldwide, Inc. (a) | 21,356 | 519,592 | ||||||
| Apollo Medical Holdings, Inc. (a) | 13,814 | 489,844 | ||||||
| Blackbaud, Inc. (a) | 1,383 | 75,650 | ||||||
| Ebix, Inc. | 2,809 | 55,590 | ||||||
| Sapiens International Corporation N.V. | 23,404 | 460,357 | ||||||
| 1,601,033 | ||||||||
The accompanying notes are an integral part of the financial statements.
59
| WESTWOOD SMALLCAP GROWTH FUND |
| OCTOBER 31, 2022 |
| COMMON STOCKS — continued |
| Shares | Value | |||||||
| Technology — continued | ||||||||
| Technology Hardware — 2.4% | ||||||||
| Fabrinet (a) | 4,618 | $ | 528,299 | |||||
| Technology Services — 5.4% | ||||||||
| Cass Information Systems, Inc. | 1,407 | 60,191 | ||||||
| EVERTEC, Inc. | 13,977 | 500,516 | ||||||
| Insight Enterprises, Inc. (a) | 597 | 56,423 | ||||||
| Maximus, Inc. | 934 | 57,600 | ||||||
| Perficient, Inc. (a) | 6,929 | 464,035 | ||||||
| TTEC Holdings, Inc. | 1,226 | 54,520 | ||||||
| 1,193,285 | ||||||||
| Utilities — 1.4% | ||||||||
| Gas & Water Utilities — 1.4% | ||||||||
| New Jersey Resources Corporation | 5,718 | 255,251 | ||||||
| Southwest Gas Holdings, Inc. | 767 | 56,045 | ||||||
| 311,296 | ||||||||
| Investments at Value — 99.8% | ||||||||
| (Cost $21,191,695) | $ | 22,154,597 | ||||||
| Other Assets in Excess of Liabilities — 0.2% | 53,427 | |||||||
| Net Assets — 100.0% | $ | 22,208,024 | ||||||
N.V. - Naamloze Vennootschap
| (a) | Non-income producing security. |
The accompanying notes are an integral part of the financial statements.
60
| WESTWOOD FUNDS | |
| OCTOBER 31, 2022 | |
| STATEMENTS OF ASSETS AND LIABILITIES | |
| Westwood | Westwood | |||||||||||||||
| Westwood | Westwood | Quality | Quality | |||||||||||||
| Quality Value | Quality MidCap | SMidCap | SmallCap | |||||||||||||
| Fund | Fund | Fund | Fund | |||||||||||||
| ASSETS | ||||||||||||||||
| Investments in securities: | ||||||||||||||||
| At cost | $ | 208,102,874 | $ | 543,723 | $ | 273,982,500 | $ | 910,698,546 | ||||||||
| At value (Note 2) | $ | 251,727,097 | $ | 534,736 | $ | 290,756,558 | $ | 989,962,977 | ||||||||
| Receivable for capital shares sold | 1,782 | — | 1,927 | 185,266 | ||||||||||||
| Receivable for investment securities sold | — | 5,055 | — | 2,086,725 | ||||||||||||
| Receivable from Adviser (Note 4) | — | 4,813 | — | — | ||||||||||||
| Dividends and interest receivable | 222,436 | 216 | 151,496 | 259,804 | ||||||||||||
| Other assets | 23,878 | 2,689 | 25,398 | 35,322 | ||||||||||||
| Total assets | 251,975,193 | 547,509 | 290,935,379 | 992,530,094 | ||||||||||||
| LIABILITIES | ||||||||||||||||
| Payable for capital shares redeemed | 5,058 | — | 200,651 | 507,903 | ||||||||||||
| Payable for investment securities purchased | 597,232 | — | — | 1,821,268 | ||||||||||||
| Payable to Adviser, net of waivers | 86,371 | — | 128,568 | 501,016 | ||||||||||||
| Payable to Administrator | 7,445 | 3,301 | 7,712 | 25,236 | ||||||||||||
| Accrued administrative servicing fees — Institutional Shares | — | — | 85,631 | 107,271 | ||||||||||||
| Payable for distribution fees — A Class Shares | 864 | — | — | 708 | ||||||||||||
| Payable for distribution fees — C Class Shares | 13 | — | — | 4,003 | ||||||||||||
| Other accrued expenses | 17,250 | 14,450 | 18,070 | 26,010 | ||||||||||||
| Total liabilities | 714,233 | 17,751 | 440,632 | 2,993,415 | ||||||||||||
| NETASSETS | $ | 251,260,960 | $ | 529,758 | $ | 290,494,747 | $ | 989,536,679 | ||||||||
| NET ASSETS CONSIST OF: | ||||||||||||||||
| Paid-in capital | $ | 207,471,817 | $ | 549,955 | $ | 271,106,209 | $ | 889,067,075 | ||||||||
| Distributable earnings (accumulated deficit) | 43,789,143 | (20,197 | ) | 19,388,538 | 100,469,604 | |||||||||||
| NETASSETS | $ | 251,260,960 | $ | 529,758 | $ | 290,494,747 | $ | 989,536,679 | ||||||||
| NET ASSET VALUE PER SHARE: | ||||||||||||||||
| INSTITUTIONAL SHARES | ||||||||||||||||
| Net assets applicable to Institutional Shares | $ | 249,760,475 | $ | 529,758 | $ | 201,585,982 | $ | 476,094,162 | ||||||||
| Institutional Shares of beneficial interest outstanding | 19,948,554 | 54,943 | 15,633,609 | 25,213,137 | ||||||||||||
| Net asset value, offering price and redemption price per share (Note 1) | $ | 12.52 | $ | 9.64 | $ | 12.89 | $ | 18.88 | ||||||||
| A CLASS SHARES | ||||||||||||||||
| Net assets applicable to A Class Shares | $ | 1,402,198 | N/A | N/A | $ | 1,555,750 | ||||||||||
| A Class Shares of beneficial interest outstanding | 111,493 | N/A | N/A | 82,566 | ||||||||||||
| Net asset value and redemption price per share (Note1) | $ | 12.58 | N/A | N/A | $ | 18.84 | ||||||||||
| Maximum sales charge | 3.00 | % | N/A | N/A | 4.00 | % | ||||||||||
| Maximum offering price per share | $ | 12.97 | N/A | N/A | $ | 19.63 | ||||||||||
| C CLASS SHARES | ||||||||||||||||
| Net assets applicable to C Class Shares | $ | 98,287 | N/A | N/A | $ | 707,801 | ||||||||||
| C Class Shares of beneficial interest outstanding | 8,006 | N/A | N/A | 38,013 | ||||||||||||
| Net asset value, offering price and redemption price | ||||||||||||||||
| per share (Note 1) | $ | 12.28 | N/A | N/A | $ | 18.62 | ||||||||||
| ULTRA CLASS SHARES | ||||||||||||||||
| Net assets applicable to Ultra Class Shares | N/A | N/A | $ | 88,908,765 | $ | 511,178,966 | ||||||||||
| Ultra Class Shares of beneficial interest outstanding | N/A | N/A | 6,893,060 | 27,032,367 | ||||||||||||
| Net asset value, offering price and redemption price per share (Note 1) | N/A | N/A | $ | 12.90 | $ | 18.91 | ||||||||||
Amounts designated as “—” are either $0 or have been rounded to $0.
N/A — Not Applicable
The accompanying notes are an integral part of the financial statements.
61
| WESTWOOD FUNDS | |
| OCTOBER 31, 2022 | |
| STATEMENTS OF ASSETS AND LIABILITIES | |
| Westwood | ||||||||||||
| Westwood | Westwood | Income | ||||||||||
| Quality AllCap | Total Return | Opportunity | ||||||||||
| Fund | Fund | Fund | ||||||||||
| ASSETS | ||||||||||||
| Investments in securities: | ||||||||||||
| At cost | $ | 21,674,499 | $ | 122,782,818 | $ | 678,127,278 | ||||||
| At value (Note 2) | $ | 22,097,877 | $ | 123,152,782 | $ | 645,529,255 | ||||||
| Receivable for capital shares sold | — | 20,897 | 16,159 | |||||||||
| Receivable for investment securities sold | 186,946 | 603,702 | — | |||||||||
| Receivable from Adviser (Note 4) | 1,757 | — | — | |||||||||
| Dividends and interest receivable | 12,960 | 667,851 | 3,853,854 | |||||||||
| Reclaim receivable | — | 4,221 | 54,473 | |||||||||
| Other assets | 19,153 | 15,533 | 48,238 | |||||||||
| Total assets | 22,318,693 | 124,464,986 | 649,501,979 | |||||||||
| LIABILITIES | ||||||||||||
| Payable for capital shares redeemed | — | 7,966 | 1,165,803 | |||||||||
| Payable to Adviser, net of waivers | — | 387,464 | 428,821 | |||||||||
| Payable to Administrator | 1,339 | 3,926 | 18,003 | |||||||||
| Accrued administrative servicing fees — Institutional Shares | 30 | — | — | |||||||||
| Payable for distribution fees — A Class Shares | — | 8 | 18,068 | |||||||||
| Payable for distribution fees — C Class Shares | — | 66 | 33,525 | |||||||||
| Other accrued expenses | 14,736 | 20,230 | 26,361 | |||||||||
| Total liabilities | 16,105 | 419,660 | 1,690,581 | |||||||||
| NETASSETS | $ | 22,302,588 | $ | 124,045,326 | $ | 647,811,398 | ||||||
| NET ASSETS CONSIST OF: | ||||||||||||
| Paid-in capital | $ | 22,195,020 | $ | 123,851,420 | $ | 680,079,948 | ||||||
| Distributable earnings (accumulated deficit) | 107,568 | 193,906 | (32,268,550 | ) | ||||||||
| NETASSETS | $ | 22,302,588 | $ | 124,045,326 | $ | 647,811,398 | ||||||
| NET ASSET VALUE PER SHARE: | ||||||||||||
| INSTITUTIONAL SHARES | ||||||||||||
| Net assets applicable to Institutional Shares | $ | 552,975 | $ | 123,965,443 | $ | 579,771,997 | ||||||
| Institutional Shares of beneficial interest outstanding | 55,125 | 20,371,829 | 54,754,262 | |||||||||
| Net asset value, offering price and redemption price per share (Note 1) | $ | 10.03 | $ | 6.09 | $ | 10.59 | ||||||
| A CLASS SHARES | ||||||||||||
| Net assets applicable to A Class Shares | N/A | $ | 24,435 | $ | 55,296,183 | |||||||
| A Class Shares of beneficial interest outstanding | N/A | 4,023 | 5,228,975 | |||||||||
| Net asset value and redemption price per share (Note 1) | N/A | $ | 6.07 | $ | 10.57 | |||||||
| Maximum sales charge | N/A | 3.00 | % | 3.00 | % | |||||||
| Maximum offering price per share | N/A | $ | 6.26 | $ | 10.90 | |||||||
| C CLASS SHARES | ||||||||||||
| Net assets applicable to C Class Shares | N/A | $ | 55,448 | $ | 12,743,218 | |||||||
| C Class Shares of beneficial interest outstanding | N/A | 9,146 | 1,210,728 | |||||||||
| Net asset value, offering price and redemption price per share (Note 1) | N/A | $ | 6.06 | $ | 10.53 | |||||||
| ULTRA SHARES | ||||||||||||
| Net assets applicable to Ultra Shares | $ | 21,749,613 | N/A | N/A | ||||||||
| Ultra Shares of beneficial interest outstanding | 2,168,777 | N/A | N/A | |||||||||
| Net asset value, offering price and redemption price per share (Note 1) | $ | 10.03 | N/A | N/A | ||||||||
Amounts designated as “—” are either $0 or have been rounded to $0.
N/A — Not Applicable
The accompanying notes are an integral part of the financial statements.
62
| WESTWOOD FUNDS | |
| OCTOBER 31, 2022 | |
| STATEMENTS OF ASSETS AND LIABILITIES | |
| Westwood | Westwood | Westwood | ||||||||||
| High Income | Alternative | SmallCap | ||||||||||
| Fund | Income Fund | Growth Fund | ||||||||||
| ASSETS | ||||||||||||
| Investments in securities: | ||||||||||||
| At cost | $ | 110,823,552 | $ | 168,435,521 | $ | 21,191,695 | ||||||
| At value (Note 2) | $ | 98,716,091 | $ | 164,119,085 | $ | 22,154,597 | ||||||
| Cash | $ | — | $ | 3,001,875 | $ | — | ||||||
| Unrealized appreciation on swap agreements | — | 921,275 | — | |||||||||
| Receivable for capital shares sold | 21,205 | 7,818 | — | |||||||||
| Receivable for investment securities sold | — | 1,304,936 | 65,975 | |||||||||
| Dividends and interest receivable | 1,090,409 | 879,457 | 8,523 | |||||||||
| Reclaim receivable | 5,496 | — | — | |||||||||
| Cash collateral for option contracts | — | 256,764 | — | |||||||||
| Cash collateral for futures contracts | — | 698,633 | — | |||||||||
| Variation Margin receivable on futures contracts | — | 4,374 | — | |||||||||
| Other assets | 27,160 | 20,736 | 13,816 | |||||||||
| Total assets | 99,860,361 | 171,214,953 | 22,242,911 | |||||||||
| LIABILITIES | ||||||||||||
| Cash overdraft | — | — | 11,082 | |||||||||
| Unrealized depreciation on swap agreements | — | 1,961,400 | — | |||||||||
| Payable for capital shares redeemed | 26,643 | 116,603 | — | |||||||||
| Payable for investment securities purchased | — | 12,719,556 | — | |||||||||
| Payable to Adviser, net of waivers | 647,283 | 5,650 | 3,865 | |||||||||
| Payable to Administrator | 3,383 | 4,586 | 1,340 | |||||||||
| Payable due to Prime Broker | — | 134,277 | — | |||||||||
| Accrued administrative servicing fees — Institutional Shares | 4,381 | 12,776 | 590 | |||||||||
| Payable for distribution fees — A Class Shares | 948 | 9 | — | |||||||||
| Payable for distribution fees — C Class Shares | 662 | 20 | — | |||||||||
| Other accrued expenses | 19,970 | 24,253 | 18,010 | |||||||||
| Total liabilities | 703,270 | 14,979,130 | 34,887 | |||||||||
| NETASSETS | $ | 99,157,091 | $ | 156,235,823 | $ | 22,208,024 | ||||||
| NET ASSETS CONSIST OF: | ||||||||||||
| Paid-in capital | $ | 122,409,830 | $ | 155,883,259 | $ | 24,256,776 | ||||||
| Distributable earnings (accumulated deficit) | (23,252,739 | ) | 352,564 | (2,048,752 | ) | |||||||
| NETASSETS | $ | 99,157,091 | $ | 156,235,823 | $ | 22,208,024 | ||||||
| NET ASSET VALUE PER SHARE: | ||||||||||||
| INSTITUTIONAL SHARES | ||||||||||||
| Net assets applicable to Institutional Shares | $ | 96,635,638 | $ | 67,312,327 | $ | 22,208,024 | ||||||
| Institutional Shares of beneficial interest outstanding | 10,801,739 | 6,475,553 | 2,734,852 | |||||||||
| Net asset value, offering price and redemption price per share (Note 1) | $ | 8.95 | $ | 10.39 | $ | 8.12 | ||||||
| A CLASS SHARES | ||||||||||||
| Net assets applicable to A Class Shares | $ | 2,320,556 | $ | 32,687 | N/A | |||||||
| A Class Shares of beneficial interest outstanding | 257,961 | 3,147 | N/A | |||||||||
| Net asset value and redemption price per share (Note1) | $ | 9.00 | $ | 10.39 | N/A | |||||||
| Maximum sales charge | 3.00 | % | 3.00 | % | N/A | |||||||
| Maximum offering price per share | $ | 9.28 | $ | 10.71 | N/A | |||||||
| C CLASS SHARES | ||||||||||||
| Net assets applicable to C Class Shares | $ | 200,897 | $ | 156,318 | N/A | |||||||
| C Class Shares of beneficial interest outstanding | 22,288 | 15,024 | N/A | |||||||||
| Net asset value, offering price and redemption price per share (Note 1) | $ | 9.01 | $ | 10.40 | N/A | |||||||
| ULTRA SHARES | ||||||||||||
| Net assets applicable to Ultra Shares | N/A | $ | 88,734,491 | N/A | ||||||||
| Ultra Shares of beneficial interest outstanding | N/A | 8,532,370 | N/A | |||||||||
| Net asset value, offering price and redemption price per share (Note 1) | N/A | $ | 10.40 | N/A | ||||||||
Amounts designated as “—” are either $0 or have been rounded to $0.
N/A — Not Applicable
The accompanying notes are an integral part of the financial statements.
63
| WESTWOOD FUNDS | |
| YEAR/PERIOD ENDED OCTOBER 31, 2022 | |
| STATEMENTS OF OPERATIONS | |
| Westwood | Westwood | |||||||||||||||
| Westwood | Westwood | Quality | Quality | |||||||||||||
| Quality Value | Quality MidCap | SMidCap | SmallCap | |||||||||||||
| Fund | Fund(a) | Fund | Fund | |||||||||||||
| INVESTMENT INCOME | ||||||||||||||||
| Dividend income (net of foreign withholding tax of $3,710, $5, $0, and $0, respectively) | $ | 5,248,885 | $ | 8,513 | $ | 4,605,132 | $ | 19,308,798 | ||||||||
| Total investment income | 5,248,885 | 8,513 | 4,605,132 | 19,308,798 | ||||||||||||
| EXPENSES | ||||||||||||||||
| Investment management fees (Note 4) | 1,550,960 | 2,743 | 2,327,583 | 8,810,939 | ||||||||||||
| Administrative service plan fees-Institutional Shares (Note 4) | — | 12 | 400,840 | 689,538 | ||||||||||||
| Administration fees (Note 4) | 59,317 | 27,500 | 73,772 | 244,129 | ||||||||||||
| Registration and filing fees | 59,155 | 10,381 | 82,722 | 100,462 | ||||||||||||
| Legal fees | 17,135 | 14,196 | 19,349 | 65,106 | ||||||||||||
| Trustees’ fees and expenses (Note 4) | 17,060 | 291 | 19,909 | 65,990 | ||||||||||||
| Audit and tax service fees | 15,730 | 14,402 | 15,871 | 16,383 | ||||||||||||
| Transfer agent fees (Note 4) | 16,300 | 9,153 | 8,353 | 20,307 | ||||||||||||
| Custody fees | 13,141 | 2,587 | 10,064 | 25,009 | ||||||||||||
| Compliance fees (Note 4) | 5,106 | 9 | 6,102 | 20,399 | ||||||||||||
| Insurance expense | 1,770 | 1,050 | 1,867 | 3,716 | ||||||||||||
| Distribution fees-A Class (Note 4) | 2,753 | — | — | 3,722 | ||||||||||||
| Distribution fees-C Class (Note 4) | 562 | — | — | 7,600 | ||||||||||||
| Other expenses | 28,013 | 12,579 | 21,780 | 70,167 | ||||||||||||
| Total expenses | 1,787,002 | 94,903 | 2,988,212 | 10,143,467 | ||||||||||||
| Investment management fees reduced and expense reimbursements by the Adviser (Note 4) | (97,530 | ) | (92,127 | ) | (476,566 | ) | (1,251,166 | ) | ||||||||
| Net expenses | 1,689,472 | 2,776 | 2,511,646 | 8,892,301 | ||||||||||||
| NET INVESTMENT INCOME | 3,559,413 | 5,737 | 2,093,486 | 10,416,497 | ||||||||||||
| REALIZED AND UNREALIZED GAINS (LOSSES) ON INVESTMENTS | ||||||||||||||||
| Net realized gains (losses) from investment transactions | (1,266,952 | ) | (16,968 | ) | 2,766,641 | 34,401,123 | ||||||||||
| Net change in unrealized appreciation (depreciation) on investments | (14,684,865 | ) | (8,987 | ) | (37,760,503 | ) | (162,632,712 | ) | ||||||||
| NET REALIZED AND UNREALIZED LOSSES ON INVESTMENTS | (15,951,817 | ) | (25,955 | ) | (34,993,862 | ) | (128,231,589 | ) | ||||||||
| NET DECREASE IN NET ASSETS RESULTING FROM OPERATIONS | $ | (12,392,404 | ) | $ | (20,218 | ) | $ | (32,900,376 | ) | $ | (117,815,092 | ) | ||||
Amounts designated as “—” are either $0 or have been rounded to $0.
| (a) | Represents the period from the commencement of operations (November 30, 2021) through October 31, 2022. |
The accompanying notes are an integral part of the financial statements.
64
| WESTWOOD FUNDS | |
| YEAR ENDED OCTOBER 31, 2022 | |
| STATEMENTS OF OPERATIONS | |
| Westwood | ||||||||||||
| Westwood | Westwood | Income | ||||||||||
| Quality AllCap | Total Return | Opportunity | ||||||||||
| Fund | Fund | Fund | ||||||||||
| INVESTMENT INCOME | ||||||||||||
| Dividend income (net of foreign withholding tax of $256, $16,804 and $96,515, respectively) | $ | 437,422 | $ | 2,051,170 | $ | 11,825,941 | ||||||
| Interest income (net of foreign withholding tax of $0, $1,191 and $18,283, respectively) | — | 2,113,667 | 13,884,292 | |||||||||
| Total investment income | 437,422 | 4,164,837 | 25,710,233 | |||||||||
| EXPENSES | ||||||||||||
| Investment management fees (Note 4) | 98,606 | 757,112 | 5,793,763 | |||||||||
| Administration fees (Note 4) | 28,548 | 32,018 | 184,400 | |||||||||
| Registration and filing fees | 19,555 | 55,383 | 76,342 | |||||||||
| Distribution fees-A Class (Note 4) | — | 31 | 149,476 | |||||||||
| Distribution fees-C Class (Note 4) | — | 901 | 132,285 | |||||||||
| Legal fees | 4,790 | 8,257 | 47,401 | |||||||||
| Trustees’ fees and expenses (Note 4) | 1,953 | 8,300 | 48,449 | |||||||||
| Transfer agent fees (Note 4) | 12,880 | 8,841 | 30,756 | |||||||||
| Audit and tax service fees | 14,411 | 16,295 | 17,069 | |||||||||
| Custody fees | 3,291 | 8,461 | 21,869 | |||||||||
| Compliance fees (Note 4) | 432 | 2,534 | 15,163 | |||||||||
| Insurance expense | 1,107 | 1,376 | 3,041 | |||||||||
| Other expenses | 18,963 | 31,576 | 48,045 | |||||||||
| Total expenses | 204,536 | 931,085 | 6,568,059 | |||||||||
| Investment management fees reduced and expense reimbursements by the Adviser (Note 4) | (105,671 | ) | (105,981 | ) | — | |||||||
| Net expenses | 98,865 | 825,104 | 6,568,059 | |||||||||
| NET INVESTMENT INCOME | 338,557 | 3,339,733 | 19,142,174 | |||||||||
| REALIZED AND UNREALIZED GAINS (LOSSES) ON INVESTMENTS | ||||||||||||
| Net realized losses from investment transactions | (595,695 | ) | (14,057 | ) | (1,585,696 | ) | ||||||
| Net realized losses from foreign currency transactions | — | — | (1,691 | ) | ||||||||
| Net change in unrealized appreciation (depreciation) on investments | (751,670 | ) | (21,595,272 | ) | (142,557,732 | ) | ||||||
| NET REALIZED AND UNREALIZED LOSSES ON INVESTMENTS | (1,347,365 | ) | (21,609,329 | ) | (144,145,119 | ) | ||||||
| NET DECREASE IN NET ASSETS RESULTING FROM OPERATIONS | $ | (1,008,808 | ) | $ | (18,269,596 | ) | $ | (125,002,945 | ) | |||
Amounts designated as “—” are either $0 or have been rounded to $0.
The accompanying notes are an integral part of the financial statements.
65
| WESTWOOD FUNDS | |
| YEAR ENDED OCTOBER 31, 2022 | |
| STATEMENTS OF OPERATIONS | |
| Westwood | Westwood | Westwood | ||||||||||
| High Income | Alternative | SmallCap | ||||||||||
| Fund | Income Fund | Growth Fund | ||||||||||
| INVESTMENT INCOME | ||||||||||||
| Dividend income (net of foreign withholding tax of $11,476, $0, and $1,040, respectively) | $ | 834,133 | $ | 106,763 | $ | 125,669 | ||||||
| Interest income (net of foreign withholding tax of $10,445, $2,819, and $0,respectively) | 4,330,482 | 3,303,247 | — | |||||||||
| Total investment income | 5,164,615 | 3,410,010 | 125,669 | |||||||||
| EXPENSES | ||||||||||||
| Investment management fees (Note 4) | 707,811 | 334,612 | 73,534 | |||||||||
| Registration and filing fees | 58,475 | 72,939 | 17,925 | |||||||||
| Administration fees (Note 4) | 24,099 | 40,099 | 28,548 | |||||||||
| Administrative service plan fees-Institutional Shares (Note 4) | 318 | 56,439 | 906 | |||||||||
| Audit and tax service fees | 14,394 | 19,558 | 14,410 | |||||||||
| Custody fees | 8,021 | 8,931 | 15,929 | |||||||||
| Transfer agent fees (Note 4) | 9,081 | 7,869 | 10,282 | |||||||||
| Legal fees | 6,696 | 10,893 | 3,460 | |||||||||
| Trustees’ fees and expenses (Note 4) | 6,838 | 10,077 | 1,479 | |||||||||
| Distribution fees-A Class (Note 4) | 5,606 | 91 | — | |||||||||
| Distribution fees-C Class (Note 4) | 2,013 | 486 | — | |||||||||
| Compliance fees (Note 4) | 1,998 | 3,132 | 275 | |||||||||
| Insurance expense | 1,326 | 1,481 | 1,115 | |||||||||
| Other expenses | 41,345 | 38,618 | 17,755 | |||||||||
| Total expenses | 888,021 | 605,225 | 185,618 | |||||||||
| Investment management fees reduced and expense reimbursements by the Adviser (Note 4) | (69,686 | ) | (216,283 | ) | (111,666 | ) | ||||||
| Contractual management fees waived by Adviser (Note 4) | — | (10,233 | ) | — | ||||||||
| Net expenses | 818,335 | 378,709 | 73,952 | |||||||||
| NET INVESTMENT INCOME | 4,346,280 | 3,031,301 | 51,717 | |||||||||
| REALIZED AND UNREALIZED GAINS (LOSSES) ON INVESTMENTS | ||||||||||||
| Net realized losses from investment transactions | (1,205,045 | ) | (16,834,246 | ) | (3,058,584 | ) | ||||||
| Net realized gains from securities sold short | — | 202,498 | — | |||||||||
| Net realized gains (losses) from foreign currency transactions | (90 | ) | 8 | — | ||||||||
| Net realized gains from futures transactions (Note 5) | — | 162,409 | — | |||||||||
| Net realized gains from purchased option contracts (Note 5) | — | 201,743 | — | |||||||||
| Net realized gains from swap transactions | — | 22,944,972 | — | |||||||||
| Net change in unrealized appreciation (depreciation) on investments | (16,901,273 | ) | (14,894,426 | ) | 946,654 | |||||||
| Net change in unrealized appreciation (depreciation) on futures | — | 60,746 | — | |||||||||
| Net change in unrealized appreciation (depreciation) on purchased option contracts | — | (99,948 | ) | — | ||||||||
| Net change in unrealized appreciation (depreciation) on swaps | — | 803,414 | — | |||||||||
| NET REALIZED AND UNREALIZED LOSSES ON INVESTMENTS | (18,106,408 | ) | (7,452,830 | ) | (2,111,930 | ) | ||||||
| NET DECREASE IN NET ASSETS RESULTING FROM OPERATIONS | $ | (13,760,128 | ) | $ | (4,421,529 | ) | $ | (2,060,213 | ) | |||
Amounts designated as “—” are either $0 or have been rounded to $0.
The accompanying notes are an integral part of the financial statements.
66
| WESTWOOD FUNDS | |
| STATEMENTS OF CHANGES IN NET ASSETS | |
| Westwood | ||||||||||||||||||||
| Westwood Quality | Quality | Westwood Quality | ||||||||||||||||||
| Value Fund | MidCap Fund | SMidCap Fund | ||||||||||||||||||
| Year Ended | Year Ended | Period Ended | Year Ended | Year Ended | ||||||||||||||||
| October 31, | October 31, | October 31, | October 31, | October 31, | ||||||||||||||||
| 2022 | 2021 (a) | 2022 (b) | 2022 | 2021 (c) | ||||||||||||||||
| FROM OPERATIONS | ||||||||||||||||||||
| Net investment income | $ | 3,559,413 | $ | 1,710,107 | $ | 5,737 | $ | 2,093,486 | $ | 2,806,105 | ||||||||||
| Net realized gains (losses) from investments and foreign currency transactions | (1,266,952 | ) | 40,037,123 | (16,968 | ) | 2,766,641 | 46,153,438 | |||||||||||||
| Net change in unrealized appreciation (depreciation) on investments and foreign currency translations | (14,684,865 | ) | 19,579,369 | (8,987 | ) | (37,760,503 | ) | 33,763,426 | ||||||||||||
| Net increase (decrease) in net assets resulting from operations | (12,392,404 | ) | 61,326,599 | (20,218 | ) | (32,900,376 | ) | 82,722,969 | ||||||||||||
| FROM DISTRIBUTIONS TO SHAREHOLDERS | ||||||||||||||||||||
| Institutional Shares | (39,487,955 | ) | (11,086,837 | ) | — | (33,934,719 | ) | (5,290,326 | ) | |||||||||||
| A Class Shares | (130,582 | ) | (131,278 | ) | — | — | — | |||||||||||||
| C Class Shares | (145 | ) | (10 | ) | — | — | — | |||||||||||||
| Ultra Shares | — | — | — | (14,978,126 | ) | (219,880 | ) | |||||||||||||
| Total distributions | (39,618,682 | ) | (11,218,125 | ) | — | (48,912,845 | ) | (5,510,206 | ) | |||||||||||
| CAPITAL SHARE TRANSACTIONS | ||||||||||||||||||||
| Institutional Class | ||||||||||||||||||||
| Issued | 110,036,446 | 26,813,884 | 549,976 | 38,683,258 | 55,681,359 | |||||||||||||||
| Reinvestment of dividends | 27,161,720 | 9,127,074 | — | 33,838,985 | 5,269,890 | |||||||||||||||
| Redeemed | (42,331,526 | ) | (51,279,758 | ) | — | (51,331,767 | ) | (50,919,571 | ) | |||||||||||
| Net increase (decrease) from Institutional Shares capital share transactions | 94,866,640 | (15,338,800 | ) | 549,976 | 21,190,476 | 10,031,678 | ||||||||||||||
| A Class Class | ||||||||||||||||||||
| Issued | 610,758 | 192,311 | N/A | N/A | N/A | |||||||||||||||
| Reinvestment of dividends | 130,582 | 131,278 | N/A | N/A | N/A | |||||||||||||||
| Redeemed | (26,195 | ) | (1,996,945 | ) | N/A | N/A | N/A | |||||||||||||
| Net increase (decrease) from A Class Shares capital share transactions | 715,145 | (1,673,356 | ) | N/A | N/A | N/A | ||||||||||||||
| C Class Class | ||||||||||||||||||||
| Issued | 101,679 | 2 | N/A | N/A | N/A | |||||||||||||||
| Reinvestment of dividends | 145 | 10 | N/A | N/A | N/A | |||||||||||||||
| Redeemed | — | — | N/A | N/A | N/A | |||||||||||||||
| Net increase from C Class Shares capital share transactions | 101,824 | 12 | N/A | N/A | N/A | |||||||||||||||
| Ultra Class | ||||||||||||||||||||
| Issued | N/A | N/A | N/A | 10,477,959 | 102,073,362 | |||||||||||||||
| Reinvestment of dividends | N/A | N/A | N/A | 14,978,126 | 219,880 | |||||||||||||||
| Redeemed | N/A | N/A | N/A | (12,750,424 | ) | (17,547,586 | ) | |||||||||||||
| Net increase from Ultra Shares capital share transactions | N/A | N/A | N/A | 12,705,661 | 84,745,656 | |||||||||||||||
| Net increase (decrease) in net assets from capital share transactions | 95,683,609 | (17,012,144 | ) | 549,976 | 33,896,137 | 94,777,334 | ||||||||||||||
| TOTAL INCREASE (DECREASE) IN NET ASSETS | 43,672,523 | 33,096,330 | 529,758 | (47,917,084 | ) | 171,990,097 | ||||||||||||||
| NET ASSETS | ||||||||||||||||||||
| Beginning of period | 207,588,437 | 174,492,107 | — | 338,411,831 | 166,421,734 | |||||||||||||||
| End of period | $ | 251,260,960 | $ | 207,588,437 | $ | 529,758 | $ | 290,494,747 | $ | 338,411,831 | ||||||||||
Amounts designated as “—” are $0 or rounded to $0.
N/A – Not Applicable
| (a) | Effective March 1, 2021, Westwood LargeCap Fund was renamed as Westwood Quality Value Fund. |
| (b) | Represents the period from the commencement of operations (November 30, 2021) through October 31, 2022. |
| (c) | Effective March 1, 2021, Westwood SMIDCap Fund was renamed as Westwood Quality SMIDCap Fund. |
The accompanying notes are an integral part of the financial statements.
67
| WESTWOOD FUNDS | |
| STATEMENTS OF CHANGES IN NET ASSETS | |
| Westwood | ||||||||||||||||||||
| Westwood Quality | Quality | Westwood Quality | ||||||||||||||||||
| Value Fund | MidCap Fund | SMidCap Fund | ||||||||||||||||||
| Year Ended | Year Ended | Period Ended | Year Ended | Year Ended | ||||||||||||||||
| October 31, | October 31, | October 31, | October 31, | October 31, | ||||||||||||||||
| 2022 | 2021 (a) | 2022 (b) | 2022 | 2021 (c) | ||||||||||||||||
| CAPITAL SHARES ACTIVITY | ||||||||||||||||||||
| Institutional Shares | ||||||||||||||||||||
| Sold | 7,869,019 | 1,895,497 | 54,943 | 2,912,499 | 3,569,810 | |||||||||||||||
| Issued in reinvestment of dividends to shareholders | 2,049,946 | 713,906 | — | 2,351,737 | 386,774 | |||||||||||||||
| Redeemed | (3,339,361 | ) | (3,843,269 | ) | — | (3,919,333 | ) | (3,402,481 | ) | |||||||||||
| Net increase (decrease) in shares outstanding | 6,579,604 | (1,233,866 | ) | 54,943 | 1,344,903 | 554,103 | ||||||||||||||
| Shares outstanding at beginning of period | 13,368,950 | 14,602,816 | — | 14,288,706 | 13,734,603 | |||||||||||||||
| Shares outstanding at end of period | 19,948,554 | 13,368,950 | 54,943 | 15,633,609 | 14,288,706 | |||||||||||||||
| A Class Shares | ||||||||||||||||||||
| Sold | 48,433 | 13,323 | N/A | N/A | N/A | |||||||||||||||
| Issued in reinvestment of dividends to shareholders | 9,819 | 10,233 | N/A | N/A | N/A | |||||||||||||||
| Redeemed | (2,033 | ) | (149,365 | ) | N/A | N/A | N/A | |||||||||||||
| Net increase (decrease) in shares outstanding | 56,219 | (125,809 | ) | N/A | N/A | N/A | ||||||||||||||
| Shares outstanding at beginning of period | 55,274 | 181,083 | N/A | N/A | N/A | |||||||||||||||
| Shares outstanding at end of period | 111,493 | 55,274 | N/A | N/A | N/A | |||||||||||||||
| C Class Shares | ||||||||||||||||||||
| Sold | 7,981 | — | N/A | N/A | N/A | |||||||||||||||
| Issued in reinvestment of dividends to shareholders | 11 | 1 | N/A | N/A | N/A | |||||||||||||||
| Redeemed | — | — | N/A | N/A | N/A | |||||||||||||||
| Net increase in shares outstanding | 7,992 | 1 | N/A | N/A | N/A | |||||||||||||||
| Shares outstanding at beginning of period | 14 | 13 | N/A | N/A | N/A | |||||||||||||||
| Shares outstanding at end of period | 8,006 | 14 | N/A | N/A | N/A | |||||||||||||||
| Ultra Shares | ||||||||||||||||||||
| Sold | N/A | N/A | N/A | 733,794 | 7,021,662 | |||||||||||||||
| Issued in reinvestment of dividends to shareholders | N/A | N/A | N/A | 1,040,385 | 16,046 | |||||||||||||||
| Redeemed | N/A | N/A | N/A | (952,530 | ) | (1,139,429 | ) | |||||||||||||
| Net increase in shares outstanding | N/A | N/A | N/A | 821,649 | 5,898,279 | |||||||||||||||
| Shares outstanding at beginning of period | N/A | N/A | N/A | 6,071,411 | 173,132 | |||||||||||||||
| Shares outstanding at end of period | N/A | N/A | N/A | 6,893,060 | 6,071,411 | |||||||||||||||
Amounts designated as “—” are $0 or rounded to $0.
N/A – Not Applicable
| (a) | Effective March 1, 2021, Westwood LargeCap Fund was renamed as Westwood Quality Value Fund. |
| (b) | Represents the period from the commencement of operations (November 30, 2021) through October 31, 2022. |
| (c) | Effective March 1, 2021, Westwood SMIDCap Fund was renamed as Westwood Quality SMIDCap Fund. |
The accompanying notes are an integral part of the financial statements.
68
| WESTWOOD FUNDS | |
| STATEMENTS OF CHANGES IN NET ASSETS | |
| Westwood Quality | Westwood Quality | Westwood Total | ||||||||||||||||||||||
| SmallCap Fund | AllCap Fund | Return Fund | ||||||||||||||||||||||
| Year Ended | Year Ended | Year Ended | Period Ended | Year Ended | Year Ended | |||||||||||||||||||
| October 31, | October 31, | October 31, | October 31, | October 31, | October 31, | |||||||||||||||||||
| 2022 | 2021 (a) | 2022 | 2021 (b) | 2022 | 2021 | |||||||||||||||||||
| FROM OPERATIONS | ||||||||||||||||||||||||
| Net investment income | $ | 10,416,497 | $ | 8,332,783 | $ | 338,557 | $ | 7,715 | $ | 3,339,733 | $ | 2,177,197 | ||||||||||||
| Net realized gains (losses) from investments and foreign currency transactions | 34,401,123 | 64,160,489 | (595,695 | ) | 49,040 | (14,057 | ) | 9,654,540 | ||||||||||||||||
| Net change in unrealized appreciation (depreciation) on investments and foreign currency translations | (162,632,712 | ) | 225,235,252 | (751,670 | ) | 1,175,048 | (21,595,272 | ) | 11,820,853 | |||||||||||||||
| Net increase (decrease) in net assets resulting from operations | (117,815,092 | ) | 297,728,524 | (1,008,808 | ) | 1,231,803 | (18,269,596 | ) | 23,652,590 | |||||||||||||||
| FROM DISTRIBUTIONS TO SHAREHOLDERS | ||||||||||||||||||||||||
| Institutional Shares | (26,825,452 | ) | (2,987,544 | ) | (2,388 | ) | — | (12,027,441 | ) | (4,734,312 | ) | |||||||||||||
| A Class Shares | (69,757 | ) | (7,294 | ) | N/A | N/A | (585 | ) | (64 | ) | ||||||||||||||
| C Class Shares | (34,797 | ) | (227 | ) | N/A | N/A | (6,552 | ) | (152 | ) | ||||||||||||||
| Ultra Shares | (24,288,100 | ) | (1,597,937 | ) | (113,039 | ) | — | N/A | N/A | |||||||||||||||
| Total distributions | (51,218,106 | ) | (4,593,002 | ) | (115,427 | ) | — | (12,034,578 | ) | (4,734,528 | ) | |||||||||||||
| CAPITAL SHARE TRANSACTIONS | ||||||||||||||||||||||||
| Institutional Class | ||||||||||||||||||||||||
| Issued | 120,733,963 | 250,276,944 | 49,977 | 500,000 | 30,276,927 | 53,807,851 | ||||||||||||||||||
| Reinvestment of dividends | 25,833,286 | 2,615,934 | 2,387 | — | 11,995,434 | 4,727,376 | ||||||||||||||||||
| Redeemed | (173,067,644 | ) | (216,685,078 | ) | — | — | (31,738,749 | ) | (19,781,500 | ) | ||||||||||||||
| Net (decrease) increase from Institutional Shares capital share transactions | (26,500,395 | ) | 36,207,800 | 52,364 | 500,000 | 10,533,612 | 38,753,727 | |||||||||||||||||
| A Class Class | ||||||||||||||||||||||||
| Issued | 1,106,597 | 683,436 | N/A | N/A | 22,317 | 3,470 | ||||||||||||||||||
| Reinvestment of dividends | 69,757 | 6,782 | N/A | N/A | 585 | 63 | ||||||||||||||||||
| Redeemed | (876,212 | ) | (589,763 | ) | N/A | N/A | (248 | ) | — | |||||||||||||||
| Net increase from A Class Shares capital share transactions | 300,142 | 100,455 | N/A | N/A | 22,654 | 3,533 | ||||||||||||||||||
| C Class Class | ||||||||||||||||||||||||
| Issued | 29,276 | 591,709 | N/A | N/A | 88,608 | 71,650 | ||||||||||||||||||
| Reinvestment of dividends | 31,748 | 227 | N/A | N/A | 6,552 | 152 | ||||||||||||||||||
| Redeemed | (71,932 | ) | (46,058 | ) | N/A | N/A | (89,401 | ) | — | |||||||||||||||
| Net (decrease) increase from C Class Shares capital share transactions | (10,908 | ) | 545,878 | N/A | N/A | 5,759 | 71,802 | |||||||||||||||||
| Ultra Class | ||||||||||||||||||||||||
| Issued | 197,226,122 | 304,226,286 | 2,498,217 | 20,512,529 | N/A | N/A | ||||||||||||||||||
| Reinvestment of dividends | 22,576,808 | 1,266,260 | 113,039 | — | N/A | N/A | ||||||||||||||||||
| Redeemed | (130,219,961 | ) | (51,155,545 | ) | (1,481,129 | ) | — | N/A | N/A | |||||||||||||||
| Net increase from Ultra Shares capital share transactions | 89,582,969 | 254,337,001 | 1,130,127 | 20,512,529 | N/A | N/A | ||||||||||||||||||
| Net increase in net assets from capital share transactions | 63,371,808 | 291,191,134 | 1,182,491 | 21,012,529 | 10,562,025 | 38,829,062 | ||||||||||||||||||
| TOTAL INCREASE (DECREASE) IN NET ASSETS | (105,661,390 | ) | 584,326,656 | 58,256 | 22,244,332 | (19,742,149 | ) | 57,747,124 | ||||||||||||||||
| NET ASSETS | ||||||||||||||||||||||||
| Beginning of period | 1,095,198,069 | 510,871,413 | 22,244,332 | — | 143,787,475 | 86,040,351 | ||||||||||||||||||
| End of period | $ | 989,536,679 | $ | 1,095,198,069 | $ | 22,302,588 | $ | 22,244,332 | $ | 124,045,326 | $ | 143,787,475 | ||||||||||||
Amounts designated as “—” are $0 or rounded to $0.
N/A — Not Applicable.
| (a) | Effective March 1, 2021, Westwood SmallCap Fund was renamed as Westwood Quality SmallCap Fund. |
| (b) | Represents the period from the commencement of operations (September 30, 2021) through October 31, 2021. |
The accompanying notes are an integral part of the financial statements.
69
| WESTWOOD FUNDS | |
| STATEMENTS OF CHANGES IN NET ASSETS | |
| Westwood Quality | Westwood Quality | Westwood Total | ||||||||||||||||||||||
| SmallCap Fund | AllCap Fund | Return Fund | ||||||||||||||||||||||
| Year Ended | Year Ended | Year Ended | Period Ended | Year Ended | Year Ended | |||||||||||||||||||
| October 31, | October 31, | October 31, | October 31, | October 31, | October 31, | |||||||||||||||||||
| 2022 | 2021 (a) | 2022 | 2021 (b) | 2022 | 2021 | |||||||||||||||||||
| CAPITAL SHARES ACTIVITY | ||||||||||||||||||||||||
| Institutional Shares | ||||||||||||||||||||||||
| Sold | 6,176,952 | 12,662,660 | 4,900 | 50,000 | 4,554,074 | 7,458,941 | ||||||||||||||||||
| Issued in reinvestment of dividends to shareholders | 1,201,430 | 148,802 | 225 | — | 1,716,992 | 678,084 | ||||||||||||||||||
| Redeemed | (8,838,361 | ) | (10,893,500 | ) | — | — | (4,675,931 | ) | (2,741,173 | ) | ||||||||||||||
| Net increase (decrease) in shares outstanding | (1,459,979 | ) | 1,917,962 | 5,125 | 50,000 | 1,595,135 | 5,395,852 | |||||||||||||||||
| Shares outstanding at beginning of period | 26,673,116 | 24,755,154 | 50,000 | — | 18,776,694 | 13,380,842 | ||||||||||||||||||
| Shares outstanding at end of period | 25,213,137 | 26,673,116 | 55,125 | 50,000 | 20,371,829 | 18,776,694 | ||||||||||||||||||
| A Class Shares | ||||||||||||||||||||||||
| Sold | 57,169 | 33,869 | N/A | N/A | 3,439 | 502 | ||||||||||||||||||
| Issued in reinvestment of dividends to shareholders | 3,251 | 386 | N/A | N/A | 90 | 9 | ||||||||||||||||||
| Redeemed | (44,861 | ) | (28,226 | ) | N/A | N/A | (42 | ) | — | |||||||||||||||
| Net increase in shares outstanding | 15,559 | 6,029 | N/A | N/A | 3,487 | 511 | ||||||||||||||||||
| Shares outstanding at beginning of period | 67,007 | 60,978 | N/A | N/A | 536 | 25 | ||||||||||||||||||
| Shares outstanding at end of period | 82,566 | 67,007 | N/A | N/A | 4,023 | 536 | ||||||||||||||||||
| C Class Shares | ||||||||||||||||||||||||
| Sold | 1,425 | 28,559 | N/A | N/A | 12,524 | 9,567 | ||||||||||||||||||
| Issued in reinvestment of dividends to shareholders | 1,494 | 13 | N/A | N/A | 930 | 20 | ||||||||||||||||||
| Redeemed | (3,931 | ) | (2,543 | ) | N/A | N/A | (13,921 | ) | — | |||||||||||||||
| Net increase (decrease) in shares outstanding | (1,012 | ) | 26,029 | N/A | N/A | (467 | ) | 9,587 | ||||||||||||||||
| Shares outstanding at beginning of period | 39,025 | 12,996 | N/A | N/A | 9,613 | 26 | ||||||||||||||||||
| Shares outstanding at end of period | 38,013 | 39,025 | N/A | N/A | 9,146 | 9,613 | ||||||||||||||||||
| Ultra Shares | ||||||||||||||||||||||||
| Sold | 10,042,232 | 14,938,603 | 249,069 | 2,050,369 | N/A | N/A | ||||||||||||||||||
| Issued in reinvestment of dividends to shareholders | 1,048,676 | 72,028 | 10,648 | — | N/A | N/A | ||||||||||||||||||
| Redeemed | (7,065,843 | ) | (2,499,316 | ) | (141,309 | ) | — | N/A | N/A | |||||||||||||||
| Net increase in shares outstanding | 4,025,065 | 12,511,315 | 118,408 | 2,050,369 | N/A | N/A | ||||||||||||||||||
| Shares outstanding at beginning of period | 23,007,302 | 10,495,987 | 2,050,369 | — | N/A | N/A | ||||||||||||||||||
| Shares outstanding at end of period | 27,032,367 | 23,007,302 | 2,168,777 | 2,050,369 | N/A | N/A | ||||||||||||||||||
Amounts designated as “—” are $0 or rounded to $0.
N/A — Not Applicable.
| (a) | Effective March 1, 2021, Westwood SmallCap Fund was renamed as Westwood Quality SmallCap Fund. |
| (b) | Represents the period from the commencement of operations (September 30, 2021) through October 31, 2021. |
The accompanying notes are an integral part of the financial statements.
70
| WESTWOOD FUNDS | |
| STATEMENTS OF CHANGES IN NET ASSETS | |
| Westwood Income | Westwood High | |||||||||||||||
| Opportunity Fund | Income Fund | |||||||||||||||
| Year Ended | Year Ended | Year Ended | Year Ended | |||||||||||||
| October 31, | October 31, | October 31, | October 31, | |||||||||||||
| 2022 | 2021 | 2022 | 2021 | |||||||||||||
| FROM OPERATIONS | ||||||||||||||||
| Net investment income | $ | 19,142,174 | $ | 13,806,434 | $ | 4,346,280 | $ | 2,902,647 | ||||||||
| Net realized gains (losses) from investments and foreign currency transactions | (1,587,387 | ) | 80,730,191 | * | (1,205,135 | ) | 6,339,468 | |||||||||
| Net change in unrealized appreciation (depreciation) on investments and foreign currency translations | (142,557,732 | ) | 30,555,527 | (16,901,273 | ) | 2,391,176 | ||||||||||
| Net increase (decrease) in net assets resulting from operations | (125,002,945 | ) | 125,092,152 | (13,760,128 | ) | 11,633,291 | ||||||||||
| FROM DISTRIBUTIONS TO SHAREHOLDERS | ||||||||||||||||
| Institutional Shares | (82,688,706 | ) | (56,562,024 | ) | (4,328,768 | ) | (2,977,937 | ) | ||||||||
| A Class Shares | (6,456,020 | ) | (3,856,704 | ) | (90,847 | ) | (28,552 | ) | ||||||||
| C Class Shares | (1,304,828 | ) | (402,304 | ) | (6,969 | ) | (586 | ) | ||||||||
| Total distributions | (90,449,554 | ) | (60,821,032 | ) | (4,426,584 | ) | (3,007,075 | ) | ||||||||
| CAPITAL SHARE TRANSACTIONS | ||||||||||||||||
| Institutional Class | ||||||||||||||||
| Issued | 141,954,917 | 223,537,176 | 43,338,245 | 30,838,485 | ||||||||||||
| Reinvestment of dividends | 77,994,988 | 51,959,190 | 4,293,860 | 2,926,171 | ||||||||||||
| Redeemed | (259,349,308 | ) | (183,004,295 | ) | (27,604,544 | ) | (20,903,961 | ) | ||||||||
| Net increase (decrease) from Institutional Shares capital share transactions | (39,399,403 | ) | 92,492,071 | 20,027,561 | 12,860,695 | |||||||||||
| A Class Class | ||||||||||||||||
| Issued | 16,556,183 | 23,359,106 | 2,072,385 | 1,497,333 | ||||||||||||
| Reinvestment of dividends | 5,584,694 | 3,507,622 | 61,929 | 28,552 | ||||||||||||
| Redeemed | (13,064,332 | ) | (16,529,826 | ) | (1,040,595 | ) | (264,074 | ) | ||||||||
| Net increase from A Class Shares capital share transactions | 9,076,545 | 10,336,902 | 1,093,719 | 1,261,811 | ||||||||||||
| C Class Class | ||||||||||||||||
| Issued | 4,131,539 | 8,354,432 | 135,011 | 104,995 | ||||||||||||
| Reinvestment of dividends | 1,304,828 | 396,871 | 6,969 | 586 | ||||||||||||
| Redeemed | (2,419,865 | ) | (396,921 | ) | (6,963 | ) | (581 | ) | ||||||||
| Net increase from C Class Shares capital share transactions | 3,016,502 | 8,354,382 | 135,017 | 105,000 | ||||||||||||
| Net increase (decrease) in net assets from capital share transactions | (27,306,356 | ) | 111,183,355 | 21,256,297 | 14,227,506 | |||||||||||
| TOTAL INCREASE (DECREASE) IN NET ASSETS | (242,758,855 | ) | 175,454,475 | 3,069,585 | 22,853,722 | |||||||||||
| NET ASSETS | ||||||||||||||||
| Beginning of year | 890,570,253 | 715,115,778 | 96,087,506 | 73,233,784 | ||||||||||||
| End of year | $ | 647,811,398 | $ | 890,570,253 | $ | 99,157,091 | $ | 96,087,506 | ||||||||
Amounts designated as “—” are $0 or rounded to $0.
N/A — Not Applicable
| * | Includes realized gains as a result of an in-kind redemption (see Note 7 in the Notes to the financial statements) |
The accompanying notes are an integral part of the financial statements.
71
| WESTWOOD FUNDS | |
| STATEMENTS OF CHANGES IN NET ASSETS | |
| Westwood Income | Westwood High | |||||||||||||||
| Opportunity Fund | Income Fund | |||||||||||||||
| Year Ended | Year Ended | Year Ended | Year Ended | |||||||||||||
| October 31, | October 31, | October 31, | October 31, | |||||||||||||
| 2022 | 2021 | 2022 | 2021 | |||||||||||||
| CAPITAL SHARES ACTIVITY | ||||||||||||||||
| Institutional Shares | ||||||||||||||||
| Sold | 11,856,221 | 16,472,352 | 4,320,818 | 2,909,531 | ||||||||||||
| Issued in reinvestment of dividends to shareholders | 6,245,895 | 3,918,464 | 441,285 | 277,550 | ||||||||||||
| Redeemed | (21,871,789 | ) | (13,468,901 | ) | (2,805,479 | ) | (1,977,856 | ) | ||||||||
| Net increase (decrease) in shares outstanding | (3,769,673 | ) | 6,921,915 | 1,956,624 | 1,209,225 | |||||||||||
| Shares outstanding at beginning of year | 58,523,935 | 51,602,020 | 8,845,115 | 7,635,890 | ||||||||||||
| Shares outstanding at end of year | 54,754,262 | 58,523,935 | 10,801,739 | 8,845,115 | ||||||||||||
| A Class Shares | ||||||||||||||||
| Sold | 1,384,742 | 1,717,828 | 205,334 | 139,984 | ||||||||||||
| Issued in reinvestment of dividends to shareholders | 449,151 | 265,073 | 6,312 | 2,674 | ||||||||||||
| Redeemed | (1,108,390 | ) | (1,225,243 | ) | (105,050 | ) | (24,561 | ) | ||||||||
| Net increase in shares outstanding | 725,503 | 757,658 | 106,596 | 118,097 | ||||||||||||
| Shares outstanding at beginning of year | 4,503,472 | 3,745,814 | 151,365 | 33,268 | ||||||||||||
| Shares outstanding at end of year | 5,228,975 | 4,503,472 | 257,961 | 151,365 | ||||||||||||
| C Class Shares | ||||||||||||||||
| Sold | 353,871 | 613,440 | 12,566 | 9,704 | ||||||||||||
| Issued in reinvestment of dividends to shareholders | 104,760 | 30,069 | 712 | 54 | ||||||||||||
| Redeemed | (210,241 | ) | (29,240 | ) | (711 | ) | (54 | ) | ||||||||
| Net increase in shares outstanding | 248,390 | 614,269 | 12,567 | 9,704 | ||||||||||||
| Shares outstanding at beginning of year | 962,338 | 348,069 | 9,721 | 17 | ||||||||||||
| Shares outstanding at end of year | 1,210,728 | 962,338 | 22,288 | 9,721 | ||||||||||||
Amounts designated as “—” are $0 or rounded to $0.
N/A — Not Applicable
The accompanying notes are an integral part of the financial statements.
72
| WESTWOOD FUNDS | |
| STATEMENTS OF CHANGES IN NET ASSETS | |
| Westwood Alternative | Westwood SmallCap | |||||||||||||||
| Income Fund | Growth Fund | |||||||||||||||
| Year Ended | Year Ended | Year Ended | Period Ended | |||||||||||||
| October 31, | October 31, | October 31, | October 31, | |||||||||||||
| 2022 | 2021 | 2022 | 2021 (a) | |||||||||||||
| FROM OPERATIONS | ||||||||||||||||
| Net investment income | $ | 3,031,301 | $ | 2,148,908 | $ | 51,717 | $ | 16 | ||||||||
| Net realized gains (losses) on investments, futures, purchased options, swap agreements and foreign currency transactions | 6,677,384 | 4,511,310 | (3,058,584 | ) | 9,912 | |||||||||||
| Net change in unrealized appreciation (depreciation) on investments, futures, purchased options, swap agreements and foreign currency translations | (14,130,214 | ) | 821,294 | 946,654 | 16,248 | |||||||||||
| Net increase (decrease) in net assets resulting from operations | (4,421,529 | ) | 7,481,512 | (2,060,213 | ) | 26,176 | ||||||||||
| FROM DISTRIBUTIONS TO SHAREHOLDERS | ||||||||||||||||
| Institutional Shares | (1,650,351 | ) | (432,393 | ) | (14,715 | ) | — | |||||||||
| A Class Shares | (1,010 | ) | (847 | ) | — | — | ||||||||||
| C Class Shares | (989 | ) | (95 | ) | — | — | ||||||||||
| Ultra Shares | (3,424,654 | ) | (1,029,336 | ) | — | — | ||||||||||
| Total distributions | (5,077,004 | ) | (1,462,671 | ) | (14,715 | ) | — | |||||||||
| CAPITAL SHARE TRANSACTIONS | ||||||||||||||||
| Institutional Class | ||||||||||||||||
| Issued | 50,924,775 | 51,704,897 | 24,972,480 | 1,000,000 | ||||||||||||
| Reinvestment of dividends | 1,650,350 | 430,754 | 14,715 | — | ||||||||||||
| Redeemed | (35,727,633 | ) | (22,321,581 | ) | (1,730,419 | ) | — | |||||||||
| Net increase from Institutional Shares capital share transactions | 16,847,492 | 29,814,070 | 23,256,776 | 1,000,000 | ||||||||||||
| A Class Class | ||||||||||||||||
| Issued | 11 | 100,652 | N/A | N/A | ||||||||||||
| Reinvestment of dividends | 1,010 | 847 | N/A | N/A | ||||||||||||
| Redeemed | (34,079 | ) | (64,339 | ) | N/A | N/A | ||||||||||
| Net increase (decrease) from A Class Shares capital share transactions | (33,058 | ) | 37,160 | N/A | N/A | |||||||||||
| C Class Class | ||||||||||||||||
| Issued | 170,723 | 40,700 | N/A | N/A | ||||||||||||
| Reinvestment of dividends | 989 | 95 | N/A | N/A | ||||||||||||
| Redeemed | (54,008 | ) | (155,945 | ) | N/A | N/A | ||||||||||
| Net increase (decrease) from C Class Shares capital share transactions | 117,704 | (115,150 | ) | N/A | N/A | |||||||||||
| Ultra Class | ||||||||||||||||
| Issued | 18,133,075 | 56,461,535 | N/A | N/A | ||||||||||||
| Reinvestment of dividends | 3,424,654 | 1,029,291 | N/A | N/A | ||||||||||||
| Redeemed | (54,926,341 | ) | (20,410,295 | ) | N/A | N/A | ||||||||||
| Net increase (decrease) from Ultra Shares capital share transactions | (33,368,612 | ) | 37,080,531 | N/A | N/A | |||||||||||
| Net increase (decrease) in net assets from capital share transactions | (16,436,474 | ) | 66,816,611 | 23,256,776 | 1,000,000 | |||||||||||
| TOTAL INCREASE (DECREASE) IN NET ASSETS | (25,935,007 | ) | 72,835,452 | 21,181,848 | 1,026,176 | |||||||||||
| NET ASSETS | ||||||||||||||||
| Beginning of period | 182,170,830 | 109,335,378 | 1,026,176 | — | ||||||||||||
| End of period | $ | 156,235,823 | $ | 182,170,830 | $ | 22,208,024 | $ | 1,026,176 | ||||||||
Amounts designated as “—” are $0 or rounded to $0.
N/A — Not Applicable.
| (a) | Represents the period from the commencement of operations (September 30, 2021) through October 31, 2021. |
The accompanying notes are an integral part of the financial statements.
73
| WESTWOOD FUNDS | |
| STATEMENTS OF CHANGES IN NET ASSETS | |
| Westwood Alternative | Westwood SmallCap | |||||||||||||||
| Income Fund | Growth Fund | |||||||||||||||
| Year Ended | Year Ended | Year Ended | Period Ended | |||||||||||||
| October 31, | October 31, | October 31, | October 31, | |||||||||||||
| 2022 | 2021 | 2022 | 2021 (a) | |||||||||||||
| CAPITAL SHARES ACTIVITY | ||||||||||||||||
| Institutional Shares | ||||||||||||||||
| Sold | 4,827,678 | 4,720,940 | 2,841,249 | 100,000 | ||||||||||||
| Issued in reinvestment of dividends to shareholders | 154,968 | 39,419 | 1,444 | — | ||||||||||||
| Redeemed | (3,385,097 | ) | (2,058,234 | ) | (207,841 | ) | — | |||||||||
| Net increase in shares outstanding | 1,597,549 | 2,702,125 | 2,634,852 | 100,000 | ||||||||||||
| Shares outstanding at beginning of period | 4,878,004 | 2,175,879 | 100,000 | — | ||||||||||||
| Shares outstanding at end of period | 6,475,553 | 4,878,004 | 2,734,852 | 100,000 | ||||||||||||
| A Class Shares | ||||||||||||||||
| Sold | 1 | 9,303 | N/A | N/A | ||||||||||||
| Issued in reinvestment of dividends to shareholders | 95 | 78 | N/A | N/A | ||||||||||||
| Redeemed | (3,113 | ) | (5,880 | ) | N/A | N/A | ||||||||||
| Net increase (decrease) in shares outstanding | (3,017 | ) | 3,501 | N/A | N/A | |||||||||||
| Shares outstanding at beginning of period | 6,164 | 2,663 | N/A | N/A | ||||||||||||
| Shares outstanding at end of period | 3,147 | 6,164 | N/A | N/A | ||||||||||||
| C Class Shares | ||||||||||||||||
| Sold | 16,377 | 3,726 | N/A | N/A | ||||||||||||
| Issued in reinvestment of dividends to shareholders | 93 | 9 | N/A | N/A | ||||||||||||
| Redeemed | (5,098 | ) | (14,335 | ) | N/A | N/A | ||||||||||
| Net increase (decrease) in shares outstanding | 11,372 | (10,600 | ) | N/A | N/A | |||||||||||
| Shares outstanding at beginning of period | 3,652 | 14,252 | N/A | N/A | ||||||||||||
| Shares outstanding at end of period | 15,024 | 3,652 | N/A | N/A | ||||||||||||
| Ultra Shares | ||||||||||||||||
| Sold | 1,694,949 | 5,166,470 | N/A | N/A | ||||||||||||
| Issued in reinvestment of dividends to shareholders | 320,452 | 94,173 | N/A | N/A | ||||||||||||
| Redeemed | (5,128,481 | ) | (1,866,231 | ) | N/A | N/A | ||||||||||
| Net increase (decrease) in shares outstanding | (3,113,080 | ) | 3,394,412 | N/A | N/A | |||||||||||
| Shares outstanding at beginning of period | 11,645,450 | 8,251,038 | N/A | N/A | ||||||||||||
| Shares outstanding at end of period | 8,532,370 | 11,645,450 | N/A | N/A | ||||||||||||
Amounts designated as “—” are $0 or rounded to $0.
N/A — Not Applicable
| (a) | Represents the period from the commencement of operations (September 30, 2021) through October 31, 2021. |
The accompanying notes are an integral part of the financial statements.
74
[This Page Intentionally Left Blank]
| WESTWOOD FUNDS |
| FINANCIAL HIGHLIGHTS |
| SELECTED PER SHARE DATA & RATIOS |
| FOR A SHARE OUTSTANDING THROUGHOUT THE YEAR OR PERIOD |
| Net realized | ||||||||||||||||||||||||
| Net asset value, | and unrealized | Total from | Dividends from | Distributions | ||||||||||||||||||||
| beginning of | Net investment | gains (losses) on | investment | net investment | from net realized | |||||||||||||||||||
| period | income (a) | investments | operations | income | capital gains | |||||||||||||||||||
| Westwood Quality Value Fund (1) | ||||||||||||||||||||||||
| Institutional Shares | ||||||||||||||||||||||||
| Year Ended October 31, 2022 | $ | 15.46 | 0.18 | (0.74 | ) | (0.56 | ) | (0.10 | ) | (2.28 | ) | |||||||||||||
| Year Ended October 31, 2021 | $ | 11.80 | 0.13 | 4.28 | 4.41 | (0.17 | ) | (0.58 | ) | |||||||||||||||
| Year Ended October 31, 2020 | $ | 13.16 | 0.20 | (0.95 | ) | (0.75 | ) | (0.21 | ) | (0.40 | ) | |||||||||||||
| Year Ended October 31, 2019 | $ | 13.07 | 0.22 | 1.21 | 1.43 | (0.19 | ) | (1.15 | ) | |||||||||||||||
| Year Ended October 31, 2018 | $ | 13.10 | 0.20 | 0.62 | 0.82 | (0.15 | ) | (0.70 | ) | |||||||||||||||
| A Class Shares | ||||||||||||||||||||||||
| Year Ended October 31, 2022 | $ | 15.53 | 0.15 | (0.75 | ) | (0.60 | ) | (0.07 | ) | (2.28 | ) | |||||||||||||
| Year Ended October 31, 2021 | $ | 11.84 | 0.08 | 4.31 | 4.39 | (0.12 | ) | (0.58 | ) | |||||||||||||||
| Year Ended October 31, 2020 | $ | 13.20 | 0.18 | (0.96 | ) | (0.78 | ) | (0.18 | ) | (0.40 | ) | |||||||||||||
| Year Ended October 31, 2019 | $ | 13.12 | 0.19 | 1.21 | 1.40 | (0.17 | ) | (1.15 | ) | |||||||||||||||
| Year Ended October 31, 2018 | $ | 13.15 | 0.17 | 0.62 | 0.79 | (0.12 | ) | (0.70 | ) | |||||||||||||||
| C Class Shares | ||||||||||||||||||||||||
| Year Ended October 31, 2022 | $ | 15.33 | 0.06 | (0.74 | ) | (0.68 | ) | (0.09 | ) | (2.28 | ) | |||||||||||||
| Year Ended October 31, 2021 | $ | 11.80 | 0.01 | 4.27 | 4.28 | (0.17 | ) | (0.58 | ) | |||||||||||||||
| Period Ended October 31, 2020 (g) | $ | 10.17 | 0.16 | 1.47 | 1.63 | — | — | |||||||||||||||||
| Westwood Quality MidCap Fund | ||||||||||||||||||||||||
| Institutional Shares | ||||||||||||||||||||||||
| Period Ended October 31, 2022 (i) | $ | 10.00 | 0.11 | (0.47 | ) | (0.36 | ) | — | — | |||||||||||||||
| Westwood Quality SMidCap Fund (2) | ||||||||||||||||||||||||
| Institutional Shares | ||||||||||||||||||||||||
| Year Ended October 31, 2022 | $ | 16.62 | 0.08 | (1.45 | ) | (1.37 | ) | (0.11 | ) | (2.25 | ) | |||||||||||||
| Year Ended October 31, 2021 | $ | 11.97 | 0.15 | 4.89 | 5.04 | (0.13 | ) | (0.26 | ) | |||||||||||||||
| Year Ended October 31, 2020 | $ | 14.21 | 0.11 | (0.75 | ) | (0.64 | ) | (0.11 | ) | (1.49 | ) | |||||||||||||
| Year Ended October 31, 2019 | $ | 15.50 | 0.10 | 0.84 | 0.94 | (0.11 | ) | (2.12 | ) | |||||||||||||||
| Year Ended October 31, 2018 | $ | 17.44 | 0.08 | (0.11 | ) | (0.03 | ) | (0.04 | ) | (1.87 | ) | |||||||||||||
| Ultra Shares | ||||||||||||||||||||||||
| Year Ended October 31, 2022 | $ | 16.62 | 0.11 | (1.44 | ) | (1.33 | ) | (0.14 | ) | (2.25 | ) | |||||||||||||
| Year Ended October 31, 2021 | $ | 11.96 | 0.16 | 4.91 | 5.07 | (0.15 | ) | (0.26 | ) | |||||||||||||||
| Period Ended October 31, 2020 (k) | $ | 11.44 | — | 0.52 | 0.52 | — | — | |||||||||||||||||
Amounts designated as “—” are either $0.00 or have been rounded to $0.00.
| (a) | Per share net income has been determined on the basis of average number of shares outstanding during the period. |
| (b) | Total return is a measure of the change in value of an investment in the Fund over the period covered. The returns shown do not reflect the deduction of taxes a shareholder would pay on Fund distributions, if any or the redemption of Fund shares. The total returns would be lower if the Adviser had not reduced investment management fees and/or reimbursed expenses (Note 4). |
| (c) | Ratio was determined after investment management fee reductions and/or reimbursed expenses (Note 4). |
| (d) | Portfolio turnover rate is calculated on the basis of the Fund as a whole without distinguishing between classes of shares issued. |
| (e) | Not annualized. |
| (f) | Annualized. |
| (g) | Represents the period from the commencement of operations (March 31, 2020) through October 31, 2020. |
| (h) | The ratio rounds to 0.00% due to the impact of the low level of average net assets. The share class is expected to run at the expense limit of 1.65% (1.73% excluding waivers) when assets are contributed. |
| (i) | Represents the period from the commencement of operations (November 30, 2021) through October 31, 2022. |
| (j) | Includes federal excise taxes of 0.01% of average net assets with respect to the period ending October 31, 2022. |
| (k) | Represents the period from the commencement of operations (July 31, 2020) through October 31, 2020. |
| (1) | Effective March 1, 2021, Westwood LargeCap Fund was renamed as Westwood Quality Value Fund. |
| (2) | Effective March 1, 2021, Westwood SMIDCap Fund was renamed as Westwood Quality SMIDCap Fund. |
The accompanying notes are an integral part of the financial statements.
76
| WESTWOOD FUNDS |
| FINANCIAL HIGHLIGHTS |
| SELECTED PER SHARE DATA & RATIOS |
| FOR A SHARE OUTSTANDING THROUGHOUT THE YEAR OR PERIOD |
| Ratio of total net | Ratio of total gross | Ratio of net | ||||||||||||||||||||||||||||
| Total | Net asset value, | Net assets, | expenses to average | expenses to average | investment income to | Portfolio | ||||||||||||||||||||||||
| distributions | end of period | Total return (b) | end of period (000’s) | net assets (c) | net assets | average net assets (c) | turnover rate (d) | |||||||||||||||||||||||
| (2.38 | ) | $ | 12.52 | (4.37 | )% | $ | 249,760 | 0.65 | % | 0.69 | % | 1.38 | % | 77 | % | |||||||||||||||
| (0.75 | ) | $ | 15.46 | 38.80 | % | $ | 206,730 | 0.65 | % | 0.76 | % | 0.91 | % | 72 | % | |||||||||||||||
| (0.61 | ) | $ | 11.80 | (6.11 | )% | $ | 172,349 | 0.65 | % | 0.77 | % | 1.66 | % | 52 | % | |||||||||||||||
| (1.34 | ) | $ | 13.16 | 13.23 | % | $ | 224,664 | 0.65 | % | 0.73 | % | 1.80 | % | 36 | % | |||||||||||||||
| (0.85 | ) | $ | 13.07 | 6.30 | % | $ | 213,175 | 0.65 | % | 0.72 | % | 1.50 | % | 49 | % | |||||||||||||||
| (2.35 | ) | $ | 12.58 | (4.64 | )% | $ | 1,402 | 0.90 | % | 0.94 | % | 1.15 | % | 77 | % | |||||||||||||||
| (0.70 | ) | $ | 15.53 | 38.46 | % | $ | 858 | 0.90 | % | 1.01 | % | 0.58 | % | 72 | % | |||||||||||||||
| (0.58 | ) | $ | 11.84 | (6.32 | )% | $ | 2,143 | 0.90 | % | 1.00 | % | 1.43 | % | 52 | % | |||||||||||||||
| (1.32 | ) | $ | 13.20 | 12.92 | % | $ | 13,174 | 0.90 | % | 0.98 | % | 1.54 | % | 36 | % | |||||||||||||||
| (0.82 | ) | $ | 13.12 | 6.02 | % | $ | 13,183 | 0.90 | % | 0.97 | % | 1.25 | % | 49 | % | |||||||||||||||
| (2.37 | ) | $ | 12.28 | (5.36 | )% | $ | 98 | 1.65 | % | 1.68 | % | 0.46 | % | 77 | % | |||||||||||||||
| (0.75 | ) | $ | 15.33 | 37.62 | % | $ | — | 1.48 | % | 1.48 | % | 0.08 | % | 72 | % | |||||||||||||||
| — | $ | 11.80 | 16.03 | %(e) | $ | — | 0.00 | %(f)(h) | 0.00 | %(f)(h) | 2.29 | %(f) | 52 | %(e) | ||||||||||||||||
| — | $ | 9.64 | (3.60 | )%(e) | $ | 530 | 0.58 | %(f)(j) | 20.06 | %(f) | 1.21 | %(f) | 96 | %(e) | ||||||||||||||||
| (2.36 | ) | $ | 12.89 | (9.64 | )% | $ | 201,586 | 0.87 | % | 1.02 | % | 0.62 | % | 104 | % | |||||||||||||||
| (0.39 | ) | $ | 16.62 | 42.85 | % | $ | 237,479 | 0.88 | % | 1.10 | % | 0.99 | % | 106 | % | |||||||||||||||
| (1.60 | ) | $ | 11.97 | (5.39 | )% | $ | 164,350 | 0.88 | % | 1.05 | % | 0.90 | % | 69 | % | |||||||||||||||
| (2.23 | ) | $ | 14.21 | 9.46 | % | $ | 187,341 | 0.88 | % | 1.02 | % | 0.75 | % | 56 | % | |||||||||||||||
| (1.91 | ) | $ | 15.50 | (0.33 | )% | $ | 315,140 | 0.88 | % | 1.03 | % | 0.50 | % | 58 | % | |||||||||||||||
| (2.39 | ) | $ | 12.90 | (9.41 | )% | $ | 88,909 | 0.68 | % | 0.83 | % | 0.80 | % | 104 | % | |||||||||||||||
| (0.41 | ) | $ | 16.62 | 43.19 | % | $ | 100,933 | 0.68 | % | 0.90 | % | 1.00 | % | 106 | % | |||||||||||||||
| — | $ | 11.96 | 4.55 | %(e) | $ | 2,072 | 0.70 | %(f) | 1.02 | %(f) | 0.08 | %(f) | 69 | %(e) | ||||||||||||||||
The accompanying notes are an integral part of the financial statements.
77
| WESTWOOD FUNDS |
| FINANCIAL HIGHLIGHTS |
| SELECTED PER SHARE DATA & RATIOS |
| FOR A SHARE OUTSTANDING THROUGHOUT THE YEAR OR PERIOD |
| Net realized | ||||||||||||||||||||||||
| Net asset value, | and unrealized | Total from | Dividends from | Distributions | ||||||||||||||||||||
| beginning of | Net investment | gains (losses) on | investment | net investment | from net realized | |||||||||||||||||||
| period | income (loss) (a) | investments | operations | income | capital gains | |||||||||||||||||||
| Westwood Quality SmallCap Fund (1) | ||||||||||||||||||||||||
| Institutional Shares | ||||||||||||||||||||||||
| Year Ended October 31, 2022 | $ | 21.99 | 0.18 | (2.28 | ) | (2.10 | ) | (0.20 | ) | (0.81 | ) | |||||||||||||
| Year Ended October 31, 2021 | $ | 14.46 | 0.18 | 7.47 | 7.65 | (0.12 | ) | — | ||||||||||||||||
| Year Ended October 31, 2020 | $ | 16.97 | 0.12 | (2.45 | ) | (2.33 | ) | (0.12 | ) | (0.06 | ) | |||||||||||||
| Year Ended October 31, 2019 | $ | 16.76 | 0.11 | 1.10 | 1.21 | (0.12 | ) | (0.88 | ) | |||||||||||||||
| Year Ended October 31, 2018 | $ | 18.39 | 0.10 | (0.47 | ) | (0.37 | ) | (0.07 | ) | (1.19 | ) | |||||||||||||
| A Class Shares | ||||||||||||||||||||||||
| Year Ended October 31, 2022 | $ | 21.94 | 0.16 | (2.27 | ) | (2.11 | ) | (0.18 | ) | (0.81 | ) | |||||||||||||
| Year Ended October 31, 2021 | $ | 14.44 | 0.16 | 7.45 | 7.61 | (0.11 | ) | — | ||||||||||||||||
| Year Ended October 31, 2020 | $ | 16.99 | 0.08 | (2.43 | ) | (2.35 | ) | (0.14 | ) | (0.06 | ) | |||||||||||||
| Period Ended October 31, 2019 (g) | $ | 15.78 | (0.02 | ) | 1.23 | 1.21 | — | — | ||||||||||||||||
| C Class Shares | ||||||||||||||||||||||||
| Year Ended October 31, 2022 | $ | 21.75 | 0.01 | (2.25 | ) | (2.24 | ) | (0.08 | ) | (0.81 | ) | |||||||||||||
| Year Ended October 31, 2021 | $ | 14.34 | (0.01 | ) | 7.44 | 7.43 | (0.02 | ) | — | |||||||||||||||
| Year Ended October 31, 2020 | $ | 16.98 | (0.01 | ) | (2.45 | ) | (2.46 | ) | (0.12 | ) | (0.06 | ) | ||||||||||||
| Period Ended October 31, 2019 (g) | $ | 15.78 | (0.04 | ) | 1.24 | 1.20 | — | — | ||||||||||||||||
| Ultra Shares | ||||||||||||||||||||||||
| Year Ended October 31, 2022 | $ | 22.01 | 0.21 | (2.28 | ) | (2.07 | ) | (0.22 | ) | (0.81 | ) | |||||||||||||
| Year Ended October 31, 2021 | $ | 14.47 | 0.20 | 7.48 | 7.68 | (0.14 | ) | — | ||||||||||||||||
| Period Ended October 31, 2020 (h) | $ | 11.72 | 0.05 | 2.70 | 2.75 | — | — | |||||||||||||||||
| Westwood Quality AllCap Fund | ||||||||||||||||||||||||
| Institutional Shares | ||||||||||||||||||||||||
| Year Ended October 31, 2022 | $ | 10.59 | 0.16 | (0.67 | ) | (0.51 | ) | (0.03 | ) | (0.02 | ) | |||||||||||||
| Period Ended October 31, 2021 (i) | $ | 10.00 | — | 0.59 | 0.59 | — | — | |||||||||||||||||
| Ultra Shares | ||||||||||||||||||||||||
| Year Ended October 31, 2022 | $ | 10.59 | 0.16 | (0.67 | ) | (0.51 | ) | (0.03 | ) | (0.02 | ) | |||||||||||||
| Period Ended October 31, 2021 (i) | $ | 10.00 | — | 0.59 | 0.59 | — | — | |||||||||||||||||
Amounts designated as “—” are either $0.00 or have been rounded to $0.00.
| (a) | Per share net income has been determined on the basis of average number of shares outstanding during the period. |
| (b) | Total return is a measure of the change in value of an investment in the Fund over the period covered. The returns shown do not reflect the deduction of taxes a shareholder would pay on Fund distributions, if any or the redemption of Fund shares. The total returns would be lower if the Adviser had not reduced investment management fees and/or reimbursed expenses (Note 4). |
| (c) | Ratio was determined after investment management fee reductions and/or reimbursed expenses (Note 4). |
| (d) | Portfolio turnover rate is calculated on the basis of the Fund as a whole without distinguishing between classes of shares issued. |
| (e) | Not annualized. |
| (f) | Annualized. |
| (g) | Represents the period from the commencement of operations (September 3, 2019) through October 31, 2019. |
| (h) | Represents the period from the commencement of operations (March 31, 2020) through October 31, 2020. |
| (i) | Represents the period from the commencement of operations (September 30, 2021) through October 31, 2021. |
| (1) | Effective March 1, 2021, Westwood SmallCap Fund was renamed as Westwood Quality SmallCap Fund. |
The accompanying notes are an integral part of the financial statements.
78
| WESTWOOD FUNDS |
| FINANCIAL HIGHLIGHTS |
| SELECTED PER SHARE DATA & RATIOS |
| FOR A SHARE OUTSTANDING THROUGHOUT THE YEAR OR PERIOD |
| Ratio of net | ||||||||||||||||||||||||||||||
| Ratio of total net | Ratio of total gross | investment income | ||||||||||||||||||||||||||||
| Total | Net asset value, | Net assets, | expenses to average | expenses to average | (loss) to average net | Portfolio turnover | ||||||||||||||||||||||||
| distributions | end of period | Total return (b) | end of period (000’s) | net assets (c) | net assets | assets (c) | rate (d) | |||||||||||||||||||||||
| (1.01 | ) | $ | 18.88 | (10.08 | )% | $ | 476,094 | 0.92 | % | 1.04 | % | 0.94 | % | 60 | % | |||||||||||||||
| (0.12 | ) | $ | 21.99 | 53.07 | % | $ | 586,435 | 0.92 | % | 1.09 | % | 0.90 | % | 58 | % | |||||||||||||||
| (0.18 | ) | $ | 14.46 | (13.90 | )% | $ | 357,901 | 0.99 | % | 1.16 | % | 0.81 | % | 67 | % | |||||||||||||||
| (1.00 | ) | $ | 16.97 | 8.65 | % | $ | 418,949 | 0.99 | % | 1.11 | % | 0.66 | % | 64 | % | |||||||||||||||
| (1.26 | ) | $ | 16.76 | (2.28 | )% | $ | 341,713 | 0.99 | % | 1.08 | % | 0.58 | % | 50 | % | |||||||||||||||
| (0.99 | ) | $ | 18.84 | (10.15 | )% | $ | 1,556 | 1.04 | % | 1.16 | % | 0.81 | % | 60 | % | |||||||||||||||
| (0.11 | ) | $ | 21.94 | 52.90 | % | $ | 1,470 | 1.04 | % | 1.22 | % | 0.77 | % | 58 | % | |||||||||||||||
| (0.20 | ) | $ | 14.44 | (14.04 | )% | $ | 881 | 1.09 | % | 1.28 | % | 0.55 | % | 67 | % | |||||||||||||||
| — | $ | 16.99 | 7.67 | %(e) | $ | 96 | 1.08 | %(f) | 1.30 | %(f) | (0.90 | )%(f) | 64 | %(e) | ||||||||||||||||
| (0.89 | ) | $ | 18.62 | (10.84 | )% | $ | 708 | 1.79 | % | 1.91 | % | 0.07 | % | 60 | % | |||||||||||||||
| (0.02 | ) | $ | 21.75 | 51.81 | % | $ | 849 | 1.79 | % | 1.97 | % | (0.04 | )% | 58 | % | |||||||||||||||
| (0.18 | ) | $ | 14.34 | (14.67 | )% | $ | 186 | 1.84 | % | 2.02 | % | (0.08 | )% | 67 | % | |||||||||||||||
| — | $ | 16.98 | 7.60 | %(e) | $ | 51 | 1.79 | %(f) | 2.05 | %(f) | (1.67 | )%(f) | 64 | %(e) | ||||||||||||||||
| (1.03 | ) | $ | 18.91 | (9.91 | )% | $ | 511,179 | 0.79 | % | 0.91 | % | 1.07 | % | 60 | % | |||||||||||||||
| (0.14 | ) | $ | 22.01 | 53.29 | % | $ | 506,444 | 0.79 | % | 0.97 | % | 0.95 | % | 58 | % | |||||||||||||||
| — | $ | 14.47 | 23.46 | %(e) | $ | 151,903 | 0.81 | %(f) | 1.10 | %(f) | 0.63 | %(f) | 67 | %(e) | ||||||||||||||||
| (0.05 | ) | $ | 10.03 | (4.86 | )% | $ | 553 | 0.45 | % | 0.93 | % | 1.55 | % | 101 | % | |||||||||||||||
| — | $ | 10.59 | 5.90 | %(e) | $ | 529 | 0.65 | %(f) | 2.25 | %(f) | 0.22 | %(f) | 4 | %(e) | ||||||||||||||||
| (0.05 | ) | $ | 10.03 | (4.81 | )% | $ | 21,750 | 0.45 | % | 0.93 | % | 1.55 | % | 101 | % | |||||||||||||||
| — | $ | 10.59 | 5.90 | %(e) | $ | 21,715 | 0.45 | %(f) | 2.07 | %(f) | 0.44 | %(f) | 4 | %(e) | ||||||||||||||||
The accompanying notes are an integral part of the financial statements.
79
| WESTWOOD FUNDS |
| FINANCIAL HIGHLIGHTS |
| SELECTED PER SHARE DATA & RATIOS |
| FOR A SHARE OUTSTANDING THROUGHOUT THE YEAR OR PERIOD |
| Net realized | ||||||||||||||||||||||||
| Net asset value, | and unrealized | Total from | Dividends from | Distributions | ||||||||||||||||||||
| beginning of | Net investment | gains (losses) on | investment | net investment | from net realized | |||||||||||||||||||
| period | income (a) | investments | operations | income | capital gains | |||||||||||||||||||
| Westwood Total Return Fund (1) | ||||||||||||||||||||||||
| Institutional Shares | ||||||||||||||||||||||||
| Year Ended October 31, 2022 | $ | 7.65 | 0.17 | (1.10 | ) | (0.93 | ) | (0.16 | ) | (0.47 | ) | |||||||||||||
| Year Ended October 31, 2021 | $ | 6.43 | 0.13 | 1.41 | 1.54 | (0.13 | ) | (0.19 | ) | |||||||||||||||
| Year Ended October 31, 2020 | $ | 6.64 | 0.07 | 0.92 | 0.99 | (0.06 | ) | (1.14 | ) | |||||||||||||||
| Year Ended October 31, 2019 | $ | 10.46 | 0.12 | 0.53 | 0.65 | (0.36 | ) | (4.11 | ) | |||||||||||||||
| Year Ended October 31, 2018 | $ | 11.94 | 0.14 | 0.15 | 0.29 | (0.12 | ) | (1.65 | ) | |||||||||||||||
| A Class Shares | ||||||||||||||||||||||||
| Year Ended October 31, 2022 | $ | 7.64 | 0.14 | (1.09 | ) | (0.95 | ) | (0.15 | ) | (0.47 | ) | |||||||||||||
| Year Ended October 31, 2021 | $ | 6.43 | 0.11 | 1.40 | 1.51 | (0.11 | ) | (0.19 | ) | |||||||||||||||
| Period Ended October 31, 2020 (g) | $ | 5.20 | 0.03 | 1.23 | 1.26 | (0.03 | ) | — | ||||||||||||||||
| C Class Shares | ||||||||||||||||||||||||
| Year Ended October 31, 2022 | $ | 7.63 | 0.11 | (1.11 | ) | (1.00 | ) | (0.10 | ) | (0.47 | ) | |||||||||||||
| Year Ended October 31, 2021 | $ | 6.43 | 0.02 | 1.44 | 1.46 | (0.07 | ) | (0.19 | ) | |||||||||||||||
| Period Ended October 31, 2020 (g) | $ | 5.20 | 0.03 | 1.23 | 1.26 | (0.03 | ) | — | ||||||||||||||||
| Westwood Income Opportunity Fund | ||||||||||||||||||||||||
| Institutional Shares | ||||||||||||||||||||||||
| Year Ended October 31, 2022 | $ | 13.92 | 0.30 | (2.19 | ) | (1.89 | ) | (0.28 | ) | (1.16 | ) | |||||||||||||
| Year Ended October 31, 2021 | $ | 12.84 | 0.23 | 1.90 | 2.13 | (0.50 | ) | (0.55 | ) | |||||||||||||||
| Year Ended October 31, 2020 | $ | 15.89 | 0.22 | 0.34 | 0.56 | (0.20 | ) | (3.41 | ) | |||||||||||||||
| Year Ended October 31, 2019 | $ | 15.31 | 0.32 | 1.25 | 1.57 | (0.36 | ) | (0.63 | ) | |||||||||||||||
| Year Ended October 31, 2018 | $ | 15.72 | 0.28 | (0.11 | ) | 0.17 | (0.28 | ) | (0.30 | ) | ||||||||||||||
| A Class Shares | ||||||||||||||||||||||||
| Year Ended October 31, 2022 | $ | 13.90 | 0.27 | (2.19 | ) | (1.92 | ) | (0.25 | ) | (1.16 | ) | |||||||||||||
| Year Ended October 31, 2021 | $ | 12.83 | 0.20 | 1.88 | 2.08 | (0.46 | ) | (0.55 | ) | |||||||||||||||
| Year Ended October 31, 2020 | $ | 15.88 | 0.18 | 0.34 | 0.52 | (0.16 | ) | (3.41 | ) | |||||||||||||||
| Year Ended October 31, 2019 | $ | 15.30 | 0.28 | 1.25 | 1.53 | (0.32 | ) | (0.63 | ) | |||||||||||||||
| Year Ended October 31, 2018 | $ | 15.71 | 0.24 | (0.11 | ) | 0.13 | (0.24 | ) | (0.30 | ) | ||||||||||||||
| C Class Shares | ||||||||||||||||||||||||
| Year Ended October 31, 2022 | $ | 13.84 | 0.18 | (2.16 | ) | (1.98 | ) | (0.17 | ) | (1.16 | ) | |||||||||||||
| Year Ended October 31, 2021 | $ | 12.79 | 0.10 | 1.88 | 1.98 | (0.38 | ) | (0.55 | ) | |||||||||||||||
| Year Ended October 31, 2020 | $ | 15.88 | 0.06 | 0.36 | 0.42 | (0.10 | ) | (3.41 | ) | |||||||||||||||
| Period Ended October 31, 2019 (h) | $ | 15.77 | 0.03 | 0.16 | 0.19 | (0.08 | ) | — | ||||||||||||||||
Amounts designated as “—” are either $0.00 or have been rounded to $0.00.
| (a) | Per share net income has been determined on the basis of average number of shares outstanding during the period. |
| (b) | Total return is a measure of the change in value of an investment in the Fund over the period covered. The returns shown do not reflect the deduction of taxes a shareholder would pay on Fund distributions, if any or the redemption of Fund shares. The total returns would be lower if the Adviser had not reduced investment management fees and/or reimbursed expenses (Note 4). |
| (c) | Ratio was determined after investment management fee reductions and/or reimbursed expenses (Note 4). |
| (d) | Portfolio turnover rate is calculated on the basis of the Fund as a whole without distinguishing between classes of shares issued. |
| (e) | Not annualized. |
| (f) | Annualized. |
| (g) | Represents the period from the commencement of operations (March 31, 2020) through October 31, 2020. |
| (h) | Represents the period from the commencement of operations (September 3, 2019) through October 31, 2019. |
| (1) | Effective November 1, 2021, Westwood Low Volatility Equity Fund was renamed as Westwood Total Return Fund. |
The accompanying notes are an integral part of the financial statements.
80
| WESTWOOD FUNDS |
| FINANCIAL HIGHLIGHTS |
| SELECTED PER SHARE DATA & RATIOS |
| FOR A SHARE OUTSTANDING THROUGHOUT THE YEAR OR PERIOD |
| Ratio of total net | Ratio of total gross | Ratio of net | ||||||||||||||||||||||||||||
| Total | Net asset value, | Net assets, | expenses to average | expenses to average | investment income to | Portfolio | ||||||||||||||||||||||||
| distributions | end of period | Total return (b) | end of period (000’s) | net assets (c) | net assets | average net assets (c) | turnover rate (d) | |||||||||||||||||||||||
| (0.63 | ) | $ | 6.09 | (13.05 | )% | $ | 123,965 | 0.64 | % | 0.72 | % | 2.60 | % | 63 | % | |||||||||||||||
| (0.32 | ) | $ | 7.65 | 24.46 | % | $ | 143,710 | 0.35 | % | 0.51 | % | 1.79 | % | 66 | % | |||||||||||||||
| (1.20 | ) | $ | 6.43 | 17.59 | % | $ | 86,040 | 0.75 | % | 1.10 | % | 1.11 | % | 62 | % | |||||||||||||||
| (4.47 | ) | $ | 6.64 | 16.55 | % | $ | 4,722 | 0.75 | % | 2.13 | % | 1.76 | % | 66 | % | |||||||||||||||
| (1.77 | ) | $ | 10.46 | 2.35 | % | $ | 7,803 | 0.75 | % | 1.05 | % | 1.30 | % | 26 | % | |||||||||||||||
| (0.62 | ) | $ | 6.07 | (13.41 | )% | $ | 24 | 0.77 | % | 0.85 | % | 2.31 | % | 63 | % | |||||||||||||||
| (0.30 | ) | $ | 7.64 | 24.04 | % | $ | 4 | 0.64 | % | 0.78 | % | 1.47 | % | 66 | % | |||||||||||||||
| (0.03 | ) | $ | 6.43 | 24.30 | %(e) | $ | — | 0.01 | %(f) | 0.01 | %(f) | 0.90 | %(f) | 62 | %(e) | |||||||||||||||
| (0.57 | ) | $ | 6.06 | (14.10 | )% | $ | 55 | 1.63 | % | 1.71 | % | 1.70 | % | 63 | % | |||||||||||||||
| (0.26 | ) | $ | 7.63 | 23.13 | % | $ | 73 | 1.37 | % | 1.56 | % | 0.24 | % | 66 | % | |||||||||||||||
| (0.03 | ) | $ | 6.43 | 24.30 | %(e) | $ | — | 0.01 | %(f) | 0.01 | %(f) | 0.88 | %(f) | 62 | %(e) | |||||||||||||||
| (1.44 | ) | $ | 10.59 | (14.97 | )% | $ | 579,772 | 0.81 | % | 0.81 | % | 2.52 | % | 81 | % | |||||||||||||||
| (1.05 | ) | $ | 13.92 | 17.21 | % | $ | 814,633 | 0.85 | % | 0.86 | % | 1.68 | % | 82 | % | |||||||||||||||
| (3.61 | ) | $ | 12.84 | 4.59 | % | $ | 662,612 | 0.89 | % | 0.89 | % | 1.69 | % | 111 | % | |||||||||||||||
| (0.99 | ) | $ | 15.89 | 10.99 | % | $ | 1,056,504 | 0.85 | % | 0.85 | % | 2.08 | % | 66 | % | |||||||||||||||
| (0.58 | ) | $ | 15.31 | 1.04 | % | $ | 2,408,695 | 0.83 | % | 0.83 | % | 1.80 | % | 42 | % | |||||||||||||||
| (1.41 | ) | $ | 10.57 | (15.21 | )% | $ | 55,296 | 1.06 | % | 1.06 | % | 2.27 | % | 81 | % | |||||||||||||||
| (1.01 | ) | $ | 13.90 | 16.86 | % | $ | 62,614 | 1.10 | % | 1.11 | % | 1.44 | % | 82 | % | |||||||||||||||
| (3.57 | ) | $ | 12.83 | 4.34 | % | $ | 48,051 | 1.14 | % | 1.14 | % | 1.43 | % | 111 | % | |||||||||||||||
| (0.95 | ) | $ | 15.88 | 10.71 | % | $ | 64,450 | 1.10 | % | 1.10 | % | 1.86 | % | 66 | % | |||||||||||||||
| (0.54 | ) | $ | 15.30 | 0.78 | % | $ | 74,510 | 1.08 | % | 1.08 | % | 1.56 | % | 42 | % | |||||||||||||||
| (1.33 | ) | $ | 10.53 | (15.75 | )% | $ | 12,743 | 1.81 | % | 1.81 | % | 1.52 | % | 81 | % | |||||||||||||||
| (0.93 | ) | $ | 13.84 | 16.03 | % | $ | 13,323 | 1.85 | % | 1.86 | % | 0.70 | % | 82 | % | |||||||||||||||
| (3.51 | ) | $ | 12.79 | 3.52 | % | $ | 4,453 | 1.90 | % | 1.90 | % | 0.48 | % | 111 | % | |||||||||||||||
| (0.08 | ) | $ | 15.88 | 1.23 | %(e) | $ | 273 | 1.90 | %(f) | 1.90 | %(f) | 1.11 | %(f) | 66 | %(e) | |||||||||||||||
The accompanying notes are an integral part of the financial statements.
81
| WESTWOOD FUNDS |
| FINANCIAL HIGHLIGHTS |
| SELECTED PER SHARE DATA & RATIOS |
| FOR A SHARE OUTSTANDING THROUGHOUT THE YEAR OR PERIOD |
| Net realized | ||||||||||||||||||||||||||||
| Net asset value, | and unrealized | Total from | Dividends from | Distributions | ||||||||||||||||||||||||
| beginning of | Net investment | gains (losses) on | investment | net investment | from net realized | |||||||||||||||||||||||
| period | income (a) | investments | operations | income | capital gains | Return of capital | ||||||||||||||||||||||
| Westwood High Income Fund (1) | ||||||||||||||||||||||||||||
| Institutional Shares | ||||||||||||||||||||||||||||
| Year Ended October 31, 2022 | $ | 10.67 | 0.42 | (1.71 | ) | (1.29 | ) | (0.43 | ) | — | — | |||||||||||||||||
| Year Ended October 31, 2021 | $ | 9.55 | 0.35 | 1.14 | 1.49 | (0.37 | ) | — | — | |||||||||||||||||||
| Year Ended October 31, 2020 | $ | 9.25 | 0.35 | 0.29 | 0.64 | (0.34 | ) | — | — | |||||||||||||||||||
| Year Ended October 31, 2019 | $ | 9.12 | 0.41 | 0.15 | 0.56 | (0.43 | ) | — | — | |||||||||||||||||||
| Year Ended October 31, 2018 | $ | 9.37 | 0.42 | (0.24 | ) | 0.18 | (0.43 | ) | — | — | ||||||||||||||||||
| A Class Shares | ||||||||||||||||||||||||||||
| Year Ended October 31, 2022 | $ | 10.72 | 0.39 | (1.71 | ) | (1.32 | ) | (0.40 | ) | — | — | |||||||||||||||||
| Year Ended October 31, 2021 | $ | 9.60 | 0.33 | 1.13 | 1.46 | (0.34 | ) | — | — | |||||||||||||||||||
| Year Ended October 31, 2020 | $ | 9.29 | 0.34 | 0.29 | 0.63 | (0.32 | ) | — | — | |||||||||||||||||||
| Year Ended October 31, 2019 | $ | 9.15 | 0.39 | 0.14 | 0.53 | (0.39 | ) | — | — | |||||||||||||||||||
| Year Ended October 31, 2018 | $ | 9.37 | 0.40 | (0.23 | ) | 0.17 | (0.39 | ) | — | — | ||||||||||||||||||
| C Class Shares | ||||||||||||||||||||||||||||
| Year Ended October 31, 2022 | $ | 10.75 | 0.33 | (1.74 | ) | (1.41 | ) | (0.33 | ) | — | — | |||||||||||||||||
| Year Ended October 31, 2021 | $ | 9.55 | 0.22 | 1.28 | 1.50 | (0.30 | ) | — | — | |||||||||||||||||||
| Period Ended October 31, 2020 (g) | $ | 8.23 | 0.24 | 1.28 | 1.52 | (0.20 | ) | — | — | |||||||||||||||||||
Amounts designated as “—” are either $0.00 or have been rounded to $0.00.
| (a) | Per share net income has been determined on the basis of average number of shares outstanding during the period. |
| (b) | Total return is a measure of the change in value of an investment in the Fund over the period covered. The returns shown do not reflect the deduction of taxes a shareholder would pay on Fund distributions, if any or the redemption of Fund shares. The total returns would be lower if the Adviser had not reduced investment management fees and/or reimbursed expenses (Note 4). |
| (c) | Ratio was determined after investment management fee reductions and/or reimbursed expenses (Note 4). |
| (d) | Portfolio turnover rate is calculated on the basis of the Fund as a whole without distinguishing between classes of shares issued. |
| (e) | Not annualized. |
| (f) | Annualized. |
| (g) | Represents the period from the commencement of operations (March 31, 2020) through October 31, 2020. |
| (1) | Effective November 1, 2019, Westwood Short Duration High Yield Fund was renamed as Westwood High Income Fund. |
The accompanying notes are an integral part of the financial statements.
82
| WESTWOOD FUNDS |
| FINANCIAL HIGHLIGHTS |
| SELECTED PER SHARE DATA & RATIOS |
| FOR A SHARE OUTSTANDING THROUGHOUT THE YEAR OR PERIOD |
| Ratio of total net | Ratio of total gross | Ratio of net | ||||||||||||||||||||||||||||
| Total | Net asset value, | Net assets, | expenses to average | expenses to average | investment income to | Portfolio | ||||||||||||||||||||||||
| distributions | end of period | Total return (b) | end of period (000’s) | net assets (c) | net assets | average net assets (c) | turnover rate (d) | |||||||||||||||||||||||
| (0.43 | ) | $ | 8.95 | (12.38 | )% | $ | 96,636 | 0.80 | % | 0.87 | % | 4.31 | % | 62 | % | |||||||||||||||
| (0.37 | ) | $ | 10.67 | 15.69 | % | $ | 94,360 | 0.80 | % | 0.96 | % | 3.37 | % | 67 | % | |||||||||||||||
| (0.34 | ) | $ | 9.55 | 7.14 | % | $ | 72,914 | 0.27 | % | 0.59 | % | 3.78 | % | 130 | % | |||||||||||||||
| (0.43 | ) | $ | 9.25 | 6.25 | % | $ | 65,168 | 0.80 | % | 1.05 | % | 4.48 | % | 59 | % | |||||||||||||||
| (0.43 | ) | $ | 9.12 | 1.92 | % | $ | 64,926 | 0.80 | % | 1.02 | % | 4.57 | % | 37 | % | |||||||||||||||
| (0.40 | ) | $ | 9.00 | (12.54 | )% | $ | 2,321 | 1.15 | % | 1.22 | % | 3.95 | % | 62 | % | |||||||||||||||
| (0.34 | ) | $ | 10.72 | 15.34 | % | $ | 1,623 | 1.05 | % | 1.21 | % | 3.05 | % | 67 | % | |||||||||||||||
| (0.32 | ) | $ | 9.60 | 7.01 | % | $ | 320 | 0.48 | % | 0.82 | % | 3.61 | % | 130 | % | |||||||||||||||
| (0.39 | ) | $ | 9.29 | 5.93 | % | $ | 46 | 1.05 | % | 1.26 | % | 4.26 | % | 59 | % | |||||||||||||||
| (0.39 | ) | $ | 9.15 | 1.91 | % | $ | 31 | 1.05 | % | 1.26 | % | 4.26 | % | 37 | % | |||||||||||||||
| (0.33 | ) | $ | 9.01 | (13.32 | )% | $ | 201 | 1.83 | % | 1.90 | % | 3.31 | % | 62 | % | |||||||||||||||
| (0.30 | ) | $ | 10.75 | 15.77 | % | $ | 104 | 1.80 | % | 1.98 | % | 2.03 | % | 67 | % | |||||||||||||||
| (0.20 | ) | $ | 9.55 | 18.51 | %(e) | $ | — | 0.02 | %(f) | 0.03 | %(f) | 4.46 | %(f) | 130 | %(e) | |||||||||||||||
The accompanying notes are an integral part of the financial statements.
83
| WESTWOOD FUNDS |
| FINANCIAL HIGHLIGHTS |
| SELECTED PER SHARE DATA & RATIOS |
| FOR A SHARE OUTSTANDING THROUGHOUT THE YEAR OR PERIOD |
| Net realized | ||||||||||||||||||||||||||||
| Net asset value, | and unrealized | Total from | Dividends from | Distributions | ||||||||||||||||||||||||
| beginning of | Net investment | gains (losses) on | investment | net investment | from net realized | |||||||||||||||||||||||
| period | income (a) | investments | operations | income | capital gains | Return of capital | ||||||||||||||||||||||
| Westwood Alternative Income Fund (1) | ||||||||||||||||||||||||||||
| Institutional Shares | ||||||||||||||||||||||||||||
| Year Ended October 31, 2022 | $ | 11.02 | 0.20 | (0.51 | ) | (0.31 | ) | (0.17 | ) | (0.15 | ) | — | ||||||||||||||||
| Year Ended October 31, 2021 | $ | 10.47 | 0.16 | 0.49 | 0.65 | (0.10 | ) | — | — | |||||||||||||||||||
| Year Ended October 31, 2020 | $ | 10.25 | 0.18 | 0.46 | 0.64 | (0.10 | ) | (0.32 | ) | — | ||||||||||||||||||
| Year Ended October 31, 2019 | $ | 9.82 | 0.23 | 0.41 | 0.64 | (0.21 | ) | — | — | |||||||||||||||||||
| Year Ended October 31, 2018 | $ | 10.12 | 0.18 | (0.29 | ) | (0.11 | ) | (0.16 | ) | — | (0.03 | ) | ||||||||||||||||
| A Class Shares | ||||||||||||||||||||||||||||
| Year Ended October 31, 2022 | $ | 11.00 | 0.18 | (0.49 | ) | (0.31 | ) | (0.15 | ) | (0.15 | ) | — | ||||||||||||||||
| Year Ended October 31, 2021 | $ | 10.46 | 0.14 | 0.48 | 0.62 | (0.08 | ) | — | — | |||||||||||||||||||
| Period Ended October 31, 2020 (g) | $ | 9.78 | 0.10 | 0.62 | 0.72 | (0.04 | ) | — | — | |||||||||||||||||||
| C Class Shares | ||||||||||||||||||||||||||||
| Year Ended October 31, 2022 | $ | 11.01 | 0.13 | (0.52 | ) | (0.39 | ) | (0.07 | ) | (0.15 | ) | — | ||||||||||||||||
| Year Ended October 31, 2021 | $ | 10.46 | 0.06 | 0.50 | 0.56 | (0.01 | ) | — | — | |||||||||||||||||||
| Period Ended October 31, 2020 (g) | $ | 9.78 | 0.05 | 0.65 | 0.70 | (0.02 | ) | — | — | |||||||||||||||||||
| Ultra Shares | ||||||||||||||||||||||||||||
| Year Ended October 31, 2022 | $ | 11.02 | 0.20 | (0.49 | ) | (0.29 | ) | (0.18 | ) | (0.15 | ) | — | ||||||||||||||||
| Year Ended October 31, 2021 | $ | 10.47 | 0.17 | 0.48 | 0.65 | (0.10 | ) | — | — | |||||||||||||||||||
| Year Ended October 31, 2020 | $ | 10.25 | 0.19 | 0.46 | 0.65 | (0.11 | ) | (0.32 | ) | — | ||||||||||||||||||
| Year Ended October 31, 2019 | $ | 9.82 | 0.24 | 0.41 | 0.65 | (0.22 | ) | — | — | |||||||||||||||||||
| Year Ended October 31, 2018 | $ | 10.13 | 0.19 | (0.29 | ) | (0.10 | ) | (0.18 | ) | — | (0.03 | ) | ||||||||||||||||
| Westwood SmallCap Growth Fund | ||||||||||||||||||||||||||||
| Institutional Shares | ||||||||||||||||||||||||||||
| Year Ended October 31, 2022 | $ | 10.26 | 0.03 | (2.14 | ) | (2.11 | ) | (0.01 | ) | (0.02 | ) | — | ||||||||||||||||
| Period Ended October 31, 2021 (j) | $ | 10.00 | — | 0.26 | 0.26 | — | — | — | ||||||||||||||||||||
Amounts designated as “—” are either $0.00 or have been rounded to $0.00.
| (a) | Per share net income has been determined on the basis of average number of shares outstanding during the period. |
| (b) | Total return is a measure of the change in value of an investment in the Fund over the period covered. The returns shown do not reflect the deduction of taxes a shareholder would pay on Fund distributions, if any or the redemption of Fund shares. The total returns would be lower if the Adviser had not reduced investment management fees and/or reimbursed expenses (Note 4). |
| (c) | Ratio was determined after investment management fee reductions and/or reimbursed expenses (Note 4). |
| (d) | Portfolio turnover rate is calculated on the basis of the Fund as a whole without distinguishing between classes of shares issued. |
| (e) | Not annualized. |
| (f) | Annualized. |
| (g) | Represents the period from the commencement of operations (March 31, 2020) through October 31, 2020. |
| (h) | Excluding stock loan fees, and dividends on securities sold short, the ratio of expenses to average net assets would have been 1.12% and 1.05% for Institutional Class and Ultra Class, respectively. (i) Excluding stock loan fees, and dividends on securities sold short, the ratio of expenses to average net assets would have been 1.15% and 1.05% for Institutional Class and Ultra Class, respectively |
| (j) | Represents the period from the commencement of operations (September 30, 2021) through October 31, 2021. |
| (1) | Effective November 1, 2019, Westwood Market Neutral Income Fund was renamed as Westwood Alternative Income Fund. |
The accompanying notes are an integral part of the financial statements.
84
| WESTWOOD FUNDS |
| FINANCIAL HIGHLIGHTS |
| SELECTED PER SHARE DATA & RATIOS |
| FOR A SHARE OUTSTANDING THROUGHOUT THE YEAR OR PERIOD |
| Ratio of total net | Ratio of total gross | Ratio of net | ||||||||||||||||||||||||||||
| Total | Net asset value, | Net assets, | expenses to average | expenses to average | investment income to | Portfolio | ||||||||||||||||||||||||
| distributions | end of period | Total return (b) | end of period (000’s) | net assets (c) | net assets | average net assets (c) | turnover rate (d) | |||||||||||||||||||||||
| (0.32 | ) | $ | 10.39 | (2.88 | )% | $ | 67,312 | 0.30 | % | 0.44 | % | 1.91 | % | 128 | % | |||||||||||||||
| (0.10 | ) | $ | 11.02 | 6.19 | % | $ | 53,734 | 0.96 | % | 1.21 | % | 1.45 | % | 125 | % | |||||||||||||||
| (0.42 | ) | $ | 10.47 | 6.44 | % | $ | 22,772 | 0.90 | % | 1.40 | % | 1.79 | % | 137 | % | |||||||||||||||
| (0.21 | ) | $ | 10.25 | 6.57 | % | $ | 7,121 | 1.15 | %(h) | 1.47 | % | 2.33 | % | 106 | % | |||||||||||||||
| (0.19 | ) | $ | 9.82 | (1.09 | )% | $ | 6,193 | 1.22 | %(i) | 1.62 | % | 1.85 | % | 88 | % | |||||||||||||||
| (0.30 | ) | $ | 10.39 | (2.88 | )% | $ | 33 | 0.45 | % | 0.59 | % | 1.69 | % | 128 | % | |||||||||||||||
| (0.08 | ) | $ | 11.00 | 5.97 | % | $ | 68 | 1.11 | % | 1.38 | % | 1.32 | % | 125 | % | |||||||||||||||
| (0.04 | ) | $ | 10.46 | 7.35 | %(e) | $ | 28 | 1.15 | %(f) | 1.67 | %(f) | 1.61 | %(f) | 137 | %(e) | |||||||||||||||
| (0.22 | ) | $ | 10.40 | (3.59 | )% | $ | 156 | 1.20 | % | 1.34 | % | 1.24 | % | 128 | % | |||||||||||||||
| (0.01 | ) | $ | 11.01 | 5.93 | % | $ | 40 | 1.83 | % | 2.13 | % | 0.56 | % | 125 | % | |||||||||||||||
| (0.02 | ) | $ | 10.46 | 7.21 | %(e) | $ | 149 | 2.10 | %(f) | 2.62 | %(f) | 0.85 | %(f) | 137 | % | |||||||||||||||
| (0.33 | ) | $ | 10.40 | (2.69 | )% | $ | 88,734 | 0.20 | % | 0.34 | % | 1.95 | % | 128 | % | |||||||||||||||
| (0.10 | ) | $ | 11.02 | 6.26 | % | $ | 128,329 | 0.85 | % | 1.12 | % | 1.53 | % | 125 | % | |||||||||||||||
| (0.43 | ) | $ | 10.47 | 6.54 | % | $ | 86,386 | 0.87 | % | 1.40 | % | 1.86 | % | 137 | % | |||||||||||||||
| (0.22 | ) | $ | 10.25 | 6.64 | % | $ | 31,553 | 1.08 | %(h) | 1.39 | % | 2.39 | % | 106 | % | |||||||||||||||
| (0.21 | ) | $ | 9.82 | (1.02 | )% | $ | 27,312 | 1.12 | %(i) | 1.52 | % | 1.96 | % | 88 | % | |||||||||||||||
| (0.03 | ) | $ | 8.12 | (20.61 | )% | $ | 22,208 | 0.56 | % | 1.37 | % | 0.39 | % | 860 | % | |||||||||||||||
| — | $ | 10.26 | 2.60 | %(e) | $ | 1,026 | 0.75 | %(f) | 27.56 | %(f) | 0.02 | %(f) | 3 | %(e) | ||||||||||||||||
The accompanying notes are an integral part of the financial statements.
85
| WESTWOOD FUNDS |
| NOTES TO FINANCIAL STATEMENTS |
1. Organization
Westwood Quality Value Fund (“Value Fund”), Westwood Quality MidCap Fund (“MidCap Fund”), Westwood Quality SMidCap Fund (“SMidCap Fund”), Westwood Quality SmallCap Fund (“SmallCap Fund”), Westwood Quality AllCap Fund (“AllCap Fund”), Westwood Total Return Fund (“Total Return Fund”), Westwood Income Opportunity Fund (“Income Opportunity Fund”), Westwood High Income Fund (“High Income Fund”), Westwood Alternative Income Fund (“Alternative Income Fund”) and Westwood SmallCap Growth Fund (“SmallCap Growth Fund”), (individually, a “Fund” and collectively, the “Funds”) are each a series of Ultimus Managers Trust (the “Trust”), an open-end investment company established as an Ohio business trust under a Declaration of Trust dated February 28, 2012. The Trust is registered under the Investment Company Act of 1940, as amended, (the “1940 Act”).
The Value, SMidCap, SmallCap, Total Return, Income Opportunity, High Income and Alternative Income Funds (“Predecessor Funds”) were formerly part of The Advisors’ Inner Circle Fund and were acquired by, and reorganized into, the Trust on November 1, 2021, pursuant to an Agreement and Plan of Reorganization dated August 9, 2021. The AllCap and SmallCap Growth Funds commenced operations on September 30, 2021 and MidCap Fund commenced operations on November 30, 2021. Each Fund is classified as a diversified fund.
The investment objective of the Value, MidCap, SMidCap, SmallCap and AllCap Funds is to seek long-term capital appreciation.
The investment objective of Total Return Fund is to seek to provide total return, through a combination of current income and capital appreciation.
The investment objective of Income Opportunity Fund is to provide current income with a secondary investment objective to provide the opportunity for long-term capital appreciation.
The investment objective of High Income Fund is to seek to maximize total return through a high level of current income and capital appreciation.
The investment objective of Alternative Income Fund is to seek to provide absolute returns through a combination of current income and capital appreciation with low correlation to equity and fixed income markets.
The investment objective of SmallCap Growth Fund is to seek to achieve long-term capital growth.
As of October 31, 2021, all of the Funds offer Institutional Shares (sold without any sales loads, but subject to an administrative services plan fee of up to 0.20% of the average daily net assets attributable to Institutional Shares (for all Funds except Value, Total Return and Income Opportunity Funds), requiring a $100,000 minimum investment and offered exclusively to certain retirement plans established for the benefit of employees of the Westwood Management Corporation (the “Adviser”) or its affiliates; defined benefit retirement plans, endowments or foundations; banks and trust companies or law firms acting as trustee or manager for trust accounts; investors who purchase through asset-based fee programs available through financial intermediaries; and insurance companies).
The Value, SmallCap, Total Return, Income Opportunity, High Income and Alternative Income Funds offer A Class Shares (sold with a maximum sales charge of 3.00% (except for SmallCap Fund, which has a maximum sales charge of 4.00%) and a 12b-1 services plan fee up to 0.25% of the average daily net assets attributable to A Class Shares), requiring a $1,000 minimum investment. Class A Shares purchases of $250,000 or more may be subject to a contingent deferred sales charge (“CDSC”) of 1.00% if redeemed within 18 months of purchase (except for SmallCap Fund, in which purchases of $1,000,000 or more may be subject to a 1.00% CDSC fee if redeemed within 18 months of purchase.)
86
| WESTWOOD FUNDS |
The Value, SmallCap, Total Return, Income Opportunity, High Income and Alternative Income Funds offer C Class Shares (sold without any sales loads, but subject to a 12b-1 services plan fee of up to 1.00% of the average daily net assets attributable to C Class Shares for each Fund), requiring a $1,000 minimum investment. C Class Shares may be subject to a CDSC fee of 1.00% if redeemed within 12 months of purchase. C Class Shares automatically convert to A Class Shares after being held for 10 years.
The SMidCap, SmallCap, AllCap and Alternative Income Funds offer Ultra Shares (sold without any sales loads and distribution and/or administrative services fees, requiring a $20,000,000 initial investment and offered exclusively to employer retirement plans; health savings accounts under section 223 of the Internal Revenue Code of 1986, as amended, if such accounts are maintained by the Fund at an omnibus level; endowments and foundations and local, city and state agencies; unaffiliated registered investment companies; collective investment trusts; banks and trust companies or law firms acting as trustee or manager for trust accounts; and insurance companies).
Each share class represents an ownership interest in the same investment portfolio of the Fund.
2. Significant Accounting Policies
The following is a summary of the Funds’ significant accounting policies. The policies are in conformity with accounting principles generally accepted in the United States of America (“GAAP”). The Funds follow accounting and reporting guidance under Financial Accounting Standards Board (“FASB”) Accounting Standards Codification Topic 946, “Financial Services – Investment Companies.”
New accounting pronouncements – In March 2020, FASB issued Accounting Standards Update No. 2020-04 (“ASU 2020-04”), “Reference Rate Reform (Topic 848): Facilitation of the Effects of Reference Rate Reform on Financial Reporting.” ASU 2020-04 provides entities with optional guidance to ease potential accounting burden associated with transitioning away from the reference rates (e.g., LIBOR) that are expected to be discontinued. ASU 2020-04 allows, amount other things, certain contract modifications to be accounted as a continuation of the existing contract. This ASU was effective upon the issuance and its optional relief can be applied through December 31, 2022. The Funds will consider this optional guidance prospectively, if applicable. Management is also currently actively working with other financial institutions and counterparties to modify contracts as required by appliable regulation and within the regulatory deadlines.
Regulatory Update – In October 2020, the Securities and Exchange Commission (the “SEC”) adopted new regulations governing the use of derivatives by registered investment companies (“Rule 18f-4”). The Alternative Income Fund was required to comply with Rule 18f-4 by August 19, 2022. Rule 18f-4 imposes limits on the amount of derivatives a fund can enter into, eliminates the asset segregation framework currently used by funds to comply with Section 18 of the 1940 Act, tracks derivatives as senior securities and requires funds whose use of derivatives is more than a limited specified exposure amount to establish and maintain a comprehensive derivatives risk management program and appoint a derivatives risk manager. The Alternative Income Fund is currently complying with Rule 18f-4.
Securities valuation – Each Fund values its portfolio securities at market value as of the close of regular trading on the New York Stock Exchange (the “NYSE”) (normally 4:00 p.m. Eastern time) on each business day the NYSE is open for business. The Funds value their listed securities on the basis of the security’s last sale price on the security’s primary exchange, if available, otherwise at the exchange’s most recently quoted mean price. NASDAQ-listed securities are valued at the NASDAQ Official Closing Price. Investments representing shares of other open-end investment companies, other than exchange-traded funds (“ETFs”), if any, but including money market funds, are valued at their net asset value (“NAV”) as reported by such companies. Option contracts are valued at the closing price on the exchange on which they are primarily traded; if no closing price is available at the time of valuation, the option will be valued at the mean of the closing bid and ask prices for that day. Future contracts are valued at the final settlement price, or, if a settled price is not available, at the last sale price as of the close of regular trading on the primary exchange on which they are traded. When using a quoted price and when the market is considered active, these
87
| WESTWOOD FUNDS |
securities will be classified as Level 1 within the fair value hierarchy (see below). Fixed income securities are generally valued using prices provided by an independent pricing service approved by the Board of Trustees of the Trust (the “Board”). The independent pricing service uses information with respect to transactions in bonds, quotations from bond dealers, market transactions in comparable securities, and various relationships between securities in determining these prices. Total return swaps are valued as the change in the value of the underlying security plus/ minus the accrued income payment based on LIBOR or some other form of indices on the notional amount. In the event that market quotations are not readily available or are considered unreliable due to market or other events, the Funds value their securities and other assets at fair value pursuant to procedures established by the Board. Under these procedures, the securities will be classified as Level 2 or 3 within the fair value hierarchy, depending on the inputs used. Unavailable or unreliable market quotes may be due to the following factors: a substantial bid-ask spread; infrequent sales resulting in stale prices; insufficient trading volume; small trade sizes; a temporary lapse in any reliable pricing source; and actions of the securities or futures markets, such as the suspension or limitation of trading. As a result, the prices of securities used to calculate each Fund’s NAV may differ from quoted or published prices for the same securities. Securities traded on foreign exchanges, if any, are fair valued by an independent pricing service and translated from the local currency into U.S. dollars using currency exchange rates supplied by an independent pricing service.
GAAP establishes a single authoritative definition of fair value, sets out a framework for measuring fair value, and requires additional disclosures about fair value measurements.
Various inputs are used in determining the value of each Fund’s investments. These inputs are summarized in the three broad levels listed below:
| ● | Level 1 – quoted prices in active markets for identical securities |
| ● | Level 2 – other significant observable inputs |
| ● | Level 3 – significant unobservable inputs |
Fixed income securities held by the Funds are classified as Level 2 since values are based on prices provided by an independent pricing service that utilizes various “other significant observable inputs” including bid and ask quotations, prices of similar securities, and interest rates, among other factors.
The inputs or methods used for valuing securities are not necessarily an indication of the risks associated with investing in those securities. The inputs used to measure fair value may fall into different levels of the fair value hierarchy. In such cases, for disclosure purposes, the level in the fair value hierarchy within which the fair value measurement falls in its entirety is determined based on the lowest level input that is significant to the fair value measurement.
The following is a summary of each Fund’s investments and the inputs used to value the investments as of October 31, 2022:
| Westwood Quality Value Fund | Level 1 | Level 2 | Level 3 | Total | ||||||||||||
| Common Stocks | $ | 241,831,986 | $ | — | $ | — | $ | 241,831,986 | ||||||||
| Money Market Fund | 9,895,111 | — | — | 9,895,111 | ||||||||||||
| Total Investment Securities | $ | 251,727,097 | $ | — | $ | — | $ | 251,727,097 | ||||||||
| Westwood Quality MidCap Fund | ||||||||||||||||
| Common Stocks | $ | 513,368 | $ | — | $ | — | $ | 513,368 | ||||||||
| Money Market Fund | 21,368 | — | — | 21,368 | ||||||||||||
| Total Investment Securities | $ | 534,736 | $ | — | $ | — | $ | 534,736 | ||||||||
88
| WESTWOOD FUNDS |
| Westwood Quality SMIDCap Fund | Level 1 | Level 2 | Level 3 | Total | ||||||||||||
| Common Stocks | $ | 289,409,320 | $ | — | $ | — | $ | 289,409,320 | ||||||||
| Money Market Fund | 1,347,238 | — | — | 1,347,238 | ||||||||||||
| Total Investment Securities | $ | 290,756,558 | $ | — | $ | — | $ | 290,756,558 | ||||||||
| Westwood Quality SmallCap Fund | ||||||||||||||||
| Common Stocks | $ | 984,297,744 | $ | — | $ | — | $ | 984,297,744 | ||||||||
| Money Market Fund | 5,665,233 | — | — | 5,665,233 | ||||||||||||
| Total Investment Securities | $ | 989,962,977 | $ | — | $ | — | $ | 989,962,977 | ||||||||
| Westwood Quality AllCap Fund | ||||||||||||||||
| Common Stocks | $ | 21,452,896 | $ | — | $ | — | $ | 21,452,896 | ||||||||
| Money Market Fund | 644,981 | — | — | 644,981 | ||||||||||||
| Total Investment Securities | $ | 22,097,877 | $ | — | $ | — | $ | 22,097,877 | ||||||||
| Westwood Total Return Fund | ||||||||||||||||
| U.S. Government & Agencies | $ | — | $ | 10,045,191 | $ | — | $ | 10,045,191 | ||||||||
| Convertible Bonds | — | 4,758,658 | — | 4,758,658 | ||||||||||||
| Corporate Bonds | — | 39,357,771 | — | 39,357,771 | ||||||||||||
| Foreign Governments | — | 1,564,955 | — | 1,564,955 | ||||||||||||
| Common Stocks | 60,529,825 | — | — | 60,529,825 | ||||||||||||
| Exchange-Traded Funds | 262,558 | — | — | 262,558 | ||||||||||||
| Preferred Stocks | 5,605,659 | — | — | 5,605,659 | ||||||||||||
| Money Market Fund | 1,028,165 | — | — | 1,028,165 | ||||||||||||
| Total Investment Securities | $ | 67,426,207 | $ | 55,726,575 | $ | — | $ | 123,152,782 | ||||||||
| Westwood Income Opportunity Fund | ||||||||||||||||
| U.S. Government & Agencies | $ | — | $ | 79,522,066 | $ | — | $ | 79,522,066 | ||||||||
| Convertible Bonds | — | 13,009,138 | — | 13,009,138 | ||||||||||||
| Corporate Bonds | — | 270,001,851 | — | 270,001,851 | ||||||||||||
| Foreign Governments | — | 8,695,186 | — | 8,695,186 | ||||||||||||
| Common Stocks | 221,634,235 | — | — | 221,634,235 | ||||||||||||
| Exchange-Traded Funds | 10,137,057 | — | — | 10,137,057 | ||||||||||||
| Preferred Stocks | 35,832,261 | — | — | 35,832,261 | ||||||||||||
| Money Market Fund | 6,697,461 | — | — | 6,697,461 | ||||||||||||
| Total Investment Securities | $ | 274,301,014 | $ | 371,228,241 | $ | — | $ | 645,529,255 | ||||||||
89
| WESTWOOD FUNDS |
| Westwood High Income Fund | Level 1 | Level 2 | Level 3 | Total | ||||||||||||
| U.S. Government & Agencies | $ | — | $ | 7,482,257 | $ | — | $ | 7,482,257 | ||||||||
| Convertible Bonds | — | 1,040,405 | — | 1,040,405 | ||||||||||||
| Corporate Bonds | — | 66,435,620 | — | 66,435,620 | ||||||||||||
| Foreign Governments | — | 593,752 | — | 593,752 | ||||||||||||
| Common Stocks | 19,492,379 | — | — | 19,492,379 | ||||||||||||
| Exchange-Traded Funds | 724,200 | — | — | 724,200 | ||||||||||||
| Preferred Stocks | 577,530 | — | — | 577,530 | ||||||||||||
| Money Market Fund | 2,369,948 | — | — | 2,369,948 | ||||||||||||
| Total Investment Securities | $ | 23,164,057 | $ | 75,552,034 | $ | — | $ | 98,716,091 | ||||||||
| Westwood Alternative Income Fund | ||||||||||||||||
| U.S. Government & Agencies | $ | — | $ | 6,962,603 | $ | — | $ | 6,962,603 | ||||||||
| Convertible Bonds | — | 101,260,490 | — | 101,260,490 | ||||||||||||
| Corporate Bonds | — | 32,782,001 | — | 32,782,001 | ||||||||||||
| Foreign Governments | — | 484,966 | — | 484,966 | ||||||||||||
| Purchased Option Contracts | 83,680 | — | — | 83,680 | ||||||||||||
| Money Market Fund | 22,545,345 | — | — | 22,545,345 | ||||||||||||
| Total Investment Securities | $ | 22,629,025 | $ | 141,490,060 | $ | — | $ | 164,119,085 | ||||||||
| Other Financial Instruments** | ||||||||||||||||
| Total Return Swaps at value (assets) | $ | — | $ | 921,275 | $ | — | $ | 921,275 | ||||||||
| Total Return Swaps at value (liabilities) | — | (1,961,400 | ) | — | (1,961,400 | ) | ||||||||||
| Futures | 83,655 | — | — | 83,655 | ||||||||||||
| Total Investments | $ | 22,712,680 | $ | 140,449,935 | $ | — | $ | 163,162,615 | ||||||||
| Westwood SmallCap Growth Fund | ||||||||||||||||
| Common Stocks | $ | 22,154,597 | $ | — | $ | — | $ | 22,154,597 | ||||||||
| Total Investment Securities | $ | 22,154,597 | $ | — | $ | — | $ | 22,154,597 | ||||||||
Amounts designated as “-” are $0 or have been rounded to $0.
| ** | Other financial instruments are derivative instruments not reflected in the Schedule of Investments such as total return swap contracts and future contracts. These instruments are valued at the unrealized appreciation (depreciation) on the instrument. |
The Funds did not hold any derivative instruments or any assets or liabilities that were measured at fair value on a recurring basis using significant unobservable inputs (Level 3) as of or during the year ended October 31, 2022.
Share valuation – The NAV per share of each class of each Fund is calculated daily by dividing the total value of the assets attributable to that class, less liabilities attributable to that class, by the number of shares outstanding of that class. The offering price and redemption price per share of each class of each Fund is equal to the NAV per share
90
| WESTWOOD FUNDS |
of such class except for A Class Shares. A Class Shares have a front-end sales charge, which is deducted from your purchased price when you buy your shares.
Investment income – Dividend income is recorded on the ex-dividend date. Non-cash dividends included in dividend income, if any, are recorded at the fair value of the security received. Interest income is accrued as earned. Withholding taxes on foreign dividends, if any, have been recorded in accordance with the Funds’ understanding of the applicable country’s tax rules and rates. The Funds may invest in real estate investment trusts (“REITs”) that pay distributions to their shareholders based on available funds from operations. It is common for these distributions to exceed the REIT’s taxable earnings and profits resulting in the excess portion of such distribution to be designated as return of capital. Distributions received from REITs are generally recorded as dividend income and, if necessary, are reclassified annually in accordance with tax information provided by the underlying REITs. Discounts and premiums on fixed income securities, if any, are amortized using the interest method.
Investment transactions – Investment transactions are accounted for on the trade date. Realized gains and losses on investments sold are determined on a specific identification basis.
Allocation between Classes – Investment income earned, realized capital gains and losses, and unrealized appreciation and depreciation are allocated daily to each Class of a Fund based upon its proportionate share of total net assets of that Fund. Class-specific expenses are charged directly to the Class incurring the expense. Common expenses which are not attributable to a specific Class are allocated daily to each Class of shares of a Fund based upon its proportionate share of total net assets of that Fund.
Common expenses – Common expenses of the Trust are allocated among the Funds and the other series of the Trust based on the relative net assets of each series, the number of series in the Trust, or the nature of the services performed and the relative applicability to each series.
Futures contracts – A Fund may use futures contracts for tactical hedging purposes as well as to enhance a Fund’s returns. A futures contract represents a commitment for the future purchase or sale of an asset at a specified price on a specified date. When a Fund purchases or sells a futures contract, no price is paid to or received by a Fund. Instead, a Fund is required to deposit in a segregated asset account an amount of cash or qualifying securities. This is called the “initial margin deposit.” Subsequent payments, known as “variation margin,” are made or received by a Fund each day, depending on the daily fluctuations in the fair value of the underlying asset. A Fund recognizes an unrealized gain or loss equal to the daily valuation margin. If market conditions move unexpectedly, a Fund may not achieve the anticipated benefits of the futures contracts and may realize a loss. The margin deposits for futures contracts and the variation receivable/payable are reported on the Statements of Assets and Liabilities.
Options written/purchased – The Funds may utilize longer maturity options for stock replacement when and as price and volatility relationships become more favorable for options versus underlying stocks or for tax and liquidity management purposes. The Funds are authorized to write (sell) and purchase put and call options. The risk in writing a call option is that the Funds give up the opportunity to profit if the market price of the security increases. The risk in writing a put option is that the Funds may incur a loss if the market price of the security decreases and the option is exercised. The risk in purchasing an option is that the Funds pay a premium whether or not the option is exercised. The Funds also have the additional risk of being unable to enter into a closing transaction at an acceptable price if a liquid secondary market does not exist. Option contracts also involve the risk that they may not work as intended due to unanticipated developments in market conditions or other causes.
Swap contracts – The Funds are authorized to enter into swap contracts for the purposes of managing the Funds’ interest rate duration, yield curve exposure and yield spread sensitivity. Swaps are a two-party contract in which the seller (buyer) will pay to the buyer (seller) the difference between the current value of a security and its value at the time the contract was entered. Interest rate swaps involve the exchange by a Fund with another party of their respective commitment to pay or receive interest (e.g., an exchange of floating rate payments for fixed rate payments) with respect to a notional amount of principal. Swap contracts are privately negotiated in the over-
91
| WESTWOOD FUNDS |
the-counter market (“OTC Swaps”) or may be executed in a multilateral or other trade facility platform, such as a registered commodities exchange (“Centrally Cleared Swaps”).
Total return swaps allow an investor to benefit from the cash flow without ever actually owning the underlying security. The receiver must pay any decline in value to the payer at the end of the total return swaps. However, the investor does not need to make a payment if there is no decline in price. Payments can be made on various indices, bonds (i.e. mortgage backed securities, bank debt and corporate), loans or commodities. The value of a total return swap is equal to the change in value of the underlying asset versus the accrued income payment based on LIBOR or some other form of indices on the notional amount. Payments received or made are recorded as realized gains or loss. A Fund could be exposed to credit or market risk due to unfavorable changes in the fluctuation of interest rates or if the counterparty defaults on its obligation to perform. Risk of loss may exceed amounts recognized on the Statements of Assets and Liabilities. Interest rate and Total Return swap contracts outstanding at period end, if any, are listed after a Fund’s portfolio. In connection with swap agreements, securities may be set aside as collateral by a Fund’s custodian.
Periodic payments made or received are recorded as realized gains or losses. The Statements of Assets and Liabilities reflect, if any, unrealized appreciation or depreciation and accrued periodic payments for swap contracts the Funds may have open.
Entering into swap contracts involve, to varying degrees, elements of credit, interest rate and market risk in excess of the amounts recognized on the Statements of Assets and Liabilities. Such risks involve the possibility that there will be no liquid market for these contracts, that the counterparty to the contract may default on its obligation to perform and that there may be unfavorable changes in market conditions or fluctuations in interest rates. Swaps outstanding at year end, if any, are listed on the Schedules of Investments. Refer to each Fund’s Schedule of Investments for details regarding open swap contracts, if applicable.
There is the risk that the counterparty refuses to continue to enter into swap agreements with the Funds in the future, or requires increased fees, which could impair the Funds’ ability to achieve their investment objective. A counterparty may also increase its collateral requirements, which may limit the Fund’s ability to use leverage and reduce investment returns. In addition, if the Funds cannot locate a counterparty willing to enter into transactions with the Funds, they will not be able to implement their investment strategy.
Foreign currency translation – Securities and other assets and liabilities denominated in or expected to settle in foreign currencies are translated into U.S. dollars based on exchange rates on the following basis:
| A. | The fair values of investment securities and other assets and liabilities are translated as of the close of the NYSE each day. |
| B. | Purchases and sales of investment securities and income and expenses are translated at the rate of exchange prevailing as of 4:00 p.m. Eastern Time on the respective date of such transactions. |
| C. | The Funds do not isolate that portion of the results of operations caused by changes in foreign exchange rates on investments from those caused by changes in market prices of securities held. Such fluctuations are included with the net realized and unrealized gains or losses on investments. |
Reported net realized foreign exchange gains or losses arise from 1) purchases and sales of foreign currencies, 2) currency gains or losses realized between the trade and settlement dates on securities transactions and 3) the difference between the amounts of dividends and foreign withholding taxes recorded on a Fund’s books and the U.S. dollar equivalent of the amounts actually received or paid. Reported net unrealized foreign exchange gains and losses arise from changes in the value of assets and liabilities other than investments in securities that result from changes in exchange rates.
92
| WESTWOOD FUNDS |
The Funds may be subject to foreign taxes related to foreign income received, capital gain on the sale of securities and certain foreign currency transactions (a portion of which may be reclaimable). All foreign taxes are recorded in accordance with the applicable regulations and rates that exist in the foreign jurisdictions in which a Fund invests.
Forward foreign currency contracts – The Funds may enter into forward foreign currency contracts to offset the exposure to foreign currency. All foreign currency contracts are “marked- to-market” daily at the applicable translation rates, resulting in unrealized gains or losses. Realized and unrealized gains or losses from transactions in foreign contracts, if any, will be included on the Funds’ Statements of Operations. Risks associated with these contracts include the potential inability of counterparties to meet the terms of their contracts and unanticipated movements in the value of a foreign currency relative to the U.S. dollar.
Estimates – The preparation of financial statements in conformity with GAAP requires management to make estimates and assumptions that affect the reported amounts of assets and liabilities and disclosure of contingent assets and liabilities as of the date of the financial statements and the reported amounts of increase (decrease) in net assets from operations during the reporting period. Actual results could differ from those estimates.
Redemption fees – In an effort to discourage short-term trading and defray costs incurred by shareholders as a result of short-term trading, the Alternative Income Fund charges a 1.00% redemption fee on redemptions (including exchanges) of shares that have been held for less than 30 days. The redemption fee is deducted from the Fund’s sale proceeds and cannot be paid separately, and any proceeds of the fee are credited to the assets of the Fund from which the redemption was made. The fee does not apply to shares purchased with reinvested dividends or distributions.
Distributions to shareholders – Value, MidCap, SMidCap, SmallCap, AllCap and SmallCap Growth Funds distribute to shareholders any net investment income dividends and net realized capital gains distributions, if any, at least once each year. Total Return, Income Opportunity and Alternative Income Funds distribute to shareholders any net investment income dividends quarterly and net realized capital gains distributions, if any, at least once each year. High Income Fund distributes to shareholders any net investment income dividends monthly and net realized capital gains distributions, if any, at least once each year. The amount of such dividends and distributions are determined in accordance with federal income tax regulations, which may differ from GAAP. Dividends and distributions to shareholders are recorded on the ex-dividend date. The character of dividends paid to shareholders of the Funds for federal income tax purposes during the periods ended October 31, 2022 and 2021 was as follows:
| Ordinary | Long-Term | Total | ||||||||||
| Period Ended | Income | Capital Gains | Distributions | |||||||||
| Value Fund | ||||||||||||
| October 31, 2022 | $ | 8,370,856 | $ | 31,247,826 | $ | 39,618,682 | ||||||
| October 31, 2021 | $ | 2,548,171 | $ | 8,669,954 | $ | 11,218,125 | ||||||
| MidCap Fund | ||||||||||||
| October 31, 2022* | $ | — | $ | — | $ | — | ||||||
| SMidCap Fund | ||||||||||||
| October 31, 2022 | $ | 19,737,893 | $ | 29,174,952 | $ | 48,912,845 | ||||||
| October 31, 2021 | $ | 1,918,171 | $ | 3,592,035 | $ | 5,510,206 | ||||||
| SmallCap Fund | ||||||||||||
| October 31, 2022 | $ | 36,264,336 | $ | 14,953,770 | $ | 51,218,106 | ||||||
| October 31, 2021 | $ | 4,593,002 | $ | — | $ | 4,593,002 | ||||||
| AllCap Fund | ||||||||||||
| October 31, 2022 | $ | 115,427 | $ | — | $ | 115,427 | ||||||
| October 31, 2021** | $ | — | $ | — | $ | — | ||||||
93
| WESTWOOD FUNDS |
| Ordinary | Long-Term | Total | ||||||||||
| Period Ended | Income | Capital Gains | Distributions | |||||||||
| Total Return Fund | ||||||||||||
| October 31, 2022 | $ | 7,513,372 | $ | 4,521,206 | $ | 12,034,578 | ||||||
| October 31, 2021 | $ | 4,414,961 | $ | 319,567 | $ | 4,734,528 | ||||||
| Income Opportunity Fund | ||||||||||||
| October 31, 2022 | $ | 50,444,398 | $ | 40,005,156 | $ | 90,449,554 | ||||||
| October 31, 2021 | $ | 29,561,680 | $ | 31,259,352 | $ | 60,821,032 | ||||||
| High Income Fund | ||||||||||||
| October 31, 2022 | $ | 4,426,584 | $ | — | $ | 4,426,584 | ||||||
| October 31, 2021 | $ | 3,007,075 | $ | — | $ | 3,007,075 | ||||||
| Alternative Income Fund | ||||||||||||
| October 31, 2022 | $ | 4,611,634 | $ | 465,370 | $ | 5,077,004 | ||||||
| October 31, 2021 | $ | 1,462,671 | $ | — | $ | 1,462,671 | ||||||
| SmallCap Growth Fund | ||||||||||||
| October 31, 2022 | $ | 14,715 | $ | — | $ | 14,715 | ||||||
| October 31, 2021** | $ | — | $ | — | $ | — | ||||||
| * | Represents the period from the commencement of operations (November 30, 2021) through October 31, 2022. |
| ** | Represents the period from the commencement of operations (September 30, 2021) through October 31, 2021. |
Federal income tax – Each Fund has qualified and intends to continue to qualify as a regulated investment company under the Internal Revenue Code of 1986, as amended (the “Code”). Qualification generally will relieve the Funds of liability for federal income taxes to the extent 100% of their net investment income and net realized capital gains are distributed in accordance with the Code.
In order to avoid imposition of the excise tax applicable to regulated investment companies, it is also each Fund’s intention to declare as dividends in each calendar year at least 98% of its net investment income (earned during the calendar year) and 98.2% of its net realized capital gains (earned during the twelve months ended October 31) plus undistributed amounts from prior years.
94
| WESTWOOD FUNDS |
The following information is computed on a tax basis for each item as of October 31, 2022:
| Value | MidCap | SMidCap | SmallCap | AllCap | ||||||||||||||||
| Fund | Fund | Fund | Fund | Fund | ||||||||||||||||
| Federal income tax cost | $ | 210,568,832 | $ | 546,124 | $ | 275,134,240 | $ | 921,870,797 | $ | 21,815,905 | ||||||||||
| Gross unrealized appreciation | $ | 49,669,603 | $ | 39,031 | $ | 34,633,957 | $ | 141,965,648 | $ | 1,556,069 | ||||||||||
| Gross unrealized depreciation | (8,511,338 | ) | (50,419 | ) | (19,011,639 | ) | (73,873,468 | ) | (1,274,097 | ) | ||||||||||
| Net unrealized appreciation | 41,158,265 | (11,388 | ) | 15,622,318 | 68,092,180 | 281,972 | ||||||||||||||
| Undistributed ordinary income | 2,914,886 | 5,758 | 1,463,506 | 12,664,502 | 279,885 | |||||||||||||||
| Undistributed long-term capital gains | — | — | 2,302,714 | 19,712,922 | — | |||||||||||||||
| Accumulated capital and other losses | (284,008 | ) | (14,567 | ) | — | — | (454,289 | ) | ||||||||||||
| Total distributable earnings (accumulated deficit) | $ | 43,789,143 | $ | (20,197 | ) | $ | 19,388,538 | $ | 100,469,604 | $ | 107,568 | |||||||||
| Total | Income | Alternative | SmallCap | |||||||||||||||||
| Return | Opportunity | High | Income | Growth | ||||||||||||||||
| Fund | Fund | Income Fund | Fund | Fund | ||||||||||||||||
| Federal income tax cost | $ | 123,122,729 | $ | 679,349,281 | $ | 110,861,411 | $ | 169,719,620 | $ | 21,258,955 | ||||||||||
| Gross unrealized appreciation | $ | 10,920,462 | $ | 46,682,787 | $ | 2,978,693 | $ | 48,126,225 | $ | 1,305,842 | ||||||||||
| Gross unrealized depreciation | (10,890,409 | ) | (80,502,912 | ) | (15,124,013 | ) | (53,726,760 | ) | (410,200 | ) | ||||||||||
| Net unrealized appreciation | 30,053 | (33,820,125 | ) | (12,145,320 | ) | (5,600,535 | ) | 895,642 | ||||||||||||
| Undistributed ordinary income | 163,853 | 2,596,712 | — | 18,259,898 | 69,565 | |||||||||||||||
| Accumulated capital and other losses | — | (1,045,137 | ) | (11,107,419 | ) | (12,306,799 | ) | (3,013,959 | ) | |||||||||||
| Total distributable earnings (accumulated deficit) | $ | 193,906 | $ | (32,268,550 | ) | $ | (23,252,739 | ) | $ | 352,564 | $ | (2,048,752 | ) | |||||||
The difference between the federal income tax cost of portfolio investments and the financial statement cost of portfolio investments are due to certain timing differences in the recognition of capital gains or losses under income tax regulations and GAAP. These “book/tax” differences are temporary in nature and are primarily due to the tax deferral of losses on wash sales, constructive dividend income and partnership adjustments. Other temporary differences primarily consists of straddle loss deferral, contingent debt adjustment, perpetual bond and options mark to market adjustments.
As of October 31, 2022, the following Funds had short term and long term capital loss carryforwards for federal income tax purposes, which may be carried forward indefinitely. These capital loss carryforwards are available to
95
| WESTWOOD FUNDS |
offset net realized capital gains in the current and future years, thereby reducing future taxable gains distributions, if any.
| Capital Loss Carryovers | ||||||||||||
| Fund | Short- term | Long- term | Total | |||||||||
| Value Fund | $ | 284,008 | $ | — | $ | 284,008 | ||||||
| MidCap Fund | 14,567 | — | 14,567 | |||||||||
| AllCap Fund | 424,891 | 29,398 | 454,289 | |||||||||
| Income Opportunity Fund | 1,045,137 | — | 1,045,137 | |||||||||
| High Income Fund | 1,200,789 | 9,906,630 | 11,107,419 | |||||||||
| Alternative Income Fund | 10,591,132 | 1,715,667 | 12,306,799 | |||||||||
| SmallCap Growth Fund | 3,013,959 | — | 3,013,959 | |||||||||
The Funds recognize the tax benefits or expenses of uncertain tax positions only when the position is “more likely than not” of being sustained assuming examination by tax authorities. Management has reviewed each Fund’s tax positions for the current tax year and has concluded that no provision for unrecognized tax benefits or expenses is required in these financial statements. The Funds identify their major tax jurisdiction as U.S. Federal.
The permanent differences primarily consist of foreign currency translations, reclassification of long term capital gain distribution on REITs, investments in publicly traded partnerships, deemed distributions, net operating loss, perpetual bond adjustments, investments in swaps, pay-down gain (loss), contingent debt adjustment and distribution reclassification. The permanent differences that are credited or charged to Paid in Capital and distributable earnings as of October 31, 2022 are primarily related to utilization of earnings and profits on shareholder redemptions, in-kind redemption gain/loss, equalization, and non-deductible partnership expenses. As of October 31, 2022 the following adjustments were made:
| Distributable | ||||||||
| earnings/(loss) | Paid in capital | |||||||
| Value Fund | $ | 4 | $ | (4 | ) | |||
| Midcap Fund | 21 | (21 | ) | |||||
| SMidCap Fund | 2 | (2 | ) | |||||
| SmallCap Fund | (12,714,109 | ) | 12,714,109 | |||||
| Total Return Fund | (341,893 | ) | 341,893 | |||||
| Income Opportunity Fund | 7,854 | (7,854 | ) | |||||
| High Income Fund | 136,225 | (136,225 | ) | |||||
| Alternative Income Fund | (49 | ) | 49 | |||||
96
| WESTWOOD FUNDS |
3. Investment Transactions
The cost of security purchases and proceeds from sales and maturities of securities (excluding short-term debt securities having maturities one year or less and U.S. Government securities) for the period ended October 31, 2022 were as follows:
| Value | MidCap | SMidCap | SmallCap | AllCap | ||||||||||||||||
| Fund | Fund | Fund | Fund | Fund | ||||||||||||||||
| Purchases of investment securities | $ | 247,712,445 | $ | 1,024,257 | $ | 322,010,025 | $ | 640,926,872 | $ | 22,541,976 | ||||||||||
| Proceeds from sales of investment securities | $ | 193,803,771 | $ | 484,862 | $ | 333,725,096 | $ | 617,509,022 | $ | 21,826,450 | ||||||||||
| Total | Income | High | Alternative | SmallCap | ||||||||||||||||
| Return | Opportunity | Income | Income | Growth | ||||||||||||||||
| Fund | Fund | Fund | Fund | Fund | ||||||||||||||||
| Purchases of investment securities | $ | 67,348,116 | $ | 441,836,084 | $ | 60,711,636 | $ | 186,023,173 | $ | 137,027,014 | ||||||||||
| Proceeds from sales and maturities of investment securities | $ | 66,368,937 | $ | 519,023,538 | $ | 47,732,126 | $ | 193,394,207 | $ | 113,758,557 | ||||||||||
The cost of security purchases and proceeds from sales and maturities of U.S. Government long-term securities for the period ended October 31, 2022 were as follows:
| Total | Income | High | ||||||||||
| Return | Opportunity | Income | ||||||||||
| Fund | Fund | Fund | ||||||||||
| Purchases of investment securities | $ | 13,662,596 | $ | 166,561,441 | $ | 16,197,998 | ||||||
| Proceeds from sales and maturities of investment securities | $ | 13,344,201 | $ | 177,357,910 | $ | 13,065,133 | ||||||
4. Transactions with Related Parties
INVESTMENT MANAGEMENT AGREEMENT
The Funds’ investments are managed by the Adviser pursuant to the terms of an Investment Management Agreement. Each Fund pays the Adviser an investment management fee, based on the average net assets of each Fund, computed and accrued daily and paid monthly, at the annual rate shown in the table below. Pursuant to an Expense Limitation Agreement (“ELA”) between each Fund and the Adviser, the Adviser has contractually agreed, until March 1, 2024, to reduce investment management fees and reimburse other expenses to the extent necessary to limit total annual fund operating expenses of each Fund (exclusive of interest; taxes; brokerage commissions; Rule 12b-1 distribution fees (if any), administrative servicing fees (if any); borrowing expenses such as dividend and interest expenses on securities sold short; acquired fund fees and expenses; costs to organize the Funds; other expenditures which are
97
| WESTWOOD FUNDS |
capitalized in accordance with generally accepted accounting principle; and extraordinary expenses) to an amount not exceeding the following percentages of average daily net assets attributable to each respective class:
| Institutional | A Class | C Class | Ultra Class | |||||||
| Management | Class Expense | Expense | Expense | Expense | ||||||
| Fund | Fee | Limitation | Limitation | Limitation | Limitation | |||||
| Value Fund | 0.60% | 0.65% | 0.65% | 0.65% | n/a | |||||
| MidCap Fund | 0.58% | 0.58% | n/a | n/a | n/a | |||||
| SMidCap Fund | 0.75% | 0.68% | n/a | n/a | 0.68% | |||||
| SmallCap Fund | 0.85% | 0.79% | 0.79% | 0.79% | 0.79% | |||||
| AllCap Fund | 0.45% | 0.45% | n/a | n/a | 0.45% | |||||
| Total Return Fund* | 0.50% | (a) | 0.75% | n/a | n/a | n/a | ||||
| Income Opportunity Fund | 0.75% | 0.84% | 0.84% | 0.84% | n/a | |||||
| High Income* | 0.38% | (b) | n/a | n/a | n/a | n/a | ||||
| Alternative Income* | 0.53% | (c) | n/a | n/a | n/a | n/a | ||||
| SmallCap Growth Fund | 0.55% | 0.55% | n/a | n/a | n/a |
The Adviser has contractually agreed to waive its management fee at an annual rate in the amount of 0.01% of the Alternative Income Fund’s average daily net assets. In addition, pursuant to a separate contractual agreement, the Adviser has contractually agreed to reduce its fees and reimburse expenses of the Total Return Fund, High Income Fund, and Alternative Income Fund in order to keep net operating expenses (excluding management fees, interest, taxes, brokerage commissions, Rule 12b-1 distribution fees (if any), administrative servicing fees (if any), acquired fund fees and expenses, other expenditures which are capitalized in accordance with generally accepted accounting principles, and extraordinary expenses (collectively, “excluded expenses”)) from exceeding the Funds’ average daily net assets as follows:
| Institutional | A Class | C Class | Ultra Class | |||||
| Class Expense | Expense | Expense | Expense | |||||
| Fund | Limitation | Limitation | Limitation | Limitation | ||||
| Total Return Fund | 0.05% | 0.05% | 0.05% | n/a | ||||
| High Income | 0.10% | 0.10% | 0.10% | n/a | ||||
| Alternative Income | 0.00% | 0.00% | 0.00% | 0.00% |
| * | In connection with the Adviser’s Sensible Fees™ framework, for its services to each share class of Total Return, High Income and Alternative Income Funds, the Adviser is entitled to a management fee, which consists of a base fee (the “Base Fee”) and a positive or negative performance adjustment (the “Performance Adjustment”) based on whether , and to what extent, the investment performance of each share class of each Fund exceeds, or is exceeded by, the performance of an index hurdle (the “Index Hurdle”) over the 12-month period from November 1 of each year though October 31 of the following year (the “Performance Period”). For each share class of each Fund, the Base Fee and Performance Adjustment are each calculated and accrued daily based on the average daily net assets of the share class during the Performance Period. |
| (a) | The Base Fee is an annual rate of 0.50%. The Index Hurdle is the Blended 60/40 S&P 500® Index/Bloomberg U.S. Aggregate Bond Index plus 1.00%. The Performance Adjustment is calculated according to a schedule that adds or subtracts 0.0020% of the share class’s average daily net assets for each 0.01% by which the performance of the share class exceeds or lags the performance of the Index Hurdle over the Performance Period. The maximum Performance Adjustment (positive or negative) will not exceed an annual rate of +/- 0.20% of the share class’s average daily net assets during the Performance Period, which would occur when the performance of the share class exceeds, or is exceeded by, the performance of the Index Hurdle by 1.00% over the Performance Period. Accordingly, the management fee will range from a minimum annual rate of 0.30% to a maximum annual rate of 0.70%. |
98
| WESTWOOD FUNDS |
| (b) | The Base Fee is an annual rate of 0.38%. The Index Hurdle is the Blended 80/20 Bloomberg U.S. Aggregate Bond Index/S&P 500® Index plus 1.00%. The Performance Adjustment is calculated according to a schedule that adds or subtracts 0.0032% of the share class’s average daily net assets for each 0.01% by which the performance of the share class exceeds or lags the performance of the Index Hurdle over the Performance Period. The maximum Performance Adjustment (positive or negative) will not exceed an annual rate of +/- 0.32% of the share class’s average daily net assets during the Performance Period, which would occur when the performance of the share class exceeds, or is exceeded by, the performance of the Index Hurdle by 1.00% over the Performance Period. Accordingly, the management fee will range from a minimum annual rate of 0.06% to a maximum annual rate of 0.70%. |
| (c) | The Base Fee is an annual rate of 0.53%. The Index Hurdle is the FTSE 1-Month U.S. Treasury Bill Index plus 2.00%. The Performance Adjustment is calculated according to a schedule that adds or subtracts 0.0016% of the share class’s average daily net assets for each 0.01% by which the performance of the share class exceeds or lags the performance of the Index Hurdle over the Performance Period. The maximum Performance Adjustment (positive or negative) will not exceed an annual rate of +/- 0.32% of the share class’s average daily net assets during the Performance Period, which would occur when the performance of the share class exceeds, or is exceeded by, the performance of the Index Hurdle by 2.00% over the Performance Period. Accordingly, the management fee will range from a minimum annual rate of 0.21% to a maximum annual rate of 0.85%. |
Under the terms of the ELA, investment management fee reductions and expense reimbursements by the Adviser are subject to repayment by the Funds for a period of three years after the date on which such fees and expenses were incurred or waived, provided that the repayments do not cause total annual fund operating expenses (exclusive of such reductions and reimbursements) to exceed (i) the expense limitation then in effect, if any, and (ii) the expense limitation in effect at the time the expenses to be repaid were incurred. Fee waivers/expense reimbursements for the Predecessor Funds prior to the Reorganization on November 1, 2021 are not subject to recoupment by the Adviser. As of October 31, 2022, the Adviser may seek repayment of investment management fee reductions and expense reimbursements no later than the dates below:
| Value | MidCap | SMidCap | SmallCap | AllCap | ||||||||||||||||
| Fund | Fund | Fund | Fund | Fund | ||||||||||||||||
| October 31, 2024 | $ | — | $ | — | $ | — | $ | — | $ | 28,954 | ||||||||||
| October 31, 2025 | 97,530 | 92,127 | 476,566 | 1,251,166 | 105,671 | |||||||||||||||
| $ | 97,530 | $ | 92,127 | $ | 476,566 | $ | 1,251,166 | $ | 134,625 | |||||||||||
| Total | Income | High | Alternative | SmallCap | ||||||||||||||||
| Return | Opportunity | Income | Income | Growth | ||||||||||||||||
| Fund | Fund | Fund | Fund* | Fund | ||||||||||||||||
| October 31, 2024 | $ | — | $ | — | $ | — | $ | — | $ | 23,034 | ||||||||||
| October 31, 2025 | 105,981 | — | 69,686 | 216,283 | 111,666 | |||||||||||||||
| $ | 105,981 | $ | — | $ | 69,686 | $ | 216,283 | $ | 134,700 | |||||||||||
| * | For the year ended October 31, 2022, the Fund had $10,233 management fee waiver that is not subject to recoupment pursuant to the Management Fee Waiver Agreement. |
OTHER SERVICE PROVIDERS
Ultimus Fund Solutions, LLC (“Ultimus”) provides administration, fund accounting, compliance and transfer agency services to the Funds. The Funds pay Ultimus fees in accordance with the agreements for such services. In addition, the Funds pay out-of-pocket expenses including, but not limited to, postage, supplies, and certain costs related to the pricing of the Funds’ portfolio securities.
99
| WESTWOOD FUNDS |
Under the terms of a Distribution Agreement with the Trust, Ultimus Fund Distributors, LLC (the “Distributor”) serves as the principal underwriter to the Funds. The Distributor is a wholly-owned subsidiary of Ultimus. The Distributor is compensated by the Adviser for acting as principal underwriter.
A Trustee and certain officers of the Trust are also officers of Ultimus.
ADMINISTRATIVE SERVICES PLAN
As of October 31, 2021, MidCap, SMidCap, SmallCap, AllCap, High Income, Alternative Income and SmallCap Growth Funds have adopted an administrative services plan (the “Plan”) that provides that the Institutional Shares class of each Fund may pay financial intermediaries for shareholder services in an amount not to exceed 0.20% based on the average daily net assets of each Fund’s Institutional Shares. During the period ended October 31, 2022, the Institutional Shares of the Funds incurred the following administrative services plan fees under the Plan:
| Administrative service plan fees | ||||
| Institutional Shares | ||||
| MidCap Fund | $ | 12 | ||
| SMIDCap Fund | 400,840 | |||
| SmallCap Fund | 689,538 | |||
| High Income Fund | 318 | |||
| Alternative Income Fund | 56,439 | |||
| SmallCap Growth Fund | 906 |
DISTRIBUTION PLAN
Value, SmallCap, Total Return, Income Opportunity, High Income and Alternative Income Funds have adopted a distribution plan under Rule 12b-1 of the 1940 Act (the “Plan”) for A Class Shares and C Class Shares that allows the Funds to pay distribution and/or service fees for the sale and distribution of Fund shares, and for services provided to shareholders in an amount not to exceed 0.25% based on average daily net assets of each Fund’s A Class Shares and 1.00% based on the average daily net assets of each Fund’s C Class Shares. During the period ended October 31, 2022, the A Class Shares and C Class Shares of the Funds incurred the following distribution fees under the Plan:
| Distribution fee | ||||
| Value Fund | ||||
| A Class Shares | $ | 2,753 | ||
| C Class Shares | 562 | |||
| SmallCap Fund | ||||
| A Class Shares | 3,722 | |||
| C Class Shares | 7,600 | |||
| Total Return Fund | ||||
| A Class Shares | 31 | |||
| C Class Shares | 901 | |||
| Income Opportunity Fund | ||||
| A Class Shares | 149,476 | |||
| C Class Shares | 132,285 |
100
| WESTWOOD FUNDS |
| Distribution fee | ||||
| High Income Fund | ||||
| A Class Shares | $ | 5,606 | ||
| C Class Shares | 2,013 | |||
| Alternative Income Fund | ||||
| A Class Shares | 91 | |||
| C Class Shares | 486 |
TRUSTEE COMPENSATION
Effective October 17, 2022 Each member of the Board (a “Trustee”) who is not an “interested person” (as defined by the 1940 Act, as amended) of the Trust (“Independent Trustee”) receives a $1,300 annual retainer from each Fund, paid quarterly, except for the Board Chairperson who receives a $1,700 annual retainer from each Fund, paid in quarterly installments. Each Independent Trustee also receives from each Fund a fee of $550 for each Board meeting attended plus reimbursement for travel and other meeting-related expenses. Prior to October 17, 2022, each Independent Trustee received a $1,300 annual retainer from the Fund, paid quarterly, except for the Board Chairperson who received a $1,500 annual retainer from the Fund, paid in quarterly installments. Each Independent Trustee also received from the Fund a fee of $500 for each Board meeting attended plus reimbursement for travel and other meeting-related expenses.
PRINCIPAL HOLDERS OF FUND SHARES
As of October 31, 2022, the following shareholders owned of record 25% or more of the outstanding shares of the Funds:
| NAME OF RECORD OWNER | % Ownership | |
| Value Fund | ||
| Institutional Class | ||
| National Financial Services, LLC (for the benefit of its customers) | 30% | |
| SEI Private Trust Co. (for the benefit of its customers) | 28% | |
| C Class Shares | ||
| Raymond James (for the benefit of its customers) | 100% | |
| MidCap Fund | ||
| Institutional Shares | ||
| Westwood Management Corp. (for the benefit of its customers) | 91% | |
| SMIDCap Fund | ||
| Institutional Class | ||
| Northern Trust Co. (The) (for the benefit of its customers) | 52% | |
| Ultra Shares | ||
| National Financial Services, LLC (for the benefit of its customers) | 89% |
101
| WESTWOOD FUNDS |
| NAME OF RECORD OWNER | % Ownership | |
| SmallCap Fund | ||
| Institutional Class | ||
| National Financial Services, LLC (for the benefit of its customers) | 43% | |
| A Class Shares | ||
| Charles Schwab & Co., Inc. (for the benefit of its customers) | 40% | |
| TD Ameritrade, Inc. (for the benefit of its customers) | 27% | |
| C Class Shares | ||
| Raymond James (for the benefit of its customers) | 58% | |
| Ultra Shares | ||
| National Financial Services, LLC (for the benefit of its customers) | 59% | |
| Quality AllCap Fund | ||
| Institutional Shares | ||
| Westwood Management Corp. (for the benefit of its customers) | 91% | |
| Ultra Shares | ||
| U.S. Bank San Diego Transit Corp. | 87% | |
| Total Return Fund | ||
| Institutional Shares | ||
| National Financial Services, LLC (for the benefit of its customers) | 89% | |
| A Class Shares | ||
| LPL Financial (for the benefit of its customers) | 85% | |
| C Class Shares | ||
| LPL Financial (for the benefit of its customers) | 100% | |
| Income Opportunity Fund | ||
| A Class Shares | ||
| Wells Fargo Clearing Services (for the benefit of its customers) | 40% | |
| C Class Shares | ||
| Raymond James (for the benefit of its customers) | 70% |
102
| WESTWOOD FUNDS |
| NAME OF RECORD OWNER | % Ownership | |
| High Income Fund | ||
| Institutional Shares | ||
| National Financial Services, LLC (for the benefit of its customers) | 79% | |
| A Class Shares | ||
| TD Ameritrade, Inc. (for the benefit of its customers) | 25% | |
| Stifel Nicolaus & Co. (for the benefit of its customers) | 50% | |
| C Class Shares | ||
| Raymond James (for the benefit of its customers) | 100% | |
| Alternative Income Fund | ||
| Institutional Shares | ||
| LPL Financial (for the benefit of its customers) | 56% | |
| A Class Shares | ||
| Pershing, LLC (for the benefit of its customers) | 58% | |
| C Class Shares | ||
| LPL Financial (for the benefit of its customers) | 100% | |
| Ultra Shares | ||
| National Financial Services, LLC (for the benefit of its customers) | 99% | |
| SmallCap Growth Fund | ||
| Institutional Shares | ||
| National Financial Services, LLC (for the benefit of its customers) | 92% |
A beneficial owner of 25% or more of a Fund’s outstanding shares may be considered a controlling person of the Fund. That shareholder’s vote could have a more significant effect on matters presented at a shareholders’ meeting.
5. Derivative Transactions
The following is a summary of the fair value of derivative instruments held by the Alternative Income Fund as of October 31, 2022 presented on the Statements of Assets and Liabilities.
| Assets | Liabilities | |||||||||||||||
| Investments, | Unrealized | Unrealized | Unrealized | |||||||||||||
| at value for | appreciation | appreciation | depreciation | |||||||||||||
| purchased | on futures | on swap | on swap | |||||||||||||
| options | contracts* | agreements * | agreements * | |||||||||||||
| Equity Risk Exposure | $ | 83,680 | $ | — | $ | 709,486 | $ | (1,948,367 | ) | |||||||
| Interest Rate Risk Exposure | — | 83,655 | — | — | ||||||||||||
| Credit Risk Exposure | — | — | 211,789 | (13,033 | ) | |||||||||||
| Total | $ | 83,680 | $ | 83,655 | $ | 921,275 | $ | (1,961,400 | ) | |||||||
Amounts designated as “—” are $0 or have been rounded to $0.
| * | Total fair value is presented by Primary Risk Exposure. For futures contracts, the amounts represent their cumulative appreciation/depreciation, which includes movements of variation margin. |
103
| WESTWOOD FUNDS |
The following summary of the effect of derivatives instruments for Alternative Income Fund on the Statements of Operations for the period ended October 31, 2022:
| Net realized | Net realized | Net realized | ||||||||||
| gains from | gains from | gains/(losses) | ||||||||||
| purchased | futures | from swap | ||||||||||
| options | contracts | transactions | ||||||||||
| Equity Risk Exposure | $ | 201,743 | $ | — | $ | 28,013,046 | ||||||
| Interest Rate Risk Exposure | — | 162,409 | — | |||||||||
| Credit Risk Exposure | — | — | (5,068,074 | ) | ||||||||
| Total | $ | 201,743 | $ | 162,409 | $ | 22,944,972 | ||||||
| Net Change in Unrealized Appreciation (Depreciation) on Derivatives | ||||||||||||
| Recognized as a Result from Operations | ||||||||||||
| Net realized | Net realized | Net realized | ||||||||||
| losses from | gains from | gains/(losses) | ||||||||||
| purchased | futures | from swap | ||||||||||
| options | contracts | transactions | ||||||||||
| Equity Risk Exposure | $ | (99,948 | ) | $ | — | $ | 529,951 | |||||
| Interest Rate Risk Exposure | — | 60,746 | — | |||||||||
| Credit Risk Exposure | — | — | 273,463 | |||||||||
| Total | $ | (99,948 | ) | $ | 60,746 | $ | 803,414 | |||||
Amounts designated as “—” are $0 or have been rounded to $0.
Offsetting Assets and Liabilities:
Alternative Income Fund is required to disclose the impact of offsetting assets and liabilities represented in the Statements of Assets and Liabilities to enable users of the financial statements to evaluate the effect or potential effect of netting arrangements on its financial position for recognized assets and liabilities. These recognized assets and liabilities are financial instruments and derivative instruments that are either subject to an enforceable master netting arrangement or similar agreement or meet the following right of setoff criteria: the amounts owed by the Alternative Income Fund to another party are determinable, the Fund has the right to set off the amounts owed with the amounts owed by the other party, the Alternative Income Fund intends to set off, and the Fund’s right of setoff is enforceable at law.
A Fund is subject to various netting arrangements with select counterparties (“Master Agreements”). Master Agreements govern the terms of certain transactions, and reduce the counterparty risk associated with relevant transactions by specifying credit protection mechanisms and providing standardization that improves legal certainty. Since different types of transactions have different mechanics and are sometimes traded out of different legal entities of a particular counterparty organization, each type of transaction may be covered by a different Master Agreement, resulting in the need for multiple agreements with a single counterparty. As the Master Agreements are specific to unique operations of different asset types, they allow a Fund to close out and net its total exposure to
104
| WESTWOOD FUNDS |
a specific counterparty entity in the event of a default with respect to all the transactions governed under a single agreement with a specific counterparty entity.
Master Agreements can also help limit counterparty risk by specifying collateral posting arrangements at pre-arranged exposure levels. Under the Master Agreements, collateral is routinely transferred if the total net exposure to certain transactions (net of existing collateral already in place) governed under the relevant Master Agreement with a counterparty in a given account exceeds a specified threshold, which typically ranges from zero to $250,000 depending on the counterparty and the type of Master Agreement. United States Treasury Securities and U.S. dollar cash are generally the preferred forms of collateral. Securities and cash pledged as collateral are reflected as assets in the Statements of Assets and Liabilities as either a component of investments at value (securities) or deposits due from counterparties (cash). Cash collateral received is not typically held in a segregated account and as such is reflected as a liability in the Statements of Assets and Liabilities as deposits due to counterparties. The market value of any securities received as collateral is not reflected as a component of net asset value. A Fund’s overall exposure to counterparty risk can change substantially within a short period, as it is affected by each transaction subject to the relevant Master Agreement.
Customer account agreements and related addendums govern cleared derivatives transactions such as futures, options on futures, and cleared Over The Counter (“OTC”) derivatives. Cleared derivative transactions require posting of initial margin as determined by each relevant clearing agency which is segregated at a broker account registered with the Commodities Futures Trading Commission (“CFTC”), or the applicable regulator. In the U.S., counterparty risk is believed to be reduced as creditors of the futures broker do not have claim to Fund assets in the segregated account. Additionally, portability of exposure in the event of default further reduces risk to the Funds. Variation margin, or changes in market value, are exchanged daily, but generally may not be netted between futures and cleared OTC derivatives.
International Swaps and Derivatives Association, Inc. Master Agreements and Credit Support Annexes (“ISDA Master Agreements”) govern OTC financial derivative transactions entered into by a Fund and select counterparties. ISDA Master Agreements maintain provisions for general obligations, representations, agreements, collateral and events of default or termination. Events of termination include conditions that may entitle counterparties to elect to terminate early and cause settlement of all outstanding transactions under the applicable ISDA Master Agreement. Any election to terminate early could be material to the financial statements. In limited circumstances, the ISDA Master Agreement may contain additional provisions that add additional counterparty protection beyond coverage of existing daily exposure if the counterparty has a decline in credit quality below a predefined level. These amounts, if any, may be segregated with a third party custodian.
As of October 31, 2022, Alternative Income Fund’s derivative assets and liabilities by type are as follows:
| Descriptions | Assets | Liabilities | ||||||
| Derivatives Financial Instruments: | ||||||||
| Options contract* | $ | 83,680 | $ | — | ||||
| Futures contracts^ | 83,655 | — | ||||||
| Swap agreements | 921,275 | (1,961,400 | ) | |||||
| Total derivative assets and liabilities in the Statements of Assets and Liabilities | 1,088,610 | (1,961,400 | ) | |||||
| Derivative not subject to a MNA or similar agreement | (167,335 | ) | — | |||||
| Total assets and liabilities subject to a MNA | $ | 921,275 | $ | (1,961,400 | ) | |||
Amounts designated as “—” are $0 or have been rounded to $0.
| * | Includes options contracts purchased at value as reported in the Statements of Assets and Liabilities. |
| ^ | The amount represents their cumulative appreciation/depreciation which includes movements of variation margin. |
105
| WESTWOOD FUNDS |
The following table represents the Alternative Income Fund’s derivative assets by counterparty, net of amounts available for offset under an MNA and net of the related collateral received by the Fund as of October 31, 2022.
| Derivatives | ||||||||||||||||||||
| Derivative | Liabilities | |||||||||||||||||||
| Assets Subject | Subject to | Net Amount | Non-cash | |||||||||||||||||
| to a MNA by | a MNA by | of Derivative | Collateral | |||||||||||||||||
| Counterparty | Counterparty | Assets | Received(a) | Net Exposure | ||||||||||||||||
| BNP Paribas | $ | 921,275 | $ | (1,961,400 | ) | $ | (1,040,125 | ) | $ | 1,040,125 | $ | — | ||||||||
| $ | 921,275 | $ | (1,961,400 | ) | $ | (1,040,125 | ) | $ | 1,040,125 | $ | — | |||||||||
| (a) | The actual collateral received or pledged may be in excess of the amounts shown in the tables. The tables only reflect collateral amounts up to the amount of the financial instruments disclosed on the Statements of Assets and Liabilities. |
6. Certain Investments and Risks
Below are summaries of some, but not all, of the principal risks of investing in one or more of the Funds, each of which could adversely affect a Fund’s NAV, yield and total return. Each risk listed below does not necessarily apply to each Fund, and you should read each Fund’s prospectus carefully for a description of the principal risks associated with investing in a particular Fund.
RISKS ASSOCIATED WITH LOWER RATE DEBT SECURITIES
High Income Fund invests substantially all of its assets in high yield, or “junk,” bonds, and such investments represent highly speculative securities that are usually issued by smaller, less creditworthy and/or highly leveraged (indebted) companies. Compared with investment-grade bonds, high yield bonds are considered to carry a greater degree of risk and are considered to be less likely to make payments of interest and principal. In particular, lower-quality high yield bonds (rated CCC, CC, C, or unrated securities judged to be of comparable quality) are subject to a greater degree of credit risk than higher-quality high yield bonds and may be near default. High yield bonds rated D are in default. Market developments and the financial and business conditions of the corporation issuing these securities generally influence their price and liquidity more than changes in interest rates, when compared to investment-grade debt securities .In addition, insufficient liquidity in the non-investment grade bond market may make it more difficult to dispose of non-investment grade bonds and may cause the Fund to experience sudden and substantial price declines.
7. In-Kind Transactions
During the year ended October 31, 2021, the Value Fund issued shares of beneficial interest in exchange for securities and the Income Opportunity Fund redeemed shares of beneficial interest in exchange for securities. The securities were transferred at their current value on the date of the transaction.
| Transaction | Shares Sold/ | Securities at | ||||||||||||||||||||
| Date | (Redeemed) | Value | Cash | Total | Realized Gain | |||||||||||||||||
| Value Fund | 6/30/2021 | $ | 1,175,620 | $ | 16,314,560 | $ | 778,960 | $ | 17,093,520 | $ | — | |||||||||||
| Income Opportunity Fund | 4/20/2021 | (1,578,769 | ) | 20,162,864 | 1,403,118 | 21,565,982 | 2,878,054 | |||||||||||||||
106
| WESTWOOD FUNDS |
8. Contingencies and Commitments
The Funds indemnify the Trust’s officers and Trustees for certain liabilities that might arise from their performance of their duties to the Funds. Additionally, in the normal course of business the Funds enter into contracts that contain a variety of representations and warranties and which provide general indemnifications. The Funds’ maximum exposure under these arrangements is unknown, as this would involve future claims that may be made against the Funds that have not yet occurred. However, based on experience, the Funds expect the risk of loss to be remote.
9. Subsequent Events
The Funds are required to recognize in the financial statements the effects of all subsequent events that provide additional evidence about conditions that existed as of the date of the Statements of Assets and Liabilities. For non-recognized subsequent events that must be disclosed to keep the financial statements from being misleading, the Funds are required to disclose the nature of the event as well as an estimate of its financial effect, or a statement that such an estimate cannot be made. Management has evaluated subsequent events through the issuance of these financial statements and has noted no such events.
107
| WESTWOOD FUNDS |
| REPORT OF INDEPENDENT REGISTERED PUBLIC ACCOUNTING FIRM |
To the Board of Trustees of Ultimus Managers Trust
and the Shareholders of Westwood Quality Value Fund, Westwood Quality MidCap Fund, Westwood Quality SMidCap Fund, Westwood Quality SmallCap Fund, Westwood Quality AllCap Fund, Westwood Total Return Fund, Westwood Income Opportunity Fund, Westwood High Income Fund, Westwood Alternative Income Fund, and Westwood SmallCap Growth Fund
Opinion on the Financial Statements
We have audited the accompanying statements of assets and liabilities of Westwood Quality Value Fund, Westwood Quality MidCap Fund, Westwood Quality SMidCap Fund, Westwood Quality SmallCap Fund, Westwood Quality AllCap Fund, Westwood Total Return Fund, Westwood Income Opportunity Fund, Westwood High Income Fund, Westwood Alternative Income Fund, and Westwood SmallCap Growth Fund, each a series of shares of beneficial interest in Ultimus Managers Trust (the “Funds”), including the schedules of investments, as of October 31, 2022, and the related statements of operations and changes in net assets, and the financial highlights as noted in the table below, and the related notes (collectively referred to as the “financial statements”). In our opinion, the financial statements present fairly, in all material respects, the financial position of the Funds as of October 31, 2022, and the results of their operations, the changes in their net assets and their financial highlights for each of the periods noted in the table below, in conformity with accounting principles generally accepted in the United States of America. The statements of changes for the year ended October 31, 2021 and the financial highlights for each of the years in the four year period ended October 31, 2021 were audited by other auditors, whose report dated December 29, 2021 expressed an unqualified opinion on such financial statements and financial highlights.
| Fund | Financial Statements Presented |
| Westwood Quality Value Fund | The statement of operations, the statement of changes in net assets and the financial highlights for the year ended October 31, 2022 |
| Westwood Quality MidCap Fund | The statement of operations, the statement of changes in net assets and the financial highlights for the year ended October 31, 2022 |
| Westwood Quality SMidCap Fund | The statement of operations, the statement of changes in net assets and the financial highlights for the year ended October 31, 2022 |
| Westwood Quality SmallCap Fund | The statement of operations, the statement of changes in net assets and the financial highlights for the year ended October 31, 2022 |
| Westwood Quality AllCap Fund | The statement of operations of the year ended October 31, 2022, and the statements of changes in net assets and the financial highlights for the year then ended and for the period September 20, 2021 (commencement of operations) through October 31, 2021 |
| Westwood Total Return Fund | The statement of operations, the statement of changes in net assets and the financial highlights for the year ended October 31, 2022 |
| Westwood Income Opportunity Fund | The statement of operations, the statement of changes in net assets and the financial highlights for the year ended October 31, 2022 |
| Westwood High Income Fund | The statement of operations, the statement of changes in net assets and the financial highlights for the year ended October 31, 2022 |
108
| WESTWOOD FUNDS |
| Fund | Financial Statements Presented |
| Westwood Alternative Income Fund | The statement of operations, the statement of changes in net assets and the financial highlights for the year ended October 31, 2022 |
| Westwood SmallCap Growth Fund | The statement of operations of the year ended October 31, 2022, and the statements of changes in net assets and the financial highlights for the year then ended and for the period September 20, 2021 (commencement of operations) through October 31, 2021 |
Basis for Opinion
These financial statements are the responsibility of the Funds’ management. Our responsibility is to express an opinion on the Funds’ financial statements based on our audits. We are a public accounting firm registered with the Public Company Accounting Oversight Board (United States) (“PCAOB”) and are required to be independent with respect to the Funds in accordance with the U.S. federal securities law and the applicable rules and regulations of the Securities and Exchange Commission and the PCAOB.
We conducted our audits in accordance with the standards of the PCAOB. Those standards require that we plan and perform the audits to obtain reasonable assurance about whether the financial statements are free of material misstatement, whether due to error or fraud. The Funds are not required to have, nor were we engaged to perform, an audit of their internal control over financial reporting. As part of our audits we are required to obtain an understanding of internal control over financial reporting but not for the purpose of expressing an opinion on the effectiveness of the Funds’ internal control over financial reporting. Accordingly, we express no such opinion.
Our audits included performing procedures to assess the risk of material misstatement of the financial statements, whether due to error or fraud, and performing procedures that respond to those risks. Such procedures included examining, on a test basis, evidence regarding the amounts and disclosures in the financial statements. Our procedures included confirmation of securities owned as of October 31, 2022 by correspondence with the custodian, brokers, or by other appropriate auditing procedures where replies from brokers were not received. Our audits also included evaluating the accounting principles used and significant estimates made by management, as well as evaluating the overall presentation of the financial statements. We believe that our audits provide a reasonable basis for our opinion.

BBD, LLP
We have served as the auditor of one or more of the Funds in the Ultimus Managers Trust since 2013.
Philadelphia, Pennsylvania
December 30, 2022
109
| WESTWOOD FUNDS |
| ABOUT YOUR FUNDS’ EXPENSES (Unaudited) |
We believe it is important for you to understand the impact of costs on your investment. As a shareholder of the Funds, you incur two types of costs: (1) transaction costs, possibly including sales charges (loads) and redemption fees, and (2) ongoing costs, including management fees, class-specific expenses (such as administrative services fees and/or Rule 12b-1 fees) and other operating expenses. The following examples are intended to help you understand your ongoing costs (in dollars) of investing in the Funds and to compare these costs with the ongoing costs of investing in other mutual funds.
A mutual fund’s ongoing costs are expressed as a percentage of its average net assets. This figure is known as the expense ratio. The expenses in the table below are based on an investment of $1,000 made at the beginning of the most recent period (May 1, 2022) and held until the end of the period (October 31, 2022).
The table below illustrates each Fund’s ongoing costs in two ways:
Actual fund return – This section helps you to estimate the actual expenses that you paid over the period. The “Ending Account Value” shown is derived from each Fund’s actual return, and the fourth column shows the dollar amount of operating expenses that would have been paid by an investor who started with $1,000 in the Funds. You may use the information here, together with the amount you invested, to estimate the expenses that you paid over the period.
To do so, simply divide your account value by $1,000 (for example, an $8,600 account value divided by $1,000 = 8.6), then multiply the result by the number given for the Funds under the heading “Expenses Paid During Period.”
Hypothetical 5% return – This section is intended to help you compare each Fund’s ongoing costs with those of other mutual funds. It assumes that the Funds had an annual return of 5% before expenses during the period shown, but that the expense ratio is unchanged. In this case, because the return used is not each Fund’s actual return, the results do not apply to your investment. The example is useful in making comparisons because the SEC requires all mutual funds to calculate expenses based on a 5% return. You can assess each Fund’s ongoing costs by comparing this hypothetical example with the hypothetical examples that appear in shareholder reports of other funds.
Note that expenses shown in the table are meant to highlight and help you compare ongoing costs only. The Funds do not charge transaction fees, such as purchase or redemption fees, nor do they carry a “sales load.”
The calculations assume no shares were bought or sold during the period. Your actual costs may have been higher or lower, depending on the amount of your investment and the timing of any purchases or redemptions.
More information about each Fund’s expenses can be found in this report. For additional information on operating expenses and other shareholder costs, please refer to each Fund’s prospectus.
110
| WESTWOOD FUNDS |
| Ending | ||||||||
| Beginning | Account Value | Expenses Paid | ||||||
| Account Value | October 31, | Net Expense | During | |||||
| May 1, 2022 | 2022 | Ratio (a) | Period (b) | |||||
| Value Fund | ||||||||
| Institutional Shares | ||||||||
| Based on Actual Fund Return | $1,000.00 | $996.00 | 0.65% | $3.27 | ||||
| Based on Hypothetical 5% Return (before expenses) | $1,000.00 | $1,021.93 | 0.65% | $3.31 | ||||
| A Class Shares | ||||||||
| Based on Actual Fund Return | $1,000.00 | $995.30 | 0.90% | $4.53 | ||||
| Based on Hypothetical 5% Return (before expenses) | $1,000.00 | $1,020.67 | 0.90% | $4.58 | ||||
| C Class Shares | ||||||||
| Based on Actual Fund Return | $1,000.00 | $991.10 | 1.65% | $8.28 | ||||
| Based on Hypothetical 5% Return (before expenses) | $1,000.00 | $1,016.89 | 1.65% | $8.39 | ||||
| MidCap Fund | ||||||||
| Institutional Share Class | ||||||||
| Based on Actual Fund Return | $1,000.00 | $989.70 | 0.42% | $2.11 | ||||
| Based on Hypothetical 5% Return (before expenses) | $1,000.00 | $1,023.09 | 0.42% | $2.14 | ||||
| SMidCap Fund | ||||||||
| Institutional Share Class | ||||||||
| Based on Actual Fund Return | $1,000.00 | $1,006.20 | 0.85% | $4.30 | ||||
| Based on Hypothetical 5% Return (before expenses) | $1,000.00 | $1,020.92 | 0.85% | $4.33 | ||||
| Ultra Shares | ||||||||
| Based on Actual Fund Return | $1,000.00 | $1,007.00 | 0.68% | $3.44 | ||||
| Based on Hypothetical 5% Return (before expenses) | $1,000.00 | $1,021.78 | 0.68% | $3.47 | ||||
| SmallCap Fund | ||||||||
| Institutional Share Class | ||||||||
| Based on Actual Fund Return | $1,000.00 | $1,025.00 | 0.92% | $4.70 | ||||
| Based on Hypothetical 5% Return (before expenses) | $1,000.00 | $1,020.57 | 0.92% | $4.69 | ||||
| A Class Shares | ||||||||
| Based on Actual Fund Return | $1,000.00 | $1,024.50 | 1.04% | $5.31 | ||||
| Based on Hypothetical 5% Return (before expenses) | $1,000.00 | $1,019.96 | 1.04% | $5.30 |
111
| WESTWOOD FUNDS |
| Ending | ||||||||
| Beginning | Account Value | Expenses Paid | ||||||
| Account Value | October 31, | Net Expense | During | |||||
| May 1, 2022 | 2022 | Ratio (a) | Period (b) | |||||
| SmallCap Fund (continued) | ||||||||
| C Class Shares | ||||||||
| Based on Actual Fund Return | $1,000.00 | $1,020.80 | 1.79% | $9.12 | ||||
| Based on Hypothetical 5% Return (before expenses) | $1,000.00 | $1,016.18 | 1.79% | $9.10 | ||||
| Ultra Shares | ||||||||
| Based on Actual Fund Return | $1,000.00 | $1,026.00 | 0.79% | $4.03 | ||||
| Based on Hypothetical 5% Return (before expenses) | $1,000.00 | $1,021.22 | 0.79% | $4.02 | ||||
| AllCap Fund | ||||||||
| Institutional Share Class | ||||||||
| Based on Actual Fund Return | $1,000.00 | $933.40 | 0.65% | $3.17 | ||||
| Based on Hypothetical 5% Return (before expenses) | $1,000.00 | $1,021.93 | 0.65% | $3.31 | ||||
| Ultra Shares | ||||||||
| Based on Actual Fund Return | $1,000.00 | $934.80 | 0.45% | $2.15 | ||||
| Based on Hypothetical 5% Return (before expenses) | $1,000.00 | $1,022.99 | 0.45% | $2.24 | ||||
| Total Return Fund | ||||||||
| Institutional Shares | ||||||||
| Based on Actual Fund Return | $1,000.00 | $955.10 | 0.73% | $3.60 | ||||
| Based on Hypothetical 5% Return (before expenses) | $1,000.00 | $1,021.53 | 0.73% | $3.72 | ||||
| A Class Shares | ||||||||
| Based on Actual Fund Return | $1,000.00 | $952.60 | 0.75% | $3.69 | ||||
| Based on Hypothetical 5% Return (before expenses) | $1,000.00 | $1,021.42 | 0.75% | $3.82 | ||||
| C Class Shares | ||||||||
| Based on Actual Fund Return | $1,000.00 | $949.00 | 1.73% | $8.50 | ||||
| Based on Hypothetical 5% Return (before expenses) | $1,000.00 | $1,016.48 | 1.73% | $8.79 | ||||
| Income Opportunity Fund | ||||||||
| Institutional Shares | ||||||||
| Based on Actual Fund Return | $1,000.00 | $932.80 | 0.82% | $3.99 | ||||
| Based on Hypothetical 5% Return (before expenses) | $1,000.00 | $1,021.07 | 0.82% | $4.18 |
112
WESTWOOD FUNDS
| Ending | ||||||||
| Beginning | Account Value | Expenses Paid | ||||||
| Account Value | October 31, | Net Expense | During | |||||
| May 1, 2022 | 2022 | Ratio (a) | Period (b) | |||||
| Income Opportunity Fund (continued) | ||||||||
| A Class Shares | ||||||||
| Based on Actual Fund Return | $1,000.00 | $951.50 | 1.07% | $5.21 | ||||
| Based on Hypothetical 5% Return (before expenses) | $1,000.00 | $1,019.81 | 1.07% | $5.45 | ||||
| C Class Shares | ||||||||
| Based on Actual Fund Return | $1,000.00 | $928.40 | 1.82% | $8.85 | ||||
| Based on Hypothetical 5% Return (before expenses) | $1,000.00 | $1,016.03 | 1.82% | $9.25 | ||||
| High Income Fund | ||||||||
| Institutional Shares | ||||||||
| Based on Actual Fund Return | $1,000.00 | $946.10 | 0.80% | $3.92 | ||||
| Based on Hypothetical 5% Return (before expenses) | $1,000.00 | $1,021.17 | 0.80% | $4.08 | ||||
| A Class Shares | ||||||||
| Based on Actual Fund Return | $1,000.00 | $945.20 | 1.05% | $5.15 | ||||
| Based on Hypothetical 5% Return (before expenses) | $1,000.00 | $1,019.91 | 1.05% | $5.35 | ||||
| C Class Shares | ||||||||
| Based on Actual Fund Return | $1,000.00 | $940.70 | 1.78% | $8.71 | ||||
| Based on Hypothetical 5% Return (before expenses) | $1,000.00 | $1,016.23 | 1.78% | $9.05 | ||||
| Alternative Income Fund | ||||||||
| Institutional Share Class | ||||||||
| Based on Actual Fund Return | $1,000.00 | $992.60 | 0.30% | $1.51 | ||||
| Based on Hypothetical 5% Return (before expenses) | $1,000.00 | $1,023.69 | 0.30% | $1.53 | ||||
| A Class Shares | ||||||||
| Based on Actual Fund Return | $1,000.00 | $992.80 | 0.45% | $2.26 | ||||
| Based on Hypothetical 5% Return (before expenses) | $1,000.00 | $1,022.94 | 0.45% | $2.29 | ||||
| C Class Shares | ||||||||
| Based on Actual Fund Return | $1,000.00 | $988.80 | 1.19% | $5.97 | ||||
| Based on Hypothetical 5% Return (before expenses) | $1,000.00 | $1,019.21 | 1.19% | $6.06 |
113
| WESTWOOD FUNDS |
| Ending | ||||||||
| Beginning | Account Value | Expenses Paid | ||||||
| Account Value | October 31, | Net Expense | During | |||||
| May 1, 2022 | 2022 | Ratio (a) | Period (b) | |||||
| Alternative Income Fund (continued) | ||||||||
| Ultra Shares | ||||||||
| Based on Actual Fund Return | $1,000.00 | $994.00 | 0.20% | $1.01 | ||||
| Based on Hypothetical 5% Return (before expenses) | $1,000.00 | $1,024.20 | 0.20% | $1.02 | ||||
| SmallCap Growth Fund | ||||||||
| Institutional Share Class | ||||||||
| Based on Actual Fund Return | $1,000.00 | $943.10 | 0.50% | $2.45 | ||||
| Based on Hypothetical 5% Return (before expenses) | $1,000.00 | $1,022.68 | 0.50% | $2.55 |
| (a) | Annualized, based on each Fund’s most recent one-half year expenses. |
| (b) | Expenses are equal to each Fund’s annualized net expense ratio multiplied by the average account value over the period, multiplied by 184/365 (to reflect the one-half year period), for Actual and Hypothetical Return information, respectively. |
114
| WESTWOOD FUNDS |
| OTHER INFORMATION (Unaudited) |
The Trust files a complete listing of portfolio holdings for the Funds with the U.S. Securities and Exchange Commission (“SEC”) as of the end of the first and third quarters of each fiscal year as an exhibit to its report on Form N-PORT. The filings are available upon request, by calling 1-877-386-3944. Furthermore, you may obtain a copy of these filings on the SEC’s website at www.sec.gov.
A description of the policies and procedures that the Funds use to vote proxies relating to portfolio securities is available without charge upon request by calling toll-free 1-877-386-3944, or on the SEC’s website at www.sec.gov. Information regarding how the Funds voted proxies relating to portfolio securities during the period ended June 30, 2022 will be available on or about August 31, 2022 without charge upon request by calling 1-877-386-3944, or on the SEC’s website at www.sec.gov.
| OTHER FEDERAL TAX INFORMATION (Unaudited) |
For the fiscal year ended October 31, 2022, the Fund designated the following as long-term capital gain distributions.
| Long term | ||||
| capital gain | ||||
| Value Fund | $ | 31,247,826 | ||
| SMID Cap Fund | 29,174,952 | |||
| Quality Small Cap Fund | 24,668,817 | |||
| Total Return Fund | 4,863,716 | |||
| Income Opportunity Fund | 40,005,156 | |||
| Alternative Income Fund | 465,370 | |||
Qualified Dividend Income – The Fund designates the following of its ordinary income dividends, or up to the maximum amount of such dividends allowable pursuant to the Internal Revenue Code, as qualified dividend income eligible for the reduced tax rate of 15%.
| Qualified | ||||
| Dividend | ||||
| Income | ||||
| Value Fund | 88.60 | % | ||
| SMID Cap Fund | 71.63 | % | ||
| Quality Small Cap Fund | 35.06 | % | ||
| Quality AllCap Fund | 50.83 | % | ||
| Total Return Fund | 28.11 | % | ||
| Income Opportunity Fund | 28.90 | % | ||
| High Income Fund | 14.45 | % | ||
| SmallCap Growth Fund | 8.55 | % | ||
Dividends Received Deduction – Corporate shareholders are generally entitled to take the dividends received deduction on the portion of the Fund’s dividend distributions that qualifies under tax law. For the fiscal year ended
115
| WESTWOOD FUNDS |
October 31, 2022 the following Funds had the following ordinary income dividends qualified for the corporate dividends received deduction. For the fiscal year ended October 31, 2022, Quality SmallCap Fund had qualified business income 0.39%.
| Dividend | ||||
| Received | ||||
| Fund | Deduction | |||
| Value Fund | 87.99 | % | ||
| SMID Cap Fund | 71.33 | % | ||
| Quality Small Cap Fund | 61.80 | % | ||
| Quality AllCap Fund | 50.83 | % | ||
| Total Return Fund | 27.88 | % | ||
| Income Opportunity Fund | 28.95 | % | ||
| High Income Fund | 13.65 | % | ||
| SmallCap Growth Fund | 11.69 | % | ||
116
| WESTWOOD FUNDS |
| TRUSTEES AND OFFICERS OF ULTIMUS MANAGERS TRUST (Unaudited) |
The Board has overall responsibility for management of the Trust’s affairs. The Trustees serve during the lifetime of the Trust and until its termination, or until death, resignation, retirement, or removal. The Trustees, in turn, elect the officers of the Fund to actively supervise their day-to-day operations. The officers have been elected for an annual term. Each Trustee’s and officer’s address is 225 Pictoria Drive, Suite 450, Cincinnati, Ohio 45246. The following are the Trustees and executive officers of the Fund:
| Name and Year of Birth | Length of Time Served | Position(s) Held with Trust | Principal Occupation(s) During Past 5 Years | Number of Funds in Trust Overseen by Trustee | Directorships of Public Companies Held by Trustee During Past 5 Years |
| Interested Trustees: | |||||
| David R. Carson* Year of Birth: 1958 | Trustee Since 2021 Officer Since 2013 | Trustee (2021 to present)
Vice President (2021 to present; and previously April 2013 to October 2013)
President and Principal Executive Officer of each of its series (2013 to 2021) | Vice President and Director of Client Strategies of Ultimus Fund Solutions, LLC (2013 to present); President of Unified Series Trust (2017 to present). | 32 | Interested Trustee of 21 series of the Unified Series Trust (a registered management company) (2020 to present). |
| Independent Trustees: | |||||
| Janine L. Cohen Year of Birth: 1952 | Since 2016 | Chairperson (2019 to present)
Trustee (2016 to present) | Retired since 2013; previously Chief Financial Officer from 2004 to 2013 and Chief Compliance Officer from 2008 to 2013 at AER Advisors, Inc. | 32 | none |
| David M. Deptula Year of Birth: 1958 | Since 2012 | Trustee | Vice President of Legal and Special Projects at Dayton Freight Lines, Inc. since February 2016. | 32 | none |
| Jacqueline A. Williams Year of Birth: 1954 | Since 2019 | Trustee | Managing Member of Custom Strategy Consulting, LLC (2017 to present); Managing Director of Global Investment Research (2005 to 2017), Cambridge Associates, LLC. | 32 | none |
| Clifford N. Schireson Year of Birth: 1953 | Since 2019 | Trustee | Retired; Founder of Schireson Consulting, LLC (2017 to present); Director of Institutional Services for Brandes Investment Partners, LP (2004-2017). | 32 | Trustee of the San Diego City Employees’ Retirement System (2019 to present). |
| Robert E. Morrison Year of Birth: 1957 | Since 2019 | Trustee | Managing Director, Midwest Trust and FCI Advisors (2022 to present); Senior Vice President and National Practice Lead for Investment, Huntington National Bank/ Huntington Private Bank (2014 to 2022); CEO, CIO, President of 5 Star Investment Management Company (2006 to 2014). | 32 | none |
| * | Mr. Carson is considered an “interested person” of the Trust within the meaning of Section 2(a)(19) of the 1940 Act because of his relationship with the Trust’s administrator, transfer agent, and distributor. Mr. Carson was President of the Trust from October 2013 to January 2021 and Vice President of the Trust from April 2013 to October 2013. |
117
| WESTWOOD FUNDS |
| TRUSTEES AND OFFICERS OF ULTIMUS MANAGERS TRUST (Unaudited) |
| Name and Year of Birth | Length of Time Served | Position(s) Held with Trust | Principal Occupation(s) During Past 5 Years |
| Executive Officers: | |||
| Todd E. Heim Year of Birth: 1967 | Since 2014 | President (2021 to present)
Vice President (2014 to 2021) | Vice President, Relationship Management (2018 to present) and Assistant Vice President, Client Implementation Manager of Ultimus Fund Solutions, LLC (2014 to 2018); Naval Flight Officer in United States Navy (1989 to 2017). |
| Jennifer L. Leamer Year of Birth: 1976 | Since 2014 | Treasurer (2014 to present)
Assistant Treasurer (April 2014 to October 2014) | Senior Vice President, Fund Accounting of Ultimus Fund Solutions, LLC (2014 to present). |
| Daniel D. Bauer Year of Birth: 1977 | Since 2016 | Assistant Treasurer (2016 to present) | Vice President, Fund Accounting (2022 to present) and Assistant Vice President, Fund Accounting of Ultimus Fund Solutions, LLC (2015 to 2022). |
| Angela A. Simmons Year of Birth: 1975 | Since 2022 | Assistant Treasurer (2022 to present) | Vice President, Financial Administration (2022 to present) and Assistant Vice President, Financial Administration (2015 to 2022) of Ultimus Fund Solutions, LLC. |
| Khimmara Greer Year of Birth: 1983 | Since 2021 | Secretary (2021 to present) | Vice President and Senior Legal Counsel of Ultimus Fund Solutions, LLC (2021 to present); Vice President, Asset Servicing – Regulatory Administration of The Bank of New York Mellon (2019 to 2021); Vice President and Counsel of State Street Bank and Trust Company (2015 to 2019). |
| David K. James Year of Birth: 1970 | Since 2021 | Assistant Secretary (2021 to present)
Secretary (2021 to 2021) | Executive Vice President and Chief Legal and Risk Officer of Ultimus Fund Solutions, LLC (2018 to present); Managing Director and Managing Counsel of State Street Bank and Trust Company (2009 to 2018). |
| Natalie S. Anderson Year of Birth: 1975 | Since 2016 | Assistant Secretary (2016 to present) | Legal Administration Manager (July 2016 to present) and Paralegal (January 2015 to June 2016) of Ultimus Fund Solutions, LLC. |
| Gweneth Gosselink Year of Birth: 1955 | Since 2020 | Chief Compliance Officer (2020 to present) | Assistant Vice President, Senior Compliance Officer of Ultimus Fund Solutions, LLC (December 2019 to present); CCO Consultant at GKG Consulting, LLC (December 2019 to present); Chief Operating Officer & CCO at Miles Capital, Inc. (June 2013 to December 2019). |
| Martin Dean Year of Birth: 1963 | Since 2019 | Assistant Chief Compliance Officer (2020 to present)
Interim Chief Compliance Officer (October 2019 to January 2020)
Assistant Chief Compliance Officer (2016 to 2017) | Senior Vice President, Head of Fund Compliance (February 2020 to present); Vice President & Director of Fund Compliance of Ultimus Fund Solutions, LLC (January 2016 to January 2020). |
Additional information about members of the Board and executive officers is available in the Fund’s Statement of Additional Information (“SAI”). To obtain a free copy of the SAI, please call toll free 1-877-FUND-WHG (1-877-386-944).
118
[This Page Intentionally Left Blank]
[This Page Intentionally Left Blank]
| The Westwood Funds |
| P.O. Box 541150 |
| Omaha, NE 68154 |
| 1-877-FUND-WHG |
| www.westwoodfunds.com |
| Adviser: |
| Westwood Management Corp. |
| 200 Crescent Court, Suite 1200 |
| Dallas, TX 75201 |
| Distributor: |
| Ultimus Fund Distributors, LLC |
| 225 Pictoria Drive |
| Suite 450 |
| Cincinnati, OH 45246 |
| Administrator: |
| Ultimus Fund Solutions, LLC |
| 225 Pictoria Drive |
| Suite 450 |
| Cincinnati, OH 45246 |
| Legal Counsel: |
| Kilpatrick Townsend & Stockton LLP |
| 4208 Six Forks Road |
| Suite 1400 |
| Raleigh, NC 27609 |
| Independent Registered Public Accounting Firm: |
| BBD, LLP |
| 1835 Market Street, 3rd Floor |
| Philadelphia, PA 19103 |
| This information must be preceded or accompanied by a current |
| prospectus for the Funds. |
Westwood-AR-22
| (b) | Not applicable |
Item 2. Code of Ethics.
(a) As of the end of the period covered by the report, the registrant has adopted a code of ethics that applies to the registrant’s Principal Executive Officer and Principal Financial Officer.
(b) Not applicable.
(c) During the period covered by the report, with respect to the registrant's code of ethics that applies to its Principal Executive Officer and Principal Financial Officer: there have been no amendments to a provision that relates to any element of the code of ethics definition enumerated in paragraph (b) of this Item 2.
(d) During the period covered by the report, with respect to the registrant's code of ethics that applies to its Principal Executive Officer and Principal Financial Officer: there have been no waivers granted from a provision that relates to any element of the code of ethics definition enumerated in paragraph (b) of this Item 2.
(e) Not applicable.
(f) The registrant has included a copy of the code of ethics that applies to the registrant’s Principal Executive Officer and Principal Financial Officer. This code of ethics is included as an Exhibit on this Form N-CSR.
Item 3. Audit Committee Financial Expert.
(a)The registrant’s board of trustees has determined that the registrant has at least one audit committee financial expert serving on its audit committee. The name of the audit committee financial expert is Janine L. Cohen. Ms. Cohen is “independent” for purposes of this Item.
Item 4. Principal Accountant Fees and Services.
(a) Audit Fees billed to the registrant by its principal accountants for the two most recent fiscal years:
Fiscal year ended 2022: $123,500
Fiscal year ended 2021: $22,000
(b) Audit-Related Fees billed to the registrant by its principal accountants for the two most recent fiscal years:
Fiscal year ended 2022: $0
Fiscal year ended 2021: $0
(c) Tax Fees billed to the registrant by its principal accountants for the two most recent fiscal years:
Fiscal year ended 2022: $30,000
Fiscal year ended 2021: $6,000
Fees for 2022 and 2021 related to the review of the registrant's tax returns. Amount requiring approval of the registrant's audit committee pursuant to paragraph (c)(7)(ii) of Rule 2-01 of Regulation S-X, $0 and $0 respectively.
(d) All other fees billed to the registrant by its principal accountants for the two most recent fiscal years:
Fiscal year ended 2022: $0
Fiscal year ended 2021: $0
Amount requiring approval of the registrant's audit committee pursuant to paragraph (c)(7)(ii) of Rule 2-01 of Regulation S-X, $0 and $0 respectively.
(e)(1) Disclose the audit committee’s pre-approval policies and procedures described in paragraph (c)(7) of Rule 2-01 of Regulation S-X
The Board has an Audit Committee that consists of all the Trustees who are not “interested persons” of the Trust within the meaning of the 1940 Act. The Audit Committee’s responsibilities include:
| (i) | recommending to the Board the selection, retention or termination of the Trust’s independent auditors; |
| (ii) | reviewing with the independent auditors the scope, performance and anticipated cost of their audit; |
| (iii) | discussing with the independent auditors certain matters relating to the Trust’s financial statements, including any adjustment to such financial statements recommended by such independent auditors, or any other results of any audit; |
| (iv) | reviewing on a periodic basis a formal written statement from the independent auditors with respect to their independence, discussing with the independent auditors any relationships or services disclosed in the statement that may impact the objectivity and independence of the Trust’s independent auditors and recommending that the Board take appropriate action in response thereto to satisfy itself of the auditor’s independence; and (v) considering the comments of the independent auditors and management’s responses thereto with respect to the quality and adequacy of the Trust’s accounting and financial reporting policies and practices and internal controls. The Audit Committee operates pursuant to an Audit Committee Charter. |
��
(e)(2) The percentage of services described in each of paragraphs (b) through (d) of this Item that were approved by the audit committee pursuant to paragraph (c)(7)(i)(C) of Rule 2-01 of Regulation S-X are as follows:
(b) 0%
(c) 0%
(d) 0%
(f) The percentage of hours expended on the principal accountant’s engagement to audit the registrant’s financial statements for the most recent fiscal year that were attributed to work performed by persons other than the principal accountant’s full-time, permanent employees was 0%.
(g) During the fiscal years ended October 31, 2022 and October 31, 2022, aggregate non-audit fees of $30,000 and $6,000, respectively, were billed by the registrant’s accountant for services rendered to the registrant. No non-audit fees were billed in the fiscal years by the registrant’s accountant for services rendered to the registrant’s investment adviser (not including any sub-adviser whose role is primarily portfolio management and is subcontracted with or overseen by another investment adviser), and any entity controlling, controlled by, or under common control with the adviser that provides ongoing services to the registrant.
(h) The registrant’s audit committee of the board of directors has considered whether the provision of non-audit services that were rendered to the registrant’s investment adviser (not including any sub-adviser whose role is primarily portfolio management and is subcontracted with or overseen by another investment adviser), and any entity controlling, controlled by, or under common control with the investment adviser that provides ongoing services to the registrant that were not pre-approved pursuant to paragraph (c)(7)(ii) of Rule 2-01 of Regulation S-X is compatible with maintaining the principal accountant’s independence.
(i) Not applicable.
(j) Not applicable.
Item 5. Audit Committee of Listed Companies.
Not applicable.
Item 6. Schedule of Investments. Schedules filed with Item 1.
Item 7. Disclosure of Proxy Voting Policies and Procedures for Closed-End Management Investment Companies.
Not applicable.
Item 8. Portfolio Managers of Closed-End Investment Companies.
Not applicable.
Item 9. Purchases of Equity Securities by Closed-End Management Investment Company and Affiliated Purchasers.
Not applicable.
Item 10. Submission of Matters to a Vote of Security Holders.
The guidelines applicable to shareholders desiring to submit recommendations for nominees to the Registrant's board of trustees are contained in the statement of additional information of the Trust with respect to the Fund(s) for which this Form N-CSR is being filed.
Item 11. Controls and Procedures.
(a) Based on their evaluation of the registrant’s disclosure controls and procedures (as defined in Rule 30a-3(c) under the Investment Company Act of 1940, as amended (the “Act”)) as of a date within 90 days of the filing date of this report, the registrant’s principal executive officer and principal financial officer have concluded that such disclosure controls and procedures are reasonably designed and are operating effectively to ensure that material information relating to the registrant is made known to them by others within those entities, particularly during the period in which this report is being prepared, and that the information required in filings on Form N-CSR is recorded, processed, summarized, and reported on a timely basis.
(b) There were no changes in the registrant’s internal control over financial reporting (as defined in Rule 30a-3(d) under the Investment Company Act of 1940) that occurred during the period covered by this report that have materially affected, or are reasonably likely to materially affect, the registrant’s internal control over financial reporting.
Item 12. Disclosure of Securities Lending Activities for Closed-End Management Investment Companies.
Not applicable.
Item 13. Exhibits.
(a)(1) Any code of ethics, or amendment thereto, that is the subject of the disclosure required by Item 2, to the extent that the registrant intends to satisfy the Item 2 requirements through filing of an exhibit:
(a)(2) A separate certification for each principal executive officer and principal financial officer of the registrant as required by Rule 30a-2(a) under the Act (17 CFR 270.30a-2(a)):
(a)(3) Any written solicitation to purchase securities under Rule 23c-1 under the Act (17 CFR 270.23c-1) sent or given during the period covered by the report by or on behalf of the registrant to 10 or more persons:
Not applicable
(a)(4) Change in the registrant’s independent public accountants:
Not applicable
(b) Certifications required by Rule 30a-2(b) under the Act (17 CFR 270.30a-2(b)): Attached hereto
| Exhibit 99.CERT | Certifications required by Rule 30a-2(a) under the Act |
| Exhibit 99.906CERT | Certification required by Rule 30a-2(b) under the Act |
SIGNATURES
Pursuant to the requirements of the Securities Exchange Act of 1934 and the Investment Company Act of 1940, the registrant has duly caused this report to be signed on its behalf by the undersigned, thereunto duly authorized.
| (Registrant) | Ultimus Managers Trust | ||
| By (Signature and Title)* | /s/ Todd E. Heim | ||
Todd E. Heim, President
| |||
| Date | 1/9/2023 | ||
| Pursuant to the requirements of the Securities Exchange Act of 1934 and the Investment Company Act of 1940, this report has been signed below by the following persons on behalf of the registrant and in the capacities and on the dates indicated. | |||
| By (Signature and Title)* | /s/ Todd E. Heim | ||
Todd E. Heim Principal Executive Officer | |||
| Date | 1/9/2023 | ||
| By (Signature and Title)* | /s/ Jennifer L. Leamer | ||
| Jennifer L. Leamer, Treasurer and Principal Financial Officer | |||
| Date | 1/9/2023 | ||
* Print the name and title of each signing officer under his or her signature.