UNITED STATES
SECURITIES AND EXCHANGE COMMISSION
Washington, D.C. 20549
FORM 10-K
| | | | | | | | | | | |
| (Mark One) | | | |
| ☒ | ANNUAL REPORT PURSUANT TO SECTION 13 OR 15(d) OF THE SECURITIES EXCHANGE ACT OF 1934 |
| | For the fiscal year ended | December 29, 2024 | |
| or |
| ☐ | TRANSITION REPORT PURSUANT TO SECTION 13 OR 15(d) OF THE SECURITIES EXCHANGE ACT OF 1934 |
| | For the transition period from ______ to ______ |
Commission File Number: 001-35625
BLOOMIN’ BRANDS, INC.
(Exact name of registrant as specified in its charter)
| | | | | | | | | | | | | | |
| Delaware | | | | 20-8023465 |
| (State or other jurisdiction of incorporation or organization) | | | | (I.R.S. Employer
Identification No.) |
2202 North West Shore Boulevard, Suite 500, Tampa, FL 33607
(Address of principal executive offices) (Zip Code)
(813) 282-1225
(Registrant’s telephone number, including area code)
Securities registered pursuant to Section 12(b) of the Act:
| | | | | | | | | | | | | | | | | |
| Title of each class | | Trading Symbol(s) | | Name of each exchange on which registered |
| Common Stock | $0.01 par value | | BLMN | | The Nasdaq Stock Market LLC (Nasdaq Global Select Market) |
Securities registered pursuant to Section 12(g) of the Act: None
Indicate by check mark if the registrant is a well-known seasoned issuer, as defined in Rule 405 of the Securities Act. Yes ☒ No ☐
Indicate by check mark if the registrant is not required to file reports pursuant to Section 13 or Section 15(d) of the Act. Yes ☐ No ☒
Indicate by check mark whether the registrant (1) has filed all reports required to be filed by Section 13 or 15(d) of the Securities Exchange Act of 1934 during the preceding 12 months (or for such shorter period that the registrant was required to file such reports), and (2) has been subject to such filing requirements for the past 90 days. Yes ☒ No ☐
Indicate by check mark whether the registrant has submitted electronically every Interactive Data File required to be submitted pursuant to Rule 405 of Regulation S-T (§232.405 of this chapter) during the preceding 12 months (or for such shorter period that the registrant was required to submit such files). Yes ☒ No ☐
Indicate by check mark whether the registrant is a large accelerated filer, an accelerated filer, a non-accelerated filer, a smaller reporting company or an emerging growth company. See the definitions of “large accelerated filer,” “accelerated filer,” “smaller reporting company” and “emerging growth company” in Rule 12b-2 of the Exchange Act.
Large Accelerated Filer ☒ Accelerated Filer ☐ Non-accelerated Filer ☐
Smaller Reporting Company ☐ Emerging Growth Company ☐
If an emerging growth company, indicate by check mark if the registrant has elected not to use the extended transition period for complying with any new or revised financial accounting standards provided pursuant to Section 13(a) of the Exchange Act. ☐
Indicate by check mark whether the registrant has filed a report on and attestation to its management’s assessment of the effectiveness of its internal control over financial reporting under Section 404(b) of the Sarbanes-Oxley Act (15 U.S.C. 7262(b)) by the registered public accounting firm that prepared or issued its audit report. ☒
If securities are registered pursuant to Section 12(b) of the Act, indicate by check mark whether the financial statements of the registrant included in the filing reflect the correction of an error to previously issued financial statements. ☐
Indicate by check mark whether any of those error corrections are restatements that required a recovery analysis of incentive-based compensation received by any of the registrant’s executive officers during the relevant recovery period pursuant to §240.10D-1(b). ☐
Indicate by check mark whether the registrant is a shell company (as defined in Rule 12b-2 of the Act). Yes ☐ No ☒
The aggregate market value of common stock held by non-affiliates (based on the closing price on the last business day of the registrant’s most recently completed second fiscal quarter as reported on the Nasdaq Global Select Market) was $1.6 billion.
As of February 21, 2025, 84,930,752 shares of common stock of the registrant were outstanding.
DOCUMENTS INCORPORATED BY REFERENCE
Portions of the registrant’s definitive Proxy Statement for its 2025 Annual Meeting of Stockholders are incorporated by reference into Part III, Items 10-14 of this Annual Report on Form 10-K.
INDEX TO ANNUAL REPORT ON FORM 10-K
For Fiscal Year 2024
TABLE OF CONTENTS
| | | | | |
| PAGE NO. |
| PART I |
| |
| |
| |
| |
| |
| |
| |
| PART II |
| |
| |
| |
| |
| |
| |
| |
| |
| |
| PART III |
| |
| |
| |
| |
| |
| PART IV |
| |
| |
| |
PART I
Cautionary Statement
This Annual Report on Form 10-K (the “Report”) includes statements that express our opinions, expectations, beliefs, plans, objectives, assumptions or projections regarding future events or future results and therefore are, or may be deemed to be, “forward-looking statements” within the meaning of Section 27A of the Securities Act of 1933, as amended (the “Securities Act”), and Section 21E of the Securities Exchange Act of 1934, as amended (the “Exchange Act”). These forward-looking statements can generally be identified by the use of forward-looking terminology, including the terms “believes,” “estimates,” “anticipates,” “expects,” “feels,” “seeks,” “forecasts,” “projects,” “intends,” “plans,” “may,” “will,” “should,” “could” or “would” or, in each case, their negative or other variations or comparable terminology, although not all forward-looking statements are accompanied by such terms. These forward-looking statements include all matters that are not historical facts. They appear in a number of places throughout this Report and include statements regarding our intentions, beliefs or current expectations concerning, among other things, our results of operations, financial condition, liquidity, prospects, growth, strategies and the industry in which we operate.
By their nature, forward-looking statements involve risks and uncertainties because they relate to events and depend on circumstances that may or may not occur in the future. Although we base these forward-looking statements on assumptions that we believe are reasonable when made, we caution you that forward-looking statements are not guarantees of future performance and that our actual results of operations, financial condition and liquidity, and industry developments may differ materially from statements made in or suggested by the forward-looking statements contained in this Report. In addition, even if our results of operations, financial condition and liquidity, and industry developments are consistent with the forward-looking statements contained in this Report, those results or developments may not be indicative of results or developments in subsequent periods. Important factors that could cause actual results to differ materially from statements made or suggested by forward-looking statements include, but are not limited to, those described in the “Risk Factors” section of this Report and the following:
(i)Consumer reactions to public health and food safety issues;
(ii)Minimum wage increases, additional mandated employee benefits and fluctuations in the cost and availability of employees;
(iii)Our ability to recruit and retain high-quality leadership, restaurant-level management and team members;
(iv)Economic and geopolitical conditions and their effects on consumer confidence and discretionary spending, consumer traffic, the cost and availability of credit and interest rates;
(v)Our ability to compete in the highly competitive restaurant industry with many well-established competitors and new market entrants;
(vi)Our ability to protect our information technology systems from interruption or security breach, including cybersecurity threats, and to protect consumer data and personal employee information;
(vii)Fluctuations in the price and availability of commodities, including supplier freight charges and restaurant distribution expenses, and other impacts of inflation and our dependence on a limited number of suppliers and distributors to meet our beef, pork, chicken and other major product supply needs;
(viii)Our ability to preserve and grow the reputation and value of our brands, particularly in light of changes in consumer engagement with social media platforms and limited control with respect to the operations of our franchisees;
(ix)The effects of international economic, political and social conditions and legal systems on our foreign operations and on foreign currency exchange rates;
(x)The impacts of our operations in Brazil as a minority investor and franchisor following our recent sale transaction on our future results;
(xi)Our ability to comply with corporate citizenship and sustainability reporting requirements and investor expectations or our failure to achieve any goals, targets or objectives that we establish with respect to corporate citizenship and sustainability matters;
(xii)Our ability to effectively respond to changes in patterns of consumer traffic, including by maintaining relationships with third-party delivery apps and services, consumer tastes and dietary habits;
(xiii)Our ability to comply with governmental laws and regulations, the costs of compliance with such laws and regulations and the effects of changes or uncertainty with respect to applicable laws and regulations, including tax laws and unanticipated liabilities, and the impact of any litigation;
(xiv)Our ability to implement our remodeling, relocation and expansion plans, due to uncertainty in locating and acquiring attractive sites on acceptable terms, obtaining required permits and approvals, recruiting and training necessary personnel, obtaining adequate financing and estimating the performance of newly opened, remodeled or relocated restaurants, and our cost savings plans to enable reinvestment in our business, due to uncertainty with respect to macroeconomic conditions and the efficiency that may be added by the actions we take;
(xv)Seasonal and periodic fluctuations in our results and the effects of significant adverse weather conditions and other disasters or unforeseen events;
(xvi)The effects of our leverage and restrictive covenants in our various credit facilities on our ability to raise additional capital to fund our operations, to make capital expenditures to invest in new or renovate restaurants and to react to changes in the economy or our industry; and
(xvii)Any impairment in the carrying value of our goodwill or other intangible or long-lived assets and its effect on our financial condition and results of operations.
Given these risks and uncertainties, we caution you not to place undue reliance on these forward-looking statements. Any forward-looking statement that we make in this Report speaks only as of the date of such statement, and we undertake no obligation to update any forward-looking statement or to publicly announce the results of any revision to any of those statements to reflect future events or developments. Comparisons of results for current and any prior periods are not intended to express any future trends or indications of future performance, unless specifically expressed as such, and should only be viewed as historical data.
Item 1. Business
Bloomin’ Brands, Inc. (“Bloomin’ Brands,” the “Company,” “we,” “us,” and “our” and similar terms mean Bloomin’ Brands, Inc. and its subsidiaries except where the context otherwise requires) is one of the largest casual dining restaurant companies in the world, with a portfolio of leading, differentiated restaurant concepts. Our restaurant portfolio includes Outback Steakhouse, Carrabba’s Italian Grill, Bonefish Grill and Fleming’s Prime Steakhouse & Wine Bar. Our restaurant concepts range in price point and degree of formality from casual (Outback Steakhouse and Carrabba’s Italian Grill) to polished casual (Bonefish Grill) and fine dining (Fleming’s Prime Steakhouse & Wine Bar). OSI Restaurant Partners, LLC (“OSI”), a wholly-owned subsidiary of Bloomin’ Brands, is our primary operating entity.
MARKETS
As of December 29, 2024, we owned and operated 1,172 restaurants and franchised 291 restaurants across 46 states, Guam and 12 countries. Subsequent to December 29, 2024, we completed the sale of the majority ownership of our Brazil operations, and all restaurants in that market are now operated as unconsolidated franchisees. See International Franchise Segment discussion below for details.
Our Segments
We consider each of our U.S. restaurant concepts and international franchise markets in aggregate to be operating segments, which reflects how we manage our business, review operating performance and allocate resources. We aggregate our U.S. operating segments into the U.S. reportable segment. The U.S. segment includes all restaurants operating in the U.S. while franchised restaurants operating outside the U.S. are included in the international franchise segment. Following is a summary of reportable segments as of December 29, 2024:
| | | | | | | | | | | | | | |
| REPORTABLE SEGMENT | | CONCEPT | | GEOGRAPHIC LOCATION |
| U.S. (1) | | Outback Steakhouse | | United States of America |
| Carrabba’s Italian Grill | |
| Bonefish Grill | |
| Fleming’s Prime Steakhouse & Wine Bar | |
| International Franchise (2) | | Outback Steakhouse | | 12 Franchise Markets |
| Carrabba’s Italian Grill (Abbraccio) | |
_________________
(1)Includes franchise locations.
(2)See Item 2. Properties for disclosure of our restaurant count by country and territory. Subsequent to December 29, 2024, we completed the sale of the majority ownership of our Brazil operations. All restaurants in that market now operate as unconsolidated franchisees and Brazil is included in our franchise market count. See International Franchise Segment discussion below for details.
U.S. Segment
As of December 29, 2024, in our U.S. segment, we owned and operated 970 restaurants and franchised 146 restaurants across 46 states.
Outback Steakhouse - Outback Steakhouse is a casual steakhouse restaurant concept focused on steaks, bold flavors and Australian decor. The Outback Steakhouse menu offers seasoned and seared grilled steaks, chops, chicken, seafood, pasta, salads and seasonal specials. The menu also offers a selection of specialty appetizers, including our signature Bloomin’ Onion®, and desserts, together with full bar service.
Carrabba’s Italian Grill - Offering authentic Italian cuisine passed down from its founders’ family recipes, Carrabba’s Italian Grill uses high-quality ingredients to prepare fresh and handmade dishes cooked to order in a lively exhibition kitchen. Featuring a wood-burning grill inspired by the many tastes of Italy, guests can enjoy signature dishes such as Chicken Bryan and Pollo Rosa Maria, wood-fire grilled steaks and chops, small plates and classic Italian pasta dishes in a welcoming, contemporary atmosphere.
Bonefish Grill - Bonefish Grill specializes in fish from around the world, hand-cut in-house every day, savory wood-grilled specialties, and locally created, seasonal Partner Selection dishes featuring high-quality and fresh ingredients. Offering a selection of classic and signature hand-crafted cocktails, using fresh juices, edible garnishes and house infusions, Bonefish Grill also features a distinct list of wines, the perfect match for any food pairing.
Fleming’s Prime Steakhouse & Wine Bar - Fleming’s Prime Steakhouse & Wine Bar is a contemporary interpretation of the classic American steakhouse, boasting culinary mastery, signature style and unrivaled attentive service to create memorable dining experiences for guests. Fleming’s Prime Steakhouse & Wine Bar offers an impressive range of USDA Prime steaks, premium seafood entrées, storied wines and fresh hand-crafted cocktails.
International Franchise Segment
As of December 29, 2024, our international franchise segment includes 145 franchised restaurants across 11 countries and Guam. See Item 2. Properties for disclosure of our international restaurant count by country and territory.
Outback Steakhouse - Our international Outback Steakhouse restaurants have a menu similar to our U.S. menu with a focus on signature steaks, including the traditional Outback Special sirloin. There is additional menu item variety to meet local taste preferences.
Carrabba’s Italian Grill (Abbraccio Cucina Italiana) - Abbraccio Cucina Italiana, our international Carrabba’s Italian Grill restaurant concept, offers a blend of traditional and modern Italian dishes. The menu varies, with additional pasta and pizza offerings, to account for local tastes and customs. Abbraccio Cucina Italiana also has a range of beverage options, including classically inspired cocktails and local favorites with an Italian twist.
On December 30, 2024, we sold 67% of our Brazil operations (the “Brazil Sale Transaction”) and retained a 33% interest. As of November 30, 2024, there were 192 restaurants operating in Brazil. Following the sale, restaurants that were formerly Company-owned now operate as unconsolidated franchisees. See Note 3 - Discontinued Operations of the Notes to Consolidated Financial Statements for additional details regarding the sale.
Restaurant Development
We utilize the ownership structure and market entry strategy that best fits the needs for a particular market, including Company-owned units and franchisees, as determined by demand, cost structure and economic conditions.
U.S. Development - We opportunistically pursue unit growth across our concepts through existing geography fill-in and market expansion opportunities. In recent years, we began developing our U.S. Outback Steakhouse restaurants utilizing a smaller-scaled “Joey” design. The Joey was designed to increase return on investment through a reduced restaurant footprint with a more efficient layout. Our current Joey design consists of a freestanding building with approximately 5,000 square feet and seating for approximately 190 guests. We opened 14 Outback Steakhouse restaurants during 2024 and plan to open approximately 15 additional locations in 2025.
International Development - We continue to pursue international expansion opportunities through our franchise partners, leveraging established franchised markets in South America, Asia and the Middle East, with a focus on Brazil, through our minority interest in these operations.
Remodeling - We regularly remodel restaurants across all of our concepts to maintain the relevance of our restaurants’ ambience, focused on driving additional traffic to our restaurants. We completed 65 restaurant remodels during 2024 and more than 100 restaurant remodels during 2023.
System-wide Restaurant Summary - Following is a system-wide rollforward of our restaurants during 2024:
| | | | | | | | | | | | | | | | | | | | | | | | | | | | | | | | | | | |
| DECEMBER 31,
2023 | | 2024 ACTIVITY | | DECEMBER 29,
2024 | | U.S. STATE |
| Number of restaurants: | | OPENINGS | | CLOSURES | | OTHER | | | COUNT |
| | | | | | | | | | | |
| U.S. | | | | | | | | | | | |
| Outback Steakhouse | | | | | | | | | | | |
| Company-owned | 562 | | | 14 | | | (23) | | | — | | | 553 | | | |
| Franchised | 126 | | | — | | | (4) | | | — | | | 122 | | | |
| Total | 688 | | | 14 | | | (27) | | | — | | | 675 | | | 44 |
| Carrabba’s Italian Grill | | | | | | | | | | | |
| Company-owned (1) | 198 | | | — | | | (7) | | | 1 | | | 192 | | | |
| Franchised (1) | 19 | | | — | | | — | | | (1) | | | 18 | | | |
| Total | 217 | | | — | | | (7) | | | — | | | 210 | | | 29 |
| Bonefish Grill | | | | | | | | | | | |
| Company-owned | 170 | | | — | | | (8) | | | — | | | 162 | | | |
| Franchised | 6 | | | — | | | (2) | | | — | | | 4 | | | |
| Total | 176 | | | — | | | (10) | | | — | | | 166 | | | 27 |
| Fleming’s Prime Steakhouse & Wine Bar | | | | | | | | | | | |
| Company-owned | 64 | | | — | | | (1) | | | — | | | 63 | | | 25 |
| Aussie Grill | | | | | | | | | | | |
| Company-owned | 4 | | | — | | | (4) | | | — | | | — | | | |
| Franchised | 1 | | | 1 | | | — | | | — | | | 2 | | | |
| Total | 5 | | | 1 | | | (4) | | | — | | | 2 | | | 2 |
| U.S. total | 1,150 | | | 15 | | | (49) | | | — | | | 1,116 | | | |
| International Franchise | | | | | | | | | | | |
| | | | | | | | | | | |
| | | | | | | | | | | |
| | | | | | | | | | | |
| | | | | | | | | | | |
| Outback Steakhouse - South Korea | 92 | | | 6 | | | (2) | | | — | | | 96 | | | |
| Other | 47 | | | 3 | | | (1) | | | — | | | 49 | | | |
| International Franchise total | 139 | | | 9 | | | (3) | | | — | | | 145 | | | |
| | | | | | | | | | | |
| Other - Company-owned | | | | | | | | | | | |
| Outback Steakhouse - Hong Kong/China | 19 | | | 1 | | | (10) | | | — | | | 10 | | | |
| Discontinued operations - Company-owned | | | | | | | | | | | |
| Outback Steakhouse - Brazil (2) | 155 | | | 18 | | | — | | | — | | | 173 | | | |
| Other - Brazil (2) | 17 | | | 2 | | | — | | | — | | | 19 | | | |
| | | | | | | | | | | |
| | | | | | | | | | | |
| System-wide total | 1,480 | | | 45 | | | (62) | | | — | | | 1,463 | | | |
| System-wide total - Company-owned | 1,189 | | | 35 | | | (53) | | | 1 | | | 1,172 | | | |
| System-wide total - Franchised | 291 | | | 10 | | | (9) | | | (1) | | | 291 | | | |
____________________
(1)During 2024, we purchased one franchised Carrabba’s Italian Grill location which is now operated as Company-owned.
(2)The restaurant counts for Brazil, including Abbraccio and Aussie Grill restaurants within International Company-owned Other - Brazil, are reported as of November 30, 2023 and 2024, respectively, to correspond with the balance sheet dates of this subsidiary. Following the close of the Brazil Sale Transaction on December 30, 2024, all restaurants in that market operate as unconsolidated franchisees. See Note 3 - Discontinued Operations of the Notes to Consolidated Financial Statements for further details.
Competition
The restaurant industry is highly competitive with a substantial number of restaurant operators that compete directly and indirectly with us in respect to price, service, location and food quality, and there are other well-established competitors with significant financial and other resources. There is also active competition for management personnel, attractive suitable real estate sites, supplies and restaurant employees. In addition, competition is influenced strongly by marketing and brand reputation. At an aggregate level, all major casual dining restaurants in markets in which we operate would be considered competitors of our concepts. We also face growing competition from the supermarket industry which offers expanded selections of prepared meals. Further, improving product offerings and convenience options from quick-service and fast-casual restaurants, and the expansion of home delivery services, together with negative economic conditions, could cause consumers to choose less expensive alternatives than our restaurants. Internationally, we face competition due to the number of casual dining restaurant options in the markets in which we operate.
REVENUE GENERATING ACTIVITIES
We generate our revenues from our Company-owned restaurants and through sales of franchise rights and ongoing royalties and other fees from our franchised restaurants.
Company-owned Restaurants - Company-owned restaurants are restaurants wholly-owned by us or in which we have a majority ownership. The results of operations of Company-owned restaurants are included in our consolidated operating results and the portion of income or loss attributable to the noncontrolling interests is eliminated in our Consolidated Statements of Operations and Comprehensive (Loss) Income.
Following is a summary of sales by occasion, sales mix by product type and average check per person for Company-owned restaurants during 2024:
| | | | | | | | | | | | | | | | | | | | | | | | | | | | | |
| U.S. | | |
| Occasion: | Outback
Steakhouse | | Carrabba’s
Italian Grill | | Bonefish Grill | | Fleming’s
Prime Steakhouse
& Wine Bar | | Outback Steakhouse Brazil |
| In-restaurant sales | 75 | % | | 66 | % | | 83 | % | | 96 | % | | 85 | % |
| Off-premises sales | 25 | % | | 34 | % | | 17 | % | | 4 | % | | 15 | % |
| 100 | % | | 100 | % | | 100 | % | | 100 | % | | 100 | % |
| | | | | | | | | |
| Sales mix by product type: | | | | | | | | | |
| Food & non-alcoholic beverage | 92 | % | | 90 | % | | 81 | % | | 80 | % | | 96 | % |
| Alcoholic beverage | 8 | % | | 10 | % | | 19 | % | | 20 | % | | 4 | % |
| 100 | % | | 100 | % | | 100 | % | | 100 | % | | 100 | % |
| | | | | | | | | |
| Average check per person (USD$) | $ | 29 | | | $ | 26 | | | $ | 36 | | | $ | 106 | | | $ | 12 | |
| Average check per person (R$) | | | | | | | | | R$ | 64 | |
Unaffiliated Franchise Program - Our unaffiliated franchise agreements grant third parties the right to establish and operate a restaurant using one of our concepts. Franchised restaurants are required to be operated in accordance with the franchise agreement and in compliance with their respective concept’s standards and specifications.
Under our franchise agreements, each franchisee is required to pay an initial franchise fee and monthly royalties based on a percentage of gross restaurant sales. Initial franchise fees for full-service restaurants are generally $40,000 for U.S. franchisees and range between $30,000 and $75,000 for international franchisees, depending on the market. Some franchisees may also pay advertising and administration fees based on a percentage of gross restaurant sales. Following is a summary of royalty fee percentages based on our existing unaffiliated franchise agreements:
| | | | | | | |
| (as a % of gross Restaurant sales) | MONTHLY ROYALTY FEE PERCENTAGE | | |
| U.S. franchisees (1) | 3.50% - 5.75% | | |
| International franchisees (2) | 2.75% - 5.00% | | |
| | | |
| | | |
| | | |
| | | |
_________________
(1)U.S. franchisees must also contribute a percentage of gross sales for national marketing programs and spend a certain percentage of gross sales on local advertising.
(2)International franchisees must spend a certain percentage of gross sales on local advertising, which varies depending on the market.
Effective December 31, 2023, we entered into an Amended & Restated Holistic Agreement (the “2023 Resolution Agreement”) with Cerca Trova Southwest Restaurant Group, LLC (d/b/a Out West Restaurant Group) and certain of its affiliates (collectively, “Out West”), a franchisee of 75 Outback Steakhouse restaurants in the western United States. Under the terms of the 2023 Resolution Agreement, advertising fees are reduced to 2.25% of gross sales until December 27, 2026 or upon the earlier occurrence of certain specified events, including the sale of all or substantially all of the assets or equity of Out West, bankruptcy or a liquidation event.
In connection with the closing of the Brazil Sale Transaction on December 30, 2024, we entered into amended and restated franchise agreements with all existing restaurants in Brazil for 20-year terms. Royalty rates, initial franchise fees, and local advertising spend requirements are consistent with the lower end of our other international franchise royalty range. The Brazil franchise agreements also include a development fee for each new restaurant and a fee upon renewal of the franchise agreement after the initial 20-year term. Initial franchise fees were not charged for restaurants operating in Brazil at the time of the closing.
RESOURCES
Sourcing and Supply - Our supply chain management organization is responsible for all food and operating supply purchases as well as a large percentage of purchases of field and corporate services. We address the end-to-end costs associated with the products and goods we purchase by utilizing a combination of global, regional and local suppliers to capture efficiencies and economies of scale. This “total cost of ownership” approach focuses on the initial purchase price, coupled with the cost structure underlying the procurement and order fulfillment process. We also regularly monitor commodity markets and trends to execute product purchases at the most advantageous times.
We and our franchisees have distribution programs that includes food, non-alcoholic beverage, smallwares and packaging goods. Where applicable, these programs may be managed by custom distribution companies that only provide products approved for our system. These customized relationships enable our staff to effectively manage and prioritize our supply chain needs.
Beef represents the majority of purchased proteins in the U.S. In 2024, our U.S. restaurants purchased beef raw materials primarily from four beef suppliers. Due to the nature of our industry, we expect to continue purchasing a substantial amount of beef from a small number of suppliers. Other major commodity categories purchased include seafood, pork, poultry, produce, dairy, bread, oils and pasta and energy sources to operate our restaurants, such as natural gas and electricity. The cost of such commodities may fluctuate widely due to government policy and regulation, changing weather patterns and conditions, climate change and other supply and/or demand impacting events such as pandemics, macroeconomic conditions, geopolitical events or other unforeseen circumstances.
Serving safe and high-quality food has always been our priority. We utilize both an internal food safety team responsible for supplier evaluations and external third parties who inspect supplier adherence and restaurant practices to monitor quality, food safety and product specifications. All of our restaurants implement best practices for food handling, monitoring and innovating to improve procedures. Our restaurant teams have many touch points to ensure food safety, quality and freshness through all phases of preparation.
We are committed to building long-term partnerships with suppliers who are dedicated to delivering safe, high-quality ingredients in a sustainable way. All suppliers are required to comply with our Supplier Code of Ethics and we strive to source only products that are raised in a sustainable, ethical and humane manner.
Information Systems - We leverage technology to support areas such as digital marketing and customer engagement, business analytics and decision support, restaurant operations and productivity initiatives related to optimizing our staffing, food waste management and supply chain efficiency.
To drive customer engagement, we continue to invest in data and technology infrastructure, including brand websites, digital marketing, online ordering, pay at the table technology and mobile apps. To increase customer convenience, we leverage our online ordering infrastructure to facilitate off-premises dining systems. Additionally, we maintain systems to support our customer loyalty program with a focus on increasing traffic to our restaurants.
Our integrated point-of-sale system allows us to transact business in our U.S. restaurants and communicate sales data through a secure corporate network to our enterprise resource planning system and data warehouse. Our Company-owned restaurants, and most of our franchised restaurants, are connected through a portal that provides our employees and franchise partners with access to business information and tools that allow them to collaborate, communicate, train and share information.
We maintain a system to ensure network security and safeguard against data loss. See Item 1C. Cybersecurity and Item 1A. Risk Factors for additional discussion of our cybersecurity measures.
Advertising and Marketing - We advertise through a diverse set of media channels including, but not limited to, national/spot television, radio, social media, search engines and other digital tactics. Our concepts have active public relations programs and also rely on national promotions, site visibility, local marketing, customer relationship management initiatives, direct mail, billboards and point-of-sale materials to promote our restaurants. We focus on data segmentation and personalization, customer relationship management and digital advertising to be more efficient and relevant with our advertising expenditures. Additionally, our larger international markets have teams that engage local agencies to tailor advertising to each market and develop relevant and timely promotions based on local consumer demand.
In 2023, Outback Steakhouse brought back our “No Rules, Just Right” campaign that highlights great food, top-quality dining experiences and the spirit of Australia. “No Rules, Just Right” is more than a marketing platform, it is a philosophy that puts the guest experience at the center of every decision made within Outback Steakhouse.
Our U.S. loyalty program, Dine Rewards, is designed to drive incremental traffic and provide data for customer segmentation and personalization opportunities.
Restaurant Management - The Restaurant Managing Partner has primary responsibility for the day-to-day operation of the restaurant and is required to follow Company-established operating standards. Area Operating Partners for our casual dining concepts oversee restaurant operations and Restaurant Managing Partners within a specific region. For our Outback Steakhouse and Carrabba’s Italian Grill brands, Market Vice Presidents oversee multiple Area Operating Partner regions.
In addition to base salary, Restaurant Managing Partners and Chef Partners (“Restaurant Partners”), Area Operating Partners, and Market Vice Presidents generally receive performance-based bonuses for providing management and supervisory services to their restaurants, certain of which may be based on a percentage of their restaurants’ monthly operating results or cash flows and/or total controllable income.
Trademarks - We regard our Outback®, Outback Steakhouse®, Carrabba’s Italian Grill®, Bonefish Grill® and Fleming’s Prime Steakhouse & Wine Bar® service marks and our Bloomin’ Onion® trademark as having significant value and as being important factors in the marketing of our restaurants. We have also obtained trademarks and service marks for these and several of our other menu items and various advertising slogans both in the U.S. and in other countries where we operate. We are aware of names and marks similar to the service marks of ours used by other persons in certain geographic areas in which we have restaurants. However, we believe such uses will not adversely affect us. Our policy is to, whenever possible, pursue registration of our marks in countries where we operate and to vigorously oppose any infringement of our marks. We also have registered domain names for each of our concepts.
We license the use of our registered trademarks to franchisees and third parties through franchise and license arrangements. The franchise and license arrangements restrict franchisees’ and licensees’ activities with respect to the use of our trademarks and impose quality control standards in connection with goods and services offered in connection with the trademarks.
SEASONALITY
Our business is subject to seasonal fluctuations. Historically, customer traffic patterns for our established U.S. restaurants are generally highest in the first quarter of the year and lowest in the third quarter of the year. International customer traffic patterns vary by market with Brazil historically experiencing minimal seasonal traffic fluctuations. Holidays may affect sales volumes seasonally in some of our markets. Severe storms, extended periods of inclement weather or climate change may affect the seasonal operating results of the areas impacted.
GOVERNMENT REGULATION
We are subject to various federal, state, local and international laws affecting our business. Each of our restaurants is subject to licensing and regulation by a number of governmental authorities, which may include, among others, alcoholic beverage control, health and safety agencies and environmental and fire agencies in the state, municipality or country in which the restaurant is located.
U.S. - Alcoholic beverage sales represent 11% of our U.S. restaurant sales. Alcoholic beverage control regulations require each of our restaurants to apply to a state authority and, in certain locations, county or municipal authorities for a license or permit to sell alcoholic beverages on the premises and, where applicable, a permit to provide service for extended hours, for carry-out or delivery and on Sundays. We also offer alcohol to-go from certain locations from each of our restaurant concepts.
Our restaurant operations are also subject to federal, state and local laws and regulations for such matters as:
•immigration, employment, minimum wage, overtime, tip credits, paid and unpaid leave, safety standards, worker conditions and health care;
•menu labeling and food safety;
•the Americans with Disabilities Act, which, among other things, requires our restaurants to meet federally mandated requirements for the disabled; and
•information security, data privacy, anti-corruption/anti-bribery, cashless payments and gift cards.
International - Our restaurants outside the U.S. are subject to similar regional and local laws and regulations as our U.S. restaurants, including labor, food safety, data privacy, anti-corruption/anti-bribery and information security.
See Item 1A. - Risk Factors for discussion of risks relating to federal, state, local and international regulation of our business.
HUMAN CAPITAL RESOURCES
Employees - As of December 29, 2024, we employed approximately 81,000 Team Members, of which approximately 800 are Restaurant Support Center (“RSC”) employees. This total includes approximately 14,000 Team Members in Brazil, of which approximately 250 are Brazil RSC employees. We track several workforce statistics to help us understand the gender, racial and ethnic diversity of our U.S. Team Members, including the following as of the period indicated:
| | | | | | | | | | | | | | | | | | |
| | DECEMBER 29, 2024 |
| KEY STATISTICS | | WOMEN | | | | PEOPLE OF COLOR (1) |
| | | | | | | | |
| Restaurant Support Center | | 59% | | | | 25% | | |
| Operations Leadership (2) | | 39% | | | | 33% | | |
| Hourly Team Members | | 52% | | | | 51% | | |
_________________
(1)Denotes U.S. Team Members that identify as Black/African American, Hispanic/Latinx, Asian, Native American, Pacific Islander or two or more races.
(2)Includes restaurant managers, Chef Partners, Restaurant Managing Partners, Area Operating Partners, Regional Vice Presidents and Market Vice Presidents.
In addition to gender, racial and ethnic diversity, our U.S Team Members are also diverse in age, comprised of five generations: Traditionalists, Baby Boomers, Generation X, Millennials and Generation Z.
Celebrating Our People – Team Members, guests, suppliers and communities have always been at the heart of our Company’s culture, driven each day by our founding Principles & Beliefs. We believe that creating exceptional guest experiences begins with providing a positive, supportive work environment that welcomes individual differences and allows employees to grow and have fun. We focus on developing genuine, emotional guest connections through friendly service and high-quality food.
We use surveys to seek feedback from our Team Members on a variety of topics that include, but are not limited to, confidence in leadership, our company culture and overall satisfaction with the Company. We utilize a comprehensive total rewards survey, the insights from which we are using to define our Value of Employment strategy. Annual strategic talent reviews and succession planning for executive-level roles, senior management and key restaurant leadership positions help ensure consistency in management talent quality. In 2024, approximately 91% of promotions to our Manager in Training program and to Restaurant Managing Partner were internal.
We regularly monitor and evaluate turnover and attrition metrics. During 2024, our turnover rates for U.S. hourly restaurant Team Members and U.S. restaurant management were 84% and 20%, respectively.
We are committed to high standards of ethical, moral and legal business conduct and strive to be an open and honest workplace, providing a positive work environment and fostering a culture of integrity and ethical decision-making. To support this commitment, we have a Code of Conduct that provides clear direction for behavioral expectations. We provide annual training to our Restaurant Partners, Area Operating Partners, Market Vice Presidents and RSC Team Members on our Code of Conduct, Preventing Discrimination and Harassment and Anti-Bribery and Anti-Corruption. All field-level employees are also provided Preventing Discrimination and Harassment training. In addition, we maintain an Ethics and Compliance Hotline (the “Hotline”), which includes a phone number and an online form where our Team Members can report any workplace concerns, with the option to report anonymously. The Hotline is accessible via several languages, 24 hours a day, seven days a week. We also developed an informational poster for our U.S. restaurants, in English and Spanish, which provides the phone number, the web address for the reporting form and a QR code to make it easy for our Team Members to report concerns.
We aim to cultivate a welcoming, safe and inclusive environment that celebrates diverse backgrounds. We deliver on this by ensuring Team Members are trained, understand their role in inclusivity and are held accountable in making our restaurants a place where everyone is valued for who they are and what they bring to the table.
We support words with actions by engaging with organizations dedicated to cultivating more diverse and inclusive communities. Additionally, employee-led resource groups have been instrumental in providing support, a sense of community and both personal and professional development for our Team Members.
Workplace Safety - Employee health and safety in the workplace is important to our Company. We believe that all employees, regardless of job role or title, have a shared responsibility in the promotion of health and safety in the workplace. We are committed to providing and following safety laws and rules, including internal policies and procedures. This commitment means carrying out company activities in ways that preserve and promote a clean, safe and healthy environment.
Total Rewards - Our philosophy is to motivate and retain our Team Members by offering comprehensive total rewards packages. To align Team Member objectives with our Company and ultimately our stockholders, Bloomin’ Brands offers programs that reward long-term performance. Additionally, we offer a well-rounded benefit package that includes the following, along with other benefits:
•Comprehensive health insurance coverage for Team Members working an average of 30 or more hours each week. This program includes wellness programs intended to proactively support healthcare and access to a health savings account that is eligible for employer contributions and is fully portable.
•An employee assistance program provided at no cost to all Team Members and their family members which includes virtual therapy sessions, free counseling and tools and resources in order to improve mental health and the well-being of our Team Members.
•All salaried Team Members are eligible to participate in company sponsored retirement plans with access to financial wellness resources. Eligible Team Members participating in the 401(k) receive matching contributions.
•Employee discounts when dining at any one of our brands.
•All levels of the organization, including hourly Team Members that meet certain service criteria, can qualify for paid time off for the purpose of rest, relaxation and planned time away from the workplace.
Employee Support and Community Engagement - Our commitment to our Team Members does not stop with competitive salaries, development and benefits. In 1999, we created a trust (the “Trust”) to support our Team Members in times of personal hardship. All contributions to the Trust are voluntary, employee-funded and are not solicited from suppliers, customers or friends. Due to the incredible generosity and caring nature of our Team Members, the Trust is able to make meaningful monetary support to our Team Members who experience very difficult, often unexpected and catastrophic issues, in their lives. Since 2017, the Trust has paid approximately $2.5 million in response to over 1,900 applications from Team Members who applied for support, including Team Members impacted by hurricanes and other natural disasters.
We embrace the communities we serve, from feeding first responders to supporting non-profit organizations, especially in the Tampa Bay area of Florida, home to our U.S. RSC. We are inspired by the generosity of our Team Members and encourage them to give back to their communities. To facilitate this community engagement, field Team Members volunteer within their communities and U.S. RSC Team Members participate in an annual Community Service Day. In 2024, its 16th year, Team Members volunteered over 700 hours of service at 16 non-profit organizations in the Tampa Bay area.
We strive to be good stewards of our communities and environment by engaging with organizations dedicated to supporting strong communities and sustainable environmental practices, including:
| | | | | | | | | | |
| | •Big Brothers, Big Sisters | | •U.S. Roundtable for Sustainable Beef |
| | •Boys & Girls Clubs | | •Clean Energy Buyers Association |
| | •Feeding America (Tampa Bay) | | •Animal Agriculture Alliance |
| | •Meals on Wheels | | •Habitat for Humanity |
In addition, during 2022 we implemented an annual matching gift and volunteer grant program for eligible 501(c)(3) non-profit organizations and provided a limited dollar-for-dollar match or grant for full-time U.S. RSC Team Members who made a personal charitable donation or volunteered for a minimum of ten hours during non-working hours.
Information About Our Executive Officers - Below is a list of the names, ages, positions and a brief description of the business experience of each of our executive officers as of February 21, 2025:
| | | | | | | | | | | | | | |
| NAME | | AGE | | TITLE AND RECENT BUSINESS EXPERIENCE |
| Michael Spanos | | 60 | | Chief Executive Officer and member of the Board of Directors since September 2024. Executive Vice President and Chief Operating Officer at Delta Airlines from June 2023 to August 2024. Owner of Mike Spanos Associates, a business consulting firm, from January 2022 to May 2023. President and Chief Executive Officer at Six Flags Entertainment Corporation from November 2019 to November 2021. More than 25 years at PepsiCo, Inc. in various roles including Chief Executive Officer of Asia, Middle East and North Africa, from October 2017 to November 2019. |
| W. Michael Healy | | 50 | | Chief Financial Officer and Executive Vice President, Global Business Development since April 2024. Executive Vice President, Global Business Development and Strategy from November 2023 to April 2024. Senior Vice President, President of Bonefish Grill from November 2021 to November 2023. Senior Vice President, Field Operations and Innovation from April 2021 to November 2021. Senior Vice President, Global Supply Chain Officer from February 2019 to April 2021. Group Vice President, Finance for Outback Steakhouse from May 2015 to February 2019. |
| Lissette Gonzalez | | 51 | | Executive Vice President, Chief Commercial Officer since February 2025. Executive Vice President, Chief Supply Chain and Operations Excellence Officer from October 2023 to February 2025. Senior Vice President, Global Supply Chain Officer from April 2021 to October 2023. Vice President, Global Supply Planning and Forecasting from April 2019 to April 2021. Vice President, Supply Planning and Forecasting from September 2014 to April 2019. |
| Mark Graff | | 45 | | Executive Vice President, President of Bonefish Grill and Fine Dining since November 2023. Senior Vice President, Development from April 2023 to November 2023. Senior Vice President, Development, Financial Planning & Analysis and Investor Relations from May 2021 to April 2023. Group Vice President, Corporate Finance and Investor Relations from February 2019 to May 2021. Vice President, Corporate Finance and Investor Relations from February 2016 to February 2019. Treasurer from February 2019 to November 2020. |
| Pat Hafner | | 51 | | Executive Vice President, Outback Steakhouse since January 2025. President of Carrabba’s Italian Grill from May 2022 to January 2025. Vice President of Operations, Carrabba’s Italian Grill from March 2018 to May 2022. |
| Kelly Lefferts | | 58 | | Executive Vice President, Chief Legal Officer and Secretary since July 2019. Group Vice President and U.S. General Counsel from September 2015 to July 2019. Vice President and Assistant General Counsel from January 2008 to September 2015. Ms. Lefferts has also served as Secretary since February 2016. |
| Philip Pace | | 50 | | Senior Vice President, Chief Accounting Officer since July 2022. Group Vice President and Controller from October 2015 to July 2022. Vice President, Corporate Controller from July 2013 to October 2015. |
Additional Information - We make available, free of charge, through our internet website www.bloominbrands.com, our Annual Report on Form 10-K, Quarterly Reports on Form 10-Q, Current Reports on Form 8-K, Proxy Statements and amendments to those reports filed or furnished pursuant to Section 13(a) or 15(d) of the Exchange Act, as soon as reasonably practicable after electronically filing such material with the Securities and Exchange Commission (“SEC”). Our reports and other materials filed with the SEC are also available at www.sec.gov. The reference to website addresses in this Report does not constitute incorporation by reference of the information contained on the websites and should not be considered part of this Report.
Item 1A. Risk Factors
The risk factors set forth below should be carefully considered. The risks described below are those that we believe could materially and adversely affect our business, financial condition or results of operations, however, they are not the only risks facing us. Additional risks and uncertainties not currently known to us or those we currently view to be immaterial may also materially and adversely affect our business, financial condition or results of operations.
Risks Related to the Restaurant Industry
Food safety and food-borne illness concerns in our restaurants or throughout the industry or supply chain may have an adverse effect on our business by reducing demand and increasing costs.
Regardless of the source or cause, any report of food-borne illnesses and other food safety issues, whether at one of our restaurants or in the industry or supply chain, generally could have a negative impact on our traffic and sales and adversely affect the reputation of our brands. Food safety issues could be caused by suppliers or distributors and, as a result, be out of our control and this risk may be exacerbated by supply chain issues, which could delay deliveries and necessitate alternative sourcing on short notice. Health concerns or outbreaks of disease in a food product could also reduce demand for particular menu offerings. Even instances of food-borne illness, food tampering or food contamination occurring solely at restaurants of other companies could result in negative publicity about the food service industry generally and adversely impact our sales. There is also the risk of allergen cross contamination in our restaurants despite precautionary measures to minimize the risk. Social media has dramatically increased the rate at which negative publicity, including as it relates to food-borne illnesses, can be disseminated before there is any meaningful opportunity to respond or address an issue. The occurrence of food-borne illnesses or food safety issues could also adversely affect the price and availability of affected ingredients, resulting in higher costs and lower margins.
The restaurant industry is highly competitive and consumer options for other prepared food offerings continue to expand. Our inability to compete effectively could adversely affect our business, financial condition and results of operations.
A substantial number of restaurant operators compete directly and indirectly with us with respect to price, service, location and food quality, some of which are well-established with significant resources. There is also active competition for management, team members and other personnel, and attractive suitable real estate sites. Consumer tastes, nutritional and dietary trends, traffic patterns and the type, number and location of competing restaurants often affect the restaurant business, and our competitors may react more efficiently, creatively and effectively to those conditions. In addition, our competitors may generate or better implement business strategies that improve the value and relevance of their brands and reputation, relative to ours. For example, our competitors may more successfully implement menu or technology initiatives, such as remote ordering, social media or mobile technology platforms that expedite or enhance the customer experience, or artificial intelligence to develop new customer insights. Further, we face growing competition from quick service and fast-casual restaurants, the supermarket industry and meal kit and food delivery providers, with the improvement of prepared food offerings. and the trend towards convergence in grocery, deli, delivery, retail and restaurant services. Further, if this competitive environment and the breadth of alternatives results in a decline in casual dining customer traffic, it could make our financial operations dependent on our ability to increase our market share within the hyper-competitive casual dining segment. We believe all of the above factors have increased competitive pressures in the casual dining sector in recent periods and we believe they will continue to present a challenging competitive environment in future periods. If we are unable to continue to compete effectively, our traffic, sales and margins could decline and our business, financial condition and results of operations would be adversely affected.
Failure to recruit, train and retain high-quality leadership, restaurant-level management and hourly team members may inhibit our ability to operate and grow successfully.
Our success will continue to depend, to a significant extent, on our leadership team and other key management personnel. For example, during 2024, we appointed a new chief executive officer and chief financial officer and made other changes to our senior leadership team. While these changes were reflective of ongoing succession-planning, leadership transition can create risks as individuals are integrated into new roles, onboarding shifts management attention from business concerns, we may fail to retain other key personnel, or we may lose institutional knowledge. These risks and uncertainties could result in operational and administrative inefficiencies and additional added costs, which could adversely impact our results of operations.
Further, the tight labor market in the United States has further strained and could continue to strain our ability to keep our restaurants fully staffed. If we are unable to attract and retain sufficiently experienced and capable management personnel, our business and financial results may suffer.
Our restaurant-level management and team members are largely responsible for the quality of our service. Our guests may be dissatisfied and our sales may decline if we fail to recruit, train and retain managers and team members that effectively implement our business strategy and provide high-quality guest service. There is active competition for quality management personnel and hourly team members, and such competition could require us to pay higher wages or incur higher costs for retaining and incentivizing our management personnel and hourly team members. If we experience high turnover, we may experience higher labor costs and have a shortage of adequate management personnel required for future growth. A shortage of team members also could cause our restaurants to operate with reduced staff, which could adversely affect our ability to provide high-quality guest service.
The food service industry is affected by consumer preferences and perceptions. Changes in these preferences and perceptions may lessen the demand for our products, which would reduce sales and harm our business.
Food service businesses are affected by changes in consumer tastes and demographic trends. For instance, if prevailing health or dietary preferences cause consumers to avoid steak and other products we offer in any of our concepts in favor of foods or ingredients that are perceived as healthier or otherwise reflect popular demand, our business and operating results would be harmed. Various factors such as menu labeling rules, nutritional guidelines and academic studies, whether issued by government agencies, research institutions, or advocacy organizations, may impact consumer choice and cause consumers to select foods other than those that are offered by our restaurants. Consumer preference on sourcing, or in response to environmental and animal welfare concerns may also cause some groups of consumers to select foods other than those that are offered by our restaurants. Our business may be negatively impacted by customer preferences regarding third-party delivery apps and services with which we engage, particularly if the availability, performance and reliability of the apps or services adversely impact customer satisfaction. If we are unable to anticipate or successfully respond to changes in consumer preferences, our results of operations could be adversely affected, generally or in particular concepts or markets.
If our suppliers or distributors are unable to fulfill their obligations under their contracts or we are unable to develop or maintain relationships with these or new suppliers or distributors, if needed, we could encounter supply shortages and incur higher costs.
We depend on frequent deliveries of fresh food products that meet our specifications, and we have a limited number of suppliers and distributors for our major products, such as beef. These factors subject us to the risk that shortages or interruptions in products could adversely affect the availability, quality or cost of products or require us to incur more costs to obtain adequate products if we are unable to manage supply chain risk. During 2024, we purchased more than 90% of our U.S. beef raw materials from four beef suppliers that represent a significant portion of the total beef marketplace in the U.S. Our dependence on a small number of suppliers subjects us to the risks of ingredient shortage, supply interruption, animal disease outbreak, and price volatility. An external disruption or an internal dispute could force us to sever ties with our suppliers, and we may not be able to find a suitable replacement in a timely or cost-efficient manner. Beef is a significant cost to us, and we may also incur higher costs to secure
adequate suppliers or make substantial changes to our menu offerings, at the risk of material adverse harm to our business. Due to the nature of our industry, we expect to continue to purchase a substantial amount of our beef from a small number of suppliers. Global economic factors continue to place significant pressure on suppliers, making the supply environment more expensive and causing supply chain issues. Supply shortages or disruptions caused by inclement weather, climate change, natural disasters, pandemics, armed conflict, sanctions, financial or solvency issues of our suppliers or distributors, fuel increases or other conditions beyond our control could adversely affect our operations and operating results. In recent years, climate-related issues, including drought and flooding in our key supplier region, have led to volatility in the prices of our ingredients, such as produce and meats. In addition, if any of our suppliers or distributors were unable to fulfill their responsibilities or we were unable to maintain current purchasing terms or ensure service availability and we were unable to locate substitutes in a timely manner, we may encounter supply shortages, lose consumers and experience an increase in costs in seeking alternative supplier or distribution services. The failure to develop and maintain supplier and distributor relationships and any resulting disruptions to the provision of food and other supplies to our restaurant locations could adversely affect our operating results.
Our inability or failure to recognize, respond to and effectively manage the accelerated impact of social media could have a material adverse impact on our business.
Social media allows individuals to access a broad audience of consumers and other interested persons. The availability of information on social media platforms is virtually immediate as is its impact, and users can post information often without filters or checks on the accuracy of the content posted. Adverse or inaccurate information concerning our Company or concepts may be posted at any time, and such information can quickly reach a wide audience. Social media has also been utilized to target specific companies or brands as a result of a variety of actions or inactions, or perceived actions or inactions, and such campaigns can rapidly accelerate and impact consumer behavior. The harm may be immediate without affording us an opportunity for redress or correction, and it is challenging to monitor, anticipate and promptly respond to such developments. These factors could have a material adverse effect on our business. Regardless of its basis or validity, any unfavorable publicity could adversely affect public perception of our brands.
Our failure to use social media responsibly in our marketing efforts may further expose us to these risks. As part of our marketing efforts, we rely on search engine marketing and social media platforms to attract and retain guests. We need to continuously innovate and develop our social media strategies in order to maintain broad appeal with guests and brand relevance. We also continue to invest in other digital marketing initiatives that allow us to reach our guests across multiple digital channels and build their awareness of, engagement with, and loyalty to our brands. These initiatives may not be successful, resulting in expenses incurred without the benefit of higher revenues, increased employee engagement or brand recognition. In addition, a variety of risks are associated with the use of social media, including the improper disclosure of proprietary or personal information and negative publicity. The inappropriate use of social media vehicles by our guests or employees could increase our costs, lead to litigation or result in negative publicity that could damage our reputation.
Risks Related to Government Regulation
We are subject to various federal and state employment and labor laws and regulations.
We and our vendors are subject to various employment and labor laws and regulations governing relationships with employees throughout the world and changes to laws and regulations may affect operating costs. These laws and regulations relate to matters including employment discrimination, pay transparency, minimum wage requirements, scheduling, overtime, tip credits, unemployment tax rates, workers’ compensation rates, working conditions, immigration status, tax reporting and other wage and benefit requirements. Any significant additional government regulations and new laws governing relationships with employees, including minimum wage increases, regulations relating to union organizing rights and activities, the employment status of third-party delivery drivers, mandated benefits or other requirements that impose additional obligations on us, could increase our costs and adversely affect our business and results of operations.
As a significant number of our food service and preparation personnel are paid at rates related to the applicable minimum wage, federal, state and local proposals related to minimum wage requirements or similar matters could, to the extent implemented, materially increase our labor and other costs. As minimum wage increases continue to be implemented in states in which we operate, we expect our labor costs will continue to increase. In addition, there have been in the past, and may be in the future, legislative efforts to significantly increase the federal minimum wage, which, if implemented, would materially increase our labor and other costs. Our distributors and suppliers could also be affected by higher minimum wage, benefit standards and compliance costs, which could result in higher costs for goods and services supplied to us. In addition, several U.S. jurisdictions have implemented fair workweek or “secure scheduling” legislation, which impose complex requirements related to scheduling for certain restaurant and retail employees, and additional jurisdictions are considering similar legislation. Several jurisdictions also have implemented sick pay/paid time off legislation, which requires employers to provide paid time off to employees, and “just cause” termination legislation, which restricts companies’ abilities to terminate employees unless they can prove “just cause” or a “bona fide economic reason” for the termination. Further, class action lawsuits filed pursuant to federal and state wage and hour laws may create additional material costs. We also rely on our employees to accurately disclose the full amount of their tip income, and we base our FICA tax reporting on the disclosures provided to us by such tipped employees. Inaccurate employee FICA tax reporting could subject us to monetary liabilities, which could harm our business, results of operations and financial condition.
Our failure to comply with government regulation related to our restaurant operations, and the costs of compliance or non-compliance, could adversely affect our business.
We are subject to various federal, state, local and foreign laws affecting our business. Each of our restaurants is subject to licensing and regulation by a number of governmental authorities, which may include, among others, alcoholic beverage control, food safety, nutritional menu labeling, health care, sanitation, hazardous material, building, zoning, land use, traffic, environmental and fire agencies in the state, municipality or country in which the restaurant is located. Our suppliers are also subject to regulation in some of these areas. Any difficulties or inabilities to retain or renew licenses, or increased compliance costs due to changed regulations, could adversely affect operations at existing restaurants. Additionally, difficulties in obtaining or failing to obtain the required licenses or approvals could delay or prevent the development of new restaurants. We are subject to various U.S. federal, state and international laws and regulations related to the offer and sale of franchisees. Failure to comply with these laws could adversely affect the results we generate from franchisees or otherwise impose costs on us. Alcoholic beverage sales represent ten percent of our consolidated restaurant sales and are subject to extensive state and local licensing and other regulations. The failure of a restaurant to obtain or retain a liquor license would adversely affect that restaurant’s operations. In addition, we are subject to “dram shop” statutes in certain states. These statutes generally provide a person injured by an intoxicated person the right to recover damages from an establishment that wrongfully served alcoholic beverages to the intoxicated person. We may also incur costs of and challenges in ensuring compliance with measures implemented in response to a widespread illness or a pandemic, such as requirements for physical barriers or other preventative measures in restaurants or vaccination or testing requirements for our employees, which can vary by the location of the restaurant and may continue to change. We are subject to laws relating to information security, cashless payments and consumer credit, protection and fraud.
Future laws, regulations, standards and other obligations, as well as changes in the interpretation of existing laws, regulations, standards and other obligations could impair our ability to operate our business, such as through increased compliance costs and procedures and distraction of management from other operational and strategic matters. For example, in June 2024 in Loper Bright Enterprises v. Raimondo (Loper), the Supreme Court’s holding that courts need not defer to a governmental agency’s interpretation of an ambiguous statute that it administers may result in increased challenges and changes to existing agency regulations.
The Trump administration and newly elected Congress and appointed agency chairs may seek sweeping regulatory changes. Further, the Trump administration has taken several executive actions and issued a number of executive orders in connection with, among other areas, energy production, trade, immigration and administrative agencies. The effects of these executive actions and executive orders, as well as any tandem regulatory changes pursued by the Trump administration and its appointees, are highly uncertain and may adversely impact our business.
Compliance with these laws and regulations and monitoring and addressing changes can be costly, and any failure or perceived failure to comply with these laws or any breach of our systems could harm our reputation or lead to litigation, which could adversely affect our financial condition.
Changes in tax laws, uncertainty in the judicial interpretation of those laws and unanticipated tax liabilities could adversely affect the taxes we pay and our profitability.
We are subject to income and other taxes in the United States and numerous foreign jurisdictions. Our effective income tax rate and other taxes in the future could be adversely affected by a number of factors, including changes in the mix of earnings in countries with different statutory tax rates, changes in the valuation of deferred tax assets and liabilities, an “ownership change” as defined under Section 382 of the Internal Revenue Code, changes in U.S. or foreign tax laws, including the 15% global minimum tax under the Organization for Economic Co-operation and Development (“OECD”) Pillar Two (“Pillar Two”), Global Anti-Base Erosion rules, uncertainty in the interpretation of tax laws, comprehensive tax reform measures or other legislative changes, particularly as a result of the recent U.S. elections, and the outcome of income tax audits and tax litigation, such as in Brazil. Further, differences in interpretations of Pillar Two and other rules by multiple jurisdictions may cause increased complexities as to compliance and increased audit controversy with tax authorities in jurisdictions where we operate. Although we believe our tax estimates are reasonable, the final determination of tax audits and tax litigation could be materially different from our historical income tax provisions and accruals. These results could have a material effect on our results of operations or cash flows in the period or periods for which these determinations are made. In addition, our effective income tax rate and our results may be impacted by our ability to realize deferred tax benefits, including our FICA tip credit carryforwards, and by any increases or decreases of our valuation allowances applied to our existing deferred tax assets.
If we fail to adequately address corporate citizenship and sustainability matters, it could have an adverse effect on our business, financial condition, and operating results and may damage our reputation.
In recent years, there has been an increasing focus from certain investors, customers, consumers, employees, state, federal and international governments and agencies, and other stakeholders concerning corporate citizenship and sustainability matters, including practices and disclosures related to environmental stewardship; social responsibility; diversity, equity and inclusion; and workplace rights. Companies across all industries are facing increasing scrutiny relating to their corporate citizenship and sustainability practices, including from opponents of these initiatives. We are also subject to corporate citizenship and sustainability disclosure rules and regulations and institutional investor voting policies that seek this information, making it more accessible for scrutiny. Changing consumer preferences may result in increased demands regarding our products and supply chain and their respective environmental and social impact, including on sustainability. These demands could require additional transparency, due diligence, and reporting and could cause us to incur additional costs or to make changes to our operations to comply with such demands. We may also determine that certain changes are required in anticipation of further evolution of consumer preferences and demands. Increased focus and activism related to corporate citizenship and sustainability may also result in investors reconsidering their investment decisions as a result of their assessment of a company’s corporate citizenship and sustainability practices. In addition, corporate diversity, equity and inclusion practices have recently come under increasing challenges from advocacy groups and federal and state officials through media campaigns, lawsuits and executive orders. Any failure or perceived failure by us to adequately address stakeholder expectations and legal requirements regarding corporate citizenship, including diversity, equity and inclusion, employee health, safety and welfare, and workplace rights, among others, may damage our reputation and adversely affect our business and results of operations. Further, concern over climate change and other environmental sustainability matters, has and may in the future result in new or increased legal and federal and state regulatory requirements to provide extensive disclosure regarding and to reduce or mitigate impacts to the environment, including greenhouse gas emissions, alternative energy policies, water consumption, packaging and waste management, responsible sourcing and other sustainability initiatives. For example, state, federal and international regulations on sustainability matters, including the recently enacted Climate Corporate Data Accountability Act and the Climate-Related Financial Risk Act in California, have been or may be implemented that will require reporting and third-party assurance on greenhouse gas emissions and other environmental matters.
If we fail to achieve goals, targets, or objectives we may set with respect to corporate citizenship and sustainability matters, if we do not meet or comply with new regulations or evolving consumer, investor, industry, or stakeholder expectations and standards, including those related to reporting, or if we are perceived to have not responded appropriately to the growing concern for corporate citizenship and sustainability matters, we may face legal or regulatory actions, the imposition of fines, penalties, or other sanctions, adverse publicity, and decreased demand from consumers, or the price of our common stock could decline, any of which could materially harm our reputation or have a material adverse effect on our business, financial condition, or operating results.
Risks Related to Inflation and Macroeconomic Disruption
Challenging economic, political and social conditions may have a negative effect on our business and financial results.
Challenging economic, political and social conditions may negatively impact consumer spending and thus cause a challenging sales environment in the casual dining sector and a decline in our financial results. For example, international, domestic and regional economic conditions, continued economic downturn or recession, or slowing or stalled recovery therefrom, unemployment levels, consumer income levels, financial market volatility, credit conditions and availability, consumer debt levels, inflation, increased energy prices, weakness in the housing market, stock market performance, rising interests rates, tariffs and trade barriers, pandemics or public health concerns, population growth, changes in government and central bank monetary policies, social unrest and governmental, political and budget matters may have a negative effect on consumer confidence and discretionary spending, which the restaurant industry depends upon. Further, it is difficult to predict what impact, if any, the U.S. presidential and congressional election outcomes could have on consumer confidence and discretionary spending. The effects of international trade conflicts between the U.S. and its global trade partners including, without limitation, China, Mexico and Canada, may have an adverse impact on economic conditions, commodity pricing and consumer spending. In addition, the effects on the global economy from the ongoing conflicts in Israel and Ukraine, particularly if they escalate or broaden, are uncertain. Terrorist attacks, heightened security requirements, attacks of critical infrastructure, protests, demonstrations, riots, civil disturbance, disobedience, insurrection, customer intimidation, mass shootings or social and other political unrest, such as those seen in recent years, have and may continue to result in restrictions, curfews or other actions and give rise to significant changes in regional and global economic conditions. If such events or disruptions persist for a prolonged period of time, our overall business and results of operations may be adversely affected.
In addition, it is difficult to predict what impact, if any, changes in federal policy, including tax, economic and monetary policies, will have on our industry, the economy as a whole, consumer confidence and discretionary spending. As a result, the nature, timing and impact on our business of potential changes to the current legal and regulatory frameworks are uncertain.
A decline in economic, political or social conditions or negative developments with respect to any of the other factors mentioned above, or a perception that such decline or negative developments are imminent, generally or in particular markets in which we operate, and our consumers’ reactions to these trends could result in increased pressure with respect to our pricing, traffic levels, commodity and other costs and the continuation of our innovation and productivity initiatives, which could negatively impact our business and results of operations. Further, poor economic conditions may force nearby businesses to shut down, which could cause our restaurant locations to be less attractive.
Increased commodity, energy and other costs could decrease our profit margins or cause us to limit or otherwise modify our menus or increase prices, which could adversely affect our business.
The performance of our restaurants depends on our ability to anticipate and react to changes in the price and availability of food commodities. Our business also incurs significant costs for energy, utilities, insurance, health care, labor, marketing and real estate over which we have little control. We have experienced and continue to experience the impact of inflation and fluctuations in costs on our operating expenses and anticipate the inflationary
conditions will continue in the near future. We are anticipating 2.5% to 3.5% commodity inflation for 2025, but there can be no assurance that our expectations will be accurate or that we will be able to efficiently pass through any increased costs in our prices. Increased prices or shortages could affect the cost and quality of the items we buy or require us to raise prices, limit our menu options or implement alternative processes or products. In response, customers may be less willing to patronize our restaurants in favor of our competitors or lower-priced alternatives. Prices may also be affected by supply, market changes, increased competition, changes in laws, shortages or interruptions in supply due to weather, disease or other conditions beyond our control, labor shortages, port disruptions and freight carrier stoppages, or other reasons. As a result, these events, individually or combined with other more general economic and demographic conditions, could impact our pricing and negatively affect our sales and profit margins.
Risks Related to Information Technology, Privacy and Intellectual Property
Cybersecurity breaches of confidential consumer, personal employee and other material information and other threats to our technological systems may adversely affect our business.
A cyber incident that compromises the information of our consumers or employees, whether affecting our technological systems or those of third-party service providers that we rely on, could result in widespread negative publicity, damage to the reputation of our brands, a loss of consumers, an interruption of our business and legal liabilities.
The majority of our restaurant sales are by credit or debit cards, and we maintain certain personal information regarding our employees and confidential information about our customers, franchisees and suppliers. Although we segment our card data environment and employ a cybersecurity protection program based upon industry frameworks, as well as scan and improve our environment for any threats and identify and remediate vulnerabilities, perform penetration testing and engage third parties to assess effectiveness of our security measures with oversight by our Audit Committee, there are no assurances that such programs will prevent or detect all cybersecurity breaches or technological failures.
Our operations and corporate functions rely heavily on information systems, including point-of-sale processing in our restaurants, management of our supply chain, payment of obligations, collection of cash, data warehousing to support analytics, finance and accounting systems, payroll and human resource systems, mobile technologies to enhance the customer experience and other various processes and procedures, some of which are handled by third parties. We have implemented a risk management program designed to identify and mitigate risks related to utilizing third-party vendors. The program also includes documenting audit and compliance reports to prevent these third-party vendors from negatively impacting our business operations. Our ability to efficiently and effectively manage our business depends significantly on the reliability and capacity of these systems. The failure of these systems to operate effectively, system maintenance problems, upgrading or transitioning to new platforms, or any cyber incident relating to these systems could expose our systems or information to cyber threats, result in delays in consumer service, reduced efficiency in our operations or result in negative publicity. Despite our security measures, our technology systems remain vulnerable to damage, disability or failures due to physical theft, fire, power loss, telecommunications failure or other catastrophic events, as well as from internal and external security breaches, employee error or malfeasance, denial of service, hacking, “phishing” attacks, social engineering, malware, ransomware, viruses, worms and other attacks or disruptive problems, which have increased in sophistication, frequency and duration in recent years. In addition, the rapid evolution and increased adoption of artificial intelligence technologies increases our cybersecurity risks, including generative artificial intelligence augmenting threat actors’ technological sophistication to enhance existing or to create new malware. We have been, and will continue to be, the target of cyber and other security threats and incidents, including those common to most industries and those targeting us due to the confidential consumer information we obtain through our electronic processing of credit and debit card transactions. Like other restaurants and retailers, we are also susceptible to claims for purportedly fraudulent transactions arising out of actual or alleged theft of credit or debit card information. A security breach or even a perceived security breach or failure to appropriately respond to a cyber incident could result in litigation or governmental investigation, as well as damage to our reputation and brands.
A claim or investigation resulting from a cyber or other security threat to our systems and data may have a material adverse effect on our business and distract management from running the business. Responses to cybersecurity incidents also have the potential of incurring significant remediation costs, to the extent such costs are not covered by our applicable insurance policies. As cybersecurity risks and applicable laws and regulations evolve, we may incur significant additional costs in technology, third-party services and personnel to maintain systems designed to anticipate and prevent cyber-attacks.
We are subject to a variety of continuously evolving laws and regulations regarding privacy, data protection and data security at federal, state and international levels. The California Consumer Privacy Act, for example, became effective January 1, 2020 and provides a private right of action to California residents related to data breaches and imposes disclosure and other requirements on companies with respect to their data collection, use and sharing practices as they relate to California residents. Other states and countries in which we operate have enacted, or are proposing to enact, similar laws or the laws expanding existing privacy rights. New areas of litigation related to privacy rights continue to emerge. Compliance with newly developed laws and regulations, which are subject to change and uncertain interpretations, may cause us to incur substantial costs.
Our failure or inability to enforce our trademarks or other proprietary rights could adversely affect our competitive position or the value of our brand.
Our trademarks, including Outback Steakhouse, Carrabba’s Italian Grill, Bonefish Grill, Fleming’s Prime Steakhouse & Wine Bar and Bloomin’ Onion, and other proprietary rights are important to our success and our competitive position. The protective actions that we take may not be sufficient to prevent unauthorized usage or imitation by others, which could harm our image, brand or competitive position. Furthermore, our ability to protect trademarks and other proprietary rights may be more limited in certain international markets where we operate.
Risks Related to Our Business Model and Strategy
We have limited control with respect to the operations of our franchisees, which could have a negative impact on our business.
Our franchisees are contractually obligated to operate their restaurants in accordance with our standards and we provide training and support to franchisees. However, franchisees are generally independent third parties that we do not control, and these franchisees own, operate and oversee the daily operations of their restaurants. As a result, the ultimate success and quality of any franchise restaurant rests with the franchisee. If franchisees do not successfully operate restaurants in a manner consistent with our product and service quality standards and contractual requirements, our image and reputation could be harmed, which in turn could adversely affect our business and operating results.
A significant portion of our financial results are dependent upon the operational and financial success of our franchisees. This portion will increase as a result of the sale of a majority interest in our Brazil operations, which are now operated as unconsolidated franchisees. If sales trends or economic conditions worsen for franchisees, their financial results may worsen and our royalty, rent and other fee revenues may decline. In addition, we may also incur expenses in connection with supporting franchise restaurants that are underperforming. As small businesses, some of our franchise operators may be negatively and disproportionately impacted by strategic initiatives, capital requirements, inflation, increased interest rates, labor costs, employee relations issues, or other causes. When Company-owned restaurants are sold to a franchisee, one of our subsidiaries is often required to remain responsible for lease payments for the sold restaurants to the extent the purchasing franchisees default on their leases. During periods of declining sales and profitability of franchisees, the incidence of franchisee defaults for these lease payments may increase and we may be required to make lease payments and seek recourse against the franchisee or agree to repayment terms.
Risks associated with our remodeling, relocation and expansion plans may have adverse effects on our operating results.
As part of our business strategy, we intend to continue to remodel, relocate and expand our current portfolio of restaurants. Our 2025 development schedule calls for the construction of approximately 18 to 20 new Company-owned locations. A variety of factors could cause the actual results and outcome of those plans to differ from the anticipated results, including, among other things, the selection of suitable locations for new or relocated restaurants, the availability and terms on which we can lease attractive sites for new or relocated restaurants, availability and terms of funding, recruiting, training and retaining skilled management and restaurant employees, construction or other delays, the availability of construction materials or restaurant equipment, construction and renovation costs and consumer tastes and acceptance of our restaurant concepts and awareness of our brands in new regions. Governmental regulations or other health guidelines concerning the operations of restaurants, including due to public health emergencies, may also cause disruptions in our plans.
It is difficult to estimate the performance of newly opened restaurants and whether they may attract customers away from other restaurants we own. If new or existing restaurants do not meet targeted performance, it could have a material adverse effect on our operating results, including any impairment losses that we may be required to recognize.
Some of the challenges described above could be more significant in international markets in which we have more limited experience, either generally or with a particular brand. Those markets are likely to have different competitive conditions, consumer tastes, discretionary spending patterns and brand awareness, which may cause our new restaurants to be less successful than restaurants in our existing markets or make it more difficult to estimate the performance of new restaurants.
In addition, in an effort to increase same-restaurant sales and improve our operating performance, we continue to make improvements to our facilities through remodels and relocations and close underperforming restaurants. We incur significant lease termination or continuation expenses and asset impairment and other charges when we close or relocate a restaurant. If the expenses associated with remodels, relocations or closures are higher than anticipated, we cannot find suitable locations or remodeled or relocated restaurants do not perform as expected, these initiatives may not yield the desired return on investment, which could have a negative effect on our operating results.
Failure to achieve projected cost savings from our efficiency initiatives could adversely affect our results of operations and eliminate potential funding for growth opportunities.
In recent years, we have identified strategies and taken steps to reduce operating costs and free up resources to reinvest in our business. These strategies include improved supply chain management, implementing labor scheduling tools, improvements in kitchen equipment and integrating restaurant information systems across our brands. We continue to evaluate and implement further cost-saving initiatives. However, the ability to reduce our operating costs through these initiatives is subject to risks and uncertainties, such as our ability to obtain improved supply pricing and the reliability of any new suppliers or technology, and we cannot assure that these activities, or any other activities that we may undertake in the future, will achieve the desired cost savings and efficiencies. In addition, these measures may not be sustainable or may be detrimental to continued operations. Failure to achieve such desired savings or other negative effects from cost-saving measures could adversely affect our results of operations and financial condition and curtail investment in growth opportunities.
Our success depends substantially on the value of our brands and our ability to execute innovative marketing and consumer relationship initiatives to maintain brand relevance and drive profitable sales growth.
Our success depends on our ability to preserve and grow our brands. Our brand value and reputation are especially important to differentiate our concepts in the highly competitive casual dining sector to achieve sustainable same-restaurant sales growth and warrant new unit growth. Brand value and reputation are based in large part on consumer perceptions, which are driven by both our actions and by actions beyond our control, such as new brand
strategies or their implementation, business incidents, ineffective advertising or marketing efforts, or unfavorable mainstream or social media publicity involving us, our industry, our franchisees, or our suppliers. A failure to innovate and extend our brands in ways that are relevant to consumers and occasions in order to generate sustainable same-restaurant traffic growth, and produce non-traditional sales and earnings growth opportunities, could have an adverse effect on our results of operations. Additionally, insufficient focus on our competition or failure to adequately address declines in the casual dining industry, could adversely impact results of operations.
If our competitors increase their spending on advertising, promotions and loyalty programs, if our advertising, media or marketing expenses increase, or if our advertising, promotions and loyalty programs become less effective than those of our competitors, or if we do not adequately leverage technology and data analytic capabilities needed to generate concise competitive insight, our results of operations could be materially and adversely affected.
There are risks and uncertainties associated with strategic actions and initiatives that we may implement, including not realizing the intended benefits of the Brazil Sale Transaction.
From time to time, we consider various strategic actions and initiatives in order to grow and evolve our business and brands and improve our operating results. These actions and initiatives could include, among other things, acquisitions, development or dispositions of restaurants or brands, new joint ventures, new franchise arrangements, restaurant closures and changes to our operating model. For example, in December 2024, we completed the sale of 67% of our Brazil operations, converting all restaurants in that market from directly owned and operated locations to franchised locations. There can be no assurance that any such strategic actions or initiatives will be successful or deliver their anticipated benefits. We may be exposed to new and unforeseen risks and challenges, particularly if we enter into markets or engage in activities with which we have limited or no prior experience, and it may be difficult to predict the success of such endeavors. If we incur significant expenses or divert management, financial and other resources to any initiative that is unsuccessful or does not meet our expectations, our results of operations and financial condition would be adversely affected. We may also incur significant asset impairment and other charges in connection with any such initiative. Regardless of the ultimate success of a strategic initiative, the implementation and integration of new business or operational processes could be disruptive to our current operations. Even if we test and evaluate an initiative on a limited basis, the diversion of management time and resources could have an adverse effect on our business.
Our ability to realize continuing benefits from our minority equity investment in our formerly owned and now franchised Brazil operations is subject to various risks and uncertainties. There is no assurance that our investment will be profitable or that growth will continue or that we will be able to generate a favorable return on the sale of our remaining interest in the future. In addition, there is no assurance that we will generate anticipated royalties from our franchise arrangement, which will be subject to the general risks associated with franchise arrangements. As a minority equity investor and franchisor, we will have limited control with respect to the Brazilian operations. The performance of these operations will also be subject to economic, regulatory and other market conditions in Brazil. As a result of the foregoing, the intended benefits of the Brazil transaction may not be realized.
We face a variety of risks associated with doing business in foreign markets that could have a negative impact on our financial performance.
We have a significant number of restaurants outside of the United States, and we intend to continue our efforts to grow internationally. There is no assurance that international operations will be profitable or international growth will continue. In addition, if we have a significant concentration of restaurants in a foreign market, the impact of any negative local conditions can have a sizable impact on our results.
Our foreign operations are subject to all of the same risks as our U.S. restaurants, as well as additional risks including, among others, international economic, political, social and legal conditions and the possibility of instability and unrest, differing cultures and consumer preferences, diverse government regulations and tax systems, cybersecurity threats, corruption, anti-American sentiment, the ability to source high-quality ingredients and other
commodities in a cost-effective manner, uncertain or differing interpretations of rights and obligations in connection with international franchise agreements and the collection of ongoing royalties from international franchisees, the availability and costs of land, construction and financing, and the availability of experienced management, appropriate franchisees and operating partners.
Local or regional events or conditions in our international markets could disrupt our business operations and affect our results. In recent years, there were protests in cities throughout the United States as well as globally, including in Hong Kong and Brazil, in connection with civil rights, liberties, and social and governmental reform.
Currency regulations and fluctuations in exchange rates could also affect our performance. We have operations in many foreign countries, including a minority equity investment in our Brazil franchisees, direct investments in restaurants in Hong Kong and international franchisees. As a result, we may experience losses from fluctuations in foreign currency exchange rates or any hedging arrangements that we enter into to offset such fluctuations, and such losses could adversely affect our overall sales and earnings.
We are subject to governmental regulation of our foreign operations, including antitrust and tax requirements, anti-boycott regulations, import/export/customs regulations and other international trade regulations, the USA Patriot Act and the Foreign Corrupt Practices Act. Any new regulatory or trade initiatives could impact our operations in certain countries. Failure to comply with any such legal requirements could subject us to monetary liabilities and other sanctions, which could harm our business, results of operations and financial condition.
Risks Related to Our Indebtedness
We may not be able to generate sufficient cash to service all of our indebtedness and operating lease obligations, and we may be forced to take other actions to satisfy our obligations under our indebtedness and operating lease obligations, which may not be successful. If we fail to meet these obligations, we would be in default under our debt agreements and the lenders could elect to declare all amounts outstanding under them to be immediately due and payable and terminate all commitments to extend further credit.
Our ability to make scheduled payments on our debt obligations and to satisfy our operating lease obligations depends upon our financial condition and operating performance, which is subject to prevailing economic and competitive conditions and to financial, business and other factors, many of which are beyond our control. We cannot be certain that we will maintain a level of cash flow from operating activities sufficient to permit us to pay the principal, premium, if any, and interest on our indebtedness, or to pay our operating lease obligations. For example, if inflation persists, or our financial position deteriorates, our revenues and liquidity position may decline. If our cash flow and capital resources are insufficient to fund our debt service obligations and operating lease obligations, we may be forced to reduce or delay capital expenditures, sell assets, seek additional capital or restructure or refinance our indebtedness. These alternative measures may not be successful and may not permit us to meet our scheduled debt service obligations. In the absence of sufficient operating results and resources, we could face substantial liquidity problems and might be required to dispose of material assets or operations or take other actions to meet our debt service and other obligations. Our debt agreements restrict our ability to dispose of assets and how we may use the proceeds from the disposition. We may not be able to consummate those dispositions or to obtain the proceeds that we could otherwise realize from such dispositions and any such proceeds that are realized may not be adequate to meet any debt service obligations then due. The failure to meet our debt service obligations or the failure to remain in compliance with the financial covenants under our debt agreements would constitute an event of default under those agreements and the lenders could elect to declare all amounts outstanding under them to be immediately due and payable and terminate all commitments to extend further credit.
Our leverage could adversely affect our ability to raise additional capital to fund our operations or limit our ability to react to changes in the economy or our industry.
As of December 29, 2024, our total net indebtedness was $1.0 billion and we had $474.0 million in available unused borrowing capacity under our revolving credit facility, net of undrawn letters of credit of $16.0 million.
Our leverage could have important consequences, including:
•making it more difficult for us to make payments on indebtedness;
•increasing our vulnerability to general economic, industry and competitive conditions and the various risks we face in our business;
•increasing our cost of borrowing or limiting our ability to obtain additional financing, if needed;
•reducing our ability to use our cash flow to fund our operations, capital expenditures, dividend payments, repurchases of our common stock and future business and strategic opportunities; and
•limiting our ability to adjust to changing market conditions and placing us at a competitive disadvantage compared to our competitors who may not be as highly leveraged.
We may incur substantial additional indebtedness in the future, subject to the restrictions contained in our credit agreement. If new indebtedness is added to our current debt levels, the related risks that we now face could increase.
We cannot be certain that our financial condition or credit and other market conditions will be favorable upon maturity of our unsecured notes or credit agreement in 2029, or at any earlier time we may seek to refinance our debt. Further, turmoil in global credit markets could adversely impact the availability and cost of credit. If we are unable to refinance our indebtedness on favorable terms, our financial condition and results of operations would be adversely affected.
Our debt agreements contain restrictions that limit our flexibility in operating our business.
Certain of our debt agreements limit our and our subsidiaries’ abilities to, among other things, incur or guarantee additional indebtedness, pay dividends above certain thresholds, redeem or repurchase our capital stock, make certain acquisitions or investments, incur or permit to exist certain liens, enter into transactions with affiliates or sell our assets to, merge or consolidate with or into, another company. Our debt agreements require us to satisfy certain financial tests and ratios. Our ability to satisfy such tests and ratios may be affected by events outside of our control.
If we breach the covenants under our debt agreements, the lenders could elect to declare all amounts outstanding under the agreements to be immediately due and payable and terminate all commitments to extend further credit. If we are unable to repay those amounts, the lenders could proceed against the collateral granted to them to secure that indebtedness. We have pledged substantially all of our assets as collateral under our credit agreement. If our lenders accelerate the repayment of borrowings, we cannot be certain that we will have sufficient assets to repay them.
Risks Related to Our Common Stock
Our ability to raise capital in the future may be limited, which could make us unable to fund our capital requirements.
Our business and operations may consume resources faster than we anticipate. In the future, we may need to raise additional funds through the issuance of new equity securities, debt or a combination of both. Additional financing may not be available on favorable terms or at all. If adequate funds are not available on acceptable terms, we may be unable to fund our capital requirements. If we issue new debt securities, the debt holders would have rights senior to common stockholders to make claims on our assets, and the terms of any debt could restrict our operations, including our ability to pay dividends above certain thresholds on our common stock. If we issue additional equity securities, existing stockholders may experience dilution, and the new equity securities could have rights senior to those of our common stock. Because our decision to issue securities in any future offering will depend on market conditions and other factors beyond our control, we cannot predict or estimate the amount, timing or nature of our future offerings.
Thus, our stockholders bear the risk of our future securities offerings reducing the market price of our common stock and diluting their interest.
Our stock price is subject to volatility.
The stock market in general is highly volatile. As a result, the market price of our common stock is similarly volatile. The price of our common stock could be subject to wide fluctuations in response to a number of factors, some of which may be beyond our control. These factors include actual or anticipated fluctuations in our operating results, changes in or our ability to achieve estimates of our operating results by analysts, investors or management, analysts’ recommendations regarding our stock or our competitors’ stock, sales of substantial amounts of our common stock by our stockholders, actions or announcements by us or our competitors, the maintenance and growth of the value of our brands, litigation, legislation or other regulatory developments affecting us or our industry, widespread/pandemic illness, natural disasters, cyber-attacks, terrorist acts, war or other calamities and changes in general market and economic conditions.
Provisions in our certificate of incorporation and bylaws and Delaware law may discourage, delay or prevent a change of control of our Company or changes in our management and, therefore, may depress the trading price of our stock.
Our certificate of incorporation and bylaws include certain provisions that could have the effect of discouraging, delaying or preventing a change of control of our Company or changes in our management. These provisions may discourage, delay or prevent a transaction involving a change in control of the Company that is in the best interests of our stockholders. Even in the absence of a takeover attempt, the existence of these provisions may adversely affect the prevailing market price of our common stock if they are viewed as discouraging future takeover attempts.
Section 203 of the Delaware General Corporation Law may affect the ability of an “interested stockholder” to engage in certain business combinations, including mergers, consolidations or acquisitions of additional shares, for a period of three years following the time that the stockholder becomes an “interested stockholder.” An “interested stockholder” is defined to include persons owning directly or indirectly 15% or more of the outstanding voting stock of a corporation. Although we have elected in our certificate of incorporation not to be subject to Section 203 of the Delaware General Corporation Law, our certificate of incorporation contains provisions that have the same effect as Section 203.
General Risk Factors
Litigation could have a material adverse impact on our business and our financial performance.
We are subject to lawsuits, administrative proceedings and claims that arise in the regular course of business. These matters typically involve claims by consumers and others regarding issues such as food borne illness, food safety, premises liability, personal injury, discrimination, “dram shop” statute liability, promotional advertising and other operational issues common to the food service industry, as well as environmental, data privacy, contract disputes and intellectual property infringement matters. We are also subject to employee claims against us based on, among other things, discrimination, harassment, wrongful termination, disability, or violation of wage and labor laws. We are also subject to the risk of being named a joint employer of workers of our franchisees for alleged violations of labor and wage laws. These claims may divert our financial and management resources that would otherwise be used to benefit our operations. The ongoing expense of or diversion of management attention due to any resulting lawsuits, any substantial settlement payment or damage award against us and any damage to our reputation could adversely affect our business and results of operations. Significant legal fees and costs in complex class action litigation or an adverse judgment or settlement that is not insured or is in excess of insurance coverage could have a material adverse effect on our financial position and results of operations.
Significant adverse weather conditions and other disasters or unforeseen events and our ability to execute, or success in executing, a comprehensive business recovery plan at our Restaurant Support Center for these events could negatively impact our results of operations and have a material adverse impact on our business.
Adverse weather conditions and natural disasters and other unforeseen events, such as winter storms, severe temperatures, thunderstorms, floods, drought, fires, hurricanes and earthquakes, terrorist attacks, war and widespread/pandemic illness, and the effects of such events on economic conditions and consumer spending patterns, could disrupt our operations or supply chain and negatively impact our results of operations. These events may result in lost restaurant sales, as well as property damage, lost products, interruptions in supply, and increased costs, temporary and prolonged restaurant closures may occur and consumer traffic may decline due to the actual or perceived effects from these events. For example, the COVID-19 pandemic, severe winter weather conditions, wildfires and hurricanes have impacted our traffic, and that of our franchisees, and results of operations in recent years. Although we cannot predict when or where we will be negatively impacted by widespread illnesses or pandemics, adverse weather events, to the extent that climate change or other factors result in more frequent, widespread or severe events, it could adversely impact our results. U.S. and foreign governmental officials also have placed an increasing focus on environmental matters, including climate change, reduction of greenhouse gases and water consumption. This increased focus could lead to legislative, regulatory or other efforts to combat these environmental concerns. These efforts could result in further increases in taxes, cost of supplies, transportation and utilities, which could increase our operating costs and those of our franchisees and require future investments in facilities and equipment. There may also be increased pressure for us to make commitments, set targets or establish goals to take actions to meet them, which could expose us and our franchisees to market, operational, execution and reputational costs or risks.
Many of our corporate systems and processes and corporate support for our restaurant operations are centralized at one location in Tampa, Florida. We have disaster recovery procedures and business continuity plans in place to address crisis-level events, including hurricanes and other natural disasters, and backup and off-site locations for recovery of electronic and other forms of data and information, and the ability to manage our business remotely. However, if we are unable to fully implement our disaster recovery plans, we may experience delays in recovery of data, inability to perform vital corporate functions, tardiness in required reporting and compliance, failures to adequately support field operations and other breakdowns in normal communication and operating procedures that could have a material adverse effect on our financial condition, results of operations and exposure to administrative and other legal claims. In addition, these threats are constantly evolving, which increases the difficulty of accurately and timely predicting, planning for and protecting against the threat. As a result, our disaster recovery procedures and business continuity plans may not adequately address all threats we face or protect us from loss.
The United States and other countries have experienced, or may experience in the future, outbreaks of viruses or other diseases. If a regional or global health pandemic occurs, depending upon its location, duration and severity, our business could be severely affected. In the event a health pandemic occurs, customers might avoid public places, and local, regional or national governments might limit or ban public gatherings to halt or delay the spread of disease. Jurisdictions in which we have restaurants may impose mandatory closures or impose restrictions on operations. If a virus is transmitted by human contact or respiratory transmission, our employees or guests could become infected, or could choose, or be advised, to avoid gathering in public places, any of which would adversely affect our restaurant guest traffic or our ability to perform functions at the corporate level. A regional or global health pandemic might also adversely affect our business by disrupting or delaying production and delivery of materials and products in our supply chain and by causing staffing shortages in our stores.
Our insurance policies may not provide adequate levels of coverage against all claims, and fluctuating insurance requirements and costs could negatively impact our profitability.
We carry insurance programs with specific retention levels or high per-claim deductibles for a significant portion of our risks and associated liabilities with respect to workers’ compensation, general liability, liquor liability, employment practices liability, property, health benefits, cybersecurity and other insurable risks. However, there are types of losses we may incur that cannot be insured against or that we believe are not commercially reasonable to
insure. These losses, if they occur, could have a material and adverse effect on our business and results of operations. Additionally, if our insurance costs increase, there can be no assurance that we will be able to successfully offset the effect of such increases and our results of operations may be adversely affected.
An impairment in the carrying value of our goodwill or other intangible or long-lived assets could adversely affect our financial condition and results of operations.
Along with other intangible assets, we test goodwill for impairment annually and whenever events or changes in circumstances indicate that its carrying value may not be recoverable. We also evaluate long-lived assets on a quarterly basis or whenever events or changes in circumstances indicate that the carrying value may not be recoverable. We cannot accurately predict the amount and timing of any impairment of assets. A significant amount of judgment is involved in determining if an indication of impairment exists. Unforeseen events could make developing forecasts for, and the accounting of, valuation of goodwill and certain other assets slower and more difficult. Should the value of goodwill or other intangible or long-lived assets become impaired, there could be an adverse effect on our financial condition and consolidated results of operations.
Failure to maintain effective systems of internal control over financial reporting and disclosure controls and procedures could adversely affect our business and financial results.
Effective internal control over financial reporting is necessary for us to provide accurate financial information. If we are unable to adequately maintain effective internal control over financial reporting, we may not be able to accurately report our financial results. Furthermore, we cannot be certain that our internal control over financial reporting and disclosure controls and procedures will prevent all possible errors and fraud, including through cyber-attacks. Because of inherent limitations in all control systems, no evaluation of controls can provide absolute assurance that all control issues and instances of error or fraud, if any, in our Company have been detected. These inherent limitations include the realities that judgments in decision-making can be faulty and that breakdowns can occur because of a simple error or mistake, which could have an adverse impact on our business. A significant financial reporting failure or a lack of sufficient internal control over financial reporting could cause a loss of investor confidence and decline in the market price of our common stock, increase our costs, lead to litigation or result in negative publicity that could damage our reputation.
Future changes to existing accounting rules, accounting standards, new pronouncements and varying interpretations of pronouncements, or the questioning of current accounting practices may adversely affect our reported financial results. Additionally, our assumptions, estimates and judgments related to complex accounting matters could significantly affect our financial results. Generally accepted accounting principles and related accounting pronouncements, implementation guidelines and interpretations with regard to a wide range of matters that are relevant to our business, including but not limited to, revenue recognition, impairment of long-lived assets, leases and related economic transactions, derivatives, intangibles, self-insurance, income taxes, property and equipment, unclaimed property laws and litigation, and stock-based compensation are highly complex and involve many subjective assumptions, estimates and judgments by us. Changes in these rules or their interpretations or changes in underlying assumptions, estimates or judgments by us could significantly change our reported or expected financial performance.
Item 1B. Unresolved Staff Comments
Not applicable.
Item 1C. Cybersecurity
Risk Management and Strategy
We maintain a risk-based, defense-in-depth approach to cybersecurity and data protection. We assess industry best practices and standards and endeavor to leverage them in our efforts to manage cybersecurity risk. We dedicate
resources and apply security controls where we believe they would be most effective to predict, prevent, detect and respond to potential security threats to our highest value information assets, which we consider to be point-of-sale systems, financial systems and confidential, personal and private customer and employee information. We use multiple safeguards to protect our internal networks and systems, including, among others, firewalls, email protection and web filtering, endpoint detection and response software, controlled access to our data and systems, segmenting our card data environment, vulnerability management and patching, and performing regular penetration testing. A risk assessment, based on the National Institute of Standards and Technology Framework, is conducted and maintained throughout the system development lifecycle and is reviewed at least annually.
We have implemented controls designed to identify and mitigate cybersecurity threats associated with our use of third-party service providers. Such providers are subject to security risk assessments at the time of onboarding, contract renewal and upon detection of an increase in risk profile. We use a variety of inputs in such risk assessments, including information supplied by providers and third parties. In addition, we require our providers to meet appropriate security requirements, controls and responsibilities, and we investigate security incidents that have impacted our third-party providers, as appropriate.
As part of our information security training program, employees and contractors participate in various cybersecurity awareness activities, including formal training exercises and simulated phishing events. We also contract with third-party cybersecurity firms to conduct simulated cyberattacks and perform regular penetration testing to assess the effectiveness of our security measures. We have also engaged with external subject matter experts to assess access management, information technology asset management and our cybersecurity policies.
We have company-wide business continuity and disaster recovery plans used to prepare for multiple events, including a potential disruption in the technology on which we rely. We maintain incident response plans and playbooks to prepare for various contingencies and types of incidents. The cybersecurity incident response plan (“IRP”) includes immediate actions to mitigate and contain the short-term impact of an incident, and long-term strategies for remediation and prevention of future incidents. The IRP also includes policies that dictate escalation procedures and remediation plans based on the severity level of an incident. As part of our IRP, we consider engaging third-party cybersecurity firms to assist in the event of a significant incident. We also conduct tabletop exercises to enhance incident response preparedness.
We, like others in our industry, experience cybersecurity incidents and attempts to access our systems. In the event we experience an incident, we classify it based on its significance and track remediation actions and outcomes. Although we do not believe we have been materially affected by cybersecurity incidents or threats in the past, or that past incidents are reasonably likely to materially affect us, we cannot provide any assurance that we will not experience a material incident in the future. As described above, we utilize a risk-based approach to manage cybersecurity risk and it is possible we may not implement appropriate controls if we do not recognize or underestimate a particular risk. In addition, security controls, no matter how well designed or implemented, may only mitigate and not fully eliminate risks. See Item 1A. Risk Factors for additional discussion of our cybersecurity risks.
Governance
Our Board of Directors (our “Board”) has charged the Audit Committee with oversight of the Company’s identification, assessment and management of cybersecurity and data privacy risks. The Audit Committee receives quarterly updates from our Chief Information Security Officer (“CISO”) and our Chief Information Officer (“CIO”) regarding our cybersecurity program and actions taken to manage cybersecurity risk, which include risk identification and management strategies, consumer data protection, security programs, ongoing risk mitigation activities and results of third-party assessments and testing.
We maintain a dedicated cybersecurity department, which consists exclusively of Company employees, within our broader information technology department. Functions within this department range from new information technology solution design and implementation, vulnerability management, phishing awareness, threat detection,
Payment Card Industry compliance and incident response. Primary responsibility for assessing, monitoring and managing our cybersecurity risks rests with the CISO, who has over 25 years of experience in the field of cybersecurity, including prior service in the military in cybersecurity roles, and relevant industry certifications commensurate with his role. Our CISO reports directly to the CIO who has over 20 years of technology leadership experience in various industries.
Our CIO receives status reports from our cybersecurity department regularly and reports to our Chief Executive Officer, who receives updates on incidents, trends, projects and other relevant information regularly. In addition, as part of our incident response planning, we maintain cross-functional response teams to be prepared to respond to an incident.
Item 2. Properties
We had 1,463 system-wide restaurants located across 46 states, Guam and 12 countries as of December 29, 2024. The following is a summary of our restaurant locations by country and territory as of December 29, 2024:
| | | | | | | | | | | | | | | | | | | | | | | | | | |
| COMPANY-OWNED | | | | | FRANCHISED |
| United States | 970 | | | | | | United States | 146 | |
| | | | | | | | | | |
| Other - Hong Kong | 10 | | | | | | International | | | | |
| Discontinued Operations - Brazil (1) | 192 | | | | | | Argentina | 3 | | | Japan | 9 | |
| | | | | | Australia | 8 | | | Mexico | 4 | |
| | | | | | Canada | 3 | | | Qatar | 7 | |
| | | | | | Costa Rica | 2 | | | Saudi Arabia | 11 | |
| | | | | | Dominican Republic | 1 | | | South Korea | 96 | |
| | | | | | Guam | 1 | | | | |
| | | | | | Total international franchised | 145 | |
| Total Company-owned | 1,172 | | | | | | Total franchised | 291 | |
| | | | | | | | | | |
____________________
(1)The restaurant count for Brazil is reported as of November 30, 2024 to correspond with the balance sheet date of this subsidiary. Subsequent to December 29, 2024, we completed the sale of the majority ownership of our Brazil operations and all restaurants in that market now operate as unconsolidated franchisees.
We lease substantially all of our restaurant properties from third parties. As of December 29, 2024, our Company-owned restaurants were located on the following sites by segment:
| | | | | | | | | | | | | | | | | | | | | | | | | | | | | |
| U.S. | | OTHER | | DISCONTINUED OPERATIONS | | TOTAL | | PERCENTAGE OF TOTAL |
| Company-owned sites | 23 | | | | | — | | | 23 | | | 2 | % |
| Leased sites: | | | | | | | | | |
| Land, ground and building leases | 677 | | | — | | | 1 | | | 678 | | | 58 | % |
| Space and in-line leases | 270 | | | 10 | | | 191 | | | 471 | | | 40 | % |
| Total Company-owned restaurant sites | 970 | | | 10 | | | 192 | | | 1,172 | | | 100 | % |
We also lease corporate offices in Tampa, Florida and, through the date of the Brazil Sale Transaction, in São Paulo, Brazil.
Item 3. Legal Proceedings
For a description of our legal proceedings, see Note 18 - Commitments and Contingencies of the Notes to Consolidated Financial Statements of this Report.
Item 4. Mine Safety Disclosures
Not applicable.
PART II
Item 5. Market for Registrant’s Common Equity, Related Stockholder Matters and Issuer Purchases of Equity Securities
Market Information - Our common stock is listed on the Nasdaq Global Select Market under the symbol “BLMN”.
Dividends - In February 2022, our Board reinstated quarterly dividends after a temporary suspension during the COVID-19 pandemic. Future dividend payments will depend on continued compliance with our financial covenants, as well as our earnings, financial condition, capital expenditure requirements, surplus and other factors that our Board considers relevant.
Holders - As of February 21, 2025, there were 116 holders of record of our common stock. The number of registered holders does not include holders who are beneficial owners whose shares are held in street name by brokers and other nominees.
Securities Authorized for Issuance Under Equity Compensation Plans - The following table presents the securities authorized for issuance under our equity compensation plans as of December 29, 2024:
| | | | | | | | | | | | | | | | | | | | |
| (shares in thousands) | | (a) | | (b) | | (c) |
| PLAN CATEGORY | | NUMBER OF SECURITIES TO BE ISSUED UPON EXERCISE OF OUTSTANDING OPTIONS, WARRANTS AND RIGHTS (1) | | WEIGHTED AVERAGE EXERCISE PRICE OF OUTSTANDING OPTIONS, WARRANTS AND RIGHTS (2) | | NUMBER OF SECURITIES REMAINING AVAILABLE FOR FUTURE ISSUANCE UNDER EQUITY COMPENSATION PLANS (EXCLUDING SECURITIES REFLECTED IN COLUMN (a)) (3) |
| Equity compensation plans approved by security holders | | 2,966 | | | $ | 20.08 | | | 5,305 | |
____________________
(1)Includes 1,766 shares issuable in respect to restricted stock units and performance-based share units (assuming target achievement of applicable performance metrics).
(2)Amounts in this column relate only to options exercisable for common shares.
(3)The shares remaining available for issuance may be issued in the form of stock options, restricted stock units or other stock awards under the 2020 Omnibus Incentive Compensation Plan. See Note 7 - Stock-based and Deferred Compensation Plans of the Notes to Consolidated Financial Statements for details regarding the plan.
Purchases of Equity Securities by the Issuer and Affiliated Purchasers - In February 2024, our Board canceled the remaining $57.5 million of authorization under the 2023 Share Repurchase Program and approved a new $350.0 million authorization (the “2024 Share Repurchase Program”), as announced in our press release issued on February 23, 2024. The 2024 Share Repurchase Program will expire on August 13, 2025.
We did not repurchase any shares of our outstanding common stock during the thirteen weeks ended December 29, 2024. As of December 29, 2024, we had $96.8 million of remaining share repurchase authorization under the 2024 Share Repurchase Program.
Stock Performance Graph - The following graph depicts total return to stockholders from December 29, 2019 through December 29, 2024, relative to the performance of the Standard & Poor’s 500 index and the Standard & Poor’s 500 Consumer Discretionary index, a peer group. The graph assumes an investment of $100 in our common stock and in each index on December 29, 2019 (the last business day of the fiscal year of investment), and the reinvestment of dividends paid since that date. The stock price performance shown in the graph is not necessarily indicative of future price performance.
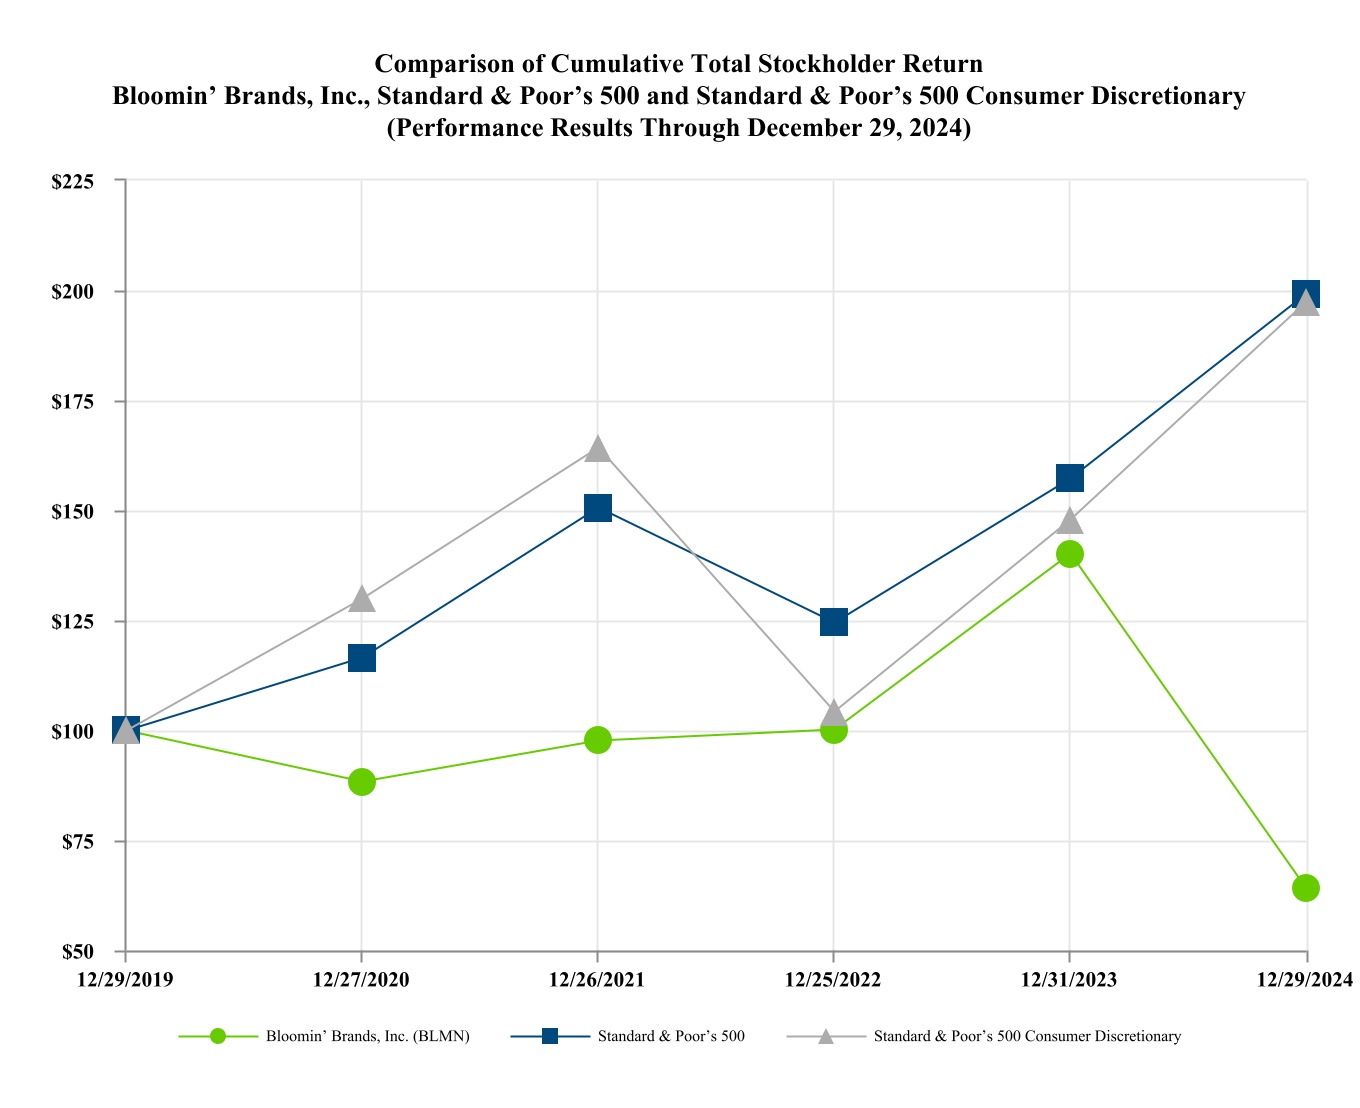
| | | | | | | | | | | | | | | | | | | | | | | | | | | | | | | | | | | |
| DECEMBER 29,
2019 | | DECEMBER 27,
2020 | | DECEMBER 26,
2021 | | DECEMBER 25,
2022 | | DECEMBER 31,
2023 | | DECEMBER 29,
2024 |
| Bloomin’ Brands, Inc. (BLMN) | $ | 100.00 | | | $ | 88.36 | | | $ | 97.68 | | | $ | 100.21 | | | $ | 140.01 | | | $ | 64.09 | |
| Standard & Poor’s 500 | $ | 100.00 | | | $ | 116.38 | | | $ | 150.62 | | | $ | 124.54 | | | $ | 157.06 | | | $ | 199.28 | |
| Standard & Poor’s 500 Consumer Discretionary | $ | 100.00 | | | $ | 129.97 | | | $ | 164.24 | | | $ | 104.12 | | | $ | 147.78 | | | $ | 197.38 | |
Item 6. [Reserved]
BLOOMIN’ BRANDS, INC.
MANAGEMENT’S DISCUSSION AND ANALYSIS OF
FINANCIAL CONDITION AND RESULTS OF OPERATIONS
Item 7. Management’s Discussion and Analysis of Financial Condition and Results of Operations
Management’s discussion and analysis of financial condition and results of operations should be read in conjunction with our consolidated financial statements and the related notes. We have classified the results of operations, non-GAAP measures, and liquidity and capital resources of our Brazil operations as discontinued operations for all periods presented. Unless otherwise noted, this Management Discussion and Analysis of Financial Condition and Results of Operations does not include discontinued operations. For discussion of our consolidated and segment-level results of operations, non-GAAP measures, and liquidity and capital resources not included in this Annual Report for fiscal year 2022, see our Annual Report on Form 10-K for the year ended December 31, 2023, filed with the SEC on February 28, 2024.
Overview
We are one of the largest casual dining restaurant companies in the world with a portfolio of leading, differentiated restaurant concepts. As of December 29, 2024, we owned and operated 1,172 restaurants and franchised 291 restaurants across 46 states, Guam and 12 countries. Our restaurant portfolio includes: Outback Steakhouse, Carrabba’s Italian Grill, Bonefish Grill and Fleming’s Prime Steakhouse & Wine Bar.
Financial Overview - Our financial overview for 2024 from continuing operations includes the following:
•U.S. combined and Outback Steakhouse comparable restaurant sales of (1.1)% and (1.2)%, respectively;
•Decrease in Total revenues of (5.2)% as compared to 2023;
•Operating income and restaurant-level operating margins of 3.5% and 13.3%, respectively, as compared to 6.8% and 15.4%, respectively for 2023;
•Operating income of $139.8 million as compared to $282.8 million in 2023; and
•Diluted (loss) earnings per share of $(0.61) as compared to $2.13 in 2023.
Sale of Majority Ownership of our Brazil Operations - On December 30, 2024, we completed the sale of 67% of our Brazil operations (the “Brazil Sale Transaction”) and entered into amended and restated franchise agreements with all existing restaurants in Brazil. The balance sheets, results of operations and cash flows of our Brazil operations are reported as discontinued operations for all periods presented. See Note 3 - Discontinued Operations of the Notes to Consolidated Financial Statements for additional details.
Business Strategies - Our current key business strategies include:
Simplifying the Agenda. We are focused on our operations, removing menu items and enabling our operators to deliver a great guest experience. Our transaction to re-franchise our Brazil business will allow our management team to focus on improvements in our domestic operations.
Consistently Deliver Guest-Centric Experience. We are investing in our product quality, technology and operational execution to ensure guests consistently have a great experience when they interact with our brands across both in-restaurant and off-premises channels. We believe this will drive increased frequency.
Refine Our Marketing Approach. We are refining our menu offerings to offer abundant, every day value, which we believe will resonate with the marketplace. We will continue to offer experiential-driven events with unique items as a way to drive trial to our brands.
Drive Long-Term Shareholder Value. We plan to drive long-term shareholder value by reinvesting into our base business and addressing the state of our asset base, paying down debt and returning excess cash to shareholders through dividends. We have refined our pipeline to slow new unit growth beginning in 2026. While we still believe
BLOOMIN’ BRANDS, INC.
MANAGEMENT’S DISCUSSION AND ANALYSIS OF
FINANCIAL CONDITION AND RESULTS OF OPERATIONS - Continued
there are development opportunities for our concepts in the U.S., we remain focused on driving healthy traffic in our existing restaurants.
We intend to fund our business strategies, drive revenue growth and margin improvement, in part by reinvesting savings generated by cost savings and productivity initiatives across our businesses.
Key Financial Performance Indicators - Key measures that we use in evaluating our restaurants and assessing our business include the following:
•Average restaurant unit volumes—average sales (excluding gift card breakage and, in our discontinued operations, the benefit of value added tax exemptions in Brazil) per restaurant to measure changes in customer traffic, pricing and development of the brand.
•Comparable restaurant sales—year-over-year comparison of the change in sales volumes (excluding gift card breakage and, in our discontinued operations, the benefit of value added tax exemptions in Brazil) for Company-owned restaurants that are open 18 months or more in order to remove the impact of new restaurant openings in comparing the operations of existing restaurants.
•System-wide sales—total restaurant sales volume for all Company-owned and franchise restaurants, regardless of ownership, to interpret the overall health of our brands.
•Restaurant-level operating margin, Income from operations, Net (loss) income and Diluted (loss) earnings per share—financial measures utilized to evaluate our operating performance.
Restaurant-level operating margin is a non-GAAP financial measure widely regarded in the industry as a useful metric to evaluate restaurant-level operating efficiency and performance of ongoing restaurant-level operations, and we use it for these purposes. Our restaurant-level operating margin is expressed as the percentage of our Restaurant sales that Food and beverage costs, Labor and other related expense and Other restaurant operating expense (including advertising expenses) represent, in each case as such items are reflected in our Consolidated Statements of Operations and Comprehensive (Loss) Income. The following categories of revenue and operating expenses are not included in restaurant-level operating income and corresponding margin because we do not consider them reflective of operating performance at the restaurant-level within a period:
(i)Franchise and other revenues, which are earned primarily from franchise royalties and other non-food and beverage revenue streams, such as rental and sublease income;
(ii)Depreciation and amortization, which, although substantially all of which is related to restaurant-level assets, represent historical sunk costs rather than cash outlays for the restaurants;
(iii)General and administrative expense, which includes primarily non-restaurant-level costs associated with support of the restaurants and other activities at our corporate offices; and
(iv)Asset impairment charges and restaurant closing costs, which are not reflective of ongoing restaurant performance in a period.
Restaurant-level operating margin excludes various expenses, as discussed above, that are essential to supporting the operations of our restaurants and may materially impact our Consolidated Statements of Operations and Comprehensive (Loss) Income. As a result, restaurant-level operating margin is not indicative of our consolidated results of operations and is presented exclusively as a supplement to, and not a substitute for, Net (loss) income or Income from operations. In addition, our presentation of restaurant-level operating margin may not be comparable to similarly titled measures used by other companies in our industry.
BLOOMIN’ BRANDS, INC.
MANAGEMENT’S DISCUSSION AND ANALYSIS OF
FINANCIAL CONDITION AND RESULTS OF OPERATIONS - Continued
•Adjusted restaurant-level operating margin, Adjusted income from operations, Adjusted net income and Adjusted diluted earnings per share—non-GAAP financial measures utilized to evaluate our operating performance, which definitions, usefulness and reconciliations are described in more detail in the “Non-GAAP Financial Measures” section below.
Selected Operating Data - The table below presents the number of our restaurants in operation (from both continuing and discontinued operations) as of the periods indicated:
| | | | | | | | | | | | | |
| Number of restaurants (at end of the period): | DECEMBER 29, 2024 | | DECEMBER 31, 2023 | | |
| U.S. | | | | | |
| Outback Steakhouse | | | | | |
| Company-owned | 553 | | | 562 | | | |
| Franchised | 122 | | | 126 | | | |
| Total | 675 | | | 688 | | | |
| Carrabba’s Italian Grill | | | | | |
| Company-owned | 192 | | | 198 | | | |
| Franchised | 18 | | | 19 | | | |
| Total | 210 | | | 217 | | | |
| Bonefish Grill | | | | | |
| Company-owned | 162 | | | 170 | | | |
| Franchised | 4 | | | 6 | | | |
| Total | 166 | | | 176 | | | |
| Fleming’s Prime Steakhouse & Wine Bar | | | | | |
| Company-owned | 63 | | | 64 | | | |
| Aussie Grill | | | | | |
| Company-owned | — | | | 4 | | | |
| Franchised | 2 | | | 1 | | | |
| Total | 2 | | | 5 | | | |
| U.S. total | 1,116 | | | 1,150 | | | |
| International Franchise | | | | | |
| | | | | |
| | | | | |
| | | | | |
| | | | | |
| | | | | |
| | | | | |
| Outback Steakhouse - South Korea | 96 | | | 92 | | | |
| Other | 49 | | | 47 | | | |
| International Franchise total | 145 | | | 139 | | | |
| Other - Company-owned | | | | | |
| Outback Steakhouse - Hong Kong/China | 10 | | | 19 | | | |
| Discontinued operations - Company-owned | | | | | |
| Outback Steakhouse - Brazil (1) | 173 | | | 155 | | | |
| Other - Brazil (1) | 19 | | | 17 | | | |
| | | | | |
| | | | | |
| | | | | |
| | | | | |
| | | | | |
| | | | | |
| System-wide total | 1,463 | | | 1,480 | | | |
| System-wide total - Company-owned | 1,172 | | | 1,189 | | | |
| System-wide total - Franchised | 291 | | | 291 | | | |
| | | | | |
| | | | | |
| | | | | |
| | | | | |
| | | | | |
| | | | | |
| | | | | |
| | | | | |
____________________
(1)The restaurant counts for Brazil, including Abbraccio and Aussie Grill restaurants within International Company-owned Other - Brazil, are reported as of November 30, 2024 and 2023, respectively, to correspond with the balance sheet dates of this subsidiary. Following the close of the Brazil Sale Transaction on December 30, 2024, all restaurants in that market operate as unconsolidated franchisees. See Note 3 - Discontinued Operations of the Notes to Consolidated Financial Statements for further details.
BLOOMIN’ BRANDS, INC.
MANAGEMENT’S DISCUSSION AND ANALYSIS OF
FINANCIAL CONDITION AND RESULTS OF OPERATIONS - Continued
Results of Operations
REVENUES
Restaurant Sales - Following is a summary of the change in Restaurant sales for the periods indicated:
| | | | | | | | | | | |
| FISCAL YEAR |
| (dollars in millions) | 2024 | | 2023 |
| Restaurant sales of prior periods (continuing operations) | $ | 4,077.8 | | | $ | 3,923.9 | |
| 53rd week restaurant sales (1) | (82.7) | | | |
| For fiscal year 2024 (comparable 52-week presentation) | 3,995.1 | | | |
| Change from: | | | |
| Restaurant closures (2) | (129.6) | | | (30.5) | |
| Comparable restaurant sales | (54.5) | | | 75.1 | |
| Restaurant openings (3) | 55.2 | | | 27.2 | |
| Effect of foreign currency translation | 0.1 | | | (0.6) | |
| | | |
| | | |
| | | |
| For fiscal year 2023 (comparable 52-week presentation) | | | 3,995.1 | |
| 53rd week restaurant sales (1) | | | 82.7 | |
| For fiscal year 2024 and 2023 (as reported) | $ | 3,866.3 | | | $ | 4,077.8 | |
| | | |
| | | |
| | | |
____________________
(1)Fiscal year 2023 included restaurant sales from December 25, 2023 through December 31, 2023, which represents the 53rd week.
(2)Fiscal years 2024 and 2023 include restaurant sales impact from the closure of 73 and 34 restaurants since December 25, 2022 and December 26, 2021, respectively.
(3)Fiscal years 2024 and 2023 include restaurant sales from 27 and 19 new restaurants, respectively, not included in our comparable restaurant sales base.
Average Restaurant Unit Volumes and Operating Weeks
Following is a summary of the average restaurant unit volumes and operating weeks for the periods indicated:
| | | | | | | | | | | | | |
| FISCAL YEAR |
| (dollars in thousands) | 2024 | | 2023 | | |
| Average restaurant unit volumes: | | | | | |
| U.S. - continuing operations | | | | | |
| Outback Steakhouse | $ | 4,004 | | | $ | 4,094 | | | |
| Carrabba’s Italian Grill | $ | 3,595 | | | $ | 3,631 | | | |
| Bonefish Grill | $ | 3,209 | | | $ | 3,339 | | | |
| Fleming’s Prime Steakhouse & Wine Bar | $ | 5,822 | | | $ | 5,935 | | | |
| Discontinued operations | | | | | |
| Outback Steakhouse - Brazil (1) | $ | 2,874 | | | $ | 3,213 | | | |
| | | | | |
| Operating weeks: | | | | | |
| U.S. - continuing operations | | | | | |
| Outback Steakhouse | 28,636 | | | 29,771 | | | |
| Carrabba’s Italian Grill | 10,030 | | | 10,537 | | | |
| Bonefish Grill | 8,486 | | | 9,056 | | | |
| Fleming’s Prime Steakhouse & Wine Bar | 3,293 | | | 3,418 | | | |
| Discontinued operations | | | | | |
| Outback Steakhouse - Brazil | 8,630 | | | 7,670 | | | |
____________________
(1)Translated at average exchange rates of 5.29 and 5.02 for 2024 and 2023, respectively. Excludes the benefit of the Brazil value added tax exemptions discussed in Note 3 - Discontinued Operations of the Notes to Consolidated Financial Statements.
BLOOMIN’ BRANDS, INC.
MANAGEMENT’S DISCUSSION AND ANALYSIS OF
FINANCIAL CONDITION AND RESULTS OF OPERATIONS - Continued
Comparable Restaurant Sales, Traffic and Average Check Per Person (Decreases) Increases
Following is a summary of comparable restaurant sales, traffic and average check per person (decreases) increases for the periods indicated:
| | | | | | | | | | | | | | | |
| | | FISCAL YEAR | | |
| | | 2024 (1) | | 2023 (1) | | |
| | | | | | | |
| Year over year percentage change: | | | | | | | |
| Comparable restaurant sales (restaurants open 18 months or more): | | | | | | | |
| U.S. - continuing operations (2) | | | | | | | |
| Outback Steakhouse | | | (1.2) | % | | 1.1 | % | | |
| Carrabba’s Italian Grill | | | — | % | | 3.9 | % | | |
| Bonefish Grill | | | (3.2) | % | | 0.8 | % | | |
| Fleming’s Prime Steakhouse & Wine Bar | | | 0.2 | % | | (0.7) | % | | |
| Combined U.S. | | | (1.1) | % | | 1.4 | % | | |
| Discontinued operations | | | | | | | |
| Outback Steakhouse - Brazil (3)(4) | | | (1.4) | % | | 5.5 | % | | |
| | | | | | | |
| Traffic: | | | | | | | |
| U.S. - continuing operations | | | | | | | |
| Outback Steakhouse | | | (4.2) | % | | (4.3) | % | | |
| Carrabba’s Italian Grill | | | (3.2) | % | | 0.3 | % | | |
| Bonefish Grill | | | (7.1) | % | | (3.3) | % | | |
| Fleming’s Prime Steakhouse & Wine Bar | | | (5.8) | % | | (2.0) | % | | |
| Combined U.S. | | | (4.4) | % | | (3.1) | % | | |
| Discontinued operations | | | | | | | |
| Outback Steakhouse - Brazil (3) | | | (4.4) | % | | (1.1) | % | | |
| | | | | | | |
| Average check per person (5): | | | | | | | |
| U.S. - continuing operations | | | | | | | |
| Outback Steakhouse | | | 3.0 | % | | 5.4 | % | | |
| Carrabba’s Italian Grill | | | 3.2 | % | | 3.6 | % | | |
| Bonefish Grill | | | 3.9 | % | | 4.1 | % | | |
| Fleming’s Prime Steakhouse & Wine Bar | | | 6.0 | % | | 1.3 | % | | |
| Combined U.S. | | | 3.3 | % | | 4.5 | % | | |
| Discontinued operations | | | | | | | |
| Outback Steakhouse - Brazil (3) | | | 2.6 | % | | 6.5 | % | | |
____________________
(1)For 2024, U.S. comparable restaurant sales, traffic and average check per person compare the 52 weeks from January 1, 2024 through December 29, 2024 to the 52 weeks from January 2, 2023 through December 31, 2023. For 2023, U.S. comparable restaurant sales, traffic and average check per person compare the 53 weeks from December 26, 2022 through December 31, 2023 to the 53 weeks from December 27, 2021 through January 1, 2023.
(2)Relocated restaurants closed more than 60 days are excluded from comparable restaurant sales until at least 18 months after reopening.
(3)Excludes the effect of fluctuations in foreign currency rates and the benefit of the Brazil value added tax exemptions discussed in Note 3 - Discontinued Operations of the Notes to Consolidated Financial Statements.
(4)Includes trading day impact from calendar period reporting.
(5)Includes the impact of menu pricing changes, product mix and discounts.
BLOOMIN’ BRANDS, INC.
MANAGEMENT’S DISCUSSION AND ANALYSIS OF
FINANCIAL CONDITION AND RESULTS OF OPERATIONS - Continued
COSTS AND EXPENSES
The following table sets forth the percentages of certain items in our Consolidated Statements of Operations in relation to Restaurant sales or Total revenues for the periods indicated:
| | | | | | | | | | | | | | | | | | | |
| FISCAL YEAR | | |
| 2024 | | 2023 | | 2022 | | |
| Revenues | | | | | | | |
| Restaurant sales | 97.9 | % | | 97.8 | % | | 97.9 | % | | |
| Franchise and other revenues | 2.1 | | | 2.2 | | | 2.1 | | | |
| Total revenues | 100.0 | | | 100.0 | | | 100.0 | | | |
| Costs and expenses | | | | | | | |
| Food and beverage (1) | 29.7 | | | 30.4 | | | 31.5 | | | |
| Labor and other related (1) | 31.1 | | | 29.9 | | | 29.1 | | | |
| Other restaurant operating (1) | 25.9 | | | 24.2 | | | 24.3 | | | |
| Depreciation and amortization | 4.4 | | | 4.1 | | | 3.7 | | | |
| General and administrative | 5.6 | | | 5.6 | | | 5.3 | | | |
| | | | | | | |
| | | | | | | |
| | | | | | | |
| Provision for impaired assets and restaurant closings | 1.6 | | | 0.8 | | | 0.1 | | | |
| | | | | | | |
| Total costs and expenses | 96.5 | | | 93.2 | | | 92.4 | | | |
| Income from operations | 3.5 | | | 6.8 | | | 7.6 | | | |
| Loss on extinguishment of debt | (3.4) | | | — | | | (2.7) | | | |
| | | | | | | |
| Loss on fair value adjustment of derivatives, net | — | | | — | | | (0.4) | | | |
| | | | | | | |
| Interest expense, net | (1.6) | | | (1.3) | | | (1.3) | | | |
| (Loss) income before (benefit) provision for income taxes | (1.5) | | | 5.5 | | | 3.2 | | | |
| (Benefit) provision for income taxes | (0.3) | | | 0.4 | | | 0.9 | | | |
| Net (loss) income from continuing operations | (1.2) | | | 5.1 | | | 2.3 | | | |
| Net (loss) income from discontinued operations, net of tax | (1.9) | | | 1.0 | | | 0.4 | | | |
| Net (loss) income | (3.1) | | | 6.1 | | | 2.7 | | | |
| Less: net income attributable to noncontrolling interests | 0.1 | | | 0.2 | | | 0.2 | | | |
| Net (loss) income attributable to Bloomin’ Brands | (3.2) | % | | 5.9 | % | | 2.5 | % | | |
| | | | | | | |
____________________
(1)As a percentage of Restaurant sales.
Fiscal year 2024 as compared to fiscal year 2023 - continuing operations
Food and beverage cost decreased as a percentage of Restaurant sales due to 1.3% from increases in menu pricing and 0.6% from cost-saving and productivity initiatives. These decreases were partially offset by increases as a percentage of Restaurant sales of 0.5% from unfavorable product mix and 0.5% from commodity inflation.
Labor and other related expense increased as a percentage of Restaurant sales primarily due to 1.6% from higher hourly and field management labor costs, primarily due to wage rate inflation, partially offset by a decrease of 0.6% from an increase in average check per person.
Other restaurant operating expense increased as a percentage of Restaurant sales primarily due to: (i) 1.1% from higher restaurant-level operating and supply expenses, primarily due to inflation, (ii) 0.5% from higher advertising expense and (iii) 0.4% from higher insurance and legal expense, primarily from lapping the 2023 favorable settlement of certain collective action wage and hour lawsuits. These increases were partially offset by decreases as a percentage of Restaurant sales of 0.3% from an increase in average check per person and 0.3% from certain cost-saving and productivity initiatives.
Depreciation and amortization expense increased primarily due to restaurant development and technology projects, partially offset by restaurant closures.
BLOOMIN’ BRANDS, INC.
MANAGEMENT’S DISCUSSION AND ANALYSIS OF
FINANCIAL CONDITION AND RESULTS OF OPERATIONS - Continued
Provision for impaired assets and restaurant closings increased primarily due to: (i) asset impairments during Q4 2024 related to 41 older, underperforming restaurants (the “Q4 2024 Restaurant Impairment”), and from the closure of (ii) nine restaurants in Hong Kong and (iii) 36 older, predominately underperforming restaurants within the U.S. segment (the “2023 Restaurant Closures”). These increases were partially offset by the Q4 2023 asset impairment and closure charges in connection with the 2023 Restaurant Closures.
Loss on extinguishment of debt and Loss on fair value adjustment of derivatives, net during 2024 were in connection with the repurchase of $83.6 million of the outstanding convertible senior notes due in 2025 (the “2025 Notes”) (the “Second 2025 Notes Partial Repurchase”), which is described in further detail within Note 11 - Convertible Senior Notes of the Notes to Consolidated Financial Statements.
Interest expense, net increased primarily due to higher balances and interest rates on the unhedged portion of our revolving credit facility partially offset by a decrease in interest expense from the Second 2025 Notes Partial Repurchase.
(Benefit) provision for income taxes includes credits we and other restaurant company employers may claim against federal income taxes for FICA taxes paid on certain tipped wages (the “FICA tax credit”). The level of FICA tax credits is primarily driven by U.S. Restaurant sales and is not impacted by costs incurred that may reduce (Loss) income before (benefit) provision for income taxes.
The change in (Benefit) provision for income taxes is primarily due to FICA tax credits on certain tipped wages partially offset by the 2024 nondeductible losses associated with the Second 2025 Notes Partial Repurchase, relative to the 2024 pre-tax book loss.
We have a blended federal and state statutory rate of approximately 26% for all periods presented. The effective income tax rate in 2024 was lower than the blended federal and state statutory rate primarily due to the federal and state impact of nondeductible losses associated with the Second 2025 Notes Partial Repurchase, partially offset by the FICA tax credits on certain tipped wages, relative to the 2024 pre-tax book loss. The effective income tax rate in 2023 was lower than the blended federal and state statutory rate primarily due to the benefit of FICA tax credits on certain tipped wages.
Fiscal year 2023 as compared to fiscal year 2022 - continuing operations
Food and beverage cost decreased as a percentage of Restaurant sales due to 2.0% from increases in average check per person, primarily driven by an increase in menu pricing, and 0.6% from certain cost saving and productivity initiatives, partially offset by an increase of 1.4% from commodity inflation.
Labor and other related expense increased as a percentage of Restaurant sales primarily due to 1.9% from higher hourly and field management labor costs, primarily due to wage rate inflation, partially offset by decreases of 0.9% from an increase in average check per person and 0.3% from certain cost saving and productivity initiatives.
Other restaurant operating expense decreased as a percentage of Restaurant sales primarily due to: (i) 0.6% from an increase in average check per person, (ii) 0.4% from the favorable settlement of certain collective action wage and hour lawsuits and (iii) 0.3% from certain cost saving and productivity initiatives. These decreases were partially offset by increases of 0.9% from higher operating expenses, including utilities, primarily due to inflation, and 0.3% from higher advertising expense.
(Benefit) provision for income taxes includes a decrease in the effective income tax rate primarily due to the non-deductible losses recorded during 2022 associated with the First 2025 Notes Partial Repurchase, which is described in further detail within Note 11 - Convertible Senior Notes of the Notes to Consolidated Financial Statements.
BLOOMIN’ BRANDS, INC.
MANAGEMENT’S DISCUSSION AND ANALYSIS OF
FINANCIAL CONDITION AND RESULTS OF OPERATIONS - Continued
Segments
We consider each of our U.S. restaurant concepts and our international franchise business as operating segments, which reflects how we manage our business, review operating performance and allocate resources. All other operating segments, which include our operations in Hong Kong and China do not meet the quantitative thresholds for determining reportable operating segments.
Resources are allocated and performance is assessed by our Chief Executive Officer, whom we have determined to be our Chief Operating Decision Maker (“CODM”). We aggregate our U.S. operating segments into a U.S. reportable segment. The U.S. segment includes all restaurants operating in the U.S. while franchised restaurants operating outside the U.S. are included in the international franchise segment.
Revenues for both segments include only transactions with customers and exclude intersegment revenues. Excluded from Income from operations for U.S. are certain legal and corporate costs not directly related to the performance of the segments, most stock-based compensation expenses, a portion of insurance expenses and certain bonus expenses.
Operating income is utilized by our CODM as the segment profit or loss measure and to manage the business, review operating performance and allocate resources.
Refer to Note 19 - Segment Reporting of the Notes to Consolidated Financial Statements for reconciliation of segment income from operations to the consolidated operating results.
Summary financial data - Following is a summary of financial data by segment for the periods indicated:
| | | | | | | | | | | | | | | | | |
| U.S. |
| FISCAL YEAR |
| (dollars in thousands) | 2024 | | 2023 | | 2022 |
| Revenues | | | | | |
| Restaurant sales (1) | $ | 3,812,604 | | | $ | 4,005,053 | | | $ | 3,863,016 | |
| Franchise and other revenues | 44,530 | | | 48,546 | | | 48,854 | |
| Total revenues | $ | 3,857,134 | | | $ | 4,053,599 | | | $ | 3,911,870 | |
| | | | | |
| | | | | |
| | | | | |
| | | | | |
| | | | | |
| | | | | |
| | | | | |
| | | | | |
| Income from continuing operations | $ | 250,050 | | | $ | 377,534 | | | $ | 407,860 | |
| Operating income margin, continuing operations | 6.5 | % | | 9.3 | % | | 10.4 | % |
| | | | | |
| INTERNATIONAL FRANCHISE |
| FISCAL YEAR |
| (dollars in thousands) | 2024 | | 2023 | | 2022 |
| | | | | |
| | | | | |
| Franchise and other revenues (2) | $ | 39,490 | | | $ | 41,524 | | | $ | 36,202 | |
| | | | | |
| | | | | |
| Income from continuing operations | $ | 37,961 | | | $ | 39,207 | | | $ | 34,216 | |
| | | | | |
| | | | | |
| | | | | |
| | | | | |
| | | | | |
| | | | | |
____________________
(1)The decrease from 2023 to 2024 was primarily due to: (i) the restaurant sales during the 53rd week of 2023, (ii) the net impact of restaurant closures and openings and (iii) lower comparable restaurant sales. The increase from 2022 to 2023 was primarily due to the restaurant sales during the 53rd week of 2023 and higher comparable restaurant sales, partially offset by the net impact of restaurant closures and openings. See Results of Operations - Restaurant Sales for a rollforward of consolidated Restaurant sales.
(2)Includes international royalties from franchisees and royalties from our Brazil operations at our historical 5% intercompany rate. On December 30, 2024, we entered into franchise agreements in connection with the Brazil Sale Transaction that include royalty rates that are lower than our historical intercompany rates and on the low end of our international franchisee royalty percentage range.
BLOOMIN’ BRANDS, INC.
MANAGEMENT’S DISCUSSION AND ANALYSIS OF
FINANCIAL CONDITION AND RESULTS OF OPERATIONS - Continued
Income from continuing operations
U.S. - The decrease in U.S. Income from operations generated during 2024 as compared to 2023 was primarily due to: (i) lower restaurant sales, as discussed above, (ii) higher labor, operating and commodity costs, primarily due to inflation, (iii) higher impairment and closure costs and (iv) higher advertising, depreciation and amortization expense. These decreases were partially offset by an increase in average check per person and the impact of certain cost-saving and productivity initiatives.
Non-GAAP Financial Measures
In addition to the results provided in accordance with generally accepted accounting principles (“U.S. GAAP”), we provide certain non-GAAP measures, which present operating results on an adjusted basis. These are supplemental measures of performance that are not required by or presented in accordance with U.S. GAAP and include the following: (i) Restaurant-level operating income, adjusted restaurant-level operating income and their corresponding margins, (ii) Adjusted income from operations and the corresponding margin, (iii) Adjusted net income, (iv) Adjusted diluted earnings per share and (v) system-wide sales.
We believe that our use of non-GAAP financial measures permits investors to assess the operating performance of our business relative to our performance based on U.S. GAAP results and relative to other companies within the restaurant industry by isolating the effects of certain items that may vary from period to period without correlation to core operating performance or that vary widely among similar companies. However, our inclusion of these adjusted measures should not be construed as an indication that our future results will be unaffected by unusual or infrequent items or that the items for which we have made adjustments are unusual or infrequent or will not recur. We believe that the disclosure of these non-GAAP measures is useful to investors as they form part of the basis for how our management team and our Board evaluate our operating performance, allocate resources and establish employee incentive plans.
These non-GAAP financial measures are not intended to replace U.S. GAAP financial measures, and they are not necessarily standardized or comparable to similarly titled measures used by other companies. We maintain internal guidelines with respect to the types of adjustments we include in our non-GAAP measures. These guidelines endeavor to differentiate between types of gains and expenses that are reflective of our core operations in a period, and those that may vary from period to period without correlation to our core performance in that period. However, implementation of these guidelines involves the application of judgment, and the treatment of any items not directly addressed by, or changes to, our guidelines will be considered by our disclosure committee. Refer to the reconciliations of non-GAAP measures for descriptions of the actual adjustments made in the current period and the corresponding prior period.
BLOOMIN’ BRANDS, INC.
MANAGEMENT’S DISCUSSION AND ANALYSIS OF
FINANCIAL CONDITION AND RESULTS OF OPERATIONS - Continued
Consolidated Restaurant-level Operating Income and Adjusted Restaurant-level Operating Income and Corresponding Margins Non-GAAP Reconciliations - Restaurant-level operating margin is calculated as Restaurant sales after deduction of the main restaurant-level operating costs, which includes Food and beverage cost, Labor and other related expense and Other restaurant operating expense. Adjusted restaurant-level operating margin is Restaurant-level operating margin adjusted for certain items. The following table reconciles consolidated Income from continuing operations and the corresponding margin to restaurant-level operating income from continuing operations and consolidated adjusted restaurant-level operating income and the corresponding margins for the periods indicated:
| | | | | | | | | | | |
| Consolidated | FISCAL YEAR |
| (dollars in thousands) | 2024 | | 2023 |
| Income from continuing operations | $ | 139,808 | | | $ | 282,769 | |
| Operating income margin, continuing operations | 3.5 | % | | 6.8 | % |
| Less: | | | |
| Franchise and other revenues | 84,131 | | | 90,371 | |
| Plus: | | | |
| Depreciation and amortization | 175,580 | | | 169,266 | |
| General and administrative | 219,383 | | | 233,559 | |
| Provision for impaired assets and restaurant closings | 64,291 | | | 33,574 | |
| Restaurant-level operating income from continuing operations | $ | 514,931 | | | $ | 628,797 | |
| Restaurant-level operating margin | 13.3 | % | | 15.4 | % |
| Adjustments: | | | |
| | | |
| Legal and other matters (1) | — | | | (3,650) | |
| Asset impairments and closure-related charges (2) | 434 | | | (2,450) | |
| Partner compensation (3) | — | | | 1,894 | |
| Total restaurant-level operating income adjustments | 434 | | | (4,206) | |
| Adjusted restaurant-level operating income from continuing operations | $ | 515,365 | | | $ | 624,591 | |
| Adjusted restaurant-level operating margin, continuing operations | 13.3 | % | | 15.3 | % |
| Restaurant-level operating income from discontinued operations (4) | 108,062 | | | 117,500 | |
| Adjusted restaurant-level operating income | $ | 623,427 | | | $ | 742,091 | |
| Adjusted restaurant level operating margin | 14.2 | % | | 16.1 | % |
_________________(1)Reflects changes in legal reserves in connection with certain collective action wage and hour lawsuits.
(2)For 2023, includes lease remeasurement gains in connection with the 2023 Restaurant Closures. See Note 5 - Impairments and Exit Costs of the Notes to Consolidated Financial Statements for additional details regarding the 2023 Restaurant Closures.
(3)Costs incurred in connection with the transition to a new partner compensation program.
(4)No adjustments for the periods presented. Excludes intercompany royalty expense of $25.9 million and $26.4 million for 2024 and 2023, respectively, since the corresponding intercompany royalty revenue is included within Franchise and other revenues from continuing operations and is therefore already excluded from the calculation of restaurant-level operating income. See Note 3 - Discontinued Operations of the Notes to Consolidated Financial Statements for additional details.
BLOOMIN’ BRANDS, INC.
MANAGEMENT’S DISCUSSION AND ANALYSIS OF
FINANCIAL CONDITION AND RESULTS OF OPERATIONS - Continued
Adjusted Income from Operations Non-GAAP Reconciliations - The following table reconciles Income from continuing operations and the corresponding margin to adjusted income from operations and the corresponding margin for the periods indicated:
| | | | | | | | | | | |
| FISCAL YEAR |
| (dollars in thousands) | 2024 | | 2023 |
| Income from continuing operations | $ | 139,808 | | | $ | 282,769 | |
| Operating income margin, continuing operations | 3.5 | % | | 6.8 | % |
| Adjustments: | | | |
| Total restaurant-level operating income adjustments (1) | 434 | | | (4,206) | |
| Asset impairments and closure-related charges (2) | 63,009 | | | 28,236 | |
| Executive transition costs (3) | 4,121 | | | — | |
| Strategic initiative fees (4) | 6,500 | | | — | |
| Foreign currency hedge gains (5) | (15,728) | | | — | |
| Other (6) | — | | | 7,546 | |
| Total income from operations adjustments | 58,336 | | | 31,576 | |
| Adjusted income from operations, continuing operations | $ | 198,144 | | | $ | 314,345 | |
| Adjusted operating income margin, continuing operations | 5.0 | % | | 7.5 | % |
| Adjusted income from operations, discontinued operations (7) | 34,446 | | | 42,375 | |
| Adjusted income from operations | $ | 232,590 | | | $ | 356,720 | |
| Adjusted operating income margin | 5.2 | % | | 7.6 | % |
_________________
(1)See the Consolidated Restaurant-level Operating Income and Adjusted Restaurant-level Operating Income and Corresponding Margins Non-GAAP Reconciliations table above for details regarding restaurant-level operating income adjustments.
(2)Fiscal year 2024 includes asset impairment, closure costs and severance primarily in connection with: (i) the 2023 Restaurant Closures, (ii) the closure of nine restaurants in Hong Kong and (iii) the Q4 2024 Restaurant Impairment. Fiscal year 2023 includes asset impairment, closure costs and severance primarily in connection with the 2023 Restaurant Closures.
(3)Compensation costs and professional fees related to our CEO transition and severance related to other executive level changes.
(4)Represents fees incurred in connection with a project-based strategic initiative. The costs incurred represent third-party consulting fees related to a strategic initiative to develop revenue growth management capabilities for Outback Steakhouse and are included in General and administrative expense. Given the magnitude and scope of this initiative and that it is not expected to recur after 2024, we consider these incremental expenses to be distinct from other consulting fees that we incur in the ordinary course of business and not reflective of the ongoing costs to operate our business or operating performance in the period.
(5)Gains in connection with the foreign exchange forward contracts entered into to partially offset foreign currency exchange risk associated with installment payments from the Brazil Sale Transaction.
(6)Primarily includes professional fees, severance and other costs not correlated to our core operating performance during the period.
(7)Includes operating income from our Brazil operations for the periods presented, including intercompany royalty expense. For 2024, includes non-GAAP adjustments of $68.3 million for impairment of assets held for sale, $3.3 million of transaction related professional fees and $1.5 million of other impairment. See Note 3 - Discontinued Operations of the Notes to Consolidated Financial Statements for additional details.
BLOOMIN’ BRANDS, INC.
MANAGEMENT’S DISCUSSION AND ANALYSIS OF
FINANCIAL CONDITION AND RESULTS OF OPERATIONS - Continued
Adjusted Net Income and Adjusted Diluted Earnings Per Share Non-GAAP Reconciliations - The following table reconciles Net (loss) income attributable to Bloomin’ Brands to adjusted net income and adjusted diluted earnings per share for the periods indicated:
| | | | | | | | | | | |
| FISCAL YEAR |
| (in thousands, except per share data) | 2024 | | 2023 |
| | | |
| | | |
| Net (loss) income attributable to Bloomin’ Brands | $ | (128,018) | | | $ | 247,386 | |
| Net (loss) income from discontinued operations, net of tax | (75,982) | | | 41,629 | |
| Net (loss) income attributable to Bloomin’ Brands from continuing operations (1) | (52,036) | | | 205,757 | |
| Adjustments: | | | |
| Income from operations adjustments (2) | 58,336 | | | 31,576 | |
| Loss on extinguishment of debt (3) | 135,797 | | | — | |
| | | |
| Total adjustments, before income taxes | 194,133 | | | 31,576 | |
| Adjustment to provision for income taxes (4) | (13,001) | | | (7,872) | |
| Net adjustments, continuing operations | 181,132 | | | 23,704 | |
| Adjusted net income, continuing operations | 129,096 | | | 229,461 | |
| Adjusted net income, discontinued operations (5) | 30,246 | | | 38,700 | |
| Adjusted net income | $ | 159,342 | | | $ | 268,161 | |
| | | |
| Diluted (loss) earnings per share: | | | |
| Continuing operations | $ | (0.61) | | | $ | 2.13 | |
| Discontinued operations | (0.88) | | | 0.43 | |
| Net diluted (loss) earnings per share | $ | (1.49) | | | $ | 2.56 | |
| | | |
| Adjusted diluted earnings per share | | | |
| Continuing operations | $ | 1.45 | | | $ | 2.38 | |
| Discontinued operations | 0.34 | | | 0.40 | |
| Adjusted diluted earnings per share (6)(7) | $ | 1.79 | | | $ | 2.78 | |
| | | |
| Diluted weighted average common shares outstanding (7) | 85,905 | | | 96,453 | |
| Adjusted diluted weighted average common shares outstanding (6)(7) | 88,900 | | | 96,453 | |
_________________
(1)Represents net (loss) income from continuing operations less net income attributable to noncontrolling interests.
(2)See the Adjusted Income from Operations Non-GAAP Reconciliations table above for details regarding Income from operations adjustments.
(3)Includes losses in connection with the Second 2025 Notes Partial Repurchase, including settlements of the related convertible senior note hedges and warrants. See Note 11 - Convertible Senior Notes of the Notes to Consolidated Financial Statements for additional details.
(4)Includes the tax effects of non-GAAP adjustments determined based on the nature of the underlying non-GAAP adjustments and their relevant jurisdictional tax rates for all periods presented. The difference between GAAP and adjusted effective income tax rates during fiscal year 2024 primarily relates to nondeductible losses and other tax costs associated with the Second 2025 Notes Partial Repurchase.
(5)Includes net (loss) income from our Brazil operations for the periods presented and Income from operations adjustments described in footnote 7 of the Adjusted Income from Operations Non-GAAP Reconciliations table above. For 2024, also includes adjustments for $33.8 million of deferred income tax expense resulting from the Brazil Sale Transaction and the tax effects of non-GAAP adjustments. For 2023, also includes a $2.9 million adjustment related to a Brazil federal income tax exemption on certain state value added tax benefits. See Note 3 - Discontinued Operations of the Notes to Consolidated Financial Statements for additional details regarding the Brazil Sale Transaction.
(6)Adjusted diluted weighted average common shares outstanding for the fiscal years 2024 and 2023 were calculated including the effect of 1.6 million and 5.1 million dilutive securities, respectively, for outstanding 2025 Notes and the effect of 1.0 million and 3.4 million dilutive securities, respectively, for the Warrant Transactions, as defined below. In connection with the offering of the 2025 Notes, we entered into convertible note hedge transactions (the “Convertible Note Hedge Transactions”) and concurrently entered into warrant transactions relating to the same number of shares of our common stock (the “Warrant Transactions”). If our stock
BLOOMIN’ BRANDS, INC.
MANAGEMENT’S DISCUSSION AND ANALYSIS OF
FINANCIAL CONDITION AND RESULTS OF OPERATIONS - Continued
price is in excess of the conversion price of the 2025 Notes ($10.60 and $11.14 as of December 29, 2024 and December 31, 2023, respectively), the Convertible Note Hedge Transactions deliver shares to offset dilution from the 2025 Notes, which, in combination with the Warrant Transactions, effectively offset dilution from the 2025 Notes up to the strike price of the Warrant Transactions ($14.84 and $15.60 as of December 29, 2024 and December 31, 2023, respectively). Adjusted diluted earnings per share and adjusted diluted weighted average common shares outstanding for the fiscal year 2023 have been recast to remove the 5.1 million share benefit of the Convertible Note Hedge Transactions which was previously included as a non-GAAP share adjustment.
(7)Due to a GAAP net loss from continuing operations, antidilutive securities are excluded from diluted weighted average common shares outstanding for the fiscal year 2024. However, considering the adjusted net income position, adjusted diluted weighted average common shares outstanding incorporates securities that would have been dilutive for GAAP.
System-Wide Sales - System-wide sales is a non-GAAP financial measure that includes sales of all restaurants operating under our brand names, whether we own them or not. Management uses this information to make decisions about future plans for the development of additional restaurants and new concepts, as well as evaluation of current operations. System-wide sales comprise sales of Company-owned and franchised restaurants. For a summary of sales of Company-owned restaurants, refer to Note 4 - Revenue Recognition of the Notes to Consolidated Financial Statements.
The following table provides a summary of sales of franchised restaurants by segment for the periods indicated, which are not included in our consolidated Restaurant sales. Franchise sales within this table do not represent our sales and are presented only as an indicator of changes in the restaurant system, which management believes is important information regarding the health of our restaurant concepts and in determining our royalties and/or service fees.
| | | | | | | | | | | | | |
| FISCAL YEAR |
| (dollars in millions) | 2024 | | 2023 | | |
| U.S. | | | | | |
| Outback Steakhouse | $ | 499 | | | $ | 514 | | | |
| Carrabba’s Italian Grill | 43 | | | 48 | | | |
| Bonefish Grill | 9 | | | 10 | | | |
| Aussie Grill | 2 | | | — | | | |
| U.S. total | 553 | | | 572 | | | |
| International Franchise | | | | | |
| Outback Steakhouse - Brazil | 487 | | | 499 | | | |
| Outback Steakhouse - South Korea | 310 | | | 354 | | | |
| Other | 129 | | | 132 | | | |
| International Franchise total | 926 | | | 985 | | | |
| Total franchise sales | $ | 1,479 | | | $ | 1,557 | | | |
| | | | | |
| | | | | |
| | | | | |
| | | | | |
| | | | | |
| | | | | |
Liquidity and Capital Resources
Cash and Cash Equivalents
As of December 29, 2024, we had $70.1 million in cash and cash equivalents of which $10.0 million was held by foreign affiliates. The international jurisdictions in which we have significant cash do not have any known restrictions that would prohibit repatriation.
As of December 29, 2024, we did not have aggregate undistributed foreign earnings from its consolidated foreign subsidiaries.
BLOOMIN’ BRANDS, INC.
MANAGEMENT’S DISCUSSION AND ANALYSIS OF
FINANCIAL CONDITION AND RESULTS OF OPERATIONS - Continued
Borrowing Capacity and Debt Service
Credit Facilities - Following is a summary of our outstanding credit facilities as of the dates indicated and principal payments and debt issuance during the periods indicated:
| | | | | | | | | | | | | | | | | | | | | | | | | | | | | | | | | | | |
| REVOLVING CREDIT FACILITY | | | | | | | | TOTAL CREDIT FACILITIES |
| SENIOR SECURED CREDIT FACILITY | | | | FORMER CREDIT FACILITY | | | | | | 2025 NOTES | | 2029 NOTES | |
| (dollars in thousands) | | | | | | | |
| Balance as of December 25, 2022 | $ | — | | | | | $ | 430,000 | | | | | | | $ | 105,000 | | | $ | 300,000 | | | $ | 835,000 | |
| 2023 new debt | — | | | | | 1,079,000 | | | | | | | — | | | — | | | 1,079,000 | |
| 2023 payments | — | | | | | (1,128,000) | | | | | | | (214) | | | — | | | (1,128,214) | |
| Balance as of December 31, 2023 | — | | | | | 381,000 | | | | | | | 104,786 | | | 300,000 | | | 785,786 | |
| 2024 new debt | 1,070,000 | | | | | 1,195,000 | | | | | | | — | | | — | | | 2,265,000 | |
| 2024 payments | (360,000) | | | | | (1,576,000) | | | | | | | — | | | — | | | (1,936,000) | |
| 2024 repurchases and conversions | — | | | | | — | | | | | | | (84,062) | | | — | | | (84,062) | |
| Balance as of December 29, 2024 (1) | $ | 710,000 | | | | | $ | — | | | | | | | $ | 20,724 | | | $ | 300,000 | | | $ | 1,030,724 | |
| | | | | | | | | | | | | | | |
| Interest rates, as of December 29, 2024 (2) | 6.52 | % | | | | | | | | | | 5.00 | % | | 5.13 | % | | |
| Principal maturity date | September 2029 | | | | | | | | | | May 2025 | | April 2029 | | |
____________________
(1)Subsequent to December 29, 2024, we repaid $140.0 million on our revolving credit facility, primarily with proceeds from the Brazil Sale Transaction.
(2)Interest rate for revolving credit facility represents the weighted average interest rate as of December 29, 2024.
As of December 29, 2024, we had $474.0 million in available unused borrowing capacity under our revolving credit facility, net of letters of credit of $16.0 million.
Credit Agreement - On September 19, 2024, we and OSI, as co-borrowers, entered into the Third Amended and Restated Credit Agreement (the “Credit Agreement”) which provides for senior secured financing of up to $1.2 billion consisting of a revolving credit facility (the “Senior Secured Credit Facility”). The Senior Secured Credit Facility matures on September 19, 2029 and replaced our prior senior secured financing of up to $1.0 billion (the “Former Credit Facility”). Our total indebtedness and the interest rate applied to our borrowings remained unchanged as a result of the Credit Agreement.
Our Credit Agreement, as amended, contains various financial and non-financial covenants. A violation of these covenants could negatively impact our liquidity by restricting our ability to borrow under the revolving credit facility and cause an acceleration of the amounts due under the credit facilities.
See Note 10 - Long-term Debt, Net of the notes to Consolidated Financial Statements for additional details regarding the Credit Agreement.
As of December 29, 2024 and December 31, 2023, we were in compliance with our debt covenants. We believe that we will remain in compliance with our debt covenants during the next 12 months and beyond.
2025 Notes Partial Repurchase - On February 29, 2024, we and certain holders entered into exchange agreements (the “2024 Exchange Agreements”) in which the holders agreed to exchange $83.6 million in aggregate principal amount of our outstanding 2025 Notes for approximately 7.5 million shares of our common stock and $3.3 million in cash, including accrued interest (the “Second 2025 Notes Partial Repurchase”).
Convertible Note Hedge and Warrant Transactions - In connection with the Second 2025 Notes Partial Repurchase, we entered into partial unwind agreements with certain financial institutions relating to a portion of the convertible note hedge transactions (the “2024 Note Hedge Early Termination Agreements”) and a portion of the Warrant Transactions (the “2024 Warrant Early Termination Agreements”) that we previously entered into in connection
BLOOMIN’ BRANDS, INC.
MANAGEMENT’S DISCUSSION AND ANALYSIS OF
FINANCIAL CONDITION AND RESULTS OF OPERATIONS - Continued
with the issuance of the 2025 Notes. Upon settlement, we received a termination payment which consisted of approximately $118.2 million in cash and 0.3 million shares of our common stock for the note hedges and we made a termination payment in an aggregate amount of approximately $102.2 million in cash for the warrants.
See Note 11 - Convertible Senior Notes of the Notes to Consolidated Financial Statements for additional details regarding the Second 2025 Notes Partial Repurchase and related 2024 Note Hedge Early Termination Agreements and 2024 Warrant Early Termination Agreements.
Sources and Uses of Cash
Cash flows generated from operating activities and availability under our revolving credit facility are our principal sources of liquidity, which we use for operating expenses, development of new restaurants, remodeling older restaurants or relocating, investments in technology and dividend payments.
We believe that our expected liquidity sources are adequate to fund debt service requirements, lease obligations, capital expenditures and working capital obligations during the 12 months following this filing. However, our ability to continue to meet these requirements and obligations will depend on, among other things, our ability to achieve anticipated levels of revenue and cash flow and our ability to manage costs and working capital successfully.
Brazil Sale Transaction - On December 30, 2024 we received cash proceeds, net of withheld income taxes, of $103.9 million, in U.S. dollars based on the exchange rate on the closing date, representing 52% of total proceeds from the Brazil Sale Transaction, and applied the proceeds to our revolving credit facility during the thirteen weeks ended March 30, 2025. The second installment payment, representing 48% of total proceeds from the Brazil Sale Transaction, is due on December 30, 2025, which we also anticipate applying towards the revolving credit facility. The remaining 33% ownership interest is subject to a put-call mechanism contained in the shareholders agreement whereby the buyer may cause us to sell or we may cause the buyer to purchase the totality of the remaining interest during the fourth quarter of 2028 at a multiple of earnings defined in the shareholders agreement.
During 2024, we received $15.1 million of cash in connection with forward currency exchange contracts entered into concurrently with the Brazil Sale Transaction to hedge a portion of the foreign currency risk of the related purchase price installment payments.
Capital Expenditures - We estimate that our capital expenditures will total approximately $190 million to $210 million in 2025. The amount of actual capital expenditures may be affected by general economic, financial, competitive, legislative and regulatory factors, among other things, including raw material constraints.
Dividends and Share Repurchases - During 2024 and 2023, we declared and paid quarterly cash dividends of $0.24 per share.
In February 2025, our Board declared a quarterly cash dividend of $0.15 per share, payable on March 26, 2025. Future dividend payments are dependent on our earnings, financial condition, capital expenditure requirements, surplus and other factors that our Board considers relevant, as well as continued compliance with the financial covenants in our debt agreements.
BLOOMIN’ BRANDS, INC.
MANAGEMENT’S DISCUSSION AND ANALYSIS OF
FINANCIAL CONDITION AND RESULTS OF OPERATIONS - Continued
Following is a summary of our share repurchase programs active during the periods presented as of December 29, 2024 (dollars in thousands):
| | | | | | | | | | | | | | | | | | | | | | | | | | | | | | | | |
| SHARE REPURCHASE PROGRAM | | BOARD APPROVAL DATE | | AUTHORIZED | | REPURCHASED | | CANCELLED OR EXPIRED | | REMAINING |
| | | | | | | | | | |
| | | | | | | | | | |
| | | | | | | | | | |
| | | | | | | | | | |
| | | | | | | | | | |
| | | | | | | | | | |
| | | | | | | | | | |
| 2022 | | February 8, 2022 | | $ | 125,000 | | | $ | 125,000 | | | $ | — | | | $ | — | |
| 2023 | | February 7, 2023 | | $ | 125,000 | | | $ | 67,499 | | | $ | 57,501 | | | $ | — | |
| 2024 (1) | | February 13, 2024 | | $ | 350,000 | | | $ | 253,195 | | | $ | — | | | $ | 96,805 | |
| | | | | | | | |
________________(1)The 2024 Share Repurchase Program will expire on August 13, 2025.
The following table presents our dividends and share repurchases for the periods indicated:
| | | | | | | | | | | | | | | | | |
| (dollars in thousands) | DIVIDENDS PAID | | SHARE REPURCHASES | | TOTAL |
| Fiscal year 2024 | $ | 82,574 | | | $ | 265,695 | | | $ | 348,269 | |
| Fiscal year 2023 | 83,742 | | | 70,000 | | | 153,742 | |
| | | | | |
| | | | | |
| | | | | |
| | | | | |
| | | | | |
| | | | | |
| | | | | |
| | | | | |
| Total | $ | 166,316 | | | $ | 335,695 | | | $ | 502,011 | |
Our ability to pay dividends and make share repurchases is dependent on our ability to obtain funds from our subsidiaries, continued compliance with the financial covenants in our debt agreements and the existence of surplus, as well as our earnings, financial condition, capital expenditure requirements and other factors that our Board deems relevant.
Material Cash Requirements - The following table presents current and long-term material cash requirements as of December 29, 2024:
| | | | | | | | | | | | | | | | | | | | | | | | | | | | | |
| PAYMENTS DUE BY PERIOD |
| | | LESS THAN | | 1-3 | | 3-5 | | MORE THAN |
| (dollars in thousands) | TOTAL | | 1 YEAR | | YEARS | | YEARS | | 5 YEARS |
| Operating leases (1) | $ | 1,188,431 | | | $ | 162,067 | | | $ | 322,831 | | | $ | 242,395 | | | $ | 461,138 | |
| Long-term debt: | | | | | | | | | |
| Principal (2) | 1,030,724 | | | 20,724 | | | — | | | 1,010,000 | | | — | |
| Interest (3) | 294,869 | | | 63,793 | | | 127,226 | | | 103,850 | | | — | |
| Purchase obligations (4) | 168,464 | | | 124,727 | | | 24,892 | | | 17,422 | | | 1,423 | |
| Other obligations (5) | 58,328 | | | 10,047 | | | 11,216 | | | 3,666 | | | 33,399 | |
| Total | $ | 2,740,816 | | | $ | 381,358 | | | $ | 486,165 | | | $ | 1,377,333 | | | $ | 495,960 | |
| | | | | | | | | |
| | | | | | | | | |
| | | | | | | | | |
____________________
(1)Amounts represent undiscounted future minimum rental commitments under non-cancelable operating leases. Excludes $988.4 million related to operating lease renewal options that are reasonably certain of exercise.
(2)Includes Senior Secured Credit Facility, 2029 Notes and 2025 Notes. Amounts are not reduced by unamortized debt issuance costs totaling $3.3 million.
(3)Projected future interest payments on long-term debt are based on interest rates in effect as of December 29, 2024. Estimated interest expense includes the impact of variable-to-fixed interest rate swap agreements.
(4)Purchase obligations include agreements to purchase goods or services that are enforceable, legally binding and specify all significant terms, including fixed or minimum quantities to be purchased; fixed, minimum or variable price provisions; and the approximate timing of the transaction. We have purchase obligations with various vendors that consist primarily of inventory, technology, store-level services and fixtures and equipment.
(5)Includes other long-term liabilities, primarily consisting of deferred compensation obligations, deposits, undiscounted finance leases and other accrued obligations. Future indemnification obligations in connection with the Brazil Sale Transaction, subject to a cap under the terms of the related purchase agreement, and unrecognized tax benefits are excluded from this table since it is not possible to estimate when these future payments may occur.
BLOOMIN’ BRANDS, INC.
MANAGEMENT’S DISCUSSION AND ANALYSIS OF
FINANCIAL CONDITION AND RESULTS OF OPERATIONS - Continued
Summary of Cash Flows and Financial Condition
Cash Flows - The following chart presents a summary of our cash flows provided by (used in) operating, investing and financing activities from continuing operations for the periods indicated:
Operating activities - The decrease in net cash provided by operating activities during 2024 as compared to 2023 was primarily due to lower net earnings and changes in working capital.
The increase in net cash provided by operating activities during 2023 as compared to 2022 was primarily due to: (i) higher net earnings, (ii) decreased employee compensation payments and (iii) lower income tax payments. These increases were partially offset by higher rent and interest payments.
Investing activities - The decrease in net cash used in investing activities during 2024 as compared to 2023 was primarily due to lower capital expenditures and receipt of proceeds from foreign exchange forward contracts.
The increase in net cash used in investing activities during 2023 as compared to 2022 was primarily due to higher capital expenditures and a decrease in cash withdrawn from Company-owned life insurance policies.
Financing activities - The decrease in net cash used in financing activities during 2024 as compared to 2023 was primarily due to higher net draws on the revolving credit facility and net cash received from the 2024 Note Hedge Early Termination Agreements, partially offset by higher repurchases of common stock and lower net proceeds from share-based compensation.
The decrease in net cash used in financing activities during 2023 as compared to 2022 was primarily due to: (i) a decrease in repurchases of common stock, (ii) higher net proceeds from share-based compensation and (iii) partner equity plan payments during 2022. These decreases were partially offset by higher payments of cash dividends on our common stock and increased repayments on our debt.
Financial Condition - Following is a summary of our current assets, current liabilities and working capital (deficit) as of the periods indicated:
| | | | | | | | | | | |
| (dollars in thousands) | DECEMBER 29, 2024 | | DECEMBER 31, 2023 |
| Current assets | $ | 320,519 | | | $ | 343,314 | |
| Current liabilities | 952,336 | | | 1,002,335 | |
| Working capital (deficit) | $ | (631,817) | | | $ | (659,021) | |
| | | |
| | | |
| | | |
BLOOMIN’ BRANDS, INC.
MANAGEMENT’S DISCUSSION AND ANALYSIS OF
FINANCIAL CONDITION AND RESULTS OF OPERATIONS - Continued
Working capital (deficit) includes: (i) Unearned revenue primarily from unredeemed gift cards of $374.1 million and $380.2 million as of December 29, 2024 and December 31, 2023, respectively, and (ii) current operating lease liabilities of $158.8 million and $163.7 million as of December 29, 2024 and December 31, 2023, respectively, with the corresponding operating right-of-use assets recorded as non-current on our Consolidated Balance Sheets. We have, and in the future may continue to have, negative working capital balances (as is common for many restaurant companies). We operate successfully with negative working capital because cash collected on restaurant sales is typically received before payment is due on our current liabilities, and our inventory turnover rates require relatively low investment in inventories. Additionally, ongoing cash flows from restaurant operations and gift card sales are typically used to service debt obligations and to make capital expenditures.
Critical Accounting Policies and Estimates
Our discussion and analysis of our financial condition and results of operations are based upon our consolidated financial statements, which have been prepared in accordance with U.S. GAAP. The preparation of these accompanying consolidated financial statements requires us to make estimates and judgments that affect the reported amounts of assets, liabilities, revenues and expenses, and related disclosure of contingent assets and liabilities during the reporting period. We base our estimates on historical experience and on various other assumptions that are believed to be reasonable under the circumstances, the results of which form the basis for making judgments about the carrying value of assets and liabilities that are not readily apparent from other sources. Actual results may differ from these estimates under different assumptions or conditions. We consider an accounting estimate to be critical if it requires assumptions to be made and changes in these assumptions could have a material impact on our consolidated financial condition or results of operations.
Impairment or Disposal of Long-Lived Assets - Long-lived assets are reviewed for impairment whenever events or changes in circumstances indicate that the carrying value may not be recoverable. The evaluation is performed at the lowest level of identifiable cash flows independent of other assets. For long-lived assets deployed at our restaurants, we review for impairment at the individual restaurant level.
When evaluating for impairment, the total future undiscounted cash flows expected to be generated by the assets are compared to the carrying amount. If the total future undiscounted cash flows expected to be generated by the assets are less than the carrying amount, this may be an indicator of impairment. An impairment loss is recognized in earnings when the asset’s carrying value exceeds its estimated fair value. Fair value is generally estimated using a discounted cash flow model. The key estimates and assumptions used in this model are future cash flow estimates, with material changes generally driven by changes in expected use, and the discount rate. These estimates are subjective and our ability to realize future cash flows and asset fair values is affected by factors such as the period of time the restaurant has been open, ongoing maintenance and improvement of the assets, changes in economic conditions and changes in our operating performance. Historically, the change in useful lives of our assets as a result of planned closures or the decision not to renew leases has been a key factor in the impairment we have recognized.
Goodwill and Indefinite-Lived Intangible Assets - Goodwill and indefinite-lived intangible assets are not subject to amortization and are tested for impairment annually in the second fiscal quarter, or whenever events or changes in circumstances indicate that the carrying amount may not be recoverable.
We may elect to perform a qualitative assessment to determine whether it is more likely than not that a reporting unit is impaired. In considering the qualitative approach, we evaluate factors including, but not limited to, macroeconomic conditions, market and industry conditions, commodity cost fluctuations, competitive environment, share price performance, results of prior impairment tests, operational stability and the overall financial performance of the reporting units. Any adverse change in these factors could have a significant impact on the recoverability of assets and could have a material impact on our consolidated financial statements.
BLOOMIN’ BRANDS, INC.
MANAGEMENT’S DISCUSSION AND ANALYSIS OF
FINANCIAL CONDITION AND RESULTS OF OPERATIONS - Continued
If the qualitative assessment is not performed or if we determine that it is not more likely than not that the fair value of the reporting unit exceeds the carrying value, a quantitative approach, using the fair value of the reporting unit, is calculated. Fair value of a reporting unit is the price a willing buyer would pay for the reporting unit and is estimated by utilizing a weighted average of the income approach, using a discounted cash flow model, and, when appropriate, the market approach including the guideline public company method and guideline transaction method. The key estimates and assumptions used in this assessment are future cash flow estimates, which are heavily influenced by revenue growth rates, operating margins and capital expenditures. These estimates are subjective, and our ability to achieve the forecasted cash flows used in our fair value calculations is affected by factors such as the success of strategic initiatives, changes in economic conditions and discount rates, changes in our operating performance and changes in our business strategies.
We estimate the fair value of trade names using the relief-from-royalty method, which requires assumptions related to projected sales for each reporting unit, assumed market royalty rates applicable to the trade names, and discount rates.
The carrying value of the reporting unit or trade name is compared to its estimated fair value, with any excess of carrying value over fair value deemed to be an impairment.
The carrying value of goodwill and trade names as of December 29, 2024 was $213.3 million and $414.7 million, respectively. We performed our annual impairment test in the second quarter of 2024 by utilizing the qualitative approach and determined that there were no events or circumstances to indicate that it was more likely than not that the fair value of any of our reporting units was less than their carrying values.
Sales declines at our restaurants, unplanned increases in commodity or labor costs, deterioration in overall economic conditions and challenges in the restaurant industry may result in future impairment charges. It is possible that changes in circumstances or changes in our judgments, assumptions and estimates could result in impairment of a portion or all of our goodwill or other intangible assets.
Leases - We use judgment at lease inception to determine the reasonably certain lease term, which in turn, impacts the applicable incremental borrowing rate (“IBR”) used to calculate the initial lease liability for each portfolio of leases. Other assumptions used in determining our incremental borrowing rate include our implied credit rating and an estimate of secured borrowing rates based on comparable market data. We determined the present value of the lease liabilities by using a country specific IBR and applying a single rate to the respective portfolio of leases based on term, regardless of the underlying asset type.
The reasonably certain lease term used in the evaluation of new leases includes renewal option periods only in instances in which the exercise of the renewal option is reasonably certain because failure to exercise such an option would result in an economic penalty. Such an economic penalty would typically result from having to abandon a building or equipment with remaining economic value upon vacating a property.
At the inception of each lease, we evaluate the property and the lease to determine whether the lease is an operating lease or a finance lease. This lease accounting evaluation may require significant judgment in determining the fair value and useful life of the leased property and the appropriate reasonably certain lease term. Determination of the reasonably certain lease term impacts the period in which buildings are depreciated. These judgments may produce materially different amounts of rent and depreciation expense in a given reporting period than would be reported if different assumed lease terms were used.
Insurance Reserves - We carry insurance programs with specific retention levels or high per-claim deductibles for a significant portion of expected losses under our workers’ compensation, general or liquor liability, health, property and management liability insurance programs. For some programs, we maintain stop-loss coverage to limit the exposure relating to certain risks.
BLOOMIN’ BRANDS, INC.
MANAGEMENT’S DISCUSSION AND ANALYSIS OF
FINANCIAL CONDITION AND RESULTS OF OPERATIONS - Continued
We record a liability for all unresolved and incurred but not reported claims at the anticipated cost below our specified retention levels or per-claim deductible amounts. Our liability for insurance claims was $53.0 million and $45.9 million as of December 29, 2024 and December 31, 2023, respectively. In establishing our reserves, we consider certain actuarial assumptions and judgments regarding economic conditions, and the frequency and severity of claims. The establishment of the reserves utilizing such estimates and assumptions is in part based on the premise that historical claims experience is indicative of current or future expected activity, which could differ significantly. Reserves recorded for workers’ compensation and general or liquor liability claims are discounted using the average of the one-year and five-year risk-free rate of monetary assets that have comparable maturities.
If actual results are not consistent with our estimates or assumptions, we may be exposed to losses or gains that could be material. A 50 basis point change in the discount rate in our insurance claim liabilities as of December 29, 2024, would have affected net earnings by $0.6 million in 2024.
Income Taxes - Deferred tax assets and liabilities are recognized based on the differences between the financial statement carrying amounts of assets and liabilities and their respective tax basis. Deferred tax assets and liabilities are measured using the tax rates, based on certain judgments regarding enacted tax laws and published guidance, in effect in the years in which we expect those temporary differences to reverse. As of December 29, 2024, tax loss carryforwards and credit carryforwards that do not have a valuation allowance are expected to be recoverable within the applicable statutory expiration periods. We currently expect to utilize general business tax credit carryforwards within a 10-year period. However, our ability to utilize these tax credits could be adversely impacted by, among other items, a future “ownership change” as defined under Section 382 of the Internal Revenue Code as well as the Company’s inability to generate sufficient future taxable income. A valuation allowance is established against the deferred tax assets when it is more likely than not that some portion or all of the deferred taxes may not be realized. Changes in assumptions regarding our level and composition of earnings, tax laws or the deferred tax valuation allowance and the results of tax audits and litigation, may materially impact the effective income tax rate.
While we consider all of our tax positions to be fully supportable, our income tax returns, like those of most companies, are periodically audited by U.S. and foreign tax authorities. In determining taxable income, income or loss before taxes is adjusted for differences between local tax laws and generally accepted accounting principles. A tax benefit from an uncertain position is recognized only if it is more likely than not that the position is sustainable based on its technical merits. For uncertain tax positions that do not meet this threshold, we recognize a liability. The liability for unrecognized tax benefits requires significant management judgment regarding exposures about our various tax positions. These assumptions and probabilities are reviewed and updated based upon new information. An unfavorable tax settlement could require the use of cash and an increase in the amount of income tax expense we recognize. As of December 29, 2024, we had $17.1 million of unrecognized tax benefits, including accrued interest and penalties, that if recognized, would impact our effective income tax rate.
Recently Issued Financial Accounting Standards
For a description of recently issued Financial Accounting Standards that we adopted in 2024 and, that are applicable to us and likely to have material effect on our consolidated financial statements, but have not yet been adopted, see Note 2 - Summary of Significant Accounting Policies of the Notes to Consolidated Financial Statements.
Item 7A. Quantitative and Qualitative Disclosures about Market Risk
We are exposed to market risk from changes in commodity prices, labor inflation, interest rates and foreign currency exchange rates.
Commodity Pricing Risk
Many of the ingredients used in the products sold in our restaurants are commodities that are subject to unpredictable price volatility. Although we attempt to minimize the effect of price volatility by negotiating fixed price contracts for the supply of key ingredients, there are no established fixed price markets for certain commodities such as produce and wild fish, and we are subject to prevailing market conditions when purchasing those types of commodities. Other commodities are purchased based upon negotiated price ranges established with vendors with reference to the fluctuating market prices. The related agreements may contain contractual features that limit the price paid by establishing certain price floors and caps. As of December 29, 2024, approximately 80% of our estimated 2025 annual food purchases are covered by fixed contracts, most of which are scheduled to expire during 2025.
During 2024, we experienced 1.1% commodity inflation in the U.S. and anticipate 2.5% to 3.5% commodity inflation for 2025. Extreme changes in commodity prices or long-term changes could affect our financial results adversely. Currently we do not use financial instruments to hedge our commodity risk.
In addition to the market risks identified above, we are subject to business risk as our U.S. beef supply is highly dependent upon a limited number of vendors. If these vendors were unable to fulfill their obligations under their contracts, we could encounter supply shortages and incur higher costs to secure adequate supplies. See Note 18 - Commitments and Contingencies of the Notes to Consolidated Financial Statements for further details.
Labor Inflation
Our restaurant operations are subject to federal and state minimum wage and other laws governing such matters as working conditions, overtime and tip credits. A significant number of our restaurant team members are paid at rates related to the federal and/or state minimum wage and, accordingly, increases in the minimum wage increase our labor costs. During 2024, we experienced 3.7% labor cost inflation in the U.S and anticipate 4.0% to 5.0% labor cost inflation for 2025.
Interest Rate Risk
Our interest rate risk management objective is to limit the impact of interest rate changes on earnings and cash flows by targeting an appropriate mix of variable and fixed-rate debt. We manage our exposure to market risk through regular operating and financing activities, using a combination of fixed-rate and variable-rate debt, and when deemed appropriate, through the use of derivative financial instruments. The amount of variable-rate debt fluctuates during the year based on our working capital requirements. As of December 29, 2024, our interest rate risk was primarily from variable interest rate changes on our revolving credit facility.
We periodically evaluate financial instruments to hedge our exposure to variable interest rates. We use derivative financial instruments as risk management tools and not for speculative purposes. To manage the risk of fluctuations in variable interest rate debt, we have interest rate swaps with an aggregate notional amount of $375.0 million, with $100.0 million maturing on December 31, 2024, $100.0 million maturing on December 31, 2025, and $175.0 million maturing March 31, 2026. See Note 13 - Derivative Instruments and Hedging Activities of the Notes to Consolidated Financial Statements for further information.
We utilize valuation models to estimate the effects of changing interest rates. The following table summarizes the changes to fair value and interest expense under a shock scenario. This analysis assumes that interest rates change suddenly, as an interest rate “shock”, and continue to increase or decrease at a consistent level above or below the SOFR curve.
| | | | | | | | | | | |
| DECEMBER 29, 2024 |
| (dollars in thousands) | INCREASE | | DECREASE |
| Change in fair value (1): | | | |
| Interest rate swap | $ | 5,693 | | | $ | (5,847) | |
| | | |
| Change in annual interest expense (1): | | | |
| Variable rate debt | $ | 8,700 | | | $ | (8,700) | |
________________(1)The potential change from a hypothetical 200 basis point increase (decrease) in short-term interest rates.
Foreign Currency Exchange Rate Risk
We are subject to foreign currency exchange risk. To manage a portion of our exchange rate risk, we entered into foreign currency forward contracts during 2024 to partially offset the foreign currency exchange gains and losses generated by the rate risk associated with the purchase price installment payments from the Brazil Sale Transaction. We recorded gains of $15.7 million as a result of changes in the fair value of foreign currency forward contracts during fiscal year 2024. As of December 29, 2024, the fair value of the derivative instruments was $0.3 million in an asset position.
As of December 29, 2024, our total notional amount of outstanding foreign currency forward contracts was $184.6 million. Subsequent to December 29, 2024, the outstanding notional amount decreased to $107.7 million following the collection of the first installment payment from the Brazil Sale Transaction. A hypothetical 10% increase or decrease in the Brazilian Real relative to the U.S. dollar for the remaining $107.7 million notional amount would result in a corresponding increase or decrease of approximately $8.4 million or $(10.2) million, respectively, in operating income with a corresponding decrease or increase in the U.S. dollar value of the hedged portion of the related receivable.
This market risk discussion contains forward-looking statements. Actual results may differ materially from the discussion based upon general market conditions and changes in U.S. and global financial markets.
Item 8. Financial Statements and Supplementary Data
INDEX TO FINANCIAL INFORMATION
Management’s Annual Report on Internal Control over Financial Reporting
Management is responsible for establishing and maintaining adequate internal control over financial reporting, as such term is defined in Exchange Act Rule 13a-15(f). The Company’s internal control over financial reporting includes those policies and procedures that (i) pertain to the maintenance of records that in reasonable detail accurately and fairly reflect the transactions and dispositions of the assets of the Company; (ii) provide reasonable assurance that transactions are recorded as necessary to permit preparation of financial statements in accordance with generally accepted accounting principles, and that receipts and expenditures of the Company are being made only in accordance with authorizations of management and directors of the Company; and (iii) provide reasonable assurance regarding prevention or timely detection of unauthorized acquisition, use or disposition of the Company’s assets that could have a material effect on the financial statements.
Internal control over financial reporting is designed to provide reasonable assurance regarding the reliability of financial reporting and the preparation of financial statements prepared for external purposes in accordance with generally accepted accounting principles. Because of its inherent limitations, internal control over financial reporting may not prevent or detect misstatements. Also, projections of any evaluation of effectiveness to future periods are subject to the risk that controls may become inadequate because of changes in conditions, or that the degree of compliance with the policies or procedures may deteriorate.
Under the supervision and with the participation of management, including our Chief Executive Officer and Chief Financial Officer, we carried out an evaluation of the effectiveness of our internal control over financial reporting as of December 29, 2024 using the criteria described in Internal Control—Integrated Framework issued by the Committee of Sponsoring Organizations of the Treadway Commission (2013 Framework) (“COSO”). Based upon our evaluation, management concluded that our internal control over financial reporting was effective as of December 29, 2024.
The effectiveness of our internal control over financial reporting as of December 29, 2024 has been audited by PricewaterhouseCoopers LLP, an independent registered public accounting firm, as stated in their report which is included herein.
Report of Independent Registered Public Accounting Firm
To the Board of Directors and Stockholders of Bloomin’ Brands, Inc.
Opinions on the Financial Statements and Internal Control over Financial Reporting
We have audited the accompanying consolidated balance sheets of Bloomin’ Brands, Inc. and its subsidiaries (the “Company”) as of December 29, 2024 and December 31, 2023 and the related consolidated statements of operations and comprehensive (loss) income, of changes in stockholders’ equity and of cash flows for each of the three years in the period ended December 29, 2024, including the related notes (collectively referred to as the “consolidated financial statements”). We also have audited the Company’s internal control over financial reporting as of December 29, 2024, based on criteria established in Internal Control - Integrated Framework (2013) issued by the Committee of Sponsoring Organizations of the Treadway Commission (COSO).
In our opinion, the consolidated financial statements referred to above present fairly, in all material respects, the financial position of the Company as of December 29, 2024 and December 31, 2023 and the results of its operations and its cash flows for each of the three years in the period ended December 29, 2024 in conformity with accounting principles generally accepted in the United States of America. Also in our opinion, the Company maintained, in all material respects, effective internal control over financial reporting as of December 29, 2024, based on criteria established in Internal Control - Integrated Framework (2013) issued by the COSO.
Basis for Opinions
The Company’s management is responsible for these consolidated financial statements, for maintaining effective internal control over financial reporting, and for its assessment of the effectiveness of internal control over financial reporting, included in the accompanying Management’s Annual Report on Internal Control over Financial Reporting. Our responsibility is to express opinions on the Company’s consolidated financial statements and on the Company’s internal control over financial reporting based on our audits. We are a public accounting firm registered with the Public Company Accounting Oversight Board (United States) (PCAOB) and are required to be independent with respect to the Company in accordance with the U.S. federal securities laws and the applicable rules and regulations of the Securities and Exchange Commission and the PCAOB.
We conducted our audits in accordance with the standards of the PCAOB. Those standards require that we plan and perform the audits to obtain reasonable assurance about whether the consolidated financial statements are free of material misstatement, whether due to error or fraud, and whether effective internal control over financial reporting was maintained in all material respects.
Our audits of the consolidated financial statements included performing procedures to assess the risks of material misstatement of the consolidated financial statements, whether due to error or fraud, and performing procedures that respond to those risks. Such procedures included examining, on a test basis, evidence regarding the amounts and disclosures in the consolidated financial statements. Our audits also included evaluating the accounting principles used and significant estimates made by management, as well as evaluating the overall presentation of the consolidated financial statements. Our audit of internal control over financial reporting included obtaining an understanding of internal control over financial reporting, assessing the risk that a material weakness exists, and testing and evaluating the design and operating effectiveness of internal control based on the assessed risk. Our audits also included performing such other procedures as we considered necessary in the circumstances. We believe that our audits provide a reasonable basis for our opinions.
Definition and Limitations of Internal Control over Financial Reporting
A company’s internal control over financial reporting is a process designed to provide reasonable assurance regarding the reliability of financial reporting and the preparation of financial statements for external purposes in accordance with generally accepted accounting principles. A company’s internal control over financial reporting
includes those policies and procedures that (i) pertain to the maintenance of records that, in reasonable detail, accurately and fairly reflect the transactions and dispositions of the assets of the company; (ii) provide reasonable assurance that transactions are recorded as necessary to permit preparation of financial statements in accordance with generally accepted accounting principles, and that receipts and expenditures of the company are being made only in accordance with authorizations of management and directors of the company; and (iii) provide reasonable assurance regarding prevention or timely detection of unauthorized acquisition, use, or disposition of the company’s assets that could have a material effect on the financial statements.
Because of its inherent limitations, internal control over financial reporting may not prevent or detect misstatements. Also, projections of any evaluation of effectiveness to future periods are subject to the risk that controls may become inadequate because of changes in conditions, or that the degree of compliance with the policies or procedures may deteriorate.
Critical Audit Matters
The critical audit matter communicated below is a matter arising from the current period audit of the consolidated financial statements that was communicated or required to be communicated to the audit committee and that (i) relates to accounts or disclosures that are material to the consolidated financial statements and (ii) involved our especially challenging, subjective, or complex judgments. The communication of critical audit matters does not alter in any way our opinion on the consolidated financial statements, taken as a whole, and we are not, by communicating the critical audit matter below, providing a separate opinion on the critical audit matter or on the accounts or disclosures to which it relates.
Valuation of Insurance Reserves
As described in Notes 2 and 18 to the consolidated financial statements, the Company’s consolidated discounted insurance reserves balance was $53.0 million as of December 29, 2024. The Company carries insurance programs with specific retention levels or high per-claim deductibles for a significant portion of expected losses under its workers’ compensation, general or liquor liability, health, property and management liability insurance programs. The Company records a liability for all unresolved claims and for an estimate of incurred but not reported claims at the anticipated cost that falls below its specified retention levels or per-claim deductible amounts. In establishing reserves, management considers certain actuarial assumptions and judgments regarding economic conditions and the frequency and severity of claims. Reserves recorded for workers’ compensation and general liability claims are discounted using the average of the one-year and five-year risk-free rate of monetary assets that have comparable maturities. The principal considerations for our determination that performing procedures relating to the valuation of insurance reserves is a critical audit matter are (i) the significant judgment by management when developing the estimated reserves, which in turn led to (ii) a high degree of auditor judgment, subjectivity, and effort in performing procedures and evaluating the actuarial assumptions related to economic conditions and the frequency and severity of claims, and (iii) the audit effort included the involvement of professionals with specialized skill and knowledge. Addressing the matter involved performing procedures and evaluating audit evidence in connection with forming our overall opinion on the consolidated financial statements. These procedures included testing the effectiveness of controls relating to the valuation of insurance reserves. These procedures also included, among others, (i) evaluating management’s process for developing the insurance reserves, (ii) evaluating the appropriateness of management’s actuarial methods used, (iii) evaluating the reasonableness of the actuarial assumptions related to economic conditions and the frequency and severity of claims, and (iv) testing the completeness and accuracy of underlying data used in the valuation. Evaluating the actuarial assumptions related to economic conditions and the frequency and severity of claims involved evaluating whether the assumptions were reasonable considering inflation and the environment, and whether these assumptions were consistent with evidence obtained in other areas of the audit. Professionals with specialized skill and knowledge were used to assist in evaluating the appropriateness of
management’s actuarial methods used in determining the insurance reserves and evaluating the reasonableness of assumptions related to economic conditions.
/s/ PricewaterhouseCoopers LLP
Tampa, Florida
February 26, 2025
We have served as the Company’s auditor since 1998.
BLOOMIN’ BRANDS, INC.
CONSOLIDATED BALANCE SHEETS
(IN THOUSANDS, EXCEPT SHARE AND PER SHARE DATA)
| | | | | | | | | | | |
| DECEMBER 29, 2024 | | DECEMBER 31, 2023 |
| ASSETS | | | |
| Current assets | | | |
| Cash and cash equivalents | $ | 70,056 | | | $ | 111,519 | |
| Restricted cash and cash equivalents | — | | | 2,854 | |
| Inventories | 68,699 | | | 62,948 | |
| Other current assets, net | 158,775 | | | 137,898 | |
| Current assets of discontinued operations held for sale | 22,989 | | | 28,095 | |
| Total current assets | 320,519 | | | 343,314 | |
| | | |
| Property, fixtures and equipment, net | 948,521 | | | 928,165 | |
| Operating lease right-of-use assets | 1,012,857 | | | 1,031,271 | |
| Goodwill | 213,323 | | | 213,323 | |
| Intangible assets, net | 429,091 | | | 432,916 | |
| Deferred income tax assets, net | 185,522 | | | 155,172 | |
| Other assets, net | 74,471 | | | 60,090 | |
| Non-current assets of discontinued operations held for sale | 200,501 | | | 259,830 | |
| Total assets | $ | 3,384,805 | | | $ | 3,424,081 | |
| LIABILITIES AND STOCKHOLDERS’ EQUITY | | | |
| Current liabilities | | | |
| Accounts payable | $ | 153,161 | | | $ | 155,874 | |
| Current operating lease liabilities | 158,806 | | | 163,724 | |
| Accrued and other current liabilities | 178,314 | | | 197,681 | |
| Unearned revenue | 374,099 | | | 380,154 | |
| | | |
| Current liabilities of discontinued operations held for sale | 87,956 | | | 104,902 | |
| Total current liabilities | 952,336 | | | 1,002,335 | |
| Non-current operating lease liabilities | 1,088,518 | | | 1,087,353 | |
| Deferred income tax liabilities, net | 33,822 | | | — | |
| Long-term debt, net | 1,027,398 | | | 780,719 | |
| Other long-term liabilities, net | 93,420 | | | 83,026 | |
| Non-current liabilities of discontinued operations held for sale | 49,865 | | | 58,645 | |
| Total liabilities | 3,245,359 | | | 3,012,078 | |
| Commitments and contingencies (Note 18) | | | |
| | | |
| | | |
| Stockholders’ equity | | | |
| Bloomin’ Brands stockholders’ equity | | | |
| Preferred stock, $0.01 par value, 25,000,000 shares authorized; no shares issued and outstanding as of December 29, 2024 and December 31, 2023 | — | | | — | |
| Common stock, $0.01 par value, 475,000,000 shares authorized; 84,854,768 and 86,968,536 shares issued and outstanding as of December 29, 2024 and December 31, 2023, respectively | 849 | | | 870 | |
| Additional paid-in capital | 1,273,288 | | | 1,115,387 | |
| Accumulated deficit | (925,834) | | | (528,831) | |
| Accumulated other comprehensive loss | (212,793) | | | (178,304) | |
| Total Bloomin’ Brands stockholders’ equity | 135,510 | | | 409,122 | |
| Noncontrolling interests | 3,936 | | | 2,881 | |
| Total stockholders’ equity | 139,446 | | | 412,003 | |
| Total liabilities and stockholders’ equity | $ | 3,384,805 | | | $ | 3,424,081 | |
| | | |
| The accompanying notes are an integral part of these consolidated financial statements. |
BLOOMIN’ BRANDS, INC.
CONSOLIDATED STATEMENTS OF OPERATIONS AND COMPREHENSIVE (LOSS) INCOME
(IN THOUSANDS, EXCEPT PER SHARE DATA)
| | | | | | | | | | | | | | | | | |
| FISCAL YEAR |
| 2024 | | 2023 | | 2022 |
| Revenues | | | | | |
| Restaurant sales | $ | 3,866,344 | | | $ | 4,077,789 | | | $ | 3,923,894 | |
| Franchise and other revenues | 84,131 | | | 90,371 | | | 85,356 | |
| Total revenues | 3,950,475 | | | 4,168,160 | | | 4,009,250 | |
| Costs and expenses | | | | | |
| Food and beverage | 1,147,859 | | | 1,240,485 | | | 1,237,418 | |
| Labor and other related | 1,202,520 | | | 1,219,839 | | | 1,141,626 | |
| Other restaurant operating | 1,001,034 | | | 988,668 | | | 955,328 | |
| Depreciation and amortization | 175,580 | | | 169,266 | | | 149,900 | |
| General and administrative | 219,383 | | | 233,559 | | | 212,932 | |
| | | | | |
| Provision for impaired assets and restaurant closings | 64,291 | | | 33,574 | | | 5,964 | |
| Total costs and expenses | 3,810,667 | | | 3,885,391 | | | 3,703,168 | |
| Income from operations | 139,808 | | | 282,769 | | | 306,082 | |
| Loss on extinguishment of debt | (136,022) | | | — | | | (107,630) | |
| Loss on fair value adjustment of derivatives, net | — | | | — | | | (17,685) | |
| | | | | |
| Interest expense, net | (62,593) | | | (51,582) | | | (53,364) | |
| (Loss) income before (benefit) provision for income taxes | (58,807) | | | 231,187 | | | 127,403 | |
| (Benefit) provision for income taxes | (12,134) | | | 18,402 | | | 34,253 | |
| Net (loss) income from continuing operations | (46,673) | | | 212,785 | | | 93,150 | |
| Net (loss) income from discontinued operations, net of tax | (75,982) | | | 41,629 | | | 16,053 | |
| Net (loss) income | (122,655) | | | 254,414 | | | 109,203 | |
| Less: net income attributable to noncontrolling interests | 5,363 | | | 7,028 | | | 7,296 | |
| Net (loss) income attributable to Bloomin’ Brands | $ | (128,018) | | | $ | 247,386 | | | $ | 101,907 | |
| | | | | |
| Net (loss) income | $ | (122,655) | | | $ | 254,414 | | | $ | 109,203 | |
| Other comprehensive (loss) income: | | | | | |
| Foreign currency translation, net of reclassification adjustments | (34,483) | | | 7,622 | | | 10,169 | |
| | | | | |
| | | | | |
| | | | | |
| | | | | |
| Net (loss) gain on derivatives, net of tax | (6) | | | (615) | | | 10,509 | |
| Comprehensive (loss) income | (157,144) | | | 261,421 | | | 129,881 | |
| Less: comprehensive income attributable to noncontrolling interests | 5,363 | | | 7,028 | | | 7,296 | |
| Comprehensive (loss) income attributable to Bloomin’ Brands | $ | (162,507) | | | $ | 254,393 | | | $ | 122,585 | |
| | | | | |
| Basic (loss) earnings per share: | | | | | |
| Continuing operations | $ | (0.61) | | | $ | 2.36 | | | $ | 0.97 | |
| Discontinued operations | (0.88) | | | 0.48 | | | 0.18 | |
| Net basic (loss) earnings per share | $ | (1.49) | | | $ | 2.84 | | | $ | 1.15 | |
| | | | | |
| Diluted (loss) earnings per share: | | | | | |
| Continuing operations | $ | (0.61) | | | $ | 2.13 | | | $ | 0.87 | |
| Discontinued operations | (0.88) | | | 0.43 | | | 0.16 | |
| Net diluted (loss) earnings per share | $ | (1.49) | | | $ | 2.56 | | | $ | 1.03 | |
| | | | | |
| | | | | |
| | | | | |
| | | | | |
| Weighted average common shares outstanding: | | | | | |
| Basic | 85,905 | | | 87,230 | | | 88,846 | |
| Diluted | 85,905 | | | 96,453 | | | 98,512 | |
| | | | | |
| Cash dividends declared per common share | $ | 0.96 | | | $ | 0.96 | | | $ | 0.56 | |
The accompanying notes are an integral part of these consolidated financial statements.
BLOOMIN’ BRANDS, INC.
CONSOLIDATED STATEMENTS OF CHANGES IN STOCKHOLDERS’ EQUITY
(IN THOUSANDS, EXCEPT PER SHARE DATA)
| | | | | | | | | | | | | | | | | | | | | | | | | | | | | | | | | | | | | | | | | |
| BLOOMIN’ BRANDS, INC. | | | | |
| COMMON STOCK | | ADDITIONAL PAID-IN CAPITAL | | ACCUM-
ULATED DEFICIT | | ACCUMULATED OTHER
COMPREHENSIVE LOSS | | NON-CONTROLLING INTERESTS | | TOTAL |
| SHARES | | AMOUNT | | | | | |
| | | | | | | | | | | | | |
Balance,
December 26, 2021 | 89,253 | | | $ | 893 | | | $ | 1,119,728 | | | $ | (698,171) | | | $ | (205,989) | | | $ | 6,389 | | | $ | 222,850 | |
| | | | | | | | | | | | | |
| Net income | — | | | — | | | — | | | 101,907 | | | — | | | 7,296 | | | 109,203 | |
| Other comprehensive income, net of tax | — | | | — | | | — | | | 100 | | | 20,678 | | | — | | | 20,778 | |
| Cash dividends declared, $0.56 per common share | — | | | — | | | (49,736) | | | — | | | — | | | — | | | (49,736) | |
| Repurchase and retirement of common stock | (5,429) | | | (54) | | | — | | | (109,945) | | | — | | | — | | | (109,999) | |
| Stock-based compensation | — | | | — | | | 16,514 | | | — | | | — | | | — | | | 16,514 | |
| | | | | | | | | | | | | |
| Common stock issued under stock plans (1) | 1,559 | | | 15 | | | 12,940 | | | — | | | — | | | — | | | 12,955 | |
| | | | | | | | | | | | | |
| Purchase of noncontrolling interests, net of tax of $489 | — | | | — | | | (1,415) | | | — | | | — | | | (3,400) | | | (4,815) | |
| | | | | | | | | | | | | |
| Distributions to noncontrolling interests | — | | | — | | | — | | | — | | | — | | | (9,127) | | | (9,127) | |
| Contributions from noncontrolling interests | — | | | — | | | — | | | — | | | — | | | 1,382 | | | 1,382 | |
| Issuance of common stock from repurchase of convertible senior notes | 2,313 | | | 23 | | | 48,542 | | | — | | | — | | | — | | | 48,565 | |
| Retirement of convertible senior note hedges | — | | | — | | | 112,956 | | | — | | | — | | | — | | | 112,956 | |
| Retirement of warrants | — | | | — | | | (97,617) | | | — | | | — | | | — | | | (97,617) | |
| | | | | | | | | | | | | |
| | | | | | | | | | | | | |
| | | | | | | | | | | | | |
| | | | | | | | | | | | | |
Balance,
December 25, 2022 | 87,696 | | | $ | 877 | | | $ | 1,161,912 | | | $ | (706,109) | | | $ | (185,311) | | | $ | 2,540 | | | $ | 273,909 | |
| | | | | | | | | | | | | |
| | | | | | | | | | | | | |
| Net income | — | | | — | | | — | | | 247,386 | | | — | | | 7,028 | | | 254,414 | |
| Other comprehensive income, net of tax | — | | | — | | | — | | | — | | | 7,007 | | | — | | | 7,007 | |
| Cash dividends declared, $0.96 per common share | — | | | — | | | (83,742) | | | — | | | — | | | — | | | (83,742) | |
| Repurchase and retirement of common stock, including excise tax of $136 | (2,807) | | | (28) | | | — | | | (70,108) | | | — | | | — | | | (70,136) | |
| Stock-based compensation | — | | | — | | | 11,911 | | | — | | | — | | | — | | | 11,911 | |
| | | | | | | | | | | | | |
| | | | | | | | | | | | | |
| Common stock issued under stock plans (1) | 2,080 | | | 21 | | | 25,306 | | | — | | | — | | | — | | | 25,327 | |
| | | | | | | | | | | | | |
| | | | | | | | | | | | | |
| Distributions to noncontrolling interests | — | | | — | | | — | | | — | | | — | | | (8,684) | | | (8,684) | |
| Contributions from noncontrolling interests | — | | | — | | | — | | | — | | | — | | | 1,997 | | | 1,997 | |
| | | | | | | | | | | | | |
| | | | | | | | | | | | | |
| | | | | | | | | | | | | |
| | | | | | | | | | | | | |
| | | | | | | | | | | | | |
| | | | | | | | | | | | | |
Balance,
December 31, 2023 | 86,969 | | | $ | 870 | | | $ | 1,115,387 | | | $ | (528,831) | | | $ | (178,304) | | | $ | 2,881 | | | $ | 412,003 | |
| | | | | | | | | | | | | |
| | | | | | | | | | | (CONTINUED...) |
BLOOMIN’ BRANDS, INC.
CONSOLIDATED STATEMENTS OF CHANGES IN STOCKHOLDERS’ EQUITY
(IN THOUSANDS, EXCEPT PER SHARE DATA)
| | | | | | | | | | | | | | | | | | | | | | | | | | | | | | | | | | | | | | | | | |
| BLOOMIN’ BRANDS, INC. | | | | |
| COMMON STOCK | | ADDITIONAL PAID-IN CAPITAL | | ACCUM-
ULATED DEFICIT | | ACCUMULATED OTHER
COMPREHENSIVE LOSS | | NON-CONTROLLING INTERESTS | | TOTAL |
| SHARES | | AMOUNT | | | | | |
| | | | | | | | | | | | | |
Balance,
December 31, 2023 | 86,969 | | | $ | 870 | | | $ | 1,115,387 | | | $ | (528,831) | | | $ | (178,304) | | | $ | 2,881 | | | $ | 412,003 | |
| | | | | | | | | | | | | |
| Net (loss) income | — | | | — | | | — | | | (128,018) | | | — | | | 5,363 | | | (122,655) | |
| Other comprehensive loss, net of tax | — | | | — | | | — | | | — | | | (34,489) | | | — | | | (34,489) | |
| Cash dividends declared, $0.96 per common share | — | | | — | | | (82,574) | | | — | | | — | | | — | | | (82,574) | |
| Repurchase and retirement of common stock, including excise tax of $325 | (10,073) | | | (100) | | | (5,681) | | | (260,642) | | | — | | | — | | | (266,423) | |
| Stock-based compensation | — | | | — | | | 7,484 | | | — | | | — | | | — | | | 7,484 | |
| | | | | | | | | | | | | |
| | | | | | | | | | | | | |
| Common stock issued under stock plans (1) | 759 | | | 8 | | | (1,736) | | | — | | | — | | | — | | | (1,728) | |
| | | | | | | | | | | | | |
| | | | | | | | | | | | | |
| Distributions to noncontrolling interests | — | | | — | | | — | | | — | | | — | | | (7,113) | | | (7,113) | |
| Contributions from noncontrolling interests | — | | | — | | | — | | | — | | | — | | | 2,805 | | | 2,805 | |
| Issuance of common stock from repurchase of convertible senior notes | 7,489 | | | 74 | | | 216,078 | | | — | | | — | | | — | | | 216,152 | |
| Retirement of convertible senior note hedges | (289) | | | (3) | | | 126,543 | | | (8,343) | | | — | | | — | | | 118,197 | |
| Retirement of warrants | — | | | — | | | (102,213) | | | — | | | — | | | — | | | (102,213) | |
| | | | | | | | | | | | | |
| | | | | | | | | | | | | |
| | | | | | | | | | | | | |
| | | | | | | | | | | | | |
| | | | | | | | | | | | | |
| | | | | | | | | | | | | |
| | | | | | | | | | | | | |
| | | | | | | | | | | | | |
| | | | | | | | | | | | | |
Balance,
December 29, 2024 | 84,855 | | | $ | 849 | | | $ | 1,273,288 | | | $ | (925,834) | | | $ | (212,793) | | | $ | 3,936 | | | $ | 139,446 | |
________________(1)Net of shares withheld for employee taxes.
The accompanying notes are an integral part of these consolidated financial statements.
BLOOMIN’ BRANDS, INC.
CONSOLIDATED STATEMENTS OF CASH FLOWS
(DOLLARS IN THOUSANDS)
| | | | | | | | | | | | | | | | | |
| FISCAL YEAR |
| 2024 | | 2023 | | 2022 |
| | | | | |
| Cash flows provided by operating activities: | | | | | |
| Net (loss) income | $ | (122,655) | | | $ | 254,414 | | | $ | 109,203 | |
| Net (loss) income from discontinued operations, net of tax | (75,982) | | | 41,629 | | | 16,053 | |
| Net (loss) income from continuing operations | (46,673) | | | 212,785 | | | 93,150 | |
| Adjustments to reconcile Net (loss) income from continuing operations to cash provided by operating activities of continuing operations: | | | | | |
| Depreciation and amortization | 175,580 | | | 169,266 | | | 149,900 | |
| Amortization of debt discounts and issuance costs | 2,769 | | | 3,115 | | | 3,538 | |
| Amortization of deferred gift card sales commissions | 22,559 | | | 23,695 | | | 24,091 | |
| | | | | |
| Provision for impaired assets and restaurant closings | 64,291 | | | 33,574 | | | 5,964 | |
| Non-cash interest expense from terminated interest rate swaps | — | | | — | | | 12,215 | |
| | | | | |
| Benefit for expected credit losses and contingent lease liabilities | (549) | | | (864) | | | (1,054) | |
| | | | | |
| Stock-based compensation expense | 7,484 | | | 11,690 | | | 16,282 | |
| Deferred income tax (benefit) expense | (30,337) | | | (8,411) | | | 11,457 | |
| | | | | |
| | | | | |
| | | | | |
| Loss on extinguishment of debt | 136,022 | | | — | | | 107,630 | |
| | | | | |
| | | | | |
| Loss on fair value adjustment of derivatives, net | — | | | — | | | 17,685 | |
| Gain on foreign currency forward contracts | (15,728) | | | — | | | — | |
| Other, net | (2,943) | | | (3,115) | | | 3,209 | |
| Change in assets and liabilities: | | | | | |
| (Increase) decrease in inventories | (7,484) | | | 2,797 | | | 1,823 | |
| (Increase) decrease in other current assets | (43,170) | | | 10,511 | | | (44,460) | |
| (Increase) decrease in other assets | (3,954) | | | 3,523 | | | (2,300) | |
| | | | | |
| (Decrease) increase in accounts payable and accrued and other current liabilities | (30,930) | | | 13,738 | | | (42,277) | |
| | | | | |
| Decrease in unearned revenue | (6,059) | | | (13,009) | | | (5,025) | |
| (Decrease) increase in operating lease liabilities | (11,096) | | | (9,525) | | | 782 | |
| Increase (decrease) in other long-term liabilities | 6,218 | | | 4,396 | | | (4,278) | |
| Net cash provided by operating activities of continuing operations | 216,000 | | | 454,166 | | | 348,332 | |
| Net cash provided by operating activities of discontinued operations | 12,132 | | | 78,255 | | | 42,590 | |
| Net cash provided by operating activities | $ | 228,132 | | | $ | 532,421 | | | $ | 390,922 | |
| Cash flows used in investing activities: | | | | | |
| | | | | |
| Proceeds from disposal of property, fixtures and equipment | $ | 5,735 | | | $ | 2,515 | | | $ | 1,607 | |
| | | | | |
| | | | | |
| | | | | |
| Proceeds received from company-owned life insurance | — | | | 3,460 | | | 16,092 | |
| Capital expenditures | (220,737) | | | (282,229) | | | (192,791) | |
| Proceeds from foreign currency forward contracts | 15,070 | | | — | | | — | |
| Other investments, net | 650 | | | 1,174 | | | 827 | |
| Net cash used in investing activities of continuing operations | (199,282) | | | (275,080) | | | (174,265) | |
| Net cash used in investing activities of discontinued operations | (39,744) | | | (42,026) | | | (26,873) | |
| Net cash used in investing activities | $ | (239,026) | | | $ | (317,106) | | | $ | (201,138) | |
| | | | | |
| | | (CONTINUED...) |
BLOOMIN’ BRANDS, INC.
CONSOLIDATED STATEMENTS OF CASH FLOWS
(DOLLARS IN THOUSANDS)
| | | | | | | | | | | | | | | | | |
| FISCAL YEAR |
| 2024 | | 2023 | | 2022 |
| | | | | |
| Cash flows used in financing activities: | | | | | |
| | | | | |
| | | | | |
| Proceeds from borrowings on revolving credit facilities | $ | 2,265,000 | | | $ | 1,079,000 | | | $ | 1,239,500 | |
| Repayments of borrowings on revolving credit facilities | (1,936,000) | | | (1,128,000) | | | (889,500) | |
| Financing fees | (8,985) | | | — | | | (1,205) | |
| Repayments of long-term debt and finance lease obligations | (1,777) | | | (1,593) | | | (196,296) | |
| | | | | |
| | | | | |
| | | | | |
| Principal settlements and repurchase of convertible senior notes | (2,335) | | | (214) | | | (196,919) | |
| | | | | |
| Proceeds from retirement of convertible senior note hedges | 118,197 | | | — | | | 131,869 | |
| | | | | |
| Payments for retirement of warrants | (102,213) | | | — | | | (114,825) | |
| (Payment of taxes) proceeds from share-based compensation, net | (1,728) | | | 25,327 | | | 12,955 | |
| Distributions to noncontrolling interests | (7,113) | | | (8,684) | | | (9,127) | |
| Contributions from noncontrolling interests | 2,805 | | | 1,997 | | | 1,382 | |
| Purchase of noncontrolling interests | (100) | | | (100) | | | (5,004) | |
| Payments for partner equity plan | — | | | — | | | (9,292) | |
| Repurchase of common stock | (265,695) | | | (70,847) | | | (109,152) | |
| | | | | |
| Cash dividends paid on common stock | (82,574) | | | (83,742) | | | (49,736) | |
| | | | | |
| Net cash used in financing activities of continuing operations | (22,518) | | | (186,856) | | | (195,350) | |
| Net cash used in financing activities of discontinued operations | (990) | | | (269) | | | (151) | |
| Net cash used in financing activities | (23,508) | | | (187,125) | | | (195,501) | |
| | | | | |
| | | | | |
| Effect of exchange rate changes on cash and cash equivalents | (9,915) | | | 1,448 | | | 1,395 | |
| Net (decrease) increase in cash, cash equivalents and restricted cash | (44,317) | | | 29,638 | | | (4,322) | |
| Cash, cash equivalents and restricted cash as of the beginning of the period | 114,373 | | | 84,735 | | | 89,057 | |
| Cash, cash equivalents and restricted cash as of the end of the period | $ | 70,056 | | | $ | 114,373 | | | $ | 84,735 | |
| Supplemental disclosures of cash flow information: | | | | | |
| Cash paid for interest | $ | 59,989 | | | $ | 50,931 | | | $ | 39,126 | |
| Cash paid for income taxes, net of refunds | $ | 21,084 | | | $ | 27,750 | | | $ | 35,450 | |
| Supplemental disclosures of non-cash investing and financing activities: | | | | | |
| Leased assets obtained in exchange for new operating lease liabilities | $ | 91,305 | | | $ | 74,539 | | | $ | 54,271 | |
| Leased assets obtained in exchange for new finance lease liabilities | $ | 4,038 | | | $ | 6,480 | | | $ | 4,066 | |
| | | | | |
| (Decrease) increase in liabilities from the acquisition of property, fixtures and equipment | $ | (8,367) | | | $ | 3,428 | | | $ | 12,762 | |
| Shares issued on settlement of convertible senior notes | $ | 216,152 | | | $ | — | | | $ | — | |
| Shares received and retired on exercise of call option under bond hedge upon settlement of convertible senior notes | $ | (8,346) | | | $ | — | | | $ | — | |
| | | | | |
| | | | | |
| | | | | |
| | | | | |
The accompanying notes are an integral part of these consolidated financial statements.
BLOOMIN’ BRANDS, INC.
NOTES TO CONSOLIDATED FINANCIAL STATEMENTS
1. Description of the Business
Bloomin’ Brands, Inc. (“Bloomin’ Brands” or the “Company”), a holding company that conducts its operations through its subsidiaries, is one of the largest casual dining restaurant companies in the world, with a portfolio of leading, differentiated restaurant concepts. OSI Restaurant Partners, LLC (“OSI”) is the Company’s primary operating entity.
The Company owns and operates casual, polished casual and fine dining restaurants. The Company’s restaurant portfolio includes Outback Steakhouse, Carrabba’s Italian Grill, Bonefish Grill and Fleming’s Prime Steakhouse & Wine Bar. Additional Outback Steakhouse, Carrabba’s Italian Grill and Bonefish Grill restaurants in which the Company has no direct investment are operated under franchise agreements.
2. Summary of Significant Accounting Policies
Basis of Presentation - The Company’s consolidated financial statements include the accounts and operations of Bloomin’ Brands and its subsidiaries.
Principles of Consolidation - All intercompany accounts and transactions have been eliminated in consolidation.
The Company consolidates variable interest entities where it has been determined that the Company is the primary beneficiary of those entities’ operations. As of December 29, 2024, the Company franchised 291 restaurants but did not possess any ownership interests in its franchisees and did not provide material direct financial support to its franchisees. These franchise relationships are not deemed variable interest entities and are not consolidated.
Investments in entities the Company does not control, but where the Company’s interest is between 20% and 50% and the Company has the ability to exercise significant influence over the entity, are accounted for under the equity method and are not consolidated into the Company’s financial statements. See Equity Method Investments below for the Company’s equity method investment accounting policies.
To ensure timely reporting, the Company consolidates the results of its Brazil operations on a one-month calendar lag. On December 30, 2024, the Company completed the sale of 67% of its Brazil operations, with the Company retaining a 33% interest accounted for under the equity method of accounting. The balance sheets, results of operations and cash flows of the Company’s Brazil operations are reported as discontinued operations for all periods presented and accounted for under the equity method of accounting following the sale. Unless otherwise noted, disclosures within these Notes to Consolidated Financial Statements relate solely to the Company’s continuing operations. For additional information regarding the Brazil sale and discontinued operations, see Note 3 - Discontinued Operations.
Fiscal Year - The Company utilizes a 52-53-week year ending on the last Sunday in December. In a 52-week fiscal year, each quarterly period is comprised of 13 weeks. The additional week in a 53-week fiscal year is added to the fourth quarter. Fiscal year 2023 consisted of 53 weeks and fiscal years 2024 and 2022 consisted of 52 weeks. The additional operating week of 2023 resulted in increases of $83.5 million of Total revenues and $0.15 of GAAP diluted earnings per share in the Consolidated Statements of Operations and Comprehensive (Loss) Income.
Use of Estimates - The preparation of the accompanying consolidated financial statements in conformity with generally accepted accounting principles requires management to make estimates and assumptions that affect the reported amounts of assets and liabilities and disclosure of contingent assets and liabilities at the date of the financial statements and the reported amounts of revenues and expenses during the reporting period. Actual results could differ from those estimated.
BLOOMIN’ BRANDS, INC.
NOTES TO CONSOLIDATED FINANCIAL STATEMENTS - Continued
Cash and Cash Equivalents - Cash equivalents consist of investments that are readily convertible to cash with an original maturity date of three months or less. Cash and cash equivalents include $49.1 million and $56.2 million, as of December 29, 2024 and December 31, 2023, respectively, for amounts in transit from credit card companies since settlement is reasonably assured.
Restricted Cash - From time to time, the Company may have short-term restricted cash balances consisting of amounts pledged for settlement of deferred compensation plan obligations.
Concentrations of Credit and Counterparty Risk - Financial instruments that potentially subject the Company to a concentration of credit risk and credit losses are through credit card and trade receivables consisting primarily of amounts due for gift card, vendor, franchise and other receivables. Gift card, vendor and other receivables consist primarily of amounts due from gift card resellers and vendor rebates. The Company considers the concentration of credit risk for gift card, vendor and other receivables to be minimal due to the payment histories and general financial condition of its gift card resellers and vendors. Amounts due from franchisees consist of initial franchise fees, royalty income and advertising fees. See Note 8 - Supplemental Balance Sheet Information - Other current assets, net for disclosure of trade receivables by category as of December 29, 2024 and December 31, 2023.
Financial instruments that potentially subject the Company to concentrations of counterparty risk are cash and cash equivalents and derivatives. The Company attempts to limit its counterparty risk by investing in certificates of deposit, money market funds, noninterest-bearing accounts and other highly rated investments. Whenever possible, the Company selects investment grade counterparties and rated money market funds in order to mitigate its counterparty risk. At times, cash balances may be in excess of FDIC insurance limits. See Note 13 - Derivative Instruments and Hedging Activities for a discussion of the Company’s use of derivative instruments and management of credit risk inherent in derivative instruments.
Allowance for Expected Credit Losses - The Company evaluates the collectability of credit card and trade receivables based on historical loss experience by risk pool and records periodic adjustments for factors such as deterioration of economic conditions, specific customer circumstances and changes in the aging of accounts receivable balances. In instances where there is no established loss history, S&P speculative-grade default rates are utilized as an estimated expected credit loss rate. Losses are charged off in the period in which they are determined to be uncollectible. See Note 16 - Allowance for Expected Credit Losses for a discussion of the Company’s allowance for expected credit losses.
The Company assigns its interest, and is contingently liable, under certain real estate leases, primarily related to divested restaurant properties. Contingent lease liabilities related to these guarantees are calculated based on management’s estimate of exposure to losses which includes historical analysis of credit losses, including known instances of default, and existing economic conditions. See Note 18 - Commitments and Contingencies for a discussion of the Company’s contingent lease liabilities.
Fair Value - Fair value is the price that would be received for an asset or paid to transfer a liability, or the exit price, in an orderly transaction between market participants on the measurement date. Fair value is categorized into one of the following three levels based on the lowest level of significant input:
| | | | | |
| Level 1 | Unadjusted quoted market prices in active markets for identical assets or liabilities |
| Level 2 | Observable inputs available at measurement date other than quoted prices included in Level 1 |
| Level 3 | Unobservable inputs that cannot be corroborated by observable market data |
Inventories - Inventories consist of food and beverages and are stated at the lower of cost (first-in, first-out) or net realizable value.
BLOOMIN’ BRANDS, INC.
NOTES TO CONSOLIDATED FINANCIAL STATEMENTS - Continued
Cloud-Based Computing Arrangements - The Company defers costs incurred under the application development stage for cloud-based computing arrangements and amortizes those costs over the related service agreement. Capitalized cloud computing implementation costs were $4.6 million, net of accumulated amortization, as of December 29, 2024, primarily related to human resource management systems, and are included in Other current assets, net and Other assets, net on the Company’s Consolidated Balance Sheets. Capitalized cloud computing implementation costs were immaterial as of December 31, 2023. Related amortization expense is included in General and administrative expenses in the Company’s Consolidated Statements of Operations and Comprehensive (Loss) Income and was immaterial for all periods presented.
Property, Fixtures and Equipment - Property, fixtures and equipment are stated at cost, net of accumulated depreciation. Depreciation is computed on the straight-line method over the estimated useful life of the assets. Estimated useful lives by major asset category are generally as follows:
| | | | | |
| Buildings (1) | 5 to 30 years |
| Furniture and fixtures | 5 to 7 years |
| Equipment | 2 to 7 years |
| |
| Computer equipment and software | 2 to 7 years |
____________________
(1)Includes improvements to leased properties which are depreciated over the shorter of their useful life or reasonably certain lease term, including reasonably certain renewal periods.
Repair and maintenance costs that maintain the appearance and functionality of the restaurant, but do not extend the useful life of any restaurant asset, are expensed as incurred. The cost and related accumulated depreciation of assets sold or disposed of are removed from the Company’s Consolidated Balance Sheets, and any resulting gain or loss is generally recognized in Other restaurant operating expense in its Consolidated Statements of Operations and Comprehensive (Loss) Income.
Depreciation and repair and maintenance expense are as follows for the periods indicated:
| | | | | | | | | | | | | | | | | |
| FISCAL YEAR |
| (dollars in thousands) | 2024 | | 2023 | | 2022 |
| Depreciation expense | $ | 171,755 | | | $ | 165,190 | | | $ | 145,961 | |
| Repair and maintenance expense | $ | 113,245 | | | $ | 114,768 | | | $ | 107,369 | |
The Company capitalizes direct and indirect internal costs associated with the acquisition, development, design and construction of Company-owned restaurant locations as these costs have a future benefit to the Company. Upon restaurant opening, these costs are charged to Depreciation and amortization expense over the reasonably certain lease term. Internal costs of $5.3 million and $4.9 million were capitalized during 2024 and 2023, respectively.
For 2024 and 2023, computer equipment and software costs of $8.1 million and $10.8 million, respectively, were capitalized. As of December 29, 2024 and December 31, 2023, there was $11.4 million and $12.5 million, respectively, of unamortized computer equipment and software included in Property, fixtures and equipment, net on the Company’s Consolidated Balance Sheets.
Equity Method Investments - Revenue and expenses of equity method investees are not consolidated into the Company’s financial statements. The Company’s proportionate share of earnings or losses is recorded in Income from operations of unconsolidated affiliates in its Consolidated Statements of Operations and Comprehensive (Loss) Income and as an adjustment to the carrying value in the Company’s Consolidated Balance Sheets. Equity method investments are evaluated for impairment when facts and circumstances indicate that the carrying value may not be recoverable.
BLOOMIN’ BRANDS, INC.
NOTES TO CONSOLIDATED FINANCIAL STATEMENTS - Continued
Goodwill and Intangible Assets - Goodwill represents the excess of the purchase price over the fair value of net assets acquired in business combinations and is assigned to the reporting unit in which the acquired business will operate. The Company’s indefinite-lived intangible assets consist of trade names recorded at fair value as of the date of acquisition. Goodwill and indefinite-lived intangible assets are tested for impairment annually, as of the first day of the second fiscal quarter, or whenever events or changes in circumstances indicate that the carrying amount may not be recoverable.
The Company may elect to perform a qualitative assessment to determine whether it is more likely than not that a reporting unit is impaired. If the qualitative assessment is not performed or if the Company determines that it is not more likely than not that the fair value of the reporting unit exceeds the carrying value, the fair value of the reporting unit is calculated. The carrying value of the reporting unit is compared to its calculated fair value, with any excess of carrying value over fair value deemed to be an impairment.
Definite-lived intangible assets, which consist of trademarks, are recorded at fair value as of the date of acquisition, amortized over their estimated useful lives and tested for impairment, using the relief from royalty method, whenever events or changes in circumstances indicate that the carrying value may not be recoverable. See Note 9 - Goodwill and Intangible Assets, Net for goodwill, indefinite-lived intangibles and definite-lived intangibles balances by reporting unit.
Derivatives - The Company records all derivatives on the balance sheet at fair value. The accounting for changes in the fair value of derivatives depends on the intended use of the derivative, whether the Company has elected to designate a derivative in a hedging relationship and apply hedge accounting and whether the hedging relationship has satisfied the criteria necessary to apply hedge accounting.
Derivatives designated and qualifying as a hedge of the exposure to variability in expected future cash flows, or other types of forecasted transactions, are considered cash flow hedges. If the derivative qualifies for hedge accounting treatment, any gain or loss on the derivative instrument is recognized in equity as a change to Accumulated other comprehensive loss and reclassified into earnings in the same period or periods during which the hedged transaction affects earnings.
Unrealized gains or losses on the Company’s interest rate swaps are reclassified to Interest expense, net as interest payments are made on the hedged portion of the Company’s revolving credit facility. The Company has elected to record cash flows from interest rate swaps within operating activities, the same category as the items being hedged, in its Consolidated Statements of Cash Flows. The Company has elected not to offset derivative positions in the balance sheet with the same counterparty under the same agreement.
The Company may enter into derivative contracts that are intended to economically hedge certain of its risks, even though hedge accounting does not apply or the Company elects not to apply hedge accounting. Derivatives not designated as hedges are not speculative and are used to manage the Company’s exposure to interest rate movements, foreign currency exchange rate movements, changes in energy prices and other identified risks. Changes in the fair value of derivatives not designated in hedging relationships are recorded directly in earnings.
During 2024, the Company entered into foreign currency forward contracts not designated as hedges to mitigate a portion of the exchange rate risk associated with purchase price installment payments in connection with the sale of the majority ownership of its Brazil operations. The change in fair value of the foreign currency forward contracts is recorded in General and administrative expense, consistent with the related underlying exposure. See Note 13 - Derivative Instruments and Hedging Activities for additional details regarding the foreign currency forward contracts.
BLOOMIN’ BRANDS, INC.
NOTES TO CONSOLIDATED FINANCIAL STATEMENTS - Continued
Deferred Debt Issuance Costs - For its revolving credit facility, the Company records deferred debt issuance costs related to the issuance of debt obligations in Other assets, net on its Consolidated Balance Sheets. For fees associated with all other debt obligations, the Company records deferred debt issuance costs as a reduction of Long-term debt, net.
The Company amortizes deferred debt issuance costs to interest expense over the term of the respective financing arrangement, primarily using the effective interest method. The Company amortized deferred debt issuance costs of $2.8 million, $3.1 million and $3.5 million to Interest expense, net for 2024, 2023 and 2022, respectively.
Liquor Licenses - The fees from obtaining non-transferable liquor licenses directly issued by local government agencies for nominal fees are expensed as incurred. The costs of purchasing transferable liquor licenses through open markets in jurisdictions with a limited number of authorized liquor licenses are capitalized as indefinite-lived intangible assets and included in Other assets, net on the Company’s Consolidated Balance Sheets. Liquor licenses are reviewed for impairment annually or more frequently if events or changes in circumstances indicate that the carrying amount may not be recoverable.
Insurance Reserves - The Company carries insurance programs with specific retention levels or high per-claim deductibles for a significant portion of expected losses under its workers’ compensation, general or liquor liability, health, property and management liability insurance programs. The Company records a liability for all unresolved claims and for an estimate of incurred but not reported claims at the anticipated cost that falls below its specified retention levels or per-claim deductible amounts. In establishing reserves, the Company considers actuarial assumptions and judgments regarding economic conditions, and the frequency and severity of claims. Reserves recorded for workers’ compensation and general liability claims are discounted using the average of the one-year and five-year risk-free rate of monetary assets that have comparable maturities.
Share Repurchase - The par value of the repurchased shares is deducted from common stock and the excess of the purchase price over the par value of the shares, including broker commissions, certain transaction related costs and excises taxes, are recorded to Accumulated deficit. All shares of common stock acquired through share repurchase programs are retired and restored to authorized but unissued shares of common stock. The Company has elected to record excise taxes in connection with share repurchases within operating activities in its Consolidated Statements of Cash Flows.
Revenue Recognition - The Company records food and beverage revenues, net of discounts and taxes, upon delivery to the customer. Franchise-related revenues are included in Franchise and other revenues in the Company’s Consolidated Statements of Operations and Comprehensive (Loss) Income. Royalties, which are generally a percentage of net sales of the franchisee, are recognized as revenue in the period in which they occurred provided collectability is reasonably assured.
Proceeds from the sale of gift cards, which do not have expiration dates, are recorded as deferred revenue and recognized as revenue upon redemption by the customer. The Company applies the portfolio approach practical expedient to account for gift card contracts and performance obligations. Gift card breakage, the amount of gift cards which will not be redeemed, is recognized using estimates based on historical redemption patterns. If actual redemptions vary from assumptions used to estimate breakage, gift card breakage income may differ from the amount recorded. The Company periodically updates its estimates used for breakage. Breakage revenue is recorded as a component of Restaurant sales in the Company’s Consolidated Statements of Operations and Comprehensive (Loss) Income. Approximately 84% of deferred gift card revenue is expected to be recognized within 12 months of inception.
Gift card sales commissions paid to third-party providers are capitalized and subsequently amortized to Other restaurant operating expense based on historical gift card redemption patterns. See Note 4 - Revenue Recognition for rollforwards of deferred gift card sales commissions and unearned gift card revenue.
BLOOMIN’ BRANDS, INC.
NOTES TO CONSOLIDATED FINANCIAL STATEMENTS - Continued
Advertising fees charged to franchisees are recognized in Franchise and other revenues in the Company’s Consolidated Statements of Operations and Comprehensive (Loss) Income provided collectability is reasonably assured. Initial franchise and renewal fees are recognized over the term of the franchise agreement and renewal period, respectively. The weighted average remaining term of franchise agreements and renewal periods was approximately 11 years as of December 29, 2024. On December 30, 2024, in connection with the sale of a majority ownership of the Company’s Brazil operations, the Company entered into 20-year franchise agreements for its existing restaurants in that market.
The Company maintains a customer loyalty program, Dine Rewards, in the U.S., where customers earn a reward after attaining qualified spend amounts. The Company’s estimate of the fair value of the reward is recorded as deferred revenue. Each reward must be redeemed within specified time limits of earning such reward. Revenue is recorded upon redemption and breakage for unredeemed rewards is recorded proportional to historical redemption patterns. The Company applies the practical expedient to exclude disclosures regarding loyalty program remaining performance obligations, which have original expected durations of less than one year.
The Company collects and remits sales, food and beverage, alcoholic beverage and hospitality taxes on transactions with customers and reports revenue net of taxes in its Consolidated Statements of Operations and Comprehensive (Loss) Income.
Leases - The Company’s determination of whether an arrangement contains a lease is based on an evaluation of whether the arrangement conveys the right to use and control specific property or equipment. The Company leases restaurant and office facilities and certain equipment under operating leases primarily having initial terms between one and 20 years. Restaurant facility leases generally have renewal periods totaling five to 30 years, exercisable at the option of the Company. Contingent rentals represent payment of variable lease obligations based on a percentage of gross revenues, as defined by the terms of the applicable lease agreement for certain restaurant facility leases. The Company also has certain leases which reset periodically based on a specified index. Such leases are recorded using the index that existed at lease commencement. Subsequent changes in the index are recorded as variable rental payments. Variable rental payments are expensed as incurred in the Company’s Consolidated Statements of Operations and Comprehensive (Loss) Income and future variable rent obligations are not included within the lease liabilities on the Consolidated Balance Sheets. The depreciable life of lease assets and leasehold improvements are limited by the expected lease term. None of the Company’s leases contain any material residual value guarantees or restrictive covenants.
Upon the 2019 adoption of ASC Topic 842 - Leases (“ASC 842”), the Company elected the practical expedient to not separate U.S. lease and non-lease components for real estate leases entered into after adoption. Additionally, for certain equipment leases, the Company applies a portfolio approach to account for lease assets and liabilities. Leases with an initial term of 12 months or less are not recorded on its Consolidated Balance Sheets and are recognized on a straight-line basis over the lease term within Other restaurant operating expense in the Company’s Consolidated Statements of Operations and Comprehensive (Loss) Income.
Rent expense for the Company’s operating leases, which generally have escalating rentals over the term of the lease and may include rent holidays, is recorded on a straight-line basis over the initial lease term and those renewal periods that are reasonably certain. Operating lease rent expense for open Company-owned restaurants is recorded in Other restaurant operating expense in the Company’s Consolidated Statements of Operations and Comprehensive (Loss) Income. Payments received from landlords as incentives for leasehold improvements are recorded as a reduction of the right-of-use asset and amortized on a straight-line basis over the term of the lease as a reduction of rent expense.
Pre-Opening Expenses - Non-capital expenditures associated with opening new restaurants are expensed as incurred and are included in Other restaurant operating expense in the Company’s Consolidated Statements of Operations and Comprehensive (Loss) Income.
BLOOMIN’ BRANDS, INC.
NOTES TO CONSOLIDATED FINANCIAL STATEMENTS - Continued
Consideration Received from Vendors - The Company receives consideration for a variety of vendor-sponsored programs, such as volume rebates, promotions and advertising allowances. Advertising allowances are intended to offset the Company’s costs of promoting and selling menu items in its restaurants. Vendor consideration is recorded as a reduction of Food and beverage cost or Other restaurant operating expense when recognized in the Company’s Consolidated Statements of Operations and Comprehensive (Loss) Income.
Impairment of Long-Lived Assets and Costs Associated with Exit Activities - Long-lived assets are reviewed for impairment whenever events or changes in circumstances indicate that the carrying value may not be recoverable. The evaluation is performed at the lowest level of identifiable cash flows independent of other assets. For long-lived assets deployed at its restaurants, the Company reviews for impairment at the individual restaurant level. When evaluating for impairment, the total future undiscounted cash flows expected to be generated by the asset are compared to the carrying amount. If the total future undiscounted cash flows of the asset are less than its carrying amount, recoverability is measured by comparing the fair value of the assets to the carrying amount. An impairment loss is recognized in earnings when the asset’s carrying value exceeds its fair value. Fair value is generally estimated using a discounted cash flow model.
Restaurant closure costs, including lease termination fees, are expensed as incurred. For U.S. restaurant facility leases executed subsequent to the adoption of ASC 842, the Company accounts for fixed lease and non-lease components as a single lease component included within the lease liability at least commencement. For all leases executed prior to such date, when the Company ceases using the property rights under a non-cancelable operating lease, it records a liability for the net present value of any remaining non-rent lease-related obligations, less the estimated subtenant cost recovery that can reasonably be obtained for the property. Any subsequent adjustment to that liability as a result of lease termination or changes in estimates of cost recovery is recorded in the period incurred. The associated expense is recorded in Provision for impaired assets and restaurant closings in the Company’s Consolidated Statements of Operations and Comprehensive (Loss) Income.
Held for Sale and Discontinued Operations - Restaurant sites and certain other assets to be sold are included in assets held for sale when certain criteria are met, including the requirement that the likelihood of selling the assets within one year is probable.
Assets and liabilities classified as held for sale are presented separately within the Consolidated Balance Sheets at the lower of its carrying value or fair value less costs to sell. Depreciation of property, plant and equipment and amortization of intangible and right-of-use assets are not recorded while these assets are classified as held for sale.
The Company reports the results of operations of a business as discontinued operations if a disposal represents a strategic shift that will have a major effect on its operations and financial results. The results of discontinued operations are reported as Net (loss) income from discontinued operations, net of tax in the Consolidated Statements of Operations and Comprehensive (Loss) Income for the current and prior periods beginning in the period in which the held for sale criteria are met.
Advertising Costs - Advertising production costs are expensed in the period when the advertising first occurs. All other advertising costs are expensed in the period in which the costs are incurred. Advertising expense of $111.3 million, $96.2 million and $80.1 million for 2024, 2023 and 2022, respectively, was recorded in Other restaurant operating expense in the Company’s Consolidated Statements of Operations and Comprehensive (Loss) Income.
Legal Costs - Settlement costs for employment litigation are recorded to Other restaurant operating expense when they are deemed probable and reasonably estimable. Legal fees are recognized as incurred and are reported in General and administrative expense in the Company’s Consolidated Statements of Operations and Comprehensive (Loss) Income.
BLOOMIN’ BRANDS, INC.
NOTES TO CONSOLIDATED FINANCIAL STATEMENTS - Continued
Research and Development Expenses (“R&D”) - R&D is expensed as incurred in General and administrative expense in the Company’s Consolidated Statements of Operations and Comprehensive (Loss) Income. R&D primarily consists of payroll and benefit costs. R&D was $3.5 million, $3.1 million and $2.5 million for 2024, 2023 and 2022, respectively.
Partner Compensation - In addition to base salary, field-level operators and multi-unit supervisors receive performance-based bonuses for providing management and supervisory services to their restaurants, certain of which may be based on their restaurants’ monthly operating results or cash flows. The Company accrues for these obligations using current and historical restaurant performance information. Most field-level compensation is recorded in Labor and other related expense, with compensation for multi-unit supervisors recorded in General and administrative expense in the Company’s Consolidated Statements of Operations and Comprehensive (Loss) Income.
Stock-based Compensation - Stock-based compensation awards are measured at fair value at the date of grant and expensed over their vesting or service periods. Stock-based compensation expense is recognized only for those awards expected to vest. The expense is recognized using the straight-line method and recorded in General and administrative expense in the Company’s Consolidated Statements of Operations and Comprehensive (Loss) Income. Forfeitures of share-based compensation awards are recognized as they occur.
Performance-based share units (“PSUs”) issued by the Company may include a relative total shareholder return (“Relative TSR”) modifier to the final payout outcome, which can adjust the payout percentage based on the achieved performance metric. The Relative TSR is measured by comparing the Company’s Relative TSR to that of the constituents of the S&P 1500 Restaurants index.
Basic and Diluted (Loss) Earnings per Share - The Company computes basic (loss) earnings per share based on the weighted average number of common shares that were outstanding during the period. Except where the result would be antidilutive, diluted (loss) earnings per share includes the dilutive effect of common stock equivalents, consisting of stock options, restricted stock units, PSUs and warrants, measured using the treasury stock method, and the Company’s convertible senior notes, measured using the if-converted method. PSUs are considered dilutive when the related performance criterion has been met.
The Company has provided the trustee of the Company’s convertible senior notes due 2025 (the “2025 Notes”) notice of its irrevocable election under the 2025 Notes indenture to settle the principal portion of the 2025 Notes upon conversion in cash and any excess in shares. As a result, only the amounts in excess of the principal amount, if applicable, are considered in diluted earnings per share.
Foreign Currency Translation and Transactions - For non-U.S. operations, the functional currency is the local currency. Foreign currency denominated assets and liabilities are translated into U.S. dollars using the exchange rates in effect at the balance sheet date with the translation adjustments recorded in Accumulated other comprehensive loss in the Company’s Consolidated Statements of Changes in Stockholders’ Equity. Results of operations are translated using the average exchange rates for the reporting period. Foreign currency exchange transaction losses are recorded in General and administrative expense in the Company’s Consolidated Statements of Operations and Comprehensive (Loss) Income.
Income Taxes - Deferred income tax assets and liabilities are recognized for the future tax consequences attributable to differences between the financial statement carrying amounts of existing assets and liabilities and their respective tax basis. Deferred income tax assets and liabilities are measured using enacted tax rates expected to apply to taxable income in the years in which those temporary differences are expected to be recovered or settled. The effect on deferred income tax assets and liabilities of a change in the tax rate is recognized within income in the period that includes the enactment date of the rate change. A valuation allowance may reduce deferred income tax assets to the amount that is more likely than not to be realized.
BLOOMIN’ BRANDS, INC.
NOTES TO CONSOLIDATED FINANCIAL STATEMENTS - Continued
The Company records a tax benefit for an uncertain tax position using the highest cumulative tax benefit that is more likely than not to be realized. The Company adjusts its liability for unrecognized tax benefits in the period in which it determines the issue is effectively settled, the statute of limitations expires or when more information becomes available. Liabilities for unrecognized tax benefits are recorded as a reduction of Deferred income tax assets, net and within Other long-term liabilities, net, with related interest and penalties recorded in Other long-term liabilities, net, on the Company’s Consolidated Balance Sheets. Interest and penalties recognized on liabilities for unrecognized tax benefits are included in (Benefit) provision for income taxes.
Recently Adopted Financial Accounting Standards - On December 29, 2024, the Company adopted Accounting Standards Update (“ASU”) No. 2023-07, “Segment Reporting (Topic 280): Improvements to Reportable Segment Disclosures,” (“ASU No. 2023-07”) which requires disclosure of significant segment expenses regularly provided to the Company’s chief operating decision-maker (“CODM”). ASU No. 2023-07 also allows for multiple measures of segment profit (loss) if the CODM utilizes such measures to allocate resources or assess performance. The adoption of ASU No. 2023-07 did not impact the Company’s results of operations, cash flows, or financial condition. See Note 19 - Segment Reporting for the Company’s segment disclosures.
Recently Issued Financial Accounting Standards Not Yet Adopted - In December 2023, the Financial Accounting Standards Board (“FASB”) issued ASU No. 2023-09, “Income Taxes (Topic 740): Improvements to Income Tax Disclosures,” (“ASU No. 2023-09”) which expands existing income tax disclosures, including disaggregation of the Company’s effective income tax rate reconciliation table and income taxes paid disclosures. ASU No. 2023-09 is effective for the Company beginning with the 2025 Form 10-K, with early adoption permitted. The Company is currently evaluating the impact ASU No. 2023-09 will have on its disclosures.
In November 2024, the FASB issued ASU No. 2024-03, “Income Statement - Reporting Comprehensive Income (Subtopic 220-40): Disaggregation of Income Statement Expenses,” (“ASU No. 2024-03”) which requires detailed disclosures in the notes to financial statements of expense categories within relevant income statement captions including purchases of inventory, employee compensation, depreciation and intangible asset amortization. ASU No. 2024-03 is effective for the Company beginning with the 2027 Form 10-K, with early adoption permitted, and may be applied either prospectively for reporting periods after the effective date or retrospectively to prior periods presented. The Company is currently evaluating the impact ASU No. 2024-03 will have on its disclosures.
Recent accounting guidance not discussed herein is not applicable, did not have or is not expected to have a material impact to the Company.
Reclassifications - The Company reclassified certain items in the accompanying consolidated financial statements for prior periods to be comparable with the classification for the current period, including presentation of certain items within consolidated statements of cash flows and the notes to the consolidated financial statements. These reclassifications had no effect on previously reported net income.
3. Discontinued Operations
On November 6, 2024, an indirect wholly owned subsidiary of the Company (the “Seller”) entered into a Quota Purchase Agreement and Other Covenants (the “Purchase Agreement”) with a fund managed by an affiliate of Vinci Partners Investments Ltd. (the “Buyer”) for the sale of 67% of its business in Brazil (the “Disposal Group”). The sale (the “Brazil Sale Transaction”) closed on December 30, 2024 (the “Closing Date”).
The aggregate consideration paid to the Seller consists of 67% of the enterprise valuation of the Disposal Group in the amount of R$2.06 billion Brazilian Reais, which equals R$1.4 billion Brazilian Reais (approximately $225.3 million in U.S. Dollars based on the exchange rate on the Closing Date), subject to customary adjustments, and withholding for Brazilian taxes (the “Purchase Price”). On December 30, 2024 the Company received cash proceeds, net of withheld income taxes, of $103.9 million, in U.S. dollars based on the exchange rate on the Closing Date, representing 52% of the Purchase Price. The proceeds were applied to the Company’s revolving credit facility
BLOOMIN’ BRANDS, INC.
NOTES TO CONSOLIDATED FINANCIAL STATEMENTS - Continued
during the thirteen weeks ended March 30, 2025. The second installment payment, representing 48% of the Purchase Price is due on the first anniversary of the Closing Date (based on the exchange rate on the date of payment) and will generate interest income based on the interbank deposit rate in Brazil until paid.
Following the closing, the Brazil restaurants began operating as unconsolidated franchisees. The sale represents a strategic shift to a primarily franchised model for the Company’s international operations. The assets and liabilities of the Disposal Group are classified as held for sale on the Company’s Consolidated Balance Sheets as of December 29, 2024 and December 31, 2023. For fiscal years 2024, 2023 and 2022, all sales, direct costs and expenses and income taxes attributable to restaurants classified as discontinued operations have been aggregated to a single caption titled (Loss) income from discontinued operations, net of tax in the Company’s Consolidated Statements of Operations and Comprehensive (Loss) Income for all periods presented.
The Company entered into foreign exchange forward contracts to mitigate most of the exchange rate risk associated with the Purchase Price installment payments. See Note 13 - Derivative Instruments and Hedging Activities for details regarding the foreign exchange forward contracts.
On the Closing Date, the Seller and the Buyer entered into a shareholders agreement (the “Shareholders Agreement”), pursuant to which Buyer and Seller will have representation on a board of directors and in executive management based on their respective equity interests.
During the thirteen weeks ended December 29, 2024, the Company recorded $68.3 million of impairment in connection with the Brazil Sale Transaction within (Loss) income from discontinued operations, net of tax in its Consolidated Statements of Operations and Comprehensive (Loss) Income. The impairment represents the difference between the estimated fair value of the Disposal Group and its carrying value, which included $212.2 million of cumulative currency translation adjustment losses and the impact of measurement of the Company’s 33% retained interest.
As of the Closing Date, the fair value of the Company’s retained interest was $59.9 million based on the proportional enterprise valuation of the Disposal Group negotiated as a part of the Purchase Agreement, adjusted for debt used by the Buyer to fund a portion of the Purchase Price and to be pushed down to the operating entity subsequent to the Closing Date. Under the Shareholders Agreement, the Buyer may cause the Seller to sell or the Seller may cause the Buyer to purchase the totality of the remaining interest in the Disposal Group for a period between October 1, 2028 and December 31, 2028 at a defined multiple of earnings less net indebtedness.
BLOOMIN’ BRANDS, INC.
NOTES TO CONSOLIDATED FINANCIAL STATEMENTS - Continued
The following table presents the carrying amounts of the major classes of assets and liabilities of the Disposal Group classified as held for sale on the Company’s Consolidated Balance Sheets as of the periods indicated:
| | | | | | | | | | | | | | | | | | | |
| (dollars in thousands) | DECEMBER 29, 2024 | | DECEMBER 31, 2023 | | | | | | | | |
| Assets: | | | | | | | | | | | |
| Current assets | | | | | | | | | | | |
| | | | | | | | | | | |
| Inventories | $ | 7,872 | | | $ | 12,991 | | | | | | | | | |
| | | | | | | | | | | |
| | | | | | | | | | | |
| | | | | | | | | | | |
| | | | | | | | | | | |
| | | | | | | | | | | |
| | | | | | | | | | | |
| | | | | | | | | | | |
| Other current assets, net | 15,117 | | | 15,104 | | | | | | | | | |
| Total current assets of disposal group classified as held for sale | $ | 22,989 | | | $ | 28,095 | | | | | | | | | |
| Non-current assets | | | | | | | | | | | |
| Property, fixtures and equipment, net | $ | 99,532 | | | $ | 103,757 | | | | | | | | | |
| Operating lease right-of-use assets | 43,884 | | | 53,679 | | | | | | | | | |
| Goodwill | 51,906 | | | 62,995 | | | | | | | | | |
| Intangible assets, net | 6,841 | | | 10,069 | | | | | | | | | |
| Deferred income tax assets, net | 2,056 | | | 4,233 | | | | | | | | | |
| Other assets, net | 64,553 | | | 25,097 | | | | | | | | | |
| Total non-current assets | 268,772 | | | 259,830 | | | | | | | | | |
| | | | | | | | | | | |
| Impairment of disposal group assets | (68,271) | | | — | | | | | | | | | |
| Net non-current assets of disposal group classified as held for sale | $ | 200,501 | | | $ | 259,830 | | | | | | | | | |
| | | | | | | | | | | |
| Liabilities: | | | | | | | | | | | |
| Current liabilities | | | | | | | | | | | |
| Accounts Payable | $ | 24,168 | | | $ | 33,328 | | | | | | | | | |
| Current operating lease liabilities | 10,109 | | | 11,718 | | | | | | | | | |
| Accrued and other current liabilities | 52,442 | | | 58,133 | | | | | | | | | |
| Unearned revenue | 1,237 | | | 1,723 | | | | | | | | | |
| Total current liabilities of disposal group classified as held for sale | $ | 87,956 | | | $ | 104,902 | | | | | | | | | |
| Non-current liabilities | | | | | | | | | | | |
| Non-current operating lease liabilities | $ | 36,297 | | | $ | 44,286 | | | | | | | | | |
| Other long-term liabilities, net | 13,568 | | | 14,359 | | | | | | | | | |
| Total non-current liabilities of disposal group classified as held for sale | $ | 49,865 | | | $ | 58,645 | | | | | | | | | |
| | | | | | | | | | | |
| | | | | | | | | | | |
Included in discontinued operations are benefits from a law in Brazil that provided a 100% exemption from income tax (IRPJ and CSLL) and federal value added taxes (PIS and COFINS). These exemptions impacted GAAP diluted earnings per share from discontinued operations by approximately $0.25 for 2023. After receipt of an unfavorable court ruling in January 2024, a cash judicial deposit of $42.9 million, inclusive of principal, interest and potential penalties, was made during 2024 to appeal the unfavorable court ruling.
During 2024, new tax legislation granted certain industries additional exemptions from income and federal value added taxes for varying timeframes resulting in a benefit of $0.15 GAAP diluted earnings per share from discontinued operations during 2024.
Following closing of the Brazil Sale Transaction, the Company retained certain rights to favorable resolution of the ongoing litigation and recorded a contingent consideration asset at fair value on the Closing Date. See Contingent Consideration Assets and Indemnification Liabilities section below for details.
BLOOMIN’ BRANDS, INC.
NOTES TO CONSOLIDATED FINANCIAL STATEMENTS - Continued
(Loss) income from discontinued operations, net of tax in the Company’s Consolidated Statements of Operations and Comprehensive (Loss) Income includes the following for the periods indicated:
| | | | | | | | | | | | | | | | | | | |
| FISCAL YEAR |
| (dollars in thousands) | 2024 | | 2023 | | 2022 | | |
| Revenues | | | | | | | |
| Restaurant sales | $ | 525,216 | | | $ | 529,619 | | | $ | 428,801 | | | |
| Other revenue | 52 | | | 52 | | | 39 | | | |
| Total revenues | 525,268 | | | 529,671 | | | 428,840 | | | |
| Costs and expenses | | | | | | | |
| Food and beverage | 167,741 | | | 169,164 | | | 146,214 | | | |
| Labor and other related | 109,853 | | | 105,500 | | | 84,834 | | | |
| Other restaurant operating (1) | 165,492 | | | 163,816 | | | 131,916 | | | |
| Depreciation and amortization | 22,191 | | | 21,905 | | | 19,717 | | | |
| General and administrative | 28,744 | | | 26,911 | | | 21,820 | | | |
| Provision for impaired assets and restaurant closings | 1,577 | | | — | | | — | | | |
| Impairment of assets held for sale | 68,271 | | | — | | | — | | | |
| Total costs and expenses | 563,869 | | | 487,296 | | | 404,501 | | | |
| (Loss) income from operations | (38,601) | | | 42,375 | | | 24,339 | | | |
| Interest income (expense), net | 1,545 | | | (587) | | | 165 | | | |
| (Loss) income before provision for income taxes | (37,056) | | | 41,788 | | | 24,504 | | | |
| Provision for income taxes | 38,926 | | | 159 | | | 8,451 | | | |
| (Loss) income from discontinued operations, net of tax | $ | (75,982) | | | $ | 41,629 | | | $ | 16,053 | | | |
____________________
(1)Includes royalty expense of $25.9 million, $26.4 million and $21.6 million for fiscal years 2024, 2023 and 2022, respectively, eliminated in consolidation prior to the Brazil Sale Transaction, with the corresponding royalty revenues recorded within Franchise and other revenues from continuing operations in the Company’s Consolidated Statements of Operations and Comprehensive (Loss) Income. On December 30, 2024, the Company entered into franchise agreements that include royalty rates that are lower than its historical intercompany rates and on the low end of its international franchisee royalty percentage range.
Contingent Consideration Assets and Indemnification Liabilities - Subsequent to December 29, 2024, the Company recognized contingent consideration assets of $29.3 million and indemnifications liabilities of $6.9 million within Other assets, net and Other long-term liabilities, net, respectively, on the Company’s Consolidated Balance Sheet in connection with the Brazil Sale Transaction.
Contingent consideration assets relate to supervening rights to certain tax benefits, including from judicial deposits paid prior to the sale. Collection of amounts in connection with these assets will be net of applicable taxes and related costs incurred. Indemnification liabilities primarily relate to known labor and tax exposures.
Contingent consideration assets and indemnification liabilities were valued utilizing a probability-adjusted discounted cash flow model using inputs not observable in the market. The key internally developed assumptions used in these models are: (i) the probabilities of outcomes, (ii) interest rates for contingencies entitled to interest, (iii) discount rates and (iv) the anticipated timing of recognition. The Company utilized discount rates of approximately 13%, in its calculations of the estimated fair values of its contingent assets and liabilities as of the Closing Date.
Subsequent measurement of contingent consideration assets is based on ASC 450 gain contingency guidance and indemnification liabilities under ASC 460 guarantees guidance. Any subsequent recognition and measurement of contingent consideration and indemnification liabilities will be presented within discontinued operations.
BLOOMIN’ BRANDS, INC.
NOTES TO CONSOLIDATED FINANCIAL STATEMENTS - Continued
4. Revenue Recognition
The following table includes the disaggregation of Restaurant sales and franchise revenues by restaurant concept and segment for the periods indicated:
| | | | | | | | | | | | | | | | | | | | | | | | | | | | | | | | | | | |
| FISCAL YEAR |
| 2024 | | 2023 | | 2022 |
| (dollars in thousands) | RESTAURANT SALES | | FRANCHISE REVENUES | | RESTAURANT SALES | | FRANCHISE REVENUES | | RESTAURANT SALES | | FRANCHISE REVENUES |
| U.S. | | | | | | | | | | | |
| Outback Steakhouse | $ | 2,219,812 | | | $ | 31,253 | | | $ | 2,316,449 | | | $ | 32,289 | | | $ | 2,240,432 | | | $ | 31,418 | |
| Carrabba’s Italian Grill | 693,421 | | | 2,771 | | | 721,946 | | | 3,036 | | | 676,467 | | | 2,938 | |
| Bonefish Grill | 523,634 | | | 479 | | | 570,578 | | | 505 | | | 559,583 | | | 662 | |
| Fleming’s Prime Steakhouse & Wine Bar | 368,663 | | | — | | | 382,729 | | | — | | | 374,388 | | | — | |
| Other | 7,074 | | | 120 | | | 13,351 | | | 78 | | | 12,146 | | | 49 | |
| U.S. total | 3,812,604 | | | 34,623 | | | 4,005,053 | | | 35,908 | | | 3,863,016 | | | 35,067 | |
| | | | | | | | | | | |
| International Franchise (1) | — | | | 39,490 | | | — | | | 41,524 | | | — | | | 36,202 | |
| Other (2) | 53,740 | | | — | | | 72,736 | | | — | | | 60,878 | | | — | |
| | | | | | | | | | | |
| Total | $ | 3,866,344 | | | $ | 74,113 | | | $ | 4,077,789 | | | $ | 77,432 | | | $ | 3,923,894 | | | $ | 71,269 | |
____________________
(1)Includes revenues from franchised restaurants and intercompany royalties from Brazil.
(2)Includes Restaurant sales for Company-owned restaurants in Hong Kong and China.
The following table includes a detail of assets and liabilities from contracts with customers included on the Company’s Consolidated Balance Sheets as of the periods indicated:
| | | | | | | | | | | | | | | | | |
| (dollars in thousands) | DECEMBER 29, 2024 | | DECEMBER 31, 2023 | | | | | | |
| Other current assets, net | | | | | | | | | |
| Deferred gift card sales commissions | $ | 16,935 | | | $ | 18,081 | | | | | | | |
| | | | | | | | | |
| Unearned revenue | | | | | | | | | |
| Deferred gift card revenue | $ | 366,059 | | | $ | 372,551 | | | | | | | |
| Deferred loyalty revenue | 6,073 | | | 5,664 | | | | | | | |
| Deferred franchise fees - current | 490 | | | 473 | | | | | | | |
| Other | 1,477 | | | 1,466 | | | | | | | |
| Total Unearned revenue | $ | 374,099 | | | $ | 380,154 | | | | | | | |
| | | | | | | | | |
| Other long-term liabilities, net | | | | | | | | | |
| Deferred franchise fees - non-current | $ | 3,901 | | | $ | 4,036 | | | | | | | |
The following table is a rollforward of deferred gift card sales commissions for the periods indicated:
| | | | | | | | | | | | | | | | | | | |
| FISCAL YEAR |
| (dollars in thousands) | 2024 | | 2023 | | 2022 | | |
| Balance, beginning of the period | $ | 18,081 | | | $ | 17,755 | | | $ | 17,793 | | | |
| Deferred gift card sales commissions amortization | (22,559) | | | (23,695) | | | (24,091) | | | |
| Deferred gift card sales commissions capitalization | 24,052 | | | 26,706 | | | 26,743 | | | |
| Other | (2,639) | | | (2,685) | | | (2,690) | | | |
| Balance, end of the period | $ | 16,935 | | | $ | 18,081 | | | $ | 17,755 | | | |
BLOOMIN’ BRANDS, INC.
NOTES TO CONSOLIDATED FINANCIAL STATEMENTS - Continued
The following table is a rollforward of unearned gift card revenue for the periods indicated:
| | | | | | | | | | | | | | | | | | | |
| FISCAL YEAR |
| (dollars in thousands) | 2024 | | 2023 | | 2022 | | |
| Balance, beginning of the period | $ | 372,551 | | | $ | 385,444 | | | $ | 387,339 | | | |
| Gift card sales | 290,481 | | | 322,291 | | | 322,288 | | | |
| Gift card redemptions | (279,810) | | | (316,139) | | | (306,427) | | | |
| Gift card breakage | (17,163) | | | (19,045) | | | (17,756) | | | |
| | | | | | | |
| Balance, end of the period | $ | 366,059 | | | $ | 372,551 | | | $ | 385,444 | | | |
Franchisee Deferred Payment Agreement - Effective December 31, 2023, the Company entered into an Amended & Restated Holistic Resolution Agreement (the “2023 Resolution Agreement”) with Cerca Trova Southwest Restaurant Group, LLC (d/b/a Out West Restaurant Group) and certain of its affiliates (collectively, “Out West”), who currently operate 75 franchised Outback Steakhouse restaurants in the western United States, primarily in California. The 2023 Resolution Agreement ends on December 27, 2026 or upon the earlier occurrence of certain specified events, including the sale of all or substantially all of the assets or equity of Out West, bankruptcy or a liquidation event. The 2023 Resolution Agreement includes agreements between Out West and its lenders prioritizing rents, royalties, national advertising fees and local marketing expenditures, and provides a mechanism to settle its obligations with its lenders and provide for capital expenditures, within certain limitations.
5. Impairments and Exit Costs
The components of Provision for impaired assets and restaurant closings are as follows for the periods indicated:
| | | | | | | | | | | | | | | | | |
| FISCAL YEAR |
| (dollars in thousands) | 2024 | | 2023 | | 2022 |
| Impairment losses | | | | | |
| U.S. (1) | $ | 33,947 | | | $ | 39,812 | | | $ | 3,942 | |
| Corporate | — | | | — | | | 7 | |
| Other (2) | 12,488 | | | 600 | | | 1,537 | |
| Total impairment losses | 46,435 | | | 40,412 | | | 5,486 | |
| Restaurant closure charges (benefit) | | | | | |
| U.S. (1) | 14,045 | | | (7,143) | | | 478 | |
| Other (2) | 3,811 | | | 305 | | | — | |
| Total restaurant closure charges (benefit) | 17,856 | | | (6,838) | | | 478 | |
| Provision for impaired assets and restaurant closings | $ | 64,291 | | | $ | 33,574 | | | $ | 5,964 | |
| | | | | |
| | | | | |
| | | | | |
| | | | | |
| | | | | |
| | | | | |
________________(1)Primarily includes charges related to the 2023 Restaurant Closures and the Q4 2024 Restaurant Impairment, as discussed below.
(2)Primarily includes charges related to the 2024 closure of nine restaurants in Hong Kong.
2023 Restaurant Closures - During 2023, the Company closed three U.S. and two Hong Kong Aussie Grill restaurants and made the decision to close 36 predominantly older, underperforming U.S. restaurants (the “2023 Restaurant Closures”). Following is a summary of 2023 Restaurant Closures expenses recognized in the Consolidated Statements of Operations and Comprehensive (Loss) Income for the periods indicated (dollars in thousands):
| | | | | | | | | | | | | | | | | | | | | | |
| DESCRIPTION | | CONSOLIDATED STATEMENTS OF OPERATIONS AND COMPREHENSIVE (LOSS) INCOME CLASSIFICATION | | | | FISCAL YEAR |
| | | | 2024 | | 2023 |
| | | | | | | | |
| | | | | | | | |
| Asset impairments and closure charges | | Provision for impaired assets and restaurant closings | | | | $ | 12,034 | | | $ | 34,200 | |
| Severance and other expenses | | General and administrative | | | | 3,798 | | | 622 | |
| Closure-related labor costs | | Labor and other related | | | | 434 | | | — | |
| Lease remeasurement gains | | Other restaurant operating | | | | — | | | (2,450) | |
| Total | | | | | | $ | 16,266 | | | $ | 32,372 | |
| | | | | | | | |
BLOOMIN’ BRANDS, INC.
NOTES TO CONSOLIDATED FINANCIAL STATEMENTS - Continued
During 2023, the Company recognized a lease termination gain of $6.7 million, net of related asset impairments, in connection with the closure of one U.S. restaurant.
Q4 2024 Restaurant Impairment - During the thirteen weeks ended December 29, 2024, the Company recorded asset impairment charges of $25.5 million primarily related to 41 older, underperforming U.S. restaurants based on an assessment of each restaurant’s historical operating performance and trends, combined with updated expected cash flow projections over the respective remaining lease term (the “Q4 2024 Restaurant Impairment”). The projections considered, among other factors, continued challenging operating and macroeconomic conditions since these restaurants tend to underperform Company-wide averages for sales and operating income.
The remaining impairment and closure charges during the periods presented resulted primarily from locations identified for closure, including the closure of all Company-owned U.S. Aussie Grill restaurants.
6. (Loss) Earnings Per Share
In connection with the offering of the 2025 Notes, the Company entered into the Convertible Note Hedge Transactions and Warrant Transactions described in Note 11 - Convertible Senior Notes. However, the Convertible Note Hedge Transactions are not considered when calculating dilutive shares given their antidilutive impact as an offset to dilution of shares underlying the 2025 Notes. The Warrant Transactions have a dilutive effect on the Company’s common stock to the extent the price of its common stock exceeds the strike price of the Warrant Transactions. See Note 11 - Convertible Senior Notes for additional information regarding the 2025 Notes, Convertible Note Hedge Transactions and Warrant Transactions.
The following table presents the computation of basic and diluted (loss) earnings per share for the periods indicated:
| | | | | | | | | | | | | | | | | |
| | FISCAL YEAR |
| (in thousands, except per share data) | 2024 | | 2023 | | 2022 |
| Net (loss) income attributable to Bloomin’ Brands | $ | (128,018) | | | $ | 247,386 | | | $ | 101,907 | |
| Net (loss) income from discontinued operations, net of tax | (75,982) | | | 41,629 | | | 16,053 | |
| Net (loss) income attributable to Bloomin’ Brands from continuing operations | $ | (52,036) | | | $ | 205,757 | | | $ | 85,854 | |
| | | | | |
| | | | | |
| | | | | |
| | | | | |
| | | | | |
| Basic weighted average common shares outstanding | 85,905 | | | 87,230 | | | 88,846 | |
| | | | | |
| Effect of dilutive securities: | | | | | |
| | | | | |
| | | | | |
| | | | | |
| Stock-based compensation awards | — | | | 767 | | | 623 | |
| Convertible senior notes (1) | — | | | 5,067 | | | 6,089 | |
| Warrants (1) | — | | | 3,389 | | | 2,954 | |
| Diluted weighted average common shares outstanding | 85,905 | | | 96,453 | | | 98,512 | |
| | | | | |
| Basic (loss) earnings per share: | | | | | |
| Continuing operations | $ | (0.61) | | | $ | 2.36 | | | $ | 0.97 | |
| Discontinued operations | (0.88) | | | 0.48 | | | 0.18 | |
| Net basic (loss) earnings per share | $ | (1.49) | | | $ | 2.84 | | | $ | 1.15 | |
| | | | | |
| Diluted (loss) earnings per share: | | | | | |
| Continuing operations | $ | (0.61) | | | $ | 2.13 | | | $ | 0.87 | |
| Discontinued operations | (0.88) | | | 0.43 | | | 0.16 | |
| Net diluted (loss) earnings per share | $ | (1.49) | | | $ | 2.56 | | | $ | 1.03 | |
| | | | | |
| | | | | |
| | | | | |
| | | | | |
| Antidilutive stock-based compensation awards | 1,706 | | | 924 | | | 2,502 | |
| | | | | |
| | | | | |
| | | | | |
________________
(1)During 2024, the Company repurchased $83.6 million of the 2025 Notes and settled the corresponding portion of the related warrants. See Note 11 - Convertible Senior Notes for additional details.
BLOOMIN’ BRANDS, INC.
NOTES TO CONSOLIDATED FINANCIAL STATEMENTS - Continued
7. Stock-based and Deferred Compensation Plans
Stock-based Compensation Plans
The Company recognized stock-based compensation expense as follows for the periods indicated:
| | | | | | | | | | | | | | | | | |
| FISCAL YEAR |
| (dollars in thousands) | 2024 | | 2023 | | 2022 |
| | | | | |
| | | | | |
| | | | | |
| Stock-based compensation expense, net of capitalized expense (1) | $ | 7,415 | | | $ | 11,613 | | | $ | 16,134 | |
| | | | | |
| | | | | |
| | | | | |
________________
(1)For 2024, 2023 and 2022, includes a cumulative life-to-date adjustment to decrease expense for PSUs granted in fiscal years 2024 and 2023, 2022 and 2020, respectively, based on updated assumptions regarding the criteria set forth in the award agreements.
PSUs and Restricted Stock Units (“RSUs”) - The number of PSUs that vest is determined for each year based on the achievement of certain performance criteria as set forth in the award agreement and may range from zero to 200% of the annual target grant. The PSUs are settled in shares of common stock, with holders receiving one share of common stock for each performance-based share unit that vests. Compensation expense for PSUs is recognized over the vesting period when it is probable the performance criteria will be achieved. RSUs generally vest over a period of three years in an equal number of shares each year.
The following table presents a summary of the Company’s PSU and RSU activity: | | | | | | | | | | | | | | | | | | | | | | | | | | | | | | | | | | | |
| | | | | WEIGHTED AVERAGE GRANT DATE FAIR VALUE PER UNIT | | AGGREGATE INTRINSIC VALUE (1) |
| (in thousands, except per unit data) | PSUs | | RSUs | | PSUs | | RSUs | | PSUs | | RSUs |
| Outstanding as of December 31, 2023 | 818 | | | 631 | | | $ | 26.92 | | | $ | 23.58 | | | $ | 23,026 | | | $ | 17,757 | |
| Granted | 290 | | | 807 | | | $ | 27.26 | | | $ | 18.76 | | | | | |
| Performance adjustment (2) | 237 | | | — | | | $ | 25.40 | | | $ | — | | | | | |
| Vested | (473) | | | (321) | | | $ | 25.40 | | | $ | 23.73 | | | | | |
| Forfeited | (150) | | | (73) | | | $ | 27.55 | | | $ | 23.93 | | | | | |
| Outstanding as of December 29, 2024 | 722 | | | 1,044 | | | $ | 27.42 | | | $ | 19.80 | | | $ | 8,860 | | | $ | 12,814 | |
| Expected to vest as of December 29, 2024 (3) | 132 | | | 1,044 | | | | | | | $ | 1,618 | | | $ | 12,814 | |
________________
(1)Based on the $28.15 and $12.27 share price of the Company’s common stock on December 29, 2023 and December 27, 2024, the last trading day of the years ended December 31, 2023 and December 29, 2024, respectively.
(2)Represents adjustment to 200% payout for PSUs granted during 2021.
(3)For PSUs, estimated number of units to be issued upon the vesting of outstanding PSUs based on Company performance projections of performance criteria set forth in the 2022, 2023 and 2024 PSU award agreements.
The Company granted PSUs subject to final payout modification by a Relative TSR modifier for all periods presented. This Relative TSR modifier can adjust the final payout outcome by 75%, 100% or 125% of the achieved performance metric, with the overall payout capped at 200% of the annual target grant. These PSUs have a three-year cliff vesting period and their fair value was estimated using the Monte Carlo simulation model. The Monte Carlo simulation model utilizes multiple input variables to estimate the probability that the market conditions will be achieved and is applied to the closing price of the Company’s common stock on the date of the grant.
BLOOMIN’ BRANDS, INC.
NOTES TO CONSOLIDATED FINANCIAL STATEMENTS - Continued
Assumptions used in the Monte Carlo simulation model and the grant date fair value of PSUs granted were as follows for the periods indicated:
| | | | | | | | | | | | | | | | | | | |
| FISCAL YEAR |
| 2024 | | 2023 | | 2022 | | |
| Assumptions: | | | | | | | |
| Risk-free interest rate (1) | 4.37 | % | | 4.26 | % | | 1.64 | % | | |
| Dividend yield (2) | 3.49 | % | | 3.47 | % | | 2.31 | % | | |
| | | | | | | |
| Volatility (3) | 51.41 | % | | 51.02 | % | | 49.11 | % | | |
| | | | | | | |
| | | | | | | |
| | | | | | | |
| | | | | | | |
________________
(1)Risk-free interest rate is the U.S. Treasury yield curve in effect as of the grant date for the performance period of the unit.
(2)Dividend yield is the level of dividends expected to be paid on the Company’s common stock over the expected term.
(3)Based on the historical volatility of the Company’s stock over the last seven years.
The following represents PSU and RSU compensation information for the periods indicated: | | | | | | | | | | | | | | | | | | | | | | | | | | | | | | | | | | | |
| FISCAL YEAR |
| 2024 | | 2023 | | 2022 |
| (dollars in thousands, except per unit data) | PSUs | | RSUs | | PSUs | | RSUs | | PSUs | | RSUs |
| Grant date fair value per unit (1) | $ | 27.26 | | | $ | 18.76 | | | $ | 29.01 | | | $ | 24.18 | | | $ | 26.10 | | | $ | 21.59 | |
| | | | | | | | | | | |
| Intrinsic value for vested units | $ | 12,593 | | | $ | 8,072 | | | $ | 12,908 | | | $ | 10,275 | | | $ | 7,626 | | | $ | 9,070 | |
| Grant date fair value of vested units | $ | 12,025 | | | $ | 7,603 | | | $ | 9,332 | | | $ | 8,257 | | | $ | 6,646 | | | $ | 8,025 | |
| Tax benefits for compensation expense | $ | 622 | | | $ | 1,152 | | | $ | 745 | | | $ | 1,528 | | | $ | 348 | | | $ | 1,113 | |
| | | | | | | | | | | |
| Unrecognized expense | $ | 2,595 | | | $ | 14,309 | | | | | | | | | |
| Remaining weighted average vesting period | 2.2 years | | 2.0 years | | | | | | | | |
________________
(1)For PSUs, represents a (discount) premium above the grant date per share value of the Company’s common stock for the Relative TSR modifier of (1.6)%, 2.7% and 7.9% for grants during 2024, 2023 and 2022, respectively. For RSUs, the weighted average dividend yield was 4.83%, 3.63% and 2.43% for 2024, 2023 and 2022, respectively.
Stock Options - Stock options generally vest and become exercisable over a period of four years in an equal number of shares each year. Stock options have an exercisable life of no more than ten years from the date of grant. The Company settles stock option exercises with authorized but unissued shares of the Company’s common stock.
The following table presents a summary of the Company’s stock option activity:
| | | | | | | | | | | | | | | | | | | | | | | |
| (in thousands, except exercise price and contractual life data) | OPTIONS | | WEIGHTED
AVERAGE
EXERCISE
PRICE | | WEIGHTED
AVERAGE
REMAINING
CONTRACTUAL
LIFE (YEARS) | | AGGREGATE
INTRINSIC
VALUE |
| Outstanding as of December 31, 2023 | 1,725 | | | $ | 21.04 | | | 3.2 | | $ | 12,263 | |
| | | | | | | |
| Exercised | (298) | | | $ | 23.74 | | | | | |
| Forfeited or expired | (227) | | | $ | 22.58 | | | | | |
| Outstanding and exercisable as of December 29, 2024 (1) | 1,200 | | | $ | 20.08 | | | 2.1 | | $ | — | |
| | | | | | | |
| | | | | | | |
| | | | | | | |
| | | | | | | |
| | | | | | | |
________________
(1)No stock options were granted during 2024.
BLOOMIN’ BRANDS, INC.
NOTES TO CONSOLIDATED FINANCIAL STATEMENTS - Continued
The following represents stock option compensation information for the periods indicated:
| | | | | | | | | | | | | | | | | |
| FISCAL YEAR |
| (dollars in thousands) | 2024 | | 2023 | | 2022 |
| Intrinsic value of options exercised | $ | 718 | | | $ | 6,200 | | | $ | 6,367 | |
| | | | | |
| Cash received from option exercises, net of tax withholding | $ | 4,354 | | | $ | 31,778 | | | $ | 17,888 | |
| Grant date fair value of stock options vested | $ | — | | | $ | 1,037 | | | $ | 7,645 | |
| Tax benefits for stock option compensation expense | $ | 111 | | | $ | 757 | | | $ | 1,495 | |
| | | | | |
| | | | | |
| | | | | |
As of December 29, 2024, the maximum number of shares of common stock available for issuance for equity instruments pursuant to the 2020 Omnibus Incentive Compensation Plan was 5,305,102.
Deferred Compensation Plans
401(k) Plan - The Company has a qualified defined contribution plan that qualifies under Section 401(k) of the Internal Revenue Code of 1986, as amended. The Company incurred contribution costs of $5.7 million, $5.6 million and $5.6 million for the 401(k) Plan for 2024, 2023 and 2022, respectively.
Highly Compensated Employee Plan - The Company provides a deferred compensation plan for its highly compensated employees who are not eligible to participate in the 401(k) Plan. The deferred compensation plan allows these employees to contribute a percentage of their base salary and cash bonus on a pre-tax basis. The deferred compensation plan is unsecured and funded through the Company’s voluntary contributions.
8. Supplemental Balance Sheet Information
Other current assets, net, consisted of the following as of the periods indicated:
| | | | | | | | | | | |
| (dollars in thousands) | DECEMBER 29, 2024 | | DECEMBER 31, 2023 |
| Prepaid expenses | $ | 23,102 | | | $ | 21,902 | |
| Accounts receivable - gift cards, net (1) | 73,113 | | | 67,424 | |
| Accounts receivable - vendors, net (1) | 29,233 | | | 13,648 | |
| Accounts receivable - franchisees, net (1) | 2,975 | | | 3,671 | |
| Accounts receivable - other, net (1) | 9,280 | | | 9,099 | |
| Deferred gift card sales commissions | 16,935 | | | 18,081 | |
| | | |
| Other current assets, net | 4,137 | | | 4,073 | |
| $ | 158,775 | | | $ | 137,898 | |
________________
(1)See Note 16 - Allowance for Expected Credit Losses for a rollforward of the related allowance for expected credit losses.
Property, fixtures and equipment, net, consisted of the following as of the periods indicated:
| | | | | | | | | | | |
| (dollars in thousands) | DECEMBER 29, 2024 | | DECEMBER 31, 2023 |
| Land | $ | 29,458 | | | $ | 34,650 | |
| Buildings | 1,201,949 | | | 1,180,004 | |
| Furniture and fixtures | 511,291 | | | 493,037 | |
| Equipment | 760,058 | | | 717,939 | |
| Construction in progress | 65,068 | | | 75,894 | |
| Less: accumulated depreciation | (1,619,303) | | | (1,573,359) | |
| $ | 948,521 | | | $ | 928,165 | |
| | | |
| | | |
| | | |
BLOOMIN’ BRANDS, INC.
NOTES TO CONSOLIDATED FINANCIAL STATEMENTS - Continued
Other assets, net, consisted of the following as of the periods indicated:
| | | | | | | | | | | |
| (dollars in thousands) | DECEMBER 29, 2024 | | DECEMBER 31, 2023 |
| Company-owned life insurance | $ | 31,971 | | | $ | 28,018 | |
| Deferred debt issuance costs - revolving credit facility (1) | 10,743 | | | 3,813 | |
| Liquor licenses | 22,422 | | | 23,125 | |
| Other assets | 9,335 | | | 5,134 | |
| $ | 74,471 | | | $ | 60,090 | |
| | | |
| | | |
| | | |
________________
(1)Net of accumulated amortization of $0.6 million and $11.7 million as of December 29, 2024 and December 31, 2023, respectively. During 2024, the Company recorded $9.0 million of deferred debt issuance costs in connection with the Third Amended and Restated Credit Agreement, as defined and discussed in more detail within Note 10 - Long-term Debt, Net below.
Accrued and other current liabilities consisted of the following as of the periods indicated:
| | | | | | | | | | | |
| (dollars in thousands) | DECEMBER 29, 2024 | | DECEMBER 31, 2023 |
| | | |
| Accrued payroll and other compensation | $ | 64,522 | | | $ | 71,848 | |
| Accrued insurance | 19,527 | | | 19,310 | |
| Other current liabilities | 94,265 | | | 106,523 | |
| $ | 178,314 | | | $ | 197,681 | |
Other long-term liabilities, net, consisted of the following as of the periods indicated:
| | | | | | | | | | | |
| (dollars in thousands) | DECEMBER 29, 2024 | | DECEMBER 31, 2023 |
| Accrued insurance | $ | 33,519 | | | $ | 26,616 | |
| | | |
| Deferred compensation obligations | 32,597 | | | 27,283 | |
| | | |
| Other long-term liabilities | 27,304 | | | 29,127 | |
| $ | 93,420 | | | $ | 83,026 | |
9. Goodwill and Intangible Assets, Net
Goodwill - The following table is a rollforward of goodwill and the related accumulated impairment losses for the periods indicated:
| | | | | | | | | | | | | | | | | |
| (dollars in thousands) | U.S. | | INTERNATIONAL FRANCHISE (1) | | CONSOLIDATED |
| | | | | |
| | | | | |
| | | | | |
| | | | | |
| | | | | |
| Balance as of December 31, 2023 | | | | | |
| | | | | |
| Goodwill, gross | $ | 838,827 | | | $ | 162,549 | | | $ | 1,001,376 | |
| Accumulated impairment losses | (668,170) | | | (119,883) | | | (788,053) | |
| Goodwill, net | 170,657 | | | 42,666 | | | 213,323 | |
| | | | | |
| Changes in goodwill | — | | | — | | | — | |
| | | | | |
| | | | | |
| | | | | |
| | | | | |
| | | | | |
| | | | | |
| Balance as of December 29, 2024 | | | | | |
| Goodwill, gross | 838,827 | | | 162,549 | | | 1,001,376 | |
| Accumulated impairment losses | (668,170) | | | (119,883) | | | (788,053) | |
| Goodwill, net | $ | 170,657 | | | $ | 42,666 | | | $ | 213,323 | |
| | | | | |
| | | | | |
| | | | | |
| | | | | |
________________
(1)Excludes $51.9 million and $63.0 million of Goodwill, net as of December 29, 2024 and December 31, 2023, respectively, classified as held for sale.
BLOOMIN’ BRANDS, INC.
NOTES TO CONSOLIDATED FINANCIAL STATEMENTS - Continued
The Company performs its annual assessment for impairment of goodwill and other indefinite-lived intangible assets during its second fiscal quarter. The Company’s 2024 and 2022 assessments were qualitative and its 2023 assessment was quantitative. In connection with these assessments, the Company did not record any goodwill asset impairment charges during the periods presented.
Intangible Assets, net - Intangible assets, net, consisted of the following as of the periods indicated:
| | | | | | | | | | | | | | | | | | | | | | | | | | | | | | | | | | | | | | | | | |
| WEIGHTED AVERAGE REMAINING AMORTIZATION PERIOD (in years) | | DECEMBER 29, 2024 | | DECEMBER 31, 2023 |
| (dollars in thousands) | | GROSS CARRYING VALUE | | ACCUMULATED AMORTIZATION | | NET CARRYING VALUE | | GROSS CARRYING VALUE | | ACCUMULATED AMORTIZATION | | NET CARRYING VALUE |
| Trade names | Indefinite | | $ | 414,716 | | | | | $ | 414,716 | | | $ | 414,716 | | | | | $ | 414,716 | |
| Trademarks | 4 | | 81,952 | | | $ | (67,577) | | | 14,375 | | | 81,952 | | | $ | (63,752) | | | 18,200 | |
| | | | | | | | | | | | | |
| | | | | | | | | | | | | |
| | | | | | | | | | | | | |
| | | | | | | | | | | | | |
| Total intangible assets | | $ | 496,668 | | | $ | (67,577) | | | $ | 429,091 | | | $ | 496,668 | | | $ | (63,752) | | | $ | 432,916 | |
| | | | | | | | | | | | | |
| | | | | | | | | | | | | |
| | | | | | | | | | | | | |
| | | | | | | | | | | | | |
| | | | | | | | | | | | | |
| | | | | | | | | | | | | |
| | | | | | | | | | | | | |
| | | | | | | | | | | | | |
| | | | | | | | | | | | | |
| | | | | | | | | | | | | |
The Company did not record any intangible asset impairment charges during the periods presented.
The following table presents goodwill, trade names and trademarks balances by reporting unit as of the periods indicated:
| | | | | | | | | | | | | | | | | | | | | | | | | | | | | | | | | | | |
| DECEMBER 29, 2024 | | DECEMBER 31, 2023 |
| (dollars in thousands) | GOODWILL | | TRADE NAMES | | TRADEMARKS | | GOODWILL | | TRADE NAMES | | TRADEMARKS |
| Outback Steakhouse | $ | 123,188 | | | $ | 287,000 | | | $ | — | | | $ | 123,188 | | | $ | 287,000 | | | $ | — | |
| Carrabba’s Italian Grill | 18,826 | | | 69,000 | | | — | | | 18,826 | | | 69,000 | | | — | |
| Bonefish Grill | 28,188 | | | — | | | 6,957 | | | 28,188 | | | — | | | 9,788 | |
| Fleming’s Prime Steakhouse & Wine Bar | 455 | | | — | | | 7,418 | | | 455 | | | — | | | 8,412 | |
| U.S. total | 170,657 | | | 356,000 | | | 14,375 | | | 170,657 | | | 356,000 | | | 18,200 | |
| | | | | | | | | | | |
| International Franchise | 42,666 | | | 58,716 | | | — | | | 42,666 | | | 58,716 | | | — | |
| | | | | | | | | | | |
| Total | $ | 213,323 | | | $ | 414,716 | | | $ | 14,375 | | | $ | 213,323 | | | $ | 414,716 | | | $ | 18,200 | |
Definite-lived intangible assets are amortized on a straight-line basis. The following table presents the aggregate expense related to the amortization of the Company’s trademarks for the periods indicated:
| | | | | | | | | | | | | | | | | |
| FISCAL YEAR |
| (dollars in thousands) | 2024 | | 2023 | | 2022 |
| Amortization expense | $ | 3,825 | | | $ | 4,076 | | | $ | 3,939 | |
The following table presents expected annual amortization of intangible assets as of December 29, 2024:
| | | | | | | | | | | | | | | | | | | | | | | | | | | | | | | | | |
| FISCAL YEAR | | | | |
| (dollars in thousands) | 2025 | | 2026 | | 2027 | | 2028 | | 2029 | | | | |
| Amortization of intangible assets | $ | 3,825 | | | $ | 3,825 | | | $ | 2,292 | | | $ | 995 | | | $ | 995 | | | | | |
| | | | | | | | | | | | | |
| | | | | | | | | | | | | |
BLOOMIN’ BRANDS, INC.
NOTES TO CONSOLIDATED FINANCIAL STATEMENTS - Continued
10. Long-term Debt, Net
Following is a summary of outstanding long-term debt, net, as of the periods indicated:
| | | | | | | | | | | | | | | | | | | | | | | |
| DECEMBER 29, 2024 | | DECEMBER 31, 2023 |
| (dollars in thousands) | OUTSTANDING BALANCE | | INTEREST RATE | | OUTSTANDING BALANCE | | INTEREST RATE |
| | | | | | | |
| | | | | | | |
| Senior secured credit facility - revolving credit facility (1)(2) | $ | 710,000 | | | 6.52 | % | | $ | — | | | |
| Former credit facility - revolving credit facility (2) | — | | | | | 381,000 | | | 6.96 | % |
| | | | | | | |
| | | | | | | |
| | | | | | | |
| | | | | | | |
| | | | | | | |
| 2025 Notes (3)(4) | 20,724 | | | 5.00 | % | | 104,786 | | | 5.00 | % |
| 2029 Notes | 300,000 | | | 5.13 | % | | 300,000 | | | 5.13 | % |
| | | | | | | |
| | | | | | | |
| Long-term debt | 1,030,724 | | | | | 785,786 | | | |
| Less: unamortized debt discount and issuance costs (3) | (3,326) | | | | | (5,067) | | | |
| | | | | | | |
| | | | | | | |
| | | | | | | |
| Long-term debt, net | $ | 1,027,398 | | | | | $ | 780,719 | | | |
| | | | | | | |
| | | | | | | |
| | | | | | | |
| | | | | | | |
| | | | | | | |
| | | | | | | |
________________(1)Subsequent to December 29, 2024, the Company repaid $140.0 million on its revolving credit facility, primarily with proceeds from the Brazil Sale Transaction.
(2)Interest rate represents the weighted average interest rate as of the respective periods.
(3)During 2024, the Company repurchased $83.6 million of the 2025 Notes and as a result, wrote off $0.8 million of debt issuance costs. See Note 11 - Convertible Senior Notes for additional details.
(4)Obligations under the 2025 Notes, which mature on May 1, 2025, have been classified as long-term, reflecting the Company’s intent and ability to refinance these notes through borrowings on its existing revolving credit facility.
Bloomin’ Brands, Inc. is a holding company and conducts its operations through its subsidiaries, certain of which have incurred indebtedness as described below.
Credit Agreement – On September 19, 2024, the Company and OSI, as co-borrowers, entered into the Third Amended and Restated Credit Agreement (the “Credit Agreement”), which provides for senior secured financing of up to $1.2 billion consisting of a revolving credit facility (the “Senior Secured Credit Facility”). The Senior Secured Credit Facility matures on September 19, 2029 and replaced the Company’s prior senior secured financing of up to $1.0 billion (the “Former Credit Facility”). The total indebtedness of the Company and interest rate applied to the Company’s borrowings remained unchanged as a result of the Credit Agreement.
The commitments under the Credit Agreement may be increased in an aggregate principal amount of up to; (i) $550.0 million or (ii) at the Company’s option, up to an unlimited amount of incremental facilities, so long as the Consolidated Senior Secured Net Leverage Ratio, as defined in the Credit Agreement, is no more than 3.00 to 1.00 as of the last day of the most recent period of four consecutive fiscal quarters ended, after giving effect to any such incurrence on a pro forma basis.
Under the Third Amended and Restated Credit Agreement, the Company may elect an interest rate at each reset period based on the Base Rate or Term SOFR, plus an applicable spread. The Term SOFR rate is the forward-looking term rate based on the secured overnight financing rate (“SOFR”) that is published by CME Group Benchmark Administration Limited (“Term SOFR”). The Base Rate option is the highest of: (i) the prime rate of Wells Fargo Bank, National Association, (ii) the federal funds effective rate plus 0.5 of 1.0% or (iii) the one-month Term SOFR plus a 0.10% Term SOFR Adjustment, plus 1.0% (the “Base Rate”). The Adjusted Term SOFR option is the Term SOFR rate plus a 0.10% Term SOFR Adjustment, subject to a 0% floor. The interest rate spreads are as follows:
| | | | | | | | | | | |
| BASE RATE ELECTION | | ADJUSTED TERM SOFR ELECTION |
| Revolving credit facility | 50 to 150 basis points over the Base Rate | | 150 to 250 basis points over the Adjusted Term SOFR |
| | | |
BLOOMIN’ BRANDS, INC.
NOTES TO CONSOLIDATED FINANCIAL STATEMENTS - Continued
The Third Amended and Restated Credit Agreement requires a Total Net Leverage Ratio (“TNLR”) not to exceed 4.50 to 1.00 (with a limited ability to temporarily increase TNLR to 5.00 to 1.00 in connection with material acquisitions). TNLR is the ratio of Consolidated Total Debt (Current portion of long-term debt and Long-term debt, net of cash, excluding the 2025 Notes) to Consolidated EBITDA (earnings before interest, taxes, depreciation and amortization and certain other adjustments as defined in the Third Amended and Restated Credit Agreement).
As of December 29, 2024 and December 31, 2023, the Company was in compliance with its debt covenants.
2029 Notes - On April 16, 2021, the Company and its wholly-owned subsidiary OSI, as co-issuers, issued $300.0 million aggregate principal amount of senior unsecured notes due 2029 (the “2029 Notes”).
The 2029 Notes were issued pursuant to an Indenture, dated April 16, 2021 (the “Indenture”), by and among the Company, the guarantors named therein, and Wells Fargo Bank, National Association, as trustee. The 2029 Notes are guaranteed by each of the Company’s existing and future domestic restricted subsidiaries (other than OSI) that are guarantors or borrowers under its Senior Secured Credit Facility or certain other indebtedness. The 2029 Notes mature on April 15, 2029, unless earlier redeemed or purchased by the Company. The 2029 Notes bear cash interest at an annual rate of 5.125% payable semi-annually in arrears on April 15 and October 15 of each year.
The Company may redeem some or all of the 2029 Notes at the redemption prices set forth in the Indenture, plus accrued and unpaid interest.
The Indenture contains restrictive covenants that limit the ability of the Company and its restricted subsidiaries to, among other things, incur additional indebtedness or issue certain preferred stock; pay dividends above certain thresholds, redeem stock or make other distributions; make certain investments; create restrictions on the ability of the Company’s restricted subsidiaries to pay dividends or make other payments to the Company; create certain liens; transfer or sell certain assets; merge or consolidate; enter into certain transactions with the Company’s affiliates; and designate subsidiaries as unrestricted subsidiaries. These covenants are subject to a number of exceptions and qualifications as set forth in the Indenture.
The Indenture contains customary events of default, including, without limitation, failure to make required payments, failure to comply with certain agreements or covenants, cross-acceleration to certain other indebtedness in excess of specified amounts, certain events of bankruptcy and insolvency, and failure to pay certain judgments.
Maturities - Following is a summary of principal payments of the Company’s total consolidated debt outstanding as of December 29, 2024:
| | | | | | | | | | | | | | | | | | | | | | | | | | | | | | | | | | | | | | | | | |
| FISCAL YEAR | | | | |
| (dollars in thousands) | 2025 | | 2026 | | 2027 | | 2028 | | 2029 | | THEREAFTER | | TOTAL |
| Debt repayments | $ | 20,724 | | | $ | — | | | $ | — | | | $ | — | | | $ | 1,010,000 | | | $ | — | | | $ | 1,030,724 | |
| | | | | | | | | | | | | |
| | | | | | | | | | | | | |
11. Convertible Senior Notes
2025 Notes - In May 2020, the Company completed a $230.0 million principal amount private offering of 5.00% convertible senior unsecured notes due in 2025 (the “2025 Notes”). The 2025 Notes are governed by the terms of an indenture between the Company and Wells Fargo Bank, National Association, as the Trustee. The 2025 Notes mature on May 1, 2025, unless earlier converted, redeemed or purchased by the Company. The 2025 Notes bear cash interest at an annual rate of 5.00%, payable semi-annually in arrears on May 1 and November 1 of each year.
The initial conversion rate applicable to the 2025 Notes was 84.122 shares of common stock per $1,000 principal amount of 2025 Notes, or a total of approximately 19.348 million shares for the total $230.0 million principal amount. This initial conversion rate was equivalent to an initial conversion price of approximately $11.89 per share. The conversion rate is subject to adjustment upon the occurrence of certain specified events.
BLOOMIN’ BRANDS, INC.
NOTES TO CONSOLIDATED FINANCIAL STATEMENTS - Continued
Holders may convert all or a portion of their 2025 Notes at any time prior to the close of business on the second scheduled trading day immediately before the maturity date.
The 2025 Notes are redeemable by the Company, in whole or in part, at the Company’s option at any time, and from time to time, on or before the 40th scheduled trading day immediately before the maturity date, at a cash redemption price equal to the principal amount of the 2025 Notes to be redeemed, plus accrued and unpaid interest, but only if the last reported sale price per share of the Company’s common stock exceeds 130% of the conversion price on: (i) each of at least 20 trading days, whether or not consecutive, during the 30 consecutive trading days ending on, and including, the trading day immediately before the date the Company sends the related redemption notice; and (ii) the trading day immediately before the date the Company sends such notice. In addition, calling any of the 2025 Notes for redemption will constitute a make-whole fundamental change with respect to that note, in which case the conversion rate applicable to the conversion of the 2025 Notes will be increased in certain circumstances if it is converted after it is called for redemption.
If a fundamental change occurs prior to the maturity date, holders may require the Company to repurchase all or a portion of their 2025 Notes for cash at a price equal to 100% of the principal amount of the 2025 Notes to be repurchased, plus accrued and unpaid interest. Holders of 2025 Notes who convert their 2025 Notes in connection with a notice of redemption or a make-whole fundamental change may be entitled to a premium in the form of an increase in the conversion rate of the 2025 Notes.
The Company has provided the trustee of the 2025 Notes notice of its irrevocable election under the 2025 Notes indenture to settle the principal portion of the 2025 Notes upon conversion in cash and any excess in shares.
On May 25, 2022, the Company entered into exchange agreements (the “2022 Exchange Agreements”) with certain holders of the 2025 Notes. These holders agreed to exchange $125.0 million in aggregate principal amount of the Company’s outstanding 2025 Notes for $196.9 million in cash, plus accrued interest, and approximately 2.3 million shares of the Company’s common stock (the “First 2025 Notes Partial Repurchase”). Under the 2022 Exchange Agreements, the total amount of cash paid and number of shares of common stock issued by the Company were based upon the volume-weighted average price per share of the Company’s common stock during a ten-trading day averaging period ending on June 14, 2022. Upon entering into the 2022 Exchange Agreements, the conversion feature related to the 2025 Notes repurchased, as well as the settlements of the related convertible senior note hedges and warrants, were subject to derivative accounting. In connection with the First 2025 Notes Partial Repurchase, the Company recognized a loss on extinguishment of debt of $104.7 million and a loss on fair value adjustment of derivatives, net of $17.7 million, and recorded a $48.5 million increase to Additional paid-in capital during 2022.
On February 29, 2024, the Company entered into exchange agreements (the “2024 Exchange Agreements”) with certain holders of the 2025 Notes. The 2024 Exchange Agreements provided for the Company to deliver and pay at the closing of the transactions on March 5, 2024, an aggregate of approximately 7.5 million shares of its common stock and $3.3 million in cash, including accrued interest, in exchange for $83.6 million in aggregate principal amount of the Company’s outstanding 2025 Notes (the “Second 2025 Notes Partial Repurchase”). In connection with the Second 2025 Notes Partial Repurchase, the Company recognized a loss on extinguishment of debt of $135.8 million and recorded a $216.1 million increase to Additional paid-in capital during 2024.
In connection with dividends paid during 2024, the conversion rate for the Company’s remaining 2025 Notes decreased to approximately $10.60 per share, which represents 94.360 shares of common stock per $1,000 principal amount of the 2025 Notes, or a total of approximately 1.956 million shares.
BLOOMIN’ BRANDS, INC.
NOTES TO CONSOLIDATED FINANCIAL STATEMENTS - Continued
The following table includes the outstanding principal amount and carrying value of the 2025 Notes as of the periods indicated:
| | | | | | | | | | | |
| (dollars in thousands) | DECEMBER 29, 2024 | | DECEMBER 31, 2023 |
| Principal | $ | 20,724 | | | $ | 104,786 | |
| | | |
| Less: unamortized debt issuance costs (1) | (56) | | | (1,138) | |
| Net carrying amount | $ | 20,668 | | | $ | 103,648 | |
| | | |
________________
(1)During 2024, the Company wrote off $0.8 million of debt issuance costs as a result of the Second 2025 Notes Partial Repurchase.
Following is a summary of interest expense for the 2025 Notes by component for the periods indicated:
| | | | | | | | | | | | | | | | | |
| FISCAL YEAR |
| (dollars in thousands) | 2024 | | 2023 | | 2022 |
| Coupon interest | $ | 1,783 | | | $ | 5,242 | | | $ | 8,080 | |
| | | | | |
| Debt issuance cost amortization | 280 | | | 798 | | | 1,156 | |
| Total interest expense (1) | $ | 2,063 | | | $ | 6,040 | | | $ | 9,236 | |
________________
(1)The effective rate of the 2025 Notes over their expected life is 5.85%.
Convertible Note Hedge and Warrant Transactions - In connection with the offering of the 2025 Notes, the Company entered into convertible note hedge transactions (the “Convertible Note Hedge Transactions”) with certain of the initial purchasers of the 2025 Notes and/or their respective affiliates and other financial institutions (in this capacity, the “Hedge Counterparties”). Concurrently with the Company’s entry into the Convertible Note Hedge Transactions, the Company also entered into separate, warrant transactions with the Hedge Counterparties collectively relating to the same number of shares of the Company’s common stock, subject to customary anti-dilution adjustments, and for which the Company received proceeds that partially offset the cost of entering into the Convertible Note Hedge Transactions (the “Warrant Transactions”).
The Convertible Note Hedge Transactions cover, subject to customary anti-dilution adjustments, the number of shares of the Company’s common stock that initially underlie the 2025 Notes, and are expected generally to reduce the potential equity dilution in excess of the principal amount due upon conversion of the 2025 Notes. The Warrant Transactions have a dilutive effect on the Company’s common stock to the extent that the price of its common stock exceeds the strike price of the Warrant Transactions. The strike price was initially $16.64 per share and is subject to certain adjustments under the terms of the Warrant Transactions.
The Convertible Note Hedge Transactions are exercisable upon conversion of the 2025 Notes and expire upon maturity of the 2025 Notes. The Warrant Transactions are exercisable on the expiration dates included in the related forms of confirmation.
In connection with the First 2025 Notes Partial Repurchase, the Company entered into partial unwind agreements with certain financial institutions relating to a portion of the convertible note hedge transactions (the “2022 Note Hedge Early Termination Agreements”) and a portion of the Warrant Transactions (the “2022 Warrant Early Termination Agreements”). Upon settlement, the Company received $131.9 million for the 2022 Note Hedge Early Termination Agreements and paid $114.8 million for the 2022 Warrant Early Termination Agreements. In connection with the 2022 Note Hedge Early Termination Agreements and the 2022 Warrant Early Termination Agreements the Company recorded a $113.0 million increase and a $97.6 million decrease, respectively, to Additional paid-in capital during 2022.
In connection with the Second 2025 Notes Partial Repurchase, the Company entered into partial unwind agreements with certain financial institutions relating to a portion of the convertible note hedge transactions (the “2024 Note Hedge Early Termination Agreements”) and a portion of the warrant transactions (the “2024 Warrant Early Termination Agreements”, together the “2024 Early Termination Agreements”), that were previously entered into
BLOOMIN’ BRANDS, INC.
NOTES TO CONSOLIDATED FINANCIAL STATEMENTS - Continued
by the Company in connection with the issuance of the 2025 Notes. Pursuant to the 2024 Early Termination Agreements, the Company received a termination payment which consisted of approximately $118.2 million in cash and 0.3 million shares of common stock, and the Company made a termination payment in an aggregate amount of approximately $102.2 million in cash. In connection with the 2024 Early Termination Agreements, the Company recorded a $126.5 million increase and a $102.2 million decrease, respectively, to Additional paid-in capital during 2024. The Company also recorded an $8.3 million increase to Accumulated deficit in connection with the 2024 Note Hedge Early Termination Agreements.
The remaining Warrant Transactions have a dilutive effect on the Company’s common stock to the extent that the price of its common stock exceeds the strike price of the Warrant Transactions. In connection with dividends paid during 2024, the strike price for the remaining Warrant Transactions decreased to $14.84.
12. Stockholders’ Equity
Share Repurchases - In February 2024, the Company’s Board of Directors (the “Board”) canceled the remaining $57.5 million under the Company’s former share repurchase authorization and approved a new $350.0 million share repurchase authorization (the “2024 Share Repurchase Program”). The 2024 Share Repurchase Program includes capacity above the Company’s normal repurchase activity to provide flexibility in retiring the 2025 Notes at or prior to their maturity. The 2024 Share Repurchase Program will expire on August 13, 2025.
On March 1, 2024, the Company entered into an accelerated share repurchase agreement (the “ASR Agreement”), in connection with the 2024 Share Repurchase Program, with Wells Fargo Bank, National Association (“Wells Fargo”) to repurchase $220.0 million of the Company’s common stock. Under the ASR Agreement, the Company repurchased 7.9 million shares of common stock through April 23, 2024 based generally on the average of the daily volume-weighted average price per share of common stock during the repurchase period, subject to discounts and certain adjustments. The repurchase resulted in a $214.3 million increase in Accumulated deficit. The Company funded the payment under the ASR Agreement, together with the cash portion of the amounts payable under the 2024 Exchange Agreements, primarily with borrowings under the revolving credit facility and net proceeds from the 2024 Early Termination Agreements.
Following is a summary of the shares repurchased during fiscal year 2024:
| | | | | | | | | | | | | | | | | | | | | | | | | | | | | |
| (in thousands, except per share data) | NUMBER OF SHARES | | AVERAGE REPURCHASE PRICE PER SHARE | | AMOUNT |
| | | | | |
| | | | | | | | | | | | | | | | | |
| First fiscal quarter | 6,948 | | | | | | | $ | 27.13 | | | | | | | $ | 188,500 | | | | | |
| Second fiscal quarter | 2,156 | | | | | | | $ | 27.36 | | | | | | | 59,000 | | | | | |
| Third fiscal quarter | 969 | | | | | | | $ | 18.78 | | | | | | | 18,195 | | | | | |
| | | | | | | | | | | | | | | | | |
| Total common stock repurchases | 10,073 | | | | | | | $ | 26.38 | | | | | | | 265,695 | | | | | |
| Share repurchase-related ASR Agreement fees and excise taxes | | | | | | | | | | | | | 728 | | | | | |
| Total | 10,073 | | | | | | | | | | | | | $ | 266,423 | | | | | |
Dividends - The Company declared and paid dividends per share during the periods presented as follows:
| | | | | | | | | | | | | | | | | | | | | | | | | | | |
| DIVIDENDS PER SHARE | | AMOUNT |
| FISCAL YEAR | | FISCAL YEAR |
| (dollars in thousands, except per share data) | 2024 | | | | 2023 | | 2024 | | | | 2023 |
| First fiscal quarter | $ | 0.24 | | | | | $ | 0.24 | | | $ | 21,075 | | | | | $ | 21,014 | |
| Second fiscal quarter | 0.24 | | | | | 0.24 | | | 20,762 | | | | | 20,990 | |
| Third fiscal quarter | 0.24 | | | | | 0.24 | | | 20,375 | | | | | 20,901 | |
| Fourth fiscal quarter | 0.24 | | | | | 0.24 | | | 20,362 | | | | | 20,837 | |
| Total cash dividends declared and paid | $ | 0.96 | | | | | $ | 0.96 | | | $ | 82,574 | | | | | $ | 83,742 | |
BLOOMIN’ BRANDS, INC.
NOTES TO CONSOLIDATED FINANCIAL STATEMENTS - Continued
In February 2025, the Board declared a quarterly cash dividend of $0.15 per share, payable on March 26, 2025 to shareholders of record at the close of business on March 11, 2025.
Accumulated Other Comprehensive Loss (“AOCL”) - The following table is a rollforward of the components of AOCL for the periods indicated:
| | | | | | | | | | | | | | | | | | | | | |
| | | | | FISCAL YEAR |
| (dollars in thousands) | | | | | 2024 | | 2023 | | 2022 |
| Foreign currency translation: | | | | | | | | | |
| Balance, beginning of the period | | | | | $ | (177,689) | | | $ | (185,311) | | | $ | (195,480) | |
| Foreign currency translation adjustment | | | | | (35,178) | | | 7,622 | | | 10,169 | |
| Reclassification of foreign currency translation adjustments related to the liquidation of foreign entities | | | | | 695 | | | — | | | — | |
| Balance, end of the period | | | | | $ | (212,172) | | | $ | (177,689) | | | $ | (185,311) | |
| (Loss) gain on derivatives, net of tax: | | | | | | | | | |
| Balance, beginning of the period | | | | | $ | (615) | | | $ | — | | | $ | (10,509) | |
| Change in fair value of derivatives, net of tax | | | | | 1,527 | | | (606) | | | 573 | |
| Reclassification realized in Net (loss) income, net of tax | | | | | (1,533) | | | (9) | | | 954 | |
| Impact of terminated interest rate swaps included in Net income, net of tax | | | | | — | | | — | | | 8,982 | |
| Balance, end of the period | | | | | $ | (621) | | | $ | (615) | | | $ | — | |
| Accumulated other comprehensive loss: | | | | | | | | | |
| Balance beginning of the period | | | | | $ | (178,304) | | | $ | (185,311) | | | $ | (205,989) | |
| Other comprehensive (loss) income attributable to Bloomin' Brands | | | | | (34,489) | | | 7,007 | | | 20,678 | |
| Balance, end of the period | | | | | $ | (212,793) | | | $ | (178,304) | | | $ | (185,311) | |
13. Derivative Instruments and Hedging Activities
Interest Rate Risk - The Company manages economic risks, including interest rate variability, primarily by managing the amount, sources and duration of its debt funding and through the use of derivative financial instruments. The Company’s objectives in using interest rate derivatives are to manage its exposure to interest rate movements. To accomplish this objective, the Company uses interest rate swaps.
Currency Exchange Rate Risk - The Company is exposed to foreign currency exchange rate risk arising from transactions and balances denominated in currencies other than the U.S. dollar. The Company may use foreign currency forward contracts to manage certain foreign currency exposures.
Designated Hedges
Cash Flow Hedges of Interest Rate Risk - In March 2024 and December 2023, OSI entered into 11 interest rate swap agreements with ten counterparties (the “Swap Transactions”) to manage its exposure to fluctuations in variable interest rates. The Swap Transactions have an aggregate notional amount of $375.0 million and include one and two-year tenors with the following terms:
| | | | | | | | | | | | | | | | | | | | |
| NOTIONAL AMOUNT | | WEIGHTED AVERAGE FIXED INTEREST RATE (1) | | EFFECTIVE DATE | | TERMINATION DATE |
| $ | 100,000,000 | | | 4.92% | | December 29, 2023 | | December 31, 2024 |
| 100,000,000 | | | 4.34% | | December 29, 2023 | | December 31, 2025 |
| 175,000,000 | | | 4.40% | | March 29, 2024 | | March 31, 2026 |
| $ | 375,000,000 | | | 4.52% | | | | |
| | | | | | |
____________________
(1)The weighted average fixed interest rate excludes the term SOFR adjustment and interest rate spread described below.
BLOOMIN’ BRANDS, INC.
NOTES TO CONSOLIDATED FINANCIAL STATEMENTS - Continued
In connection with the Swap Transactions, the Company converted $375.0 million of its outstanding indebtedness from SOFR, plus a term SOFR adjustment of 0.10% and a spread of 150 to 250 basis points to the weighted average fixed interest rates within the table above, plus a term SOFR adjustment of 0.10% and a spread of 150 to 250 basis points. The Swap Transactions have an embedded floor of minus 0.10%.
The Swap Transactions have been designated and qualify as cash flow hedges, are recognized on the Company’s Consolidated Balance Sheets at fair value as of December 29, 2024 and are classified based on the instruments’ maturity dates. The Company estimates $0.7 million of interest expense will be reclassified from AOCL to Interest expense, net over the next 12 months related to the Swap Transactions.
The following table presents the fair value and classification of the Company’s swap agreements as of the periods indicated:
| | | | | | | | | | | | | | | | | |
| (dollars in thousands) | CONSOLIDATED BALANCE SHEET CLASSIFICATION | | DECEMBER 29, 2024 | | DECEMBER 31, 2023 |
| Interest rate swaps - asset (1) | Other current assets, net | | $ | — | | | $ | 320 | |
| | | | | |
| | | | | |
| | | | | |
| Interest rate swaps - liability | Accrued and other current liabilities | | $ | 579 | | | $ | 253 | |
| Interest rate swaps - liability | Other long-term liabilities, net | | 255 | | | 893 | |
| Total fair value of derivative instruments - liabilities (1) | | | $ | 834 | | | $ | 1,146 | |
| | | | | |
____________________
(1) See Note 15 - Fair Value Measurements for fair value discussion of the interest rate swaps.
By utilizing the interest rate swaps, the Company is exposed to credit-related losses in the event that the counterparty fails to perform under the terms of the derivative contract. To mitigate this risk, the Company enters into derivative contracts with major financial institutions based upon credit ratings and other factors. The Company continually assesses the creditworthiness of its counterparties. As of December 29, 2024, all counterparties to the Swap Transactions performed in accordance with their contractual obligations.
As of December 29, 2024 and December 31, 2023, the fair value of the Company’s Swap Transactions was in a net liability position, including accrued interest but excluding any adjustment for nonperformance risk, of $0.8 million. As of December 29, 2024 and December 31, 2023, the Company has not posted any collateral related to the Swap Transactions.
The Swap Transactions contain provisions whereby the Company could be declared in default on its derivative obligations if the repayment of the underlying indebtedness is accelerated by the lender due to the Company’s default on indebtedness. If the Company had breached any of these provisions as of December 29, 2024 and December 31, 2023, it could have been required to settle its obligations under the Swap Transactions at their termination value of $0.8 million.
Non-Designated Hedges
During the fourth quarter of 2024, the Company entered into foreign currency forward contracts to partially offset the foreign currency exchange gains and losses generated by the Brazilian Reais rate risk associated with the purchase price installment payments from the Brazil Sale Transaction. As of December 29, 2024, the Company had $184.6 million of outstanding notional amounts related to its foreign currency forward contracts. Subsequent to December 29, 2024, the outstanding notional amounts related to the Company’s foreign currency forward contracts decreased to $107.7 million following the collection of the first installment payment from the Brazil Sale Transaction. As of December 29, 2024, the Company has not posted any collateral related to the foreign currency forward contracts.
BLOOMIN’ BRANDS, INC.
NOTES TO CONSOLIDATED FINANCIAL STATEMENTS - Continued
The following table presents the fair value and classification of the Company’s foreign exchange forward contracts as of the period indicated:
| | | | | | | | | | | | | | | |
| (dollars in thousands) | CONSOLIDATED BALANCE SHEET CLASSIFICATION | | DECEMBER 29, 2024 | | | | |
| Foreign currency forward contracts - asset (1) | Other current assets, net | | $ | 304 | | | | | |
| | | | | | | |
| | | | | | | |
____________________
(1) See Note 15 - Fair Value Measurements for fair value discussion of the interest rate swaps.
The following table summarizes the effects of the Company’s foreign exchange forward contracts on the Consolidated Statements of Operations and Comprehensive (Loss) Income for the period indicated:
| | | | | | | | | | | | | | | |
| CONSOLIDATED STATEMENTS OF OPERATIONS AND COMPREHENSIVE (LOSS) INCOME CLASSIFICATION | | FISCAL YEAR | | | | |
| (dollars in thousands) | | 2024 | | | | |
| Gains on foreign currency forward contracts | General and administrative | | $ | 15,728 | | | | | |
The Company’s interest rate swaps and foreign currency forward contracts are subject to master netting arrangements. As of December 29, 2024, the Company elected not to offset derivative positions in the balance sheet with the same counterparty under the same agreement.
14. Leases
The following table includes a detail of lease assets and liabilities included on the Company’s Consolidated Balance Sheets as of the periods indicated:
| | | | | | | | | | | | | | | | | | | |
| (dollars in thousands) | CONSOLIDATED BALANCE SHEET CLASSIFICATION | | DECEMBER 29, 2024 | | DECEMBER 31, 2023 | | |
| Operating lease right-of-use assets | Operating lease right-of-use assets | | $ | 1,012,857 | | | $ | 1,031,271 | | | |
| Finance lease right-of-use assets (1) | Property, fixtures and equipment, net | | 10,058 | | | 8,858 | | | |
| | | | | | | |
| | | | | | | |
| Total lease assets, net | | | $ | 1,022,915 | | | $ | 1,040,129 | | | |
| | | | | | | |
| Current operating lease liabilities | Current operating lease liabilities | | $ | 158,806 | | | $ | 163,724 | | | |
| Current finance lease liabilities | Accrued and other current liabilities | | 2,618 | | | 2,171 | | | |
| Non-current operating lease liabilities | Non-current operating lease liabilities | | 1,088,518 | | | 1,087,353 | | | |
| Non-current finance lease liabilities | Other long-term liabilities, net | | 8,359 | | | 7,347 | | | |
| Total lease liabilities | | | $ | 1,258,301 | | | $ | 1,260,595 | | | |
________________
(1)Net of accumulated amortization of $4.0 million and $3.5 million as December 29, 2024 and December 31, 2023, respectively.
Following is a summary of expenses and income related to leases recognized in the Company’s Consolidated Statements of Operations and Comprehensive (Loss) Income for the periods indicated:
| | | | | | | | | | | | | | | | | | | | | | | | | | | | | |
| CONSOLIDATED STATEMENTS OF OPERATIONS AND COMPREHENSIVE (LOSS) INCOME CLASSIFICATION | | | | | | FISCAL YEAR |
| (dollars in thousands) | | | | | | 2024 | | 2023 | | 2022 | | |
| Operating lease cost (1) | Other restaurant operating | | | | | | $ | 169,661 | | | $ | 171,248 | | | $ | 172,874 | | | |
| Variable lease cost | Other restaurant operating | | | | | | 3,878 | | | 2,930 | | | 53 | | | |
| Finance lease costs: | | | | | | | | | | | | | |
| Amortization of leased assets | Depreciation and amortization | | | | | | 2,032 | | | 1,975 | | | 1,279 | | | |
| Interest on lease liabilities | Interest expense, net | | | | | | 710 | | | 667 | | | 156 | | | |
| Sublease revenue | Franchise and other revenues | | | | | | (7,060) | | | (7,614) | | | (8,978) | | | |
| Lease costs, net | | | | | | | $ | 169,221 | | | $ | 169,206 | | | $ | 165,384 | | | |
________________
(1)Excludes rent expense for office facilities and Company-owned closed or subleased properties of $14.3 million, $12.1 million and $11.9 million for 2024, 2023 and 2022, respectively, which is included in General and administrative expense.
BLOOMIN’ BRANDS, INC.
NOTES TO CONSOLIDATED FINANCIAL STATEMENTS - Continued
As of December 29, 2024, future minimum lease payments and sublease revenues under non-cancelable leases are as follows:
| | | | | | | | | | | | | | | | | |
| (dollars in thousands) | OPERATING LEASES | | FINANCE LEASES | | SUBLEASE REVENUES |
| 2025 (1) | $ | 165,372 | | | $ | 2,699 | | | $ | (5,559) | |
| 2026 | 182,009 | | | 2,281 | | | (5,511) | |
| 2027 | 173,983 | | | 1,970 | | | (5,638) | |
| 2028 | 165,855 | | | 1,181 | | | (5,557) | |
| 2029 | 161,723 | | | 1,125 | | | (5,363) | |
| Thereafter | 1,327,887 | | | 6,712 | | | (28,065) | |
| Total minimum lease payments (receipts) (2) | 2,176,829 | | | 15,968 | | | $ | (55,693) | |
| Less: Interest | (929,505) | | | (4,991) | | | |
| Present value of future lease payments | $ | 1,247,324 | | | $ | 10,977 | | | |
____________________
(1)Net of operating lease prepaid rent of $15.3 million.
(2)Includes $988.4 million related to operating lease renewal options that are reasonably certain of exercise and excludes $172.4 million of signed operating leases that have not yet commenced.
The following table is a summary of the weighted average remaining lease terms and weighted average discount rates of the Company’s leases as of the periods indicated:
| | | | | | | | | | | | | | | | | | | | | | | | | |
| FINANCE LEASES | | OPERATING LEASES | | |
| DECEMBER 29, 2024 | | DECEMBER 31, 2023 | | DECEMBER 29, 2024 | | DECEMBER 31, 2023 | | |
| Weighted average remaining lease term (1): | 9.1 years | | 10.5 years | | 13.4 years | | 13.3 years | | |
| Weighted average discount rate (2): | 7.70 | % | | 7.80 | % | | 8.22 | % | | 8.33 | % | | |
____________________
(1)Includes lease renewal options that are reasonably certain of exercise.
(2)Based on the Company’s incremental borrowing rate at lease commencement or lease remeasurement.
The following table is a summary of cash flow impacts from the Company’s Consolidated Financial Statements related to its leases for the periods indicated:
| | | | | | | | | | | | | | | | | | | |
| FISCAL YEAR |
| (dollars in thousands) | 2024 | | 2023 | | 2022 | | |
| | | | | | | |
| Cash flows from operating activities: | | | | | | | |
| Cash paid for amounts included in the measurement of operating lease liabilities | $ | 184,969 | | | $ | 185,861 | | | $ | 183,817 | | | |
| | | | | | | |
| | | | | | | |
| | | | | | | |
| | | | | | | |
| | | | | | | |
15. Fair Value Measurements
Fair Value Measurements on a Recurring Basis - The following table summarizes the Company’s financial assets and liabilities measured at fair value by hierarchy level on a recurring basis as of the periods indicated:
| | | | | | | | | | | | | | | | | | | | | | | | | | | | | | | | | | | |
| CONSOLIDATED BALANCE SHEET CLASSIFICATION | | MEASUREMENT LEVEL | | FAIR VALUE | | |
| (dollars in thousands) | | | DECEMBER 29, 2024 | | | | | | | | DECEMBER 31, 2023 | | |
| Assets: | | | | | | | | | | | | | | | | | | | |
| Short-term investments | Cash and cash equivalents | | Level 1 | | $ | 11,868 | | | | | | | | | $ | 23,920 | | | | | | | |
| | | | | | | | | | | | | | | | | | | |
| Short-term investments | Restricted cash and cash equivalents | | Level 1 | | $ | — | | | | | | | | | $ | 2,854 | | | | | | | |
| Interest rate swaps | Other current assets, net | | Level 2 | | $ | — | | | | | | | | | $ | 320 | | | | | | | |
| Foreign currency forward contracts | Other current assets, net | | Level 2 | | $ | 304 | | | | | | | | | $ | — | | | | | | | |
| | | | | | | | | | | | | | | | | | | |
| | | | | | | | | | | | | | | | | | | |
| | | | | | | | | | | | | | | | | | | |
| Liabilities: | | | | | | | | | | | | | | | | | | | |
| Interest rate swaps | Accrued and other current liabilities | | Level 2 | | $ | 579 | | | | | | | | | $ | 253 | | | | | | | |
| | | | | | | | | | | | | | | | | | | |
| Interest rate swaps | Other long-term liabilities | | Level 2 | | $ | 255 | | | | | | | | | $ | 893 | | | | | | | |
| | | | | | | | | | | | | | | | | | | |
| | | | | | | | | | | | | | | | | | | |
| | | | | | | | | | | | | | | | | | | |
| | | | | | | | | | | | | | | | | | | |
| | | | | | | | | | | | | | | | | | | |
| | | | | | | | | | | | | | | | | | | |
| | | | | | | | | | | | | | | | | | | |
| | | | | | | | | | | | | | | | | | | |
| | | | | | | | | | | | | | | | | | | |
| | | | | | | | | | | | | | | | | | | |
| | | | | | | | | | | | | | | | | | | |
| | | | | | | | | | | | | | | | | | | |
BLOOMIN’ BRANDS, INC.
NOTES TO CONSOLIDATED FINANCIAL STATEMENTS - Continued
Fair value of each class of financial instruments is determined based on the following:
| | | | | | | | |
| FINANCIAL INSTRUMENT | | METHODS AND ASSUMPTIONS |
| Short-term investments | | Carrying value approximates fair value because maturities are less than three months. |
| Derivative instruments | | The Company’s derivative instruments include interest rate swaps and foreign currency forward contracts. Fair value measurements are based on the contractual terms of the derivatives and observable market-based inputs. Interest rate swaps are valued using a discounted cash flow analysis on the expected cash flows of each derivative using observable inputs including interest rate curves and credit spreads. Foreign currency forwards are valued by comparing the contracted forward exchange rate to the current market forward exchange rate. Key inputs for the valuation of the foreign currency forwards are spot rates, foreign currency forward rates, and the interest rate curve of the domestic currency. The Company also considers its own nonperformance risk and the respective counterparty’s nonperformance risk in the fair value measurements. As of December 29, 2024 and December 31, 2023, the Company determined that the credit valuation adjustments were not significant to the overall valuation of its derivatives. |
Fair Value Measurements on a Nonrecurring Basis - Assets and liabilities that are measured at fair value on a nonrecurring basis relate primarily to property, fixtures and equipment, operating lease right-of-use assets, goodwill and other intangible assets, which are remeasured when carrying value exceeds fair value. Carrying value after impairment approximates fair value. The following table summarizes the Company’s assets measured at fair value by hierarchy level on a nonrecurring basis for the periods indicated:
| | | | | | | | | | | | | | | | | | | | | | | | | | | | | | | | | | | |
| 2024 | | 2023 | | 2022 |
| (dollars in thousands) | REMAINING CARRYING VALUE | | TOTAL IMPAIRMENT | | REMAINING CARRYING VALUE | | TOTAL IMPAIRMENT | | REMAINING CARRYING VALUE | | TOTAL IMPAIRMENT |
| | | | | | | | | | | |
| Operating lease right-of-use assets (1) | $ | 14,053 | | | $ | 23,895 | | | $ | 4,057 | | | $ | 10,210 | | | $ | 2,219 | | | $ | 1,233 | |
| Property, fixtures and equipment (2) | 17,096 | | | 22,540 | | | 4,623 | | | 30,202 | | | 2,807 | | | 4,253 | |
| | | | | | | | | | | |
| $ | 31,149 | | | $ | 46,435 | | | $ | 8,680 | | | $ | 40,412 | | | $ | 5,026 | | | $ | 5,486 | |
________________
(1)Carrying values measured using discounted cash flow models (Level 3).
(2)Carrying values measured using Level 2 inputs to estimate fair value totaled $1.2 million for 2024 and 2023. All other assets were valued using Level 3 inputs. Third-party market appraisals and executed sales contracts (Level 2) and discounted cash flow models (Level 3) were used to estimate the fair value.
See Note 5 - Impairments and Exit Costs for information regarding impairment charges during 2024 and 2023. Projected future cash flows, including discount rate and growth rate assumptions, are derived from current economic conditions, expectations of management and projected trends of current operating results. As a result, the Company has determined that the majority of the inputs used to value its long-lived assets held and used are unobservable inputs that fall within Level 3 of the fair value hierarchy.
In the assessment of impairment for operating locations, the Company determines the fair values of individual operating locations using an income approach, which requires discounting projected future cash flows. When determining the stream of projected future cash flows associated with an individual operating location, management makes assumptions, including highest and best use and inputs from restaurant operations, where necessary, and about key variables including the following unobservable inputs: revenue growth rates, controllable and uncontrollable expenses, and asset residual values. In order to calculate the present value of those future cash flows, the Company discounts its cash flow estimates at its weighted-average cost of capital applicable to the country in which the measured assets reside. Unobservable inputs, including weighted average cost of capital of 12%, were used in the Company’s Level 3 fair value measurements of Operating lease right-of-use assets and Property, fixtures and equipment for the impairment losses incurred during 2024.
Fair Value of Financial Instruments - The Company’s non-derivative financial instruments consist of cash equivalents, accounts receivable, accounts payable and long-term debt. The fair values of cash equivalents, accounts receivable and accounts payable approximate their carrying amounts reported on its Consolidated Balance Sheets due to their short duration.
BLOOMIN’ BRANDS, INC.
NOTES TO CONSOLIDATED FINANCIAL STATEMENTS - Continued
Debt is carried at amortized cost; however, the Company estimates the fair value of debt for disclosure purposes. The following table includes the carrying value and fair value of the Company’s debt by hierarchy level as of the periods indicated:
| | | | | | | | | | | | | | | | | | | | | | | | | | | |
| DECEMBER 29, 2024 | | DECEMBER 31, 2023 |
| CARRYING VALUE | | FAIR VALUE LEVEL 2 | | | | CARRYING VALUE | | FAIR VALUE LEVEL 2 | | |
| (dollars in thousands) | | | |
| | | | | | | | | | | |
| Senior secured credit facility - revolving credit facility | $ | 710,000 | | | $ | 710,000 | | | | | $ | 381,000 | | | $ | 381,000 | | | |
| | | | | | | | | | | |
| | | | | | | | | | | |
| | | | | | | | | | | |
| 2025 Notes | $ | 20,724 | | | $ | 24,145 | | | | | $ | 104,786 | | | $ | 265,896 | | | |
| 2029 Notes | $ | 300,000 | | | $ | 270,132 | | | | | $ | 300,000 | | | $ | 277,809 | | | |
16. Allowance for Expected Credit Losses
The following table is a rollforward of the Company’s trade receivables allowance for expected credit losses for the periods indicated:
| | | | | | | | | | | | | | | | | |
| FISCAL YEAR |
| (dollars in thousands) | 2024 | | 2023 | | 2022 |
| Allowance for expected credit losses, beginning of the period | $ | 5,217 | | | $ | 5,369 | | | $ | 4,020 | |
| | | | | |
| Provision for expected credit losses | — | | | — | | | 1,498 | |
| Charge-off of accounts | (1) | | | (152) | | | (149) | |
| | | | | |
| | | | | |
| | | | | |
| Allowance for expected credit losses, end of the period | $ | 5,216 | | | $ | 5,217 | | | $ | 5,369 | |
The Company is also exposed to credit losses from off-balance sheet lease guarantees primarily related to the divestiture of certain formerly Company-owned restaurant sites. See Note 18 - Commitments and Contingencies for details regarding these lease guarantees.
17. Income Taxes
The following table presents the domestic and foreign components of (Loss) income before (benefit) provision for income taxes for the periods indicated:
| | | | | | | | | | | | | | | | | |
| | FISCAL YEAR |
| (dollars in thousands) | 2024 | | 2023 | | 2022 |
| Domestic | $ | (53,921) | | | $ | 235,357 | | | $ | 134,465 | |
| Foreign | (4,886) | | | (4,170) | | | (7,062) | |
| (Loss) income before (benefit) provision for income taxes | $ | (58,807) | | | $ | 231,187 | | | $ | 127,403 | |
| | | | | |
| | | | | |
| | | | | |
(Benefit) provision for income taxes consisted of the following for the periods indicated:
| | | | | | | | | | | | | | | | | |
| | FISCAL YEAR |
| (dollars in thousands) | 2024 | | 2023 | | 2022 |
| Current provision (benefit): | | | | | |
| Federal | $ | 12,192 | | | $ | 16,260 | | | $ | 12,368 | |
| State | 6,011 | | | 10,593 | | | 10,428 | |
| Foreign | — | | | (40) | | | — | |
| | 18,203 | | | 26,813 | | | 22,796 | |
| Deferred (benefit) provision: | | | | | |
| Federal | (31,185) | | | (6,506) | | | 3,227 | |
| State | (348) | | | 726 | | | 3,327 | |
| Foreign | 1,196 | | | (2,631) | | | 4,903 | |
| | (30,337) | | | (8,411) | | | 11,457 | |
| (Benefit) provision for income taxes | $ | (12,134) | | | $ | 18,402 | | | $ | 34,253 | |
BLOOMIN’ BRANDS, INC.
NOTES TO CONSOLIDATED FINANCIAL STATEMENTS - Continued
Effective Income Tax Rate - The reconciliation of income taxes calculated at the United States federal tax statutory rate to the Company’s effective income tax rate is as follows for the periods indicated. Due to the pre-tax book loss for 2024, a positive percentage change for such year in the effective tax rate table reflects a favorable income tax benefit, whereas a negative percentage change in the effective tax rate table reflects an unfavorable income tax expense:
| | | | | | | | | | | | | | | | | |
| | FISCAL YEAR |
| | 2024 | | 2023 | | 2022 |
| Income taxes at federal statutory rate | 21.0 | % | | 21.0 | % | | 21.0 | % |
| State and local income taxes, net of federal benefit | (7.8) | | | 3.8 | | | 8.5 | |
| Non-deductible loss on 2025 Notes Partial Repurchases | (49.5) | | | — | | | 21.4 | |
| Net changes in deferred tax valuation allowances | (5.3) | | | (0.9) | | | (2.0) | |
| Foreign tax rate differential | (2.7) | | | 0.1 | | | 0.2 | |
| | | | | |
| Non-deductible compensation | (2.2) | | | 1.0 | | | 1.1 | |
| Other non-deductible expenses | (2.2) | | | 0.3 | | | (0.1) | |
| Change in foreign tax law | (2.0) | | | (1.1) | | | 3.8 | |
| Statute expiration on foreign net operating losses | (0.3) | | | 1.1 | | | 0.9 | |
| Tax settlements and related adjustments | (0.1) | | | 0.1 | | | 0.2 | |
| Employment-related credits, net | 58.9 | | | (15.9) | | | (26.7) | |
| Non-taxable gains on foreign currency forward contracts | 6.9 | | | — | | | — | |
| Non-controlling interests | 1.9 | | | (0.6) | | | (1.2) | |
| Net life insurance expense | 1.4 | | | (0.3) | | | 0.7 | |
| U.S. tax impact on foreign income | 1.2 | | | (0.9) | | | (0.9) | |
| | | | | |
| | | | | |
| | | | | |
| Other, net | 1.4 | | | 0.3 | | | — | |
| Total | 20.6 | % | | 8.0 | % | | 26.9 | % |
In the U.S., a restaurant company employer may claim a credit against its federal income taxes for FICA taxes paid on certain tipped wages (the “FICA tax credit”). The level of FICA tax credits is primarily driven by U.S. Restaurant sales and is not impacted by costs incurred that may reduce (Loss) income before (benefit) provision for income taxes.
The net increase in the effective income tax rate in 2024 as compared to 2023 was primarily a result of the benefit of FICA tax credits on certain tipped wages, partially offset by the 2024 non-deductible losses associated with the Second 2025 Notes Partial Repurchase, relative to the 2024 pre-tax book loss.
The net decrease in the effective income tax rate in 2023 as compared to 2022 was primarily a result of the non-deductible losses recorded during 2022 associated with the First 2025 Notes Partial Repurchase.
The Company has a blended federal and state statutory rate of approximately 26%. The effective income tax rate for 2024 was lower than the blended federal and state statutory rate primarily due to the federal and state impact of nondeductible losses associated with the Second 2025 Notes Partial Repurchase, partially offset by the FICA tax credits on certain tipped wages, relative to the 2024 pre-tax book loss.
BLOOMIN’ BRANDS, INC.
NOTES TO CONSOLIDATED FINANCIAL STATEMENTS - Continued
Deferred Tax Assets and Liabilities - The income tax effects of temporary differences that give rise to significant portions of deferred income tax assets and liabilities are as follows as of the periods indicated:
| | | | | | | | | | | |
| (dollars in thousands) | DECEMBER 29, 2024 | | DECEMBER 31, 2023 |
| Deferred income tax assets: | | | |
| Operating lease liabilities | $ | 320,169 | | | $ | 319,039 | |
| | | |
| Insurance reserves | 13,874 | | | 14,184 | |
| Unearned revenue | 57,567 | | | 55,746 | |
| Deferred compensation | 11,392 | | | 12,210 | |
| | | |
| Net operating loss carryforwards | 9,002 | | | 7,046 | |
| Federal tax credit carryforwards | 202,319 | | | 177,775 | |
| | | |
| Other, net (1) | 6,905 | | | 5,667 | |
| Gross deferred income tax assets | 621,228 | | | 591,667 | |
| Less: valuation allowance | (13,707) | | | (10,483) | |
| Deferred income tax assets, net of valuation allowance | 607,521 | | | 581,184 | |
| Deferred income tax liabilities: | | | |
| Less: operating lease right-of-use asset basis differences | (252,958) | | | (257,422) | |
| Less: property, fixtures and equipment basis differences | (68,814) | | | (70,934) | |
| Less: intangible asset basis differences | (100,227) | | | (97,656) | |
| Less: foreign outside basis differences | (33,822) | | | — | |
| Deferred income tax assets, net | $ | 151,700 | | | $ | 155,172 | |
| | | |
| | | |
| | | |
| | | |
| | | |
________________
(1)As of December 29, 2024 and December 31, 2023, the Company maintained deferred tax liabilities for state income taxes on historical foreign earnings of $0.3 million and $0.5 million, respectively.
As of December 29, 2024, valuation allowances against deferred tax assets in the U.S. and in certain foreign jurisdictions totaled $0.9 million and $12.8 million, respectively. The Company will maintain the valuation allowances in each applicable tax jurisdiction until it determines it is more likely than not the deferred tax assets will be realized. The net change in the deferred tax valuation allowance in 2024 is primarily attributable to additional net operating loss carryforwards in certain foreign jurisdictions with full valuation allowances recorded that are available to the Company.
In connection with the Brazil Sale Transaction, the Company no longer asserts that is it is indefinitely reinvested in its Brazil operations and has recorded a deferred tax liability of $33.8 million. The deferred tax liability is related to the financial statement carrying amount over the respective tax basis of the Company’s investment in the Brazil operations. Except for the Brazil operations, the Company has not recorded a deferred tax liability on the financial statement carrying amount over the tax basis of its investments in foreign subsidiaries because the Company continues to assert that it is indefinitely reinvested in its underlying investments in foreign subsidiaries. The determination of any unrecorded deferred tax liability on this amount is not practicable due to the uncertainty of how these investments would be recovered.
As of December 29, 2024, the Company did not have aggregate undistributed foreign earnings from its consolidated foreign subsidiaries.
Tax Carryforwards - The amount and expiration dates of tax loss carryforwards and credit carryforwards as of December 29, 2024 are as follows:
| | | | | | | | | | | | | | | | | |
| (dollars in thousands) | EXPIRATION DATE | | AMOUNT |
| Federal tax credit carryforwards | 2026 | - | 2044 | | $ | 214,846 | |
| Foreign loss carryforwards | 2025 | - | Indefinite | | $ | 50,187 | |
| Foreign credit carryforwards | Indefinite | | $ | 864 | |
BLOOMIN’ BRANDS, INC.
NOTES TO CONSOLIDATED FINANCIAL STATEMENTS - Continued
As of December 29, 2024, the Company had $213.7 million in general business tax credit carryforwards, which have a 20-year carryforward period and are utilized on a first-in, first-out basis. The Company currently expects to utilize these tax credit carryforwards within a 10-year period. However, the Company’s ability to utilize these tax credits could be adversely impacted by, among other items, a future “ownership change” as defined under Section 382 of the Internal Revenue Code as well as the Company’s inability to generate sufficient future taxable income.
Unrecognized Tax Benefits - As of December 29, 2024 and December 31, 2023, the liability for unrecognized tax benefits was $17.5 million and $17.1 million, respectively. Of the total amount of unrecognized tax benefits, including accrued interest and penalties, $17.1 million and $16.6 million, respectively, if recognized, would impact the Company’s effective income tax rate.
The following table summarizes the activity related to the Company’s unrecognized tax benefits for the period indicated:
| | | | | | | | | |
| FISCAL YEAR | | | | |
| (dollars in thousands) | 2024 | | | | |
| Balance, beginning of the period | $ | 17,121 | | | | | |
| Additions for tax positions taken during a prior period | 19 | | | | | |
| Reductions for tax positions taken during a prior period | (6) | | | | | |
| Additions for tax positions taken during the current period | 941 | | | | | |
| | | | | |
| | | | | |
| Lapses in the applicable statutes of limitations | (596) | | | | | |
| | | | | |
| Balance, end of the period | $ | 17,479 | | | | | |
| | | | | |
| | | | | |
| | | | | |
| | | | | |
The Company had approximately $0.7 million and $0.5 million accrued for the payment of interest and penalties as of December 29, 2024 and December 31, 2023, respectively. The Company recognized immaterial interest and penalties related to uncertain tax positions in the (Benefit) provision for income taxes, for all periods presented.
In many cases, the Company’s uncertain tax positions are related to tax years that remain subject to examination by relevant taxable authorities. Based on the outcome of these examinations, or a result of the expiration of the statute of limitations for specific jurisdictions, it is reasonably possible that the related recorded unrecognized tax benefits for tax positions taken on previously filed tax returns will change by approximately $0.5 million to $1.0 million within the next 12 months.
Open Tax Years - Following is a summary of the open audit years by jurisdiction as of December 29, 2024:
| | | | | | | | | | | |
| OPEN AUDIT YEARS |
| United States - federal | 2007 | - | 2023 |
| United States - state | 2020 | - | 2023 |
| Foreign | 2015 | - | 2023 |
18. Commitments and Contingencies
Lease Guarantees - The Company assigned its interest, and is contingently liable, under certain real estate leases, the latest of which expires in 2032. As of December 29, 2024, the undiscounted payments the Company could be required to make in the event of non-payment by the primary lessees was approximately $10.4 million. The present value of these potential payments discounted at the Company’s incremental borrowing rate as of December 29, 2024 was approximately $8.6 million. In the event of default, the indemnity clauses in the Company’s purchase and sale agreements govern its ability to pursue and recover damages incurred. As of December 29, 2024 and December 31, 2023, the Company’s recorded contingent lease liability was $1.6 million and $5.3 million, respectively.
BLOOMIN’ BRANDS, INC.
NOTES TO CONSOLIDATED FINANCIAL STATEMENTS - Continued
Purchase Obligations - Purchase obligations were $168.5 million and $165.1 million as of December 29, 2024 and December 31, 2023, respectively. These purchase obligations are primarily due within three years, however commitments with various vendors extend through December 2030. Outstanding commitments consist primarily of inventory, technology, store-level services and fixtures and equipment. In 2024, the Company purchased more than 90% of its U.S. beef raw materials from four beef suppliers that represent a significant portion of the total beef marketplace in the U.S.
Litigation and Other Matters - The Company is subject to legal proceedings, claims and liabilities, such as liquor liability, slip and fall cases, wage and hour and other employment-related litigation, which arise in the ordinary course of business. A reserve is recorded when it is both: (i) probable that a loss has occurred and (ii) the amount of loss can be reasonably estimated. The Company evaluates, on a quarterly basis, developments in legal proceedings that could cause an increase or decrease in the amount of the reserve that has been previously recorded, or a revision to the disclosed estimated range of possible losses, as applicable.
The Company’s legal proceedings range from cases brought by a single plaintiff to threatened class actions with many putative class members. While some matters pending against the Company specify the damages claimed by the plaintiff or class, many seek unspecified amounts or are at very early stages of the legal process. Even when the amount of damages claimed against the Company are stated, the claimed amount may be exaggerated, unsupported or unrelated to possible outcomes, and as such, are not meaningful indicators of the Company’s potential liability or financial exposure. As a result, some matters have not yet progressed sufficiently through discovery or development of important factual information and legal issues to enable the Company to estimate an amount of loss or a range of possible loss.
The Company intends to defend itself in legal matters. Some of these matters may be covered, at least in part, by insurance if they exceed specified retention or deductible amounts. However, it is possible that claims may be denied by the Company’s insurance carriers, the Company may be required by its insurance carriers to contribute to the payment of claims, or the Company’s insurance coverage may not continue to be available on acceptable terms or in sufficient amounts. The Company records receivables from third party insurers when recovery has been determined to be probable. The Company believes that the ultimate determination of liability in connection with legal claims pending against the Company, if any, in excess of amounts already provided for such matters in the consolidated financial statements, will not have a material adverse effect on its business, annual results of operations, liquidity or financial position. However, it is possible that the Company’s business, results of operations, liquidity or financial condition could be materially affected in a particular future reporting period by the unfavorable resolution of one or more matters or contingencies during such period.
In recent years, certain subsidiaries of the Company were named in collective actions alleging violations of the Fair Labor Standards Act and state wage and hour laws. For these and other matters, the Company recorded reserves of $2.3 million and $10.5 million as of December 29, 2024 and December 31, 2023, respectively, within Accrued and other current liabilities on its Consolidated Balance Sheets. While the Company believes that additional losses beyond these accruals are reasonably possible, it cannot estimate a possible loss contingency or range of reasonably possible loss contingencies beyond these accruals. During 2024, 2023 and 2022, the Company recognized $(0.9) million, $(0.2) million and $9.4 million, respectively, in Other restaurant operating expense in the Company’s Consolidated Statements of Operations and Comprehensive (Loss) Income for certain legal reserves and settlements.
Insurance - As of December 29, 2024, the future undiscounted payments the Company expects for workers’ compensation, general liability and health insurance claims are as follows:
| | | | | | | | | | | | | | | | | | | | | | | | | | | | | | | | | | | | | | | | | |
| FISCAL YEAR | | | | |
| (dollars in thousands) | 2025 | | 2026 | | 2027 | | 2028 | | 2029 | | THEREAFTER | | TOTAL |
| Undiscounted payments | $ | 19,872 | | | $ | 13,113 | | | $ | 9,891 | | | $ | 5,735 | | | $ | 3,088 | | | $ | 7,708 | | | $ | 59,407 | |
| | | | | | | | | | | | | |
| | | | | | | | | | | | | |
BLOOMIN’ BRANDS, INC.
NOTES TO CONSOLIDATED FINANCIAL STATEMENTS - Continued
The following is a reconciliation of the expected aggregate undiscounted reserves to the discounted reserves for insurance claims recognized on the Company’s Consolidated Balance Sheets as of the periods indicated:
| | | | | | | | | | | |
| (dollars in thousands) | DECEMBER 29, 2024 | | DECEMBER 31, 2023 |
| Undiscounted reserves | $ | 59,407 | | | $ | 52,494 | |
| Discount (1) | (6,361) | | | (6,568) | |
| Discounted reserves | $ | 53,046 | | | $ | 45,926 | |
| | | |
| Discounted reserves recognized on the Company’s Consolidated Balance Sheets: | | | |
| Accrued and other current liabilities | $ | 19,527 | | | $ | 19,310 | |
| Other long-term liabilities, net | 33,519 | | | 26,616 | |
| $ | 53,046 | | | $ | 45,926 | |
____________________
(1) Discount rates of 4.21% and 5.13% were used for December 29, 2024 and December 31, 2023, respectively.
19. Segment Reporting
The Company considers each of its U.S. restaurant concepts and its international franchise business as operating segments, which reflects how the Company manages its business, reviews operating performance and allocates resources. All other operating segments, which include the Company’s operations in Hong Kong and China do not meet the quantitative thresholds for determining reportable operating segments.
Resources are allocated and performance is assessed by the Company’s Chief Executive Officer, whom the Company has determined to be its CODM. The Company aggregates its U.S. operating segments into a U.S. reportable segment. The U.S. segment includes all restaurants operating in the U.S. while franchised restaurants operating outside the U.S. are included in the international franchise segment.
The following is a summary of reportable segments:
| | | | | | | | | | | | | | |
| REPORTABLE SEGMENT | | CONCEPT | | GEOGRAPHIC LOCATION |
| U.S. (1) | | Outback Steakhouse | | United States of America |
| Carrabba’s Italian Grill | |
| Bonefish Grill | |
| Fleming’s Prime Steakhouse & Wine Bar | |
| International Franchise | | Outback Steakhouse | | 12 Franchise Markets |
| | Carrabba’s Italian Grill (Abbraccio) | |
_________________
(1)Includes franchise locations.
Segment accounting policies are the same as those described in Note 2 - Summary of Significant Accounting Policies. Revenues for all segments include only transactions with customers and exclude intersegment revenues. Excluded from Income from operations for U.S. are certain legal and corporate costs not directly related to the performance of the segment, most stock-based compensation expenses, a portion of insurance expenses and certain bonus expenses.
Operating income is utilized by the Company’s CODM as the primary segment profit or loss measure. The Company’s CODM utilizes the segment profit or loss measures to manage the business, review operating performance and allocate resources.
BLOOMIN’ BRANDS, INC.
NOTES TO CONSOLIDATED FINANCIAL STATEMENTS - Continued
The following table is a summary of revenues by segment for the periods indicated:
| | | | | | | | | | | | | | | | | |
| FISCAL YEAR |
| (dollars in thousands) | 2024 | | 2023 | | 2022 |
| Revenues | | | | | |
| U.S. | $ | 3,857,134 | | | $ | 4,053,599 | | | $ | 3,911,870 | |
| International Franchise | 39,490 | | | 41,524 | | | 36,202 | |
| Total segment revenues | 3,896,624 | | | 4,095,123 | | | 3,948,072 | |
| All other revenues (1) | 53,851 | | | 73,037 | | | 61,178 | |
| Total revenues | $ | 3,950,475 | | | $ | 4,168,160 | | | $ | 4,009,250 | |
| | | | | |
| | | | | |
| | | | | |
____________________
(1)Includes revenues related to the Company’s Hong Kong and China subsidiaries.
The following table presents segment operating income and significant segment expense information for the periods indicated:
| | | | | | | | | | | | | | | | | |
| FISCAL YEAR |
| (dollars in thousands) | 2024 | | 2023 | | 2022 |
| | | | | |
| U.S. | | | | | |
| Total revenues | $ | 3,857,134 | | | $ | 4,053,599 | | | $ | 3,911,870 | |
| Less: | | | | | |
| Food and beverage | 1,132,678 | | | 1,219,141 | | | 1,217,774 | |
| Labor and other related | 1,183,227 | | | 1,203,170 | | | 1,131,844 | |
| Other restaurant operating | 970,119 | | | 964,308 | | | 917,401 | |
| Other (1) | 321,060 | | | 289,446 | | | 236,991 | |
| Total segment expenses | $ | 3,607,084 | | | $ | 3,676,065 | | | $ | 3,504,010 | |
| Income from operations | $ | 250,050 | | | $ | 377,534 | | | $ | 407,860 | |
| | | | | |
| | | | | |
| |
| | | | | |
| | | | | |
| International Franchise | | | | | |
| Total revenues | $ | 39,490 | | | $ | 41,524 | | | $ | 36,202 | |
| Less: | | | | | |
| Total segment expenses (2) | 1,529 | | | 2,317 | | | 1,986 | |
| Income from operations | $ | 37,961 | | | $ | 39,207 | | | $ | 34,216 | |
| | | | | |
| | | | | |
| |
| | | | | |
| | | | | |
| Total segment | | | | | |
| Total revenues | $ | 3,896,624 | | | $ | 4,095,123 | | | $ | 3,948,072 | |
| Less: | | | | | |
| | | | | |
| | | | | |
| | | | | |
| | | | | |
| | | | | |
| | | | | |
| | | | | |
| Total segment expenses | 3,608,613 | | | 3,678,382 | | | 3,505,996 | |
| Total segment income from operations | $ | 288,011 | | | $ | 416,741 | | | $ | 442,076 | |
| | | | | |
_________________
(1)Includes depreciation and amortization, general and administrative and impairment expense.
(2)Includes amortization and general and administrative expense.
BLOOMIN’ BRANDS, INC.
NOTES TO CONSOLIDATED FINANCIAL STATEMENTS - Continued
The following table is a reconciliation of segment income from operations to (Loss) income before (benefit) provision for income taxes for the periods indicated:
| | | | | | | | | | | | | | | | | |
| FISCAL YEAR |
| (dollars in thousands) | 2024 | | 2023 | | 2022 |
| | | | | |
| | | | | |
| | | | | |
| Total segment income from operations | $ | 288,011 | | | $ | 416,741 | | | $ | 442,076 | |
| Unallocated corporate operating expense | (130,769) | | | (134,057) | | | (132,837) | |
| Other (loss) income from operations (1) | (17,434) | | | 85 | | | (3,157) | |
| Total income from operations | 139,808 | | | 282,769 | | | 306,082 | |
| Loss on extinguishment of debt | (136,022) | | | — | | | (107,630) | |
| Loss on fair value adjustment of derivatives, net | — | | | — | | | (17,685) | |
| | | | | |
| Interest expense, net | (62,593) | | | (51,582) | | | (53,364) | |
| (Loss) income before (benefit) provision for income taxes | $ | (58,807) | | | $ | 231,187 | | | $ | 127,403 | |
____________________
(1)Includes net (loss) income from operations related to the Company’s Hong Kong and China subsidiaries.
The following table is a summary of Depreciation and amortization expense by segment for the periods indicated:
| | | | | | | | | | | | | | | | | |
| FISCAL YEAR |
| (dollars in thousands) | 2024 | | 2023 | | 2022 |
| Depreciation and amortization | | | | | |
| U.S. | $ | 165,140 | | | $ | 157,878 | | | $ | 139,170 | |
| International Franchise | — | | | 252 | | | 114 | |
| Total segment depreciation and amortization | 165,140 | | | 158,130 | | | 139,284 | |
| Corporate | 8,568 | | | 7,611 | | | 6,936 | |
| Other | 1,872 | | | 3,525 | | | 3,680 | |
| Total depreciation and amortization | $ | 175,580 | | | $ | 169,266 | | | $ | 149,900 | |
| | | | | |
| | | | | |
| | | | | |
The following table is a summary of capital expenditures by segment for the periods indicated:
| | | | | | | | | | | | | | | | | |
| FISCAL YEAR |
| (dollars in thousands) | 2024 | | 2023 | | 2022 |
| Capital expenditures | | | | | |
| U.S. | $ | 210,792 | | | $ | 276,660 | | | $ | 196,163 | |
| | | | | |
| Corporate | 7,303 | | | 11,961 | | | 11,709 | |
| Other | 734 | | | 612 | | | 857 | |
| Discontinued operations | 37,323 | | | 44,930 | | | 27,790 | |
| Total capital expenditures | $ | 256,152 | | | $ | 334,163 | | | $ | 236,519 | |
The following table sets forth Total assets by segment as of the periods indicated:
| | | | | | | | | | | | |
| (dollars in thousands) | DECEMBER 29, 2024 | | DECEMBER 31, 2023 | |
| Assets | | | | |
| U.S. | $ | 2,735,251 | | | $ | 2,703,751 | | |
| International Franchise | 103,242 | | | 103,545 | | |
| Total segment assets | 2,838,493 | | | 2,807,296 | | |
| Corporate | 306,560 | | | 291,540 | | |
| Other | 16,262 | | | 37,320 | | |
| Assets of discontinued operations held for sale | 223,490 | | | 287,925 | | |
| Total assets | $ | 3,384,805 | | | $ | 3,424,081 | | |
BLOOMIN’ BRANDS, INC.
NOTES TO CONSOLIDATED FINANCIAL STATEMENTS - Continued
Geographic areas — International assets are defined as assets residing in a country other than the U.S. The following table details long-lived assets, excluding goodwill, operating lease right-of-use assets, intangible assets and deferred tax assets, by major geographic area as of the periods indicated:
| | | | | | | | | | | |
| (dollars in thousands) | DECEMBER 29, 2024 | | DECEMBER 31, 2023 |
| U.S. | $ | 1,018,309 | | | $ | 980,731 | |
| International | 4,683 | | | 7,524 | |
| | | |
| Total long-lived assets | $ | 1,022,992 | | | $ | 988,255 | |
| | | |
20. Selected Quarterly Financial Data (Unaudited)
| | | | | | | | | | | | | | | | | | | | | | | | | | | | | |
| 2024 FISCAL QUARTERS | | FISCAL YEAR 2024 |
| (dollars in thousands, except per share data) | FIRST (1) | | SECOND (1) | | THIRD (1) | | FOURTH (1) | |
| Total revenues | $ | 1,069,073 | | | $ | 999,369 | | | $ | 910,013 | | | $ | 972,020 | | | $ | 3,950,475 | |
| Income from operations | 70,917 | | | 44,052 | | | 8,642 | | | 16,197 | | | 139,808 | |
| Net (loss) income from continuing operations | (85,198) | | | 25,976 | | | (36) | | | 12,585 | | | (46,673) | |
| Net (loss) income from continuing operations attributable to Bloomin’ Brands | (86,780) | | | 24,748 | | | (665) | | | 10,661 | | | (52,036) | |
| (Loss) earnings per share from continuing operations: | | | | | | | | | |
| Basic | $ | (1.00) | | | $ | 0.29 | | | $ | (0.01) | | | $ | 0.13 | | | $ | (0.61) | |
| Diluted | $ | (1.00) | | | $ | 0.28 | | | $ | (0.01) | | | $ | 0.12 | | | $ | (0.61) | |
| | | | | | | | | | | | | | | | | | | | | | | | | | | | | |
| 2023 FISCAL QUARTERS | | FISCAL YEAR 2023 |
| (dollars in thousands, except per share data) | FIRST | | SECOND | | THIRD | | FOURTH (2) | |
| Total revenues | $ | 1,122,066 | | | $ | 1,032,755 | | | $ | 941,625 | | | $ | 1,071,714 | | | $ | 4,168,160 | |
| Income from operations | 107,132 | | | 78,741 | | | 47,296 | | | 49,600 | | | 282,769 | |
| Net income from continuing operations | 81,989 | | | 60,270 | | | 32,502 | | | 38,024 | | | 212,785 | |
| Net income from continuing attributable to Bloomin’ Brands | 79,872 | | | 58,545 | | | 31,599 | | | 35,741 | | | 205,757 | |
| Earnings per share from continuing operations: | | | | | | | | | |
| Basic | $ | 0.90 | | | $ | 0.66 | | | $ | 0.36 | | | $ | 0.41 | | | $ | 2.36 | |
| Diluted | $ | 0.81 | | | $ | 0.60 | | | $ | 0.32 | | | $ | 0.37 | | | $ | 2.13 | |
____________________
(1)Income from operations in the first, second, third and fourth quarters include expense of $13.0 million, $16.2 million, $5.1 million and $30.6 million, respectively, primarily related to asset impairment, closure costs and severance in connection with the 2023 Restaurant Closures, the closure of nine Hong Kong restaurants and the Q4 2024 Restaurant Impairment. Net loss in the first quarter includes losses in connection with the Second 2025 Notes Partial Repurchase.
(2)Total revenues includes $83.5 million for the 53rd week. Income from operations includes expense of $32.4 million, primarily related to asset impairments, closure costs and severance partially offset by lease remeasurement gains in connection with the 2023 Restaurant Closures. Includes $0.15 of additional diluted earnings per share from a 53rd operating week.
Item 9. Changes in and Disagreements with Accountants on Accounting and Financial Disclosure
None.
Item 9A. Controls and Procedures
Evaluation of Disclosure Controls and Procedures
We have established and maintain disclosure controls and procedures that are designed to ensure that information required to be disclosed by us in the reports that we file or submit under the Securities Exchange Act of 1934, as amended, is recorded, processed, summarized and reported within the time periods specified in the Securities and Exchange Commission’s rules and forms, and that such information is accumulated and communicated to our management, including our Chief Executive Officer and Chief Financial Officer, as appropriate to allow timely decisions regarding required disclosure. We carried out an evaluation, under the supervision and with the participation of our management, including our Chief Executive Officer and Chief Financial Officer, of the effectiveness of our disclosure controls and procedures (as defined in Rule 13a-15(e) under the Exchange Act) as of the end of the period covered by this Report. Based on that evaluation, the Chief Executive Officer and Chief Financial Officer concluded that our disclosure controls and procedures were effective as of December 29, 2024.
Management’s Annual Report on Internal Control over Financial Reporting
Management’s report on our internal control over financial reporting and the attestation report of PricewaterhouseCoopers LLP, our independent registered certified public accounting firm, on our internal control over financial reporting are included in Item 8, Financial Statements and Supplementary Data, of this Annual Report on Form 10-K.
Changes in Internal Control over Financial Reporting
There have been no changes in our internal control over financial reporting (as defined in Rule 13a-15(f) under the Exchange Act) during our most recent quarter ended December 29, 2024 that have materially affected, or are reasonably likely to materially affect, our internal control over financial reporting.
Item 9B. Other Information
Rule 10b5-1 Trading Plans - During the thirteen weeks ended December 29, 2024, none of the Company’s directors or executive officers adopted, modified or terminated a Rule 10b5-1 trading arrangement or any “non-Rule 10b5-1 trading arrangement” (as defined in Item 408 of Regulation S-K).
Item 9C. Disclosure Regarding Foreign Jurisdictions that Prevent Inspections
None.
PART III
Item 10. Directors, Executive Officers and Corporate Governance
The information required by this item relating to our directors and nominees will be included under the captions “Proposal No. 1: Election of Directors—Nominees for Election at this Annual Meeting” in our definitive Proxy Statement for the 2025 Annual Meeting of Stockholders (“Definitive Proxy Statement”) and is incorporated herein by reference.
The information required by this item relating to our executive officers is included under the caption “Information About Our Executive Officers” in Part I of this Report on Form 10-K.
We have adopted a Code of Conduct that applies to all employees. A copy of our Code of Conduct is available on our website, free of charge. The Internet address for our website is www.bloominbrands.com, and the Code of Conduct may be found on our main webpage by clicking first on “Investors” and then on “Governance—Governance Documents” and next on “Code of Conduct.”
We intend to satisfy any disclosure requirement under Item 5.05 of Form 8-K regarding an amendment to, or waiver from, a provision of this code of ethics by posting such information on our website, on the Governance Documents webpage, as specified above.
The information required by this item regarding our Audit Committee and Audit Committee Financial Expert will be included under the caption “Proposal No. 1: Election of Directors—Board Committees and Meetings” in our Definitive Proxy Statement and is incorporated herein by reference.
We have adopted an Insider Trading Policy governing the purchase, sale and other disposition of our securities by directors, officers, and employees that is designed to promote compliance with insider trading laws, rules and regulations, and applicable listing standards, as well as procedures designed to further the foregoing purposes. While the Company does not have a formal written policy governing the purchase, sale, and/or any other dispositions of its securities by the Company, the Company has developed procedures that are designed to promote compliance with insider trading laws, rules and regulations with respect to the Company’s share repurchase program.
A copy of our Insider Trading Policy is filed with this Annual Report on Form 10-K as Exhibit 19.1.
Item 11. Executive Compensation
The information required by this item will be included under the captions “Proposal No. 1: Election of Directors—Director Compensation” and “Executive Compensation and Related Information” in our Definitive Proxy Statement and, except for the information under the caption “Pay vs. Performance”, is incorporated herein by reference.
Item 12. Security Ownership of Certain Beneficial Owners and Management and Related Stockholder Matters
The information required by this item will be included under the caption “Ownership of Securities” in our Definitive Proxy Statement and is incorporated herein by reference.
The information relating to securities authorized for issuance under equity compensation plans is included under the caption “Securities Authorized for Issuance Under Equity Compensation Plans” in Item 5 of this Report on Form 10-K.
Item 13. Certain Relationships and Related Transactions, and Director Independence
The information required by this item relating to transactions with related persons will be included under the caption “Certain Relationships and Related Party Transactions,” and the information required by this item relating to director independence will be included under the caption “Proposal No. 1: Election of Directors—Independent Directors,” in each case in our Definitive Proxy Statement, and is incorporated herein by reference.
Item 14. Principal Accounting Fees and Services
The information required by this item will be included under the captions “Proposal No. 2: Ratification of Independent Registered Certified Public Accounting Firm—Principal Accountant Fees and Services” and “—Policy on Audit Committee Pre-Approval of Audit and Permissible Non-Audit Services of Independent Auditor” in our Definitive Proxy Statement and is incorporated herein by reference.
PART IV
Item 15. Exhibits and Financial Statement Schedules
(a)(1) LISTING OF FINANCIAL STATEMENTS
The following consolidated financial statements of the Company and subsidiaries are included in Item 8 of this Report:
•Consolidated Balance Sheets – December 29, 2024 and December 31, 2023
•Consolidated Statements of Operations and Comprehensive (Loss) Income – Fiscal years 2024, 2023 and 2022
•Consolidated Statements of Changes in Stockholders’ Equity – Fiscal years 2024, 2023 and 2022
•Consolidated Statements of Cash Flows – Fiscal years 2024, 2023 and 2022
•Notes to Consolidated Financial Statements
(a)(2) FINANCIAL STATEMENT SCHEDULES
All financial statement schedules have been omitted, since the required information is not applicable or is not present in amounts sufficient to require submission of the schedule, or because the information required is included in the consolidated financial statements and notes thereto included in this Report.
(a)(3) EXHIBITS
| | | | | | | | | | | | | | |
EXHIBIT
NUMBER | | DESCRIPTION OF EXHIBITS | | FILINGS REFERENCED FOR
INCORPORATION BY REFERENCE |
| | | | |
| 3.1 | | | | April 19, 2023, Form 8-K, Exhibit 3.1 |
| | | | |
| 3.2 | | | | April 19, 2023, Form 8-K, Exhibit 3.2 |
| | | | |
| 4.1 | | | | Amendment No. 4 to Registration Statement on Form S-1, File No. 333-180615, filed on July 18, 2012, Exhibit 4.1 |
| | | | |
| 4.2 | | | | March 26, 2023, Form 10-Q, Exhibit 4.1 |
| | | | |
| 4.3 | | | | May 11, 2020, Form 8-K, Exhibit 4.1 |
| | | | |
| 4.4 | | | | May 11, 2020, Form 8-K, Included as Exhibit A to Exhibit 4.1 |
| | | | |
| 4.5 | | Indenture, dated as of April 16, 2021, by and among Bloomin’ Brands, Inc., OSI Restaurant Partners, LLC, the guarantors party thereto, and Wells Fargo Bank, National Association, as trustee | | April 20, 2021, Form 8-K, Exhibit 4.1 |
| | | | |
| 4.6 | | | | April 20, 2021, Form 8-K, Included as Exhibit A to Exhibit 4.1 |
| | | | |
| 10.1 | | Third Amended and Restated Credit Agreement, dated September 19, 2024, by and among Bloomin’ Brands, Inc., OSI Restaurant Partners, LLC. the guarantors party thereto, the lenders party thereto, and Wells Fargo Bank, National Association, as administrative Agent | | September 24, 2024, Form 8-K, Exhibit 10.1 |
| | | | | | | | | | | | | | |
EXHIBIT
NUMBER | | DESCRIPTION OF EXHIBITS | | FILINGS REFERENCED FOR
INCORPORATION BY REFERENCE |
| | | | |
| 10.2* | | | | December 31, 2024, Form 8-K, Exhibit 10.2 |
| | | | |
| 10.3 | | | | Registration Statement on Form S-1, File No. 333-180615, filed on April 6, 2012, Exhibit 10.8 |
| | | | |
| 10.4* | | | | November 8, 2024, Form 8-K, Exhibit 10.1 |
| | | | |
| 10.5** | | | | December 31, 2023, Form 10-K, Exhibit 10.5 |
| | | | |
| 10.6** | | | | Amendment No. 4 to Registration Statement on Form S-1, File No. 333-180615, filed on July 18, 2012, Exhibit 10.2 |
| | | | |
| 10.7** | | | | December 7, 2012, Form 8-K, Exhibit 10.2 |
| | | | |
| 10.8** | | | | Amendment No. 4 to Registration Statement on Form S-1, File No. 333-180615, filed on July 18, 2012, Exhibit 10.39 |
| | | | |
| 10.9** | | | | March 11, 2016, Definitive Proxy Statement |
| | | | |
| 10.10** | | | | June 26, 2016, Form 10-Q, Exhibit 10.2 |
| | | | |
| 10.11** | | | | April 9, 2020, Definitive Proxy Statement |
| | | | |
| 10.12** | | | | May 29, 2020, Form 8-K, Exhibit 10.2 |
| | | | |
| 10.13** | | | | May 29, 2020, Form 8-K, Exhibit 10.3 |
| | | | |
| 10.14** | | | | May 29, 2020, Form 8-K, Exhibit 10.4 |
| | | | |
| 10.15** | | | | May 29, 2020, Form 8-K, Exhibit 10.5 |
| | | | |
| 10.16** | | | | May 29, 2020, Form 8-K, Exhibit 10.6 |
| | | | | | | | | | | | | | |
EXHIBIT
NUMBER | | DESCRIPTION OF EXHIBITS | | FILINGS REFERENCED FOR
INCORPORATION BY REFERENCE |
| | | | |
| 10.17** | | | | December 27, 2020, Form 10-K, Exhibit 10.48 |
| | | | |
| 10.18** | | | | December 27, 2020, Form 10-K, Exhibit 10.49 |
| | | | |
| 10.19** | | | | December 27, 2020, Form 10-K, Exhibit 10.50 |
| | | | |
| 10.20** | | | | August 7, 2024, Form 10-Q, Exhibit 10.2 |
| | | | |
| 10.21** | | | | December 7, 2012, Form 8-K, Exhibit 10.1 |
| | | | |
| 10.22** | | | | October 24, 2024, Form 8-K, Exhibit 10.1 |
| | | | |
| 10.23** | | | | March 31, 2019, Form 10-Q, Exhibit 10.3 |
| | | | |
| 10.24** | | | | March 31, 2019, Form 10-Q, Exhibit 10.4 |
| | | | |
| 10.25** | | | | June 30, 2019, Form 10-Q, Exhibit 10.4 |
| | | | |
| 10.26** | | | | March 29, 2020, Form 10-Q, Exhibit 10.4 |
| | | | |
| 10.27** | | | | December 26, 2021, Form 10-K, Exhibit 10.48 |
| | | | |
| 10.28** | | | | May 8, 2024, Form 10-Q, Exhibit 10.4 |
| | | | |
| 10.29** | | | | November 8, 2024, Form 10-Q, Exhibit 10.2 |
| | | | |
| 10.30** | | | | Filed herewith |
| | | | |
| 10.31** | | | | December 31, 2023, Form 10-K, Exhibit 10.36 |
| | | | |
| 10.32** | | | | November 8, 2024, Form 10-Q, Exhibit 10.3 |
| | | | |
| 10.33 | | | | January 2, 2024, Form 8-K, Exhibit 10.1 |
| | | | |
| 10.34 | | | | May 11, 2020, Form 8-K, Exhibit 10.1 |
| | | | | | | | | | | | | | |
EXHIBIT
NUMBER | | DESCRIPTION OF EXHIBITS | | FILINGS REFERENCED FOR
INCORPORATION BY REFERENCE |
| | | | |
| 10.35 | | | | May 11, 2020, Form 8-K, Exhibit 10.2 |
| | | | |
| 10.36 | | | | May 8, 2024, Form 10-Q, Exhibit 10.2 |
| | | | |
| 10.37 | | | | May 8, 2024, Form 10-Q, Exhibit 10.3 |
| | | | |
| 19.1 | | | | Filed herewith |
| | | | |
| 21.1 | | | | Filed herewith |
| | | | |
| 23.1 | | | | Filed herewith |
| | | | |
| 31.1 | | | | Filed herewith |
| | | | |
| 31.2 | | | | Filed herewith |
| | | | |
| 32.1 | | | | Furnished herewith |
| | | | |
| 32.2 | | | | Furnished herewith |
| | | | |
| 97.1 | | | | December 31, 2023, Form 10-K, Exhibit 97.1 |
| | | | |
| 101.INS | | Inline XBRL Instance Document | | Filed herewith |
| | | | |
| 101.SCH | | Inline XBRL Taxonomy Extension Schema Document | | Filed herewith |
| | | | |
| 101.CAL | | Inline XBRL Taxonomy Extension Calculation Linkbase Document | | Filed herewith |
| | | | |
| 101.DEF | | Inline XBRL Taxonomy Extension Definition Linkbase Document | | Filed herewith |
| | | | |
| 101.LAB | | Inline XBRL Taxonomy Extension Label Linkbase Document | | Filed herewith |
| | | | |
| 101.PRE | | Inline XBRL Taxonomy Extension Presentation Linkbase Document | | Filed herewith |
| | | | |
| 104 | | Cover Page Interactive Data File (formatted as inline XBRL and contained in Exhibit 101) | | Filed herewith |
| | | | |
| *Portions of this exhibit (indicated by asterisks) have been redacted in compliance with Regulation S-K Item 601(b)(2)(ii). |
| | | | |
| **Management contract or compensatory plan or arrangement required to be filed as an exhibit. |
| | | | |
| (1) These certifications are not deemed to be “filed” for purposes of Section 18 of the Exchange Act, or otherwise subject to the liability of that section. These certifications will not be deemed to be incorporated by reference into any filing under the Exchange Act or the Exchange Act, except to the extent that the registrant specifically incorporates them by reference. |
Item 16. Form 10-K Summary
None.
SIGNATURES
Pursuant to the requirements of Section 13 or 15(d) of the Securities Exchange Act of 1934, the registrant has duly caused this report to be signed on its behalf by the undersigned, thereunto duly authorized.
| | | | | | | | | | | |
| Date: | February 26, 2025 | Bloomin’ Brands, Inc. |
| | | |
| | | By: /s/ Michael L. Spanos |
| | | Michael L. Spanos Chief Executive Officer (Principal Executive Officer) |
Pursuant to the requirements of the Securities Exchange Act of 1934, this report has been signed below by the following persons on behalf of the registrant and in the capacities and on the dates indicated.
| | | | | | | | | | | | | | |
| Signature | | Title | | Date |
| | | | |
| /s/ Michael L. Spanos | | Chief Executive Officer and Director
(Principal Executive Officer) | | |
| Michael L. Spanos | | | February 26, 2025 |
| | | | |
| /s/ W. Michael Healy | | Executive Vice President and Chief Financial Officer
(Principal Financial Officer) | | |
| W. Michael Healy | | | February 26, 2025 |
| | | | |
| /s/ Philip Pace | | Senior Vice President, Chief Accounting Officer (Principal Accounting Officer) | | |
| Philip Pace | | | February 26, 2025 |
| | | | |
| /s/ R. Michael Mohan | | Chairman of the Board and Director | | |
| R. Michael Mohan | | | | February 26, 2025 |
| | | | |
| /s/ David George | | Director | | |
| David George | | | | February 26, 2025 |
| | | | |
| /s/ Lawrence Jackson | | Director | | |
| Lawrence Jackson | | | | February 26, 2025 |
| | | | |
| /s/ Julie Kunkel | | Director | | |
| Julie Kunkel | | | | February 26, 2025 |
| | | | |
| /s/ Rohit Lal | | Director | | |
| Rohit Lal | | | | February 26, 2025 |
| | | | |
| /s/ Tara Walpert Levy | | Director | | |
| Tara Walpert Levy | | | | February 26, 2025 |
| | | | |
| /s/ John J. Mahoney | | Director | | |
| John J. Mahoney | | | | February 26, 2025 |
| | | | |
| /s/ Melanie Marein-Efron | | Director | | |
| Melanie Marein-Efron | | | | February 26, 2025 |
| | | | |
| /s/ Jonathan Sagal | | Director | | |
| Jonathan Sagal | | | | February 26, 2025 |
| | | | |
| /s/ James L. Dinkins | | Director | | |
| James L. Dinkins | | | | February 26, 2025 |