UNITED STATES
SECURITIES AND EXCHANGE COMMISSION
Washington, D.C. 20549
FORM N-CSR
CERTIFIED SHAREHOLDER REPORT OF REGISTERED
MANAGEMENT INVESTMENT COMPANIES
Investment Company Act file number: 811-22696
Victory Portfolios II
(Exact name of registrant as specified in charter)
4900 Tiedeman Road, 4th Floor, Brooklyn, Ohio 44144
(Address of principal executive offices) (Zip code)
Citi Fund Services Ohio, Inc., 4400 Easton Commons, Suite 200, Columbus, OH 43219
(Name and address of agent for service)
Registrant’s telephone number, including area code: 800-539-3863
Date of fiscal year end: June 30
Date of reporting period: December 31, 2021
Item 1. Reports to Stockholders.

December 31, 2021
Semi Annual Report
Victory US 500 Enhanced Volatility Wtd Index Fund
Victory Market Neutral Income Fund
www.vcm.com
News, Information And Education 24 Hours A Day, 7 Days A Week
The Victory Capital website gives fund shareholders, prospective shareholders, and investment professionals a convenient way to access fund information, get guidance, and track fund performance anywhere they can access the Internet. The site includes:
• Detailed performance records
• Daily share prices
• The latest fund news
• Investment resources to help you become a better investor
• A section dedicated to investment professionals
Whether you're a potential investor searching for the fund that matches your investment philosophy, a seasoned investor interested in planning tools, or an investment professional, www.vcm.com has what you seek. Visit us anytime. We're always open.
Victory Portfolios II
TABLE OF CONTENTS
| Investment Objective & Portfolio Holdings (Unaudited) | 3 | ||||||
Schedules of Portfolio Investments | |||||||
Victory US 500 Enhanced Volatility Wtd Index Fund | 5 | ||||||
Victory Market Neutral Income Fund | 17 | ||||||
Financial Statements | |||||||
Statements of Assets and Liabilities | 33 | ||||||
Statements of Operations | 34 | ||||||
Statements of Changes in Net Assets | 35 | ||||||
Financial Highlights | 38 | ||||||
Notes to Financial Statements | 42 | ||||||
Supplemental Information (Unaudited) | 52 | ||||||
Proxy Voting and Portfolio Holdings Information | 52 | ||||||
Expense Examples | 52 | ||||||
Advisory Contract Approval | 53 | ||||||
Privacy Policy (inside back cover) | |||||||
1
IRA DISTRIBUTION WITHHOLDING DISCLOSURE
We generally must withhold federal income tax at a rate of 10% of the taxable portion of your distribution and, if you live in a state that requires state income tax withholding, at your state's tax rate. However, you may elect not to have withholding apply or to have income tax withheld at a higher rate. Any withholding election that you make will apply to any subsequent distribution unless and until you change or revoke the election. If you wish to make a withholding election, or change or revoke a prior withholding election, call 800-539-3863 (800-235-8396 for Member Class) and form W-4P (OMB No. 1545-0074 withholding certificate for pension or annuity payments) will be electronically sent.
If you do not have a withholding election in place by the date of a distribution, federal income tax will be withheld from the taxable portion of your distribution at a rate of 10%. If you must pay estimated taxes, you may be subject to estimated tax penalties if your estimated tax payments are not sufficient and sufficient tax is not withheld from your distribution.
For more specific information, please consult your tax adviser.
The Funds are distributed by Victory Capital Services, Inc. Victory Capital Management Inc. is the investment adviser to the Funds and receives fees from the Funds for performing services for the Funds.
This report is not authorized for distribution to prospective investors unless preceded or accompanied by a current prospectus of the Victory Funds.
For additional information about any Victory Fund, including fees, expenses, and risks, view our prospectus online at vcm.com or call 800-539-3863 (800-235-8396 for Member Class). Read it carefully before you invest or send money.
The information in this report is based on data obtained from recognized services and sources and is believed to be reliable. Any opinions, projections, or recommendations in this report are subject to change without notice and are not intended as individual investment advice. Past investment performance of the Funds, markets or securities mentioned herein should not be considered to be indicative of future results.
• NOT FDIC INSURED • NO BANK GUARANTEE • MAY LOSE VALUE

Call Victory at:
800-539-FUND (800-539-3863)
800-235-8396 for Member Class
Visit our website at:
www.vcm.com
2
| Victory Portfolios II Victory US 500 Enhanced Volatility Wtd Index Fund | December 31, 2021 | ||||||
(Unaudited)
Investment Objective and Portfolio Holdings:
The Fund seeks to provide investment results that track the performance of the Nasdaq Victory US Large Cap 500 Long/Cash Volatility Weighted Index before fees and expenses.
Top 10 Holdings*:
December 31, 2021
(% of Net Assets)
The Procter & Gamble Co. | 0.4 | % | |||||
The Hershey Co. | 0.4 | % | |||||
Costco Wholesale Corp. | 0.4 | % | |||||
PepsiCo, Inc. | 0.4 | % | |||||
Church & Dwight Co., Inc. | 0.4 | % | |||||
Colgate-Palmolive Co. | 0.4 | % | |||||
Cerner Corp. | 0.4 | % | |||||
McDonald's Corp. | 0.4 | % | |||||
McCormick & Co., Inc. | 0.3 | % | |||||
The Coca-Cola Co. | 0.3 | % | |||||
Sector Allocation*:
December 31, 2021
(% of Net Assets)

* Does not include futures contracts, money market instruments, and short-term investments purchased with cash collateral from securities loaned.
Percentages are of the net assets of the Fund and may not equal 100%.
Refer to the Schedule of Portfolio Investments for a complete list of securities.
3
| Victory Portfolios II Victory Market Neutral Income Fund | December 31, 2021 | ||||||
(Unaudited)
Investment Objective and Portfolio Holdings:
The Fund seeks to provide high current income.
Top 10 Holdings*:
December 31, 2021
(% of Net Assets)
Emera, Inc. | 0.5 | % | |||||
Far EasTone Telecommunications Co. Ltd. | 0.5 | % | |||||
Fortis, Inc. | 0.5 | % | |||||
Otter Tail Corp. | 0.4 | % | |||||
Taiwan Mobile Co. Ltd. | 0.4 | % | |||||
CSG Systems International, Inc. | 0.4 | % | |||||
The Bank of Nova Scotia | 0.4 | % | |||||
Mega Financial Holding Co. Ltd. | 0.4 | % | |||||
Costco Wholesale Corp. | 0.4 | % | |||||
BCE, Inc. | 0.4 | % | |||||
Sector Allocation*:
December 31, 2021
(% of Net Assets)

* Does not include futures contracts, money market instruments, and short-term investments purchased with cash collateral from securities loaned.
Percentages are of the net assets of the Fund and may not equal 100%.
Refer to the Schedule of Portfolio Investments for a complete list of securities.
4
| Victory Portfolios II Victory US 500 Enhanced Volatility Wtd Index Fund | Schedule of Portfolio Investments December 31, 2021 | ||||||
(Unaudited)
Security Description | Shares | Value | |||||||||
Common Stocks (99.2%) | |||||||||||
Communication Services (4.2%): | |||||||||||
Activision Blizzard, Inc. | 1,519 | $ | 101,059 | ||||||||
Alphabet, Inc., Class A (a) | 50 | 144,852 | |||||||||
Altice USA, Inc., Class A (a) | 4,332 | 70,092 | |||||||||
Cable One, Inc. | 63 | 111,097 | |||||||||
Charter Communications, Inc., Class A (a) | 182 | 118,659 | |||||||||
Comcast Corp., Class A | 2,661 | 133,928 | |||||||||
Discovery, Inc., Class A (a) (b) | 2,107 | 49,599 | |||||||||
DISH Network Corp., Class A (a) | 2,085 | 67,637 | |||||||||
Electronic Arts, Inc. | 1,075 | 141,792 | |||||||||
Fox Corp., Class A | 2,441 | 90,073 | |||||||||
IAC/InterActiveCorp (a) | 602 | 78,687 | |||||||||
Liberty Broadband Corp., Class C (a) | 755 | 121,630 | |||||||||
Match Group, Inc. (a) | 595 | 78,689 | |||||||||
Meta Platforms, Inc., Class A (a) | 324 | 108,977 | |||||||||
Netflix, Inc. (a) | 183 | 110,246 | |||||||||
News Corp., Class A | 5,493 | 122,549 | |||||||||
Omnicom Group, Inc. | 1,844 | 135,110 | |||||||||
Pinterest, Inc., Class A (a) | 1,111 | 40,385 | |||||||||
Roku, Inc. (a) | 173 | 39,479 | |||||||||
Sirius XM Holdings, Inc. (b) | 18,939 | 120,263 | |||||||||
Take-Two Interactive Software, Inc. (a) | 731 | 129,913 | |||||||||
The Interpublic Group of Cos., Inc. | 3,127 | 117,106 | |||||||||
The Walt Disney Co. (a) | 786 | 121,743 | |||||||||
T-Mobile U.S., Inc. (a) | 1,104 | 128,042 | |||||||||
Twitter, Inc. (a) | 1,222 | 52,815 | |||||||||
Verizon Communications, Inc. | 4,457 | 231,586 | |||||||||
ViacomCBS, Inc., Class B | 1,270 | 38,329 | |||||||||
Warner Music Group Corp., Class A | 2,649 | 114,384 | |||||||||
Zillow Group, Inc., Class C (a) (b) | 626 | 39,970 | |||||||||
ZoomInfo Technologies, Inc. (a) | 1,013 | 65,035 | |||||||||
3,023,726 | |||||||||||
Consumer Discretionary (10.1%): | |||||||||||
Advance Auto Parts, Inc. | 663 | 159,040 | |||||||||
Amazon.com, Inc. (a) | 42 | 140,042 | |||||||||
Aptiv PLC (a) | 678 | 111,836 | |||||||||
AutoZone, Inc. (a) | 104 | 218,025 | |||||||||
Bath & Body Works, Inc. | 1,131 | 78,933 | |||||||||
Best Buy Co., Inc. | 944 | 95,910 | |||||||||
Booking Holdings, Inc. (a) | 48 | 115,163 | |||||||||
Burlington Stores, Inc. (a) | 328 | 95,615 | |||||||||
CarMax, Inc. (a) | 797 | 103,793 | |||||||||
Chewy, Inc., Class A (a) (b) | 722 | 42,576 | |||||||||
Chipotle Mexican Grill, Inc. (a) | 64 | 111,888 | |||||||||
D.R. Horton, Inc. | 1,076 | 116,692 | |||||||||
Darden Restaurants, Inc. | 746 | 112,377 | |||||||||
Deckers Outdoor Corp. (a) | 241 | 88,281 | |||||||||
Dick's Sporting Goods, Inc. (b) | 577 | 66,349 | |||||||||
See notes to financial statements.
5
| Victory Portfolios II Victory US 500 Enhanced Volatility Wtd Index Fund | Schedule of Portfolio Investments — continued December 31, 2021 | ||||||
(Unaudited)
Security Description | Shares | Value | |||||||||
Dollar General Corp. | 734 | $ | 173,099 | ||||||||
Dollar Tree, Inc. (a) | 1,394 | 195,885 | |||||||||
Domino's Pizza, Inc. | 252 | 142,211 | |||||||||
eBay, Inc. | 1,343 | 89,310 | |||||||||
Etsy, Inc. (a) | 272 | 59,552 | |||||||||
Five Below, Inc. (a) | 468 | 96,825 | |||||||||
Floor & Decor Holdings, Inc., Class A (a) | 720 | 93,607 | |||||||||
Ford Motor Co. | 6,591 | 136,895 | |||||||||
Garmin Ltd. | 1,054 | 143,523 | |||||||||
General Motors Co. (a) | 1,834 | 107,527 | |||||||||
Genuine Parts Co. | 1,242 | 174,128 | |||||||||
Hasbro, Inc. | 1,408 | 143,306 | |||||||||
Lennar Corp., Class A | 829 | 96,297 | |||||||||
Levi Strauss & Co., Class A | 3,585 | 89,733 | |||||||||
LKQ Corp. | 2,560 | 153,677 | |||||||||
Lowe's Cos., Inc. | 666 | 172,148 | |||||||||
Marriott International, Inc., Class A (a) | 853 | 140,950 | |||||||||
McDonald's Corp. | 942 | 252,522 | |||||||||
Mohawk Industries, Inc. (a) | 534 | 97,284 | |||||||||
Newell Brands, Inc. | 4,744 | 103,609 | |||||||||
NIKE, Inc., Class B | 731 | 121,836 | |||||||||
NVR, Inc. (a) | 26 | 153,631 | |||||||||
O'Reilly Automotive, Inc. (a) | 297 | 209,750 | |||||||||
Penn National Gaming, Inc. (a) | 697 | 36,139 | |||||||||
Pool Corp. | 276 | 156,216 | |||||||||
PulteGroup, Inc. | 1,871 | 106,946 | |||||||||
RH (a) | 116 | 62,169 | |||||||||
Ross Stores, Inc. | 970 | 110,852 | |||||||||
Service Corp. International | 2,356 | 167,252 | |||||||||
Starbucks Corp. | 1,398 | 163,524 | |||||||||
Tapestry, Inc. | 2,238 | 90,863 | |||||||||
Target Corp. (c) | 612 | 141,641 | |||||||||
Tesla, Inc. (a) | 86 | 90,883 | |||||||||
The Home Depot, Inc. | 549 | 227,841 | |||||||||
The TJX Cos., Inc. | 1,918 | 145,615 | |||||||||
Tractor Supply Co. | 684 | 163,202 | |||||||||
Ulta Beauty, Inc. (a) | 302 | 124,527 | |||||||||
Vail Resorts, Inc. | 408 | 133,783 | |||||||||
VF Corp. | 1,528 | 111,880 | |||||||||
Wayfair, Inc., Class A (a) (b) | 211 | 40,084 | |||||||||
Whirlpool Corp. | 541 | 126,951 | |||||||||
Williams-Sonoma, Inc. | 408 | 69,005 | |||||||||
Yum! Brands, Inc. | 1,394 | 193,571 | |||||||||
7,266,769 | |||||||||||
Consumer Staples (9.1%): | |||||||||||
Albertsons Cos., Inc., Class A (b) | 2,686 | 81,090 | |||||||||
Altria Group, Inc. | 3,254 | 154,207 | |||||||||
Archer-Daniels-Midland Co. | 2,838 | 191,820 | |||||||||
Brown-Forman Corp., Class B | 2,610 | 190,165 | |||||||||
Bunge Ltd. | 1,632 | 152,364 | |||||||||
See notes to financial statements.
6
| Victory Portfolios II Victory US 500 Enhanced Volatility Wtd Index Fund | Schedule of Portfolio Investments — continued December 31, 2021 | ||||||
(Unaudited)
Security Description | Shares | Value | |||||||||
Campbell Soup Co. | 3,647 | $ | 158,499 | ||||||||
Church & Dwight Co., Inc. | 2,546 | 260,965 | |||||||||
Colgate-Palmolive Co. | 3,057 | 260,884 | |||||||||
Conagra Brands, Inc. | 5,101 | 174,199 | |||||||||
Constellation Brands, Inc., Class A | 794 | 199,270 | |||||||||
Costco Wholesale Corp. | 471 | 267,387 | |||||||||
Darling Ingredients, Inc. (a) | 1,058 | 73,309 | |||||||||
General Mills, Inc. | 3,213 | 216,492 | |||||||||
Hormel Foods Corp. (b) | 3,777 | 184,355 | |||||||||
Kellogg Co. | 2,853 | 183,790 | |||||||||
Keurig Dr Pepper, Inc. | 6,019 | 221,860 | |||||||||
Kimberly-Clark Corp. | 1,557 | 222,526 | |||||||||
McCormick & Co., Inc. | 2,554 | 246,742 | |||||||||
Mondelez International, Inc., Class A | 3,689 | 244,618 | |||||||||
Monster Beverage Corp. (a) | 1,725 | 165,669 | |||||||||
PepsiCo, Inc. | 1,534 | 266,471 | |||||||||
Philip Morris International, Inc. | 2,052 | 194,940 | |||||||||
Sysco Corp. | 1,690 | 132,750 | |||||||||
The Clorox Co. | 846 | 147,509 | |||||||||
The Coca-Cola Co. | 4,161 | 246,373 | |||||||||
The Estee Lauder Cos., Inc. | 394 | 145,859 | |||||||||
The Hershey Co. | 1,419 | 274,534 | |||||||||
The J.M. Smucker Co. | 1,316 | 178,739 | |||||||||
The Kraft Heinz Co. | 4,467 | 160,365 | |||||||||
The Kroger Co. | 2,705 | 122,428 | |||||||||
The Procter & Gamble Co. | 1,680 | 274,814 | |||||||||
Tyson Foods, Inc., Class A | 1,979 | 172,490 | |||||||||
Walgreens Boots Alliance, Inc. | 2,500 | 130,400 | |||||||||
Walmart, Inc. | 1,424 | 206,039 | |||||||||
6,503,922 | |||||||||||
Energy (1.8%): | |||||||||||
Chevron Corp. | 1,375 | 161,356 | |||||||||
ConocoPhillips | 1,702 | 122,850 | |||||||||
Continental Resources, Inc. (b) | 1,462 | 65,439 | |||||||||
Devon Energy Corp. | 2,241 | 98,716 | |||||||||
EOG Resources, Inc. | 1,119 | 99,401 | |||||||||
Halliburton Co. | 3,807 | 87,066 | |||||||||
Kinder Morgan, Inc. | 8,262 | 131,035 | |||||||||
ONEOK, Inc. | 2,066 | 121,398 | |||||||||
Pioneer Natural Resources Co. | 587 | 106,764 | |||||||||
Schlumberger NV | 2,979 | 89,221 | |||||||||
Texas Pacific Land Corp. | 51 | 63,693 | |||||||||
The Williams Cos., Inc. | 5,938 | 154,626 | |||||||||
1,301,565 | |||||||||||
Financials (15.5%): | |||||||||||
Aflac, Inc. | 3,063 | 178,849 | |||||||||
Ally Financial, Inc. | 2,140 | 101,885 | |||||||||
American Express Co. | 819 | 133,988 | |||||||||
American Financial Group, Inc. | 738 | 101,342 | |||||||||
See notes to financial statements.
7
| Victory Portfolios II Victory US 500 Enhanced Volatility Wtd Index Fund | Schedule of Portfolio Investments — continued December 31, 2021 | ||||||
(Unaudited)
Security Description | Shares | Value | |||||||||
American International Group, Inc. | 2,120 | $ | 120,543 | ||||||||
Ameriprise Financial, Inc. | 496 | 149,623 | |||||||||
Aon PLC, Class A | 521 | 156,592 | |||||||||
Apollo Global Management, Inc. | 2,105 | 152,465 | |||||||||
Arch Capital Group Ltd. (a) | 3,780 | 168,021 | |||||||||
Ares Management Corp., Class A | 1,701 | 138,240 | |||||||||
Arthur J. Gallagher & Co. | 1,291 | 219,044 | |||||||||
Bank of America Corp. | 3,264 | 145,215 | |||||||||
Berkshire Hathaway, Inc., Class B (a) | 771 | 230,529 | |||||||||
BlackRock, Inc. | 163 | 149,236 | |||||||||
Blackstone, Inc. | 1,197 | 154,880 | |||||||||
Brown & Brown, Inc. | 3,114 | 218,852 | |||||||||
Capital One Financial Corp. | 687 | 99,677 | |||||||||
Cboe Global Markets, Inc. | 978 | 127,531 | |||||||||
Chubb Ltd. | 780 | 150,782 | |||||||||
Cincinnati Financial Corp. | 1,099 | 125,209 | |||||||||
Citigroup, Inc. | 1,763 | 106,468 | |||||||||
Citizens Financial Group, Inc. | 2,373 | 112,124 | |||||||||
CME Group, Inc. | 766 | 175,000 | |||||||||
CNA Financial Corp. | 3,492 | 153,927 | |||||||||
Discover Financial Services | 830 | 95,915 | |||||||||
East West Bancorp, Inc. | 1,381 | 108,657 | |||||||||
Everest Re Group Ltd. | 555 | 152,026 | |||||||||
FactSet Research Systems, Inc. | 411 | 199,750 | |||||||||
Fidelity National Financial, Inc. | 2,778 | 144,956 | |||||||||
Fifth Third Bancorp | 2,811 | 122,419 | |||||||||
First Republic Bank | 658 | 135,884 | |||||||||
Franklin Resources, Inc. | 3,107 | 104,053 | |||||||||
Huntington Bancshares, Inc. | 6,908 | 106,521 | |||||||||
Interactive Brokers Group, Inc. | 1,876 | 148,992 | |||||||||
Intercontinental Exchange, Inc. | 1,739 | 237,843 | |||||||||
Invesco Ltd. | 3,752 | 86,371 | |||||||||
JPMorgan Chase & Co. | 995 | 157,558 | |||||||||
KeyCorp | 5,243 | 121,271 | |||||||||
KKR & Co., Inc. | 2,306 | 171,797 | |||||||||
Lincoln National Corp. | 1,373 | 93,721 | |||||||||
Loews Corp. | 2,829 | 163,403 | |||||||||
LPL Financial Holdings, Inc. | 776 | 124,230 | |||||||||
M&T Bank Corp. | 793 | 121,789 | |||||||||
Markel Corp. (a) | 122 | 150,548 | |||||||||
MarketAxess Holdings, Inc. | 229 | 94,181 | |||||||||
Marsh & McLennan Cos., Inc. | 1,340 | 232,919 | |||||||||
MetLife, Inc. | 2,148 | 134,229 | |||||||||
Moody's Corp. | 494 | 192,947 | |||||||||
Morgan Stanley | 1,257 | 123,387 | |||||||||
Morningstar, Inc. | 522 | 178,519 | |||||||||
MSCI, Inc. | 228 | 139,693 | |||||||||
Nasdaq, Inc. | 967 | 203,080 | |||||||||
Northern Trust Corp. | 1,160 | 138,748 | |||||||||
Principal Financial Group, Inc. | 1,860 | 134,534 | |||||||||
See notes to financial statements.
8
| Victory Portfolios II Victory US 500 Enhanced Volatility Wtd Index Fund | Schedule of Portfolio Investments — continued December 31, 2021 | ||||||
(Unaudited)
Security Description | Shares | Value | |||||||||
Prudential Financial, Inc. | 1,287 | $ | 139,305 | ||||||||
Raymond James Financial, Inc. | 1,540 | 154,616 | |||||||||
Regions Financial Corp. | 5,228 | 113,970 | |||||||||
S&P Global, Inc. | 393 | 185,469 | |||||||||
Signature Bank | 337 | 109,009 | |||||||||
State Street Corp. | 1,216 | 113,088 | |||||||||
SVB Financial Group (a) | 163 | 110,553 | |||||||||
Synchrony Financial | 2,052 | 95,192 | |||||||||
T. Rowe Price Group, Inc. | 674 | 132,535 | |||||||||
The Allstate Corp. | 1,323 | 155,651 | |||||||||
The Bank of New York Mellon Corp. | 2,436 | 141,483 | |||||||||
The Carlyle Group, Inc. | 2,798 | 153,610 | |||||||||
The Charles Schwab Corp. | 1,577 | 132,626 | |||||||||
The Goldman Sachs Group, Inc. | 327 | 125,094 | |||||||||
The Hartford Financial Services Group, Inc. | 1,583 | 109,290 | |||||||||
The PNC Financial Services Group, Inc. | 685 | 137,356 | |||||||||
The Progressive Corp. | 1,734 | 177,995 | |||||||||
The Travelers Cos., Inc. | 1,016 | 158,933 | |||||||||
Tradeweb Markets, Inc., Class A | 1,711 | 171,340 | |||||||||
Truist Financial Corp. | 2,124 | 124,360 | |||||||||
U.S. Bancorp | 2,265 | 127,225 | |||||||||
UWM Holdings Corp. | 8,523 | 50,456 | |||||||||
W.R. Berkley Corp. | 2,322 | 191,310 | |||||||||
Wells Fargo & Co. | 2,221 | 106,564 | |||||||||
11,106,993 | |||||||||||
Health Care (13.8%): | |||||||||||
Abbott Laboratories | 1,279 | 180,006 | |||||||||
AbbVie, Inc. | 1,513 | 204,860 | |||||||||
ABIOMED, Inc. (a) | 288 | 103,441 | |||||||||
Agilent Technologies, Inc. | 1,059 | 169,069 | |||||||||
Align Technology, Inc. (a) | 128 | 84,119 | |||||||||
Amgen, Inc. | 753 | 169,402 | |||||||||
Anthem, Inc. | 403 | 186,807 | |||||||||
Avantor, Inc. (a) | 3,169 | 133,542 | |||||||||
Baxter International, Inc. | 2,697 | 231,510 | |||||||||
Becton Dickinson & Co. | 765 | 192,382 | |||||||||
Biogen, Inc. (a) | 193 | 46,305 | |||||||||
BioMarin Pharmaceutical, Inc. (a) | 1,506 | 133,055 | |||||||||
Bio-Rad Laboratories, Inc., Class A (a) | 172 | 129,958 | |||||||||
Bio-Techne Corp. | 208 | 107,607 | |||||||||
Boston Scientific Corp. (a) | 3,482 | 147,915 | |||||||||
Bruker Corp. | 1,608 | 134,927 | |||||||||
Cardinal Health, Inc. | 2,362 | 121,619 | |||||||||
Catalent, Inc. (a) | 929 | 118,940 | |||||||||
Centene Corp. (a) | 1,867 | 153,841 | |||||||||
Cerner Corp. | 2,780 | 258,179 | |||||||||
Charles River Laboratories International, Inc. (a) | 315 | 118,686 | |||||||||
Cigna Corp. | 626 | 143,748 | |||||||||
CVS Health Corp. | 1,932 | 199,305 | |||||||||
Danaher Corp. | 460 | 151,345 | |||||||||
See notes to financial statements.
9
| Victory Portfolios II Victory US 500 Enhanced Volatility Wtd Index Fund | Schedule of Portfolio Investments — continued December 31, 2021 | ||||||
(Unaudited)
Security Description | Shares | Value | |||||||||
DaVita, Inc. (a) | 1,074 | $ | 122,178 | ||||||||
DENTSPLY SIRONA, Inc. | 1,970 | 109,906 | |||||||||
Dexcom, Inc. (a) | 185 | 99,336 | |||||||||
Edwards Lifesciences Corp. (a) | 1,361 | 176,318 | |||||||||
Eli Lilly & Co. | 421 | 116,289 | |||||||||
Gilead Sciences, Inc. (c) | 2,360 | 171,360 | |||||||||
HCA Healthcare, Inc. | 490 | 125,891 | |||||||||
Henry Schein, Inc. (a) | 1,742 | 135,057 | |||||||||
Hologic, Inc. (a) | 1,537 | 117,673 | |||||||||
Horizon Therapeutics PLC (a) | 759 | 81,790 | |||||||||
Humana, Inc. | 391 | 181,369 | |||||||||
IDEXX Laboratories, Inc. (a) | 195 | 128,400 | |||||||||
Illumina, Inc. (a) | 210 | 79,892 | |||||||||
Incyte Corp. (a) | 1,572 | 115,385 | |||||||||
Intuitive Surgical, Inc. (a) | 368 | 132,222 | |||||||||
IQVIA Holdings, Inc. (a) | 664 | 187,341 | |||||||||
Johnson & Johnson (c) | 1,366 | 233,682 | |||||||||
Laboratory Corp. of America Holdings (a) | 562 | 176,586 | |||||||||
Masimo Corp. (a) | 493 | 144,341 | |||||||||
Medtronic PLC | 1,400 | 144,830 | |||||||||
Merck & Co., Inc. | 2,640 | 202,330 | |||||||||
Mettler-Toledo International, Inc. (a) | 99 | 168,024 | |||||||||
Moderna, Inc. (a) | 122 | 30,986 | |||||||||
Molina Healthcare, Inc. (a) | 452 | 143,772 | |||||||||
PerkinElmer, Inc. | 650 | 130,689 | |||||||||
Pfizer, Inc. | 3,652 | 215,651 | |||||||||
Quest Diagnostics, Inc. | 1,132 | 195,847 | |||||||||
Regeneron Pharmaceuticals, Inc. (a) | 212 | 133,882 | |||||||||
Repligen Corp. (a) | 297 | 78,657 | |||||||||
ResMed, Inc. | 465 | 121,123 | |||||||||
Seagen, Inc. (a) | 565 | 87,349 | |||||||||
STERIS PLC | 772 | 187,913 | |||||||||
Stryker Corp. | 655 | 175,160 | |||||||||
Teleflex, Inc. | 338 | 111,026 | |||||||||
The Cooper Cos., Inc. | 359 | 150,399 | |||||||||
Thermo Fisher Scientific, Inc. | 261 | 174,150 | |||||||||
UnitedHealth Group, Inc. | 464 | 232,993 | |||||||||
Universal Health Services, Inc., Class B | 890 | 115,397 | |||||||||
Veeva Systems, Inc., Class A (a) | 305 | 77,921 | |||||||||
Vertex Pharmaceuticals, Inc. (a) | 682 | 149,767 | |||||||||
Waters Corp. (a) | 381 | 141,961 | |||||||||
West Pharmaceutical Services, Inc. | 360 | 168,844 | |||||||||
Zimmer Biomet Holdings, Inc. | 1,056 | 134,154 | |||||||||
Zoetis, Inc. | 848 | 206,937 | |||||||||
9,935,346 | |||||||||||
Industrials (16.6%): | |||||||||||
3M Co. | 978 | 173,722 | |||||||||
AGCO Corp. | 687 | 79,706 | |||||||||
Allegion PLC | 1,095 | 145,022 | |||||||||
AMERCO, Inc. | 196 | 142,341 | |||||||||
See notes to financial statements.
10
| Victory Portfolios II Victory US 500 Enhanced Volatility Wtd Index Fund | Schedule of Portfolio Investments — continued December 31, 2021 | ||||||
(Unaudited)
Security Description | Shares | Value | |||||||||
AMETEK, Inc. | 1,350 | $ | 198,504 | ||||||||
AO Smith Corp. | 1,859 | 159,595 | |||||||||
Booz Allen Hamilton Holding Corp. | 1,844 | 156,353 | |||||||||
Builders FirstSource, Inc. (a) | 1,631 | 139,793 | |||||||||
C.H. Robinson Worldwide, Inc. | 1,695 | 182,433 | |||||||||
Carlisle Cos., Inc. | 770 | 191,052 | |||||||||
Carrier Global Corp. | 2,214 | 120,087 | |||||||||
Caterpillar, Inc. | 657 | 135,828 | |||||||||
Cintas Corp. | 362 | 160,427 | |||||||||
Copart, Inc. (a) | 1,021 | 154,804 | |||||||||
CoStar Group, Inc. (a) (c) | 1,461 | 115,463 | |||||||||
CSX Corp. | 4,816 | 181,082 | |||||||||
Cummins, Inc. | 626 | 136,556 | |||||||||
Deere & Co. | 318 | 109,039 | |||||||||
Dover Corp. | 1,003 | 182,145 | |||||||||
Eaton Corp. PLC | 984 | 170,055 | |||||||||
Emerson Electric Co. | 1,578 | 146,707 | |||||||||
Equifax, Inc. | 451 | 132,048 | |||||||||
Expeditors International of Washington, Inc. | 1,416 | 190,155 | |||||||||
Fastenal Co. | 3,138 | 201,020 | |||||||||
FedEx Corp. | 496 | 128,285 | |||||||||
Fortive Corp. | 2,162 | 164,939 | |||||||||
Fortune Brands Home & Security, Inc. | 1,328 | 141,963 | |||||||||
Generac Holdings, Inc. (a) | 174 | 61,234 | |||||||||
General Dynamics Corp. | 975 | 203,258 | |||||||||
Graco, Inc. | 2,198 | 177,203 | |||||||||
HEICO Corp. | 1,050 | 151,431 | |||||||||
Honeywell International, Inc. | 779 | 162,429 | |||||||||
Howmet Aerospace, Inc. | 3,293 | 104,816 | |||||||||
Hubbell, Inc. | 714 | 148,705 | |||||||||
IDEX Corp. | 811 | 191,655 | |||||||||
Illinois Tool Works, Inc. | 939 | 231,745 | |||||||||
Ingersoll Rand, Inc. (c) | 2,339 | 144,714 | |||||||||
J.B. Hunt Transport Services, Inc. | 774 | 158,206 | |||||||||
Jacobs Engineering Group, Inc. | 1,062 | 147,862 | |||||||||
Johnson Controls International PLC | 2,244 | 182,460 | |||||||||
L3Harris Technologies, Inc. | 777 | 165,687 | |||||||||
Leidos Holdings, Inc. | 1,350 | 120,015 | |||||||||
Lennox International, Inc. | 423 | 137,204 | |||||||||
Lockheed Martin Corp. | 574 | 204,005 | |||||||||
Masco Corp. | 2,621 | 184,047 | |||||||||
Nordson Corp. | 661 | 168,733 | |||||||||
Norfolk Southern Corp. (b) | 614 | 182,794 | |||||||||
Northrop Grumman Corp. | 527 | 203,986 | |||||||||
Old Dominion Freight Line, Inc. | 500 | 179,190 | |||||||||
Otis Worldwide Corp. | 1,882 | 163,866 | |||||||||
PACCAR, Inc. | 1,722 | 151,984 | |||||||||
Parker-Hannifin Corp. | 469 | 149,198 | |||||||||
Quanta Services, Inc. | 1,138 | 130,483 | |||||||||
Raytheon Technologies Corp. | 1,752 | 150,777 | |||||||||
See notes to financial statements.
11
| Victory Portfolios II Victory US 500 Enhanced Volatility Wtd Index Fund | Schedule of Portfolio Investments — continued December 31, 2021 | ||||||
(Unaudited)
Security Description | Shares | Value | |||||||||
Republic Services, Inc. (c) | 1,736 | $ | 242,085 | ||||||||
Robert Half International, Inc. | 1,388 | 154,790 | |||||||||
Rockwell Automation, Inc. | 492 | 171,634 | |||||||||
Rollins, Inc. | 3,580 | 122,472 | |||||||||
Roper Technologies, Inc. | 378 | 185,923 | |||||||||
Snap-on, Inc. | 614 | 132,243 | |||||||||
Stanley Black & Decker, Inc. | 817 | 154,102 | |||||||||
Textron, Inc. | 1,606 | 123,983 | |||||||||
The Toro Co. | 1,537 | 153,562 | |||||||||
Trane Technologies PLC | 758 | 153,139 | |||||||||
TransDigm Group, Inc. (a) | 202 | 128,529 | |||||||||
TransUnion | 1,201 | 142,415 | |||||||||
Trex Co., Inc. (a) | 921 | 124,363 | |||||||||
Union Pacific Corp. | 772 | 194,490 | |||||||||
United Parcel Service, Inc., Class B | 726 | 155,611 | |||||||||
United Rentals, Inc. (a) | 271 | 90,051 | |||||||||
Verisk Analytics, Inc. | 733 | 167,659 | |||||||||
W.W. Grainger, Inc. | 368 | 190,712 | |||||||||
Waste Management, Inc. | 1,451 | 242,172 | |||||||||
Watsco, Inc. | 508 | 158,943 | |||||||||
Westinghouse Air Brake Technologies Corp. | 1,389 | 127,941 | |||||||||
Xylem, Inc. | 1,228 | 147,262 | |||||||||
11,960,892 | |||||||||||
Information Technology (15.2%): | |||||||||||
Accenture PLC, Class A | 549 | 227,588 | |||||||||
Adobe, Inc. (a) | 221 | 125,320 | |||||||||
Advanced Micro Devices, Inc. (a) | 811 | 116,703 | |||||||||
Akamai Technologies, Inc. (a) | 1,171 | 137,054 | |||||||||
Amphenol Corp., Class A | 2,250 | 196,785 | |||||||||
Analog Devices, Inc. | 768 | 134,991 | |||||||||
ANSYS, Inc. (a) | 296 | 118,732 | |||||||||
Apple, Inc. | 875 | 155,374 | |||||||||
Applied Materials, Inc. | 577 | 90,797 | |||||||||
Arista Networks, Inc. (a) (b) | 1,520 | 218,500 | |||||||||
Autodesk, Inc. (a) | 366 | 102,916 | |||||||||
Automatic Data Processing, Inc. | 870 | 214,525 | |||||||||
Black Knight, Inc. (a) | 2,102 | 174,235 | |||||||||
Block, Inc. (a) | 251 | 40,539 | |||||||||
Broadcom, Inc. | 245 | 163,025 | |||||||||
Broadridge Financial Solutions, Inc. | 1,046 | 191,230 | |||||||||
Cadence Design Systems, Inc. (a) | 661 | 123,177 | |||||||||
CDW Corp. | 754 | 154,404 | |||||||||
Cisco Systems, Inc. | 3,345 | 211,973 | |||||||||
Citrix Systems, Inc. | 1,114 | 105,373 | |||||||||
Cognex Corp. | 1,385 | 107,698 | |||||||||
Cognizant Technology Solutions Corp., Class A | 1,955 | 173,448 | |||||||||
Corning, Inc. | 3,346 | 124,572 | |||||||||
Dell Technologies, Inc., Class C (a) | 2,717 | 152,614 | |||||||||
Dynatrace, Inc. (a) | 1,142 | 68,920 | |||||||||
Enphase Energy, Inc. (a) | 296 | 54,150 | |||||||||
See notes to financial statements.
12
| Victory Portfolios II Victory US 500 Enhanced Volatility Wtd Index Fund | Schedule of Portfolio Investments — continued December 31, 2021 | ||||||
(Unaudited)
Security Description | Shares | Value | |||||||||
Entegris, Inc. | 740 | $ | 102,549 | ||||||||
EPAM Systems, Inc. (a) | 199 | 133,022 | |||||||||
F5, Inc. (a) | 649 | 158,817 | |||||||||
Fair Isaac Corp. (a) | 251 | 108,851 | |||||||||
Fidelity National Information Services, Inc. | 1,065 | 116,245 | |||||||||
Fiserv, Inc. (a) | 1,378 | 143,023 | |||||||||
FleetCor Technologies, Inc. (a) | 541 | 121,097 | |||||||||
Fortinet, Inc. (a) | 356 | 127,946 | |||||||||
Gartner, Inc. (a) | 369 | 123,364 | |||||||||
Global Payments, Inc. | 774 | 104,629 | |||||||||
GoDaddy, Inc., Class A (a) | 1,484 | 125,932 | |||||||||
Hewlett Packard Enterprise Co. | 8,350 | 131,680 | |||||||||
HP, Inc. | 4,121 | 155,238 | |||||||||
Intel Corp. | 1,947 | 100,270 | |||||||||
International Business Machines Corp. | 1,104 | 147,561 | |||||||||
Intuit, Inc. | 241 | 155,016 | |||||||||
Jack Henry & Associates, Inc. | 898 | 149,957 | |||||||||
Keysight Technologies, Inc. (a) | 869 | 179,457 | |||||||||
KLA Corp. | 242 | 104,087 | |||||||||
Kyndryl Holdings, Inc. (a) | 221 | 4,000 | |||||||||
Lam Research Corp. | 129 | 92,770 | |||||||||
Mastercard, Inc., Class A | 401 | 144,087 | |||||||||
Microchip Technology, Inc. | 1,177 | 102,470 | |||||||||
Micron Technology, Inc. | 1,161 | 108,147 | |||||||||
Microsoft Corp. (c) | 575 | 193,384 | |||||||||
Monolithic Power Systems, Inc. | 170 | 83,866 | |||||||||
Motorola Solutions, Inc. | 746 | 202,688 | |||||||||
NetApp, Inc. | 1,256 | 115,539 | |||||||||
NortonLifeLock, Inc. | 4,417 | 114,754 | |||||||||
NVIDIA Corp. | 390 | 114,703 | |||||||||
NXP Semiconductors NV | 419 | 95,440 | |||||||||
ON Semiconductor Corp. (a) | 1,787 | 121,373 | |||||||||
Oracle Corp. | 1,628 | 141,978 | |||||||||
Paychex, Inc. | 1,650 | 225,225 | |||||||||
Paycom Software, Inc. (a) | 184 | 76,395 | |||||||||
Paylocity Holding Corp. (a) | 328 | 77,460 | |||||||||
PayPal Holdings, Inc. (a) | 341 | 64,306 | |||||||||
PTC, Inc. (a) | 668 | 80,928 | |||||||||
Qorvo, Inc. (a) | 500 | 78,195 | |||||||||
QUALCOMM, Inc. | 760 | 138,981 | |||||||||
salesforce.com, Inc. (a) | 542 | 137,738 | |||||||||
Seagate Technology Holdings PLC | 999 | 112,867 | |||||||||
ServiceNow, Inc. (a) (c) | 160 | 103,858 | |||||||||
Skyworks Solutions, Inc. | 494 | 76,639 | |||||||||
SS&C Technologies Holdings, Inc. | 2,195 | 179,946 | |||||||||
Synopsys, Inc. (a) | 344 | 126,764 | |||||||||
TE Connectivity Ltd. | 982 | 158,436 | |||||||||
Teledyne Technologies, Inc. (a) | 284 | 124,077 | |||||||||
Teradyne, Inc. | 653 | 106,785 | |||||||||
Texas Instruments, Inc. | 657 | 123,825 | |||||||||
See notes to financial statements.
13
| Victory Portfolios II Victory US 500 Enhanced Volatility Wtd Index Fund | Schedule of Portfolio Investments — continued December 31, 2021 | ||||||
(Unaudited)
Security Description | Shares | Value | |||||||||
The Trade Desk, Inc., Class A (a) | 672 | $ | 61,582 | ||||||||
Trimble, Inc. (a) | 1,299 | 113,260 | |||||||||
Tyler Technologies, Inc. (a) | 253 | 136,101 | |||||||||
Ubiquiti, Inc. | 233 | 71,461 | |||||||||
VeriSign, Inc. (a) | 831 | 210,924 | |||||||||
Visa, Inc., Class A | 726 | 157,331 | |||||||||
VMware, Inc., Class A | 1,091 | 126,425 | |||||||||
Western Digital Corp. (a) | 1,190 | 77,600 | |||||||||
Zebra Technologies Corp. (a) | 224 | 133,325 | |||||||||
Zoom Video Communications, Inc., Class A (a) | 230 | 42,299 | |||||||||
10,931,316 | |||||||||||
Materials (5.3%): | |||||||||||
Air Products & Chemicals, Inc. | 592 | 180,122 | |||||||||
Albemarle Corp. | 322 | 75,274 | |||||||||
Avery Dennison Corp. | 653 | 141,420 | |||||||||
Ball Corp. | 1,600 | 154,032 | |||||||||
Celanese Corp. | 856 | 143,859 | |||||||||
Cleveland-Cliffs, Inc. (a) (b) | 2,146 | 46,718 | |||||||||
Corteva, Inc. | 2,912 | 137,679 | |||||||||
Crown Holdings, Inc. | 1,266 | 140,045 | |||||||||
Dow, Inc. | 1,867 | 105,896 | |||||||||
DuPont de Nemours, Inc. | 1,613 | 130,298 | |||||||||
Eastman Chemical Co. | 1,133 | 136,991 | |||||||||
Ecolab, Inc. | 775 | 181,807 | |||||||||
FMC Corp. | 1,408 | 154,725 | |||||||||
Freeport-McMoRan, Inc. | 1,825 | 76,157 | |||||||||
International Flavors & Fragrances, Inc. | 748 | 112,686 | |||||||||
International Paper Co. | 2,363 | 111,014 | |||||||||
LyondellBasell Industries NV, Class A | 1,124 | 103,667 | |||||||||
Martin Marietta Materials, Inc. | 330 | 145,372 | |||||||||
Newmont Corp. | 2,195 | 136,134 | |||||||||
Nucor Corp. | 743 | 84,814 | |||||||||
Packaging Corp. of America | 1,125 | 153,169 | |||||||||
Pegasystems, Inc. | 790 | 88,338 | |||||||||
PPG Industries, Inc. | 927 | 159,852 | |||||||||
RPM International, Inc. | 2,137 | 215,837 | |||||||||
Steel Dynamics, Inc. | 1,292 | 80,195 | |||||||||
Sylvamo Corp. (a) | 215 | 5,996 | |||||||||
The Mosaic Co. | 2,509 | 98,579 | |||||||||
The Sherwin-Williams Co. | 649 | 228,552 | |||||||||
Vulcan Materials Co. | 704 | 146,136 | |||||||||
Westlake Chemical Corp. | 1,225 | 118,984 | |||||||||
3,794,348 | |||||||||||
Real Estate (0.4%): | |||||||||||
CBRE Group, Inc., Class A (a) | 1,354 | 146,923 | |||||||||
Jones Lang LaSalle, Inc. (a) | 471 | 126,859 | |||||||||
273,782 | |||||||||||
See notes to financial statements.
14
| Victory Portfolios II Victory US 500 Enhanced Volatility Wtd Index Fund | Schedule of Portfolio Investments — continued December 31, 2021 | ||||||
(Unaudited)
Security Description | Shares | Value | |||||||||
Utilities (7.2%): | |||||||||||
Alliant Energy Corp. | 3,117 | $ | 191,602 | ||||||||
Ameren Corp. | 2,230 | 198,492 | |||||||||
American Electric Power Co., Inc. (c) | 2,297 | 204,364 | |||||||||
American Water Works Co., Inc. | 911 | 172,051 | |||||||||
Atmos Energy Corp. | 1,789 | 187,434 | |||||||||
Avangrid, Inc. (b) | 3,428 | 170,989 | |||||||||
CenterPoint Energy, Inc. | 6,016 | 167,907 | |||||||||
CMS Energy Corp. | 3,021 | 196,516 | |||||||||
Consolidated Edison, Inc. (c) | 2,760 | 235,483 | |||||||||
Dominion Energy, Inc. | 2,590 | 203,470 | |||||||||
DTE Energy Co. | 1,671 | 199,751 | |||||||||
Duke Energy Corp. (c) | 2,055 | 215,569 | |||||||||
Edison International | 2,831 | 193,216 | |||||||||
Entergy Corp. | 1,558 | 175,509 | |||||||||
Essential Utilities, Inc. | 3,382 | 181,580 | |||||||||
Evergy, Inc. (c) | 2,714 | 186,208 | |||||||||
Eversource Energy (c) | 1,878 | 170,860 | |||||||||
Exelon Corp. | 3,719 | 214,809 | |||||||||
FirstEnergy Corp. | 4,393 | 182,705 | |||||||||
NextEra Energy, Inc. (c) | 1,811 | 169,075 | |||||||||
NRG Energy, Inc. | 1,901 | 81,895 | |||||||||
PG&E Corp. (a) | 11,548 | 140,193 | |||||||||
PPL Corp. | 6,590 | 198,095 | |||||||||
Public Service Enterprise Group, Inc. | 2,835 | 189,180 | |||||||||
Sempra Energy | 1,334 | 176,462 | |||||||||
The Southern Co. (c) | 3,202 | 219,593 | |||||||||
WEC Energy Group, Inc. (c) | 1,916 | 185,986 | |||||||||
Xcel Energy, Inc. (c) | 2,723 | 184,347 | |||||||||
5,193,341 | |||||||||||
Total Common Stocks (Cost $45,384,448) | 71,292,000 | ||||||||||
Investment Companies (0.6%) | |||||||||||
BlackRock Liquidity Funds T-Fund, Institutional Shares, 0.01% (d) | 437,647 | 437,647 | |||||||||
Total Investment Companies (Cost $437,647) | 437,647 | ||||||||||
Collateral for Securities Loaned^ (1.8%) | |||||||||||
BlackRock Liquidity Funds TempFund, Institutional Shares, 0.04% (d) | 30,933 | 30,933 | |||||||||
| Fidelity Investments Money Market Government Portfolio, Institutional Shares, 0.01% (d) | 607,520 | 607,520 | |||||||||
| Goldman Sachs Financial Square Prime Obligations Fund, Institutional Shares, 0.02% (d) | 15,437 | 15,437 | |||||||||
JPMorgan Prime Money Market Fund, Capital Shares, 0.07% (d) | 123,089 | 123,089 | |||||||||
Morgan Stanley Institutional Liquidity Prime Portfolio, Institutional Shares, 0.06% (d) | 553,432 | 553,432 | |||||||||
Total Collateral for Securities Loaned (Cost $1,330,411) | 1,330,411 | ||||||||||
Total Investments (Cost $47,152,506) — 101.6% | 73,060,058 | ||||||||||
Liabilities in excess of other assets — (1.6)% | (1,129,776 | ) | |||||||||
NET ASSETS — 100.00% | $ | 71,930,282 | |||||||||
See notes to financial statements.
15
| Victory Portfolios II Victory US 500 Enhanced Volatility Wtd Index Fund | Schedule of Portfolio Investments — continued December 31, 2021 | ||||||
(Unaudited)
^ Purchased with cash collateral from securities on loan.
(a) Non-income producing security.
(b) All or a portion of this security is on loan.
(c) All or a portion of this security has been segregated as collateral for derivative instruments.
(d) Rate disclosed is the daily yield on December 31, 2021.
PLC — Public Limited Company
Futures Contracts Purchased
| Number of Contracts | Expiration Date | Notional Amount | Value | Unrealized Appreciation (Depreciation) | |||||||||||||||||||
E-Mini S&P 500 Futures | 3 | 3/18/22 | $ | 697,987 | $ | 713,775 | $ | 15,788 | |||||||||||||||
Total unrealized appreciation | $ | 15,788 | |||||||||||||||||||||
Total unrealized depreciation | — | ||||||||||||||||||||||
Total net unrealized appreciation (depreciation) | $ | 15,788 | |||||||||||||||||||||
See notes to financial statements.
16
| Victory Portfolios II Victory Market Neutral Income Fund | Schedule of Portfolio Investments December 31, 2021 | ||||||
(Unaudited)
Security Description | Shares | Value | |||||||||
Common Stocks (83.9%) | |||||||||||
Australia (0.8%): | |||||||||||
Communication Services (0.3%): | |||||||||||
Telstra Corp. Ltd. | 1,559,187 | $ | 4,737,701 | ||||||||
Financials (0.2%): | |||||||||||
Suncorp Group Ltd. | 367,732 | 2,960,031 | |||||||||
Materials (0.3%): | |||||||||||
BHP Group Ltd. (a) | 79,417 | 2,397,242 | |||||||||
Fortescue Metals Group Ltd. | 130,186 | 1,829,615 | |||||||||
Rio Tinto Ltd. | 30,451 | 2,221,619 | |||||||||
6,448,476 | |||||||||||
14,146,208 | |||||||||||
Austria (0.2%): | |||||||||||
Energy (0.2%): | |||||||||||
OMV AG | 49,728 | 2,811,997 | |||||||||
Bermuda (0.3%): | |||||||||||
Financials (0.3%): | |||||||||||
Everest Re Group Ltd. | 14,403 | 3,945,270 | |||||||||
Invesco Ltd. | 97,376 | 2,241,595 | |||||||||
6,186,865 | |||||||||||
Brazil (1.8%): | |||||||||||
Communication Services (0.2%): | |||||||||||
TIM SA | 1,637,700 | 3,879,909 | |||||||||
Consumer Discretionary (0.1%): | |||||||||||
Vibra Energia SA | 517,955 | 1,986,328 | |||||||||
Consumer Staples (0.2%): | |||||||||||
JBS SA | 545,400 | 3,721,959 | |||||||||
Energy (0.1%): | |||||||||||
Petroleo Brasileiro SA, Preference Shares | 398,300 | 2,023,786 | |||||||||
Financials (0.5%): | |||||||||||
B3 SA — Brasil Bolsa Balcao | 1,100,200 | 2,191,315 | |||||||||
Banco do Brasil SA | 557,500 | 2,881,896 | |||||||||
BB Seguridade Participacoes SA | 1,181,100 | 4,372,775 | |||||||||
9,445,986 | |||||||||||
Materials (0.2%): | |||||||||||
Cia Siderurgica Nacional SA | 290,600 | 1,301,784 | |||||||||
Vale SA | 158,100 | 2,203,252 | |||||||||
3,505,036 | |||||||||||
See notes to financial statements.
17
| Victory Portfolios II Victory Market Neutral Income Fund | Schedule of Portfolio Investments — continued December 31, 2021 | ||||||
(Unaudited)
Security Description | Shares | Value | |||||||||
Utilities (0.5%): | |||||||||||
Centrais Eletricas Brasileiras SA | 333,000 | $ | 2,030,315 | ||||||||
| CPFL Energia SA | 590,900 | 2,846,793 | |||||||||
Engie Brasil Energia SA | 616,800 | 4,250,883 | |||||||||
9,127,991 | |||||||||||
33,690,995 | |||||||||||
Canada (3.4%): | |||||||||||
Communication Services (0.7%): | |||||||||||
BCE, Inc. (a) (b) | 133,104 | 6,925,659 | |||||||||
TELUS Corp. (a) (b) | 283,229 | 6,670,930 | |||||||||
13,596,589 | |||||||||||
Energy (0.8%): | |||||||||||
Canadian Natural Resources Ltd. | 70,923 | 2,997,181 | |||||||||
Enbridge, Inc. | 120,600 | 4,711,295 | |||||||||
Suncor Energy, Inc. | 118,081 | 2,954,826 | |||||||||
TC Energy Corp. | 83,499 | 3,883,812 | |||||||||
14,547,114 | |||||||||||
Financials (1.0%): | |||||||||||
Great-West Lifeco, Inc. (a) | 208,137 | 6,246,743 | |||||||||
Manulife Financial Corp. | 216,335 | 4,123,843 | |||||||||
The Bank of Nova Scotia | 100,429 | 7,110,545 | |||||||||
17,481,131 | |||||||||||
Utilities (0.9%): | |||||||||||
Emera, Inc. | 170,846 | 8,539,599 | |||||||||
Fortis, Inc. (a) | 172,799 | 8,338,016 | |||||||||
16,877,615 | |||||||||||
62,502,449 | |||||||||||
China (3.7%): | |||||||||||
Energy (0.3%): | |||||||||||
China Shenhua Energy Co. Ltd., Class H | 1,402,500 | 3,282,353 | |||||||||
PetroChina Co. Ltd., Class H | 6,194,000 | 2,743,385 | |||||||||
6,025,738 | |||||||||||
Financials (2.9%): | |||||||||||
Agricultural Bank of China Ltd., Class H (b) | 12,836,000 | 4,416,204 | |||||||||
Bank of China Ltd., Class H (b) | 15,993,000 | 5,753,928 | |||||||||
Bank of Communications Co. Ltd., Class H | 8,035,000 | 4,857,413 | |||||||||
China CITIC Bank Corp. Ltd., Class H | 9,380,000 | 4,068,900 | |||||||||
China Construction Bank Corp., Class H (b) | 6,241,000 | 4,324,820 | |||||||||
China Everbright Bank Co. Ltd., Class H | 9,972,000 | 3,531,207 | |||||||||
China Galaxy Securities Co. Ltd., Class H | 6,035,500 | 3,469,133 | |||||||||
China Merchants Securities Co. Ltd., Class H (a) (c) | 1,838,600 | 2,816,481 | |||||||||
China Minsheng Banking Corp. Ltd., Class H | 9,018,000 | 3,448,325 | |||||||||
China Pacific Insurance Group Co. Ltd., Class H | 777,800 | 2,113,256 | |||||||||
Guotai Junan Securities Co. Ltd., Class H (c) | 2,756,400 | 4,280,375 | |||||||||
Industrial & Commercial Bank of China Ltd., Class H | 7,926,000 | 4,471,068 | |||||||||
See notes to financial statements.
18
| Victory Portfolios II Victory Market Neutral Income Fund | Schedule of Portfolio Investments — continued December 31, 2021 | ||||||
(Unaudited)
Security Description | Shares | Value | |||||||||
New China Life Insurance Co. Ltd., Class H | 1,122,500 | $ | 3,003,473 | ||||||||
Postal Savings Bank of China Co. Ltd., Class H (c) | 3,841,000 | 2,697,419 | |||||||||
53,252,002 | |||||||||||
Industrials (0.1%): | |||||||||||
Zoomlion Heavy Industry Science and Technology Co. Ltd., Class H | 1,938,400 | 1,221,092 | |||||||||
Information Technology (0.2%): | |||||||||||
China Railway Signal & Communication Corp. Ltd., Class H (c) | 8,782,000 | 3,209,545 | |||||||||
Materials (0.1%): | |||||||||||
Anhui Conch Cement Co. Ltd., Class H | 598,500 | 2,993,651 | |||||||||
Real Estate (0.1%): | |||||||||||
Sunac China Holdings Ltd. | 964,000 | 1,458,323 | |||||||||
68,160,351 | |||||||||||
Colombia (0.1%): | |||||||||||
Utilities (0.1%): | |||||||||||
Interconexion Electrica SA ESP | 478,224 | 2,631,976 | |||||||||
Denmark (0.2%): | |||||||||||
Financials (0.2%): | |||||||||||
Tryg A/S | 157,630 | 3,890,441 | |||||||||
Finland (0.4%): | |||||||||||
Materials (0.2%): | |||||||||||
UPM-Kymmene Oyj | 88,861 | 3,380,726 | |||||||||
Utilities (0.2%): | |||||||||||
Fortum Oyj | 122,041 | 3,742,705 | |||||||||
7,123,431 | |||||||||||
France (1.6%): | |||||||||||
Communication Services (0.4%): | |||||||||||
Orange SA | 406,060 | 4,337,206 | |||||||||
Publicis Groupe SA | 50,601 | 3,408,880 | |||||||||
7,746,086 | |||||||||||
Energy (0.2%): | |||||||||||
TotalEnergies SE | 76,047 | 3,870,452 | |||||||||
Financials (0.6%): | |||||||||||
AXA SA | 134,317 | 3,997,344 | |||||||||
CNP Assurances | 158,026 | 3,908,436 | |||||||||
Credit Agricole SA | 206,574 | 2,944,918 | |||||||||
10,850,698 | |||||||||||
Health Care (0.2%): | |||||||||||
Sanofi | 45,753 | 4,590,615 | |||||||||
Industrials (0.2%): | |||||||||||
Bouygues SA | 89,842 | 3,215,689 | |||||||||
30,273,540 | |||||||||||
See notes to financial statements.
19
| Victory Portfolios II Victory Market Neutral Income Fund | Schedule of Portfolio Investments — continued December 31, 2021 | ||||||
(Unaudited)
Security Description | Shares | Value | |||||||||
Germany (0.9%): | |||||||||||
Financials (0.2%): | |||||||||||
Allianz SE, Registered Shares | 15,569 | $ | 3,671,747 | ||||||||
Materials (0.4%): | |||||||||||
BASF SE | 47,858 | 3,358,621 | |||||||||
Evonik Industries AG | 135,046 | 4,362,324 | |||||||||
7,720,945 | |||||||||||
Utilities (0.3%): | |||||||||||
E.ON SE | 332,190 | 4,616,166 | |||||||||
16,008,858 | |||||||||||
Hong Kong (1.9%): | |||||||||||
Industrials (0.3%): | |||||||||||
CK Hutchison Holdings Ltd. | 451,000 | 2,903,823 | |||||||||
SITC International Holdings Co. Ltd. | 335,000 | 1,211,629 | |||||||||
Xinyi Glass Holdings Ltd. | 334,000 | 836,638 | |||||||||
4,952,090 | |||||||||||
Materials (0.1%): | |||||||||||
China Resources Cement Holdings Ltd. | 3,594,000 | 2,718,344 | |||||||||
Real Estate (0.7%): | |||||||||||
CK Asset Holdings Ltd. | 488,500 | 3,081,540 | |||||||||
Henderson Land Development Co. Ltd. | 855,000 | 3,647,184 | |||||||||
New World Development Co. Ltd. | 755,000 | 2,989,349 | |||||||||
Sun Hung Kai Properties Ltd. | 264,500 | 3,209,612 | |||||||||
12,927,685 | |||||||||||
Utilities (0.8%): | |||||||||||
CK Infrastructure Holdings Ltd. | 646,500 | 4,119,122 | |||||||||
CLP Holdings Ltd. | 606,000 | 6,123,688 | |||||||||
Power Assets Holdings Ltd. (b) | 761,500 | 4,746,833 | |||||||||
14,989,643 | |||||||||||
35,587,762 | |||||||||||
Hungary (0.2%): | |||||||||||
Energy (0.2%): | |||||||||||
MOL Hungarian Oil & Gas PLC | 474,320 | 3,684,303 | |||||||||
India (1.7%): | |||||||||||
Communication Services (0.2%): | |||||||||||
Indus Towers Ltd. | 984,871 | 3,284,169 | |||||||||
Consumer Discretionary (0.2%): | |||||||||||
Bajaj Auto Ltd. | 73,499 | 3,203,421 | |||||||||
Consumer Staples (0.2%): | |||||||||||
ITC Ltd. | 1,452,408 | 4,249,945 | |||||||||
See notes to financial statements.
20
| Victory Portfolios II Victory Market Neutral Income Fund | Schedule of Portfolio Investments — continued December 31, 2021 | ||||||
(Unaudited)
Security Description | Shares | Value | |||||||||
Energy (0.4%): | |||||||||||
Bharat Petroleum Corp. Ltd. | 587,178 | $ | 3,036,169 | ||||||||
Hindustan Petroleum Corp. Ltd. | 899,397 | 3,528,146 | |||||||||
6,564,315 | |||||||||||
Materials (0.3%): | |||||||||||
Ambuja Cements Ltd. | 581,028 | 2,941,269 | |||||||||
Vedanta Ltd. | 550,669 | 2,518,710 | |||||||||
5,459,979 | |||||||||||
Utilities (0.4%): | |||||||||||
NTPC Ltd. | 2,306,395 | 3,848,460 | |||||||||
Power Grid Corp. of India Ltd. | 1,345,588 | 3,692,842 | |||||||||
7,541,302 | |||||||||||
30,303,131 | |||||||||||
Indonesia (0.4%): | |||||||||||
Communication Services (0.2%): | |||||||||||
PT Telkom Indonesia Persero Tbk | 13,180,300 | 3,762,346 | |||||||||
Consumer Staples (0.2%): | |||||||||||
PT Indofood Sukses Makmur Tbk | 8,715,800 | 3,870,742 | |||||||||
7,633,088 | |||||||||||
Ireland (0.3%): | |||||||||||
Information Technology (0.1%): | |||||||||||
Seagate Technology Holdings PLC | 25,926 | 2,929,119 | |||||||||
Materials (0.2%): | |||||||||||
Smurfit Kappa Group PLC | 56,446 | 3,110,815 | |||||||||
6,039,934 | |||||||||||
Italy (0.9%): | |||||||||||
Financials (0.2%): | |||||||||||
Poste Italiane SpA (c) | 264,050 | 3,458,808 | |||||||||
Utilities (0.7%): | |||||||||||
Enel SpA | 381,297 | 3,048,602 | |||||||||
Snam SpA | 833,438 | 5,019,481 | |||||||||
Terna — Rete Elettrica Nazionale | 546,164 | 4,417,863 | |||||||||
12,485,946 | |||||||||||
15,944,754 | |||||||||||
Japan (2.9%): | |||||||||||
Communication Services (0.9%): | |||||||||||
KDDI Corp. | 126,200 | 3,691,200 | |||||||||
Nintendo Co. Ltd. (b) | 5,600 | 2,620,457 | |||||||||
Nippon Telegraph & Telephone Corp. | 154,100 | 4,215,101 | |||||||||
Softbank Corp. | 412,700 | 5,213,545 | |||||||||
15,740,303 | |||||||||||
Consumer Discretionary (0.2%): | |||||||||||
Sekisui House Ltd. | 169,900 | 3,656,162 | |||||||||
See notes to financial statements.
21
| Victory Portfolios II Victory Market Neutral Income Fund | Schedule of Portfolio Investments — continued December 31, 2021 | ||||||
(Unaudited)
Security Description | Shares | Value | |||||||||
Consumer Staples (0.2%): | |||||||||||
Japan Tobacco, Inc. (a) | 216,900 | $ | 4,380,396 | ||||||||
Energy (0.2%): | |||||||||||
ENEOS Holdings, Inc. | 804,000 | 3,004,115 | |||||||||
Financials (0.7%): | |||||||||||
Mizuho Financial Group, Inc. | 265,400 | 3,371,499 | |||||||||
Nomura Holdings, Inc. | 512,100 | 2,230,917 | |||||||||
Sumitomo Mitsui Financial Group, Inc. | 95,200 | 3,251,389 | |||||||||
Tokio Marine Holdings, Inc. | 70,500 | 3,925,392 | |||||||||
12,779,197 | |||||||||||
Health Care (0.2%): | |||||||||||
Takeda Pharmaceutical Co. Ltd. | 118,300 | 3,231,135 | |||||||||
Industrials (0.5%): | |||||||||||
Marubeni Corp. | 305,600 | 2,977,978 | |||||||||
Mitsubishi Corp. | 116,500 | 3,699,881 | |||||||||
Mitsui & Co. Ltd. | 121,200 | 2,872,682 | |||||||||
9,550,541 | |||||||||||
52,341,849 | |||||||||||
Korea, Republic Of (0.6%): | |||||||||||
Communication Services (0.1%): | |||||||||||
SK Telecom Co. Ltd. | 30,077 | 1,461,819 | |||||||||
Financials (0.3%): | |||||||||||
KB Financial Group, Inc. | 54,468 | 2,519,153 | |||||||||
Shinhan Financial Group Co. Ltd. | 90,036 | 2,782,378 | |||||||||
5,301,531 | |||||||||||
Information Technology (0.0%): (d) | |||||||||||
SK Square Co. Ltd. (e) | 19,442 | 1,086,109 | |||||||||
Materials (0.1%): | |||||||||||
POSCO | 7,335 | 1,701,105 | |||||||||
Utilities (0.1%): | |||||||||||
Korea Electric Power Corp. | 121,831 | 2,262,406 | |||||||||
11,812,970 | |||||||||||
Luxembourg (0.2%): | |||||||||||
Materials (0.2%): | |||||||||||
Orion Engineered Carbons SA (e) | 182,499 | 3,350,682 | |||||||||
Malaysia (0.9%): | |||||||||||
Health Care (0.2%): | |||||||||||
Hartalega Holdings Bhd | 1,138,500 | 1,567,148 | |||||||||
Top Glove Corp. Bhd | 2,082,000 | 1,294,921 | |||||||||
2,862,069 | |||||||||||
See notes to financial statements.
22
| Victory Portfolios II Victory Market Neutral Income Fund | Schedule of Portfolio Investments — continued December 31, 2021 | ||||||
(Unaudited)
Security Description | Shares | Value | |||||||||
Industrials (0.4%): | |||||||||||
MISC Bhd | 2,510,300 | $ | 4,246,058 | ||||||||
Sime Darby Bhd | 6,571,700 | 3,664,158 | |||||||||
7,910,216 | |||||||||||
Utilities (0.3%): | |||||||||||
Tenaga Nasional Bhd | 2,240,700 | 5,025,138 | |||||||||
15,797,423 | |||||||||||
Mexico (0.6%): | |||||||||||
Consumer Staples (0.5%): | |||||||||||
Arca Continental SAB de CV | 782,956 | 4,992,033 | |||||||||
Kimberly-Clark de Mexico SAB de CV, Class A | 2,430,569 | 3,681,907 | |||||||||
8,673,940 | |||||||||||
Materials (0.1%): | |||||||||||
Grupo Mexico SAB de CV, Class B | 537,271 | 2,343,470 | |||||||||
11,017,410 | |||||||||||
Netherlands (0.7%): | |||||||||||
Communication Services (0.2%): | |||||||||||
Koninklijke KPN NV | 1,082,234 | 3,355,293 | |||||||||
Consumer Staples (0.2%): | |||||||||||
X5 Retail Group NV, GDR | 121,076 | 3,206,048 | |||||||||
Financials (0.2%): | |||||||||||
NN Group NV | 75,943 | 4,106,640 | |||||||||
Materials (0.1%): | |||||||||||
LyondellBasell Industries NV, Class A | 29,169 | 2,690,257 | |||||||||
13,358,238 | |||||||||||
Norway (0.7%): | |||||||||||
Communication Services (0.3%): | |||||||||||
Telenor ASA | 294,462 | 4,630,586 | |||||||||
Financials (0.2%): | |||||||||||
DNB Bank ASA | 171,406 | 3,922,322 | |||||||||
Materials (0.2%): | |||||||||||
Yara International ASA | 72,928 | 3,678,422 | |||||||||
12,231,330 | |||||||||||
Peru (0.2%): | |||||||||||
Financials (0.2%): | |||||||||||
Credicorp Ltd. | 23,025 | 2,810,662 | |||||||||
Philippines (0.6%): | |||||||||||
Communication Services (0.4%): | |||||||||||
Globe Telecom, Inc. | 53,685 | 3,500,931 | |||||||||
PLDT, Inc. | 111,635 | 3,967,841 | |||||||||
7,468,772 | |||||||||||
See notes to financial statements.
23
| Victory Portfolios II Victory Market Neutral Income Fund | Schedule of Portfolio Investments — continued December 31, 2021 | ||||||
(Unaudited)
Security Description | Shares | Value | |||||||||
Utilities (0.2%): | |||||||||||
Manila Electric Co. | 756,000 | $ | 4,376,195 | ||||||||
11,844,967 | |||||||||||
Poland (0.2%): | |||||||||||
Energy (0.2%): | |||||||||||
Polski Koncern Naftowy ORLEN SA | 175,585 | 3,238,178 | |||||||||
Portugal (0.2%): | |||||||||||
Utilities (0.2%): | |||||||||||
EDP — Energias de Portugal SA | 550,051 | 3,021,319 | |||||||||
Russian Federation (2.8%): | |||||||||||
Communication Services (0.7%): | |||||||||||
Mobile TeleSystems PJSC | 1,616,610 | 6,436,919 | |||||||||
Rostelecom PJSC (b) | 4,684,670 | 5,442,511 | |||||||||
11,879,430 | |||||||||||
Consumer Staples (0.3%): | |||||||||||
Magnit PJSC | 64,672 | 4,685,062 | |||||||||
Energy (0.2%): | |||||||||||
Tatneft PJSC | 574,124 | 3,821,660 | |||||||||
Financials (0.2%): | |||||||||||
Moscow Exchange MICEX-RTS PJSC | 1,807,050 | 3,681,309 | |||||||||
Materials (0.9%): | |||||||||||
Magnitogorsk Iron & Steel Works PJSC | 3,242,300 | 2,994,273 | |||||||||
MMC Norilsk Nickel PJSC | 10,324 | 3,146,465 | |||||||||
Novolipetsk Steel PJSC | 1,024,720 | 2,969,313 | |||||||||
Polyus PJSC | 23,871 | 4,175,096 | |||||||||
Severstal PAO | 155,364 | 3,320,738 | |||||||||
16,605,885 | |||||||||||
Utilities (0.5%): | |||||||||||
Inter RAO UES PJSC | 88,989,500 | 5,058,715 | |||||||||
RusHydro PJSC | 481,760,000 | 4,756,884 | |||||||||
9,815,599 | |||||||||||
50,488,945 | |||||||||||
South Africa (1.1%): | |||||||||||
Communication Services (0.2%): | |||||||||||
Vodacom Group Ltd. | 473,033 | 3,995,503 | |||||||||
Energy (0.1%): | |||||||||||
Exxaro Resources Ltd. | 231,545 | 2,222,528 | |||||||||
Financials (0.2%): | |||||||||||
Sanlam Ltd. | 995,531 | 3,712,512 | |||||||||
Materials (0.6%): | |||||||||||
African Rainbow Minerals Ltd. | 144,775 | 2,100,322 | |||||||||
Anglo American Platinum Ltd. | 20,702 | 2,362,783 | |||||||||
Impala Platinum Holdings Ltd. | 144,647 | 2,041,855 | |||||||||
See notes to financial statements.
24
| Victory Portfolios II Victory Market Neutral Income Fund | Schedule of Portfolio Investments — continued December 31, 2021 | ||||||
(Unaudited)
Security Description | Shares | Value | |||||||||
Kumba Iron Ore Ltd. | 53,867 | $ | 1,554,512 | ||||||||
Sibanye Stillwater Ltd. | 542,160 | 1,686,872 | |||||||||
9,746,344 | |||||||||||
19,676,887 | |||||||||||
Spain (0.5%): | |||||||||||
Communication Services (0.1%): | |||||||||||
Telefonica SA (a) | 571,259 | 2,476,870 | |||||||||
Energy (0.2%): | |||||||||||
Repsol SA | 218,559 | 2,588,184 | |||||||||
Utilities (0.2%): | |||||||||||
Endesa SA | 145,902 | 3,358,563 | |||||||||
8,423,617 | |||||||||||
Switzerland (1.4%): | |||||||||||
Communication Services (0.3%): | |||||||||||
Swisscom AG, Registered Shares | 8,669 | 4,892,002 | |||||||||
Financials (0.7%): | |||||||||||
Swiss Life Holding AG | 7,775 | 4,751,911 | |||||||||
Swiss Re AG | 41,127 | 4,061,128 | |||||||||
Zurich Insurance Group AG | 10,193 | 4,466,810 | |||||||||
13,279,849 | |||||||||||
Health Care (0.2%): | |||||||||||
Novartis AG, Registered Shares | 55,374 | 4,867,428 | |||||||||
Materials (0.2%): | |||||||||||
Holcim Ltd. | 68,405 | 3,480,161 | |||||||||
26,519,440 | |||||||||||
Taiwan (4.1%): | |||||||||||
Communication Services (0.9%): | |||||||||||
Far EasTone Telecommunications Co. Ltd. | 3,652,000 | 8,522,854 | |||||||||
Taiwan Mobile Co. Ltd. | 2,129,000 | 7,691,724 | |||||||||
16,214,578 | |||||||||||
Financials (0.9%): | |||||||||||
Mega Financial Holding Co. Ltd. | 5,490,000 | 7,053,187 | |||||||||
SinoPac Financial Holdings Co. Ltd. | 10,343,000 | 6,034,126 | |||||||||
Yuanta Financial Holding Co. Ltd. | 4,318,000 | 3,945,634 | |||||||||
17,032,947 | |||||||||||
Industrials (0.2%): | |||||||||||
Far Eastern New Century Corp. | 3,488,000 | 3,689,980 | |||||||||
Information Technology (1.6%): | |||||||||||
Asustek Computer, Inc. | 278,000 | 3,775,344 | |||||||||
Catcher Technology Co. Ltd. | 672,000 | 3,800,316 | |||||||||
Compal Electronics, Inc. (b) | 4,533,000 | 3,964,194 | |||||||||
Lite-On Technology Corp. | 1,561,000 | 3,595,887 | |||||||||
MediaTek, Inc. | 71,000 | 3,047,678 | |||||||||
See notes to financial statements.
25
| Victory Portfolios II Victory Market Neutral Income Fund | Schedule of Portfolio Investments — continued December 31, 2021 | ||||||
(Unaudited)
Security Description | Shares | Value | |||||||||
Micro-Star International Co. Ltd. | 524,000 | $ | 3,036,087 | ||||||||
Pegatron Corp. | 1,718,000 | 4,288,129 | |||||||||
Quanta Computer, Inc. (b) | 1,417,000 | 4,841,126 | |||||||||
30,348,761 | |||||||||||
Materials (0.5%): | |||||||||||
Asia Cement Corp. | 2,848,000 | 4,555,119 | |||||||||
Taiwan Cement Corp. (b) | 2,382,000 | 4,129,844 | |||||||||
8,684,963 | |||||||||||
75,971,229 | |||||||||||
Thailand (0.4%): | |||||||||||
Energy (0.2%): | |||||||||||
PTT Exploration & Production PCL | 1,110,100 | 3,914,290 | |||||||||
Materials (0.2%): | |||||||||||
The Siam Cement PCL | 369,300 | 4,270,295 | |||||||||
8,184,585 | |||||||||||
Turkey (0.3%): | |||||||||||
Communication Services (0.2%): | |||||||||||
Turkcell Iletisim Hizmetleri A/S (a) | 1,968,823 | 2,749,779 | |||||||||
Materials (0.1%): | |||||||||||
Eregli Demir ve Celik Fabrikalari TAS | 1,209,605 | 2,583,111 | |||||||||
5,332,890 | |||||||||||
United Kingdom (3.2%): | |||||||||||
Consumer Discretionary (0.1%): | |||||||||||
Persimmon PLC | 64,847 | 2,512,959 | |||||||||
Consumer Staples (0.8%): | |||||||||||
British American Tobacco PLC | 93,915 | 3,486,603 | |||||||||
Imperial Brands PLC | 154,936 | 3,394,785 | |||||||||
Tesco PLC | 1,165,486 | 4,587,788 | |||||||||
Unilever PLC | 72,951 | 3,912,865 | |||||||||
15,382,041 | |||||||||||
Energy (0.3%): | |||||||||||
| BP PLC | 567,203 | 2,540,969 | |||||||||
Royal Dutch Shell PLC, Class A | 134,968 | 2,957,216 | |||||||||
5,498,185 | |||||||||||
Financials (0.5%): | |||||||||||
Admiral Group PLC | 78,515 | 3,360,192 | |||||||||
Aviva PLC | 627,090 | 3,494,885 | |||||||||
Legal & General Group PLC | 739,069 | 2,984,046 | |||||||||
9,839,123 | |||||||||||
Health Care (0.3%): | |||||||||||
GlaxoSmithKline PLC (b) | 213,361 | 4,644,628 | |||||||||
Industrials (0.2%): | |||||||||||
BAE Systems PLC | 515,785 | 3,845,624 | |||||||||
See notes to financial statements.
26
| Victory Portfolios II Victory Market Neutral Income Fund | Schedule of Portfolio Investments — continued December 31, 2021 | ||||||
(Unaudited)
Security Description | Shares | Value | |||||||||
Materials (0.5%): | |||||||||||
Anglo American PLC | 44,208 | $ | 1,818,049 | ||||||||
BHP Group PLC | 81,439 | 2,422,762 | |||||||||
Evraz PLC (b) | 277,775 | 2,270,632 | |||||||||
Rio Tinto PLC | 31,846 | 2,099,751 | |||||||||
8,611,194 | |||||||||||
Utilities (0.5%): | |||||||||||
National Grid PLC | 351,122 | 5,062,026 | |||||||||
SSE PLC | 141,769 | 3,168,706 | |||||||||
8,230,732 | |||||||||||
58,564,486 | |||||||||||
United States (43.5%): | |||||||||||
Communication Services (0.9%): | |||||||||||
Omnicom Group, Inc. | 47,862 | 3,506,848 | |||||||||
Telephone & Data Systems, Inc. | 182,552 | 3,678,423 | |||||||||
The Interpublic Group of Cos., Inc. | 81,153 | 3,039,180 | |||||||||
Verizon Communications, Inc. | 115,649 | 6,009,122 | |||||||||
16,233,573 | |||||||||||
Consumer Discretionary (3.5%): | |||||||||||
Big 5 Sporting Goods Corp. (a) | 57,171 | 1,086,821 | |||||||||
Big Lots, Inc. | 49,836 | 2,245,112 | |||||||||
Ethan Allen Interiors, Inc. (a) | 134,787 | 3,543,550 | |||||||||
Franchise Group, Inc. (a) | 107,115 | 5,587,118 | |||||||||
Genuine Parts Co. | 32,237 | 4,519,627 | |||||||||
Guess?, Inc. | 103,590 | 2,453,011 | |||||||||
Hasbro, Inc. | 36,533 | 3,718,329 | |||||||||
Haverty Furniture Cos., Inc. (a) | 80,727 | 2,467,824 | |||||||||
Jack in the Box, Inc. | 40,321 | 3,527,281 | |||||||||
La-Z-Boy, Inc. | 106,747 | 3,875,984 | |||||||||
Monro, Inc. | 64,049 | 3,732,135 | |||||||||
Newell Brands, Inc. | 123,106 | 2,688,635 | |||||||||
Oxford Industries, Inc. | 35,481 | 3,602,031 | |||||||||
Standard Motor Products, Inc. | 97,343 | 5,099,800 | |||||||||
Strategic Education, Inc. | 45,984 | 2,659,715 | |||||||||
Sturm Ruger & Co., Inc. (a) (b) | 48,878 | 3,324,681 | |||||||||
The Buckle, Inc. (a) | 81,747 | 3,458,716 | |||||||||
VF Corp. | 39,639 | 2,902,368 | |||||||||
Whirlpool Corp. | 14,039 | 3,294,392 | |||||||||
63,787,130 | |||||||||||
Consumer Staples (6.5%): | |||||||||||
Altria Group, Inc. | 84,443 | 4,001,754 | |||||||||
Archer-Daniels-Midland Co. | 73,640 | 4,977,328 | |||||||||
B&G Foods, Inc. (a) | 94,753 | 2,911,760 | |||||||||
Bunge Ltd. | 42,349 | 3,953,703 | |||||||||
Calavo Growers, Inc. | 88,022 | 3,732,133 | |||||||||
Campbell Soup Co. | 94,640 | 4,113,054 | |||||||||
Conagra Brands, Inc. | 132,380 | 4,520,777 | |||||||||
See notes to financial statements.
27
| Victory Portfolios II Victory Market Neutral Income Fund | Schedule of Portfolio Investments — continued December 31, 2021 | ||||||
(Unaudited)
Security Description | Shares | Value | |||||||||
Costco Wholesale Corp. | 12,211 | $ | 6,932,185 | ||||||||
Energizer Holdings, Inc. | 125,653 | 5,038,685 | |||||||||
General Mills, Inc. | 83,382 | 5,618,279 | |||||||||
Kellogg Co. | 74,032 | 4,769,141 | |||||||||
Kimberly-Clark Corp. | 40,405 | 5,774,683 | |||||||||
Medifast, Inc. | 12,298 | 2,575,570 | |||||||||
Nu Skin Enterprises, Inc., Class A (a) | 72,536 | 3,681,202 | |||||||||
PepsiCo, Inc. | 39,813 | 6,915,916 | |||||||||
Philip Morris International, Inc. | 53,246 | 5,058,370 | |||||||||
SpartanNash Co. | 196,525 | 5,062,484 | |||||||||
The Andersons, Inc. | 101,853 | 3,942,730 | |||||||||
The Clorox Co. | 21,959 | 3,828,771 | |||||||||
The Coca-Cola Co. | 107,988 | 6,393,969 | |||||||||
The J.M. Smucker Co. | 34,154 | 4,638,796 | |||||||||
The Kraft Heinz Co. | 115,913 | 4,161,277 | |||||||||
Universal Corp. | 96,121 | 5,278,965 | |||||||||
Vector Group Ltd. | 239,329 | 2,747,497 | |||||||||
Walgreens Boots Alliance, Inc. | 64,887 | 3,384,506 | |||||||||
Weis Markets, Inc. (a) (b) | 75,147 | 4,950,684 | |||||||||
118,964,219 | |||||||||||
Energy (1.4%): | |||||||||||
Altus Midstream Co., Class A | 42,168 | 2,585,320 | |||||||||
Archrock, Inc. | 452,913 | 3,387,789 | |||||||||
Chevron Corp. | 35,693 | 4,188,574 | |||||||||
ConocoPhillips | 44,160 | 3,187,469 | |||||||||
Devon Energy Corp. | 58,145 | 2,561,287 | |||||||||
Kinder Morgan, Inc. | 214,407 | 3,400,495 | |||||||||
ONEOK, Inc. | 53,599 | 3,149,477 | |||||||||
The Williams Cos., Inc. | 154,085 | 4,012,374 | |||||||||
26,472,785 | |||||||||||
Financials (9.8%): | |||||||||||
American Financial Group, Inc. | 19,119 | 2,625,421 | |||||||||
American International Group, Inc. | 55,010 | 3,127,869 | |||||||||
Apollo Global Management, Inc. (a) | 54,612 | 3,955,547 | |||||||||
Blackstone, Inc. | 31,062 | 4,019,112 | |||||||||
Brookline Bancorp, Inc. | 300,718 | 4,868,624 | |||||||||
Citigroup, Inc. | 45,744 | 2,762,480 | |||||||||
Citizens Financial Group, Inc. | 61,585 | 2,909,891 | |||||||||
CME Group, Inc. | 19,869 | 4,539,272 | |||||||||
CNA Financial Corp. | 90,622 | 3,994,618 | |||||||||
Columbia Banking System, Inc. | 104,434 | 3,417,080 | |||||||||
CVB Financial Corp. | 218,311 | 4,674,039 | |||||||||
Federal Agricultural Mortgage Corp., Class C | 44,444 | 5,507,945 | |||||||||
Fidelity National Financial, Inc. | 72,101 | 3,762,230 | |||||||||
Fifth Third Bancorp | 72,937 | 3,176,406 | |||||||||
First Busey Corp. | 182,250 | 4,942,620 | |||||||||
First Commonwealth Financial Corp. | 298,930 | 4,809,784 | |||||||||
First Financial Bancorp | 153,408 | 3,740,087 | |||||||||
First Interstate BancSystem, Inc., Class A | 101,608 | 4,132,397 | |||||||||
See notes to financial statements.
28
| Victory Portfolios II Victory Market Neutral Income Fund | Schedule of Portfolio Investments — continued December 31, 2021 | ||||||
(Unaudited)
Security Description | Shares | Value | |||||||||
Franklin Resources, Inc. | 80,630 | $ | 2,700,299 | ||||||||
Fulton Financial Corp. | 256,900 | 4,367,300 | |||||||||
Heritage Financial Corp. | 162,485 | 3,971,133 | |||||||||
Hope Bancorp, Inc. | 267,779 | 3,939,029 | |||||||||
Huntington Bancshares, Inc. | 179,275 | 2,764,421 | |||||||||
KeyCorp | 136,059 | 3,147,045 | |||||||||
Lincoln National Corp. | 35,634 | 2,432,377 | |||||||||
M&T Bank Corp. | 20,590 | 3,162,212 | |||||||||
MetLife, Inc. | 55,732 | 3,482,693 | |||||||||
Northern Trust Corp. | 30,101 | 3,600,381 | |||||||||
Northwest Bancshares, Inc. (b) | 416,550 | 5,898,348 | |||||||||
OceanFirst Financial Corp. | 191,405 | 4,249,191 | |||||||||
Old National Bancorp | 294,582 | 5,337,826 | |||||||||
Park National Corp. (a) | 36,465 | 5,007,009 | |||||||||
Premier Financial Corp. | 125,976 | 3,893,918 | |||||||||
Principal Financial Group, Inc. | 48,276 | 3,491,803 | |||||||||
Provident Financial Services, Inc. | 189,845 | 4,598,046 | |||||||||
Prudential Financial, Inc. | 33,393 | 3,614,458 | |||||||||
Regions Financial Corp. | 135,653 | 2,957,235 | |||||||||
S&T Bancorp, Inc. | 127,721 | 4,025,766 | |||||||||
Safety Insurance Group, Inc. (b) | 68,353 | 5,812,056 | |||||||||
Sculptor Capital Management, Inc. | 105,547 | 2,253,428 | |||||||||
Southside Bancshares, Inc. (b) | 122,233 | 5,111,784 | |||||||||
The PNC Financial Services Group, Inc. | 17,770 | 3,563,240 | |||||||||
Truist Financial Corp. | 55,121 | 3,227,335 | |||||||||
U.S. Bancorp | 58,783 | 3,301,841 | |||||||||
UWM Holdings Corp. (a) | 221,187 | 1,309,427 | |||||||||
Washington Trust Bancorp, Inc. | 80,642 | 4,545,790 | |||||||||
WesBanco, Inc. | 114,490 | 4,006,005 | |||||||||
180,736,818 | |||||||||||
Health Care (2.4%): | |||||||||||
AbbVie, Inc. | 39,265 | 5,316,481 | |||||||||
Amgen, Inc. | 19,544 | 4,396,814 | |||||||||
Cardinal Health, Inc. | 61,297 | 3,156,182 | |||||||||
Gilead Sciences, Inc. (b) | 61,244 | 4,446,927 | |||||||||
Johnson & Johnson (b) | 35,453 | 6,064,945 | |||||||||
Merck & Co., Inc. | 68,510 | 5,250,606 | |||||||||
National HealthCare Corp. (b) | 55,730 | 3,786,296 | |||||||||
Patterson Cos., Inc. (b) | 124,877 | 3,665,140 | |||||||||
Pfizer, Inc. | 94,757 | 5,595,401 | |||||||||
Phibro Animal Health Corp., Class A | 159,305 | 3,253,008 | |||||||||
44,931,800 | |||||||||||
Industrials (5.1%): | |||||||||||
3M Co. | 25,382 | 4,508,605 | |||||||||
ACCO Brands Corp. | 384,276 | 3,174,120 | |||||||||
Apogee Enterprises, Inc. | 78,819 | 3,795,135 | |||||||||
Argan, Inc. | 104,151 | 4,029,602 | |||||||||
Brady Corp., Class A | 98,652 | 5,317,343 | |||||||||
Deluxe Corp. (a) | 84,400 | 2,710,084 | |||||||||
See notes to financial statements.
29
| Victory Portfolios II Victory Market Neutral Income Fund | Schedule of Portfolio Investments — continued December 31, 2021 | ||||||
(Unaudited)
Security Description | Shares | Value | |||||||||
Douglas Dynamics, Inc. | 98,544 | $ | 3,849,129 | ||||||||
Global Industrial Co. | 78,109 | 3,194,658 | |||||||||
H&E Equipment Services, Inc. | 83,378 | 3,691,144 | |||||||||
Healthcare Services Group | 134,077 | 2,385,230 | |||||||||
Heidrick & Struggles International, Inc. | 92,617 | 4,050,142 | |||||||||
HNI Corp. | 100,186 | 4,212,821 | |||||||||
Hyster-Yale Materials Handling, Inc. | 47,183 | 1,939,221 | |||||||||
Kforce, Inc. | 74,579 | 5,609,832 | |||||||||
Lockheed Martin Corp. | 14,900 | 5,295,609 | |||||||||
Matthews International Corp., Class A | 111,675 | 4,095,122 | |||||||||
McGrath RentCorp | 64,003 | 5,136,881 | |||||||||
Pitney Bowes, Inc. | 143,786 | 953,301 | |||||||||
Rush Enterprises, Inc., Class A | 98,402 | 5,475,087 | |||||||||
Steelcase, Inc., Class A (a) | 253,445 | 2,970,375 | |||||||||
The Gorman-Rupp Co. | 119,820 | 5,337,981 | |||||||||
The Greenbrier Cos., Inc. (a) | 72,140 | 3,310,505 | |||||||||
Wabash National Corp. | 227,729 | 4,445,270 | |||||||||
Watsco, Inc. | 13,190 | 4,126,887 | |||||||||
93,614,084 | |||||||||||
Information Technology (3.3%): | |||||||||||
ADTRAN, Inc. | 130,358 | 2,976,073 | |||||||||
American Software, Inc., Class A | 93,223 | 2,439,646 | |||||||||
Benchmark Electronics, Inc. (a) | 164,214 | 4,450,199 | |||||||||
Broadcom, Inc. | 6,360 | 4,232,008 | |||||||||
Cass Information Systems, Inc. | 115,077 | 4,524,828 | |||||||||
Cisco Systems, Inc. | 86,813 | 5,501,340 | |||||||||
Corning, Inc. | 86,834 | 3,232,830 | |||||||||
CSG Systems International, Inc. (a) | 130,259 | 7,505,524 | |||||||||
Hewlett Packard Enterprise Co. | 216,686 | 3,417,138 | |||||||||
HP, Inc. | 106,943 | 4,028,543 | |||||||||
Intel Corp. | 50,513 | 2,601,419 | |||||||||
InterDigital, Inc. | 60,219 | 4,313,487 | |||||||||
International Business Machines Corp. | 28,637 | 3,827,621 | |||||||||
Kyndryl Holdings, Inc. (e) | 5,728 | 103,677 | |||||||||
Progress Software Corp. | 100,082 | 4,830,958 | |||||||||
SolarWinds Corp. | 147,568 | 2,093,990 | |||||||||
60,079,281 | |||||||||||
Materials (2.1%): | |||||||||||
Dow, Inc. | 48,449 | 2,748,027 | |||||||||
Eastman Chemical Co. | 29,409 | 3,555,842 | |||||||||
Glatfelter Corp. | 247,485 | 4,256,742 | |||||||||
International Paper Co. | 61,314 | 2,880,532 | |||||||||
Kronos Worldwide, Inc. | 309,093 | 4,639,486 | |||||||||
Myers Industries, Inc. | 176,109 | 3,523,941 | |||||||||
Newmont Corp. | 56,971 | 3,533,341 | |||||||||
Packaging Corp. of America | 29,182 | 3,973,129 | |||||||||
Schnitzer Steel Industries, Inc. | 52,703 | 2,736,340 | |||||||||
Schweitzer-Mauduit International, Inc. | 98,905 | 2,957,259 | |||||||||
See notes to financial statements.
30
| Victory Portfolios II Victory Market Neutral Income Fund | Schedule of Portfolio Investments — continued December 31, 2021 | ||||||
(Unaudited)
Security Description | Shares | Value | |||||||||
Sylvamo Corp. (e) | 5,576 | $ | 155,515 | ||||||||
Worthington Industries, Inc. (a) | 56,416 | 3,083,699 | |||||||||
38,043,853 | |||||||||||
Real Estate (0.4%): | |||||||||||
Douglas Elliman, Inc. (e) | 119,665 | 1,376,142 | |||||||||
RE/MAX Holdings, Inc. | 119,120 | 3,631,969 | |||||||||
The RMR Group, Inc., Class A | 82,353 | 2,856,002 | |||||||||
7,864,113 | |||||||||||
Utilities (8.1%): | |||||||||||
Alliant Energy Corp. | 80,876 | 4,971,448 | |||||||||
American Electric Power Co., Inc. (b) | 59,616 | 5,304,036 | |||||||||
Avangrid, Inc. (a) | 88,955 | 4,437,075 | |||||||||
Avista Corp. | 135,469 | 5,756,078 | |||||||||
Chesapeake Utilities Corp. | 45,229 | 6,594,840 | |||||||||
CMS Energy Corp. | 78,398 | 5,099,790 | |||||||||
Consolidated Edison, Inc. (b) | 71,613 | 6,110,021 | |||||||||
Dominion Energy, Inc. | 67,222 | 5,280,960 | |||||||||
DTE Energy Co. | �� | 43,357 | 5,182,896 | ||||||||
Duke Energy Corp. (b) | 53,335 | 5,594,842 | |||||||||
Edison International | 73,470 | 5,014,328 | |||||||||
Entergy Corp. | 40,433 | 4,554,777 | |||||||||
Evergy, Inc. (b) | 70,419 | 4,831,448 | |||||||||
Exelon Corp. | 96,494 | 5,573,493 | |||||||||
FirstEnergy Corp. | 114,003 | 4,741,385 | |||||||||
MGE Energy, Inc. | 78,961 | 6,494,542 | |||||||||
Northwest Natural Holding Co. | 81,437 | 3,972,497 | |||||||||
NRG Energy, Inc. | 49,344 | 2,125,740 | |||||||||
Otter Tail Corp. (b) | 111,962 | 7,996,326 | |||||||||
PPL Corp. | 171,018 | 5,140,801 | |||||||||
Public Service Enterprise Group, Inc. | 73,559 | 4,908,592 | |||||||||
Sempra Energy | 34,622 | 4,579,798 | |||||||||
SJW Group | 82,819 | 6,062,351 | |||||||||
South Jersey Industries, Inc. | 136,723 | 3,571,205 | |||||||||
The Southern Co. (b) | 83,090 | 5,698,312 | |||||||||
The York Water Co. | 98,280 | 4,892,378 | |||||||||
Unitil Corp. (b) | 87,872 | 4,041,233 | |||||||||
WEC Energy Group, Inc. (b) | 49,730 | 4,827,291 | |||||||||
Xcel Energy, Inc. (b) | 70,673 | 4,784,562 | |||||||||
148,143,045 | |||||||||||
798,870,701 | |||||||||||
Total Common Stocks (Cost $1,465,461,083) | 1,539,477,891 | ||||||||||
Collateral for Securities Loaned^ (3.4%) | |||||||||||
United States (3.4%): | |||||||||||
BlackRock Liquidity Funds TempFund, Institutional Shares, 0.04% (f) | 1,467,834 | 1,467,834 | |||||||||
| Fidelity Investments Money Market Government Portfolio, Institutional Shares, 0.01% (f) | 28,828,442 | 28,828,442 | |||||||||
See notes to financial statements.
31
| Victory Portfolios II Victory Market Neutral Income Fund | Schedule of Portfolio Investments — continued December 31, 2021 | ||||||
(Unaudited)
Security Description | Shares | Value | |||||||||
| Goldman Sachs Financial Square Prime Obligations Fund, Institutional Shares, 0.02% (f) | 732,521 | $ | 732,521 | ||||||||
JPMorgan Prime Money Market Fund, Capital Shares, 0.07% (f) | 5,840,899 | 5,840,899 | |||||||||
| Morgan Stanley Institutional Liquidity Prime Portfolio, Institutional Shares, 0.06% (f) | 26,261,820 | 26,261,820 | |||||||||
Total Collateral for Securities Loaned (Cost $63,131,516) | 63,131,516 | ||||||||||
Total Investments (Cost $1,528,592,599) — 87.3% | 1,602,609,407 | ||||||||||
Other assets in excess of liabilities — 12.7% | 232,229,161 | ||||||||||
NET ASSETS — 100.00% | $ | 1,834,838,568 | |||||||||
^ Purchased with cash collateral from securities on loan.
(a) All or a portion of this security is on loan.
(b) All or a portion of this security has been segregated as collateral for derivative instruments.
(c) Rule 144A security or other security that is restricted as to resale to institutional investors. The Fund's Adviser has deemed this security to be liquid (unless otherwise noted as illiquid) based upon procedures approved by the Board of Trustees. As of December 31, 2021, the fair value of these securities was $16,462,628 and amounted to 0.9% of net assets.
(d) Amount represents less than 0.05% of net assets.
(e) Non-income producing security.
(f) Rate disclosed is the daily yield on December 31, 2021.
GDR — Global Depositary Receipt
PCL — Public Company Limited
PLC — Public Limited Company
Futures Contracts Purchased | |||||||||||||||||||||||
| Number of Contracts | Expiration Date | Notional Amount | Value | Unrealized Appreciation (Depreciation) | |||||||||||||||||||
NASDAQ 100 E-Mini Futures | 3,059 | 3/18/22 | $ | 1,001,616,797 | $ | 998,503,485 | $ | (3,113,312 | ) | ||||||||||||||
Futures Contracts Sold | |||||||||||||||||||||||
| Number of Contracts | Expiration Date | Notional Amount | Value | Unrealized Appreciation (Depreciation) | |||||||||||||||||||
| E-Mini MSCI EAFE Index Futures | 2,071 | 3/18/22 | $ | 236,714,372 | $ | 240,422,390 | $ | (3,708,018 | ) | ||||||||||||||
| E-Mini MSCI Emerging Markets Index Futures | 2,939 | 3/18/22 | 181,671,929 | 180,204,785 | 1,467,144 | ||||||||||||||||||
| E-Mini Russell 2000 Index Futures | 2,877 | 3/18/22 | 324,042,940 | 322,626,780 | 1,416,160 | ||||||||||||||||||
E-Mini S&P 500 Futures | 6,019 | 3/18/22 | 1,411,917,883 | 1,432,070,575 | (20,152,692 | ) | |||||||||||||||||
$ | (20,977,406 | ) | |||||||||||||||||||||
Total unrealized appreciation | $ | 2,883,304 | |||||||||||||||||||||
Total unrealized depreciation | (26,974,022 | ) | |||||||||||||||||||||
Total net unrealized appreciation (depreciation) | $ | (24,090,718 | ) | ||||||||||||||||||||
See notes to financial statements.
32
Victory Portfolios II | Statements of Assets and Liabilities December 31, 2021 | ||||||
(Unaudited)
| Victory US 500 Enhanced Volatility Wtd Index Fund | Victory Market Neutral Income Fund | ||||||||||
Assets: | |||||||||||
Investments, at value (Cost $47,152,506 and $1,528,592,599) | $ | 73,060,058 | (a) | $ | 1,602,609,407 | (b) | |||||
Foreign currency, at value (Cost $— and $298,088) | — | 300,851 | |||||||||
Cash | — | 171,515,143 | |||||||||
Deposit with broker for futures contracts | 194,568 | 117,832,366 | |||||||||
Receivables: | |||||||||||
Interest and dividends | 67,595 | 3,010,479 | |||||||||
Capital shares issued | 200 | 4,479,039 | |||||||||
Variation margin on open futures contracts | — | 5,862,265 | |||||||||
Reclaims | — | 147,746 | |||||||||
From Adviser | 33,815 | 439,201 | |||||||||
Prepaid expenses | 18,016 | 102,915 | |||||||||
Total Assets | 73,374,252 | 1,906,299,412 | |||||||||
Liabilities: | |||||||||||
Payables: | |||||||||||
Collateral received on loaned securities | 1,330,411 | 63,131,516 | |||||||||
Capital shares redeemed | 22,339 | 774,914 | |||||||||
Variation margin on open futures contracts | 2,062 | 6,659,132 | |||||||||
Accrued foreign capital gains taxes | — | 81,246 | |||||||||
Accrued expenses and other payables: | |||||||||||
Investment advisory fees | 41,759 | 522,537 | |||||||||
Administration fees | 3,627 | 84,710 | |||||||||
Custodian fees | 1,973 | 45,222 | |||||||||
Transfer agent fees | 17,307 | 76,370 | |||||||||
Compliance fees | 44 | 726 | |||||||||
Trustees' fees | 62 | 1,481 | |||||||||
| 12b-1 fees | 13,641 | 7,575 | |||||||||
Other accrued expenses | 10,745 | 75,415 | |||||||||
Total Liabilities | 1,443,970 | 71,460,844 | |||||||||
Net Assets: | |||||||||||
Capital | 46,268,890 | 1,839,839,460 | |||||||||
Total accumulated earnings/(loss) | 25,661,392 | (5,000,892 | ) | ||||||||
Net Assets | $ | 71,930,282 | $ | 1,834,838,568 | |||||||
Net Assets | |||||||||||
Class A | $ | 30,948,625 | $ | 60,213,710 | |||||||
Class C | 24,178,601 | 3,333,051 | |||||||||
Class I | 16,803,056 | 1,766,385,412 | |||||||||
Member Class | — | 4,906,395 | |||||||||
Total | $ | 71,930,282 | $ | 1,834,838,568 | |||||||
| Shares (unlimited number of shares authorized with a par value of $0.001 per share): | |||||||||||
Class A | 1,920,950 | 6,318,893 | |||||||||
Class C | 1,573,379 | 353,792 | |||||||||
Class I | 1,041,477 | 184,166,624 | |||||||||
Member Class | — | 514,731 | |||||||||
Total | 4,535,806 | 191,354,040 | |||||||||
| Net asset value, offering (except Class A) and redemption price per share: | |||||||||||
Class A | $ | 16.11 | $ | 9.53 | |||||||
Class C (c) | 15.37 | 9.42 | |||||||||
Class I | 16.13 | 9.59 | |||||||||
Member Class | — | 9.53 | |||||||||
Maximum Sales Charge — Class A | 5.75 | % | 5.75 | % | |||||||
| Maximum offering price (100%/(100%-maximum sales charge) of net asset value adjusted to the nearest cent) per share — Class A | $ | 17.09 | $ | 10.11 | |||||||
(a) Includes $1,294,662 of securities on loan.
(b) Includes $56,063,114 of securities on loan.
(c) Redemption price per share varies by the length of time shares are held.
See notes to financial statements.
33
Victory Portfolios II | Statements of Operations For the Six Months Ended December 31, 2021 | ||||||
(Unaudited)
| Victory US 500 Enhanced Volatility Wtd Index Fund | Victory Market Neutral Income Fund | ||||||||||
Investment Income: | |||||||||||
Dividends | $ | 571,940 | $ | 28,493,820 | |||||||
Interest | — | 17,612 | |||||||||
Securities lending (net of fees) | 2,434 | 127,418 | |||||||||
Foreign tax withholding | (85 | ) | (1,976,449 | ) | |||||||
Total Income | 574,289 | 26,662,401 | |||||||||
Expenses: | |||||||||||
Investment advisory fees | 251,214 | 2,407,243 | |||||||||
Administration fees | 19,493 | 373,228 | |||||||||
Sub-Administration fees | 9,052 | 8,549 | |||||||||
| 12b-1 fees — Class A | 39,244 | 67,520 | |||||||||
| 12b-1 fees — Class C | 122,161 | 12,483 | |||||||||
Custodian fees | 1,847 | 187,097 | |||||||||
Transfer agent fees — Class A | 16,682 | 15,043 | |||||||||
Transfer agent fees — Class C | 14,690 | 916 | |||||||||
Transfer agent fees — Class I | 6,694 | 602,865 | |||||||||
Transfer agent fees — Member Class | — | 3,529 | |||||||||
Trustees' fees | 2,882 | 33,848 | |||||||||
Compliance fees | 258 | 4,191 | |||||||||
Legal and audit fees | 7,925 | 43,549 | |||||||||
State registration and filing fees | 26,177 | 111,421 | |||||||||
Broker interest fees | — | 184,786 | |||||||||
Other expenses | 6,172 | 67,614 | |||||||||
Total Expenses | 524,491 | 4,123,882 | |||||||||
Expenses waived/reimbursed by Adviser | (97,508 | ) | (1,068,478 | ) | |||||||
Net Expenses | 426,983 | 3,055,404 | |||||||||
Net Investment Income (Loss) | 147,306 | 23,606,997 | |||||||||
Realized/Unrealized Gains (Losses) from Investments: | |||||||||||
| Net realized gains (losses) from investment securities and foreign currency transactions | 3,724,646 | 17,202,303 | |||||||||
Foreign taxes on realized gains | — | (226,821 | ) | ||||||||
Net realized gains (losses) from futures contracts | 72,571 | 13,919,737 | |||||||||
| Net change in unrealized appreciation/depreciation on investment securities and foreign currency translations | 2,424,576 | 11,969,393 | |||||||||
Net change in unrealized appreciation/depreciation on futures contracts | 6,865 | (36,580,085 | ) | ||||||||
Net change in accrued foreign taxes on unrealized gains | — | 298,422 | |||||||||
Net realized/unrealized gains (losses) on investments | 6,228,658 | 6,582,949 | |||||||||
Change in net assets resulting from operations | $ | 6,375,964 | $ | 30,189,946 | |||||||
See notes to financial statements.
34
Victory Portfolios II | Statements of Changes in Net Assets | ||||||
| Victory US 500 Enhanced Volatility Wtd Index Fund | Victory Market Neutral Income Fund | ||||||||||||||||||
| Six Months Ended December 31, 2021 (Unaudited) | Year Ended June 30, 2021 | Six Months Ended December 31, 2021 (Unaudited) | Year Ended June 30, 2021 | ||||||||||||||||
From Investment Activities: | |||||||||||||||||||
Operations: | |||||||||||||||||||
Net investment income (loss) | $ | 147,306 | $ | 172,009 | $ | 23,606,997 | $ | 17,153,655 | |||||||||||
| Net realized gains (losses) from investments | 3,797,217 | 6,275,708 | 30,895,219 | (72,209,027 | ) | ||||||||||||||
| Net change in unrealized appreciation/depreciation on investments | 2,431,441 | 15,241,446 | (24,312,270 | ) | 66,086,768 | ||||||||||||||
| Change in net assets resulting from operations | 6,375,964 | 21,689,163 | 30,189,946 | 11,031,396 | |||||||||||||||
Distributions to Shareholders: | |||||||||||||||||||
Class A | (3,523,784 | ) | (3,095,618 | ) | (893,243 | ) | (1,168,163 | ) | |||||||||||
Class C | (2,773,356 | ) | (2,479,942 | ) | (33,071 | ) | (43,125 | ) | |||||||||||
Class I | (1,913,403 | ) | (1,479,876 | ) | (23,526,702 | ) | (20,375,553 | ) | |||||||||||
Member Class (a) | — | — | (60,801 | ) | (28,037 | ) | |||||||||||||
| Change in net assets resulting from distributions to shareholders | (8,210,543 | ) | (7,055,436 | ) | (24,513,817 | ) | (21,614,878 | ) | |||||||||||
| Change in net assets resulting from capital transactions | 3,006,779 | (10,688,711 | ) | 766,024,074 | 885,507,053 | ||||||||||||||
Change in net assets | 1,172,200 | 3,945,016 | 771,700,203 | 874,923,571 | |||||||||||||||
Net Assets: | |||||||||||||||||||
Beginning of period | 70,758,082 | 66,813,066 | 1,063,138,365 | 188,214,794 | |||||||||||||||
End of period | $ | 71,930,282 | $ | 70,758,082 | $ | 1,834,838,568 | $ | 1,063,138,365 | |||||||||||
(a) Victory Market Neutral Income Fund Member Class commenced operations on November 3, 2020.
(continues on next page)
See notes to financial statements.
35
Victory Portfolios II | Statements of Changes in Net Assets | ||||||
(continued)
| Victory US 500 Enhanced Volatility Wtd Index Fund | Victory Market Neutral Income Fund | ||||||||||||||||||
| Six Months Ended December 31, 2021 (Unaudited) | Year Ended June 30, 2021 | Six Months Ended December 31, 2021 (Unaudited) | Year Ended June 30, 2021 | ||||||||||||||||
Capital Transactions: | |||||||||||||||||||
Class A | |||||||||||||||||||
Proceeds from shares issued | $ | 345,046 | $ | 1,823,429 | $ | 17,006,820 | $ | 45,585,137 | |||||||||||
Distributions reinvested | 3,415,126 | 3,067,725 | 879,992 | 1,139,275 | |||||||||||||||
Cost of shares redeemed | (3,585,554 | ) | (6,232,186 | ) | (8,557,110 | ) | (8,065,289 | ) | |||||||||||
Total Class A | $ | 174,618 | $ | (1,341,032 | ) | $ | 9,329,702 | $ | 38,659,123 | ||||||||||
Class C | |||||||||||||||||||
Proceeds from shares issued | $ | 308,176 | $ | 514,706 | $ | 1,511,642 | $ | 1,847,869 | |||||||||||
Distributions reinvested | 2,734,654 | 2,452,286 | 33,071 | 43,125 | |||||||||||||||
Cost of shares redeemed | (2,658,277 | ) | (9,866,326 | ) | (196,153 | ) | (504,231 | ) | |||||||||||
Total Class C | $ | 384,553 | $ | (6,899,334 | ) | $ | 1,348,560 | $ | 1,386,763 | ||||||||||
Class I | |||||||||||||||||||
Proceeds from shares issued | $ | 1,890,912 | $ | 1,662,249 | $ | 856,900,063 | $ | 899,695,692 | |||||||||||
Distributions reinvested | 1,900,045 | 1,458,551 | 22,077,194 | 19,340,855 | |||||||||||||||
Cost of shares redeemed | (1,343,349 | ) | (5,569,145 | ) | (126,006,219 | ) | (76,117,382 | ) | |||||||||||
Total Class I | $ | 2,447,608 | $ | (2,448,345 | ) | $ | 752,971,038 | $ | 842,919,165 | ||||||||||
Member Class (a) | |||||||||||||||||||
Proceeds from shares issued | $ | — | $ | — | $ | 2,826,243 | $ | 3,115,297 | |||||||||||
Distributions reinvested | — | — | 60,801 | 28,033 | |||||||||||||||
Cost of shares redeemed | — | — | (512,270 | ) | (601,328 | ) | |||||||||||||
Total Member Class | $ | — | $ | — | $ | 2,374,774 | $ | 2,542,002 | |||||||||||
| Change in net assets resulting from capital transactions | $ | 3,006,779 | $ | (10,688,711 | ) | $ | 766,024,074 | $ | 885,507,053 | ||||||||||
Share Transactions: | |||||||||||||||||||
Class A | |||||||||||||||||||
Issued | 20,004 | 130,514 | 1,789,138 | 4,742,117 | |||||||||||||||
Reinvested | 216,393 | 214,063 | 92,875 | 118,861 | |||||||||||||||
Redeemed | (211,501 | ) | (415,394 | ) | (900,833 | ) | (839,879 | ) | |||||||||||
Total Class A | 24,896 | (70,817 | ) | 981,180 | 4,021,099 | ||||||||||||||
Class C | |||||||||||||||||||
Issued | 18,733 | 35,212 | 161,021 | 194,654 | |||||||||||||||
Reinvested | 182,067 | 178,089 | 3,530 | 4,543 | |||||||||||||||
Redeemed | (161,625 | ) | (699,614 | ) | (20,883 | ) | (53,678 | ) | |||||||||||
Total Class C | 39,175 | (486,313 | ) | 143,668 | 145,519 | ||||||||||||||
Class I | |||||||||||||||||||
Issued | 111,430 | 109,438 | 89,670,808 | 93,474,591 | |||||||||||||||
Reinvested | 120,144 | 101,556 | 2,314,890 | 2,006,390 | |||||||||||||||
Redeemed | (79,090 | ) | (377,582 | ) | (13,192,443 | ) | (7,886,007 | ) | |||||||||||
Total Class I | 152,484 | (166,588 | ) | 78,793,255 | 87,594,974 | ||||||||||||||
Member Class (a) | |||||||||||||||||||
Issued | — | — | 297,475 | 324,844 | |||||||||||||||
Reinvested | — | — | 6,414 | 2,924 | |||||||||||||||
Redeemed | — | — | (53,988 | ) | (62,938 | ) | |||||||||||||
Total Member Class | — | — | 249,901 | 264,830 | |||||||||||||||
Change in Shares | 216,555 | (723,718 | ) | 80,168,004 | 92,026,422 | ||||||||||||||
(a) Victory Market Neutral Income Fund Member Class commenced operations on November 3, 2020.
See notes to financial statements.
36
This page is intentionally left blank.
37
Victory Portfolios II | Financial Highlights | ||||||
For a Share Outstanding Throughout Each Period
Investment Activities | Distributions to Shareholders From | ||||||||||||||||||||||||||
| Net Asset Value, Beginning of Period | Net Investment Income (Loss)(a) | Net Realized and Unrealized Gains (Losses) on Investments | Total from Investment Activities | Net Investment Income | Net Realized Gains from Investments | ||||||||||||||||||||||
Victory US 500 Enhanced Volatility Wtd Index Fund | |||||||||||||||||||||||||||
Class A | |||||||||||||||||||||||||||
| Six Months Ended December 31, 2021 (Unaudited) | $ | 16.62 | 0.05 | 1.47 | 1.52 | (0.05 | ) | (1.98 | ) | ||||||||||||||||||
Year Ended June 30: | |||||||||||||||||||||||||||
2021 | $ | 13.42 | 0.07 | 4.77 | 4.84 | (0.05 | ) | (1.59 | ) | ||||||||||||||||||
2020 | $ | 14.26 | 0.08 | 0.88 | 0.96 | (0.07 | ) | (1.73 | ) | ||||||||||||||||||
2019 | $ | 16.50 | 0.13 | (0.36 | ) | (0.23 | ) | (0.12 | ) | (1.89 | ) | ||||||||||||||||
2018 | $ | 16.04 | 0.11 | 1.91 | 2.02 | (0.10 | ) | (1.46 | ) | ||||||||||||||||||
2017 | $ | 13.80 | 0.11 | 2.48 | 2.59 | (0.11 | ) | (0.24 | ) | ||||||||||||||||||
Class C | |||||||||||||||||||||||||||
| Six Months Ended December 31, 2021 (Unaudited) | $ | 15.95 | (0.01 | ) | 1.41 | 1.40 | — | (1.98 | ) | ||||||||||||||||||
Year Ended June 30: | |||||||||||||||||||||||||||
2021 | $ | 12.99 | (0.04 | ) | 4.59 | 4.55 | — | (f) | (1.59 | ) | |||||||||||||||||
2020 | $ | 13.90 | (0.03 | ) | 0.87 | 0.84 | (0.02 | ) | (1.73 | ) | |||||||||||||||||
2019 | $ | 16.16 | 0.02 | (0.35 | ) | (0.33 | ) | (0.04 | ) | (1.89 | ) | ||||||||||||||||
2018 | $ | 15.78 | (0.02 | ) | 1.86 | 1.84 | — | (f) | (1.46 | ) | |||||||||||||||||
2017 | $ | 13.59 | — | (f) | 2.44 | 2.44 | (0.01 | ) | (0.24 | ) | |||||||||||||||||
Class I | |||||||||||||||||||||||||||
| Six Months Ended December 31, 2021 (Unaudited) | $ | 16.64 | 0.08 | 1.46 | 1.54 | (0.07 | ) | (1.98 | ) | ||||||||||||||||||
Year Ended June 30: | |||||||||||||||||||||||||||
2021 | $ | 13.43 | 0.11 | 4.77 | 4.88 | (0.08 | ) | (1.59 | ) | ||||||||||||||||||
2020 | $ | 14.26 | 0.12 | 0.88 | 1.00 | (0.10 | ) | (1.73 | ) | ||||||||||||||||||
2019 | $ | 16.50 | 0.17 | (0.36 | ) | (0.19 | ) | (0.16 | ) | (1.89 | ) | ||||||||||||||||
2018 | $ | 16.05 | 0.15 | 1.90 | 2.05 | (0.14 | ) | (1.46 | ) | ||||||||||||||||||
2017 | $ | 13.80 | 0.15 | 2.48 | 2.63 | (0.14 | ) | (0.24 | ) | ||||||||||||||||||
(a) Per share net investment income (loss) has been calculated using the average daily shares method.
(b) Not annualized for periods less than one year.
(c) Annualized for periods less than one year.
(d) Portfolio turnover is calculated on the basis of the Fund as a whole without distinguishing between the classes of shares issued.
(e) Portfolio turnover increased significantly due to changes in the volume and timing of purchases and sales of portfolio holdings during the year.
(f) Amount is less than $0.005 per share.
See notes to financial statements.
38
Victory Portfolios II | Financial Highlights — continued | ||||||
For a Share Outstanding Throughout Each Period
Ratios to Average Net Assets | Supplemental Data | ||||||||||||||||||||||||||||||||||
| Total Distributions | Net Asset Value, End of Period | Total Return (Excludes Sales Charge)(b) | Net Expenses(c) | Net Investment Income (Loss)(c) | Gross Expenses(c) | Net Assets, End of Period (000's) | Portfolio Turnover(b)(d) | ||||||||||||||||||||||||||||
Victory US 500 Enhanced Volatility Wtd Index Fund | |||||||||||||||||||||||||||||||||||
Class A | |||||||||||||||||||||||||||||||||||
| Six Months Ended December 31, 2021 (Unaudited) | (2.03 | ) | $ | 16.11 | 9.45 | % | 0.99 | % | 0.61 | % | 1.25 | % | $ | 30,949 | 15 | % | |||||||||||||||||||
Year Ended June 30: | |||||||||||||||||||||||||||||||||||
2021 | (1.64 | ) | $ | 16.62 | 38.05 | % | 0.99 | % | 0.47 | % | 1.24 | % | $ | 31,504 | 68 | % | |||||||||||||||||||
2020 | (1.80 | ) | $ | 13.42 | 6.71 | % | 0.99 | % | 0.56 | % | 1.28 | % | $ | 26,394 | 54 | % | |||||||||||||||||||
2019 | (2.01 | ) | $ | 14.26 | (0.01 | )% | 0.99 | % | 0.84 | % | 1.25 | % | $ | 33,406 | 120 | %(e) | |||||||||||||||||||
2018 | (1.56 | ) | $ | 16.50 | 12.79 | % | 0.99 | % | 0.67 | % | 1.19 | % | $ | 51,671 | 45 | % | |||||||||||||||||||
2017 | (0.35 | ) | $ | 16.04 | 18.89 | % | 0.99 | % | 0.75 | % | 1.35 | % | $ | 36,721 | 38 | % | |||||||||||||||||||
Class C | |||||||||||||||||||||||||||||||||||
| Six Months Ended December 31, 2021 (Unaudited) | (1.98 | ) | $ | 15.37 | 9.06 | % | 1.74 | % | (0.14 | )% | 2.03 | % | $ | 24,179 | 15 | % | |||||||||||||||||||
Year Ended June 30: | |||||||||||||||||||||||||||||||||||
2021 | (1.59 | ) | $ | 15.95 | 36.98 | % | 1.74 | % | (0.29 | )% | 1.99 | % | $ | 24,465 | 68 | % | |||||||||||||||||||
2020 | (1.75 | ) | $ | 12.99 | 5.96 | % | 1.74 | % | (0.19 | )% | 2.03 | % | $ | 26,240 | 54 | % | |||||||||||||||||||
2019 | (1.93 | ) | $ | 13.90 | (0.73 | )% | 1.74 | % | 0.10 | % | 2.00 | % | $ | 35,649 | 120 | %(e) | |||||||||||||||||||
2018 | (1.46 | ) | $ | 16.16 | 11.78 | % | 1.74 | % | (0.11 | )% | 1.97 | % | $ | 41,410 | 45 | % | |||||||||||||||||||
2017 | (0.25 | ) | $ | 15.78 | 18.09 | % | 1.74 | % | 0.01 | % | 2.12 | % | $ | 57,620 | 38 | % | |||||||||||||||||||
Class I | |||||||||||||||||||||||||||||||||||
| Six Months Ended December 31, 2021 (Unaudited) | (2.05 | ) | $ | 16.13 | 9.57 | % | 0.74 | % | 0.87 | % | 1.00 | % | $ | 16,803 | 15 | % | |||||||||||||||||||
Year Ended June 30: | |||||||||||||||||||||||||||||||||||
2021 | (1.67 | ) | $ | 16.64 | 38.43 | % | 0.74 | % | 0.71 | % | 0.98 | % | $ | 14,789 | 68 | % | |||||||||||||||||||
2020 | (1.83 | ) | $ | 13.43 | 6.97 | % | 0.74 | % | 0.86 | % | 1.02 | % | $ | 14,179 | 54 | % | |||||||||||||||||||
2019 | (2.05 | ) | $ | 14.26 | 0.24 | % | 0.74 | % | 1.10 | % | 1.00 | % | $ | 26,501 | 120 | %(e) | |||||||||||||||||||
2018 | (1.60 | ) | $ | 16.50 | 12.97 | % | 0.74 | % | 0.91 | % | 0.95 | % | $ | 36,400 | 45 | % | |||||||||||||||||||
2017 | (0.38 | ) | $ | 16.05 | 19.24 | % | 0.74 | % | 1.00 | % | 1.13 | % | $ | 32,751 | 38 | % | |||||||||||||||||||
See notes to financial statements.
39
Victory Portfolios II | Financial Highlights | ||||||
For a Share Outstanding Throughout Each Period
Investment Activities | Distributions to Shareholders From | ||||||||||||||||||||||||||
| Net Asset Value, Beginning of Period | Net Investment Income (Loss)(a) | Net Realized and Unrealized Gains (Losses) on Investments | Total from Investment Activities | Net Investment Income | Net Realized Gains from Investments | ||||||||||||||||||||||
Victory Market Neutral Income Fund | |||||||||||||||||||||||||||
Class A | |||||||||||||||||||||||||||
| Six Months Ended December 31, 2021 (Unaudited): | $ | 9.51 | 0.15 | 0.03 | 0.18 | (0.16 | ) | — | |||||||||||||||||||
Year Ended June 30: | |||||||||||||||||||||||||||
2021 | $ | 9.77 | 0.29 | (0.06 | ) | 0.23 | (0.24 | ) | (0.25 | ) | |||||||||||||||||
2020 | $ | 9.51 | 0.27 | 0.23 | 0.50 | (0.24 | ) | — | |||||||||||||||||||
2019 | $ | 9.61 | 0.32 | (0.13 | ) | 0.19 | (0.27 | ) | (0.02 | ) | |||||||||||||||||
2018 | $ | 9.40 | 0.24 | 0.26 | 0.50 | (0.29 | ) | — | |||||||||||||||||||
2017 | $ | 9.21 | 0.24 | 0.20 | 0.44 | (0.25 | ) | — | |||||||||||||||||||
Class C | |||||||||||||||||||||||||||
| Six Months Ended December 31, 2021 (Unaudited): | $ | 9.40 | 0.11 | 0.04 | 0.15 | (0.13 | ) | — | |||||||||||||||||||
Year Ended June 30: | |||||||||||||||||||||||||||
2021 | $ | 9.69 | 0.22 | (0.08 | ) | 0.14 | (0.18 | ) | (0.25 | ) | |||||||||||||||||
2020 | $ | 9.43 | 0.21 | 0.22 | 0.43 | (0.17 | ) | — | |||||||||||||||||||
2019 | $ | 9.54 | 0.25 | (0.14 | ) | 0.11 | (0.20 | ) | (0.02 | ) | |||||||||||||||||
2018 | $ | 9.33 | 0.17 | 0.26 | 0.43 | (0.22 | ) | — | |||||||||||||||||||
2017 | $ | 9.15 | 0.17 | 0.20 | 0.37 | (0.19 | ) | — | |||||||||||||||||||
Class I | |||||||||||||||||||||||||||
| Six Months Ended December 31, 2021 (Unaudited): | $ | 9.57 | 0.17 | 0.02 | 0.19 | (0.17 | ) | — | |||||||||||||||||||
Year Ended June 30: | |||||||||||||||||||||||||||
2021 | $ | 9.83 | 0.33 | (0.08 | ) | 0.25 | (0.26 | ) | (0.25 | ) | |||||||||||||||||
2020 | $ | 9.55 | 0.31 | 0.23 | 0.54 | (0.26 | ) | — | |||||||||||||||||||
2019 | $ | 9.65 | 0.38 | (0.16 | ) | 0.22 | (0.30 | ) | (0.02 | ) | |||||||||||||||||
2018 | $ | 9.44 | 0.26 | 0.26 | 0.52 | (0.31 | ) | — | |||||||||||||||||||
2017 | $ | 9.24 | 0.27 | 0.20 | 0.47 | (0.27 | ) | — | |||||||||||||||||||
Member Class | |||||||||||||||||||||||||||
| Six Months Ended December 31, 2021 (Unaudited): | $ | 9.51 | 0.16 | 0.03 | 0.19 | (0.17 | ) | — | |||||||||||||||||||
| November 3, 2020 (g) through June 30, 2021: | $ | 9.62 | 0.25 | 0.04 | (h) | 0.29 | (0.15 | ) | (0.25 | ) | |||||||||||||||||
(a) Per share net investment income (loss) has been calculated using the average daily shares method.
(b) Not annualized for periods less than one year.
(c) Annualized for periods less than one year.
(d) Portfolio turnover is calculated on the basis of the Fund as a whole without distinguishing between the classes of shares issued.
(e) Includes impact of broker interest fees. Without these broker interest fees, the net expense ratio would have been at the contractual expense cap. (See note 4 in the Notes to Financial Statements).
See notes to financial statements.
40
Victory Portfolios II | Financial Highlights — continued | ||||||
For a Share Outstanding Throughout Each Period
Ratios to Average Net Assets | Supplemental Data | ||||||||||||||||||||||||||||||||||
| Total Distributions | Net Asset Value, End of Period | Total Return (Excludes Sales Charge)(b) | Net Expenses(c) | Net Investment Income (Loss)(c) | Gross Expenses(c) | Net Assets, End of Period (000's) | Portfolio Turnover(b)(d) | ||||||||||||||||||||||||||||
Victory Market Neutral Income Fund | |||||||||||||||||||||||||||||||||||
Class A | |||||||||||||||||||||||||||||||||||
| Six Months Ended December 31, 2021 (Unaudited): | (0.16 | ) | $ | 9.53 | 1.89 | % | 0.78 | %(e) | 3.11 | % | 0.82 | % | $ | 60,214 | 33 | % | |||||||||||||||||||
Year Ended June 30: | |||||||||||||||||||||||||||||||||||
2021 | (0.49 | ) | $ | 9.51 | 2.33 | % | 0.79 | %(e) | 3.03 | % | 0.95 | % | $ | 50,735 | 89 | % | |||||||||||||||||||
2020 | (0.24 | ) | $ | 9.77 | 5.31 | % | 0.75 | % | 2.78 | % | 1.17 | % | $ | 12,870 | 119 | %(f) | |||||||||||||||||||
2019 | (0.29 | ) | $ | 9.51 | 1.99 | % | 0.75 | % | 3.36 | % | 1.03 | % | $ | 32,627 | 82 | % | |||||||||||||||||||
2018 | (0.29 | ) | $ | 9.61 | 5.37 | % | 0.89 | % | 2.55 | % | 1.18 | % | $ | 23,847 | 69 | % | |||||||||||||||||||
2017 | (0.25 | ) | $ | 9.40 | 4.77 | % | 0.90 | % | 2.59 | % | 1.25 | % | $ | 24,998 | 63 | % | |||||||||||||||||||
Class C | |||||||||||||||||||||||||||||||||||
| Six Months Ended December 31, 2021 (Unaudited): | (0.13 | ) | $ | 9.42 | 1.57 | % | 1.53 | %(e) | 2.30 | % | 2.29 | % | $ | 3,333 | 33 | % | |||||||||||||||||||
Year Ended June 30: | |||||||||||||||||||||||||||||||||||
2021 | (0.43 | ) | $ | 9.40 | 1.40 | % | 1.54 | %(e) | 2.28 | % | 2.29 | % | $ | 1,976 | 89 | % | |||||||||||||||||||
2020 | (0.17 | ) | $ | 9.69 | 4.59 | % | 1.50 | % | 2.20 | % | 2.62 | % | $ | 626 | 119 | %(f) | |||||||||||||||||||
2019 | (0.22 | ) | $ | 9.43 | 1.19 | % | 1.50 | % | 2.57 | % | 2.56 | % | $ | 441 | 82 | % | |||||||||||||||||||
2018 | (0.22 | ) | $ | 9.54 | 4.64 | % | 1.64 | % | 1.79 | % | 2.51 | % | $ | 311 | 69 | % | |||||||||||||||||||
2017 | (0.19 | ) | $ | 9.33 | 4.02 | % | 1.65 | % | 1.88 | % | 3.00 | % | $ | 519 | 63 | % | |||||||||||||||||||
Class I | |||||||||||||||||||||||||||||||||||
| Six Months Ended December 31, 2021 (Unaudited): | (0.17 | ) | $ | 9.59 | 2.05 | % | 0.43 | %(e) | 3.44 | % | 0.58 | % | $ | 1,766,385 | 33 | % | |||||||||||||||||||
Year Ended June 30: | |||||||||||||||||||||||||||||||||||
2021 | (0.51 | ) | $ | 9.57 | 2.62 | % | 0.44 | %(e) | 3.37 | % | 0.75 | % | $ | 1,007,909 | 89 | % | |||||||||||||||||||
2020 | (0.26 | ) | $ | 9.83 | 5.79 | % | 0.40 | % | 3.23 | % | 0.89 | % | $ | 174,719 | 119 | %(f) | |||||||||||||||||||
2019 | (0.32 | ) | $ | 9.55 | 2.25 | % | 0.40 | % | 3.91 | % | 1.05 | % | $ | 54,920 | 82 | % | |||||||||||||||||||
2018 | (0.31 | ) | $ | 9.65 | 5.62 | % | 0.64 | % | 2.72 | % | 1.09 | % | $ | 19,483 | 69 | % | |||||||||||||||||||
2017 | (0.27 | ) | $ | 9.44 | 5.11 | % | 0.65 | % | 2.83 | % | 1.13 | % | $ | 31,140 | 63 | % | |||||||||||||||||||
Member Class | |||||||||||||||||||||||||||||||||||
| Six Months Ended December 31, 2021 (Unaudited): | (0.17 | ) | $ | 9.53 | 2.00 | % | 0.58 | %(e) | 3.26 | % | 1.32 | % | $ | 4,906 | 33 | % | |||||||||||||||||||
| November 3, 2020 (g) through June 30, 2021: | (0.40 | ) | $ | 9.51 | 3.05 | % | 0.60 | % | 3.94 | % | 5.38 | % | $ | 2,518 | 89 | % | |||||||||||||||||||
(f) Portfolio turnover increased significantly due to changes in the volume and timing of purchases and sales of portfolio holdings during the year.
(g) Commencement of operations.
(h) The amount shown reflects a net realized and unrealized gain per share, whereas the statement of operations reflected a net realized and unrealized loss for the period for the Fund in total. The difference in realized and unrealized gains and losses for the Fund versus the class is due to the timing of sales and repurchases of the class in relation to fluctuating market values during the period.
See notes to financial statements.
41
Victory Portfolios II | Notes to Financial Statements December 31, 2021 | ||||||
(Unaudited)
1. Organization:
Victory Portfolios II (the "Trust") is organized as a Delaware statutory trust and the Trust is registered under the Investment Company Act of 1940, as amended (the "1940 Act"), as an open-end investment company. The Trust is comprised of 25 funds, 23 of which are Exchange-Traded Funds ("ETFs"), and is authorized to issue an unlimited number of shares, which are units of beneficial interest with no par value.
The accompanying financial statements are those of the following two Funds (collectively, the "Funds" and individually, a "Fund"). Each Fund is classified as diversified under the 1940 Act.
Funds (Legal Name) | Funds (Short Name) | Investment Share Classes Offered | |||||||||
| Victory US 500 Enhanced Volatility Wtd Index Fund | US 500 Enhanced Volatility Wtd Index Fund | A, C, and I | |||||||||
Victory Market Neutral Income Fund | Market Neutral Income Fund | A, C, I, and Member Class | |||||||||
Each class of shares of a Fund has substantially identical rights and privileges except with respect to sales charges, fees paid under distribution plans, expenses allocable exclusively to each class of shares, voting rights on matters solely affecting a single class of shares, and the exchange privilege of each class of shares.
Under the Trust's organizational documents, its officers and trustees are indemnified against certain liabilities arising out of the performance of their duties to the Funds. In addition, in the normal course of business, the Funds enter into contracts with their vendors and others that provide for general indemnifications. The Funds' maximum exposure under these arrangements is unknown, as this would involve future claims that may be made against the Fund. However, based on experience, the Funds expect that risk of loss to be remote.
2. Significant Accounting Policies:
The following is a summary of significant accounting policies followed by the Trust in the preparation of its financial statements. The policies are in conformity with U.S. Generally Accepted Accounting Principle ("GAAP"). The preparation of financial statements in accordance with GAAP requires management to make estimates and assumptions that affect the reported amounts of assets and liabilities and disclosure of contingent assets and liabilities at the date of the financial statements and the reported amounts of income and expenses for the period. Actual results could differ from those estimates. The Funds follow the specialized accounting and reporting requirements under GAAP that are applicable to investment companies under Accounting Standards Codification Topic 946.
Investment Valuation:
The Funds record investments at fair value. Fair value is defined as the price that would be received to sell an asset or paid to transfer a liability in an orderly transaction between market participants at the measurement date.
The valuation techniques described below maximize the use of observable inputs and minimize the use of unobservable inputs in determining fair value. The inputs used for valuing the Funds' investments are summarized in the three broad levels listed below:
• Level 1 — quoted prices in active markets for identical securities
• Level 2 — other significant observable inputs (including quoted prices for similar securities or interest rates applicable to those securities, etc.)
• Level 3 — significant unobservable inputs (including the Funds' own assumptions in determining the fair value of investments)
Changes in valuation techniques may result in transfers in or out of an assigned level within the disclosure hierarchy. The inputs or methodologies used for valuation techniques are not necessarily an indication of the risk associated with entering into those investments.
Victory Capital Management Inc. ("VCM" or the "Adviser") has established the Pricing and Liquidity Committee (the "Committee"), and subject to the Trust's Board of Trustees' (the "Board") oversight, the
42
Victory Portfolios II | Notes to Financial Statements — continued December 31, 2021 | ||||||
(Unaudited)
Committee administers and oversees the Funds' valuation policies and procedures, which are approved by the Board.
Portfolio securities listed or traded on securities exchanges, including ETFs and American Depositary Receipts ("ADRs"), are valued at the closing price on the exchange or system where the security is principally traded, if available, or at the Nasdaq Official Closing Price. If there have been no sales for that day on the exchange or system, then a security is valued at the last available bid quotation on the exchange or system where the security is principally traded. In each of these situations, valuations are typically categorized as Level 1 in the fair value hierarchy.
Investments in open-end investment companies are valued at their net asset value ("NAV"). These valuations are typically categorized as Level 1 in the fair value hierarchy.
Futures contracts are valued at the settlement price established each day by the board of trade or an exchange on which they are traded. These valuations are typically categorized as Level 1 in the fair value hierarchy.
In the event that price quotations or valuations are not readily available, investments are valued at fair value in accordance with procedures established by and under the general supervision and responsibility of the Board. These valuations are typically categorized as Level 2 or Level 3 in the fair value hierarchy, based on the observability of inputs used to determine the fair value. The effect of fair value pricing is that securities may not be priced on the basis of quotations from the primary market in which they are traded and the actual price realized from the sale of a security may differ materially from the fair value price. Valuing these securities at fair value is intended to cause the Fund's NAV to be more reliable than it otherwise would be.
In accordance with procedures adopted by the Board, fair value pricing may be used if events materially affecting the value of foreign securities occur between the time the exchange on which they are traded closes and the time a Fund's NAV is calculated. The Market Neutral Income Fund uses a systematic valuation model, provided daily by an independent third party to fair value its international equity securities. The valuations are considered as Level 2 in the fair value hierarchy.
A summary of the valuations as of December 31, 2021, is included in the table below while the breakdown, by category, of investments is disclosed on the Schedules of Portfolio Investments:
Level 1 | Level 2 | Level 3 | Total | ||||||||||||||||
US 500 Enhanced Volatility Wtd Index Fund | |||||||||||||||||||
Common Stocks | $ | 71,292,000 | $ | — | $ | — | $ | 71,292,000 | |||||||||||
Investment Companies | 437,647 | — | — | 437,647 | |||||||||||||||
Collateral for Securities Loaned | 1,330,411 | — | — | 1,330,411 | |||||||||||||||
Total | $ | 73,060,058 | $ | — | $ | — | $ | 73,060,058 | |||||||||||
Other Financial Investments^: | |||||||||||||||||||
Assets: | |||||||||||||||||||
Future | $ | 15,788 | $ | — | $ | — | $ | 15,788 | |||||||||||
Total | $ | 15,788 | $ | — | $ | — | $ | 15,788 | |||||||||||
Market Neutral Income Fund | |||||||||||||||||||
Common Stocks | $ | 891,444,254 | $ | 648,033,637 | $ | — | $ | 1,539,477,891 | |||||||||||
Collateral for Securities Loaned | 63,131,516 | — | — | 63,131,516 | |||||||||||||||
Total | $ | 954,575,770 | $ | 648,033,637 | $ | — | $ | 1,602,609,407 | |||||||||||
Other Financial Investments^: | |||||||||||||||||||
Assets: | |||||||||||||||||||
Futures | $ | 2,883,304 | $ | — | $ | — | $ | 2,883,304 | |||||||||||
Liabilities: | |||||||||||||||||||
Futures | $ | (26,974,022 | ) | $ | — | $ | — | $ | (26,974,022 | ) | |||||||||
Total | $ | (24,090,718 | ) | $ | — | $ | — | $ | (24,090,718 | ) | |||||||||
^ Futures contracts are valued at the unrealized appreciation (depreciation) on the investment.
43
Victory Portfolios II | Notes to Financial Statements — continued December 31, 2021 | ||||||
(Unaudited)
For the six months ended December 31, 2021, there were no transfers in or out of Level 3 in the fair value hierarchy.
Investment Companies:
Open-End Funds:
The Funds may invest in portfolios of open-end investment companies. These investment companies value securities in their portfolios for which market quotations are readily available at their market values (generally the last reported sale price) and all other securities and assets at their fair value by the methods established by the board of directors of the underlying funds.
Derivatives Instruments:
Foreign Exchange Currency Contracts:
The Funds may enter into foreign exchange currency contracts to convert U.S. dollars to and from various foreign currencies. A foreign exchange currency contract is an obligation by a Fund to purchase or sell a specific currency at a future date at a price (in U.S. dollars) set at the time of the contract. The Funds do not engage in "cross-currency" foreign exchange contracts (i.e., contracts to purchase or sell one foreign currency in exchange for another foreign currency). The Funds' foreign exchange currency contracts might be considered spot contracts (typically a contract of one week or less) or forward contracts (typically a contract term over one week). A spot contract is entered into for purposes of hedging against foreign currency fluctuations relating to a specific portfolio transaction, such as the delay between a security transaction trade date and settlement date. Forward contracts are entered into for purposes of hedging portfolio holdings or concentrations of such holdings. The Funds enter into foreign exchange currency contracts solely for spot or forward hedging purposes, and not for speculative purposes (i.e., the Funds do not enter into such contracts solely for the purpose of earning foreign currency gains). Each foreign exchange currency contract is adjusted daily by the prevailing spot or forward rate of the underlying currency, and any appreciation or depreciation is recorded for financial statement purposes as unrealized until the contract settlement date, at which time the Funds record realized gains or losses equal to the difference between the value of a contract at the time it was opened and the value at the time it was closed. The Funds could be exposed to risk if a counterparty is unable to meet the terms of a foreign exchange currency contract or if the value of the foreign currency changes unfavorably. In addition, the use of foreign exchange currency contracts does not eliminate fluctuations in the underlying prices of the securities. As of December 31, 2021, the Funds had no open forward foreign exchange currency contracts.
Futures Contracts:
The Funds may enter into contracts for the future delivery of securities or foreign currencies and futures contracts based on a specific security, class of securities, foreign currency or an index, and purchase or sell options on any such futures contracts. A futures contract on a securities index is an agreement obligating either party to pay, and entitling the other party to receive, while the contract is outstanding, cash payments based on the level of a specified securities index. No physical delivery of the underlying asset is made. The Funds may enter into futures contracts in an effort to hedge against market risks. The acquisition of put and call options on futures contracts will give the Funds the right (but not the obligation), for a specified price, to sell or to purchase the underlying futures contract, upon exercise of the option, at any time during the option period. Futures transactions involve brokerage costs and require the Funds to segregate assets to cover contracts that would require it to purchase securities or currencies. A good faith margin deposit, known as initial margin, of cash or government securities with a broker or custodian is required to initiate and maintain open positions in futures contracts. Subsequent payments, known as variation margin, are made or received by the Funds based on the change in the market value of the position and are recorded as unrealized appreciation or depreciation until the contract is closed out, at which time the gain or loss is realized. The Funds may lose the expected benefit of futures transactions if interest rates, exchange rates or securities prices change in an unanticipated manner. Such unanticipated changes may also result in lower overall performance than if the Funds had not entered into any futures transactions. In addition, the value of
44
Victory Portfolios II | Notes to Financial Statements — continued December 31, 2021 | ||||||
(Unaudited)
the Funds' futures positions may not prove to be perfectly or even highly correlated with the value of its portfolio securities or foreign currencies, limiting the Funds' ability to hedge effectively against interest rate, exchange rate and/or market risk and giving rise to additional risks. There is no assurance of liquidity in the secondary market for purposes of closing out futures positions. The collateral held by the Funds is reflected on the Statements of Assets and Liabilities under Deposit with broker for futures contracts. As of December 31, 2021, the Funds entered into futures contracts primarily for the strategy of hedging or other purposes, including but not limited to, providing liquidity and equitizing cash.
Summary of Derivative Instruments:
The following table summarizes the fair values of derivative instruments on the Statements of Assets and Liabilities, categorized by risk exposure, as of December 31, 2021:
Asset | Liabilities | ||||||||||
| Variation Margin Receivable on Open Futures Contracts* | Variation Margin Payable on Open Futures Contracts* | ||||||||||
Equity Risk Exposure | |||||||||||
US 500 Enhanced Volatility Wtd Index Fund | $ | 15,788 | $ | — | |||||||
Market Neutral Income Fund | 2,883,304 | 26,974,022 | |||||||||
* Includes cumulative appreciation (depreciation) of futures contracts as reported on the Schedules of Portfolio Investments. Only current day's variation margin for futures contracts is reported within the Statements of Assets and Liabilities.
The following table presents the effect of derivative instruments on the Statements of Operations, categorized by risk exposure, for the six months ended December 31, 2021:
| Net Realized Gains (Losses) on Derivatives Recognized as a Result from Operations | Net Change in Unrealized Appreciation/Depreciation on Derivatives Recognized as a Result of Operations | ||||||||||
| Net Realized Gains (Losses) from Futures Contracts | Net Change in Unrealized Appreciation/ Depreciation on Futures Contracts | ||||||||||
Equity Risk Exposure: | |||||||||||
US 500 Enhanced Volatility Wtd Index Fund | $ | 72,571 | $ | 6,865 | |||||||
Market Neutral Income Fund | 13,919,737 | (36,580,085 | ) | ||||||||
All open derivative positions at period end are reflected on each respective Fund's Schedule of Portfolio Investments. The underlying face value of open derivative positions relative to each Fund's net assets at period end is generally representative of the notional amount of open positions to net assets throughout the period.
Investment Transactions and Related Income:
Changes in holdings of investments are accounted for no later than one business day following the trade date. For financial reporting purposes, however, investment transactions are accounted for on trade date or the last business day of the reporting period. Interest income is determined on the basis of coupon interest accrued using the effective interest method which adjusts, where applicable, the amortization of premiums or accretion of discounts. Dividend income is recorded on the ex-dividend date. Gains or losses realized on sales of securities are recorded on the identified cost basis.
Withholding taxes on interest, dividends, and gains as a result of certain investments in ADRs by the Funds have been provided for in accordance with each investment's applicable country's tax rules and rates.
45
Victory Portfolios II | Notes to Financial Statements — continued December 31, 2021 | ||||||
(Unaudited)
Securities Lending:
The Funds, through a Securities Lending Agreement with Citibank, N.A. ("Citibank"), may lend their securities to qualified financial institutions, such as certain broker-dealers and banks, to earn additional income, net of income retained by Citibank. Borrowers are required to initially secure their loans for collateral in the amount of at least 102% of the value of U.S. securities loaned or at least 105% of the value of non-U.S. securities loaned, marked-to-market daily. Any collateral shortfalls associated with increases in the valuation of the securities loaned are generally cured the next business day. The collateral can be received in the form of cash collateral and/or non-cash collateral. Non-cash collateral can include U.S. Government Securities and other securities as permitted by Securities and Exchange Commission ("SEC") guidelines. The cash collateral is invested in short-term instruments or cash equivalents, primarily open-end investment companies, as noted on the Funds' Schedules of Portfolio Investments. The Funds effectively do not have control of the non-cash collateral and therefore it is not disclosed on the Funds' Schedules of Portfolio Investments. Collateral requirements are determined daily based on the value of the Funds' securities on loan as of the end of the prior business day. During the time portfolio securities are on loan, the borrower will pay the Funds any dividends or interest paid on such securities plus any fee negotiated between the parties to the lending agreement. The Funds also earn a return from the collateral. The Funds pay Citibank various fees in connection with the investment of cash collateral and fees based on the investment income received from securities lending activities. Securities lending income (net of these fees) is disclosed on the Statements of Operations. Loans are terminable upon demand and the borrower must return the loaned securities within the lesser of one standard settlement period or five business days. Although risk is mitigated by the collateral, a Fund could experience a delay in recovering its securities and possible loss of income or value if the borrower fails to return them. In addition, there is a risk that the value of the short-term investments will be less than the amount of cash collateral required to be returned to the borrower.
The Funds' agreement with Citibank does not include master netting provisions. Non-cash collateral received by the Funds may not be sold or repledged, except to satisfy borrower default.
The following table is a summary of the Funds' securities lending transactions as of December 31, 2021.
| Value of Securities on Loan | Non-Cash Collateral | Cash Collateral | |||||||||||||
U.S. 500 Enhanced Volatility Wtd Index Fund | $ | 1,294,662 | $ | — | $ | 1,330,411 | |||||||||
Market Neutral Income Fund | 56,063,114 | — | 63,131,516 | ||||||||||||
Foreign Currency Translations:
The accounting records of the Funds are maintained in U.S. dollars. Investment securities and other assets and liabilities of a Fund denominated in a foreign currency are translated into U.S. dollars at current exchange rates. Purchases and sales of securities, income receipts and expense payments are translated into U.S. dollars at the exchange rates on the date of the transactions. The Funds do not isolate the portion of the results of operations resulting from changes in foreign exchange rates on investments from fluctuations arising from changes in market prices of securities held. Such fluctuations are disclosed as Net change in unrealized appreciation/depreciation on investment securities and foreign currency translations on the Statements of Operations. Any realized gains or losses from these fluctuations are disclosed as Net realized gains (losses) from investment securities and foreign currency transactions on the Statements of Operations.
Foreign Taxes:
The Funds may be subject to foreign taxes related to foreign income received (a portion of which may be reclaimable), capital gains on the sale of securities, and certain foreign currency transactions. All foreign taxes are recorded in accordance with the applicable regulations and rates that exist in the foreign jurisdictions in which the Funds invest.
46
Victory Portfolios II | Notes to Financial Statements — continued December 31, 2021 | ||||||
(Unaudited)
Federal Income Taxes:
It is each Fund's policy to continue to qualify as a regulated investment company by complying with the provisions available to certain investment companies, as defined in applicable sections of the Internal Revenue Code, and to make distributions of net investment income and net realized gains sufficient to relieve it from all, or substantially all, federal income taxes. Accordingly, no provision for federal income taxes is required in the financial statements. The Funds have a tax year end of June 30.
For the six months ended December 31, 2021, the Funds did not incur any income tax, interest, or penalties, and have recorded no liability for net unrecognized tax benefits relating to uncertain income tax positions.
Management of the Funds has reviewed tax positions taken in tax years that remain subject to examination by all major tax jurisdictions, including federal (i.e., the last four tax years, which includes the current fiscal tax year end). Management believes that there is no tax liability resulting from unrecognized tax benefits related to uncertain tax positions taken.
Allocations:
Expenses directly attributable to a Fund are charged to that Fund, while expenses that are attributable to more than one fund in the Trust, or jointly with an affiliated trust, are allocated among the respective funds in the Trust and/or an affiliated trust based upon net assets or another appropriate basis.
Income, expenses (other than class-specific expenses such as transfer agent fees, state registration fees, 12b-1 fees, and printing fees), and realized and unrealized gains or losses on investments are allocated to each class of shares based on its relative net assets on the date income is earned or expenses and realized and unrealized gains and losses are incurred.
3. Purchases and Sales:
Purchases and sales of securities (excluding securities maturing less than one year from acquisition) for the six months ended December 31, 2021, were as follows:
| Excluding U.S. Government Securities | |||||||||||
Purchases | Sales | ||||||||||
US 500 Enhanced Volatility Wtd Index Fund | $ | 10,568,690 | $ | 15,571,725 | |||||||
Market Neutral Income Fund | 998,008,153 | 372,880,377 | |||||||||
4. Fees and Transactions with Affiliates and Related Parties:
Investment Advisory Fees:
Investment advisory services are provided to the Fund by the Adviser, which is a New York corporation registered as an investment adviser with the SEC. The Adviser is an indirect wholly owned subsidiary of Victory Capital Holdings, Inc., a publicly traded Delaware corporation, and a wholly owned direct subsidiary of Victory Capital Operating, LLC.
Under the terms of the Investment Advisory Agreement, the Adviser is entitled to receive fees based on a percentage of the average daily net assets of each Fund. The rates at which the Adviser is paid by each Fund are included in the table below.
US 500 Enhanced Volatility Wtd Index Fund | 0.70 | % | |||||
Market Neutral Income Fund | 0.35 | % | |||||
Amounts incurred and paid to VCM for the six months ended December 31, 2021, are reflected on the Statements of Operations as Investment advisory fees.
47
Victory Portfolios II | Notes to Financial Statements — continued December 31, 2021 | ||||||
(Unaudited)
Administration and Servicing Fees:
VCM also serves as the Funds' administrator and fund accountant. Under the Administration and Fund Accounting Agreement, VCM is entitled to receive fees based on a percentage of the average daily net assets of the Trust, Victory Variable Insurance Funds and Victory Portfolios. The tiered rates at which VCM is paid by the Funds are shown in the table below:
| Net Assets | |||||||||||||||
| Up to $15 billion | $15 billion - $30 billion | Over $30 billion | |||||||||||||
| 0.08 %, plus | 0.05 | %, plus | 0.04 | % | |||||||||||
Amounts incurred for the six months ended December 31, 2021, are reflected on the Statements of Operations as Administration fees.
Citi Fund Services Ohio, Inc. ("Citi"), an affiliate of Citibank, acts as sub-administrator and sub-fund accountant to the Funds pursuant to the Sub-Administration and Sub-Fund Accounting Services Agreement between VCM and Citi. VCM pays Citi a fee for providing these services. The Trust reimburses VCM and Citi for out-of-pocket expenses incurred in providing these services and certain other expenses specifically allocated to the Funds. Amounts incurred for the six months ended December 31, 2021, are reflected on the Statements of Operations as Sub-Administration fees.
The Funds (as part of the Trust) have entered into an agreement with the Adviser to provide compliance services, pursuant to which the Adviser furnishes its compliance personnel, including the services of the Chief Compliance Officer ("CCO"), and other resources reasonably necessary to provide the Trust with compliance oversight services related to the design, administration, and oversight of a compliance program for the Trust in accordance with Rule 38a-1 under the 1940 Act. The CCO is an employee of the Adviser, which pays the compensation of the CCO and support staff. The funds in the Trust, Victory Variable Insurance Funds, Victory Portfolios, and USAA Mutual Funds (collectively, the "Victory Funds Complex") in the aggregate, compensate the Adviser for these services. Amounts incurred for the six months ended December 31, 2021, are reflected on the Statements of Operations as Compliance fees.
Transfer Agency Fees:
FIS Investor Services, LLC ("FIS") serves as the Funds' transfer agent. Under the Transfer Agent Agreement, the Trust pays FIS a fee for its services and reimburses FIS for all of their reasonable out-of-pocket expenses incurred in providing these services. Victory Capital Transfer Agency, Inc., an affiliate of the Adviser, serves as sub-transfer agent for the Member Class. Victory Capital Transfer Agency, Inc. receives no fee or other compensation for these services. Amounts incurred for the six months ended December 31, 2021, are reflected on the Statements of Operations as Transfer agent fees.
Distributor/Underwriting Services:
Victory Capital Services, Inc. (the "Distributor"), an affiliate of the Adviser, serves as distributor for the continuous offering of the shares of the Funds pursuant to a Distribution Agreement between the Distributor and the Trust.
Pursuant to the Distribution and Service Plans adopted in accordance with Rule 12b-1 under the 1940 Act, the Distributor may receive a monthly distribution and service fee as shown in the table below
Class A | Class C | ||||||||||
US 500 Enhanced Volatility Wtd Index Fund | 0.25 | % | 1.00 | % | |||||||
Market Neutral Income Fund | 0.25 | % | 1.00 | % | |||||||
The Plans are characterized as reimbursement plans since the distribution fees will be paid to the Distributor as reimbursement for, or in anticipation of, expenses incurred for distribution-related activity. If the aggregate payments received by the Distributor for a particular class of shares of the Funds in any fiscal year exceed the expenditures made by the Distributor in that year pursuant to the Plans, the Distributor will reimburse the Funds for the amount of the excess. For the six months ended December 31, 2021, the Distributor did not reimburse the Funds.
48
Victory Portfolios II | Notes to Financial Statements — continued December 31, 2021 | ||||||
(Unaudited)
The distribution and service fees paid to the Distributor may be used by the Distributor to pay for activities primarily intended to result in the sale of Class A and Class C. Amounts incurred for the six months ended December 31, 2021, are reflected on the Statements of Operations as 12b-1 fees.
In addition, the Distributor is entitled to receive commissions on sale of the Class A. For the six months ended December 31, 2021, the Distributor received approximately $3,744 from commissions earned on the sale of Class A. A $15 fee may be charged for redemptions made by wire. The redemption fee is paid directly to and retained by the Funds, and is designed to deter excessive short-term trading and to offset brokerage commissions, market impact and other costs that may be associated with short-term money movement in and out of the Funds.
Other Fees:
Citibank serves as the Funds' custodian. The Funds pay Citibank a fee for providing these services. Amounts incurred for the six months ended December 31, 2021, are reflected on the Statements of Operations as Custodian fees.
Sidley Austin LLP provides legal services to the Trust.
The Adviser has entered into an expense limitation agreement with the Funds. Under the terms of the agreements, the Adviser has agreed to waive fees or reimburse certain expenses to the extent that ordinary operating expenses incurred by certain classes of the Fund in any fiscal year exceed the expense limit for such classes of the Fund. Such excess amounts will be the liability of the Adviser. Acquired fund fees and expenses, interest, taxes, brokerage commissions, other expenditures which are capitalized in accordance with GAAP, and other extraordinary expenses not incurred in the ordinary course of a Fund's business are excluded from the expense limits. As of December 31, 2021, the expense limits (excluding voluntary waivers) are as follows:
In Effect Until October 31, 2022 | |||||||||||||||||||
Class A | Class C | Class I | Member Class | ||||||||||||||||
US 500 Enhanced Volatility Wtd Index Fund | 0.99 | % | 1.74 | % | 0.74 | % | N/A | ||||||||||||
Market Neutral Income Fund | 0.75 | % | 1.50 | % | 0.40 | % | 0.55 | % | |||||||||||
Under the terms of the expense limitation agreements, as amended May 1, 2021, the Funds have agreed to repay fees and expenses that were waived or reimbursed by the Adviser for a period of up to three years (thirty-six (36) months) after the waiver or reimbursement took place, subject to the lesser of any operating expense limits in effect at the time of: (a) the original waiver or expense reimbursement; or (b) the recoupment, after giving effect to the recoupment amount. Prior to May 1, 2021, the Funds were permitted to recoup fees waived and expenses reimbursed for up to three years after the fiscal year in which the waiver or reimbursement took place, subject to the limitations above. This change did not have any effect on the amounts previously reported for recoupment.
As of December 31, 2021, the following amounts are available to be repaid to the Adviser. The Funds have not recorded any amounts available to be repaid as a liability due to an assessment that repayments are not probable at December 31, 2021.
| Expires 2022 | Expires 2023 | Expires 2024 | Expires 2025 | Total | |||||||||||||||||||
| US 500 Enhanced Volatility Wtd Index Fund | $ | 144,445 | $ | 229,910 | $ | 170,552 | $ | 97,508 | $ | 642,415 | |||||||||||||
Market Neutral Income Fund | 155,692 | 670,257 | 1,612,292 | 1,068,478 | 3,506,719 | ||||||||||||||||||
The Adviser may voluntarily waive or reimburse additional fees to assist the Funds in maintaining competitive expense ratios. Voluntary waivers and reimbursements applicable to the Funds are not available to be recouped at a future time. There were no voluntary waivers or reimbursements for the six months ended December 31, 2021.
49
Victory Portfolios II | Notes to Financial Statements — continued December 31, 2021 | ||||||
(Unaudited)
Certain officers and/or interested trustees of the Funds are also officers and/or employees of the Adviser, administrator, fund accountant, sub-administrator, sub-fund accountant, custodian, legal counsel, and Distributor.
5. Risks:
The Funds may be subject to other risks in addition to these identified risks.
Equity Risk — An investment in the Funds' shares represents an indirect investment in the securities owned by the Funds, some of which will be traded on a national securities exchange or in the over-the-counter markets. The value of the securities in which the Funds invest, like other market investments, may move up or down, sometimes rapidly and unpredictably. The value of the securities in which the Funds invest may affect the value of the Funds' shares. An investment in the Funds' shares at any point in time may be worth less than the original investment, even after taking into account the reinvestment of the Funds' distributions.
Stock Market Risk — Overall stock market risks may affect the value of the Fund. Domestic and international factors such as political events, war, trade disputes, interest rate levels and other fiscal and monetary policy changes, pandemics and other public health crises and related geopolitical events, as well as environmental disasters such as earthquakes, fire and floods, may add to instability in world economies and markets generally. The impact of these and other factors may be short-term or may last for extended periods.
Large Capitalization Stock Risk — The securities of large capitalization companies may underperform the securities of smaller capitalization companies or the market as a whole. The growth rate of larger, more established companies may lag those of smaller companies, especially during periods of economic expansion.
Investment Style Risk — Different types of investment styles, for example growth or value, tend to perform differently and shift into and out of favor with investors depending on changes in market and economic sentiment and conditions. As a result, the Fund's performance may at times be worse than the performance of other mutual funds that invest more broadly or that have different investment styles.
6. Borrowing and Interfund Lending:
Line of Credit:
The Victory Funds Complex participates in a short-term demand note "Line of Credit" agreement with Citibank. The Line of Credit agreement with Citibank was renewed on June 28, 2021, with a termination date of June 27, 2022. Under the agreement with Citibank, the Victory Funds Complex may borrow up to $600 million, of which $300 million is committed and $300 million is uncommitted. $40 million of the Line of Credit is reserved for use by the Victory Floating Rate Fund, another series of the Victory Funds Complex, with Victory Floating Rate Fund paying the related commitment fees for that amount. The purpose of the Line of Credit is to meet temporary or emergency cash needs. For the six months ended December 31, 2021, Citibank received an annual commitment fee of 0.15% on $300 million for providing the Line of Credit. Each fund in the Victory Funds Complex pays a pro-rata portion of the commitment fees plus any interest (one-month London InterBank Offered Rate ("LIBOR") plus one percent, with LIBOR to be replaced by a different benchmark rate in accordance with the terms of the agreement) on amounts borrowed. Prior to June 28, 2021, the Victory Funds Complex paid an annual commitment fee of 0.15% and an upfront fee of 0.10%. Each fund in the Victory Funds Complex paid a pro-rata portion of the upfront fee. Interest charged to each fund during the period, if applicable, is reflected on the Statement of Operations under Line of credit fees.
The Funds had no borrowings under the Line of Credit agreement during the six months ended December 31, 2021.
50
Victory Portfolios II | Notes to Financial Statements — continued December 31, 2021 | ||||||
(Unaudited)
Interfund Lending:
The Trust and Adviser rely on an exemptive order granted by the SEC in March 2017 (the "Order"), permitting the establishment and operation of an Interfund Lending Facility (the "Facility"). The Facility allows each Fund to directly lend and borrow money to or from any other fund in the Victory Funds Complex that is permitted to participate in the Facility, relying upon the Order at rates beneficial to both the borrowing and lending funds. Advances under the Facility are allowed for temporary or emergency purposes, including the meeting of redemption requests that otherwise might require the untimely disposition of securities, and are subject to each Fund's borrowing restrictions. The interfund loan rate is determined, as specified in the Order, by averaging the current repurchase agreement rate and the current bank loan rate. As a Borrower, interest charged to each Fund, if any, during the period, is reflected on the Statements of Operations under Interfund lending fees. As a Lender, interest earned by each Fund, if any, during the period, is reflected on the Statements of Operations under Interest expense on interfund lending.
The Funds did not utilize or participate in the Facility during the six months ended December 31, 2021.
7. Federal Income Tax Information:
Dividends from net investment income, if any, are declared and paid as noted in the table below. Distributable net realized gains, if any, are declared and distributed at least annually from each Fund.
Declared | Paid | ||||||||||
US 500 Enhanced Volatility Wtd Index Fund | Quarterly | Quarterly | |||||||||
Market Neutral Income Fund | Monthly | Monthly | |||||||||
The amounts of dividends from net investment income and distributions from net realized gains (collectively, distributions to shareholders) are determined in accordance with federal income tax regulations, which may differ from GAAP. To the extent these "book/tax" differences are permanent in nature (e.g., net operating loss and distribution reclassification), such amounts are reclassified within the components of net assets based on their federal tax-basis treatment; temporary differences (e.g., wash sales) do not require reclassification. To the extent dividends and distributions exceed net investment income and net realized gains for tax purposes, they are reported as distributions of capital. Net investment losses incurred by the Funds may be reclassified as an offset to capital on the accompanying Statements of Assets and Liabilities.
The tax character of current year distributions paid and the tax basis of the current components of accumulated earnings (deficit) will be determined at the end of the current tax year ending June 30, 2022.
As of June 30, 2021, the Fund below had net capital loss carryforwards as shown in the table below. It is unlikely that the Board will authorize a distribution of capital gains realized in the future until the capital loss carryforwards have been used.
Long-Term | |||||||
Market Neutral Income Fund | $ | 70,633,978 | |||||
51
Victory Portfolios II | Supplemental Information December 31, 2021 | ||||||
(Unaudited)
Proxy Voting and Portfolio Holdings Information
Proxy Voting:
Information regarding the policies and procedures each Fund uses to determine how to vote proxies relating to portfolio securities is available without charge, upon request, by calling 800-539-3863. The information is also included in the Funds' Statement of Additional Information, which is available on the SEC's website at www.sec.gov.
Information relating to how the Funds voted proxies relating to portfolio securities held during the most recent 12 months ended June 30 is available on the SEC's website at www.sec.gov.
Availability of Schedules of Portfolio Investments:
The Trust files a complete list of Schedules of Portfolio Investments with the SEC for the first and third quarter of each fiscal year on Form N-PORT. Forms N-PORT are available on the SEC's website at www.sec.gov.
Expense Examples
As a shareholder of the Fund, you may incur two types of costs: (1) transaction costs, including sales charges (loads) on purchases; and (2) ongoing costs, including management fees and other Fund expenses. These examples are intended to help you understand your ongoing costs (in dollars) of investing in the Fund and to compare these costs with the ongoing costs of investing in other mutual funds.
These examples are based on an investment of $1,000 invested at the beginning of the period and held for the entire period from July 1, 2021, through December 31, 2021.
The Actual Expense figures in the table below provide information about actual account values and actual expenses. You may use the information below, together with the amount you invested, to estimate the expenses that you paid over the period. Simply divide your account value by $1,000 (for example, an $8,600 account value divided by $1,000 = 8.6), then multiply the result by the number in the table under the heading entitled "Actual Expenses Paid During Period" to estimate the expenses you paid on your account during this period.
The Hypothetical Expense figures in the table below provide information about hypothetical account values and hypothetical expenses based on the Fund's actual expense ratio and an assumed rate of return of 5% per year before expenses, which is not the Fund's actual return. The hypothetical account values and expenses may not be used to estimate the actual ending account balance or expenses you paid for the period. You may use this information to compare this 5% hypothetical example with the 5% hypothetical examples that appear in shareholder reports of other funds.
Please note the expenses shown in the table below are meant to highlight your ongoing costs only and do not reflect any transactional costs. Therefore, the hypothetical expenses in the table are useful in comparing ongoing costs only and will not help you determine the relative total costs of owning different funds. In addition, if these transactional costs were included, your costs would have been higher.
| Beginning Account Value 7/1/21 | Actual Ending Account Value 12/31/21 | Hypothetical Ending Account Value 12/31/21 | Actual Expenses Paid During Period 7/1/21-12/31/21* | Hypothetical Expenses Paid During Period 7/1/21-12/31/21* | Annualized Expense Ratio During Period 7/1/21-12/31/21 | ||||||||||||||||||||||
US 500 Enhanced Volatility Wtd Index Fund | |||||||||||||||||||||||||||
Class A | $ | 1,000.00 | $ | 1,094.50 | $ | 1,020.21 | $ | 5.23 | $ | 5.04 | 0.99 | % | |||||||||||||||
Class C | 1,000.00 | 1,090.60 | 1,016.43 | 9.17 | 8.84 | 1.74 | |||||||||||||||||||||
Class I | 1,000.00 | 1,095.70 | 1,021.48 | 3.91 | 3.77 | 0.74 | |||||||||||||||||||||
Market Neutral Income Fund | |||||||||||||||||||||||||||
Class A | 1,000.00 | 1,018.90 | 1,021.27 | 3.97 | 3.97 | 0.78 | % | ||||||||||||||||||||
Class C | 1,000.00 | 1,015.70 | 1,017.49 | 7.77 | 7.78 | 1.53 | |||||||||||||||||||||
Class I | 1,000.00 | 1,020.50 | 1,023.04 | 2.19 | 2.19 | 0.43 | |||||||||||||||||||||
Member Class | 1,000.00 | 1,020.00 | 1,022.28 | 2.95 | 2.96 | 0.58 | |||||||||||||||||||||
* Expenses are equal to the average account value multiplied by the Fund's annualized expense ratio multiplied by 184/365 (the number of days in the most recent fiscal half-year divided by the number of days in the fiscal year).
52
Victory Portfolios II | Supplemental Information — continued December 31, 2021 | ||||||
(Unaudited)
Considerations of the Board in Continuing the Investment Advisory Agreement (the "Agreement")
The Board approved the Agreement on behalf of each of the Funds at a meeting, which was called for that purpose, on November 30, 2021. The Board also considered information relating to the Funds and the Agreement provided throughout the year and, more specifically, at the meetings on October 19, 2021, and November 30, 2021. In considering whether to approve the Agreement, the Board requested, and the Adviser provided, information that the Board believed to be reasonably necessary to reach its conclusions.
The Board, including the Independent Trustees, evaluated this information along with other information obtained throughout the year and was advised by legal counsel to the Funds and independent legal counsel to the Independent Trustees. In addition, the Independent Trustees considered a past review of their overall process for conducting the annual review of the Funds' advisory arrangements by a consultant retained through their counsel.
The Board took into consideration regular reports from the Adviser throughout the COVID-19 pandemic public health crisis concerning how the ongoing pandemic has affected market volatility, investment risk, liquidity and valuation of portfolio securities, and the implementation and effectiveness of business continuity plans. These reports also had confirmed that the pandemic had no material impact on the Adviser's operations.
The Board considered each Fund's advisory fee, expense ratio and investment performance as significant factors in determining whether the Agreement should be continued. In considering whether the compensation paid to the Adviser was fair and reasonable, the Board also evaluated, among other things, the following factors:
• The requirements of the Funds for the services provided by the Adviser;
• The nature, quality and extent of the services provided and expected to be provided;
• The performance of the Funds as compared to comparable funds;
• The fees payable for the services and whether the fee arrangements provided for economies of scale that would benefit Fund shareholders as the Funds grow (acknowledging that economies of scale can be complex to assess and typically are not directly measurable);
• Whether the fee would be sufficient to enable the Adviser to attract and retain experienced personnel and continue to provide quality services to the Funds;
• The fees paid by other clients of the Adviser whose accounts are managed in a similar investment style and any differences in the services provided to the other clients compared to those provided to the Funds;
• The total expenses of each Fund;
• Management's commitment to operating the Funds at competitive expense levels;
• The profitability of the Adviser (as reflected by comparing fees earned against an estimate of the Adviser's costs) with respect to the Adviser's relationship with the Funds;
• Research and other service benefits received by the Adviser obtained through payment of client commissions for securities transactions;
• Other benefits received by the Adviser, and its affiliates, including revenues paid to the Adviser, or its affiliates, by the Funds for administration and fund accounting services, and distribution;
• The capabilities and financial condition of the Adviser;
• Current economic and industry trends; and
• The historical relationship between each Fund and the Adviser.
The Board reviewed each Fund's current management fee, comprised of the advisory fee plus the administrative services fee paid to the Adviser, in the context of the Adviser's profitability with respect to each Fund individually. The Board retained a consultant to provide comparative information about fees and performance. The Board met with the consultant to review its inputs and methodologies, among other things. The Board compared each Fund's gross management fee and total operating expense ratio on a net and gross basis with the median gross management fee and median expense ratio of a universe of comparable mutual funds compiled by the consultant and a peer group of funds with similar investment strategies selected by that consultant from the universe. The
53
Victory Portfolios II | Supplemental Information — continued December 31, 2021 | ||||||
(Unaudited)
Board reviewed the factors and methodology used by the consultant in the selection of each Fund's peer group, including the consultant's selection of a broad universe of funds, the more specific universe of comparable funds, and peer groups of funds with comparable investment strategies and asset levels, among other factors. The Board also reviewed any changes to the consultant's methodology as compared to the prior year, including those resulting from the Adviser's input, if any. The Board noted that none of the advisory fee arrangements for the Funds included breakpoints, which would be a structure that results in reduced fees as a fund grows. The Board also considered the Adviser's commitment to limit expenses as discussed in more detail below.
The Board also reviewed the compliance and administrative services provided to the Funds by the Adviser and its affiliates, including the Adviser's oversight of the Funds' day-to-day operations and oversight of Fund accounting, assistance in meeting legal and regulatory requirements, and other services necessary for the operation of the Funds and the Trust.
The Board found that the gross annual management fee paid by each Fund was within the range of management fees paid by each Fund's respective peer group. The Board also found that each Fund's Class A net annual expense ratio, taking into account any shareholder servicing or distribution fees, was reasonable as compared with each Fund's respective peer group. The Board considered the Adviser's contractual agreement with each Fund to waive its fees and reimburse expenses of certain classes for a specified period of time, as described in the Fund's prospectus.
The Board reviewed each Fund's performance over one- and three-year periods against the performance of the Fund's selected peer group and benchmark index. The Board recognized that the performance of the Funds and the peer group funds are net of expenses, while the performance of the benchmark index is gross returns.
The Board reviewed various other specific factors with respect to each Fund, as described below. In their deliberations, the Trustees did not rank the importance of any particular information or factor considered and each Trustee may have attributed different weights to various factors.
US 500 Enhanced Volatility Wtd Index Fund
Noting that the Fund commenced operations in 2012, the Board compared the Fund's Class A performance for the one-, three- and five-year periods ended June 30, 2021, to that of the median performance of the Fund's peer group for the same periods and considered the fact that the Fund underperformed both the benchmark index and the peer group median for all of the periods reviewed. The Board noted that the Fund's investment objective is to track its benchmark index before fees and expenses. The Board recognized that the performance of the Fund is net of expenses, while the performance of the benchmark index is gross returns and as a result, the Fund generally will underperform its benchmark due to fees and expenses. The Board discussed with the Adviser the Fund's rules-based rebalancing in light of market conditions and that the Fund performed in accordance with the Adviser's expectations.
Having considered, among other things: (1) the Fund's management fee compared to comparable mutual funds; (2) the Fund's total expense ratio compared to comparable mutual funds; (3) that the Adviser's willingness to limit the expenses of certain classes for a period of time would provide stability to the Fund's expenses for those share classes during that period; and (4) the Fund's performance during the periods reviewed, the Board concluded that the Agreement continued to be in the best interests of the Fund's shareholders.
Market Neutral Income Fund
Noting that the Fund commenced operations in 2012, the Board compared the Fund's Class A performance for the one-, three- and five-year periods ended June 30, 2021, to that of the median performance of the Fund's peer group and benchmark index for the same periods and considered the fact that the Fund outperformed both the benchmark index and the peer group median for all of the periods reviewed.
Having considered, among other things: (1) the Fund's management fee compared to comparable mutual funds; (2) the Fund's total expense ratio compared to comparable mutual funds; (3) that the Adviser's willingness to limit the expenses of certain classes for a period of time would provide stability to the Fund's expenses for those share classes during that period; and (4) the Fund's performance during the periods reviewed, the Board concluded that the Agreement continued to be in the best interests of the Fund's shareholders.
54
Victory Portfolios II | Supplemental Information — continued December 31, 2021 | ||||||
(Unaudited)
Conclusion
Based on its review of the information requested and provided, and following extended discussions, the Board determined that the Agreement, on behalf of the Funds discussed above, was consistent with the best interests of each Fund and its shareholders, and the Board unanimously approved the Agreement, on behalf of each Fund, for an additional annual period on the basis of the foregoing review and discussions and the following considerations, among others:
• The fairness and reasonableness of the investment advisory fee payable to the Adviser under the Agreement in light of the investment advisory services provided, the costs of these services, the profitability of the Adviser's relationship with the Fund and the comparability of the fee paid to the fees paid by other investment companies;
• The nature, quality and extent of the investment advisory services provided by the Adviser;
• The Adviser's entrepreneurial commitment to the management of the Funds and the creation of a broad-based family of funds, which could entail a substantial commitment of the Adviser's resources to the successful operation of the Funds;
• The Adviser's representations regarding its staffing and capabilities to manage the Funds, including the retention of personnel with relevant portfolio management experience;
• The Adviser's efforts to enhance investment results by, among other things, developing quality portfolio management teams; and
• The overall high quality of the personnel, operations, financial condition, investment management capabilities, methodologies and performance of the Adviser.
55
Privacy Policy
Protecting the Privacy of Information
The Trust respects your right to privacy. We also know that you expect us to conduct and process your business in an accurate and efficient manner. To do so, we must collect and maintain certain personal information about you. This is the information we collect from you on applications or other forms, and from the transactions you make with us or third parties. It may include your name, address, social security number, account transactions and balances, and information about investment goals and risk tolerance.
We do not disclose any information about you or about former customers to anyone except as permitted or required by law. Specifically, we may disclose the information we collect to companies that perform services on our behalf, such as the transfer agent that processes shareholder accounts and printers and mailers that assist us in the distribution of investor materials. We may also disclose this information to companies that perform marketing services on our behalf. This allows us to continue to offer you Victory investment products and services that meet your investing needs, and to effect transactions that you request or authorize. These companies will use this information only in connection with the services for which we hired them. They are not permitted to use or share this information for any other purpose.
To protect your personal information internally, we permit access only by authorized employees and maintain physical, electronic, and procedural safeguards to guard your personal information.*
* You may have received communications regarding information about privacy policies from other financial institutions which gave you the opportunity to "opt-out" of certain information sharing with companies which are not affiliated with that financial institution. The Trust does not share information with other companies for purposes of marketing solicitations for products other than the Trust. Therefore, the Trust does not provide opt-out options to their shareholders.
Victory Funds
P.O. Box 182593
Columbus, Ohio 43218-2593

Visit our website at: | Call Victory at: | ||||||
www.vcm.com | 800-539-FUND (800-539-3863) | ||||||
| 800-235-8396 for Member Class | |||||||
VP-COMPASS-SAR (12/21)

December 31, 2021
Semi Annual Report
VictoryShares US 500 Volatility Wtd ETF
VictoryShares US Small Cap Volatility Wtd ETF
VictoryShares International Volatility Wtd ETF
VictoryShares US Large Cap High Div Volatility Wtd ETF
VictoryShares US Small Cap High Div Volatility Wtd ETF
VictoryShares International High Div Volatility Wtd ETF
VictoryShares Emerging Market High Div Volatility Wtd ETF
VictoryShares Dividend Accelerator ETF
VictoryShares US Multi-Factor Minimum Volatility ETF
VictoryShares US 500 Enhanced Volatility Wtd ETF
VictoryShares US EQ Income Enhanced Volatility Wtd ETF
VictoryShares US Discovery Enhanced Volatility Wtd ETF
VictoryShares Developed Enhanced Volatility Wtd ETF
VictoryShares Nasdaq Next 50 ETF
VictoryShares ESG Core Plus Bond ETF
VictoryShares ESG Corporate Bond ETF
VictoryShares THB Mid Cap ESG ETF
www.vcm.com
News, Information And Education 24 Hours A Day, 7 Days A Week
The Victory Capital website gives fund shareholders, prospective shareholders, and investment professionals a convenient way to access fund information, get guidance, and track fund performance anywhere they can access the Internet. The site includes:
• Detailed performance records
• Daily share prices
• The latest fund news
• Investment resources to help you become a better investor
• A section dedicated to investment professionals
Whether you're a potential investor searching for the fund that matches your investment philosophy, a seasoned investor interested in planning tools, or an investment professional, www.vcm.com has what you seek. Visit us anytime. We're always open.
Victory Portfolios II
TABLE OF CONTENTS
| Investment Objective & Portfolio Holdings (Unaudited) | 2 | ||||||
Schedules of Portfolio Investments | |||||||
VictoryShares US 500 Volatility Wtd ETF | 19 | ||||||
VictoryShares US Small Cap Volatility Wtd ETF | 31 | ||||||
VictoryShares International Volatility Wtd ETF | 43 | ||||||
| VictoryShares US Large Cap High Div Volatility Wtd ETF | 63 | ||||||
| VictoryShares US Small Cap High Div Volatility Wtd ETF | 67 | ||||||
| VictoryShares International High Div Volatility Wtd ETF | 71 | ||||||
| VictoryShares Emerging Market High Div Volatility Wtd ETF | 77 | ||||||
VictoryShares Dividend Accelerator ETF | 83 | ||||||
VictoryShares US Multi-Factor Minimum Volatility ETF | 86 | ||||||
VictoryShares US 500 Enhanced Volatility Wtd ETF | 89 | ||||||
| VictoryShares US EQ Income Enhanced Volatility Wtd ETF | 101 | ||||||
| VictoryShares US Discovery Enhanced Volatility Wtd ETF | 105 | ||||||
VictoryShares Developed Enhanced Volatility Wtd ETF | 117 | ||||||
VictoryShares Nasdaq Next 50 ETF | 137 | ||||||
VictoryShares ESG Core Plus Bond ETF | 139 | ||||||
VictoryShares ESG Corporate Bond ETF | 150 |
| |||||
VictoryShares THB Mid Cap ESG ETF | 156 | ||||||
Financial Statements | |||||||
Statements of Assets and Liabilities | 158 | ||||||
Statements of Operations | 164 | ||||||
Statements of Changes in Net Assets | 170 | ||||||
Financial Highlights | 176 | ||||||
Notes to Financial Statements | 188 | ||||||
Supplemental Information (Unaudited) | |||||||
Proxy Voting and Portfolio Holdings Information | 206 | ||||||
Expense Examples | 206 | ||||||
Advisory Contract Approval | 208 | ||||||
Privacy Policy (inside back cover) | |||||||
1
| Victory Portfolios II VictoryShares US 500 Volatility Wtd ETF | December 31, 2021 | ||||||
(Unaudited)
Investment Objective and Portfolio Holdings:
The Fund seeks to provide investment results that track the performance of the Nasdaq Victory US Large Cap 500 Volatility Weighted Index before fees and expenses.
Top 10 Holdings*:
December 31, 2021
(% of Net Assets)
The Procter & Gamble Co. | 0.4 | % | |||||
The Hershey Co. | 0.4 | % | |||||
Costco Wholesale Corp. | 0.4 | % | |||||
PepsiCo, Inc. | 0.4 | % | |||||
Church & Dwight Co., Inc. | 0.4 | % | |||||
Colgate-Palmolive Co. | 0.4 | % | |||||
Cerner Corp. | 0.4 | % | |||||
McDonald's Corp. | 0.4 | % | |||||
McCormick & Co., Inc. | 0.3 | % | |||||
The Coca-Cola Co. | 0.3 | % | |||||
Sector Allocation*:
December 31, 2021
(% of Net Assets)
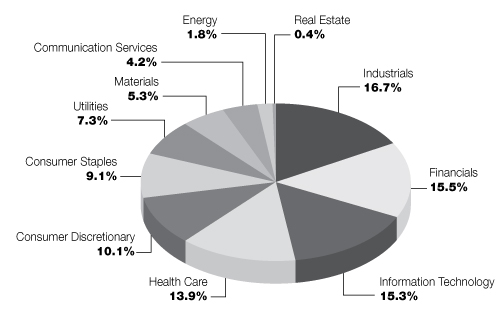
* Does not include futures contracts, money market instruments, and short-term investments purchased with cash collateral from securities loaned.
Percentages are of the net assets of the Fund and may not equal 100%.
Refer to the Schedule of Portfolio Investments for a complete list of securities.
2
| Victory Portfolios II VictoryShares US Small Cap Volatility Wtd ETF | December 31, 2021 | ||||||
(Unaudited)
Investment Objective and Portfolio Holdings:
The Fund seeks to provide investment results that track the performance of the Nasdaq Victory US Small Cap 500 Volatility Weighted Index before fees and expenses.
Top 10 Holdings*:
December 31, 2021
(% of Net Assets)
TTM Technologies, Inc. | 0.6 | % | |||||
Otter Tail Corp. | 0.5 | % | |||||
CSG Systems International, Inc. | 0.4 | % | |||||
Hostess Brands, Inc. | 0.4 | % | |||||
Mesa Laboratories, Inc. | 0.4 | % | |||||
Columbia Financial, Inc. | 0.4 | % | |||||
Encore Wire Corp. | 0.4 | % | |||||
Carriage Services, Inc. | 0.4 | % | |||||
Knowles Corp. | 0.4 | % | |||||
CBIZ, Inc. | 0.4 | % | |||||
Sector Allocation*:
December 31, 2021
(% of Net Assets)

* Does not include futures contracts, money market instruments, and short-term investments purchased with cash collateral from securities loaned.
Percentages are of the net assets of the Fund and may not equal 100%.
Refer to the Schedule of Portfolio Investments for a complete list of securities.
3
| Victory Portfolios II VictoryShares International Volatility Wtd ETF | December 31, 2021 | ||||||
(Unaudited)
Investment Objective and Portfolio Holdings:
The Fund seeks to provide investment results that track the performance of the Nasdaq Victory International 500 Volatility Weighted Index before fees and expenses.
Top 10 Holdings*:
December 31, 2021
(% of Net Assets)
Emera, Inc. | 0.5 | % | |||||
Fortis, Inc. | 0.5 | % | |||||
Royal Bank of Canada | 0.5 | % | |||||
Hydro One Ltd. | 0.5 | % | |||||
The Toronto-Dominion Bank | 0.4 | % | |||||
The Bank of Nova Scotia | 0.4 | % | |||||
BCE, Inc. | 0.4 | % | |||||
SGS SA, Registered Shares | 0.4 | % | |||||
Canadian Imperial Bank of Commerce | 0.4 | % | |||||
Nestle SA, Registered Shares | 0.4 | % | |||||
Sector Allocation*:
December 31, 2021
(% of Net Assets)

* Does not include futures contracts, money market instruments, and short-term investments purchased with cash collateral from securities loaned.
Percentages are of the net assets of the Fund and may not equal 100%.
Refer to the Schedule of Portfolio Investments for a complete list of securities.
4
| Victory Portfolios II VictoryShares US Large Cap High Div Volatility Wtd ETF | December 31, 2021 | ||||||
(Unaudited)
Investment Objective and Portfolio Holdings:
The Fund seeks to provide investment results that track the performance of the Nasdaq Victory US Large Cap High Dividend 100 Volatility Weighted Index before fees and expenses.
Top 10 Holdings*:
December 31, 2021
(% of Net Assets)
Costco Wholesale Corp. | 1.7 | % | |||||
PepsiCo, Inc. | 1.7 | % | |||||
The Coca-Cola Co. | 1.5 | % | |||||
Consolidated Edison, Inc. | 1.5 | % | |||||
Johnson & Johnson | 1.5 | % | |||||
Verizon Communications, Inc. | 1.5 | % | |||||
Kimberly-Clark Corp. | 1.4 | % | |||||
The Southern Co. | 1.4 | % | |||||
General Mills, Inc. | 1.4 | % | |||||
Duke Energy Corp. | 1.4 | % | |||||
Sector Allocation*:
December 31, 2021
(% of Net Assets)

* Does not include futures contracts, money market instruments, and short-term investments purchased with cash collateral from securities loaned.
Percentages are of the net assets of the Fund and may not equal 100%.
Refer to the Schedule of Portfolio Investments for a complete list of securities.
5
| Victory Portfolios II VictoryShares US Small Cap High Div Volatility Wtd ETF | December 31, 2021 | ||||||
(Unaudited)
Investment Objective and Portfolio Holdings:
The Fund seeks to provide investment results that track the performance of the Nasdaq Victory US Small Cap High Dividend 100 Volatility Weighted Index before fees and expenses.
Top 10 Holdings*:
December 31, 2021
(% of Net Assets)
Otter Tail Corp. | 2.0 | % | |||||
CSG Systems International, Inc. | 1.9 | % | |||||
Chesapeake Utilities Corp. | 1.6 | % | |||||
MGE Energy, Inc. | 1.6 | % | |||||
SJW Group | 1.5 | % | |||||
Northwest Bancshares, Inc. | 1.4 | % | |||||
Safety Insurance Group, Inc. | 1.4 | % | |||||
Avista Corp. | 1.4 | % | |||||
Kforce, Inc. | 1.4 | % | |||||
Franchise Group, Inc. | 1.4 | % | |||||
Sector Allocation*:
December 31, 2021
(% of Net Assets)

* Does not include futures contracts, money market instruments, and short-term investments purchased with cash collateral from securities loaned.
Percentages are of the net assets of the Fund and may not equal 100%.
Refer to the Schedule of Portfolio Investments for a complete list of securities.
6
| Victory Portfolios II VictoryShares International High Div Volatility Wtd ETF | December 31, 2021 | ||||||
(Unaudited)
Investment Objective and Portfolio Holdings:
The Fund seeks to provide investment results that track the performance of the Nasdaq Victory International High Dividend 100 Volatility Weighted Index before fees and expenses.
Top 10 Holdings*:
December 31, 2021
(% of Net Assets)
Emera, Inc. | 2.3 | % | |||||
Fortis, Inc. | 2.2 | % | |||||
The Bank of Nova Scotia | 1.9 | % | |||||
BCE, Inc. | 1.9 | % | |||||
TELUS Corp. | 1.8 | % | |||||
Great-West Lifeco, Inc. | 1.7 | % | |||||
CLP Holdings Ltd. | 1.6 | % | |||||
Softbank Corp. | 1.4 | % | |||||
National Grid PLC | 1.4 | % | |||||
Snam SpA | 1.4 | % | |||||
Sector Allocation*:
December 31, 2021
(% of Net Assets)

* Does not include futures contracts, money market instruments, and short-term investments purchased with cash collateral from securities loaned.
Percentages are of the net assets of the Fund and may not equal 100%.
Refer to the Schedule of Portfolio Investments for a complete list of securities.
7
| Victory Portfolios II VictoryShares Emerging Market High Div Volatility Wtd ETF | December 31, 2021 | ||||||
(Unaudited)
Investment Objective and Portfolio Holdings:
The Fund seeks to provide investment results that track the performance of the Nasdaq Victory Emerging Market High Dividend 100 Volatility Weighted Index before fees and expenses.
Top 10 Holdings*:
December 31, 2021
(% of Net Assets)
Far EasTone Telecommunications Co. Ltd. | 2.4 | % | |||||
Taiwan Mobile Co. Ltd. | 2.1 | % | |||||
Mega Financial Holding Co. Ltd. | 2.0 | % | |||||
Mobile TeleSystems PJSC | 1.8 | % | |||||
SinoPac Financial Holdings Co. Ltd. | 1.7 | % | |||||
Bank of China Ltd., Class H | 1.6 | % | |||||
Rostelecom PJSC | 1.5 | % | |||||
Inter RAO UES PJSC | 1.4 | % | |||||
Tenaga Nasional Bhd | 1.4 | % | |||||
Arca Continental SAB de CV | 1.4 | % | |||||
Sector Allocation*:
December 31, 2021
(% of Net Assets)

* Does not include futures contracts, money market instruments, and short-term investments purchased with cash collateral from securities loaned.
Percentages are of the net assets of the Fund and may not equal 100%.
Refer to the Schedule of Portfolio Investments for a complete list of securities.
8
| Victory Portfolios II VictoryShares Dividend Accelerator ETF | December 31, 2021 | ||||||
(Unaudited)
Investment Objective and Portfolio Holdings:
The Fund seeks to provide investment results that track the performance of the Nasdaq Victory Dividend Accelerator Index before fees and expenses.
Top 10 Holdings*:
December 31, 2021
(% of Net Assets)
3M Co. | 3.0 | % | |||||
McDonald's Corp. | 3.0 | % | |||||
Xcel Energy, Inc. | 2.8 | % | |||||
ResMed, Inc. | 2.6 | % | |||||
Alliant Energy Corp. | 2.4 | % | |||||
Consolidated Edison, Inc. | 2.3 | % | |||||
Aon PLC, Class A | 2.3 | % | |||||
W.W. Grainger, Inc. | 2.3 | % | |||||
Dollar General Corp. | 2.0 | % | |||||
Dover Corp. | 2.0 | % | |||||
Sector Allocation*:
December 31, 2021
(% of Net Assets)

* Does not include futures contracts, money market instruments, and short-term investments purchased with cash collateral from securities loaned.
Percentages are of the net assets of the Fund and may not equal 100%.
Refer to the Schedule of Portfolio Investments for a complete list of securities.
9
| Victory Portfolios II VictoryShares US Multi-Factor Minimum Volatility ETF | December 31, 2021 | ||||||
(Unaudited)
Investment Objective and Portfolio Holdings:
The Fund seeks to provide investment results that track the performance of the Nasdaq Victory US Multi-Factor Minimum Volatility Index before fees and expenses.
Top 10 Holdings*:
December 31, 2021
(% of Net Assets)
Microsoft Corp. | 9.0 | % | |||||
Apple, Inc. | 8.3 | % | |||||
AbbVie, Inc. | 3.9 | % | |||||
Johnson & Johnson | 3.9 | % | |||||
AutoZone, Inc. | 3.4 | % | |||||
Walmart, Inc. | 3.3 | % | |||||
O'Reilly Automotive, Inc. | 3.2 | % | |||||
Automatic Data Processing, Inc. | 3.2 | % | |||||
Waste Management, Inc. | 3.2 | % | |||||
The Kroger Co. | 3.1 | % | |||||
Sector Allocation*:
December 31, 2021
(% of Net Assets)

* Does not include futures contracts, money market instruments, and short-term investments purchased with cash collateral from securities loaned.
Percentages are of the net assets of the Fund and may not equal 100%.
Refer to the Schedule of Portfolio Investments for a complete list of securities.
10
| Victory Portfolios II VictoryShares US 500 Enhanced Volatility Wtd ETF | December 31, 2021 | ||||||
(Unaudited)
Investment Objective and Portfolio Holdings:
The Fund seeks to provide investment results that track the performance of the Nasdaq Victory US Large Cap 500 Long/Cash Volatility Weighted Index before fees and expenses.
Top 10 Holdings*:
December 31, 2021
(% of Net Assets)
The Procter & Gamble Co. | 0.4 | % | |||||
The Hershey Co. | 0.4 | % | |||||
Costco Wholesale Corp. | 0.4 | % | |||||
PepsiCo, Inc. | 0.4 | % | |||||
Church & Dwight Co., Inc. | 0.4 | % | |||||
Colgate-Palmolive Co. | 0.4 | % | |||||
Cerner Corp. | 0.4 | % | |||||
McDonald's Corp. | 0.4 | % | |||||
McCormick & Co., Inc. | 0.3 | % | |||||
The Coca-Cola Co. | 0.3 | % | |||||
Sector Allocation*:
December 31, 2021
(% of Net Assets)

* Does not include futures contracts, money market instruments, and short-term investments purchased with cash collateral from securities loaned.
Percentages are of the net assets of the Fund and may not equal 100%.
Refer to the Schedule of Portfolio Investments for a complete list of securities.
11
| Victory Portfolios II VictoryShares US EQ Income Enhanced Volatility Wtd ETF | December 31, 2021 | ||||||
(Unaudited)
Investment Objective and Portfolio Holdings:
The Fund seeks to provide investment results that track the performance of the Nasdaq Victory US Large Cap High Dividend 100 Long/Cash Volatility Weighted Index before fees and expenses.
Top 10 Holdings*:
December 31, 2021
(% of Net Assets)
Costco Wholesale Corp. | 1.7 | % | |||||
PepsiCo, Inc. | 1.7 | % | |||||
The Coca-Cola Co. | 1.5 | % | |||||
Consolidated Edison, Inc. | 1.5 | % | |||||
Johnson & Johnson | 1.5 | % | |||||
Verizon Communications, Inc. | 1.5 | % | |||||
Kimberly-Clark Corp. | 1.4 | % | |||||
The Southern Co. | 1.4 | % | |||||
General Mills, Inc. | 1.4 | % | |||||
Duke Energy Corp. | 1.4 | % | |||||
Sector Allocation*:
December 31, 2021
(% of Net Assets)

* Does not include futures contracts, money market instruments, and short-term investments purchased with cash collateral from securities loaned.
Percentages are of the net assets of the Fund and may not equal 100%.
Refer to the Schedule of Portfolio Investments for a complete list of securities.
12
| Victory Portfolios II VictoryShares US Discovery Enhanced Volatility Wtd ETF | December 31, 2021 | ||||||
(Unaudited)
Investment Objective and Portfolio Holdings:
The Fund seeks to provide investment results that track the performance of the Nasdaq Victory US Small Cap High Dividend 500 Long/Cash Volatility Weighted Index before fees and expenses.
Top 10 Holdings*:
December 31, 2021
(% of Net Assets)
TTM Technologies, Inc. | 0.6 | % | |||||
Otter Tail Corp. | 0.5 | % | |||||
CSG Systems International, Inc. | 0.4 | % | |||||
Hostess Brands, Inc. | 0.4 | % | |||||
Mesa Laboratories, Inc. | 0.4 | % | |||||
Columbia Financial, Inc. | 0.4 | % | |||||
Encore Wire Corp. | 0.4 | % | |||||
Carriage Services, Inc. | 0.4 | % | |||||
Knowles Corp. | 0.4 | % | |||||
CBIZ, Inc. | 0.4 | % | |||||
Sector Allocation*:
December 31, 2021
(% of Net Assets)

* Does not include futures contracts, money market instruments, and short-term investments purchased with cash collateral from securities loaned.
Percentages are of the net assets of the Fund and may not equal 100%.
Refer to the Schedule of Portfolio Investments for a complete list of securities.
13
| Victory Portfolios II VictoryShares Developed Enhanced Volatility Wtd ETF | December 31, 2021 | ||||||
(Unaudited)
Investment Objective and Portfolio Holdings:
The Fund seeks to provide investment results that track the performance of the Nasdaq Victory International 500 Long/Cash Volatility Weighted Index before fees and expenses.
Top 10 Holdings*:
December 31, 2021
(% of Net Assets)
Emera, Inc. | 0.5 | % | |||||
Fortis, Inc. | 0.5 | % | |||||
Royal Bank of Canada | 0.5 | % | |||||
Hydro One Ltd. | 0.5 | % | |||||
The Toronto-Dominion Bank | 0.4 | % | |||||
The Bank of Nova Scotia | 0.4 | % | |||||
BCE, Inc. | 0.4 | % | |||||
SGS SA, Registered Shares | 0.4 | % | |||||
Canadian Imperial Bank of Commerce | 0.4 | % | |||||
Nestle SA, Registered Shares | 0.4 | % | |||||
Sector Allocation*:
December 31, 2021
(% of Net Assets)
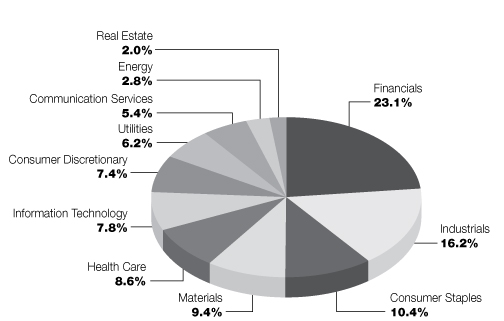
* Does not include futures contracts, money market instruments, and short-term investments purchased with cash collateral from securities loaned.
Percentages are of the net assets of the Fund and may not equal 100%.
Refer to the Schedule of Portfolio Investments for a complete list of securities.
14
| Victory Portfolios II VictoryShares Nasdaq Next 50 ETF | December 31, 2021 | ||||||
(Unaudited)
Investment Objective and Portfolio Holdings:
The Fund seeks to provide investment results that track the performance of the Nasdaq Q-50 Index before fees and expenses.
Top 10 Holdings*:
December 31, 2021
(% of Net Assets)
Old Dominion Freight Line, Inc. | 3.5 | % | |||||
The Trade Desk, Inc., Class A | 3.5 | % | |||||
AstraZeneca PLC | 3.0 | % | |||||
MongoDB, Inc. | 3.0 | % | |||||
Zebra Technologies Corp. | 2.7 | % | |||||
CoStar Group, Inc. | 2.7 | % | |||||
ON Semiconductor Corp. | 2.5 | % | |||||
CDW Corp. | 2.4 | % | |||||
Etsy, Inc. | 2.4 | % | |||||
Cerner Corp. | 2.3 | % | |||||
Sector Allocation*:
December 31, 2021
(% of Net Assets)

* Does not include futures contracts, money market instruments, and short-term investments purchased with cash collateral from securities loaned.
Percentages are of the net assets of the Fund and may not equal 100%.
Refer to the Schedule of Portfolio Investments for a complete list of securities.
15
| Victory Portfolios II VictoryShares ESG Core Plus Bond ETF | December 31, 2021 | ||||||
(Unaudited)
Investment Objective and Portfolio Holdings:
The Fund seeks to provide high current income without undue risk to principal.
Asset Allocation*:
December 31, 2021
(% of Net Assets)

* Does not include futures contracts, money market instruments, and short-term investments purchased with cash collateral from securities loaned.
Percentages are of the net assets of the Fund and may not equal 100%.
Refer to the Schedule of Portfolio Investments for a complete list of securities.
16
| Victory Portfolios II VictoryShares ESG Corporate Bond ETF | December 31, 2021 | ||||||
(Unaudited)
Investment Objective and Portfolio Holdings:
The Fund seeks to provide maximum current income without undue risk to principal.
Asset Allocation*:
December 31, 2021
(% of Net Assets)
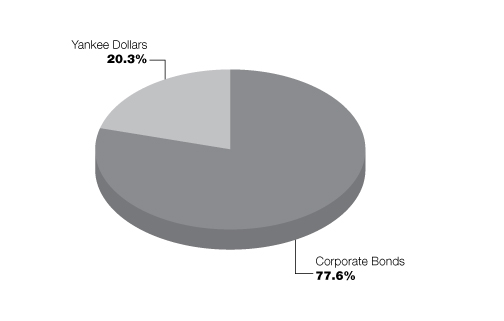
* Does not include futures contracts, money market instruments, and short-term investments purchased with cash collateral from securities loaned.
Percentages are of the net assets of the Fund and may not equal 100%.
Refer to the Schedule of Portfolio Investments for a complete list of securities.
17
| Victory Portfolios II VictoryShares THB Mid Cap ESG ETF | December 31, 2021 | ||||||
(Unaudited)
Investment Objective and Portfolio Holdings:
The Fund seeks to provide capital appreciation.
Top 10 Holdings*:
December 31, 2021
(% of Net Assets)
Copart, Inc. | 4.7 | % | |||||
Cadence Design Systems, Inc. | 4.6 | % | |||||
Amphenol Corp., Class A | 4.4 | % | |||||
Verisk Analytics, Inc. | 4.1 | % | |||||
Waters Corp. | 4.1 | % | |||||
J.B. Hunt Transport Services, Inc. | 3.8 | % | |||||
Tyler Technologies, Inc. | 3.8 | % | |||||
NVR, Inc. | 3.7 | % | |||||
Synopsys, Inc. | 3.7 | % | |||||
Zebra Technologies Corp. | 3.6 | % | |||||
Sector Allocation*:
December 31, 2021
(% of Net Assets)

* Does not include futures contracts, money market instruments, and short-term investments purchased with cash collateral from securities loaned.
Percentages are of the net assets of the Fund and may not equal 100%.
Refer to the Schedule of Portfolio Investments for a complete list of securities.
18
| Victory Portfolios II VictoryShares US 500 Volatility Wtd ETF | Schedule of Portfolio Investments December 31, 2021 | ||||||
(Unaudited)
Security Description | Shares | Value | |||||||||
Common Stocks (99.6%) | |||||||||||
Communication Services (4.2%): | |||||||||||
Activision Blizzard, Inc. | 14,601 | $ | 971,404 | ||||||||
Alphabet, Inc., Class A (a) | 475 | 1,376,094 | |||||||||
Altice USA, Inc., Class A (a) | 41,620 | 673,412 | |||||||||
Cable One, Inc. | 612 | 1,079,231 | |||||||||
Charter Communications, Inc., Class A (a) | 1,745 | 1,137,688 | |||||||||
Comcast Corp., Class A | 25,575 | 1,287,190 | |||||||||
Discovery, Inc., Class A (a) (b) | 20,245 | 476,567 | |||||||||
DISH Network Corp., Class A (a) | 20,038 | 650,033 | |||||||||
Electronic Arts, Inc. | 10,328 | 1,362,263 | |||||||||
Fox Corp., Class A | 23,453 | 865,416 | |||||||||
IAC/InterActiveCorp (a) | 5,783 | 755,896 | |||||||||
Liberty Broadband Corp., Class C (a) | 7,256 | 1,168,942 | |||||||||
Match Group, Inc. (a) | 5,722 | 756,734 | |||||||||
Meta Platforms, Inc., Class A (a) | 3,110 | 1,046,048 | |||||||||
Netflix, Inc. (a) | 1,752 | 1,055,475 | |||||||||
News Corp., Class A | 52,771 | 1,177,321 | |||||||||
Omnicom Group, Inc. | 17,721 | 1,298,418 | |||||||||
Pinterest, Inc., Class A (a) | 10,676 | 388,073 | |||||||||
Roku, Inc. (a) | 1,665 | 379,953 | |||||||||
Sirius XM Holdings, Inc. (b) | 181,953 | 1,155,402 | |||||||||
Take-Two Interactive Software, Inc. (a) | 7,023 | 1,248,128 | |||||||||
The Interpublic Group of Cos., Inc. | 30,041 | 1,125,035 | |||||||||
The Walt Disney Co. (a) | 7,547 | 1,168,955 | |||||||||
T-Mobile U.S., Inc. (a) | 10,601 | 1,229,504 | |||||||||
Twitter, Inc. (a) | 11,740 | 507,403 | |||||||||
Verizon Communications, Inc. | 42,816 | 2,224,719 | |||||||||
ViacomCBS, Inc., Class B | 12,202 | 368,256 | |||||||||
Warner Music Group Corp., Class A | 25,450 | 1,098,931 | |||||||||
Zillow Group, Inc., Class C (a) (b) | 6,018 | 384,249 | |||||||||
ZoomInfo Technologies, Inc. (a) | 9,732 | 624,794 | |||||||||
29,041,534 | |||||||||||
Consumer Discretionary (10.1%): | |||||||||||
Advance Auto Parts, Inc. | 6,369 | 1,527,796 | |||||||||
Amazon.com, Inc. (a) | 403 | 1,343,739 | |||||||||
Aptiv PLC (a) | 6,514 | 1,074,484 | |||||||||
AutoZone, Inc. (a) | 991 | 2,077,522 | |||||||||
Bath & Body Works, Inc. | 10,869 | 758,548 | |||||||||
Best Buy Co., Inc. | 9,068 | 921,309 | |||||||||
Booking Holdings, Inc. (a) | 454 | 1,089,250 | |||||||||
Burlington Stores, Inc. (a) | 3,148 | 917,673 | |||||||||
CarMax, Inc. (a) | 7,655 | 996,911 | |||||||||
Chewy, Inc., Class A (a) (b) | 6,935 | 408,957 | |||||||||
Chipotle Mexican Grill, Inc. (a) | 620 | 1,083,915 | |||||||||
D.R. Horton, Inc. | 10,339 | 1,121,265 | |||||||||
Darden Restaurants, Inc. | 7,168 | 1,079,788 | |||||||||
Deckers Outdoor Corp. (a) | 2,315 | 848,008 | |||||||||
Dick's Sporting Goods, Inc. (b) | 5,552 | 638,424 | |||||||||
See notes to financial statements.
19
| Victory Portfolios II VictoryShares US 500 Volatility Wtd ETF | Schedule of Portfolio Investments — continued December 31, 2021 | ||||||
(Unaudited)
Security Description | Shares | Value | |||||||||
Dollar General Corp. | 7,053 | $ | 1,663,309 | ||||||||
Dollar Tree, Inc. (a) | 13,384 | 1,880,720 | |||||||||
Domino's Pizza, Inc. | 2,417 | 1,363,986 | |||||||||
eBay, Inc. | 12,898 | 857,717 | |||||||||
Etsy, Inc. (a) | 2,607 | 570,777 | |||||||||
Five Below, Inc. (a) | 4,497 | 930,384 | |||||||||
Floor & Decor Holdings, Inc., Class A (a) | 6,918 | 899,409 | |||||||||
Ford Motor Co. | 63,319 | 1,315,136 | |||||||||
Garmin Ltd. | 10,132 | 1,379,674 | |||||||||
General Motors Co. (a) | 17,619 | 1,033,002 | |||||||||
Genuine Parts Co. | 11,940 | 1,673,988 | |||||||||
Hasbro, Inc. | 13,530 | 1,377,083 | |||||||||
Lennar Corp., Class A | 7,961 | 924,750 | |||||||||
Levi Strauss & Co., Class A | 34,439 | 862,008 | |||||||||
LKQ Corp. | 24,595 | 1,476,438 | |||||||||
Lowe's Cos., Inc. | 6,397 | 1,653,497 | |||||||||
Marriott International, Inc., Class A (a) | 8,202 | 1,355,298 | |||||||||
McDonald's Corp. | 9,053 | 2,426,838 | |||||||||
Mohawk Industries, Inc. (a) | 5,132 | 934,948 | |||||||||
Newell Brands, Inc. | 45,578 | 995,424 | |||||||||
NIKE, Inc., Class B | 7,016 | 1,169,357 | |||||||||
NVR, Inc. (a) | 251 | 1,483,126 | |||||||||
O'Reilly Automotive, Inc. (a) | 2,851 | 2,013,462 | |||||||||
Penn National Gaming, Inc. (a) | 6,694 | 347,084 | |||||||||
Pool Corp. | 2,650 | 1,499,900 | |||||||||
PulteGroup, Inc. | 17,974 | 1,027,394 | |||||||||
RH (a) | 1,121 | 600,789 | |||||||||
Ross Stores, Inc. | 9,320 | 1,065,090 | |||||||||
Service Corp. International | 22,629 | 1,606,433 | |||||||||
Starbucks Corp. | 13,426 | 1,570,439 | |||||||||
Tapestry, Inc. | 21,504 | 873,062 | |||||||||
Target Corp. (c) | 5,882 | 1,361,330 | |||||||||
Tesla, Inc. (a) | 825 | 871,843 | |||||||||
The Home Depot, Inc. | 5,276 | 2,189,593 | |||||||||
The TJX Cos., Inc. | 18,423 | 1,398,674 | |||||||||
Tractor Supply Co. | 6,569 | 1,567,363 | |||||||||
Ulta Beauty, Inc. (a) | 2,910 | 1,199,909 | |||||||||
Vail Resorts, Inc. | 3,925 | 1,287,007 | |||||||||
VF Corp. | 14,675 | 1,074,503 | |||||||||
Wayfair, Inc., Class A (a) (b) | 2,028 | 385,259 | |||||||||
Whirlpool Corp. (b) | 5,202 | 1,220,701 | |||||||||
Williams-Sonoma, Inc. | 3,922 | 663,328 | |||||||||
Yum! Brands, Inc. | 13,389 | 1,859,197 | |||||||||
69,796,818 | |||||||||||
Consumer Staples (9.1%): | |||||||||||
Albertsons Cos., Inc., Class A | 25,799 | 778,872 | |||||||||
Altria Group, Inc. | 31,258 | 1,481,317 | |||||||||
Archer-Daniels-Midland Co. | 27,263 | 1,842,706 | |||||||||
Brown-Forman Corp., Class B | 24,731 | 1,801,901 | |||||||||
Bunge Ltd. | 15,673 | 1,463,231 | |||||||||
See notes to financial statements.
20
| Victory Portfolios II VictoryShares US 500 Volatility Wtd ETF | Schedule of Portfolio Investments — continued December 31, 2021 | ||||||
(Unaudited)
Security Description | Shares | Value | |||||||||
Campbell Soup Co. | 35,038 | $ | 1,522,751 | ||||||||
Church & Dwight Co., Inc. | 24,464 | 2,507,560 | |||||||||
Colgate-Palmolive Co. | 29,370 | 2,506,436 | |||||||||
Conagra Brands, Inc. | 49,008 | 1,673,623 | |||||||||
Constellation Brands, Inc., Class A | 7,634 | 1,915,905 | |||||||||
Costco Wholesale Corp. | 4,515 | 2,563,166 | |||||||||
Darling Ingredients, Inc. (a) | 10,173 | 704,887 | |||||||||
General Mills, Inc. | 30,874 | 2,080,290 | |||||||||
Hormel Foods Corp. (b) | 36,289 | 1,771,266 | |||||||||
Kellogg Co. | 27,407 | 1,765,559 | |||||||||
Keurig Dr Pepper, Inc. | 57,825 | 2,131,430 | |||||||||
Kimberly-Clark Corp. | 14,957 | 2,137,654 | |||||||||
McCormick & Co., Inc. | 24,530 | 2,369,843 | |||||||||
Mondelez International, Inc., Class A | 35,445 | 2,350,358 | |||||||||
Monster Beverage Corp. (a) | 16,568 | 1,591,191 | |||||||||
PepsiCo, Inc. | 14,743 | 2,561,007 | |||||||||
Philip Morris International, Inc. | 19,718 | 1,873,210 | |||||||||
Sysco Corp. | 16,236 | 1,275,338 | |||||||||
The Clorox Co. | 8,129 | 1,417,372 | |||||||||
The Coca-Cola Co. | 39,978 | 2,367,097 | |||||||||
The Estee Lauder Cos., Inc. | 3,794 | 1,404,539 | |||||||||
The Hershey Co. | 13,633 | 2,637,577 | |||||||||
The J.M. Smucker Co. | 12,650 | 1,718,123 | |||||||||
The Kraft Heinz Co. | 42,919 | 1,540,792 | |||||||||
The Kroger Co. | 25,986 | 1,176,126 | |||||||||
The Procter & Gamble Co. | 16,147 | 2,641,326 | |||||||||
Tyson Foods, Inc., Class A | 19,013 | 1,657,173 | |||||||||
Walgreens Boots Alliance, Inc. | 24,019 | 1,252,831 | |||||||||
Walmart, Inc. | 13,680 | 1,979,359 | |||||||||
62,461,816 | |||||||||||
Energy (1.8%): | |||||||||||
Chevron Corp. | 13,210 | 1,550,194 | |||||||||
ConocoPhillips | 16,354 | 1,180,432 | |||||||||
Continental Resources, Inc. (b) | 14,049 | 628,833 | |||||||||
Devon Energy Corp. | 21,522 | 948,044 | |||||||||
EOG Resources, Inc. | 10,582 | 939,999 | |||||||||
Halliburton Co. | 36,569 | 836,333 | |||||||||
Kinder Morgan, Inc. | 79,383 | 1,259,014 | |||||||||
ONEOK, Inc. | 19,845 | 1,166,092 | |||||||||
Pioneer Natural Resources Co. | 5,633 | 1,024,530 | |||||||||
Schlumberger NV | 28,617 | 857,079 | |||||||||
Texas Pacific Land Corp. | 484 | 604,453 | |||||||||
The Williams Cos., Inc. | 57,048 | 1,485,530 | |||||||||
12,480,533 | |||||||||||
Financials (15.5%): | |||||||||||
Aflac, Inc. | 29,434 | 1,718,651 | |||||||||
Ally Financial, Inc. | 20,560 | 978,862 | |||||||||
American Express Co. | 7,877 | 1,288,677 | |||||||||
American Financial Group, Inc. | 7,088 | 973,324 | |||||||||
See notes to financial statements.
21
| Victory Portfolios II VictoryShares US 500 Volatility Wtd ETF | Schedule of Portfolio Investments — continued December 31, 2021 | ||||||
(Unaudited)
Security Description | Shares | Value | |||||||||
American International Group, Inc. | 20,367 | $ | 1,158,068 | ||||||||
Ameriprise Financial, Inc. | 4,766 | 1,437,712 | |||||||||
Aon PLC, Class A | 5,012 | 1,506,407 | |||||||||
Apollo Global Management, Inc. (b) | 20,222 | 1,464,679 | |||||||||
Arch Capital Group Ltd. (a) | 36,317 | 1,614,291 | |||||||||
Ares Management Corp., Class A | 16,343 | 1,328,196 | |||||||||
Arthur J. Gallagher & Co. | 12,407 | 2,105,096 | |||||||||
Bank of America Corp. | 31,355 | 1,394,984 | |||||||||
Berkshire Hathaway, Inc., Class B (a) | 7,402 | 2,213,198 | |||||||||
BlackRock, Inc. | 1,567 | 1,434,683 | |||||||||
Blackstone, Inc. | 11,499 | 1,487,856 | |||||||||
Brown & Brown, Inc. | 29,920 | 2,102,778 | |||||||||
Capital One Financial Corp. | 6,605 | 958,319 | |||||||||
Cboe Global Markets, Inc. | 9,397 | 1,225,369 | |||||||||
Chubb Ltd. | 7,496 | 1,449,052 | |||||||||
Cincinnati Financial Corp. | 10,550 | 1,201,961 | |||||||||
Citigroup, Inc. | 16,932 | 1,022,523 | |||||||||
Citizens Financial Group, Inc. | 22,798 | 1,077,205 | |||||||||
CME Group, Inc. | 7,352 | 1,679,638 | |||||||||
CNA Financial Corp. | 33,544 | 1,478,620 | |||||||||
Discover Financial Services | 7,974 | 921,475 | |||||||||
East West Bancorp, Inc. | 13,272 | 1,044,241 | |||||||||
Everest Re Group Ltd. | 5,334 | 1,461,089 | |||||||||
FactSet Research Systems, Inc. | 3,948 | 1,918,767 | |||||||||
Fidelity National Financial, Inc. | 26,691 | 1,392,736 | |||||||||
Fifth Third Bancorp | 26,997 | 1,175,719 | |||||||||
First Republic Bank | 6,322 | 1,305,556 | |||||||||
Franklin Resources, Inc. | 29,846 | 999,543 | |||||||||
Huntington Bancshares, Inc. | 66,370 | 1,023,425 | |||||||||
Interactive Brokers Group, Inc. | 18,025 | 1,431,545 | |||||||||
Intercontinental Exchange, Inc. | 16,710 | 2,285,427 | |||||||||
Invesco Ltd. | 36,047 | 829,802 | |||||||||
JPMorgan Chase & Co. | 9,560 | 1,513,826 | |||||||||
KeyCorp | 50,366 | 1,164,966 | |||||||||
KKR & Co., Inc. | 22,160 | 1,650,920 | |||||||||
Lincoln National Corp. | 13,187 | 900,145 | |||||||||
Loews Corp. | 27,178 | 1,569,801 | |||||||||
LPL Financial Holdings, Inc. | 7,458 | 1,193,951 | |||||||||
M&T Bank Corp. | 7,623 | 1,170,740 | |||||||||
Markel Corp. (a) | 1,165 | 1,437,610 | |||||||||
MarketAxess Holdings, Inc. | 2,210 | 908,907 | |||||||||
Marsh & McLennan Cos., Inc. | 12,875 | 2,237,932 | |||||||||
MetLife, Inc. | 20,628 | 1,289,044 | |||||||||
Moody's Corp. | 4,748 | 1,854,474 | |||||||||
Morgan Stanley | 12,083 | 1,186,067 | |||||||||
Morningstar, Inc. | 5,017 | 1,715,764 | |||||||||
MSCI, Inc. | 2,200 | 1,347,918 | |||||||||
Nasdaq, Inc. | 9,293 | 1,951,623 | |||||||||
Northern Trust Corp. | 11,144 | 1,332,934 | |||||||||
Principal Financial Group, Inc. | 17,873 | 1,292,754 | |||||||||
See notes to financial statements.
22
| Victory Portfolios II VictoryShares US 500 Volatility Wtd ETF | Schedule of Portfolio Investments — continued December 31, 2021 | ||||||
(Unaudited)
Security Description | Shares | Value | |||||||||
Prudential Financial, Inc. | 12,361 | $ | 1,337,955 | ||||||||
Raymond James Financial, Inc. | 14,787 | 1,484,615 | |||||||||
Regions Financial Corp. | 50,219 | 1,094,774 | |||||||||
S&P Global, Inc. | 3,775 | 1,781,536 | |||||||||
Signature Bank | 3,238 | 1,047,396 | |||||||||
State Street Corp. | 11,683 | 1,086,519 | |||||||||
SVB Financial Group (a) | 1,567 | 1,062,802 | |||||||||
Synchrony Financial | 19,723 | 914,950 | |||||||||
T. Rowe Price Group, Inc. | 6,473 | 1,272,851 | |||||||||
The Allstate Corp. | 12,705 | 1,494,743 | |||||||||
The Bank of New York Mellon Corp. | 23,409 | 1,359,595 | |||||||||
The Carlyle Group, Inc. | 26,883 | 1,475,877 | |||||||||
The Charles Schwab Corp. | 15,148 | 1,273,947 | |||||||||
The Goldman Sachs Group, Inc. | 3,139 | 1,200,824 | |||||||||
The Hartford Financial Services Group, Inc. | 15,212 | 1,050,236 | |||||||||
The PNC Financial Services Group, Inc. | 6,581 | 1,319,622 | |||||||||
The Progressive Corp. | 16,658 | 1,709,944 | |||||||||
The Travelers Cos., Inc. | 9,761 | 1,526,913 | |||||||||
Tradeweb Markets, Inc., Class A (b) | 16,432 | 1,645,500 | |||||||||
Truist Financial Corp. | 20,411 | 1,195,064 | |||||||||
U.S. Bancorp | 21,762 | 1,222,372 | |||||||||
UWM Holdings Corp. | 81,880 | 484,730 | |||||||||
W.R. Berkley Corp. | 22,024 | 1,814,557 | |||||||||
Wells Fargo & Co. | 21,337 | 1,023,749 | |||||||||
106,689,921 | |||||||||||
Health Care (13.9%): | |||||||||||
Abbott Laboratories | 12,294 | 1,730,257 | |||||||||
AbbVie, Inc. | 14,539 | 1,968,581 | |||||||||
ABIOMED, Inc. (a) | 2,762 | 992,027 | |||||||||
Agilent Technologies, Inc. | 10,176 | 1,624,598 | |||||||||
Align Technology, Inc. (a) | 1,228 | 807,017 | |||||||||
Amgen, Inc. | 7,234 | 1,627,433 | |||||||||
Anthem, Inc. | 3,868 | 1,792,973 | |||||||||
Avantor, Inc. (a) | 30,450 | 1,283,163 | |||||||||
Baxter International, Inc. | 25,911 | 2,224,200 | |||||||||
Becton Dickinson & Co. | 7,346 | 1,847,372 | |||||||||
Biogen, Inc. (a) | 1,859 | 446,011 | |||||||||
BioMarin Pharmaceutical, Inc. (a) | 14,469 | 1,278,336 | |||||||||
Bio-Rad Laboratories, Inc., Class A (a) | 1,658 | 1,252,735 | |||||||||
Bio-Techne Corp. | 2,003 | 1,036,232 | |||||||||
Boston Scientific Corp. (a) | 33,457 | 1,421,253 | |||||||||
Bruker Corp. | 15,456 | 1,296,913 | |||||||||
Cardinal Health, Inc. | 22,696 | 1,168,617 | |||||||||
Catalent, Inc. (a) | 8,932 | 1,143,564 | |||||||||
Centene Corp. (a) | 17,943 | 1,478,503 | |||||||||
Cerner Corp. | 26,705 | 2,480,093 | |||||||||
Charles River Laboratories International, Inc. (a) | 3,027 | 1,140,513 | |||||||||
Cigna Corp. | 6,017 | 1,381,684 | |||||||||
CVS Health Corp. | 18,555 | 1,914,134 | |||||||||
Danaher Corp. | 4,418 | 1,453,566 | |||||||||
See notes to financial statements.
23
| Victory Portfolios II VictoryShares US 500 Volatility Wtd ETF | Schedule of Portfolio Investments — continued December 31, 2021 | ||||||
(Unaudited)
Security Description | Shares | Value | |||||||||
DaVita, Inc. (a) | 10,322 | $ | 1,174,231 | ||||||||
DENTSPLY SIRONA, Inc. (b) | 18,924 | 1,055,770 | |||||||||
Dexcom, Inc. (a) | 1,781 | 956,308 | |||||||||
Edwards Lifesciences Corp. (a) | 13,071 | 1,693,348 | |||||||||
Eli Lilly & Co. | 4,045 | 1,117,310 | |||||||||
Gilead Sciences, Inc. (c) | 22,675 | 1,646,432 | |||||||||
HCA Healthcare, Inc. | 4,699 | 1,207,267 | |||||||||
Henry Schein, Inc. (a) | 16,734 | 1,297,387 | |||||||||
Hologic, Inc. (a) | 14,768 | 1,130,638 | |||||||||
Horizon Therapeutics PLC (a) | 7,297 | 786,325 | |||||||||
Humana, Inc. | 3,755 | 1,741,794 | |||||||||
IDEXX Laboratories, Inc. (a) | 1,867 | 1,229,345 | |||||||||
Illumina, Inc. (a) | 2,026 | 770,771 | |||||||||
Incyte Corp. (a) | 15,102 | 1,108,487 | |||||||||
Intuitive Surgical, Inc. (a) | 3,534 | 1,269,766 | |||||||||
IQVIA Holdings, Inc. (a) | 6,376 | 1,798,925 | |||||||||
Johnson & Johnson (c) | 13,128 | 2,245,807 | |||||||||
Laboratory Corp. of America Holdings (a) | 5,399 | 1,696,420 | |||||||||
Masimo Corp. (a) | 4,729 | 1,384,557 | |||||||||
Medtronic PLC | 13,448 | 1,391,196 | |||||||||
Merck & Co., Inc. | 25,367 | 1,944,127 | |||||||||
Mettler-Toledo International, Inc. (a) | 954 | 1,619,138 | |||||||||
Moderna, Inc. (a) | 1,163 | 295,379 | |||||||||
Molina Healthcare, Inc. (a) | 4,337 | 1,379,513 | |||||||||
PerkinElmer, Inc. | 6,246 | 1,255,821 | |||||||||
Pfizer, Inc. | 35,084 | 2,071,710 | |||||||||
Quest Diagnostics, Inc. | 10,877 | 1,881,830 | |||||||||
Regeneron Pharmaceuticals, Inc. (a) | 2,036 | 1,285,775 | |||||||||
Repligen Corp. (a) | 2,856 | 756,383 | |||||||||
ResMed, Inc. | 4,469 | 1,164,085 | |||||||||
Seagen, Inc. (a) | 5,423 | 838,396 | |||||||||
STERIS PLC | 7,416 | 1,805,129 | |||||||||
Stryker Corp. | 6,285 | 1,680,735 | |||||||||
Teleflex, Inc. | 3,251 | 1,067,888 | |||||||||
The Cooper Cos., Inc. | 3,452 | 1,446,181 | |||||||||
Thermo Fisher Scientific, Inc. | 2,512 | 1,676,107 | |||||||||
UnitedHealth Group, Inc. | 4,462 | 2,240,549 | |||||||||
Universal Health Services, Inc., Class B | 8,550 | 1,108,593 | |||||||||
Veeva Systems, Inc., Class A (a) | 2,929 | 748,301 | |||||||||
Vertex Pharmaceuticals, Inc. (a) | 6,548 | 1,437,941 | |||||||||
Waters Corp. (a) | 3,654 | 1,361,480 | |||||||||
West Pharmaceutical Services, Inc. | 3,456 | 1,620,898 | |||||||||
Zimmer Biomet Holdings, Inc. | 10,148 | 1,289,202 | |||||||||
Zoetis, Inc. | 8,151 | 1,989,088 | |||||||||
95,456,108 | |||||||||||
Industrials (16.7%): | |||||||||||
3M Co. | 9,399 | 1,669,544 | |||||||||
AGCO Corp. | 6,602 | 765,964 | |||||||||
Allegion PLC | 10,524 | 1,393,799 | |||||||||
AMERCO, Inc. | 1,880 | 1,365,312 | |||||||||
See notes to financial statements.
24
| Victory Portfolios II VictoryShares US 500 Volatility Wtd ETF | Schedule of Portfolio Investments — continued December 31, 2021 | ||||||
(Unaudited)
Security Description | Shares | Value | |||||||||
AMETEK, Inc. | 12,977 | $ | 1,908,138 | ||||||||
AO Smith Corp. | 17,861 | 1,533,367 | |||||||||
Booz Allen Hamilton Holding Corp. | 17,721 | 1,502,564 | |||||||||
Builders FirstSource, Inc. (a) | 15,665 | 1,342,647 | |||||||||
C.H. Robinson Worldwide, Inc. | 16,285 | 1,752,755 | |||||||||
Carlisle Cos., Inc. | 7,390 | 1,833,607 | |||||||||
Carrier Global Corp. | 21,268 | 1,153,576 | |||||||||
Caterpillar, Inc. | 6,312 | 1,304,943 | |||||||||
Cintas Corp. | 3,473 | 1,539,129 | |||||||||
Copart, Inc. (a) | 9,813 | 1,487,847 | |||||||||
CoStar Group, Inc. (a) (c) | 14,041 | 1,109,660 | |||||||||
CSX Corp. | 46,276 | 1,739,978 | |||||||||
Cummins, Inc. | 6,016 | 1,312,330 | |||||||||
Deere & Co. | 3,060 | 1,049,243 | |||||||||
Dover Corp. | 9,639 | 1,750,442 | |||||||||
Eaton Corp. PLC | 9,455 | 1,634,013 | |||||||||
Emerson Electric Co. | 15,155 | 1,408,960 | |||||||||
Equifax, Inc. | 4,337 | 1,269,830 | |||||||||
Expeditors International of Washington, Inc. | 13,604 | 1,826,881 | |||||||||
Fastenal Co. | 30,155 | 1,931,729 | |||||||||
FedEx Corp. | 4,769 | 1,233,454 | |||||||||
Fortive Corp. | 20,779 | 1,585,230 | |||||||||
Fortune Brands Home & Security, Inc. | 12,757 | 1,363,723 | |||||||||
Generac Holdings, Inc. (a) | 1,679 | 590,874 | |||||||||
General Dynamics Corp. | 9,364 | 1,952,113 | |||||||||
Graco, Inc. | 21,119 | 1,702,614 | |||||||||
HEICO Corp. | 10,087 | 1,454,747 | |||||||||
Honeywell International, Inc. | 7,489 | 1,561,531 | |||||||||
Howmet Aerospace, Inc. | 31,630 | 1,006,783 | |||||||||
Hubbell, Inc. | 6,856 | 1,427,899 | |||||||||
IDEX Corp. | 7,790 | 1,840,933 | |||||||||
Illinois Tool Works, Inc. | 9,023 | 2,226,876 | |||||||||
Ingersoll Rand, Inc. (c) | 22,466 | 1,389,971 | |||||||||
J.B. Hunt Transport Services, Inc. | 7,440 | 1,520,736 | |||||||||
Jacobs Engineering Group, Inc. | 10,197 | 1,419,728 | |||||||||
Johnson Controls International PLC | 21,553 | 1,752,475 | |||||||||
L3Harris Technologies, Inc. | 7,472 | 1,593,329 | |||||||||
Leidos Holdings, Inc. | 12,973 | 1,153,300 | |||||||||
Lennox International, Inc. | 4,066 | 1,318,848 | |||||||||
Lockheed Martin Corp. | 5,519 | 1,961,508 | |||||||||
Masco Corp. | 25,185 | 1,768,491 | |||||||||
Nordson Corp. | 6,349 | 1,620,709 | |||||||||
Norfolk Southern Corp. | 5,904 | 1,757,680 | |||||||||
Northrop Grumman Corp. | 5,054 | 1,956,252 | |||||||||
Old Dominion Freight Line, Inc. | 4,806 | 1,722,374 | |||||||||
Otis Worldwide Corp. | 18,081 | 1,574,313 | |||||||||
PACCAR, Inc. | 16,293 | 1,438,020 | |||||||||
Parker-Hannifin Corp. | 4,508 | 1,434,085 | |||||||||
Quanta Services, Inc. | 10,931 | 1,253,349 | |||||||||
Raytheon Technologies Corp. | 16,828 | 1,448,218 | |||||||||
See notes to financial statements.
25
| Victory Portfolios II VictoryShares US 500 Volatility Wtd ETF | Schedule of Portfolio Investments — continued December 31, 2021 | ||||||
(Unaudited)
Security Description | Shares | Value | |||||||||
Republic Services, Inc. (c) | 16,681 | $ | 2,326,166 | ||||||||
Robert Half International, Inc. | 13,342 | 1,487,900 | |||||||||
Rockwell Automation, Inc. | 4,725 | 1,648,316 | |||||||||
Rollins, Inc. | 34,310 | 1,173,745 | |||||||||
Roper Technologies, Inc. | 3,629 | 1,784,960 | |||||||||
Snap-on, Inc. | 5,903 | 1,271,388 | |||||||||
Stanley Black & Decker, Inc. | 7,855 | 1,481,610 | |||||||||
Textron, Inc. | 15,435 | 1,191,582 | |||||||||
The Toro Co. | 14,769 | 1,475,571 | |||||||||
Trane Technologies PLC | 7,289 | 1,472,597 | |||||||||
TransDigm Group, Inc. (a) | 1,944 | 1,236,928 | |||||||||
TransUnion | 11,544 | 1,368,888 | |||||||||
Trex Co., Inc. (a) | 8,845 | 1,194,340 | |||||||||
Union Pacific Corp. | 7,413 | 1,867,557 | |||||||||
United Parcel Service, Inc., Class B | 6,977 | 1,495,450 | |||||||||
United Rentals, Inc. (a) | 2,597 | 862,957 | |||||||||
Verisk Analytics, Inc. | 7,037 | 1,609,573 | |||||||||
W.W. Grainger, Inc. | 3,531 | 1,829,906 | |||||||||
Waste Management, Inc. | 13,934 | 2,325,585 | |||||||||
Watsco, Inc. | 4,878 | 1,526,229 | |||||||||
Westinghouse Air Brake Technologies Corp. | 13,351 | 1,229,761 | |||||||||
Xylem, Inc. | 11,796 | 1,414,576 | |||||||||
114,892,006 | |||||||||||
Information Technology (15.3%): | |||||||||||
Accenture PLC, Class A | 5,272 | 2,185,508 | |||||||||
Adobe, Inc. (a) | 2,119 | 1,201,600 | |||||||||
Advanced Micro Devices, Inc. (a) | 7,793 | 1,121,413 | |||||||||
Akamai Technologies, Inc. (a) | 11,243 | 1,315,881 | |||||||||
Amphenol Corp., Class A | 21,621 | 1,890,973 | |||||||||
Analog Devices, Inc. | 7,377 | 1,296,655 | |||||||||
ANSYS, Inc. (a) | 2,841 | 1,139,582 | |||||||||
Apple, Inc. | 8,408 | 1,493,009 | |||||||||
Applied Materials, Inc. | 5,547 | 872,876 | |||||||||
Arista Networks, Inc. (a) | 14,596 | 2,098,175 | |||||||||
Autodesk, Inc. (a) | 3,518 | 989,226 | |||||||||
Automatic Data Processing, Inc. | 8,363 | 2,062,149 | |||||||||
Black Knight, Inc. (a) | 20,199 | 1,674,295 | |||||||||
Block, Inc. (a) | 2,403 | 388,109 | |||||||||
Broadcom, Inc. | 2,359 | 1,569,702 | |||||||||
Broadridge Financial Solutions, Inc. | 10,051 | 1,837,524 | |||||||||
Cadence Design Systems, Inc. (a) | 6,350 | 1,183,323 | |||||||||
CDW Corp. | 7,247 | 1,484,041 | |||||||||
Cisco Systems, Inc. | 32,135 | 2,036,395 | |||||||||
Citrix Systems, Inc. | 10,705 | 1,012,586 | |||||||||
Cognex Corp. | 13,307 | 1,034,752 | |||||||||
Cognizant Technology Solutions Corp., Class A | 18,779 | 1,666,073 | |||||||||
Corning, Inc. | 32,143 | 1,196,684 | |||||||||
Dell Technologies, Inc., Class C (a) | 26,341 | 1,479,574 | |||||||||
Dynatrace, Inc. (a) | 10,969 | 661,979 | |||||||||
Enphase Energy, Inc. (a) | 2,849 | 521,196 | |||||||||
See notes to financial statements.
26
| Victory Portfolios II VictoryShares US 500 Volatility Wtd ETF | Schedule of Portfolio Investments — continued December 31, 2021 | ||||||
(Unaudited)
Security Description | Shares | Value | |||||||||
Entegris, Inc. | 7,111 | $ | 985,442 | ||||||||
EPAM Systems, Inc. (a) | 1,912 | 1,278,076 | |||||||||
F5, Inc. (a) | 6,242 | 1,527,480 | |||||||||
Fair Isaac Corp. (a) | 2,412 | 1,046,012 | |||||||||
Fidelity National Information Services, Inc. | 10,227 | 1,116,277 | |||||||||
Fiserv, Inc. (a) (b) | 13,237 | 1,373,868 | |||||||||
FleetCor Technologies, Inc. (a) | 5,198 | 1,163,520 | |||||||||
Fortinet, Inc. (a) | 3,427 | 1,231,664 | |||||||||
Gartner, Inc. (a) | 3,548 | 1,186,167 | |||||||||
Global Payments, Inc. | 7,437 | 1,005,334 | |||||||||
GoDaddy, Inc., Class A (a) | 14,250 | 1,209,255 | |||||||||
Hewlett Packard Enterprise Co. (b) | 80,223 | 1,265,117 | |||||||||
HP, Inc. | 39,588 | 1,491,280 | |||||||||
Intel Corp. | 18,697 | 962,895 | |||||||||
International Business Machines Corp. | 10,601 | 1,416,930 | |||||||||
Intuit, Inc. | 2,319 | 1,491,627 | |||||||||
Jack Henry & Associates, Inc. | 8,627 | 1,440,623 | |||||||||
Keysight Technologies, Inc. (a) | 8,348 | 1,723,945 | |||||||||
KLA Corp. | 2,325 | 1,000,006 | |||||||||
Kyndryl Holdings, Inc. (a) | 2,120 | 38,372 | |||||||||
Lam Research Corp. | 1,239 | 891,027 | |||||||||
Mastercard, Inc., Class A | 3,848 | 1,382,663 | |||||||||
Microchip Technology, Inc. | 11,310 | 984,649 | |||||||||
Micron Technology, Inc. | 11,152 | 1,038,809 | |||||||||
Microsoft Corp. (c) | 5,523 | 1,857,495 | |||||||||
Monolithic Power Systems, Inc. | 1,640 | 809,061 | |||||||||
Motorola Solutions, Inc. | 7,169 | 1,947,817 | |||||||||
NetApp, Inc. | 12,072 | 1,110,503 | |||||||||
NortonLifeLock, Inc. | 42,434 | 1,102,435 | |||||||||
NVIDIA Corp. | 3,751 | 1,103,207 | |||||||||
NXP Semiconductors NV | 4,021 | 915,903 | |||||||||
ON Semiconductor Corp. (a) | 17,173 | 1,166,390 | |||||||||
Oracle Corp. | 15,643 | 1,364,226 | |||||||||
Paychex, Inc. | 15,844 | 2,162,706 | |||||||||
Paycom Software, Inc. (a) | 1,765 | 732,810 | |||||||||
Paylocity Holding Corp. (a) | 3,146 | 742,959 | |||||||||
PayPal Holdings, Inc. (a) | 3,275 | 617,600 | |||||||||
PTC, Inc. (a) | 6,421 | 777,904 | |||||||||
Qorvo, Inc. (a) | 4,804 | 751,298 | |||||||||
QUALCOMM, Inc. | 7,304 | 1,335,682 | |||||||||
salesforce.com, Inc. (a) | 5,217 | 1,325,796 | |||||||||
Seagate Technology Holdings PLC | 9,601 | 1,084,721 | |||||||||
ServiceNow, Inc. (a) (c) | 1,530 | 993,138 | |||||||||
Skyworks Solutions, Inc. | 4,741 | 735,519 | |||||||||
SS&C Technologies Holdings, Inc. | 21,090 | 1,728,958 | |||||||||
Synopsys, Inc. (a) | 3,306 | 1,218,261 | |||||||||
TE Connectivity Ltd. | 9,443 | 1,523,534 | |||||||||
Teledyne Technologies, Inc. (a) | 2,737 | 1,195,768 | |||||||||
Teradyne, Inc. | 6,275 | 1,026,151 | |||||||||
Texas Instruments, Inc. | 6,311 | 1,189,434 | |||||||||
See notes to financial statements.
27
| Victory Portfolios II VictoryShares US 500 Volatility Wtd ETF | Schedule of Portfolio Investments — continued December 31, 2021 | ||||||
(Unaudited)
Security Description | Shares | Value | |||||||||
The Trade Desk, Inc., Class A (a) | 6,461 | $ | 592,086 | ||||||||
Trimble, Inc. (a) | 12,479 | 1,088,044 | |||||||||
Tyler Technologies, Inc. (a) | 2,424 | 1,303,991 | |||||||||
Ubiquiti, Inc. (b) | 2,231 | 684,248 | |||||||||
VeriSign, Inc. (a) | 7,987 | 2,027,260 | |||||||||
Visa, Inc., Class A | 6,979 | 1,512,419 | |||||||||
VMware, Inc., Class A | 10,481 | 1,214,538 | |||||||||
Western Digital Corp. (a) | 11,429 | 745,285 | |||||||||
Zebra Technologies Corp. (a) | 2,156 | 1,283,251 | |||||||||
Zoom Video Communications, Inc., Class A (a) | 2,213 | 406,993 | |||||||||
105,041,709 | |||||||||||
Materials (5.3%): | |||||||||||
Air Products & Chemicals, Inc. | 5,693 | 1,732,152 | |||||||||
Albemarle Corp. | 3,094 | 723,284 | |||||||||
Avery Dennison Corp. | 6,278 | 1,359,626 | |||||||||
Ball Corp. | 15,368 | 1,479,477 | |||||||||
Celanese Corp. | 8,227 | 1,382,630 | |||||||||
Cleveland-Cliffs, Inc. (a) | 20,621 | 448,919 | |||||||||
Corteva, Inc. | 27,981 | 1,322,942 | |||||||||
Crown Holdings, Inc. | 12,160 | 1,345,139 | |||||||||
Dow, Inc. | 17,941 | 1,017,614 | |||||||||
DuPont de Nemours, Inc. | 15,491 | 1,251,363 | |||||||||
Eastman Chemical Co. | 10,886 | 1,316,226 | |||||||||
Ecolab, Inc. | 7,451 | 1,747,930 | |||||||||
FMC Corp. | 13,529 | 1,486,702 | |||||||||
Freeport-McMoRan, Inc. | 17,534 | 731,694 | |||||||||
International Flavors & Fragrances, Inc. | 7,183 | 1,082,119 | |||||||||
International Paper Co. | 22,703 | 1,066,587 | |||||||||
LyondellBasell Industries NV, Class A | 10,799 | 995,992 | |||||||||
Martin Marietta Materials, Inc. | 3,168 | 1,395,567 | |||||||||
Newmont Corp. | 21,094 | 1,308,250 | |||||||||
Nucor Corp. | 7,141 | 815,145 | |||||||||
Packaging Corp. of America | 10,804 | 1,470,965 | |||||||||
Pegasystems, Inc. | 7,590 | 848,714 | |||||||||
PPG Industries, Inc. | 8,909 | 1,536,268 | |||||||||
RPM International, Inc. | 20,535 | 2,074,035 | |||||||||
Steel Dynamics, Inc. | 12,418 | 770,785 | |||||||||
Sylvamo Corp. (a) | 2,059 | 57,426 | |||||||||
The Mosaic Co. | 24,104 | 947,046 | |||||||||
The Sherwin-Williams Co. | 6,239 | 2,197,126 | |||||||||
Vulcan Materials Co. | 6,770 | 1,405,317 | |||||||||
Westlake Chemical Corp. | 11,770 | 1,143,220 | |||||||||
36,460,260 | |||||||||||
Real Estate (0.4%): | |||||||||||
CBRE Group, Inc., Class A (a) | 13,010 | 1,411,715 | |||||||||
Jones Lang LaSalle, Inc. (a) | 4,515 | 1,216,070 | |||||||||
2,627,785 | |||||||||||
See notes to financial statements.
28
| Victory Portfolios II VictoryShares US 500 Volatility Wtd ETF | Schedule of Portfolio Investments — continued December 31, 2021 | ||||||
(Unaudited)
Security Description | Shares | Value | |||||||||
Utilities (7.3%): | |||||||||||
Alliant Energy Corp. | 29,944 | $ | 1,840,658 | ||||||||
Ameren Corp. | 21,420 | 1,906,594 | |||||||||
American Electric Power Co., Inc. (c) | 22,068 | 1,963,390 | |||||||||
American Water Works Co., Inc. | 8,756 | 1,653,658 | |||||||||
Atmos Energy Corp. | 17,185 | 1,800,472 | |||||||||
Avangrid, Inc. (b) | 32,934 | 1,642,748 | |||||||||
CenterPoint Energy, Inc. | 57,794 | 1,613,031 | |||||||||
CMS Energy Corp. | 29,024 | 1,888,011 | |||||||||
Consolidated Edison, Inc. (c) | 26,510 | 2,261,833 | |||||||||
Dominion Energy, Inc. | 24,868 | 1,953,630 | |||||||||
DTE Energy Co. | 16,048 | 1,918,378 | |||||||||
Duke Energy Corp. (c) | 19,740 | 2,070,726 | |||||||||
Edison International | 27,196 | 1,856,127 | |||||||||
Entergy Corp. | 14,965 | 1,685,807 | |||||||||
Essential Utilities, Inc. | 32,482 | 1,743,959 | |||||||||
Evergy, Inc. (c) | 26,075 | 1,789,006 | |||||||||
Eversource Energy (c) | 18,046 | 1,641,825 | |||||||||
Exelon Corp. | 35,723 | 2,063,361 | |||||||||
FirstEnergy Corp. | 42,212 | 1,755,597 | |||||||||
NextEra Energy, Inc. (c) | 17,405 | 1,624,931 | |||||||||
NRG Energy, Inc. | 18,270 | 787,072 | |||||||||
PG&E Corp. (a) | 110,942 | 1,346,836 | |||||||||
PPL Corp. | 63,311 | 1,903,129 | |||||||||
Public Service Enterprise Group, Inc. | 27,232 | 1,817,191 | |||||||||
Sempra Energy | 12,823 | 1,696,226 | |||||||||
The Southern Co. (c) | 30,759 | 2,109,452 | |||||||||
WEC Energy Group, Inc. (c) | 18,412 | 1,787,253 | |||||||||
Xcel Energy, Inc. (c) | 26,163 | 1,771,235 | |||||||||
49,892,136 | |||||||||||
Total Common Stocks (Cost $496,463,580) | 684,840,626 | ||||||||||
Collateral for Securities Loaned^ (1.5%) | |||||||||||
BlackRock Liquidity Funds TempFund, Institutional Shares, 0.04% (d) | 233,332 | 233,332 | |||||||||
| Fidelity Investments Money Market Government Portfolio, Institutional Shares, 0.01% (d) | 4,582,662 | 4,582,662 | |||||||||
| Goldman Sachs Financial Square Prime Obligations Fund, Institutional Shares, 0.02% (d) | 116,444 | 116,444 | |||||||||
JPMorgan Prime Money Market Fund, Capital Shares, 0.07% (d) | 928,488 | 928,488 | |||||||||
| Morgan Stanley Institutional Liquidity Prime Portfolio, Institutional Shares, 0.06% (d) | 4,174,664 | 4,174,664 | |||||||||
Total Collateral for Securities Loaned (Cost $10,035,590) | 10,035,590 | ||||||||||
Total Investments (Cost $506,499,170) — 101.1% | 694,876,216 | ||||||||||
Liabilities in excess of other assets — (1.1)% | (7,554,870 | ) | |||||||||
NET ASSETS — 100.00% | $ | 687,321,346 | |||||||||
^ Purchased with cash collateral from securities on loan.
(a) Non-income producing security.
See notes to financial statements.
29
| Victory Portfolios II VictoryShares US 500 Volatility Wtd ETF | Schedule of Portfolio Investments — continued December 31, 2021 | ||||||
(Unaudited)
(b) All or a portion of this security is on loan.
(c) All or a portion of this security has been segregated as collateral for derivative instruments.
(d) Rate disclosed is the daily yield on December 31, 2021.
PLC — Public Limited Company
Futures Contracts Purchased
| Number of Contracts | Expiration Date | Notional Amount | Value | Unrealized Appreciation (Depreciation) | |||||||||||||||||||
E-Mini S&P 500 Futures | 9 | 3/18/22 | $ | 2,112,436 | $ | 2,141,325 | $ | 28,889 | |||||||||||||||
Total unrealized appreciation | $ | 28,889 | |||||||||||||||||||||
Total unrealized depreciation | — | ||||||||||||||||||||||
Total net unrealized appreciation (depreciation) | $ | 28,889 | |||||||||||||||||||||
See notes to financial statements.
30
| Victory Portfolios II VictoryShares US Small Cap Volatility Wtd ETF | Schedule of Portfolio Investments December 31, 2021 | ||||||
(Unaudited)
Security Description | Shares | Value | |||||||||
Common Stocks (99.7%) | |||||||||||
Banks (15.5%): | |||||||||||
1st Source Corp. | 1,441 | $ | 71,474 | ||||||||
Amerant Bancorp, Inc. | 1,755 | 60,635 | |||||||||
Atlantic Union Bankshares Corp. | 1,598 | 59,589 | |||||||||
Banc of California, Inc. | 3,300 | 64,746 | |||||||||
BancFirst Corp. | 1,093 | 77,122 | |||||||||
Banner Corp. | 1,004 | 60,913 | |||||||||
Berkshire Hills Bancorp, Inc. | 1,885 | 53,590 | |||||||||
Brookline Bancorp, Inc. | 4,641 | 75,138 | |||||||||
Byline Bancorp, Inc. | 2,551 | 69,770 | |||||||||
City Holding Co. | 1,078 | 88,170 | |||||||||
Columbia Banking System, Inc. | 1,612 | 52,745 | |||||||||
ConnectOne Bancorp, Inc. | 2,029 | 66,369 | |||||||||
Customers Bancorp, Inc. | 1,117 | 73,018 | |||||||||
CVB Financial Corp. | 3,370 | 72,152 | |||||||||
Dime Community Bancshares, Inc. | 1,669 | 58,682 | |||||||||
Eagle Bancorp, Inc. | 1,088 | 63,474 | |||||||||
Enterprise Financial Services Corp. | 1,389 | 65,408 | |||||||||
FB Financial Corp. | 1,541 | 67,527 | |||||||||
First Bancorp/Puerto Rico | 4,266 | 58,785 | |||||||||
First Bancorp/Southern Pines NC | 1,432 | 65,471 | |||||||||
First Busey Corp. | 2,813 | 76,289 | |||||||||
First Commonwealth Financial Corp. | 4,614 | 74,239 | |||||||||
First Financial Bancorp | 2,368 | 57,732 | |||||||||
First Foundation, Inc. | 2,653 | 65,954 | |||||||||
First Interstate BancSystem, Inc., Class A | 1,568 | 63,771 | |||||||||
First Merchants Corp. | 1,479 | 61,955 | |||||||||
Fulton Financial Corp. | 3,965 | 67,405 | |||||||||
German American Bancorp, Inc. | 1,843 | 71,840 | |||||||||
Great Western Bancorp, Inc. | 1,692 | 57,460 | |||||||||
Heartland Financial USA, Inc. | 1,449 | 73,334 | |||||||||
Heritage Financial Corp. | 2,508 | 61,295 | |||||||||
Hilltop Holdings, Inc. | 1,619 | 56,892 | |||||||||
Hope Bancorp, Inc. | 4,133 | 60,796 | |||||||||
Independent Bank Corp. | 876 | 71,420 | |||||||||
International Bancshares Corp. | 1,397 | 59,219 | |||||||||
Lakeland Bancorp, Inc. | 3,810 | 72,352 | |||||||||
Lakeland Financial Corp. | 979 | 78,457 | |||||||||
Live Oak Bancshares, Inc. | 642 | 56,040 | |||||||||
National Bank Holdings Corp., Class A | 1,824 | 80,147 | |||||||||
NBT Bancorp, Inc. | 1,904 | 73,342 | |||||||||
OFG Bancorp | 2,011 | 53,412 | |||||||||
Old National Bancorp | 4,547 | 82,392 | |||||||||
Origin Bancorp, Inc. | 1,397 | 59,959 | |||||||||
Park National Corp. | 564 | 77,443 | |||||||||
Preferred Bank | 1,037 | 74,446 | |||||||||
Renasant Corp. | 1,808 | 68,614 | |||||||||
Republic Bancorp, Inc., Class A | 1,460 | 74,226 | |||||||||
S&T Bancorp, Inc. | 1,971 | 62,126 | |||||||||
See notes to financial statements.
31
| Victory Portfolios II VictoryShares US Small Cap Volatility Wtd ETF | Schedule of Portfolio Investments — continued December 31, 2021 | ||||||
(Unaudited)
Security Description | Shares | Value | |||||||||
Sandy Spring Bancorp, Inc. | 1,405 | $ | 67,552 | ||||||||
Seacoast Banking Corp. of Florida | 1,767 | 62,534 | |||||||||
Silvergate Capital Corp., Class A (a) | 165 | 24,453 | |||||||||
Southside Bancshares, Inc. (b) | 1,889 | 78,998 | |||||||||
Stock Yards Bancorp, Inc. | 1,465 | 93,584 | |||||||||
The Bancorp, Inc. (a) | 1,714 | 43,381 | |||||||||
Tompkins Financial Corp. (c) | 773 | 64,607 | |||||||||
Towne Bank | 2,088 | 65,960 | |||||||||
TriCo Bancshares | 1,576 | 67,705 | |||||||||
Triumph Bancorp, Inc. (a) | 570 | 67,876 | |||||||||
Trustmark Corp. | 1,979 | 64,238 | |||||||||
United Community Banks, Inc. | 2,066 | 74,252 | |||||||||
Veritex Holdings, Inc. | 1,678 | 66,751 | |||||||||
Washington Trust Bancorp, Inc. | 1,245 | 70,181 | |||||||||
WesBanco, Inc. | 1,767 | 61,827 | |||||||||
Westamerica Bancorp | 1,446 | 83,478 | |||||||||
4,274,712 | |||||||||||
Capital Markets (2.3%): | |||||||||||
B Riley Financial, Inc. | 661 | 58,736 | |||||||||
BGC Partners, Inc., Class A | 9,228 | 42,910 | |||||||||
Brightsphere Investment Group, Inc. | 2,189 | 56,038 | |||||||||
Cowen, Inc., Class A | 1,016 | 36,678 | |||||||||
Donnelley Financial Solutions, Inc. (a) | 1,216 | 57,322 | |||||||||
Piper Sandler Cos. | 417 | 74,439 | |||||||||
PJT Partners, Inc., Class A | 914 | 67,718 | |||||||||
Sculptor Capital Management, Inc. | 1,629 | 34,779 | |||||||||
StoneX Group, Inc. (a) | 797 | 48,816 | |||||||||
Victory Capital Holdings, Inc., Class A (d) | 1,690 | 61,736 | |||||||||
Virtus Investment Partners, Inc. | 177 | 52,587 | |||||||||
WisdomTree Investments, Inc. | 7,680 | 47,002 | |||||||||
638,761 | |||||||||||
Communication Services (2.2%): | |||||||||||
AMC Networks, Inc., Class A (a) | 602 | 20,733 | |||||||||
Boston Omaha Corp., Class A (a) | 990 | 28,443 | |||||||||
Cars.com, Inc. (a) | 2,770 | 44,569 | |||||||||
Gray Television, Inc. | 2,651 | 53,444 | |||||||||
IDT Corp., Class B (a) | 669 | 29,543 | |||||||||
QuinStreet, Inc. (a) | 3,042 | 55,334 | |||||||||
Sciplay Corp., Class A (a) | 2,040 | 28,111 | |||||||||
Shenandoah Telecommunications Co. | 1,088 | 27,744 | |||||||||
TechTarget, Inc. (a) | 454 | 43,430 | |||||||||
Telephone & Data Systems, Inc. | 2,818 | 56,783 | |||||||||
The EW Scripps Co., Class A (a) | 2,643 | 51,142 | |||||||||
Thryv Holdings, Inc. (a) | 786 | 32,328 | |||||||||
United States Cellular Corp. (a) | 1,876 | 59,131 | |||||||||
WideOpenWest, Inc. (a) | 1,839 | 39,575 | |||||||||
Yelp, Inc. (a) | 1,153 | 41,785 | |||||||||
612,095 | |||||||||||
See notes to financial statements.
32
| Victory Portfolios II VictoryShares US Small Cap Volatility Wtd ETF | Schedule of Portfolio Investments — continued December 31, 2021 | ||||||
(Unaudited)
Security Description | Shares | Value | |||||||||
Consumer Discretionary (13.1%): | |||||||||||
1-800-Flowers.com, Inc., Class A (a) | 1,031 | $ | 24,094 | ||||||||
Abercrombie & Fitch Co. (a) | 1,067 | 37,164 | |||||||||
Accel Entertainment, Inc. (a) | 4,337 | 56,468 | |||||||||
Adtalem Global Education, Inc. (a) | 1,473 | 43,542 | |||||||||
American Axle & Manufacturing Holdings, Inc. (a) | 3,858 | 35,995 | |||||||||
America's Car-Mart, Inc. (a) | 343 | 35,123 | |||||||||
Arko Corp. (a) | 4,633 | 40,631 | |||||||||
Bally's Corp. (a) | 674 | 25,652 | |||||||||
Bed Bath & Beyond, Inc. (a) (c) | 561 | 8,179 | |||||||||
Big 5 Sporting Goods Corp. (c) | 884 | 16,805 | |||||||||
Big Lots, Inc. | 769 | 34,643 | |||||||||
Bloomin' Brands, Inc. (a) | 1,696 | 35,582 | |||||||||
Boot Barn Holdings, Inc. (a) | 442 | 54,388 | |||||||||
Brinker International, Inc. (a) | 747 | 27,333 | |||||||||
Carriage Services, Inc. | 1,695 | 109,226 | |||||||||
Cavco Industries, Inc. (a) | 211 | 67,024 | |||||||||
Century Communities, Inc. | 517 | 42,285 | |||||||||
Chuy's Holdings, Inc. (a) | 1,235 | 37,198 | |||||||||
Citi Trends, Inc. (a) | 429 | 40,648 | |||||||||
Clarus Corp. | 2,272 | 62,980 | |||||||||
Conn's, Inc. (a) | 1,156 | 27,189 | |||||||||
Denny's Corp. (a) | 3,010 | 48,160 | |||||||||
Dine Brands Global, Inc. | 539 | 40,862 | |||||||||
Dorman Products, Inc. (a) | 662 | 74,813 | |||||||||
El Pollo Loco Holdings, Inc. (a) | 3,376 | 47,905 | |||||||||
Ethan Allen Interiors, Inc. | 2,080 | 54,683 | |||||||||
Franchise Group, Inc. | 1,653 | 86,220 | |||||||||
Funko, Inc., Class A (a) | 1,530 | 28,764 | |||||||||
Genesco, Inc. (a) | 549 | 35,229 | |||||||||
Gentherm, Inc. (a) | 597 | 51,879 | |||||||||
G-III Apparel Group Ltd. (a) | 1,353 | 37,397 | |||||||||
Golden Entertainment, Inc. (a) | 735 | 37,140 | |||||||||
GoPro, Inc., Class A (a) | 3,010 | 31,033 | |||||||||
Green Brick Partners, Inc. (a) | 1,587 | 48,134 | |||||||||
Group 1 Automotive, Inc. | 258 | 50,367 | |||||||||
Groupon, Inc. (a) | 1,122 | 25,986 | |||||||||
GrowGeneration Corp. (a) (b) | 734 | 9,579 | |||||||||
Guess?, Inc. | 1,599 | 37,864 | |||||||||
Haverty Furniture Cos., Inc. | 1,246 | 38,090 | |||||||||
Hibbett, Inc. | 392 | 28,197 | |||||||||
Hovnanian Enterprises, Inc., Class A (a) | 216 | 27,495 | |||||||||
iRobot Corp. (a) | 381 | 25,100 | |||||||||
Jack in the Box, Inc. | 622 | 54,413 | |||||||||
Johnson Outdoors, Inc., Class A | 524 | 49,094 | |||||||||
Lands' End, Inc. (a) | 758 | 14,880 | |||||||||
La-Z-Boy, Inc. | 1,648 | 59,839 | |||||||||
Liquidity Services, Inc. (a) | 1,002 | 22,124 | |||||||||
Lumber Liquidators Holdings, Inc. (a) | 1,970 | 33,628 | |||||||||
M/I Homes, Inc. (a) | 674 | �� | 41,909 | ||||||||
See notes to financial statements.
33
| Victory Portfolios II VictoryShares US Small Cap Volatility Wtd ETF | Schedule of Portfolio Investments — continued December 31, 2021 | ||||||
(Unaudited)
Security Description | Shares | Value | |||||||||
Malibu Boats, Inc., Class A (a) | 635 | $ | 43,644 | ||||||||
MarineMax, Inc. (a) | 684 | 40,383 | |||||||||
Monarch Casino & Resort, Inc. (a) | 773 | 57,163 | |||||||||
Monro, Inc. | 989 | 57,629 | |||||||||
Movado Group, Inc. | 1,108 | 46,348 | |||||||||
OneWater Marine, Inc. | 929 | 56,641 | |||||||||
Oxford Industries, Inc. | 548 | 55,633 | |||||||||
Patrick Industries, Inc. | 630 | 50,835 | |||||||||
Perdoceo Education Corp. (a) | 5,338 | 62,775 | |||||||||
Ruth's Hospitality Group, Inc. (a) | 2,169 | 43,163 | |||||||||
Sally Beauty Holdings, Inc. (a) | 1,976 | 36,477 | |||||||||
Shoe Carnival, Inc. | 1,127 | 44,043 | |||||||||
Sleep Number Corp. (a) | 419 | 32,095 | |||||||||
Smith & Wesson Brands, Inc. | 1,346 | 23,959 | |||||||||
Sonic Automotive, Inc., Class A | 895 | 44,258 | |||||||||
Standard Motor Products, Inc. | 1,502 | 78,690 | |||||||||
Stoneridge, Inc. (a) | 2,120 | 41,849 | |||||||||
Strategic Education, Inc. | 710 | 41,066 | |||||||||
Stride, Inc. (a) | 1,267 | 42,229 | |||||||||
Sturm Ruger & Co., Inc. (b) | 754 | 51,287 | |||||||||
The Buckle, Inc. | 1,261 | 53,353 | |||||||||
The Children's Place, Inc. (a) | 378 | 29,972 | |||||||||
The Lovesac Co. (a) | 509 | 33,726 | |||||||||
The ODP Corp. (a) | 778 | 30,560 | |||||||||
TravelCenters of America, Inc. (a) | 769 | 39,696 | |||||||||
Tri Pointe Homes, Inc. (a) | 1,913 | 53,354 | |||||||||
Tupperware Brands Corp. (a) | 1,349 | 20,626 | |||||||||
Universal Electronics, Inc. (a) | 1,097 | 44,703 | |||||||||
Vista Outdoor, Inc. (a) | 888 | 40,910 | |||||||||
Visteon Corp. (a) | 457 | 50,791 | |||||||||
Winmark Corp. | 374 | 92,860 | |||||||||
Winnebago Industries, Inc. | 659 | 49,372 | |||||||||
Workhorse Group, Inc. (a) | 1,678 | 7,316 | |||||||||
WW International, Inc. (a) | 1,412 | 22,776 | |||||||||
XPEL, Inc. (a) | 430 | 29,360 | |||||||||
Zumiez, Inc. (a) | 1,097 | 52,645 | |||||||||
3,605,120 | |||||||||||
Consumer Finance (1.2%): | |||||||||||
Atlanticus Holdings Corp. (a) | 430 | 30,668 | |||||||||
Encore Capital Group, Inc. (a) | 1,246 | 77,389 | |||||||||
Enova International, Inc. (a) | 1,360 | 55,706 | |||||||||
Green Dot Corp., Class A (a) | 1,093 | 39,610 | |||||||||
PRA Group, Inc. (a) | 1,615 | 81,089 | |||||||||
World Acceptance Corp. (a) | 164 | 40,250 | |||||||||
324,712 | |||||||||||
Consumer Staples (7.0%): | |||||||||||
B&G Foods, Inc. (c) | 1,462 | 44,927 | |||||||||
BellRing Brands, Inc., Class A (a) (c) | 1,846 | 52,666 | |||||||||
Calavo Growers, Inc. | 1,359 | 57,622 | |||||||||
See notes to financial statements.
34
| Victory Portfolios II VictoryShares US Small Cap Volatility Wtd ETF | Schedule of Portfolio Investments — continued December 31, 2021 | ||||||
(Unaudited)
Security Description | Shares | Value | |||||||||
Cal-Maine Foods, Inc. | 2,620 | $ | 96,914 | ||||||||
Central Garden & Pet Co., Class A (a) | 1,677 | 80,245 | |||||||||
e.l.f. Beauty, Inc. (a) | 2,017 | 66,985 | |||||||||
Edgewell Personal Care Co. | 1,528 | 69,845 | |||||||||
Energizer Holdings, Inc. | 1,939 | 77,754 | |||||||||
Fresh Del Monte Produce, Inc. | 1,610 | 44,436 | |||||||||
Grocery Outlet Holding Corp. (a) | 1,962 | 55,485 | |||||||||
Hostess Brands, Inc. (a) | 5,663 | 115,639 | |||||||||
Ingles Markets, Inc., Class A | 1,054 | 91,002 | |||||||||
Inter Parfums, Inc. | 918 | 98,134 | |||||||||
John B Sanfilippo & Son, Inc. | 991 | 89,349 | |||||||||
Medifast, Inc. | 190 | 39,792 | |||||||||
MGP Ingredients, Inc. | 765 | 65,017 | |||||||||
Nu Skin Enterprises, Inc., Class A | 1,120 | 56,840 | |||||||||
PriceSmart, Inc. | 885 | 64,755 | |||||||||
SpartanNash Co. | 3,033 | 78,130 | |||||||||
Sprouts Farmers Market, Inc. (a) | 2,387 | 70,846 | |||||||||
The Andersons, Inc. | 1,572 | 60,852 | |||||||||
Tootsie Roll Industries, Inc. | 1,463 | 53,005 | |||||||||
TreeHouse Foods, Inc. (a) | 1,432 | 58,039 | |||||||||
Turning Point Brands, Inc. | 990 | 37,402 | |||||||||
United Natural Foods, Inc. (a) | 829 | 40,687 | |||||||||
Universal Corp. | 1,484 | 81,501 | |||||||||
USANA Health Sciences, Inc. (a) | 667 | 67,500 | |||||||||
Vector Group Ltd. | 3,694 | 42,407 | |||||||||
Weis Markets, Inc. (b) | 1,160 | 76,421 | |||||||||
1,934,197 | |||||||||||
Diversified Financial Services (0.3%): | |||||||||||
Cannae Holdings, Inc. (a) | 2,073 | 72,866 | |||||||||
Energy (1.3%): | |||||||||||
Altus Midstream Co., Class A | 651 | 39,913 | |||||||||
Archrock, Inc. | 6,990 | 52,285 | |||||||||
Cactus, Inc., Class A | 986 | 37,596 | |||||||||
Civitas Resources, Inc. | 882 | 43,192 | |||||||||
CONSOL Energy, Inc. (a) | 1,183 | 26,866 | |||||||||
Core Laboratories NV | 1,320 | 29,449 | |||||||||
Renewable Energy Group, Inc. (a) | 587 | 24,912 | |||||||||
Transocean Ltd. (a) | 6,164 | 17,013 | |||||||||
Whiting Petroleum Corp. (a) | 799 | 51,679 | |||||||||
World Fuel Services Corp. (b) | 1,356 | 35,893 | |||||||||
358,798 | |||||||||||
Health Care (8.7%): | |||||||||||
Addus HomeCare Corp. (a) | 585 | 54,703 | |||||||||
Amneal Pharmaceuticals, Inc. (a) | 6,098 | 29,209 | |||||||||
Amphastar Pharmaceuticals, Inc. (a) | 3,992 | 92,974 | |||||||||
Antares Pharma, Inc. (a) | 12,168 | 43,440 | |||||||||
Atrion Corp. | 103 | 72,605 | |||||||||
Avanos Medical, Inc. (a) | 1,789 | 62,025 | |||||||||
Avid Bioservices, Inc. (a) | 1,409 | 41,115 | |||||||||
See notes to financial statements.
35
| Victory Portfolios II VictoryShares US Small Cap Volatility Wtd ETF | Schedule of Portfolio Investments — continued December 31, 2021 | ||||||
(Unaudited)
Security Description | Shares | Value | |||||||||
BioLife Solutions, Inc. (a) | 579 | $ | 21,579 | ||||||||
Cara Therapeutics, Inc. (a) | 1,702 | 20,730 | |||||||||
Collegium Pharmaceutical, Inc. (a) | 1,947 | 36,370 | |||||||||
Community Health Systems, Inc. (a) | 2,239 | 29,801 | |||||||||
Corcept Therapeutics, Inc. (a) | 3,191 | 63,182 | |||||||||
CorVel Corp. (a) | 469 | 97,552 | |||||||||
Cross Country Healthcare, Inc. (a) | 1,646 | 45,693 | |||||||||
Cutera, Inc. (a) | 700 | 28,924 | |||||||||
Eagle Pharmaceuticals, Inc. (a) | 933 | 47,508 | |||||||||
Fulgent Genetics, Inc. (a) | 211 | 21,224 | |||||||||
Hanger, Inc. (a) | 2,494 | 45,216 | |||||||||
HealthStream, Inc. (a) | 2,564 | 67,587 | |||||||||
Innoviva, Inc. (a) | 3,888 | 67,068 | |||||||||
Ironwood Pharmaceuticals, Inc. (a) | 4,494 | 52,400 | |||||||||
LeMaitre Vascular, Inc. | 1,029 | 51,687 | |||||||||
Lexicon Pharmaceuticals, Inc. (a) | 2,971 | 11,706 | |||||||||
Ligand Pharmaceuticals, Inc. (a) | 242 | 37,379 | |||||||||
Meridian Bioscience, Inc. (a) | 1,564 | 31,906 | |||||||||
Mesa Laboratories, Inc. | 342 | 112,207 | |||||||||
ModivCare, Inc. (a) | 234 | 34,700 | |||||||||
National HealthCare Corp. (b) | 860 | 58,428 | |||||||||
National Research Corp. | 1,222 | 50,737 | |||||||||
Natus Medical, Inc. (a) | 1,957 | 46,440 | |||||||||
NextGen Healthcare, Inc. (a) | 3,450 | 61,375 | |||||||||
OPKO Health, Inc. (a) | 9,136 | 43,944 | |||||||||
OptimizeRx Corp. (a) | 452 | 28,074 | |||||||||
OraSure Technologies, Inc. (a) | 3,619 | 31,449 | |||||||||
Organogenesis Holdings, Inc. (a) | 1,560 | 14,414 | |||||||||
Owens & Minor, Inc. | 707 | 30,755 | |||||||||
Pacira BioSciences, Inc. (a) | 970 | 58,365 | |||||||||
Patterson Cos., Inc. (b) | 1,927 | 56,557 | |||||||||
Phibro Animal Health Corp., Class A | 2,459 | 50,213 | |||||||||
Prestige Consumer Healthcare, Inc. (a) | 1,384 | 83,940 | |||||||||
RadNet, Inc. (a) | 1,224 | 36,855 | |||||||||
Sage Therapeutics, Inc. (a) | 789 | 33,564 | |||||||||
Simulations Plus, Inc. | 895 | 42,334 | |||||||||
Supernus Pharmaceuticals, Inc. (a) | 1,629 | 47,502 | |||||||||
Surmodics, Inc. (a) | 932 | 44,876 | |||||||||
Tactile Systems Technology, Inc. (a) | 1,041 | 19,810 | |||||||||
The Joint Corp. (a) | 346 | 22,729 | |||||||||
The Pennant Group, Inc. (a) | 1,262 | 29,127 | |||||||||
U.S. Physical Therapy, Inc. | 389 | 37,169 | |||||||||
uniQure NV (a) | 1,310 | 27,169 | |||||||||
Vanda Pharmaceuticals, Inc. (a) | 2,625 | 41,186 | |||||||||
Vericel Corp. (a) | 617 | 24,248 | |||||||||
Xencor, Inc. (a) | 1,392 | 55,847 | |||||||||
2,397,597 | |||||||||||
See notes to financial statements.
36
| Victory Portfolios II VictoryShares US Small Cap Volatility Wtd ETF | Schedule of Portfolio Investments — continued December 31, 2021 | ||||||
(Unaudited)
Security Description | Shares | Value | |||||||||
Industrials (21.8%): | |||||||||||
AAR Corp. (a) | 1,582 | $ | 61,745 | ||||||||
ACCO Brands Corp. | 5,931 | 70,736 | |||||||||
AeroVironment, Inc. (a) | 344 | 21,338 | |||||||||
Air Transport Services Group, Inc. (a) | 2,203 | 64,724 | |||||||||
Alamo Group, Inc. | 470 | 69,175 | |||||||||
Albany International Corp. | 782 | 69,168 | |||||||||
American Woodmark Corp. (a) | 732 | 47,726 | |||||||||
Apogee Enterprises, Inc. | 1,217 | 58,599 | |||||||||
ArcBest Corp. | 625 | 74,906 | |||||||||
Arcosa, Inc. | 999 | 52,647 | |||||||||
Argan, Inc. | 1,608 | 62,214 | |||||||||
Astec Industries, Inc. | 803 | 55,624 | |||||||||
Atlas Air Worldwide Holdings, Inc. (a) | 823 | 77,461 | |||||||||
AZZ, Inc. | 1,288 | 71,214 | |||||||||
Babcock & Wilcox Enterprises, Inc. (a) | 3,657 | 32,986 | |||||||||
Barnes Group, Inc. | 1,318 | 61,406 | |||||||||
Boise Cascade Co. | 769 | 54,753 | |||||||||
Brady Corp., Class A | 1,523 | 82,090 | |||||||||
BrightView Holdings, Inc. (a) | 3,782 | 53,251 | |||||||||
CBIZ, Inc. (a) | 2,696 | 105,468 | |||||||||
Columbus McKinnon Corp. | 1,331 | 61,572 | |||||||||
Comfort Systems USA, Inc. | 815 | 80,636 | |||||||||
Construction Partners, Inc., Class A (a) | 1,404 | 41,292 | |||||||||
Cornerstone Building Brands, Inc. (a) | 2,175 | 37,932 | |||||||||
CRA International, Inc. | 566 | 52,842 | |||||||||
CSW Industrials, Inc. | 522 | 63,089 | |||||||||
Deluxe Corp. | 1,303 | 41,839 | |||||||||
Douglas Dynamics, Inc. | 1,521 | 59,410 | |||||||||
Ducommun, Inc. (a) | 974 | 45,554 | |||||||||
Dycom Industries, Inc. (a) | 488 | 45,755 | |||||||||
Eagle Bulk Shipping, Inc. | 630 | 28,665 | |||||||||
Encore Wire Corp. | 768 | 109,901 | |||||||||
Energy Recovery, Inc. (a) | 2,069 | 44,463 | |||||||||
Enerpac Tool Group Corp. | 2,351 | 47,678 | |||||||||
EnPro Industries, Inc. | 759 | 83,543 | |||||||||
ESCO Technologies, Inc. | 824 | 74,152 | |||||||||
Federal Signal Corp. | 1,777 | 77,015 | |||||||||
Forrester Research, Inc. (a) | 1,334 | 78,346 | |||||||||
Forward Air Corp. | 795 | 96,267 | |||||||||
Franklin Covey Co. (a) | 1,293 | 59,943 | |||||||||
Gibraltar Industries, Inc. (a) | 681 | 45,409 | |||||||||
Global Industrial Co. | 1,206 | 49,325 | |||||||||
GMS, Inc. (a) | 996 | 59,870 | |||||||||
GrafTech International Ltd. | 3,879 | 45,889 | |||||||||
Great Lakes Dredge & Dock Corp. (a) | 4,042 | 63,540 | |||||||||
Griffon Corp. | 2,235 | 63,653 | |||||||||
H&E Equipment Services, Inc. | 1,287 | 56,975 | |||||||||
Healthcare Services Group | 2,069 | 36,808 | |||||||||
Heartland Express, Inc. | 5,653 | 95,083 | |||||||||
See notes to financial statements.
37
| Victory Portfolios II VictoryShares US Small Cap Volatility Wtd ETF | Schedule of Portfolio Investments — continued December 31, 2021 | ||||||
(Unaudited)
Security Description | Shares | Value | |||||||||
Heidrick & Struggles International, Inc. | 1,430 | $ | 62,534 | ||||||||
Helios Technologies, Inc. | 817 | 85,924 | |||||||||
Heritage-Crystal Clean, Inc. (a) | 1,732 | 55,459 | |||||||||
HNI Corp. | 1,546 | 65,009 | |||||||||
Hub Group, Inc., Class A (a) | 956 | 80,533 | |||||||||
Huron Consulting Group, Inc. (a) | 1,117 | 55,738 | |||||||||
Hyster-Yale Materials Handling, Inc. | 728 | 29,921 | |||||||||
ICF International, Inc. | 839 | 86,039 | |||||||||
IES Holdings, Inc. (a) | 1,042 | 52,767 | |||||||||
Insteel Industries, Inc. | 1,306 | 51,992 | |||||||||
Interface, Inc. | 3,341 | 53,289 | |||||||||
JELD-WEN Holding, Inc. (a) | 1,679 | 44,258 | |||||||||
Kadant, Inc. | 327 | 75,367 | |||||||||
KAR Auction Services, Inc. (a) | 2,585 | 40,378 | |||||||||
Kelly Services, Inc., Class A | 2,856 | 47,895 | |||||||||
Kforce, Inc. | 1,151 | 86,578 | |||||||||
Lindsay Corp. | 409 | 62,168 | |||||||||
Marten Transport Ltd. | 4,576 | 78,524 | |||||||||
Matthews International Corp., Class A | 1,724 | 63,219 | |||||||||
McGrath RentCorp | 988 | 79,297 | |||||||||
Mercury Systems, Inc. (a) | 958 | 52,747 | |||||||||
Meritor, Inc. (a) | 2,071 | 51,319 | |||||||||
Moog, Inc., Class A | 845 | 68,420 | |||||||||
Mueller Industries, Inc. | 1,479 | 87,793 | |||||||||
Mueller Water Products, Inc., Class A | 4,772 | 68,717 | |||||||||
MYR Group, Inc. (a) | 489 | 54,059 | |||||||||
NV5 Global, Inc. (a) | 483 | 66,712 | |||||||||
Omega Flex, Inc. | 286 | 36,308 | |||||||||
PAE, Inc. (a) | 7,302 | 72,509 | |||||||||
PGT Innovations, Inc. (a) | 2,517 | 56,607 | |||||||||
Pitney Bowes, Inc. | 2,219 | 14,712 | |||||||||
Primoris Services Corp. | 1,839 | 44,099 | |||||||||
Proto Labs, Inc. (a) | 462 | 23,724 | |||||||||
Quanex Building Products Corp. | 2,604 | 64,527 | |||||||||
REV Group, Inc. | 1,963 | 27,776 | |||||||||
Romeo Power, Inc. (a) (c) | 3,370 | 12,300 | |||||||||
Rush Enterprises, Inc., Class A | 1,519 | 84,517 | |||||||||
SkyWest, Inc. (a) | 965 | 37,924 | |||||||||
SPX Corp. (a) | 1,052 | 62,783 | |||||||||
Standex International Corp. | 660 | 73,036 | |||||||||
Steelcase, Inc., Class A | 3,912 | 45,849 | |||||||||
Sterling Construction Co., Inc. (a) | 1,587 | 41,738 | |||||||||
Tennant Co. | 1,111 | 90,035 | |||||||||
The Gorman-Rupp Co. | 1,849 | 82,373 | |||||||||
The Greenbrier Cos., Inc. | 1,113 | 51,076 | |||||||||
The Manitowoc Co., Inc. (a) | 1,435 | 26,677 | |||||||||
The Shyft Group, Inc. | 1,056 | 51,881 | |||||||||
Titan Machinery, Inc. (a) | 1,237 | 41,675 | |||||||||
TPI Composites, Inc. (a) | 748 | 11,190 | |||||||||
TrueBlue, Inc. (a) | 1,663 | 46,015 | |||||||||
See notes to financial statements.
38
| Victory Portfolios II VictoryShares US Small Cap Volatility Wtd ETF | Schedule of Portfolio Investments — continued December 31, 2021 | ||||||
(Unaudited)
Security Description | Shares | Value | |||||||||
Tutor Perini Corp. (a) | 2,618 | $ | 32,385 | ||||||||
Veritiv Corp. (a) | 279 | 34,197 | |||||||||
VSE Corp. | 1,086 | 66,181 | |||||||||
Wabash National Corp. | 3,515 | 68,613 | |||||||||
6,001,040 | |||||||||||
Information Technology (10.4%): | |||||||||||
A10 Networks, Inc. | 3,031 | 50,254 | |||||||||
ACM Research, Inc., Class A (a) | 258 | 22,000 | |||||||||
ADTRAN, Inc. | 2,012 | 45,934 | |||||||||
Alpha & Omega Semiconductor Ltd. (a) | 1,099 | 66,555 | |||||||||
American Software, Inc., Class A | 1,439 | 37,659 | |||||||||
Avaya Holdings Corp. (a) | 1,992 | 39,442 | |||||||||
Avid Technology, Inc. (a) | 1,096 | 35,697 | |||||||||
Axcelis Technologies, Inc. (a) | 661 | 49,284 | |||||||||
Belden, Inc. | 846 | 55,607 | |||||||||
Benchmark Electronics, Inc. | 2,535 | 68,698 | |||||||||
Calix, Inc. (a) | 703 | 56,219 | |||||||||
Cambium Networks Corp. (a) | 725 | 18,582 | |||||||||
Cass Information Systems, Inc. | 1,776 | 69,832 | |||||||||
ChannelAdvisor Corp. (a) | 1,642 | 40,524 | |||||||||
Clearfield, Inc. (a) | 683 | 57,659 | |||||||||
Cohu, Inc. (a) | 956 | 36,414 | |||||||||
CSG Systems International, Inc. | 2,011 | 115,874 | |||||||||
CTS Corp. | 1,640 | 60,221 | |||||||||
Digi International, Inc. (a) | 2,056 | 50,516 | |||||||||
Ebix, Inc. | 810 | 24,624 | |||||||||
EchoStar Corp., Class A (a) | 1,760 | 46,376 | |||||||||
ePlus, Inc. (a) | 1,200 | 64,656 | |||||||||
Extreme Networks, Inc. (a) | 3,610 | 56,677 | |||||||||
FARO Technologies, Inc. (a) | 789 | 55,246 | |||||||||
Ichor Holdings Ltd. (a) | 745 | 34,292 | |||||||||
InterDigital, Inc. | 929 | 66,544 | |||||||||
Kimball Electronics, Inc. (a) | 1,739 | 37,841 | |||||||||
Knowles Corp. (a) | 4,627 | 108,040 | |||||||||
Methode Electronics, Inc. | 1,417 | 69,674 | |||||||||
Mitek Systems, Inc. (a) | 1,815 | 32,216 | |||||||||
Napco Security Technologies, Inc. (a) | 1,389 | 69,422 | |||||||||
NETGEAR, Inc. (a) | 1,408 | 41,128 | |||||||||
NetScout Systems, Inc. (a) | 2,736 | 90,507 | |||||||||
OSI Systems, Inc. (a) | 1,023 | 95,344 | |||||||||
PC Connection, Inc. | 1,294 | 55,810 | |||||||||
Photronics, Inc. (a) | 3,687 | 69,500 | |||||||||
Plexus Corp. (a) | 819 | 78,534 | |||||||||
Progress Software Corp. | 1,545 | 74,577 | |||||||||
Ribbon Communications, Inc. (a) | 5,796 | 35,066 | |||||||||
Sanmina Corp. (a) | 1,974 | 81,842 | |||||||||
ScanSource, Inc. (a) | 1,278 | 44,832 | |||||||||
SMART Global Holdings, Inc. (a) | 813 | 57,715 | |||||||||
SolarWinds Corp. | 2,278 | 32,325 | |||||||||
Super Micro Computer, Inc. (a) | 1,746 | 76,737 | |||||||||
See notes to financial statements.
39
| Victory Portfolios II VictoryShares US Small Cap Volatility Wtd ETF | Schedule of Portfolio Investments — continued December 31, 2021 | ||||||
(Unaudited)
Security Description | Shares | Value | |||||||||
TTM Technologies, Inc. (a) | 11,219 | $ | 167,163 | ||||||||
Ultra Clean Holdings, Inc. (a) | 688 | 39,464 | |||||||||
Veeco Instruments, Inc. (a) | 2,311 | 65,794 | |||||||||
Verra Mobility Corp. (a) | 3,499 | 53,989 | |||||||||
Xperi Holding Corp. | 2,899 | 54,820 | |||||||||
2,857,726 | |||||||||||
Insurance (2.8%): | |||||||||||
American Equity Investment Life Holding Co. | 2,121 | 82,549 | |||||||||
AMERISAFE, Inc. | 1,560 | 83,975 | |||||||||
Argo Group International Holdings Ltd. | 1,342 | 77,984 | |||||||||
eHealth, Inc. (a) | 803 | 20,477 | |||||||||
Employers Holdings, Inc. | 1,885 | 78,001 | |||||||||
Genworth Financial, Inc. (a) | 8,772 | 35,527 | |||||||||
HCI Group, Inc. | 362 | 30,241 | |||||||||
Horace Mann Educators Corp. | 2,043 | 79,064 | |||||||||
Palomar Holdings, Inc. (a) | 472 | 30,571 | |||||||||
Safety Insurance Group, Inc. (b) | 1,055 | 89,707 | |||||||||
Selectquote, Inc. (a) | 2,638 | 23,900 | |||||||||
SiriusPoint Ltd. (a) | 7,130 | 57,967 | |||||||||
Stewart Information Services Corp. | 1,116 | 88,979 | |||||||||
778,942 | |||||||||||
IT Services (0.2%): | |||||||||||
Everi Holdings, Inc. (a) | 1,820 | 38,857 | |||||||||
Machinery (0.1%): | |||||||||||
DMC Global, Inc. (a) | 878 | 34,778 | |||||||||
Materials (4.1%): | |||||||||||
AdvanSix, Inc. | 1,210 | 57,172 | |||||||||
Chase Corp. | 598 | 59,537 | |||||||||
Coeur Mining, Inc. (a) | 3,726 | 18,779 | |||||||||
GCP Applied Technologies, Inc. (a) | 2,643 | 83,677 | |||||||||
Glatfelter Corp. | 3,820 | 65,704 | |||||||||
Hawkins, Inc. | 1,318 | 51,995 | |||||||||
Innospec, Inc. | 740 | 66,852 | |||||||||
Koppers Holdings, Inc. (a) | 1,574 | 49,266 | |||||||||
Kronos Worldwide, Inc. | 4,771 | 71,613 | |||||||||
Materion Corp. | 844 | 77,597 | |||||||||
Minerals Technologies, Inc. | 831 | 60,788 | |||||||||
Myers Industries, Inc. | 2,718 | 54,387 | |||||||||
O-I Glass, Inc. (a) | 2,956 | 35,561 | |||||||||
Orion Engineered Carbons SA (a) | 2,817 | 51,720 | |||||||||
Ryerson Holding Corp. | 1,240 | 32,302 | |||||||||
Schnitzer Steel Industries, Inc. | 813 | 42,211 | |||||||||
Schweitzer-Mauduit International, Inc. | 1,527 | 45,657 | |||||||||
Stepan Co. | 716 | 88,992 | |||||||||
TimkenSteel Corp. (a) | 1,840 | 30,360 | |||||||||
Trinseo PLC (a) | 912 | 47,844 | |||||||||
Worthington Industries, Inc. | 871 | 47,609 | |||||||||
1,139,623 | |||||||||||
See notes to financial statements.
40
| Victory Portfolios II VictoryShares US Small Cap Volatility Wtd ETF | Schedule of Portfolio Investments — continued December 31, 2021 | ||||||
(Unaudited)
Security Description | Shares | Value | |||||||||
Real Estate (1.6%): | |||||||||||
Douglas Elliman, Inc. (a) | 1,847 | $ | 21,241 | ||||||||
Forestar Group, Inc. (a) | 3,340 | 72,645 | |||||||||
Marcus & Millichap, Inc. (a) | 1,987 | 102,251 | |||||||||
Newmark Group, Inc., Class A | 3,395 | 63,486 | |||||||||
RE/MAX Holdings, Inc. | 1,839 | 56,071 | |||||||||
Realogy Holdings Corp. (a) | 2,072 | 34,830 | |||||||||
The RMR Group, Inc., Class A | 1,271 | 44,078 | |||||||||
The St. Joe Co. | 1,013 | 52,727 | |||||||||
447,329 | |||||||||||
Thrifts & Mortgage Finance (4.1%): | |||||||||||
Axos Financial, Inc. (a) | 1,257 | 70,279 | |||||||||
Capitol Federal Financial, Inc. | 7,681 | 87,026 | |||||||||
Columbia Financial, Inc. (a) (b) | 5,302 | 110,600 | |||||||||
Federal Agricultural Mortgage Corp., Class C | 686 | 85,016 | |||||||||
Kearny Financial Corp. | 5,721 | 75,803 | |||||||||
Merchants Bancorp | 1,449 | 68,581 | |||||||||
Meta Financial Group, Inc. | 1,172 | 69,921 | |||||||||
NMI Holdings, Inc., Class A (a) | 2,447 | 53,467 | |||||||||
Northfield Bancorp, Inc. | 4,888 | 78,990 | |||||||||
Northwest Bancshares, Inc. (b) | 6,429 | 91,035 | |||||||||
OceanFirst Financial Corp. | 2,954 | 65,579 | |||||||||
Premier Financial Corp. | 1,944 | 60,089 | |||||||||
Provident Financial Services, Inc. | 2,930 | 70,965 | |||||||||
Washington Federal, Inc. | 2,154 | 71,900 | |||||||||
WSFS Financial Corp. | 1,226 | 61,447 | |||||||||
1,120,698 | |||||||||||
Utilities (3.0%): | |||||||||||
Avista Corp. | 2,091 | 88,847 | |||||||||
Chesapeake Utilities Corp. | 698 | 101,775 | |||||||||
MGE Energy, Inc. | 1,219 | 100,263 | |||||||||
Middlesex Water Co. | 535 | 64,361 | |||||||||
Northwest Natural Holding Co. | 1,257 | 61,316 | |||||||||
Otter Tail Corp. (b) | 1,728 | 123,414 | |||||||||
SJW Group | 1,278 | 93,550 | |||||||||
South Jersey Industries, Inc. | 2,110 | 55,113 | |||||||||
The York Water Co. | 1,517 | 75,516 | |||||||||
Unitil Corp. (b) | 1,356 | 62,362 | |||||||||
826,517 | |||||||||||
Total Common Stocks (Cost $23,380,949) | 27,464,368 | ||||||||||
Collateral for Securities Loaned^ (0.5%) | |||||||||||
BlackRock Liquidity Funds TempFund, Institutional Shares, 0.04% (e) | 3,370 | 3,370 | |||||||||
| Fidelity Investments Money Market Government Portfolio, Institutional Shares, 0.01% (e) | 66,186 | 66,186 | |||||||||
| Goldman Sachs Financial Square Prime Obligations Fund, Institutional Shares, 0.02% (e) | 1,682 | 1,682 | |||||||||
See notes to financial statements.
41
| Victory Portfolios II VictoryShares US Small Cap Volatility Wtd ETF | Schedule of Portfolio Investments — continued December 31, 2021 | ||||||
(Unaudited)
Security Description | Shares | Value | |||||||||
JPMorgan Prime Money Market Fund, Capital Shares, 0.07% (e) | 13,410 | $ | 13,410 | ||||||||
| Morgan Stanley Institutional Liquidity Prime Portfolio, Institutional Shares, 0.06% (e) | 60,294 | 60,294 | |||||||||
Total Collateral for Securities Loaned (Cost $144,942) | 144,942 | ||||||||||
Total Investments (Cost $23,525,891) — 100.2% | 27,609,310 | ||||||||||
Liabilities in excess of other assets — (0.2)% | (43,096 | ) | |||||||||
NET ASSETS — 100.00% | $ | 27,566,214 | |||||||||
^ Purchased with cash collateral from securities on loan.
(a) Non-income producing security.
(b) All or a portion of this security has been segregated as collateral for derivative instruments.
(c) All or a portion of this security is on loan.
(d) Affiliated security. (See Note 8 in the Notes to Financial Statements)
(e) Rate disclosed is the daily yield on December 31, 2021.
PLC — Public Limited Company
Futures Contracts Purchased
| Number of Contracts | Expiration Date | Notional Amount | Value | Unrealized Appreciation (Depreciation) | |||||||||||||||||||
E-Mini Russell 2000 Index Futures | 1 | 3/18/22 | $ | 113,359 | $ | 112,140 | $ | (1,219 | ) | ||||||||||||||
Total unrealized appreciation | $ | — | |||||||||||||||||||||
Total unrealized depreciation | (1,219 | ) | |||||||||||||||||||||
Total net unrealized appreciation (depreciation) | $ | (1,219 | ) | ||||||||||||||||||||
See notes to financial statements.
42
| Victory Portfolios II VictoryShares International Volatility Wtd ETF | Schedule of Portfolio Investments December 31, 2021 | ||||||
(Unaudited)
Security Description | Shares | Value | |||||||||
Common Stocks (99.6%) | |||||||||||
Australia (4.7%): | |||||||||||
Communication Services (0.5%): | |||||||||||
REA Group Ltd. | 1,868 | $ | 227,786 | ||||||||
Telstra Corp. Ltd. | 111,911 | 340,269 | |||||||||
568,055 | |||||||||||
Consumer Discretionary (0.2%): | |||||||||||
Aristocrat Leisure Ltd. | 7,050 | 223,434 | |||||||||
Consumer Staples (0.5%): | |||||||||||
Coles Group Ltd. | 21,757 | 283,919 | |||||||||
Woolworths Group Ltd. | 10,009 | 276,734 | |||||||||
560,653 | |||||||||||
Energy (0.2%): | |||||||||||
Woodside Petroleum Ltd. | 13,908 | 221,859 | |||||||||
Financials (1.8%): | |||||||||||
ASX Ltd. | 5,342 | 360,988 | |||||||||
Australia & New Zealand Banking Group Ltd. | 15,527 | 310,707 | |||||||||
Commonwealth Bank of Australia | 4,044 | 297,102 | |||||||||
Macquarie Group Ltd. | 2,265 | 338,409 | |||||||||
National Australia Bank Ltd. | 16,731 | 350,986 | |||||||||
Suncorp Group Ltd. | 26,395 | 212,541 | |||||||||
Westpac Banking Corp. | 16,796 | 260,842 | |||||||||
2,131,575 | |||||||||||
Health Care (0.5%): | |||||||||||
CSL Ltd. | 1,165 | 246,362 | |||||||||
Sonic Healthcare Ltd. | 9,227 | 312,967 | |||||||||
559,329 | |||||||||||
Industrials (0.2%): | |||||||||||
Brambles Ltd. | 41,078 | 317,626 | |||||||||
Materials (0.8%): | |||||||||||
BHP Group Ltd. (a) | 5,700 | 172,066 | |||||||||
Fortescue Metals Group Ltd. | 9,344 | 130,567 | |||||||||
Newcrest Mining Ltd. | 11,020 | 196,230 | |||||||||
Rio Tinto Ltd. | 2,186 | 159,185 | |||||||||
Wesfarmers Ltd. | 7,309 | 315,272 | |||||||||
973,320 | |||||||||||
5,555,851 | |||||||||||
Austria (0.5%): | |||||||||||
Energy (0.2%): | |||||||||||
OMV AG | 3,570 | 203,000 | |||||||||
Financials (0.2%): | |||||||||||
Erste Group Bank AG | 6,002 | 282,530 | |||||||||
See notes to financial statements.
43
| Victory Portfolios II VictoryShares International Volatility Wtd ETF | Schedule of Portfolio Investments — continued December 31, 2021 | ||||||
(Unaudited)
Security Description | Shares | Value | |||||||||
Utilities (0.1%): | |||||||||||
Verbund AG | 1,422 | $ | 160,099 | ||||||||
645,629 | |||||||||||
Belgium (1.5%): | |||||||||||
Consumer Staples (0.2%): | |||||||||||
Anheuser-Busch InBev SA (a) | 3,690 | 223,350 | |||||||||
Financials (0.8%): | |||||||||||
Groupe Bruxelles Lambert SA | 3,280 | 366,523 | |||||||||
KBC Group NV | 2,402 | 206,340 | |||||||||
Sofina SA | 603 | 296,547 | |||||||||
869,410 | |||||||||||
Health Care (0.2%): | |||||||||||
UCB SA | 2,264 | 258,635 | |||||||||
Materials (0.3%): | |||||||||||
Solvay SA, Class A | 2,099 | 244,206 | |||||||||
Umicore SA (a) | 2,949 | 120,017 | |||||||||
364,223 | |||||||||||
1,715,618 | |||||||||||
Canada (12.9%): | |||||||||||
Communication Services (1.1%): | |||||||||||
BCE, Inc. (a) (b) | 9,554 | 497,113 | |||||||||
Rogers Communications, Inc., Class B | 5,793 | 275,864 | |||||||||
TELUS Corp. (a) (b) | 20,329 | 478,812 | |||||||||
1,251,789 | |||||||||||
Consumer Discretionary (0.5%): | |||||||||||
Dollarama, Inc. | 6,757 | 338,224 | |||||||||
Restaurant Brands International, Inc. | 4,158 | 252,149 | |||||||||
590,373 | |||||||||||
Consumer Staples (1.3%): | |||||||||||
Alimentation Couche-Tard, Inc. | 5,743 | 240,654 | |||||||||
George Weston Ltd. | 3,111 | 360,736 | |||||||||
Loblaw Cos. Ltd. | 5,377 | 440,601 | |||||||||
Metro, Inc. | 8,613 | 458,434 | |||||||||
1,500,425 | |||||||||||
Energy (0.9%): | |||||||||||
Canadian Natural Resources Ltd. | 5,091 | 215,144 | |||||||||
Enbridge, Inc. | 8,656 | 338,151 | |||||||||
Suncor Energy, Inc. | 8,476 | 212,101 | |||||||||
TC Energy Corp. | 5,993 | 278,754 | |||||||||
1,044,150 | |||||||||||
Financials (4.6%): | |||||||||||
Bank of Montreal | 3,801 | 409,281 | |||||||||
Brookfield Asset Management, Inc., Class A | 4,498 | 271,665 | |||||||||
Canadian Imperial Bank of Commerce | 4,163 | 485,321 | |||||||||
See notes to financial statements.
44
| Victory Portfolios II VictoryShares International Volatility Wtd ETF | Schedule of Portfolio Investments — continued December 31, 2021 | ||||||
(Unaudited)
Security Description | Shares | Value | |||||||||
Fairfax Financial Holdings Ltd. | 582 | $ | 286,325 | ||||||||
Great-West Lifeco, Inc. | 14,939 | 448,359 | |||||||||
Intact Financial Corp. | 2,770 | 360,091 | |||||||||
Manulife Financial Corp. | 15,528 | 295,999 | |||||||||
National Bank of Canada (a) | 5,455 | 415,939 | |||||||||
Power Corp. of Canada | 12,239 | 404,483 | |||||||||
Royal Bank of Canada | 5,074 | 538,571 | |||||||||
Sun Life Financial, Inc. | 7,559 | 420,801 | |||||||||
The Bank of Nova Scotia (a) | 7,209 | 510,410 | |||||||||
The Toronto-Dominion Bank (a) | 6,662 | 510,817 | |||||||||
5,358,062 | |||||||||||
Industrials (1.2%): | |||||||||||
Canadian National Railway Co. | 2,197 | 269,900 | |||||||||
Canadian Pacific Railway Ltd. | 3,386 | 243,563 | |||||||||
Thomson Reuters Corp. | 2,313 | 276,635 | |||||||||
Waste Connections, Inc. | 3,053 | 416,142 | |||||||||
WSP Global, Inc. | 1,664 | 241,588 | |||||||||
1,447,828 | |||||||||||
Information Technology (0.8%): | |||||||||||
CGI, Inc. (c) | 3,548 | 313,760 | |||||||||
Constellation Software, Inc. | 144 | 267,204 | |||||||||
Open Text Corp. | 5,989 | 284,297 | |||||||||
Shopify, Inc., Class A (c) | 75 | 103,279 | |||||||||
968,540 | |||||||||||
Materials (1.0%): | |||||||||||
Aginco Eagle Mines Ltd. (a) | 3,054 | 162,238 | |||||||||
Barrick Gold Corp. | 9,225 | 175,412 | |||||||||
First Quantum Minerals Ltd. | 4,813 | 115,188 | |||||||||
Franco-Nevada Corp. | 1,523 | 210,653 | |||||||||
Nutrien Ltd. | 3,649 | 274,309 | |||||||||
Teck Resources Ltd., Class B | 5,180 | 149,199 | |||||||||
Wheaton Precious Metals Corp. | 3,591 | 154,111 | |||||||||
1,241,110 | |||||||||||
Utilities (1.5%): | |||||||||||
Emera, Inc. | 12,263 | 612,956 | |||||||||
Fortis, Inc. (a) | 12,403 | 598,478 | |||||||||
Hydro One Ltd. (d) | 20,039 | 521,414 | |||||||||
1,732,848 | |||||||||||
15,135,125 | |||||||||||
Denmark (2.4%): | |||||||||||
Consumer Discretionary (0.1%): | |||||||||||
Pandora A/S | 1,345 | 167,919 | |||||||||
Consumer Staples (0.3%): | |||||||||||
Carlsberg A/S, Class B | 1,683 | 291,057 | |||||||||
See notes to financial statements.
45
| Victory Portfolios II VictoryShares International Volatility Wtd ETF | Schedule of Portfolio Investments — continued December 31, 2021 | ||||||
(Unaudited)
Security Description | Shares | Value | |||||||||
Financials (0.4%): | |||||||||||
Danske Bank A/S | 12,152 | $ | 210,156 | ||||||||
Tryg A/S | 11,314 | 279,766 | |||||||||
489,922 | |||||||||||
Health Care (0.7%): | |||||||||||
Coloplast A/S, Class B | 1,309 | 230,686 | |||||||||
Demant A/S (a) (c) | 2,879 | 147,714 | |||||||||
Genmab A/S (c) | 435 | 175,167 | |||||||||
Novo Nordisk A/S, Class B | 2,509 | 282,355 | |||||||||
835,922 | |||||||||||
Industrials (0.4%): | |||||||||||
AP Moller — Maersk A/S, Class B | 56 | 201,066 | |||||||||
DSV A/S | 913 | 213,530 | |||||||||
Vestas Wind Systems A/S (a) | 2,958 | 90,580 | |||||||||
505,176 | |||||||||||
Materials (0.4%): | |||||||||||
Christian Hansen Holding A/S | 2,489 | 196,416 | |||||||||
Novozymes A/S, B Shares | 3,202 | 263,369 | |||||||||
459,785 | |||||||||||
Utilities (0.1%): | |||||||||||
Orsted A/S (d) | 916 | 117,137 | |||||||||
2,866,918 | |||||||||||
Finland (1.6%): | |||||||||||
Consumer Staples (0.2%): | |||||||||||
Kesko Oyj, Class B | 6,096 | 203,609 | |||||||||
Energy (0.1%): | |||||||||||
Neste Oyj | 3,031 | 149,613 | |||||||||
Financials (0.5%): | |||||||||||
Nordea Bank Abp | 23,688 | 289,773 | |||||||||
Sampo Oyj, A Shares | 6,086 | 305,260 | |||||||||
595,033 | |||||||||||
Industrials (0.2%): | |||||||||||
Kone Oyj, Class B | 3,336 | 239,406 | |||||||||
Materials (0.4%): | |||||||||||
Stora Enso Oyj, Class R | 10,703 | 196,654 | |||||||||
UPM-Kymmene Oyj | 6,378 | 242,942 | |||||||||
439,596 | |||||||||||
Utilities (0.2%): | |||||||||||
Fortum Oyj | 8,760 | 269,153 | |||||||||
1,896,410 | |||||||||||
See notes to financial statements.
46
| Victory Portfolios II VictoryShares International Volatility Wtd ETF | Schedule of Portfolio Investments — continued December 31, 2021 | ||||||
(Unaudited)
Security Description | Shares | Value | |||||||||
France (9.0%): | |||||||||||
Communication Services (0.5%): | |||||||||||
Orange SA | 29,145 | $ | 312,310 | ||||||||
Publicis Groupe SA | 3,632 | 244,771 | |||||||||
Vivendi SE | 5,141 | 69,586 | |||||||||
626,667 | |||||||||||
Consumer Discretionary (0.9%): | |||||||||||
Cie Generale des Etablissements Michelin SCA | 1,674 | 274,703 | |||||||||
Hermes International | 195 | 340,972 | |||||||||
Kering SA | 252 | 202,792 | |||||||||
LVMH Moet Hennessy Louis Vuitton SE | 324 | 268,147 | |||||||||
1,086,614 | |||||||||||
Consumer Staples (1.0%): | |||||||||||
Carrefour SA | 9,960 | 182,605 | |||||||||
Danone SA | 3,751 | 233,106 | |||||||||
L'Oreal SA | 702 | 333,207 | |||||||||
Pernod Ricard SA | 1,641 | 395,104 | |||||||||
1,144,022 | |||||||||||
Energy (0.4%): | |||||||||||
Bollore SA | 38,482 | 215,534 | |||||||||
TotalEnergies SE | 5,459 | 277,353 | |||||||||
492,887 | |||||||||||
Financials (1.2%): | |||||||||||
Amundi SA (d) | 2,912 | 240,504 | |||||||||
AXA SA | 9,641 | 287,387 | |||||||||
BNP Paribas SA | 3,170 | 219,301 | |||||||||
CNP Assurances | 11,343 | 280,854 | |||||||||
Credit Agricole SA | 14,827 | 211,831 | |||||||||
Societe Generale SA | 5,412 | 186,093 | |||||||||
1,425,970 | |||||||||||
Health Care (0.6%): | |||||||||||
BioMerieux | 1,658 | 235,744 | |||||||||
Sanofi | 3,284 | 331,155 | |||||||||
Sartorius Stedim Biotech | 319 | 175,182 | |||||||||
742,081 | |||||||||||
Industrials (2.4%): | |||||||||||
Airbus SE (c) | 1,272 | 162,701 | |||||||||
Alstom SA | 4,410 | 156,734 | |||||||||
Bouygues SA | 6,449 | 231,184 | |||||||||
Bureau Veritas SA | 12,434 | 413,037 | |||||||||
Cie de Saint-Gobain | 3,167 | 223,060 | |||||||||
Legrand SA | 2,802 | 328,228 | |||||||||
Safran SA | 1,513 | 185,433 | |||||||||
Schneider Electric SE | 1,569 | 308,038 | |||||||||
Teleperformance | 645 | 287,832 | |||||||||
See notes to financial statements.
47
| Victory Portfolios II VictoryShares International Volatility Wtd ETF | Schedule of Portfolio Investments — continued December 31, 2021 | ||||||
(Unaudited)
Security Description | Shares | Value | |||||||||
Thales SA | 2,799 | $ | 238,340 | ||||||||
Vinci SA | 2,250 | 237,979 | |||||||||
2,772,566 | |||||||||||
Information Technology (0.8%): | |||||||||||
Capgemini SE | 1,272 | 312,052 | |||||||||
Dassault Systemes SE | 4,998 | 297,628 | |||||||||
Edenred | 4,311 | 199,102 | |||||||||
Worldline SA (c) (d) | 2,267 | 126,482 | |||||||||
935,264 | |||||||||||
Materials (0.6%): | |||||||||||
Air Liquide SA | 2,092 | 365,135 | |||||||||
EssilorLuxottica SA | 1,460 | 311,203 | |||||||||
676,338 | |||||||||||
Utilities (0.6%): | |||||||||||
Electricite de France SA | 11,415 | 134,236 | |||||||||
Engie SA | 19,160 | 283,857 | |||||||||
Veolia Environnement SA | 6,889 | 252,996 | |||||||||
671,089 | |||||||||||
10,573,498 | |||||||||||
Germany (6.7%): | |||||||||||
Communication Services (0.2%): | |||||||||||
Deutsche Telekom AG | 14,593 | 270,785 | |||||||||
Consumer Discretionary (1.0%): | |||||||||||
adidas AG | 525 | 151,327 | |||||||||
Bayerische Motoren Werke AG | 2,183 | 219,908 | |||||||||
Continental AG (c) | 1,425 | 151,044 | |||||||||
Daimler AG | 2,396 | 184,358 | |||||||||
HelloFresh SE (c) | 1,150 | 88,420 | |||||||||
Puma SE | 1,930 | 236,189 | |||||||||
Zalando SE (c) (d) | 1,500 | 121,478 | |||||||||
1,152,724 | |||||||||||
Consumer Staples (0.2%): | |||||||||||
Beiersdorf AG | 2,612 | 268,744 | |||||||||
Financials (1.1%): | |||||||||||
Allianz SE, Registered Shares | 1,118 | 264,282 | |||||||||
Deutsche Bank AG, Registered Shares (c) | 13,432 | 168,475 | |||||||||
Deutsche Boerse AG | 1,803 | 301,927 | |||||||||
Hannover Rueck SE | 1,546 | 294,177 | |||||||||
Muenchener Rueckversicherungs-Gesellschaft AG, Class R | 827 | 245,248 | |||||||||
1,274,109 | |||||||||||
Health Care (0.8%): | |||||||||||
Carl Zeiss Meditec AG | 1,167 | 245,574 | |||||||||
Fresenius Medical Care AG & Co. KGaA | 3,212 | 208,934 | |||||||||
Fresenius SE & Co. KGaA | 4,941 | 199,118 | |||||||||
Merck KGaA | 1,039 | 268,494 | |||||||||
922,120 | |||||||||||
See notes to financial statements.
48
| Victory Portfolios II VictoryShares International Volatility Wtd ETF | Schedule of Portfolio Investments — continued December 31, 2021 | ||||||
(Unaudited)
Security Description | Shares | Value | |||||||||
Industrials (1.2%): | |||||||||||
Brenntag SE | 3,128 | $ | 283,376 | ||||||||
Daimler Truck Holding AG (c) | 1,198 | 44,037 | |||||||||
Deutsche Post AG, Registered Shares | 3,401 | 218,905 | |||||||||
KION Group AG | 1,974 | 216,809 | |||||||||
Knorr-Bremse AG | 1,817 | 179,749 | |||||||||
MTU Aero Engines AG | 752 | 153,580 | |||||||||
Rational AG | 132 | 135,301 | |||||||||
Siemens AG, Registered Shares | 1,286 | 223,520 | |||||||||
1,455,277 | |||||||||||
Information Technology (0.4%): | |||||||||||
Infineon Technologies AG | 3,910 | 181,428 | |||||||||
SAP SE | 1,851 | 263,185 | |||||||||
444,613 | |||||||||||
Materials (1.1%): | |||||||||||
BASF SE | 3,435 | 241,584 | |||||||||
Covestro AG (d) | 3,020 | 186,337 | |||||||||
Evonik Industries AG | 9,693 | 314,151 | |||||||||
HeidelbergCement AG | 2,556 | 173,187 | |||||||||
Symrise AG (a) | 2,250 | 333,749 | |||||||||
1,249,008 | |||||||||||
Real Estate (0.2%): | |||||||||||
Vonovia SE | 4,134 | 228,247 | |||||||||
Utilities (0.5%): | |||||||||||
E.ON SE | 23,843 | 330,924 | |||||||||
RWE AG | 5,596 | 227,553 | |||||||||
558,477 | |||||||||||
7,824,104 | |||||||||||
Hong Kong (3.2%): | |||||||||||
Consumer Staples (0.1%): | |||||||||||
WH Group Ltd. (d) | 172,482 | 108,170 | |||||||||
Financials (0.5%): | |||||||||||
AIA Group Ltd. | 14,208 | 143,222 | |||||||||
Hang Seng Bank Ltd. | 17,172 | 314,268 | |||||||||
Hong Kong Exchanges and Clearing Ltd. | 2,358 | 137,719 | |||||||||
595,209 | |||||||||||
Health Care (0.1%): | |||||||||||
Sino Biopharmaceutical Ltd. | 173,204 | 121,285 | |||||||||
Industrials (0.5%): | |||||||||||
CK Hutchison Holdings Ltd. | 32,566 | 210,082 | |||||||||
Jardine Matheson Holdings Ltd. | 3,500 | 192,535 | |||||||||
SITC International Holdings Co. Ltd. | 24,000 | 86,799 | |||||||||
Techtronic Industries Co. Ltd. | 5,454 | 108,558 | |||||||||
Xinyi Glass Holdings Ltd. | 24,000 | 60,021 | |||||||||
657,995 | |||||||||||
See notes to financial statements.
49
| Victory Portfolios II VictoryShares International Volatility Wtd ETF | Schedule of Portfolio Investments — continued December 31, 2021 | ||||||
(Unaudited)
Security Description | Shares | Value | |||||||||
Real Estate (0.8%): | |||||||||||
CK Asset Holdings Ltd. | 35,035 | $ | 220,842 | ||||||||
Henderson Land Development Co. Ltd. | 61,158 | 260,404 | |||||||||
New World Development Co. Ltd. | 54,368 | 215,107 | |||||||||
Sun Hung Kai Properties Ltd. | 19,066 | 231,316 | |||||||||
927,669 | |||||||||||
Utilities (1.2%): | |||||||||||
CK Infrastructure Holdings Ltd. | 46,154 | 293,890 | |||||||||
CLP Holdings Ltd. | 43,638 | 440,729 | |||||||||
Hong Kong and China Gas Co. Ltd. | 203,239 | 316,433 | |||||||||
Power Assets Holdings Ltd. (b) | 54,882 | 342,075 | |||||||||
1,393,127 | |||||||||||
3,803,455 | |||||||||||
Ireland (0.9%): | |||||||||||
Consumer Staples (0.2%): | |||||||||||
Kerry Group PLC | 1,904 | 245,470 | |||||||||
Industrials (0.3%): | |||||||||||
Experian PLC | 5,353 | 263,112 | |||||||||
Kingspan Group PLC | 1,280 | 153,000 | |||||||||
416,112 | |||||||||||
Materials (0.4%): | |||||||||||
CRH PLC | 4,046 | 214,268 | |||||||||
Smurfit Kappa Group PLC | 4,052 | 223,443 | |||||||||
437,711 | |||||||||||
1,099,293 | |||||||||||
Israel (0.5%): | |||||||||||
Financials (0.3%): | |||||||||||
Bank Leumi Le-Israel BM | 34,975 | 376,651 | |||||||||
Information Technology (0.2%): | |||||||||||
Nice Ltd. (c) | 696 | 213,252 | |||||||||
589,903 | |||||||||||
Italy (2.7%): | |||||||||||
Consumer Discretionary (0.2%): | |||||||||||
Moncler SpA | 3,331 | 242,763 | |||||||||
Financials (0.9%): | |||||||||||
Assicurazioni Generali SpA | 15,682 | 332,588 | |||||||||
Intesa Sanpaolo SpA | 95,114 | 246,223 | |||||||||
Poste Italiane SpA (d) | 18,952 | 248,974 | |||||||||
UniCredit SpA | 14,337 | 221,054 | |||||||||
1,048,839 | |||||||||||
See notes to financial statements.
50
| Victory Portfolios II VictoryShares International Volatility Wtd ETF | Schedule of Portfolio Investments — continued December 31, 2021 | ||||||
(Unaudited)
Security Description | Shares | Value | |||||||||
Health Care (0.5%): | |||||||||||
Amplifon SpA (a) | 3,550 | $ | 191,760 | ||||||||
DiaSorin SpA | 801 | 152,690 | |||||||||
Recordati Industria Chimica e Farmaceutica SpA | 4,151 | 266,989 | |||||||||
611,439 | |||||||||||
Industrials (0.2%): | |||||||||||
Atlantia SpA (c) | 11,050 | 219,571 | |||||||||
Information Technology (0.1%): | |||||||||||
Nexi SpA (a) (c) (d) | 9,709 | 154,627 | |||||||||
Utilities (0.8%): | |||||||||||
Enel SpA | 27,368 | 219,522 | |||||||||
Snam SpA | 59,821 | 360,929 | |||||||||
Terna — Rete Elettrica Nazionale | 39,201 | 317,471 | |||||||||
897,922 | |||||||||||
3,175,161 | |||||||||||
Japan (17.7%): | |||||||||||
Communication Services (1.3%): | |||||||||||
KDDI Corp. | 9,100 | 266,013 | |||||||||
Nexon Co. Ltd. | 8,000 | 154,700 | |||||||||
Nintendo Co. Ltd. (b) | 400 | 186,592 | |||||||||
Nippon Telegraph & Telephone Corp. | 11,100 | 304,017 | |||||||||
Softbank Corp. | 29,600 | 374,343 | |||||||||
SoftBank Group Corp. | 2,800 | 132,295 | |||||||||
Z Holdings Corp. | 23,800 | 138,111 | |||||||||
1,556,071 | |||||||||||
Consumer Discretionary (2.6%): | |||||||||||
Bandai Namco Holdings, Inc. | 2,700 | 211,145 | |||||||||
Bridgestone Corp. | 4,500 | 193,640 | |||||||||
Denso Corp. | 2,400 | 198,849 | |||||||||
Fast Retailing Co. Ltd. | 300 | 170,359 | |||||||||
Honda Motor Co. Ltd. | 6,500 | 182,549 | |||||||||
Nitori Holdings Co. Ltd. | 1,200 | 179,723 | |||||||||
Pan Pacific International Holdings Corp. | 10,400 | 143,507 | |||||||||
Panasonic Corp. | 15,700 | 172,685 | |||||||||
Sekisui House Ltd. | 12,200 | 261,906 | |||||||||
Shimano, Inc. | 700 | 186,610 | |||||||||
Sony Group Corp. | 1,600 | 201,374 | |||||||||
Subaru Corp. | 10,900 | 194,951 | |||||||||
Suzuki Motor Corp. | 3,900 | 150,188 | |||||||||
Toyota Industries Corp. | 2,400 | 191,775 | |||||||||
Toyota Motor Corp. | 13,500 | 247,146 | |||||||||
ZOZO, Inc. | 3,600 | 112,373 | |||||||||
2,998,780 | |||||||||||
See notes to financial statements.
51
| Victory Portfolios II VictoryShares International Volatility Wtd ETF | Schedule of Portfolio Investments — continued December 31, 2021 | ||||||
(Unaudited)
Security Description | Shares | Value | |||||||||
Consumer Staples (1.5%): | |||||||||||
Asahi Group Holdings Ltd. | 4,600 | $ | 178,944 | ||||||||
Japan Tobacco, Inc. | 15,600 | 315,025 | |||||||||
Kao Corp. | 4,500 | 235,506 | |||||||||
Kikkoman Corp. | 2,300 | 193,383 | |||||||||
Kirin Holdings Co. Ltd. | 15,900 | 255,346 | |||||||||
Seven & i Holdings Co. Ltd. | 4,500 | 197,826 | |||||||||
Suntory Beverage & Food Ltd. | 5,200 | 188,088 | |||||||||
Unicharm Corp. | 4,800 | 208,636 | |||||||||
1,772,754 | |||||||||||
Energy (0.4%): | |||||||||||
Ajinomoto Co., Inc. | 7,600 | 231,086 | |||||||||
ENEOS Holdings, Inc. | 57,700 | 215,879 | |||||||||
446,965 | |||||||||||
Financials (2.5%): | |||||||||||
Dai-ichi Life Holdings, Inc. | 9,000 | 181,980 | |||||||||
Japan Exchange Group, Inc. | 7,400 | 162,014 | |||||||||
Japan Post Bank Co. Ltd. | 28,300 | 259,599 | |||||||||
Japan Post Holdings Co. Ltd. | 28,000 | 218,332 | |||||||||
Mitsubishi UFJ Financial Group, Inc. | 42,200 | 229,291 | |||||||||
Mizuho Financial Group, Inc. | 19,070 | 242,582 | |||||||||
MS&AD Insurance Group Holdings, Inc. | 8,400 | 259,209 | |||||||||
Nomura Holdings, Inc. | 36,700 | 160,094 | |||||||||
ORIX Corp. | 10,400 | 212,277 | |||||||||
Sompo Holdings, Inc. | 6,100 | 257,716 | |||||||||
Sumitomo Mitsui Financial Group, Inc. | 6,900 | 236,559 | |||||||||
Sumitomo Mitsui Trust Holdings, Inc. | 7,300 | 243,926 | |||||||||
Tokio Marine Holdings, Inc. | 5,100 | 283,447 | |||||||||
2,947,026 | |||||||||||
Health Care (2.2%): | |||||||||||
Astellas Pharma, Inc. | 12,800 | 208,177 | |||||||||
Chugai Pharmaceutical Co. Ltd. | 5,000 | 162,377 | |||||||||
Daiichi Sankyo Co. Ltd. | 7,400 | 188,201 | |||||||||
Eisai Co. Ltd. | 1,500 | 85,179 | |||||||||
Hoya Corp. | 1,200 | 178,524 | |||||||||
Kyowa Kirin Co. Ltd. | 5,900 | 160,825 | |||||||||
M3, Inc. | 2,200 | 110,813 | |||||||||
Olympus Corp. | 7,800 | 179,690 | |||||||||
Ono Pharmaceutical Co. Ltd. | 9,400 | 233,427 | |||||||||
Otsuka Holdings Co. Ltd. | 5,600 | 202,994 | |||||||||
Shionogi & Co. Ltd. | 3,400 | 240,196 | |||||||||
Sysmex Corp. | 1,400 | 189,288 | |||||||||
Takeda Pharmaceutical Co. Ltd. | 8,500 | 231,845 | |||||||||
Terumo Corp. | 5,000 | 211,286 | |||||||||
2,582,822 | |||||||||||
See notes to financial statements.
52
| Victory Portfolios II VictoryShares International Volatility Wtd ETF | Schedule of Portfolio Investments — continued December 31, 2021 | ||||||
(Unaudited)
Security Description | Shares | Value | |||||||||
Industrials (3.1%): | |||||||||||
Daikin Industries Ltd. | 700 | $ | 158,795 | ||||||||
FANUC Corp. | 800 | 169,585 | |||||||||
Hitachi Ltd. | 3,300 | 178,758 | |||||||||
ITOCHU Corp. | 8,900 | 272,239 | |||||||||
Komatsu Ltd. | 8,000 | 187,358 | |||||||||
Kubota Corp. | 9,000 | 199,822 | |||||||||
Makita Corp. | 3,400 | 144,354 | |||||||||
Marubeni Corp. | 21,900 | 213,173 | |||||||||
Mitsubishi Corp. | 8,400 | 266,732 | |||||||||
Mitsubishi Electric Corp. | 16,000 | 202,904 | |||||||||
Mitsui & Co. Ltd. | 8,700 | 206,021 | |||||||||
Nidec Corp. | 1,600 | 188,088 | |||||||||
Nippon Yusen KK | 1,400 | 106,634 | |||||||||
Recruit Holdings Co. Ltd. | 2,700 | 163,676 | |||||||||
Secom Co. Ltd. | 3,500 | 243,031 | |||||||||
SG Holdings Co. Ltd. | 6,800 | 159,224 | |||||||||
SMC Corp. | 300 | 202,391 | |||||||||
Toshiba Corp. | 3,000 | 123,381 | |||||||||
Toyota Tsusho Corp. | 3,600 | 165,899 | |||||||||
Yaskawa Electric Corp. | 3,500 | 171,637 | |||||||||
3,723,702 | |||||||||||
Information Technology (2.8%): | |||||||||||
Advantest Corp. | 1,700 | 161,116 | |||||||||
Canon, Inc. (a) | 7,600 | 185,093 | |||||||||
FUJIFILM Holdings Corp. | 2,600 | 192,745 | |||||||||
Fujitsu Ltd. | 1,000 | 171,550 | |||||||||
Keyence Corp. | 300 | 188,540 | |||||||||
Kyocera Corp. | 3,700 | 231,214 | |||||||||
Lasertec Corp. | 500 | 153,421 | |||||||||
Murata Manufacturing Co. Ltd. | 2,400 | 191,086 | |||||||||
NEC Corp. | 3,100 | 143,127 | |||||||||
Nomura Research Institute Ltd. | 4,778 | 205,021 | |||||||||
NTT Data Corp. | 10,900 | 233,714 | |||||||||
Obic Co. Ltd. | 1,000 | 187,810 | |||||||||
Omron Corp. | 2,200 | 219,216 | |||||||||
Renesas Electronics Corp. (c) | 12,300 | 152,186 | |||||||||
Shimadzu Corp. | 4,500 | 189,962 | |||||||||
TDK Corp. | 5,400 | 210,816 | |||||||||
Tokyo Electron Ltd. | 400 | 230,519 | |||||||||
3,247,136 | |||||||||||
Materials (0.7%): | |||||||||||
Asahi Kasei Corp. | 19,600 | 184,224 | |||||||||
Mitsubishi Chemical Holdings Corp. | 22,700 | 168,163 | |||||||||
Nippon Paint Holdings Co. Ltd. | 10,400 | 113,395 | |||||||||
Nippon Steel Corp. | 6,200 | 101,267 | |||||||||
Shin-Etsu Chemical Co. Ltd. | 1,300 | 225,163 | |||||||||
792,212 | |||||||||||
See notes to financial statements.
53
| Victory Portfolios II VictoryShares International Volatility Wtd ETF | Schedule of Portfolio Investments — continued December 31, 2021 | ||||||
(Unaudited)
Security Description | Shares | Value | |||||||||
Real Estate (0.6%): | |||||||||||
Daiwa House Industry Co. Ltd. | 7,200 | $ | 207,092 | ||||||||
Mitsubishi Estate Co. Ltd. | 15,600 | 216,279 | |||||||||
Mitsui Fudosan Co. Ltd. | 8,600 | 170,377 | |||||||||
Sumitomo Realty & Development Co. Ltd. | 5,400 | 158,840 | |||||||||
752,588 | |||||||||||
20,820,056 | |||||||||||
Korea, Republic Of (3.2%): | |||||||||||
Communication Services (0.4%): | |||||||||||
Kakao Corp. | 1,152 | 109,036 | |||||||||
NAVER Corp. | 445 | 141,707 | |||||||||
NCSoft Corp. | 247 | 133,620 | |||||||||
SK Telecom Co. Ltd. | 2,162 | 105,317 | |||||||||
489,680 | |||||||||||
Consumer Discretionary (0.4%): | |||||||||||
Hyundai Mobis Co. Ltd. | 539 | 115,410 | |||||||||
Hyundai Motor Co. | 760 | 133,636 | |||||||||
Kia Corp. | 1,669 | 115,423 | |||||||||
LG Electronics, Inc. | 757 | 87,890 | |||||||||
452,359 | |||||||||||
Consumer Staples (0.2%): | |||||||||||
Amorepacific Corp. | 882 | 123,922 | |||||||||
LG Household & Health Care Ltd. | 168 | 155,053 | |||||||||
278,975 | |||||||||||
Financials (0.5%): | |||||||||||
KB Financial Group, Inc. | 3,910 | 180,927 | |||||||||
Samsung Life Insurance Co. Ltd. | 3,095 | 166,910 | |||||||||
Shinhan Financial Group Co. Ltd. | 6,463 | 200,100 | |||||||||
547,937 | |||||||||||
Health Care (0.3%): | |||||||||||
Celltrion Healthcare Co. Ltd. | 1,148 | 77,427 | |||||||||
Celltrion, Inc. | 507 | 84,447 | |||||||||
Samsung Biologics Co. Ltd. (c) (d) | 206 | 156,502 | |||||||||
318,376 | |||||||||||
Industrials (0.4%): | |||||||||||
HMM Co. Ltd. (c) | 2,362 | 53,456 | |||||||||
LG Corp. | 1,551 | 105,566 | |||||||||
Samsung C&T Corp. | 1,526 | 152,780 | |||||||||
SK, Inc. | 615 | 129,871 | |||||||||
441,673 | |||||||||||
Information Technology (0.7%): | |||||||||||
Samsung Electro-Mechanics Co. Ltd. | 1,054 | 175,135 | |||||||||
Samsung Electronics Co. Ltd. | 3,627 | 238,932 | |||||||||
Samsung SDI Co. Ltd. | 222 | 122,337 | |||||||||
See notes to financial statements.
54
| Victory Portfolios II VictoryShares International Volatility Wtd ETF | Schedule of Portfolio Investments — continued December 31, 2021 | ||||||
(Unaudited)
Security Description | Shares | Value | |||||||||
SK Hynix, Inc. | 1,617 | $ | 178,215 | ||||||||
SK Square Co. Ltd. (c) | 1,397 | 78,042 | |||||||||
792,661 | |||||||||||
Materials (0.2%): | |||||||||||
LG Chem Ltd. | 204 | 105,553 | |||||||||
POSCO | 527 | 121,707 | |||||||||
227,260 | |||||||||||
Utilities (0.1%): | |||||||||||
Korea Electric Power Corp. | 8,745 | 162,598 | |||||||||
3,711,519 | |||||||||||
Luxembourg (0.6%): | |||||||||||
Energy (0.1%): | |||||||||||
Tenaris SA | 15,059 | 157,888 | |||||||||
Health Care (0.2%): | |||||||||||
Eurofins Scientific SE | 1,543 | 191,112 | |||||||||
Materials (0.1%): | |||||||||||
ArcelorMittal SA | 4,209 | 134,857 | |||||||||
Real Estate (0.2%): | |||||||||||
Aroundtown SA (a) | 29,603 | 179,283 | |||||||||
663,140 | |||||||||||
Netherlands (4.0%): | |||||||||||
Communication Services (0.3%): | |||||||||||
Koninklijke KPN NV | 77,678 | 241,409 | |||||||||
Universal Music Group NV | 5,141 | 145,025 | |||||||||
386,434 | |||||||||||
Consumer Discretionary (0.1%): | |||||||||||
Prosus NV | 1,645 | 137,697 | |||||||||
Consumer Staples (1.0%): | |||||||||||
Davide Campari-Milano NV | 21,794 | 318,935 | |||||||||
Heineken Holding NV | 3,050 | 281,761 | |||||||||
Heineken NV | 2,489 | 280,116 | |||||||||
Koninklijke Ahold Delhaize NV | 9,447 | 324,084 | |||||||||
1,204,896 | |||||||||||
Financials (0.8%): | |||||||||||
ABN AMRO Bank NV (d) | 11,732 | 172,501 | |||||||||
Euronext NV (d) | 2,193 | 227,806 | |||||||||
ING Groep NV | 13,153 | 183,303 | |||||||||
NN Group NV | 5,451 | 295,439 | |||||||||
879,049 | |||||||||||
Health Care (0.2%): | |||||||||||
Koninklijke Philips NV | 5,730 | 213,726 | |||||||||
See notes to financial statements.
55
| Victory Portfolios II VictoryShares International Volatility Wtd ETF | Schedule of Portfolio Investments — continued December 31, 2021 | ||||||
(Unaudited)
Security Description | Shares | Value | |||||||||
Industrials (0.5%): | |||||||||||
Randstad NV | 3,520 | $ | 240,589 | ||||||||
Wolters Kluwer NV | 2,985 | 352,044 | |||||||||
592,633 | |||||||||||
Information Technology (0.6%): | |||||||||||
Adyen NV (c) (d) | 47 | 123,676 | |||||||||
ASM International NV | 407 | 180,095 | |||||||||
| ASML Holding NV | 222 | 178,600 | |||||||||
STMicroelectronics NV | 4,378 | 216,151 | |||||||||
698,522 | |||||||||||
Materials (0.5%): | |||||||||||
Akzo Nobel NV | 2,389 | 262,444 | |||||||||
Koninklijke DSM NV | 1,561 | 351,852 | |||||||||
614,296 | |||||||||||
4,727,253 | |||||||||||
New Zealand (0.3%): | |||||||||||
Health Care (0.2%): | |||||||||||
Fisher & Paykel Healthcare Corp. Ltd. | 7,259 | 162,825 | |||||||||
Information Technology (0.1%): | |||||||||||
Xero Ltd. (c) | 1,417 | 145,786 | |||||||||
308,611 | |||||||||||
Norway (1.4%): | |||||||||||
Communication Services (0.3%): | |||||||||||
Telenor ASA | 21,135 | 332,767 | |||||||||
Consumer Staples (0.2%): | |||||||||||
Mowi ASA | 9,429 | 223,544 | |||||||||
Financials (0.5%): | |||||||||||
DNB Bank ASA | 12,303 | 282,317 | |||||||||
Gjensidige Forsikring ASA | 12,992 | 315,837 | |||||||||
598,154 | |||||||||||
Materials (0.4%): | |||||||||||
Norsk Hydro ASA | 22,953 | 181,269 | |||||||||
Yara International ASA | 5,235 | 264,637 | |||||||||
445,906 | |||||||||||
1,600,371 | |||||||||||
Portugal (0.4%): | |||||||||||
Consumer Staples (0.2%): | |||||||||||
Jeronimo Martins SGPS SA | 12,126 | 277,464 | |||||||||
Utilities (0.2%): | |||||||||||
EDP — Energias de Portugal SA (a) | 39,480 | 217,168 | |||||||||
494,632 | |||||||||||
See notes to financial statements.
56
| Victory Portfolios II VictoryShares International Volatility Wtd ETF | Schedule of Portfolio Investments — continued December 31, 2021 | ||||||
(Unaudited)
Security Description | Shares | Value | |||||||||
Singapore (1.4%): | |||||||||||
Communication Services (0.3%): | |||||||||||
Singapore Telecommunications Ltd. | 178,700 | $ | 307,715 | ||||||||
Consumer Staples (0.2%): | |||||||||||
Wilmar International Ltd. | 89,800 | 275,939 | |||||||||
Financials (0.9%): | |||||||||||
DBS Group Holdings Ltd. | 13,500 | 327,254 | |||||||||
Oversea-Chinese Banking Corp. Ltd. | 38,700 | 327,455 | |||||||||
United Overseas Bank Ltd. | 19,800 | 395,324 | |||||||||
1,050,033 | |||||||||||
1,633,687 | |||||||||||
Spain (1.5%): | |||||||||||
Communication Services (0.2%): | |||||||||||
Telefonica SA | 40,956 | 179,596 | |||||||||
Consumer Discretionary (0.2%): | |||||||||||
Industria de Diseno Textil SA | 6,732 | 218,645 | |||||||||
Energy (0.2%): | |||||||||||
Repsol SA | 15,687 | 186,366 | |||||||||
Financials (0.4%): | |||||||||||
Banco Bilbao Vizcaya Argentaria SA | 26,344 | 157,447 | |||||||||
Banco Santander SA | 48,195 | 161,330 | |||||||||
CaixaBank SA | 60,825 | 167,152 | |||||||||
485,929 | |||||||||||
Health Care (0.1%): | |||||||||||
Grifols SA | 8,637 | 165,920 | |||||||||
Utilities (0.4%): | |||||||||||
Endesa SA | 10,472 | 240,810 | |||||||||
Iberdrola SA | 22,550 | 267,233 | |||||||||
508,043 | |||||||||||
1,744,499 | |||||||||||
Sweden (5.0%): | |||||||||||
Consumer Discretionary (0.3%): | |||||||||||
Evolution AB (d) | 720 | 102,520 | |||||||||
Hennes & Mauritz AB, Class B | 10,833 | 213,566 | |||||||||
316,086 | |||||||||||
Consumer Staples (0.5%): | |||||||||||
Essity AB, Class B | 9,886 | 323,295 | |||||||||
Swedish Match AB | 28,973 | 231,001 | |||||||||
554,296 | |||||||||||
Financials (1.5%): | |||||||||||
EQT AB | 2,691 | 146,868 | |||||||||
Industrivarden AB, Class C | 7,971 | 250,699 | |||||||||
Investor AB, Class B | 12,643 | 318,769 | |||||||||
See notes to financial statements.
57
| Victory Portfolios II VictoryShares International Volatility Wtd ETF | Schedule of Portfolio Investments — continued December 31, 2021 | ||||||
(Unaudited)
Security Description | Shares | Value | |||||||||
L E Lundbergforetagen AB, Class B | 4,458 | $ | 250,710 | ||||||||
Skandinaviska Enskilda Banken AB, Class A | 19,766 | 275,385 | |||||||||
Svenska Handelsbanken AB, Class A | 24,777 | 268,424 | |||||||||
Swedbank AB, Class A | 13,133 | 264,754 | |||||||||
1,775,609 | |||||||||||
Industrials (1.9%): | |||||||||||
Alfa Laval AB | 5,850 | 235,995 | |||||||||
Assa Abloy AB, Class B | 8,041 | 245,868 | |||||||||
Atlas Copco AB, Class A | 3,601 | 249,475 | |||||||||
Epiroc AB, Class A | 10,282 | 260,891 | |||||||||
Indutrade AB | 7,011 | 215,150 | |||||||||
Lifco AB, Class B | 7,371 | 220,893 | |||||||||
Nibe Industrier AB, Class B | 13,037 | 197,366 | |||||||||
Sandvik AB | 7,973 | 222,958 | |||||||||
Skanska AB, Class B | 8,279 | 214,651 | |||||||||
Volvo AB, Class B | 9,338 | 216,729 | |||||||||
2,279,976 | |||||||||||
Information Technology (0.4%): | |||||||||||
Hexagon AB, Class B | 14,923 | 237,318 | |||||||||
Sinch AB (c) (d) | 4,811 | 61,303 | |||||||||
Telefonaktiebolaget LM Ericsson, Class B | 18,540 | 204,816 | |||||||||
503,437 | |||||||||||
Materials (0.2%): | |||||||||||
Svenska Cellulosa AB SCA, Class B | 13,732 | 244,373 | |||||||||
Real Estate (0.2%): | |||||||||||
Fastighets AB Balder, Class B (c) | 3,297 | 237,904 | |||||||||
5,911,681 | |||||||||||
Switzerland (8.1%): | |||||||||||
Communication Services (0.3%): | |||||||||||
Swisscom AG, Registered Shares | 623 | 351,955 | |||||||||
Consumer Discretionary (0.4%): | |||||||||||
Cie Financiere Richemont SA, Registered Shares | 1,923 | 289,115 | |||||||||
The Swatch Group AG | 815 | 249,627 | |||||||||
538,742 | |||||||||||
Consumer Staples (1.3%): | |||||||||||
Barry Callebaut AG, Registered Shares | 147 | 357,616 | |||||||||
Chocoladefabriken Lindt & Spruengli AG | 27 | 374,366 | |||||||||
Coca-Cola HBC AG | 7,901 | 273,193 | |||||||||
Nestle SA, Registered Shares | 3,440 | 481,275 | |||||||||
1,486,450 | |||||||||||
Financials (1.6%): | |||||||||||
Credit Suisse Group AG, Registered Shares | 17,653 | 171,937 | |||||||||
Julius Baer Group Ltd. | 3,482 | 233,866 | |||||||||
Partners Group Holding AG | 154 | 255,709 | |||||||||
Swiss Life Holding AG | 558 | 342,433 | |||||||||
See notes to financial statements.
58
| Victory Portfolios II VictoryShares International Volatility Wtd ETF | Schedule of Portfolio Investments — continued December 31, 2021 | ||||||
(Unaudited)
Security Description | Shares | Value | |||||||||
Swiss Re AG | 2,952 | $ | 292,510 | ||||||||
UBS Group AG | 14,721 | 265,362 | |||||||||
Zurich Insurance Group AG | 732 | 321,762 | |||||||||
1,883,579 | |||||||||||
Health Care (1.4%): | |||||||||||
Alcon, Inc. | 2,692 | 238,612 | |||||||||
Lonza Group AG, Registered Shares | 309 | 258,354 | |||||||||
Novartis AG, Registered Shares | 3,975 | 350,327 | |||||||||
Roche Holding AG | 801 | 333,362 | |||||||||
Sonova Holding AG | 519 | 203,862 | |||||||||
Straumann Holding AG, Class R | 113 | 240,291 | |||||||||
1,624,808 | |||||||||||
Industrials (1.6%): | |||||||||||
ABB Ltd., Registered Shares | 7,610 | 291,568 | |||||||||
Geberit AG, Registered Shares | 411 | 336,236 | |||||||||
Kuehne + Nagel International AG, Class R | 679 | 219,450 | |||||||||
Schindler Holding AG | 928 | 250,109 | |||||||||
SGS SA, Registered Shares | 146 | 488,376 | |||||||||
VAT Group AG (d) | 505 | 251,918 | |||||||||
1,837,657 | |||||||||||
Information Technology (0.2%): | |||||||||||
Logitech International SA, Class R | 1,648 | 139,091 | |||||||||
Temenos AG | 1,002 | 138,657 | |||||||||
277,748 | |||||||||||
Materials (1.3%): | |||||||||||
EMS-Chemie Holding AG | 299 | 335,140 | |||||||||
Givaudan SA, Registered Shares | 72 | 378,773 | |||||||||
Glencore PLC | 34,394 | 174,523 | |||||||||
Holcim Ltd. | 4,910 | 250,701 | |||||||||
Sika AG, Registered Shares | 837 | 349,355 | |||||||||
1,488,492 | |||||||||||
9,489,431 | |||||||||||
United Kingdom (9.4%): | |||||||||||
Communication Services (0.2%): | |||||||||||
BT Group PLC | 75,197 | 172,542 | |||||||||
Consumer Discretionary (0.6%): | |||||||||||
Entain PLC (c) | 4,970 | 113,198 | |||||||||
JD Sports Fashion PLC (c) | 59,360 | 174,964 | |||||||||
Next PLC | 1,824 | 201,177 | |||||||||
Persimmon PLC | 4,655 | 179,918 | |||||||||
669,257 | |||||||||||
Consumer Staples (1.4%): | |||||||||||
Associated British Foods PLC | 7,931 | 215,520 | |||||||||
British American Tobacco PLC | 6,741 | 249,368 | |||||||||
Diageo PLC | 6,251 | 341,427 | |||||||||
See notes to financial statements.
59
| Victory Portfolios II VictoryShares International Volatility Wtd ETF | Schedule of Portfolio Investments — continued December 31, 2021 | ||||||
(Unaudited)
Security Description | Shares | Value | |||||||||
Imperial Brands PLC | 11,121 | $ | 243,285 | ||||||||
Tesco PLC | 83,653 | 328,191 | |||||||||
Unilever PLC | 5,236 | 279,575 | |||||||||
1,657,366 | |||||||||||
Energy (0.3%): | |||||||||||
| BP PLC | 40,712 | 182,092 | |||||||||
Royal Dutch Shell PLC, Class A | 9,688 | 212,632 | |||||||||
394,724 | |||||||||||
Financials (2.2%): | |||||||||||
| 3i Group PLC | 13,045 | 255,805 | |||||||||
Admiral Group PLC | 5,636 | 240,792 | |||||||||
Aviva PLC | 45,011 | 249,990 | |||||||||
Barclays PLC | 67,015 | 169,594 | |||||||||
HSBC Holdings PLC | 40,790 | 247,661 | |||||||||
Legal & General Group PLC | 53,047 | 213,572 | |||||||||
Lloyds Banking Group PLC | 304,337 | 196,870 | |||||||||
London Stock Exchange Group PLC | 1,667 | 156,339 | |||||||||
NatWest Group PLC | 61,160 | 186,808 | |||||||||
Schroders PLC | 5,384 | 259,389 | |||||||||
St James's Place PLC | 10,989 | 250,362 | |||||||||
Standard Chartered PLC | 32,110 | 194,851 | |||||||||
2,622,033 | |||||||||||
Health Care (0.7%): | |||||||||||
AstraZeneca PLC | 2,244 | 263,535 | |||||||||
GlaxoSmithKline PLC (b) | 15,314 | 332,961 | |||||||||
Smith & Nephew PLC | 11,266 | 197,212 | |||||||||
793,708 | |||||||||||
Industrials (2.0%): | |||||||||||
Ashtead Group PLC | 3,224 | 259,254 | |||||||||
BAE Systems PLC | 37,021 | 275,454 | |||||||||
Bunzl PLC | 7,504 | 292,978 | |||||||||
Ferguson PLC | 2,014 | 357,185 | |||||||||
Intertek Group PLC | 3,285 | 250,288 | |||||||||
RELX PLC | 10,092 | 328,055 | |||||||||
Rentokil Initial PLC | 31,784 | 251,199 | |||||||||
Rolls-Royce Holdings PLC (c) | 77,479 | 128,844 | |||||||||
Spirax-Sarco Engineering PLC | 1,204 | 261,516 | |||||||||
2,404,773 | |||||||||||
Information Technology (0.4%): | |||||||||||
AVEVA Group PLC | 3,464 | 159,575 | |||||||||
Halma PLC | 6,682 | 289,370 | |||||||||
448,945 | |||||||||||
Materials (1.1%): | |||||||||||
Anglo American PLC | 3,173 | 129,508 | |||||||||
Antofagasta PLC | 7,936 | 143,753 | |||||||||
BHP Group PLC | 5,845 | 173,982 | |||||||||
See notes to financial statements.
60
| Victory Portfolios II VictoryShares International Volatility Wtd ETF | Schedule of Portfolio Investments — continued December 31, 2021 | ||||||
(Unaudited)
Security Description | Shares | Value | |||||||||
Croda International PLC | 2,413 | $ | 330,472 | ||||||||
Evraz PLC (b) | 19,937 | 162,317 | |||||||||
Mondi PLC | 8,543 | 211,110 | |||||||||
Rio Tinto PLC | 2,286 | 151,342 | |||||||||
1,302,484 | |||||||||||
Utilities (0.5%): | |||||||||||
National Grid PLC | 25,202 | 361,456 | |||||||||
SSE PLC | 10,176 | 227,088 | |||||||||
588,544 | |||||||||||
11,054,376 | |||||||||||
Total Common Stocks (Cost $94,836,435) | 117,040,221 | ||||||||||
Collateral for Securities Loaned^ (3.4%) | |||||||||||
United States (3.4%): | |||||||||||
BlackRock Liquidity Funds TempFund, Institutional Class, 0.04% (e) | 93,591 | 93,591 | |||||||||
| Fidelity Investments Money Market Government Portfolio, Institutional Shares, 0.01% (e) | 1,838,143 | 1,838,143 | |||||||||
| Goldman Sachs Financial Square Prime Obligations Fund, Institutional Shares, 0.02% (e) | 46,707 | 46,707 | |||||||||
JPMorgan Prime Money Market Fund, Capital Shares, 0.07% (e) | 372,424 | 372,424 | |||||||||
| Morgan Stanley Institutional Liquidity Prime Portfolio, Institutional Shares, 0.06% (e) | 1,674,491 | 1,674,491 | |||||||||
Total Collateral for Securities Loaned (Cost $4,025,356) | 4,025,356 | ||||||||||
Total Investments (Cost $98,861,791) — 103.0% | 121,065,577 | ||||||||||
Liabilities in excess of other assets — (3.0)% | (3,536,178 | ) | |||||||||
NET ASSETS — 100.00% | $ | 117,529,399 | |||||||||
^ Purchased with cash collateral from securities on loan.
(a) All or a portion of this security is on loan.
(b) All or a portion of this security has been segregated as collateral for derivative instruments.
(c) Non-income producing security.
(d) Rule 144A security or other security that is restricted as to resale to institutional investors. The Fund's Adviser has deemed this security to be liquid (unless otherwise noted as illiquid) based upon procedures approved by the Board of Trustees. As of December 31, 2021, the fair value of these securities was $2,921,349 and amounted to 2.5% of net assets.
(e) Rate disclosed is the daily yield on December 31, 2021.
PLC — Public Limited Company
See notes to financial statements.
61
| Victory Portfolios II VictoryShares International Volatility Wtd ETF | Schedule of Portfolio Investments — continued December 31, 2021 | ||||||
(Unaudited)
Futures Contracts Purchased
| Number of Contracts | Expiration Date | Notional Amount | Value | Unrealized Appreciation (Depreciation) | |||||||||||||||||||
E-Mini MSCI EAFE Index Futures | 2 | 3/18/22 | $ | 228,373 | $ | 232,180 | $ | 3,807 | |||||||||||||||
Total unrealized appreciation | $ | 3,807 | |||||||||||||||||||||
Total unrealized depreciation | — | ||||||||||||||||||||||
Total net unrealized appreciation (depreciation) | $ | 3,807 | |||||||||||||||||||||
See notes to financial statements.
62
| Victory Portfolios II VictoryShares US Large Cap High Div Volatility Wtd ETF | Schedule of Portfolio Investments December 31, 2021 | ||||||
(Unaudited)
Security Description | Shares | Value | |||||||||
Common Stocks (99.5%) | |||||||||||
Communication Services (3.0%): | |||||||||||
Omnicom Group, Inc. | 28,041 | $ | 2,054,564 | ||||||||
The Interpublic Group of Cos., Inc. | 47,544 | 1,780,523 | |||||||||
Verizon Communications, Inc. | 67,757 | 3,520,654 | |||||||||
7,355,741 | |||||||||||
Consumer Discretionary (4.2%): | |||||||||||
Genuine Parts Co. | 18,887 | 2,647,957 | |||||||||
Hasbro, Inc. | 21,403 | 2,178,397 | |||||||||
Newell Brands, Inc. | 72,122 | 1,575,145 | |||||||||
VF Corp. | 23,224 | 1,700,461 | |||||||||
Whirlpool Corp. | 8,224 | 1,929,844 | |||||||||
10,031,804 | |||||||||||
Consumer Staples (19.2%): | |||||||||||
Altria Group, Inc. | 49,472 | 2,344,478 | |||||||||
Archer-Daniels-Midland Co. | 43,143 | 2,916,035 | |||||||||
Bunge Ltd. | 24,810 | 2,316,262 | |||||||||
Campbell Soup Co. | 55,447 | 2,409,727 | |||||||||
Conagra Brands, Inc. | 77,557 | 2,648,571 | |||||||||
Costco Wholesale Corp. | 7,154 | 4,061,326 | |||||||||
General Mills, Inc. | 48,850 | 3,291,513 | |||||||||
Kellogg Co. | 43,373 | 2,794,089 | |||||||||
Kimberly-Clark Corp. | 23,672 | 3,383,202 | |||||||||
PepsiCo, Inc. | 23,324 | 4,051,612 | |||||||||
Philip Morris International, Inc. | 31,196 | 2,963,620 | |||||||||
The Clorox Co. | 12,866 | 2,243,316 | |||||||||
The Coca-Cola Co. | 63,267 | 3,746,039 | |||||||||
The J.M. Smucker Co. | 20,010 | 2,717,758 | |||||||||
The Kraft Heinz Co. | 67,910 | 2,437,969 | |||||||||
Walgreens Boots Alliance, Inc. | 38,015 | 1,982,862 | |||||||||
46,308,379 | |||||||||||
Energy (5.0%): | |||||||||||
Chevron Corp. | 20,912 | 2,454,023 | |||||||||
ConocoPhillips | 25,871 | 1,867,369 | |||||||||
Devon Energy Corp. | 34,066 | 1,500,607 | |||||||||
Kinder Morgan, Inc. | 125,613 | 1,992,222 | |||||||||
ONEOK, Inc. | 31,401 | 1,845,123 | |||||||||
The Williams Cos., Inc. | 90,273 | 2,350,709 | |||||||||
12,010,053 | |||||||||||
Financials (20.4%): | |||||||||||
American Financial Group, Inc. | 11,216 | 1,540,181 | |||||||||
American International Group, Inc. | 32,229 | 1,832,541 | |||||||||
Apollo Global Management, Inc. | 31,996 | 2,317,470 | |||||||||
Blackstone, Inc. | 18,198 | 2,354,639 | |||||||||
Citigroup, Inc. | 26,800 | 1,618,452 | |||||||||
Citizens Financial Group, Inc. | 36,081 | 1,704,827 | |||||||||
CME Group, Inc. | 11,642 | 2,659,731 | |||||||||
See notes to financial statements.
63
| Victory Portfolios II VictoryShares US Large Cap High Div Volatility Wtd ETF | Schedule of Portfolio Investments — continued December 31, 2021 | ||||||
(Unaudited)
Security Description | Shares | Value | |||||||||
CNA Financial Corp. | 53,091 | $ | 2,340,251 | ||||||||
Everest Re Group Ltd. | 8,439 | 2,311,611 | |||||||||
Fidelity National Financial, Inc. | 42,242 | 2,204,188 | |||||||||
Fifth Third Bancorp | 42,731 | 1,860,935 | |||||||||
Franklin Resources, Inc. | 47,237 | 1,581,967 | |||||||||
Huntington Bancshares, Inc. | 105,029 | 1,619,547 | |||||||||
Invesco Ltd. | 57,049 | 1,313,268 | |||||||||
KeyCorp | 79,711 | 1,843,716 | |||||||||
Lincoln National Corp. | 20,877 | 1,425,064 | |||||||||
M&T Bank Corp. | 12,063 | 1,852,636 | |||||||||
MetLife, Inc. | 32,651 | 2,040,361 | |||||||||
Northern Trust Corp. | 17,635 | 2,109,322 | |||||||||
Principal Financial Group, Inc. | 28,285 | 2,045,854 | |||||||||
Prudential Financial, Inc. | 19,565 | 2,117,716 | |||||||||
Regions Financial Corp. | 79,475 | 1,732,555 | |||||||||
The PNC Financial Services Group, Inc. | 10,412 | 2,087,814 | |||||||||
Truist Financial Corp. | 32,295 | 1,890,872 | |||||||||
U.S. Bancorp | 34,438 | 1,934,383 | |||||||||
UWM Holdings Corp. | 129,581 | 767,120 | |||||||||
49,107,021 | |||||||||||
Health Care (8.3%): | |||||||||||
AbbVie, Inc. | 23,004 | 3,114,741 | |||||||||
Amgen, Inc. | 11,450 | 2,575,906 | |||||||||
Cardinal Health, Inc. | 35,912 | 1,849,109 | |||||||||
Gilead Sciences, Inc. (a) | 35,880 | 2,605,247 | |||||||||
Johnson & Johnson (a) | 20,769 | 3,552,953 | |||||||||
Merck & Co., Inc. | 40,137 | 3,076,100 | |||||||||
Pfizer, Inc. | 55,516 | 3,278,220 | |||||||||
20,052,276 | |||||||||||
Industrials (3.4%): | |||||||||||
3M Co. | 14,871 | 2,641,536 | |||||||||
Lockheed Martin Corp. | 8,731 | 3,103,085 | |||||||||
Watsco, Inc. | 7,728 | 2,417,936 | |||||||||
8,162,557 | |||||||||||
Information Technology (7.3%): | |||||||||||
Broadcom, Inc. | 3,727 | 2,479,983 | |||||||||
Cisco Systems, Inc. | 50,862 | 3,223,125 | |||||||||
Corning, Inc. | 50,872 | 1,893,965 | |||||||||
Hewlett Packard Enterprise Co. | 126,947 | 2,001,954 | |||||||||
HP, Inc. | 62,653 | 2,360,139 | |||||||||
Intel Corp. | 29,594 | 1,524,091 | |||||||||
International Business Machines Corp. | 16,778 | 2,242,547 | |||||||||
Kyndryl Holdings, Inc. (b) | 3,354 | 60,707 | |||||||||
Seagate Technology Holdings PLC | 15,189 | 1,716,053 | |||||||||
17,502,564 | |||||||||||
Materials (4.7%): | |||||||||||
Dow, Inc. | 28,385 | 1,609,997 | |||||||||
Eastman Chemical Co. | 17,230 | 2,083,279 | |||||||||
See notes to financial statements.
64
| Victory Portfolios II VictoryShares US Large Cap High Div Volatility Wtd ETF | Schedule of Portfolio Investments — continued December 31, 2021 | ||||||
(Unaudited)
Security Description | Shares | Value | |||||||||
International Paper Co. | 35,922 | $ | 1,687,616 | ||||||||
LyondellBasell Industries NV, Class A | 17,089 | 1,576,118 | |||||||||
Newmont Corp. | 33,376 | 2,069,980 | |||||||||
Packaging Corp. of America | 17,097 | 2,327,757 | |||||||||
Sylvamo Corp. (b) | 3,264 | 91,033 | |||||||||
11,445,780 | |||||||||||
Utilities (24.0%): | |||||||||||
Alliant Energy Corp. | 47,383 | 2,912,633 | |||||||||
American Electric Power Co., Inc. (a) | 34,927 | 3,107,455 | |||||||||
Avangrid, Inc. (c) | 52,116 | 2,599,546 | |||||||||
CMS Energy Corp. | 45,930 | 2,987,746 | |||||||||
Consolidated Edison, Inc. (a) | 41,955 | 3,579,601 | |||||||||
Dominion Energy, Inc. | 39,384 | 3,094,007 | |||||||||
DTE Energy Co. | 25,402 | 3,036,555 | |||||||||
Duke Energy Corp. (a) | 31,247 | 3,277,810 | |||||||||
Edison International | 43,044 | 2,937,753 | |||||||||
Entergy Corp. | 23,690 | 2,668,678 | |||||||||
Evergy, Inc. (a) | 41,257 | 2,830,643 | |||||||||
Exelon Corp. | 56,534 | 3,265,404 | |||||||||
FirstEnergy Corp. | 66,790 | 2,777,796 | |||||||||
NRG Energy, Inc. | 28,908 | 1,245,357 | |||||||||
PPL Corp. | 100,193 | 3,011,802 | |||||||||
Public Service Enterprise Group, Inc. | 43,096 | 2,875,796 | |||||||||
Sempra Energy | 20,285 | 2,683,300 | |||||||||
The Southern Co. (a) | 48,679 | 3,338,406 | |||||||||
WEC Energy Group, Inc. (a) | 29,136 | 2,828,232 | |||||||||
Xcel Energy, Inc. (a) | 41,405 | 2,803,118 | |||||||||
57,861,638 | |||||||||||
Total Common Stocks (Cost $207,436,489) | 239,837,813 | ||||||||||
Collateral for Securities Loaned^ (0.9%) | |||||||||||
BlackRock Liquidity Funds TempFund, Institutional Shares, 0.04% (d) | 51,436 | 51,436 | |||||||||
| Fidelity Investments Money Market Government Portfolio, Institutional Shares, 0.01% (d) | 1,010,214 | 1,010,214 | |||||||||
| Goldman Sachs Financial Square Prime Obligations Fund, Institutional Shares, 0.02% (d) | 25,669 | 25,669 | |||||||||
JPMorgan Prime Money Market Fund, Capital Shares, 0.07% (d) | 204,678 | 204,678 | |||||||||
| Morgan Stanley Institutional Liquidity Prime Portfolio, Institutional Shares, 0.06% (d) | 920,273 | 920,273 | |||||||||
Total Collateral for Securities Loaned (Cost $2,212,270) | 2,212,270 | ||||||||||
Total Investments (Cost $209,648,759) — 100.4% | 242,050,083 | ||||||||||
Liabilities in excess of other assets — (0.4)% | (989,440 | ) | |||||||||
NET ASSETS — 100.00% | $ | 241,060,643 | |||||||||
^ Purchased with cash collateral from securities on loan.
(a) All or a portion of this security has been segregated as collateral for derivative instruments.
(b) Non-income producing security.
See notes to financial statements.
65
| Victory Portfolios II VictoryShares US Large Cap High Div Volatility Wtd ETF | Schedule of Portfolio Investments — continued December 31, 2021 | ||||||
(Unaudited)
(c) All or a portion of this security is on loan.
(d) Rate disclosed is the daily yield on December 31, 2021.
PLC — Public Limited Company
Futures Contracts Purchased
| Number of Contracts | Expiration Date | Notional Amount | Value | Unrealized Appreciation (Depreciation) | |||||||||||||||||||
E-Mini S&P 500 Futures | 3 | 3/18/22 | $ | 704,825 | $ | 713,775 | $ | 8,950 | |||||||||||||||
Total unrealized appreciation | $ | 8,950 | |||||||||||||||||||||
Total unrealized depreciation | — | ||||||||||||||||||||||
Total net unrealized appreciation (depreciation) | $ | 8,950 | |||||||||||||||||||||
See notes to financial statements.
66
| Victory Portfolios II VictoryShares US Small Cap High Div Volatility Wtd ETF | Schedule of Portfolio Investments December 31, 2021 | ||||||
(Unaudited)
Security Description | Shares | Value | |||||||||
Common Stocks (99.6%) | |||||||||||
Banks (17.5%): | |||||||||||
Brookline Bancorp, Inc. | 186,101 | $ | 3,012,975 | ||||||||
Columbia Banking System, Inc. | 64,630 | 2,114,694 | |||||||||
CVB Financial Corp. | 135,103 | 2,892,555 | |||||||||
First Busey Corp. | 112,786 | 3,058,756 | |||||||||
First Commonwealth Financial Corp. | 184,993 | 2,976,537 | |||||||||
First Financial Bancorp | 94,938 | 2,314,588 | |||||||||
First Interstate BancSystem, Inc., Class A | 62,882 | 2,557,411 | |||||||||
Fulton Financial Corp. | 159,772 | 2,716,124 | |||||||||
Heritage Financial Corp. | 100,556 | 2,457,589 | |||||||||
Hope Bancorp, Inc. | 165,716 | 2,437,682 | |||||||||
Old National Bancorp | 182,304 | 3,303,349 | |||||||||
Park National Corp. | 22,600 | 3,103,206 | |||||||||
S&T Bancorp, Inc. | 79,042 | 2,491,404 | |||||||||
Southside Bancshares, Inc. (a) | 75,748 | 3,167,781 | |||||||||
Washington Trust Bancorp, Inc. | 49,907 | 2,813,258 | |||||||||
WesBanco, Inc. | 70,854 | 2,479,182 | |||||||||
43,897,091 | |||||||||||
Capital Markets (0.6%): | |||||||||||
Sculptor Capital Management, Inc. | 65,320 | 1,394,582 | |||||||||
Communication Services (0.9%): | |||||||||||
Telephone & Data Systems, Inc. | 112,975 | 2,276,446 | |||||||||
Consumer Discretionary (11.5%): | |||||||||||
Big 5 Sporting Goods Corp. (b) | 35,446 | 673,828 | |||||||||
Big Lots, Inc. | 30,842 | 1,389,432 | |||||||||
Ethan Allen Interiors, Inc. (b) | 83,414 | 2,192,954 | |||||||||
Franchise Group, Inc. | 66,289 | 3,457,634 | |||||||||
Guess?, Inc. | 64,108 | 1,518,077 | |||||||||
Haverty Furniture Cos., Inc. (b) | 49,966 | 1,527,461 | |||||||||
Jack in the Box, Inc. | 24,953 | 2,182,888 | |||||||||
La-Z-Boy, Inc. | 66,062 | 2,398,711 | |||||||||
Monro, Inc. | 39,637 | 2,309,648 | |||||||||
Oxford Industries, Inc. | 21,959 | 2,229,278 | |||||||||
Standard Motor Products, Inc. | 60,243 | 3,156,131 | |||||||||
Strategic Education, Inc. | 28,458 | 1,646,011 | |||||||||
Sturm Ruger & Co., Inc. (a) | 30,249 | 2,057,537 | |||||||||
The Buckle, Inc. | 50,605 | 2,141,098 | |||||||||
28,880,688 | |||||||||||
Consumer Staples (9.8%): | |||||||||||
B&G Foods, Inc. (b) | 58,638 | 1,801,946 | |||||||||
Calavo Growers, Inc. | 54,473 | 2,309,655 | |||||||||
Energizer Holdings, Inc. | 77,761 | 3,118,216 | |||||||||
Medifast, Inc. | 7,611 | 1,593,972 | |||||||||
Nu Skin Enterprises, Inc., Class A | 44,889 | 2,278,117 | |||||||||
SpartanNash Co. | 121,621 | 3,132,957 | |||||||||
The Andersons, Inc. | 63,034 | 2,440,046 | |||||||||
Universal Corp. | 59,484 | 3,266,861 | |||||||||
See notes to financial statements.
67
| Victory Portfolios II VictoryShares US Small Cap High Div Volatility Wtd ETF | Schedule of Portfolio Investments — continued December 31, 2021 | ||||||
(Unaudited)
Security Description | Shares | Value | |||||||||
Vector Group Ltd. | 148,108 | $ | 1,700,280 | ||||||||
Weis Markets, Inc. (a)(b) | 46,504 | 3,063,683 | |||||||||
24,705,733 | |||||||||||
Energy (1.5%): | |||||||||||
Altus Midstream Co., Class A | 26,095 | 1,599,884 | |||||||||
Archrock, Inc. | 280,285 | 2,096,532 | |||||||||
3,696,416 | |||||||||||
Health Care (2.6%): | |||||||||||
National HealthCare Corp. (a) | 34,489 | 2,343,183 | |||||||||
Patterson Cos., Inc. (a) | 77,281 | 2,268,197 | |||||||||
Phibro Animal Health Corp., Class A | 98,587 | 2,013,147 | |||||||||
6,624,527 | |||||||||||
Industrials (19.6%): | |||||||||||
ACCO Brands Corp. | 237,810 | 1,964,310 | |||||||||
Apogee Enterprises, Inc. | 48,779 | 2,348,709 | |||||||||
Argan, Inc. | 64,455 | 2,493,764 | |||||||||
Brady Corp., Class A | 61,052 | 3,290,703 | |||||||||
Deluxe Corp. | 52,233 | 1,677,202 | |||||||||
Douglas Dynamics, Inc. | 60,985 | 2,382,074 | |||||||||
Global Industrial Co. | 49,523 | 2,025,491 | |||||||||
H&E Equipment Services, Inc. | 51,599 | 2,284,288 | |||||||||
Healthcare Services Group | 82,974 | 1,476,107 | |||||||||
Heidrick & Struggles International, Inc. | 57,317 | 2,506,472 | |||||||||
HNI Corp. | 62,002 | 2,607,184 | |||||||||
Hyster-Yale Materials Handling, Inc. | 29,199 | 1,200,079 | |||||||||
Kforce, Inc. | 46,154 | 3,471,704 | |||||||||
Matthews International Corp., Class A | 69,111 | 2,534,300 | |||||||||
McGrath RentCorp | 39,609 | 3,179,018 | |||||||||
Pitney Bowes, Inc. | 88,979 | 589,931 | |||||||||
Rush Enterprises, Inc., Class B | 60,897 | 3,388,309 | |||||||||
Steelcase, Inc., Class A | 156,844 | 1,838,212 | |||||||||
The Gorman-Rupp Co. | 74,151 | 3,303,427 | |||||||||
The Greenbrier Cos., Inc. | 44,644 | 2,048,713 | |||||||||
Wabash National Corp. | 140,932 | 2,750,993 | |||||||||
49,360,990 | |||||||||||
Information Technology (8.2%): | |||||||||||
ADTRAN, Inc. | 80,673 | 1,841,765 | |||||||||
American Software, Inc., Class A | 57,692 | 1,509,800 | |||||||||
Benchmark Electronics, Inc. | 101,625 | 2,754,037 | |||||||||
Cass Information Systems, Inc. | 71,216 | 2,800,213 | |||||||||
CSG Systems International, Inc. | 80,612 | 4,644,863 | |||||||||
InterDigital, Inc. | 37,267 | 2,669,435 | |||||||||
Progress Software Corp. | 61,936 | 2,989,651 | |||||||||
SolarWinds Corp. | 91,324 | 1,295,888 | |||||||||
20,505,652 | |||||||||||
Insurance (1.4%): | |||||||||||
Safety Insurance Group, Inc. (a) | 42,302 | 3,596,939 | |||||||||
See notes to financial statements.
68
| Victory Portfolios II VictoryShares US Small Cap High Div Volatility Wtd ETF | Schedule of Portfolio Investments — continued December 31, 2021 | ||||||
(Unaudited)
Security Description | Shares | Value | |||||||||
Materials (6.0%): | |||||||||||
Glatfelter Corp. | 153,158 | $ | 2,634,317 | ||||||||
Kronos Worldwide, Inc. | 191,283 | 2,871,158 | |||||||||
Myers Industries, Inc. | 108,986 | 2,180,810 | |||||||||
Orion Engineered Carbons SA (c) | 112,941 | 2,073,597 | |||||||||
Schnitzer Steel Industries, Inc. | 32,616 | 1,693,423 | |||||||||
Schweitzer-Mauduit International, Inc. | 61,207 | 1,830,089 | |||||||||
Worthington Industries, Inc. | 34,914 | 1,908,399 | |||||||||
15,191,793 | |||||||||||
Real Estate (1.9%): | |||||||||||
Douglas Elliman, Inc. (c) | 74,054 | 851,621 | |||||||||
RE/MAX Holdings, Inc. | 73,720 | 2,247,723 | |||||||||
The RMR Group, Inc., Class A | 50,964 | 1,767,432 | |||||||||
4,866,776 | |||||||||||
Thrifts & Mortgage Finance (5.9%): | |||||||||||
Federal Agricultural Mortgage Corp., Class C | 27,504 | 3,408,571 | |||||||||
Northwest Bancshares, Inc. (a) | 257,785 | 3,650,236 | |||||||||
OceanFirst Financial Corp. | 118,454 | 2,629,679 | |||||||||
Premier Financial Corp. | 77,961 | 2,409,774 | |||||||||
Provident Financial Services, Inc. | 117,488 | 2,845,559 | |||||||||
14,943,819 | |||||||||||
Utilities (12.2%): | |||||||||||
Avista Corp. | 83,835 | 3,562,149 | |||||||||
Chesapeake Utilities Corp. | 27,991 | 4,081,368 | |||||||||
MGE Energy, Inc. | 48,867 | 4,019,311 | |||||||||
Northwest Natural Holding Co. | 50,398 | 2,458,414 | |||||||||
Otter Tail Corp. (a) | 69,288 | 4,948,549 | |||||||||
SJW Group | 51,254 | 3,751,793 | |||||||||
South Jersey Industries, Inc. | 84,613 | 2,210,092 | |||||||||
The York Water Co. | 60,823 | 3,027,769 | |||||||||
Unitil Corp. (a) | 54,380 | 2,500,936 | |||||||||
30,560,381 | |||||||||||
Total Common Stocks (Cost $235,206,825) | 250,501,833 | ||||||||||
Collateral for Securities Loaned^ (2.3%) | |||||||||||
BlackRock Liquidity Funds TempFund, Institutional Shares, 0.04% (d) | 136,913 | 136,913 | |||||||||
| Fidelity Investments Money Market Government Portfolio, Institutional Shares, 0.01% (d) | 2,688,998 | 2,688,998 | |||||||||
| Goldman Sachs Financial Square Prime Obligations Fund, Institutional Shares, 0.02% (d) | 68,327 | 68,327 | |||||||||
JPMorgan Prime Money Market Fund, Capital Shares, 0.07% (d) | 544,815 | 544,815 | |||||||||
| Morgan Stanley Institutional Liquidity Prime Portfolio, Institutional Shares, 0.06% (d) | 2,449,594 | 2,449,594 | |||||||||
Total Collateral for Securities Loaned (Cost $5,888,647) | 5,888,647 | ||||||||||
Total Investments (Cost $241,095,472) — 101.9% | 256,390,480 | ||||||||||
Liabilities in excess of other assets — (1.9)% | (4,754,399 | ) | |||||||||
NET ASSETS — 100.00% | $ | 251,636,081 | |||||||||
See notes to financial statements.
69
| Victory Portfolios II VictoryShares US Small Cap High Div Volatility Wtd ETF | Schedule of Portfolio Investments — continued December 31, 2021 | ||||||
(Unaudited)
^ Purchased with cash collateral from securities on loan.
(a) All or a portion of this security has been segregated as collateral for derivative instruments.
(b) All or a portion of this security is on loan.
(c) Non-income producing security.
(d) Rate disclosed is the daily yield on December 31, 2021.
Futures Contracts Purchased
| Number of Contracts | Expiration Date | Notional Amount | Value | Unrealized Appreciation (Depreciation) | |||||||||||||||||||
E-Mini Russell 2000 Index Futures | 8 | 3/18/22 | $ | 871,824 | $ | 897,120 | $ | 25,296 | |||||||||||||||
Total unrealized appreciation | $ | 25,296 | |||||||||||||||||||||
Total unrealized depreciation | — | ||||||||||||||||||||||
Total net unrealized appreciation (depreciation) | $ | 25,296 | |||||||||||||||||||||
See notes to financial statements.
70
| Victory Portfolios II VictoryShares International High Div Volatility Wtd ETF | Schedule of Portfolio Investments December 31, 2021 | ||||||
(Unaudited)
Security Description | Shares | Value | |||||||||
Common Stocks (99.0%) | |||||||||||
Australia (3.8%): | |||||||||||
Communication Services (1.3%): | |||||||||||
Telstra Corp. Ltd. | 81,610 | $ | 248,138 | ||||||||
Financials (0.8%): | |||||||||||
Suncorp Group Ltd. | 19,248 | 154,991 | |||||||||
Materials (1.7%): | |||||||||||
BHP Group Ltd. (a) | 4,157 | 125,488 | |||||||||
Fortescue Metals Group Ltd. | 6,814 | 95,214 | |||||||||
Rio Tinto Ltd. | 1,594 | 116,075 | |||||||||
336,777 | |||||||||||
739,906 | |||||||||||
Austria (0.8%): | |||||||||||
Energy (0.8%): | |||||||||||
OMV AG | 2,603 | 148,014 | |||||||||
Canada (16.8%): | |||||||||||
Communication Services (3.7%): | |||||||||||
BCE, Inc. (a)(b) | 6,967 | 362,507 | |||||||||
TELUS Corp. (a)(b) | 14,825 | 349,175 | |||||||||
711,682 | |||||||||||
Energy (3.9%): | |||||||||||
Canadian Natural Resources Ltd. | 3,712 | 156,868 | |||||||||
Enbridge, Inc. | 6,313 | 246,620 | |||||||||
Suncor Energy, Inc. | 6,181 | 154,672 | |||||||||
TC Energy Corp. | 4,371 | 203,309 | |||||||||
761,469 | |||||||||||
Financials (4.7%): | |||||||||||
Great-West Lifeco, Inc. | 10,910 | 327,438 | |||||||||
Manulife Financial Corp. | 11,347 | 216,300 | |||||||||
The Bank of Nova Scotia | 5,257 | 372,205 | |||||||||
915,943 | |||||||||||
Utilities (4.5%): | |||||||||||
Emera, Inc. | 8,943 | 447,009 | |||||||||
Fortis, Inc. (a) | 9,045 | 436,445 | |||||||||
883,454 | |||||||||||
3,272,548 | |||||||||||
Denmark (1.0%): | |||||||||||
Financials (1.0%): | |||||||||||
Tryg A/S | 8,251 | 204,026 | |||||||||
Finland (1.9%): | |||||||||||
Materials (0.9%): | |||||||||||
UPM-Kymmene Oyj | 4,651 | 177,160 | |||||||||
See notes to financial statements.
71
| Victory Portfolios II VictoryShares International High Div Volatility Wtd ETF | Schedule of Portfolio Investments — continued December 31, 2021 | ||||||
(Unaudited)
Security Description | Shares | Value | |||||||||
Utilities (1.0%): | |||||||||||
Fortum Oyj | 6,388 | $ | 196,273 | ||||||||
373,433 | |||||||||||
France (8.1%): | |||||||||||
Communication Services (2.1%): | |||||||||||
Orange SA | 21,254 | 227,752 | |||||||||
Publicis Groupe SA | 2,649 | 178,524 | |||||||||
406,276 | |||||||||||
Energy (1.0%): | |||||||||||
TotalEnergies SE | 3,981 | 202,261 | |||||||||
Financials (2.9%): | |||||||||||
AXA SA | 7,031 | 209,586 | |||||||||
CNP Assurances | 8,272 | 204,815 | |||||||||
Credit Agricole SA | 10,812 | 154,470 | |||||||||
568,871 | |||||||||||
Health Care (1.2%): | |||||||||||
Sanofi | 2,395 | 241,509 | |||||||||
Industrials (0.9%): | |||||||||||
Bouygues SA | 4,703 | 168,593 | |||||||||
1,587,510 | |||||||||||
Germany (4.3%): | |||||||||||
Financials (1.0%): | |||||||||||
Allianz SE, Registered Shares | 815 | 192,656 | |||||||||
Materials (2.1%): | |||||||||||
BASF SE | 2,505 | 176,177 | |||||||||
Evonik Industries AG | 7,069 | 229,107 | |||||||||
405,284 | |||||||||||
Utilities (1.2%): | |||||||||||
E.ON SE | 17,387 | 241,319 | |||||||||
839,259 | |||||||||||
Hong Kong (8.8%): | |||||||||||
Industrials (1.3%): | |||||||||||
CK Hutchison Holdings Ltd. | 23,528 | 151,778 | |||||||||
SITC International Holdings Co. Ltd. | 18,000 | 65,099 | |||||||||
Xinyi Glass Holdings Ltd. | 17,000 | 42,515 | |||||||||
259,392 | |||||||||||
Real Estate (3.5%): | |||||||||||
CK Asset Holdings Ltd. | 25,800 | 162,629 | |||||||||
Henderson Land Development Co. Ltd. | 44,916 | 191,247 | |||||||||
New World Development Co. Ltd. | 39,914 | 157,920 | |||||||||
Sun Hung Kai Properties Ltd. | 13,968 | 169,465 | |||||||||
681,261 | |||||||||||
See notes to financial statements.
72
| Victory Portfolios II VictoryShares International High Div Volatility Wtd ETF | Schedule of Portfolio Investments — continued December 31, 2021 | ||||||
(Unaudited)
Security Description | Shares | Value | |||||||||
Utilities (4.0%): | |||||||||||
CK Infrastructure Holdings Ltd. | 33,999 | $ | 216,492 | ||||||||
CLP Holdings Ltd. | 31,814 | 321,310 | |||||||||
Power Assets Holdings Ltd. (b) | 39,921 | 248,825 | |||||||||
786,627 | |||||||||||
1,727,280 | |||||||||||
Ireland (0.8%): | |||||||||||
Materials (0.8%): | |||||||||||
Smurfit Kappa Group PLC | 2,955 | 162,950 | |||||||||
Italy (4.3%): | |||||||||||
Financials (0.9%): | |||||||||||
Poste Italiane SpA (c) | 13,821 | 181,567 | |||||||||
Utilities (3.4%): | |||||||||||
Enel SpA | 19,958 | 160,086 | |||||||||
Snam SpA | 43,623 | 263,199 | |||||||||
Terna — Rete Elettrica Nazionale | 28,587 | 231,513 | |||||||||
654,798 | |||||||||||
836,365 | |||||||||||
Japan (14.0%): | |||||||||||
Communication Services (4.2%): | |||||||||||
KDDI Corp. | 6,600 | 192,933 | |||||||||
Nintendo Co. Ltd. (b) | 300 | 139,944 | |||||||||
Nippon Telegraph & Telephone Corp. | 7,900 | 216,373 | |||||||||
Softbank Corp. | 21,600 | 273,169 | |||||||||
822,419 | |||||||||||
Consumer Discretionary (1.0%): | |||||||||||
Sekisui House Ltd. | 8,900 | 191,063 | |||||||||
Consumer Staples (1.2%): | |||||||||||
Japan Tobacco, Inc. | 11,400 | 230,210 | |||||||||
Energy (0.8%): | |||||||||||
ENEOS Holdings, Inc. | 42,100 | 157,514 | |||||||||
Financials (3.4%): | |||||||||||
Mizuho Financial Group, Inc. | 13,900 | 176,817 | |||||||||
Nomura Holdings, Inc. | 26,800 | 116,907 | |||||||||
Sumitomo Mitsui Financial Group, Inc. | 5,000 | 171,420 | |||||||||
Tokio Marine Holdings, Inc. | 3,700 | 205,638 | |||||||||
670,782 | |||||||||||
Health Care (0.9%): | |||||||||||
Takeda Pharmaceutical Co. Ltd. | 6,200 | 169,111 | |||||||||
See notes to financial statements.
73
| Victory Portfolios II VictoryShares International High Div Volatility Wtd ETF | Schedule of Portfolio Investments — continued December 31, 2021 | ||||||
(Unaudited)
Security Description | Shares | Value | |||||||||
Industrials (2.5%): | |||||||||||
Marubeni Corp. | 16,000 | $ | 155,743 | ||||||||
Mitsubishi Corp. | 6,100 | 193,698 | |||||||||
Mitsui & Co. Ltd. (a) | 6,300 | 149,187 | |||||||||
498,628 | |||||||||||
2,739,727 | |||||||||||
Korea, Republic Of (3.2%): | |||||||||||
Communication Services (0.4%): | |||||||||||
SK Telecom Co. Ltd. | 1,577 | 76,820 | |||||||||
Financials (1.4%): | |||||||||||
KB Financial Group, Inc. | 2,851 | 131,924 | |||||||||
Shinhan Financial Group Co. Ltd. | 4,713 | 145,918 | |||||||||
277,842 | |||||||||||
Information Technology (0.3%): | |||||||||||
SK Square Co. Ltd. (d) | 1,020 | 56,981 | |||||||||
Materials (0.5%): | |||||||||||
POSCO | 384 | 88,683 | |||||||||
Utilities (0.6%): | |||||||||||
Korea Electric Power Corp. | 6,377 | 118,570 | |||||||||
618,896 | |||||||||||
Netherlands (2.0%): | |||||||||||
Communication Services (0.9%): | |||||||||||
Koninklijke KPN NV | 56,646 | 176,045 | |||||||||
Financials (1.1%): | |||||||||||
NN Group NV | 3,975 | 215,441 | |||||||||
391,486 | |||||||||||
Norway (3.3%): | |||||||||||
Communication Services (1.2%): | |||||||||||
Telenor ASA | 15,413 | 242,675 | |||||||||
Financials (1.1%): | |||||||||||
DNB Bank ASA | 8,972 | 205,880 | |||||||||
Materials (1.0%): | |||||||||||
Yara International ASA | 3,818 | 193,006 | |||||||||
641,561 | |||||||||||
Portugal (0.8%): | |||||||||||
Utilities (0.8%): | |||||||||||
EDP — Energias de Portugal SA | 28,790 | 158,366 | |||||||||
Spain (2.3%): | |||||||||||
Communication Services (0.7%): | |||||||||||
Telefonica SA | 29,866 | 130,965 | |||||||||
Energy (0.7%): | |||||||||||
Repsol SA | 11,440 | 135,911 | |||||||||
See notes to financial statements.
74
| Victory Portfolios II VictoryShares International High Div Volatility Wtd ETF | Schedule of Portfolio Investments — continued December 31, 2021 | ||||||
(Unaudited)
Security Description | Shares | Value | |||||||||
Utilities (0.9%): | |||||||||||
Endesa SA | 7,637 | $ | 175,617 | ||||||||
442,493 | |||||||||||
Switzerland (7.1%): | |||||||||||
Communication Services (1.3%): | |||||||||||
Swisscom AG, Registered Shares | 454 | 256,481 | |||||||||
Financials (3.6%): | |||||||||||
Swiss Life Holding AG | 407 | 249,767 | |||||||||
Swiss Re AG | 2,153 | 213,338 | |||||||||
Zurich Insurance Group AG | 534 | 234,728 | |||||||||
697,833 | |||||||||||
Health Care (1.3%): | |||||||||||
Novartis AG, Registered Shares | 2,899 | 255,496 | |||||||||
Materials (0.9%): | |||||||||||
Holcim Ltd. | 3,581 | 182,844 | |||||||||
1,392,654 | |||||||||||
United Kingdom (15.7%): | |||||||||||
Consumer Discretionary (0.7%): | |||||||||||
Persimmon PLC | 3,394 | 131,180 | |||||||||
Consumer Staples (4.1%): | |||||||||||
British American Tobacco PLC | 4,916 | 181,856 | |||||||||
Imperial Brands PLC | 8,110 | 177,416 | |||||||||
Tesco PLC | 61,003 | 239,329 | |||||||||
Unilever PLC | 3,819 | 203,915 | |||||||||
802,516 | |||||||||||
Energy (1.5%): | |||||||||||
| BP PLC | 29,689 | 132,790 | |||||||||
Royal Dutch Shell PLC, Class A | 7,065 | 155,062 | |||||||||
287,852 | |||||||||||
Financials (2.6%): | |||||||||||
Admiral Group PLC | 4,110 | 175,596 | |||||||||
Aviva PLC | 32,823 | 182,298 | |||||||||
Legal & General Group PLC | 38,684 | 155,745 | |||||||||
513,639 | |||||||||||
Health Care (1.3%): | |||||||||||
GlaxoSmithKline PLC (b) | 11,168 | 242,817 | |||||||||
Industrials (1.0%): | |||||||||||
BAE Systems PLC | 26,997 | 200,871 | |||||||||
Materials (2.3%): | |||||||||||
Anglo American PLC | 2,314 | 94,448 | |||||||||
BHP Group PLC | 4,263 | 126,892 | |||||||||
Evraz PLC (b) | 14,539 | 118,369 | |||||||||
Rio Tinto PLC | 1,667 | 110,362 | |||||||||
450,071 | |||||||||||
See notes to financial statements.
75
| Victory Portfolios II VictoryShares International High Div Volatility Wtd ETF | Schedule of Portfolio Investments — continued December 31, 2021 | ||||||
(Unaudited)
Security Description | Shares | Value | |||||||||
Utilities (2.2%): | |||||||||||
National Grid PLC | 18,378 | $ | 263,584 | ||||||||
SSE PLC | 7,420 | 165,585 | |||||||||
429,169 | |||||||||||
3,058,115 | |||||||||||
Total Common Stocks (Cost $18,579,044) | 19,334,589 | ||||||||||
Collateral for Securities Loaned^ (4.4%) | |||||||||||
United States (4.4%): | |||||||||||
BlackRock Liquidity Funds TempFund, Institutional Shares, 0.04% (e) | 19,939 | 19,939 | |||||||||
| Fidelity Investments Money Market Government Portfolio, Institutional Shares, 0.01% (e) | 391,604 | 391,604 | |||||||||
| Goldman Sachs Financial Square Prime Obligations Fund, Institutional Shares, 0.02% (e) | 9,951 | 9,951 | |||||||||
JPMorgan Prime Money Market Fund, Capital Shares, 0.07% (e) | 79,342 | 79,342 | |||||||||
| Morgan Stanley Institutional Liquidity Prime Portfolio, Institutional Shares, 0.06% (e) | 356,739 | 356,739 | |||||||||
Total Collateral for Securities Loaned (Cost $857,575) | 857,575 | ||||||||||
Total Investments (Cost $19,436,619) — 103.4% | 20,192,164 | ||||||||||
Liabilities in excess of other assets — (3.4)% | (663,103 | ) | |||||||||
NET ASSETS — 100.00% | $ | 19,529,061 | |||||||||
^ Purchased with cash collateral from securities on loan.
(a) All or a portion of this security is on loan.
(b) All or a portion of this security has been segregated as collateral for derivative instruments.
(c) Rule 144A security or other security that is restricted as to resale to institutional investors. The Fund's Adviser has deemed this security to be liquid (unless otherwise noted as illiquid) based upon procedures approved by the Board of Trustees. As of December 31, 2021, the fair value of these securities was $181,567 and amounted to 0.9% of net assets.
(d) Non-income producing security.
(e) Rate disclosed is the daily yield on December 31, 2021.
PLC — Public Limited Company
Futures Contracts Purchased
| Number of Contracts | Expiration Date | Notional Amount | Value | Unrealized Appreciation (Depreciation) | |||||||||||||||||||
E-Mini MSCI EAFE Index Futures | 1 | 3/18/22 | $ | 112,004 | $ | 116,090 | $ | 4,086 | |||||||||||||||
Total unrealized appreciation | $ | 4,086 | |||||||||||||||||||||
Total unrealized depreciation | — | ||||||||||||||||||||||
Total net unrealized appreciation (depreciation) | $ | 4,086 | |||||||||||||||||||||
See notes to financial statements.
76
| Victory Portfolios II VictoryShares Emerging Market High Div Volatility Wtd ETF | Schedule of Portfolio Investments December 31, 2021 | ||||||
(Unaudited)
Security Description | Shares | Value | |||||||||
Common Stocks (99.6%) | |||||||||||
Brazil (9.4%): | |||||||||||
Communication Services (1.1%): | |||||||||||
TIM SA | 75,300 | $ | 177,805 | ||||||||
Consumer Discretionary (0.6%): | |||||||||||
Vibra Energia SA | 23,820 | 91,533 | |||||||||
Consumer Staples (1.0%): | |||||||||||
JBS SA | 25,100 | 171,044 | |||||||||
Energy (0.6%): | |||||||||||
Petroleo Brasileiro SA, Preference Shares | 18,300 | 93,488 | |||||||||
Financials (2.6%): | |||||||||||
B3 SA — Brasil Bolsa Balcao | 50,600 | 101,218 | |||||||||
Banco do Brasil SA | 25,600 | 132,620 | |||||||||
BB Seguridade Participacoes SA | 54,300 | 202,321 | |||||||||
436,159 | |||||||||||
Materials (1.0%): | |||||||||||
Cia Siderurgica Nacional SA | 13,400 | 60,131 | |||||||||
Vale SA | 7,300 | 102,192 | |||||||||
162,323 | |||||||||||
Utilities (2.5%): | |||||||||||
Centrais Eletricas Brasileiras SA | 15,300 | 91,789 | |||||||||
| CPFL Energia SA | 27,200 | 131,042 | |||||||||
Engie Brasil Energia SA | 28,400 | 195,878 | |||||||||
418,709 | |||||||||||
1,551,061 | |||||||||||
China (19.1%): | |||||||||||
Energy (1.7%): | |||||||||||
China Shenhua Energy Co. Ltd., Class H | 64,726 | 151,744 | |||||||||
PetroChina Co. Ltd., Class H | 284,488 | 126,604 | |||||||||
278,348 | |||||||||||
Financials (14.9%): | |||||||||||
Agricultural Bank of China Ltd., Class H (a) | 590,192 | 202,854 | |||||||||
Bank of China Ltd., Class H (a)(b) | 735,486 | 265,055 | |||||||||
Bank of Communications Co. Ltd., Class H | 369,500 | 223,198 | |||||||||
China CITIC Bank Corp. Ltd., Class H | 431,282 | 186,953 | |||||||||
China Construction Bank Corp., Class H (a)(b) | 287,252 | 198,936 | |||||||||
China Everbright Bank Co. Ltd., Class H | 458,516 | 162,300 | |||||||||
China Galaxy Securities Co. Ltd., Class H | 277,500 | 159,440 | |||||||||
China Merchants Securities Co. Ltd., Class H (c) | 84,600 | 129,548 | |||||||||
China Minsheng Banking Corp. Ltd., Class H | 414,690 | 158,488 | |||||||||
China Pacific Insurance Group Co. Ltd., Class H | 35,800 | 97,107 | |||||||||
Guotai Junan Securities Co. Ltd., Class H (c) | 126,800 | 196,771 | |||||||||
Industrial & Commercial Bank of China Ltd., Class H (b) | 363,846 | 205,317 | |||||||||
See notes to financial statements.
77
| Victory Portfolios II VictoryShares Emerging Market High Div Volatility Wtd ETF | Schedule of Portfolio Investments — continued December 31, 2021 | ||||||
(Unaudited)
Security Description | Shares | Value | |||||||||
New China Life Insurance Co. Ltd., Class H | 51,606 | $ | 137,995 | ||||||||
Postal Savings Bank of China Co. Ltd., Class H (b)(c) | 177,000 | 124,170 | |||||||||
2,448,132 | |||||||||||
Industrials (0.4%): | |||||||||||
Zoomlion Heavy Industry Science and Technology Co. Ltd., Class H | 89,200 | 56,170 | |||||||||
Information Technology (0.9%): | |||||||||||
China Railway Signal & Communication Corp. Ltd., Class H (c) | 403,258 | 147,395 | |||||||||
Materials (0.8%): | |||||||||||
Anhui Conch Cement Co. Ltd., Class H | 27,500 | 137,371 | |||||||||
Real Estate (0.4%): | |||||||||||
Sunac China Holdings Ltd. (b) | 44,000 | 66,475 | |||||||||
3,133,891 | |||||||||||
Colombia (0.7%): | |||||||||||
Utilities (0.7%): | |||||||||||
Interconexion Electrica SA ESP | 21,992 | 121,186 | |||||||||
Hong Kong (0.8%): | |||||||||||
Materials (0.8%): | |||||||||||
China Resources Cement Holdings Ltd. | 165,926 | 125,339 | |||||||||
Hungary (1.0%): | |||||||||||
Energy (1.0%): | |||||||||||
MOL Hungarian Oil & Gas PLC | 21,812 | 169,546 | |||||||||
India (8.5%): | |||||||||||
Communication Services (0.9%): | |||||||||||
Indus Towers Ltd. | 45,290 | 151,293 | |||||||||
Consumer Discretionary (0.9%): | |||||||||||
Bajaj Auto Ltd. | 3,380 | 147,754 | |||||||||
Consumer Staples (1.2%): | |||||||||||
ITC Ltd. | 66,791 | 195,935 | |||||||||
Energy (1.9%): | |||||||||||
Bharat Petroleum Corp. Ltd. | 27,002 | 140,024 | |||||||||
Hindustan Petroleum Corp. Ltd. | 41,360 | 162,676 | |||||||||
302,700 | |||||||||||
Materials (1.5%): | |||||||||||
Ambuja Cements Ltd. | 26,719 | 135,699 | |||||||||
Vedanta Ltd. | 25,323 | 116,242 | |||||||||
251,941 | |||||||||||
Utilities (2.1%): | |||||||||||
NTPC Ltd. | 106,062 | 177,508 | |||||||||
Power Grid Corp. of India Ltd. | 61,879 | 170,162 | |||||||||
347,670 | |||||||||||
1,397,293 | |||||||||||
See notes to financial statements.
78
| Victory Portfolios II VictoryShares Emerging Market High Div Volatility Wtd ETF | Schedule of Portfolio Investments — continued December 31, 2021 | ||||||
(Unaudited)
Security Description | Shares | Value | |||||||||
Indonesia (2.1%): | |||||||||||
Communication Services (1.0%): | |||||||||||
PT Telkom Indonesia Persero Tbk | 606,070 | $ | 171,826 | ||||||||
Consumer Staples (1.1%): | |||||||||||
PT Indofood Sukses Makmur Tbk | 400,752 | 177,878 | |||||||||
349,704 | |||||||||||
Malaysia (4.4%): | |||||||||||
Health Care (0.8%): | |||||||||||
Hartalega Holdings Bhd | 52,300 | 71,969 | |||||||||
Top Glove Corp. Bhd | 96,300 | 59,898 | |||||||||
131,867 | |||||||||||
Industrials (2.2%): | |||||||||||
MISC Bhd | 115,400 | 195,382 | |||||||||
Sime Darby Bhd | 302,200 | 168,373 | |||||||||
363,755 | |||||||||||
Utilities (1.4%): | |||||||||||
Tenaga Nasional Bhd | 103,000 | 231,033 | |||||||||
726,655 | |||||||||||
Mexico (3.1%): | |||||||||||
Consumer Staples (2.4%): | |||||||||||
Arca Continental SAB de CV | 36,005 | 229,564 | |||||||||
Kimberly-Clark de Mexico SAB de CV, Class A | 111,773 | 169,317 | |||||||||
398,881 | |||||||||||
Materials (0.7%): | |||||||||||
Grupo Mexico SAB de CV, Class B | 24,707 | 107,767 | |||||||||
506,648 | |||||||||||
Netherlands (0.9%): | |||||||||||
Consumer Staples (0.9%): | |||||||||||
X5 Retail Group NV, GDR | 5,568 | 147,385 | |||||||||
Peru (0.8%): | |||||||||||
Financials (0.8%): | |||||||||||
Credicorp Ltd. | 1,059 | 129,272 | |||||||||
Philippines (3.3%): | |||||||||||
Communication Services (2.1%): | |||||||||||
Globe Telecom, Inc. | 2,470 | 160,968 | |||||||||
PLDT, Inc. | 5,135 | 182,533 | |||||||||
343,501 | |||||||||||
Utilities (1.2%): | |||||||||||
Manila Electric Co. | 34,770 | 201,356 | |||||||||
544,857 | |||||||||||
See notes to financial statements.
79
| Victory Portfolios II VictoryShares Emerging Market High Div Volatility Wtd ETF | Schedule of Portfolio Investments — continued December 31, 2021 | ||||||
(Unaudited)
Security Description | Shares | Value | |||||||||
Poland (0.9%): | |||||||||||
Energy (0.9%): | |||||||||||
Polski Koncern Naftowy ORLEN SA | 8,075 | $ | 149,071 | ||||||||
Russian Federation (14.1%): | |||||||||||
Communication Services (3.3%): | |||||||||||
Mobile TeleSystems PJSC | 74,342 | 296,207 | |||||||||
Rostelecom PJSC (a) | 215,430 | 250,722 | |||||||||
546,929 | |||||||||||
Consumer Staples (1.3%): | |||||||||||
Magnit PJSC | 2,974 | 215,939 | |||||||||
Energy (1.1%): | |||||||||||
Tatneft PJSC | 26,402 | 176,324 | |||||||||
Financials (1.0%): | |||||||||||
Moscow Exchange MICEX-RTS PJSC | 83,100 | 169,853 | |||||||||
Materials (4.6%): | |||||||||||
Magnitogorsk Iron & Steel Works PJSC | 149,100 | 138,152 | |||||||||
MMC Norilsk Nickel PJSC | 475 | 144,688 | |||||||||
Novolipetsk Steel PJSC | 47,120 | 136,841 | |||||||||
Polyus PJSC | 1,098 | 191,564 | |||||||||
Severstal PAO | 7,145 | 153,039 | |||||||||
764,284 | |||||||||||
Utilities (2.8%): | |||||||||||
Inter RAO UES PJSC | 4,092,276 | 233,302 | |||||||||
RusHydro PJSC | 22,153,994 | 219,344 | |||||||||
452,646 | |||||||||||
2,325,975 | |||||||||||
South Africa (5.5%): | |||||||||||
Communication Services (1.1%): | |||||||||||
Vodacom Group Ltd. | 21,753 | 183,893 | |||||||||
Energy (0.6%): | |||||||||||
Exxaro Resources Ltd. | 10,648 | 102,218 | |||||||||
Financials (1.1%): | |||||||||||
Sanlam Ltd. | 45,780 | 170,650 | |||||||||
Materials (2.7%): | |||||||||||
African Rainbow Minerals Ltd. | 6,658 | 96,673 | |||||||||
Anglo American Platinum Ltd. | 952 | 108,611 | |||||||||
Impala Platinum Holdings Ltd. | 6,652 | 93,988 | |||||||||
Kumba Iron Ore Ltd. | 2,477 | 71,566 | |||||||||
Sibanye Stillwater Ltd. | 24,932 | 76,873 | |||||||||
447,711 | |||||||||||
904,472 | |||||||||||
See notes to financial statements.
80
| Victory Portfolios II VictoryShares Emerging Market High Div Volatility Wtd ETF | Schedule of Portfolio Investments — continued December 31, 2021 | ||||||
(Unaudited)
Security Description | Shares | Value | |||||||||
Taiwan (21.2%): | |||||||||||
Communication Services (4.5%): | |||||||||||
Far EasTone Telecommunications Co. Ltd. | 168,000 | $ | 392,407 | ||||||||
Taiwan Mobile Co. Ltd. | 98,000 | 354,341 | |||||||||
746,748 | |||||||||||
Financials (4.8%): | |||||||||||
Mega Financial Holding Co. Ltd. | 252,000 | 323,918 | |||||||||
SinoPac Financial Holdings Co. Ltd. | 476,000 | 277,955 | |||||||||
Yuanta Financial Holding Co. Ltd. | 198,000 | 181,126 | |||||||||
782,999 | |||||||||||
Industrials (1.0%): | |||||||||||
Far Eastern New Century Corp. | 160,000 | 169,505 | |||||||||
Information Technology (8.5%): | |||||||||||
Asustek Computer, Inc. | 13,000 | 176,736 | |||||||||
Catcher Technology Co. Ltd. | 31,000 | 175,417 | |||||||||
Compal Electronics, Inc. (a) | 208,000 | 182,001 | |||||||||
Lite-On Technology Corp. | 72,059 | 166,228 | |||||||||
MediaTek, Inc. | 3,000 | 129,081 | |||||||||
Micro-Star International Co. Ltd. | 24,000 | 139,277 | |||||||||
Pegatron Corp. | 79,000 | 197,379 | |||||||||
Quanta Computer, Inc. (a) | 65,000 | 222,566 | |||||||||
1,388,685 | |||||||||||
Materials (2.4%): | |||||||||||
Asia Cement Corp. | 131,000 | 209,831 | |||||||||
Taiwan Cement Corp. (a) | 110,000 | 190,910 | |||||||||
400,741 | |||||||||||
3,488,678 | |||||||||||
Thailand (2.3%): | |||||||||||
Energy (1.1%): | |||||||||||
PTT Exploration & Production PCL | 51,100 | 180,539 | |||||||||
Materials (1.2%): | |||||||||||
The Siam Cement PCL | 17,000 | 196,473 | |||||||||
377,012 | |||||||||||
Turkey (1.5%): | |||||||||||
Communication Services (0.8%): | |||||||||||
Turkcell Iletisim Hizmetleri A/S | 90,538 | 126,818 | |||||||||
Materials (0.7%): | |||||||||||
Eregli Demir ve Celik Fabrikalari TAS | 55,624 | 118,853 | |||||||||
245,671 | |||||||||||
Total Common Stocks (Cost $16,637,120) | 16,393,716 | ||||||||||
See notes to financial statements.
81
| Victory Portfolios II VictoryShares Emerging Market High Div Volatility Wtd ETF | Schedule of Portfolio Investments — continued December 31, 2021 | ||||||
(Unaudited)
Security Description | Shares | Value | |||||||||
Collateral for Securities Loaned^ (4.6%) | |||||||||||
United States (4.6%): | |||||||||||
BlackRock Liquidity Funds TempFund, Institutional Class, 0.04% (d) | 17,428 | $ | 17,428 | ||||||||
Fidelity Investments Money Market Government Portfolio, I Shares, 0.01% (d) | 342,287 | 342,287 | |||||||||
| Goldman Sachs Financial Square Prime Obligations Fund, Institutional Shares, 0.02% (d) | 8,697 | 8,697 | |||||||||
JPMorgan Prime Money Market Fund, Capital Shares, 0.07% (d) | 69,350 | 69,350 | |||||||||
| Morgan Stanley Institutional Liquidity Prime Portfolio, Institutional Shares, 0.06% (d) | 311,813 | 311,813 | |||||||||
Total Collateral for Securities Loaned (Cost $749,575) | 749,575 | ||||||||||
Total Investments (Cost $17,386,695) — 104.2% | 17,143,291 | ||||||||||
Liabilities in excess of other assets — (4.2)% | (686,735 | ) | |||||||||
NET ASSETS — 100.00% | $ | 16,456,556 | |||||||||
^ Purchased with cash collateral from securities on loan.
(a) All or a portion of this security has been segregated as collateral for derivative instruments.
(b) All or a portion of this security is on loan.
(c) Rule 144A security or other security that is restricted as to resale to institutional investors. The Fund's Adviser has deemed this security to be liquid (unless otherwise noted as illiquid) based upon procedures approved by the Board of Trustees. As of December 31, 2021, the fair value of these securities was $597,884 and amounted to 3.6% of net assets.
(d) Rate disclosed is the daily yield on December 31, 2021.
GDR — Global Depositary Receipt
PCL — Public Company Limited
PLC — Public Limited Company
Futures Contracts Purchased
| Number of Contracts | Expiration Date | Notional Amount | Value | Unrealized Appreciation (Depreciation) | |||||||||||||||||||
E-Mini MSCI Emerging Markets Index Futures | 1 | 3/18/22 | $ | 60,989 | $ | 61,315 | $ | 326 | |||||||||||||||
Total unrealized appreciation | $ | 326 | |||||||||||||||||||||
Total unrealized depreciation | — | ||||||||||||||||||||||
Total net unrealized appreciation (depreciation) | $ | 326 | |||||||||||||||||||||
See notes to financial statements.
82
| Victory Portfolios II VictoryShares Dividend Accelerator ETF | Schedule of Portfolio Investments December 31, 2021 | ||||||
(Unaudited)
Security Description | Shares | Value | |||||||||
Common Stocks (99.7%) | |||||||||||
Consumer Discretionary (9.1%): | |||||||||||
Dollar General Corp. | 30,715 | $ | 7,243,519 | ||||||||
Lowe's Cos., Inc. | 11,357 | 2,935,557 | |||||||||
McDonald's Corp. | 39,059 | 10,470,546 | |||||||||
NIKE, Inc., Class B | 35,590 | 5,931,785 | |||||||||
Target Corp. (a) | 24,707 | 5,718,188 | |||||||||
32,299,595 | |||||||||||
Consumer Staples (18.3%): | |||||||||||
Altria Group, Inc. | 33,268 | 1,576,571 | |||||||||
Archer-Daniels-Midland Co. | 78,279 | 5,290,878 | |||||||||
Brown-Forman Corp., Class B | 62,815 | 4,576,701 | |||||||||
Church & Dwight Co., Inc. | 32,230 | 3,303,575 | |||||||||
Colgate-Palmolive Co. | 82,810 | 7,067,005 | |||||||||
Costco Wholesale Corp. | 11,661 | 6,619,950 | |||||||||
Hormel Foods Corp. (b) | 74,183 | 3,620,872 | |||||||||
Kimberly-Clark Corp. | 31,022 | 4,433,664 | |||||||||
Lancaster Colony Corp. | 35,415 | 5,864,724 | |||||||||
McCormick & Co., Inc. | 32,384 | 3,128,618 | |||||||||
PepsiCo, Inc. | 22,026 | 3,826,137 | |||||||||
The Clorox Co. | 21,667 | 3,777,858 | |||||||||
The Coca-Cola Co. | 53,587 | 3,172,886 | |||||||||
The Procter & Gamble Co. | 25,591 | 4,186,176 | |||||||||
Walmart, Inc. | 30,683 | 4,439,523 | |||||||||
64,885,138 | |||||||||||
Financials (10.4%): | |||||||||||
Aflac, Inc. | 64,649 | 3,774,855 | |||||||||
Aon PLC, Class A | 27,333 | 8,215,206 | |||||||||
Cincinnati Financial Corp. | 11,483 | 1,308,258 | |||||||||
CME Group, Inc. | 27,275 | 6,231,247 | |||||||||
Commerce Bancshares, Inc. | 61,276 | 4,212,112 | |||||||||
Old Republic International Corp. | 49,467 | 1,215,899 | |||||||||
S&P Global, Inc. | 3,393 | 1,601,259 | |||||||||
SEI Investments Co. | 49,927 | 3,042,551 | |||||||||
T. Rowe Price Group, Inc. | 12,151 | 2,389,373 | |||||||||
The Allstate Corp. | 40,735 | 4,792,473 | |||||||||
36,783,233 | |||||||||||
Health Care (15.0%): | |||||||||||
Abbott Laboratories | 37,475 | 5,274,231 | |||||||||
Becton Dickinson & Co. | 13,609 | 3,422,391 | |||||||||
Chemed Corp. | 7,018 | 3,712,803 | |||||||||
Eli Lilly & Co. | 25,110 | 6,935,884 | |||||||||
Humana, Inc. | 14,388 | 6,674,018 | |||||||||
Johnson & Johnson (a) | 17,383 | 2,973,710 | |||||||||
Medtronic PLC | 40,899 | 4,231,001 | |||||||||
Merck & Co., Inc. | 68,790 | 5,272,066 | |||||||||
ResMed, Inc. | 35,664 | 9,289,759 | |||||||||
See notes to financial statements.
83
| Victory Portfolios II VictoryShares Dividend Accelerator ETF | Schedule of Portfolio Investments — continued December 31, 2021 | ||||||
(Unaudited)
Security Description | Shares | Value | |||||||||
STERIS PLC | 15,025 | $ | 3,657,235 | ||||||||
West Pharmaceutical Services, Inc. | 3,874 | 1,816,945 | |||||||||
53,260,043 | |||||||||||
Industrials (22.9%): | |||||||||||
3M Co. | 59,747 | 10,612,860 | |||||||||
Carlisle Cos., Inc. | 14,515 | 3,601,462 | |||||||||
Cintas Corp. | 4,816 | 2,134,307 | |||||||||
CSX Corp. | 135,820 | 5,106,832 | |||||||||
Dover Corp. | 39,520 | 7,176,832 | |||||||||
Emerson Electric Co. | 70,110 | 6,518,127 | |||||||||
Graco, Inc. | 21,256 | 1,713,659 | |||||||||
Illinois Tool Works, Inc. | 24,836 | 6,129,525 | |||||||||
Lennox International, Inc. | 13,968 | 4,530,660 | |||||||||
Nordson Corp. | 16,818 | 4,293,131 | |||||||||
Republic Services, Inc. (a) | 45,500 | 6,344,975 | |||||||||
Roper Technologies, Inc. | 4,050 | 1,992,033 | |||||||||
Stanley Black & Decker, Inc. | 13,224 | 2,494,311 | |||||||||
Union Pacific Corp. | 23,468 | 5,912,293 | |||||||||
W.W. Grainger, Inc. | 15,540 | 8,053,449 | |||||||||
Waste Management, Inc. | 27,024 | 4,510,305 | |||||||||
81,124,761 | |||||||||||
Information Technology (8.3%): | |||||||||||
Automatic Data Processing, Inc. | 17,268 | 4,257,944 | |||||||||
Jack Henry & Associates, Inc. | 38,140 | 6,368,999 | |||||||||
Mastercard, Inc., Class A | 17,175 | 6,171,321 | |||||||||
Microsoft Corp. (a) | 12,173 | 4,094,023 | |||||||||
Texas Instruments, Inc. | 25,190 | 4,747,559 | |||||||||
Visa, Inc., Class A | 17,106 | 3,707,041 | |||||||||
29,346,887 | |||||||||||
Materials (6.2%): | |||||||||||
Air Products & Chemicals, Inc. | 14,756 | 4,489,660 | |||||||||
Ecolab, Inc. | 13,040 | 3,059,054 | |||||||||
PPG Industries, Inc. | 23,906 | 4,122,351 | |||||||||
RPM International, Inc. | 30,962 | 3,127,162 | |||||||||
Sonoco Products Co. | 82,793 | 4,792,887 | |||||||||
The Sherwin-Williams Co. | 6,826 | 2,403,844 | |||||||||
21,994,958 | |||||||||||
Utilities (9.5%): | |||||||||||
Alliant Energy Corp. | 138,105 | 8,489,314 | |||||||||
Atmos Energy Corp. | 24,782 | 2,596,410 | |||||||||
Consolidated Edison, Inc. (a) | 96,525 | 8,235,513 | |||||||||
MDU Resources Group, Inc. | 77,754 | 2,397,933 | |||||||||
NextEra Energy, Inc. (a) | 24,292 | 2,267,901 | |||||||||
Xcel Energy, Inc. (a) | 144,098 | 9,755,435 | |||||||||
33,742,506 | |||||||||||
Total Common Stocks (Cost $288,737,888) | 353,437,121 | ||||||||||
See notes to financial statements.
84
| Victory Portfolios II VictoryShares Dividend Accelerator ETF | Schedule of Portfolio Investments — continued December 31, 2021 | ||||||
(Unaudited)
Security Description | Shares | Value | |||||||||
Collateral for Securities Loaned^ (0.1%) | |||||||||||
BlackRock Liquidity Funds TempFund, Institutional Shares, 0.04% (c) | 8,630 | $ | 8,630 | ||||||||
| Fidelity Investments Money Market Government Portfolio, Institutional Shares, 0.01% (c) | 169,492 | 169,492 | |||||||||
| Goldman Sachs Financial Square Prime Obligations Fund, Institutional Shares, 0.02% (c) | 4,307 | 4,307 | |||||||||
JPMorgan Prime Money Market Fund, Capital Shares, 0.07% (c) | 34,341 | 34,341 | |||||||||
| Morgan Stanley Institutional Liquidity Prime Portfolio, Institutional Shares, 0.06% (c) | 154,402 | 154,402 | |||||||||
Total Collateral for Securities Loaned (Cost $371,172) | 371,172 | ||||||||||
Total Investments (Cost $289,109,060) — 99.8% | 353,808,293 | ||||||||||
Other assets in excess of liabilities — 0.2% | 868,848 | ||||||||||
NET ASSETS — 100.00% | $ | 354,677,141 | |||||||||
^ Purchased with cash collateral from securities on loan.
(a) All or a portion of this security has been segregated as collateral for derivative instruments.
(b) All or a portion of this security is on loan.
(c) Rate disclosed is the daily yield on December 31, 2021.
PLC — Public Limited Company
Futures Contracts Purchased
| Number of Contracts | Expiration Date | Notional Amount | Value | Unrealized Appreciation (Depreciation) | |||||||||||||||||||
E-Mini S&P 500 Futures | 3 | 3/18/22 | $ | 692,175 | $ | 713,775 | $ | 21,600 | |||||||||||||||
Total unrealized appreciation | $ | 21,600 | |||||||||||||||||||||
Total unrealized depreciation | — | ||||||||||||||||||||||
Total net unrealized appreciation (depreciation) | $ | 21,600 | |||||||||||||||||||||
See notes to financial statements.
85
| Victory Portfolios II VictoryShares US Multi-Factor Minimum Volatility ETF | Schedule of Portfolio Investments December 31, 2021 | ||||||
(Unaudited)
Security Description | Shares | Value | |||||||||
Common Stocks (99.6%) | |||||||||||
Communication Services (3.5%): | |||||||||||
Fox Corp., Class A | 16,725 | $ | 617,153 | ||||||||
The Interpublic Group of Cos., Inc. | 10,148 | 380,043 | |||||||||
Verizon Communications, Inc. | 90,441 | 4,699,314 | |||||||||
5,696,510 | |||||||||||
Consumer Discretionary (13.7%): | |||||||||||
AutoNation, Inc. (a) | 3,882 | 453,612 | |||||||||
AutoZone, Inc. (a) | 2,693 | 5,645,578 | |||||||||
Deckers Outdoor Corp. (a) | 2,699 | 988,670 | |||||||||
Lowe's Cos., Inc. | 1,833 | 473,794 | |||||||||
O'Reilly Automotive, Inc. (a) | 7,531 | 5,318,618 | |||||||||
Target Corp. (b) | 21,138 | 4,892,179 | |||||||||
Tractor Supply Co. | 19,945 | 4,758,877 | |||||||||
22,531,328 | |||||||||||
Consumer Staples (12.7%): | |||||||||||
Altria Group, Inc. | 10,645 | 504,466 | |||||||||
Colgate-Palmolive Co. | 6,584 | 561,879 | |||||||||
Flowers Foods, Inc. | 21,049 | 578,216 | |||||||||
Kellogg Co. | 26,317 | 1,695,341 | |||||||||
The Clorox Co. | 21,422 | 3,735,140 | |||||||||
The J.M. Smucker Co. | 16,450 | 2,234,239 | |||||||||
The Kroger Co. | 112,330 | 5,084,056 | |||||||||
The Procter & Gamble Co. | 2,662 | 435,450 | |||||||||
Tyson Foods, Inc., Class A | 7,352 | 640,800 | |||||||||
Walmart, Inc. | 37,311 | 5,398,529 | |||||||||
20,868,116 | |||||||||||
Financials (5.5%): | |||||||||||
Aflac, Inc. | 9,974 | 582,382 | |||||||||
Evercore, Inc. | 4,480 | 608,608 | |||||||||
Everest Re Group Ltd. | 1,571 | 430,328 | |||||||||
First American Financial Corp. | 9,646 | 754,606 | |||||||||
Lazard Ltd., Class A | 11,871 | 517,932 | |||||||||
SEI Investments Co. | 13,099 | 798,253 | |||||||||
T. Rowe Price Group, Inc. | 5,280 | 1,038,259 | |||||||||
The Allstate Corp. | 36,021 | 4,237,871 | |||||||||
8,968,239 | |||||||||||
Health Care (17.3%): | |||||||||||
AbbVie, Inc. | 47,778 | 6,469,141 | |||||||||
Bristol-Myers Squibb Co. | 64,879 | 4,045,206 | |||||||||
DaVita, Inc. (a) | 9,275 | 1,055,124 | |||||||||
Henry Schein, Inc. (a) | 15,858 | 1,229,471 | |||||||||
Johnson & Johnson (b) | 37,305 | 6,381,766 | |||||||||
Laboratory Corp. of America Holdings (a) | 16,156 | 5,076,377 | |||||||||
McKesson Corp. | 1,866 | 463,831 | |||||||||
Quest Diagnostics, Inc. | 21,312 | 3,687,189 | |||||||||
28,408,105 | |||||||||||
See notes to financial statements.
86
| Victory Portfolios II VictoryShares US Multi-Factor Minimum Volatility ETF | Schedule of Portfolio Investments — continued December 31, 2021 | ||||||
(Unaudited)
Security Description | Shares | Value | |||||||||
Industrials (17.8%): | |||||||||||
3M Co. | 26,364 | $ | 4,683,037 | ||||||||
Acuity Brands, Inc. | 2,145 | 454,139 | |||||||||
Cintas Corp. | 976 | 432,534 | |||||||||
Clean Harbors, Inc. (a) | 3,582 | 357,376 | |||||||||
Expeditors International of Washington, Inc. | 3,593 | 482,504 | |||||||||
Illinois Tool Works, Inc. | 6,500 | 1,604,200 | |||||||||
J.B. Hunt Transport Services, Inc. | 2,224 | 454,586 | |||||||||
Lockheed Martin Corp. | 13,913 | 4,944,819 | |||||||||
ManpowerGroup, Inc. | 3,437 | 334,523 | |||||||||
Northrop Grumman Corp. | 10,637 | 4,117,264 | |||||||||
Robert Half International, Inc. | 17,656 | 1,968,997 | |||||||||
Rockwell Automation, Inc. | 1,266 | 441,644 | |||||||||
The Toro Co. | 14,100 | 1,408,731 | |||||||||
Union Pacific Corp. | 3,134 | 789,549 | |||||||||
Waste Management, Inc. | 31,331 | 5,229,144 | |||||||||
Watsco, Inc. | 4,566 | 1,428,610 | |||||||||
29,131,657 | |||||||||||
IT Services (3.5%): | |||||||||||
Automatic Data Processing, Inc. | 21,276 | 5,246,236 | |||||||||
Genpact Ltd. | 7,834 | 415,829 | |||||||||
5,662,065 | |||||||||||
Materials (0.2%): | |||||||||||
Packaging Corp. of America | 2,707 | 368,558 | |||||||||
Semiconductors & Semiconductor Equipment (2.9%): | |||||||||||
NXP Semiconductors NV | 2,344 | 533,916 | |||||||||
Texas Instruments, Inc. | 22,663 | 4,271,296 | |||||||||
4,805,212 | |||||||||||
Software (12.5%): | |||||||||||
Microsoft Corp. (b) | 43,673 | 14,688,104 | |||||||||
Oracle Corp. | 57,144 | 4,983,528 | |||||||||
Ziff Davis Inc. (a) | 8,077 | 895,416 | |||||||||
20,567,048 | |||||||||||
Technology Hardware, Storage & Peripherals (10.0%): | |||||||||||
Apple, Inc. | 76,423 | 13,570,432 | |||||||||
NetApp, Inc. | 30,342 | 2,791,161 | |||||||||
16,361,593 | |||||||||||
Total Common Stocks (Cost $134,164,994) | 163,368,431 | ||||||||||
Total Investments (Cost $134,164,994) — 99.6% | 163,368,431 | ||||||||||
Other assets in excess of liabilities — 0.4% | 649,534 | ||||||||||
NET ASSETS — 100.00% | $ | 164,017,965 | |||||||||
(a) Non-income producing security.
(b) All or a portion of this security has been segregated as collateral for derivative instruments.
See notes to financial statements.
87
| Victory Portfolios II VictoryShares US Multi-Factor Minimum Volatility ETF | Schedule of Portfolio Investments — continued December 31, 2021 | ||||||
(Unaudited)
Futures Contracts Purchased
| Number of Contracts | Expiration Date | Notional Amount | Value | Unrealized Appreciation (Depreciation) | |||||||||||||||||||
E-Mini S&P 500 Futures | 3 | 3/18/22 | $ | 707,775 | $ | 713,775 | $ | 6,000 | |||||||||||||||
Total unrealized appreciation | $ | 6,000 | |||||||||||||||||||||
Total unrealized depreciation | — | ||||||||||||||||||||||
Total net unrealized appreciation (depreciation) | $ | 6,000 | |||||||||||||||||||||
See notes to financial statements.
88
| Victory Portfolios II VictoryShares US 500 Enhanced Volatility Wtd ETF | Schedule of Portfolio Investments December 31, 2021 | ||||||
(Unaudited)
Security Description | Shares | Value | |||||||||
Common Stocks (99.6%) | |||||||||||
Communication Services (4.2%): | |||||||||||
Activision Blizzard, Inc. | 22,679 | $ | 1,508,834 | ||||||||
Alphabet, Inc., Class A (a) | 746 | 2,161,192 | |||||||||
Altice USA, Inc., Class A (a) | 64,677 | 1,046,474 | |||||||||
Cable One, Inc. | 941 | 1,659,406 | |||||||||
Charter Communications, Inc., Class A (a) | 2,715 | 1,770,099 | |||||||||
Comcast Corp., Class A | 39,741 | 2,000,164 | |||||||||
Discovery, Inc., Class A (a)(b) | 31,453 | 740,404 | |||||||||
DISH Network Corp., Class A (a)(b) | 31,136 | 1,010,052 | |||||||||
Electronic Arts, Inc. | 16,042 | 2,115,940 | |||||||||
Fox Corp., Class A | 36,444 | 1,344,784 | |||||||||
IAC/InterActiveCorp (a) | 8,996 | 1,175,867 | |||||||||
Liberty Broadband Corp., Class C (a) | 11,276 | 1,816,564 | |||||||||
Match Group, Inc. (a) | 8,884 | 1,174,909 | |||||||||
Meta Platforms, Inc., Class A (a) | 4,843 | 1,628,943 | |||||||||
Netflix, Inc. (a) | 2,726 | 1,642,251 | |||||||||
News Corp., Class A | 82,006 | 1,829,554 | |||||||||
Omnicom Group, Inc. | 27,537 | 2,017,636 | |||||||||
Pinterest, Inc., Class A (a) | 16,584 | 602,828 | |||||||||
Roku, Inc. (a) | 2,578 | 588,300 | |||||||||
Sirius XM Holdings, Inc. (b) | 282,771 | 1,795,596 | |||||||||
Take-Two Interactive Software, Inc. (a) | 10,922 | 1,941,058 | |||||||||
The Interpublic Group of Cos., Inc. | 46,693 | 1,748,653 | |||||||||
The Walt Disney Co. (a) | 11,737 | 1,817,944 | |||||||||
T-Mobile U.S., Inc. (a) | 16,477 | 1,911,002 | |||||||||
Twitter, Inc. (a) | 18,236 | 788,160 | |||||||||
Verizon Communications, Inc. | 66,542 | 3,457,522 | |||||||||
ViacomCBS, Inc., Class B | 18,964 | 572,333 | |||||||||
Warner Music Group Corp., Class A | 39,557 | 1,708,071 | |||||||||
Zillow Group, Inc., Class C (a)(b) | 9,353 | 597,189 | |||||||||
ZoomInfo Technologies, Inc. (a) | 15,125 | 971,025 | |||||||||
45,142,754 | |||||||||||
Consumer Discretionary (10.1%): | |||||||||||
Advance Auto Parts, Inc. | 9,898 | 2,374,332 | |||||||||
Amazon.com, Inc. (a) | 620 | 2,067,291 | |||||||||
Aptiv PLC (a) | 10,128 | 1,670,614 | |||||||||
AutoZone, Inc. (a) | 1,550 | 3,249,404 | |||||||||
Bath & Body Works, Inc. | 16,882 | 1,178,195 | |||||||||
Best Buy Co., Inc. | 14,087 | 1,431,239 | |||||||||
Booking Holdings, Inc. (a) | 716 | 1,717,849 | |||||||||
Burlington Stores, Inc. (a) | 4,897 | 1,427,524 | |||||||||
CarMax, Inc. (a) | 11,891 | 1,548,565 | |||||||||
Chewy, Inc., Class A (a)(b) | 10,772 | 635,225 | |||||||||
Chipotle Mexican Grill, Inc. (a) | 956 | 1,671,327 | |||||||||
D.R. Horton, Inc. | 16,058 | 1,741,490 | |||||||||
Darden Restaurants, Inc. | 11,129 | 1,676,473 | |||||||||
Deckers Outdoor Corp. (a) | 3,596 | 1,317,251 | |||||||||
Dick's Sporting Goods, Inc. | 8,619 | 991,099 | |||||||||
See notes to financial statements.
89
| Victory Portfolios II VictoryShares US 500 Enhanced Volatility Wtd ETF | Schedule of Portfolio Investments — continued December 31, 2021 | ||||||
(Unaudited)
Security Description | Shares | Value | |||||||||
Dollar General Corp. | 10,964 | $ | 2,585,640 | ||||||||
Dollar Tree, Inc. (a) | 20,809 | 2,924,081 | |||||||||
Domino's Pizza, Inc. | 3,764 | 2,124,138 | |||||||||
eBay, Inc. | 20,048 | 1,333,192 | |||||||||
Etsy, Inc. (a) | 4,058 | 888,458 | |||||||||
Five Below, Inc. (a) | 6,979 | 1,443,885 | |||||||||
Floor & Decor Holdings, Inc., Class A (a) | 10,749 | 1,397,477 | |||||||||
Ford Motor Co. | 98,408 | 2,043,934 | |||||||||
Garmin Ltd. | 15,740 | 2,143,316 | |||||||||
General Motors Co. (a) | 27,392 | 1,605,993 | |||||||||
Genuine Parts Co. | 18,545 | 2,600,009 | |||||||||
Hasbro, Inc. | 21,016 | 2,139,008 | |||||||||
Lennar Corp., Class A | 12,373 | 1,437,248 | |||||||||
Levi Strauss & Co., Class A | 53,531 | 1,339,881 | |||||||||
LKQ Corp. | 38,224 | 2,294,587 | |||||||||
Lowe's Cos., Inc. | 9,938 | 2,568,774 | |||||||||
Marriott International, Inc., Class A (a) | 12,738 | 2,104,827 | |||||||||
McDonald's Corp. | 14,066 | 3,770,673 | |||||||||
Mohawk Industries, Inc. (a) | 7,976 | 1,453,068 | |||||||||
Newell Brands, Inc. | 70,830 | 1,546,927 | |||||||||
NIKE, Inc., Class B | 10,912 | 1,818,703 | |||||||||
NVR, Inc. (a) | 379 | 2,239,462 | |||||||||
O'Reilly Automotive, Inc. (a) | 4,429 | 3,127,893 | |||||||||
Penn National Gaming, Inc. (a) | 10,408 | 539,655 | |||||||||
Pool Corp. | 4,119 | 2,331,354 | |||||||||
PulteGroup, Inc. | 27,943 | 1,597,222 | |||||||||
RH (a) | 1,734 | 929,320 | |||||||||
Ross Stores, Inc. | 14,492 | 1,656,146 | |||||||||
Service Corp. International | 35,171 | 2,496,789 | |||||||||
Starbucks Corp. | 20,869 | 2,441,047 | |||||||||
Tapestry, Inc. | 33,407 | 1,356,324 | |||||||||
Target Corp. (c) | 9,135 | 2,114,204 | |||||||||
Tesla, Inc. (a) | 1,290 | 1,363,246 | |||||||||
The Home Depot, Inc. | 8,205 | 3,405,157 | |||||||||
The TJX Cos., Inc. | 28,629 | 2,173,514 | |||||||||
Tractor Supply Co. | 10,207 | 2,435,390 | |||||||||
Ulta Beauty, Inc. (a) | 4,512 | 1,860,478 | |||||||||
Vail Resorts, Inc. | 6,095 | 1,998,550 | |||||||||
VF Corp. | 22,807 | 1,669,929 | |||||||||
Wayfair, Inc., Class A (a)(b) | 3,141 | 596,696 | |||||||||
Whirlpool Corp. | 8,075 | 1,894,879 | |||||||||
Williams-Sonoma, Inc. | 6,091 | 1,030,171 | |||||||||
Yum! Brands, Inc. | 20,816 | 2,890,510 | |||||||||
108,409,633 | |||||||||||
Consumer Staples (9.1%): | |||||||||||
Albertsons Cos., Inc., Class A | 40,099 | 1,210,589 | |||||||||
Altria Group, Inc. | 48,588 | 2,302,585 | |||||||||
Archer-Daniels-Midland Co. | 42,369 | 2,863,721 | |||||||||
Brown-Forman Corp., Class B | 38,440 | 2,800,738 | |||||||||
Bunge Ltd. | 24,368 | 2,274,997 | |||||||||
See notes to financial statements.
90
| Victory Portfolios II VictoryShares US 500 Enhanced Volatility Wtd ETF | Schedule of Portfolio Investments — continued December 31, 2021 | ||||||
(Unaudited)
Security Description | Shares | Value | |||||||||
Campbell Soup Co. | 54,453 | $ | 2,366,527 | ||||||||
Church & Dwight Co., Inc. | 38,014 | 3,896,435 | |||||||||
Colgate-Palmolive Co. | 45,645 | 3,895,344 | |||||||||
Conagra Brands, Inc. | 76,166 | 2,601,069 | |||||||||
Constellation Brands, Inc., Class A | 11,861 | 2,976,755 | |||||||||
Costco Wholesale Corp. | 7,028 | 3,989,796 | |||||||||
Darling Ingredients, Inc. (a) | 15,798 | 1,094,643 | |||||||||
General Mills, Inc. | 47,971 | 3,232,286 | |||||||||
Hormel Foods Corp. (b) | 56,396 | 2,752,689 | |||||||||
Kellogg Co. | 42,596 | 2,744,034 | |||||||||
Keurig Dr Pepper, Inc. | 89,872 | 3,312,682 | |||||||||
Kimberly-Clark Corp. | 23,251 | 3,323,033 | |||||||||
McCormick & Co., Inc. | 38,131 | 3,683,836 | |||||||||
Mondelez International, Inc., Class A | 55,078 | 3,652,222 | |||||||||
Monster Beverage Corp. (a) | 25,758 | 2,473,798 | |||||||||
PepsiCo, Inc. | 22,904 | 3,978,654 | |||||||||
Philip Morris International, Inc. | 30,633 | 2,910,135 | |||||||||
Sysco Corp. | 25,238 | 1,982,445 | |||||||||
The Clorox Co. | 12,635 | 2,203,039 | |||||||||
The Coca-Cola Co. | 62,132 | 3,678,836 | |||||||||
The Estee Lauder Cos., Inc. | 5,885 | 2,178,627 | |||||||||
The Hershey Co. | 21,187 | 4,099,049 | |||||||||
The J.M. Smucker Co. | 19,648 | 2,668,591 | |||||||||
The Kraft Heinz Co. | 66,695 | 2,394,351 | |||||||||
The Kroger Co. | 40,390 | 1,828,051 | |||||||||
The Procter & Gamble Co. | 25,088 | 4,103,895 | |||||||||
Tyson Foods, Inc., Class A | 29,538 | 2,574,532 | |||||||||
Walgreens Boots Alliance, Inc. | 37,335 | 1,947,394 | |||||||||
Walmart, Inc. | 21,254 | 3,075,241 | |||||||||
97,070,619 | |||||||||||
Energy (1.8%): | |||||||||||
Chevron Corp. | 20,538 | 2,410,134 | |||||||||
ConocoPhillips | 25,405 | 1,833,733 | |||||||||
Continental Resources, Inc. (b) | 21,824 | 976,842 | |||||||||
Devon Energy Corp. | 33,457 | 1,473,781 | |||||||||
EOG Resources, Inc. | 16,450 | 1,461,254 | |||||||||
Halliburton Co. | 56,841 | 1,299,954 | |||||||||
Kinder Morgan, Inc. | 123,364 | 1,956,553 | |||||||||
ONEOK, Inc. | 30,838 | 1,812,041 | |||||||||
Pioneer Natural Resources Co. | 8,759 | 1,593,087 | |||||||||
Schlumberger NV | 44,480 | 1,332,176 | |||||||||
Texas Pacific Land Corp. | 759 | 947,892 | |||||||||
The Williams Cos., Inc. | 88,650 | 2,308,446 | |||||||||
19,405,893 | |||||||||||
Financials (15.5%): | |||||||||||
Aflac, Inc. | 45,736 | 2,670,525 | |||||||||
Ally Financial, Inc. | 31,948 | 1,521,044 | |||||||||
American Express Co. | 12,231 | 2,000,992 | |||||||||
American Financial Group, Inc. | 11,015 | 1,512,580 | |||||||||
See notes to financial statements.
91
| Victory Portfolios II VictoryShares US 500 Enhanced Volatility Wtd ETF | Schedule of Portfolio Investments — continued December 31, 2021 | ||||||
(Unaudited)
Security Description | Shares | Value | |||||||||
American International Group, Inc. | 31,649 | $ | 1,799,562 | ||||||||
Ameriprise Financial, Inc. | 7,409 | 2,234,999 | |||||||||
Aon PLC, Class A | 7,781 | 2,338,657 | |||||||||
Apollo Global Management, Inc. (b) | 31,420 | 2,275,751 | |||||||||
Arch Capital Group Ltd. (a) | 56,435 | 2,508,536 | |||||||||
Ares Management Corp., Class A | 25,391 | 2,063,527 | |||||||||
Arthur J. Gallagher & Co. | 19,279 | 3,271,068 | |||||||||
Bank of America Corp. | 48,725 | 2,167,775 | |||||||||
Berkshire Hathaway, Inc., Class B (a) | 11,507 | 3,440,593 | |||||||||
BlackRock, Inc. | 2,438 | 2,232,135 | |||||||||
Blackstone, Inc. | 17,872 | 2,312,458 | |||||||||
Brown & Brown, Inc. | 46,497 | 3,267,809 | |||||||||
Capital One Financial Corp. | 10,257 | 1,488,188 | |||||||||
Cboe Global Markets, Inc. | 14,602 | 1,904,101 | |||||||||
Chubb Ltd. | 11,641 | 2,250,322 | |||||||||
Cincinnati Financial Corp. | 16,405 | 1,869,022 | |||||||||
Citigroup, Inc. | 26,321 | 1,589,525 | |||||||||
Citizens Financial Group, Inc. | 35,434 | 1,674,256 | |||||||||
CME Group, Inc. | 11,436 | 2,612,669 | |||||||||
CNA Financial Corp. | 52,141 | 2,298,375 | |||||||||
Discover Financial Services | 12,390 | 1,431,788 | |||||||||
East West Bancorp, Inc. | 20,626 | 1,622,854 | |||||||||
Everest Re Group Ltd. | 8,286 | 2,269,701 | |||||||||
FactSet Research Systems, Inc. | 6,128 | 2,978,269 | |||||||||
Fidelity National Financial, Inc. | 41,485 | 2,164,687 | |||||||||
Fifth Third Bancorp | 41,968 | 1,827,706 | |||||||||
First Republic Bank | 9,831 | 2,030,200 | |||||||||
Franklin Resources, Inc. | 46,392 | 1,553,668 | |||||||||
Huntington Bancshares, Inc. | 103,145 | 1,590,496 | |||||||||
Interactive Brokers Group, Inc. | 28,017 | 2,225,110 | |||||||||
Intercontinental Exchange, Inc. | 25,959 | 3,550,412 | |||||||||
Invesco Ltd. | 56,028 | 1,289,765 | |||||||||
JPMorgan Chase & Co. | 14,856 | 2,352,448 | |||||||||
KeyCorp | 78,284 | 1,810,709 | |||||||||
KKR & Co., Inc. | 34,433 | 2,565,258 | |||||||||
Lincoln National Corp. | 20,506 | 1,399,740 | |||||||||
Loews Corp. | 42,247 | 2,440,187 | |||||||||
LPL Financial Holdings, Inc. | 11,587 | 1,854,963 | |||||||||
M&T Bank Corp. | 11,846 | 1,819,309 | |||||||||
Markel Corp. (a) | 1,821 | 2,247,114 | |||||||||
MarketAxess Holdings, Inc. | 3,422 | 1,407,366 | |||||||||
Marsh & McLennan Cos., Inc. | 20,015 | 3,479,007 | |||||||||
MetLife, Inc. | 32,068 | 2,003,929 | |||||||||
Moody's Corp. | 7,382 | 2,883,262 | |||||||||
Morgan Stanley | 18,772 | 1,842,659 | |||||||||
Morningstar, Inc. | 7,788 | 2,663,418 | |||||||||
MSCI, Inc. | 3,408 | 2,088,047 | |||||||||
Nasdaq, Inc. | 14,444 | 3,033,384 | |||||||||
Northern Trust Corp. | 17,319 | 2,071,526 | |||||||||
Principal Financial Group, Inc. | 27,777 | 2,009,110 | |||||||||
See notes to financial statements.
92
| Victory Portfolios II VictoryShares US 500 Enhanced Volatility Wtd ETF | Schedule of Portfolio Investments — continued December 31, 2021 | ||||||
(Unaudited)
Security Description | Shares | Value | |||||||||
Prudential Financial, Inc. | 19,214 | $ | 2,079,723 | ||||||||
Raymond James Financial, Inc. | 22,992 | 2,308,397 | |||||||||
Regions Financial Corp. | 78,051 | 1,701,512 | |||||||||
S&P Global, Inc. | 5,859 | 2,765,038 | |||||||||
Signature Bank | 5,025 | 1,625,437 | |||||||||
State Street Corp. | 18,156 | 1,688,508 | |||||||||
SVB Financial Group (a) | 2,438 | 1,653,549 | |||||||||
Synchrony Financial | 30,641 | 1,421,436 | |||||||||
T. Rowe Price Group, Inc. | 10,070 | 1,980,165 | |||||||||
The Allstate Corp. | 19,751 | 2,323,705 | |||||||||
The Bank of New York Mellon Corp. | 36,373 | 2,112,544 | |||||||||
The Carlyle Group, Inc. | 41,781 | 2,293,777 | |||||||||
The Charles Schwab Corp. | 23,552 | 1,980,723 | |||||||||
The Goldman Sachs Group, Inc. | 4,885 | 1,868,757 | |||||||||
The Hartford Financial Services Group, Inc. | 23,643 | 1,632,313 | |||||||||
The PNC Financial Services Group, Inc. | 10,224 | 2,050,116 | |||||||||
The Progressive Corp. | 25,885 | 2,657,095 | |||||||||
The Travelers Cos., Inc. | 15,166 | 2,372,417 | |||||||||
Tradeweb Markets, Inc., Class A (b) | 25,541 | 2,557,676 | |||||||||
Truist Financial Corp. | 31,713 | 1,856,796 | |||||||||
U.S. Bancorp | 33,821 | 1,899,726 | |||||||||
UWM Holdings Corp. | 127,257 | 753,361 | |||||||||
W.R. Berkley Corp. | 34,217 | 2,819,139 | |||||||||
Wells Fargo & Co. | 33,170 | 1,591,497 | |||||||||
165,803,968 | |||||||||||
Health Care (13.9%): | |||||||||||
Abbott Laboratories | 19,095 | 2,687,430 | |||||||||
AbbVie, Inc. | 22,591 | 3,058,821 | |||||||||
ABIOMED, Inc. (a) | 4,301 | 1,544,790 | |||||||||
Agilent Technologies, Inc. | 15,802 | 2,522,789 | |||||||||
Align Technology, Inc. (a) | 1,909 | 1,254,557 | |||||||||
Amgen, Inc. | 11,245 | 2,529,788 | |||||||||
Anthem, Inc. | 6,014 | 2,787,730 | |||||||||
Avantor, Inc. (a) | 47,321 | 1,994,107 | |||||||||
Baxter International, Inc. | 40,259 | 3,455,833 | |||||||||
Becton Dickinson & Co. | 11,421 | 2,872,153 | |||||||||
Biogen, Inc. (a) | 2,891 | 693,609 | |||||||||
BioMarin Pharmaceutical, Inc. (a) | 22,493 | 1,987,256 | |||||||||
Bio-Rad Laboratories, Inc., Class A (a) | 2,568 | 1,940,304 | |||||||||
Bio-Techne Corp. | 3,105 | 1,606,341 | |||||||||
Boston Scientific Corp. (a) | 51,993 | 2,208,663 | |||||||||
Bruker Corp. | 24,012 | 2,014,847 | |||||||||
Cardinal Health, Inc. | 35,266 | 1,815,846 | |||||||||
Catalent, Inc. (a) | 13,871 | 1,775,904 | |||||||||
Centene Corp. (a) | 27,876 | 2,296,982 | |||||||||
Cerner Corp. | 41,505 | 3,854,569 | |||||||||
Charles River Laboratories International, Inc. (a) | 4,701 | 1,771,243 | |||||||||
Cigna Corp. | 9,351 | 2,147,270 | |||||||||
CVS Health Corp. | 28,840 | 2,975,134 | |||||||||
Danaher Corp. | 6,867 | 2,259,312 | |||||||||
See notes to financial statements.
93
| Victory Portfolios II VictoryShares US 500 Enhanced Volatility Wtd ETF | Schedule of Portfolio Investments — continued December 31, 2021 | ||||||
(Unaudited)
Security Description | Shares | Value | |||||||||
DaVita, Inc. (a) | 16,033 | $ | 1,823,914 | ||||||||
DENTSPLY SIRONA, Inc. | 29,411 | 1,640,840 | |||||||||
Dexcom, Inc. (a) | 2,766 | 1,485,204 | |||||||||
Edwards Lifesciences Corp. (a) | 20,317 | 2,632,067 | |||||||||
Eli Lilly & Co. | 6,289 | 1,737,148 | |||||||||
Gilead Sciences, Inc. (c) | 35,236 | 2,558,486 | |||||||||
HCA Healthcare, Inc. | 7,313 | 1,878,856 | |||||||||
Henry Schein, Inc. (a) | 26,017 | 2,017,098 | |||||||||
Hologic, Inc. (a) | 22,940 | 1,756,286 | |||||||||
Horizon Therapeutics PLC (a) | 11,335 | 1,221,460 | |||||||||
Humana, Inc. | 5,831 | 2,704,768 | |||||||||
IDEXX Laboratories, Inc. (a) | 2,912 | 1,917,435 | |||||||||
Illumina, Inc. (a) | 3,138 | 1,193,821 | |||||||||
Incyte Corp. (a) | 23,462 | 1,722,111 | |||||||||
Intuitive Surgical, Inc. (a) | 5,496 | 1,974,713 | |||||||||
IQVIA Holdings, Inc. (a) | 9,908 | 2,795,443 | |||||||||
Johnson & Johnson (c) | 20,398 | 3,489,486 | |||||||||
Laboratory Corp. of America Holdings (a) | 8,380 | 2,633,080 | |||||||||
Masimo Corp. (a) | 7,357 | 2,153,982 | |||||||||
Medtronic PLC | 20,899 | 2,162,002 | |||||||||
Merck & Co., Inc. | 39,415 | 3,020,766 | |||||||||
Mettler-Toledo International, Inc. (a) | 1,473 | 2,499,990 | |||||||||
Moderna, Inc. (a) | 1,817 | 461,482 | |||||||||
Molina Healthcare, Inc. (a) | 6,748 | 2,146,404 | |||||||||
PerkinElmer, Inc. | 9,700 | 1,950,282 | |||||||||
Pfizer, Inc. | 54,518 | 3,219,288 | |||||||||
Quest Diagnostics, Inc. | 16,893 | 2,922,658 | |||||||||
Regeneron Pharmaceuticals, Inc. (a) | 3,176 | 2,005,707 | |||||||||
Repligen Corp. (a) | 4,435 | 1,174,565 | |||||||||
ResMed, Inc. | 6,939 | 1,807,471 | |||||||||
Seagen, Inc. (a) | 8,437 | 1,304,360 | |||||||||
STERIS PLC | 11,528 | 2,806,030 | |||||||||
Stryker Corp. | 9,779 | 2,615,100 | |||||||||
Teleflex, Inc. | 5,044 | 1,656,853 | |||||||||
The Cooper Cos., Inc. | 5,368 | 2,248,870 | |||||||||
Thermo Fisher Scientific, Inc. | 3,899 | 2,601,569 | |||||||||
UnitedHealth Group, Inc. | 6,929 | 3,479,328 | |||||||||
Universal Health Services, Inc., Class B | 13,280 | 1,721,885 | |||||||||
Veeva Systems, Inc., Class A (a) | 4,563 | 1,165,755 | |||||||||
Vertex Pharmaceuticals, Inc. (a) | 10,177 | 2,234,869 | |||||||||
Waters Corp. (a) | 5,688 | 2,119,349 | |||||||||
West Pharmaceutical Services, Inc. | 5,382 | 2,524,212 | |||||||||
Zimmer Biomet Holdings, Inc. | 15,763 | 2,002,531 | |||||||||
Zoetis, Inc. | 12,667 | 3,091,128 | |||||||||
148,333,930 | |||||||||||
Industrials (16.7%): | |||||||||||
3M Co. | 14,604 | 2,594,109 | |||||||||
AGCO Corp. | 10,253 | 1,189,553 | |||||||||
Allegion PLC | 16,345 | 2,164,732 | |||||||||
AMERCO, Inc. | 2,931 | 2,128,580 | |||||||||
See notes to financial statements.
94
| Victory Portfolios II VictoryShares US 500 Enhanced Volatility Wtd ETF | Schedule of Portfolio Investments — continued December 31, 2021 | ||||||
(Unaudited)
Security Description | Shares | Value | |||||||||
AMETEK, Inc. | 20,160 | $ | 2,964,326 | ||||||||
AO Smith Corp. | 27,760 | 2,383,196 | |||||||||
Booz Allen Hamilton Holding Corp. | 27,538 | 2,334,947 | |||||||||
Builders FirstSource, Inc. (a) | 24,357 | 2,087,639 | |||||||||
C.H. Robinson Worldwide, Inc. | 25,308 | 2,723,900 | |||||||||
Carlisle Cos., Inc. | 11,491 | 2,851,147 | |||||||||
Carrier Global Corp. | 33,048 | 1,792,524 | |||||||||
Caterpillar, Inc. | 9,817 | 2,029,567 | |||||||||
Cintas Corp. | 5,407 | 2,396,220 | |||||||||
Copart, Inc. (a) | 15,240 | 2,310,689 | |||||||||
CoStar Group, Inc. (a)(c) | 21,813 | 1,723,881 | |||||||||
CSX Corp. | 71,906 | 2,703,666 | |||||||||
Cummins, Inc. | 9,350 | 2,039,609 | |||||||||
Deere & Co. | 4,749 | 1,628,385 | |||||||||
Dover Corp. | 14,969 | 2,718,370 | |||||||||
Eaton Corp. PLC | 14,684 | 2,537,689 | |||||||||
Emerson Electric Co. | 23,562 | 2,190,559 | |||||||||
Equifax, Inc. | 6,741 | 1,973,697 | |||||||||
Expeditors International of Washington, Inc. | 21,145 | 2,839,562 | |||||||||
Fastenal Co. | 46,855 | 3,001,531 | |||||||||
FedEx Corp. | 7,413 | 1,917,298 | |||||||||
Fortive Corp. | 32,283 | 2,462,870 | |||||||||
Fortune Brands Home & Security, Inc. | 19,823 | 2,119,079 | |||||||||
Generac Holdings, Inc. (a) | 2,598 | 914,288 | |||||||||
General Dynamics Corp. | 14,554 | 3,034,072 | |||||||||
Graco, Inc. | 32,813 | 2,645,384 | |||||||||
HEICO Corp. | 15,676 | 2,260,793 | |||||||||
Honeywell International, Inc. | 11,631 | 2,425,180 | |||||||||
Howmet Aerospace, Inc. | 49,162 | 1,564,826 | |||||||||
Hubbell, Inc. | 10,662 | 2,220,575 | |||||||||
IDEX Corp. | 12,106 | 2,860,890 | |||||||||
Illinois Tool Works, Inc. | 14,024 | 3,461,123 | |||||||||
Ingersoll Rand, Inc. (c) | 34,915 | 2,160,191 | |||||||||
J.B. Hunt Transport Services, Inc. | 11,561 | 2,363,068 | |||||||||
Jacobs Engineering Group, Inc. | 15,857 | 2,207,770 | |||||||||
Johnson Controls International PLC | 33,500 | 2,723,885 | |||||||||
L3Harris Technologies, Inc. | 11,606 | 2,474,863 | |||||||||
Leidos Holdings, Inc. | 20,155 | 1,791,780 | |||||||||
Lennox International, Inc. | 6,320 | 2,049,955 | |||||||||
Lockheed Martin Corp. | 8,573 | 3,046,930 | |||||||||
Masco Corp. | 39,133 | 2,747,919 | |||||||||
Nordson Corp. | 9,871 | 2,519,770 | |||||||||
Norfolk Southern Corp. | 9,167 | 2,729,108 | |||||||||
Northrop Grumman Corp. | 7,866 | 3,044,693 | |||||||||
Old Dominion Freight Line, Inc. | 7,465 | 2,675,307 | |||||||||
Otis Worldwide Corp. | 28,096 | 2,446,319 | |||||||||
PACCAR, Inc. | 25,319 | 2,234,655 | |||||||||
Parker-Hannifin Corp. | 6,995 | 2,225,249 | |||||||||
Quanta Services, Inc. | 16,993 | 1,948,417 | |||||||||
Raytheon Technologies Corp. | 26,150 | 2,250,469 | |||||||||
See notes to financial statements.
95
| Victory Portfolios II VictoryShares US 500 Enhanced Volatility Wtd ETF | Schedule of Portfolio Investments — continued December 31, 2021 | ||||||
(Unaudited)
Security Description | Shares | Value | |||||||||
Republic Services, Inc. (c) | 25,918 | $ | 3,614,265 | ||||||||
Robert Half International, Inc. | 20,725 | 2,311,252 | |||||||||
Rockwell Automation, Inc. | 7,350 | 2,564,048 | |||||||||
Rollins, Inc. | 53,325 | 1,824,248 | |||||||||
Roper Technologies, Inc. | 5,644 | 2,776,058 | |||||||||
Snap-on, Inc. | 9,166 | 1,974,173 | |||||||||
Stanley Black & Decker, Inc. | 12,199 | 2,300,975 | |||||||||
Textron, Inc. | 23,983 | 1,851,488 | |||||||||
The Toro Co. | 22,942 | 2,292,135 | |||||||||
Trane Technologies PLC | 11,323 | 2,287,586 | |||||||||
TransDigm Group, Inc. (a) | 3,022 | 1,922,838 | |||||||||
TransUnion | 17,934 | 2,126,614 | |||||||||
Trex Co., Inc. (a) | 13,746 | 1,856,122 | |||||||||
Union Pacific Corp. | 11,523 | 2,902,989 | |||||||||
United Parcel Service, Inc., Class B | 10,833 | 2,321,945 | |||||||||
United Rentals, Inc. (a) | 4,044 | 1,343,781 | |||||||||
Verisk Analytics, Inc. | 10,942 | 2,502,764 | |||||||||
W.W. Grainger, Inc. | 5,489 | 2,844,619 | |||||||||
Waste Management, Inc. | 21,662 | 3,615,388 | |||||||||
Watsco, Inc. | 7,592 | 2,375,385 | |||||||||
Westinghouse Air Brake Technologies Corp. | 20,739 | 1,910,269 | |||||||||
Xylem, Inc. | 18,341 | 2,199,453 | |||||||||
178,553,199 | |||||||||||
Information Technology (15.3%): | |||||||||||
Accenture PLC, Class A | 8,198 | 3,398,481 | |||||||||
Adobe, Inc. (a) | 3,294 | 1,867,896 | |||||||||
Advanced Micro Devices, Inc. (a) | 12,111 | 1,742,773 | |||||||||
Akamai Technologies, Inc. (a) | 17,485 | 2,046,444 | |||||||||
Amphenol Corp., Class A | 33,597 | 2,938,394 | |||||||||
Analog Devices, Inc. | 11,472 | 2,016,433 | |||||||||
ANSYS, Inc. (a) | 4,414 | 1,770,544 | |||||||||
Apple, Inc. | 13,073 | 2,321,373 | |||||||||
Applied Materials, Inc. | 8,613 | 1,355,342 | |||||||||
Arista Networks, Inc. (a) | 22,699 | 3,262,981 | |||||||||
Autodesk, Inc. (a) | 5,471 | 1,538,390 | |||||||||
Automatic Data Processing, Inc. | 12,991 | 3,203,321 | |||||||||
Black Knight, Inc. (a) | 31,388 | 2,601,751 | |||||||||
Block, Inc. (a) | 3,745 | 604,855 | |||||||||
Broadcom, Inc. | 3,658 | 2,434,070 | |||||||||
Broadridge Financial Solutions, Inc. | 15,626 | 2,856,745 | |||||||||
Cadence Design Systems, Inc. (a) | 9,872 | 1,839,647 | |||||||||
CDW Corp. | 11,264 | 2,306,642 | |||||||||
Cisco Systems, Inc. | 49,952 | 3,165,458 | |||||||||
Citrix Systems, Inc. | 16,625 | 1,572,559 | |||||||||
Cognex Corp. | 20,676 | 1,607,766 | |||||||||
Cognizant Technology Solutions Corp., Class A | 29,182 | 2,589,027 | |||||||||
Corning, Inc. | 49,962 | 1,860,085 | |||||||||
Dell Technologies, Inc., Class C (a) | 40,725 | 2,287,523 | |||||||||
Dynatrace, Inc. (a) | 17,048 | 1,028,847 | |||||||||
Enphase Energy, Inc. (a) | 4,426 | 809,692 | |||||||||
See notes to financial statements.
96
| Victory Portfolios II VictoryShares US 500 Enhanced Volatility Wtd ETF | Schedule of Portfolio Investments — continued December 31, 2021 | ||||||
(Unaudited)
Security Description | Shares | Value | |||||||||
Entegris, Inc. | 11,047 | $ | 1,530,893 | ||||||||
EPAM Systems, Inc. (a) | 2,976 | 1,989,307 | |||||||||
F5, Inc. (a) | 9,694 | 2,372,219 | |||||||||
Fair Isaac Corp. (a) | 3,757 | 1,629,298 | |||||||||
Fidelity National Information Services, Inc. | 15,898 | 1,735,267 | |||||||||
Fiserv, Inc. (a)(b) | 20,576 | 2,135,583 | |||||||||
FleetCor Technologies, Inc. (a) | 8,069 | 1,806,165 | |||||||||
Fortinet, Inc. (a) | 5,318 | 1,911,289 | |||||||||
Gartner, Inc. (a) | 5,513 | 1,843,106 | |||||||||
Global Payments, Inc. | 11,557 | 1,562,275 | |||||||||
GoDaddy, Inc., Class A (a) | 22,158 | 1,880,328 | |||||||||
Hewlett Packard Enterprise Co. | 124,666 | 1,965,983 | |||||||||
HP, Inc. | 61,532 | 2,317,910 | |||||||||
Intel Corp. | 29,065 | 1,496,847 | |||||||||
International Business Machines Corp. | 16,478 | 2,202,449 | |||||||||
Intuit, Inc. | 3,601 | 2,316,235 | |||||||||
Jack Henry & Associates, Inc. | 13,413 | 2,239,837 | |||||||||
Keysight Technologies, Inc. (a) | 12,970 | 2,678,435 | |||||||||
KLA Corp. | 3,610 | 1,552,697 | |||||||||
Kyndryl Holdings, Inc. (a) | 3,295 | 59,640 | |||||||||
Lam Research Corp. | 1,925 | 1,384,364 | |||||||||
Mastercard, Inc., Class A | 5,986 | 2,150,890 | |||||||||
Microchip Technology, Inc. | 17,578 | 1,530,341 | |||||||||
Micron Technology, Inc. | 17,331 | 1,614,383 | |||||||||
Microsoft Corp. (c) | 8,578 | 2,884,953 | |||||||||
Monolithic Power Systems, Inc. | 2,543 | 1,254,538 | |||||||||
Motorola Solutions, Inc. | 11,147 | 3,028,640 | |||||||||
NetApp, Inc. | 18,756 | 1,725,364 | |||||||||
NortonLifeLock, Inc. | 65,951 | 1,713,407 | |||||||||
NVIDIA Corp. | 5,825 | 1,713,191 | |||||||||
NXP Semiconductors NV | 6,256 | 1,424,992 | |||||||||
ON Semiconductor Corp. (a) | 26,687 | 1,812,581 | |||||||||
Oracle Corp. | 24,302 | 2,119,377 | |||||||||
Paychex, Inc. | 24,635 | 3,362,677 | |||||||||
Paycom Software, Inc. (a) | 2,743 | 1,138,866 | |||||||||
Paylocity Holding Corp. (a) | 4,895 | 1,156,003 | |||||||||
PayPal Holdings, Inc. (a) | 5,091 | 960,061 | |||||||||
PTC, Inc. (a) | 9,972 | 1,208,108 | |||||||||
Qorvo, Inc. (a) | 7,463 | 1,167,139 | |||||||||
QUALCOMM, Inc. | 11,344 | 2,074,477 | |||||||||
salesforce.com, Inc. (a) | 8,096 | 2,057,436 | |||||||||
Seagate Technology Holdings PLC | 14,915 | 1,685,097 | |||||||||
ServiceNow, Inc. (a)(c) | 2,387 | 1,549,426 | |||||||||
Skyworks Solutions, Inc. | 7,373 | 1,143,847 | |||||||||
SS&C Technologies Holdings, Inc. | 32,773 | 2,686,731 | |||||||||
Synopsys, Inc. (a) | 5,146 | 1,896,301 | |||||||||
TE Connectivity Ltd. | 14,667 | 2,366,374 | |||||||||
Teledyne Technologies, Inc. (a) | 4,242 | 1,853,287 | |||||||||
Teradyne, Inc. | 9,741 | 1,592,946 | |||||||||
Texas Instruments, Inc. | 9,817 | 1,850,210 | |||||||||
See notes to financial statements.
97
| Victory Portfolios II VictoryShares US 500 Enhanced Volatility Wtd ETF | Schedule of Portfolio Investments — continued December 31, 2021 | ||||||
(Unaudited)
Security Description | Shares | Value | |||||||||
The Trade Desk, Inc., Class A (a) | 10,043 | $ | 920,341 | ||||||||
Trimble, Inc. (a) | 19,398 | 1,691,312 | |||||||||
Tyler Technologies, Inc. (a) | 3,775 | 2,030,761 | |||||||||
Ubiquiti, Inc. | 3,477 | 1,066,396 | |||||||||
VeriSign, Inc. (a) | 12,410 | 3,149,906 | |||||||||
Visa, Inc., Class A | 10,836 | 2,348,270 | |||||||||
VMware, Inc., Class A | 16,348 | 1,894,406 | |||||||||
Western Digital Corp. (a) | 17,772 | 1,158,912 | |||||||||
Zebra Technologies Corp. (a) | 3,347 | 1,992,134 | |||||||||
Zoom Video Communications, Inc., Class A (a) | 3,433 | 631,363 | |||||||||
163,242,610 | |||||||||||
Materials (5.3%): | |||||||||||
Air Products & Chemicals, Inc. | 8,844 | 2,690,875 | |||||||||
Albemarle Corp. | 4,797 | 1,121,395 | |||||||||
Avery Dennison Corp. | 9,745 | 2,110,475 | |||||||||
Ball Corp. | 23,888 | 2,299,698 | |||||||||
Celanese Corp. | 12,774 | 2,146,798 | |||||||||
Cleveland-Cliffs, Inc. (a) | 32,044 | 697,598 | |||||||||
Corteva, Inc. | 43,482 | 2,055,829 | |||||||||
Crown Holdings, Inc. | 18,905 | 2,091,271 | |||||||||
Dow, Inc. | 27,874 | 1,581,013 | |||||||||
DuPont de Nemours, Inc. | 24,085 | 1,945,586 | |||||||||
Eastman Chemical Co. | 16,924 | 2,046,281 | |||||||||
Ecolab, Inc. | 11,577 | 2,715,848 | |||||||||
FMC Corp. | 21,015 | 2,309,338 | |||||||||
Freeport-McMoRan, Inc. | 27,248 | 1,137,059 | |||||||||
International Flavors & Fragrances, Inc. | 11,173 | 1,683,212 | |||||||||
International Paper Co. | 35,276 | 1,657,267 | |||||||||
LyondellBasell Industries NV, Class A | 16,783 | 1,547,896 | |||||||||
Martin Marietta Materials, Inc. | 4,926 | 2,170,002 | |||||||||
Newmont Corp. | 32,778 | 2,032,892 | |||||||||
Nucor Corp. | 11,089 | 1,265,809 | |||||||||
Packaging Corp. of America | 16,790 | 2,285,959 | |||||||||
Pegasystems, Inc. | 11,798 | 1,319,252 | |||||||||
PPG Industries, Inc. | 13,838 | 2,386,225 | |||||||||
RPM International, Inc. | 31,913 | 3,223,213 | |||||||||
Steel Dynamics, Inc. | 19,296 | 1,197,703 | |||||||||
Sylvamo Corp. (a) | 3,208 | 89,471 | |||||||||
The Mosaic Co. | 37,455 | 1,471,607 | |||||||||
The Sherwin-Williams Co. | 9,690 | 3,412,430 | |||||||||
Vulcan Materials Co. | 10,515 | 2,182,704 | |||||||||
Westlake Chemical Corp. | 18,279 | 1,775,439 | |||||||||
56,650,145 | |||||||||||
Real Estate (0.4%): | |||||||||||
CBRE Group, Inc., Class A (a) | 20,219 | 2,193,964 | |||||||||
Jones Lang LaSalle, Inc. (a) | 7,029 | 1,893,191 | |||||||||
4,087,155 | |||||||||||
Utilities (7.3%): | |||||||||||
Alliant Energy Corp. | 46,532 | 2,860,322 | |||||||||
Ameren Corp. | 33,289 | 2,963,054 | |||||||||
See notes to financial statements.
98
| Victory Portfolios II VictoryShares US 500 Enhanced Volatility Wtd ETF | Schedule of Portfolio Investments — continued December 31, 2021 | ||||||
(Unaudited)
Security Description | Shares | Value | |||||||||
American Electric Power Co., Inc. (c) | 34,303 | $ | 3,051,938 | ||||||||
American Water Works Co., Inc. | 13,596 | 2,567,741 | |||||||||
Atmos Energy Corp. | 26,704 | 2,797,778 | |||||||||
Avangrid, Inc. (b) | 51,179 | 2,552,809 | |||||||||
CenterPoint Energy, Inc. | 89,827 | 2,507,072 | |||||||||
CMS Energy Corp. | 45,107 | 2,934,210 | |||||||||
Consolidated Edison, Inc. (c) | 41,204 | 3,515,525 | |||||||||
Dominion Energy, Inc. | 38,679 | 3,038,622 | |||||||||
DTE Energy Co. | 24,948 | 2,982,284 | |||||||||
Duke Energy Corp. (c) | 30,689 | 3,219,276 | |||||||||
Edison International | 42,274 | 2,885,200 | |||||||||
Entergy Corp. | 23,268 | 2,621,140 | |||||||||
Essential Utilities, Inc. | 50,491 | 2,710,862 | |||||||||
Evergy, Inc. (c) | 40,515 | 2,779,734 | |||||||||
Eversource Energy (c) | 28,046 | 2,551,625 | |||||||||
Exelon Corp. | 55,521 | 3,206,893 | |||||||||
FirstEnergy Corp. | 65,595 | 2,728,096 | |||||||||
NextEra Energy, Inc. (c) | 27,040 | 2,524,454 | |||||||||
NRG Energy, Inc. | 28,388 | 1,222,955 | |||||||||
PG&E Corp. (a) | 172,417 | 2,093,142 | |||||||||
PPL Corp. | 98,398 | 2,957,844 | |||||||||
Public Service Enterprise Group, Inc. | 42,324 | 2,824,281 | |||||||||
Sempra Energy | 19,918 | 2,634,753 | |||||||||
The Southern Co. (c) | 47,807 | 3,278,604 | |||||||||
WEC Energy Group, Inc. (c) | 28,613 | 2,777,464 | |||||||||
Xcel Energy, Inc. (c) | 40,664 | 2,752,953 | |||||||||
77,540,631 | |||||||||||
Total Common Stocks (Cost $808,694,654) | 1,064,240,537 | ||||||||||
Investment Companies (0.3%) | |||||||||||
BlackRock Liquidity Funds T-Fund, Institutional Shares, 0.01% (d) | 2,825,925 | 2,825,925 | |||||||||
Total Investment Companies (Cost $2,825,925) | 2,825,925 | ||||||||||
Collateral for Securities Loaned^ (1.1%) | |||||||||||
BlackRock Liquidity Funds TempFund, Institutional Shares, 0.04% (d) | 286,918 | 286,918 | |||||||||
| Fidelity Investments Money Market Government Portfolio, Institutional Shares, 0.01% (d) | 5,635,114 | 5,635,114 | |||||||||
| Goldman Sachs Financial Square Prime Obligations Fund, Institutional Shares, 0.02% (d) | 143,186 | 143,186 | |||||||||
JPMorgan Prime Money Market Fund, Capital Shares, 0.07% (d) | 1,141,724 | 1,141,724 | |||||||||
| Morgan Stanley Institutional Liquidity Prime Portfolio, Institutional Shares, 0.06% (d) | 5,133,414 | 5,133,414 | |||||||||
Total Collateral for Securities Loaned (Cost $12,150,265) | 12,340,356 | ||||||||||
Total Investments (Cost $823,670,844) — 101.0% | 1,079,406,818 | ||||||||||
Liabilities in excess of other assets — (1.0)% | (11,186,363 | ) | |||||||||
NET ASSETS — 100.00% | $ | 1,068,220,455 | |||||||||
See notes to financial statements.
99
| Victory Portfolios II VictoryShares US 500 Enhanced Volatility Wtd ETF | Schedule of Portfolio Investments — continued December 31, 2021 | ||||||
(Unaudited)
^ Purchased with cash collateral from securities on loan.
(a) Non-income producing security.
(b) All or a portion of this security is on loan.
(c) All or a portion of this security has been segregated as collateral for derivative instruments.
(d) Rate disclosed is the daily yield on December 31, 2021.
PLC — Public Limited Company
Futures Contracts Purchased
| Number of Contracts | Expiration Date | Notional Amount | Value | Unrealized Appreciation (Depreciation) | |||||||||||||||||||
E-Mini S&P 500 Futures | 14 | 3/18/22 | $ | 3,283,582 | $ | 3,330,950 | $ | 47,368 | |||||||||||||||
Total unrealized appreciation | $ | 47,368 | |||||||||||||||||||||
Total unrealized depreciation | — | ||||||||||||||||||||||
Total net unrealized appreciation (depreciation) | $ | 47,368 | |||||||||||||||||||||
See notes to financial statements.
100
| Victory Portfolios II VictoryShares US EQ Income Enhanced Volatility Wtd ETF | Schedule of Portfolio Investments December 31, 2021 | ||||||
(Unaudited)
Security Description | Shares | Value | |||||||||
Common Stocks (99.4%) | |||||||||||
Communication Services (3.0%): | |||||||||||
Omnicom Group, Inc. | 128,574 | $ | 9,420,617 | ||||||||
The Interpublic Group of Cos., Inc. | 218,029 | 8,165,186 | |||||||||
Verizon Communications, Inc. | 310,705 | 16,144,232 | |||||||||
33,730,035 | |||||||||||
Consumer Discretionary (4.2%): | |||||||||||
Genuine Parts Co. | 86,598 | 12,141,039 | |||||||||
Hasbro, Inc. | 98,156 | 9,990,318 | |||||||||
Newell Brands, Inc. | 330,723 | 7,222,990 | |||||||||
VF Corp. | 106,499 | 7,797,857 | |||||||||
Whirlpool Corp. | 37,726 | 8,852,783 | |||||||||
46,004,987 | |||||||||||
Consumer Staples (19.2%): | |||||||||||
Altria Group, Inc. | 226,849 | 10,750,374 | |||||||||
Archer-Daniels-Midland Co. | 197,834 | 13,371,600 | |||||||||
Bunge Ltd. | 113,777 | 10,622,221 | |||||||||
Campbell Soup Co. (a) | 254,271 | 11,050,618 | |||||||||
Conagra Brands, Inc. | 355,632 | 12,144,833 | |||||||||
Costco Wholesale Corp. | 32,798 | 18,619,425 | |||||||||
General Mills, Inc. | 223,996 | 15,092,850 | |||||||||
Kellogg Co. | 198,880 | 12,811,850 | |||||||||
Kimberly-Clark Corp. | 108,540 | 15,512,537 | |||||||||
PepsiCo, Inc. | 106,947 | 18,577,763 | |||||||||
Philip Morris International, Inc. | 143,056 | 13,590,320 | |||||||||
The Clorox Co. | 59,010 | 10,288,984 | |||||||||
The Coca-Cola Co. | 290,107 | 17,177,235 | |||||||||
The J.M. Smucker Co. (a) | 91,771 | 12,464,337 | |||||||||
The Kraft Heinz Co. | 311,398 | 11,179,188 | |||||||||
Walgreens Boots Alliance, Inc. | 174,318 | 9,092,427 | |||||||||
212,346,562 | |||||||||||
Energy (5.0%): | |||||||||||
Chevron Corp. | 95,904 | 11,254,334 | |||||||||
ConocoPhillips | 118,640 | 8,563,435 | |||||||||
Devon Energy Corp. | 156,206 | 6,880,874 | |||||||||
Kinder Morgan, Inc. | 576,003 | 9,135,408 | |||||||||
ONEOK, Inc. | 144,003 | 8,461,616 | |||||||||
The Williams Cos., Inc. | 413,961 | 10,779,545 | |||||||||
55,075,212 | |||||||||||
Financials (20.4%): | |||||||||||
American Financial Group, Inc. | 51,439 | 7,063,603 | |||||||||
American International Group, Inc. | 147,796 | 8,403,681 | |||||||||
Apollo Global Management, Inc. (a) | 146,708 | 10,626,060 | |||||||||
Blackstone, Inc. | 83,437 | 10,795,913 | |||||||||
Citigroup, Inc. | 122,881 | 7,420,784 | |||||||||
Citizens Financial Group, Inc. | 165,442 | 7,817,134 | |||||||||
CME Group, Inc. | 53,389 | 12,197,251 | |||||||||
See notes to financial statements.
101
| Victory Portfolios II VictoryShares US EQ Income Enhanced Volatility Wtd ETF | Schedule of Portfolio Investments — continued December 31, 2021 | ||||||
(Unaudited)
Security Description | Shares | Value | |||||||||
CNA Financial Corp. | 243,469 | $ | 10,732,114 | ||||||||
Everest Re Group Ltd. | 38,705 | 10,602,074 | |||||||||
Fidelity National Financial, Inc. | 193,701 | 10,107,318 | |||||||||
Fifth Third Bancorp | 195,942 | 8,533,274 | |||||||||
Franklin Resources, Inc. | 216,604 | 7,254,068 | |||||||||
Huntington Bancshares, Inc. | 481,638 | 7,426,858 | |||||||||
Invesco Ltd. | 261,615 | 6,022,377 | |||||||||
KeyCorp | 365,512 | 8,454,293 | |||||||||
Lincoln National Corp. | 95,734 | 6,534,803 | |||||||||
M&T Bank Corp. (a) | 55,316 | 8,495,431 | |||||||||
MetLife, Inc. | 149,729 | 9,356,565 | |||||||||
Northern Trust Corp. | 80,859 | 9,671,545 | |||||||||
Principal Financial Group, Inc. | 129,706 | 9,381,635 | |||||||||
Prudential Financial, Inc. | 89,711 | 9,710,319 | |||||||||
Regions Financial Corp. | 364,440 | 7,944,792 | |||||||||
The PNC Financial Services Group, Inc. | 47,740 | 9,572,825 | |||||||||
Truist Financial Corp. | 148,100 | 8,671,255 | |||||||||
U.S. Bancorp | 157,932 | 8,871,040 | |||||||||
UWM Holdings Corp. (a) | 594,224 | 3,517,806 | |||||||||
225,184,818 | |||||||||||
Health Care (8.3%): | |||||||||||
AbbVie, Inc. | 105,498 | 14,284,429 | |||||||||
Amgen, Inc. | 52,502 | 11,811,375 | |||||||||
Cardinal Health, Inc. | 164,682 | 8,479,476 | |||||||||
Gilead Sciences, Inc. (b) | 164,522 | 11,945,943 | |||||||||
Johnson & Johnson (b) | 95,262 | 16,296,470 | |||||||||
Merck & Co., Inc. | 184,060 | 14,106,359 | |||||||||
Pfizer, Inc. | 254,585 | 15,033,244 | |||||||||
91,957,296 | |||||||||||
Industrials (3.4%): | |||||||||||
3M Co. | 68,181 | 12,110,991 | |||||||||
Lockheed Martin Corp. | 40,039 | 14,230,261 | |||||||||
Watsco, Inc. | 35,424 | 11,083,461 | |||||||||
37,424,713 | |||||||||||
Information Technology (7.2%): | |||||||||||
Broadcom, Inc. | 17,097 | 11,376,515 | |||||||||
Cisco Systems, Inc. | 233,217 | 14,778,961 | |||||||||
Corning, Inc. | 233,292 | 8,685,461 | |||||||||
Hewlett Packard Enterprise Co. | 582,143 | 9,180,395 | |||||||||
HP, Inc. | 287,290 | 10,822,214 | |||||||||
Intel Corp. | 135,713 | 6,989,220 | |||||||||
International Business Machines Corp. | 76,939 | 10,283,667 | |||||||||
Kyndryl Holdings, Inc. (c) | 15,379 | 278,360 | |||||||||
Seagate Technology Holdings PLC | 69,650 | 7,869,057 | |||||||||
80,263,850 | |||||||||||
Materials (4.7%): | |||||||||||
Dow, Inc. | 130,155 | 7,382,392 | |||||||||
Eastman Chemical Co. | 78,995 | 9,551,285 | |||||||||
See notes to financial statements.
102
| Victory Portfolios II VictoryShares US EQ Income Enhanced Volatility Wtd ETF | Schedule of Portfolio Investments — continued December 31, 2021 | ||||||
(Unaudited)
Security Description | Shares | Value | |||||||||
International Paper Co. | 164,724 | $ | 7,738,734 | ||||||||
LyondellBasell Industries NV, Class A | 78,353 | 7,226,497 | |||||||||
Newmont Corp. | 153,048 | 9,492,037 | |||||||||
Packaging Corp. of America | 78,414 | 10,676,066 | |||||||||
Sylvamo Corp. (c) | 14,972 | 417,569 | |||||||||
52,484,580 | |||||||||||
Utilities (24.0%): | |||||||||||
Alliant Energy Corp. | 217,271 | 13,355,648 | |||||||||
American Electric Power Co., Inc. (b) | 160,173 | 14,250,592 | |||||||||
Avangrid, Inc. (a) | 238,997 | 11,921,170 | |||||||||
CMS Energy Corp. | 210,611 | 13,700,246 | |||||||||
Consolidated Edison, Inc. (b) | 192,391 | 16,414,800 | |||||||||
Dominion Energy, Inc. | 180,599 | 14,187,857 | |||||||||
DTE Energy Co. | 116,473 | 13,923,182 | |||||||||
Duke Energy Corp. (b) | 143,295 | 15,031,646 | |||||||||
Edison International | 197,389 | 13,471,799 | |||||||||
Entergy Corp. | 108,644 | 12,238,747 | |||||||||
Evergy, Inc. (b) | 189,190 | 12,980,326 | |||||||||
Exelon Corp. | 259,235 | 14,973,414 | |||||||||
FirstEnergy Corp. | 306,271 | 12,737,811 | |||||||||
NRG Energy, Inc. | 132,563 | 5,710,814 | |||||||||
PPL Corp. | 459,453 | 13,811,157 | |||||||||
Public Service Enterprise Group, Inc. | 197,608 | 13,186,382 | |||||||||
Sempra Energy | 93,032 | 12,306,273 | |||||||||
The Southern Co. (b) | 223,224 | 15,308,702 | |||||||||
WEC Energy Group, Inc. (b) | 133,600 | 12,968,552 | |||||||||
Xcel Energy, Inc. (b) | 189,867 | 12,853,996 | |||||||||
265,333,114 | |||||||||||
Total Common Stocks (Cost $952,565,563) | 1,099,805,167 | ||||||||||
Investment Companies (0.3%) | |||||||||||
BlackRock Liquidity Funds T-Fund, Institutional Shares, 0.01% (d) | 2,805,385 | 2,805,385 | |||||||||
Total Investment Companies (Cost $2,805,385) | 2,805,385 | ||||||||||
Collateral for Securities Loaned^ (1.9%) | |||||||||||
BlackRock Liquidity Funds TempFund, Institutional Shares, 0.04% (d) | 478,629 | 478,629 | |||||||||
| Fidelity Investments Money Market Government Portfolio, Institutional Shares, 0.01% (d) | 9,400,333 | 9,400,333 | |||||||||
| Goldman Sachs Financial Square Prime Obligations Fund, Institutional Shares, 0.02% (d) | 238,859 | 238,859 | |||||||||
JPMorgan Prime Money Market Fund, Capital Shares, 0.07% (d) | 1,904,591 | 1,904,591 | |||||||||
| Morgan Stanley Institutional Liquidity Prime Portfolio, Institutional Shares, 0.06% (d) | 8,563,413 | 8,563,413 | |||||||||
Total Collateral for Securities Loaned (Cost $20,585,825) | 20,585,825 | ||||||||||
Total Investments (Cost $975,956,773) — 101.6% | 1,123,196,377 | ||||||||||
Liabilities in excess of other assets — (1.6)% | (17,582,977 | ) | |||||||||
NET ASSETS — 100.00% | $ | 1,105,613,400 | |||||||||
See notes to financial statements.
103
| Victory Portfolios II VictoryShares US EQ Income Enhanced Volatility Wtd ETF | Schedule of Portfolio Investments — continued December 31, 2021 | ||||||
(Unaudited)
^ Purchased with cash collateral from securities on loan.
(a) All or a portion of this security is on loan.
(b) All or a portion of this security has been segregated as collateral for derivative instruments.
(c) Non-income producing security.
(d) Rate disclosed is the daily yield on December 31, 2021.
PLC — Public Limited Company
Futures Contracts Purchased
| Number of Contracts | Expiration Date | Notional Amount | Value | Unrealized Appreciation (Depreciation) | |||||||||||||||||||
E-Mini S&P 500 Futures | 15 | 3/18/22 | $ | 3,509,661 | $ | 3,568,875 | $ | 59,214 | |||||||||||||||
Total unrealized appreciation | $ | 59,214 | |||||||||||||||||||||
Total unrealized depreciation | — | ||||||||||||||||||||||
Total net unrealized appreciation (depreciation) | $ | 59,214 | |||||||||||||||||||||
See notes to financial statements.
104
| Victory Portfolios II VictoryShares US Discovery Enhanced Volatility Wtd ETF | Schedule of Portfolio Investments December 31, 2021 | ||||||
(Unaudited)
Security Description | Shares | Value | |||||||||
Common Stocks (99.6%) | |||||||||||
Banks (15.5%): | |||||||||||
1st Source Corp. | 3,693 | $ | 183,173 | ||||||||
Amerant Bancorp, Inc. | 4,497 | 155,371 | |||||||||
Atlantic Union Bankshares Corp. | 4,095 | 152,703 | |||||||||
Banc of California, Inc. | 8,458 | 165,946 | |||||||||
BancFirst Corp. | 2,802 | 197,709 | |||||||||
Banner Corp. | 2,574 | 156,165 | |||||||||
Berkshire Hills Bancorp, Inc. | 4,833 | 137,402 | |||||||||
Brookline Bancorp, Inc. | 11,897 | 192,612 | |||||||||
Byline Bancorp, Inc. | 6,538 | 178,814 | |||||||||
City Holding Co. | 2,764 | 226,068 | |||||||||
Columbia Banking System, Inc. | 4,132 | 135,199 | |||||||||
ConnectOne Bancorp, Inc. | 5,201 | 170,125 | |||||||||
Customers Bancorp, Inc. | 2,862 | 187,089 | |||||||||
CVB Financial Corp. | 8,637 | 184,918 | |||||||||
Dime Community Bancshares, Inc. | 4,277 | 150,379 | |||||||||
Eagle Bancorp, Inc. | 2,788 | 162,652 | |||||||||
Enterprise Financial Services Corp. | 3,560 | 167,640 | |||||||||
FB Financial Corp. | 3,950 | 173,089 | |||||||||
First BanCorp/Puerto Rico | 10,935 | 150,684 | |||||||||
First Bancorp/Southern Pines NC | 3,670 | 167,792 | |||||||||
First Busey Corp. | 7,210 | 195,535 | |||||||||
First Commonwealth Financial Corp. | 11,826 | 190,280 | |||||||||
First Financial Bancorp | 6,069 | 147,962 | |||||||||
First Foundation, Inc. | 6,799 | 169,023 | |||||||||
First Interstate BancSystem, Inc., Class A | 4,020 | 163,493 | |||||||||
First Merchants Corp. | 3,791 | 158,805 | |||||||||
Fulton Financial Corp. | 10,163 | 172,771 | |||||||||
German American Bancorp, Inc. | 4,724 | 184,142 | |||||||||
Great Western Bancorp, Inc. | 4,336 | 147,251 | |||||||||
Heartland Financial USA, Inc. | 3,714 | 187,966 | |||||||||
Heritage Financial Corp. | 6,428 | 157,100 | |||||||||
Hilltop Holdings, Inc. | 4,149 | 145,796 | |||||||||
Hope Bancorp, Inc. | 10,594 | 155,838 | |||||||||
Independent Bank Corp. | 2,247 | 183,198 | |||||||||
International Bancshares Corp. | 3,581 | 151,799 | |||||||||
Lakeland Bancorp, Inc. | 9,766 | 185,456 | |||||||||
Lakeland Financial Corp. | 2,511 | 201,232 | |||||||||
Live Oak Bancshares, Inc. | 1,645 | 143,592 | |||||||||
National Bank Holdings Corp., Class A | 4,676 | 205,463 | |||||||||
NBT Bancorp, Inc. | 4,880 | 187,978 | |||||||||
OFG Bancorp | 5,154 | 136,890 | |||||||||
Old National Bancorp | 11,654 | 211,170 | |||||||||
Origin Bancorp, Inc. | 3,581 | 153,697 | |||||||||
Park National Corp. | 1,445 | 198,413 | |||||||||
Preferred Bank | 2,658 | 190,818 | |||||||||
Renasant Corp. | 4,634 | 175,860 | |||||||||
Republic Bancorp, Inc., Class A | 3,742 | 190,243 | |||||||||
S&T Bancorp, Inc. | 5,053 | 159,271 | |||||||||
See notes to financial statements.
105
| Victory Portfolios II VictoryShares US Discovery Enhanced Volatility Wtd ETF | Schedule of Portfolio Investments — continued December 31, 2021 | ||||||
(Unaudited)
Security Description | Shares | Value | |||||||||
Sandy Spring Bancorp, Inc. | 3,602 | $ | 173,184 | ||||||||
Seacoast Banking Corp. of Florida | 4,530 | 160,317 | |||||||||
Silvergate Capital Corp., Class A (a) | 423 | 62,689 | |||||||||
Southside Bancshares, Inc. (b) | 4,842 | 202,492 | |||||||||
Stock Yards Bancorp, Inc. | 3,754 | 239,806 | |||||||||
The Bancorp, Inc. (a) | 4,394 | 111,212 | |||||||||
Tompkins Financial Corp. (c) | 1,982 | 165,656 | |||||||||
Towne Bank | 5,352 | 169,070 | |||||||||
TriCo Bancshares | 4,039 | 173,515 | |||||||||
Triumph Bancorp, Inc. (a) | 1,462 | 174,095 | |||||||||
Trustmark Corp. | 5,072 | 164,637 | |||||||||
United Community Banks, Inc. | 5,295 | 190,302 | |||||||||
Veritex Holdings, Inc. | 4,302 | 171,134 | |||||||||
Washington Trust Bancorp, Inc. | 3,190 | 179,820 | |||||||||
WesBanco, Inc. | 4,529 | 158,470 | |||||||||
Westamerica Bancorp | 3,707 | 214,005 | |||||||||
10,956,976 | |||||||||||
Capital Markets (2.3%): | |||||||||||
B Riley Financial, Inc. | 1,694 | 150,529 | |||||||||
BGC Partners, Inc., Class A | 23,652 | 109,982 | |||||||||
Brightsphere Investment Group, Inc. | 5,612 | 143,667 | |||||||||
Cowen, Inc., Class A | 2,605 | 94,041 | |||||||||
Donnelley Financial Solutions, Inc. (a) | 3,117 | 146,935 | |||||||||
Piper Sandler Cos. | 1,069 | 190,827 | |||||||||
PJT Partners, Inc., Class A | 2,342 | 173,519 | |||||||||
Sculptor Capital Management, Inc. | 4,176 | 89,158 | |||||||||
StoneX Group, Inc. (a) | 2,043 | 125,134 | |||||||||
Victory Capital Holdings, Inc., Class A (d) | 4,333 | 158,284 | |||||||||
Virtus Investment Partners, Inc. | 454 | 134,883 | |||||||||
WisdomTree Investments, Inc. (c) | 19,686 | 120,478 | |||||||||
1,637,437 | |||||||||||
Communication Services (2.2%): | |||||||||||
AMC Networks, Inc., Class A (a) | 1,542 | 53,107 | |||||||||
Boston Omaha Corp., Class A (a) | 2,539 | 72,945 | |||||||||
Cars.com, Inc. (a) | 7,100 | 114,239 | |||||||||
Gray Television, Inc. | 6,795 | 136,987 | |||||||||
IDT Corp., Class B (a) | 1,714 | 75,690 | |||||||||
QuinStreet, Inc. (a) | 7,796 | 141,809 | |||||||||
Sciplay Corp., Class A (a) | 5,228 | 72,042 | |||||||||
Shenandoah Telecommunications Co. | 2,790 | 71,145 | |||||||||
TechTarget, Inc. (a) | 1,163 | 111,253 | |||||||||
Telephone & Data Systems, Inc. | 7,222 | 145,523 | |||||||||
The EW Scripps Co., Class A (a) | 6,774 | 131,077 | |||||||||
Thryv Holdings, Inc. (a) | 2,014 | 82,836 | |||||||||
United States Cellular Corp. (a) | 4,809 | 151,580 | |||||||||
WideOpenWest, Inc. (a) | 4,713 | 101,424 | |||||||||
Yelp, Inc. (a) | 2,955 | 107,089 | |||||||||
1,568,746 | |||||||||||
See notes to financial statements.
106
| Victory Portfolios II VictoryShares US Discovery Enhanced Volatility Wtd ETF | Schedule of Portfolio Investments — continued December 31, 2021 | ||||||
(Unaudited)
Security Description | Shares | Value | |||||||||
Consumer Discretionary (13.2%): | |||||||||||
1-800-Flowers.com, Inc., Class A (a) | 2,641 | $ | 61,720 | ||||||||
Abercrombie & Fitch Co. (a) | 2,735 | 95,260 | |||||||||
Accel Entertainment, Inc. (a) | 11,116 | 144,730 | |||||||||
Adtalem Global Education, Inc. (a) | 3,776 | 111,619 | |||||||||
American Axle & Manufacturing Holdings, Inc. (a) | 9,889 | 92,264 | |||||||||
America's Car-Mart, Inc. (a) | 878 | 89,907 | |||||||||
Arko Corp. (a) | 11,876 | 104,152 | |||||||||
Bally's Corp. (a) | 1,728 | 65,768 | |||||||||
Bed Bath & Beyond, Inc. (a)(c) | 1,438 | 20,966 | |||||||||
Big 5 Sporting Goods Corp. (c) | 2,266 | 43,077 | |||||||||
Big Lots, Inc. | 1,972 | 88,839 | |||||||||
Bloomin' Brands, Inc. (a) | 4,348 | 91,221 | |||||||||
Boot Barn Holdings, Inc. (a) | 1,133 | 139,416 | |||||||||
Brinker International, Inc. (a) | 1,914 | 70,033 | |||||||||
Carriage Services, Inc. | 4,346 | 280,056 | |||||||||
Cavco Industries, Inc. (a) | 540 | 171,531 | |||||||||
Century Communities, Inc. | 1,325 | 108,372 | |||||||||
Chuy's Holdings, Inc. (a) | 3,164 | 95,300 | |||||||||
Citi Trends, Inc. (a) | 1,100 | 104,225 | |||||||||
Clarus Corp. | 5,822 | 161,386 | |||||||||
Conn's, Inc. (a) | 2,962 | 69,666 | |||||||||
Denny's Corp. (a) | 7,715 | 123,440 | |||||||||
Dine Brands Global, Inc. | 1,383 | 104,845 | |||||||||
Dorman Products, Inc. (a) | 1,698 | 191,891 | |||||||||
El Pollo Loco Holdings, Inc. (a) | 8,653 | 122,786 | |||||||||
Ethan Allen Interiors, Inc. (c) | 5,332 | 140,178 | |||||||||
Franchise Group, Inc. | 4,238 | 221,054 | |||||||||
Funko, Inc., Class A (a) | 3,922 | 73,734 | |||||||||
Genesco, Inc. (a) | 1,408 | 90,351 | |||||||||
Gentherm, Inc. (a) | 1,529 | 132,870 | |||||||||
G-III Apparel Group Ltd. (a) | 3,467 | 95,828 | |||||||||
Golden Entertainment, Inc. (a) | 1,884 | 95,198 | |||||||||
GoPro, Inc., Class A (a) | 7,714 | 79,531 | |||||||||
Green Brick Partners, Inc. (a) | 4,069 | 123,413 | |||||||||
Group 1 Automotive, Inc. | 662 | 129,236 | |||||||||
Groupon, Inc. (a) | 2,877 | 66,631 | |||||||||
GrowGeneration Corp. (a)(b) | 1,881 | 24,547 | |||||||||
Guess?, Inc. | 4,098 | 97,041 | |||||||||
Haverty Furniture Cos., Inc. | 3,194 | 97,641 | |||||||||
Hibbett, Inc. | 1,004 | 72,218 | |||||||||
Hovnanian Enterprises, Inc., Class A (a) | 554 | 70,519 | |||||||||
iRobot Corp. (a) | 977 | 64,365 | |||||||||
Jack in the Box, Inc. | 1,595 | 139,531 | |||||||||
Johnson Outdoors, Inc., Class A | 1,344 | 125,919 | |||||||||
Lands' End, Inc. (a) | 1,944 | 38,161 | |||||||||
La-Z-Boy, Inc. | 4,223 | 153,337 | |||||||||
Liquidity Services, Inc. (a) | 2,568 | 56,701 | |||||||||
Lumber Liquidators Holdings, Inc. (a) | 5,049 | 86,186 | |||||||||
M/I Homes, Inc. (a) | 1,727 | 107,385 | |||||||||
See notes to financial statements.
107
| Victory Portfolios II VictoryShares US Discovery Enhanced Volatility Wtd ETF | Schedule of Portfolio Investments — continued December 31, 2021 | ||||||
(Unaudited)
Security Description | Shares | Value | |||||||||
Malibu Boats, Inc., Class A (a) | 1,627 | $ | 111,824 | ||||||||
MarineMax, Inc. (a)(c) | 1,753 | 103,497 | |||||||||
Monarch Casino & Resort, Inc. (a) | 1,981 | 146,495 | |||||||||
Monro, Inc. | 2,534 | 147,656 | |||||||||
Movado Group, Inc. | 2,839 | 118,755 | |||||||||
OneWater Marine, Inc. | 2,382 | 145,231 | |||||||||
Oxford Industries, Inc. | 1,404 | 142,534 | |||||||||
Party City Holdco, Inc. (a) | 10,007 | 55,739 | |||||||||
Patrick Industries, Inc. | 1,614 | 130,234 | |||||||||
Perdoceo Education Corp. (a) | 13,681 | 160,889 | |||||||||
Ruth's Hospitality Group, Inc. (a) | 5,559 | 110,624 | |||||||||
Sally Beauty Holdings, Inc. (a) | 5,065 | 93,500 | |||||||||
Shoe Carnival, Inc. | 2,889 | 112,902 | |||||||||
Sleep Number Corp. (a) | 1,074 | 82,268 | |||||||||
Smith & Wesson Brands, Inc. | 3,451 | 61,428 | |||||||||
Sonic Automotive, Inc., Class A | 2,295 | 113,488 | |||||||||
Standard Motor Products, Inc. | 3,851 | 201,754 | |||||||||
Stoneridge, Inc. (a) | 5,435 | 107,287 | |||||||||
Strategic Education, Inc. | 1,819 | 105,211 | |||||||||
Stride, Inc. (a) | 3,248 | 108,256 | |||||||||
Sturm Ruger & Co., Inc. (b) | 1,934 | 131,551 | |||||||||
The Buckle, Inc. (c) | 3,234 | 136,830 | |||||||||
The Children's Place, Inc. (a)(c) | 968 | 76,753 | |||||||||
The Lovesac Co. (a) | 1,305 | 86,469 | |||||||||
The ODP Corp. (a) | 1,994 | 78,324 | |||||||||
TravelCenters of America, Inc. (a) | 1,971 | 101,743 | |||||||||
Tri Pointe Homes, Inc. (a) | 4,903 | 136,745 | |||||||||
Tupperware Brands Corp. (a) | 3,457 | 52,857 | |||||||||
Universal Electronics, Inc. (a) | 2,812 | 114,589 | |||||||||
Vista Outdoor, Inc. (a) | 2,276 | 104,855 | |||||||||
Visteon Corp. (a) | 1,171 | 130,145 | |||||||||
Winmark Corp. | 962 | 238,855 | |||||||||
Winnebago Industries, Inc. | 1,689 | 126,540 | |||||||||
Workhorse Group, Inc. (a)(c) | 4,300 | 18,748 | |||||||||
WW International, Inc. (a) | 3,619 | 58,374 | |||||||||
XPEL, Inc. (a) | 1,102 | 75,245 | |||||||||
Zumiez, Inc. (a) | 2,812 | 134,948 | |||||||||
9,297,188 | |||||||||||
Consumer Finance (1.2%): | |||||||||||
Atlanticus Holdings Corp. (a) | 1,103 | 78,666 | |||||||||
Encore Capital Group, Inc. (a) | 3,194 | 198,379 | |||||||||
Enova International, Inc. (a) | 3,487 | 142,828 | |||||||||
Green Dot Corp., Class A (a) | 2,802 | 101,545 | |||||||||
PRA Group, Inc. (a) | 4,139 | 207,819 | |||||||||
World Acceptance Corp. (a)(c) | 419 | 102,835 | |||||||||
832,072 | |||||||||||
Consumer Staples (7.0%): | |||||||||||
B&G Foods, Inc. (c) | 3,749 | 115,207 | |||||||||
BellRing Brands, Inc., Class A (a)(c) | 4,732 | 135,004 | |||||||||
See notes to financial statements.
108
| Victory Portfolios II VictoryShares US Discovery Enhanced Volatility Wtd ETF | Schedule of Portfolio Investments — continued December 31, 2021 | ||||||
(Unaudited)
Security Description | Shares | Value | |||||||||
Calavo Growers, Inc. | 3,482 | $ | 147,637 | ||||||||
Cal-Maine Foods, Inc. | 6,715 | 248,388 | |||||||||
Central Garden & Pet Co., Class A (a) | 4,298 | 205,659 | |||||||||
Edgewell Personal Care Co. | 3,916 | 179,000 | |||||||||
e.l.f. Beauty, Inc. (a) | 5,169 | 171,662 | |||||||||
Energizer Holdings, Inc. | 4,971 | 199,337 | |||||||||
Fresh Del Monte Produce, Inc. | 4,128 | 113,933 | |||||||||
Grocery Outlet Holding Corp. (a) | 5,028 | 142,192 | |||||||||
Hostess Brands, Inc. (a) | 14,515 | 296,396 | |||||||||
Ingles Markets, Inc., Class A | 2,701 | 233,204 | |||||||||
Inter Parfums, Inc. | 2,353 | 251,536 | |||||||||
John B Sanfilippo & Son, Inc. | 2,540 | 229,006 | |||||||||
Medifast, Inc. | 487 | 101,992 | |||||||||
MGP Ingredients, Inc. | 1,962 | 166,750 | |||||||||
Nu Skin Enterprises, Inc., Class A | 2,870 | 145,653 | |||||||||
PriceSmart, Inc. | 2,267 | 165,876 | |||||||||
SpartanNash Co. | 7,775 | 200,284 | |||||||||
Sprouts Farmers Market, Inc. (a) | 6,117 | 181,553 | |||||||||
The Andersons, Inc. | 4,029 | 155,963 | |||||||||
Tootsie Roll Industries, Inc. (c) | 3,749 | 135,826 | |||||||||
TreeHouse Foods, Inc. (a) | 3,670 | 148,745 | |||||||||
Turning Point Brands, Inc. | 2,538 | 95,886 | |||||||||
United Natural Foods, Inc. (a) | 2,125 | 104,295 | |||||||||
Universal Corp. | 3,803 | 208,861 | |||||||||
USANA Health Sciences, Inc. (a) | 1,709 | 172,951 | |||||||||
Vector Group Ltd. | 9,468 | 108,693 | |||||||||
Weis Markets, Inc. (b) | 2,973 | 195,861 | |||||||||
4,957,350 | |||||||||||
Diversified Financial Services (0.3%): | |||||||||||
Cannae Holdings, Inc. (a) | 5,314 | 186,787 | |||||||||
Energy (1.3%): | |||||||||||
Altus Midstream Co., Class A | 1,668 | 102,265 | |||||||||
Archrock, Inc. | 17,918 | 134,027 | |||||||||
Cactus, Inc., Class A | 2,528 | 96,393 | |||||||||
Civitas Resources, Inc. | 2,260 | 110,672 | |||||||||
CONSOL Energy, Inc. (a) | 3,033 | 68,879 | |||||||||
Core Laboratories NV | 3,383 | 75,475 | |||||||||
Renewable Energy Group, Inc. (a) | 1,505 | 63,872 | |||||||||
Transocean Ltd. (a)(c) | 15,800 | 43,608 | |||||||||
Whiting Petroleum Corp. (a) | 2,049 | 132,529 | |||||||||
World Fuel Services Corp. (b) | 3,475 | 91,983 | |||||||||
919,703 | |||||||||||
Health Care (8.7%): | |||||||||||
Addus HomeCare Corp. (a) | 1,501 | 140,358 | |||||||||
Amneal Pharmaceuticals, Inc. (a) | 15,629 | 74,863 | |||||||||
Amphastar Pharmaceuticals, Inc. (a)(c) | 10,231 | 238,280 | |||||||||
Antares Pharma, Inc. (a) | 31,189 | 111,345 | |||||||||
Atrion Corp. | 263 | 185,389 | |||||||||
Avanos Medical, Inc. (a) | 4,586 | 158,997 | |||||||||
See notes to financial statements.
109
| Victory Portfolios II VictoryShares US Discovery Enhanced Volatility Wtd ETF | Schedule of Portfolio Investments — continued December 31, 2021 | ||||||
(Unaudited)
Security Description | Shares | Value | |||||||||
Avid Bioservices, Inc. (a) | 3,612 | $ | 105,398 | ||||||||
BioLife Solutions, Inc. (a) | 1,485 | 55,346 | |||||||||
Cara Therapeutics, Inc. (a) | 4,362 | 53,129 | |||||||||
Collegium Pharmaceutical, Inc. (a) | 4,989 | 93,194 | |||||||||
Community Health Systems, Inc. (a) | 5,739 | 76,386 | |||||||||
Corcept Therapeutics, Inc. (a) | 8,179 | 161,944 | |||||||||
CorVel Corp. (a) | 1,201 | 249,808 | |||||||||
Cross Country Healthcare, Inc. (a) | 4,218 | 117,092 | |||||||||
Cutera, Inc. (a) | 1,794 | 74,128 | |||||||||
Eagle Pharmaceuticals, Inc. (a) | 2,392 | 121,801 | |||||||||
Fulgent Genetics, Inc. (a) | 542 | 54,520 | |||||||||
Hanger, Inc. (a) | 6,392 | 115,887 | |||||||||
HealthStream, Inc. (a) | 6,572 | 173,238 | |||||||||
Innoviva, Inc. (a) | 9,966 | 171,913 | |||||||||
Ironwood Pharmaceuticals, Inc. (a) | 11,518 | 134,300 | |||||||||
LeMaitre Vascular, Inc. | 2,637 | 132,456 | |||||||||
Lexicon Pharmaceuticals, Inc. (a) | 7,614 | 29,999 | |||||||||
Ligand Pharmaceuticals, Inc. (a) | 621 | 95,920 | |||||||||
Meridian Bioscience, Inc. (a) | 4,009 | 81,784 | |||||||||
Mesa Laboratories, Inc. | 877 | 287,735 | |||||||||
ModivCare, Inc. (a) | 601 | 89,122 | |||||||||
National HealthCare Corp. (b) | 2,205 | 149,808 | |||||||||
National Research Corp. | 3,132 | 130,041 | |||||||||
Natus Medical, Inc. (a) | 5,017 | 119,053 | |||||||||
NextGen Healthcare, Inc. (a) | 8,843 | 157,317 | |||||||||
OPKO Health, Inc. (a)(c) | 23,418 | 112,641 | |||||||||
OptimizeRx Corp. (a) | 1,159 | 71,985 | |||||||||
OraSure Technologies, Inc. (a) | 9,275 | 80,600 | |||||||||
Organogenesis Holdings, Inc. (a) | 3,998 | 36,942 | |||||||||
Owens & Minor, Inc. | 1,813 | 78,865 | |||||||||
Pacira BioSciences, Inc. (a) | 2,486 | 149,583 | |||||||||
Patterson Cos., Inc. (b) | 4,940 | 144,989 | |||||||||
Phibro Animal Health Corp., Class A | 6,302 | 128,687 | |||||||||
Prestige Consumer Healthcare, Inc. (a) | 3,548 | 215,186 | |||||||||
RadNet, Inc. (a) | 3,138 | 94,485 | |||||||||
Sage Therapeutics, Inc. (a) | 2,021 | 85,973 | |||||||||
Simulations Plus, Inc. | 2,294 | 108,506 | |||||||||
Supernus Pharmaceuticals, Inc. (a) | 4,175 | 121,743 | |||||||||
Surmodics, Inc. (a) | 2,388 | 114,982 | |||||||||
Tactile Systems Technology, Inc. (a) | 2,669 | 50,791 | |||||||||
The Joint Corp. (a) | 887 | 58,267 | |||||||||
The Pennant Group, Inc. (a) | 3,234 | 74,641 | |||||||||
U.S. Physical Therapy, Inc. | 997 | 95,263 | |||||||||
uniQure NV (a) | 3,358 | 69,645 | |||||||||
Vanda Pharmaceuticals, Inc. (a) | 6,727 | 105,547 | |||||||||
Vericel Corp. (a) | 1,581 | 62,133 | |||||||||
Xencor, Inc. (a) | 3,567 | 143,108 | |||||||||
6,145,113 | |||||||||||
See notes to financial statements.
110
| Victory Portfolios II VictoryShares US Discovery Enhanced Volatility Wtd ETF | Schedule of Portfolio Investments — continued December 31, 2021 | ||||||
(Unaudited)
Security Description | Shares | Value | |||||||||
Industrials (21.7%): | |||||||||||
AAR Corp. (a) | 4,055 | $ | 158,267 | ||||||||
ACCO Brands Corp. | 15,202 | 125,568 | |||||||||
AeroVironment, Inc. (a) | 882 | 54,710 | |||||||||
Air Transport Services Group, Inc. (a) | 5,646 | 165,879 | |||||||||
Alamo Group, Inc. | 1,203 | 177,058 | |||||||||
Albany International Corp. | 2,004 | 177,254 | |||||||||
American Woodmark Corp. (a) | 1,877 | 122,380 | |||||||||
Apogee Enterprises, Inc. | 3,118 | 150,132 | |||||||||
ArcBest Corp. | 1,601 | 191,880 | |||||||||
Arcosa, Inc. | 2,560 | 134,912 | |||||||||
Argan, Inc. | 4,120 | 159,403 | |||||||||
Astec Industries, Inc. | 2,059 | 142,627 | |||||||||
Atlas Air Worldwide Holdings, Inc. (a) | 2,110 | 198,593 | |||||||||
AZZ, Inc. | 3,302 | 182,568 | |||||||||
Babcock & Wilcox Enterprises, Inc. (a) | 9,374 | 84,553 | |||||||||
Barnes Group, Inc. | 3,379 | 157,428 | |||||||||
Boise Cascade Co. | 1,971 | 140,335 | |||||||||
Brady Corp., Class A | 3,903 | 210,372 | |||||||||
BrightView Holdings, Inc. (a) | 9,695 | 136,506 | |||||||||
CBIZ, Inc. (a) | 6,910 | 270,319 | |||||||||
Columbus McKinnon Corp. | 3,411 | 157,793 | |||||||||
Comfort Systems USA, Inc. | 2,088 | 206,587 | |||||||||
Construction Partners, Inc., Class A (a) | 3,598 | 105,817 | |||||||||
Cornerstone Building Brands, Inc. (a) | 5,576 | 97,245 | |||||||||
CRA International, Inc. | 1,450 | 135,372 | |||||||||
CSW Industrials, Inc. | 1,338 | 161,711 | |||||||||
Deluxe Corp. | 3,339 | 107,215 | |||||||||
Douglas Dynamics, Inc. | 3,899 | 152,295 | |||||||||
Ducommun, Inc. (a) | 2,496 | 116,738 | |||||||||
Dycom Industries, Inc. (a) | 1,251 | 117,294 | |||||||||
Eagle Bulk Shipping, Inc. | 1,614 | 73,437 | |||||||||
Encore Wire Corp. | 1,969 | 281,764 | |||||||||
Energy Recovery, Inc. (a) | 5,304 | 113,983 | |||||||||
Enerpac Tool Group Corp. | 6,027 | 122,228 | |||||||||
EnPro Industries, Inc. | 1,945 | 214,086 | |||||||||
ESCO Technologies, Inc. | 2,112 | 190,059 | |||||||||
Federal Signal Corp. | 4,555 | 197,414 | |||||||||
Forrester Research, Inc. (a) | 3,420 | 200,857 | |||||||||
Forward Air Corp. | 2,038 | 246,781 | |||||||||
Franklin Covey Co. (a) | 3,314 | 153,637 | |||||||||
Gibraltar Industries, Inc. (a) | 1,746 | 116,423 | |||||||||
Global Industrial Co. | 3,090 | 126,381 | |||||||||
GMS, Inc. (a) | 2,553 | 153,461 | |||||||||
GrafTech International Ltd. | 9,942 | 117,614 | |||||||||
Great Lakes Dredge & Dock Corp. (a) | 10,359 | 162,843 | |||||||||
Griffon Corp. | 5,728 | 163,133 | |||||||||
H&E Equipment Services, Inc. | 3,299 | 146,047 | |||||||||
Healthcare Services Group | 5,304 | 94,358 | |||||||||
Heartland Express, Inc. | 14,491 | 243,739 | |||||||||
See notes to financial statements.
111
| Victory Portfolios II VictoryShares US Discovery Enhanced Volatility Wtd ETF | Schedule of Portfolio Investments — continued December 31, 2021 | ||||||
(Unaudited)
Security Description | Shares | Value | |||||||||
Heidrick & Struggles International, Inc. | 3,664 | $ | 160,227 | ||||||||
Helios Technologies, Inc. | 2,094 | 220,226 | |||||||||
Heritage-Crystal Clean, Inc. (a) | 4,439 | 142,137 | |||||||||
HNI Corp. | 3,964 | 166,686 | |||||||||
Hub Group, Inc., Class A (a) | 2,450 | 206,388 | |||||||||
Huron Consulting Group, Inc. (a) | 2,863 | 142,864 | |||||||||
Hyster-Yale Materials Handling, Inc. | 1,867 | 76,734 | |||||||||
ICF International, Inc. | 2,149 | 220,380 | |||||||||
IES Holdings, Inc. (a) | 2,670 | 135,209 | |||||||||
Insteel Industries, Inc. | 3,348 | 133,284 | |||||||||
Interface, Inc. | 8,564 | 136,596 | |||||||||
JELD-WEN Holding, Inc. (a) | 4,304 | 113,453 | |||||||||
Kadant, Inc. | 837 | 192,912 | |||||||||
KAR Auction Services, Inc. (a) | 6,625 | 103,482 | |||||||||
Kelly Services, Inc., Class A | 7,321 | 122,773 | |||||||||
Kforce, Inc. | 2,950 | 221,899 | |||||||||
Lindsay Corp. | 1,049 | 159,448 | |||||||||
Marten Transport Ltd. | 11,728 | 201,252 | |||||||||
Matthews International Corp., Class A | 4,418 | 162,008 | |||||||||
McGrath RentCorp | 2,532 | 203,218 | |||||||||
Mercury Systems, Inc. (a) | 2,456 | 135,227 | |||||||||
Meritor, Inc. (a) | 5,307 | 131,507 | |||||||||
Moog, Inc., Class A | 2,167 | 175,462 | |||||||||
Mueller Industries, Inc. | 3,790 | 224,974 | |||||||||
Mueller Water Products, Inc., Class A | 12,231 | 176,126 | |||||||||
MYR Group, Inc. (a) | 1,254 | 138,630 | |||||||||
NV5 Global, Inc. (a) | 1,239 | 171,131 | |||||||||
Omega Flex, Inc. | 733 | 93,054 | |||||||||
PAE, Inc. (a) | 18,717 | 185,860 | |||||||||
PGT Innovations, Inc. (a) | 6,451 | 145,083 | |||||||||
Pitney Bowes, Inc. | 5,688 | 37,711 | |||||||||
Primoris Services Corp. | 4,713 | 113,018 | |||||||||
Proto Labs, Inc. (a) | 1,185 | 60,850 | |||||||||
Quanex Building Products Corp. | 6,674 | 165,382 | |||||||||
REV Group, Inc. | 5,031 | 71,189 | |||||||||
Romeo Power, Inc. (a)(c) | 8,637 | 31,525 | |||||||||
Rush Enterprises, Inc., Class B | 3,893 | 216,607 | |||||||||
SkyWest, Inc. (a) | 2,474 | 97,228 | |||||||||
SPX Corp. (a) | 2,697 | 160,957 | |||||||||
Standex International Corp. | 1,693 | 187,347 | |||||||||
Steelcase, Inc., Class A | 10,026 | 117,505 | |||||||||
Sterling Construction Co., Inc. (a) | 4,067 | 106,962 | |||||||||
Tennant Co. | 2,847 | 230,721 | |||||||||
The Gorman-Rupp Co. | 4,740 | 211,167 | |||||||||
The Greenbrier Cos., Inc. | 2,854 | 130,970 | |||||||||
The Manitowoc Co., Inc. (a) | 3,678 | 68,374 | |||||||||
The Shyft Group, Inc. | 2,707 | 132,995 | |||||||||
Titan Machinery, Inc. (a) | 3,170 | 106,797 | |||||||||
TPI Composites, Inc. (a) | 1,916 | 28,663 | |||||||||
TrueBlue, Inc. (a) | 4,262 | 117,930 | |||||||||
See notes to financial statements.
112
| Victory Portfolios II VictoryShares US Discovery Enhanced Volatility Wtd ETF | Schedule of Portfolio Investments — continued December 31, 2021 | ||||||
(Unaudited)
Security Description | Shares | Value | |||||||||
Tutor Perini Corp. (a) | 6,709 | $ | 82,990 | ||||||||
Veritiv Corp. (a) | 714 | 87,515 | |||||||||
VSE Corp. | 2,782 | 169,535 | |||||||||
Wabash National Corp. | 9,009 | 175,856 | |||||||||
15,325,080 | |||||||||||
Information Technology (10.4%): | |||||||||||
A10 Networks, Inc. | 7,769 | 128,810 | |||||||||
ACM Research, Inc., Class A (a) | 662 | 56,449 | |||||||||
ADTRAN, Inc. | 5,157 | 117,734 | |||||||||
Alpha & Omega Semiconductor Ltd. (a) | 2,816 | 170,537 | |||||||||
American Software, Inc., Class A | 3,688 | 96,515 | |||||||||
Avaya Holdings Corp. (a) | 5,106 | 101,099 | |||||||||
Avid Technology, Inc. (a) | 2,810 | 91,522 | |||||||||
Axcelis Technologies, Inc. (a) | 1,695 | 126,379 | |||||||||
Belden, Inc. | 2,169 | 142,568 | |||||||||
Benchmark Electronics, Inc. | 6,497 | 176,069 | |||||||||
Calix, Inc. (a) | 1,801 | 144,026 | |||||||||
Cambium Networks Corp. (a) | 1,859 | 47,646 | |||||||||
Cass Information Systems, Inc. | 4,553 | 179,024 | |||||||||
ChannelAdvisor Corp. (a) | 4,208 | 103,853 | |||||||||
Clearfield, Inc. (a) | 1,750 | 147,735 | |||||||||
Cohu, Inc. (a) | 2,450 | 93,321 | |||||||||
CSG Systems International, Inc. | 5,153 | 296,916 | |||||||||
CTS Corp. | 4,203 | 154,334 | |||||||||
Digi International, Inc. (a) | 5,270 | 129,484 | |||||||||
Ebix, Inc. | 2,075 | 63,080 | |||||||||
EchoStar Corp., Class A (a) | 4,511 | 118,865 | |||||||||
ePlus, Inc. (a) | 3,074 | 165,627 | |||||||||
Extreme Networks, Inc. (a) | 9,252 | 145,256 | |||||||||
FARO Technologies, Inc. (a) | 2,022 | 141,581 | |||||||||
Ichor Holdings Ltd. (a) | 1,909 | 87,871 | |||||||||
InterDigital, Inc. | 2,382 | 170,623 | |||||||||
Kimball Electronics, Inc. (a) | 4,456 | 96,963 | |||||||||
Knowles Corp. (a) | 11,861 | 276,954 | |||||||||
Methode Electronics, Inc. | 3,632 | 178,586 | |||||||||
Mitek Systems, Inc. (a) | 4,653 | 82,591 | |||||||||
Napco Security Technologies, Inc. (a) | 3,561 | 177,979 | |||||||||
NETGEAR, Inc. (a) | 3,610 | 105,448 | |||||||||
NetScout Systems, Inc. (a) | 7,012 | 231,957 | |||||||||
OSI Systems, Inc. (a) | 2,622 | 244,370 | |||||||||
PC Connection, Inc. | 3,316 | 143,019 | |||||||||
Photronics, Inc. (a) | 9,450 | 178,133 | |||||||||
Plexus Corp. (a) | 2,100 | 201,369 | |||||||||
Progress Software Corp. | 3,959 | 191,101 | |||||||||
Ribbon Communications, Inc. (a) | 14,855 | 89,873 | |||||||||
Sanmina Corp. (a) | 5,059 | 209,746 | |||||||||
ScanSource, Inc. (a) | 3,275 | 114,887 | |||||||||
SMART Global Holdings, Inc. (a) | 2,083 | 147,872 | |||||||||
SolarWinds Corp. | 5,838 | 82,841 | |||||||||
Super Micro Computer, Inc. (a) | 4,476 | 196,720 | |||||||||
See notes to financial statements.
113
| Victory Portfolios II VictoryShares US Discovery Enhanced Volatility Wtd ETF | Schedule of Portfolio Investments — continued December 31, 2021 | ||||||
(Unaudited)
Security Description | Shares | Value | |||||||||
TTM Technologies, Inc. (a) | 28,757 | $ | 428,479 | ||||||||
Ultra Clean Holdings, Inc. (a) | 1,765 | 101,240 | |||||||||
Veeco Instruments, Inc. (a) | 5,924 | 168,656 | |||||||||
Verra Mobility Corp. (a) | 8,968 | 138,376 | |||||||||
Xperi Holding Corp. | 7,431 | 140,520 | |||||||||
7,324,604 | |||||||||||
Insurance (2.8%): | |||||||||||
American Equity Investment Life Holding Co. | 5,437 | 211,608 | |||||||||
AMERISAFE, Inc. | 4,000 | 215,320 | |||||||||
Argo Group International Holdings Ltd. | 3,440 | 199,898 | |||||||||
eHealth, Inc. (a) | 2,058 | 52,479 | |||||||||
Employers Holdings, Inc. | 4,831 | 199,907 | |||||||||
Genworth Financial, Inc. (a) | 22,485 | 91,064 | |||||||||
HCI Group, Inc. | 929 | 77,609 | |||||||||
Horace Mann Educators Corp. | 5,238 | 202,711 | |||||||||
Palomar Holdings, Inc. (a) | 1,210 | 78,372 | |||||||||
Safety Insurance Group, Inc. (b) | 2,704 | 229,921 | |||||||||
Selectquote, Inc. (a) | 6,762 | 61,264 | |||||||||
SiriusPoint Ltd. (a) | 18,275 | 148,576 | |||||||||
Stewart Information Services Corp. | 2,861 | 228,107 | |||||||||
1,996,836 | |||||||||||
IT Services (0.1%): | |||||||||||
Everi Holdings, Inc. (a) | 4,665 | 99,598 | |||||||||
Machinery (0.1%): | |||||||||||
DMC Global, Inc. (a) | 2,251 | 89,162 | |||||||||
Materials (4.1%): | |||||||||||
AdvanSix, Inc. | 3,101 | 146,522 | |||||||||
Chase Corp. | 1,533 | 152,625 | |||||||||
Coeur Mining, Inc. (a) | 9,550 | 48,132 | |||||||||
GCP Applied Technologies, Inc. (a) | 6,774 | 214,465 | |||||||||
Glatfelter Corp. | 9,791 | 168,405 | |||||||||
Hawkins, Inc. | 3,377 | 133,223 | |||||||||
Innospec, Inc. | 1,897 | 171,375 | |||||||||
Koppers Holdings, Inc. (a) | 4,034 | 126,264 | |||||||||
Kronos Worldwide, Inc. | 12,228 | 183,542 | |||||||||
Materion Corp. | 2,164 | 198,958 | |||||||||
Minerals Technologies, Inc. | 2,130 | 155,810 | |||||||||
Myers Industries, Inc. | 6,967 | 139,410 | |||||||||
O-I Glass, Inc. (a) | 7,575 | 91,127 | |||||||||
Orion Engineered Carbons SA (a) | 7,220 | 132,559 | |||||||||
Ryerson Holding Corp. | 3,180 | 82,839 | |||||||||
Schnitzer Steel Industries, Inc. | 2,085 | 108,253 | |||||||||
Schweitzer-Mauduit International, Inc. | 3,913 | 116,999 | |||||||||
Stepan Co. | 1,834 | 227,948 | |||||||||
TimkenSteel Corp. (a) | 4,717 | 77,831 | |||||||||
Trinseo PLC (a) | 2,337 | 122,599 | |||||||||
Worthington Industries, Inc. | 2,232 | 122,001 | |||||||||
2,920,887 | |||||||||||
See notes to financial statements.
114
| Victory Portfolios II VictoryShares US Discovery Enhanced Volatility Wtd ETF | Schedule of Portfolio Investments — continued December 31, 2021 | ||||||
(Unaudited)
Security Description | Shares | Value | |||||||||
Real Estate (1.6%): | |||||||||||
Douglas Elliman, Inc. (a) | 4,734 | $ | 54,441 | ||||||||
Forestar Group, Inc. (a) | 8,560 | 186,180 | |||||||||
Marcus & Millichap, Inc. (a) | 5,093 | 262,086 | |||||||||
Newmark Group, Inc., Class A | 8,702 | 162,727 | |||||||||
RE/MAX Holdings, Inc. | 4,713 | 143,699 | |||||||||
Realogy Holdings Corp. (a) | 5,310 | 89,261 | |||||||||
The RMR Group, Inc., Class A | 3,258 | 112,988 | |||||||||
The St. Joe Co. | 2,597 | 135,174 | |||||||||
1,146,556 | |||||||||||
Thrifts & Mortgage Finance (4.1%): | |||||||||||
Axos Financial, Inc. (a) | 3,221 | 180,086 | |||||||||
Capitol Federal Financial, Inc. | 19,688 | 223,065 | |||||||||
Columbia Financial, Inc. (a)(b) | 13,589 | 283,467 | |||||||||
Federal Agricultural Mortgage Corp., Class C | 1,758 | 217,869 | |||||||||
Kearny Financial Corp. | 14,664 | 194,298 | |||||||||
Merchants Bancorp | 3,713 | 175,736 | |||||||||
Meta Financial Group, Inc. | 3,005 | 179,278 | |||||||||
NMI Holdings, Inc., Class A (a) | 6,271 | 137,021 | |||||||||
Northfield Bancorp, Inc. | 12,529 | 202,469 | |||||||||
Northwest Bancshares, Inc. (b) | 16,479 | 233,343 | |||||||||
OceanFirst Financial Corp. | 7,572 | 168,098 | |||||||||
Premier Financial Corp. | 4,984 | 154,056 | |||||||||
Provident Financial Services, Inc. | 7,511 | 181,916 | |||||||||
Washington Federal, Inc. | 5,522 | 184,324 | |||||||||
WSFS Financial Corp. | 3,141 | 157,427 | |||||||||
2,872,453 | |||||||||||
Utilities (3.0%): | |||||||||||
Avista Corp. | 5,359 | 227,704 | |||||||||
Chesapeake Utilities Corp. | 1,789 | 260,854 | |||||||||
MGE Energy, Inc. | 3,124 | 256,949 | |||||||||
Middlesex Water Co. | 1,372 | 165,052 | |||||||||
Northwest Natural Holding Co. | 3,222 | 157,169 | |||||||||
Otter Tail Corp. (b) | 4,429 | 316,319 | |||||||||
SJW Group | 3,276 | 239,803 | |||||||||
South Jersey Industries, Inc. | 5,409 | 141,283 | |||||||||
The York Water Co. | 3,888 | 193,545 | |||||||||
Unitil Corp. (b) | 3,476 | 159,861 | |||||||||
2,118,539 | |||||||||||
Total Common Stocks (Cost $58,981,440) | 70,395,087 | ||||||||||
Investment Companies (0.3%) | |||||||||||
BlackRock Liquidity Funds T-Fund, Institutional Shares, 0.01% (e) | 225,408 | 225,408 | |||||||||
Total Investment Companies (Cost $225,408) | 225,408 | ||||||||||
See notes to financial statements.
115
| Victory Portfolios II VictoryShares US Discovery Enhanced Volatility Wtd ETF | Schedule of Portfolio Investments — continued December 31, 2021 | ||||||
(Unaudited)
Security Description | Shares | Value | |||||||||
Collateral for Securities Loaned^ (1.2%) | |||||||||||
BlackRock Liquidity Funds TempFund, Institutional Shares, 0.04% (e) | 19,182 | $ | 19,182 | ||||||||
| Fidelity Investments Money Market Government Portfolio, Institutional Shares, 0.01% (e) | 376,734 | 376,734 | |||||||||
| Goldman Sachs Financial Square Prime Obligations Fund, Institutional Shares, 0.02% (e) | 9,573 | 9,573 | |||||||||
JPMorgan Prime Money Market Fund, Capital Shares, 0.07% (e) | 76,330 | 76,330 | |||||||||
| Morgan Stanley Institutional Liquidity Prime Portfolio, Institutional Shares, 0.06% (e) | 343,193 | 343,193 | |||||||||
Total Collateral for Securities Loaned (Cost $825,012) | 825,012 | ||||||||||
Total Investments (Cost $60,031,860) — 101.1% | 71,445,507 | ||||||||||
Liabilities in excess of other assets — (1.1)% | (773,588 | ) | |||||||||
NET ASSETS — 100.00% | $ | 70,671,919 | |||||||||
^ Purchased with cash collateral from securities on loan.
(a) Non-income producing security.
(b) All or a portion of this security has been segregated as collateral for derivative instruments.
(c) All or a portion of this security is on loan.
(d) Affiliated security. (See Note 8 in the Notes to Financial Statements)
(e) Rate disclosed is the daily yield on December 31, 2021.
PLC — Public Limited Company
Futures Contracts Purchased
| Number of Contracts | Expiration Date | Notional Amount | Value | Unrealized Appreciation (Depreciation) | |||||||||||||||||||
E-Mini Russell 2000 Index Futures | 2 | 3/18/22 | $ | 213,193 | $ | 224,280 | $ | 11,087 | |||||||||||||||
Total unrealized appreciation | $ | 11,087 | |||||||||||||||||||||
Total unrealized depreciation | — | ||||||||||||||||||||||
Total net unrealized appreciation (depreciation) | $ | 11,087 | |||||||||||||||||||||
See notes to financial statements.
116
| Victory Portfolios II VictoryShares Developed Enhanced Volatility Wtd ETF | Schedule of Portfolio Investments December 31, 2021 | ||||||
(Unaudited)
Security Description | Shares | Value | |||||||||
Common Stocks (99.3%) | |||||||||||
Australia (4.7%): | |||||||||||
Communication Services (0.5%): | |||||||||||
REA Group Ltd. | 654 | $ | 79,750 | ||||||||
Telstra Corp. Ltd. | 39,188 | 119,152 | |||||||||
198,902 | |||||||||||
Consumer Discretionary (0.2%): | |||||||||||
Aristocrat Leisure Ltd. | 2,469 | 78,250 | |||||||||
Consumer Staples (0.5%): | |||||||||||
Coles Group Ltd. | 7,619 | 99,424 | |||||||||
Woolworths Group Ltd. | 3,505 | 96,908 | |||||||||
196,332 | |||||||||||
Energy (0.2%): | |||||||||||
Woodside Petroleum Ltd. | 4,855 | 77,446 | |||||||||
Financials (1.8%): | |||||||||||
ASX Ltd. | 1,870 | 126,366 | |||||||||
Australia & New Zealand Banking Group Ltd. | 5,432 | 108,699 | |||||||||
Commonwealth Bank of Australia | 1,416 | 104,030 | |||||||||
Macquarie Group Ltd. | 793 | 118,481 | |||||||||
National Australia Bank Ltd. | 5,853 | 122,785 | |||||||||
Suncorp Group Ltd. | 9,239 | 74,395 | |||||||||
Westpac Banking Corp. | 5,876 | 91,254 | |||||||||
746,010 | |||||||||||
Health Care (0.5%): | |||||||||||
CSL Ltd. | 408 | 86,280 | |||||||||
Sonic Healthcare Ltd. | 3,231 | 109,591 | |||||||||
195,871 | |||||||||||
Industrials (0.2%): | |||||||||||
Brambles Ltd. | 14,378 | 111,174 | |||||||||
Materials (0.8%): | |||||||||||
BHP Group Ltd. (a) | 1,996 | 60,254 | |||||||||
Fortescue Metals Group Ltd. | 3,270 | 45,693 | |||||||||
Newcrest Mining Ltd. | 3,858 | 68,698 | |||||||||
Rio Tinto Ltd. | 766 | 55,780 | |||||||||
Wesfarmers Ltd. | 2,560 | 110,425 | |||||||||
340,850 | |||||||||||
1,944,835 | |||||||||||
Austria (0.5%): | |||||||||||
Energy (0.2%): | |||||||||||
OMV AG | 1,250 | 71,079 | |||||||||
Financials (0.2%): | |||||||||||
Erste Group Bank AG | 2,101 | 98,900 | |||||||||
See notes to financial statements.
117
| Victory Portfolios II VictoryShares Developed Enhanced Volatility Wtd ETF | Schedule of Portfolio Investments — continued December 31, 2021 | ||||||
(Unaudited)
Security Description | Shares | Value | |||||||||
Utilities (0.1%): | |||||||||||
Verbund AG | 498 | $ | 56,068 | ||||||||
226,047 | |||||||||||
Belgium (1.5%): | |||||||||||
Consumer Staples (0.2%): | |||||||||||
Anheuser-Busch InBev SA (a) | 1,288 | 77,961 | |||||||||
Financials (0.8%): | |||||||||||
Groupe Bruxelles Lambert SA | 1,148 | 128,283 | |||||||||
KBC Group NV | 855 | 73,447 | |||||||||
Sofina SA | 211 | 103,767 | |||||||||
305,497 | |||||||||||
Health Care (0.2%): | |||||||||||
UCB SA | 792 | 90,476 | |||||||||
Materials (0.3%): | |||||||||||
Solvay SA, Class A | 733 | 85,280 | |||||||||
Umicore SA | 1,032 | 42,000 | |||||||||
127,280 | |||||||||||
601,214 | |||||||||||
Canada (12.8%): | |||||||||||
Communication Services (1.1%): | |||||||||||
BCE, Inc. (a)(b) | 3,345 | 174,047 | |||||||||
Rogers Communications, Inc., Class B | 2,028 | 96,574 | |||||||||
TELUS Corp. (a)(b) | 7,115 | 167,580 | |||||||||
438,201 | |||||||||||
Consumer Discretionary (0.5%): | |||||||||||
Dollarama, Inc. | 2,366 | 118,431 | |||||||||
Restaurant Brands International, Inc. | 1,455 | 88,234 | |||||||||
206,665 | |||||||||||
Consumer Staples (1.3%): | |||||||||||
Alimentation Couche-Tard, Inc. | 2,011 | 84,269 | |||||||||
George Weston Ltd. | 1,089 | 126,275 | |||||||||
Loblaw Cos. Ltd. (a) | 1,883 | 154,296 | |||||||||
Metro, Inc. (a) | 3,016 | 160,529 | |||||||||
525,369 | |||||||||||
Energy (0.9%): | |||||||||||
Canadian Natural Resources Ltd. | 1,777 | 75,096 | |||||||||
Enbridge, Inc. | 3,030 | 118,368 | |||||||||
Suncor Energy, Inc. | 2,959 | 74,045 | |||||||||
TC Energy Corp. | 2,098 | 97,585 | |||||||||
365,094 | |||||||||||
Financials (4.5%): | |||||||||||
Bank of Montreal | 1,330 | 143,211 | |||||||||
Brookfield Asset Management, Inc., Class A | 1,570 | 94,823 | |||||||||
Canadian Imperial Bank of Commerce | 1,458 | 169,973 | |||||||||
See notes to financial statements.
118
| Victory Portfolios II VictoryShares Developed Enhanced Volatility Wtd ETF | Schedule of Portfolio Investments — continued December 31, 2021 | ||||||
(Unaudited)
Security Description | Shares | Value | |||||||||
Fairfax Financial Holdings Ltd. | 204 | $ | 100,361 | ||||||||
Great-West Lifeco, Inc. | 5,227 | 156,876 | |||||||||
Intact Financial Corp. | 970 | 126,097 | |||||||||
Manulife Financial Corp. | 5,431 | 103,527 | |||||||||
National Bank of Canada (a) | 1,910 | 145,636 | |||||||||
Power Corp. of Canada | 4,285 | 141,614 | |||||||||
Royal Bank of Canada | 1,776 | 188,511 | |||||||||
Sun Life Financial, Inc. | 2,645 | 147,244 | |||||||||
The Bank of Nova Scotia | 2,522 | 178,562 | |||||||||
The Toronto-Dominion Bank | 2,331 | 178,732 | |||||||||
1,875,167 | |||||||||||
Industrials (1.2%): | |||||||||||
Canadian National Railway Co. | 769 | 94,471 | |||||||||
Canadian Pacific Railway Ltd. (a) | 1,186 | 85,312 | |||||||||
Thomson Reuters Corp. | 810 | 96,876 | |||||||||
Waste Connections, Inc. | 1,069 | 145,711 | |||||||||
WSP Global, Inc. | 583 | 84,643 | |||||||||
507,013 | |||||||||||
Information Technology (0.8%): | |||||||||||
CGI, Inc. (c) | 1,242 | 109,834 | |||||||||
Constellation Software, Inc. | 50 | 92,779 | |||||||||
Open Text Corp. | 2,097 | 99,545 | |||||||||
Shopify, Inc., Class A (c) | 26 | 35,803 | |||||||||
337,961 | |||||||||||
Materials (1.0%): | |||||||||||
Aginco Eagle Mines Ltd. (a) | 1,069 | 56,788 | |||||||||
Barrick Gold Corp. | 3,229 | 61,399 | |||||||||
First Quantum Minerals Ltd. | 1,680 | 40,207 | |||||||||
Franco-Nevada Corp. | 533 | 73,722 | |||||||||
Nutrien Ltd. | 1,277 | 95,997 | |||||||||
Teck Resources Ltd., Class B | 1,808 | 52,076 | |||||||||
Wheaton Precious Metals Corp. | 1,258 | 53,988 | |||||||||
434,177 | |||||||||||
Utilities (1.5%): | |||||||||||
Emera, Inc. | 4,291 | 214,482 | |||||||||
Fortis, Inc. (a) | 4,341 | 209,465 | |||||||||
Hydro One Ltd. (d) | 7,014 | 182,504 | |||||||||
606,451 | |||||||||||
5,296,098 | |||||||||||
Denmark (2.4%): | |||||||||||
Consumer Discretionary (0.1%): | |||||||||||
Pandora A/S | 473 | 59,053 | |||||||||
Consumer Staples (0.3%): | |||||||||||
Carlsberg A/S, Class B | 589 | 101,861 | |||||||||
See notes to financial statements.
119
| Victory Portfolios II VictoryShares Developed Enhanced Volatility Wtd ETF | Schedule of Portfolio Investments — continued December 31, 2021 | ||||||
(Unaudited)
Security Description | Shares | Value | |||||||||
Financials (0.4%): | |||||||||||
Danske Bank A/S | 4,253 | $ | 73,551 | ||||||||
Tryg A/S | 3,958 | 97,871 | |||||||||
171,422 | |||||||||||
Health Care (0.7%): | |||||||||||
Coloplast A/S, Class B | 458 | 80,714 | |||||||||
Demant A/S (c) | 1,008 | 51,718 | |||||||||
Genmab A/S (c) | 152 | 61,207 | |||||||||
Novo Nordisk A/S, Class B | 879 | 98,920 | |||||||||
292,559 | |||||||||||
Industrials (0.4%): | |||||||||||
AP Moller — Maersk A/S, Class B | 20 | 71,809 | |||||||||
DSV A/S | 320 | 74,841 | |||||||||
Vestas Wind Systems A/S (a) | 1,036 | 31,725 | |||||||||
178,375 | |||||||||||
Materials (0.4%): | |||||||||||
Christian Hansen Holding A/S | 872 | 68,812 | |||||||||
Novozymes A/S, B Shares | 1,121 | 92,204 | |||||||||
161,016 | |||||||||||
Utilities (0.1%): | |||||||||||
Orsted A/S (d) | 321 | 41,049 | |||||||||
1,005,335 | |||||||||||
Finland (1.6%): | |||||||||||
Consumer Staples (0.2%): | |||||||||||
Kesko Oyj, Class B | 2,135 | 71,310 | |||||||||
Energy (0.1%): | |||||||||||
Neste Oyj | 1,061 | 52,372 | |||||||||
Financials (0.5%): | |||||||||||
Nordea Bank Abp | 8,295 | 101,472 | |||||||||
Sampo Oyj, A Shares | 2,125 | 106,585 | |||||||||
208,057 | |||||||||||
Industrials (0.2%): | |||||||||||
Kone Oyj, Class B | 1,168 | 83,821 | |||||||||
Materials (0.4%): | |||||||||||
Stora Enso Oyj, Class R | 3,748 | 68,865 | |||||||||
UPM-Kymmene Oyj | 2,233 | 85,056 | |||||||||
153,921 | |||||||||||
Utilities (0.2%): | |||||||||||
Fortum Oyj | 3,067 | 94,234 | |||||||||
663,715 | |||||||||||
See notes to financial statements.
120
| Victory Portfolios II VictoryShares Developed Enhanced Volatility Wtd ETF | Schedule of Portfolio Investments — continued December 31, 2021 | ||||||
(Unaudited)
Security Description | Shares | Value | |||||||||
France (9.0%): | |||||||||||
Communication Services (0.5%): | |||||||||||
Orange SA | 10,196 | $ | 109,257 | ||||||||
Publicis Groupe SA | 1,271 | 85,657 | |||||||||
Vivendi SE | 1,800 | 24,364 | |||||||||
219,278 | |||||||||||
Consumer Discretionary (0.9%): | |||||||||||
Cie Generale des Etablissements Michelin SCA | 586 | 96,163 | |||||||||
Hermes International | 68 | 118,903 | |||||||||
Kering SA | 88 | 70,816 | |||||||||
LVMH Moet Hennessy Louis Vuitton SE | 113 | 93,520 | |||||||||
379,402 | |||||||||||
Consumer Staples (1.0%): | |||||||||||
Carrefour SA | 3,488 | 63,949 | |||||||||
Danone SA | 1,313 | 81,596 | |||||||||
L'Oreal SA | 246 | 116,765 | |||||||||
Pernod Ricard SA | 575 | 138,443 | |||||||||
400,753 | |||||||||||
Energy (0.4%): | |||||||||||
Bollore SA | 13,475 | 75,472 | |||||||||
TotalEnergies SE | 1,906 | 96,837 | |||||||||
172,309 | |||||||||||
Financials (1.2%): | |||||||||||
Amundi SA (d) | 1,019 | 84,160 | |||||||||
AXA SA | 3,374 | 100,575 | |||||||||
BNP Paribas SA | 1,109 | 76,721 | |||||||||
CNP Assurances | 3,969 | 98,273 | |||||||||
Credit Agricole SA | 5,188 | 74,120 | |||||||||
Societe Generale SA | 1,889 | 64,953 | |||||||||
498,802 | |||||||||||
Health Care (0.6%): | |||||||||||
BioMerieux | 580 | 82,468 | |||||||||
Sanofi | 1,150 | 115,965 | |||||||||
Sartorius Stedim Biotech | 112 | 61,506 | |||||||||
259,939 | |||||||||||
Industrials (2.4%): | |||||||||||
Airbus SE (c) | 444 | 56,792 | |||||||||
Alstom SA | 1,544 | 54,875 | |||||||||
Bouygues SA | 2,256 | 80,873 | |||||||||
Bureau Veritas SA | 4,350 | 144,500 | |||||||||
Cie de Saint-Gobain | 1,109 | 78,109 | |||||||||
Legrand SA | 981 | 114,915 | |||||||||
Safran SA | 529 | 64,834 | |||||||||
Schneider Electric SE | 549 | 107,784 | |||||||||
Teleperformance | 226 | 100,853 | |||||||||
See notes to financial statements.
121
| Victory Portfolios II VictoryShares Developed Enhanced Volatility Wtd ETF | Schedule of Portfolio Investments — continued December 31, 2021 | ||||||
(Unaudited)
Security Description | Shares | Value | |||||||||
Thales SA | 979 | $ | 83,364 | ||||||||
Vinci SA | 787 | 83,239 | |||||||||
970,138 | |||||||||||
Information Technology (0.8%): | |||||||||||
Capgemini SE | 445 | 109,169 | |||||||||
Dassault Systemes SE | 1,750 | 104,211 | |||||||||
Edenred | 1,509 | 69,693 | |||||||||
Worldline SA (c) | 793 | 44,244 | |||||||||
327,317 | |||||||||||
Materials (0.6%): | |||||||||||
Air Liquide SA | 733 | 127,937 | |||||||||
EssilorLuxottica SA | 509 | 108,495 | |||||||||
236,432 | |||||||||||
Utilities (0.6%): | |||||||||||
Electricite de France SA | 3,985 | 46,862 | |||||||||
Engie SA | 6,688 | 99,083 | |||||||||
Veolia Environnement SA | 2,412 | 88,580 | |||||||||
234,525 | |||||||||||
3,698,895 | |||||||||||
Germany (6.6%): | |||||||||||
Communication Services (0.2%): | |||||||||||
Deutsche Telekom AG | 5,110 | 94,820 | |||||||||
Consumer Discretionary (1.0%): | |||||||||||
adidas AG | 184 | 53,036 | |||||||||
Bayerische Motoren Werke AG | 765 | 77,064 | |||||||||
Continental AG (c) | 497 | 52,680 | |||||||||
Daimler AG | 839 | 64,556 | |||||||||
HelloFresh SE (c) | 403 | 30,986 | |||||||||
Puma SE | 676 | 82,727 | |||||||||
Zalando SE (c)(d) | 525 | 42,517 | |||||||||
403,566 | |||||||||||
Consumer Staples (0.2%): | |||||||||||
Beiersdorf AG | 914 | 94,040 | |||||||||
Financials (1.1%): | |||||||||||
Allianz SE, Registered Shares | 391 | 92,427 | |||||||||
Deutsche Bank AG, Registered Shares (c) | 4,703 | 58,989 | |||||||||
Deutsche Boerse AG | 631 | 105,666 | |||||||||
Hannover Rueck SE | 541 | 102,943 | |||||||||
Muenchener Rueckversicherungs-Gesellschaft AG, Class R | 290 | 86,000 | |||||||||
446,025 | |||||||||||
Health Care (0.8%): | |||||||||||
Carl Zeiss Meditec AG | 409 | 86,067 | |||||||||
Fresenius Medical Care AG & Co. KGaA | 1,125 | 73,179 | |||||||||
See notes to financial statements.
122
| Victory Portfolios II VictoryShares Developed Enhanced Volatility Wtd ETF | Schedule of Portfolio Investments — continued December 31, 2021 | ||||||
(Unaudited)
Security Description | Shares | Value | |||||||||
Fresenius SE & Co. KGaA | 1,730 | $ | 69,718 | ||||||||
Merck KGaA | 364 | 94,063 | |||||||||
323,027 | |||||||||||
Industrials (1.2%): | |||||||||||
Brenntag SE | 1,095 | 99,200 | |||||||||
Daimler Truck Holding AG (c) | 419 | 15,402 | |||||||||
Deutsche Post AG, Registered Shares | 1,191 | 76,659 | |||||||||
KION Group AG | 691 | 75,894 | |||||||||
Knorr-Bremse AG | 634 | 62,719 | |||||||||
MTU Aero Engines AG | 263 | 53,712 | |||||||||
Rational AG | 46 | 47,150 | |||||||||
Siemens AG, Registered Shares | 450 | 78,215 | |||||||||
508,951 | |||||||||||
Information Technology (0.4%): | |||||||||||
Infineon Technologies AG | 1,369 | 63,523 | |||||||||
SAP SE | 648 | 92,136 | |||||||||
155,659 | |||||||||||
Materials (1.0%): | |||||||||||
BASF SE | 1,199 | 84,326 | |||||||||
Covestro AG (d) | 1,057 | 65,218 | |||||||||
Evonik Industries AG | 3,392 | 109,935 | |||||||||
HeidelbergCement AG | 892 | 60,439 | |||||||||
Symrise AG | 788 | 116,886 | |||||||||
436,804 | |||||||||||
Real Estate (0.2%): | |||||||||||
Vonovia SE | 1,448 | 79,947 | |||||||||
Utilities (0.5%): | |||||||||||
E.ON SE | 8,349 | 115,878 | |||||||||
RWE AG | 1,960 | 79,701 | |||||||||
195,579 | |||||||||||
2,738,418 | |||||||||||
Hong Kong (3.2%): | |||||||||||
Consumer Staples (0.1%): | |||||||||||
WH Group Ltd. (d) | 60,459 | 37,916 | |||||||||
Financials (0.5%): | |||||||||||
AIA Group Ltd. | 4,982 | 50,221 | |||||||||
Hang Seng Bank Ltd. | 6,012 | 110,027 | |||||||||
Hong Kong Exchanges and Clearing Ltd. | 877 | 51,221 | |||||||||
211,469 | |||||||||||
Health Care (0.1%): | |||||||||||
Sino Biopharmaceutical Ltd. | 60,749 | 42,539 | |||||||||
Industrials (0.5%): | |||||||||||
CK Hutchison Holdings Ltd. | 11,077 | 71,457 | |||||||||
Jardine Matheson Holdings Ltd. | 1,200 | 66,012 | |||||||||
SITC International Holdings Co. Ltd. | 8,000 | 28,933 | |||||||||
See notes to financial statements.
123
| Victory Portfolios II VictoryShares Developed Enhanced Volatility Wtd ETF | Schedule of Portfolio Investments — continued December 31, 2021 | ||||||
(Unaudited)
Security Description | Shares | Value | |||||||||
Techtronic Industries Co. Ltd. | 2,014 | $ | 40,087 | ||||||||
Xinyi Glass Holdings Ltd. | 8,239 | 20,605 | |||||||||
227,094 | |||||||||||
Real Estate (0.8%): | |||||||||||
CK Asset Holdings Ltd. | 12,069 | 76,077 | |||||||||
Henderson Land Development Co. Ltd. | 21,711 | 92,443 | |||||||||
New World Development Co. Ltd. | 19,031 | 75,296 | |||||||||
Sun Hung Kai Properties Ltd. | 6,535 | 79,285 | |||||||||
323,101 | |||||||||||
Utilities (1.2%): | |||||||||||
China Common Rich Renewable Energy Investments Ltd. (c)(e)(f) | 26,000 | 667 | |||||||||
CK Infrastructure Holdings Ltd. | 15,992 | 101,830 | |||||||||
CLP Holdings Ltd. | 15,330 | 154,828 | |||||||||
Hong Kong and China Gas Co. Ltd. | 71,268 | 110,961 | |||||||||
Power Assets Holdings Ltd. (b) | 19,122 | 119,186 | |||||||||
487,472 | |||||||||||
1,329,591 | |||||||||||
Ireland (0.9%): | |||||||||||
Consumer Staples (0.2%): | |||||||||||
Kerry Group PLC | 667 | 85,992 | |||||||||
Industrials (0.3%): | |||||||||||
Experian PLC | 1,874 | 92,111 | |||||||||
Kingspan Group PLC | 448 | 53,550 | |||||||||
145,661 | |||||||||||
Materials (0.4%): | |||||||||||
CRH PLC | 1,417 | 75,042 | |||||||||
Smurfit Kappa Group PLC | 1,419 | 78,249 | |||||||||
153,291 | |||||||||||
384,944 | |||||||||||
Israel (0.5%): | |||||||||||
Financials (0.3%): | |||||||||||
Bank Leumi Le-Israel BM | 12,209 | 131,480 | |||||||||
Information Technology (0.2%): | |||||||||||
Nice Ltd. (c) | 244 | 74,761 | |||||||||
206,241 | |||||||||||
Italy (2.7%): | |||||||||||
Consumer Discretionary (0.2%): | |||||||||||
Moncler SpA | 1,166 | 84,978 | |||||||||
Financials (0.9%): | |||||||||||
Assicurazioni Generali SpA | 5,489 | 116,412 | |||||||||
Intesa Sanpaolo SpA | 33,287 | 86,170 | |||||||||
Poste Italiane SpA (d) | 6,636 | 87,178 | |||||||||
UniCredit SpA | 5,004 | 77,154 | |||||||||
366,914 | |||||||||||
See notes to financial statements.
124
| Victory Portfolios II VictoryShares Developed Enhanced Volatility Wtd ETF | Schedule of Portfolio Investments — continued December 31, 2021 | ||||||
(Unaudited)
Security Description | Shares | Value | |||||||||
Health Care (0.5%): | |||||||||||
Amplifon SpA (a) | 1,239 | $ | 66,927 | ||||||||
DiaSorin SpA | 280 | 53,375 | |||||||||
Recordati Industria Chimica e Farmaceutica SpA | 1,453 | 93,456 | |||||||||
213,758 | |||||||||||
Industrials (0.2%): | |||||||||||
Atlantia SpA (c) | 3,857 | 76,641 | |||||||||
Information Technology (0.1%): | |||||||||||
Nexi SpA (c)(d) | 3,400 | 54,149 | |||||||||
Utilities (0.8%): | |||||||||||
Enel SpA | 9,580 | 76,842 | |||||||||
Snam SpA | 20,935 | 126,311 | |||||||||
Terna — Rete Elettrica Nazionale | 13,727 | 111,169 | |||||||||
314,322 | |||||||||||
1,110,762 | |||||||||||
Japan (17.7%): | |||||||||||
Communication Services (1.3%): | |||||||||||
KDDI Corp. | 3,208 | 93,777 | |||||||||
Nexon Co. Ltd. | 2,800 | 54,145 | |||||||||
Nintendo Co. Ltd. (b) | 100 | 46,648 | |||||||||
Nippon Telegraph & Telephone Corp. | 3,828 | 104,845 | |||||||||
Softbank Corp. | 10,400 | 131,526 | |||||||||
SoftBank Group Corp. | 1,000 | 47,248 | |||||||||
Z Holdings Corp. | 8,330 | 48,339 | |||||||||
526,528 | |||||||||||
Consumer Discretionary (2.5%): | |||||||||||
Bandai Namco Holdings, Inc. | 900 | 70,382 | |||||||||
Bridgestone Corp. | 1,600 | 68,850 | |||||||||
Denso Corp. | 800 | 66,283 | |||||||||
Fast Retailing Co. Ltd. | 100 | 56,786 | |||||||||
Honda Motor Co. Ltd. | 2,300 | 64,594 | |||||||||
Nitori Holdings Co. Ltd. | 430 | 64,401 | |||||||||
Pan Pacific International Holdings Corp. | 3,600 | 49,676 | |||||||||
Panasonic Corp. | 5,500 | 60,495 | |||||||||
Sekisui House Ltd. | 4,272 | 91,710 | |||||||||
Shimano, Inc. | 240 | 63,980 | |||||||||
Sony Group Corp. | 600 | 75,515 | |||||||||
Subaru Corp. | 3,800 | 67,964 | |||||||||
Suzuki Motor Corp. | 1,400 | 53,914 | |||||||||
Toyota Industries Corp. | 808 | 64,564 | |||||||||
Toyota Motor Corp. | 4,720 | 86,410 | |||||||||
ZOZO, Inc. | 1,300 | 40,579 | |||||||||
1,046,103 | |||||||||||
Consumer Staples (1.5%): | |||||||||||
Asahi Group Holdings Ltd. | 1,560 | 60,685 | |||||||||
Japan Tobacco, Inc. | 5,444 | 109,936 | |||||||||
See notes to financial statements.
125
| Victory Portfolios II VictoryShares Developed Enhanced Volatility Wtd ETF | Schedule of Portfolio Investments — continued December 31, 2021 | ||||||
(Unaudited)
Security Description | Shares | Value | |||||||||
Kao Corp. | 1,518 | $ | 79,444 | ||||||||
Kikkoman Corp. | 800 | 67,264 | |||||||||
Kirin Holdings Co. Ltd. | 5,600 | 89,933 | |||||||||
Seven & i Holdings Co. Ltd. | 1,600 | 70,338 | |||||||||
Suntory Beverage & Food Ltd. | 1,800 | 65,107 | |||||||||
Unicharm Corp. | 1,694 | 73,631 | |||||||||
616,338 | |||||||||||
Energy (0.4%): | |||||||||||
Ajinomoto Co., Inc. | 2,700 | 82,096 | |||||||||
ENEOS Holdings, Inc. | 20,100 | 75,203 | |||||||||
157,299 | |||||||||||
Financials (2.5%): | |||||||||||
Dai-ichi Life Holdings, Inc. | 3,188 | 64,461 | |||||||||
Japan Exchange Group, Inc. | 2,600 | 56,924 | |||||||||
Japan Post Bank Co. Ltd. | 9,912 | 90,924 | |||||||||
Japan Post Holdings Co. Ltd. | 9,800 | 76,416 | |||||||||
Mitsubishi UFJ Financial Group, Inc. | 14,800 | 80,415 | |||||||||
Mizuho Financial Group, Inc. | 6,700 | 85,228 | |||||||||
MS&AD Insurance Group Holdings, Inc. | 2,900 | 89,489 | |||||||||
Nomura Holdings, Inc. | 12,800 | 55,837 | |||||||||
ORIX Corp. | 3,668 | 74,868 | |||||||||
Sompo Holdings, Inc. | 2,100 | 88,722 | |||||||||
Sumitomo Mitsui Financial Group, Inc. | 2,384 | 81,733 | |||||||||
Sumitomo Mitsui Trust Holdings, Inc. | 2,600 | 86,878 | |||||||||
Tokio Marine Holdings, Inc. | 1,800 | 100,040 | |||||||||
1,031,935 | |||||||||||
Health Care (2.2%): | |||||||||||
Astellas Pharma, Inc. | 4,452 | 72,406 | |||||||||
Chugai Pharmaceutical Co. Ltd. | 1,790 | 58,131 | |||||||||
Daiichi Sankyo Co. Ltd. | 2,600 | 66,125 | |||||||||
Eisai Co. Ltd. | 554 | 31,460 | |||||||||
Hoya Corp. | 418 | 62,186 | |||||||||
Kyowa Kirin Co. Ltd. | 2,100 | 57,243 | |||||||||
M3, Inc. | 800 | 40,296 | |||||||||
Olympus Corp. | 2,700 | 62,200 | |||||||||
Ono Pharmaceutical Co. Ltd. | 3,284 | 81,550 | |||||||||
Otsuka Holdings Co. Ltd. | 2,000 | 72,498 | |||||||||
Shionogi & Co. Ltd. | 1,228 | 86,753 | |||||||||
Sysmex Corp. | 474 | 64,087 | |||||||||
Takeda Pharmaceutical Co. Ltd. | 3,000 | 81,828 | |||||||||
Terumo Corp. | 1,700 | 71,837 | |||||||||
908,600 | |||||||||||
Industrials (3.0%): | |||||||||||
Daikin Industries Ltd. | 266 | 60,342 | |||||||||
FANUC Corp. | 230 | 48,756 | |||||||||
Hitachi Ltd. | 1,100 | 59,586 | |||||||||
ITOCHU Corp. | 3,100 | 94,825 | |||||||||
Komatsu Ltd. | 2,788 | 65,294 | |||||||||
See notes to financial statements.
126
| Victory Portfolios II VictoryShares Developed Enhanced Volatility Wtd ETF | Schedule of Portfolio Investments — continued December 31, 2021 | ||||||
(Unaudited)
Security Description | Shares | Value | |||||||||
Kubota Corp. | 3,204 | $ | 71,136 | ||||||||
Makita Corp. | 1,200 | 50,949 | |||||||||
Marubeni Corp. | 7,700 | 74,951 | |||||||||
Mitsubishi Corp. | 2,892 | 91,832 | |||||||||
Mitsubishi Electric Corp. | 5,552 | 70,408 | |||||||||
Mitsui & Co. Ltd. (a) | 2,986 | 70,710 | |||||||||
Nidec Corp. | 554 | 65,125 | |||||||||
Nippon Yusen KK | 500 | 38,084 | |||||||||
Recruit Holdings Co. Ltd. | 920 | 55,771 | |||||||||
Secom Co. Ltd. | 1,210 | 84,019 | |||||||||
SG Holdings Co. Ltd. | 2,400 | 56,197 | |||||||||
SMC Corp. | 114 | 76,909 | |||||||||
Toshiba Corp. | 1,100 | 45,239 | |||||||||
Toyota Tsusho Corp. | 1,300 | 59,908 | |||||||||
1,240,041 | |||||||||||
Information Technology (3.0%): | |||||||||||
Advantest Corp. | 600 | 56,865 | |||||||||
Canon, Inc. (a) | 2,614 | 63,662 | |||||||||
FUJIFILM Holdings Corp. | 960 | 71,167 | |||||||||
Fujitsu Ltd. | 400 | 68,620 | |||||||||
Keyence Corp. | 128 | 80,444 | |||||||||
Kyocera Corp. | 1,300 | 81,237 | |||||||||
Lasertec Corp. | 200 | 61,369 | |||||||||
Murata Manufacturing Co. Ltd. | 802 | 63,855 | |||||||||
NEC Corp. | 1,100 | 50,787 | |||||||||
Nomura Research Institute Ltd. | 1,674 | 71,830 | |||||||||
NTT Data Corp. | 3,808 | 81,650 | |||||||||
Obic Co. Ltd. | 400 | 75,124 | |||||||||
Omron Corp. | 800 | 79,715 | |||||||||
Renesas Electronics Corp. (c) | 4,300 | 53,203 | |||||||||
TDK Corp. | 1,900 | 74,176 | |||||||||
Shimadzu Corp. | 1,600 | 67,542 | |||||||||
Tokyo Electron Ltd. | 126 | 72,613 | |||||||||
Yaskawa Electric Corp. | 1,200 | 58,847 | |||||||||
1,232,706 | |||||||||||
Materials (0.7%): | |||||||||||
Asahi Kasei Corp. | 6,800 | 63,914 | |||||||||
Mitsubishi Chemical Holdings Corp. | 7,900 | 58,524 | |||||||||
Nippon Paint Holdings Co. Ltd. | 3,590 | 39,143 | |||||||||
Nippon Steel Corp. | 2,100 | 34,300 | |||||||||
Shin-Etsu Chemical Co. Ltd. | 470 | 81,405 | |||||||||
277,286 | |||||||||||
Real Estate (0.6%): | |||||||||||
Daiwa House Industry Co. Ltd. | 2,500 | 71,907 | |||||||||
Mitsubishi Estate Co. Ltd. | 5,452 | 75,587 | |||||||||
See notes to financial statements.
127
| Victory Portfolios II VictoryShares Developed Enhanced Volatility Wtd ETF | Schedule of Portfolio Investments — continued December 31, 2021 | ||||||
(Unaudited)
Security Description | Shares | Value | |||||||||
Mitsui Fudosan Co. Ltd. | 2,978 | $ | 58,998 | ||||||||
Sumitomo Realty & Development Co. Ltd. | 1,900 | 55,888 | |||||||||
262,380 | |||||||||||
7,299,216 | |||||||||||
Korea, Republic Of (3.1%): | |||||||||||
Communication Services (0.4%): | |||||||||||
Kakao Corp. | 403 | 38,143 | |||||||||
NAVER Corp. | 156 | 49,677 | |||||||||
NCSoft Corp. | 86 | 46,524 | |||||||||
SK Telecom Co. Ltd. | 756 | 36,827 | |||||||||
171,171 | |||||||||||
Consumer Discretionary (0.4%): | |||||||||||
Hyundai Mobis Co. Ltd. | 189 | 40,468 | |||||||||
Hyundai Motor Co. | 266 | 46,773 | |||||||||
Kia Corp. | 584 | 40,388 | |||||||||
LG Electronics, Inc. | 265 | 30,767 | |||||||||
158,396 | |||||||||||
Consumer Staples (0.2%): | |||||||||||
Amorepacific Corp. | 308 | 43,275 | |||||||||
LG Household & Health Care Ltd. | 59 | 54,453 | |||||||||
97,728 | |||||||||||
Financials (0.4%): | |||||||||||
KB Financial Group, Inc. | 1,369 | 63,348 | |||||||||
Samsung Life Insurance Co. Ltd. | 1,083 | 58,405 | |||||||||
Shinhan Financial Group Co. Ltd. | 2,263 | 70,064 | |||||||||
191,817 | |||||||||||
Health Care (0.3%): | |||||||||||
Celltrion Healthcare Co. Ltd. | 402 | 27,116 | |||||||||
Celltrion, Inc. | 177 | 29,565 | |||||||||
Samsung Biologics Co. Ltd. (c)(d) | 72 | 54,700 | |||||||||
111,381 | |||||||||||
Industrials (0.4%): | |||||||||||
HMM Co. Ltd. (c) | 825 | 18,671 | |||||||||
LG Corp. | 543 | 36,958 | |||||||||
Samsung C&T Corp. | 534 | 53,463 | |||||||||
SK, Inc. | 215 | 45,402 | |||||||||
154,494 | |||||||||||
Information Technology (0.7%): | |||||||||||
Samsung Electro-Mechanics Co. Ltd. | 369 | 61,314 | |||||||||
Samsung Electronics Co. Ltd. | 1,269 | 83,596 | |||||||||
Samsung SDI Co. Ltd. | 78 | 42,983 | |||||||||
SK Hynix, Inc. | 566 | 62,381 | |||||||||
SK Square Co. Ltd. (c) | 488 | 27,262 | |||||||||
277,536 | |||||||||||
See notes to financial statements.
128
| Victory Portfolios II VictoryShares Developed Enhanced Volatility Wtd ETF | Schedule of Portfolio Investments — continued December 31, 2021 | ||||||
(Unaudited)
Security Description | Shares | Value | |||||||||
Materials (0.2%): | |||||||||||
LG Chem Ltd. | 71 | $ | 36,736 | ||||||||
POSCO | 184 | 42,494 | |||||||||
79,230 | |||||||||||
Utilities (0.1%): | |||||||||||
Korea Electric Power Corp. | 3,062 | 56,933 | |||||||||
1,298,686 | |||||||||||
Luxembourg (0.6%): | |||||||||||
Energy (0.1%): | |||||||||||
Tenaris SA | 5,257 | 55,117 | |||||||||
Health Care (0.2%): | |||||||||||
Eurofins Scientific SE (d) | 540 | 66,883 | |||||||||
Materials (0.1%): | |||||||||||
ArcelorMittal SA | 1,469 | 47,067 | |||||||||
Real Estate (0.2%): | |||||||||||
Aroundtown SA (a) | 10,356 | 62,719 | |||||||||
231,786 | |||||||||||
Netherlands (4.0%): | |||||||||||
Communication Services (0.3%): | |||||||||||
Koninklijke KPN NV | 27,188 | 84,495 | |||||||||
Universal Music Group NV | 1,800 | 50,777 | |||||||||
135,272 | |||||||||||
Consumer Discretionary (0.1%): | |||||||||||
Prosus NV | 574 | 48,047 | |||||||||
Consumer Staples (1.0%): | |||||||||||
Davide Campari-Milano NV | 7,631 | 111,672 | |||||||||
Heineken Holding NV | 1,065 | 98,385 | |||||||||
Heineken NV | 869 | 97,799 | |||||||||
Koninklijke Ahold Delhaize NV | 3,308 | 113,483 | |||||||||
421,339 | |||||||||||
Financials (0.8%): | |||||||||||
ABN AMRO Bank NV (d) | 4,095 | 60,211 | |||||||||
Euronext NV (d) | 765 | 79,467 | |||||||||
ING Groep NV | 4,605 | 64,176 | |||||||||
NN Group NV | 1,908 | 103,412 | |||||||||
307,266 | |||||||||||
Health Care (0.2%): | |||||||||||
Koninklijke Philips NV | 2,005 | 74,786 | |||||||||
Industrials (0.5%): | |||||||||||
Randstad NV | 1,255 | 85,778 | |||||||||
Wolters Kluwer NV | 1,045 | 123,245 | |||||||||
209,023 | |||||||||||
See notes to financial statements.
129
| Victory Portfolios II VictoryShares Developed Enhanced Volatility Wtd ETF | Schedule of Portfolio Investments — continued December 31, 2021 | ||||||
(Unaudited)
Security Description | Shares | Value | |||||||||
Information Technology (0.6%): | |||||||||||
Adyen NV (c)(d) | 16 | $ | 42,103 | ||||||||
ASM International NV | 142 | 62,834 | |||||||||
| ASML Holding NV | 77 | 61,947 | |||||||||
STMicroelectronics NV | 1,497 | 73,910 | |||||||||
240,794 | |||||||||||
Materials (0.5%): | |||||||||||
Akzo Nobel NV | 837 | 91,949 | |||||||||
Koninklijke DSM NV | 547 | 123,295 | |||||||||
215,244 | |||||||||||
1,651,771 | |||||||||||
New Zealand (0.3%): | |||||||||||
Health Care (0.2%): | |||||||||||
Fisher & Paykel Healthcare Corp. Ltd. | 2,542 | 57,019 | |||||||||
Information Technology (0.1%): | |||||||||||
Xero Ltd. (c) | 496 | 51,030 | |||||||||
108,049 | |||||||||||
Norway (1.4%): | |||||||||||
Communication Services (0.3%): | |||||||||||
Telenor ASA | 7,398 | 116,480 | |||||||||
Consumer Staples (0.2%): | |||||||||||
Mowi ASA | 3,300 | 78,237 | |||||||||
Financials (0.5%): | |||||||||||
DNB Bank ASA | 4,306 | 98,810 | |||||||||
Gjensidige Forsikring ASA | 4,603 | 111,900 | |||||||||
210,710 | |||||||||||
Materials (0.4%): | |||||||||||
Norsk Hydro ASA | 8,037 | 63,471 | |||||||||
Yara International ASA | 1,833 | 92,661 | |||||||||
156,132 | |||||||||||
561,559 | |||||||||||
Portugal (0.4%): | |||||||||||
Consumer Staples (0.2%): | |||||||||||
Jeronimo Martins SGPS SA | 4,246 | 97,156 | |||||||||
Utilities (0.2%): | |||||||||||
EDP — Energias de Portugal SA | 13,825 | 76,047 | |||||||||
173,203 | |||||||||||
Singapore (1.4%): | |||||||||||
Communication Services (0.3%): | |||||||||||
Singapore Telecommunications Ltd. | 62,600 | 107,795 | |||||||||
Consumer Staples (0.2%): | |||||||||||
Wilmar International Ltd. | 31,362 | 96,370 | |||||||||
See notes to financial statements.
130
| Victory Portfolios II VictoryShares Developed Enhanced Volatility Wtd ETF | Schedule of Portfolio Investments — continued December 31, 2021 | ||||||
(Unaudited)
Security Description | Shares | Value | |||||||||
Financials (0.9%): | |||||||||||
DBS Group Holdings Ltd. | 4,678 | $ | 113,400 | ||||||||
Oversea-Chinese Banking Corp. Ltd. | 13,538 | 114,550 | |||||||||
United Overseas Bank Ltd. | 6,892 | 137,604 | |||||||||
365,554 | |||||||||||
569,719 | |||||||||||
Spain (1.5%): | |||||||||||
Communication Services (0.2%): | |||||||||||
Telefonica SA | 14,332 | 62,847 | |||||||||
Consumer Discretionary (0.2%): | |||||||||||
Industria de Diseno Textil SA | 2,374 | 77,104 | |||||||||
Energy (0.2%): | |||||||||||
Repsol SA | 5,476 | 65,056 | |||||||||
Financials (0.4%): | |||||||||||
Banco Bilbao Vizcaya Argentaria SA | 9,219 | 55,098 | |||||||||
Banco Santander SA | 16,823 | 56,314 | |||||||||
CaixaBank SA | 21,283 | 58,488 | |||||||||
169,900 | |||||||||||
Health Care (0.1%): | |||||||||||
Grifols SA | 3,024 | 58,092 | |||||||||
Utilities (0.4%): | |||||||||||
Endesa SA | 3,667 | 84,325 | |||||||||
Iberdrola SA | 7,897 | 93,585 | |||||||||
177,910 | |||||||||||
610,909 | |||||||||||
Sweden (5.0%): | |||||||||||
Consumer Discretionary (0.3%): | |||||||||||
Evolution AB (d) | 252 | 35,882 | |||||||||
Hennes & Mauritz AB, Class B | 3,789 | 74,698 | |||||||||
110,580 | |||||||||||
Consumer Staples (0.5%): | |||||||||||
Essity AB, Class B | 3,461 | 113,183 | |||||||||
Swedish Match AB | 10,144 | 80,878 | |||||||||
194,061 | |||||||||||
Financials (1.5%): | |||||||||||
EQT AB | 942 | 51,412 | |||||||||
Industrivarden AB, Class C | 2,779 | 87,403 | |||||||||
Investor AB, Class B | 4,427 | 111,618 | |||||||||
L E Lundbergforetagen AB, Class B | 1,561 | 87,788 | |||||||||
Skandinaviska Enskilda Banken AB, Class A | 6,920 | 96,411 | |||||||||
Svenska Handelsbanken AB, Class A | 8,922 | 96,658 | |||||||||
Swedbank AB, Class A | 4,598 | 92,693 | |||||||||
623,983 | |||||||||||
See notes to financial statements.
131
| Victory Portfolios II VictoryShares Developed Enhanced Volatility Wtd ETF | Schedule of Portfolio Investments — continued December 31, 2021 | ||||||
(Unaudited)
Security Description | Shares | Value | |||||||||
Industrials (1.9%): | |||||||||||
Alfa Laval AB | 2,049 | $ | 82,659 | ||||||||
Assa Abloy AB, Class B | 2,815 | 86,074 | |||||||||
Atlas Copco AB, Class A | 1,261 | 87,361 | |||||||||
Epiroc AB, Class A | 3,600 | 91,345 | |||||||||
Indutrade AB | 2,447 | 75,092 | |||||||||
Lifco AB, Class B | 2,573 | 77,107 | |||||||||
Nibe Industrier AB, Class B | 4,565 | 69,109 | |||||||||
Sandvik AB | 2,791 | 78,048 | |||||||||
Skanska AB, Class B | 2,899 | 75,163 | |||||||||
Volvo AB, Class B | 3,270 | 75,895 | |||||||||
797,853 | |||||||||||
Information Technology (0.4%): | |||||||||||
Hexagon AB, Class B | 5,226 | 83,108 | |||||||||
Sinch AB (c)(d) | 1,679 | 21,394 | |||||||||
Telefonaktiebolaget LM Ericsson, Class B | 6,489 | 71,686 | |||||||||
176,188 | |||||||||||
Materials (0.2%): | |||||||||||
Svenska Cellulosa AB SCA, Class B | 4,808 | 85,563 | |||||||||
Real Estate (0.2%): | |||||||||||
Fastighets AB Balder, Class B (c) | 1,151 | 83,053 | |||||||||
2,071,281 | |||||||||||
Switzerland (8.1%): | |||||||||||
Communication Services (0.3%): | |||||||||||
Swisscom AG, Registered Shares | 218 | 123,156 | |||||||||
Consumer Discretionary (0.4%): | |||||||||||
Cie Financiere Richemont SA, Registered Shares | 674 | 101,333 | |||||||||
The Swatch Group AG | 284 | 86,987 | |||||||||
188,320 | |||||||||||
Consumer Staples (1.3%): | |||||||||||
Barry Callebaut AG, Registered Shares | 51 | 124,071 | |||||||||
Chocoladefabriken Lindt & Spruengli AG | 10 | 138,654 | |||||||||
Coca-Cola HBC AG | 2,764 | 95,571 | |||||||||
Nestle SA, Registered Shares | 1,205 | 168,586 | |||||||||
526,882 | |||||||||||
Financials (1.6%): | |||||||||||
Credit Suisse Group AG, Registered Shares | 6,176 | 60,153 | |||||||||
Julius Baer Group Ltd. | 1,219 | 81,873 | |||||||||
Partners Group Holding AG | 54 | 89,664 | |||||||||
Swiss Life Holding AG | 195 | 119,667 | |||||||||
Swiss Re AG | 1,031 | 102,161 | |||||||||
UBS Group AG | 5,154 | 92,907 | |||||||||
Zurich Insurance Group AG | 256 | 112,529 | |||||||||
658,954 | |||||||||||
See notes to financial statements.
132
| Victory Portfolios II VictoryShares Developed Enhanced Volatility Wtd ETF | Schedule of Portfolio Investments — continued December 31, 2021 | ||||||
(Unaudited)
Security Description | Shares | Value | |||||||||
Health Care (1.4%): | |||||||||||
Alcon, Inc. | 940 | $ | 83,319 | ||||||||
Lonza Group AG, Registered Shares | 108 | 90,299 | |||||||||
Novartis AG, Registered Shares | 1,392 | 122,681 | |||||||||
Roche Holding AG | 280 | 116,531 | |||||||||
Sonova Holding AG | 182 | 71,489 | |||||||||
Straumann Holding AG, Class R | 39 | 82,932 | |||||||||
567,251 | |||||||||||
Industrials (1.6%): | |||||||||||
ABB Ltd., Registered Shares | 2,665 | 102,106 | |||||||||
Geberit AG, Registered Shares | 144 | 117,805 | |||||||||
Kuehne + Nagel International AG, Class R | 238 | 76,921 | |||||||||
Schindler Holding AG | 325 | 87,592 | |||||||||
SGS SA, Registered Shares | 51 | 170,597 | |||||||||
VAT Group AG (d) | 176 | 87,797 | |||||||||
642,818 | |||||||||||
Information Technology (0.2%): | |||||||||||
Logitech International SA, Class R | 577 | 48,699 | |||||||||
Temenos AG | 351 | 48,571 | |||||||||
97,270 | |||||||||||
Materials (1.3%): | |||||||||||
EMS-Chemie Holding AG | 105 | 117,692 | |||||||||
Givaudan SA, Registered Shares | 25 | 131,518 | |||||||||
Glencore PLC | 12,006 | 60,921 | |||||||||
Holcim Ltd. | 1,719 | 87,771 | |||||||||
Sika AG, Registered Shares | 293 | 122,295 | |||||||||
520,197 | |||||||||||
3,324,848 | |||||||||||
United Kingdom (9.4%): | �� | ||||||||||
Communication Services (0.2%): | |||||||||||
BT Group PLC | 26,332 | 60,420 | |||||||||
Consumer Discretionary (0.6%): | |||||||||||
Entain PLC (c) | 1,735 | 39,517 | |||||||||
JD Sports Fashion PLC (c) | 20,785 | 61,264 | |||||||||
Next PLC | 638 | 70,368 | |||||||||
Persimmon PLC | 1,629 | 62,961 | |||||||||
234,110 | |||||||||||
Consumer Staples (1.4%): | |||||||||||
Associated British Foods PLC | 2,774 | 75,382 | |||||||||
British American Tobacco PLC | 2,360 | 87,303 | |||||||||
Diageo PLC | 2,188 | 119,507 | |||||||||
Imperial Brands PLC | 3,893 | 85,164 | |||||||||
Tesco PLC | 29,293 | 114,923 | |||||||||
Unilever PLC | 1,833 | 97,873 | |||||||||
580,152 | |||||||||||
See notes to financial statements.
133
| Victory Portfolios II VictoryShares Developed Enhanced Volatility Wtd ETF | Schedule of Portfolio Investments — continued December 31, 2021 | ||||||
(Unaudited)
Security Description | Shares | Value | |||||||||
Energy (0.3%): | |||||||||||
| BP PLC | 14,211 | $ | 63,561 | ||||||||
Royal Dutch Shell PLC, Class A | 3,382 | 74,228 | |||||||||
137,789 | |||||||||||
Financials (2.2%): | |||||||||||
| 3i Group PLC | 4,568 | 89,576 | |||||||||
Admiral Group PLC | 1,973 | 84,294 | |||||||||
Aviva PLC | 15,753 | 87,492 | |||||||||
Barclays PLC | 23,458 | 59,365 | |||||||||
HSBC Holdings PLC | 14,268 | 86,630 | |||||||||
Legal & General Group PLC | 18,566 | 74,749 | |||||||||
Lloyds Banking Group PLC | 106,510 | 68,899 | |||||||||
London Stock Exchange Group PLC | 584 | 54,770 | |||||||||
NatWest Group PLC | 21,349 | 65,209 | |||||||||
Schroders PLC | 1,884 | 90,767 | |||||||||
St James's Place PLC | 3,836 | 87,395 | |||||||||
Standard Chartered PLC | 11,232 | 68,158 | |||||||||
917,304 | |||||||||||
Health Care (0.7%): | |||||||||||
AstraZeneca PLC | 786 | 92,308 | |||||||||
GlaxoSmithKline PLC (b) | 5,362 | 116,582 | |||||||||
Smith & Nephew PLC | 3,942 | 69,005 | |||||||||
277,895 | |||||||||||
Industrials (2.0%): | |||||||||||
Ashtead Group PLC | 1,129 | 90,787 | |||||||||
BAE Systems PLC | 12,956 | 96,399 | |||||||||
Bunzl PLC | 2,627 | 102,566 | |||||||||
Ferguson PLC | 705 | 125,033 | |||||||||
Intertek Group PLC | 1,150 | 87,620 | |||||||||
RELX PLC | 3,533 | 114,845 | |||||||||
Rentokil Initial PLC | 11,130 | 87,964 | |||||||||
Rolls-Royce Holdings PLC (c) | 27,045 | 44,974 | |||||||||
Spirax-Sarco Engineering PLC | 422 | 91,661 | |||||||||
841,849 | |||||||||||
Information Technology (0.4%): | |||||||||||
AVEVA Group PLC | 1,213 | 55,879 | |||||||||
Halma PLC | 2,340 | 101,335 | |||||||||
157,214 | |||||||||||
Materials (1.1%): | |||||||||||
Anglo American PLC | 1,111 | 45,346 | |||||||||
Antofagasta PLC | 2,778 | 50,321 | |||||||||
BHP Group PLC | 2,047 | 60,931 | |||||||||
Croda International PLC | 845 | 115,727 | |||||||||
Evraz PLC (b) | 6,982 | 56,844 | |||||||||
Mondi PLC | 2,992 | 73,937 | |||||||||
Rio Tinto PLC | 801 | 53,029 | |||||||||
456,135 | |||||||||||
See notes to financial statements.
134
| Victory Portfolios II VictoryShares Developed Enhanced Volatility Wtd ETF | Schedule of Portfolio Investments — continued December 31, 2021 | ||||||
(Unaudited)
Security Description | Shares | Value | |||||||||
Utilities (0.5%): | |||||||||||
National Grid PLC | 8,822 | $ | 126,528 | ||||||||
SSE PLC | 3,563 | 79,512 | |||||||||
206,040 | |||||||||||
3,868,908 | |||||||||||
Total Common Stocks (Cost $34,314,854) | 40,976,030 | ||||||||||
Investment Companies (0.1%) | |||||||||||
United States (0.1%): | |||||||||||
BlackRock Liquidity Funds T-Fund, Institutional Shares, 0.01% (g) | 48,398 | 48,398 | |||||||||
Total Investment Companies (Cost $48,398) | 48,398 | ||||||||||
Collateral for Securities Loaned^ (3.3%) | |||||||||||
United States (3.3%): | |||||||||||
BlackRock Liquidity Funds TempFund, Institutional Class, 0.04% (g) | 32,185 | 32,185 | |||||||||
| Fidelity Investments Money Market Government Portfolio, Institutional Shares, 0.01% (g) | 632,115 | 632,115 | |||||||||
| Goldman Sachs Financial Square Prime Obligations Fund, Institutional Shares, 0.02% (g) | 16,062 | 16,062 | |||||||||
JPMorgan Prime Money Market Fund, Capital Shares, 0.07% (g) | 128,072 | 128,072 | |||||||||
| Morgan Stanley Institutional Liquidity Prime Portfolio, Institutional Class, 0.06% (g) | 575,837 | 575,837 | |||||||||
Total Collateral for Securities Loaned (Cost $1,384,271) | 1,384,271 | ||||||||||
Total Investments (Cost $35,747,523) — 102.7% | 42,408,699 | ||||||||||
Liabilities in excess of other assets — (2.7)% | (1,122,971 | ) | |||||||||
NET ASSETS — 100.00% | $ | 41,285,728 | |||||||||
^ Purchased with cash collateral from securities on loan.
(a) All or a portion of this security is on loan.
(b) All or a portion of this security has been segregated as collateral for derivative instruments.
(c) Non-income producing security.
(d) Rule 144A security or other security that is restricted as to resale to institutional investors. The Fund's Adviser has deemed this security to be liquid (unless otherwise noted as illiquid) based upon procedures approved by the Board of Trustees. As of December 31, 2021, the fair value of these securities was $1,043,128 and amounted to 2.5% of net assets.
(e) Security was fair valued based upon procedures approved by the Board of Trustees and represents less than 0.05% of net assets as of December 31, 2021. This security is classified as Level 3 within the fair value hierarchy. (See Note 2 in the Notes to Financial Statements)
(f) The Fund's Adviser has deemed this security to be illiquid based upon procedures approved by the Board of Trustees. As of December 31, 2021, illiquid securities were less than 0.05% of net assets.
(g) Rate disclosed is the daily yield on December 31, 2021.
PLC — Public Limited Company
See notes to financial statements.
135
| Victory Portfolios II VictoryShares Developed Enhanced Volatility Wtd ETF | Schedule of Portfolio Investments — continued December 31, 2021 | ||||||
(Unaudited)
Futures Contracts Purchased
| Number of Contracts | Expiration Date | Notional Amount | Value | Unrealized Appreciation (Depreciation) | |||||||||||||||||||
E-Mini MSCI EAFE Index Futures | 1 | 3/18/22 | $ | 114,254 | $ | 116,090 | $ | 1,836 | |||||||||||||||
Total unrealized appreciation | $ | 1,836 | |||||||||||||||||||||
Total unrealized depreciation | — | ||||||||||||||||||||||
Total net unrealized appreciation (depreciation) | $ | 1,836 | |||||||||||||||||||||
See notes to financial statements.
136
| Victory Portfolios II VictoryShares Nasdaq Next 50 ETF | Schedule of Portfolio Investments December 31, 2021 | ||||||
(Unaudited)
Security Description | Shares | Value | |||||||||
Common Stocks (99.6%) | |||||||||||
Communication Services (14.8%): | |||||||||||
Fox Corp., Class A | 42,396 | $ | 1,564,412 | ||||||||
Fox Corp., Class B | 32,985 | 1,130,396 | |||||||||
Liberty Broadband Corp., Class C (a) | 19,710 | 3,175,281 | |||||||||
Roku, Inc. (a) | 15,578 | 3,554,900 | |||||||||
Take-Two Interactive Software, Inc. (a) | 15,259 | 2,711,829 | |||||||||
ViacomCBS, Inc., Class B | 80,293 | 2,423,243 | |||||||||
Yandex NV, Class A (a) | 42,728 | 2,585,044 | |||||||||
Zillow Group, Inc., Class A (a) | 8,122 | 505,351 | |||||||||
Zillow Group, Inc., Class C (a) | 24,776 | 1,581,948 | |||||||||
ZoomInfo Technologies, Inc. (a) | 53,362 | 3,425,840 | |||||||||
22,658,244 | |||||||||||
Consumer Discretionary (13.6%): | |||||||||||
Caesars Entertainment, Inc. (a) | 28,292 | 2,646,151 | |||||||||
DraftKings, Inc., Class A (a) | 53,791 | 1,477,639 | |||||||||
Etsy, Inc. (a) | 16,779 | 3,673,594 | |||||||||
Expedia Group, Inc. (a) | 19,323 | 3,492,052 | |||||||||
Pool Corp. | 5,305 | 3,002,630 | |||||||||
Tractor Supply Co. | 15,063 | 3,594,032 | |||||||||
Ulta Beauty, Inc. (a) | 7,194 | 2,966,374 | |||||||||
20,852,472 | |||||||||||
Consumer Staples (2.2%): | |||||||||||
Coca-Cola Europacific Partners PLC | 60,332 | 3,374,369 | |||||||||
Electronic Equipment, Instruments & Components (7.0%): | |||||||||||
CDW Corp. | 17,962 | 3,678,258 | |||||||||
Trimble, Inc. (a) | 33,219 | 2,896,365 | |||||||||
Zebra Technologies Corp. (a) | 7,073 | 4,209,849 | |||||||||
10,784,472 | |||||||||||
Energy (1.7%): | |||||||||||
Diamondback Energy, Inc. | 23,977 | 2,585,919 | |||||||||
Health Care (19.5%): | |||||||||||
Alnylam Pharmaceuticals, Inc. (a) | 15,828 | 2,684,112 | |||||||||
AstraZeneca PLC, ADR | 80,251 | 4,674,621 | |||||||||
BeiGene Ltd., ADR (a) | 6,568 | 1,779,468 | |||||||||
BioNTech SE, ADR (a) | 11,660 | 3,005,948 | |||||||||
Bio-Techne Corp. | 5,200 | 2,690,168 | |||||||||
Cerner Corp. | 38,938 | 3,616,172 | |||||||||
Hologic, Inc. (a) | 33,274 | 2,547,458 | |||||||||
Horizon Therapeutics PLC (a) | 30,018 | 3,234,740 | |||||||||
ICON PLC (a) | 10,772 | 3,336,088 | |||||||||
Insulet Corp. (a) | 9,127 | 2,428,421 | |||||||||
29,997,196 | |||||||||||
Industrials (10.0%): | |||||||||||
CoStar Group, Inc. (a) (b) | 52,267 | 4,130,661 | |||||||||
Expeditors International of Washington, Inc. | 22,419 | 3,010,648 | |||||||||
J.B. Hunt Transport Services, Inc. | 13,898 | 2,840,751 | |||||||||
Old Dominion Freight Line, Inc. | 15,221 | 5,454,902 | |||||||||
15,436,962 | |||||||||||
See notes to financial statements.
137
| Victory Portfolios II VictoryShares Nasdaq Next 50 ETF | Schedule of Portfolio Investments — continued December 31, 2021 | ||||||
(Unaudited)
Security Description | Shares | Value | |||||||||
IT Services (6.5%): | |||||||||||
Affirm Holdings, Inc. (a) | 27,553 | $ | 2,770,730 | ||||||||
Akamai Technologies, Inc. (a) | 21,503 | 2,516,711 | |||||||||
MongoDB, Inc. (a) | 8,758 | 4,636,047 | |||||||||
9,923,488 | |||||||||||
Semiconductors & Semiconductor Equipment (13.3%): | |||||||||||
Enphase Energy, Inc. (a) | 17,855 | 3,266,394 | |||||||||
Entegris, Inc. | 17,934 | 2,485,294 | |||||||||
Monolithic Power Systems, Inc. | 6,100 | 3,009,313 | |||||||||
ON Semiconductor Corp. (a) | 57,018 | 3,872,662 | |||||||||
Qorvo, Inc. (a) | 14,587 | 2,281,261 | |||||||||
SolarEdge Technologies, Inc. (a) | 6,951 | 1,950,242 | |||||||||
Teradyne, Inc. | 21,573 | 3,527,833 | |||||||||
20,392,999 | |||||||||||
Software (7.1%): | |||||||||||
AppLovin Corp., Class A (a) | 29,964 | 2,824,406 | |||||||||
SS&C Technologies Holdings, Inc. | 33,651 | 2,758,709 | |||||||||
The Trade Desk, Inc., Class A (a) | 57,712 | 5,288,728 | |||||||||
10,871,843 | |||||||||||
Technology Hardware, Storage & Peripherals (3.9%): | |||||||||||
NetApp, Inc. | 29,596 | 2,722,536 | |||||||||
Seagate Technology Holdings PLC | 29,464 | 3,328,843 | |||||||||
6,051,379 | |||||||||||
Total Common Stocks (Cost $133,079,382) | 152,929,343 | ||||||||||
Total Investments (Cost $133,079,382) — 99.6% | 152,929,343 | ||||||||||
Other assets in excess of liabilities — 0.4% | 594,761 | ||||||||||
NET ASSETS — 100.00% | $ | 153,524,104 | |||||||||
(a) Non-income producing security.
(b) All or a portion of this security has been segregated as collateral for derivative instruments.
ADR — American Depositary Receipt
PLC — Public Limited Company
Futures Contracts Purchased
| Number of Contracts | Expiration Date | Notional Amount | Value | Unrealized Appreciation (Depreciation) | |||||||||||||||||||
NASDAQ 100 E-Mini Futures | 2 | 3/18/22 | $ | 638,152 | $ | 652,830 | $ | 14,678 | |||||||||||||||
Total unrealized appreciation | $ | 14,678 | |||||||||||||||||||||
Total unrealized depreciation | — | ||||||||||||||||||||||
Total net unrealized appreciation (depreciation) | $ | 14,678 | |||||||||||||||||||||
See notes to financial statements.
138
| Victory Portfolios II VictoryShares ESG Core Plus Bond ETF | Schedule of Portfolio Investments December 31, 2021 | ||||||
(Unaudited)
Security Description | Principal Amount | Value | |||||||||
Asset-Backed Securities (10.6%) | |||||||||||
| AmeriCredit Automobile Receivables Trust, Series 2021-3, Class C, 1.41%, 8/18/27, Callable 9/18/25 @ 100 | $ | 500,000 | $ | 496,331 | |||||||
| BCC Funding XVII LLC, Series 2020-1, Class B, 1.46%, 9/22/25, Callable 7/20/24 @ 100 (a) | 250,000 | 249,650 | |||||||||
CARDS II Trust, Series 2021-1A, Class C, 1.20%, 4/15/27 (a) | 540,000 | 533,082 | |||||||||
| Carvana Auto Receivables Trust, Series 2021-P4, Class B, 1.98%, 2/10/28, Callable 4/10/27 @ 100 | 500,000 | 499,663 | |||||||||
| Carvana Auto Receivables Trust, Series 2021-N4, Class D, 2.30%, 9/11/28, Callable 12/10/26 @ 100 | 875,000 | 874,640 | |||||||||
| Carvana Auto Receivables Trust, Series 2019-2A, Class D, 3.28%, 1/15/25, Callable 7/15/24 @ 100 (a) | 250,000 | 254,061 | |||||||||
| CCG Receivables Trust, Series 2021-2, Class C, 1.50%, 3/14/29, Callable 5/14/25 @ 100 (a) | 250,000 | 247,346 | |||||||||
| Credit Acceptance Auto Loan Trust, Series 2021-4, Class B, 1.74%, 12/16/30, Callable 4/15/25 @ 100 (a) | 320,000 | 317,377 | |||||||||
| DB Master Finance LLC, Series 2021-1A, Class A2II, 2.49%, 11/20/51, Callable 11/20/25 @ 100 (a) | 600,000 | 596,065 | |||||||||
| Diamond Issuer, Series 2021-1A, Class B, 2.70%, 11/20/51, Callable 11/20/25 @ 100 (a) | 654,000 | 649,428 | |||||||||
| Drive Auto Receivables Trust, Series 2021-3, Class C, 1.47%, 1/15/27, Callable 7/15/26 @ 100 | 500,000 | 496,657 | |||||||||
| Drive Auto Receivables Trust, Series 2020-2, Class C, 2.28%, 8/17/26, Callable 6/15/23 @ 100 | 420,000 | 425,542 | |||||||||
| DT Auto Owner Trust, Series 2020-2A, Class D, 4.73%, 3/16/26, Callable 1/15/24 @ 100 (a) | 500,000 | 527,991 | |||||||||
| Evergreen Credit Card Trust, Series 2021-1, Class B, 1.15%, 10/15/26, Callable 11/15/24 @ 100 (a) | 391,000 | 387,471 | |||||||||
| Evergreen Credit Card Trust, Series 2021-1, Class C, 1.42%, 10/15/26, Callable 11/15/24 @ 100 (a) | 319,000 | 316,319 | |||||||||
| Exeter Automobile Receivables Trust 2019-4, Series 2019-4A, Class D, 2.58%, 9/15/25, Callable 10/15/23 @ 100 (a) | 250,000 | 254,187 | |||||||||
| First Investors Auto Owner Trust, Series 2019-1A, Class D, 3.55%, 4/15/25, Callable 1/15/23 @ 100 (a) | 250,000 | 254,960 | |||||||||
FirstKey Homes Trust, Series 2021-SFR3, Class A, 2.14%, 12/17/38 (a) | 750,000 | 748,149 | |||||||||
FirstKey Homes Trust, Series 2021-SFR3, Class D, 2.79%, 12/17/38 (a) | 750,000 | 743,026 | |||||||||
FirstKey Homes Trust, Series 2021-SFR3, Class B, 2.44%, 12/17/38 (a) | 500,000 | 495,345 | |||||||||
| Flagship Credit Auto Trust, Series 2018-4, Class D, 4.33%, 12/16/24, Callable 1/15/24 @ 100 (a) | 500,000 | 515,955 | |||||||||
| Flagship Credit Auto Trust, Series 2018-3, Class D, 4.15%, 12/16/24, Callable 10/15/23 @ 100 (a) | 350,000 | 360,777 | |||||||||
| Flagship Credit Auto Trust, Series 4, Class C, 1.96%, 12/15/27, Callable 3/15/26 @ 100 (a) | 500,000 | 498,272 | |||||||||
| Ford Credit Auto Owner Trust, Series 2021-2, Class C, 2.11%, 5/15/34, Callable 11/15/26 @ 100 (a) | 500,000 | 495,231 | |||||||||
| Hyundai Auto Receivables Trust 2021-C, Series 2021-C, Class C, 1.66%, 6/15/28, Callable 12/15/25 @ 100 | 500,000 | 493,645 | |||||||||
| JPMorgan Chase Bank NA, Series 2020-2, Class C, 1.14%, 2/25/28, Callable 4/25/24 @ 100 (a) | 286,983 | 287,049 | |||||||||
See notes to financial statements.
139
| Victory Portfolios II VictoryShares ESG Core Plus Bond ETF | Schedule of Portfolio Investments — continued December 31, 2021 | ||||||
(Unaudited)
Security Description | Principal Amount | Value | |||||||||
| JPMorgan Chase Bank NA, Series 2021-2, Class B, 0.89%, 12/26/28, Callable 8/25/24 @ 100 (a) | $ | 214,997 | $ | 213,826 | |||||||
Master Credit Card Trust, Series 2021-1A, Class C, 1.06%, 11/21/25 (a) | 1,000,000 | 984,686 | |||||||||
| New Economy Assets Phase 1 Sponsor LLC, Series 2021-1, Class B1, 2.41%, 10/20/61, Callable 10/20/24 @ 100 (a) | 366,000 | 366,843 | |||||||||
| New Economy Assets Phase 1 Sponsor LLC, Series 2021-1, Class A1, 1.91%, 10/20/61, Callable 10/20/24 @ 100 (a) | 677,000 | 663,806 | |||||||||
| Oscar U.S. Funding XII LLC, Series 1A, Class A4, 1.00%, 4/10/28, Callable 2/10/25 @ 100 (a) | 250,000 | 244,969 | |||||||||
| Pawnee Equipment Receivables LLC, Series 2021-1, Class B, 1.82%, 7/15/27, Callable 11/15/25 @ 100 (a) | 136,000 | 134,709 | |||||||||
| Santander Bank NA, Series 2021-1A, Class C, 3.27%, 12/15/31, Callable 6/15/25 @ 100 (a) | 750,000 | 749,323 | |||||||||
| Santander Bank NA, Series 2021-1A, Class B, 1.83%, 12/15/31, Callable 6/15/25 @ 100 (a) | 800,000 | 799,262 | |||||||||
| Santander Consumer Auto Receivables Trust, Series 2020-AA, Class D, 5.49%, 4/15/26, Callable 11/15/23 @ 100 (a) | 250,000 | 265,342 | |||||||||
| Santander Drive Auto Receivables Trust, Series 2021-4, Class C, 1.26%, 2/16/27, Callable 9/15/25 @ 100 | 250,000 | 247,329 | |||||||||
| SCF Equipment Leasing LLC, Series 2021-1A, Class D, 1.93%, 9/20/30, Callable 5/20/23 @ 100 (a) | 500,000 | 488,638 | |||||||||
Trillium Credit Card Trust II, Series 2021-1A, Class C, 2.42%, 10/26/29 (a) | 744,000 | 741,057 | |||||||||
| Vantage Data Centers LLC, Series 2020-2A, Class A2, 1.99%, 9/15/45, Callable 9/15/25 @ 100 (a) | 453,000 | 441,213 | |||||||||
| Verizon Master Trust, Series 2021-2, Class C, 1.38%, 4/20/28, Callable 10/20/24 @ 100 | 500,000 | 496,785 | |||||||||
| Westlake Automobile Receivables Trust, Series 2021-3A, Class C, 1.58%, 1/15/27, Callable 12/15/24 @ 100 (a) | 500,000 | 499,057 | |||||||||
| Westlake Automobile Receivables Trust, Series 2019-2A, Class E, 4.02%, 4/15/25, Callable 3/15/23 @ 100 (a) | 1,250,000 | 1,281,834 | |||||||||
Total Asset-Backed Securities (Cost $20,769,411) | 20,636,898 | ||||||||||
Collateralized Mortgage Obligations (16.4%) | |||||||||||
| 37 Capital CLO I, Series 2021-1A, Class C, 2.45% (US0003M+225bps), 10/15/34, Callable 10/15/23 @ 100 (a) (b) | 250,000 | 248,667 | |||||||||
| Aimco CLO 11 Ltd., Series 2020-11A, Class BR, 1.72% (US0003M+160bps), 10/17/34, Callable 1/17/24 @ 100 (a) (b) | 250,000 | 247,219 | |||||||||
| AOA Mortgage Trust, Series 2021-1177, Class D, 1.93% (US0001M+182bps), 10/15/36 (a) (b) | 300,000 | 298,364 | |||||||||
| AOA Mortgage Trust, Series 2021-1177, Class B, 1.28% (US0001M+117bps), 10/15/36 (a) (b) | 250,000 | 247,810 | |||||||||
Aventura Mall Trust, Series 2018-AVM, Class A, 4.11%, 7/5/40 (a) (d) | 500,000 | 555,632 | |||||||||
| Ballyrock CLO 18 Ltd., Series 2021-18A, Class A2, 1.88% (US0003M+165bps), 1/15/35 (a) (b) | 750,000 | 744,333 | |||||||||
| BAMLL Commercial Mortgage Securities Trust, Series 2015-200P, Class B, 3.49%, 4/14/33, Callable 4/14/25 @ 100 (a) | 750,000 | 779,219 | |||||||||
| BAMLL Commercial Mortgage Securities Trust, Series 2015-200P, Class D, 3.60% (LIBOR01M+105bps), 4/14/33, Callable 4/14/25 @ 100 (a) (b) | 750,000 | 763,620 | |||||||||
| BBCMS Mortgage Trust, Series 2020-BID, Class C, 3.75% (LIBOR01M+364bps), 10/15/37 (a) (b) | 300,000 | 301,130 | |||||||||
See notes to financial statements.
140
| Victory Portfolios II VictoryShares ESG Core Plus Bond ETF | Schedule of Portfolio Investments — continued December 31, 2021 | ||||||
(Unaudited)
Security Description | Principal Amount | Value | |||||||||
| BBCMS Mortgage Trust, Series 2020-BID, Class B, 2.65% (LIBOR01M+254bps), 10/15/37 (a) (b) | $ | 500,000 | $ | 501,193 | |||||||
| Benchmark 2020-B19 Mortgage Trust, Series 2020-B19, Class AS, 2.15%, 9/15/53, Callable 9/15/30 @ 100 | 1,000,000 | 966,676 | |||||||||
BPR Trust, Series 2021-TY, Class A, 1.16% (LIBOR01M+105bps), 9/23/23 (a) (b) | 500,000 | 499,073 | |||||||||
BPR Trust, Series 2021-TY, Class D, 2.46% (LIBOR01M+235bps), 9/23/23 (a) (b) | 500,000 | 498,320 | |||||||||
| BX Commercial Mortgage Trust, Series 2021-VOLT, Class B, 1.06% (LIBOR01M+85bps), 9/15/23 (a) (b) | 250,000 | 247,736 | |||||||||
| BX Commercial Mortgage Trust, Series 2021-SOAR, Class D, 1.51% (LIBOR01M+140bps), 6/15/38 (a) (b) | 250,000 | 247,612 | |||||||||
| BX Commercial Mortgage Trust, Series 2021-XL2, Class B, 1.11% (US0001M+100bps), 10/15/36 (a) (b) | 250,000 | 247,944 | |||||||||
| BX Commercial Mortgage Trust, Series 2019-XL, Class D, 1.56% (LIBOR01M+145bps), 10/15/36 (a) (b) | 1,215,500 | 1,212,060 | |||||||||
| BX Mortgage Trust, Series 2021-PAC, Class B, 1.01% (US0001M+90bps), 10/15/36 (a) (b) | 250,000 | 248,150 | |||||||||
BX Trust, Series 2021-ARIA, Class D, 2.01% (US0001M+190bps), 10/15/36 (a) (b) | 250,000 | 249,435 | |||||||||
BX Trust, Series 2021-RISE, Class B, 1.35% (US0001M+125bps), 11/15/36 (a) (b) | 500,000 | 499,821 | |||||||||
BXP Trust, Series 2021-601L, Class C, 2.78%, 1/15/44 (a) (d) | 250,000 | 240,181 | |||||||||
BXP Trust, Series 2021-601L, Class D, 2.78%, 1/15/44 (a) (d) | 1,000,000 | 921,098 | |||||||||
BXP Trust, Series 2021-601L, Class B, 2.78%, 1/15/44 (a) (d) | 500,000 | 504,449 | |||||||||
| CAMB Commercial Mortgage Trust, Series 2021-CX2, Class A, 2.70%, 11/10/46 (a) | 1,000,000 | 1,027,578 | |||||||||
| CHT Mortgage Trust, Series 2017-CSMO, Class E, 3.11% (LIBOR01M+300bps), 11/15/36 (a) (b) | 696,000 | 695,919 | |||||||||
| Columbia Cent CLO 29 Ltd., Series 2020-29A, Class BR, 1.85% (US0003M+170bps), 10/20/34, Callable 10/20/23 @ 100 (a) (b) | 500,000 | 497,746 | |||||||||
| COMM Mortgage Trust, Series 2020-CX, Class A, 2.17%, 11/10/46, Callable 11/10/30 @ 100 (a) | 825,000 | 813,935 | |||||||||
| COMM Mortgage Trust, Series 2014-277P, Class A, 3.61%, 8/10/49, Callable 8/10/24 @ 100 (a) (d) | 500,000 | 522,668 | |||||||||
| Eaton Vance CLO Ltd., Series 2020-2A, Class BR, 1.81% (US0003M+170bps), 1/15/35, Callable 1/15/24 @ 100 (a) (b) | 500,000 | 498,894 | |||||||||
| Flatiron CLO 20 Ltd., Series 2020-1A, Class B, 1.91% (US0003M+175bps), 11/20/33, Callable 11/20/22 @ 100 (a) (b) | 750,000 | 750,396 | |||||||||
| Golub Capital Partners CLO Ltd., Series 2020-52A, Class C, 2.93% (LIBOR03M+280bps), 1/20/34, Callable 1/20/23 @ 100 (a) (b) | 500,000 | 501,412 | |||||||||
Hilton USA Trust, Series 2016-HHV, Class C, 4.19%, 11/5/38 (a) (d) | 200,000 | 209,445 | |||||||||
Hilton USA Trust, Series 2016-HHV, Class B, 4.19%, 11/5/38 (a) (d) | 350,000 | 372,187 | |||||||||
| Hudson Yards Mortgage Trust, Series 2019-55HY, Class A, 2.94%, 12/10/41 (a) (d) | 1,000,000 | 1,047,612 | |||||||||
| JP Morgan Chase Commercial Mortgage Securities Trust, Series 2013-C10, Class B, 3.67%, 12/15/47, Callable 2/15/23 @ 100 (d) | 449,000 | 459,349 | |||||||||
| JP Morgan Chase Commercial Mortgage Securities Trust, Series 2013-C13, Class B, 4.08%, 1/15/46, Callable 6/15/23 @ 100 (d) | 338,000 | 349,898 | |||||||||
LCM Ltd., Series 36A, Class A2, 1.65% (US0003M+140bps), 1/15/34 (a) (b) | 750,000 | 749,725 | |||||||||
| MHC Commercial Mortgage Trust, Series 2021-MHC, Class A, 0.91% (US0001M+80bps), 4/15/38 (a) (b) | 250,000 | 249,041 | |||||||||
| MHC Commercial Mortgage Trust, Series MHC, Class D, 1.71% (US0001M+160bps), 4/15/26 (a) (b) | 500,000 | 497,504 | |||||||||
See notes to financial statements.
141
| Victory Portfolios II VictoryShares ESG Core Plus Bond ETF | Schedule of Portfolio Investments — continued December 31, 2021 | ||||||
(Unaudited)
Security Description | Principal Amount | Value | |||||||||
Morgan Stanley Capital I Trust, Series 2021-PLZA, Class C, 2.81%, 11/9/31 (a) | $ | 750,000 | $ | 737,644 | |||||||
| Morgan Stanley Capital I Trust, Series 2017-CLS, Class F, 2.71% (LIBOR01M+260bps), 11/15/34 (a) (b) | 500,000 | 497,611 | |||||||||
Morgan Stanley Capital I Trust, Series 2021-PLZA, Class B, 2.81%, 11/9/31 (a) | 500,000 | 503,052 | |||||||||
| Oaktree CLO Ltd., Series 2020-1A, Class BR, 1.77% (US0003M+165bps), 7/15/34, Callable 7/15/23 @ 100 (a) (b) | 250,000 | 248,199 | |||||||||
| Octagon 57 Ltd., Series 2021-1A, Class B1, 1.77% (US0003M+165bps), 10/15/34, Callable 10/15/23 @ 100 (a) (b) | 500,000 | 498,189 | |||||||||
| Octagon Investment Partners 48 Ltd., Series 2020-3A, Class BR, 1.73% (US0003M+160bps), 10/20/34, Callable 10/20/23 @ 100 (a) (b) | 500,000 | 496,277 | |||||||||
SLG Office Trust, Series 2021-OVA, Class A, 2.59%, 7/15/41 (a) | 500,000 | 512,613 | |||||||||
SLG Office Trust, Series 2021-OVA, Class C, 2.85%, 7/15/41 (a) | 500,000 | 500,508 | |||||||||
| Sound Point CLO V-R Ltd., Series 2014-1RA, Class C, 2.22% (US0003M+210bps), 7/18/31, Callable 1/18/22 @ 100 (a) (b) | 500,000 | 494,925 | |||||||||
| Sound Point CLO XXXII Ltd., Series 2021-4A, Class B1, 1.87% (US0003M+175bps), 10/25/34 (a) (b) | 500,000 | 499,650 | |||||||||
| SREIT Trust, Series 2021-MFP2, Class B, 1.27% (US0001M+117bps), 11/15/36 (a) (b) | 500,000 | 497,500 | |||||||||
| SREIT Trust, Series 2021-MFP2, Class D, 1.67% (US0001M+157bps), 11/15/36 (a) (b) | 760,000 | 756,201 | |||||||||
| Stratus CLO Ltd., Series 2021-1A, Class B, 1.49% (US0003M+140bps), 12/29/29 (a) (b) | 500,000 | 498,782 | |||||||||
| Stratus CLO Ltd., Series 2021-3A, Class B 1.68% (US0003M+155bps), 12/29/29 (a) (b) | 205,000 | 205,000 | |||||||||
| Symphony CLO XXII Ltd., Series 2020-22A, Class C, 2.27% (US0003M+215bps), 4/18/33, Callable 4/18/22 @ 100 (a) (b) | 500,000 | 500,385 | |||||||||
| Symphony CLO XXIX Ltd., Series 2021-29A, Class B, 1.89% (US0003M+165bps), 1/15/34 (a) (b) | 500,000 | 499,017 | |||||||||
| Trestles CLO III Ltd., Series 2020-3A, Class C, 2.38% (US0003M+225bps), 1/20/33, Callable 1/20/22 @ 100 (a) (b) | 500,000 | 500,153 | |||||||||
| Trimaran Cavu Ltd., Series 2021-2A, Class B1 1.88% (US0003M+175bps), 10/25/34 (a) (b) | 500,000 | 498,521 | |||||||||
| Trimaran Cavu Ltd., Series 2021-3A, Class C1, 2.57% (US0003M+247bps), 1/18/35 (a) (b) (h) | 750,000 | 749,999 | |||||||||
TTAN, Series 2021-MHC, Class C, 1.46% (US0001M+140bps), 3/15/38 (a) (b) | 699,677 | 697,553 | |||||||||
| Voya CLO Ltd., Series 2017-3A, Class A2AR, 1.68% (US0003M+155bps), 4/20/34, Callable 4/20/23 @ 100 (a) (b) | 500,000 | 492,652 | |||||||||
| Wells Fargo Commercial Mortgage Trust, Series 2021-SAVE, Class B, 1.56% (US0001M+145bps), 2/15/40 (a) (b) | 227,255 | 226,236 | |||||||||
| Wells Fargo Commercial Mortgage Trust, Series 2021-SAVE, Class C, 1.91% (US0001M+180bps), 2/15/40 (a) (b) | 227,255 | 227,350 | |||||||||
Total Collateralized Mortgage Obligations (Cost $32,053,474) | 31,851,068 | ||||||||||
Senior Secured Loans (5.7%) | |||||||||||
| AAdvantage Loyalty IP Ltd., Initial Term Loan, First Lien, 5.50% (LIBOR03M+475bps), 4/20/28 (b) (c) | 750,000 | 775,845 | |||||||||
| Asurion LLC, New B-9 Term Loans, First Lien, 3.34% (LIBOR01M+325bps), 7/29/27 (b) (c) | 500,000 | 496,500 | |||||||||
Covanta Holding Corp., Initial Term B Loans, First Lien, 11/17/28 (c) (e) | 465,157 | 465,389 | |||||||||
Covanta Holding Corp., Initial Term C Loan, First Lien, 11/17/28 (c) (e) | 34,843 | 34,861 | |||||||||
See notes to financial statements.
142
| Victory Portfolios II VictoryShares ESG Core Plus Bond ETF | Schedule of Portfolio Investments — continued December 31, 2021 | ||||||
(Unaudited)
Security Description | Principal Amount | Value | |||||||||
| Delta Airlines, Inc. and Skymiles IP Ltd., Initial Term Loan, First Lien, 4.75% (LIBOR03M+375bps), 9/16/27 (b) (c) | $ | 750,000 | $ | 792,188 | |||||||
| Directv Financing LLC, Closing Date Term Loans, First Lien, 5.75% (LIBOR03M+500bps), 7/22/27 (b) (c) | 1,000,000 | 1,000,290 | |||||||||
| Great Outdoors Group LLC, Term B1, First Lien, 4.50% (LIBOR01M+375bps), 3/5/28 (b) | 500,000 | 500,105 | |||||||||
| Hub International Ltd., B-3 Incremental Term Loans, First Lien, 4.00% (LIBOR03M+325bps), 4/25/25 (b) (c) | 500,000 | 499,530 | |||||||||
| IRB Holding Corp., Fourth Amendment Incremental Term Loans, First Lien, 4.25% (LIBOR03M+325bps), 11/19/27 (b) (c) | 500,000 | 499,530 | |||||||||
| Mileage Plus Holdings LLC, Initial Term Loan, First Lien, 6.25% (LIBOR03M+525bps), 6/20/27 (b) (c) | 750,000 | 789,848 | |||||||||
| Proofpoint, Inc., Initial Term Loans, First Lien, 3.75% (LIBOR03M+325bps), 8/31/28 (b) (c) | 500,000 | 497,540 | |||||||||
| Sotheby's, 2021 2nd Refin Term Loan, First Lien, 5.00% (LIBOR03M+450bps), 1/15/27 (b) | 498,750 | 498,750 | |||||||||
| UKG, Inc., 2021 Incremental Term Loans, First Lien, 4.25% (LIBOR03M+325bps), 5/3/26 (b) (c) | 500,000 | 497,030 | |||||||||
UKG, Inc., Initial Term Loan, First Lien, 5/3/26 (c) (e) | 500,000 | 498,125 | |||||||||
Walker & Dunlop, Inc., Term Loan B, First Lien, 2.75%, 10/15/28 (c) | 1,500,000 | 1,496,250 | |||||||||
| Weber-Stephen Products LLC, Initial Term B Loans, First Lien, 4.00% (LIBOR01M+325bps), 10/30/27 (b) (c) | 500,000 | 500,415 | |||||||||
| Whatabrands LLC, Initial Term B Loans, First Lien, 3.75% (LIBOR01M+325bps), 7/21/28 (b) | 500,000 | 497,725 | |||||||||
Whatabrands LLC, Initial Term B Loans, First Lien, 7/21/28 (c) (e) | 750,000 | 746,587 | |||||||||
Total Senior Secured Loans (Cost $11,148,656) | 11,086,508 | ||||||||||
Corporate Bonds (31.2%) | |||||||||||
Communication Services (2.5%): | |||||||||||
AT&T, Inc., 4.50%, 5/15/35, Callable 11/15/34 @ 100 | 750,000 | 867,660 | |||||||||
| CCO Holdings LLC/CCO Holdings Capital Corp., 4.25%, 2/1/31, Callable 7/1/25 @ 102.13 (a) | 250,000 | 252,665 | |||||||||
CSC Holdings LLC, 3.38%, 2/15/31, Callable 2/15/26 @ 101.69 (a) | 500,000 | 468,120 | |||||||||
Discovery Communications LLC, 4.65%, 5/15/50, Callable 11/15/49 @ 100 | 250,000 | 294,180 | |||||||||
Lamar Media Corp., 3.63%, 1/15/31, Callable 1/15/26 @ 101.81 | 500,000 | 487,240 | |||||||||
Sirius XM Radio, Inc., 3.88%, 9/1/31, Callable 9/1/26 @ 101.94 (a) | 250,000 | 245,685 | |||||||||
| T-Mobile USA, Inc. 2.55%, 2/15/31, Callable 11/15/30 @ 100 | 500,000 | 497,670 | |||||||||
3.50%, 4/15/31, Callable 4/15/26 @ 101.75 (a) | 1,250,000 | 1,295,625 | |||||||||
Verizon Communications, Inc., 4.50%, 8/10/33 (f) | 500,000 | 589,935 | |||||||||
4,998,780 | |||||||||||
Consumer Discretionary (3.1%): | |||||||||||
Asbury Automotive Group, Inc., 4.75%, 3/1/30, Callable 3/1/25 @ 102.38 | 750,000 | 766,965 | |||||||||
AutoNation, Inc., 2.40%, 8/1/31, Callable 5/1/31 @ 100 | 500,000 | 483,970 | |||||||||
Dollar Tree, Inc., 2.65%, 12/1/31, Callable 9/1/31 @ 100 | 500,000 | 501,025 | |||||||||
Group 1 Automotive, Inc., 4.00%, 8/15/28, Callable 8/15/23 @ 102 (a) | 100,000 | 99,886 | |||||||||
| Hilton Domestic Operating Co., Inc., 3.63%, 2/15/32, Callable 8/15/26 @ 101.81 (a) | 250,000 | 248,915 | |||||||||
Kohl's Corp., 3.38%, 5/1/31, Callable 2/1/31 @ 100 | 300,000 | 305,385 | |||||||||
See notes to financial statements.
143
| Victory Portfolios II VictoryShares ESG Core Plus Bond ETF | Schedule of Portfolio Investments — continued December 31, 2021 | ||||||
(Unaudited)
Security Description | Principal Amount | Value | |||||||||
Marriott International, Inc., 3.50%, 10/15/32, Callable 7/15/32 @ 100 (f) | $ | 750,000 | $ | 785,797 | |||||||
Marriott Ownership Resorts, Inc., 4.50%, 6/15/29, Callable 6/15/24 @ 102.25 (a) | 250,000 | 251,813 | |||||||||
Nordstrom, Inc., 4.25%, 8/1/31, Callable 5/1/31 @ 100 | 750,000 | 737,198 | |||||||||
| Resorts World Las Vegas LLC/RWLV Capital, Inc., 4.63%, 4/6/31, Callable 1/6/31 @ 100 (a) | 500,000 | 498,340 | |||||||||
Sodexo, Inc., 2.72%, 4/16/31, Callable 1/16/31 @ 100 (a) | 250,000 | 255,973 | |||||||||
Sotheby's, 7.38%, 10/15/27, Callable 10/15/22 @ 103.69 (a) | 750,000 | 798,623 | |||||||||
| Wynn Resorts Finance LLC/Wynn Resorts Capital Corp., 5.13%, 10/1/29, Callable 7/1/29 @ 100 (a) | 250,000 | 254,280 | |||||||||
5,988,170 | |||||||||||
Consumer Staples (0.5%): | |||||||||||
General Mills, Inc., 2.25%, 10/14/31, Callable 7/14/31 @ 100 | 250,000 | 247,308 | |||||||||
Sysco Corp., 2.45%, 12/14/31, Callable 9/14/31 @ 100 | 333,000 | 333,932 | |||||||||
US Foods, Inc., 4.63%, 6/1/30, Callable 6/1/25 @ 102.31 (a) | 500,000 | 506,125 | |||||||||
1,087,365 | |||||||||||
Energy (1.8%): | |||||||||||
Boardwalk Pipelines LP, 3.40%, 2/15/31, Callable 11/15/30 @ 100 | 250,000 | 257,930 | |||||||||
| Hilcorp Energy I LP/Hilcorp Finance Co., 6.25%, 11/1/28, Callable 11/1/23 @ 103.13 (a) | 750,000 | 798,479 | |||||||||
Magellan Midstream Partners LP, 5.15%, 10/15/43, Callable 4/15/43 @ 100 (f) | 500,000 | 604,650 | |||||||||
Midwest Connector Capital Co. LLC, 4.63%, 4/1/29, Callable 1/1/29 @ 100 (a) (f) | 500,000 | 539,010 | |||||||||
| Plains All American Pipeline LP/PAA Finance Corp., 3.80%, 9/15/30, Callable 6/15/30 @ 100 (f) | 750,000 | 789,503 | |||||||||
Viper Energy Partners LP, 5.38%, 11/1/27, Callable 11/1/22 @ 102.69 (a) | 500,000 | 517,445 | |||||||||
3,507,017 | |||||||||||
Financials (8.1%): | |||||||||||
AmFam Holdings, Inc., 2.81%, 3/11/31, Callable 12/11/30 @ 100 (a) | 500,000 | 510,880 | |||||||||
Assurant, Inc., 2.65%, 1/15/32, Callable 10/15/31 @ 100 | 250,000 | 245,403 | |||||||||
| Bank of America Corp. 2.69% (SOFR+110bps), 4/22/32, Callable 4/22/31 @ 100 (b) (f) | 500,000 | 508,550 | |||||||||
2.57% (SOFR+121bps), 10/20/32, Callable 10/20/31 @ 100 (b) | 250,000 | 251,415 | |||||||||
Blackstone Private Credit Fund, 3.25%, 3/15/27, Callable 2/15/27 @ 100 (a) | 750,000 | 750,923 | |||||||||
Blue Owl Finance LLC, 3.13%, 6/10/31, Callable 3/10/31 @ 100 (a) (f) | 750,000 | 733,905 | |||||||||
Citizens Financial Group, Inc., 2.64%, 9/30/32, Callable 7/2/32 @ 100 | 500,000 | 495,545 | |||||||||
Cullen/Frost Bankers, Inc., 4.50%, 3/17/27, Callable 2/17/27 @ 100 (f) | 500,000 | 551,315 | |||||||||
F&G Global Funding, 2.00%, 9/20/28 (a) | 500,000 | 488,190 | |||||||||
Franklin Resources, Inc., 2.95%, 8/12/51, Callable 2/12/51 @ 100 | 1,000,000 | 969,139 | |||||||||
| Global Atlantic Financial Co. 4.40%, 10/15/29, Callable 7/15/29 @ 100 (a) | 1,000,000 | 1,077,989 | |||||||||
3.13%, 6/15/31, Callable 3/15/31 @ 100 (a) | 250,000 | 247,918 | |||||||||
Hub International Ltd., 5.63%, 12/1/29, Callable 12/1/24 @ 102.81 (a) | 100,000 | 102,976 | |||||||||
Huntington Bancshares, Inc., 2.49%, 8/15/36, Callable 8/15/31 @ 100 (a) | 1,000,000 | 957,930 | |||||||||
| JPMorgan Chase & Co., 2.96% (SOFR+252bps), 5/13/31, Callable 5/13/30 @ 100 (b) (f) | 1,750,000 | 1,811,057 | |||||||||
Level 3 Financing, Inc., 3.88%, 11/15/29, Callable 8/15/29 @ 100 (a) | 250,000 | 254,945 | |||||||||
| Morgan Stanley, 1.93% (SOFR+102bps), 4/28/32, MTN, Callable 4/28/31 @ 100 (b) | 1,500,000 | 1,433,204 | |||||||||
See notes to financial statements.
144
| Victory Portfolios II VictoryShares ESG Core Plus Bond ETF | Schedule of Portfolio Investments — continued December 31, 2021 | ||||||
(Unaudited)
Security Description | Principal Amount | Value | |||||||||
New York Life Global Funding, 1.85%, 8/1/31 (a) | $ | 1,600,000 | $ | 1,556,959 | |||||||
State Street Corp., 1.68% (SOFR+56bps), 11/18/27, Callable 11/18/26 @ 100 (b) | 750,000 | 750,953 | |||||||||
| Texas Capital Bancshares, Inc., 4.00% (H15T5Y+315bps), 5/6/31, Callable 5/6/26 @ 100 (b) | 500,000 | 514,710 | |||||||||
| The Bank of New York Mellon Corp., 3.75% (H15T5Y+263bps), Callable 12/20/26 @ 100 (b) (g) | 750,000 | 752,408 | |||||||||
| Truist Financial Corp., 5.10% (H15T10Y+435bps), Callable 3/1/30 @ 100 (b) (f) (g) | 500,000 | 559,490 | |||||||||
United Financial Bancorp, Inc., 5.75%, 10/1/24 | 300,000 | 313,488 | |||||||||
15,839,292 | |||||||||||
Health Care (2.2%): | |||||||||||
AbbVie, Inc., 4.25%, 11/21/49, Callable 5/21/49 @ 100 (f) | 250,000 | 300,930 | |||||||||
| Baxter International, Inc. 2.27%, 12/1/28, Callable 10/1/28 @ 100 (a) | 750,000 | 755,993 | |||||||||
2.54%, 2/1/32, Callable 11/1/31 @ 100 (a) | 250,000 | 252,570 | |||||||||
Centene Corp., 2.50%, 3/1/31, Callable 12/1/30 @ 100 | 1,000,000 | 973,430 | |||||||||
CVS Health Corp., 1.88%, 2/28/31, Callable 11/28/30 @ 100 | 750,000 | 719,640 | |||||||||
Illumina, Inc., 2.55%, 3/23/31, Callable 12/23/30 @ 100 | 500,000 | 500,780 | |||||||||
MEDNAX, Inc., 6.25%, 1/15/27, Callable 2/7/22 @ 104.69 (a) | 275,000 | 288,453 | |||||||||
Royalty Pharma PLC, 2.15%, 9/2/31, Callable 6/2/31 @ 100 | 500,000 | 477,060 | |||||||||
4,268,856 | |||||||||||
Industrials (2.0%): | |||||||||||
Aircastle Ltd., 4.25%, 6/15/26, Callable 4/15/26 @ 100 (f) | 500,000 | 536,090 | |||||||||
American Airlines, Inc./AAdvantage Loyalty IP Ltd., 5.75%, 4/20/29 (a) | 250,000 | 267,355 | |||||||||
Delta Air Lines, Inc./Skymiles IP Ltd., 4.75%, 10/20/28 (a) | 250,000 | 273,463 | |||||||||
GXO Logistics, Inc., 2.65%, 7/15/31, Callable 4/15/31 @ 100 (a) | 250,000 | 246,573 | |||||||||
| Mileage Plus Holdings LLC/Mileage Plus Intellectual Property Assets Ltd., 6.50%, 6/20/27, Callable 6/30/23 @ 103.25 (a) | 500,000 | 534,445 | |||||||||
Molex Electronic Technologies LLC, 3.90%, 4/15/25, Callable 1/15/25 @ 100 (a) | 500,000 | 526,440 | |||||||||
| Spirit Loyalty Cayman Ltd./Spirit IP Cayman Ltd., 8.00%, 9/20/25, Callable 9/20/23 @ 104 (a) | 500,000 | 551,850 | |||||||||
| The Boeing Co. 3.63%, 2/1/31, Callable 11/1/30 @ 100 (f) | 650,000 | 694,285 | |||||||||
5.81%, 5/1/50, Callable 11/1/49 @ 100 | 250,000 | 339,435 | |||||||||
3,969,936 | |||||||||||
Information Technology (4.6%): | |||||||||||
Autodesk, Inc., 2.40%, 12/15/31, Callable 9/15/31 @ 100 | 350,000 | 349,486 | |||||||||
Broadcom, Inc., 2.60%, 2/15/33, Callable 11/15/32 @ 100 (a) (f) | 1,250,000 | 1,212,363 | |||||||||
Citrix Systems, Inc., 4.50%, 12/1/27, Callable 9/1/27 @ 100 | 750,000 | 813,885 | |||||||||
Dell, Inc., 5.40%, 9/10/40 (f) | 500,000 | 563,280 | |||||||||
| Global Payments, Inc. 2.90%, 11/15/31, Callable 8/15/31 @ 100 | 500,000 | 507,960 | |||||||||
4.15%, 8/15/49, Callable 2/15/49 @ 100 | 1,000,000 | 1,148,700 | |||||||||
Microsoft Corp., 2.53%, 6/1/50, Callable 12/1/49 @ 100 | 1,000,000 | 984,339 | |||||||||
Qorvo, Inc., 3.38%, 4/1/31, Callable 4/1/26 @ 101.69 (a) | 500,000 | 508,715 | |||||||||
TSMC Arizona Corp., 2.50%, 10/25/31, Callable 7/25/31 @ 100 | 1,500,000 | 1,518,509 | |||||||||
Twilio, Inc., 3.63%, 3/15/29, Callable 3/15/24 @ 101.81 | 500,000 | 503,825 | |||||||||
See notes to financial statements.
145
| Victory Portfolios II VictoryShares ESG Core Plus Bond ETF | Schedule of Portfolio Investments — continued December 31, 2021 | ||||||
(Unaudited)
Security Description | Principal Amount | Value | |||||||||
VMware, Inc., 2.20%, 8/15/31, Callable 5/15/31 @ 100 | $ | 500,000 | $ | 491,455 | |||||||
Western Digital Corp., 3.10%, 2/1/32, Callable 11/1/31 @ 100 | 200,000 | 201,460 | |||||||||
8,803,977 | |||||||||||
Materials (1.3%): | |||||||||||
Amcor Flexibles North America, Inc., 2.69%, 5/25/31, Callable 2/25/31 @ 100 | 1,000,000 | 1,011,850 | |||||||||
Avery Dennison Corp., 2.25%, 2/15/32, Callable 11/15/31 @ 100 | 500,000 | 485,770 | |||||||||
Cabot Corp., 4.00%, 7/1/29, Callable 4/1/29 @ 100 | 250,000 | 271,210 | |||||||||
Eagle Materials, Inc., 2.50%, 7/1/31, Callable 4/1/31 @ 100 (f) | 750,000 | 741,083 | |||||||||
2,509,913 | |||||||||||
Real Estate (3.5%): | |||||||||||
Alexandria Real Estate Equities, Inc., 1.88%, 2/1/33, Callable 11/1/32 @ 100 | 500,000 | 469,825 | |||||||||
| Boston Properties LP 2.55%, 4/1/32, Callable 1/1/32 @ 100 (f) | 750,000 | 746,324 | |||||||||
2.45%, 10/1/33, Callable 7/1/33 @ 100 | 250,000 | 242,188 | |||||||||
CBRE Services, Inc., 2.50%, 4/1/31, Callable 1/1/31 @ 100 | 250,000 | 251,358 | |||||||||
GLP Capital LP/GLP Financing II, Inc., 3.25%, 1/15/32, Callable 10/15/31 @ 100 | 233,000 | 234,191 | |||||||||
Healthpeak Properties, Inc., 2.13%, 12/1/28, Callable 10/1/28 @ 100 | 500,000 | 500,690 | |||||||||
Host Hotels & Resorts LP, 3.50%, 9/15/30, Callable 6/15/30 @ 100 | 500,000 | 513,455 | |||||||||
| Invitation Homes Operating Partnership LP, 2.70%, 1/15/34, Callable 10/15/33 @ 100 | 750,000 | 735,668 | |||||||||
Physicians Realty LP, 2.63%, 11/1/31, Callable 8/1/31 @ 100 | 250,000 | 249,503 | |||||||||
| RHP Hotel Properties LP/RHP Finance Corp., 4.50%, 2/15/29, Callable 2/15/24 @ 102.25 (a) | 250,000 | 251,905 | |||||||||
SBA Communications Corp., 3.13%, 2/1/29, Callable 2/1/24 @ 101.56 (a) | 250,000 | 240,590 | |||||||||
SBA Tower Trust, 2.59%, 10/15/56 (a) | 500,000 | 506,287 | |||||||||
Simon Property Group LP, 2.25%, 1/15/32, Callable 10/15/31 @ 100 (f) | 1,250,000 | 1,221,974 | |||||||||
| VICI Properties LP/VICI Note Co., Inc., 4.13%, 8/15/30, Callable 2/15/25 @ 102.06 (a) | 750,000 | 793,979 | |||||||||
6,957,937 | |||||||||||
Utilities (1.6%): | |||||||||||
Ameren Corp., 1.95%, 3/15/27, Callable 2/15/27 @ 100 | 500,000 | 501,950 | |||||||||
Duke Energy Corp., 2.55%, 6/15/31, Callable 3/15/31 @ 100 | 250,000 | 249,855 | |||||||||
Duquesne Light Holdings, Inc., 2.78%, 1/7/32, Callable 10/7/31 @ 100 (a) | 500,000 | 497,340 | |||||||||
Entergy Corp., 2.40%, 6/15/31, Callable 3/5/31 @ 100 | 1,000,000 | 989,159 | |||||||||
NRG Energy, Inc., 4.45%, 6/15/29, Callable 3/15/29 @ 100 (a) (f) | 750,000 | 817,703 | |||||||||
3,056,007 | |||||||||||
Total Corporate Bonds (Cost $61,127,252) | 60,987,250 | ||||||||||
Yankee Dollars (7.1%) | |||||||||||
Communication Services (0.6%): | |||||||||||
British Telecommunications PLC, 3.25%, 11/8/29, Callable 8/8/29 @ 100 (a) | 1,250,000 | 1,278,524 | |||||||||
Consumer Staples (0.7%): | |||||||||||
Anheuser-Busch InBev Worldwide, Inc., 3.75%, 7/15/42 (f) | 750,000 | 815,393 | |||||||||
Becle SAB de CV, 2.50%, 10/14/31, Callable 7/14/31 @ 100 (a) | 500,000 | 490,570 | |||||||||
1,305,963 | |||||||||||
See notes to financial statements.
146
| Victory Portfolios II VictoryShares ESG Core Plus Bond ETF | Schedule of Portfolio Investments — continued December 31, 2021 | ||||||
(Unaudited)
Security Description | Principal Amount | Value | |||||||||
Financials (3.4%): | |||||||||||
| Bank of Montreal, 3.80% (USSW5+143bps), 12/15/32, Callable 12/15/27 @ 100 (b) | $ | 500,000 | $ | 535,405 | |||||||
Barclays PLC, 2.28% (H15T1Y+105bps), 11/24/27, Callable 11/24/26 @ 100 (b) | 1,000,000 | 1,002,520 | |||||||||
| BP Capital Markets PLC, 4.38% (H15T5Y+404bps), Callable 6/22/25 @ 100 (b) (f) (g) | 500,000 | 522,305 | |||||||||
Brookfield Finance I UK PLC, 2.34%, 1/30/32, Callable 10/30/31 @ 100 | 250,000 | 243,478 | |||||||||
Brookfield Finance, Inc., 2.72%, 4/15/31, Callable 1/15/31 @ 100 | 600,000 | 605,760 | |||||||||
| Credit Suisse Group AG, 3.09% (SOFR+173bps), 5/14/32, Callable 5/14/31 @ 100 (a) (b) | 500,000 | 508,295 | |||||||||
| Deutsche Bank AG, 2.31% (SOFR+122bps), 11/16/27, Callable 11/16/26 @ 100 (b) | 500,000 | 499,895 | |||||||||
JAB Holdings BV, 3.75%, 5/28/51, Callable 11/28/50 @ 100 (a) | 250,000 | 274,073 | |||||||||
| Macquarie Bank Ltd., 3.05% (H15T5Y+170bps), 3/3/36, Callable 3/3/31 @ 100 (a) (b) | 500,000 | 491,010 | |||||||||
Mizuho Financial Group, Inc., 2.56%, 9/13/31 | 500,000 | 487,945 | |||||||||
| NXP BV/NXP Funding LLC/NXP USA, Inc., 2.65%, 2/15/32, Callable 11/15/31 @ 100 (a) | 750,000 | 752,768 | |||||||||
| Westpac Banking Corp., 3.02% (H15T5Y+153bps), 11/18/36, Callable 11/18/31 @ 100 (b) | 750,000 | 742,522 | |||||||||
6,665,976 | |||||||||||
Health Care (0.7%): | |||||||||||
Olympus Corp., 2.14%, 12/8/26 (a) | 303,000 | 304,739 | |||||||||
STERIS Irish FinCo Unlimited Co., 2.70%, 3/15/31, Callable 12/15/30 @ 100 | 900,000 | 910,548 | |||||||||
1,215,287 | |||||||||||
Industrials (0.5%): | |||||||||||
Canadian Pacific Railway Co., 1.75%, 12/2/26, Callable 11/2/26 @ 100 | 1,000,000 | 1,004,470 | |||||||||
Information Technology (0.1%): | |||||||||||
Open Text Holdings, Inc., 4.13%, 12/1/31, Callable 12/1/26 @ 102.06 (a) | 250,000 | 253,005 | |||||||||
Real Estate (1.0%): | |||||||||||
| Ontario Teachers' Cadillac Fairview Properties Trust, 2.50%, 10/15/31, Callable 7/15/31 @ 100 (a) | 1,792,000 | 1,798,934 | |||||||||
Sovereign Bond (0.1%): | |||||||||||
Korea International Bond, 1.75%, 10/15/31 | 250,000 | 250,773 | |||||||||
Total Yankee Dollars (Cost $13,795,575) | 13,772,932 | ||||||||||
Municipal Bonds (1.1%) | |||||||||||
Alabama (0.2%): | |||||||||||
Homewood Educational Building Authority, 2.25%, 12/1/29 | 250,000 | 250,759 | |||||||||
Arkansas (0.1%): | |||||||||||
University of Arkansas, 1.32%, 11/1/26 | 250,000 | 248,531 | |||||||||
Georgia (0.2%): | |||||||||||
Metropolitan Atlanta Rapid Transit Authority, 1.52%, 7/1/26 | 250,000 | 250,771 | |||||||||
Montana (0.1%): | |||||||||||
Montana Facility Finance Authority, 2.44%, 8/15/31 | 250,000 | 249,653 | |||||||||
See notes to financial statements.
147
| Victory Portfolios II VictoryShares ESG Core Plus Bond ETF | Schedule of Portfolio Investments — continued December 31, 2021 | ||||||
(Unaudited)
Security Description | Shares or Principal Amount | Value | |||||||||
South Carolina (0.1%): | |||||||||||
County of Charleston SC, 1.92%, 12/1/29 | $ | 250,000 | $ | 249,388 | |||||||
Texas (0.4%): | |||||||||||
Central Texas Regional Mobility Authority, 1.34%, 1/1/25 MERIT | 250,000 | 250,102 | |||||||||
Dallas Area Rapid Transit, 2.18%, 12/1/33, Continuously Callable @100 | 250,000 | 248,499 | |||||||||
| Dallas Fort Worth International Airport, 2.44%, 11/1/32, Continuously Callable @100 | 350,000 | 352,042 | |||||||||
850,643 | |||||||||||
Total Municipal Bonds (Cost $2,098,202) | 2,099,745 | ||||||||||
U.S. Treasury Obligations (27.0%) | |||||||||||
| U.S. Treasury Bonds 1.38%, 11/15/40 | 1,500,000 | 1,371,328 | |||||||||
1.75%, 8/15/41 (f) | 2,000,000 | 1,945,313 | |||||||||
1.25%, 5/15/50 (f) | 1,500,000 | 1,275,234 | |||||||||
2.00%, 8/15/51 | 700,000 | 717,063 | |||||||||
| U.S. Treasury Notes 0.38%, 9/15/24 | 12,000,000 | 11,831,250 | |||||||||
0.38%, 11/30/25 (f) | 15,500,000 | 15,037,422 | |||||||||
0.88%, 9/30/26 | 3,000,000 | 2,947,969 | |||||||||
0.38%, 7/31/27 (f) | 6,500,000 | 6,175,508 | |||||||||
1.25%, 9/30/28 | 10,500,000 | 10,385,156 | |||||||||
0.63%, 8/15/30 (f) | 750,000 | 699,609 | |||||||||
1.25%, 8/15/31 (f) | 250,000 | 244,492 | |||||||||
Total U.S. Treasury Obligations (Cost $52,714,643) | 52,630,344 | ||||||||||
Commercial Papers (5.4%) (i) | |||||||||||
AutoNation, Inc., 0.32%, 1/3/22 (a) | 1,100,000 | 1,099,971 | |||||||||
Aviation Capital Group, 0.21%, 1/11/22 (a) | 1,900,000 | 1,899,881 | |||||||||
CenterPoint Energy Resources Corp., 0.16%, 1/5/22 (a) | 1,900,000 | 1,899,958 | |||||||||
Hannover Funding Co. LLC, 0.16%, 1/3/22 (a) | 1,900,000 | 1,899,975 | |||||||||
Jabil, Inc., 0.49%, 1/6/22 (a) | 1,800,000 | 1,799,852 | |||||||||
Oge Energy Corp., 0.16%, 1/6/22 (a) | 1,900,000 | 1,899,950 | |||||||||
Total Commercial Papers (Cost $10,499,467) | 10,499,587 | ||||||||||
Total Investments (Cost $204,206,680) — 104.5% | 203,564,332 | ||||||||||
Liabilities in excess of other assets — (4.5)% | (8,779,736 | ) | |||||||||
NET ASSETS — 100.00% | $ | 194,784,596 | |||||||||
(a) Rule 144A security or other security that is restricted as to resale to institutional investors. The Fund's Adviser has deemed this security to be liquid (unless otherwise noted as illiquid) based upon procedures approved by the Board of Trustees. As of December 31, 2021, the fair value of these securities was $85,572,579 and amounted to 43.9% of net assets.
(b) Variable or Floating-Rate Security. Rate disclosed is as of December 31, 2021.
(c) Security or a portion of the security purchased on a delayed-delivery and/or when-issued basis.
See notes to financial statements.
148
| Victory Portfolios II VictoryShares ESG Core Plus Bond ETF | Schedule of Portfolio Investments — continued December 31, 2021 | ||||||
(Unaudited)
(d) The rate for certain asset-backed and mortgage-backed securities may vary based on factors relating to the pool of assets underlying the security. The rate disclosed is the rate in effect at December 31, 2021.
(e) The rates for this senior secured loan will be known on settlement date of the loan, subsequent to this report date. Senior secured loans have rates that will fluctuate over time in line with prevailing interest rates.
(f) All or a portion of the security has been segregated as collateral for securities purchased on a delayed-delivery and/or when-issued basis.
(g) Security is perpetual and has no final maturity date but may be subject to calls at various dates in the future.
(h) Security was fair valued based upon procedures approved by the Board of Trustees and represents 0.4% of net assets as of December 31, 2021. (See Note 2 in the Notes to Financial Statements)
(i) Rate represents the effective yield at December 31, 2021.
bps — Basis points
H15T1Y — 1 Year Treasury Constant Maturity Rate, rate disclosed as of December 31, 2021.
H15T5Y — 5 Year Treasury Constant Maturity Rate, rate disclosed as of December 31, 2021.
LIBOR — London InterBank Offered Rate
LIBOR01M — 1 Month US Dollar LIBOR, rate disclosed as of December 31, 2021, based on the last reset date of the security
LIBOR03M — 3 Month US Dollar LIBOR, rate disclosed as of December 31, 2021, based on the last reset date of the security
LLC — Limited Liability Company
LP — Limited Partnership
MTN — Medium Term Note
PLC — Public Limited Company
SOFR — Secured Overnight Financing Rate
US0001M — 1 Month US Dollar LIBOR, rate disclosed as of December 31, 2021, based on the last reset date of the security
US0003M — 3 Month US Dollar LIBOR, rate disclosed as of December 31, 2021, based on the last reset date of the security
USSW5 — USD 5 Year Swap Rate, rate disclosed as of December 31, 2021.
See notes to financial statements.
149
| Victory Portfolios II VictoryShares ESG Corporate Bond ETF | Schedule of Portfolio Investments December 31, 2021 | ||||||
(Unaudited)
Security Description | Principal Amount | Value | |||||||||
Corporate Bonds (77.6%) | |||||||||||
Communication Services (8.3%): | |||||||||||
AT&T, Inc., 3.10%, 2/1/43, Callable 8/1/42 @ 100 | $ | 2,000,000 | $ | 1,936,940 | |||||||
Comcast Corp., 3.90%, 3/1/38, Callable 9/1/37 @ 100 | 1,000,000 | 1,131,960 | |||||||||
Discovery Communications LLC, 3.95%, 3/20/28, Callable 12/20/27 @ 100 | 500,000 | 543,065 | |||||||||
The Walt Disney Co., 2.20%, 1/13/28 | 1,000,000 | 1,018,880 | |||||||||
T-Mobile USA, Inc., 2.55%, 2/15/31, Callable 11/15/30 @ 100 | 1,500,000 | 1,493,010 | |||||||||
| Verizon Communications, Inc. 4.50%, 8/10/33 | 500,000 | 589,935 | |||||||||
2.88%, 11/20/50, Callable 5/20/50 @ 100 | 1,000,000 | 949,840 | |||||||||
ViacomCBS, Inc., 3.38%, 2/15/28, Callable 11/15/27 @ 100 | 1,000,000 | 1,065,950 | |||||||||
8,729,580 | |||||||||||
Consumer Discretionary (5.2%): | |||||||||||
Amazon.com, Inc., 2.88%, 5/12/41, Callable 11/12/40 @ 100 | 500,000 | 518,015 | |||||||||
AutoNation, Inc., 4.75%, 6/1/30, Callable 3/1/30 @ 100 | 500,000 | 571,800 | |||||||||
Daimler Trucks Finance North America LLC, 2.38%, 12/14/28 (a) | 350,000 | 351,855 | |||||||||
Hasbro, Inc., 3.55%, 11/19/26, Callable 9/19/26 @ 100 | 500,000 | 536,615 | |||||||||
Kohl's Corp., 3.38%, 5/1/31, Callable 2/1/31 @ 100 | 500,000 | 508,975 | |||||||||
Lowe's Cos., Inc., 2.80%, 9/15/41, Callable 3/15/41 @ 100 | 1,000,000 | 977,230 | |||||||||
Sodexo, Inc., 2.72%, 4/16/31, Callable 1/16/31 @ 100 (a) | 500,000 | 511,945 | |||||||||
The Home Depot, Inc., 2.38%, 3/15/51, Callable 9/15/50 @ 100 | 500,000 | 462,275 | |||||||||
VF Corp., 2.95%, 4/23/30, Callable 1/23/30 @ 100 | 500,000 | 518,930 | |||||||||
Volkswagen Group of America Finance LLC, 3.20%, 9/26/26 (a) | 500,000 | 527,115 | |||||||||
5,484,755 | |||||||||||
Consumer Staples (3.1%): | |||||||||||
Anheuser-Busch InBev Worldwide, Inc., 3.50%, 6/1/30, Callable 3/1/30 @ 100 | 750,000 | 821,768 | |||||||||
Bunge Ltd. Finance Corp., 2.75%, 5/14/31, Callable 2/14/31 @ 100 | 500,000 | 507,625 | |||||||||
Church & Dwight Co., Inc., 2.30%, 12/15/31, Callable 9/15/31 @ 100 | 250,000 | 251,760 | |||||||||
General Mills, Inc., 2.25%, 10/14/31, Callable 7/14/31 @ 100 | 750,000 | 741,923 | |||||||||
McCormick & Co., Inc., 1.85%, 2/15/31, Callable 11/15/30 @ 100 | 500,000 | 478,815 | |||||||||
Sysco Corp., 2.45%, 12/14/31, Callable 9/14/31 @ 100 | 500,000 | 501,400 | |||||||||
3,303,291 | |||||||||||
Energy (1.0%): | |||||||||||
Boardwalk Pipelines LP, 4.95%, 12/15/24, Callable 9/15/24 @ 100 | 500,000 | 541,875 | |||||||||
| Plains All American Pipeline LP/PAA Finance Corp., 3.80%, 9/15/30, Callable 6/15/30 @ 100 | 500,000 | 526,335 | |||||||||
1,068,210 | |||||||||||
Financials (26.0%): | |||||||||||
AmFam Holdings, Inc., 2.81%, 3/11/31, Callable 12/11/30 @ 100 (a) | 500,000 | 510,880 | |||||||||
Assurant, Inc., 2.65%, 1/15/32, Callable 10/15/31 @ 100 | 250,000 | 245,403 | |||||||||
| Bank of America Corp. 3.42% (LIBOR03M+104bps), 12/20/28, Callable 12/20/27 @ 100 (b) | 2,000,000 | 2,137,319 | |||||||||
2.69% (SOFR+110bps), 4/22/32, Callable 4/22/31 @ 100 (b) | 2,000,000 | 2,034,200 | |||||||||
2.57% (SOFR+121bps), 10/20/32, Callable 10/20/31 @ 100 (b) | 250,000 | 251,415 | |||||||||
Blue Owl Finance LLC, 3.13%, 6/10/31, Callable 3/10/31 @ 100 (a) | 250,000 | 244,635 | |||||||||
Citigroup, Inc., 1.46% (SOFR+77bps), 6/9/27, Callable 6/9/26 @ 100 (b) | 2,000,000 | 1,963,500 | |||||||||
Cullen/Frost Bankers, Inc., 4.50%, 3/17/27, Callable 2/17/27 @ 100 | 500,000 | 551,315 | |||||||||
See notes to financial statements.
150
| Victory Portfolios II VictoryShares ESG Corporate Bond ETF | Schedule of Portfolio Investments — continued December 31, 2021 | ||||||
(Unaudited)
Security Description | Principal Amount | Value | |||||||||
F&G Global Funding, 2.00%, 9/20/28 (a) | $ | 250,000 | $ | 244,095 | |||||||
First American Financial Corp., 2.40%, 8/15/31, Callable 5/15/31 @ 100 | 500,000 | 490,075 | |||||||||
GA Global Funding Trust, 1.63%, 1/15/26 (a) | 500,000 | 496,115 | |||||||||
GlaxoSmithKline Capital, Inc., 4.20%, 3/18/43 | 500,000 | 608,835 | |||||||||
Global Atlantic Financial Co., 3.13%, 6/15/31, Callable 3/15/31 @ 100 (a) | 250,000 | 247,918 | |||||||||
Huntington Bancshares, Inc., 2.49%, 8/15/36, Callable 8/15/31 @ 100 (a) | 500,000 | 478,965 | |||||||||
| JPMorgan Chase & Co. 2.96% (SOFR+252bps), 5/13/31, Callable 5/13/30 @ 100 (b) | 250,000 | 258,723 | |||||||||
1.95% (SOFR+1bps), 2/4/32, Callable 2/4/31 @ 100 (b) | 2,000,000 | 1,927,420 | |||||||||
3.33% (SOFR+158bps), 4/22/52, Callable 4/22/51 @ 100 (b) | 1,000,000 | 1,077,890 | |||||||||
KeyBank NA, 3.90%, 4/13/29 | 500,000 | 550,480 | |||||||||
Level 3 Financing, Inc., 3.88%, 11/15/29, Callable 8/15/29 @ 100 (a) | 500,000 | 509,890 | |||||||||
MetLife, Inc., 4.13%, 8/13/42 | 500,000 | 593,459 | |||||||||
| Morgan Stanley 1.59% (SOFR+88bps), 5/4/27, Callable 5/4/26 @ 100 (b) | 2,500,000 | 2,474,374 | |||||||||
1.93% (SOFR+102bps), 4/28/32, Callable 4/28/31 @ 100, MTN (b) | 500,000 | 477,735 | |||||||||
2.51% (SOFR+120bps), 10/20/32, Callable 10/20/31 @ 100, MTN (b) | 250,000 | 250,138 | |||||||||
2.80% (SOFR+143bps), 1/25/52, Callable 1/25/51 @ 100 (b) | 1,000,000 | 982,530 | |||||||||
New York Life Global Funding, 1.85%, 8/1/31 (a) | 500,000 | 486,550 | |||||||||
PNC Bank NA, 3.88%, 4/10/25, Callable 3/10/25 @ 100 | 500,000 | 535,890 | |||||||||
Prudential Financial, Inc., 3.94%, 12/7/49, Callable 6/7/49 @ 100 | 500,000 | 587,254 | |||||||||
Regions Bank, 6.45%, 6/26/37 | 1,000,000 | 1,398,610 | |||||||||
| The Allstate Corp., 5.75% (LIBOR03M+294bps), 8/15/53, Callable 8/15/23 @ 100 (b) | 500,000 | 520,045 | |||||||||
| The Goldman Sachs Group, Inc., 2.38% (SOFR+125bps), 7/21/32, MTN, Callable 7/21/31 @ 100 (b) | 1,000,000 | 984,710 | |||||||||
| The PNC Financial Services Group, Inc., 2.55%, 1/22/30, Callable 10/24/29 @ 100 | 500,000 | 515,605 | |||||||||
| Truist Financial Corp. 5.10% (H15T10Y+435bps), Callable 3/1/30 @ 100 (b) (c) | 500,000 | 559,490 | |||||||||
1.89% (SOFR+63bps), 6/7/29, Callable 6/7/28 @ 100, MTN (b) | 1,000,000 | 984,220 | |||||||||
U.S. Bancorp, 3.10%, 4/27/26, MTN, Callable 3/27/26 @ 100 | 500,000 | 529,330 | |||||||||
Webster Financial Corp., 4.10%, 3/25/29, Callable 12/25/28 @ 100 | 500,000 | 549,140 | |||||||||
27,258,153 | |||||||||||
Health Care (7.2%): | |||||||||||
AbbVie, Inc., 4.25%, 11/21/49, Callable 5/21/49 @ 100 | 500,000 | 601,860 | |||||||||
Amgen, Inc., 1.65%, 8/15/28, Callable 6/15/28 @ 100 | 500,000 | 490,100 | |||||||||
Baxter International, Inc., 2.54%, 2/1/32, Callable 11/1/31 @ 100 (a) | 250,000 | 252,570 | |||||||||
Bristol-Myers Squibb Co., 2.55%, 11/13/50, Callable 5/13/50 @ 100 | 500,000 | 476,340 | |||||||||
Cigna Corp., 3.40%, 3/1/27, Callable 12/1/26 @ 100 | 500,000 | 538,025 | |||||||||
CVS Health Corp., 3.25%, 8/15/29, Callable 5/15/29 @ 100 | 2,000,000 | 2,134,340 | |||||||||
DENTSPLY SIRONA, Inc., 3.25%, 6/1/30, Callable 3/1/30 @ 100 | 750,000 | 791,903 | |||||||||
| Fresenius Medical Care U.S. Finance III, Inc., 2.38%, 2/16/31, Callable 11/16/30 @ 100 (a) | 500,000 | 477,950 | |||||||||
HCA, Inc., 4.50%, 2/15/27, Callable 8/15/26 @ 100 | 250,000 | 275,905 | |||||||||
Illumina, Inc., 2.55%, 3/23/31, Callable 12/23/30 @ 100 | 500,000 | 500,780 | |||||||||
PerkinElmer, Inc., 2.55%, 3/15/31, Callable 12/15/30 @ 100 | 500,000 | 504,260 | |||||||||
Roche Holdings, Inc., 1.93%, 12/13/28, Callable 10/13/28 @ 100 (a) | 500,000 | 502,940 | |||||||||
7,546,973 | |||||||||||
See notes to financial statements.
151
| Victory Portfolios II VictoryShares ESG Corporate Bond ETF | Schedule of Portfolio Investments — continued December 31, 2021 | ||||||
(Unaudited)
Security Description | Principal Amount | Value | |||||||||
Industrials (5.2%): | |||||||||||
Acuity Brands Lighting, Inc., 2.15%, 12/15/30, Callable 9/15/30 @ 100 | $ | 500,000 | $ | 487,245 | |||||||
Aircastle Ltd., 4.25%, 6/15/26, Callable 4/15/26 @ 100 | 500,000 | 536,090 | |||||||||
| Burlington Northern Santa Fe LLC 3.65%, 9/1/25, Callable 6/1/25 @ 100 | 500,000 | 538,460 | |||||||||
3.90%, 8/1/46, Callable 2/1/46 @ 100 | 500,000 | 583,730 | |||||||||
Carlisle Cos., Inc., 2.75%, 3/1/30, Callable 12/1/29 @ 100 | 500,000 | 510,810 | |||||||||
Carrier Global Corp., 3.38%, 4/5/40, Callable 10/5/39 @ 100 | 500,000 | 523,160 | |||||||||
GXO Logistics, Inc., 2.65%, 7/15/31, Callable 4/15/31 @ 100 (a) | 750,000 | 739,718 | |||||||||
Hubbell, Inc., 2.30%, 3/15/31, Callable 12/15/30 @ 100 | 500,000 | 500,340 | |||||||||
IDEX Corp., 3.00%, 5/1/30, Callable 2/1/30 @ 100 | 500,000 | 520,610 | |||||||||
Otis Worldwide Corp., 3.11%, 2/15/40, Callable 8/15/39 @ 100 | 500,000 | 512,110 | |||||||||
5,452,273 | |||||||||||
Information Technology (5.8%): | |||||||||||
Autodesk, Inc., 2.40%, 12/15/31, Callable 9/15/31 @ 100 | 750,000 | 748,898 | |||||||||
Broadcom, Inc., 2.60%, 2/15/33, Callable 11/15/32 @ 100 (a) | 1,000,000 | 969,890 | |||||||||
Dell, Inc., 5.40%, 9/10/40 | 500,000 | 563,280 | |||||||||
Jabil, Inc., 3.00%, 1/15/31, Callable 10/15/30 @ 100 | 500,000 | 514,390 | |||||||||
Micron Technology, Inc., 2.70%, 4/15/32, Callable 1/15/32 @ 100 | 250,000 | 251,015 | |||||||||
Microsoft Corp., 3.45%, 8/8/36, Callable 2/8/36 @ 100 | 500,000 | 574,445 | |||||||||
| Oracle Corp. 1.65%, 3/25/26, Callable 2/25/26 @ 100 | 1,000,000 | 991,690 | |||||||||
2.95%, 4/1/30, Callable 1/1/30 @ 100 | 500,000 | 505,365 | |||||||||
TSMC Arizona Corp., 2.50%, 10/25/31, Callable 7/25/31 @ 100 | 450,000 | 455,553 | |||||||||
VMware, Inc., 2.20%, 8/15/31, Callable 5/15/31 @ 100 | 500,000 | 491,455 | |||||||||
Western Digital Corp., 3.10%, 2/1/32, Callable 11/1/31 @ 100 | 100,000 | 100,730 | |||||||||
6,166,711 | |||||||||||
Materials (4.2%): | |||||||||||
Avery Dennison Corp., 2.25%, 2/15/32, Callable 11/15/31 @ 100 | 500,000 | 485,770 | |||||||||
Eagle Materials, Inc., 2.50%, 7/1/31, Callable 4/1/31 @ 100 | 250,000 | 247,028 | |||||||||
Ecolab, Inc., 1.65%, 2/1/27, Callable 1/1/27 @ 100 | 400,000 | 402,032 | |||||||||
LYB International Finance III LLC, 2.25%, 10/1/30, Callable 7/1/30 @ 100 | 500,000 | 497,600 | |||||||||
Packaging Corp. of America, 3.05%, 10/1/51, Callable 4/1/51 @ 100 | 750,000 | 746,393 | |||||||||
Reliance Steel & Aluminum Co., 2.15%, 8/15/30, Callable 5/15/30 @ 100 | 500,000 | 487,580 | |||||||||
The Dow Chemical Co., 4.25%, 10/1/34, Callable 4/1/34 @ 100 | 500,000 | 577,075 | |||||||||
WRKCo, Inc., 3.00%, 6/15/33, Callable 3/15/33 @ 100 | 1,000,000 | 1,031,310 | |||||||||
4,474,788 | |||||||||||
Real Estate (5.0%): | |||||||||||
Alexandria Real Estate Equities, Inc., 2.00%, 5/18/32, Callable 2/18/32 @ 100 | 1,000,000 | 960,010 | |||||||||
American Tower Corp., 1.50%, 1/31/28, Callable 11/30/27 @ 100 | 500,000 | 478,830 | |||||||||
Boston Properties LP, 2.55%, 4/1/32, Callable 1/1/32 @ 100 | 500,000 | 497,550 | |||||||||
CBRE Services, Inc., 2.50%, 4/1/31, Callable 1/1/31 @ 100 | 250,000 | 251,358 | |||||||||
ERP Operating LP, 2.85%, 11/1/26, Callable 8/1/26 @ 100 | 500,000 | 524,835 | |||||||||
Essex Portfolio LP, 2.65%, 3/15/32, Callable 12/15/31 @ 100 | 1,000,000 | 1,005,979 | |||||||||
GLP Capital LP/GLP Financing II, Inc., 3.25%, 1/15/32, Callable 10/15/31 @ 100 | 117,000 | 117,598 | |||||||||
Host Hotels & Resorts LP, 3.50%, 9/15/30, Callable 6/15/30 @ 100 | 500,000 | 513,455 | |||||||||
Kilroy Realty LP, 2.65%, 11/15/33, Callable 8/15/33 @ 100 | 250,000 | 242,997 | |||||||||
See notes to financial statements.
152
| Victory Portfolios II VictoryShares ESG Corporate Bond ETF | Schedule of Portfolio Investments — continued December 31, 2021 | ||||||
(Unaudited)
Security Description | Principal Amount | Value | |||||||||
| Physicians Realty LP 4.30%, 3/15/27, Callable 12/15/26 @ 100 | $ | 250,000 | $ | 277,610 | |||||||
2.63%, 11/1/31, Callable 8/1/31 @ 100 | 250,000 | 249,503 | |||||||||
Simon Property Group LP, 2.25%, 1/15/32, Callable 10/15/31 @ 100 | 250,000 | 244,395 | |||||||||
5,364,120 | |||||||||||
Utilities (6.6%): | |||||||||||
Alabama Power Co., 3.13%, 7/15/51, Callable 1/15/51 @ 100 | 500,000 | 512,180 | |||||||||
Duke Energy Florida LLC, 2.40%, 12/15/31, Callable 9/15/31 @ 100 | 1,000,000 | 1,012,287 | |||||||||
Duquesne Light Holdings, Inc., 2.78%, 1/7/32, Callable 10/7/31 @ 100 (a) | 250,000 | 248,670 | |||||||||
Entergy Corp., 2.40%, 6/15/31, Callable 3/5/31 @ 100 | 500,000 | 494,580 | |||||||||
Florida Power & Light Co., 3.15%, 10/1/49, Callable 4/1/49 @ 100 | 250,000 | 267,803 | |||||||||
ITC Holdings Corp., 3.35%, 11/15/27, Callable 8/15/27 @ 100 | 500,000 | 530,544 | |||||||||
MidAmerican Energy Co., 2.70%, 8/1/52, Callable 2/1/52 @ 100 | 500,000 | 490,025 | |||||||||
| NextEra Energy Capital Holdings, Inc. 0.45% (SOFR+40bps), 11/3/23, Callable 5/3/22 @ 100 (b) | 250,000 | 249,688 | |||||||||
2.44%, 1/15/32, Callable 10/15/31 @ 100 | 500,000 | 501,320 | |||||||||
Oncor Electric Delivery Co. LLC, 3.75%, 4/1/45, Callable 10/1/44 @ 100 | 500,000 | 571,649 | |||||||||
PECO Energy Co., 3.00%, 9/15/49, Callable 3/15/49 @ 100 | 500,000 | 507,460 | |||||||||
Southwestern Electric Power Co., 3.25%, 11/1/51, Callable 5/1/51 @ 100 | 250,000 | 249,108 | |||||||||
Union Electric Co., 2.15%, 3/15/32, Callable 12/15/31 @ 100 | 500,000 | 492,950 | |||||||||
Wisconsin Public Service Corp., 2.85%, 12/1/51, Callable 6/1/51 @ 100 | 250,000 | 247,115 | |||||||||
Xcel Energy, Inc., 2.35%, 11/15/31, Callable 5/15/31 @ 100 | 500,000 | 499,415 | |||||||||
6,874,794 | |||||||||||
Total Corporate Bonds (Cost $82,301,904) | 81,723,648 | ||||||||||
Yankee Dollars (20.3%) | |||||||||||
Communication Services (1.0%): | |||||||||||
British Telecommunications PLC, 3.25%, 11/8/29, Callable 8/8/29 @ 100 (a) | 500,000 | 511,410 | |||||||||
| Deutsche Telekom International Finance BV, 3.60%, 1/19/27, Callable 10/19/26 @ 100 (a) | 500,000 | 536,680 | |||||||||
1,048,090 | |||||||||||
Consumer Staples (2.0%): | |||||||||||
Alimentation Couche-Tard, Inc., 2.95%, 1/25/30, Callable 10/25/29 @ 100 (a) | 500,000 | 518,935 | |||||||||
Anheuser-Busch InBev Worldwide, Inc., 3.75%, 7/15/42 | 750,000 | 815,393 | |||||||||
Bacardi Ltd., 4.70%, 5/15/28, Callable 2/15/28 @ 100 (a) | 500,000 | 565,465 | |||||||||
Becle SAB de CV, 2.50%, 10/14/31, Callable 7/14/31 @ 100 (a) | 250,000 | 245,285 | |||||||||
2,145,078 | |||||||||||
Financials (14.0%): | |||||||||||
Barclays PLC, 4.95%, 1/10/47 | 1,000,000 | 1,295,530 | |||||||||
BNP Paribas SA, 4.38%, 5/12/26 (a) | 500,000 | 543,790 | |||||||||
| BP Capital Markets PLC, 4.38% (H15T5Y+404bps), Callable 6/22/25 @ 100 (b) (c) | 500,000 | 522,305 | |||||||||
BPCE SA, 3.25%, 1/11/28 (a) | 500,000 | 532,980 | |||||||||
Brookfield Finance, Inc., 2.72%, 4/15/31, Callable 1/15/31 @ 100 | 500,000 | 504,800 | |||||||||
Canadian Imperial Bank of Commerce, 7.26%, 4/10/32 (a) | 252,603 | 323,954 | |||||||||
Commonwealth Bank of Australia, 2.69%, 3/11/31 (a) | 500,000 | 491,815 | |||||||||
Credit Agricole SA, 3.25%, 10/4/24 (a) | 500,000 | 525,075 | |||||||||
See notes to financial statements.
153
| Victory Portfolios II VictoryShares ESG Corporate Bond ETF | Schedule of Portfolio Investments — continued December 31, 2021 | ||||||
(Unaudited)
Security Description | Principal Amount | Value | |||||||||
| Credit Suisse Group AG, 3.09% (SOFR+173bps), 5/14/32, Callable 5/14/31 @ 100 (a) (b) | $ | 500,000 | $ | 508,295 | |||||||
| Deutsche Bank AG, 4.88% (USISDA05+255bps), 12/1/32, Callable 12/1/27 @ 100 (b) | 500,000 | 539,720 | |||||||||
HSBC Holdings PLC, 2.21% (SOFR+129bps), 8/17/29, Callable 8/17/28 @ 100 (b) | 2,000,000 | 1,961,839 | |||||||||
JAB Holdings BV, 3.75%, 5/28/51, Callable 11/28/50 @ 100 (a) | 250,000 | 274,073 | |||||||||
| Lloyds Banking Group PLC, 1.63% (H15T1Y+85bps), 5/11/27, Callable 5/11/26 @ 100 (b) | 1,000,000 | 983,530 | |||||||||
| Macquarie Bank Ltd., 3.05% (H15T5Y+170bps), 3/3/36, Callable 3/3/31 @ 100 (a) (b) | 500,000 | 491,010 | |||||||||
| Nationwide Building Society, 4.13% (USISDA05+185bps), 10/18/32, Callable 10/18/27 @ 100 (a) (b) | 500,000 | 534,015 | |||||||||
| NatWest Group PLC, 1.64% (H15T1Y+90bps), 6/14/27, Callable 6/14/26 @ 100 (b) | 1,000,000 | 984,850 | |||||||||
| Shell International Finance BV 2.75%, 4/6/30, Callable 1/6/30 @ 100 | 500,000 | 523,005 | |||||||||
2.88%, 11/26/41, Callable 5/26/41 @ 100 | 500,000 | 501,820 | |||||||||
Siemens Financieringsmaatschappij NV, 3.40%, 3/16/27 (a) | 500,000 | 539,060 | |||||||||
| Societe Generale SA, 1.49% (H15T1Y+1bps), 12/14/26, Callable 12/14/25 @ 100 (a) (b) | 500,000 | 487,435 | |||||||||
The Bank of Nova Scotia, 4.50%, 12/16/25 | 500,000 | 550,330 | |||||||||
| The Toronto-Dominion Bank, 3.62% (USSW5+221bps), 9/15/31, Callable 9/15/26 @ 100 (b) | 500,000 | 537,060 | |||||||||
| Westpac Banking Corp., 4.32% (USISDA05+224bps), 11/23/31, Callable 11/23/26 @ 100 (b) | 500,000 | 540,940 | |||||||||
14,697,231 | |||||||||||
Health Care (1.1%): | |||||||||||
Mylan NV, 3.95%, 6/15/26, Callable 3/15/26 @ 100 | 500,000 | 539,290 | |||||||||
Olympus Corp., 2.14%, 12/8/26 (a) | 152,000 | 152,872 | |||||||||
Smith & Nephew PLC, 2.03%, 10/14/30, Callable 7/14/30 @ 100 | 500,000 | 483,525 | |||||||||
1,175,687 | |||||||||||
Industrials (1.0%): | |||||||||||
CNH Industrial NV, 3.85%, 11/15/27, MTN, Callable 8/15/27 @ 100 | 500,000 | 545,710 | |||||||||
Ferguson Finance PLC, 3.25%, 6/2/30, Callable 3/2/30 @ 100 (a) | 500,000 | 526,255 | |||||||||
1,071,965 | |||||||||||
Materials (0.7%): | |||||||||||
| CCL Industries, Inc. 3.25%, 10/1/26, Callable 7/1/26 @ 100 (a) | 500,000 | 525,145 | |||||||||
3.05%, 6/1/30, Callable 3/1/30 @ 100 (a) | 235,000 | 243,223 | |||||||||
768,368 | |||||||||||
Real Estate (0.5%): | |||||||||||
| Ontario Teachers' Cadillac Fairview Properties Trust, 2.50%, 10/15/31, Callable 7/15/31 @ 100 (a) | 504,000 | 505,950 | |||||||||
Total Yankee Dollars (Cost $21,636,576) | 21,412,369 | ||||||||||
See notes to financial statements.
154
| Victory Portfolios II VictoryShares ESG Corporate Bond ETF | Schedule of Portfolio Investments — continued December 31, 2021 | ||||||
(Unaudited)
Security Description | Principal Amount | Value | |||||||||
Commercial Papers (0.9%) (d) | |||||||||||
AutoNation, Inc., 0.32%, 1/3/22 (a) | $ | 500,000 | $ | 499,987 | |||||||
Jabil, Inc., 0.49%, 1/6/22 (a) | 500,000 | 499,959 | |||||||||
Total Commercial Papers (Cost $999,963) | 999,946 | ||||||||||
Total Investments (Cost $104,938,443) — 98.8% | 104,135,963 | ||||||||||
Other assets in excess of liabilities — 1.2% | 1,274,338 | ||||||||||
NET ASSETS — 100.00% | $ | 105,410,301 | |||||||||
(a) Rule 144A security or other security that is restricted as to resale to institutional investors. The Fund's Adviser has deemed this security to be liquid (unless otherwise noted as illiquid) based upon procedures approved by the Board of Trustees. As of December 31, 2021, the fair value of these securities was $18,384,369 and amounted to 17.4% of net assets.
(b) Variable or Floating-Rate Security. Rate disclosed is as of December 31, 2021.
(c) Security is perpetual and has no final maturity date but may be subject to calls at various dates in the future.
(d) Rate represents the effective yield at December 31, 2021.
bps — Basis points
H15T1Y — 1 Year Treasury Constant Maturity Rate, rate disclosed as of December 31, 2021.
H15T5Y — 5 Year Treasury Constant Maturity Rate, rate disclosed as of December 31, 2021.
LIBOR — London InterBank Offered Rate
LIBOR03M — 3 Month US Dollar LIBOR, rate disclosed as of December 31, 2021, based on the last reset date of the security
LLC — Limited Liability Company
LP — Limited Partnership
MTN — Medium Term Note
PLC — Public Limited Company
SOFR — Secured Overnight Financing Rate
USISDA05 — 5 Year USD ICE Swap, rate disclosed as of December 31, 2021
USSW5 — USD 5 Year Swap Rate, rate disclosed as of December 31, 2021.
See notes to financial statements.
155
| Victory Portfolios II VictoryShares THB Mid Cap ESG ETF | Schedule of Portfolio Investments December 31, 2021 | ||||||
(Unaudited)
Security Description | Shares | Value | |||||||||
Common Stocks (100.0%) | |||||||||||
Aerospace & Defense (3.2%): | |||||||||||
HEICO Corp. | 597 | $ | 86,099 | ||||||||
Air Freight & Logistics (3.5%): | |||||||||||
GXO Logistics, Inc. (a) | 1,033 | 93,827 | |||||||||
Commercial Services & Supplies (10.0%): | |||||||||||
Cintas Corp. | 192 | 85,089 | |||||||||
Copart, Inc. (a) | 844 | 127,967 | |||||||||
Rollins, Inc. | 1,744 | 59,662 | |||||||||
272,718 | |||||||||||
Consumer Discretionary (9.9%): | |||||||||||
D.R. Horton, Inc. | 900 | 97,605 | |||||||||
LKQ Corp. | 1,176 | 70,595 | |||||||||
NVR, Inc. (a) | 17 | 100,451 | |||||||||
268,651 | |||||||||||
Electronic Equipment, Instruments & Components (13.2%): | |||||||||||
Amphenol Corp., Class A | 1,400 | 122,444 | |||||||||
Keysight Technologies, Inc. (a) | 372 | 76,822 | |||||||||
Teledyne Technologies, Inc. (a) | 148 | 64,660 | |||||||||
Zebra Technologies Corp. (a) | 166 | 98,803 | |||||||||
362,729 | |||||||||||
Health Care (16.5%): | |||||||||||
Chemed Corp. | 158 | 83,588 | |||||||||
DENTSPLY SIRONA, Inc. | 1,248 | 69,626 | |||||||||
Laboratory Corp. of America Holdings (a) | 304 | 95,520 | |||||||||
STERIS PLC | 356 | 86,654 | |||||||||
Waters Corp. (a) | 296 | 110,290 | |||||||||
445,678 | |||||||||||
Industrial Conglomerates (3.1%): | |||||||||||
Carlisle Cos., Inc. | 340 | 84,361 | |||||||||
Machinery (9.4%): | |||||||||||
Graco, Inc. | 1,068 | 86,102 | |||||||||
Parker-Hannifin Corp. | 276 | 87,801 | |||||||||
The Toro Co. | 812 | 81,127 | |||||||||
255,030 | |||||||||||
Materials (2.0%): | |||||||||||
Crown Holdings, Inc. | 500 | 55,310 | |||||||||
Professional Services (6.6%): | |||||||||||
CACI International, Inc., Class A (a) | 257 | 69,187 | |||||||||
Verisk Analytics, Inc. | 484 | 110,705 | |||||||||
179,892 | |||||||||||
See notes to financial statements.
156
| Victory Portfolios II VictoryShares THB Mid Cap ESG ETF | Schedule of Portfolio Investments — continued December 31, 2021 | ||||||
(Unaudited)
Security Description | Shares | Value | |||||||||
Road & Rail (7.0%): | |||||||||||
J.B. Hunt Transport Services, Inc. | 512 | $ | 104,653 | ||||||||
Old Dominion Freight Line, Inc. | 240 | 86,011 | |||||||||
190,664 | |||||||||||
Software (12.1%): | |||||||||||
Cadence Design Systems, Inc. (a) | 672 | 125,228 | |||||||||
Synopsys, Inc. (a) | 270 | 99,495 | |||||||||
Tyler Technologies, Inc. (a) | 192 | 103,286 | |||||||||
328,009 | |||||||||||
Trading Companies & Distributors (3.5%): | |||||||||||
Fastenal Co. | 1,500 | 96,090 | |||||||||
Total Common Stocks (Cost $2,373,955) | 2,719,058 | ||||||||||
Total Investments (Cost $2,373,955) — 100.0% | 2,719,058 | ||||||||||
Liabilities in excess of other assets — 0.0% (b) | (644 | ) | |||||||||
NET ASSETS — 100.00% | $ | 2,718,414 | |||||||||
(a) Non-income producing security.
(b) Amount represents less than 0.05% of net assets.
PLC — Public Limited Company
See notes to financial statements.
157
Victory Portfolios II | Statements of Assets and Liabilities December 31, 2021 | ||||||
(Unaudited)
| VictoryShares US 500 Volatility Wtd ETF | VictoryShares US Small Cap Volatility Wtd ETF | VictoryShares International Volatility Wtd ETF | |||||||||||||
Assets: | |||||||||||||||
| Affiliated investments, at value (Cost $—, $40,115 and $—) | $ | — | $ | 61,736 | $ | — | |||||||||
| Unaffiliated investments, at value (Cost $506,499,170, $23,485,776 and $98,861,791) | 694,876,216 | (a) | 27,547,574 | (b) | 121,065,577 | (c) | |||||||||
| Foreign currency, at value (Cost $—, $— and $23,838) | — | — | 23,858 | ||||||||||||
Cash | 1,673,088 | 64,847 | 123,106 | ||||||||||||
Deposit with broker for futures contracts | 396,358 | 33,471 | 108,697 | ||||||||||||
Receivables: | |||||||||||||||
Interest and dividends | 662,388 | 13,616 | 156,158 | ||||||||||||
Investments sold | 3,866,775 | — | — | ||||||||||||
Reclaims | — | — | 151,286 | ||||||||||||
From Adviser | 832 | 3,851 | 12,683 | ||||||||||||
Prepaid expenses | 1,321 | 33 | 187 | ||||||||||||
Total Assets | 701,476,978 | 27,725,128 | 121,641,552 | ||||||||||||
Liabilities: | |||||||||||||||
Payables: | |||||||||||||||
Collateral received on loaned securities | 10,035,590 | 144,942 | 4,025,356 | ||||||||||||
Capital shares redeemed | 3,879,824 | — | — | ||||||||||||
| Variation margin on open futures contracts | 5,804 | 205 | 130 | ||||||||||||
Accrued expenses and other payables: | |||||||||||||||
Investment advisory fees | 176,154 | 6,829 | 39,020 | ||||||||||||
Administration fees | 9,122 | 355 | 1,959 | ||||||||||||
Custodian fees | 5,106 | 573 | 25,995 | ||||||||||||
Compliance fees | 427 | 15 | 67 | ||||||||||||
Trustees' fees | 571 | — | — | ||||||||||||
Other accrued expenses | 43,034 | 5,995 | 19,626 | ||||||||||||
Total Liabilities | 14,155,632 | 158,914 | 4,112,153 | ||||||||||||
Net Assets: | |||||||||||||||
Capital | 514,595,245 | 30,433,962 | 99,339,127 | ||||||||||||
Total accumulated earnings/(loss) | 172,726,101 | (2,867,748 | ) | 18,190,272 | |||||||||||
Net Assets | $ | 687,321,346 | $ | 27,566,214 | $ | 117,529,399 | |||||||||
| Shares (unlimited shares authorized, no par value): | 8,850,000 | 400,000 | 2,600,000 | ||||||||||||
Net asset value: | $ | 77.66 | $ | 68.92 | $ | 45.20 | |||||||||
(a) Includes $9,714,977 of securities on loan.
(b) Includes $139,560 of securities on loan.
(c) Includes $3,853,110 of securities on loan.
See notes to financial statements.
158
Victory Portfolios II | Statements of Assets and Liabilities December 31, 2021 | ||||||
(Unaudited)
| VictoryShares US Large Cap High Div Volatility Wtd ETF | VictoryShares US Small Cap High Div Volatility Wtd ETF | ||||||||||
Assets: | |||||||||||
Investments, at value (Cost $209,648,759 and $241,095,472) | $ | 242,050,083 | (a) | $ | 256,390,480 | (b) | |||||
Cash | 441,546 | 751,574 | |||||||||
Deposit with broker for futures contracts | 284,342 | 112,934 | |||||||||
Receivables: | |||||||||||
Interest and dividends | 576,893 | 332,724 | |||||||||
Capital shares issued | — | 3,065,320 | |||||||||
From Adviser | 2,773 | 3,715 | |||||||||
Prepaid expenses | 343 | 123 | |||||||||
Total Assets | 243,355,980 | 260,656,870 | |||||||||
Liabilities: | |||||||||||
Payables: | |||||||||||
Collateral received on loaned securities | 2,212,270 | 5,888,647 | |||||||||
Investments purchased | — | 3,052,122 | |||||||||
Variation margin on open futures contracts | 2,063 | 1,624 | |||||||||
Accrued expenses and other payables: | |||||||||||
Investment advisory fees | 58,299 | 61,681 | |||||||||
Administration fees | 3,235 | 4,372 | |||||||||
Custodian fees | 1,874 | 1,856 | |||||||||
Compliance fees | 129 | 101 | |||||||||
Other accrued expenses | 17,467 | 10,386 | |||||||||
Total Liabilities | 2,295,337 | 9,020,789 | |||||||||
Net Assets: | |||||||||||
Capital | 244,197,638 | 257,678,415 | |||||||||
Total accumulated earnings/(loss) | (3,136,995 | ) | (6,042,334 | ) | |||||||
Net Assets | $ | 241,060,643 | $ | 251,636,081 | |||||||
Shares (unlimited shares authorized, no par value): | 3,950,000 | 4,100,000 | |||||||||
Net asset value: | $ | 61.03 | $ | 61.37 | |||||||
(a) Includes $2,140,650 of securities on loan.
(b) Includes $5,683,641 of securities on loan.
See notes to financial statements.
159
Victory Portfolios II | Statements of Assets and Liabilities December 31, 2021 | ||||||
(Unaudited)
| VictoryShares International High Div Volatility Wtd ETF | VictoryShares Emerging Market High Div Volatility Wtd ETF | VictoryShares Dividend Accelerator ETF | |||||||||||||
Assets: | |||||||||||||||
| Investments, at value (Cost $19,436,619, $17,386,695 and $289,109,060) | $ | 20,192,164 | (a) | $ | 17,143,291 | (b) | $ | 353,808,293 | (c) | ||||||
| Foreign currency, at value (Cost $11,136, $2,057 and $—) | 11,136 | 2,057 | — | ||||||||||||
Cash | 51,936 | 28,618 | 496,743 | ||||||||||||
Deposit with broker for futures contracts | 25,836 | 40,550 | 304,372 | ||||||||||||
Receivables: | |||||||||||||||
Interest and dividends | 49,826 | 29,938 | 552,248 | ||||||||||||
Reclaims | 71,076 | 2,326 | — | ||||||||||||
From Adviser | 5,717 | 18,039 | 1,557 | ||||||||||||
Prepaid expenses | 128 | 40 | 590 | ||||||||||||
Total Assets | 20,407,819 | 17,264,859 | 355,163,803 | ||||||||||||
Liabilities: | |||||||||||||||
Payables: | |||||||||||||||
Collateral received on loaned securities | 857,575 | 749,575 | 371,172 | ||||||||||||
| Variation margin on open futures contracts | 65 | 350 | 2,063 | ||||||||||||
Accrued expenses and other payables: | |||||||||||||||
Investment advisory fees | 6,495 | 6,222 | 87,852 | ||||||||||||
Administration fees | 53 | 19 | 6,022 | ||||||||||||
Custodian fees | 4,929 | 25,183 | 2,793 | ||||||||||||
Compliance fees | 23 | 11 | 188 | ||||||||||||
Other accrued expenses | 9,618 | 26,943 | 16,572 | ||||||||||||
Total Liabilities | 878,758 | 808,303 | 486,662 | ||||||||||||
Net Assets: | |||||||||||||||
Capital | 32,588,686 | 21,485,479 | 282,543,417 | ||||||||||||
Total accumulated earnings/(loss) | (13,059,625 | ) | (5,028,923 | ) | 72,133,724 | ||||||||||
Net Assets | $ | 19,529,061 | $ | 16,456,556 | $ | 354,677,141 | |||||||||
| Shares (unlimited shares authorized, no par value): | 600,000 | 700,000 | 7,450,000 | ||||||||||||
Net asset value: | $ | 32.55 | $ | 23.51 | $ | 47.61 | |||||||||
(a) Includes $823,029 of securities on loan.
(b) Includes $690,659 of securities on loan.
(c) Includes $365,148 of securities on loan.
See notes to financial statements.
160
Victory Portfolios II | Statements of Assets and Liabilities December 31, 2021 | ||||||
(Unaudited)
| VictoryShares US Multi-Factor Minimum Volatility ETF | VictoryShares US 500 Enhanced Volatility Wtd ETF | VictoryShares US EQ Income Enhanced Volatility Wtd ETF | |||||||||||||
Assets: | |||||||||||||||
| Investments, at value (Cost $134,164,994, $823,670,844 and $975,956,773) | $ | 163,368,431 | $ | 1,079,406,818 | (a) | $ | 1,123,196,377 | (b) | |||||||
Cash | 382,216 | — | — | ||||||||||||
| Deposit with broker for futures contracts | 218,297 | 494,437 | 652,277 | ||||||||||||
Receivables: | |||||||||||||||
Interest and dividends | 104,442 | 1,001,982 | 2,640,743 | ||||||||||||
Capital shares issued | — | — | 10,430,315 | ||||||||||||
From Adviser | 3,250 | — | — | ||||||||||||
Prepaid expenses | 344 | 1,316 | 1,193 | ||||||||||||
Total Assets | 164,076,980 | 1,080,904,553 | 1,136,920,905 | ||||||||||||
Liabilities: | |||||||||||||||
Payables: | |||||||||||||||
| Collateral received on loaned securities | — | 12,340,356 | 20,585,825 | ||||||||||||
Investments purchased | — | — | 10,375,967 | ||||||||||||
| Variation margin on open futures contracts | 2,062 | 9,242 | 9,546 | ||||||||||||
Accrued expenses and other payables: | |||||||||||||||
Investment advisory fees | 40,915 | 264,407 | 267,260 | ||||||||||||
Administration fees | 2,685 | 14,916 | 16,597 | ||||||||||||
Custodian fees | 1,544 | 6,387 | 6,289 | ||||||||||||
Compliance fees | 96 | 544 | 525 | ||||||||||||
Trustees' fees | — | 650 | 394 | ||||||||||||
Other accrued expenses | 11,713 | 47,596 | 45,102 | ||||||||||||
Total Liabilities | 59,015 | 12,684,098 | 31,307,505 | ||||||||||||
Net Assets: | |||||||||||||||
Capital | 132,376,865 | 839,313,634 | 971,718,632 | ||||||||||||
Total accumulated earnings/(loss) | 31,641,100 | 228,906,821 | 133,894,768 | ||||||||||||
Net Assets | $ | 164,017,965 | $ | 1,068,220,455 | $ | 1,105,613,400 | |||||||||
| Shares (unlimited shares authorized, no par value): | 3,900,000 | 13,750,000 | 15,900,000 | ||||||||||||
Net asset value: | $ | 42.06 | $ | 77.69 | $ | 69.54 | |||||||||
(a) Includes $11,875,760 of securities on loan.
(b) Includes $20,053,733 of securities on loan.
See notes to financial statements.
161
Victory Portfolios II | Statements of Assets and Liabilities December 31, 2021 | ||||||
(Unaudited)
| VictoryShares US Discovery Enhanced Volatility Wtd ETF | VictoryShares Developed Enhanced Volatility Wtd ETF | VictoryShares Nasdaq Next 50 ETF | |||||||||||||
Assets: | |||||||||||||||
| Affiliated investments, at value (Cost $88,744, $— and $—) | $ | 158,284 | $ | — | $ | — | |||||||||
| Unaffiliated investments, at value (Cost $59,943,116, $35,747,523 and $133,079,382) | 71,287,223 | (a) | 42,408,699 | (b) | 152,929,343 | ||||||||||
| Foreign currency, at value (Cost $—, $9,019 and $—) | — | 9,041 | — | ||||||||||||
Cash | — | — | 655,078 | ||||||||||||
| Deposit with broker for futures contracts | 41,644 | 90,258 | 104,495 | ||||||||||||
Receivables: | |||||||||||||||
Interest and dividends | 34,948 | 54,400 | 54,148 | ||||||||||||
Reclaims | — | 162,128 | 4,092 | ||||||||||||
From Adviser | 3,772 | 15,758 | 12,075 | ||||||||||||
Prepaid expenses | 80 | 84 | 71 | ||||||||||||
Total Assets | 71,525,951 | 42,740,368 | 153,759,302 | ||||||||||||
Liabilities: | |||||||||||||||
Payables: | |||||||||||||||
| Collateral received on loaned securities | 825,012 | 1,384,271 | — | ||||||||||||
Investments purchased | — | — | 146,080 | ||||||||||||
| Variation margin on open futures contracts | 410 | 65 | 4,380 | ||||||||||||
Accrued expenses and other payables: | |||||||||||||||
Investment advisory fees | 17,506 | 13,707 | 19,649 | ||||||||||||
Administration fees | 824 | 76 | 886 | ||||||||||||
Custodian fees | 755 | 37,683 | 2,393 | ||||||||||||
Compliance fees | 39 | 27 | 73 | ||||||||||||
Trustees' fees | — | — | 86 | ||||||||||||
Other accrued expenses | 9,486 | 18,811 | 61,651 | ||||||||||||
Total Liabilities | 854,032 | 1,454,640 | 235,198 | ||||||||||||
Net Assets: | |||||||||||||||
Capital | 89,783,795 | 60,012,292 | 140,723,118 | ||||||||||||
Total accumulated earnings/(loss) | (19,111,876 | ) | (18,726,564 | ) | 12,800,986 | ||||||||||
Net Assets | $ | 70,671,919 | $ | 41,285,728 | $ | 153,524,104 | |||||||||
| Shares (unlimited shares authorized, no par value): | 1,100,000 | 1,200,000 | 4,500,000 | ||||||||||||
Net asset value: | $ | 64.25 | $ | 34.40 | $ | 34.12 | |||||||||
(a) Includes $796,001 of securities on loan.
(b) Includes $1,327,116 of securities on loan.
See notes to financial statements.
162
Victory Portfolios II | Statements of Assets and Liabilities December 31, 2021 | ||||||
(Unaudited)
| VictoryShares ESG Core Plus Bond ETF | VictoryShares ESG Corporate Bond ETF | VictoryShares THB Mid Cap ESG ETF | |||||||||||||
Assets: | |||||||||||||||
| Investments, at value (Cost $204,206,680, $104,938,443 and $2,373,955) | $ | 203,564,332 | $ | 104,135,963 | $ | 2,719,058 | |||||||||
Cash | 182,342 | 566,351 | 10,850 | ||||||||||||
Receivables: | |||||||||||||||
Interest and dividends | 725,323 | 726,482 | 661 | ||||||||||||
Investments sold | — | — | 45,112 | ||||||||||||
From Adviser | 4,396 | 5,204 | 3,554 | ||||||||||||
Prepaid expenses | 26,547 | 24,340 | — | ||||||||||||
Total Assets | 204,502,940 | 105,458,340 | 2,779,235 | ||||||||||||
Liabilities: | |||||||||||||||
Payables: | |||||||||||||||
Investments purchased | 9,643,957 | — | 55,256 | ||||||||||||
Accrued expenses and other payables: | |||||||||||||||
Investment advisory fees | 57,267 | 31,347 | 1,120 | ||||||||||||
Administration fees | 3,689 | 2,022 | 51 | ||||||||||||
Custodian fees | 1,440 | 1,442 | 538 | ||||||||||||
Compliance fees | 98 | 89 | 10 | ||||||||||||
Trustees' fees | 1,402 | 1,365 | 368 | ||||||||||||
Other accrued expenses | 10,491 | 11,774 | 3,478 | ||||||||||||
Total Liabilities | 9,718,344 | 48,039 | 60,821 | ||||||||||||
Net Assets: | |||||||||||||||
Capital | 195,400,606 | 106,319,172 | 2,373,729 | ||||||||||||
Total accumulated earnings/(loss) | (616,010 | ) | (908,871 | ) | 344,685 | ||||||||||
Net Assets | $ | 194,784,596 | $ | 105,410,301 | $ | 2,718,414 | |||||||||
| Shares (unlimited shares authorized, no par value): | 7,825,000 | 4,250,000 | 100,000 | ||||||||||||
Net asset value: | $ | 24.89 | $ | 24.80 | $ | 27.18 | |||||||||
See notes to financial statements.
163
Victory Portfolios II | Statements of Operations For the Six Months Ended December 31, 2021 | ||||||
(Unaudited)
| VictoryShares US 500 Volatility Wtd ETF | VictoryShares US Small Cap Volatility Wtd ETF | VictoryShares International Volatility Wtd ETF | |||||||||||||
Investment Income: | |||||||||||||||
Dividends | $ | 5,641,040 | $ | 254,881 | $ | 1,348,635 | |||||||||
Non-cash dividends | — | — | 286,295 | ||||||||||||
Affiliated dividend income | — | 639 | — | ||||||||||||
Interest | 382 | 1 | 17 | ||||||||||||
Securities lending (net of fees) | 21,373 | 569 | 24,810 | ||||||||||||
Foreign tax withholding | (830 | ) | (170 | ) | (222,361 | ) | |||||||||
Total Income | 5,661,965 | 255,920 | 1,437,396 | ||||||||||||
Expenses: | |||||||||||||||
Investment advisory fees | 1,062,492 | 40,150 | 236,367 | ||||||||||||
Administration fees | 192,367 | 7,268 | 32,097 | ||||||||||||
Sub-Administration fees | 9,052 | 9,052 | 9,052 | ||||||||||||
Custodian fees | 16,378 | 1,770 | 54,893 | ||||||||||||
Servicing fees | 2,619 | 2,568 | 2,568 | ||||||||||||
Trustees' fees | 22,131 | 1,482 | 4,207 | ||||||||||||
Compliance fees | 2,542 | 94 | 419 | ||||||||||||
Legal and audit fees | 22,288 | 6,425 | 9,423 | ||||||||||||
Broker interest fees | 398 | — | — | ||||||||||||
Interest fees | — | 47 | 139 | ||||||||||||
Other expenses | 32,795 | 4,013 | 9,249 | ||||||||||||
Total Expenses | 1,363,062 | 72,869 | 358,414 | ||||||||||||
Expenses waived/reimbursed by Adviser | (123,273 | ) | (25,965 | ) | (92,355 | ) | |||||||||
Net Expenses | 1,239,789 | 46,904 | 266,059 | ||||||||||||
Net Investment Income (Loss) | 4,422,176 | 209,016 | 1,171,337 | ||||||||||||
| Realized/Unrealized Gains (Losses) from Investments: | |||||||||||||||
| Net realized gains (losses) from unaffiliated investment securities and foreign currency transactions | (1,874,529 | ) | (666,915 | ) | 2,524,777 | ||||||||||
| Net realized gains (losses) from affiliated investment securities | — | 22,352 | — | ||||||||||||
Net realized gains (losses) from futures contracts | 365,354 | (3,354 | ) | (2,870 | ) | ||||||||||
Net realized gains (losses) from in-kind redemptions | 58,817,375 | 2,036,548 | — | ||||||||||||
| Net change in unrealized appreciation/depreciation on unaffiliated investment securities and foreign currency translations | 3,217,521 | 212,083 | (689,760 | ) | |||||||||||
| Net change in unrealized appreciation/depreciation on affiliated investment securities | — | (13,005 | ) | — | |||||||||||
| Net change in unrealized appreciation/depreciation on futures contracts | (24,872 | ) | (4,355 | ) | 9,664 | ||||||||||
Net realized/unrealized gains (losses) on investments | 60,500,849 | 1,583,354 | 1,841,811 | ||||||||||||
Change in net assets resulting from operations | $ | 64,923,025 | $ | 1,792,370 | $ | 3,013,148 | |||||||||
See notes to financial statements.
164
Victory Portfolios II | Statements of Operations For the Six Months Ended December 31, 2021 | ||||||
(Unaudited)
| VictoryShares US Large Cap High Div Volatility Wtd ETF | VictoryShares US Small Cap High Div Volatility Wtd ETF | ||||||||||
Investment Income: | |||||||||||
Dividends | $ | 3,989,931 | $ | 4,688,610 | |||||||
Interest | 67 | 68 | |||||||||
Securities lending (net of fees) | 3,880 | 21,175 | |||||||||
Foreign tax withholding | — | (293 | ) | ||||||||
Total Income | 3,993,878 | 4,709,560 | |||||||||
Expenses: | |||||||||||
Investment advisory fees | 342,573 | 373,577 | |||||||||
Administration fees | 62,019 | 67,639 | |||||||||
Sub-Administration fees | 9,052 | 9,052 | |||||||||
Custodian fees | 5,977 | 6,449 | |||||||||
Servicing fees | 2,568 | 2,568 | |||||||||
Trustees' fees | 7,465 | 7,555 | |||||||||
Compliance fees | 805 | 831 | |||||||||
Legal and audit fees | 11,185 | 10,951 | |||||||||
Broker interest fees | — | 173 | |||||||||
Other expenses | 13,255 | 11,690 | |||||||||
Total Expenses | 454,899 | 490,485 | |||||||||
Expenses waived/reimbursed by Adviser | (55,045 | ) | (54,478 | ) | |||||||
Net Expenses | 399,854 | 436,007 | |||||||||
Net Investment Income (Loss) | 3,594,024 | 4,273,553 | |||||||||
Realized/Unrealized Gains (Losses) from Investments: | |||||||||||
Net realized gains (losses) from investment securities | (1,983,717 | ) | (9,742,487 | ) | |||||||
Net realized gains (losses) from futures contracts | 134,052 | (15,213 | ) | ||||||||
Net realized gains (losses) from in-kind redemptions | 14,822,667 | 12,757,596 | |||||||||
| Net change in unrealized appreciation/depreciation on investment securities | 3,637,179 | 2,892,130 | |||||||||
| Net change in unrealized appreciation/depreciation on futures contracts | (3,232 | ) | 27,507 | ||||||||
Net realized/unrealized gains (losses) on investments | 16,606,949 | 5,919,533 | |||||||||
Change in net assets resulting from operations | $ | 20,200,973 | $ | 10,193,086 | |||||||
See notes to financial statements.
165
Victory Portfolios II | Statements of Operations For the Six Months Ended December 31, 2021 | ||||||
(Unaudited)
| VictoryShares International High Div Volatility Wtd ETF | VictoryShares Emerging Market High Div Volatility Wtd ETF | VictoryShares Dividend Accelerator ETF | |||||||||||||
Investment Income: | |||||||||||||||
Dividends | $ | 439,205 | $ | 715,572 | $ | 3,249,739 | |||||||||
Non-cash dividends | 70,450 | — | — | ||||||||||||
Interest | 71 | — | 47 | ||||||||||||
Securities lending (net of fees) | 4,316 | 94 | 73 | ||||||||||||
Foreign tax withholding | (54,278 | ) | (94,883 | ) | — | ||||||||||
Total Income | 459,764 | 620,783 | 3,249,859 | ||||||||||||
Expenses: | |||||||||||||||
Investment advisory fees | 41,331 | 40,088 | 518,135 | ||||||||||||
Administration fees | 5,614 | 4,840 | 93,805 | ||||||||||||
Sub-Administration fees | 9,052 | 10,057 | 9,052 | ||||||||||||
Custodian fees | 10,764 | 48,851 | 8,530 | ||||||||||||
Servicing fees | 2,568 | 2,499 | 2,499 | ||||||||||||
Trustees' fees | 1,486 | 1,281 | 10,972 | ||||||||||||
Compliance fees | 88 | 67 | 1,222 | ||||||||||||
Legal and audit fees | 6,913 | 23,486 | 12,273 | ||||||||||||
Line of credit fees | — | 28 | — | ||||||||||||
Interest fees | 117 | 757 | — | ||||||||||||
Other expenses | 4,971 | 6,151 | 14,875 | ||||||||||||
Total Expenses | 82,904 | 138,105 | 671,363 | ||||||||||||
Expenses waived/reimbursed by Adviser | (36,333 | ) | (92,823 | ) | (66,779 | ) | |||||||||
Net Expenses | 46,571 | 45,282 | 604,584 | ||||||||||||
Net Investment Income (Loss) | 413,193 | 575,501 | 2,645,275 | ||||||||||||
| Realized/Unrealized Gains (Losses) from Investments: | |||||||||||||||
| Net realized gains (losses) from investment securities and foreign currency transactions | 235,402 | 489,334 | (402,752 | ) | |||||||||||
Foreign taxes on realized gains | — | (24,811 | ) | — | |||||||||||
Net realized gains (losses) from futures contracts | (2,726 | ) | (4,675 | ) | 129,243 | ||||||||||
| Net realized gains (losses) from in-kind redemptions | 290,838 | 164,150 | 14,738,749 | ||||||||||||
| Net change in unrealized appreciation/ depreciation on investment securities and foreign currency translations | (467,566 | ) | (1,197,431 | ) | 12,491,854 | ||||||||||
| Net change in unrealized appreciation/ depreciation on futures contracts | 6,669 | 100 | 10,781 | ||||||||||||
| Net change in accrued foreign taxes on unrealized gains | — | 9,836 | — | ||||||||||||
| Net realized/unrealized gains (losses) on investments | 62,617 | (563,497 | ) | 26,967,875 | |||||||||||
Change in net assets resulting from operations | $ | 475,810 | $ | 12,004 | $ | 29,613,150 | |||||||||
See notes to financial statements.
166
Victory Portfolios II | Statements of Operations For the Six Months Ended December 31, 2021 | ||||||
(Unaudited)
| VictoryShares US Multi-Factor Minimum Volatility ETF | VictoryShares US 500 Enhanced Volatility Wtd ETF | VictoryShares US EQ Income Enhanced Volatility Wtd ETF | |||||||||||||
Investment Income: | |||||||||||||||
Dividends | $ | 1,614,724 | $ | 8,116,038 | $ | 17,419,780 | |||||||||
Interest | 70 | — | — | ||||||||||||
Securities lending (net of fees) | 1 | 30,855 | 17,290 | ||||||||||||
Foreign tax withholding | (428 | ) | (1,207 | ) | — | ||||||||||
Total Income | 1,614,367 | 8,145,686 | 17,437,070 | ||||||||||||
Expenses: | |||||||||||||||
Investment advisory fees | 256,628 | 1,515,517 | 1,487,191 | ||||||||||||
Administration fees | 46,470 | 274,340 | 269,194 | ||||||||||||
Sub-Administration fees | 9,051 | 9,051 | 9,051 | ||||||||||||
Custodian fees | 4,876 | 22,087 | 21,512 | ||||||||||||
Servicing fees | 2,341 | 2,619 | 2,619 | ||||||||||||
Trustees' fees | 5,831 | 29,255 | 28,467 | ||||||||||||
Compliance fees | 609 | 3,456 | 3,364 | ||||||||||||
Legal and audit fees | 10,158 | 28,915 | 28,522 | ||||||||||||
Broker interest fees | — | 565 | 494 | ||||||||||||
Interest fees | — | 90 | 897 | ||||||||||||
Other expenses | 9,391 | 40,148 | 38,852 | ||||||||||||
Total Expenses | 345,355 | 1,926,043 | 1,890,163 | ||||||||||||
| Expenses waived/reimbursed by Adviser | (45,958 | ) | (160,191 | ) | (157,183 | ) | |||||||||
Net Expenses | 299,397 | 1,765,852 | 1,732,980 | ||||||||||||
Net Investment Income (Loss) | 1,314,970 | 6,379,834 | 15,704,090 | ||||||||||||
| Realized/Unrealized Gains (Losses) from Investments: | |||||||||||||||
| Net realized gains (losses) from investment securities | (1,300,065 | ) | (4,345,664 | ) | (7,215,386 | ) | |||||||||
| Net realized gains (losses) from futures contracts | 75,119 | 484,025 | 547,290 | ||||||||||||
| Net realized gains (losses) from in-kind redemptions | 14,080,178 | 43,110,175 | 65,886,878 | ||||||||||||
| Net change in unrealized appreciation/ depreciation on investment securities | 3,511,492 | 47,237,625 | 14,610,245 | ||||||||||||
| Net change in unrealized appreciation/ depreciation on futures contracts | (2,993 | ) | (22,926 | ) | 18,142 | ||||||||||
| Net realized/unrealized gains (losses) on investments | 16,363,731 | 86,463,235 | 73,847,169 | ||||||||||||
| Change in net assets resulting from operations | $ | 17,678,701 | $ | 92,843,069 | $ | 89,551,259 | |||||||||
See notes to financial statements.
167
Victory Portfolios II | Statements of Operations For the Six Months Ended December 31, 2021 | ||||||
(Unaudited)
| VictoryShares US Discovery Enhanced Volatility Wtd ETF | VictoryShares Developed Enhanced Volatility Wtd ETF | VictoryShares Nasdaq Next 50 ETF | |||||||||||||
Investment Income: | |||||||||||||||
Dividends | $ | 649,314 | $ | 472,942 | $ | 275,837 | |||||||||
Non-cash dividends | — | 100,083 | — | ||||||||||||
Affiliated dividend income | 1,637 | — | — | ||||||||||||
Interest | 1 | 62 | 45 | ||||||||||||
Securities lending (net of fees) | 1,804 | 8,314 | 64,970 | ||||||||||||
Foreign tax withholding | (436 | ) | (79,434 | ) | (3,069 | ) | |||||||||
Total Income | 652,320 | 501,967 | 337,783 | ||||||||||||
Expenses: | |||||||||||||||
Investment advisory fees | 101,952 | 83,749 | 113,839 | ||||||||||||
Administration fees | 18,456 | 11,373 | 41,215 | ||||||||||||
Sub-Administration fees | 9,051 | 9,051 | 7,352 | ||||||||||||
Custodian fees | 2,574 | 60,958 | 3,601 | ||||||||||||
Servicing fees | 2,345 | 2,568 | 1,510 | ||||||||||||
Trustees' fees | 2,636 | 2,008 | 4,490 | ||||||||||||
Compliance fees | 235 | 153 | 504 | ||||||||||||
Legal and audit fees | 7,502 | 7,845 | 7,252 | ||||||||||||
Interest fees |
| 73 | — | ||||||||||||
Licensing fees | — | — | 22,771 | ||||||||||||
Other expenses | 6,187 | 8,966 | 21,475 | ||||||||||||
Total Expenses | 150,938 | 186,744 | 224,009 | ||||||||||||
Expenses waived/reimbursed by Adviser | (31,926 | ) | (92,472 | ) | (87,374 | ) | |||||||||
Net Expenses | 119,012 | 94,272 | 136,635 | ||||||||||||
Net Investment Income (Loss) | 533,308 | 407,695 | 201,148 | ||||||||||||
| Realized/Unrealized Gains (Losses) from Investments: | |||||||||||||||
| Net realized gains (losses) from unaffiliated investment securities | (1,414,225 | ) | 737,365 | (9,347,342 | ) | ||||||||||
| Net realized gains (losses) from affiliated securities transactions | 32,611 | — | — | ||||||||||||
| Net realized gains (losses) from futures contracts | (21,696 | ) | 1 | 40,689 | |||||||||||
| Net realized gains (losses) from in-kind redemptions | 4,809,647 | 447,202 | 9,563,604 | ||||||||||||
| Net change in unrealized appreciation/ depreciation on unaffiliated investment securities | 690,572 | (512,288 | ) | (1,495,339 | ) | ||||||||||
| Net change in unrealized appreciation/ depreciation on affiliated investments | (8,717 | ) | — | — | |||||||||||
| Net change in unrealized appreciation/ depreciation on futures contracts | 10,070 | 7,674 | 4,712 | ||||||||||||
| Net realized/unrealized gains (losses) on investments | 4,098,262 | 679,954 | (1,233,676 | ) | |||||||||||
| Change in net assets resulting from operations | $ | 4,631,570 | $ | 1,087,649 | $ | (1,032,528 | ) | ||||||||
See notes to financial statements.
168
Victory Portfolios II | Statements of Operations For the Six Months Ended December 31, 2021 | ||||||
(Unaudited)
| VictoryShares ESG Core Plus Bond ETF(a) | VictoryShares ESG Corporate Bond ETF(a) | VictoryShares THB Mid Cap ESG ETF(a) | |||||||||||||
Investment Income: | |||||||||||||||
Dividends | $ | — | $ | — | $ | 3,507 | |||||||||
Interest | 676,760 | 539,803 | — | ||||||||||||
Total Income | 676,760 | 539,803 | 3,507 | ||||||||||||
Expenses: | |||||||||||||||
Investment advisory fees | 129,518 | 84,717 | 3,125 | ||||||||||||
Administration fees | 19,995 | 13,091 | 338 | ||||||||||||
Sub-Administration fees | 3,790 | 3,790 | 3,764 | ||||||||||||
Custodian fees | 1,640 | 1,642 | 538 | ||||||||||||
Servicing fees | 1,005 | 1,005 | 1,005 | ||||||||||||
Trustees' fees | 1,439 | 1,403 | 369 | ||||||||||||
Compliance fees | 158 | 145 | 12 | ||||||||||||
Legal and audit fees | 3,066 | 2,794 | 1,662 | ||||||||||||
Interest fees | — | — | 9 | ||||||||||||
Listing fees | 2,500 | 2,500 | 2,500 | ||||||||||||
Other expenses | 7,331 | 7,634 | 701 | ||||||||||||
Total Expenses | 170,442 | 118,721 | 14,023 | ||||||||||||
Expenses waived/reimbursed by Adviser | (20,315 | ) | (20,773 | ) | (10,572 | ) | |||||||||
Net Expenses | 150,127 | 97,948 | 3,451 | ||||||||||||
Net Investment Income (Loss) | 526,633 | 441,855 | 56 | ||||||||||||
| Realized/Unrealized Gains (Losses) from Investments: | |||||||||||||||
| Net realized gains (losses) from investment securities | 22,986 | 20,636 | 7,427 | ||||||||||||
| Net change in unrealized appreciation/ depreciation on investment securities | (642,348 | ) | (802,480 | ) | 345,103 | ||||||||||
| Net realized/unrealized gains (losses) on investments | (619,362 | ) | (781,844 | ) | 352,530 | ||||||||||
| Change in net assets resulting from operations | $ | (92,729 | ) | $ | (339,989 | ) | $ | 352,586 | |||||||
(a) Commencement of operations on October 5, 2021.
See notes to financial statements.
169
Victory Portfolios II | Statements of Changes in Net Assets | ||||||
| VictoryShares US 500 Volatility Wtd ETF | VictoryShares US Small Cap Volatility Wtd ETF | VictoryShares International Volatility Wtd ETF | |||||||||||||||||||||||||
| Six Months Ended December 31, 2021 (Unaudited) | Year Ended June 30, 2021 | Six Months Ended December 31, 2021 (Unaudited) | Year Ended June 30, 2021 | Six Months Ended December 31, 2021 (Unaudited) | Year Ended June 30, 2021 | ||||||||||||||||||||||
From Investment Activities: | |||||||||||||||||||||||||||
Operations: | |||||||||||||||||||||||||||
| Net investment income (loss) | $ | 4,422,176 | $ | 7,661,551 | $ | 209,016 | $ | 281,342 | $ | 1,171,337 | $ | 2,422,654 | |||||||||||||||
| Net realized gains (losses) from investments | 57,308,200 | 69,253,916 | 1,388,631 | 3,440,333 | 2,521,907 | 2,246,705 | |||||||||||||||||||||
| Net change in unrealized appreciation/ depreciation on investments | 3,192,649 | 160,491,386 | 194,723 | 6,333,917 | (680,096 | ) | 23,696,788 | ||||||||||||||||||||
| Change in net assets resulting from operations | 64,923,025 | 237,406,853 | 1,792,370 | 10,055,592 | 3,013,148 | 28,366,147 | |||||||||||||||||||||
| Change in net assets resulting from distributions to shareholders | (5,088,696 | ) | (7,561,107 | ) | (225,432 | ) | (287,612 | ) | (2,193,810 | ) | (2,408,306 | ) | |||||||||||||||
| Change in net assets resulting from capital transactions | (77,950,457 | ) | (194,413,139 | ) | 13,589 | 128,296 | — | 7,632,260 | |||||||||||||||||||
Change in net assets | (18,116,128 | ) | 35,432,607 | 1,580,527 | 9,896,276 | 819,338 | 33,590,101 | ||||||||||||||||||||
Net Assets: | |||||||||||||||||||||||||||
Beginning of period | 705,437,474 | 670,004,867 | 25,985,687 | 16,089,411 | 116,710,061 | 83,119,960 | |||||||||||||||||||||
End of period | $ | 687,321,346 | $ | 705,437,474 | $ | 27,566,214 | $ | 25,985,687 | $ | 117,529,399 | $ | 116,710,061 | |||||||||||||||
Capital Transactions: | |||||||||||||||||||||||||||
| Proceeds from shares issued | 88,325,657 | 109,696,136 | 6,396,216 | 9,846,161 | — | 11,872,178 | |||||||||||||||||||||
Cost of shares redeemed | (166,276,114 | ) | (304,109,275 | ) | (6,382,627 | ) | (9,717,865 | ) | — | (4,239,918 | ) | ||||||||||||||||
| Change in net assets resulting from capital transactions | (77,950,457 | ) | (194,413,139 | ) | 13,589 | 128,296 | — | 7,632,260 | |||||||||||||||||||
Share Transactions: | |||||||||||||||||||||||||||
Issued | 1,200,000 | 1,650,000 | 100,000 | 150,000 | — | 300,000 | |||||||||||||||||||||
Redeemed | (2,250,000 | ) | (5,000,000 | ) | (100,000 | ) | (150,000 | ) | — | (100,000 | ) | ||||||||||||||||
Change in Shares | (1,050,000 | ) | (3,350,000 | ) | — | — | — | 200,000 | |||||||||||||||||||
See notes to financial statements.
170
Victory Portfolios II | Statements of Changes in Net Assets | ||||||
| VictoryShares US Large Cap High Div Volatility Wtd ETF | VictoryShares US Small Cap High Div Volatility Wtd ETF | ||||||||||||||||||
| Six Months Ended December 31, 2021 (Unaudited) | Year Ended June 30, 2021 | Six Months Ended December 31, 2021 (Unaudited) | Year Ended June 30, 2021 | ||||||||||||||||
From Investment Activities: | |||||||||||||||||||
Operations: | |||||||||||||||||||
Net investment income (loss) | $ | 3,594,024 | $ | 5,978,979 | $ | 4,273,553 | $ | 4,617,664 | |||||||||||
Net realized gains (losses) from investments | 12,973,002 | 13,598,702 | 2,999,896 | 24,892,624 | |||||||||||||||
| Net change in unrealized appreciation/ depreciation on investments | 3,633,947 | 54,543,611 | 2,919,637 | 22,086,728 | |||||||||||||||
Change in net assets resulting from operations | 20,200,973 | 74,121,292 | 10,193,086 | 51,597,016 | |||||||||||||||
| Change in net assets resulting from distributions to shareholders | (4,094,581 | ) | (5,707,683 | ) | (4,782,669 | ) | (4,510,283 | ) | |||||||||||
Change in net assets resulting from capital transactions | 3,898,691 | (40,993,350 | ) | (5,571,721 | ) | 138,568,910 | |||||||||||||
Change in net assets | 20,005,083 | 27,420,259 | (161,304 | ) | 185,655,643 | ||||||||||||||
Net Assets: | |||||||||||||||||||
Beginning of period | 221,055,560 | 193,635,301 | 251,797,385 | 66,141,742 | |||||||||||||||
End of period | $ | 241,060,643 | $ | 221,055,560 | $ | 251,636,081 | $ | 251,797,385 | |||||||||||
Capital Transactions: | |||||||||||||||||||
Proceeds from shares issued | 61,149,598 | 73,170,915 | 78,440,404 | 248,883,695 | |||||||||||||||
Cost of shares redeemed | (57,250,907 | ) | (114,164,265 | ) | (84,012,125 | ) | (110,314,785 | ) | |||||||||||
| Change in net assets resulting from capital transactions | 3,898,691 | (40,993,350 | ) | (5,571,721 | ) | 138,568,910 | |||||||||||||
Share Transactions: | |||||||||||||||||||
Issued | 1,050,000 | 1,350,000 | 1,350,000 | 4,350,000 | |||||||||||||||
Redeemed | (1,000,000 | ) | (2,350,000 | ) | (1,450,000 | ) | (1,950,000 | ) | |||||||||||
Change in Shares | 50,000 | (1,000,000 | ) | (100,000 | ) | 2,400,000 | |||||||||||||
See notes to financial statements.
171
Victory Portfolios II | Statements of Changes in Net Assets | ||||||
| VictoryShares International High Div Volatility Wtd ETF | VictoryShares Emerging Market High Div Volatility Wtd ETF | VictoryShares Dividend Accelerator ETF | |||||||||||||||||||||||||
| Six Months Ended December 31, 2021 (Unaudited) | Year Ended June 30, 2021 | Six Months Ended December 31, 2021 (Unaudited) | Year Ended June 30, 2021 | Six Months Ended December 31, 2021 (Unaudited) | Year Ended June 30, 2021 | ||||||||||||||||||||||
From Investment Activities: | |||||||||||||||||||||||||||
Operations: | |||||||||||||||||||||||||||
| Net investment income (loss) | $ | 413,193 | $ | 1,511,245 | $ | 575,501 | $ | 915,679 | $ | 2,645,275 | $ | 5,136,658 | |||||||||||||||
| Net realized gains (losses) from investments | 523,514 | 744,698 | 623,998 | (315,457 | ) | 14,465,240 | 38,451,332 | ||||||||||||||||||||
| Net change in unrealized appreciation/ depreciation on investments | (460,897 | ) | 10,014,311 | (1,187,495 | ) | 4,615,926 | 12,502,635 | 47,590,115 | |||||||||||||||||||
| Change in net assets resulting from operations | 475,810 | 12,270,254 | 12,004 | 5,216,148 | 29,613,150 | 91,178,105 | |||||||||||||||||||||
| Change in net assets resulting from distributions to shareholders | (623,807 | ) | (1,705,787 | ) | (791,056 | ) | (809,574 | ) | (3,118,525 | ) | (4,931,587 | ) | |||||||||||||||
| Change in net assets resulting from capital transactions | (3,301,198 | ) | (49,628,242 | ) | (2,450,765 | ) | (6,399,375 | ) | (15,971,955 | ) | 22,631,344 | ||||||||||||||||
Change in net assets | (3,449,195 | ) | (39,063,775 | ) | (3,229,817 | ) | (1,992,801 | ) | 10,522,670 | 108,877,862 | |||||||||||||||||
Net Assets: | |||||||||||||||||||||||||||
Beginning of period | 22,978,256 | 62,042,031 | 19,686,373 | 21,679,174 | 344,154,471 | 235,276,609 | |||||||||||||||||||||
End of period | $ | 19,529,061 | $ | 22,978,256 | $ | 16,456,556 | $ | 19,686,373 | $ | 354,677,141 | $ | 344,154,471 | |||||||||||||||
Capital Transactions: | |||||||||||||||||||||||||||
| Proceeds from shares issued | — | 3,066,706 | 1,067 | 1,135,264 | 31,181,703 | 156,222,479 | |||||||||||||||||||||
Cost of shares redeemed | (3,301,198 | ) | (52,694,948 | ) | (2,451,832 | ) | (7,534,639 | ) | (47,153,658 | ) | (133,591,135 | ) | |||||||||||||||
| Change in net assets resulting from capital transactions | (3,301,198 | ) | (49,628,242 | ) | (2,450,765 | ) | (6,399,375 | ) | (15,971,955 | ) | 22,631,344 | ||||||||||||||||
Share Transactions: | |||||||||||||||||||||||||||
Issued | — | 100,000 | — | 50,000 | 700,000 | 3,850,000 | |||||||||||||||||||||
Redeemed | (100,000 | ) | (1,850,000 | ) | (100,000 | ) | (350,000 | ) | (1,050,000 | ) | (3,150,000 | ) | |||||||||||||||
Change in Shares | (100,000 | ) | (1,750,000 | ) | (100,000 | ) | (300,000 | ) | (350,000 | ) | 700,000 | ||||||||||||||||
See notes to financial statements.
172
Victory Portfolios II | Statements of Changes in Net Assets | ||||||
| VictoryShares US Multi-Factor Minimum Volatility ETF | VictoryShares US 500 Enhanced Volatility Wtd ETF | VictoryShares US EQ Income Enhanced Volatility Wtd ETF | |||||||||||||||||||||||||
| Six Months Ended December 31, 2021 (Unaudited) | Year Ended June 30, 2021 | Six Months Ended December 31, 2021 (Unaudited) | Year Ended June 30, 2021 | Six Months Ended December 31, 2021 (Unaudited) | Year Ended June 30, 2021 | ||||||||||||||||||||||
From Investment Activities: | |||||||||||||||||||||||||||
Operations: | |||||||||||||||||||||||||||
| Net investment income (loss) | $ | 1,314,970 | $ | 2,767,382 | $ | 6,379,834 | $ | 8,590,245 | $ | 15,704,090 | $ | 19,769,279 | |||||||||||||||
| Net realized gains (losses) from investments | 12,855,232 | 13,042,099 | 39,248,536 | 72,481,462 | 59,218,782 | 122,693,510 | |||||||||||||||||||||
| Net change in unrealized appreciation/ depreciation on investments | 3,508,499 | 20,081,016 | 47,214,699 | 162,743,239 | 14,628,387 | 97,533,008 | |||||||||||||||||||||
| Change in net assets resulting from operations | 17,678,701 | 35,890,497 | 92,843,069 | 243,814,946 | 89,551,259 | 239,995,797 | |||||||||||||||||||||
| Change in net assets resulting from distributions to shareholders | (1,451,323 | ) | (2,790,098 | ) | (7,337,785 | ) | (7,661,659 | ) | (17,790,099 | ) | (18,139,639 | ) | |||||||||||||||
| Change in net assets resulting from capital transactions | (16,274,370 | ) | (24,217,756 | ) | 45,374,421 | 91,574,225 | 117,006,289 | 129,097,767 | |||||||||||||||||||
Change in net assets | (46,992 | ) | 8,882,643 | 130,879,705 | 327,727,512 | 188,767,449 | 350,953,925 | ||||||||||||||||||||
Net Assets: | |||||||||||||||||||||||||||
Beginning of period | 164,064,957 | 155,182,314 | 937,340,750 | 609,613,238 | 916,845,951 | 565,892,026 | |||||||||||||||||||||
End of period | $ | 164,017,965 | $ | 164,064,957 | $ | 1,068,220,455 | $ | 937,340,750 | $ | 1,105,613,400 | $ | 916,845,951 | |||||||||||||||
Capital Transactions: | |||||||||||||||||||||||||||
| Proceeds from shares issued | 46,517,363 | 52,363,615 | 161,993,978 | 281,258,675 | 380,996,280 | 465,006,422 | |||||||||||||||||||||
| Cost of shares redeemed | (62,791,733 | ) | (76,581,371 | ) | (116,619,557 | ) | (189,684,450 | ) | (263,989,991 | ) | (335,908,655 | ) | |||||||||||||||
| Change in net assets resulting from capital transactions | (16,274,370 | ) | (24,217,756 | ) | 45,374,421 | 91,574,225 | 117,006,289 | 129,097,767 | |||||||||||||||||||
Share Transactions: | |||||||||||||||||||||||||||
Issued | 1,200,000 | 1,450,000 | 2,200,000 | 4,250,000 | 5,750,000 | 7,600,000 | |||||||||||||||||||||
Redeemed | (1,600,000 | ) | (2,200,000 | ) | (1,600,000 | ) | (2,850,000 | ) | (4,050,000 | ) | (5,550,000 | ) | |||||||||||||||
Change in Shares | (400,000 | ) | (750,000 | ) | 600,000 | 1,400,000 | 1,700,000 | 2,050,000 | |||||||||||||||||||
See notes to financial statements.
173
Victory Portfolios II | Statements of Changes in Net Assets | ||||||
| VictoryShares US Discovery Enhanced Volatility Wtd ETF | VictoryShares Developed Enhanced Volatility Wtd ETF | VictoryShares Nasdaq Next 50 ETF | |||||||||||||||||||||||||
| Six Months Ended December 31, 2021 (Unaudited) | Year Ended June 30, 2021 | Six Months Ended December 31, 2021 (Unaudited) | Year Ended June 30, 2021 | Six Months Ended December 31, 2021 (Unaudited) | For the Period September 10, 2020(a) through June 30, 2021 | ||||||||||||||||||||||
From Investment Activities: | |||||||||||||||||||||||||||
Operations: | |||||||||||||||||||||||||||
| Net investment income (loss) | $ | 533,308 | $ | 612,754 | $ | 407,695 | $ | 943,772 | $ | 201,148 | $ | 428,808 | |||||||||||||||
| Net realized gains (losses) from investments | 3,406,337 | 13,619,143 | 1,184,568 | 2,593,353 | 256,951 | 6,489,508 | |||||||||||||||||||||
| Net change in unrealized appreciation/ depreciation on investments | 691,925 | 6,795,969 | (504,614 | ) | 7,824,474 | (1,490,627 | ) | 21,355,266 | |||||||||||||||||||
| Change in net assets resulting from operations | 4,631,570 | 21,027,866 | 1,087,649 | 11,361,599 | (1,032,528 | ) | 28,273,582 | ||||||||||||||||||||
| Change in net assets resulting from distributions to shareholders | (580,023 | ) | (596,428 | ) | (785,406 | ) | (879,139 | ) | (293,349 | ) | (345,554 | ) | |||||||||||||||
| Change in net assets resulting from capital transactions | 3,047,921 | 5,938,386 | (1,758,973 | ) | (16,195,189 | ) | 6,383,039 | 120,538,914 | |||||||||||||||||||
Change in net assets | 7,099,468 | 26,369,824 | (1,456,730 | ) | (5,712,729 | ) | 5,057,162 | 148,466,942 | |||||||||||||||||||
Net Assets: | |||||||||||||||||||||||||||
Beginning of period | 63,572,451 | 37,202,627 | 42,742,458 | 48,455,187 | 148,466,942 | — | |||||||||||||||||||||
End of period | $ | 70,671,919 | $ | 63,572,451 | $ | 41,285,728 | $ | 42,742,458 | $ | 153,524,104 | $ | 148,466,942 | |||||||||||||||
Capital Transactions: | |||||||||||||||||||||||||||
| Proceeds from shares issued | 17,919,618 | 34,562,229 | — | — | 33,789,092 | 196,036,909 | |||||||||||||||||||||
Cost of shares redeemed | (14,871,697 | ) | (28,623,843 | ) | (1,758,973 | ) | (16,195,189 | ) | (27,406,053 | ) | (75,497,995 | ) | |||||||||||||||
| Change in net assets resulting from capital transactions | 3,047,921 | 5,938,386 | (1,758,973 | ) | (16,195,189 | ) | 6,383,039 | 120,538,914 | |||||||||||||||||||
Share Transactions: | |||||||||||||||||||||||||||
Issued | 300,000 | 600,000 | — | — | 1,000,000 | 6,675,000 | |||||||||||||||||||||
Redeemed | (250,000 | ) | (500,000 | ) | (50,000 | ) | (550,000 | ) | (825,000 | ) | (2,350,000 | ) | |||||||||||||||
Change in Shares | 50,000 | 100,000 | (50,000 | ) | (550,000 | ) | 175,000 | 4,325,000 | |||||||||||||||||||
(a) Commencement of operations.
See notes to financial statements.
174
Victory Portfolios II | Statements of Changes in Net Assets | ||||||
| VictoryShares ESG Core Plus Bond ETF | VictoryShares ESG Corporate Bond ETF | VictoryShares THB Mid Cap ESG ETF | |||||||||||||
| For the Period October 5, 2021(a) through December 31, 2021 (Unaudited) | For the Period October 5, 2021(a) through December 31, 2021 (Unaudited) | For the Period October 5, 2021(a) through December 31, 2021 (Unaudited) | |||||||||||||
From Investment Activities: | |||||||||||||||
Operations: | |||||||||||||||
Net investment income (loss) | $ | 526,633 | $ | 441,855 | $ | 56 | |||||||||
Net realized gains (losses) from investments | 22,986 | 20,636 | 7,427 | ||||||||||||
| Net change in unrealized appreciation/ depreciation on investments | (642,348 | ) | (802,480 | ) | 345,103 | ||||||||||
Change in net assets resulting from operations | (92,729 | ) | (339,989 | ) | 352,586 | ||||||||||
| Change in net assets resulting from distributions to shareholders | (523,281 | ) | (568,882 | ) | (7,901 | ) | |||||||||
| Change in net assets resulting from capital transactions | 195,400,606 | 106,319,172 | 2,373,729 | ||||||||||||
Change in net assets | 194,784,596 | 105,410,301 | 2,718,414 | ||||||||||||
Net Assets: | |||||||||||||||
Beginning of period | — | — | — | ||||||||||||
End of period | $ | 194,784,596 | $ | 105,410,301 | $ | 2,718,414 | |||||||||
Capital Transactions: | |||||||||||||||
Proceeds from shares issued | 195,400,606 | 106,319,172 | 2,373,729 | ||||||||||||
| Change in net assets resulting from capital transactions | 195,400,606 | 106,319,172 | 2,373,729 | ||||||||||||
Share Transactions: | |||||||||||||||
Issued | 7,825,000 | 4,250,000 | 100,000 | ||||||||||||
Change in Shares | 7,825,000 | 4,250,000 | 100,000 | ||||||||||||
(a) Commencement of operations.
See notes to financial statements.
175
Victory Portfolios II | Financial Highlights | ||||||
For a Share Outstanding Throughout Each Period
| Investment Activities | Distributions to Shareholders From | |||||||||||||||||||||||||||||||||
| Net Asset Value, Beginning of Period | Net Investment Income (Loss)(a) | Net Realized and Unrealized Gains (Losses) on Investments | Total from Investment Activities | Net Investment Income | Total Distributions | Net Asset Value, End of Period | Total Return(b) | ||||||||||||||||||||||||||||
VictoryShares US 500 Volatility Wtd ETF | |||||||||||||||||||||||||||||||||||
| Six Months Ended December 31, 2021 (Unaudited) | $ | 71.26 | 0.47 | 6.47 | 6.94 | (0.54 | ) | (0.54 | ) | $ | 77.66 | 9.79 | % | ||||||||||||||||||||||
Year Ended June 30: | |||||||||||||||||||||||||||||||||||
2021 | $ | 50.57 | 0.69 | 20.68 | 21.37 | (0.68 | ) | (0.68 | ) | $ | 71.26 | 42.51 | % | ||||||||||||||||||||||
2020 | $ | 52.46 | 0.77 | (1.88 | ) | (1.11 | ) | (0.78 | ) | (0.78 | ) | $ | 50.57 | (2.12 | )% | ||||||||||||||||||||
2019 | $ | 49.34 | 0.73 | 3.09 | 3.82 | (0.70 | ) | (0.70 | ) | $ | 52.46 | 7.86 | % | ||||||||||||||||||||||
2018 | $ | 44.05 | 0.63 | 5.26 | 5.89 | (0.60 | ) | (0.60 | ) | $ | 49.34 | 13.42 | % | ||||||||||||||||||||||
2017 | $ | 37.24 | 0.60 | 6.71 | 7.31 | (0.50 | ) | (0.50 | ) | $ | 44.05 | 19.72 | % | ||||||||||||||||||||||
VictoryShares US Small Cap Volatility Wtd ETF | |||||||||||||||||||||||||||||||||||
| Six Months Ended December 31, 2021 (Unaudited) | $ | 64.96 | 0.52 | 4.00 | 4.52 | (0.56 | ) | (0.56 | ) | $ | 68.92 | 7.00 | % | ||||||||||||||||||||||
Year Ended June 30: | |||||||||||||||||||||||||||||||||||
2021 | $ | 40.22 | 0.70 | 24.76 | 25.46 | (0.72 | ) | (0.72 | ) | $ | 64.96 | 63.72 | % | ||||||||||||||||||||||
2020 | $ | 45.87 | 0.59 | (5.62 | ) | (5.03 | ) | (0.62 | ) | (0.62 | ) | $ | 40.22 | (11.00 | )% | ||||||||||||||||||||
2019 | $ | 48.54 | 0.63 | (2.62 | ) | (1.99 | ) | (0.68 | ) | (0.68 | ) | $ | 45.87 | (4.07 | )% | ||||||||||||||||||||
2018 | $ | 42.40 | 0.50 | 6.14 | 6.64 | (0.50 | ) | (0.50 | ) | $ | 48.54 | 15.75 | % | ||||||||||||||||||||||
2017 | $ | 34.35 | 0.50 | 8.01 | 8.51 | (0.46 | ) | (0.46 | ) | $ | 42.40 | 24.86 | % | ||||||||||||||||||||||
VictoryShares International Volatility Wtd ETF | |||||||||||||||||||||||||||||||||||
| Six Months Ended December 31, 2021 (Unaudited) | $ | 44.89 | 0.45 | 0.70 | 1.15 | (0.84 | ) | (0.84 | ) | $ | 45.20 | 2.60 | % | ||||||||||||||||||||||
Year Ended June 30: | |||||||||||||||||||||||||||||||||||
2021 | $ | 34.63 | 0.95 | 10.25 | 11.20 | (0.94 | ) | (0.94 | ) | $ | 44.89 | 32.59 | % | ||||||||||||||||||||||
2020 | $ | 38.12 | 0.77 | (3.51 | ) | (2.74 | ) | (0.75 | ) | (0.75 | ) | $ | 34.63 | (7.23 | )% | ||||||||||||||||||||
2019 | $ | 39.09 | 1.17 | (1.07 | ) | 0.10 | (1.07 | ) | (1.07 | ) | $ | 38.12 | 0.33 | % | |||||||||||||||||||||
2018 | $ | 37.20 | 1.04 | 1.81 | 2.85 | (0.96 | ) | (0.96 | ) | $ | 39.09 | 7.62 | % | ||||||||||||||||||||||
2017 | $ | 32.11 | 0.76 | 5.10 | 5.86 | (0.77 | ) | (0.77 | ) | $ | 37.20 | 18.44 | % | ||||||||||||||||||||||
(a) Per share net investment income (loss) has been calculated using the average daily shares method.
(b) Not annualized for periods less than one year.
(c) Annualized for periods less than one year.
(d) Excludes impact of in-kind transaction.
See notes to financial statements.
176
Victory Portfolios II | Financial Highlights — continued | ||||||
For a Share Outstanding Throughout Each Period
Ratios to Average Net Assets | Supplemental Data | ||||||||||||||||||||||
| Net Expenses(c) | Net Investment Income (Loss)(c) | Gross Expenses(c) | Net Assets, End of Period (000's) | Portfolio Turnover(b)(d) | |||||||||||||||||||
VictoryShares US 500 Volatility Wtd ETF | |||||||||||||||||||||||
| Six Months Ended December 31, 2021 (Unaudited) | 0.35 | % | 1.25 | % | 0.38 | % | $ | 687,321 | 11 | % | |||||||||||||
Year Ended June 30: | |||||||||||||||||||||||
2021 | 0.35 | % | 1.13 | % | 0.39 | % | $ | 705,437 | 34 | % | |||||||||||||
2020 | 0.35 | % | 1.49 | % | 0.40 | % | $ | 670,005 | 28 | % | |||||||||||||
2019 | 0.35 | % | 1.48 | % | 0.40 | % | $ | 731,775 | 46 | % | |||||||||||||
2018 | 0.35 | % | 1.32 | % | 0.41 | % | $ | 567,370 | 36 | % | |||||||||||||
2017 | 0.35 | % | 1.43 | % | 0.47 | % | $ | 292,921 | 26 | % | |||||||||||||
VictoryShares US Small Cap Volatility Wtd ETF | |||||||||||||||||||||||
| Six Months Ended December 31, 2021 (Unaudited) | 0.35 | % | 1.56 | % | 0.54 | % | $ | 27,566 | 26 | % | |||||||||||||
Year Ended June 30: | |||||||||||||||||||||||
2021 | 0.35 | % | 1.30 | % | 0.55 | % | $ | 25,986 | 71 | % | |||||||||||||
2020 | 0.35 | % | 1.35 | % | 0.55 | % | $ | 16,089 | 50 | % | |||||||||||||
2019 | 0.35 | % | 1.36 | % | 0.46 | % | $ | 29,814 | 62 | % | |||||||||||||
2018 | 0.35 | % | 1.10 | % | 0.47 | % | $ | 41,261 | 47 | % | |||||||||||||
2017 | 0.35 | % | 1.25 | % | 0.68 | % | $ | 25,438 | 47 | % | |||||||||||||
VictoryShares International Volatility Wtd ETF | |||||||||||||||||||||||
| Six Months Ended December 31, 2021 (Unaudited) | 0.45 | % | 1.98 | % | 0.61 | % | $ | 117,529 | 18 | % | |||||||||||||
Year Ended June 30: | |||||||||||||||||||||||
2021 | 0.45 | % | 2.34 | % | 0.63 | % | $ | 116,710 | 45 | % | |||||||||||||
2020 | 0.45 | % | 2.12 | % | 0.64 | % | $ | 83,120 | 41 | % | |||||||||||||
2019 | 0.45 | % | 3.14 | % | 0.73 | % | $ | 36,215 | 53 | % | |||||||||||||
2018 | 0.45 | % | 2.61 | % | 0.98 | % | $ | 21,497 | 37 | % | |||||||||||||
2017 | 0.45 | % | 2.25 | % | 1.54 | % | $ | 13,021 | 46 | % | |||||||||||||
See notes to financial statements.
177
Victory Portfolios II | Financial Highlights | ||||||
For a Share Outstanding Throughout Each Period
| Investment Activities | Distributions to Shareholders From | |||||||||||||||||||||||||||||||||
| Net Asset Value, Beginning of Period | Net Investment Income (Loss)(a) | Net Realized and Unrealized Gains (Losses) on Investments | Total from Investment Activities | Net Investment Income | Total Distributions | Net Asset Value, End of Period | Total Return(b) | ||||||||||||||||||||||||||||
VictoryShares US Large Cap High Div Volatility Wtd ETF | |||||||||||||||||||||||||||||||||||
| Six Months Ended December 31, 2021 (Unaudited) | $ | 56.68 | 0.92 | 4.49 | 5.41 | (1.06 | ) | (1.06 | ) | $ | 61.03 | 9.63 | % | ||||||||||||||||||||||
Year Ended June 30: | |||||||||||||||||||||||||||||||||||
2021 | $ | 39.52 | 1.45 | 17.10 | 18.55 | (1.39 | ) | (1.39 | ) | $ | 56.68 | 47.74 | % | ||||||||||||||||||||||
2020 | $ | 47.03 | 1.58 | (7.44 | ) | (5.86 | ) | (1.65 | ) | (1.65 | ) | $ | 39.52 | (12.78 | )% | ||||||||||||||||||||
2019 | $ | 45.06 | 1.51 | 1.83 | 3.34 | (1.37 | ) | (1.37 | ) | $ | 47.03 | 7.59 | % | ||||||||||||||||||||||
2018 | $ | 42.17 | 1.34 | 2.92 | 4.26 | (1.37 | ) | (1.37 | ) | $ | 45.06 | 10.23 | % | ||||||||||||||||||||||
2017 | $ | 37.58 | 1.24 | 4.46 | 5.70 | (1.11 | ) | (1.11 | ) | $ | 42.17 | 15.37 | % | ||||||||||||||||||||||
VictoryShares US Small Cap High Div Volatility Wtd ETF | |||||||||||||||||||||||||||||||||||
| Six Months Ended December 31, 2021 (Unaudited) | $ | 59.95 | 1.03 | 1.56 | 2.59 | (1.17 | ) | (1.17 | ) | $ | 61.37 | 4.40 | % | ||||||||||||||||||||||
Year Ended June 30: | |||||||||||||||||||||||||||||||||||
2021 | $ | 36.75 | 1.85 | 23.26 | 25.11 | (1.91 | ) | (1.91 | ) | $ | 59.95 | 69.75 | % | ||||||||||||||||||||||
2020 | $ | 44.28 | 1.53 | (7.47 | ) | (5.94 | ) | (1.59 | ) | (1.59 | ) | $ | 36.75 | (13.61 | )% | ||||||||||||||||||||
2019 | $ | 45.96 | 1.38 | (1.74 | ) | (0.36 | ) | (1.32 | ) | (1.32 | ) | $ | 44.28 | (0.70 | )% | ||||||||||||||||||||
2018 | $ | 40.41 | 1.39 | 5.61 | 7.00 | (1.45 | ) | (1.45 | ) | $ | 45.96 | 17.64 | % | ||||||||||||||||||||||
2017 | $ | 35.40 | 1.43 | 4.93 | 6.36 | (1.35 | ) | (1.35 | ) | $ | 40.41 | 18.07 | % | ||||||||||||||||||||||
(a) Per share net investment income (loss) has been calculated using the average daily shares method.
(b) Not annualized for periods less than one year.
(c) Annualized for periods less than one year.
(d) Excludes impact of in-kind transactions.
See notes to financial statements.
178
Victory Portfolios II | Financial Highlights — continued | ||||||
For a Share Outstanding Throughout Each Period
Ratios to Average Net Assets | Supplemental Data | ||||||||||||||||||||||
| Net Expenses(c) | Net Investment Income (Loss)(c) | Gross Expenses(c) | Net Assets, End of Period (000's) | Portfolio Turnover(b)(d) | |||||||||||||||||||
VictoryShares US Large Cap High Div Volatility Wtd ETF | |||||||||||||||||||||||
| Six Months Ended December 31, 2021 (Unaudited) | 0.35 | % | 3.15 | % | 0.40 | % | $ | 241,061 | 20 | % | |||||||||||||
Year Ended June 30: | |||||||||||||||||||||||
2021 | 0.35 | % | 3.04 | % | 0.41 | % | $ | 221,056 | 67 | % | |||||||||||||
2020 | 0.35 | % | 3.47 | % | 0.41 | % | $ | 193,635 | 56 | % | |||||||||||||
2019 | 0.35 | % | 3.33 | % | 0.42 | % | $ | 331,527 | 66 | % | |||||||||||||
2018 | 0.35 | % | 3.04 | % | 0.42 | % | $ | 144,187 | 52 | % | |||||||||||||
2017 | 0.35 | % | 3.05 | % | 0.45 | % | $ | 120,181 | 48 | % | |||||||||||||
VictoryShares US Small Cap High Div Volatility Wtd ETF | |||||||||||||||||||||||
| Six Months Ended December 31, 2021 (Unaudited) | 0.35 | % | 3.43 | % | 0.39 | % | $ | 251,636 | 35 | % | |||||||||||||
Year Ended June 30: | |||||||||||||||||||||||
2021 | 0.35 | % | 3.51 | % | 0.42 | % | $ | 251,797 | 104 | % | |||||||||||||
2020 | 0.35 | % | 3.69 | % | 0.44 | % | $ | 66,142 | 68 | % | |||||||||||||
2019 | 0.35 | % | 3.10 | % | 0.44 | % | $ | 75,277 | 83 | % | |||||||||||||
2018 | 0.35 | % | 3.23 | % | 0.45 | % | $ | 43,665 | 68 | % | |||||||||||||
2017 | 0.35 | % | 3.65 | % | 0.55 | % | $ | 32,325 | 65 | % | |||||||||||||
See notes to financial statements.
179
Victory Portfolios II | Financial Highlights | ||||||
For a Share Outstanding Throughout Each Period
| Investment Activities | Distributions to Shareholders From | |||||||||||||||||||||||||
| Net Asset Value, Beginning of Period | Net Investment Income (Loss)(a) | Net Realized and Unrealized Gains (Losses) on Investments | Total from Investment Activities | Net Investment Income | Net Realized Gains from Investments | ||||||||||||||||||||||
VictoryShares International High Div Volatility Wtd ETF | |||||||||||||||||||||||||||
| Six Months Ended December 31, 2021 (Unaudited) | $ | 32.83 | 0.65 | 0.04 | 0.69 | (0.97 | ) | — | |||||||||||||||||||
Year Ended June 30: | |||||||||||||||||||||||||||
2021 | $ | 25.32 | 1.11 | 7.73 | 8.84 | (1.33 | ) | — | |||||||||||||||||||
2020 | $ | 32.43 | 1.02 | (7.13 | ) | (6.11 | ) | (1.00 | ) | — | |||||||||||||||||
2019 | $ | 33.94 | 1.63 | (1.48 | ) | 0.15 | (1.66 | ) | — | ||||||||||||||||||
2018 | $ | 34.25 | 1.47 | (0.41 | ) | 1.06 | (1.37 | ) | — | ||||||||||||||||||
2017 | $ | 30.65 | 1.40 | 3.47 | 4.87 | (1.27 | ) | — | |||||||||||||||||||
VictoryShares Emerging Market High Div Volatility Wtd ETF | |||||||||||||||||||||||||||
| Six Months Ended December 31, 2021 (Unaudited) | $ | 24.61 | 0.78 | (0.85 | ) | (0.07 | ) | (1.03 | ) | — | |||||||||||||||||
Year Ended June 30: | |||||||||||||||||||||||||||
2021 | $ | 19.71 | 0.99 | 4.73 | 5.72 | (0.82 | ) | — | |||||||||||||||||||
2020 | $ | 24.39 | 0.94 | (4.63 | ) | (3.69 | ) | (0.99 | ) | — | |||||||||||||||||
2019 | $ | 23.92 | 1.31 | 0.35 | 1.66 | (1.05 | ) | (0.14 | ) | ||||||||||||||||||
| October 26, 2017(f) through June 30, 2018 | $ | 24.95 | 0.78 | (1.29 | ) | (0.51 | ) | (0.52 | ) | — | |||||||||||||||||
VictoryShares Dividend Accelerator ETF | |||||||||||||||||||||||||||
| Six Months Ended December 31, 2021 (Unaudited) | $ | 44.12 | 0.35 | 3.56 | 3.91 | (0.42 | ) | — | |||||||||||||||||||
Year Ended June 30: | |||||||||||||||||||||||||||
2021 | $ | 33.14 | 0.66 | 10.95 | 11.61 | (0.63 | ) | — | |||||||||||||||||||
2020 | $ | 32.90 | 0.55 | 0.19 | 0.74 | (0.50 | ) | — | |||||||||||||||||||
2019 | $ | 28.41 | 0.48 | 4.47 | 4.95 | (0.46 | ) | — | |||||||||||||||||||
2018 | $ | 25.95 | 0.48 | 2.45 | 2.93 | (0.47 | ) | — | |||||||||||||||||||
| April 18, 2017(f) through June 30, 2017 | $ | 25.26 | 0.12 | 0.65 | 0.77 | (0.08 | ) | — | |||||||||||||||||||
(a) Per share net investment income (loss) has been calculated using the average daily shares method.
(b) Not annualized for periods less than one year.
(c) Annualized for periods less than one year.
(d) Excludes impact of in-kind transactions.
(e) During the period, the Fund paid interest fees. Excluding these fees, the ratio of net expense to average net assets for the year ended June 30, 2019, and the six months ended June 30, 2021, was 0.50%.
(f) Commencement of operations.
See notes to financial statements.
180
Victory Portfolios II | Financial Highlights — continued | ||||||
For a Share Outstanding Throughout Each Period
Ratios to Average Net Assets | Supplemental Data | ||||||||||||||||||||||||||||||||||
| Total Distributions | Net Asset Value, End of Period | Total Return(b) | Net Expenses(c) | Net Investment Income (Loss)(c) | Gross Expenses(c) | Net Assets, End of Period (000's) | Portfolio Turnover(b)(d) | ||||||||||||||||||||||||||||
VictoryShares International High Div Volatility Wtd ETF | |||||||||||||||||||||||||||||||||||
| Six Months Ended December 31, 2021 (Unaudited) | (0.97 | ) | $ | 32.55 | 2.18 | % | 0.45 | % | 4.00 | % | 0.80 | % | $ | 19,529 | 30 | % | |||||||||||||||||||
Year Ended June 30: | |||||||||||||||||||||||||||||||||||
2021 | (1.33 | ) | $ | 32.83 | 35.49 | % | 0.45 | % | 3.95 | % | 0.66 | % | $ | 22,978 | 111 | % | |||||||||||||||||||
2020 | (1.00 | ) | $ | 25.32 | (19.22 | )% | 0.45 | % | 3.45 | % | 0.57 | % | $ | 62,042 | 71 | % | |||||||||||||||||||
2019 | (1.66 | ) | $ | 32.43 | 0.58 | % | 0.45 | % | 5.06 | % | 0.59 | % | $ | 40,540 | 76 | % | |||||||||||||||||||
2018 | (1.37 | ) | $ | 33.94 | 3.00 | % | 0.45 | % | 4.14 | % | 0.60 | % | $ | 45,824 | 58 | % | |||||||||||||||||||
2017 | (1.27 | ) | $ | 34.25 | 16.16 | % | 0.45 | % | 4.32 | % | 0.77 | % | $ | 32,541 | 69 | % | |||||||||||||||||||
VictoryShares Emerging Market High Div Volatility Wtd ETF | |||||||||||||||||||||||||||||||||||
| Six Months Ended December 31, 2021 (Unaudited) | (1.03 | ) | $ | 23.51 | (0.28 | )% | 0.51 | %(e) | 6.47 | % | 1.55 | % | $ | 16,457 | 47 | % | |||||||||||||||||||
Year Ended June 30: | |||||||||||||||||||||||||||||||||||
2021 | (0.82 | ) | $ | 24.61 | 29.69 | % | 0.50 | % | 4.55 | % | 1.19 | % | $ | 19,686 | 101 | % | |||||||||||||||||||
2020 | (0.99 | ) | $ | 19.71 | (15.55 | )% | 0.50 | % | 4.24 | % | 0.85 | % | $ | 21,679 | 86 | % | |||||||||||||||||||
2019 | (1.19 | ) | $ | 24.39 | 7.30 | % | 0.51 | %(e) | 5.52 | % | 0.88 | % | $ | 40,251 | 103 | % | |||||||||||||||||||
| October 26, 2017(f) through June 30, 2018 | (0.52 | ) | $ | 23.92 | (2.17 | )% | 0.50 | % | 4.44 | % | 1.05 | % | $ | 21,532 | 52 | % | |||||||||||||||||||
VictoryShares Dividend Accelerator ETF | |||||||||||||||||||||||||||||||||||
| Six Months Ended December 31, 2021 (Unaudited) | (0.42 | ) | $ | 47.61 | 8.88 | % | 0.35 | % | 1.53 | % | 0.39 | % | $ | 354,677 | 5 | % | |||||||||||||||||||
Year Ended June 30: | |||||||||||||||||||||||||||||||||||
2021 | (0.63 | ) | $ | 44.12 | 35.33 | % | 0.35 | % | 1.67 | % | 0.40 | % | $ | 344,154 | 41 | % | |||||||||||||||||||
2020 | (0.50 | ) | $ | 33.14 | 2.23 | % | 0.35 | % | 1.65 | % | 0.42 | % | $ | 235,277 | 74 | % | |||||||||||||||||||
2019 | (0.46 | ) | $ | 32.90 | 17.60 | % | 0.35 | % | 1.57 | % | 0.59 | % | $ | 16,450 | 62 | % | |||||||||||||||||||
2018 | (0.47 | ) | $ | 28.41 | 11.33 | % | 0.35 | % | 1.75 | % | 0.67 | % | $ | 7,102 | 43 | % | |||||||||||||||||||
| April 18, 2017(f) through June 30, 2017 | (0.08 | ) | $ | 25.95 | 3.05 | % | 0.35 | % | 2.31 | % | 1.92 | % | $ | 3,893 | — | % | |||||||||||||||||||
See notes to financial statements.
181
Victory Portfolios II | Financial Highlights | ||||||
For a Share Outstanding Throughout Each Period
| Investment Activities | Distributions to Shareholders From | |||||||||||||||||||||||||||||||||
| Net Asset Value, Beginning of Period | Net Investment Income (Loss)(a) | Net Realized and Unrealized Gains (Losses) on Investments | Total from Investment Activities | Net Investment Income | Total Distributions | Net Asset Value, End of Period | Total Return(b) | ||||||||||||||||||||||||||||
VictoryShares US Multi-Factor Minimum Volatility ETF | |||||||||||||||||||||||||||||||||||
| Six Months Ended December 31, 2021 (Unaudited) | $ | 38.15 | 0.31 | 3.94 | 4.25 | (0.34 | ) | (0.34 | ) | $ | 42.06 | 11.17 | % | ||||||||||||||||||||||
Year Ended June 30: | |||||||||||||||||||||||||||||||||||
2021 | $ | 30.73 | 0.62 | 7.43 | 8.05 | (0.63 | ) | (0.63 | ) | $ | 38.15 | 26.47 | % | ||||||||||||||||||||||
2020 | $ | 30.87 | 0.70 | (0.14 | ) | 0.56 | (0.70 | ) | (0.70 | ) | $ | 30.73 | 1.82 | % | |||||||||||||||||||||
2019 | $ | 27.58 | 0.73 | 3.20 | 3.93 | (0.64 | ) | (0.64 | ) | $ | 30.87 | 14.47 | % | ||||||||||||||||||||||
2018 | $ | 24.83 | 0.63 | 2.69 | 3.32 | (0.57 | ) | (0.57 | ) | $ | 27.58 | 13.41 | % | ||||||||||||||||||||||
| June 22, 2017(e) through June 30, 2017 | $ | 24.97 | 0.02 | (0.16 | ) | (0.14 | ) | — | — | $ | 24.83 | (0.54 | )% | ||||||||||||||||||||||
VictoryShares US 500 Enhanced Volatility Wtd ETF | |||||||||||||||||||||||||||||||||||
| Six Months Ended December 31, 2021 (Unaudited) | $ | 71.28 | 0.47 | 6.48 | 6.95 | (0.54 | ) | (0.54 | ) | $ | 77.69 | 9.79 | % | ||||||||||||||||||||||
Year Ended June 30: | |||||||||||||||||||||||||||||||||||
2021 | $ | 51.88 | 0.70 | 19.32 | 20.02 | (0.62 | ) | (0.62 | ) | $ | 71.28 | 38.78 | % | ||||||||||||||||||||||
2020 | $ | 48.89 | 0.60 | 3.04 | 3.64 | (0.65 | ) | (0.65 | ) | $ | 51.88 | 7.49 | % | ||||||||||||||||||||||
2019 | $ | 49.30 | 0.73 | (0.42 | ) | 0.31 | (0.72 | ) | (0.72 | ) | $ | 48.89 | 0.69 | % | |||||||||||||||||||||
2018 | $ | 44.00 | 0.64 | 5.25 | 5.89 | (0.59 | ) | (0.59 | ) | $ | 49.30 | 13.42 | % | ||||||||||||||||||||||
2017 | $ | 37.23 | 0.58 | 6.71 | 7.29 | (0.52 | ) | (0.52 | ) | $ | 44.00 | 19.72 | % | ||||||||||||||||||||||
VictoryShares US EQ Income Enhanced Volatility Wtd ETF | |||||||||||||||||||||||||||||||||||
| Six Months Ended December 31, 2021 (Unaudited) | $ | 64.57 | 1.06 | 5.10 | 6.16 | (1.19 | ) | (1.19 | ) | $ | 69.54 | 9.63 | % | ||||||||||||||||||||||
Year Ended June 30: | |||||||||||||||||||||||||||||||||||
2021 | $ | 46.58 | 1.56 | 17.87 | 19.43 | (1.44 | ) | (1.44 | ) | $ | 64.57 | 42.31 | % | ||||||||||||||||||||||
2020 | $ | 45.54 | 1.39 | 1.09 | 2.48 | (1.44 | ) | (1.44 | ) | $ | 46.58 | 5.49 | % | ||||||||||||||||||||||
2019 | $ | 46.29 | 1.46 | (0.80 | ) | 0.66 | (1.41 | ) | (1.41 | ) | $ | 45.54 | 1.52 | % | |||||||||||||||||||||
2018 | $ | 43.30 | 1.39 | 2.99 | 4.38 | (1.39 | ) | (1.39 | ) | $ | 46.29 | 10.23 | % | ||||||||||||||||||||||
2017 | $ | 38.59 | 1.28 | 4.58 | 5.86 | (1.15 | ) | (1.15 | ) | $ | 43.30 | 15.35 | % | ||||||||||||||||||||||
(a) Per share net investment income (loss) has been calculated using the average daily shares method.
(b) Not annualized for periods less than one year.
(c) Annualized for periods less than one year.
(d) Excludes impact of in-kind transactions.
(e) Commencement of operations.
(f) Portfolio turnover increased significantly due to changes in the volume and timing of purchases and sales of portfolio holdings during the year.
(g) Increased trading levels in a given year reflect additional portfolio transactions required to track the "enhanced volatility" methodology of the Fund's underlying index. The Fund expects trading levels to be lower during periods of lower market volatility.
See notes to financial statements.
182
Victory Portfolios II | Financial Highlights — continued | ||||||
For a Share Outstanding Throughout Each Period
Ratios to Average Net Assets | Supplemental Data | ||||||||||||||||||||||
| Net Expenses(c) | Net Investment Income (Loss)(c) | Gross Expenses(c) | Net Assets, End of Period (000's) | Portfolio Turnover(b)(d) | |||||||||||||||||||
VictoryShares US Multi-Factor Minimum Volatility ETF | |||||||||||||||||||||||
| Six Months Ended December 31, 2021 (Unaudited) | 0.35 | % | 1.54 | % | 0.40 | % | $ | 164,018 | 25 | % | |||||||||||||
Year Ended June 30: | |||||||||||||||||||||||
2021 | 0.35 | % | 1.80 | % | 0.41 | % | $ | 164,065 | 56 | % | |||||||||||||
2020 | 0.35 | % | 2.23 | % | 0.42 | % | $ | 155,182 | 69 | % | |||||||||||||
2019 | 0.35 | % | 2.50 | % | 0.48 | % | $ | 43,213 | 34 | % | |||||||||||||
2018 | 0.35 | % | 2.33 | % | 0.74 | % | $ | 8,273 | 26 | % | |||||||||||||
| June 22, 2017(e) through June 30, 2017 | 0.35 | % | 3.20 | % | 7.21 | % | $ | 2,483 | — | % | |||||||||||||
VictoryShares US 500 Enhanced Volatility Wtd ETF | |||||||||||||||||||||||
| Six Months Ended December 31, 2021 (Unaudited) | 0.35 | % | 1.26 | % | 0.38 | % | $ | 1,068,220 | 11 | % | |||||||||||||
Year Ended June 30: | |||||||||||||||||||||||
2021 | 0.35 | % | 1.13 | % | 0.39 | % | $ | 937,341 | 34 | % | |||||||||||||
2020 | 0.35 | % | 1.20 | % | 0.40 | % | $ | 609,613 | 56 | % | |||||||||||||
2019 | 0.35 | % | 1.51 | % | 0.40 | % | $ | 828,729 | 116 | %(f) | |||||||||||||
2018 | 0.35 | % | 1.32 | % | 0.41 | % | $ | 951,411 | 37 | % | |||||||||||||
2017 | 0.35 | % | 1.42 | % | 0.45 | % | $ | 415,847 | 26 | % | |||||||||||||
VictoryShares US EQ Income Enhanced Volatility Wtd ETF | |||||||||||||||||||||||
| Six Months Ended December 31, 2021 (Unaudited) | 0.35 | % | 3.16 | % | 0.38 | % | $ | 1,105,613 | 20 | % | |||||||||||||
Year Ended June 30: | |||||||||||||||||||||||
2021 | 0.35 | % | 2.80 | % | 0.40 | % | $ | 916,846 | 65 | %(g) | |||||||||||||
2020 | 0.35 | % | 3.02 | % | 0.40 | % | $ | 565,892 | 116 | % | |||||||||||||
2019 | 0.35 | % | 3.22 | % | 0.40 | % | $ | 696,814 | 143 | %(f) | |||||||||||||
2018 | 0.35 | % | 3.06 | % | 0.41 | % | $ | 738,260 | 52 | % | |||||||||||||
2017 | 0.35 | % | 3.06 | % | 0.43 | % | $ | 471,927 | 49 | % | |||||||||||||
See notes to financial statements.
183
Victory Portfolios II | Financial Highlights | ||||||
For a Share Outstanding Throughout Each Period
| Investment Activities | Distributions to Shareholders From | |||||||||||||||||||||||||
| Net Asset Value, Beginning of Period | Net Investment Income (Loss)(a) | Net Realized and Unrealized Gains (Losses) on Investments | Total from Investment Activities | Net Investment Income | Net Realized Gains from Investments | ||||||||||||||||||||||
VictoryShares US Discovery Enhanced Volatility Wtd ETF | |||||||||||||||||||||||||||
| Six Months Ended December 31, 2021 (Unaudited) | $ | 60.55 | 0.49 | 3.74 | 4.23 | (0.53 | ) | — | |||||||||||||||||||
Year Ended June 30: | |||||||||||||||||||||||||||
2021 | $ | 39.16 | 0.62 | 21.38 | 22.00 | (0.61 | ) | — | |||||||||||||||||||
2020 | $ | 37.80 | 0.44 | 1.42 | (f) | 1.86 | (0.50 | ) | — | ||||||||||||||||||
2019 | $ | 47.41 | 0.64 | (9.61 | ) | (8.97 | ) | (0.64 | ) | — | |||||||||||||||||
2018 | $ | 41.41 | 0.50 | 5.98 | 6.48 | (0.48 | ) | — | |||||||||||||||||||
2017 | $ | 33.55 | 0.49 | 7.84 | 8.33 | (0.47 | ) | — | |||||||||||||||||||
VictoryShares Developed Enhanced Volatility Wtd ETF | |||||||||||||||||||||||||||
| Six Months Ended December 31, 2021 (Unaudited) | $ | 34.19 | 0.34 | 0.52 | 0.86 | (0.65 | ) | — | |||||||||||||||||||
Year Ended June 30: | |||||||||||||||||||||||||||
2021 | $ | 26.92 | 0.66 | 7.26 | 7.92 | (0.65 | ) | — | |||||||||||||||||||
2020 | $ | 32.10 | 0.52 | (5.14 | ) | (4.62 | ) | (0.56 | ) | — | |||||||||||||||||
2019 | $ | 33.79 | 0.85 | (1.59 | ) | (0.74 | ) | (0.95 | ) | — | |||||||||||||||||
2018 | $ | 32.22 | 0.94 | 1.45 | 2.39 | (0.82 | ) | — | |||||||||||||||||||
2017 | $ | 29.00 | 0.78 | 2.90 | (h) | 3.68 | (0.46 | ) | — | ||||||||||||||||||
VictoryShares Nasdaq Next 50 ETF | |||||||||||||||||||||||||||
| Six Months Ended December 31, 2021 (Unaudited) | $ | 34.33 | 0.05 | (0.20 | ) | (0.15 | ) | (0.06 | ) | — | |||||||||||||||||
| September 10, 2020(j) through June 30, 2021 | $ | 25.45 | 0.12 | 8.85 | 8.97 | (0.09 | ) | — | |||||||||||||||||||
(a) Per share net investment income (loss) has been calculated using the average daily shares method.
(b) Not annualized for periods less than one year.
(c) Annualized for periods less than one year.
(d) Excludes impact of in-kind transactions.
(e) Increased trading levels in a given year reflect additional portfolio transactions required to track the "enhanced volatility" methodology of the Fund's underlying index. The Fund expects trading levels to be lower during periods of lower market volatility.
(f) The amount shown reflects a net realized and unrealized gain per share, whereas the Statement of Operations reflected a net realized and unrealized loss for the period for the Fund in total. The difference in realized and unrealized gains and losses for the Fund versus the class is due to the timing of sales and repurchases of the class in relation to fluctuating market values during the period.
(g) Portfolio turnover increased significantly due to changes in the volume and timing of purchases and sales of portfolio holdings during the year.
(h) Includes $0.07 gain derived from a payment from affiliate.
(i) Before the payment from affiliate for the loss resulting from a trade error, the total return for the year would have been 12.55%.
(j) Commencement of operations.
See notes to financial statements.
184
Victory Portfolios II | Financial Highlights — continued | ||||||
For a Share Outstanding Throughout Each Period
Ratios to Average Net Assets | Supplemental Data | ||||||||||||||||||||||||||||||||||
| Total Distributions | Net Asset Value, End of Period | Total Return(b) | Net Expenses(c) | Net Investment Income (Loss)(c) | Gross Expenses(c) | Net Assets, End of Period (000's) | Portfolio Turnover(b)(d) | ||||||||||||||||||||||||||||
VictoryShares US Discovery Enhanced Volatility Wtd ETF | |||||||||||||||||||||||||||||||||||
| Six Months Ended December 31, 2021 (Unaudited) | (0.53 | ) | $ | 64.25 | 7.04 | % | 0.35 | % | 1.57 | % | 0.44 | % | $ | 70,672 | 26 | % | |||||||||||||||||||
Year Ended June 30: | |||||||||||||||||||||||||||||||||||
2021 | (0.61 | ) | $ | 60.55 | 56.47 | % | 0.35 | % | 1.22 | % | 0.46 | % | $ | 63,572 | 70 | %(e) | |||||||||||||||||||
2020 | (0.50 | ) | $ | 39.16 | 5.00 | % | 0.35 | % | 1.19 | % | 0.47 | % | $ | 37,203 | 232 | % | |||||||||||||||||||
2019 | (0.64 | ) | $ | 37.80 | (19.04 | )% | 0.35 | % | 1.48 | % | 0.42 | % | $ | 92,614 | 398 | %(g) | |||||||||||||||||||
2018 | (0.48 | ) | $ | 47.41 | 15.75 | % | 0.35 | % | 1.13 | % | 0.43 | % | $ | 116,157 | 47 | % | |||||||||||||||||||
2017 | (0.47 | ) | $ | 41.41 | 24.91 | % | 0.35 | % | 1.25 | % | 0.55 | % | $ | 57,971 | 50 | % | |||||||||||||||||||
VictoryShares Developed Enhanced Volatility Wtd ETF | |||||||||||||||||||||||||||||||||||
| Six Months Ended December 31, 2021 (Unaudited) | (0.65 | ) | $ | 34.40 | 2.54 | % | 0.45 | % | 1.95 | % | 0.89 | % | $ | 41,286 | 18 | % | |||||||||||||||||||
Year Ended June 30: | |||||||||||||||||||||||||||||||||||
2021 | (0.65 | ) | $ | 34.19 | 29.63 | % | 0.45 | % | 2.16 | % | 0.88 | % | $ | 42,742 | 55 | % | |||||||||||||||||||
2020 | (0.56 | ) | $ | 26.92 | (14.55 | )% | 0.45 | % | 1.69 | % | 0.65 | % | $ | 48,455 | 33 | % | |||||||||||||||||||
2019 | (0.95 | ) | $ | 32.10 | (2.16 | )% | 0.45 | % | 2.63 | % | 0.56 | % | $ | 110,746 | 154 | %(g) | |||||||||||||||||||
2018 | (0.82 | ) | $ | 33.79 | 7.41 | % | 0.45 | % | 2.73 | % | 0.58 | % | $ | 179,103 | 38 | % | |||||||||||||||||||
2017 | (0.46 | ) | $ | 32.22 | 12.79 | %(i) | 0.45 | % | 2.59 | % | 0.86 | % | $ | 82,150 | 164 | % | |||||||||||||||||||
VictoryShares Nasdaq Next 50 ETF | |||||||||||||||||||||||||||||||||||
| Six Months Ended December 31, 2021 (Unaudited) | (0.06 | ) | $ | 34.12 | (0.42 | )% | 0.18 | % | 0.26 | % | 0.30 | % | $ | 153,524 | 35 | % | |||||||||||||||||||
| September 10, 2020(j) through June 30, 2021 | (0.09 | ) | $ | 34.33 | 35.26 | % | 0.18 | % | 0.46 | % | 0.30 | % | $ | 148,467 | 68 | % | |||||||||||||||||||
See notes to financial statements.
185
Victory Portfolios II | Financial Highlights | ||||||
For a Share Outstanding Throughout Each Period
Investment Activities | Distributions to Shareholders From | ||||||||||||||||||||||||||
| Net Asset Value, Beginning of Period | Net Investment Income (Loss)(a) | Net Realized and Unrealized Gains (Losses) on Investments | Total from Investment Activities | Net Investment Income | Net Realized Gains from Investments | ||||||||||||||||||||||
VictoryShares ESG Core Plus Bond ETF | |||||||||||||||||||||||||||
| October 5 2021(d) through December 31, 2021 (Unaudited) | $ | 25.00 | 0.08 | (0.12 | ) | (0.04 | ) | (0.07 | ) | — | |||||||||||||||||
VictoryShares ESG Corporate Bond ETF | |||||||||||||||||||||||||||
| October 5, 2021(d) through December 31, 2021 (Unaudited) | $ | 25.00 | 0.11 | (0.17 | ) | (0.06 | ) | (0.14 | ) | — | |||||||||||||||||
VictoryShares THB Mid Cap ESG ETF | |||||||||||||||||||||||||||
| October 5, 2021(d) through December 31, 2021 (Unaudited) | $ | 23.74 | — | (e) | 3.52 | 3.52 | (0.08 | ) | — | ||||||||||||||||||
(a) Per share net investment income (loss) has been calculated using the average daily shares method.
(b) Not annualized for periods less than one year.
(c) Annualized for periods less than one year.
(d) Commencement of operations.
(e) Amount is less than $0.005 per share.
See notes to financial statements.
186
Victory Portfolios II | Financial Highlights — continued | ||||||
For a Share Outstanding Throughout Each Period
Ratios to Average Net Assets | Supplemental Data | ||||||||||||||||||||||||||||||||||
| Total Distributions | Net Asset Value, End of Period | Total Return(b) | Net Expenses(c) | Net Investment Income (Loss)(c) | Gross Expenses(c) | Net Assets, End of Period (000's) | Portfolio Turnover(b) | ||||||||||||||||||||||||||||
VictoryShares ESG Core Plus Bond ETF | |||||||||||||||||||||||||||||||||||
| October 5 2021(d) through December 31, 2021 (Unaudited) | (0.07 | ) | $ | 24.89 | (0.15 | )% | 0.40 | % | 1.40 | % | 0.45 | % | $ | 194,785 | 12 | % | |||||||||||||||||||
VictoryShares ESG Corporate Bond ETF | |||||||||||||||||||||||||||||||||||
| October 5, 2021(d) through December 31, 2021 (Unaudited) | (0.14 | ) | $ | 24.80 | (0.25 | )% | 0.40 | % | 1.80 | % | 0.48 | % | $ | 105,410 | 1 | % | |||||||||||||||||||
VictoryShares THB Mid Cap ESG ETF | |||||||||||||||||||||||||||||||||||
| October 5, 2021(d) through December 31, 2021 (Unaudited) | (0.08 | ) | $ | 27.18 | 14.86 | % | 0.55 | % | 0.01 | % | 2.24 | % | $ | 2,718 | 10 | % | |||||||||||||||||||
See notes to financial statements.
187
Victory Portfolios II | Notes to Financial Statements December 31, 2021 | ||||||
(Unaudited)
1. Organization:
Victory Portfolios II (the "Trust") is organized as a Delaware statutory trust and the Trust is registered under the Investment Company Act of 1940, as amended (the "1940 Act"), as an open-end investment company. The Trust is comprised of 25 funds, 23 of which are Exchange-Traded Funds ("ETFs"), and is authorized to issue an unlimited number of shares, which are units of beneficial interest with no par value.
The accompanying financial statements are those of the following 17 Funds (collectively, the "Funds" and individually, a "Fund"). Each Fund is classified as diversified under the 1940 Act.
Funds (Legal Name) | Funds (Short Name) | ||||||
VictoryShares US 500 Volatility Wtd ETF | US 500 Volatility Wtd ETF | ||||||
VictoryShares US Small Cap Volatility Wtd ETF | US Small Cap Volatility Wtd ETF | ||||||
VictoryShares International Volatility Wtd ETF | International Volatility Wtd ETF | ||||||
| VictoryShares US Large Cap High Div Volatility Wtd ETF | US Large Cap High Div Volatility Wtd ETF | ||||||
| VictoryShares US Small Cap High Div Volatility Wtd ETF | US Small Cap High Div Volatility Wtd ETF | ||||||
| VictoryShares International High Div Volatility Wtd ETF | International High Div Volatility Wtd ETF | ||||||
| VictoryShares Emerging Market High Div Volatility Wtd ETF | Emerging Market High Div Volatility Wtd ETF | ||||||
VictoryShares Dividend Accelerator ETF | Dividend Accelerator ETF | ||||||
| VictoryShares US Multi-Factor Minimum Volatility ETF | US Multi-Factor Minimum Volatility ETF | ||||||
VictoryShares US 500 Enhanced Volatility Wtd ETF | US 500 Enhanced Volatility Wtd ETF | ||||||
| VictoryShares US EQ Income Enhanced Volatility Wtd ETF | US EQ Income Enhanced Volatility Wtd ETF | ||||||
| VictoryShares US Discovery Enhanced Volatility Wtd ETF | US Discovery Enhanced Volatility Wtd ETF | ||||||
| VictoryShares Developed Enhanced Volatility Wtd ETF | Developed Enhanced Volatility Wtd ETF | ||||||
VictoryShares Nasdaq Next 50 ETF | Nasdaq Next 50 ETF | ||||||
VictoryShares ESG Core Plus Bond ETF | ESG Core Plus Bond ETF* | ||||||
VictoryShares ESG Corporate Bond ETF | ESG Corporate Bond ETF* | ||||||
VictoryShares THB Mid Cap ESG ETF | THB Mid Cap ESG ETF* | ||||||
* Commenced operations on October 5, 2021.
Under the Trust's organizational documents, its officers and trustees are indemnified against certain liabilities arising out of the performance of their duties to the Funds. In addition, in the normal course of business, the Funds enter into contracts with their vendors and others that provide for general indemnifications. The Funds' maximum exposure under these arrangements is unknown, as this would involve future claims that may be made against the Fund. However, based on experience, the Funds expect that risk of loss to be remote.
2. Significant Accounting Policies:
The following is a summary of significant accounting policies followed by the Trust in the preparation of its financial statements. The policies are in conformity with U.S. Generally Accepted Accounting Principles ("GAAP"). The preparation of financial statements in accordance with GAAP requires management to make estimates and assumptions that affect the reported amounts of assets and liabilities and disclosure of contingent assets and liabilities at the date of the financial statements and the reported amounts of income and expenses for the period. Actual results could differ from those estimates. The Funds follow the specialized accounting and reporting requirements under GAAP that are applicable to investment companies under Accounting Standards Codification Topic 946.
188
Victory Portfolios II | Notes to Financial Statements — continued December 31, 2021 | ||||||
(Unaudited)
Shares of the Funds are listed and traded on Nasdaq Stock Market, LLC. (the "Exchange"). The Funds issue and redeem shares at NAV only in aggregations of 50,000 shares, or 25,000 shares in the case of THB Mid Cap ESG ETF, ESG Core Plus Bond ETF, ESG Corporate Bond ETF, and Nasdaq Next 50 ETF (each a "Creation Unit"). Creation Units are issued and redeemed in exchange for a basket of securities included in the respective Fund's Index (the "Deposit Securities"), and/or with the deposit of a specified cash payment (the "Cash Component"), plus a transaction fee. Shares trade on the Exchange at market prices that may be below, at, or above NAV. Shares of a Fund may only be purchased or redeemed by certain financial institutions ("Authorized Participants"). An Authorized Participant is either (i) a broker-dealer or other participant in the clearing process through the Continuous Net Settlement System of the National Securities Clearing Corporation or (ii) a DTC participant and, in each case, must have executed a Participant Agreement with the distributor. Only Authorized Participants may purchase or redeem the shares directly from a Fund. In addition, shares may be issued in advance of receipt of Deposit Securities subject to various conditions, including a requirement to maintain on deposit with the Trust cash equal to up to 105% of the market value of the missing Deposit Securities. In each instance of such cash creations or redemptions, transaction fees may be imposed and may be higher than the transaction fees associated with in-kind creations or redemptions.
Each Fund may issue an unlimited number of shares of beneficial interest, with no par value. Shares of each Fund have equal rights and privileges. A purchase (i.e., creation) transaction fee is imposed for the transfer and other transactional costs associated with the purchase of Creation Units. In addition, a variable fee may be charged on all cash transactions or substitutes for Creation Units. Variable fees received by each Fund are displayed in the Capital Transactions section of the Statements of Changes in Net Assets as an increase to Capital.
The transaction fees for each Fund are listed below:
| Fee for In-Kind and Cash Purchases and Redemptions | Maximum Additional Variable Charge for Cash Purchases and Redemptions* | ||||||||||
US 500 Volatility Wtd ETF | $ | 750 | 2.00 | % | |||||||
US Small Cap Volatility Wtd ETF | 750 | 2.00 | % | ||||||||
International Volatility Wtd ETF | 6,000 | 2.00 | % | ||||||||
US Large Cap High Div Volatility Wtd ETF | 250 | 2.00 | % | ||||||||
US Small Cap High Div Volatility Wtd ETF | 250 | 2.00 | % | ||||||||
International High Div Volatility Wtd ETF | 1,500 | 2.00 | % | ||||||||
Emerging Market High Div Volatility Wtd ETF | 3,400 | 2.00 | % | ||||||||
Dividend Accelerator ETF | 250 | 2.00 | % | ||||||||
US Multi-Factor Minimum Volatility ETF | 250 | 2.00 | % | ||||||||
US 500 Enhanced Volatility Wtd ETF | 750 | 2.00 | % | ||||||||
US EQ Income Enhanced Volatility Wtd ETF | 250 | 2.00 | % | ||||||||
US Discovery Enhanced Volatility Wtd ETF | 750 | 2.00 | % | ||||||||
Developed Enhanced Volatility Wtd ETF | 4,500 | 2.00 | % | ||||||||
Nasdaq Next 50 ETF | 250 | 2.00 | % | ||||||||
ESG Core Plus Bond ETF | 100 | 2.00 | % | ||||||||
ESG Corporate Bond ETF | 100 | 2.00 | % | ||||||||
| THB Mid Cap ESG ETF | 250 | 2.00 | % | ||||||||
* As a percentage of the amount invested.
Investment Valuation:
The Funds record investments at fair value. Fair value is defined as the price that would be received to sell an asset or paid to transfer a liability in an orderly transaction between market participants at the measurement date.
189
Victory Portfolios II | Notes to Financial Statements — continued December 31, 2021 | ||||||
(Unaudited)
The valuation techniques described below maximize the use of observable inputs and minimize the use of unobservable inputs in determining fair value. The inputs used for valuing the Funds' investments are summarized in the three broad levels listed below:
• Level 1 — quoted prices in active markets for identical securities
• Level 2 — other significant observable inputs (including quoted prices for similar securities or interest rates applicable to those securities, etc.)
• Level 3 — significant unobservable inputs (including the Funds' own assumptions in determining the fair value of investments)
Changes in valuation techniques may result in transfers in or out of an assigned level within the disclosure hierarchy. The inputs or methodologies used for valuation techniques are not necessarily an indication of the risk associated with entering into those investments.
Victory Capital Management Inc. ("VCM" or the "Adviser") has established the Pricing and Liquidity Committee (the "Committee"), and subject to the Trust's Board of Trustees' (the "Board") oversight, the Committee administers and oversees the Funds' valuation policies and procedures, which are approved by the Board.
Portfolio securities listed or traded on securities exchanges, including ETFs and American Depositary Receipts ("ADRs"), are valued at the closing price on the exchange or system where the security is principally traded, if available, or at the Nasdaq Official Closing Price. If there have been no sales for that day on the exchange or system, then a security is valued at the last available bid quotation on the exchange or system where the security is principally traded. In each of these situations, valuations are typically categorized as Level 1 in the fair value hierarchy.
Investments in open-end investment companies are valued at NAV. These valuations are typically categorized as Level 1 in the fair value hierarchy.
Futures contracts are valued at the settlement price established each day by the board of trade or an exchange on which they are traded. These valuations are typically categorized as Level 1 in the fair value hierarchy.
In the event that price quotations or valuations are not readily available, investments are valued at fair value in accordance with procedures established by and under the general supervision and responsibility of the Board. These valuations are typically categorized as Level 2 or Level 3 in the fair value hierarchy, based on the observability of inputs used to determine the fair value. The effect of fair value pricing is that securities may not be priced on the basis of quotations from the primary market in which they are traded and the actual price realized from the sale of a security may differ materially from the fair value price. Valuing these securities at fair value is intended to cause the Fund's NAV to be more reliable than it otherwise would be.
A summary of the valuations as of December 31, 2021, is included in the table below while the breakdown, by category, of investments is disclosed on the Schedules of Portfolio Investments:
Level 1 | Level 2 | Level 3 | Total | ||||||||||||||||
US 500 Volatility Wtd ETF | |||||||||||||||||||
Common Stocks | $ | 684,840,626 | $ | — | $ | — | $ | 684,840,626 | |||||||||||
Collateral for Securities Loaned | 10,035,590 | — | — | 10,035,590 | |||||||||||||||
Total | $ | 694,876,216 | $ | — | $ | — | $ | 694,876,216 | |||||||||||
Other Financial Investments^: | |||||||||||||||||||
Assets: | |||||||||||||||||||
Futures | $ | 28,889 | $ | — | $ | — | $ | 28,889 | |||||||||||
Total | $ | 28,889 | $ | — | $ | — | $ | 28,889 | |||||||||||
190
Victory Portfolios II | Notes to Financial Statements — continued December 31, 2021 | ||||||
(Unaudited)
Level 1 | Level 2 | Level 3 | Total | ||||||||||||||||
US Small Cap Volatility Wtd ETF | |||||||||||||||||||
Common Stocks | $ | 27,464,368 | $ | — | $ | — | $ | 27,464,368 | |||||||||||
Collateral for Securities Loaned | 144,942 | — | — | 144,942 | |||||||||||||||
Total | $ | 27,609,310 | $ | — | $ | — | $ | 27,609,310 | |||||||||||
Other Financial Investments^: | |||||||||||||||||||
Liabilities: | |||||||||||||||||||
Futures | $ | (1,219 | ) | $ | — | $ | — | $ | (1,219 | ) | |||||||||
Total | $ | (1,219 | ) | $ | — | $ | — | $ | (1,219 | ) | |||||||||
International Volatility Wtd ETF | |||||||||||||||||||
Common Stocks | $ | 117,040,221 | $ | — | $ | — | $ | 117,040,221 | |||||||||||
Collateral for Securities Loaned | 4,025,356 | — | — | 4,025,356 | |||||||||||||||
Total | $ | 121,065,577 | $ | — | $ | — | $ | 121,065,577 | |||||||||||
Other Financial Investments^: | |||||||||||||||||||
Assets: | |||||||||||||||||||
Futures | $ | 3,807 | $ | — | $ | — | $ | 3,807 | |||||||||||
Total | $ | 3,807 | $ | — | $ | — | $ | 3,807 | |||||||||||
US Large Cap High Div Volatility Wtd ETF | |||||||||||||||||||
Common Stocks | $ | 239,837,813 | $ | — | $ | — | $ | 239,837,813 | |||||||||||
Collateral for Securities Loaned | 2,212,270 | — | — | 2,212,270 | |||||||||||||||
Total | $ | 242,050,083 | $ | — | $ | — | $ | 242,050,083 | |||||||||||
Other Financial Investments^: | |||||||||||||||||||
Assets: | |||||||||||||||||||
Futures | $ | 8,950 | $ | — | $ | — | $ | 8,950 | |||||||||||
Total | $ | 8,950 | $ | — | $ | — | $ | 8,950 | |||||||||||
US Small Cap High Div Volatility Wtd ETF | |||||||||||||||||||
Common Stocks | $ | 250,501,833 | $ | — | $ | — | $ | 250,501,833 | |||||||||||
Collateral for Securities Loaned | 5,888,647 | — | — | 5,888,647 | |||||||||||||||
Total | $ | 256,390,480 | $ | — | $ | — | $ | 256,390,480 | |||||||||||
Other Financial Investments^: | |||||||||||||||||||
Assets: | |||||||||||||||||||
Futures | $ | 25,296 | $ | — | $ | — | $ | 25,296 | |||||||||||
Total | $ | 25,296 | $ | — | $ | — | $ | 25,296 | |||||||||||
International High Div Volatility Wtd ETF | |||||||||||||||||||
Common Stocks | $ | 19,334,589 | $ | — | $ | — | $ | 19,334,589 | |||||||||||
Collateral for Securities Loaned | 857,575 | — | — | 857,575 | |||||||||||||||
Total | $ | 20,192,164 | $ | — | $ | — | $ | 20,192,164 | |||||||||||
Other Financial Investments^: | |||||||||||||||||||
Assets: | |||||||||||||||||||
Futures | $ | 4,086 | $ | — | $ | — | $ | 4,086 | |||||||||||
Total | $ | 4,086 | $ | — | $ | — | $ | 4,086 | |||||||||||
| Emerging Market High Div Volatility Wtd ETF | |||||||||||||||||||
Common Stocks | $ | 16,393,716 | $ | — | $ | — | $ | 16,393,716 | |||||||||||
Collateral for Securities Loaned | 749,575 | — | — | 749,575 | |||||||||||||||
Total | $ | 17,143,291 | $ | — | $ | — | $ | 17,143,291 | |||||||||||
191
Victory Portfolios II | Notes to Financial Statements — continued December 31, 2021 | ||||||
(Unaudited)
Level 1 | Level 2 | Level 3 | Total | ||||||||||||||||
Other Financial Investments^: | |||||||||||||||||||
Assets: | |||||||||||||||||||
Futures | $ | 326 | $ | — | $ | — | $ | 326 | |||||||||||
Total | $ | 326 | $ | — | $ | — | $ | 326 | |||||||||||
Dividend Accelerator ETF | |||||||||||||||||||
Common Stocks | $ | 353,437,121 | $ | — | $ | — | $ | 353,437,121 | |||||||||||
Collateral for Securities Loaned | 371,172 | — | — | 371,172 | |||||||||||||||
Total | $ | 353,808,293 | $ | — | $ | — | $ | 353,808,293 | |||||||||||
Other Financial Investments^: | |||||||||||||||||||
Assets: | |||||||||||||||||||
Futures | $ | 21,600 | $ | — | $ | — | $ | 21,600 | |||||||||||
Total | $ | 21,600 | $ | — | $ | — | $ | 21,600 | |||||||||||
US Multi-Factor Minimum Volatility ETF | |||||||||||||||||||
Common Stocks | $ | 163,368,431 | $ | — | $ | — | $ | 163,368,431 | |||||||||||
Total | $ | 163,368,431 | $ | — | $ | — | $ | 163,368,431 | |||||||||||
Other Financial Investments^: | |||||||||||||||||||
Assets: | |||||||||||||||||||
Futures | $ | 6,000 | $ | — | $ | — | $ | 6,000 | |||||||||||
Total | $ | 6,000 | $ | — | $ | — | $ | 6,000 | |||||||||||
US 500 Enhanced Volatility Wtd ETF | |||||||||||||||||||
Common Stocks | $ | 1,064,240,537 | $ | — | $ | — | $ | 1,064,240,537 | |||||||||||
Investment Companies | 2,825,925 | — | — | 2,825,925 | |||||||||||||||
Collateral for Securities Loaned | 12,340,356 | — | — | 12,340,356 | |||||||||||||||
Total | $ | 1,079,406,818 | $ | — | $ | — | $ | 1,079,406,818 | |||||||||||
Other Financial Investments^: | |||||||||||||||||||
Assets: | |||||||||||||||||||
Futures | $ | 47,368 | $ | — | $ | — | $ | 47,368 | |||||||||||
Total | $ | 47,368 | $ | — | $ | — | $ | 47,368 | |||||||||||
| US EQ Income Enhanced Volatility Wtd ETF | |||||||||||||||||||
Common Stocks | $ | 1,099,805,167 | $ | — | $ | — | $ | 1,099,805,167 | |||||||||||
Investment Companies | 2,805,385 | — | — | 2,805,385 | |||||||||||||||
Collateral for Securities Loaned | 20,585,825 | — | — | 20,585,825 | |||||||||||||||
Total | $ | 1,123,196,377 | $ | — | $ | — | $ | 1,123,196,377 | |||||||||||
Other Financial Investments^: | |||||||||||||||||||
Assets: | |||||||||||||||||||
Futures | $ | 59,214 | $ | — | $ | — | $ | 59,214 | |||||||||||
Total | $ | 59,214 | $ | — | $ | — | $ | 59,214 | |||||||||||
US Discovery Enhanced Volatility Wtd ETF | |||||||||||||||||||
Common Stocks | $ | 70,395,087 | $ | — | $ | — | $ | 70,395,087 | |||||||||||
Investment Companies | 225,408 | — | — | 225,408 | |||||||||||||||
Collateral for Securities Loaned | 825,012 | — | — | 825,012 | |||||||||||||||
Total | $ | 71,445,507 | $ | — | $ | — | $ | 71,445,507 | |||||||||||
192
Victory Portfolios II | Notes to Financial Statements — continued December 31, 2021 | ||||||
(Unaudited)
Level 1 | Level 2 | Level 3 | Total | ||||||||||||||||
Other Financial Investments^: | |||||||||||||||||||
Assets: | |||||||||||||||||||
Futures | $ | 11,087 | $ | — | $ | — | $ | 11,087 | |||||||||||
Total | $ | 11,087 | $ | — | $ | — | $ | 11,087 | |||||||||||
Developed Enhanced Volatility Wtd ETF | |||||||||||||||||||
Common Stocks | $ | 40,975,363 | $ | — | $ | 667 | $ | 40,976,030 | |||||||||||
Investment Companies | 48,398 | — | — | 48,398 | |||||||||||||||
Collateral for Securities Loaned | 1,384,271 | — | — | 1,384,271 | |||||||||||||||
Total | $ | 42,408,032 | $ | — | $ | 667 | $ | 42,408,699 | |||||||||||
Other Financial Investments^: | |||||||||||||||||||
Assets: | |||||||||||||||||||
Futures | $ | 1,836 | $ | — | $ | — | $ | 1,836 | |||||||||||
Total | $ | 1,836 | $ | — | $ | — | $ | 1,836 | |||||||||||
Nasdaq Next 50 ETF | |||||||||||||||||||
Common Stocks | $ | 152,929,343 | $ | — | $ | — | $ | 152,929,343 | |||||||||||
Total | $ | 152,929,343 | $ | — | $ | — | $ | 152,929,343 | |||||||||||
Other Financial Investments^: | |||||||||||||||||||
Assets: | |||||||||||||||||||
Futures | $ | 14,678 | $ | — | $ | — | $ | 14,678 | |||||||||||
Total | $ | 14,678 | $ | — | $ | — | $ | 14,678 | |||||||||||
ESG Core Plus Bond ETF | |||||||||||||||||||
Asset-Backed Securities | $ | — | $ | 20,636,898 | $ | — | $ | 20,636,898 | |||||||||||
Collateralized Mortgage Obligations | — | 31,851,068 | — | 31,851,068 | |||||||||||||||
Senior Secured Loans | — | 11,086,508 | — | 11,086,508 | |||||||||||||||
Corporate Bond | — | 60,987,250 | — | 60,987,250 | |||||||||||||||
Yankee Dollars | — | 13,772,932 | — | 13,772,932 | |||||||||||||||
Municipal Bonds | — | 2,099,745 | — | 2,099,745 | |||||||||||||||
U.S. Treasury Obligations | — | 52,630,344 | — | 52,630,344 | |||||||||||||||
Commercial Papers | — | 10,499,587 | — | 10,499,587 | |||||||||||||||
Total | $ | — | $ | 203,564,332 | $ | — | $ | 203,564,332 | |||||||||||
ESG Corporate Bond ETF | |||||||||||||||||||
Corporate Bonds | $ | — | $ | 81,723,648 | $ | — | $ | 81,723,648 | |||||||||||
Yankee Dollars | — | 21,412,369 | — | 21,412,369 | |||||||||||||||
Commercial Papers | — | 999,946 | — | 999,946 | |||||||||||||||
Total | $ | — | $ | 104,135,963 | $ | — | $ | 104,135,963 | |||||||||||
THB Mid Cap ESG ETF | |||||||||||||||||||
Common Stocks | $ | 2,719,058 | $ | — | $ | — | $ | 2,719,058 | |||||||||||
Total | $ | 2,719,058 | $ | — | $ | — | $ | 2,719,058 | |||||||||||
^ Futures contracts are valued at the unrealized appreciation (depreciation) on the investment.
For the six months ended December 31, 2021, there were no transfers in or out of Level 3 in the fair value hierarchy.
As of December 31, 2021, there were no significant Level 3 holdings in the fair value hierarchy
193
Victory Portfolios II | Notes to Financial Statements — continued December 31, 2021 | ||||||
(Unaudited)
Real Estate Investment Trusts ("REITs"):
The Funds may invest in REITs, which report information on the source of their distributions annually. REITs are pooled investment vehicles that invest primarily in income-producing real estate or real-estate related loans or interests (such as mortgages). Certain distributions received from REITs during the year are recorded as realized gains or return of capital as estimated by the Funds or when such information becomes known.
Securities Purchased on a Delayed-Delivery or When-Issued Basis:
The Funds may purchase securities on a delayed-delivery or when-issued basis. Delivery and payment for securities that have been purchased by the Fund on a delayed-delivery or when-issued basis, or for delayed draws on loans can take place a month or more after the trade date. At the time a Fund makes the commitment to purchase a security on a when-issued basis, the Fund records the transaction and reflects the value of the security in determining NAV. No interest accrues to the Fund until the transaction settles and payment takes place. Normally, the settlement date occurs within one month of the purchase. A segregated account is established and the Fund maintains cash and/or marketable securities at least equal in value to commitments for when-issued securities. If a Fund owns when-issued securities, these values are included in Payables for investments purchased on the accompanying Statements of Assets and Liabilities and the segregated assets are identified on the Schedules of Portfolio Investments.
Investment Companies:
Open-End Funds:
The Funds may invest in portfolios of open-end investment companies. These investment companies value securities in their portfolios for which market quotations are readily available at their market values (generally the last reported sale price) and all other securities and assets at their fair value by the methods established by the board of directors of the underlying funds.
Mortgage- and Asset-Backed Securities:
The values of some mortgage-related or asset-backed securities may be particularly sensitive to changes in prevailing interest rates. Early repayment of principal on some mortgage-related securities may expose the Fund to a lower rate of return upon reinvestment of principal. The values of mortgage- and asset-backed securities depend in part on the credit quality and adequacy of the underlying assets or collateral and may fluctuate in response to the market's perception of these factors as well as current and future repayment rates. Some mortgage-backed securities are backed by the full faith and credit of the U.S. government (e.g., mortgage-backed securities issued by the Government National Mortgage Association, commonly known as "Ginnie Mae"), while other mortgage-backed securities (e.g., mortgage-backed securities issued by the Federal National Mortgage Association and the Federal Home Loan Mortgage Corporation, commonly known as "Fannie Mae" and "Freddie Mac," respectively), are backed only by the credit of the government entity issuing them. In addition, some mortgage-backed securities are issued by private entities and, as such, are not guaranteed by the U.S. government or any agency or instrumentality of the U.S. government.
Derivative Instruments:
Foreign Exchange Currency Contracts:
Certain Funds may enter into foreign exchange currency contracts to convert U.S. dollars to and from various foreign currencies. A foreign exchange currency contract is an obligation by a Fund to purchase or sell a specific currency at a future date at a price (in U.S. dollars) set at the time of the contract. The Funds do not engage in "cross-currency" foreign exchange contracts (i.e., contracts to purchase or sell one foreign currency in exchange for another foreign currency). The Funds' foreign exchange currency contracts might be considered spot contracts (typically a contract of one week or less) or forward contracts (typically a contract term over one week). A spot contract is entered into for purposes of hedging against foreign currency fluctuations relating to a specific portfolio transaction, such as the delay between a security transaction trade date and settlement date. Forward contracts are entered
194
Victory Portfolios II | Notes to Financial Statements — continued December 31, 2021 | ||||||
(Unaudited)
into for purposes of hedging portfolio holdings or concentrations of such holdings. The Funds enter into foreign exchange currency contracts solely for spot or forward hedging purposes, and not for speculative purposes (i.e., the Funds do not enter into such contracts solely for the purpose of earning foreign currency gains). Each foreign exchange currency contract is adjusted daily by the prevailing spot or forward rate of the underlying currency, and any appreciation or depreciation is recorded for financial statement purposes as unrealized until the contract settlement date, at which time the Funds record realized gains or losses equal to the difference between the value of a contract at the time it was opened and the value at the time it was closed. The Funds could be exposed to risk if a counterparty is unable to meet the terms of a foreign exchange currency contract or if the value of the foreign currency changes unfavorably. In addition, the use of foreign exchange currency contracts does not eliminate fluctuations in the underlying prices of the securities. As of December 31, 2021, the Funds had no open forward foreign exchange currency contracts.
Futures Contracts:
The Funds may enter into contracts for the future delivery of securities or foreign currencies and futures contracts based on a specific security, class of securities, foreign currency or an index, and purchase or sell options on any such futures contracts. A futures contract on a securities index is an agreement obligating either party to pay, and entitling the other party to receive, while the contract is outstanding, cash payments based on the level of a specified securities index. No physical delivery of the underlying asset is made. The Funds may enter into futures contracts in an effort to hedge against market risks. The acquisition of put and call options on futures contracts will give the Funds the right (but not the obligation), for a specified price, to sell or to purchase the underlying futures contract, upon exercise of the option, at any time during the option period. Futures transactions involve brokerage costs and require the Funds to segregate assets to cover contracts that would require it to purchase securities or currencies. A good faith margin deposit, known as initial margin, of cash or government securities with a broker or custodian is required to initiate and maintain open positions in futures contracts. Subsequent payments, known as variation margin, are made or received by the Funds based on the change in the market value of the position and are recorded as unrealized appreciation or depreciation until the contract is closed out, at which time the gain or loss is realized. The Funds may lose the expected benefit of futures transactions if interest rates, exchange rates or securities prices change in an unanticipated manner. Such unanticipated changes may also result in lower overall performance than if the Funds had not entered into any futures transactions. In addition, the value of the Funds' futures positions may not prove to be perfectly or even highly correlated with the value of its portfolio securities or foreign currencies, limiting the Funds' ability to hedge effectively against interest rate, exchange rate and/or market risk and giving rise to additional risks. There is no assurance of liquidity in the secondary market for purposes of closing out futures positions. The collateral held by the Funds is reflected on the Statements of Assets and Liabilities under Deposit with broker for futures contracts.
Management has determined that no offsetting requirements exist as a result of their conclusion that the Funds are not subject to master netting agreements for futures contracts. As of December 31, 2021, the Funds entered into futures contracts primarily for the strategy of hedging or other purposes, including but not limited to, providing liquidity and equitizing cash.
Summary of Derivative Instruments:
The following table summarizes the fair values of derivative instruments on the Statements of Assets and Liabilities, categorized by risk exposure, as of December 31, 2021:
Asset | Liabilities | ||||||||||
| Variation Margin Receivable on Open Futures Contracts* | Variation Margin Payable on Open Futures Contracts* | ||||||||||
Equity Risk Exposure | |||||||||||
US 500 Volatility Wtd ETF | $ | 28,889 | $ | — | |||||||
US Small Cap Volatility Wtd ETF | — | 1,219 | |||||||||
International Volatility Wtd ETF | 3,807 | — | |||||||||
US Large Cap High Div Volatility Wtd ETF | 8,950 | — | |||||||||
195
Victory Portfolios II | Notes to Financial Statements — continued December 31, 2021 | ||||||
(Unaudited)
Asset | Liabilities | ||||||||||
| Variation Margin Receivable on Open Futures Contracts* | Variation Margin Payable on Open Futures Contracts* | ||||||||||
US Small Cap High Div Volatility Wtd ETF | $ | 25,296 | $ | — | |||||||
International High Div Volatility Wtd ETF | 4,086 | — | |||||||||
Emerging Market High Div Volatility Wtd ETF | 326 | — | |||||||||
Dividend Accelerator ETF | 21,600 | — | |||||||||
US Multi-Factor Minimum Volatility ETF | 6,000 | — | |||||||||
US 500 Enhanced Volatility Wtd ETF | 47,368 | — | |||||||||
US EQ Income Enhanced Volatility Wtd ETF | 59,214 | — | |||||||||
US Discovery Enhanced Volatility Wtd ETF | 11,087 | — | |||||||||
Developed Enhanced Volatility Wtd ETF | 1,836 | — | |||||||||
Nasdaq Next 50 ETF | 14,678 | — | |||||||||
* Includes cumulative appreciation (depreciation) of futures contracts as reported on the Schedules of Portfolio Investments. Only current day's variation margin for futures contracts is reported within the Statements of Assets and Liabilities.
The following table presents the effect of derivative instruments on the Statements of Operations, categorized by risk exposure, for the six months ended December 31, 2021:
| Net Realized Gains (Losses) on Derivatives Recognized as a Result of Operations | Net Change in Unrealized Appreciation/Depreciation on Derivatives Recognized as a Result of Operations | ||||||||||
| Net Realized Gains (Losses) from Futures Contracts | Net Change in Unrealized Appreciation/Depreciation on Futures Contracts | ||||||||||
Equity Risk Exposure | |||||||||||
US 500 Volatility Wtd ETF | $ | 365,354 | $ | (24,872 | ) | ||||||
US Small Cap Volatility Wtd ETF | (3,354 | ) | (4,355 | ) | |||||||
International Volatility Wtd ETF | (2,870 | ) | 9,664 | ||||||||
US Large Cap High Div Volatility Wtd ETF | 134,052 | (3,232 | ) | ||||||||
US Small Cap High Div Volatility Wtd ETF | (15,213 | ) | 27,507 | ||||||||
International High Div Volatility Wtd ETF | (2,726 | ) | 6,669 | ||||||||
Emerging Market High Div Volatility Wtd ETF | (4,675 | ) | 100 | ||||||||
Dividend Accelerator ETF | 129,243 | 10,781 | |||||||||
US Multi-Factor Minimum Volatility ETF | 75,119 | (2,993 | ) | ||||||||
US 500 Enhanced Volatility Wtd ETF | 484,025 | (22,926 | ) | ||||||||
US EQ Income Enhanced Volatility Wtd ETF | 547,290 | 18,142 | |||||||||
US Discovery Enhanced Volatility Wtd ETF | (21,696 | ) | 10,070 | ||||||||
Developed Enhanced Volatility Wtd ETF | 1 | 7,674 | |||||||||
Nasdaq Next 50 ETF | 40,689 | 4,712 | |||||||||
All open derivative positions at period end are reflected on each respective Fund's Schedule of Portfolio Investments. The underlying face value of open derivative positions relative to each Fund's net assets at period end is generally representative of the notional amount of open positions to net assets throughout the period.
Investment Transactions and Related Income:
Changes in holdings of investments are accounted for no later than one business day following the trade date. For financial reporting purposes, however, investment transactions are accounted for on trade date or the last business day of the reporting period. Interest income is determined on the basis of coupon interest accrued using the effective interest method which adjusts, where applicable, the amortization of premiums or accretion of discounts. Dividend income is recorded on the ex-dividend date. Gains or losses realized on sales of securities are recorded on the identified cost basis. Paydown
196
Victory Portfolios II | Notes to Financial Statements — continued December 31, 2021 | ||||||
(Unaudited)
gains or losses on applicable securities, if any, are recorded as a component of Interest income on the Statements of Operations.
Withholding taxes on interest, dividends, and gains as a result of certain investments in ADRs by the Funds have been provided for in accordance with each investment's applicable country's tax rules and rates.
Securities Lending:
The Funds, through a Securities Lending Agreement with Citibank, N.A. ("Citibank"), may lend their securities to qualified financial institutions, such as certain broker-dealers and banks, to earn additional income, net of income retained by Citibank. Borrowers are required to initially secure their loans for collateral in the amount of at least 102% of the value of U.S. securities loaned or at least 105% of the value of non-U.S. securities loaned, marked-to-market daily. Any collateral shortfalls associated with increases in the valuation of the securities loaned are generally cured the next business day. The collateral can be received in the form of cash collateral and/or non-cash collateral. Non-cash collateral can include U.S. Government Securities and other securities as permitted by Securities and Exchange Commission ("SEC") guidelines. The cash collateral is invested in short-term instruments or cash equivalents, primarily open-end investment companies, as noted on the Funds' Schedules of Portfolio Investments. The Funds effectively do not have control of the non-cash collateral and therefore it is not disclosed on the Funds' Schedules of Portfolio Investments. Collateral requirements are determined daily based on the value of the Funds' securities on loan as of the end of the prior business day. During the time portfolio securities are on loan, the borrower will pay the Funds any dividends or interest paid on such securities plus any fee negotiated between the parties to the lending agreement. The Funds also earn a return from the collateral. The Funds pay Citibank various fees in connection with the investment of cash collateral and fees based on the investment income received from securities lending activities. Securities lending income (net of these fees) is disclosed on the Statements of Operations. Loans are terminable upon demand and the borrower must return the loaned securities within the lesser of one standard settlement period or five business days. Although risk is mitigated by the collateral, a Fund could experience a delay in recovering its securities and possible loss of income or value if the borrower fails to return them. In addition, there is a risk that the value of the short-term investments will be less than the amount of cash collateral required to be returned to the borrower.
The Funds' agreement with Citibank does not include master netting provisions. Non-cash collateral received by the Funds may not be sold or repledged, except to satisfy borrower default.
The following table is a summary of the Funds' securities lending transactions as of December 31, 2021.
| Value of Securities on Loan | Non-Cash Collateral | Cash Collateral | |||||||||||||
US 500 Volatility Wtd ETF | $ | 9,714,977 | $ | — | $ | 10,035,590 | |||||||||
US Small Cap Volatility Wtd ETF | 139,560 | — | 144,942 | ||||||||||||
International Volatility Wtd ETF | 3,853,110 | — | 4,025,356 | ||||||||||||
US Large Cap High Div Volatility Wtd ETF | 2,140,650 | — | 2,212,270 | ||||||||||||
US Small Cap High Div Volatility Wtd ETF | 5,683,641 | — | 5,888,647 | ||||||||||||
International High Div Volatility Wtd ETF | 823,029 | — | 857,575 | ||||||||||||
Emerging Market High Div Volatility Wtd ETF | 690,659 | — | 749,575 | ||||||||||||
Dividend Accelerator ETF | 365,148 | — | 371,172 | ||||||||||||
US 500 Enhanced Volatility Wtd ETF | 11,875,760 | — | 12,340,356 | ||||||||||||
US EQ Income Enhanced Volatility Wtd ETF | 20,053,733 | — | 20,585,825 | ||||||||||||
US Discovery Enhanced Volatility Wtd ETF | 796,001 | — | 825,012 | ||||||||||||
Developed Enhanced Volatility Wtd ETF | 1,327,116 | — | 1,384,271 | ||||||||||||
Foreign Currency Translations:
The accounting records of the Funds are maintained in U.S. dollars. Investment securities and other assets and liabilities of a Fund denominated in a foreign currency are translated into U.S. dollars at current exchange rates. Purchases and sales of securities, income receipts and expense payments are
197
Victory Portfolios II | Notes to Financial Statements — continued December 31, 2021 | ||||||
(Unaudited)
translated into U.S. dollars at the exchange rates on the date of the transactions. The Funds do not isolate the portion of the results of operations resulting from changes in foreign exchange rates on investments from fluctuations arising from changes in market prices of securities held. Such fluctuations are disclosed as Net change in unrealized appreciation/depreciation on investment securities and foreign currency translations on the Statements of Operations. Any realized gains or losses from these fluctuations are disclosed as Net realized gains (losses) from investment securities and foreign currency transactions on the Statements of Operations.
Foreign Taxes:
The Funds may be subject to foreign taxes related to foreign income received (a portion of which may be reclaimable), capital gains on the sale of securities, and certain foreign currency transactions. All foreign taxes are recorded in accordance with the applicable regulations and rates that exist in the foreign jurisdictions in which the Funds invest.
Federal Income Taxes:
It is each Fund's policy to continue to qualify as a regulated investment company by complying with the provisions available to certain investment companies, as defined in applicable sections of the Internal Revenue Code, and to make distributions of net investment income and net realized gains sufficient to relieve it from all, or substantially all, federal income taxes. Accordingly, no provision for federal income taxes is required in the financial statements. The Funds have a tax year end of June 30.
For the six months ended December 31, 2021, the Funds did not incur any income tax, interest, or penalties, and have recorded no liability for net unrecognized tax benefits relating to uncertain income tax positions.
Management of the Funds has reviewed tax positions taken in tax years that remain subject to examination by all major tax jurisdictions, including federal (i.e., the last four tax years, which includes the current fiscal tax year end). Management believes that there is no tax liability resulting from unrecognized tax benefits related to uncertain tax positions taken.
Allocations:
Expenses directly attributable to a Fund are charged to that Fund, while expenses that are attributable to more than one fund in the Trust, or jointly with an affiliated trust, are allocated among the respective funds in the Trust and/or an affiliated trust based upon net assets or another appropriate basis.
3. Purchases and Sales:
Purchases and sales of securities (excluding securities maturing less than one year from acquisition) and purchases and sales of in-kind transactions for the six months ended December 31, 2021, were as follows. Any realized gains or losses from in-kind redemptions are reflected on the Statements of Operations as Net realized gains (losses) from in-kind redemptions.
| Excluding U.S. Government Securities and In-Kind Transactions | Associated with In-Kind Transactions | |||||||||||||||||
Purchases | Sales | Purchases | Sales | ||||||||||||||||
US 500 Volatility Wtd ETF | $ | 79,666,293 | $ | 78,649,379 | $ | 87,868,066 | $ | 165,929,076 | |||||||||||
US Small Cap Volatility Wtd ETF | 6,761,582 | 6,758,854 | 6,363,119 | 6,356,550 | |||||||||||||||
International Volatility Wtd ETF | 20,565,345 | 21,667,713 | — | — | |||||||||||||||
| US Large Cap High Div Volatility Wtd ETF | 45,243,811 | 45,299,771 | 60,822,135 | 57,115,636 | |||||||||||||||
| US Small Cap High Div Volatility Wtd ETF | 85,492,133 | 85,507,712 | 78,012,304 | 83,328,869 | |||||||||||||||
| International High Div Volatility Wtd ETF | 6,061,973 | 6,324,491 | — | 3,217,687 | |||||||||||||||
| Emerging Market High Div Volatility Wtd ETF | 8,285,848 | 9,424,483 | — | 1,390,518 | |||||||||||||||
198
Victory Portfolios II | Notes to Financial Statements — continued December 31, 2021 | ||||||
(Unaudited)
| Excluding U.S. Government Securities and In-Kind Transactions | Associated with In-Kind Transactions | ||||||||||||||||||
Purchases | Sales | Purchases | Sales | ||||||||||||||||
Dividend Accelerator ETF | $ | 16,638,783 | $ | 16,658,786 | $ | 30,750,056 | $ | 47,096,526 | |||||||||||
| US Multi-Factor Minimum Volatility ETF | 40,517,207 | 40,745,671 | 46,304,374 | 62,382,652 | |||||||||||||||
| US 500 Enhanced Volatility Wtd ETF | 113,919,981 | 112,603,143 | 161,099,966 | 116,643,120 | |||||||||||||||
| US EQ Income Enhanced Volatility Wtd ETF | 191,654,235 | 192,996,774 | 378,952,400 | 263,128,985 | |||||||||||||||
| US Discovery Enhanced Volatility Wtd ETF | 17,404,388 | 17,434,599 | 17,812,001 | 14,789,511 | |||||||||||||||
| Developed Enhanced Volatility Wtd ETF | 7,360,541 | 7,723,132 | — | 1,682,156 | |||||||||||||||
Nasdaq Next 50 ETF | 79,659,468 | 79,510,932 | 33,696,998 | 27,735,567 | |||||||||||||||
ESG Core Plus Bond ETF | 147,072,902 | 6,037,702 | — | — | |||||||||||||||
ESG Corporate Bond ETF | 104,885,760 | 847,676 | — | — | |||||||||||||||
| THB Mid Cap ESG ETF | 294,319 | 261,273 | 2,333,480 | — | |||||||||||||||
U.S. Government Securities | |||||||||||
Purchases | Sales | ||||||||||
ESG Core Plus Bond ETF | $ | 66,408,115 | $ | 13,758,768 | |||||||
4. Fees and Transactions with Affiliates and Related Parties:
Investment Advisory Fees:
Investment advisory services are provided to the Fund by the Adviser, which is a New York corporation registered as an investment adviser with the SEC. The Adviser is an indirect wholly owned subsidiary of Victory Capital Holdings, Inc., a publicly traded Delaware corporation, and a wholly owned direct subsidiary of Victory Capital Operating, LLC.
Under the terms of the Investment Advisory Agreement, the Adviser is entitled to receive fees based on a percentage of the average daily net assets of each Fund. The rates at which the Adviser is paid by each Fund are included in the table below.
Flat Rate | |||||||
US 500 Volatility Wtd ETF | 0.30 | % | |||||
US Small Cap Volatility Wtd ETF | 0.30 | % | |||||
International Volatility Wtd ETF | 0.40 | % | |||||
US Large Cap High Div Volatility Wtd ETF | 0.30 | % | |||||
US Small Cap High Div Volatility Wtd ETF | 0.30 | % | |||||
International High Div Volatility Wtd ETF | 0.40 | % | |||||
US 500 Enhanced Volatility Wtd ETF | 0.30 | % | |||||
US EQ Income Enhanced Volatility Wtd ETF | 0.30 | % | |||||
US Discovery Enhanced Volatility Wtd ETF | 0.30 | % | |||||
Developed Enhanced Volatility Wtd ETF | 0.40 | % | |||||
Emerging Market High Div Volatility Wtd ETF | 0.45 | % | |||||
US Multi-Factor Minimum Volatility ETF | 0.30 | % | |||||
Dividend Accelerator ETF | 0.30 | % | |||||
Nasdaq Next 50 ETF | 0.15 | % | |||||
ESG Core Plus Bond ETF | 0.35 | % | |||||
ESG Corporate Bond ETF | 0.35 | % | |||||
| THB Mid Cap ESG ETF | 0.50 | % | |||||
Amounts incurred and paid to VCM for the six months ended December 31, 2021, are reflected on the Statements of Operations as Investment advisory fees.
199
Victory Portfolios II | Notes to Financial Statements — continued December 31, 2021 | ||||||
(Unaudited)
Administration and Servicing Fees:
VCM also serves as the Funds' administrator and fund accountant. Under the Administration and Fund Accounting Agreement, VCM is entitled to receive fees based on a percentage of the average daily net assets of the Trust, Victory Variable Insurance Funds and Victory Portfolios. The tiered rates at which VCM is paid by the Funds are shown in the table below:
Net Assets | |||||||||||
Up to $15 billion | $15 billion – $30 billion | Over $30 billion | |||||||||
0.08 | %, plus | 0.05 | %, plus | 0.04 | % | ||||||
Amounts incurred for the six months ended December 31, 2021, are reflected on the Statements of Operations as Administration fees.
Citi Fund Services Ohio, Inc. ("Citi"), an affiliate of Citibank, acts as sub-administrator and sub-fund accountant to the Funds pursuant to the Sub-Administration and Sub-Fund Accounting Services Agreement between VCM and Citi. VCM pays Citi a fee for providing these services. The Trust reimburses VCM and Citi for out-of-pocket expenses incurred in providing these services and certain other expenses specifically allocated to the Funds. Amounts incurred for the six months ended December 31, 2021, are reflected on the Statements of Operations as Sub-Administration fees.
The Funds (as part of the Trust) have entered into an agreement with the Adviser to provide compliance services, pursuant to which the Adviser furnishes its compliance personnel, including the services of the Chief Compliance Officer ("CCO"), and other resources reasonably necessary to provide the Trust with compliance oversight services related to the design, administration, and oversight of a compliance program for the Trust in accordance with Rule 38a-1 under the 1940 Act. The CCO is an employee of the Adviser, which pays the compensation of the CCO and support staff. The funds in the Trust, Victory Variable Insurance Funds, Victory Portfolios, and USAA Mutual Funds (collectively, the "Victory Funds Complex") in the aggregate, compensate the Adviser for these services. Amounts incurred for the six months ended December 31, 2021, are reflected on the Statements of Operations as Compliance fees.
Transfer Agency Fees:
Citibank serves as the Funds' Transfer Agent. Amounts incurred for the six months ended December 31, 2021, are reflected on the Statements of Operations as Transfer agent fees.
Distributor/Underwriting Services:
Foreside Fund Services, LLC ("Foreside") serves as the Funds' distributor.
Other Fees:
Citibank serves as the Funds' custodian. The Funds pay Citibank a fee for providing these services. Amounts incurred for the six months ended December 31, 2021, are reflected on the Statements of Operations as Custodian fees.
Sidley Austin LLP provides legal services to the Trust.
The Adviser has entered into expense limitation agreements with the Funds. Under the terms of the agreements, the Adviser has agreed to waive fees or reimburse certain expenses to the extent that ordinary operating expenses incurred by certain Funds in any fiscal year exceed the expense limit for such Fund. Such excess amounts will be the liability of the Adviser. Acquired fund fees and expenses, interest, taxes, brokerage commissions, other expenditures which are capitalized in accordance with GAAP, and other extraordinary expenses not incurred in the ordinary course of a Fund's business are excluded from the expense limits. As of December 31, 2021, the expense limits (excluding voluntary waivers) are as follows:
| In Effect Until October 31, 2022 | |||||||
US 500 Volatility Wtd ETF | 0.35 | % | |||||
US Small Cap Volatility Wtd ETF | 0.35 | % | |||||
International Volatility Wtd ETF | 0.45 | % | |||||
200
Victory Portfolios II | Notes to Financial Statements — continued December 31, 2021 | ||||||
(Unaudited)
| In Effect Until October 31, 2022 | |||||||
US Large Cap High Div Volatility Wtd ETF | 0.35 | % | |||||
US Small Cap High Div Volatility Wtd ETF | 0.35 | % | |||||
International High Div Volatility Wtd ETF | 0.45 | % | |||||
Emerging Market High Div Volatility Wtd ETF | 0.50 | % | |||||
Dividend Accelerator ETF | 0.35 | % | |||||
US Multi-Factor Minimum Volatility ETF | 0.35 | % | |||||
US 500 Enhanced Volatility Wtd ETF | 0.35 | % | |||||
US EQ Income Enhanced Volatility Wtd ETF | 0.35 | % | |||||
US Discovery Enhanced Volatility Wtd ETF | 0.35 | % | |||||
Developed Enhanced Volatility Wtd ETF | 0.45 | % | |||||
Nasdaq Next 50 ETF | 0.18 | % | |||||
ESG Core Plus Bond ETF | 0.40 | %(a) | |||||
ESG Corporate Bond ETF | 0.40 | %(a) | |||||
| THB Mid Cap ESG ETF | 0.55 | %(a) | |||||
(a) In effect from October 5, 2021, until at least October 31, 2022.
Under the terms of the expense limitation agreements, as amended May 1, 2021, the Funds have agreed to repay fees and expenses that were waived or reimbursed by the Adviser for a period of up to three years (thirty-six (36) months) after the waiver or reimbursement took place, subject to the lesser of any operating expense limits in effect at the time of: (a) the original waiver or expense reimbursement; or (b) the recoupment, after giving effect to the recoupment amount. Prior to May 1, 2021, the Funds were permitted to recoup fees waived and expenses reimbursed for up to three years after the fiscal year in which the waiver or reimbursement took place, subject to the limitations above. This change did not have any effect on the amounts previously reported for recoupment.
As of December 31, 2021, the following amounts are available to be repaid to the Adviser. The Funds have not recorded any amounts available to be repaid as a liability due to an assessment that repayments are not probable at December 31, 2021.
| Expires 2022 | Expires 2023 | Expires 2024 | Expires 2025 | Total | |||||||||||||||||||
US 500 Volatility Wtd ETF | $ | 106,033 | $ | 99,179 | $ | 66,415 | $ | 10,945 | $ | 282,572 | |||||||||||||
US Small Cap Volatility Wtd ETF | 16,234 | 39,631 | 35,421 | 21,721 | 113,007 | ||||||||||||||||||
International Volatility Wtd ETF | 37,758 | 121,119 | 150,668 | 73,613 | 383,158 | ||||||||||||||||||
| US Large Cap High Div Volatility Wtd ETF | 60,123 | 64,858 | 47,070 | 18,831 | 190,882 | ||||||||||||||||||
| US Small Cap High Div Volatility Wtd ETF | 21,762 | 45,375 | 47,951 | 14,982 | 130,070 | ||||||||||||||||||
| International High Div Volatility Wtd ETF | 24,799 | 63,200 | 65,624 | 33,055 | 186,678 | ||||||||||||||||||
| Emerging Market High Div Volatility Wtd ETF | 49,451 | 117,270 | 130,204 | 89,997 | 386,922 | ||||||||||||||||||
Dividend Accelerator ETF | 13,393 | 51,403 | 46,360 | 12,004 | 123,160 | ||||||||||||||||||
| US Multi-Factor Minimum Volatility ETF | 20,209 | 47,372 | 40,209 | 18,823 | 126,613 | ||||||||||||||||||
US 500 Enhanced Volatility Wtd ETF | 111,204 | 90,547 | 77,028 | — | 278,779 | ||||||||||||||||||
| US EQ Income Enhanced Volatility Wtd ETF | 95,646 | 75,542 | 89,656 | — | 260,844 | ||||||||||||||||||
| US Discovery Enhanced Volatility Wtd ETF | 28,011 | 45,253 | 38,554 | 21,149 | 132,967 | ||||||||||||||||||
| Developed Enhanced Volatility Wtd ETF | 60,509 | 132,700 | 172,550 | 85,831 | 451,590 | ||||||||||||||||||
Nasdaq Next 50 ETF | — | — | 74,147 | 63,308 | 137,455 | ||||||||||||||||||
201
Victory Portfolios II | Notes to Financial Statements — continued December 31, 2021 | ||||||
(Unaudited)
| Expires 2022 | Expires 2023 | Expires 2024 | Expires 2025 | Total | |||||||||||||||||||
ESG Core Plus Bond ETF | $ | — | $ | — | $ | — | $ | 8,405 | $ | 8,405 | |||||||||||||
ESG Corporate Bond ETF | — | — | — | 12,843 | 12,843 | ||||||||||||||||||
| THB Mid Cap ESG ETF | — | — | — | 10,375 | 10,375 | ||||||||||||||||||
The Adviser may voluntarily waive or reimburse additional fees to assist the Funds in maintaining competitive expense ratios. Voluntary waivers and reimbursements applicable to the Funds are not available to be recouped at a future time and are reflected on the Statements of Operations as Expenses waived/reimbursed by Adviser. For the six months ended December 31, 2021, the Adviser voluntarily waived the following amounts:
US 500 Volatility Wtd ETF | $ | 112,328 | |||||
US Small Cap Volatility Wtd ETF | 4,244 | ||||||
International Volatility Wtd ETF | 18,742 | ||||||
US Large Cap High Div Volatility Wtd ETF | 36,214 | ||||||
US Small Cap High Div Volatility Wtd ETF | 39,496 | ||||||
International High Div Volatility Wtd ETF | 3,278 | ||||||
Emerging Market High Div Volatility Wtd ETF | 2,826 | ||||||
Dividend Accelerator ETF | 54,775 | ||||||
US Multi-Factor Minimum Volatility ETF | 27,135 | ||||||
US 500 Enhanced Volatility Wtd ETF | 160,191 | ||||||
US EQ Income Enhanced Volatility Wtd ETF | 157,183 | ||||||
US Discovery Enhanced Volatility Wtd ETF | 10,777 | ||||||
Developed Enhanced Volatility Wtd ETF | 6,641 | ||||||
Nasdaq Next 50 ETF | 24,066 | ||||||
ESG Core Plus Bond ETF | 11,910 | ||||||
ESG Corporate Bond ETF | 7,930 | ||||||
| THB Mid Cap ESG ETF | 197 | ||||||
Certain officers and/or interested trustees of the Funds are also officers and/or employees of the Adviser, administrator, fund accountant, sub-administrator, sub-fund accountant, custodian, legal counsel, and distributor.
5. Risks:
The Funds may be subject to other risks in addition to these identified risks.
Equity Risk — An investment in the Funds' shares represents an indirect investment in the securities owned by the Funds, some of which will be traded on a national securities exchange or in the over-the-counter markets. The value of the securities in which the Funds invest, like other market investments, may move up or down, sometimes rapidly and unpredictably. The value of the securities in which the Funds invest may affect the value of the Funds' shares. An investment in the Funds' shares at any point in time may be worth less than the original investment, even after taking into account the reinvestment of the Funds' distributions.
Foreign Securities Risk — The Developed Enhanced Volatility Wtd ETF, International Volatility Wtd ETF, International High Div Volatility Wtd ETF and Emerging Market High Div Volatility Wtd ETF invest in securities of foreign issuers in various countries. Investing on an international basis involves certain risks not involved in domestic investments including the risk of nationalization or expropriation of assets, imposition of currency exchange controls or restrictions on the repatriation of foreign currency, confiscatory taxation, political or financial instability and diplomatic developments, which could affect the value of a Fund's investments in certain foreign countries. Governments of many countries have exercised, and continue to exercise, substantial influence over many aspects of the private sector through the ownership or control of many companies, including some of the largest in these countries. As a result, government actions in the future could have a significant effect on economic conditions which may adversely affect prices of certain portfolio securities. There is also generally less government
202
Victory Portfolios II | Notes to Financial Statements — continued December 31, 2021 | ||||||
(Unaudited)
supervision and regulation of stock exchanges, brokers and listed companies than in the U.S. Dividends or interest on, or proceeds from the sale of, foreign securities may be subject to foreign withholding taxes, and special U.S. tax considerations may apply. Moreover, foreign economies may differ favorably or unfavorably from the U.S. economy in such respects as growth of gross national product, rate of inflation, capital reinvestment, resource self-sufficiency and balance of payments position. The Schedule of Portfolio Investments includes information on each Fund's holdings, including industry and/or geographic composition, as relevant.
Passive Investment Risk — Each Fund is designed to track its index and is not actively managed. A Fund will not buy or sell shares of an equity security due to current or projected performance of a security, industry or sector, unless that security is added to or removed, respectively, from its index. A Fund does not, therefore, seek returns in excess of its index, and does not attempt to take defensive positions or hedge against potential risks unless such defensive positions are also taken by its index. Different types of investment styles, for example passively managed or actively managed, or growth or value, tend to perform differently and shift into and out of favor with investors depending on changes in market and economic sentiment and conditions. As a result, a Fund's performance may at times be worse than the performance of other mutual funds that invest more broadly or that have different investment styles.
LIBOR Discontinuation Risk — The London Interbank Offered Rate ("LIBOR") discontinuation may adversely affect the financial markets generally and the Funds' operations, finances and investments specifically. LIBOR has been the principal floating-rate benchmark in the financial markets, and a large portion of the Funds' assets are tied to LIBOR. However, LIBOR has been or will be discontinued as a floating rate benchmark. The date of discontinuation depends on the LIBOR currency and tenor. With limited exceptions, no new LIBOR obligations will be entered into after December 31, 2021. Existing LIBOR obligations have transitioned or will transition to another benchmark, depending on the LIBOR currency and tenor. For some existing LIBOR-based obligations, the contractual consequences of the discontinuation of LIBOR may not be clear.
Non-LIBOR floating-rate obligations, including Secured Overnight Financing Rate ("SOFR")-based obligations, may have returns and values that fluctuate more than those of floating-rate debt obligations that are based on LIBOR or other rates. Also, because SOFR and some alternative floating rates are relatively new market indexes, markets for certain non-LIBOR obligations may never develop or may not be liquid. Market terms for non-LIBOR floating rate obligations, such as the spread over the index reflected in interest-rate provisions, may evolve over time, and prices of non-LIBOR floating rate obligations may be different depending on when they are issued and changing views about correct spread levels.
Various SOFR-based rates, including SOFR-based term rates, and various non-SOFR-based rates are expected to develop in response to the discontinuation of U.S. dollar LIBOR, which may create various risks for the Funds and the financial markets more generally. There are non-LIBOR forward-looking floating rates that are not based on SOFR and that may be considered by participants in the financial markets as LIBOR alternatives. Such rates include Ameribor (American Interbank Offered Rate), BSBY (Bloomberg Short-Term Bank Yield Index) and BYI (Bank Yield Index). Unlike forward-looking SOFR-based term rates, such rates are intended to reflect a bank credit spread component.
It is not clear how replacement rates for LIBOR — including SOFR-based rates and non-SOFR-based rates — will develop and to what extent they will be used. There is no assurance that these replacement rates will be suitable substitutes for LIBOR, and thus the substitution of such rates for LIBOR could have an adverse effect on the Funds and the financial markets more generally. Concerns about market depth and stability could affect the development of non-SOFR-based term rates, and such rates may create various risks, which may or may not be similar to the risks relating to SOFR.
203
Victory Portfolios II | Notes to Financial Statements — continued December 31, 2021 | ||||||
(Unaudited)
6. Borrowing and Interfund Lending:
Line of Credit:
The Victory Funds Complex participates in a short-term demand note "Line of Credit" agreement with Citibank. The Line of Credit agreement with Citibank was renewed on June 28, 2021, with a termination date of June 27, 2022. Under the agreement with Citibank, the Victory Funds Complex may borrow up to $600 million, of which $300 million is committed and $300 million is uncommitted. $40 million of the Line of Credit is reserved for use by the Victory Floating Rate Fund, another series of the Victory Funds Complex, with Victory Floating Rate Fund paying the related commitment fees for that amount. The purpose of the Line of Credit is to meet temporary or emergency cash needs. For the six months ended December 31, 2021, Citibank received an annual commitment fee of 0.15% on $300 million for providing the Line of Credit. Each fund in the Victory Funds Complex pays a pro-rata portion of the commitment fees plus any interest (one-month LIBOR plus one percent, with LIBOR to be replaced by a different benchmark rate in accordance with the terms of the agreement) on amounts borrowed. Prior to June 28, 2021, the Victory Funds Complex paid an annual commitment fee of 0.15% and an upfront fee of 0.10%. Each fund in the Victory Funds Complex paid a pro-rata portion of the upfront fee. Interest charged to each fund during the period, if applicable, is reflected on the Statements of Operations under Line of credit fees.
The Funds had no borrowings under the Line of Credit agreement during the six months ended December 31, 2021.
7. Federal Income Tax Information:
Dividends from net investment income, if any, are declared and paid as noted in the table below. Distributable net realized gains, if any, are declared and distributed at least annually from each Fund.
Declared | Paid | ||||||||||
US 500 Volatility Wtd ETF | Monthly | Monthly | |||||||||
US Small Cap Volatility Wtd ETF | Monthly | Monthly | |||||||||
International Volatility Wtd ETF | Monthly | Monthly | |||||||||
US Large Cap High Div Volatility Wtd ETF | Monthly | Monthly | |||||||||
US Small Cap High Div Volatility Wtd ETF | Monthly | Monthly | |||||||||
International High Div Volatility Wtd ETF | Monthly | Monthly | |||||||||
Emerging Market High Div Volatility Wtd ETF | Monthly | Monthly | |||||||||
Dividend Accelerator ETF | Monthly | Monthly | |||||||||
US Multi-Factor Minimum Volatility ETF | Monthly | Monthly | |||||||||
US 500 Enhanced Volatility Wtd ETF | Monthly | Monthly | |||||||||
US EQ Income Enhanced Volatility Wtd ETF | Monthly | Monthly | |||||||||
US Discovery Enhanced Volatility Wtd ETF | Monthly | Monthly | |||||||||
Developed Enhanced Volatility Wtd ETF | Monthly | Monthly | |||||||||
Nasdaq Next 50 ETF | Monthly | Monthly | |||||||||
ESG Core Plus Bond ETF | Monthly | Monthly | |||||||||
ESG Corporate Bond ETF | Monthly | Monthly | |||||||||
| THB Mid Cap ESG ETF | Monthly | Monthly | |||||||||
The tax character of current year distributions paid and the tax basis of the current components of accumulated earnings (deficit) will be determined at the end of the current tax year ending June 30, 2022.
204
Victory Portfolios II | Notes to Financial Statements — continued December 31, 2021 | ||||||
(Unaudited)
As of June 30, 2021, the Funds had net capital loss carryforwards as shown in the table below. It is unlikely that the Board will authorize a distribution of capital gains realized in the future until the capital loss carryforwards have been used.
Short-Term | Long-Term | Total | |||||||||||||
US 500 Volatility Wtd ETF | $ | 32,961,455 | $ | 40,015,382 | $ | 72,976,837 | |||||||||
US Small Cap Volatility Wtd ETF | 4,331,731 | 4,000,814 | 8,332,545 | ||||||||||||
International Volatility Wtd ETF | 2,133,118 | 3,628,271 | 5,761,389 | ||||||||||||
US Large Cap High Div Volatility Wtd ETF | 24,533,271 | 24,047,315 | 48,580,586 | ||||||||||||
US Small Cap High Div Volatility Wtd ETF | 17,059,791 | 7,314,557 | 24,374,348 | ||||||||||||
International High Div Volatility Wtd ETF | 6,491,232 | 7,844,520 | 14,335,752 | ||||||||||||
Emerging Market High Div Volatility Wtd ETF | 1,878,803 | 3,502,728 | 5,381,531 | ||||||||||||
Dividend Accelerator ETF | 6,483,950 | 582,487 | 7,066,437 | ||||||||||||
US Multi-Factor Minimum Volatility ETF | 9,291,562 | 1,066,391 | 10,357,953 | ||||||||||||
US 500 Enhanced Volatility Wtd ETF | 37,473,355 | 21,460,892 | 58,934,247 | ||||||||||||
US EQ Income Enhanced Volatility Wtd ETF | 23,545,385 | 38,371,169 | 61,916,554 | ||||||||||||
US Discovery Enhanced Volatility Wtd ETF | 28,850,722 | 3,486,082 | 32,336,804 | ||||||||||||
Developed Enhanced Volatility Wtd ETF | 15,822,824 | 10,448,580 | 26,271,404 | ||||||||||||
Nasdaq Next 50 ETF | 7,214,867 | — | 7,214,867 | ||||||||||||
8. Affiliated Securities:
An affiliated security is a security in which a Fund has ownership of at least 5% of the security's outstanding voting shares, an investment company managed by VCM, or an issuer under common control with a Fund or VCM. The Funds do not invest in affiliated securities for the purpose of exercising management or control. These securities are noted as affiliated on a Fund's Schedule of Portfolio Investments.
Section 12(d)(3) of the 1940 Act, and Rule 12d3-1(c) under the 1940 Act, generally prohibit a fund from purchasing the securities issued by, among other entities, a fund's investment adviser. When a fund's investment objective is to track the performance of an unaffiliated index by investing in the stocks that comprise that index, the staff of the SEC has taken the position that, subject to certain conditions, the fund may establish and maintain a position in the common stock of an affiliate of the fund's investment adviser in an amount approximately in proportion to the percentage that the stock is represented in the index. In seeking to provide investment results that closely correspond to its respective unaffiliated index, one or more Funds may hold the securities of Victory Capital Holdings, Inc., the parent company of VCM and other Fund service providers.
Transactions in affiliated securities during the six months ended December 31, 2021, were as follows:
| US Small Cap Volatility Wtd ETF | Fair Value 6/30/2021 | Purchases at Cost | Proceeds from Sales | Realized Gains (Losses) | Capital Gain Distribution | Net Change in Unrealized Appreciation/ Depreciation | Fair Value 12/31/21 | Dividend Income | |||||||||||||||||||||||||||
| Victory Capital Holdings Inc. | $ | 74,558 | $ | 21,478 | $ | (43,647 | ) | $ | 22,352 | $ | — | $ | (13,005 | ) | $ | 61,736 | $ | 639 | |||||||||||||||||
| US Discovery Enhanced Volatility Wtd ETF | Fair Value 6/30/2021 | Purchases at Cost | Proceeds from Sales | Realized Gains (Losses) | Capital Gain Distribution | Net Change in Unrealized Appreciation/ Depreciation | Fair Value 12/31/21 | Dividend Income | |||||||||||||||||||||||||||
| Victory Capital Holdings Inc. | $ | 182,471 | $ | 58,684 | $ | (106,765 | ) | $ | 32,611 | $ | — | $ | (8,717 | ) | $ | 158,284 | $ | 1,637 | |||||||||||||||||
205
Victory Portfolios II | Supplemental Information December 31, 2021 | ||||||
(Unaudited)
Proxy Voting and Portfolio Holdings Information
Proxy Voting:
Information regarding the policies and procedures each Fund uses to determine how to vote proxies relating to portfolio securities is available without charge, upon request, by calling 800-539-3863. The information is also included in the Funds' Statement of Additional Information, which is available on the SEC's website at www.sec.gov.
Information relating to how the Funds voted proxies relating to portfolio securities held during the most recent 12 months ended June 30 is available on the SEC's website at www.sec.gov.
Availability of Schedules of Portfolio Investments:
The Trust files a complete list of Schedules of Portfolio Investments with the SEC for the first and third quarter of each fiscal year on Form N-PORT. Forms N-PORT are available on the SEC's website at www.sec.gov.
Expense Examples
As a shareholder of the Fund, you may incur two types of costs: (1) transaction costs, and (2) ongoing costs, including management fees and other Fund expenses. These examples are intended to help you understand your ongoing costs (in dollars) of investing in the Fund and to compare these costs with the ongoing costs of investing in other mutual funds.
These examples are based on an investment of $1,000 invested at the beginning of the period and held for the entire period from July 1, 2021, through December 31, 2021.
The Actual Expense figures in the table below provide information about actual account values and actual expenses. You may use the information below, together with the amount you invested, to estimate the expenses that you paid over the period. Simply divide your account value by $1,000 (for example, an $8,600 account value divided by $1,000 = 8.6), then multiply the result by the number in the table under the heading entitled "Actual Expenses Paid During Period" to estimate the expenses you paid on your account during this period.
The Hypothetical Expense figures in the table below provide information about hypothetical account values and hypothetical expenses based on the Fund's actual expense ratio and an assumed rate of return of 5% per year before expenses, which is not the Fund's actual return. The hypothetical account values and expenses may not be used to estimate the actual ending account balance or expenses you paid for the period. You may use this information to compare this 5% hypothetical example with the 5% hypothetical examples that appear in shareholder reports of other funds.
Please note the expenses shown in the table below are meant to highlight your ongoing costs only and do not reflect any transactional costs. Therefore, the hypothetical expenses in the table are useful in comparing ongoing costs only and will not help you determine the relative total costs of owning different funds. In addition, if these transactional costs were included, your costs would have been higher.
| Beginning Account Value 7/1/21 | Actual Ending Account Value 12/31/21 | Hypothetical Ending Account Value 12/31/21 | Actual Expenses Paid During Period 7/1/21- 12/31/21* | Hypothetical Expenses Paid During Period 7/1/21- 12/31/21* | Annualized Expense Ratio During Period 7/1/21- 12/31/21 | ||||||||||||||||||||||
US 500 Volatility Wtd ETF | $ | 1,000.00 | $ | 1,097.90 | $ | 1,023.44 | $ | 1.85 | $ | 1.79 | 0.35 | % | |||||||||||||||
| US Small Cap Volatility Wtd ETF | 1,000.00 | 1,070.00 | 1,023.44 | 1.83 | 1.79 | 0.35 | % | ||||||||||||||||||||
| International Volatility Wtd ETF | 1,000.00 | 1,026.00 | 1,022.94 | 2.30 | 2.29 | 0.45 | % | ||||||||||||||||||||
| US Large Cap High Div Volatility Wtd ETF | 1,000.00 | 1,096.30 | 1,023.44 | 1.85 | 1.79 | 0.35 | % | ||||||||||||||||||||
206
Victory Portfolios II | Supplemental Information — continued December 31, 2021 | ||||||
(Unaudited)
| Beginning Account Value 7/1/21 | Actual Ending Account Value 12/31/21 | Hypothetical Ending Account Value 12/31/21 | Actual Expenses Paid During Period 7/1/21- 12/31/21* | Hypothetical Expenses Paid During Period 7/1/21- 12/31/21* | Annualized Expense Ratio During Period 7/1/21- 12/31/21 | ||||||||||||||||||||||
| US Small Cap High Div Volatility Wtd ETF | $ | 1,000.00 | $ | 1,044.00 | $ | 1,023.44 | $ | 1.80 | $ | 1.79 | 0.35 | % | |||||||||||||||
| International High Div Volatility Wtd ETF | 1,000.00 | 1,021.80 | 1,022.94 | 2.29 | 2.29 | 0.45 | % | ||||||||||||||||||||
| Emerging Market High Div Volatility Wtd ETF | 1,000.00 | 997.20 | 1,022.63 | 2.57 | 2.60 | 0.51 | % | ||||||||||||||||||||
Dividend Accelerator ETF | 1,000.00 | 1,088.80 | 1,023.44 | 1.84 | 1.79 | 0.35 | % | ||||||||||||||||||||
| US Multi-Factor Minimum Volatility ETF | 1,000.00 | 1,111.70 | 1,023.44 | 1.86 | 1.79 | 0.35 | % | ||||||||||||||||||||
| US 500 Enhanced Volatility Wtd ETF | 1,000.00 | 1,097.90 | 1,023.44 | 1.85 | 1.79 | 0.35 | % | ||||||||||||||||||||
| US EQ Income Enhanced Volatility Wtd ETF | 1,000.00 | 1,096.30 | 1,023.44 | 1.85 | 1.79 | 0.35 | % | ||||||||||||||||||||
| US Discovery Enhanced Volatility Wtd ETF | 1,000.00 | 1,070.40 | 1,023.44 | 1.83 | 1.79 | 0.35 | % | ||||||||||||||||||||
| Developed Enhanced Volatility Wtd ETF | 1,000.00 | 1,025.40 | 1,022.94 | 2.30 | 2.29 | 0.45 | % | ||||||||||||||||||||
Nasdaq Next 50 ETF | 1,000.00 | 995.80 | 1,024.30 | 0.91 | 0.92 | 0.18 | % | ||||||||||||||||||||
ESG Core Plus Bond ETF** | 1,000.00 | 998.50 | 1,023.19 | 0.96 | 2.04 | 0.40 | % | ||||||||||||||||||||
ESG Corporate Bond ETF** | 1,000.00 | 997.50 | 1,023.19 | 0.96 | 2.04 | 0.40 | % | ||||||||||||||||||||
| THB Mid Cap ESG ETF** | 1,000.00 | 1,148.60 | 1,022.43 | 1.42 | 2.80 | 0.55 | % | ||||||||||||||||||||
* Expenses are equal to the average account value multiplied by the Fund's annualized expense ratio multiplied by 184/365 (the number of days in the most recent fiscal half-year divided by the number of days in the fiscal year).
** Actual Expenses Paid are equal to the average account value multiplied by the Fund's annualized expense ratio multiplied by 88/365 to reflect the stub period from commencement of operations October 5, 2021, through December 31, 2021.
207
Victory Portfolios II | Supplemental Information — continued December 31, 2021 | ||||||
(Unaudited)
Considerations of the Board in Continuing the Investment Advisory Agreement (the "Agreement")
The Board approved the Agreement on behalf of each of the Funds at a meeting, which was called for that purpose, on November 30, 2021. The Board also considered information relating to the Funds and the Agreement provided throughout the year and, more specifically, at the meetings on October 19, 2021, and November 30, 2021. In considering whether to approve the Agreement, the Board requested, and the Adviser provided, information that the Board believed to be reasonably necessary to reach its conclusions.
The Board, including the Independent Trustees, evaluated this information along with other information obtained throughout the year and was advised by legal counsel to the Funds and independent legal counsel to the Independent Trustees. In addition, the Independent Trustees considered a past review of their overall process for conducting the annual review of the Funds' advisory arrangements by a consultant retained through their counsel.
The Board took into consideration regular reports from the Adviser throughout the COVID-19 pandemic public health crisis concerning how the ongoing pandemic has affected market volatility, investment risk, liquidity and valuation of portfolio securities, and the implementation and effectiveness of business continuity plans. These reports also had confirmed that the pandemic had no material impact on the Adviser's operations.
The Board considered each Fund's advisory fee, expense ratio and investment performance as significant factors in determining whether the Agreement should be continued. In considering whether the compensation paid to the Adviser was fair and reasonable, the Board also evaluated, among other things, the following factors:
• The requirements of the Funds for the services provided by the Adviser;
• The nature, quality and extent of the services provided and expected to be provided;
• The performance of the Funds as compared to comparable funds;
• The fees payable for the services and whether the fee arrangements provided for economies of scale that would benefit Fund shareholders as the Funds grow (acknowledging that economies of scale can be complex to assess and typically are not directly measurable);
• Whether the fee would be sufficient to enable the Adviser to attract and retain experienced personnel and continue to provide quality services to the Funds;
• Fees paid by other clients of the Adviser whose accounts are managed in a similar investment style and any differences in the services provided to the other clients compared to those provided to the Funds;
• Total expenses of each Fund;
• Management's commitment to operating the Funds at competitive expense levels;
• The profitability of the Adviser (as reflected by comparing fees earned against an estimate of the Adviser's costs) with respect to the Adviser's relationship with the Funds;
• Research and other service benefits received by the Adviser obtained through payment of client commissions for securities transactions;
• Other benefits received by the Adviser, and its affiliates, including revenues paid to the Adviser, or its affiliates, by the Funds for administration and fund accounting services, and distribution;
• The capabilities and financial condition of the Adviser;
• Current economic and industry trends; and
• The historical relationship between each Fund and the Adviser.
For Funds with total net expense ratios that ranked within the fourth quartile (most expensive) in relation to their peers as evaluated by a consultant, the Board also considered a memorandum that it requested the Adviser to prepare. The Adviser reviewed additional relevant circumstances, which included, among other things, specialized strategies, small or decreasing assets, or rapid or recent changes in peer expense ratios.
The Board reviewed each Fund's current management fee in the context of the Adviser's profitability with respect to each Fund. The Board retained a consultant to provide comparative information about fees and
208
Victory Portfolios II | Supplemental Information — continued December 31, 2021 | ||||||
(Unaudited)
performance. The Board met with the consultant to review its inputs and methodologies, among other things. The Board compared each Fund's gross management fee and total expense ratio on a net and gross basis with the median gross management fee and median expense ratio of a universe of comparable exchange-traded funds ("ETFs") compiled by the consultant and a peer group of funds with similar investment strategies selected by that consultant from the universe. The Board reviewed the factors and methodology used by the consultant in the selection of each Fund's peer group, including the consultant's selection of a broad universe of funds, the more specific universe of comparable funds, and peer groups of funds with comparable investment strategies and asset levels, among other factors. The Board also reviewed any changes to the consultant's methodology as compared to the prior year, including those resulting from the Adviser's input, if any.
The Board also reviewed the fee of a comparable mutual fund managed by the Adviser that is comparable to the VictoryShares US 500 Enhanced Volatility Wtd ETF and the differences in the services provided to the mutual fund. The Board noted that none of the advisory fee arrangements for the Funds included breakpoints, which would be a structure that results in reduced fees as a fund grows. The Board also considered the Adviser's commitment to limit expenses as discussed in more detail below.
The Board also reviewed the compliance and administrative services provided to the Funds by the Adviser and its affiliates, including the Adviser's oversight of the Funds' day-to-day operations and oversight of Fund accounting, assistance in meeting legal and regulatory requirements, and other services necessary for the operation of the Funds and the Trust.
The Board found that the gross annual management fee paid by each Fund was within the range of management fees paid by each Fund's respective peer group. The Board also found that each Fund's net annual expense ratio was reasonable as compared with each Fund's respective peer group. The Board considered the Adviser's contractual agreement with each Fund to waive its fees and reimburse expenses for a specified period of time, as described in the Fund's prospectus.
The Board reviewed each Fund's performance over one- and three-year periods against the performance of the Fund's selected peer group and benchmark index. The Board noted that each Fund's investment objective is to track an index maintained by an independent third party. The Board recognized that the performance of each Fund is net of expenses, while the performance of each benchmark index reflects gross returns, and as a result, each Fund will generally underperform its benchmark index due to fees and expenses. The Board also considered each Fund's tracking error as a factor in evaluating performance.
The Board reviewed various other specific factors with respect to each Fund, as described below. In their deliberations, the Trustees did not rank the importance of any particular information or factor considered and each Trustee may have attributed different weights to various factors.
VictoryShares US 500 Volatility Wtd ETF
Noting that the Fund commenced operations in 2014, the Board compared the Fund's one-, three- and five-year performance for the periods ended June 30, 2021, to that of the median performance of the Fund's peer group and benchmark index for the same periods and considered the fact that the Fund underperformed the benchmark index for all of the periods reviewed and outperformed the peer group median for all of the periods reviewed. The Board noted the Fund's tracking error for the periods relative to its peers.
Having considered, among other things: (1) the Fund's management fee compared to comparable ETFs; (2) the Fund's total expense ratio compared to comparable ETFs; (3) that the Adviser's willingness to limit the expenses for a period of time would provide stability to the Fund's expenses during that period; and (4) that the Fund's performance in relation to its benchmark index and peer group was within an acceptable range, the Board concluded that the Agreement continued to be in the best interests of the Fund's shareholders.
VictoryShares US Small Cap Volatility Wtd ETF
Noting that the Fund commenced operations in 2015, the Board compared the Fund's one-, three- and five-year performance for the periods ended June 30, 2021, to that of the median performance of the Fund's peer group and benchmark index for the same periods and considered the fact that the Fund underperformed the benchmark index for all of the periods reviewed and outperformed the peer group median for all of the periods reviewed. The Board noted the Fund's tracking error for the periods relative to its peers.
209
Victory Portfolios II | Supplemental Information — continued December 31, 2021 | ||||||
(Unaudited)
Having considered, among other things: (1) the Fund's management fee compared to comparable ETFs; (2) the Fund's total expense ratio compared to comparable ETFs; (3) that the Adviser's willingness to limit the expenses for a period of time would provide stability to the Fund's expenses during that period; and (4) that the Fund's performance in relation to its benchmark index and peer group was within an acceptable range, the Board concluded that the Agreement continued to be in the best interests of the Fund's shareholders.
VictoryShares International Volatility Wtd ETF
Noting that the Fund commenced operations in 2015, the Board compared the Fund's one-, three- and five-year performance for the periods ended June 30, 2021, to that of the median performance of the Fund's peer group and benchmark index for the same periods and considered the fact that the Fund underperformed the benchmark index for all of the periods reviewed, outperformed the peer group median for the one- and five-year periods, and matched the peer group median for the three-year period. The Board noted the Fund's tracking error for the periods relative to its peers.
Having considered, among other things: (1) the Fund's management fee compared to comparable ETFs; (2) the Fund's total expense ratio compared to comparable ETFs; (3) that the Adviser's willingness to limit the expenses for a period of time would provide stability to the Fund's expenses during that period; and (4) that the Fund's performance in relation to its benchmark index and peer group was within an acceptable range, the Board concluded that the Agreement continued to be in the best interests of the Fund's shareholders.
VictoryShares US Large Cap High Div Volatility Wtd ETF
Noting that the Fund commenced operations in 2015, the Board compared the Fund's one-, three- and five-year performance for the periods ended June 30, 2021, to that of the median performance of the Fund's peer group and benchmark index for the same periods and considered the fact that the Fund underperformed both the benchmark index for all of the periods reviewed, outperformed the peer group median for the one-year period and underperformed the peer group median for the three- and five-year periods. The Board noted the Fund's tracking error for the periods relative to its peers.
Having considered, among other things: (1) the Fund's management fee compared to comparable ETFs; (2) the Fund's total expense ratio compared to comparable ETFs; (3) that the Adviser's willingness to limit the expenses for a period of time would provide stability to the Fund's expenses during that period; and (4) that the Fund's performance in relation to its benchmark index and peer group was within an acceptable range, the Board concluded that the Agreement continued to be in the best interests of the Fund's shareholders.
VictoryShares US Small Cap High Div Volatility Wtd ETF
Noting that the Fund commenced operations in 2015, the Board compared the Fund's one-, three- and five-year performance for the periods ended June 30, 2021, to that of the median performance of the Fund's peer group and benchmark index for the same periods and considered the fact that the Fund underperformed the benchmark index for all of the periods reviewed, underperformed the peer group median for the one-year period and outperformed the peer group median for the three- and five-year periods. The Board noted the Fund's tracking error for the periods relative to its peers.
Having considered, among other things: (1) the Fund's management fee compared to comparable ETFs; (2) the Fund's total expense ratio compared to comparable ETFs; (3) that the Adviser's willingness to limit the expenses for a period of time would provide stability to the Fund's expenses during that period; and (4) that the Fund's performance in relation to its benchmark index and peer group was within an acceptable range, the Board concluded that the Agreement continued to be in the best interests of the Fund's shareholders.
VictoryShares International High Div Volatility Wtd ETF
Noting that the Fund commenced operations in 2015, the Board compared the Fund's one-, three- and five-year performance for the periods ended June 30, 2021, to that of the median performance of the Fund's peer group and benchmark index for the same periods and considered the fact that the Fund underperformed the benchmark index for all of the periods reviewed, outperformed the peer group median for the one-year period
210
Victory Portfolios II | Supplemental Information — continued December 31, 2021 | ||||||
(Unaudited)
and underperformed the peer group median for the three- and five-year periods. The Board noted the Fund's tracking error for the periods relative to its peers.
Having considered, among other things: (1) the Fund's management fee compared to comparable ETFs; (2) the Fund's total expense ratio compared to comparable ETFs; (3) that the Adviser's willingness to limit the expenses for a period of time would provide stability to the Fund's expenses during that period; and (4) that the Fund's performance in relation to its benchmark index and peer group was within an acceptable range, the Board concluded that the Agreement continued to be in the best interests of the Fund's shareholders.
VictoryShares Emerging Market High Div Volatility Wtd ETF
Noting that the Fund commenced operations in 2017, the Board compared the Fund's one- and three-year performance for the periods ended June 30, 2021, to that of the median performance of the Fund's peer group and benchmark index for the same periods and considered the fact that the Fund underperformed both the benchmark index and the peer group median for both of the periods reviewed. The Board noted the Fund's tracking error for the period relative to its peers.
Having considered, among other things: (1) the Fund's management fee compared to comparable ETFs; (2) the Fund's total expense ratio compared to comparable ETFs; (3) that the Adviser's willingness to limit the expenses for a period of time would provide stability to the Fund's expenses during that period; and (4) that the Fund's performance in relation to its benchmark index and peer group was within an acceptable range, the Board concluded that the Agreement continued to be in the best interests of the Fund's shareholders.
VictoryShares Dividend Accelerator ETF
Noting that the Fund commenced operations in 2017, the Board compared the Fund's one- and three-year performance for the periods ended June 30, 2021, to that of the median performance of the Fund's peer group and benchmark index for the same periods and considered the fact that the Fund underperformed the benchmark index for both of the periods reviewed, underperformed the peer group median for the one-year period and outperformed the peer group median for the three-year period. The Board noted the Fund's tracking error for the period relative to its peers.
Having considered, among other things: (1) the Fund's management fee compared to comparable ETFs; (2) the Fund's total expense ratio compared to comparable ETFs; (3) that the Adviser's willingness to limit the expenses for a period of time would provide stability to the Fund's expenses during that period; and (4) that the Fund's performance in relation to its benchmark index and peer group was within an acceptable range, the Board concluded that the Agreement continued to be in the best interests of the Fund's shareholders.
VictoryShares US Multi-Factor Minimum Volatility ETF
Noting that the Fund commenced operations in 2017, the Board compared the Fund's one- and three-year performance for the periods ended June 30, 2021, to that of the median performance of the Fund's peer group and benchmark index for the same periods and considered the fact that the Fund underperformed the benchmark index for both of the periods reviewed, underperformed the peer group median for the one-year period and outperformed the peer group median for the three-year period. The Board noted the Fund's tracking error for the period relative to its peers.
Having considered, among other things: (1) the Fund's management fee compared to comparable ETFs; (2) the Fund's total expense ratio compared to comparable ETFs; (3) that the Adviser's willingness to limit the expenses for a period of time would provide stability to the Fund's expenses during that period; and (4) that the Fund's performance in relation to its benchmark index and peer group was within an acceptable range, the Board concluded that the Agreement continued to be in the best interests of the Fund's shareholders.
VictoryShares US 500 Enhanced Volatility Wtd ETF
Noting that the Fund commenced operations in 2014, the Board compared the Fund's one-, three- and five-year performance for the periods ended June 30, 2021, to that of the median performance of the Fund's peer group and benchmark index for the same periods and considered the fact that the Fund underperformed the benchmark index for all of the periods reviewed, matched the peer group median for the one-year period,
211
Victory Portfolios II | Supplemental Information — continued December 31, 2021 | ||||||
(Unaudited)
underperformed the peer group median for the three-year period and outperformed the peer group median for the five-year period. The Board noted the Fund's tracking error for the periods relative to its peers, and discussed with the Adviser the Fund's rules-based rebalancing in light of market conditions and that the Fund performed in accordance with the Adviser's expectations.
Having considered, among other things: (1) the Fund's management fee compared to comparable ETFs; (2) the Fund's total expense ratio compared to comparable ETFs; (3) that the Adviser's willingness to limit the expenses for a period of time would provide stability to the Fund's expenses during that period; and (4) that the Fund's performance in relation to its benchmark index and peer group was within an acceptable range, the Board concluded that the Agreement continued to be in the best interests of the Fund's shareholders.
VictoryShares US EQ Income Enhanced Volatility Wtd ETF
Noting that the Fund commenced operations in 2014, the Board compared the Fund's one-, three- and five-year performance for the periods ended June 30, 2021, to that of the median performance of the Fund's peer group and benchmark index for the same periods and considered the fact that the Fund underperformed the benchmark index for all of the periods reviewed, and outperformed the peer group median for all of the periods reviewed. The Board noted the Fund's tracking error for the periods relative to its peers, and discussed with the Adviser the Fund's rules-based rebalancing in light of market conditions and that the Fund performed in accordance with the Adviser's expectations.
Having considered, among other things: (1) the Fund's management fee compared to comparable ETFs; (2) the Fund's total expense ratio compared to comparable ETFs; (3) that the Adviser's willingness to limit the expenses for a period of time would provide stability to the Fund's expenses during that period; and (4) that the Fund's performance in relation to its benchmark index and peer group was within an acceptable range, the Board concluded that the Agreement continued to be in the best interests of the Fund's shareholders.
VictoryShares US Discovery Enhanced Volatility Wtd ETF
Noting that the Fund commenced operations in 2014, the Board compared the Fund's one-, three- and five-year performance for the periods ended June 30, 2021, to that of the median performance of the Fund's peer group and benchmark index for the same periods and considered the fact that the Fund underperformed the benchmark index for all of the periods reviewed, and underperformed the peer group median for all of the periods reviewed, with the exception of the five-year period. The Board noted the Fund's tracking error for the periods relative to its peers, and discussed with the Adviser the Fund's rules-based rebalancing in light of market conditions and that the Fund performed in accordance with the Adviser's expectations.
Having considered, among other things: (1) the Fund's management fee compared to comparable ETFs; (2) the Fund's total expense ratio compared to comparable ETFs; (3) that the Adviser's willingness to limit the expenses for a period of time would provide stability to the Fund's expenses during that period; and (4) that the Fund's performance in relation to its benchmark index and peer group was within an acceptable range, the Board concluded that the Agreement continued to be in the best interests of the Fund's shareholders.
VictoryShares Developed Enhanced Volatility Wtd ETF
Noting that the Fund commenced operations in 2014, the Board compared the Fund's one-, three- and five-year performance for the periods ended June 30, 2021, to that of the median performance of the Fund's peer group and benchmark index for the same periods and considered the fact that the Fund underperformed both the benchmark index and the peer group median for all of the periods reviewed. The Board noted the Fund's tracking error for the periods relative to its peers, and discussed with the Adviser the Fund's rules-based rebalancing in light of market conditions and that the Fund performed in accordance with the Adviser's expectations.
Having considered, among other things: (1) the Fund's management fee compared to comparable ETFs; (2) the Fund's total expense ratio compared to comparable ETFs; (3) that the Adviser's willingness to limit the expenses for a period of time would provide stability to the Fund's expenses during that period; and (4) that the Fund's performance in relation to its benchmark index and peer group was within an acceptable range, the Board concluded that the Agreement continued to be in the best interests of the Fund's shareholders.
212
Victory Portfolios II | Supplemental Information — continued December 31, 2021 | ||||||
(Unaudited)
VictoryShares Nasdaq Next 50 ETF
Noting that the Fund commenced operations in 2020, the Board compared the Fund's one-year performance for the period ended September 30, 2021, to that of the median performance of the Fund's peer group and benchmark index for the same period and considered the fact that the Fund underperformed both the benchmark index and the peer group median for the period. The Board noted the Fund's tracking error for the period relative to its peers.
Having considered, among other things: (1) the Fund's management fee compared to comparable ETFs; (2) the Fund's total expense ratio compared to comparable ETFs; (3) that the Adviser's willingness to limit the expenses for a period of time would provide stability to the Fund's expenses during that period; and (4) that the Fund's performance in relation to its benchmark index and peer group was within an acceptable range, the Board concluded that the Agreement continued to be in the best interests of the Fund's shareholders.
Conclusion
Based on its review of the information requested and provided, and following extended discussions, the Board determined that the Agreement, on behalf of the Funds discussed above, was consistent with the best interests of each Fund and its shareholders, and the Board unanimously approved the Agreement, on behalf of each Fund, for an additional annual period on the basis of the foregoing review and discussions and the following considerations, among others:
• The fairness and reasonableness of the investment advisory fee payable to the Adviser under the Agreement in light of the investment advisory services provided, the costs of these services, the profitability of the Adviser's relationship with the Fund and the comparability of the fee paid to the fees paid by other investment companies, to the extent applicable;
• The nature, quality and extent of the investment advisory services provided by the Adviser;
• The Adviser's entrepreneurial commitment to the management of the Funds and the creation of a broad-based family of funds, which could entail a substantial commitment of the Adviser's resources to the successful operation of the Funds;
• The Adviser's representations regarding its staffing and capabilities to manage the Funds, including the retention of personnel with relevant portfolio management experience;
• The Adviser's efforts to enhance investment results by, among other things, developing quality portfolio management teams; and
• The overall high quality of the personnel, operations, financial condition, investment management capabilities, methodologies and performance of the Adviser.
Considerations of the Board in Approving the Investment Advisory Agreements (the "Agreements")
The Board approved the Agreements on behalf of each of the VictoryShares ESG Core Plus Bond ETF, VictoryShares ESG Corporate Bond ETF and VictoryShares THB Mid Cap ESG ETF (the "Funds") at a meeting, which was called for that purpose, on May 18, 2021. In considering whether to approve the Agreements, the Board requested, and the Adviser provided, information that the Board believed to be reasonably necessary to reach its conclusions.
The Board, including the Independent Trustees, evaluated the information provided and its extensive experience with the Adviser and was advised by legal counsel to the Funds and independent legal counsel to the Independent Trustees. The Board reviewed numerous factors with respect to the Funds. The Board recognized that management was proposing to add the Funds as investment portfolios of the Trust and that the Funds had not yet commenced operations and thus had no performance record or historical expenses. In considering whether
213
Victory Portfolios II | Supplemental Information — continued December 31, 2021 | ||||||
(Unaudited)
the compensation to be paid to the Adviser was fair and reasonable, the Board also evaluated, among other things, the following factors:
• The requirements of the Funds for the services to be provided by the Adviser;
• The nature, quality and extent of the services provided to the other exchange-traded funds in the Trust and expected to be provided to the Funds;
• The fees payable for the services and whether the fee arrangements provided for economies of scale that would benefit Fund shareholders as the Funds grow (acknowledging that economies of scale can be complex to assess and typically are not directly measurable);
• Fees paid by other clients of the Adviser whose accounts are managed in a similar investment style and any differences in the services provided to the other clients compared to those provided to the Funds;
• The estimated total expenses of the Funds;
• Management's commitments to operating the Funds at competitive expense levels;
• The expected profitability of the Adviser with respect to the Adviser's relationship with the Funds;
• Research and other service benefits expected to be received by the Adviser obtained through payment of client commissions for securities transactions;
• Other benefits expected to be received by the Adviser, including revenues to be paid to affiliates of the Adviser by the Funds for administration and fund accounting services;
• The capabilities and financial condition of the Adviser;
• Current economic and industry trends; and
• The historical relationship between the Trust and the Adviser.
The Board reviewed the Funds' proposed gross management fee both in the context of the Adviser's expected profitability from the Funds and the historical costs associated with operating similar funds. The Board acknowledged that the Funds' profitability is inherently difficult to estimate in a startup phase. In addition, the Board compared the Funds' expected operating expense ratio, with the understanding that no distribution or shareholder servicing fees were being proposed to be paid at this time, and management fee with comparable exchange-traded funds in a peer group of funds with similar investment strategies. The Board considered the Adviser's commitment to competitive total operating expense ratios through its contractual agreement to waive its fees and reimburse expenses for a specified period of time, noting that this could result in substantial initial subsidies by the Adviser. The Trustees noted that no breakpoints in the advisory fee schedule for the Funds were being proposed at this time.
The Board reviewed various other factors with respect to the Funds. In their deliberations, the Trustees did not rank the importance of any particular information or factor considered and each Trustee attributed different weights to various factors.
Approval of the Agreements on Behalf of the Funds
Based on its review of the information requested and provided, and following extended discussions, the Board determined that the Agreements, on behalf of the Funds, were consistent with the best interests of the Funds and their future shareholders, and the Board unanimously approved the Agreements, on behalf of the Funds, for an initial two year period on the basis of the foregoing review and discussions and the following considerations, among others:
• The fairness and reasonableness of the investment advisory fee to be paid to the Adviser under the Agreements in light of the investment advisory services to be provided, the costs of these services, the expected profitability of the Adviser's relationship with the Funds and the comparability of the fee to be paid to the fees paid by other investment companies;
• The nature, quality and extent of the investment advisory services to be provided by Adviser;
214
Victory Portfolios II | Supplemental Information — continued December 31, 2021 | ||||||
(Unaudited)
• The Adviser's entrepreneurial commitment to the management of the Funds and their inclusion in a broad-based family of funds, which could entail a substantial commitment of the Adviser's resources to the successful operation of the Funds;
• The Adviser's representations regarding its staffing and capabilities to manage the Funds, including the retention of personnel with relevant portfolio management experience;
• The Adviser's efforts to enhance investment results by, among other things, developing quality portfolio management teams; and
• The overall high quality of the personnel, operations, financial condition, investment management capabilities, methodologies and performance of the Adviser.
215
Privacy Policy
Protecting the Privacy of Information
The Trust respects your right to privacy. We also know that you expect us to conduct and process your business in an accurate and efficient manner. To do so, we must collect and maintain certain personal information about you. This is the information we collect from you on applications or other forms, and from the transactions you make with us or third parties. It may include your name, address, social security number, account transactions and balances, and information about investment goals and risk tolerance.
We do not disclose any information about you or about former customers to anyone except as permitted or required by law. Specifically, we may disclose the information we collect to companies that perform services on our behalf, such as the transfer agent that processes shareholder accounts and printers and mailers that assist us in the distribution of investor materials. We may also disclose this information to companies that perform marketing services on our behalf. This allows us to continue to offer you Victory investment products and services that meet your investing needs, and to effect transactions that you request or authorize. These companies will use this information only in connection with the services for which we hired them. They are not permitted to use or share this information for any other purpose.
To protect your personal information internally, we permit access only by authorized employees and maintain physical, electronic, and procedural safeguards to guard your personal information.*
* You may have received communications regarding information about privacy policies from other financial institutions which gave you the opportunity to "opt-out" of certain information sharing with companies which are not affiliated with that financial institution. The Trust does not share information with other companies for purposes of marketing solicitations for products other than the Trust. Therefore, the Trust does not provide opt-out options to their shareholders.
The Victory Funds
P.O. Box 182593
Columbus, Ohio
43218-2593

Visit our website at: | Call Victory at: | ||||||
www.vcm.com | 866-376-7890 | ||||||
VPII-VICTORYSHARESETF-SAR (12/21)

December 31, 2021
Semi Annual Report
VictoryShares USAA Core Short-Term Bond ETF
VictoryShares USAA Core Intermediate-Term Bond ETF
www.vcm.com
News, Information And Education 24 Hours A Day, 7 Days A Week
The Victory Capital website gives fund shareholders, prospective shareholders, and investment professionals a convenient way to access fund information, get guidance, and track fund performance anywhere they can access the Internet. The site includes:
• Detailed performance records
• Daily share prices
• The latest fund news
• Investment resources to help you become a better investor
• A section dedicated to investment professionals
Whether you're a potential investor searching for the fund that matches your investment philosophy, a seasoned investor interested in planning tools, or an investment professional, www.vcm.com has what you seek. Visit us anytime. We're always open.
Victory Portfolios II
TABLE OF CONTENTS
| Investment Objective & Portfolio Holdings (Unaudited) | 2 | ||||||
Schedules of Portfolio Investments | |||||||
VictoryShares USAA Core Short-Term Bond ETF | 4 | ||||||
| VictoryShares USAA Core Intermediate-Term Bond ETF | 19 | ||||||
Financial Statements | |||||||
Statements of Assets and Liabilities | 42 | ||||||
Statements of Operations | 43 | ||||||
Statements of Changes in Net Assets | 44 | ||||||
Financial Highlights | 46 | ||||||
Notes to Financial Statements | 48 | ||||||
Supplemental Information (Unaudited) | 58 | ||||||
Proxy Voting and Portfolio Holdings Information | 58 | ||||||
Expense Examples | 58 | ||||||
Advisory Contract Approval | 59 | ||||||
Privacy Policy (inside back cover) | |||||||
1
| Victory Portfolios II VictoryShares USAA Core Short-Term Bond ETF | December 31, 2021 | ||||||
(Unaudited)
Investment Objective and Portfolio Holdings:
The Fund seeks to provide high current income consistent with preservation of principal.
Asset Allocation*:
December 31, 2021
(% of Net Assets)

* Does not include futures contracts, money market instruments, and short-term investments purchased with cash collateral from securities loaned.
Percentages are of the net assets of the Fund and may not equal 100%.
Refer to the Schedule of Portfolio Investments for a complete list of securities.
2
| Victory Portfolios II VictoryShares USAA Core Intermediate-Term Bond ETF | December 31, 2021 | ||||||
(Unaudited)
Investment Objective and Portfolio Holdings:
The Fund seeks to provide high current income without undue risk to principal.
Asset Allocation*:
December 31, 2021
(% of Net Assets)

* Does not include futures contracts, money market instruments, and short-term investments purchased with cash collateral from securities loaned.
Percentages are of the net assets of the Fund and may not equal 100%.
Refer to the Schedule of Portfolio Investments for a complete list of securities.
3
| Victory Portfolios II VictoryShares USAA Core Short-Term Bond ETF | Schedule of Portfolio Investments December 31, 2021 | ||||||
(Unaudited)
Security Description | Principal Amount | Value | |||||||||
Asset-Backed Securities (16.4%) | |||||||||||
| AmeriCredit Automobile Receivables Trust, Series 2017-3, Class D, 3.18%, 7/18/23, Callable 3/18/22 @ 100 | $ | 500,000 | $ | 502,429 | |||||||
| AmeriCredit Automobile Receivables Trust, Series 2021-2, Class C, 1.01%, 1/19/27, Callable 9/18/24 @ 100 | 1,000,000 | 988,091 | |||||||||
| AmeriCredit Automobile Receivables Trust, Series 2017-4, Class C, 2.60%, 9/18/23, Callable 6/18/22 @ 100 | 143,428 | 143,770 | |||||||||
| Atalaya Equipment Leasing Trust, Series 2021-1A, Class A2, 1.23%, 5/15/26, Callable 9/15/24 @ 100 (a) | 1,250,000 | 1,248,162 | |||||||||
| Bank of The West Auto Trust, Series 2017-1, Class C, 2.96%, 2/15/24, Callable 2/15/22 @ 100 (a) | 500,000 | 501,432 | |||||||||
| Bank of The West Auto Trust, Series 2018-1, Class C, 3.98%, 5/15/24, Callable 5/15/22 @ 100 (a) | 400,000 | 404,867 | |||||||||
| BCC Funding XVII LLC, Series 2020-1, Class B, 1.46%, 9/22/25, Callable 7/20/24 @ 100 (a) | 3,000,000 | 2,995,799 | |||||||||
| Canadian Pacer Auto Receivables Trust, Series 2018-2A, Class B, 3.63%, 1/19/24, Callable 4/19/22 @ 100 (a) | 500,000 | 504,433 | |||||||||
| CarMax Auto Owner Trust, Series 2021-2, Class A3, 0.52%, 2/17/26, Callable 4/15/24 @ 100 | 2,000,000 | 1,990,620 | |||||||||
| CarMax Auto Owner Trust, Series 2020-4, Class A3, 0.50%, 8/15/25, Callable 4/15/24 @ 100 | 1,000,000 | 995,939 | |||||||||
CARS LP, Series 2020-1A, Class A1, 2.69%, 2/15/50, Callable 2/15/23 @ 100 (a) | 586,109 | 593,329 | |||||||||
| Carvana Auto Receivables Trust, Series 2021-N1, Class C, 1.30%, 1/10/28, Callable 7/10/24 @ 100 | 1,500,000 | 1,497,682 | |||||||||
| Carvana Auto Receivables Trust, Series 2021-N1, Class A, 0.70%, 1/10/28, Callable 7/10/24 @ 100 | 870,157 | 863,101 | |||||||||
| Carvana Auto Receivables Trust, Series 2021-N4, Class C, 1.72%, 9/11/28, Callable 12/10/26 @ 100 | 1,000,000 | 999,746 | |||||||||
| CNH Equipment Trust, Series 2018-B, Class B, 3.56%, 2/17/26, Callable 12/15/22 @ 100 | 350,000 | 357,320 | |||||||||
| Conn's Receivables Funding LLC, Series 2021-A, Class B, 2.87%, 5/15/26, Callable 9/15/23 @ 100.25 (a) | 1,000,000 | 996,639 | |||||||||
| Conn's Receivables Funding LLC, Series 2021-A, Class A, 1.05%, 5/15/26, Callable 9/15/23 @ 100 (a) | 1,787,730 | 1,787,227 | |||||||||
| CPS Auto Receivables Trust, Series 2019-C, Class D, 3.17%, 6/16/25, Callable 7/15/23 @ 100 (a) | 1,000,000 | 1,015,219 | |||||||||
| Credit Acceptance Auto Loan Trust, Series 2021-4, Class A, 1.26%, 10/15/30, Callable 4/15/25 @ 100 (a) | 333,000 | 331,129 | |||||||||
| Credit Acceptance Auto Loan Trust, Series 2021-4, Class B, 1.74%, 12/16/30, Callable 4/15/25 @ 100 (a) | 320,000 | 317,377 | |||||||||
| Dell Equipment Finance Trust, Series 2020-2, Class D, 1.92%, 3/23/26, Callable 5/22/23 @ 100 (a) | 1,000,000 | 1,007,518 | |||||||||
| Diamond Issuer, Series 2021-1A, Class B, 2.70%, 11/20/51, Callable 11/20/25 @ 100 (a) | 655,000 | 650,421 | |||||||||
| Drive Auto Receivables Trust, Series 2021-1, Class C, 1.02%, 6/15/27, Callable 10/15/23 @ 100 | 708,000 | 707,181 | |||||||||
| Drive Auto Receivables Trust, Series 2020-2, Class C, 2.28%, 8/17/26, Callable 6/15/23 @ 100 | 750,000 | 759,896 | |||||||||
| Drive Auto Receivables Trust, Series 2021-1, Class B, 0.65%, 7/15/25, Callable 10/15/23 @ 100 | 750,000 | 748,370 | |||||||||
See notes to financial statements.
4
| Victory Portfolios II VictoryShares USAA Core Short-Term Bond ETF | Schedule of Portfolio Investments — continued December 31, 2021 | ||||||
(Unaudited)
Security Description | Principal Amount | Value | |||||||||
Evergreen Credit Card Trust, Series 2019-2, Class B, 2.27%, 9/15/24 (a) | $ | 750,000 | $ | 757,755 | |||||||
| Evergreen Credit Card Trust, Series 2021-1A, Class A, 0.90%, 10/15/26, Callable 11/15/24 @ 100 (a) | 1,500,000 | 1,486,820 | |||||||||
| Exeter Automobile Receivables Trust, Series 2021-4, Class C, 1.68%, 10/15/27, Callable 1/15/25 @ 100 | 1,000,000 | 995,405 | |||||||||
| Exeter Automobile Receivables Trust, Series 2020-3A, Class C, 1.32%, 7/15/25, Callable 4/15/24 @ 100 | 472,000 | 473,639 | |||||||||
| Exeter Automobile Receivables Trust, Series 2021-2A, Class C, 0.98%, 6/15/26, Callable 5/15/24 @ 100 | 1,500,000 | 1,494,572 | |||||||||
FirstKey Homes Trust, Series 2021-SFR3, Class B, 2.44%, 12/17/38 (a) | 1,000,000 | 990,691 | |||||||||
FirstKey Homes Trust, Series 2021-SFR3, Class C, 2.54%, 12/17/38 (a) | 1,000,000 | 988,408 | |||||||||
FirstKey Homes Trust, Series 2021-SFR3, Class A, 2.14%, 12/17/38 (a) | 1,000,000 | 997,532 | |||||||||
| Flagship Credit Auto Trust, Series 4, Class B, 1.49%, 2/15/27, Callable 3/15/26 @ 100 (a) | 1,000,000 | 996,353 | |||||||||
| Flagship Credit Auto Trust, Series 4, Class C, 1.96%, 12/15/27, Callable 3/15/26 @ 100 (a) | 1,000,000 | 996,544 | |||||||||
| Flexential Issuer, Series 2021-1A, Class A2, 3.25%, 11/27/51, Callable 11/25/25 @ 100 (a) | 1,000,000 | 1,001,780 | |||||||||
| Ford Credit Auto Owner Trust, Series 2018-B, Class A3, 3.24%, 4/15/23, Callable 8/15/22 @ 100 | 22,622 | 22,658 | |||||||||
| GLS Auto Receivables Issuer Trust, Series 4A, Class B, 1.53%, 4/15/26, Callable 6/15/26 @ 100 (a) | 500,000 | 500,150 | |||||||||
| GLS Auto Receivables Issuer Trust, Series 4A, Class A, 0.84%, 7/15/25, Callable 6/15/26 @ 100 (a) | 1,000,000 | 999,639 | |||||||||
| GLS Auto Receivables Issuer Trust, Series 2020-2A, Class B, 3.16%, 6/16/25, Callable 1/15/24 @ 100 (a) | 1,250,000 | 1,276,239 | |||||||||
| GM Financial Automobile Leasing Trust, Series 2020-3, Class A4, 0.51%, 10/21/24, Callable 4/20/23 @ 100 | 1,000,000 | 998,217 | |||||||||
| GM Financial Automobile Leasing Trust, Series 2020-1, Class B, 1.84%, 12/20/23, Callable 8/20/22 @ 100 | 489,000 | 492,033 | |||||||||
| GM Financial Consumer Automobile Receivables Trust, Series 2018-3, Class A3, 3.02%, 5/16/23, Callable 6/16/22 @ 100 | 33,908 | 33,976 | |||||||||
| Honda Auto Receivables Owner Trust, Series 2020-3, Class A3, 0.37%, 10/18/24, Callable 11/18/23 @ 100 | 1,000,000 | 996,957 | |||||||||
| Hyundai Auto Receivables Trust, Series 2020-C, Class A3, 0.38%, 5/15/25, Callable 11/15/24 @ 100 | 1,000,000 | 995,436 | |||||||||
| John Deere Owner Trust, Series 2021-B, Class A3, 0.52%, 3/16/26, Callable 4/15/25 @ 100 | 1,500,000 | 1,479,360 | |||||||||
| JPMorgan Chase Bank NA — CACLN, Series 2021-3, Class B, 0.76%, 2/26/29, Callable 1/25/25 @ 100 (a) | 621,680 | 618,480 | |||||||||
| Lad Auto Receivables Trust, Series 2021-1A, Class B, 1.94%, 11/16/26, Callable 9/15/25 @ 100 (a) | 1,000,000 | 997,206 | |||||||||
| LAD Auto Receivables Trust, Series 2021-1A, Class A, 1.30%, 8/17/26, Callable 9/15/25 @ 100 (a) | 908,653 | 906,524 | |||||||||
Master Credit Card Trust, Series 2021-1A, Class C, 1.06%, 11/21/25 (a) | 1,500,000 | 1,477,030 | |||||||||
| Mercedes-Benz Auto Lease Trust, Series 2020-B, Class A3, 0.40%, 11/15/23, Callable 3/15/23 @ 100 | 1,000,000 | 998,737 | |||||||||
| New Economy Assets Phase 1 Sponsor LLC, Series 2021-1, Class B1, 2.41%, 10/20/61, Callable 10/20/24 @ 100 (a) | 293,000 | 293,675 | |||||||||
See notes to financial statements.
5
| Victory Portfolios II VictoryShares USAA Core Short-Term Bond ETF | Schedule of Portfolio Investments — continued December 31, 2021 | ||||||
(Unaudited)
Security Description | Principal Amount | Value | |||||||||
| New Economy Assets Phase 1 Sponsor LLC, Series 2021-1, Class A1, 1.91%, 10/20/61, Callable 10/20/24 @ 100 (a) | $ | 903,000 | $ | 885,402 | |||||||
| Nissan Auto Lease Trust 2020-B, Series 2020-B, Class A3, 0.43%, 10/16/23, Callable 6/15/23 @ 100 | 1,000,000 | 999,875 | |||||||||
| Oscar U.S. Funding XII LLC, Series 1A, Class A4, 1.00%, 4/10/28, Callable 2/10/25 @ 100 (a) | 2,500,000 | 2,449,694 | |||||||||
| Pawnee Equipment Receivables LLC, Series 2021-1, Class A2, 1.10%, 7/15/27, Callable 11/15/25 @ 100 (a) | 545,000 | 541,810 | |||||||||
PSNH Funding LLC, Series 2018-1, Class A1, 3.09%, 2/1/26 | 205,911 | 210,391 | |||||||||
| Santander Drive Auto Receivables Trust, Series 2020-4, Class C, 1.01%, 1/15/26, Callable 8/15/23 @ 100 | 1,000,000 | 1,001,552 | |||||||||
| Santander Drive Auto Receivables Trust, Series 2021-2, Class B, 0.59%, 9/15/25, Callable 1/15/24 @ 100 | 1,000,000 | 998,312 | |||||||||
| Santander Drive Auto Receivables Trust, Series 2019-3, Class C, 2.49%, 10/15/25, Callable 4/15/23 @ 100 | 401,841 | 403,622 | |||||||||
| SCF Equipment Leasing LLC, Series 2019-2A, Class A2, 2.47%, 4/20/26, Callable 10/20/24 @ 100 (a) | 750,000 | 760,475 | |||||||||
| SCF Equipment Leasing LLC, Series 2020-1A, Class A3, 1.19%, 10/20/27, Callable 3/20/25 @ 100 (a) | 1,500,000 | 1,502,598 | |||||||||
| Vantage Data Centers LLC, Series 2020-1A, Class A2, 1.65%, 9/15/45, Callable 9/15/23 @ 100 (a) | 1,000,000 | 973,075 | |||||||||
| Westlake Automobile Receivables Trust, Series 2019-2A, Class C, 2.84%, 7/15/24, Callable 3/15/23 @ 100 (a) | 372,148 | 373,818 | |||||||||
| Westlake Automobile Receivables Trust, Series 2021-3A, Class D, 2.12%, 1/15/27, Callable 12/15/24 @ 100 (a) | 1,000,000 | 1,002,388 | |||||||||
| Westlake Automobile Receivables Trust, Series 2019-2A, Class E, 4.02%, 4/15/25, Callable 3/15/23 @ 100 (a) | 1,000,000 | 1,025,468 | |||||||||
| World Omni Select Auto Trust, Series 2021-A, Class A3, 0.53%, 3/15/27, Callable 7/15/24 @ 100 | 2,000,000 | 1,977,263 | |||||||||
| World Omni Select Auto Trust, Series 2020-A, Class A3, 0.55%, 7/15/25, Callable 8/15/23 @ 100 | 1,000,000 | 999,907 | |||||||||
Total Asset-Backed Securities (Cost $63,484,719) | 63,279,163 | ||||||||||
Collateralized Mortgage Obligations (4.7%) | |||||||||||
| BBCMS Mortgage Trust, Series 2020-BID, Class A, 2.25% (LIBOR01M+214bps), 10/15/37 (a) (b) | 1,000,000 | 1,002,122 | |||||||||
| BBCMS Mortgage Trust, Series 2020-BID, Class B, 2.65% (LIBOR01M+254bps), 10/15/37 (a) (b) | 1,750,000 | 1,754,177 | |||||||||
BPR Trust, Series 2021-TY, Class C, 1.81% (LIBOR01M+170bps), 9/23/23 (a) (b) | 1,000,000 | 997,203 | |||||||||
BPR Trust, Series 2021-TY, Class A, 1.16% (LIBOR01M+105bps), 9/23/23 (a) (b) | 1,000,000 | 998,145 | |||||||||
| BX Commercial Mortgage Trust, Series 2019-XL, Class D, 1.56% (LIBOR01M+145bps), 10/15/36 (a) (b) | 2,465,000 | 2,458,026 | |||||||||
| CHT Mortgage Trust, Series 2017-CSMO, Class E, 3.11% (LIBOR01M+300bps), 11/15/36 (a) (b) | 2,000,000 | 1,999,768 | |||||||||
| Citigroup Commercial Mortgage Trust, Series 2019-SMRT, Class B, 4.38%, 1/10/36 (a) | 500,000 | 521,010 | |||||||||
| JP Morgan Chase Commercial Mortgage Securities Trust, Series 2013-C13, Class C, 4.08%, 1/15/46, Callable 7/15/23 @ 100 (c) | 1,000,000 | 1,028,867 | |||||||||
| JPMorgan Chase Commercial Mortgage Securities Trust, Series 2013-C10, Class A5, 3.14%, 12/15/47, Callable 2/15/23 @ 100 | 979,433 | 996,923 | |||||||||
See notes to financial statements.
6
| Victory Portfolios II VictoryShares USAA Core Short-Term Bond ETF | Schedule of Portfolio Investments — continued December 31, 2021 | ||||||
(Unaudited)
Security Description | Principal Amount | Value | |||||||||
| KNDL Mortgage Trust, Series 2019-KNSQ, Class C, 1.16% (US0001M+105bps), 5/15/36 (a) (b) | $ | 1,175,000 | $ | 1,173,445 | |||||||
| Morgan Stanley Capital I Trust, Series 2017-CLS, Class F, 2.71% (LIBOR01M+260bps), 11/15/34 (a) (b) | 1,000,000 | 995,222 | |||||||||
| Palmer Square Loan Funding Ltd., Series 2020-1A, Class A1, 0.96% (LIBOR03M+80bps), 2/20/28, Callable 2/20/22 @ 100 (a) (b) | 241,739 | 241,927 | |||||||||
| SREIT Trust, Series 2021-MFP2, Class B, 1.27% (LIBOR01M+117bps), 11/15/36 (a) (b) | 1,000,000 | 994,999 | |||||||||
| Stratus CLO Ltd., Series 2021-3A, Class A, 1.08% (US0003M+95bps), 12/29/29 (a) (b) | 1,000,000 | 1,000,000 | |||||||||
| Stratus CLO Ltd., Series 2021-3A, Class B, 1.68% (US0003M +155bps), 12/29/29 (a) (b) | 821,000 | 821,000 | |||||||||
| STREIT Trust, Series 2021-MFP2, Class A, 0.92% (US0001M+82bps), 11/15/36 (a) (b) | 1,000,000 | 994,999 | |||||||||
| WFRBS Commercial Mortgage Trust, Series 2012-C9, Class ASB, 2.45%, 11/15/45, Callable 7/15/22 @ 100 | 77,385 | 77,744 | |||||||||
| WFRBS Commercial Mortgage Trust, Series 2012-C7, Class AS, 4.09%, 6/15/45, Callable 6/15/22 @ 100 (c) | 225,017 | 225,584 | |||||||||
Total Collateralized Mortgage Obligations (Cost $18,313,425) | 18,281,161 | ||||||||||
Senior Secured Loans (1.3%) | |||||||||||
| Clean Harbors, Inc., Initial Term Loan, First Lien, 1.84% (LIBOR01M+175bps), 6/30/24 (b) | 496,104 | 495,836 | |||||||||
Genpact International LLC, Term Loan A,First Lien, 8/9/23 (d) (e) | 3,000,000 | 2,977,500 | |||||||||
Magallanes, Inc., Term Loan A, First Lien, 12/4/22 (d) (e) | 1,500,000 | 1,475,625 | |||||||||
Total Senior Secured Loans (Cost $4,998,066) | 4,948,961 | ||||||||||
Corporate Bonds (42.7%) | |||||||||||
Communication Services (1.4%): | |||||||||||
DISH DBS Corp., 5.88%, 7/15/22 | 1,374,000 | 1,397,248 | |||||||||
TEGNA, Inc., 4.75%, 3/15/26, Callable 3/15/23 @ 102.38 (a) (f) | 2,000,000 | 2,082,600 | |||||||||
T-Mobile USA, Inc., 2.63%, 4/15/26, Callable 4/15/23 @ 101.31 (f) | 2,000,000 | 2,014,340 | |||||||||
5,494,188 | |||||||||||
Consumer Discretionary (3.4%): | |||||||||||
Association of American Medical Colleges, 2.12%, 10/1/24 | 750,000 | 750,175 | |||||||||
Daimler Trucks Finance North America LLC, 1.63%, 12/13/24 (a) | 2,000,000 | 2,014,380 | |||||||||
Expedia Group, Inc., 6.25%, 5/1/25, Callable 2/1/25 @ 100 (a) | 1,000,000 | 1,128,690 | |||||||||
| Genting New York LLC/GENNY Capital, Inc., 3.30%, 2/15/26, Callable 1/15/26 @ 100 (a) | 500,000 | 495,015 | |||||||||
Howard University, 2.74%, 10/1/22 | 500,000 | 506,555 | |||||||||
Macy's Retail Holdings LLC, 2.88%, 2/15/23, Callable 11/15/22 @ 100 | 750,000 | 759,225 | |||||||||
Marriott International, Inc., 2.30%, 1/15/22 | 1,000,000 | 1,000,430 | |||||||||
Murphy Oil USA, Inc., 5.63%, 5/1/27, Callable 5/1/22 @ 102.81 | 1,500,000 | 1,557,930 | |||||||||
Nordstrom, Inc., 2.30%, 4/8/24, Callable 4/8/22 @ 100 | 1,500,000 | 1,499,460 | |||||||||
QVC, Inc., 4.38%, 3/15/23 | 667,000 | 687,771 | |||||||||
Sodexo, Inc., 1.63%, 4/16/26, Callable 3/16/26 @ 100 (a) (f) | 2,000,000 | 1,982,620 | |||||||||
Toll Brothers Finance Corp., 4.38%, 4/15/23, Callable 1/15/23 @ 100 | 750,000 | 775,515 | |||||||||
13,157,766 | |||||||||||
See notes to financial statements.
7
| Victory Portfolios II VictoryShares USAA Core Short-Term Bond ETF | Schedule of Portfolio Investments — continued December 31, 2021 | ||||||
(Unaudited)
Security Description | Principal Amount | Value | |||||||||
Consumer Staples (2.0%): | |||||||||||
Central Garden & Pet Co., 5.13%, 2/1/28, Callable 1/1/23 @ 102.56 | $ | 1,000,000 | $ | 1,045,570 | |||||||
Darling Ingredients, Inc., 5.25%, 4/15/27, Callable 4/15/22 @ 102.63 (a) | 2,000,000 | 2,065,000 | |||||||||
Hormel Foods Corp., 0.65%, 6/3/24, Callable 6/3/22 @ 100 | 1,500,000 | 1,488,705 | |||||||||
JBS USA Food Co., 5.75%, 1/15/28, Callable 7/15/22 @ 102.88 (a) | 1,000,000 | 1,045,160 | |||||||||
| Jbs USA Lux SA / Jbs USA Food Co., 6.50%, 4/15/29, Callable 4/15/24 @ 103.25 (a) | 2,000,000 | 2,200,020 | |||||||||
7,844,455 | |||||||||||
Energy (9.5%): | |||||||||||
Apache Corp., 3.25%, 4/15/22, Callable 1/18/22 @ 100 | 1,250,000 | 1,251,112 | |||||||||
| Continental Resources, Inc. 4.50%, 4/15/23, Callable 1/15/23 @ 100 (f) | 1,230,000 | 1,269,852 | |||||||||
3.80%, 6/1/24, Callable 3/1/24 @ 100 | 381,000 | 397,703 | |||||||||
2.27%, 11/15/26, Callable 11/15/23 @ 100 (a) | 1,000,000 | 993,040 | |||||||||
DCP Midstream Operating LP, 3.88%, 3/15/23, Callable 12/15/22 @ 100 | 1,000,000 | 1,024,790 | |||||||||
Energy Transfer LP, 4.90%, 2/1/24, Callable 11/1/23 @ 100 | 1,715,000 | 1,817,506 | |||||||||
EnLink Midstream Partners, LP, 4.40%, 4/1/24, Callable 1/1/24 @ 100 | 900,000 | 946,485 | |||||||||
| EQM Midstream Partners LP 4.75%, 7/15/23, Callable 6/15/23 @ 100 (f) | 135,000 | 140,277 | |||||||||
4.00%, 8/1/24, Callable 5/1/24 @ 100 | 865,000 | 899,730 | |||||||||
Gray Oak Pipeline LLC, 2.00%, 9/15/23 (a) | 833,000 | 842,296 | |||||||||
Hess Corp., 3.50%, 7/15/24, Callable 4/15/24 @ 100 | 1,000,000 | 1,044,060 | |||||||||
Hess Midstream Operations, LP, 5.63%, 2/15/26, Callable 2/7/22 @ 104.22 (a) | 3,000,000 | 3,090,000 | |||||||||
| HollyFrontier Corp. 2.63%, 10/1/23 | 1,000,000 | 1,019,710 | |||||||||
5.88%, 4/1/26, Callable 1/1/26 @ 100 (f) | 1,881,000 | 2,109,241 | |||||||||
| Midwest Connector Capital Co. LLC 3.63%, 4/1/22, Callable 3/1/22 @ 100 (a) (f) | 1,500,000 | 1,507,335 | |||||||||
3.90%, 4/1/24, Callable 3/1/24 @ 100 (a) | 2,500,000 | 2,594,600 | |||||||||
MPLX LP, 3.50%, 12/1/22, Callable 11/1/22 @ 100 | 271,000 | 276,756 | |||||||||
| Murphy Oil Corp. 6.88%, 8/15/24, Callable 2/7/22 @ 101.72 | 565,000 | 575,786 | |||||||||
5.88%, 12/1/27, Callable 12/1/22 @ 102.94 | 1,690,000 | 1,744,232 | |||||||||
Occidental Petroleum Corp., 2.90%, 8/15/24, Callable 7/15/24 @ 100 | 687,000 | 701,674 | |||||||||
| Ovintiv Exploration, Inc. 5.63%, 7/1/24 | 1,000,000 | 1,101,880 | |||||||||
5.38%, 1/1/26, Callable 10/1/25 @ 100 (f) | 1,000,000 | 1,109,700 | |||||||||
| Parsley Energy LLC/Parsley Finance Corp., 4.13%, 2/15/28, Callable 2/15/23 @ 102.06 (a) | 1,000,000 | 1,017,400 | |||||||||
| Range Resources Corp. 5.88%, 7/1/22, Callable 4/1/22 @ 100 | 540,000 | 544,747 | |||||||||
5.00%, 8/15/22, Callable 5/15/22 @ 100 | 500,000 | 505,600 | |||||||||
SM Energy Co., 5.63%, 6/1/25, Callable 2/7/22 @ 101.88 | 1,000,000 | 1,009,290 | |||||||||
Southwestern Energy Co., 4.10%, 3/15/22, Callable 1/24/22 @ 100 | 1,500,000 | 1,502,130 | |||||||||
| Targa Resources Partners LP/Targa Resources Partners Finance Corp, 6.50%, 7/15/27, Callable 7/15/22 @ 104.88 | 700,000 | 750,400 | |||||||||
USX Corp., 8.13%, 7/15/23 | 400,000 | 436,528 | |||||||||
See notes to financial statements.
8
| Victory Portfolios II VictoryShares USAA Core Short-Term Bond ETF | Schedule of Portfolio Investments — continued December 31, 2021 | ||||||
(Unaudited)
Security Description | Principal Amount | Value | |||||||||
| Western Midstream Operating LP 4.00%, 7/1/22, Callable 4/1/22 @ 100 | $ | 1,500,000 | $ | 1,506,705 | |||||||
1.97% (LIBOR03M+185bps), 1/13/23 (b) | 500,000 | 499,170 | |||||||||
4.35%, 2/1/25, Callable 1/1/25 @ 100 | 2,000,000 | 2,082,460 | |||||||||
WPX Energy, Inc., 8.25%, 8/1/23, Callable 6/1/23 @ 100 | 500,000 | 547,615 | |||||||||
36,859,810 | |||||||||||
Financials (11.5%): | |||||||||||
Ares Capital Corp., 3.25%, 7/15/25, Callable 6/15/25 @ 100 | 750,000 | 778,050 | |||||||||
| Athene Global Funding 2.80%, 5/26/23 (a) | 750,000 | 769,028 | |||||||||
1.20%, 10/13/23 (a) | 500,000 | 501,005 | |||||||||
| Blackstone Private Credit Fund 1.75%, 9/15/24 (a) | 1,000,000 | 984,400 | |||||||||
2.35%, 11/22/24 (a) | 1,000,000 | 1,000,160 | |||||||||
| Cadence Bancorp, 4.75% (LIBOR03M+303bps), 6/30/29, Callable 6/30/24 @ 100 (b) | 1,165,000 | 1,235,785 | |||||||||
| CIT Group, Inc. 5.00%, 8/15/22 | 1,740,000 | 1,782,265 | |||||||||
4.75%, 2/16/24, Callable 11/16/23 @ 100 | 735,000 | 777,593 | |||||||||
| Citigroup, Inc., 3.14% (LIBOR03M+72bps), 1/24/23, Callable 1/24/22 @ 100 (b) | 400,000 | 400,528 | |||||||||
Colfax Corp., 6.38%, 2/15/26, Callable 2/15/22 @ 103.19 (a) | 1,500,000 | 1,553,385 | |||||||||
DAE Funding LLC, 1.55%, 8/1/24, Callable 7/1/24 @ 100 (a) | 250,000 | 245,970 | |||||||||
First American Financial Corp., 4.30%, 2/1/23 | 2,800,000 | 2,885,484 | |||||||||
| First Citizens BancShares, Inc., 3.37% (SOFR+247bps), 3/15/30, Callable 3/15/25 @ 100 (b) | 1,000,000 | 1,015,470 | |||||||||
First Financial Bancorp, 5.13%, 8/25/25 | 1,000,000 | 1,033,720 | |||||||||
FNB Corp., 2.20%, 2/24/23, Callable 1/24/23 @ 100 | 1,876,000 | 1,893,916 | |||||||||
Ford Motor Credit Co. LLC, 3.38%, 11/13/25, Callable 10/13/25 @ 100 | 1,000,000 | 1,037,590 | |||||||||
| FS KKR Capital Corp. 4.75%, 5/15/22, Callable 4/15/22 @ 100 | 1,000,000 | 1,009,430 | |||||||||
1.65%, 10/12/24 | 1,024,000 | 1,005,650 | |||||||||
| Fulton Financial Corp., 3.25% (SOFR+230bps), 3/15/30, Callable 3/15/25 @ 100 (b) | 1,000,000 | 1,009,010 | |||||||||
GA Global Funding Trust, 1.63%, 1/15/26 (a) | 500,000 | 496,115 | |||||||||
Infinity Property & Casualty Corp., 5.00%, 9/19/22 (f) | 500,000 | 512,475 | |||||||||
| Main Street Capital Corp. 5.20%, 5/1/24 | 2,000,000 | 2,135,900 | |||||||||
3.00%, 7/14/26, Callable 6/14/26 @ 100 | 500,000 | 501,555 | |||||||||
| Morgan Stanley 3.73% (US0003M+361bps), Callable 1/18/22 @ 100 (b) (g) | 3,000,000 | 3,001,110 | |||||||||
0.79% (SOFR+53bps), 5/30/25, Callable 5/30/24 @ 100 (b) | 2,000,000 | 1,973,600 | |||||||||
People's United Bank NA, 4.00%, 7/15/24, Callable 4/16/24 @ 100 | 1,000,000 | 1,050,800 | |||||||||
ProAssurance Corp., 5.30%, 11/15/23 | 1,000,000 | 1,054,940 | |||||||||
Protective Life Global Funding, 3.10%, 4/15/24 (a) | 500,000 | 520,500 | |||||||||
Radian Group, Inc., 4.50%, 10/1/24, Callable 7/1/24 @ 100 | 1,000,000 | 1,048,300 | |||||||||
Reliance Standard Life Global Funding II, 2.75%, 5/7/25 (a) | 750,000 | 776,100 | |||||||||
Santander Holdings USA, Inc., 3.40%, 1/18/23, Callable 12/18/22 @ 100 | 250,000 | 255,512 | |||||||||
SCE Recovery Funding LLC, 0.86%, 11/15/31 | 1,924,384 | 1,832,572 | |||||||||
Synovus Bank, 2.29% (SOFR+95bps), 2/10/23, Callable 2/10/22 @ 100 (b) | 1,008,000 | 1,008,937 | |||||||||
See notes to financial statements.
9
| Victory Portfolios II VictoryShares USAA Core Short-Term Bond ETF | Schedule of Portfolio Investments — continued December 31, 2021 | ||||||
(Unaudited)
Security Description | Principal Amount | Value | |||||||||
| TCF National Bank, 5.50% (LIBOR03M+509bps), 5/6/30, Callable 5/6/25 @ 100 (b) | $ | 750,000 | $ | 800,347 | |||||||
| Texas Capital Bancshares, Inc., 4.00% (H15T5Y+315bps), 5/6/31, Callable 5/6/26 @ 100 (b) | 1,000,000 | 1,029,420 | |||||||||
The Prudential Insurance Co. of America, 8.30%, 7/1/25 (a) | 1,000,000 | 1,213,770 | |||||||||
| TIAA FSB Holdings, Inc. 5.75%, 7/2/25, Callable 6/2/25 @ 100 | 1,000,000 | 1,091,330 | |||||||||
4.91% (LIBOR03M+470bps), 3/15/26, Callable 2/7/22 @ 100 (b) | 750,000 | 761,783 | |||||||||
| UMB Financial Corp., 3.70% (H15T5Y+344bps), 9/17/30, Callable 9/17/25 @ 100 (b) | 750,000 | 757,793 | |||||||||
Webster Financial Corp., 4.38%, 2/15/24, Callable 1/16/24 @ 100 | 1,700,000 | 1,785,493 | |||||||||
44,526,791 | |||||||||||
Health Care (1.4%): | |||||||||||
Astrazeneca Finance LLC, 0.70%, 5/28/24, Callable 5/28/22 @ 100 | 1,000,000 | 992,260 | |||||||||
| Fresenius Medical Care U.S. Finance III, Inc., 1.88%, 12/1/26, Callable 11/1/26 @ 100 (a) | 1,000,000 | 990,440 | |||||||||
Hikma Finance USA LLC, 3.25%, 7/9/25 | 2,000,000 | 2,052,320 | |||||||||
Laboratory Corp. of America Holdings, 1.55%, 6/1/26, Callable 5/1/26 @ 100 | 1,000,000 | 989,620 | |||||||||
SSM Health Care Corp., 3.69%, 6/1/23, Callable 3/1/23 @ 100 | 500,000 | 515,750 | |||||||||
5,540,390 | |||||||||||
Industrials (5.0%): | |||||||||||
Air Lease Corp., 2.25%, 1/15/23 | 250,000 | 253,177 | |||||||||
Aircastle Ltd., 4.25%, 6/15/26, Callable 4/15/26 @ 100 (f) | 500,000 | 537,388 | |||||||||
American Airlines, Inc./AAdvantage Loyalty IP Ltd., 5.50%, 4/20/26 (a) | 1,000,000 | 1,040,710 | |||||||||
Ashtead Capital, Inc., 4.38%, 8/15/27, Callable 8/15/22 @ 102.19 (a) (f) | 3,435,000 | 3,563,469 | |||||||||
Aviation Capital Group LLC, 5.50%, 12/15/24, Callable 11/15/24 @ 100 (a) | 1,000,000 | 1,094,510 | |||||||||
Builders FirstSource, Inc., 6.75%, 6/1/27, Callable 6/1/22 @ 103.38 (a) | 1,764,000 | 1,860,085 | |||||||||
Continental Airlines Pass Through Trust, 5.98%, 10/19/23 | 85,617 | 86,311 | |||||||||
Delta Air Lines Pass Through Trust, 2.00%, 12/10/29 | 910,309 | 892,777 | |||||||||
Delta Air Lines, Inc./SkyMiles IP Ltd., 4.50%, 10/20/25 (a) | 1,370,000 | 1,441,007 | |||||||||
Hillenbrand, Inc., 5.75%, 6/15/25, Callable 6/15/22 @ 102.88 | 1,000,000 | 1,050,630 | |||||||||
Huntington Ingalls Industries, Inc., 0.67%, 8/16/23, Callable 8/16/22 @ 100 (a) | 500,000 | 495,730 | |||||||||
| Mileage Plus Holdings LLC/Mileage Plus Intellectual Property Assets Ltd., 6.50%, 6/20/27, Callable 6/30/23 @ 103.25 (a) | 1,000,000 | 1,068,890 | |||||||||
| Penske Truck Leasing Co. LP/PTL Finance Corp., 1.70%, 6/15/26, Callable 5/15/26 @ 100 (a) | 1,000,000 | 991,020 | |||||||||
Spirit Airlines Pass Through Trust, 4.45%, 10/1/25 | 925,297 | 946,782 | |||||||||
The Nature Conservancy, 0.63%, 7/1/24 | 650,000 | 642,285 | |||||||||
TransDigm, Inc., 8.00%, 12/15/25, Callable 4/8/22 @ 104 (a) (f) | 2,000,000 | 2,109,640 | |||||||||
U.S. Airways Pass Through Trust, 3.95%, 5/15/27 | 329,209 | 330,453 | |||||||||
| United Airlines Pass Through Trust 4.15%, 10/11/25 | 581,641 | 601,731 | |||||||||
4.88%, 7/15/27 | 308,014 | 320,676 | |||||||||
19,327,271 | |||||||||||
Information Technology (1.2%): | |||||||||||
Global Payments, Inc., 1.50%, 11/15/24, Callable 10/15/24 @ 100 | 2,000,000 | 2,000,600 | |||||||||
Qorvo, Inc., 1.75%, 12/15/24, Callable 12/15/22 @ 100 (a) | 1,675,000 | 1,676,273 | |||||||||
Skyworks Solutions, Inc., 0.90%, 6/1/23, Callable 6/1/22 @ 100 | 1,000,000 | 994,980 | |||||||||
4,671,853 | |||||||||||
See notes to financial statements.
10
| Victory Portfolios II VictoryShares USAA Core Short-Term Bond ETF | Schedule of Portfolio Investments — continued December 31, 2021 | ||||||
(Unaudited)
Security Description | Principal Amount | Value | |||||||||
Materials (3.5%): | |||||||||||
Cleveland Cliffs, Inc., 9.88%, 10/17/25, Callable 10/17/22 @ 107.41 (a) (f) | $ | 2,575,000 | $ | 2,916,754 | |||||||
Commercial Metals Co., 4.88%, 5/15/23, Callable 2/15/23 @ 100 | 2,625,000 | 2,711,966 | |||||||||
Freeport-McMoRan, Inc., 5.00%, 9/1/27, Callable 9/1/22 @ 102.5 (f) | 3,000,000 | 3,139,830 | |||||||||
Ingevity Corp., 4.50%, 2/1/26, Callable 2/7/22 @ 101.13 (a) | 1,500,000 | 1,503,750 | |||||||||
| Sealed Air Corp. 5.25%, 4/1/23, Callable 1/1/23 @ 100 (a) | 1,000,000 | 1,037,260 | |||||||||
1.57%, 10/15/26, Callable 9/15/26 @ 100 (a) | 1,000,000 | 970,140 | |||||||||
West Fraser Timber Co Ltd, 4.35%, 10/15/24, Callable 7/15/24 @ 100 (a) | 1,000,000 | 1,068,740 | |||||||||
13,348,440 | |||||||||||
Real Estate (1.9%): | |||||||||||
Host Hotels & Resorts LP, 4.50%, 2/1/26, Callable 11/1/25 @ 100 | 1,044,000 | 1,122,916 | |||||||||
| MPT Operating Partnership LP/MPT Finance Corp., 5.00%, 10/15/27, Callable 10/15/22 @ 102.5 | 1,500,000 | 1,570,530 | |||||||||
Office Properties Income Trust, 4.00%, 7/15/22, Callable 6/15/22 @ 100 | 1,000,000 | 1,011,990 | |||||||||
Omega Healthcare Investors, Inc., 4.38%, 8/1/23, Callable 6/1/23 @ 100 | 919,000 | 958,002 | |||||||||
SBA Tower Trust, 2.84%, 1/15/25, Callable 1/15/24 @ 100 (a) | 750,000 | 769,439 | |||||||||
| VICI Properties LP/VICI Note Co., Inc., 3.50%, 2/15/25, Callable 2/15/22 @ 101.75 (a) | 364,000 | 371,142 | |||||||||
Vornado Realty LP, 2.15%, 6/1/26, Callable 5/1/26 @ 100 | 1,500,000 | 1,503,210 | |||||||||
7,307,229 | |||||||||||
Utilities (1.9%): | |||||||||||
Calpine Corp., 5.25%, 6/1/26, Callable 2/7/22 @ 102.63 (a) | 802,000 | 822,812 | |||||||||
CenterPoint Energy Resources Corp., 0.70%, 3/2/23, Callable 2/7/22 @ 100 | 1,000,000 | 995,590 | |||||||||
| Cleco Power LLC, 0.70% (US0003M+50bps), 6/15/23, Callable 3/15/22 @ 100 (a) (b) | 2,000,000 | 1,998,460 | |||||||||
Entergy Texas, Inc., 1.50%, 9/1/26, Callable 8/1/26 @ 100 | 1,000,000 | 980,870 | |||||||||
NextEra Energy Capital Holdings, Inc., 0.65%, 3/1/23 | 1,000,000 | 997,930 | |||||||||
Oklahoma Gas & Electric Co., 0.55%, 5/26/23, Callable 2/7/22 @ 100 | 1,000,000 | 994,860 | |||||||||
Sierra Pacific Power Co., 3.38%, 8/15/23, Callable 5/15/23 @ 100 | 500,000 | 516,670 | |||||||||
7,307,192 | |||||||||||
Total Corporate Bonds (Cost $165,028,929) | 165,385,385 | ||||||||||
Yankee Dollars (12.7%) | |||||||||||
Communication Services (0.7%): | |||||||||||
Bharti Airtel International Netherlands BV, 5.35%, 5/20/24 (a) | 1,000,000 | 1,077,230 | |||||||||
Pearson Funding Four PLC, 3.75%, 5/8/22 (a) | 750,000 | 753,667 | |||||||||
Telefonica Chile SA, 3.88%, 10/12/22 (a) | 1,000,000 | 1,020,040 | |||||||||
2,850,937 | |||||||||||
Consumer Discretionary (0.6%): | |||||||||||
Nissan Motor Co. Ltd., 3.04%, 9/15/23 (a) | 1,000,000 | 1,026,360 | |||||||||
Stellantis Finance US, Inc., 1.71%, 1/29/27, Callable 12/29/26 @ 100 (a) | 333,000 | 327,682 | |||||||||
Stellantis NV, 5.25%, 4/15/23 | 1,000,000 | 1,050,720 | |||||||||
2,404,762 | |||||||||||
Consumer Staples (0.3%): | |||||||||||
Imperial Brands Finance PLC, 3.13%, 7/26/24, Callable 6/26/24 @ 100 (a) | 948,000 | 980,602 | |||||||||
See notes to financial statements.
11
| Victory Portfolios II VictoryShares USAA Core Short-Term Bond ETF | Schedule of Portfolio Investments — continued December 31, 2021 | ||||||
(Unaudited)
Security Description | Principal Amount | Value | |||||||||
Energy (2.2%): | |||||||||||
Bharat Petroleum Corp. Ltd., 4.38%, 1/24/22 | $ | 2,095,000 | $ | 2,098,557 | |||||||
Galaxy Pipeline Assets Bidco Ltd., 1.75%, 9/30/27 (a) | 489,325 | 490,255 | |||||||||
Harbour Energy PLC, 5.50%, 10/15/26, Callable 10/15/23 @ 102.75 (a) | 1,500,000 | 1,489,935 | |||||||||
Harvest Operations Corp., 1.00%, 4/26/24, Callable 4/26/22 @ 100 (a) | 1,214,000 | 1,208,027 | |||||||||
| Petroleos Mexicanos 4.88%, 1/24/22 | 703,000 | 704,047 | |||||||||
3.85% (LIBOR03M+365bps), 3/11/22 (b) | 1,000,000 | 1,001,090 | |||||||||
Suncor Energy Ventures Corp., 4.50%, 4/1/22 (a) | 1,597,000 | 1,612,699 | |||||||||
8,604,610 | |||||||||||
Financials (4.2%): | |||||||||||
| Banco Santander Mexico SA Institucion de Banca Multiple Grupo Financiero Santand, 5.38%, 4/17/25 (a) (f) | 3,000,000 | 3,275,700 | |||||||||
BAT International Finance PLC, 1.67%, 3/25/26, Callable 2/25/26 @ 100 | 1,000,000 | 982,780 | |||||||||
BBVA Bancomer SA, 6.75%, 9/30/22 (a) | 3,305,000 | 3,428,904 | |||||||||
Element Fleet Management Corp., 1.60%, 4/6/24, Callable 3/6/24 @ 100 (a) | 400,000 | 400,932 | |||||||||
Ontario Teachers' Finance Trust, 0.38%, 9/29/23 (a) | 1,000,000 | 992,440 | |||||||||
| Prudential PLC 4.38%, Callable 1/20/22 @ 100, MTN (g) | 590,000 | 590,024 | |||||||||
5.25%, Callable 1/20/22 @ 100, MTN (g) | 3,000,000 | 3,004,980 | |||||||||
SA Global Sukuk Ltd., 0.95%, 6/17/24, Callable 5/17/24 @ 100 (a) | 416,000 | 409,760 | |||||||||
| Santander UK Group Holdings PLC, 3.37% (LIBOR03M+108bps), 1/5/24, Callable 1/5/23 @ 100 (b) | 250,000 | 255,430 | |||||||||
Standard Chartered PLC, 7.50% (USSW5+630bps), Callable 4/2/22 @ 100 (b) (g) | 1,000,000 | 1,013,750 | |||||||||
| VEON Holdings BV 7.50%, 3/1/22 (a) | 1,000,000 | 1,010,050 | |||||||||
5.95%, 2/13/23 | 1,000,000 | 1,041,660 | |||||||||
16,406,410 | |||||||||||
Health Care (0.3%): | |||||||||||
Olympus Corp., 2.14%, 12/8/26 (a) | 1,212,000 | 1,218,957 | |||||||||
Industrials (1.7%): | |||||||||||
| AerCap Ireland Capital DAC/AerCap Global Aviation Trust, 3.15%, 2/15/24, Callable 1/15/24 @ 100 | 1,000,000 | 1,030,790 | |||||||||
| Air Canada Pass Through Trust 5.00%, 6/15/25 (a) | 243,814 | 247,520 | |||||||||
4.13%, 11/15/26 (a) | 928,905 | 937,181 | |||||||||
Avolon Holdings Funding Ltd., 2.13%, 2/21/26, Callable 1/21/26 @ 100 (a) | 750,000 | 737,025 | |||||||||
CK Hutchison International Ltd., 2.75%, 3/29/23 (a) | 750,000 | 766,148 | |||||||||
IHS Markit Ltd., 5.00%, 11/1/22, Callable 8/1/22 @ 100 (a) | 900,000 | 921,681 | |||||||||
Smiths Group PLC, 3.63%, 10/12/22 (a) | 1,000,000 | 1,020,630 | |||||||||
The Weir Group PLC, 2.20%, 5/13/26, Callable 4/13/26 @ 100 (a) | 1,000,000 | 992,010 | |||||||||
6,652,985 | |||||||||||
Information Technology (0.8%): | |||||||||||
Telefonaktiebolaget LM Ericsson, 4.13%, 5/15/22 | 2,000,000 | 2,022,860 | |||||||||
TSMC Global Ltd., 0.75%, 9/28/25, Callable 8/28/25 @ 100 (a) | 1,000,000 | 969,370 | |||||||||
2,992,230 | |||||||||||
See notes to financial statements.
12
| Victory Portfolios II VictoryShares USAA Core Short-Term Bond ETF | Schedule of Portfolio Investments — continued December 31, 2021 | ||||||
(Unaudited)
Security Description | Principal Amount | Value | |||||||||
Materials (1.5%): | |||||||||||
OCI NV, 4.63%, 10/15/25, Callable 10/15/22 @ 102.31 (a) | $ | 1,800,000 | $ | 1,864,404 | |||||||
POSCO, 2.38%, 1/17/23 | 2,100,000 | 2,123,352 | |||||||||
Syngenta Finance NV, 3.13%, 3/28/22 | 1,718,000 | 1,722,793 | |||||||||
5,710,549 | |||||||||||
Utilities (0.4%): | |||||||||||
TransAlta Corp., 4.50%, 11/15/22, Callable 8/15/22 @ 100 | 1,300,000 | 1,324,895 | |||||||||
Total Yankee Dollars (Cost $49,214,964) | 49,146,937 | ||||||||||
Municipal Bonds (17.6%) | |||||||||||
Alabama (0.3%): | |||||||||||
City of Birmingham, GO, 0.86%, 3/1/24 | 1,015,000 | 1,010,175 | |||||||||
California (3.1%): | |||||||||||
| California Municipal Finance Authority Revenue 0.73%, 2/1/22 | 1,835,000 | 1,835,033 | |||||||||
0.93%, 2/1/23 | 1,000,000 | 998,709 | |||||||||
1.36%, 2/1/24 | 495,000 | 494,882 | |||||||||
| California Statewide Communities Development Authority Revenue, 2.15%, 11/15/30, Continuously Callable @100 | 1,155,000 | 1,118,468 | |||||||||
| California Statewide Communities Development Authority Revenue (NBGA — California Health Insurance Construction Loan Insurance Program), 2.05%, 8/1/30 | 1,545,000 | 1,512,082 | |||||||||
City of El Cajon Revenue, Series A, 0.65%, 4/1/23 | 650,000 | 648,088 | |||||||||
City of Gardena Revenue, 1.30%, 4/1/23 | 565,000 | 567,931 | |||||||||
| Golden State Tobacco Securitization Corp. Revenue 1.24%, 6/1/22 | 1,500,000 | 1,501,216 | |||||||||
1.71%, 6/1/24 | 1,000,000 | 1,003,947 | |||||||||
Series B, 0.67%, 6/1/23 | 1,000,000 | 997,768 | |||||||||
Series B, 0.99%, 6/1/24 | 500,000 | 497,780 | |||||||||
| Placentia Public Financing Authority Revenue Series A, 1.72%, 6/1/22 | 200,000 | 199,822 | |||||||||
Series A, 1.93%, 6/1/23 | 300,000 | 298,852 | |||||||||
| San Jose Redevelopment Agency Successor Agency Tax Allocation, Series A-T, 2.63%, 8/1/22 | 250,000 | 253,175 | |||||||||
11,927,753 | |||||||||||
Colorado (1.6%): | |||||||||||
| City & County of Denver Co. Airport System Revenue Series C, 0.88%, 11/15/23 | 500,000 | 499,750 | |||||||||
Series C, 1.12%, 11/15/24 | 500,000 | 499,727 | �� | ||||||||
| City of Loveland Electric & Communications Enterprise Revenue, 2.85%, 12/1/23 | 600,000 | 617,539 | |||||||||
| Colorado Health Facilities Authority Revenue Series B, 2.24%, 11/1/22 | 750,000 | 756,984 | |||||||||
Series B, 2.80%, 12/1/26 | 500,000 | 505,397 | |||||||||
County of El Paso Co. Revenue, Series B, 1.05%, 6/1/24 | 1,230,000 | 1,224,129 | |||||||||
| Denver City & County Housing Authority Revenue, 1.33%, 6/1/24, Continuously Callable @100 | 750,000 | 747,875 | |||||||||
See notes to financial statements.
13
| Victory Portfolios II VictoryShares USAA Core Short-Term Bond ETF | Schedule of Portfolio Investments — continued December 31, 2021 | ||||||
(Unaudited)
Security Description | Principal Amount | Value | |||||||||
Denver City & County Housing Authority Revenue, 2.15%, 12/1/24 | $ | 750,000 | $ | 767,065 | |||||||
Park Creek Metropolitan District Revenue, Series B, 2.43%, 12/1/23 | 700,000 | 722,979 | |||||||||
6,341,445 | |||||||||||
Florida (0.3%): | |||||||||||
Hillsborough County IDA Revenue, 2.16%, 8/1/25 | 1,250,000 | 1,257,102 | |||||||||
Georgia (0.3%): | |||||||||||
Municipal Electric Authority of Georgia, 1.42%, 1/1/25 | 500,000 | 498,010 | |||||||||
Municipal Electric Authority of Georgia Revenue, Series B, 1.58%, 1/1/26 | 555,000 | 549,787 | |||||||||
1,047,797 | |||||||||||
Guam (0.3%): | |||||||||||
Territory of Guam Revenue, Series E, 3.25%, 11/15/26 | 1,000,000 | 1,019,572 | |||||||||
Hawaii (0.5%): | |||||||||||
| State of Hawaii Airports System Revenue Series B, 0.90%, 7/1/23 | 300,000 | 298,402 | |||||||||
Series E, 1.39%, 7/1/25 | 1,500,000 | 1,498,686 | |||||||||
1,797,088 | |||||||||||
Illinois (0.7%): | |||||||||||
Chicago O'Hare International Airport Revenue, Series D, 0.96%, 1/1/23 | 165,000 | 165,484 | |||||||||
Sales Tax Securitization Corp. Revenue, 0.79%, 1/1/23 | 1,750,000 | 1,747,974 | |||||||||
State of Illinois Sales Tax Revenue, Series B, 0.91%, 6/15/24 | 1,000,000 | 985,592 | |||||||||
2,899,050 | |||||||||||
Indiana (0.5%): | |||||||||||
| Indiana Finance Authority Revenue 0.96%, 3/1/24 | 450,000 | 446,006 | |||||||||
2.48%, 3/1/24 (f) | 1,000,000 | 1,027,942 | |||||||||
1.41%, 3/1/25 | 570,000 | 566,806 | |||||||||
2,040,754 | |||||||||||
Kentucky (0.3%): | |||||||||||
County of Warren Revenue, Series B, 0.92%, 4/1/25 | 1,200,000 | 1,179,401 | |||||||||
Maine (0.1%): | |||||||||||
Maine State Housing Authority Revenue, Series H, 1.70%, 11/15/26 | 600,000 | 595,639 | |||||||||
Maryland (0.6%): | |||||||||||
County of Howard, GO, Series C, 1.34%, 8/15/23 | 500,000 | 504,590 | |||||||||
| Maryland Health & Higher Educational Facilities Authority Revenue 1.81%, 1/1/25 | 1,000,000 | 991,416 | |||||||||
1.89%, 1/1/26 | 1,000,000 | 983,524 | |||||||||
2,479,530 | |||||||||||
Michigan (1.0%): | |||||||||||
City of Grand Rapids MI Sanitary Sewer System Revenue, 0.94%, 1/1/25 | 1,000,000 | 994,312 | |||||||||
Ecorse Public School District, GO, 2.00%, 5/1/24 | 750,000 | 768,301 | |||||||||
| Michigan Finance Authority Revenue 2.21%, 12/1/23 | 185,000 | 188,808 | |||||||||
2.31%, 12/1/24 | 105,000 | 107,786 | |||||||||
2.37%, 9/1/49, (Put Date 9/1/23) (h) | 446,000 | 453,758 | |||||||||
Series A-1, 2.33%, 6/1/30 | 764,071 | 777,580 | |||||||||
See notes to financial statements.
14
| Victory Portfolios II VictoryShares USAA Core Short-Term Bond ETF | Schedule of Portfolio Investments — continued December 31, 2021 | ||||||
(Unaudited)
Security Description | Principal Amount | Value | |||||||||
Ypsilanti School District, GO, 1.89%, 5/1/24 | $ | 510,000 | $ | 513,084 | |||||||
3,803,629 | |||||||||||
Mississippi (0.1%): | |||||||||||
Medical Center Educational Building Corp. Revenue, 0.67%, 6/1/23 | 280,000 | 280,177 | |||||||||
Missouri (0.4%): | |||||||||||
| Missouri State Environmental Improvement & Energy Resources Authority Revenue, Series B, 0.70%, 1/1/24 | 1,495,000 | 1,486,839 | |||||||||
Nebraska (0.2%): | |||||||||||
| Papio-Missouri River Natural Resource District Special Tax, 2.09%, 12/15/24, Continuously Callable @100 | 630,000 | 639,648 | |||||||||
New Jersey (0.6%): | |||||||||||
Essex County Improvement Authority Revenue, Series B, 1.96%, 8/1/22 (a) | 350,000 | 348,289 | |||||||||
| South Jersey Transportation Authority Revenue Series B, 2.10%, 11/1/24 | 750,000 | 756,825 | |||||||||
Series B, 2.20%, 11/1/25 | 750,000 | 756,801 | |||||||||
| South Jersey Transportation Authority System Revenue, Series B, 3.02%, 11/1/25 | 425,000 | 441,716 | |||||||||
2,303,631 | |||||||||||
New York (1.0%): | |||||||||||
County of Suffolk, GO, Series C, 1.05%, 6/15/23 | 1,250,000 | 1,252,907 | |||||||||
Madison County Capital Resource Corp. Revenue, 2.18%, 7/1/23 | 500,000 | 511,551 | |||||||||
| Metropolitan Transportation Authority Revenue, Series A, 0.78%, 11/15/22, Continuously Callable @100 | 2,000,000 | 2,002,362 | |||||||||
3,766,820 | |||||||||||
Ohio (0.1%): | |||||||||||
Hamilton County Health Care Facilities Revenue, 2.37%, 6/1/22 | 325,000 | 326,992 | |||||||||
Oklahoma (0.4%): | |||||||||||
| Oklahoma Turnpike Authority Revenue Series B, 0.49%, 1/1/22 | 750,000 | 750,000 | |||||||||
Series B, 0.63%, 1/1/23 | 560,000 | 560,551 | |||||||||
The University of Oklahoma Revenue, Series B, 0.93%, 7/1/24 | 350,000 | 346,168 | |||||||||
1,656,719 | |||||||||||
Pennsylvania (0.3%): | |||||||||||
| School District of Scranton, GO (INS — Build America Mutual Assurance Co.), 2.46%, 4/1/22 | 500,000 | 502,548 | |||||||||
State Public School Building Authority Revenue, 2.75%, 4/1/25 | 500,000 | 519,592 | |||||||||
1,022,140 | |||||||||||
Rhode Island (0.4%): | |||||||||||
Providence Redevelopment Agency Revenue, Series A, 2.50%, 3/15/26 | 1,000,000 | 991,274 | |||||||||
Rhode Island Commerce Corp. Revenue, 2.86%, 5/1/24 | 500,000 | 518,766 | |||||||||
1,510,040 | |||||||||||
South Carolina (0.1%): | |||||||||||
Charleston Educational Excellence Finance Corp. Revenue, 0.65%, 12/1/23 | 600,000 | 596,782 | |||||||||
See notes to financial statements.
15
| Victory Portfolios II VictoryShares USAA Core Short-Term Bond ETF | Schedule of Portfolio Investments — continued December 31, 2021 | ||||||
(Unaudited)
Security Description | Principal Amount | Value | |||||||||
Tennessee (0.1%): | |||||||||||
| Metropolitan Government Nashville & Davidson County Sports Authority Revenue, 1.03%, 8/1/24 | $ | 600,000 | $ | 597,737 | |||||||
Texas (2.7%): | |||||||||||
| Aledo Independent School District, GO (NBGA — Texas Permanent School Fund), 0.95%, 2/15/24 | 250,000 | 244,997 | |||||||||
| Boerne School District, GO 0.64%, 2/1/24 | 400,000 | 398,137 | |||||||||
0.79%, 2/1/25 | 250,000 | 247,859 | |||||||||
| Central Texas Turnpike System Revenue, Series B, 1.98%, 8/15/42, (Put Date 08/15/22) (h) | 1,000,000 | 1,006,082 | |||||||||
City of Houston, GO, 2.77%, 3/1/22 | 150,000 | 150,598 | |||||||||
Clear Creek Independent School District, GO, Series B, 5.00%, 2/15/24 | 1,000,000 | 1,083,971 | |||||||||
Denton Independent School District, GO, Series A, 0.99%, 8/15/24 | 500,000 | 487,190 | |||||||||
| Harris County Cultural Education Facilities Finance Corp. Revenue 1.59%, 11/15/23 | 675,000 | 680,743 | |||||||||
1.84%, 11/15/24 | 500,000 | 505,321 | |||||||||
Series B, 2.30%, 5/15/24 | 600,000 | 616,010 | |||||||||
Lubbock Texas Water & Wastewater System Revenue, Series B, 1.93%, 2/15/24 | 750,000 | 768,361 | |||||||||
| Marshall Independent School District, GO (NBGA — Texas Permanent School Fund), 1.19%, 2/15/24 | 1,000,000 | 975,023 | |||||||||
State of Texas, GO, 3.11%, 10/1/23 | 500,000 | 520,972 | |||||||||
| Tarrant County Cultural Education Facilities Finance Corp. Revenue 1.07%, 9/1/23 | 525,000 | 527,318 | |||||||||
1.36%, 9/1/24 | 700,000 | 705,377 | |||||||||
Texas A&M University Revenue, Series A, 2.95%, 5/15/23 | 500,000 | 515,515 | |||||||||
| White Settlement Independent School District, GO (NBGA — Texas Permanent School Fund), Series A, 1.33%, 8/15/25 | 920,000 | 876,688 | |||||||||
10,310,162 | |||||||||||
Virginia (0.8%): | |||||||||||
County of Arlington, GO, Series B, 0.64%, 8/1/24 (f) | 2,000,000 | 1,983,958 | |||||||||
| Virginia Small Business Financing Authority Revenue, 2.25%, 7/1/50, (Put Date 12/29/22) (a) (h) | 1,250,000 | 1,250,289 | |||||||||
3,234,247 | |||||||||||
Washington (0.1%): | |||||||||||
Washington State University Revenue, Series A, 0.86%, 10/1/23 | 480,000 | 478,803 | |||||||||
West Virginia (0.4%): | |||||||||||
Tobacco Settlement Finance Authority Revenue, Series A, 1.19%, 6/1/23 | 1,500,000 | 1,503,571 | |||||||||
Wisconsin (0.3%): | |||||||||||
Public Finance Authority Revenue, Series S, 0.51%, 2/1/22 | 1,100,000 | 1,099,386 | |||||||||
Total Municipal Bonds (Cost $68,074,097) | 68,212,629 | ||||||||||
U.S. Treasury Obligations (2.3%) | |||||||||||
| U.S. Treasury Notes 0.38%, 10/31/23 (f) | 2,000,000 | 1,988,594 | |||||||||
1.00%, 12/15/24 | 7,000,000 | 7,007,656 | |||||||||
Total U.S. Treasury Obligations (Cost $8,992,536) | 8,996,250 | ||||||||||
See notes to financial statements.
16
| Victory Portfolios II VictoryShares USAA Core Short-Term Bond ETF | Schedule of Portfolio Investments — continued December 31, 2021 | ||||||
(Unaudited)
Security Description | Principal Amount | Value | |||||||||
Commercial Papers (2.6%) (i) | |||||||||||
AutoNation, Inc., 0.33%, 1/5/22 (a) | $ | 2,300,000 | $ | 2,299,895 | |||||||
Energy Transfer LP, 0.33%, 1/5/22 (a) | 2,000,000 | 1,999,909 | |||||||||
Jabil, Inc., 0.48%, 1/3/22 (a) | 3,800,000 | 3,799,848 | |||||||||
One Gas, Inc., 0.18%, 1/4/22 (a) | 2,000,000 | 1,999,959 | |||||||||
Total Commercial Papers (Cost $10,099,709) | 10,099,611 | ||||||||||
Total Investments (Cost $388,206,445) — 100.3% | 388,350,097 | ||||||||||
Liabilities in excess of other assets — (0.3)% | (1,314,444 | ) | |||||||||
NET ASSETS — 100.00% | $ | 387,035,653 | |||||||||
(a) Rule 144A security or other security that is restricted as to resale to institutional investors. The Fund's Adviser has deemed this security to be liquid (unless otherwise noted as illiquid) based upon procedures approved by the Board of Trustees. As of December 31, 2021, the fair value of these securities was $152,891,407 and amounted to 39.5% of net assets.
(b) Variable or Floating-Rate Security. Rate disclosed is as of December 31, 2021.
(c) The rate for certain asset-backed and mortgage-backed securities may vary based on factors relating to the pool of assets underlying the security. The rate disclosed is the rate in effect at December 31, 2021.
(d) The rates for this senior secured loan will be known on settlement date of the loan, subsequent to this report date. Senior secured loans have rates that will fluctuate over time in line with prevailing interest rates.
(e) Security or a portion of the security purchased on a delayed-delivery and/or when-issued basis.
(f) All or a portion of the security has been segregated as collateral for securities purchased on a delayed-delivery and/or when-issued basis.
(g) Security is perpetual and has no final maturity date but may be subject to calls at various dates in the future.
(h) Put Bond.
(i) Rate represents the effective yield at December 31, 2021.
bps — Basis points
GO — General Obligation
H15T5Y — 5 Year Treasury Constant Maturity Rate
IDA — Industrial Development Authority
LIBOR — London InterBank Offered Rate
LIBOR01M — 1 Month US Dollar LIBOR, rate disclosed as of December 31, 2021, based on the last reset date of the security
LIBOR03M — 3 Month US Dollar LIBOR, rate disclosed as of December 31, 2021, based on the last reset date of the security
LLC — Limited Liability Company
LP — Limited Partnership
See notes to financial statements.
17
| Victory Portfolios II VictoryShares USAA Core Short-Term Bond ETF | Schedule of Portfolio Investments — continued December 31, 2021 | ||||||
(Unaudited)
MTN — Medium Term Note
PLC — Public Limited Company
SOFR — Secured Overnight Financing Rate
US0001M — 1 Month US Dollar LIBOR, rate disclosed as of December 31, 2021, based on the last reset date of the security
US0003M — 3 Month US Dollar LIBOR, rate disclosed as of December 31, 2021, based on the last reset date of the security
USSW5 — USD 5 Year Swap Rate, rate disclosed as of December 31, 2021.
Credit Enhancements — Adds the financial strength of the provider of the enhancement to support the issuer's ability to repay the principal and interest payments when due. The enhancement may be provided by a high-quality bank, insurance company or other corporation, or a collateral trust. The enhancements do not guarantee the market values of the securities.
INS Principal and interest payments are insured by the name listed. Although bond insurance reduces the risk of loss due to default by an issuer, such bonds remain subject to the risk that value may fluctuate for other reasons, and there is no assurance that the insurance company will meet its obligations.
NBGA Principal and interest payments or, under certain circumstances, underlying mortgages, are guaranteed by a nonbank guarantee agreement from the name listed.
See notes to financial statements.
18
| Victory Portfolios II VictoryShares USAA Core Intermediate-Term Bond ETF | Schedule of Portfolio Investments December 31, 2021 | ||||||
(Unaudited)
Security Description | Principal Amount | Value | |||||||||
Asset-Backed Securities (7.8%) | |||||||||||
| Aligned Data Centers Issuer LLC, Series 2021-1A, Class A2, 1.94%, 8/15/46, Callable 8/15/24 @ 100 (a) | $ | 1,500,000 | $ | 1,477,815 | |||||||
| American Express Credit Account Master Trust, Series 2019-2, Class B, 2.86%, 11/15/24 | 2,076,000 | 2,090,213 | |||||||||
| AmeriCredit Automobile Receivables Trust, Series 2021-3, Class B, 1.17%, 8/18/27, Callable 9/18/25 @ 100 | 1,000,000 | 991,173 | |||||||||
| ARI Fleet Lease Trust, Series 2020-A, Class A3, 1.80%, 8/15/28, Callable 2/15/23 @ 100 (a) | 900,000 | 908,210 | |||||||||
| Avis Budget Rental Car Funding AESOP LLC, Series 2019-2A, Class B, 3.55%, 9/22/25, Callable 10/20/24 @ 100 (a) | 500,000 | 521,102 | |||||||||
| Bank of The West Auto Trust, Series 2019-1, Class C, 2.90%, 4/15/25, Callable 5/15/23 @ 100 (a) | 1,062,000 | 1,084,696 | |||||||||
| Bank of The West Auto Trust, Series 2017-1, Class C, 2.96%, 2/15/24, Callable 2/15/22 @ 100 (a) | 500,000 | 501,432 | |||||||||
| BCC Funding Corp. XVI LLC, Series 2019-1A, Class A2, 2.46%, 8/20/24, Callable 6/20/23 @ 100 (a) | 282,431 | 283,949 | |||||||||
| BCC Funding XVII LLC, Series 2020-1, Class B, 1.46%, 9/22/25, Callable 7/20/24 @ 100 (a) | 1,500,000 | 1,497,900 | |||||||||
| BCC Funding XVII LLC, Series 2020-1, Class A2, 0.91%, 8/20/25, Callable 7/20/24 @ 100 (a) | 875,632 | 876,750 | |||||||||
| Canadian Pacer Auto Receivables Trust, Series 2020-1A, Class A4, 1.89%, 3/19/25, Callable 7/19/23 @ 100 (a) | 433,000 | 438,382 | |||||||||
| Canadian Pacer Auto Receivables Trust, Series 2018-2A, Class B, 3.63%, 1/19/24, Callable 4/19/22 @ 100 (a) | 500,000 | 504,433 | |||||||||
CARDS II Trust, Series 2021-1A, Class A, 0.60%, 4/15/27 (a) | 2,300,000 | 2,273,362 | |||||||||
| CarMax Auto Owner Trust, Series 2021-2, Class B, 1.03%, 12/15/26, Callable 4/15/24 @ 100 | 2,000,000 | 1,983,431 | |||||||||
| CarMax Auto Owner Trust, Series 2020-1, Class B, 2.21%, 9/15/25, Callable 11/15/23 @ 100 | 1,275,000 | 1,298,329 | |||||||||
| CarNow Auto Receivables Trust, Series 2021-1A, Class A, 0.97%, 10/15/24, Callable 9/15/23 @ 100 (a) | 470,631 | 470,749 | |||||||||
| Carvana Auto Receivables Trust, Series 2021-P2, Class B, 1.27%, 3/10/27, Callable 4/10/25 @ 100 | 1,500,000 | 1,485,823 | |||||||||
| CF Hippolyta LLC, Series 2021-1A, Class A1, 1.53%, 3/15/61, Callable 3/15/24 @ 100 (a) | 1,446,758 | 1,419,617 | |||||||||
| Chesapeake Funding II LLC, Series 2019-1A, Class A1, 2.94%, 4/15/31, Callable 6/15/22 @ 100 (a) | 1,073,816 | 1,082,502 | |||||||||
| CPS Auto Receivables Trust, Series 2019-C, Class D, 3.17%, 6/16/25, Callable 7/15/23 @ 100 (a) | 2,000,000 | 2,030,437 | |||||||||
| Credit Acceptance Auto Loan Trust, Series 2021-2A, Class B, 1.26%, 4/15/30, Callable 12/15/24 @ 100 (a) | 1,038,000 | 1,022,253 | |||||||||
| Credit Acceptance Auto Loan Trust, Series 2020-1A, Class B, 2.39%, 4/16/29, Callable 1/15/24 @ 100 (a) | 823,000 | 836,334 | |||||||||
| Crossroads Asset Trust, Series 2021-A, Class A2, 0.82%, 3/20/24, Callable 4/20/24 @ 100 (a) | 559,961 | 559,918 | |||||||||
| Dell Equipment Finance Trust, Series 2020-1, Class A3, 2.24%, 2/22/23, Callable 10/22/22 @ 100 (a) | 687,500 | 692,859 | |||||||||
| Diamond Infrastructure Funding LLC, Series 2021-1A, Class A, 1.76%, 4/15/49, Callable 9/20/25 @ 100 (a) | 1,000,000 | 973,009 | |||||||||
See notes to financial statements.
19
| Victory Portfolios II VictoryShares USAA Core Intermediate-Term Bond ETF | Schedule of Portfolio Investments — continued December 31, 2021 | ||||||
(Unaudited)
Security Description | Principal Amount | Value | |||||||||
| Diamond Issuer, Series 2021-1A, Class A, 2.31%, 11/20/51, Callable 11/20/25 @ 100 (a) | $ | 1,125,000 | $ | 1,117,044 | |||||||
| Donlen Fleet Lease Funding 2 LLC, Series 2021-2, Class B, 0.98%, 12/11/34 (a) | 1,327,000 | 1,308,611 | |||||||||
| Drive Auto Receivables Trust, Series 2021-1, Class B, 0.65%, 7/15/25, Callable 10/15/23 @ 100 | 1,500,000 | 1,496,740 | |||||||||
| DT Auto Owner Trust, Series 2018-2A, Class D, 4.15%, 3/15/24, Callable 8/15/22 @ 100 (a) | 831,267 | 838,634 | |||||||||
| DT Auto Owner Trust, Series 2021-3A, Class B, 0.58%, 11/17/25, Callable 9/15/25 @ 100 (a) | 2,000,000 | 1,974,714 | |||||||||
| Encina Equipment Finance LLC, Series 2021-1A, Class B, 1.21%, 2/15/27, Callable 3/15/24 @ 100 (a) | 1,187,000 | 1,181,365 | |||||||||
| Encina Equipment Finance LLC, Series 2021-1A, Class A2, 0.74%, 12/15/26, Callable 3/15/24 @ 100 (a) | 877,000 | 875,121 | |||||||||
| Enterprise Fleet Financing LLC, Series 2020-1, Class A3, 1.86%, 12/22/25, Callable 8/20/23 @ 100 (a) | 820,000 | 831,367 | |||||||||
| Exeter Automobile Receivables Trust, Series 2017-3A, Class D, 5.28%, 10/15/24, Callable 6/15/22 @ 100 (a) | 500,000 | 510,041 | |||||||||
| Exeter Automobile Receivables Trust, Series 2021-4A, Class B, 1.26%, 5/15/26, Callable 1/15/25 @ 100 | 1,000,000 | 996,325 | |||||||||
| Exeter Automobile Receivables Trust, Series 2020-1A, Class B, 2.26%, 4/15/24, Callable 10/15/23 @ 100 (a) | 63,777 | 63,804 | |||||||||
| ExteNet LLC, Series 2019-1A, Class A2, 3.20%, 7/26/49, Callable 1/25/23 @ 100 (a) | 500,000 | 507,165 | |||||||||
| First Investors Auto Owner Trust, Series 2018-2A, Class F, 7.31%, 9/15/25, Callable 12/15/22 @ 100 (a) | 750,000 | 772,152 | |||||||||
| First Investors Auto Owner Trust, Series 2019-2A, Class C, 2.71%, 12/15/25, Callable 6/15/23 @ 100 (a) | 1,500,000 | 1,518,350 | |||||||||
FirstKey Homes Trust, Series 2021-SFR2, Class B, 1.61%, 9/17/26 (a) | 1,153,846 | 1,104,326 | |||||||||
| Flagship Credit Auto Trust, Series 2020-2, Class D, 5.75%, 4/15/26, Callable 2/15/24 @ 100 (a) | 1,000,000 | 1,071,923 | |||||||||
| Ford Credit Auto Owner Trust, Series 2020-1, Class B, 2.29%, 8/15/31, Callable 2/15/25 @ 100 (a) | 1,500,000 | 1,524,743 | |||||||||
| Foursight Capital Automobile Receivables Trust, Series 2021-1, Class B, 0.87%, 1/15/26, Callable 11/15/24 @ 100 (a) | 1,406,000 | 1,392,236 | |||||||||
| GLS Auto Receivables Issuer Trust, Series 2020-1A, Class B, 2.43%, 11/15/24, Callable 9/15/23 @ 100 (a) | 1,000,000 | 1,009,301 | |||||||||
| GM Financial Consumer Automobile Receivables Trust, Series 2020-1, Class A4, 1.90%, 3/17/25, Callable 7/16/23 @ 100 | 1,000,000 | 1,014,771 | |||||||||
| GM Financial Consumer Automobile Receivables Trust, Series 2020-2, Class A4, 1.74%, 8/18/25, Callable 10/16/23 @ 100 | 750,000 | 759,427 | |||||||||
Hertz Vehicle Financing III LP, Series 2021-2A, Class A, 1.68%, 12/27/27 (a) | 1,000,000 | 987,844 | |||||||||
Hertz Vehicle Financing LLC, Series 2021-1A, Class C, 2.05%, 12/26/25 (a) | 1,333,000 | 1,319,501 | |||||||||
| HPEFS Equipment Trust, Series 2020-1A, Class B, 1.89%, 2/20/30, Callable 2/20/23 @ 100 (a) | 385,000 | 387,668 | |||||||||
| HPEFS Equipment Trust, Series 2019-1A, Class C, 2.49%, 9/20/29, Callable 8/20/22 @ 100 (a) | 500,000 | 503,033 | |||||||||
| Hyundai Auto Receivables Trust, Series 2021-C, Class B, 1.49%, 12/15/27, Callable 12/15/25 @ 100 | 2,000,000 | 1,977,753 | |||||||||
See notes to financial statements.
20
| Victory Portfolios II VictoryShares USAA Core Intermediate-Term Bond ETF | Schedule of Portfolio Investments — continued December 31, 2021 | ||||||
(Unaudited)
Security Description | Principal Amount | Value | |||||||||
| Hyundai Auto Receivables Trust, Series 2020-C, Class B, 0.81%, 11/16/26, Callable 11/15/24 @ 100 | $ | 1,271,000 | $ | 1,248,654 | |||||||
| John Deere Owner Trust, Series 2020-A, Class A4, 1.21%, 11/16/26, Callable 7/15/23 @ 100 | 2,000,000 | 2,007,832 | |||||||||
| JPMorgan Chase Bank NA, Series 2021-2, Class B, 0.89%, 12/26/28, Callable 8/25/24 @ 100 (a) | 687,129 | 683,389 | |||||||||
| JPMorgan Chase Bank NA, Series 2021-1, Class B, 0.88%, 9/25/28, Callable 9/25/24 @ 100 (a) | 737,183 | 734,643 | |||||||||
| Kubota Credit Owner Trust, Series 2020-1A, Class A4, 2.26%, 7/15/26, Callable 9/15/23 @ 100 (a) | 433,000 | 441,750 | |||||||||
| LAD Auto Receivables Trust, Series 2021-1A, Class A, 1.30%, 8/17/26, Callable 9/15/25 @ 100 (a) | 1,817,305 | 1,813,047 | |||||||||
Master Credit Card Trust, Series 2021-1A, Class B, 0.79%, 11/21/25 (a) | 539,000 | 530,576 | |||||||||
| MMAF Equipment Finance LLC, Series 2017-B, Class A4, 2.41%, 11/15/24, Callable 9/15/27 @ 100 (a) | 512,889 | 515,928 | |||||||||
| MVW LLC, Series 2021-1WA, Class A, 1.14%, 1/22/41, Callable 4/20/27 @ 100 (a) | 876,094 | 860,648 | |||||||||
| Navient Student Loan Trust, Series 2018-2A, Class B, 1.25% (LIBOR01M+115bps), 3/25/67, Callable 11/25/33 @ 100 (a) (b) | 1,000,000 | 975,833 | |||||||||
| Nelnet Student Loan Trust, Series 2019-5, Class A, 2.53%, 10/25/67, Callable 5/25/35 @ 100 (a) | 1,133,683 | 1,157,969 | |||||||||
| New Economy Assets Phase 1 Sponsor LLC, Series 2021-1, Class A1, 1.91%, 10/20/61, Callable 10/20/24 @ 100 (a) | 1,807,000 | 1,771,785 | |||||||||
NP SPE II LLC, Series 2019-2A, Class C1, 6.44%, 11/19/49 (a) | 976,744 | 910,644 | |||||||||
NP SPE LLC, Series 2019-1A, Class A2, 3.24%, 9/20/49 (a) | 500,000 | 506,092 | |||||||||
| Oscar U.S. Funding XIII LLC, Series 2021-2A, Class A4, 1.27%, 9/11/28, Callable 6/10/25 @ 100 (a) | 1,500,000 | 1,475,756 | |||||||||
| Pawnee Equipment Receivables LLC, Series 2020-1, Class B, 1.84%, 1/15/26, Callable 2/15/24 @ 100 (a) | 1,000,000 | 1,006,308 | |||||||||
| Prestige Auto Receivables Trust, Series 2020-1A, Class C, 1.31%, 11/16/26, Callable 6/15/23 @ 100 (a) | 929,000 | 931,367 | |||||||||
| Prestige Auto Receivables Trust, Series 2021-1A, Class C, 1.53%, 2/15/28, Callable 10/15/25 @ 100 (a) | 1,000,000 | 991,818 | |||||||||
| Progress Residential Trust, Series 2021-SFR6, Class A, 1.52%, 7/17/38, Callable 7/17/26 @ 100 (a) | 1,100,000 | 1,075,479 | |||||||||
PSNH Funding LLC, Series 2018-1, Class A3, 3.81%, 2/1/35 | 1,000,000 | 1,132,319 | |||||||||
| Santander Bank NA, Series 2021-1A, Class B, 1.83%, 12/15/31, Callable 6/15/25 @ 100 (a) | 2,286,000 | 2,283,891 | |||||||||
| Santander Consumer Auto Receivables Trust, Series 2020-AA, Class D, 5.49%, 4/15/26, Callable 11/15/23 @ 100 (a) | 1,000,000 | 1,061,369 | |||||||||
| SCF Equipment Leasing LLC, Series 2020-1A, Class A3, 1.19%, 10/20/27, Callable 3/20/25 @ 100 (a) | 1,000,000 | 1,001,732 | |||||||||
| SLM Student Loan Trust, Series 2006-10, Class B, 0.34% (LIBOR03M+22bps), 3/25/44, Callable 7/25/32 @ 100 (b) | 204,502 | 192,131 | |||||||||
| SLM Student Loan Trust, Series 2007-1, Class B, 0.34% (LIBOR03M+22bps), 1/27/42, Callable 7/25/29 @ 100 (b) | 325,179 | 306,903 | |||||||||
| Synchrony Credit Card Master Note Trust, Series 2018-2, Class A, 3.47%, 5/15/26 | 2,000,000 | 2,072,263 | |||||||||
| Toyota Auto Loan Extended Note Trust, Series 2021-1A, Class A, 1.07%, 2/27/34, Callable 2/25/26 @ 100 (a) (c) | 2,000,000 | 1,961,039 | |||||||||
See notes to financial statements.
21
| Victory Portfolios II VictoryShares USAA Core Intermediate-Term Bond ETF | Schedule of Portfolio Investments — continued December 31, 2021 | ||||||
(Unaudited)
Security Description | Principal Amount | Value | |||||||||
| Transportation Finance Equipment Trust, Series 2019-1, Class A4, 1.88%, 3/25/24, Callable 5/23/23 @ 100 (a) | $ | 1,280,000 | $ | 1,294,483 | |||||||
Trillium Credit Card Trust II, Series 2021-1A, Class C, 2.42%, 10/26/29 (a) | 2,000,000 | 1,992,090 | |||||||||
Trillium Credit Card Trust II, Series 2021-1A, Class A, 1.53%, 10/26/29 (a) | 2,000,000 | 1,991,951 | |||||||||
| VB-S1 Issuer LLC, Series 2018-1A, Class C, 3.41%, 2/15/48, Callable 2/15/22 @ 100 (a) | 500,000 | 502,808 | |||||||||
| Wepco Environmental Trust Finance I LLC, Series 2021-1, Class A, 1.58%, 12/15/35 | 1,447,897 | 1,451,741 | |||||||||
| Westlake Automobile Receivables Trust, Series 2021-3A, Class C, 1.58%, 1/15/27, Callable 12/15/24 @ 100 (a) | 1,000,000 | 998,115 | |||||||||
| Westlake Automobile Receivables Trust, Series 2018-2A, Class D, 4.00%, 1/16/24, Callable 2/15/22 @ 100 (a) | 33,493 | 33,524 | |||||||||
| Westlake Automobile Receivables Trust, Series 2018-3A, Class D, 4.00%, 10/16/23, Callable 7/15/22 @ 100 (a) | 470,254 | 473,496 | |||||||||
| Westlake Automobile Receivables Trust, Series 2019-2A, Class E, 4.02%, 4/15/25, Callable 3/15/23 @ 100 (a) | 1,000,000 | 1,025,468 | |||||||||
Total Asset-Backed Securities (Cost $94,109,110) | 93,763,478 | ||||||||||
Collateralized Mortgage Obligations (2.5%) | |||||||||||
Aventura Mall Trust, Series 2018-AVM, Class D, 4.11%, 7/5/40 (a) (c) | 1,000,000 | 996,671 | |||||||||
| BAMLL Commercial Mortgage Securities Trust, Series 2015-200P, Class D, 3.60% (LIBOR01M+105bps), 4/14/33, Callable 4/14/25 @ 100 (a) (b) | 500,000 | 509,080 | |||||||||
| BBCMS Mortgage Trust, Series 2020-BID, Class B, 2.65% (LIBOR01M+254bps), 10/15/37 (a) (b) | 1,750,000 | 1,754,177 | |||||||||
| Benchmark Mortgage Trust, Series 2020-B17, Class ASB, 2.18%, 3/15/53, Callable 11/15/29 @ 100 | 1,000,000 | 1,007,127 | |||||||||
| BPR Trust, Series 2021-TY, Class A, 1.16% (LIBOR01M+105bps), 9/23/23 (a) (b) | 865,000 | 863,396 | |||||||||
| BX Commercial Mortgage Trust, Series 2019-XL, Class B, 1.19% (LIBOR01M+108bps), 10/15/36 (a) (b) | 218,450 | 218,235 | |||||||||
| BX Commercial Mortgage Trust, Series 2019-XL, Class D, 1.56% (LIBOR01M+145bps), 10/15/36 (a) (b) | 1,015,750 | 1,012,876 | |||||||||
BX Trust, Series 2019-OC11, Class A, 3.20%, 12/9/41 (a) | 923,077 | 972,942 | |||||||||
BXP Trust, Series 2021-601L, Class C, 2.78%, 1/15/44 (a) (c) | 1,500,000 | 1,441,087 | |||||||||
| CHT Mortgage Trust, Series 2017-CSMO, Class E, 3.11% (LIBOR01M+300bps), 11/15/36 (a) (b) | 1,000,000 | 999,884 | |||||||||
| Citigroup Commercial Mortgage Trust, Series 2020-GC46, Class AAB, 2.61%, 1/15/53, Callable 11/15/29 @ 100 | 732,000 | 754,841 | |||||||||
| Citigroup Commercial Mortgage Trust, Series 2020-555, Class A, 2.65%, 12/10/41 (a) | 2,000,000 | 2,024,607 | |||||||||
| Citigroup Commercial Mortgage Trust, Series 2017-P8, Class AS, 3.79%, 9/15/50, Callable 9/15/27 @ 100 (c) | 500,000 | 539,232 | |||||||||
| Citigroup Commercial Mortgage Trust, Series 2019-SMRT, Class C, 4.68%, 1/10/36 (a) | 500,000 | 517,480 | |||||||||
COMM Mortgage Trust, Series 2015-LC23, Class AM, 4.16%, 10/10/48 (c) | 250,000 | 267,397 | |||||||||
| COMM Mortgage Trust, Series 2020-CX, Class A, 2.17%, 11/10/46, Callable 11/10/30 @ 100 (a) | 1,500,000 | 1,479,883 | |||||||||
| COMM Mortgage Trust, Series 2015-PC1, Class B, 4.32%, 7/10/50, Callable 6/10/25 @ 100 (c) | 865,000 | 922,058 | |||||||||
See notes to financial statements.
22
| Victory Portfolios II VictoryShares USAA Core Intermediate-Term Bond ETF | Schedule of Portfolio Investments — continued December 31, 2021 | ||||||
(Unaudited)
Security Description | Principal Amount | Value | |||||||||
| COMM Mortgage Trust, Series 2014-277P, Class A, 3.61%, 8/10/49, Callable 8/10/24 @ 100 (a) (c) | $ | 1,000,000 | $ | 1,045,335 | |||||||
| DBJPM Mortgage Trust, Series 2016-SFC, Class A, 2.83%, 8/10/36, Callable 8/10/26 @ 100 (a) | 250,000 | 253,420 | |||||||||
| Extended Stay America Trust, Series 2021-ESH, Class B, 1.49% (LIBOR01M+138bps), 7/15/38 (a) (b) | 773,753 | 774,807 | |||||||||
FREMF Mortgage Trust, Series 2019-K99, Class B, 3.65%, 9/25/29 (a) (c) | 1,000,000 | 1,065,882 | |||||||||
| GS Mortgage Securities Corp. Trust, Series 2012-ALOH, Class A, 3.55%, 4/10/34 (a) | 1,000,000 | 999,997 | |||||||||
| GS Mortgage Securities Corp. Trust, Series 2017-GPTX, Class A, 2.86%, 5/10/34 (a) | 1,000,000 | 997,613 | |||||||||
| Houston Galleria Mall Trust, Series 2015-HGLR, Class A1A2, 3.09%, 3/5/37 (a) | 1,000,000 | 1,021,158 | |||||||||
| Hudson Yards Mortgage Trust, Series 2019-30HY, Class D, 3.44%, 7/10/39 (a) (c) | 595,000 | 607,703 | |||||||||
| J.P. Morgan Chase Commercial Mortgage Securities Trust, Series 2021-2NU, Class B, 2.08%, 1/5/40 (a) | 1,000,000 | 974,891 | |||||||||
| J.P. Morgan Chase Commercial Mortgage Securities Trust, Series 2010-C2, Class C, 5.69%, 11/15/43, Callable 1/15/22 @ 100 (a) (c) | 438,837 | 438,917 | |||||||||
Manhattan West, Series 2020-1MW, Class A, 2.13%, 9/10/40 (a) | 750,000 | 748,451 | |||||||||
| Morgan Stanley Capital I Trust, Series 2021-PLZA, Class B, 2.81%, 11/9/31 (a) | 1,000,000 | 1,006,104 | |||||||||
SLG Office Trust, Series 2021-OVA, Class A, 2.59%, 7/15/41 (a) | 800,000 | 820,181 | |||||||||
| SREIT Trust, Series 2021-MFP2, Class B, 1.27% (LIBOR01M+117bps), 11/15/36 (a) (b) | 1,500,000 | 1,492,499 | |||||||||
| VLS Commercial Mortgage Trust, Series 2020-LAB, Class A, 2.13%, 10/10/42 (a) | 1,000,000 | 982,640 | |||||||||
| Wells Fargo Commercial Mortgage Trust, Series 2018-AUS, Class A, 4.06%, 7/17/36 (a) (c) | 250,000 | 273,728 | |||||||||
Total Collateralized Mortgage Obligations (Cost $30,023,691) | 29,784,299 | ||||||||||
Corporate Bonds (32.5%) | |||||||||||
Communication Services (1.7%): | |||||||||||
| AT&T, Inc. 4.35%, 3/1/29, Callable 12/1/28 @ 100 | 1,000,000 | 1,125,150 | |||||||||
3.10%, 2/1/43, Callable 8/1/42 @ 100 | 2,000,000 | 1,936,940 | |||||||||
CenturyLink, Inc., 4.50%, 1/15/29, Callable 1/15/24 @ 102.25 (a) | 1,000,000 | 969,730 | |||||||||
| Charter Communications Operating LLC/Charter Communications Operating Capital 3.75%, 2/15/28, Callable 11/15/27 @ 100 | 500,000 | 536,020 | |||||||||
2.25%, 1/15/29, Callable 11/15/28 @ 100 | 2,000,000 | 1,956,080 | |||||||||
2.30%, 2/1/32, Callable 11/1/31 @ 100 | 2,500,000 | 2,375,625 | |||||||||
Comcast Corp., 3.55%, 5/1/28, Callable 2/1/28 @ 100 | 750,000 | 821,138 | |||||||||
Fox Corp., 4.71%, 1/25/29, Callable 10/25/28 @ 100 | 1,000,000 | 1,143,120 | |||||||||
| T-Mobile USA, Inc. 4.75%, 2/1/28, Callable 2/1/23 @ 102.38 | 643,000 | 676,905 | |||||||||
3.88%, 4/15/30, Callable 1/15/30 @ 100 | 1,000,000 | 1,094,270 | |||||||||
2.25%, 11/15/31, Callable 8/15/31 @ 100 | 3,000,000 | 2,910,660 | |||||||||
See notes to financial statements.
23
| Victory Portfolios II VictoryShares USAA Core Intermediate-Term Bond ETF | Schedule of Portfolio Investments — continued December 31, 2021 | ||||||
(Unaudited)
Security Description | Principal Amount | Value | |||||||||
| Verizon Communications, Inc. 2.10%, 3/22/28, Callable 1/22/28 @ 100 | $ | 1,500,000 | $ | 1,504,575 | |||||||
1.75%, 1/20/31, Callable 10/20/30 @ 100 | 3,000,000 | 2,839,440 | |||||||||
ViacomCBS, Inc., 3.38%, 2/15/28, Callable 11/15/27 @ 100 | 1,000,000 | 1,065,950 | |||||||||
20,955,603 | |||||||||||
Consumer Discretionary (2.3%): | |||||||||||
| AutoNation, Inc. 4.75%, 6/1/30, Callable 3/1/30 @ 100 | 600,000 | 686,160 | |||||||||
2.40%, 8/1/31, Callable 5/1/31 @ 100 | 3,000,000 | 2,903,820 | |||||||||
AutoZone, Inc., 3.75%, 6/1/27, Callable 3/1/27 @ 100 | 500,000 | 547,035 | |||||||||
Brunswick Corp., 2.40%, 8/18/31, Callable 5/18/31 @ 100 | 1,500,000 | 1,445,985 | |||||||||
D.R. Horton, Inc., 4.75%, 2/15/23, Callable 11/15/22 @ 100 | 500,000 | 516,450 | |||||||||
| Daimler Finance North America LLC 3.70%, 5/4/23 (a) | 1,000,000 | 1,036,000 | |||||||||
3.45%, 1/6/27 (a) | 1,000,000 | 1,077,370 | |||||||||
Daimler Trucks Finance North America LLC, 2.38%, 12/14/28 (a) | 1,050,000 | 1,055,565 | |||||||||
| Genting New York LLC/GENNY Capital, Inc., 3.30%, 2/15/26, Callable 1/15/26 @ 100 (a) | 1,000,000 | 990,030 | |||||||||
| Hasbro, Inc. 3.55%, 11/19/26, Callable 9/19/26 @ 100 | 600,000 | 643,938 | |||||||||
3.90%, 11/19/29, Callable 8/19/29 @ 100 | 1,000,000 | 1,102,440 | |||||||||
Kohl's Corp., 3.38%, 5/1/31, Callable 2/1/31 @ 100 (d) | 2,000,000 | 2,035,900 | |||||||||
Marriott International, Inc., 2.85%, 4/15/31, Callable 1/15/31 @ 100 | 2,000,000 | 1,995,240 | |||||||||
| Murphy Oil USA, Inc. 4.75%, 9/15/29, Callable 9/15/24 @ 102.38 | 1,000,000 | 1,054,720 | |||||||||
3.75%, 2/15/31, Callable 2/15/26 @ 101.88 (a) | 235,000 | 233,552 | |||||||||
Newell Brands, Inc., 4.70%, 4/1/26, Callable 1/1/26 @ 100 | 500,000 | 545,345 | |||||||||
Nordstrom, Inc., 4.25%, 8/1/31, Callable 5/1/31 @ 100 (d) | 750,000 | 737,198 | |||||||||
Novant Health, Inc., 2.64%, 11/1/36, Callable 8/1/36 @ 100 | 2,000,000 | 2,016,560 | |||||||||
O'Reilly Automotive, Inc., 4.20%, 4/1/30, Callable 1/1/30 @ 100 | 500,000 | 565,130 | |||||||||
| Resorts World Las Vegas LLC/RWLV Capital, Inc., 4.63%, 4/6/31, Callable 1/6/31 @ 100 (a) | 1,300,000 | 1,295,684 | |||||||||
Sodexo, Inc., 2.72%, 4/16/31, Callable 1/16/31 @ 100 (a) | 2,000,000 | 2,047,780 | |||||||||
Stellantis Finance U.S., Inc., 2.69%, 9/15/31, Callable 6/15/31 @ 100 (a) | 1,200,000 | 1,182,024 | |||||||||
VF Corp., 2.95%, 4/23/30, Callable 1/23/30 @ 100 | 500,000 | 518,930 | |||||||||
Volkswagen Group of America Finance LLC, 3.20%, 9/26/26 (a) | 1,000,000 | 1,054,230 | |||||||||
27,287,086 | |||||||||||
Consumer Staples (2.3%): | |||||||||||
Altria Group, Inc., 2.45%, 2/4/32, Callable 11/4/31 @ 100 | 1,500,000 | 1,425,765 | |||||||||
| Anheuser-Busch InBev Worldwide, Inc. 3.65%, 2/1/26, Callable 11/1/25 @ 100 | 1,000,000 | 1,078,730 | |||||||||
3.50%, 6/1/30, Callable 3/1/30 @ 100 | 1,500,000 | 1,643,535 | |||||||||
4.38%, 4/15/38, Callable 10/15/37 @ 100 | 500,000 | 586,015 | |||||||||
5.45%, 1/23/39, Callable 7/23/38 @ 100 | 500,000 | 656,925 | |||||||||
4.35%, 6/1/40, Callable 12/1/39 @ 100 | 1,000,000 | 1,176,030 | |||||||||
| BAT Capital Corp. 2.73%, 3/25/31, Callable 12/25/30 @ 100 | 1,000,000 | 971,280 | |||||||||
4.39%, 8/15/37, Callable 2/15/37 @ 100 | 1,250,000 | 1,322,587 | |||||||||
Bunge Ltd. Finance Corp., 2.75%, 5/14/31, Callable 2/14/31 @ 100 | 2,000,000 | 2,030,500 | |||||||||
See notes to financial statements.
24
| Victory Portfolios II VictoryShares USAA Core Intermediate-Term Bond ETF | Schedule of Portfolio Investments — continued December 31, 2021 | ||||||
(Unaudited)
Security Description | Principal Amount | Value | |||||||||
Cargill, Inc., 2.13%, 11/10/31, Callable 8/10/31 @ 100 (a) | $ | 1,000,000 | $ | 984,540 | |||||||
Church & Dwight Co., Inc., 2.30%, 12/15/31, Callable 9/15/31 @ 100 | 1,000,000 | 1,007,040 | |||||||||
| Constellation Brands, Inc. 3.50%, 5/9/27, Callable 2/9/27 @ 100 | 750,000 | 808,470 | |||||||||
2.25%, 8/1/31, Callable 5/1/31 @ 100 | 1,769,000 | 1,729,074 | |||||||||
General Mills, Inc., 4.55%, 4/17/38, Callable 10/17/37 @ 100 | 1,000,000 | 1,194,110 | |||||||||
JBS Finance Luxembourg Sarl, 2.50%, 1/15/27, Callable 12/15/26 @ 100 (a) | 1,500,000 | 1,492,800 | |||||||||
Keurig Dr Pepper, Inc., 2.25%, 3/15/31, Callable 12/15/30 @ 100 | 1,000,000 | 987,540 | |||||||||
Kraft Heinz Foods Co., 3.75%, 4/1/30, Callable 1/1/30 @ 100 | 1,000,000 | 1,080,440 | |||||||||
Mars, Inc., 3.88%, 4/1/39, Callable 10/1/38 @ 100 (a) | 1,000,000 | 1,156,950 | |||||||||
| McCormick & Co., Inc. 2.50%, 4/15/30, Callable 1/15/30 @ 100 | 375,000 | 379,058 | |||||||||
1.85%, 2/15/31, Callable 11/15/30 @ 100 | 1,000,000 | 957,630 | |||||||||
PepsiCo, Inc., 2.75%, 3/19/30, Callable 12/19/29 @ 100 | 1,000,000 | 1,057,280 | |||||||||
| Sysco Corp. 5.95%, 4/1/30, Callable 1/1/30 @ 100 | 260,000 | 324,987 | |||||||||
2.45%, 12/14/31, Callable 9/14/31 @ 100 | 1,500,000 | 1,504,200 | |||||||||
The Coca-Cola Co., 2.00%, 3/5/31 | 2,000,000 | 1,994,120 | |||||||||
The Kroger Co., 3.50%, 2/1/26, Callable 11/1/25 @ 100 | 500,000 | 535,755 | |||||||||
28,085,361 | |||||||||||
Energy (2.6%): | |||||||||||
| Baker Hughes Holdings LLC/Baker Hughes Co-Obligor, Inc., 2.06%, 12/15/26, Callable 11/15/26 @ 100 | 1,312,000 | 1,324,792 | |||||||||
| Boardwalk Pipelines LP 4.45%, 7/15/27, Callable 4/15/27 @ 100 | 1,500,000 | 1,645,020 | |||||||||
4.80%, 5/3/29, Callable 2/3/29 @ 100 | 500,000 | 560,540 | |||||||||
Buckeye Partners LP, 4.13%, 12/1/27, Callable 9/1/27 @ 100 | 1,000,000 | 1,032,310 | |||||||||
Cameron LNG LLC, 3.30%, 1/15/35, Callable 9/15/34 @ 100 (a) | 1,091,000 | 1,143,695 | |||||||||
| Cheniere Corpus Christi Holdings LLC, 2.74%, 12/31/39, Callable 7/4/39 @ 100 (a) | 1,333,000 | 1,304,154 | |||||||||
Diamondback Energy, Inc., 3.25%, 12/1/26, Callable 10/1/26 @ 100 | 1,000,000 | 1,055,600 | |||||||||
Enable Midstream Partners LP, 4.15%, 9/15/29, Callable 6/15/29 @ 100 | 1,000,000 | 1,074,430 | |||||||||
Energy Transfer LP, 3.75%, 5/15/30, Callable 2/15/30 @ 100 | 1,000,000 | 1,062,810 | |||||||||
| Enterprise Products Operating LLC, 2.80%, 1/31/30, Callable 10/31/29 @ 100 | 1,000,000 | 1,042,930 | |||||||||
EQT Corp., 7.50%, 2/1/30, Callable 11/1/29 @ 100 | 514,000 | 659,878 | |||||||||
Exxon Mobil Corp., 2.61%, 10/15/30, Callable 7/15/30 @ 100 | 1,500,000 | 1,556,670 | |||||||||
Florida Gas Transmission Co. LLC, 2.55%, 7/1/30, Callable 4/1/30 @ 100 (a) | 750,000 | 754,718 | |||||||||
Gray Oak Pipeline LLC, 3.45%, 10/15/27, Callable 8/15/27 @ 100 (a) | 1,334,000 | 1,394,817 | |||||||||
| Hilcorp Energy I LP/Hilcorp Finance Co. 6.25%, 11/1/28, Callable 11/1/23 @ 103.13 (a) | 1,000,000 | 1,064,640 | |||||||||
6.00%, 2/1/31, Callable 2/1/26 @ 103 (a) | 396,000 | 410,268 | |||||||||
HollyFrontier Corp., 4.50%, 10/1/30, Callable 7/1/30 @ 100 | 2,000,000 | 2,162,440 | |||||||||
| Midwest Connector Capital Co. LLC, 4.63%, 4/1/29, Callable 1/1/29 @ 100 (a) | 500,000 | 539,010 | |||||||||
| MPLX LP 4.25%, 12/1/27, Callable 9/1/27 @ 100 | 500,000 | 553,910 | |||||||||
4.00%, 3/15/28, Callable 12/15/27 @ 100 | 750,000 | 815,295 | |||||||||
4.80%, 2/15/29, Callable 11/15/28 @ 100 | 250,000 | 285,812 | |||||||||
See notes to financial statements.
25
| Victory Portfolios II VictoryShares USAA Core Intermediate-Term Bond ETF | Schedule of Portfolio Investments — continued December 31, 2021 | ||||||
(Unaudited)
Security Description | Principal Amount | Value | |||||||||
| Murphy Oil Corp. 6.88%, 8/15/24, Callable 2/7/22 @ 101.72 | $ | 448,000 | $ | 456,552 | |||||||
5.75%, 8/15/25, Callable 2/7/22 @ 102.88 | 500,000 | 513,755 | |||||||||
| Occidental Petroleum Corp. 3.40%, 4/15/26, Callable 1/15/26 @ 100 | 1,000,000 | 1,025,450 | |||||||||
4.40%, 8/15/49, Callable 2/15/49 @ 100 | 500,000 | 508,175 | |||||||||
ONEOK, Inc., 4.55%, 7/15/28, Callable 4/15/28 @ 100 | 500,000 | 553,370 | |||||||||
Pioneer Natural Resources Co., 1.90%, 8/15/30, Callable 5/15/30 @ 100 | 1,500,000 | 1,424,100 | |||||||||
| Plains All American Pipeline LP/PAA Finance Corp., 3.55%, 12/15/29, Callable 9/15/29 @ 100 | 2,280,000 | 2,371,132 | |||||||||
Rockies Express Pipeline LLC, 4.95%, 7/15/29, Callable 4/15/29 @ 100 (a) | 1,000,000 | 1,073,330 | |||||||||
Sabal Trail Transmission LLC, 4.25%, 5/1/28, Callable 2/1/28 @ 100 (a) | 1,000,000 | 1,115,000 | |||||||||
Southwestern Energy Co., 7.75%, 10/1/27, Callable 10/1/22 @ 103.88 (d) | 500,000 | 538,955 | |||||||||
31,023,558 | |||||||||||
Financials (8.0%): | |||||||||||
American Honda Finance Corp., 1.30%, 9/9/26 | 1,000,000 | 988,330 | |||||||||
AmFam Holdings, Inc., 2.81%, 3/11/31, Callable 12/11/30 @ 100 (a) | 1,000,000 | 1,021,760 | |||||||||
Assurant, Inc., 2.65%, 1/15/32, Callable 10/15/31 @ 100 | 1,000,000 | 981,610 | |||||||||
Athene Global Funding, 1.45%, 1/8/26 (a) | 1,000,000 | 986,970 | |||||||||
Athene Holding Ltd., 3.50%, 1/15/31, Callable 10/15/30 @ 100 | 1,000,000 | 1,055,430 | |||||||||
AXA Equitable Holdings, Inc., 4.35%, 4/20/28, Callable 1/20/28 @ 100 | 1,000,000 | 1,120,320 | |||||||||
| Bank of America Corp. 1.53% (SOFR+65bps), 12/6/25, Callable 12/6/24 @ 100, MTN (b) | 500,000 | 501,275 | |||||||||
1.66% (SOFR+91bps), 3/11/27, Callable 3/11/26 @ 100 (b) | 1,500,000 | 1,489,485 | |||||||||
3.70% (LIBOR03M+151bps), 4/24/28, Callable 4/24/27 @ 100 (b) | 1,000,000 | 1,085,880 | |||||||||
2.57% (SOFR+121bps), 10/20/32, Callable 10/20/31 @ 100 (b) | 2,750,000 | 2,765,565 | |||||||||
BB&T Corp., 4.25%, 9/30/24 | 750,000 | 799,598 | |||||||||
Belrose Funding Trust, 2.33%, 8/15/30, Callable 5/15/30 @ 100 (a) | 1,000,000 | 980,140 | |||||||||
| Blackstone Private Credit Fund, 2.63%, 12/15/26, Callable 11/15/26 @ 100 (a) | 1,290,000 | 1,258,743 | |||||||||
Blue Owl Finance LLC, 3.13%, 6/10/31, Callable 3/10/31 @ 100 (a) | 1,000,000 | 978,540 | |||||||||
| BMW US Capital LLC 1.25%, 8/12/26, Callable 7/12/26 @ 100 (a) | 1,000,000 | 984,730 | |||||||||
3.75%, 4/12/28, Callable 1/12/28 @ 100 (a) | 1,000,000 | 1,103,090 | |||||||||
| Cadence Bancorp, 4.75% (LIBOR03M+303bps), 6/30/29, Callable 6/30/24 @ 100 (b) | 500,000 | 530,380 | |||||||||
| Cadence Bank, 4.13% (LIBOR03M+247bps), 11/20/29, Callable 11/20/24 @ 100 (b) | 625,000 | 646,881 | |||||||||
| Capital One Financial Corp. 3.75%, 7/28/26, Callable 6/28/26 @ 100 | 1,000,000 | 1,071,410 | |||||||||
2.36% (SOFR+134bps), 7/29/32, Callable 7/29/31 @ 100 (b) | 1,000,000 | 948,730 | |||||||||
CIT Group, Inc., 5.25%, 3/7/25, Callable 12/7/24 @ 100 | 500,000 | 549,430 | |||||||||
Citigroup, Inc., 2.52% (SOFR+118bps), 11/3/32, Callable 11/3/31 @ 100 (b) | 2,000,000 | 2,000,680 | |||||||||
Citizens Financial Group, Inc., 2.50%, 2/6/30, Callable 11/6/29 @ 100 | 2,000,000 | 2,010,620 | |||||||||
| Compeer Financial FLCA/Compeer Financial PCA, 3.38% (SOFR+197bps), 6/1/36, Callable 6/1/31 @ 100 (a) (b) | 978,000 | 931,838 | |||||||||
Credit Acceptance Corp., 6.63%, 3/15/26, Callable 3/15/22 @ 103.31 | 500,000 | 520,650 | |||||||||
F&G Global Funding, 2.00%, 9/20/28 (a) | 2,000,000 | 1,952,760 | |||||||||
Fifth Third Bancorp, 3.95%, 3/14/28, Callable 2/14/28 @ 100 | 500,000 | 552,090 | |||||||||
First American Financial Corp., 2.40%, 8/15/31, Callable 5/15/31 @ 100 | 2,275,000 | 2,229,841 | |||||||||
See notes to financial statements.
26
| Victory Portfolios II VictoryShares USAA Core Intermediate-Term Bond ETF | Schedule of Portfolio Investments — continued December 31, 2021 | ||||||
(Unaudited)
Security Description | Principal Amount | Value | |||||||||
| First Citizens BancShares, Inc., 3.37% (SOFR+247bps), 3/15/30, Callable 3/15/25 @ 100 (b) | $ | 1,000,000 | $ | 1,015,470 | |||||||
First Horizon Bank, 5.75%, 5/1/30, Callable 2/1/30 @ 100 | 500,000 | 600,060 | |||||||||
| Ford Motor Credit Co. LLC 4.54%, 8/1/26, Callable 6/1/26 @ 100 | 1,000,000 | 1,085,840 | |||||||||
5.11%, 5/3/29, Callable 2/3/29 @ 100 | 500,000 | 568,750 | |||||||||
FS KKR Capital Corp., 4.63%, 7/15/24, Callable 6/15/24 @ 100 | 1,000,000 | 1,054,220 | |||||||||
| GA Global Funding Trust 1.63%, 1/15/26 (a) | 250,000 | 248,058 | |||||||||
1.95%, 9/15/28 (a) | 1,000,000 | 974,370 | |||||||||
| Glencore Funding LLC 2.50%, 9/1/30, Callable 6/1/30 @ 100 (a) | 500,000 | 485,800 | |||||||||
2.85%, 4/27/31, Callable 1/27/31 @ 100 (a) | 1,000,000 | 992,810 | |||||||||
Global Atlantic Financial Co., 4.40%, 10/15/29, Callable 7/15/29 @ 100 (a) | 1,714,000 | 1,847,675 | |||||||||
Guardian Life Global Funding, 1.25%, 5/13/26 (a) | 2,000,000 | 1,974,080 | |||||||||
Huntington Bancshares, Inc., 2.49%, 8/15/36, Callable 8/15/31 @ 100 (a) | 1,000,000 | 957,930 | |||||||||
| Hyundai Capital America 3.40%, 6/20/24 (a) | 500,000 | 522,360 | |||||||||
3.50%, 11/2/26, Callable 9/2/26 @ 100 (a) | 500,000 | 530,600 | |||||||||
ILFC E-Capital Trust I, 3.37%, 12/21/65, Callable 2/7/22 @ 100 (a) | 500,000 | 409,635 | |||||||||
| JPMorgan Chase & Co. 2.52% (SOFR+204bps), 4/22/31, Callable 4/22/30 @ 100 (b) | 2,500,000 | 2,528,975 | |||||||||
1.95% (SOFR+1bps), 2/4/32, Callable 2/4/31 @ 100 (b) | 1,333,000 | 1,284,625 | |||||||||
KeyBank NA, 3.90%, 4/13/29 | 1,500,000 | 1,651,440 | |||||||||
KeyCorp, 2.25%, 4/6/27, MTN | 500,000 | 508,400 | |||||||||
| Level 3 Financing, Inc. 3.75%, 7/15/29, Callable 1/15/24 @ 101.88 (a) | 1,500,000 | 1,436,250 | |||||||||
3.88%, 11/15/29, Callable 8/15/29 @ 100 (a) | 1,500,000 | 1,529,670 | |||||||||
Lincoln National Corp., 3.80%, 3/1/28, Callable 12/1/27 @ 100 | 500,000 | 548,820 | |||||||||
| Main Street Capital Corp. 4.50%, 12/1/22 | 500,000 | 512,735 | |||||||||
3.00%, 7/14/26, Callable 6/14/26 @ 100 | 1,000,000 | 1,003,110 | |||||||||
MassMutual Global Funding II, 1.20%, 7/16/26 (a) (d) | 1,500,000 | 1,471,125 | |||||||||
Mercury General Corp., 4.40%, 3/15/27, Callable 12/15/26 @ 100 | 1,000,000 | 1,103,010 | |||||||||
| Morgan Stanley, 2.51% (SOFR+120bps), 10/20/32, MTN, Callable 10/20/31 @ 100 (b) | 4,250,000 | 4,252,337 | |||||||||
| New York Community Bancorp, Inc., 5.90% (LIBOR03M+278bps), 11/6/28, Callable 11/6/23 @ 100 (b) | 500,000 | 539,000 | |||||||||
New York Life Global Funding, 1.85%, 8/1/31 (a) | 1,500,000 | 1,459,650 | |||||||||
Pacific Life Global Funding II, 1.38%, 4/14/26 (a) | 2,000,000 | 1,990,420 | |||||||||
Pine Street Trust I, 4.57%, 2/15/29, Callable 11/15/28 @ 100 (a) | 500,000 | 564,215 | |||||||||
Primerica, Inc., 2.80%, 11/19/31, Callable 8/19/31 @ 100 | 1,500,000 | 1,517,070 | |||||||||
Principal Life Global Funding II, 1.25%, 8/16/26 (a) | 2,000,000 | 1,953,040 | |||||||||
Protective Life Global Funding, 1.90%, 7/6/28 (a) | 2,000,000 | 1,956,640 | |||||||||
Prudential Financial, Inc., 3.94%, 12/7/49, Callable 6/7/49 @ 100 | 1,000,000 | 1,174,510 | |||||||||
Regions Financial Corp., 1.80%, 8/12/28, Callable 6/12/28 @ 100 | 4,000,000 | 3,916,560 | |||||||||
| Santander Holdings USA, Inc. 3.40%, 1/18/23, Callable 12/18/22 @ 100 | 250,000 | 255,513 | |||||||||
4.40%, 7/13/27, Callable 4/14/27 @ 100 | 750,000 | 824,190 | |||||||||
Stewart Information Services Corp., 3.60%, 11/15/31, Callable 8/15/31 @ 100 | 1,500,000 | 1,519,740 | |||||||||
See notes to financial statements.
27
| Victory Portfolios II VictoryShares USAA Core Intermediate-Term Bond ETF | Schedule of Portfolio Investments — continued December 31, 2021 | ||||||
(Unaudited)
Security Description | Principal Amount | Value | |||||||||
| Synchrony Financial 4.50%, 7/23/25, Callable 4/23/25 @ 100 | $ | 500,000 | $ | 540,545 | |||||||
5.15%, 3/19/29, Callable 12/19/28 @ 100 | 500,000 | 575,030 | |||||||||
| Synovus Bank/Columbus GA, 4.00% (H15T5Y+363bps), 10/29/30, Callable 10/29/25 @ 100 (b) | 500,000 | 523,320 | |||||||||
| Synovus Financial Corp., 5.90% (USSW5+338bps), 2/7/29, Callable 2/7/24 @ 100 (b) | 500,000 | 534,500 | |||||||||
| TCF National Bank, 4.13% (LIBOR03M+238bps), 7/2/29, Callable 7/2/24 @ 100 (b) | 1,000,000 | 1,051,330 | |||||||||
| Texas Capital Bancshares, Inc., 4.00% (H15T5Y+315bps), 5/6/31, Callable 5/6/26 @ 100 (b) | 1,000,000 | 1,029,420 | |||||||||
Texas Capital Bank NA, 5.25%, 1/31/26 | 250,000 | 270,023 | |||||||||
| The Bank of New York Mellon Corp., 3.75% (H15T5Y+263bps), Callable 12/20/26 @ 100 (b) (e) | 1,000,000 | 1,003,210 | |||||||||
| The PNC Financial Services Group, Inc., 2.55%, 1/22/30, Callable 10/24/29 @ 100 | 1,500,000 | 1,546,815 | |||||||||
Torchmark Corp., 4.55%, 9/15/28, Callable 6/15/28 @ 100 | 500,000 | 568,215 | |||||||||
Toyota Motor Credit Corp., 3.38%, 4/1/30, MTN | 536,000 | 587,611 | |||||||||
Truist Bank, 2.25%, 3/11/30, Callable 12/11/29 @ 100 | 1,050,000 | 1,049,412 | |||||||||
| UMB Financial Corp., 3.70% (H15T5Y+344bps), 9/17/30, Callable 9/17/25 @ 100 (b) | 375,000 | 378,896 | |||||||||
US BanCorp, 2.49% (H15T5Y+95bps), 11/3/36, Callable 11/3/31 @ 100 (b) | 1,500,000 | 1,497,030 | |||||||||
| Webster Financial Corp. 4.38%, 2/15/24, Callable 1/16/24 @ 100 | 1,000,000 | 1,050,290 | |||||||||
4.10%, 3/25/29, Callable 12/25/28 @ 100 | 500,000 | 549,140 | |||||||||
| Wells Fargo & Co. 2.19% (SOFR+200bps), 4/30/26, Callable 4/30/25 @ 100 (b) | 750,000 | 764,168 | |||||||||
3.00%, 10/23/26 | 1,000,000 | 1,051,770 | |||||||||
Zions Bancorp NA, 3.25%, 10/29/29, Callable 7/29/29 @ 100 | 1,000,000 | 1,033,940 | |||||||||
96,420,144 | |||||||||||
Health Care (3.1%): | |||||||||||
| AbbVie, Inc. 3.20%, 11/21/29, Callable 8/21/29 @ 100 | 2,000,000 | 2,141,080 | |||||||||
4.25%, 11/21/49, Callable 5/21/49 @ 100 | 500,000 | 601,860 | |||||||||
| Anthem, Inc. 2.88%, 9/15/29, Callable 6/15/29 @ 100 | 323,000 | 337,835 | |||||||||
2.55%, 3/15/31, Callable 12/15/30 @ 100 | 2,000,000 | 2,048,220 | |||||||||
Baxter International, Inc., 2.54%, 2/1/32, Callable 11/1/31 @ 100 (a) | 1,750,000 | 1,767,990 | |||||||||
Boston Medical Center Corp., 3.91%, 7/1/28 | 500,000 | 545,405 | |||||||||
Bristol Myers Squibb Co., 3.90%, 2/20/28, Callable 11/20/27 @ 100 | 500,000 | 557,530 | |||||||||
Centene Corp., 2.50%, 3/1/31, Callable 12/1/30 @ 100 | 500,000 | 486,715 | |||||||||
Cigna Corp., 2.38%, 3/15/31, Callable 12/15/30 @ 100 | 2,000,000 | 2,008,240 | |||||||||
| CVS Health Corp. 3.25%, 8/15/29, Callable 5/15/29 @ 100 | 500,000 | 533,585 | |||||||||
1.75%, 8/21/30, Callable 5/21/30 @ 100 | 1,000,000 | 955,430 | |||||||||
2.13%, 9/15/31, Callable 6/15/31 @ 100 (d) | 2,000,000 | 1,960,360 | |||||||||
DENTSPLY SIRONA, Inc., 3.25%, 6/1/30, Callable 3/1/30 @ 100 | 2,000,000 | 2,111,740 | |||||||||
Duke University Health System, Inc., 2.60%, 6/1/30 | 500,000 | 505,845 | |||||||||
Eastern Maine Healthcare Systems, 3.71%, 7/1/26 | 400,000 | 409,061 | |||||||||
See notes to financial statements.
28
| Victory Portfolios II VictoryShares USAA Core Intermediate-Term Bond ETF | Schedule of Portfolio Investments — continued December 31, 2021 | ||||||
(Unaudited)
Security Description | Principal Amount | Value | |||||||||
| Fresenius Medical Care U.S. Finance III, Inc., 2.38%, 2/16/31, Callable 11/16/30 @ 100 (a) (d) | $ | 2,500,000 | $ | 2,389,750 | |||||||
Gilead Sciences, Inc., 1.20%, 10/1/27, Callable 8/1/27 @ 100 | 1,000,000 | 966,530 | |||||||||
HCA, Inc., 4.50%, 2/15/27, Callable 8/15/26 @ 100 | 1,250,000 | 1,379,525 | |||||||||
Illumina, Inc., 2.55%, 3/23/31, Callable 12/23/30 @ 100 | 2,000,000 | 2,003,120 | |||||||||
Mercy Health, 4.30%, 7/1/28, Callable 1/1/28 @ 100 | 250,000 | 281,018 | |||||||||
| Orlando Health Obligated Group 3.78%, 10/1/28, Callable 7/1/28 @ 100 | 500,000 | 543,085 | |||||||||
2.89%, 10/1/35 | 1,000,000 | 1,010,260 | |||||||||
| PerkinElmer, Inc. 2.55%, 3/15/31, Callable 12/15/30 @ 100 | 1,500,000 | 1,512,780 | |||||||||
2.25%, 9/15/31, Callable 6/15/31 @ 100 | 500,000 | 486,990 | |||||||||
Quest Diagnostics, Inc., 3.45%, 6/1/26, Callable 3/1/26 @ 100 | 1,250,000 | 1,337,637 | |||||||||
Roche Holdings, Inc., 1.93%, 12/13/28, Callable 10/13/28 @ 100 (a) | 1,500,000 | 1,508,820 | |||||||||
| Royalty Pharma PLC 2.20%, 9/2/30, Callable 6/2/30 @ 100 | 2,000,000 | 1,936,880 | |||||||||
2.15%, 9/2/31, Callable 6/2/31 @ 100 | 1,500,000 | 1,431,180 | |||||||||
| Southern Illinois Healthcare Enterprises, Inc., 3.97%, 5/15/50, Callable 11/15/49 @ 100 | 1,000,000 | 1,135,650 | |||||||||
Universal Health Services, Inc., 2.65%, 1/15/32, Callable 10/15/31 @ 100 (a) | 1,000,000 | 982,210 | |||||||||
Viatris, Inc., 2.30%, 6/22/27, Callable 4/22/27 @ 100 | 1,250,000 | 1,261,063 | |||||||||
37,137,394 | |||||||||||
Industrials (3.5%): | |||||||||||
Acuity Brands Lighting, Inc., 2.15%, 12/15/30, Callable 9/15/30 @ 100 | 2,000,000 | 1,948,980 | |||||||||
Aircastle Ltd., 4.25%, 6/15/26, Callable 4/15/26 @ 100 | 1,000,000 | 1,072,180 | |||||||||
| American Airlines Pass Through Trust 3.70%, 4/1/28 | 312,683 | 316,654 | |||||||||
3.85%, 8/15/29 | 429,217 | 405,515 | |||||||||
3.60%, 4/15/31 | 405,286 | 393,443 | |||||||||
Arconic, Inc., 5.90%, 2/1/27 | 250,000 | 285,757 | |||||||||
| Ashtead Capital, Inc. 4.25%, 11/1/29, Callable 11/1/24 @ 102.13 (a) | 1,448,000 | 1,540,397 | |||||||||
2.45%, 8/12/31, Callable 5/12/31 @ 100 (a) | 667,000 | 650,032 | |||||||||
| British Airways Pass Through Trust 3.35%, 12/15/30 (a) | 419,835 | 415,569 | |||||||||
3.80%, 3/20/33 (a) | 596,387 | 620,869 | |||||||||
Carlisle Cos., Inc., 2.75%, 3/1/30, Callable 12/1/29 @ 100 | 1,000,000 | 1,021,620 | |||||||||
Carrier Global Corp., 3.38%, 4/5/40, Callable 10/5/39 @ 100 | 1,000,000 | 1,046,320 | |||||||||
Caterpillar, Inc., 2.60%, 4/9/30, Callable 1/9/30 @ 100 | 500,000 | 521,845 | |||||||||
CNH Industrial Capital LLC, 1.88%, 1/15/26, Callable 12/15/25 @ 100 | 1,000,000 | 1,003,520 | |||||||||
CoStar Group, Inc., 2.80%, 7/15/30, Callable 4/15/30 @ 100 (a) | 669,000 | 670,385 | |||||||||
FedEx Corp., 3.90%, 2/1/35 | 1,250,000 | 1,393,538 | |||||||||
Fluor Corp., 4.25%, 9/15/28, Callable 6/15/28 @ 100 (d) | 1,000,000 | 1,048,010 | |||||||||
GXO Logistics, Inc., 2.65%, 7/15/31, Callable 4/15/31 @ 100 (a) | 2,000,000 | 1,972,580 | |||||||||
| Hawaiian Airlines Pass Through Certificates 4.95%, 7/15/23 | 351,322 | 351,094 | |||||||||
3.90%, 7/15/27 | 98,689 | 96,562 | |||||||||
| Hillenbrand, Inc. 5.00%, 9/15/26, Callable 7/15/26 @ 100 | 1,000,000 | 1,113,890 | |||||||||
3.75%, 3/1/31, Callable 3/1/26 @ 101.88 | 350,000 | 350,847 | |||||||||
See notes to financial statements.
29
| Victory Portfolios II VictoryShares USAA Core Intermediate-Term Bond ETF | Schedule of Portfolio Investments — continued December 31, 2021 | ||||||
(Unaudited)
Security Description | Principal Amount | Value | |||||||||
Howmet Aerospace, Inc., 3.00%, 1/15/29, Callable 11/15/28 @ 100 | $ | 1,500,000 | $ | 1,502,640 | |||||||
| Hubbell, Inc. 3.50%, 2/15/28, Callable 11/15/27 @ 100 | 1,000,000 | 1,076,840 | |||||||||
2.30%, 3/15/31, Callable 12/15/30 @ 100 | 1,500,000 | 1,501,020 | |||||||||
Huntington Ingalls Industries, Inc., 2.04%, 8/16/28, Callable 6/16/28 @ 100 (a) | 1,500,000 | 1,469,445 | |||||||||
IDEX Corp., 3.00%, 5/1/30, Callable 2/1/30 @ 100 | 500,000 | 520,610 | |||||||||
| Ingersoll-Rand Global Holding Co. Ltd., 3.75%, 8/21/28, Callable 5/21/28 @ 100 | 500,000 | 545,945 | |||||||||
JetBlue Pass Through Trust, 2.95%, 11/15/29 | 223,175 | 217,140 | |||||||||
Kennametal, Inc., 4.63%, 6/15/28, Callable 3/15/28 @ 100 | 1,058,000 | 1,188,155 | |||||||||
Leidos, Inc., 2.30%, 2/15/31, Callable 11/15/30 @ 100 | 1,500,000 | 1,439,805 | |||||||||
Northrop Grumman Corp., 3.25%, 1/15/28, Callable 10/15/27 @ 100 | 500,000 | 534,635 | |||||||||
Otis Worldwide Corp., 3.11%, 2/15/40, Callable 8/15/39 @ 100 | 1,000,000 | 1,024,220 | |||||||||
| Penske Truck Leasing Co. LP/PTL Finance Corp. 4.45%, 1/29/26, Callable 11/29/25 @ 100 (a) | 1,000,000 | 1,098,480 | |||||||||
1.70%, 6/15/26, Callable 5/15/26 @ 100 (a) | 1,000,000 | 991,020 | |||||||||
Ryder System, Inc., 3.40%, 3/1/23, MTN, Callable 2/1/23 @ 100 | 1,000,000 | 1,026,970 | |||||||||
Southwest Airlines Co., 5.13%, 6/15/27, Callable 4/15/27 @ 100 | 800,000 | 915,664 | |||||||||
Teledyne Technologies, Inc., 2.75%, 4/1/31, Callable 1/1/31 @ 100 | 2,000,000 | 2,032,660 | |||||||||
| The Boeing Co. 2.20%, 2/4/26, Callable 2/4/23 @ 100 | 1,333,000 | 1,332,787 | |||||||||
3.25%, 2/1/28, Callable 12/1/27 @ 100 | 1,500,000 | 1,564,695 | |||||||||
3.63%, 2/1/31, Callable 11/1/30 @ 100 | 1,000,000 | 1,068,130 | |||||||||
5.71%, 5/1/40, Callable 11/1/39 @ 100 | 1,000,000 | 1,288,660 | |||||||||
Union Pacific Corp., 3.25%, 2/5/50, Callable 8/5/49 @ 100 | 1,000,000 | 1,073,960 | |||||||||
| United Airlines Pass Through Trust 4.88%, 7/15/27 | 308,014 | 320,676 | |||||||||
3.70%, 9/1/31 | 429,339 | 435,659 | |||||||||
42,409,423 | |||||||||||
Information Technology (2.4%): | |||||||||||
| Amphenol Corp. 4.35%, 6/1/29, Callable 3/1/29 @ 100 | 500,000 | 568,110 | |||||||||
2.20%, 9/15/31, Callable 6/15/31 @ 100 | 1,125,000 | 1,102,601 | |||||||||
| Broadcom, Inc. 2.45%, 2/15/31, Callable 11/15/30 @ 100 (a) | 2,500,000 | 2,447,625 | |||||||||
3.42%, 4/15/33, Callable 1/15/33 @ 100 (a) | 2,000,000 | 2,090,020 | |||||||||
| Dell International LLC / EMC Corp., 3.38%, 12/15/41, Callable 6/15/41 @ 100 (a) | 500,000 | 495,055 | |||||||||
Dell, Inc., 5.40%, 9/10/40 | 2,000,000 | 2,253,120 | |||||||||
Global Payments, Inc., 2.90%, 11/15/31, Callable 8/15/31 @ 100 | 1,500,000 | 1,523,880 | |||||||||
| HP, Inc. 3.40%, 6/17/30, Callable 3/17/30 @ 100 | 743,000 | 784,831 | |||||||||
2.65%, 6/17/31, Callable 3/17/31 @ 100 (a) | 1,500,000 | 1,480,950 | |||||||||
Jabil, Inc., 3.00%, 1/15/31, Callable 10/15/30 @ 100 | 1,474,000 | 1,516,422 | |||||||||
Marvell Technology, Inc., 2.45%, 4/15/28, Callable 2/15/28 @ 100 | 1,050,000 | 1,065,970 | |||||||||
Micron Technology, Inc., 2.70%, 4/15/32, Callable 1/15/32 @ 100 | 1,500,000 | 1,506,090 | |||||||||
Microsoft Corp., 3.45%, 8/8/36, Callable 2/8/36 @ 100 | 500,000 | 574,445 | |||||||||
Motorola Solutions, Inc., 2.75%, 5/24/31, Callable 2/24/31 @ 100 | 1,000,000 | 1,002,490 | |||||||||
See notes to financial statements.
30
| Victory Portfolios II VictoryShares USAA Core Intermediate-Term Bond ETF | Schedule of Portfolio Investments — continued December 31, 2021 | ||||||
(Unaudited)
Security Description | Principal Amount | Value | |||||||||
| Oracle Corp. 2.95%, 4/1/30, Callable 1/1/30 @ 100 | $ | 1,000,000 | $ | 1,010,730 | |||||||
2.88%, 3/25/31, Callable 12/25/30 @ 100 | 750,000 | 753,758 | |||||||||
Qorvo, Inc., 3.38%, 4/1/31, Callable 4/1/26 @ 101.69 (a) | 1,909,000 | 1,942,274 | |||||||||
Salesforce.com, Inc., 3.70%, 4/11/28, Callable 1/11/28 @ 100 | 1,000,000 | 1,108,780 | |||||||||
Skyworks Solutions, Inc., 3.00%, 6/1/31, Callable 3/1/31 @ 100 | 1,200,000 | 1,207,416 | |||||||||
TSMC Arizona Corp., 2.50%, 10/25/31, Callable 7/25/31 @ 100 | 2,950,000 | 2,986,403 | |||||||||
Western Digital Corp., 3.10%, 2/1/32, Callable 11/1/31 @ 100 | 1,500,000 | 1,510,950 | |||||||||
28,931,920 | |||||||||||
Materials (1.7%): | |||||||||||
| Avery Dennison Corp. 2.65%, 4/30/30, Callable 2/1/30 @ 100 | 800,000 | 810,568 | |||||||||
2.25%, 2/15/32, Callable 11/15/31 @ 100 | 1,500,000 | 1,457,310 | |||||||||
Ball Corp., 3.13%, 9/15/31, Callable 6/15/31 @ 100 | 1,500,000 | 1,484,580 | |||||||||
Colonial Enterprises, Inc., 3.25%, 5/15/30, Callable 2/15/30 @ 100 (a) | 375,000 | 395,940 | |||||||||
Commercial Metals Co., 3.88%, 2/15/31, Callable 2/15/26 @ 101.94 | 1,000,000 | 994,580 | |||||||||
DuPont de Nemours, Inc., 4.73%, 11/15/28, Callable 8/15/28 @ 100 | 500,000 | 579,550 | |||||||||
Eagle Materials, Inc., 2.50%, 7/1/31, Callable 4/1/31 @ 100 | 1,500,000 | 1,482,165 | |||||||||
Ecolab, Inc., 1.65%, 2/1/27, Callable 1/1/27 @ 100 | 1,200,000 | 1,206,096 | |||||||||
Freeport-McMoRan, Inc., 4.38%, 8/1/28, Callable 8/1/23 @ 102.19 | 2,000,000 | 2,098,440 | |||||||||
LYB International Finance III LLC, 2.25%, 10/1/30, Callable 7/1/30 @ 100 | 500,000 | 497,600 | |||||||||
| Martin Marietta Materials, Inc. 3.50%, 12/15/27, Callable 9/15/27 @ 100 | 625,000 | 673,113 | |||||||||
2.40%, 7/15/31, Callable 4/15/31 @ 100 | 1,000,000 | 994,890 | |||||||||
NewMarket Corp., 2.70%, 3/18/31, Callable 12/18/30 @ 100 (d) | 1,250,000 | 1,246,137 | |||||||||
| Packaging Corp. of America 3.40%, 12/15/27, Callable 9/15/27 @ 100 | 500,000 | 539,045 | |||||||||
3.05%, 10/1/51, Callable 4/1/51 @ 100 | 1,875,000 | 1,865,981 | |||||||||
| Reliance Steel & Aluminum Co. 4.50%, 4/15/23, Callable 1/15/23 @ 100 | 500,000 | 518,195 | |||||||||
2.15%, 8/15/30, Callable 5/15/30 @ 100 | 1,000,000 | 975,160 | |||||||||
The Mosaic Co., 4.05%, 11/15/27, Callable 8/15/27 @ 100 | 1,000,000 | 1,102,310 | |||||||||
| Vulcan Materials Co. 3.90%, 4/1/27, Callable 1/1/27 @ 100 | 500,000 | 547,480 | |||||||||
3.50%, 6/1/30, Callable 3/1/30 @ 100 | 1,000,000 | 1,078,040 | |||||||||
WRKCo, Inc., 3.00%, 6/15/33, Callable 3/15/33 @ 100 | 365,000 | 376,428 | |||||||||
20,923,608 | |||||||||||
Real Estate (1.7%): | |||||||||||
| Alexandria Real Estate Equities, Inc., 2.00%, 5/18/32, Callable 2/18/32 @ 100 | 2,750,000 | 2,640,027 | |||||||||
| AvalonBay Communities, Inc. 3.20%, 1/15/28, Callable 10/15/27 @ 100, MTN | 750,000 | 802,875 | |||||||||
2.45%, 1/15/31, Callable 10/17/30 @ 100, MTN | 1,000,000 | 1,026,080 | |||||||||
Boston Properties LP, 2.55%, 4/1/32, Callable 1/1/32 @ 100 | 2,250,000 | 2,238,975 | |||||||||
CBRE Services, Inc., 2.50%, 4/1/31, Callable 1/1/31 @ 100 | 500,000 | 502,715 | |||||||||
Crown Castle International Corp., 2.25%, 1/15/31, Callable 10/15/30 @ 100 | 1,500,000 | 1,459,755 | |||||||||
| Essex Portfolio LP 1.70%, 3/1/28, Callable 1/1/28 @ 100 | 1,500,000 | 1,463,940 | |||||||||
2.65%, 3/15/32, Callable 12/15/31 @ 100 | 1,500,000 | 1,508,970 | |||||||||
See notes to financial statements.
31
| Victory Portfolios II VictoryShares USAA Core Intermediate-Term Bond ETF | Schedule of Portfolio Investments — continued December 31, 2021 | ||||||
(Unaudited)
Security Description | Principal Amount | Value | |||||||||
| GLP Capital LP/GLP Financing II, Inc. 3.25%, 1/15/32, Callable 10/15/31 @ 100 | $ | 933,000 | $ | 937,768 | |||||||
4.00%, 1/15/31, Callable 10/15/30 @ 100 | 250,000 | 266,833 | |||||||||
| Host Hotels & Resorts LP 3.38%, 12/15/29, Callable 9/15/29 @ 100 | 500,000 | 511,440 | |||||||||
3.50%, 9/15/30, Callable 6/15/30 @ 100 | 811,000 | 832,824 | |||||||||
| Hudson Pacific Properties LP 3.95%, 11/1/27, Callable 8/1/27 @ 100 | 500,000 | 537,450 | |||||||||
4.65%, 4/1/29, Callable 1/1/29 @ 100 | 500,000 | 567,005 | |||||||||
3.25%, 1/15/30, Callable 10/15/29 @ 100 | 1,500,000 | 1,562,910 | |||||||||
Kilroy Realty LP, 2.65%, 11/15/33, Callable 8/15/33 @ 100 | 1,500,000 | 1,457,983 | |||||||||
| Physicians Realty LP 4.30%, 3/15/27, Callable 12/15/26 @ 100 | 750,000 | 832,830 | |||||||||
2.63%, 11/1/31, Callable 8/1/31 @ 100 | 750,000 | 748,507 | |||||||||
Vornado Realty LP, 3.50%, 1/15/25, Callable 11/15/24 @ 100 | 500,000 | 524,410 | |||||||||
20,423,297 | |||||||||||
Utilities (3.2%): | |||||||||||
AEP Texas, Inc., 3.45%, 1/15/50, Callable 7/15/49 @ 100 | 1,500,000 | 1,539,300 | |||||||||
Alabama Power Co., 3.13%, 7/15/51, Callable 1/15/51 @ 100 (d) | 2,000,000 | 2,048,720 | |||||||||
| Ameren Corp. 1.75%, 3/15/28, Callable 1/15/28 @ 100 | 1,400,000 | 1,356,572 | |||||||||
3.50%, 1/15/31, Callable 10/15/30 @ 100 | 250,000 | 270,638 | |||||||||
American Water Capital Corp., 2.95%, 9/1/27, Callable 6/1/27 @ 100 | 1,000,000 | 1,056,750 | |||||||||
Appalachian Power Co., 2.70%, 4/1/31, Callable 1/1/31 @ 100 | 1,500,000 | 1,535,130 | |||||||||
CenterPoint Energy, Inc., 2.65%, 6/1/31, Callable 3/1/31 @ 100 | 1,500,000 | 1,517,970 | |||||||||
Cleco Corporate Holdings LLC, 3.38%, 9/15/29, Callable 6/15/29 @ 100 | 1,000,000 | 1,022,690 | |||||||||
Dominion Energy, Inc., 2.25%, 8/15/31, Callable 5/15/31 @ 100 | 1,500,000 | 1,469,310 | |||||||||
DTE Electric Co., 2.25%, 3/1/30, Callable 12/1/29 @ 100 | 1,000,000 | 1,004,240 | |||||||||
Duke Energy Corp., 2.55%, 6/15/31, Callable 3/15/31 @ 100 | 1,500,000 | 1,499,130 | |||||||||
Duquesne Light Holdings, Inc., 2.78%, 1/7/32, Callable 10/7/31 @ 100 (a) | 1,200,000 | 1,193,616 | |||||||||
Entergy Corp., 1.90%, 6/15/28, Callable 4/15/28 @ 100 | 2,000,000 | 1,961,260 | |||||||||
Entergy Louisiana LLC, 4.00%, 3/15/33, Callable 12/15/32 @ 100 | 1,000,000 | 1,143,800 | |||||||||
IPALCO Enterprises, Inc., 4.25%, 5/1/30, Callable 2/1/30 @ 100 | 1,525,000 | 1,672,620 | |||||||||
ITC Holdings Corp., 2.95%, 5/14/30, Callable 2/14/30 @ 100 (a) | 500,000 | 511,465 | |||||||||
National Fuel Gas Co., 4.75%, 9/1/28, Callable 6/1/28 @ 100 | 1,000,000 | 1,102,500 | |||||||||
| NextEra Energy Capital Holdings, Inc. 0.45% (SOFR+40bps), 11/3/23, Callable 5/3/22 @ 100 (b) | 1,500,000 | 1,498,125 | |||||||||
2.44%, 1/15/32, Callable 10/15/31 @ 100 | 2,000,000 | 2,005,280 | |||||||||
NRG Energy, Inc., 4.45%, 6/15/29, Callable 3/15/29 @ 100 (a) | 1,000,000 | 1,090,270 | |||||||||
Oncor Electric Delivery Co. LLC, 2.70%, 11/15/51, Callable 5/15/51 @ 100 (a) | 1,500,000 | 1,459,755 | |||||||||
Public Service Co. of Colorado, 1.88%, 6/15/31, Callable 12/15/30 @ 100 | 2,000,000 | 1,949,480 | |||||||||
| Public Service Electric & Gas Co., 1.90%, 8/15/31, MTN, Callable 5/15/31 @ 100 | 2,000,000 | 1,958,960 | |||||||||
South Jersey Industries, Inc., 5.02%, 4/15/31 | 1,000,000 | 1,096,470 | |||||||||
Southern Co. Gas Capital Corp., 1.75%, 1/15/31, Callable 10/15/30 @ 100 | 1,000,000 | 939,750 | |||||||||
Southwestern Electric Power Co., 3.25%, 11/1/51, Callable 5/1/51 @ 100 | 750,000 | 747,322 | |||||||||
The AES Corp., 2.45%, 1/15/31, Callable 10/15/30 @ 100 | 1,000,000 | 973,340 | |||||||||
| The Cleveland Electric Illuminating Co., 4.55%, 11/15/30, Callable 8/15/30 @ 100 (a) | 500,000 | 574,795 | |||||||||
Vistra Operations Co. LLC, 4.30%, 7/15/29, Callable 4/15/29 @ 100 (a) | 500,000 | 535,790 | |||||||||
See notes to financial statements.
32
| Victory Portfolios II VictoryShares USAA Core Intermediate-Term Bond ETF | Schedule of Portfolio Investments — continued December 31, 2021 | ||||||
(Unaudited)
Security Description | Principal Amount | Value | |||||||||
Wisconsin Public Service Corp., 2.85%, 12/1/51, Callable 6/1/51 @ 100 | $ | 1,250,000 | $ | 1,235,575 | |||||||
Xcel Energy, Inc., 2.35%, 11/15/31, Callable 5/15/31 @ 100 | 500,000 | 499,415 | |||||||||
38,470,038 | |||||||||||
Total Corporate Bonds (Cost $384,204,891) | 392,067,432 | ||||||||||
Yankee Dollars (8.3%) | |||||||||||
Communication Services (0.1%): | |||||||||||
British Telecommunications PLC, 3.25%, 11/8/29, Callable 8/8/29 @ 100 (a) | 1,000,000 | 1,022,820 | |||||||||
Consumer Discretionary (0.4%): | |||||||||||
Ascot Group Ltd., 4.25%, 12/15/30, Callable 12/15/25 @ 100 (a) | 1,000,000 | 1,029,940 | |||||||||
GENM Capital Labuan Ltd., 3.88%, 4/19/31, Callable 1/19/31 @ 100 (a) | 1,500,000 | 1,465,950 | |||||||||
| International Game Technology PLC, 5.25%, 1/15/29, Callable 1/15/24 @ 102.63 (a) | 1,000,000 | 1,060,840 | |||||||||
Nemak SAB de CV, 3.63%, 6/28/31, Callable 3/28/31 @ 100 (a) | 1,269,000 | 1,238,569 | |||||||||
4,795,299 | |||||||||||
Consumer Staples (0.9%): | |||||||||||
| Alimentation Couche-Tard, Inc. 2.95%, 1/25/30, Callable 10/25/29 @ 100 (a) | 667,000 | 692,259 | |||||||||
3.44%, 5/13/41, Callable 11/13/40 @ 100 (a) | 750,000 | 776,700 | |||||||||
Anheuser-Busch InBev Worldwide, Inc., 3.75%, 7/15/42 | 750,000 | 815,393 | |||||||||
| Bacardi Ltd. 4.45%, 5/15/25, Callable 3/15/25 @ 100 (a) | 1,500,000 | 1,624,890 | |||||||||
2.75%, 7/15/26, Callable 4/15/26 @ 100 (a) | 500,000 | 515,180 | |||||||||
4.70%, 5/15/28, Callable 2/15/28 @ 100 (a) | 500,000 | 565,465 | |||||||||
Becle SAB de CV, 2.50%, 10/14/31, Callable 7/14/31 @ 100 (a) | 1,750,000 | 1,716,995 | |||||||||
Imperial Brands Finance PLC, 3.88%, 7/26/29, Callable 4/26/29 @ 100 (a) | 1,000,000 | 1,060,320 | |||||||||
JDE Peet's NV, 2.25%, 9/24/31, Callable 6/24/31 @ 100 (a) | 3,000,000 | 2,896,770 | |||||||||
10,663,972 | |||||||||||
Energy (0.3%): | |||||||||||
Aker BP ASA, 4.00%, 1/15/31, Callable 10/15/30 @ 100 (a) | 750,000 | 812,333 | |||||||||
| Petroleos Mexicanos 6.50%, 3/13/27 | 2,000,000 | 2,133,400 | |||||||||
6.70%, 2/16/32, Callable 11/16/31 @ 100 | 500,000 | 503,515 | |||||||||
Transocean Guardian Ltd., 5.88%, 1/15/24, Callable 2/7/22 @ 102.94 (a) | 335,000 | 321,315 | |||||||||
3,770,563 | |||||||||||
Financials (4.7%): | |||||||||||
ABN AMRO Bank NV, 4.80%, 4/18/26 (a) | 500,000 | 551,435 | |||||||||
| Banco Santander Mexico SA Institucion de Banca Multiple Grupo Financiero Santand, 5.38%, 4/17/25 (a) | 357,000 | 389,808 | |||||||||
Banco Santander SA, 4.38%, 4/12/28 | 600,000 | 671,946 | |||||||||
| Bank of Montreal, 3.80% (USSW5+143bps), 12/15/32, Callable 12/15/27 @ 100 (b) | 500,000 | 535,405 | |||||||||
Bank of New Zealand, 1.00%, 3/3/26 (a) | 1,600,000 | 1,557,152 | |||||||||
| Barclays PLC 4.61% (LIBOR03M+140bps), 2/15/23, Callable 2/15/22 @ 100 (b) | 1,000,000 | 1,004,250 | |||||||||
3.93% (LIBOR03M+161bps), 5/7/25, Callable 5/7/24 @ 100 (b) | 500,000 | 526,330 | |||||||||
See notes to financial statements.
33
| Victory Portfolios II VictoryShares USAA Core Intermediate-Term Bond ETF | Schedule of Portfolio Investments — continued December 31, 2021 | ||||||
(Unaudited)
Security Description | Principal Amount | Value | |||||||||
2.28% (H15T1Y+105bps), 11/24/27, Callable 11/24/26 @ 100 (b) | $ | 2,000,000 | $ | 2,005,040 | |||||||
| BNP Paribas SA, 4.71% (LIBOR03M+224bps), 1/10/25, Callable 1/10/24 @ 100 (a) (b) | 1,000,000 | 1,064,350 | |||||||||
| BPCE SA 4.00%, 9/12/23 (a) | 500,000 | 523,200 | |||||||||
3.25%, 1/11/28 (a) | 1,000,000 | 1,065,960 | |||||||||
Brookfield Finance, Inc., 2.72%, 4/15/31, Callable 1/15/31 @ 100 | 1,000,000 | 1,009,600 | |||||||||
Commonwealth Bank of Australia, 2.69%, 3/11/31 (a) | 1,000,000 | 983,630 | |||||||||
| Cooperatieve Rabobank UA 1.11% (H15T1Y+55bps), 2/24/27, Callable 2/24/26 @ 100 (a) (b) | 2,000,000 | 1,942,620 | |||||||||
4.00% (USSW5+189bps), 4/10/29, Callable 4/10/24 @ 100, MTN (b) | 600,000 | 628,164 | |||||||||
Credit Agricole SA, 3.25%, 10/4/24 (a) | 1,250,000 | 1,312,688 | |||||||||
| Credit Suisse Group AG, 1.31% (SOFR+98bps), 2/2/27, Callable 2/2/26 @ 100 (a) (b) | 1,000,000 | 966,580 | |||||||||
Credit Suisse Group Funding Guernsey Ltd., 3.75%, 3/26/25 | 500,000 | 531,100 | |||||||||
Deutsche Bank AG, 1.69%, 3/19/26 | 1,500,000 | 1,495,950 | |||||||||
Enel Finance International NV, 1.88%, 7/12/28, Callable 5/12/28 @ 100 (a) | 2,000,000 | 1,950,740 | |||||||||
| HSBC Holdings PLC 3.80% (LIBOR03M+121bps), 3/11/25, Callable 3/11/24 @ 100 (b) | 500,000 | 525,025 | |||||||||
4.29% (LIBOR03M+135bps), 9/12/26, Callable 9/12/25 @ 100 (b) | 500,000 | 539,920 | |||||||||
2.21% (SOFR+129bps), 8/17/29, Callable 8/17/28 @ 100 (b) | 1,500,000 | 1,471,380 | |||||||||
ING Groep NV, 2.73% (SOFR+112bps), 4/1/32, Callable 4/1/31 @ 100 (b) | 2,000,000 | 2,038,300 | |||||||||
JAB Holdings BV, 3.75%, 5/28/51, Callable 11/28/50 @ 100 (a) | 500,000 | 548,145 | |||||||||
| Lloyds Banking Group PLC 2.91% (LIBOR03M+81bps), 11/7/23, Callable 11/7/22 @ 100 (b) | 250,000 | 254,015 | |||||||||
1.63% (H15T1Y+85bps), 5/11/27, Callable 5/11/26 @ 100 (b) | 1,000,000 | 983,530 | |||||||||
3.57% (LIBOR03M+121bps), 11/7/28, Callable 11/7/27 @ 100 (b) | 250,000 | 267,240 | |||||||||
| Macquarie Bank Ltd., 3.05% (H15T5Y+170bps), 3/3/36, Callable 3/3/31 @ 100 (a) (b) | 1,250,000 | 1,227,525 | |||||||||
| Mizuho Financial Group, Inc. 2.56%, 9/13/31 | 1,000,000 | 975,890 | |||||||||
2.17% (H15T1Y+87bps), 5/22/32, Callable 5/22/31 @ 100 (b) | 1,500,000 | 1,457,175 | |||||||||
| National Australia Bank Ltd., 3.93% (H15T5Y+188bps), 8/2/34, Callable 8/2/29 @ 100 (a) (b) | 1,500,000 | 1,595,640 | |||||||||
| Nationwide Building Society 3.62% (LIBOR03M+118bps), 4/26/23, Callable 4/26/22 @ 100 (a) (b) | 1,000,000 | 1,008,260 | |||||||||
4.27% (LIBOR03M+139bps), 8/1/24, Callable 8/1/23 @ 100 (a) (b) | 750,000 | 785,640 | |||||||||
4.30% (LIBOR03M+145bps), 3/8/29, Callable 3/8/28 @ 100 (a) (b) | 250,000 | 276,350 | |||||||||
3.96% (LIBOR03M+186bps), 7/18/30, Callable 7/18/29 @ 100 (a) (b) | 500,000 | 550,620 | |||||||||
| NXP BV/NXP Funding LLC/NXP USA, Inc., 2.65%, 2/15/32, Callable 11/15/31 @ 100 (a) | 1,500,000 | 1,505,535 | |||||||||
| Royal Bank of Scotland Group PLC 4.27% (LIBOR03M+176bps), 3/22/25, Callable 3/22/24 @ 100 (b) | 1,000,000 | 1,059,070 | |||||||||
5.08% (LIBOR03M+191bps), 1/27/30, Callable 1/27/29 @ 100 (b) | 500,000 | 580,070 | |||||||||
4.45% (LIBOR03M+187bps), 5/8/30, Callable 5/8/29 @ 100 (b) | 1,000,000 | 1,125,220 | |||||||||
| Santander UK Group Holdings PLC, 2.90% (SOFR+148bps), 3/15/32, Callable 3/15/31 @ 100 (b) | 2,000,000 | 2,021,000 | |||||||||
Shell International Finance BV, 2.88%, 11/26/41, Callable 5/26/41 @ 100 | 1,500,000 | 1,505,460 | |||||||||
See notes to financial statements.
34
| Victory Portfolios II VictoryShares USAA Core Intermediate-Term Bond ETF | Schedule of Portfolio Investments — continued December 31, 2021 | ||||||
(Unaudited)
Security Description | Principal Amount | Value | |||||||||
| Siemens Financieringsmaatschappij NV 1.70%, 3/11/28 (a) | $ | 1,000,000 | $ | 990,160 | |||||||
2.15%, 3/11/31 (a) | 1,000,000 | 996,800 | |||||||||
| Societe Generale SA 3.88%, 3/28/24 (a) | 1,000,000 | 1,052,770 | |||||||||
1.49% (H15T1Y+1bps), 12/14/26, Callable 12/14/25 @ 100 (a) (b) | 500,000 | 487,435 | |||||||||
| Standard Chartered PLC, 4.87% (LIBOR03M+197bps), 3/15/33, Callable 3/15/28 @ 100 (a) (b) | 500,000 | 545,375 | |||||||||
Sumitomo Mitsui Financial Group, Inc., 2.22%, 9/17/31 | 1,500,000 | 1,469,280 | |||||||||
Swedbank AB, 0.85%, 3/18/24 (a) | 1,500,000 | 1,490,100 | |||||||||
| The Bank of Nova Scotia 4.50%, 12/16/25 | 500,000 | 550,330 | |||||||||
1.30%, 9/15/26, Callable 6/15/26 @ 100 (d) | 1,500,000 | 1,473,405 | |||||||||
The Toronto-Dominion Bank, 2.00%, 9/10/31 (d) | 1,500,000 | 1,478,220 | |||||||||
| Westpac Banking Corp. 4.32% (USISDA05+224bps), 11/23/31, Callable 11/23/26 @ 100 (b) | 1,000,000 | 1,081,880 | |||||||||
2.67% (H15T5Y+2bps), 11/15/35, Callable 11/15/30 @ 100 (b) | 1,000,000 | 975,490 | |||||||||
3.02% (H15T5Y+153bps), 11/18/36, Callable 11/18/31 @ 100 (b) | 1,000,000 | 990,030 | |||||||||
56,598,233 | |||||||||||
Health Care (0.6%): | |||||||||||
Mylan NV, 3.95%, 6/15/26, Callable 3/15/26 @ 100 | 1,000,000 | 1,078,580 | |||||||||
Olympus Corp., 2.14%, 12/8/26 (a) | 758,000 | 762,351 | |||||||||
Smith & Nephew PLC, 2.03%, 10/14/30, Callable 7/14/30 @ 100 | 3,500,000 | 3,384,675 | |||||||||
STERIS Irish FinCo Unlimited Co., 2.70%, 3/15/31, Callable 12/15/30 @ 100 | 2,000,000 | 2,023,440 | |||||||||
7,249,046 | |||||||||||
Industrials (0.7%): | |||||||||||
Air Canada Pass Through Trust, 4.13%, 11/15/26 (a) | 1,857,191 | 1,873,739 | |||||||||
Aircastle Ltd., 4.40%, 9/25/23, Callable 8/25/23 @ 100 | 500,000 | 523,775 | |||||||||
BAE Systems PLC, 3.40%, 4/15/30, Callable 1/15/30 @ 100 (a) | 750,000 | 799,815 | |||||||||
Canadian Pacific Railway Co., 2.45%, 12/2/31, Callable 9/2/31 @ 100 | 833,000 | 848,894 | |||||||||
| CK Hutchison International 19 II Ltd., 2.75%, 9/6/29, Callable 6/6/29 @ 100 (a) | 1,500,000 | 1,554,060 | |||||||||
Ferguson Finance PLC, 3.25%, 6/2/30, Callable 3/2/30 @ 100 (a) | 1,450,000 | 1,526,139 | |||||||||
| Port of Newcastle Investments Financing Pty Ltd., 5.90%, 11/24/31, Callable 8/24/31 @ 100 (a) (d) | 1,000,000 | 1,029,260 | |||||||||
Rolls-Royce PLC, 3.63%, 10/14/25, Callable 7/14/25 @ 100 (a) | 275,000 | 279,994 | |||||||||
8,435,676 | |||||||||||
Information Technology (0.0%): (f) | |||||||||||
CGI, Inc., 1.45%, 9/14/26, Callable 8/14/26 @ 100 (a) | 533,000 | 521,668 | |||||||||
Materials (0.3%): | |||||||||||
Anglo American Capital PLC, 4.00%, 9/11/27 (a) | 1,000,000 | 1,077,700 | |||||||||
Braskem Netherlands Finance BV, 4.50%, 1/31/30 (a) | 1,000,000 | 1,065,020 | |||||||||
CCL Industries, Inc., 3.05%, 6/1/30, Callable 3/1/30 @ 100 (a) | 2,000,000 | 2,069,980 | |||||||||
4,212,700 | |||||||||||
See notes to financial statements.
35
| Victory Portfolios II VictoryShares USAA Core Intermediate-Term Bond ETF | Schedule of Portfolio Investments — continued December 31, 2021 | ||||||
(Unaudited)
Security Description | Principal Amount | Value | |||||||||
Real Estate (0.3%): | |||||||||||
| Ontario Teachers' Cadillac Fairview Properties Trust, 2.50%, 10/15/31, Callable 7/15/31 @ 100 (a) | $ | 3,233,000 | $ | 3,245,512 | |||||||
Total Yankee Dollars (Cost $98,930,930) | 100,515,489 | ||||||||||
Municipal Bonds (3.1%) | |||||||||||
Arizona (0.1%): | |||||||||||
The University of Arizona Revenue, Series A, 1.82%, 6/1/30 | 1,000,000 | 1,001,424 | |||||||||
California (0.2%): | |||||||||||
| California Statewide Communities Development Authority Revenue, 1.73%, 4/1/27 | 1,000,000 | 985,009 | |||||||||
| City of El Cajon Revenue Series A, 1.70%, 4/1/27 | 620,000 | 614,920 | |||||||||
Series A, 1.90%, 4/1/28 | 500,000 | 496,497 | |||||||||
| San Jose Redevelopment Agency Successor Agency Tax Allocation, Series A-T, 3.13%, 8/1/28, Continuously Callable @ 100 | 500,000 | 529,201 | |||||||||
2,625,627 | |||||||||||
Colorado (0.1%): | |||||||||||
| City & County of Denver Co. Airport System Revenue, Series C, 2.14%, 11/15/29 | 1,500,000 | 1,519,068 | |||||||||
Connecticut (0.1%): | |||||||||||
State of Connecticut, GO, Series A, 3.43%, 4/15/28 | 500,000 | 546,739 | |||||||||
Florida (0.3%): | |||||||||||
| County of Miami-Dade Seaport Department Revenue, Series B-3, 2.34%, 10/1/33, Continuously Callable @ 100 | 1,500,000 | 1,467,732 | |||||||||
| Hillsborough County IDA Revenue, 3.58%, 8/1/35, Continuously Callable @ 100 | 1,500,000 | 1,624,136 | |||||||||
| Hillsborough County School Board Certificate of Participation, Series B, 1.92%, 7/1/25 | 750,000 | 758,670 | |||||||||
3,850,538 | |||||||||||
Georgia (0.1%): | |||||||||||
| City of Atlanta GA Water & Wastewater Revenue, 2.26%, 11/1/35, Continuously Callable @ 100 | 1,500,000 | 1,496,268 | |||||||||
Hawaii (0.1%): | |||||||||||
State of Hawaii Airports System Revenue, Series E, 1.81%, 7/1/27 | 915,000 | 915,061 | |||||||||
Illinois (0.0%): (f) | |||||||||||
Illinois Finance Authority Revenue, 3.55%, 8/15/29 | 500,000 | 543,040 | |||||||||
Louisiana (0.1%): | |||||||||||
| Louisiana Local Government Environmental Facilities & Community Development Authority Revenue, 1.55%, 2/1/27 | 700,000 | 687,585 | |||||||||
Louisiana Public Facilities Authority Revenue, 2.28%, 6/1/30 | 500,000 | 503,836 | |||||||||
1,191,421 | |||||||||||
See notes to financial statements.
36
| Victory Portfolios II VictoryShares USAA Core Intermediate-Term Bond ETF | Schedule of Portfolio Investments — continued December 31, 2021 | ||||||
(Unaudited)
Security Description | Principal Amount | Value | |||||||||
Michigan (0.2%): | |||||||||||
| Michigan Finance Authority Revenue 2.47%, 12/1/25 | $ | 1,000,000 | $ | 1,031,816 | |||||||
3.08%, 12/1/34 | 1,000,000 | 1,060,581 | |||||||||
2,092,397 | |||||||||||
New Jersey (0.3%): | |||||||||||
| New Jersey Economic Development Authority Revenue, Series NNN, 3.47%, 6/15/27 | 1,000,000 | 1,062,357 | |||||||||
| New Jersey Health Care Facilities Financing Authority Revenue, Series A, 3.36%, 7/1/40 | 1,000,000 | 1,046,645 | |||||||||
New Jersey Transportation Trust Fund Authority Revenue, 4.08%, 6/15/39 | 385,000 | 426,930 | |||||||||
South Jersey Transportation Authority Revenue, Series B, 2.38%, 11/1/27 | 900,000 | 888,142 | |||||||||
3,424,074 | |||||||||||
New York (0.2%): | |||||||||||
New York City Industrial Development Agency Revenue, 2.73%, 3/1/34 | 1,500,000 | 1,510,017 | |||||||||
New York State Dormitory Authority Revenue, Series A, 2.46%, 7/1/32 | 750,000 | 754,035 | |||||||||
2,264,052 | |||||||||||
Oklahoma (0.1%): | |||||||||||
| Oklahoma Development Finance Authority Revenue, Series C, 5.45%, 8/15/28 | 500,000 | 560,322 | |||||||||
The University of Oklahoma Revenue, Series C, 2.05%, 7/1/29 | 1,000,000 | 993,761 | |||||||||
1,554,083 | |||||||||||
Pennsylvania (0.2%): | |||||||||||
Commonwealth Financing Authority Revenue, Series A, 3.63%, 6/1/29 | 500,000 | 540,731 | |||||||||
Public Parking Authority Of Pittsburgh Revenue, 2.33%, 12/1/29 | 895,000 | 899,177 | |||||||||
State Public School Building Authority Revenue, 3.15%, 4/1/30 | 1,290,000 | 1,377,680 | |||||||||
2,817,588 | |||||||||||
Texas (0.8%): | |||||||||||
City of Houston Airport System Revenue, Series C, 2.09%, 7/1/28 | 750,000 | 752,491 | |||||||||
City of San Antoni, GO, 1.76%, 2/1/31, Continuously Callable @ 100 | 630,000 | 618,057 | |||||||||
County of Bexar Revenue, 2.28%, 8/15/32, Continuously Callable @ 100 | 1,070,000 | 1,036,187 | |||||||||
| Harris County Cultural Education Facilities Finance Corp. Revenue 3.34%, 11/15/37 | 2,000,000 | 2,124,478 | |||||||||
Series D, 2.28%, 7/1/34 | 370,000 | 365,719 | |||||||||
North Texas Tollway Authority Revenue, 1.02%, 1/1/25 | 1,000,000 | 989,818 | |||||||||
San Antonio Education Facilities Corp. Revenue, 2.50%, 4/1/29 | 1,270,000 | 1,241,370 | |||||||||
| Tarrant County Cultural Education Facilities Finance Corp. Revenue 1.63%, 9/1/26 | 525,000 | 526,856 | |||||||||
1.82%, 9/1/27 | 700,000 | 702,140 | |||||||||
| Uptown Development Authority Tax Allocation Series B, 2.58%, 9/1/31 | 270,000 | 272,293 | |||||||||
Series B, 2.78%, 9/1/33, Continuously Callable @ 100 | 500,000 | 509,615 | |||||||||
9,139,024 | |||||||||||
Virginia (0.1%): | |||||||||||
| Virginia Housing Development Authority Revenue Series J, 1.97%, 11/1/28 | 225,000 | 226,200 | |||||||||
See notes to financial statements.
37
| Victory Portfolios II VictoryShares USAA Core Intermediate-Term Bond ETF | Schedule of Portfolio Investments — continued December 31, 2021 | ||||||
(Unaudited)
Security Description | Principal Amount | Value | |||||||||
Series J, 2.27%, 11/1/31, Continuously Callable @ 100 | $ | 225,000 | $ | 226,540 | |||||||
Series J, 2.42%, 11/1/32, Continuously Callable @ 100 | 275,000 | 278,345 | |||||||||
Series J, 2.47%, 11/1/33, Continuously Callable @ 100 | 270,000 | 273,041 | |||||||||
Series J, 2.52%, 11/1/34, Continuously Callable @ 100 | 250,000 | 252,692 | |||||||||
Series J, 2.57%, 11/1/35, Continuously Callable @ 100 | 300,000 | 303,169 | |||||||||
1,559,987 | |||||||||||
Washington (0.1%): | |||||||||||
Washington State University Revenue, Series A, 2.24%, 10/1/28 | 1,000,000 | 1,013,194 | |||||||||
Total Municipal Bonds (Cost $36,829,598) | 37,553,585 | ||||||||||
U.S. Government Agency Mortgages (3.4%) | |||||||||||
| Federal Home Loan Mortgage Corp. Series K028, Class A2, 3.11%, 2/25/23 | 992,943 | 1,012,883 | |||||||||
Series K059, Class A2, 3.12%, 9/25/26 (c) | 1,000,000 | 1,071,798 | |||||||||
Series KIR3, Class A2, 3.28%, 8/25/27 | 1,500,000 | 1,636,289 | |||||||||
Series K069, Class A2, 3.19%, 9/25/27 (c) | 86,000 | 93,451 | |||||||||
Series K071, Class A2, 3.29%, 11/25/27 | 500,000 | 546,640 | |||||||||
Series K075, Class A2, 3.65%, 2/25/28 (c) | 500,000 | 558,391 | |||||||||
Series K087, Class A2, 3.77%, 12/25/28 | 500,000 | 565,398 | |||||||||
Series K091, Class A2, 3.51%, 3/25/29 | 1,250,000 | 1,395,817 | |||||||||
Series K095, Class A2, 2.79%, 6/25/29 | 1,000,000 | 1,072,865 | |||||||||
Series K097, Class A2, 2.51%, 7/25/29 | 2,000,000 | 2,107,443 | |||||||||
Series K096, Class A2, 2.52%, 7/25/29 | 1,000,000 | 1,054,252 | |||||||||
Series KG02, Class A2, 2.41%, 8/25/29 | 909,000 | 948,260 | |||||||||
Series K100, Class A2, 2.67%, 9/25/29 | 545,000 | 581,013 | |||||||||
Series K159, Class A2, 3.95%, 11/25/30 (c) | 500,000 | 579,715 | |||||||||
3.00%, 3/1/31 – 2/1/33 | 303,206 | 318,169 | |||||||||
3.50%, 5/1/33 – 11/1/47 | 1,561,143 | 1,660,739 | |||||||||
Series K-1510, Class A3, 3.79%, 1/25/34 | 1,000,000 | 1,161,443 | |||||||||
Series K-1512, Class A3, 3.06%, 4/25/34 | 1,000,000 | 1,089,919 | |||||||||
4.00%, 7/1/42 – 5/1/46 | 1,235,304 | 1,341,268 | |||||||||
4.50%, 12/1/45 | 93,343 | 102,867 | |||||||||
18,898,620 | |||||||||||
| Federal National Mortgage Association Series M4, Class A2, 3.06%, 3/25/28 (c) | 463,717 | 501,709 | |||||||||
Series 2019-M1, Class A2, 3.55%, 9/25/28 (c) | 750,000 | 839,111 | |||||||||
Series 2019-M12, Class A2, 2.89%, 5/25/29 (c) | 1,000,000 | 1,078,352 | |||||||||
2.50%, 11/1/34 | 340,456 | 352,214 | |||||||||
4.00%, 12/1/41 – 2/1/50 | 5,259,888 | 5,607,213 | |||||||||
3.50%, 9/1/45 – 2/1/50 | 5,579,653 | 5,915,419 | |||||||||
4.50%, 8/1/47 | 16,174 | 17,490 | |||||||||
3.00%, 2/1/50 | 617,345 | 640,208 | |||||||||
2.00%, 11/1/51 – 12/1/51 | 3,473,387 | 3,473,007 | |||||||||
18,424,723 | |||||||||||
| Government National Mortgage Association 3.00%, 10/20/51 | 2,963,899 | 3,074,926 | |||||||||
Total U.S. Government Agency Mortgages (Cost $39,044,092) | 40,398,269 | ||||||||||
See notes to financial statements.
38
| Victory Portfolios II VictoryShares USAA Core Intermediate-Term Bond ETF | Schedule of Portfolio Investments — continued December 31, 2021 | ||||||
(Unaudited)
Security Description | Principal Amount | Value | |||||||||
U.S. Treasury Obligations (39.1%) | |||||||||||
| U.S. Treasury Bonds 4.38%, 2/15/38 | $ | 750,000 | $ | 1,034,766 | |||||||
3.50%, 2/15/39 | 2,770,000 | 3,481,111 | |||||||||
4.38%, 11/15/39 | 1,000,000 | 1,393,125 | |||||||||
1.13%, 5/15/40 | 1,000,000 | 879,531 | |||||||||
1.38%, 11/15/40 | 5,000,000 | 4,571,094 | |||||||||
1.88%, 2/15/41 | 9,000,000 | 8,935,312 | |||||||||
1.75%, 8/15/41 | 1,000,000 | 972,656 | |||||||||
2.75%, 8/15/47 | 500,000 | 582,422 | |||||||||
2.75%, 11/15/47 | 500,000 | 582,813 | |||||||||
3.00%, 2/15/48 | 3,500,000 | 4,275,469 | |||||||||
3.38%, 11/15/48 | 2,012,000 | 2,634,462 | |||||||||
1.38%, 8/15/50 | 7,000,000 | 6,163,281 | |||||||||
1.63%, 11/15/50 | 3,000,000 | 2,807,813 | |||||||||
1.88%, 2/15/51 | 4,000,000 | 3,976,875 | |||||||||
2.00%, 8/15/51 | 2,000,000 | 2,048,750 | |||||||||
U.S. Treasury Inflation Indexed Bonds, 0.88%, 1/15/29 | 500,000 | 633,382 | |||||||||
U.S. Treasury Notes | |||||||||||
2.50%, 1/15/22 | 712,000 | 712,501 | |||||||||
1.88%, 1/31/22 | 1,000,000 | 1,001,289 | |||||||||
1.50%, 1/31/22 | 7,000,000 | 7,007,109 | |||||||||
2.50%, 2/15/22 | 2,000,000 | 2,005,547 | |||||||||
1.88%, 2/28/22 | 1,700,000 | 1,704,648 | |||||||||
2.25%, 4/15/22 | 2,000,000 | 2,011,875 | |||||||||
0.13%, 5/31/22 | 5,000,000 | 4,999,219 | |||||||||
0.13%, 6/30/22 | 10,000,000 | 9,995,703 | |||||||||
0.13%, 7/31/22 | 12,500,000 | 12,492,187 | |||||||||
1.50%, 8/15/22 | 1,000,000 | 1,007,656 | |||||||||
0.13%, 9/30/22 | 6,000,000 | 5,992,266 | |||||||||
0.13%, 10/31/22 | 10,000,000 | 9,983,594 | |||||||||
2.00%, 10/31/22 | 400,000 | 405,391 | |||||||||
0.13%, 6/30/23 | 10,000,000 | 9,932,812 | |||||||||
0.13%, 8/31/23 | 5,000,000 | 4,956,055 | |||||||||
0.13%, 9/15/23 | 6,000,000 | 5,944,687 | |||||||||
0.13%, 10/15/23 | 2,500,000 | 2,474,902 | |||||||||
0.25%, 11/15/23 | 22,000,000 | 21,817,813 | |||||||||
0.13%, 1/15/24 | 10,000,000 | 9,873,437 | |||||||||
2.00%, 4/30/24 | 24,550,000 | 25,215,535 | |||||||||
0.25%, 6/15/24 | 20,000,000 | 19,706,250 | |||||||||
0.38%, 7/15/24 | 7,000,000 | 6,913,594 | |||||||||
0.38%, 8/15/24 | 10,000,000 | 9,867,969 | |||||||||
1.50%, 10/31/24 | 3,000,000 | 3,047,109 | |||||||||
1.00%, 12/15/24 | 30,000,000 | 30,032,813 | |||||||||
2.25%, 12/31/24 | 5,000,000 | 5,189,063 | |||||||||
2.75%, 2/28/25 | 850,000 | 895,820 | |||||||||
0.25%, 6/30/25 | 10,000,000 | 9,716,406 | |||||||||
3.00%, 9/30/25 | 300,000 | 320,648 | |||||||||
0.25%, 9/30/25 | 3,500,000 | 3,389,531 | |||||||||
0.38%, 11/30/25 | 13,000,000 | 12,612,031 | |||||||||
See notes to financial statements.
39
| Victory Portfolios II VictoryShares USAA Core Intermediate-Term Bond ETF | Schedule of Portfolio Investments — continued December 31, 2021 | ||||||
(Unaudited)
Security Description | Shares or Principal Amount | Value | |||||||||
0.38%, 1/31/26 | $ | 4,000,000 | $ | 3,872,188 | |||||||
1.50%, 8/15/26 | 2,000,000 | 2,023,281 | |||||||||
1.38%, 8/31/26 | 8,000,000 | 8,050,000 | |||||||||
1.13%, 10/31/26 | 4,000,000 | 3,976,563 | |||||||||
1.63%, 10/31/26 | 5,000,000 | 5,086,719 | |||||||||
2.00%, 11/15/26 | 2,700,000 | 2,794,500 | |||||||||
0.50%, 6/30/27 | 2,500,000 | 2,392,773 | |||||||||
2.25%, 8/15/27 | 1,000,000 | 1,049,375 | |||||||||
2.25%, 11/15/27 | 1,700,000 | 1,785,930 | |||||||||
0.63%, 11/30/27 | 13,000,000 | 12,456,641 | |||||||||
0.75%, 1/31/28 | 10,000,000 | 9,637,500 | |||||||||
2.75%, 2/15/28 | 2,000,000 | 2,161,875 | |||||||||
1.25%, 3/31/28 | 8,000,000 | 7,935,000 | |||||||||
1.25%, 4/30/28 | 10,000,000 | 9,917,187 | |||||||||
2.88%, 5/15/28 | 4,000,000 | 4,359,063 | |||||||||
1.25%, 6/30/28 | 15,000,000 | 14,851,172 | |||||||||
1.00%, 7/31/28 | 15,000,000 | 14,608,594 | |||||||||
2.88%, 8/15/28 | 630,000 | 688,275 | |||||||||
1.13%, 8/31/28 | 5,000,000 | 4,905,469 | |||||||||
3.13%, 11/15/28 | 1,000,000 | 1,111,875 | |||||||||
2.63%, 2/15/29 | 1,000,000 | 1,081,250 | |||||||||
1.63%, 8/15/29 | 10,000,000 | 10,146,875 | |||||||||
0.63%, 5/15/30 | 2,500,000 | 2,340,625 | |||||||||
0.63%, 8/15/30 | 5,000,000 | 4,664,062 | |||||||||
0.88%, 11/15/30 | 17,000,000 | 16,165,937 | |||||||||
1.13%, 2/15/31 | 12,000,000 | 11,647,500 | |||||||||
1.63%, 5/15/31 | 20,000,000 | 20,256,250 | |||||||||
1.25%, 8/15/31 | 5,000,000 | 4,889,844 | |||||||||
Total U.S. Treasury Obligations (Cost $472,732,255) | 471,054,645 | ||||||||||
Commercial Papers (2.8%) (g) | |||||||||||
CenterPoint Energy, 0.15%, 1/3/22 (a) | 10,000,000 | 9,999,872 | |||||||||
Hannover Funding Co. LLC, 0.16%, 1/3/22 (a) | 1,000,000 | 999,987 | |||||||||
One Gas, Inc., 0.29%, 1/18/22 (a) | 2,000,000 | 1,999,708 | |||||||||
Sonoco Products Co., 0.15%, 1/3/22 (a) | 11,000,000 | 10,999,858 | |||||||||
Wisconsin Energy Corp., 0.12%, 1/4/22 (a) | 10,000,000 | 9,999,867 | |||||||||
Total Commercial Papers (Cost $33,999,419) | 33,999,292 | ||||||||||
Collateral for Securities Loaned^ (0.8%) | |||||||||||
BlackRock Liquidity Funds TempFund, Institutional Shares, 0.04% (h) | 214,462 | 214,462 | |||||||||
| Fidelity Investments Money Market Government Portfolio, Institutional Shares, 0.01% (h) | 4,212,067 | 4,212,067 | |||||||||
| Goldman Sachs Financial Square Prime Obligations Fund, Institutional Shares, 0.02% (h) | 107,027 | 107,027 | |||||||||
JPMorgan Prime Money Market Fund, Capital Shares, 0.07% (h) | 853,402 | 853,402 | |||||||||
See notes to financial statements.
40
| Victory Portfolios II VictoryShares USAA Core Intermediate-Term Bond ETF | Schedule of Portfolio Investments — continued December 31, 2021 | ||||||
(Unaudited)
Security Description | Principal Amount | Value | |||||||||
| Morgan Stanley Institutional Liquidity Prime Portfolio, Institutional Shares, 0.06% (h) | $ | 3,837,063 | $ | 3,837,063 | |||||||
Total Collateral for Securities Loaned (Cost $9,224,021) | 9,224,021 | ||||||||||
Total Investments (Cost $1,199,098,007) — 100.3% | 1,208,360,510 | ||||||||||
Liabilities in excess of other assets — (0.3)% | (3,633,478 | ) | |||||||||
NET ASSETS — 100.00% | $ | 1,204,727,032 | |||||||||
^ Purchased with cash collateral from securities on loan.
(a) Rule 144A security or other security that is restricted as to resale to institutional investors. The Fund's Adviser has deemed this security to be liquid (unless otherwise noted as illiquid) based upon procedures approved by the Board of Trustees. As of December 31, 2021, the fair value of these securities was $274,698,576 and amounted to 22.8% of net assets.
(b) Variable or Floating-Rate Security. Rate disclosed is as of December 31, 2021.
(c) The rate for certain asset-backed and mortgage-backed securities may vary based on factors relating to the pool of assets underlying the security. The rate disclosed is the rate in effect at December 31, 2021.
(d) All or a portion of this security is on loan.
(e) Security is perpetual and has no final maturity date but may be subject to calls at various dates in the future.
(f)�� Amount represents less than 0.05% of net assets.
(g) Rate represents the effective yield at December 31, 2021.
(h) Rate disclosed is the daily yield on December 31, 2021.
bps — Basis points
GO — General Obligation
H15T1Y — 1 Year Treasury Constant Maturity Rate
H15T5Y — 5 Year Treasury Constant Maturity Rate
IDA — Industrial Development Authority
LIBOR — London InterBank Offered Rate
LIBOR01M — 1 Month US Dollar LIBOR, rate disclosed as of December 31, 2021, based on the last reset date of the security
LIBOR03M — 3 Month US Dollar LIBOR, rate disclosed as of December 31, 2021, based on the last reset date of the security
LLC — Limited Liability Company
LP — Limited Partnership
MTN — Medium Term Note
PLC — Public Limited Company
SOFR — Secured Overnight Financing Rate
USISDA05 — 5 Year USD ICE Swap, rate disclosed as of December 31, 2021
USSW5 — USD 5 Year Swap Rate, rate disclosed as of December 31, 2021.
See notes to financial statements.
41
Victory Portfolios II | Statements of Assets and Liabilities December 31, 2021 | ||||||
(Unaudited)
| VictoryShares USAA Core Short-Term Bond ETF | VictoryShares USAA Core Intermediate-Term Bond ETF | ||||||||||
Assets: | |||||||||||
Investments, at value (Cost $388,206,445 and $1,199,098,007) | $ | 388,350,097 | $ | 1,208,360,510 | (a) | ||||||
| Cash | 1,615,979 | 1,016,991 | |||||||||
Deposit with broker for futures contracts | — | 40,048 | |||||||||
Receivables: | |||||||||||
Interest and dividends | 2,522,145 | 5,439,577 | |||||||||
Investments sold | 200,966 | — | |||||||||
Prepaid expenses | 302 | 980 | |||||||||
Total Assets | 392,689,489 | 1,214,858,106 | |||||||||
Liabilities: | |||||||||||
Payables: | |||||||||||
Collateral received on loaned securities | — | 9,224,021 | |||||||||
Investments purchased | 5,536,741 | 523,185 | |||||||||
Accrued expenses and other payables: | |||||||||||
Investment advisory fees | 81,307 | 305,324 | |||||||||
Administration fees | 7,197 | 22,017 | |||||||||
Custodian fees | 2,336 | 3,891 | |||||||||
Compliance fees | 143 | 592 | |||||||||
Trustees' fees | — | 1,634 | |||||||||
Other accrued expenses | 26,112 | 50,410 | |||||||||
Total Liabilities | 5,653,836 | 10,131,074 | |||||||||
Net Assets: | |||||||||||
Capital | 386,881,097 | 1,195,534,676 | |||||||||
Total accumulated earnings/(loss) | 154,556 | 9,192,356 | |||||||||
Net Assets | $ | 387,035,653 | $ | 1,204,727,032 | |||||||
Shares (unlimited shares authorized, no par value): | 7,550,000 | 22,750,000 | |||||||||
Net asset value: | $ | 51.26 | $ | 52.96 | |||||||
(a) Includes $8,913,411 of securities on loan.
See notes to financial statements.
42
Victory Portfolios II | Statements of Operations For the Six Months Ended December 31, 2021 | ||||||
(Unaudited)
| VictoryShares USAA Core Short-Term Bond ETF | VictoryShares USAA Core Intermediate-Term Bond ETF | ||||||||||
Investment Income: | |||||||||||
Interest | $ | 2,705,477 | $ | 10,399,779 | |||||||
Securities lending (net of fees) | 1,216 | 5,900 | |||||||||
Total Income | 2,706,693 | 10,405,679 | |||||||||
Expenses: | |||||||||||
Investment advisory fees | 379,152 | 1,604,831 | |||||||||
Administration fees | 82,313 | 290,420 | |||||||||
Sub-Administration fees | 10,057 | 12,395 | |||||||||
Custodian fees | 7,381 | 19,668 | |||||||||
Servicing fees | 7,339 | 7,337 | |||||||||
Trustees' fees | 8,765 | 28,984 | |||||||||
Compliance fees | 974 | 3,509 | |||||||||
Legal and audit fees | 13,661 | 34,699 | |||||||||
Other expenses | 23,987 | 50,311 | |||||||||
Total Expenses | 533,629 | 2,052,154 | |||||||||
Expenses waived/reimbursed by Adviser | (48,057 | ) | (169,575 | ) | |||||||
Net Expenses | 485,572 | 1,882,579 | |||||||||
Net Investment Income (Loss) | 2,221,121 | 8,523,100 | |||||||||
Realized/Unrealized Gains (Losses) from Investments: | |||||||||||
Net realized gains (losses) from investment securities | 466,159 | 1,834,964 | |||||||||
| Net change in unrealized appreciation/depreciation on investment securities | (2,669,667 | ) | (14,036,879 | ) | |||||||
Net realized/unrealized gains (losses) on investments | (2,203,508 | ) | (12,201,915 | ) | |||||||
Change in net assets resulting from operations | $ | 17,613 | $ | (3,678,815 | ) | ||||||
See notes to financial statements.
43
Victory Portfolios II | Statements of Changes in Net Assets | ||||||
| VictoryShares USAA Core Short-Term Bond ETF | VictoryShares USAA Core Intermediate-Term Bond ETF | ||||||||||||||||||
| Six Months Ended December 31, 2021 (Unaudited) | Year Ended June 30, 2021 | Six Months Ended December 31, 2021 (Unaudited) | Year Ended June 30, 2021 | ||||||||||||||||
From Investment Activities: | |||||||||||||||||||
Operations: | |||||||||||||||||||
Net investment income (loss) | $ | 2,221,121 | $ | 3,587,482 | $ | 8,523,100 | $ | 12,759,697 | |||||||||||
| Net realized gains (losses) from investments | 466,159 | 1,090,676 | 1,834,964 | 3,145,663 | |||||||||||||||
| Net change in unrealized appreciation/depreciation on investments | (2,669,667 | ) | 1,492,704 | (14,036,879 | ) | (2,477,903 | ) | ||||||||||||
| Change in net assets resulting from operations | 17,613 | 6,170,862 | (3,678,815 | ) | 13,427,457 | ||||||||||||||
| Change in net assets resulting from distributions to shareholders | (3,915,435 | ) | (4,553,556 | ) | (13,555,127 | ) | (14,839,541 | ) | |||||||||||
| Change in net assets resulting from capital transactions | 118,637,570 | 165,678,281 | 327,627,854 | 444,955,757 | |||||||||||||||
Change in net assets | 114,739,748 | 167,295,587 | 310,393,912 | 443,543,673 | |||||||||||||||
Net Assets: | |||||||||||||||||||
Beginning of period | 272,295,905 | 105,000,318 | 894,333,120 | 450,789,447 | |||||||||||||||
End of period | $ | 387,035,653 | $ | 272,295,905 | $ | 1,204,727,032 | $ | 894,333,120 | |||||||||||
Capital Transactions: | |||||||||||||||||||
Proceeds from shares issued | $ | 118,637,570 | $ | 181,229,714 | $ | 327,627,854 | $ | 458,507,492 | |||||||||||
Cost of shares redeemed | — | (15,551,433 | ) | — | (13,551,735 | ) | |||||||||||||
| Change in net assets resulting from capital transactions | $ | 118,637,570 | $ | 165,678,281 | $ | 327,627,854 | $ | 444,955,757 | |||||||||||
Share Transactions: | |||||||||||||||||||
Issued | 2,300,000 | 3,500,000 | 6,100,000 | 8,500,000 | |||||||||||||||
Redeemed | — | (300,000 | ) | — | (250,000 | ) | |||||||||||||
Change in Shares | 2,300,000 | 3,200,000 | 6,100,000 | 8,250,000 | |||||||||||||||
See notes to financial statements.
44
This page is intentionally left blank.
45
Victory Portfolios II | Financial Highlights | ||||||
For a Share Outstanding Throughout Each Period
Investment Activities | Distributions to Shareholders From | ||||||||||||||||||||||||||
| Net Asset Value, Beginning of Period | Net Investment Income (Loss)(a) | Net Realized and Unrealized Gains (Losses) on Investments | Total from Investment Activities | Net Investment Income | Net Realized Gains from Investments | ||||||||||||||||||||||
VictoryShares USAA Core Short-Term Bond ETF | |||||||||||||||||||||||||||
| Six Months Ended December 31, 2021 (Unaudited) | $ | 51.87 | 0.38 | (0.37 | ) | 0.01 | (0.45 | ) | (0.17 | ) | |||||||||||||||||
| Year Ended June 30, 2021 | $ | 51.22 | 0.84 | 0.93 | 1.77 | (0.90 | ) | (0.22 | ) | ||||||||||||||||||
| Ten Months Ended June 30, 2020(f) | $ | 50.65 | 1.10 | 0.48 | 1.58 | (1.01 | ) | — | |||||||||||||||||||
| Year Ended August 31, 2019 | $ | 49.50 | 1.37 | 1.13 | 2.50 | (1.35 | ) | — | |||||||||||||||||||
| October 24, 2017(h) through August 31, 2018 | $ | 50.00 | 0.93 | (0.59 | ) | 0.34 | (0.84 | ) | — | ||||||||||||||||||
VictoryShares USAA Core Intermediate-Term Bond ETF | |||||||||||||||||||||||||||
| Six Months Ended December 31, 2021 (Unaudited) | $ | 53.71 | 0.43 | (0.52 | ) | (0.09 | ) | (0.53 | ) | (0.13 | ) | ||||||||||||||||
| Year Ended June 30, 2021 | $ | 53.67 | 1.08 | 0.27 | 1.35 | (1.11 | ) | (0.20 | ) | ||||||||||||||||||
| Ten Months Ended June 30, 2020(f) | $ | 52.48 | 1.21 | 1.12 | 2.33 | (1.14 | ) | — | |||||||||||||||||||
| Year Ended August 31, 2019 | $ | 48.61 | 1.62 | 3.81 | 5.43 | (1.56 | ) | — | |||||||||||||||||||
| October 24, 2017(h) through August 31, 2018 | $ | 49.93 | 1.29 | (1.46 | ) | (0.17 | ) | (1.15 | ) | — | |||||||||||||||||
(a) Per share net investment income (loss) has been calculated using the average daily shares method.
(b) Not annualized for periods less than one year.
(c) Annualized for periods less than one year.
(d) Excludes impact of in-kind transactions.
(e) Includes impact of voluntary waivers. Without these voluntary waivers, the net expense ratio would have been at the contractual cap. (See note 4 in the Notes to Financial Statements)
(f) The Fund's fiscal year-end changed from August 31 to June 30, effective September 1, 2019.
(g) Portfolio turnover increased significantly due to changes in the volume and timing of purchases and sales of portfolio holdings during the period.
(h) Commencement of operations.
(i) Includes impact of voluntary waiver. Without this voluntary waiver, the net expense ratio would have been 0.03% and 0.02% higher for the six months ended December 31, 2021, and ten months ended June 30, 2020, respectively.
(j) Portfolio turnover decreased significantly due to changes in the volume and timing of purchases and sales of portfolio holdings during the year.
See notes to financial statements.
46
Victory Portfolios II | Financial Highlights — continued | ||||||
For a Share Outstanding Throughout Each Period
Ratios to Average Net Assets | Supplemental Data | ||||||||||||||||||||||||||||||||||
| Total Distributions | Net Asset Value, End of Period | Total Return(b) | Net Expenses(c) | Net Investment Income (Loss)(c) | Gross Expenses(c) | Net Assets, End of Period (000's) | Portfolio Turnover(b)(d) | ||||||||||||||||||||||||||||
VictoryShares USAA Core Short-Term Bond ETF | |||||||||||||||||||||||||||||||||||
| Six Months Ended December 31, 2021 (Unaudited) | (0.62 | ) | $ | 51.26 | 0.04 | % | 0.32 | %(e) | 1.46 | % | 0.35 | % | $ | 387,036 | 36 | % | |||||||||||||||||||
| Year Ended June 30, 2021 | (1.12 | ) | $ | 51.87 | 3.48 | % | 0.34 | %(e) | 1.62 | % | 0.37 | % | $ | 272,296 | 80 | % | |||||||||||||||||||
| Ten Months Ended June 30, 2020(f) | (1.01 | ) | $ | 51.22 | 3.17 | % | 0.35 | % | 2.62 | % | 0.44 | % | $ | 105,000 | 72 | %(g) | |||||||||||||||||||
| Year Ended August 31, 2019 | (1.35 | ) | $ | 50.65 | 5.11 | % | 0.35 | % | 2.75 | % | 0.40 | % | $ | 83,573 | 30 | % | |||||||||||||||||||
| October 24, 2017(h) through August 31, 2018 | (0.84 | ) | $ | 49.50 | 0.70 | % | 0.35 | % | 2.21 | % | 0.40 | % | $ | 61,872 | 22 | % | |||||||||||||||||||
VictoryShares USAA Core Intermediate-Term Bond ETF | |||||||||||||||||||||||||||||||||||
| Six Months Ended December 31, 2021 (Unaudited) | (0.66 | ) | $ | 52.96 | (0.18 | )% | 0.35 | %(i) | 1.59 | % | 0.38 | % | $ | 1,204,727 | 10 | % | |||||||||||||||||||
| Year Ended June 30, 2021 | (1.31 | ) | $ | 53.71 | 2.55 | % | 0.37 | %(e) | 2.01 | % | 0.41 | % | $ | 894,333 | 16 | % | |||||||||||||||||||
| Ten Months Ended June 30, 2020(f) | (1.14 | ) | $ | 53.67 | 4.52 | % | 0.38 | %(i) | 2.80 | % | 0.42 | % | $ | 450,789 | 13 | % | |||||||||||||||||||
| Year Ended August 31, 2019 | (1.56 | ) | $ | 52.48 | 11.37 | % | 0.39 | % | 3.27 | % | 0.44 | % | $ | 314,856 | 3 | %(j) | |||||||||||||||||||
| October 24, 2017(h) through August 31, 2018 | (1.15 | ) | $ | 48.61 | (0.33 | )% | 0.40 | % | 3.10 | % | 0.45 | % | $ | 150,703 | 10 | % | |||||||||||||||||||
See notes to financial statements.
47
Victory Portfolios II | Notes to Financial Statements December 31, 2021 | ||||||
(Unaudited)
1. Organization:
Victory Portfolios II (the "Trust") is organized as a Delaware statutory trust and the Trust is registered under the Investment Company Act of 1940, as amended (the "1940 Act"), as an open-end investment company. The Trust is comprised of 25 funds, 23 of which are Exchange-Traded Funds ("ETFs"), and is authorized to issue an unlimited number of shares, which are units of beneficial interest with no par value.
The accompanying financial statements are those of the following two Funds (collectively, the "Funds" and individually, a "Fund"). Each Fund is classified as diversified under the 1940 Act.
Funds (Legal Name) | Funds (Short Name) | ||||||
VictoryShares USAA Core Short-Term Bond ETF | USAA Core Short-Term Bond ETF | ||||||
VictoryShares USAA Core Intermediate-Term Bond ETF | USAA Core Intermediate-Term Bond ETF | ||||||
Under the Trust's organizational documents, its officers and trustees are indemnified against certain liabilities arising out of the performance of their duties to the Funds. In addition, in the normal course of business, the Funds enter into contracts with their vendors and others that provide for general indemnifications. The Funds' maximum exposure under these arrangements is unknown, as this would involve future claims that may be made against the Fund. However, based on experience, the Funds expect that risk of loss to be remote.
2. Significant Accounting Policies:
The following is a summary of significant accounting policies followed by the Trust in the preparation of its financial statements. The policies are in conformity with U.S. Generally Accepted Accounting Principles ("GAAP"). The preparation of financial statements in accordance with GAAP requires management to make estimates and assumptions that affect the reported amounts of assets and liabilities and disclosure of contingent assets and liabilities at the date of the financial statements and the reported amounts of income and expenses for the period. Actual results could differ from those estimates. The Funds follow the specialized accounting and reporting requirements under GAAP that are applicable to investment companies under Accounting Standards Codification Topic 946.
Shares of the Funds are listed and traded on the NYSE Arca, Inc. (the "Exchange"). The Funds issue and redeem shares ("Shares") at net asset value ("NAV") only in aggregations of 50,000 shares, (each a "Creation Unit"). Creation Units are issued and redeemed in exchange for a basket of securities included in the respective Fund's Index (the "Deposit Securities"), and/or with the deposit of a specified cash payment (the "Cash Component"), plus a transaction fee. Shares trade on the Exchange at market prices that may be below, at, or above NAV. Shares of a Fund may only be purchased or redeemed by certain financial institutions ("Authorized Participants"). An Authorized Participant is either (i) a broker-dealer or other participant in the clearing process through the Continuous Net Settlement System of the National Securities Clearing Corporation or (ii) a DTC participant and, in each case, must have executed a Participant Agreement with the distributor. Only Authorized Participants may purchase or redeem the shares directly from a Fund. In addition, shares may be issued in advance of receipt of Deposit Securities subject to various conditions, including a requirement to maintain on deposit with the Trust cash equal to up to 105% of the market value of the missing Deposit Securities. In each instance of such cash creations or redemptions, transaction fees may be imposed and may be higher than the transaction fees associated with in-kind creations or redemptions.
Each Fund may issue an unlimited number of shares of beneficial interest, with no par value. Shares of each Fund have equal rights and privileges. A purchase (i.e., creation) transaction fee is imposed for the transfer and other transactional costs associated with the purchase of Creation Units. In addition, a variable fee may be charged on all cash transactions or substitutes for Creation Units. Variable fees received by each Fund are displayed in the Capital Transactions section of the Statements of Changes in Net Assets as an increase to Capital.
48
Victory Portfolios II | Notes to Financial Statements — continued December 31, 2021 | ||||||
(Unaudited)
The transaction fees for each Fund are listed below:
| Fee for In-Kind and Cash Purchases and Redemptions | Maximum Additional Variable Charge for Cash Purchases and Redemptions* | ||||||||||
USAA Core Short-Term Bond ETF | $ | 100 | 2.00 | % | |||||||
USAA Core Intermediate-Term Bond ETF | 100 | 2.00 | % | ||||||||
* As a percentage of the amount invested.
Investment Valuation:
The Funds record investments at fair value. Fair value is defined as the price that would be received to sell an asset or paid to transfer a liability in an orderly transaction between market participants at the measurement date.
The valuation techniques described below maximize the use of observable inputs and minimize the use of unobservable inputs in determining fair value. The inputs used for valuing the Funds' investments are summarized in the three broad levels listed below:
• Level 1 — quoted prices in active markets for identical securities
• Level 2 — other significant observable inputs (including quoted prices for similar securities or interest rates applicable to those securities, etc.)
• Level 3 — significant unobservable inputs (including the Funds' own assumptions in determining the fair value of investments)
Changes in valuation techniques may result in transfers in or out of an assigned level within the disclosure hierarchy. The inputs or methodologies used for valuation techniques are not necessarily an indication of the risk associated with entering into those investments.
Victory Capital Management Inc. ("VCM" or the "Adviser") has established the Pricing and Liquidity Committee (the "Committee"), and subject to the Trust's Board of Trustees' (the "Board") oversight, the Committee administers and oversees the Funds' valuation policies and procedures, which are approved by the Board.
Investments in open-end investment companies are valued at their NAV. These valuations are typically categorized as Level 1 in the fair value hierarchy.
Debt securities are valued each business day by a pricing service approved by the Board. The approved pricing service uses the evaluated bid or the last sale price to value securities. Debt obligations maturing within 60 days may be valued at amortized cost, provided that the amortized cost represents the fair value of such securities. These valuations are typically categorized as Level 2 in the fair value hierarchy.
In the event that price quotations or valuations are not readily available, investments are valued at fair value in accordance with procedures established by and under the general supervision and responsibility of the Board. These valuations are typically categorized as Level 2 or Level 3 in the fair value hierarchy, based on the observability of inputs used to determine the fair value. The effect of fair value pricing is that securities may not be priced on the basis of quotations from the primary market in which they are traded and the actual price realized from the sale of a security may differ materially from the fair value price. Valuing these securities at fair value is intended to cause the Fund's NAV to be more reliable than it otherwise would be.
49
Victory Portfolios II | Notes to Financial Statements — continued December 31, 2021 | ||||||
(Unaudited)
A summary of the valuations as of December 31, 2021, is included in the table below while the breakdown, by category, of investments is disclosed on the Schedules of Portfolio Investments:
Level 1 | Level 2 | Level 3 | Total | ||||||||||||||||
USAA Core Short-Term Bond ETF | |||||||||||||||||||
Asset-Backed Securities | $ | — | $ | 63,279,163 | $ | — | $ | 63,279,163 | |||||||||||
Collateralized Mortgage Obligations | — | 18,281,161 | — | 18,281,161 | |||||||||||||||
Senior Secured Loans | — | 4,948,961 | — | 4,948,961 | |||||||||||||||
Corporate Bonds | — | 165,385,385 | — | 165,385,385 | |||||||||||||||
Yankee Dollars | — | 49,146,937 | — | 49,146,937 | |||||||||||||||
Municipal Bonds | — | 68,212,629 | — | 68,212,629 | |||||||||||||||
U.S. Treasury Obligations | — | 8,996,250 | — | 8,996,250 | |||||||||||||||
Commercial Papers | — | 10,099,611 | — | 10,099,611 | |||||||||||||||
Total | $ | — | $ | 388,350,097 | $ | — | $ | 388,350,097 | |||||||||||
USAA Core Intermediate-Term Bond ETF | |||||||||||||||||||
Asset-Backed Securities | $ | — | $ | 93,763,478 | $ | — | $ | 93,763,478 | |||||||||||
Collateralized Mortgage Obligations | — | 29,784,299 | — | 29,784,299 | |||||||||||||||
Corporate Bonds | — | 392,067,432 | — | 392,067,432 | |||||||||||||||
Yankee Dollars | — | 100,515,489 | — | 100,515,489 | |||||||||||||||
Municipal Bonds | — | 37,553,585 | — | 37,553,585 | |||||||||||||||
U.S. Government Agency Mortgages | — | 40,398,269 | — | 40,398,269 | |||||||||||||||
U.S. Treasury Obligations | — | 471,054,645 | — | 471,054,645 | |||||||||||||||
Commercial Papers | — | 33,999,292 | — | 33,999,292 | |||||||||||||||
Collateral for Securities Loaned | 9,224,021 | — | — | 9,224,021 | |||||||||||||||
Total | $ | 9,224,021 | $ | 1,199,136,489 | $ | — | $ | 1,208,360,510 | |||||||||||
For the six months ended December 31, 2021, there were no transfers in or out of Level 3 in the fair value hierarchy.
Securities Purchased on a Delayed-Delivery or When-Issued Basis:
The Funds may purchase securities on a delayed-delivery or when-issued basis. Delivery and payment for securities that have been purchased by the Fund on a delayed-delivery or when-issued basis, or for delayed draws on loans can take place a month or more after the trade date. At the time a Fund makes the commitment to purchase a security on a when-issued basis, the Fund records the transaction and reflects the value of the security in determining NAV. No interest accrues to the Fund until the transaction settles and payment takes place. Normally, the settlement date occurs within one month of the purchase. A segregated account is established and the Fund maintains cash and/or marketable securities at least equal in value to commitments for when-issued securities. If a Fund owns when-issued securities, these values are included in Payables for investments purchased on the accompanying Statements of Assets and Liabilities and the segregated assets are identified on the Schedules of Portfolio Investments.
Municipal Obligations:
The values of municipal obligations can fluctuate and may be affected by adverse tax, legislative, or political changes, and by financial developments affecting municipal issuers. Payment of municipal obligations may depend on a relatively limited source of revenue, resulting in greater credit risk. Future changes in federal tax laws or the activity of an issuer may adversely affect the tax-exempt status of municipal obligations.
Mortgage- and Asset-Backed Securities:
The values of some mortgage-related or asset-backed securities may be particularly sensitive to changes in prevailing interest rates. Early repayment of principal on some mortgage-related securities may expose the Fund to a lower rate of return upon reinvestment of principal. The values of mortgage- and asset-backed securities depend in part on the credit quality and adequacy of the underlying assets or
50
Victory Portfolios II | Notes to Financial Statements — continued December 31, 2021 | ||||||
(Unaudited)
collateral and may fluctuate in response to the market's perception of these factors as well as current and future repayment rates. Some mortgage-backed securities are backed by the full faith and credit of the U.S. government (e.g., mortgage-backed securities issued by the Government National Mortgage Association, commonly known as "Ginnie Mae"), while other mortgage-backed securities (e.g., mortgage-backed securities issued by the Federal National Mortgage Association and the Federal Home Loan Mortgage Corporation, commonly known as "Fannie Mae" and "Freddie Mac," respectively), are backed only by the credit of the government entity issuing them. In addition, some mortgage-backed securities are issued by private entities and, as such, are not guaranteed by the U.S. government or any agency or instrumentality of the U.S. government.
Below-Investment-Grade Securities:
Certain Funds may invest in below-investment-grade securities (i.e., lower-quality, "junk" debt), which are subject to various risks. Lower-quality debt is considered to be speculative because it is less certain that the issuer will be able to pay interest or repay the principal than in the case of investment-grade debt. These securities can involve a substantially greater risk of default than higher-rated securities, and their values can decline significantly over short periods of time. Lower-quality debt securities tend to be more sensitive to adverse news about their issuers, the market and the economy in general, than higher-quality debt securities. The market for these securities can be less liquid, especially during periods of recession or general market decline.
Collateralized Loan Obligations ("CLOs"):
CLOs are securities issued by entities that are collateralized by a pool of loans. CLOs are issued in multiple classes (tranches) and can be equity or debt with specific adjustable or fixed interest rates and varying maturities. The cash flow from the underlying loans is used to pay off each tranche separately within the debt, or senior tranches. Equity, or subordinated tranches, typically are not paid a cash flow but do offer ownership in the CLO itself in the event of a sale.
Bank Loans:
Floating rate loans in which a Fund invests are primarily "senior" loans. Senior floating rate loans typically hold a senior position in the capital structures of the borrower, are typically secured by specific collateral, and have a claim on the assets and/or stock of the borrower that is senior to that held by subordinated debtholders and stockholders of the borrower. While these protections may reduce risk, these investments still present significant credit risk. A significant portion of a Fund's floating rate investments may be issued in connection with highly leveraged transactions such as leveraged buyouts, leveraged recapitalization loans, and other types of acquisition financing. Obligations in these types of transactions are subject to greater credit risk (including default and bankruptcy) than many other investments and may be, or become, illiquid. See the note below regarding below investment grade securities.
The Funds may purchase second-lien loans (secured loans with a claim on collateral subordinate to a senior lender's claim on such collateral), fixed rate loans, unsecured loans, and other debt obligations.
Transactions in loans often settle on a delayed basis, and a Fund may not receive the proceeds from the sale of a loan or pay for a loan purchase for a substantial period of time after entering into the transactions.
Investment Companies:
Open-End Funds:
The Funds may invest in portfolios of open-end investment companies. These investment companies value securities in their portfolios for which market quotations are readily available at their market values (generally the last reported sale price) and all other securities and assets at their fair value by the methods established by the board of directors of the underlying funds.
51
Victory Portfolios II | Notes to Financial Statements — continued December 31, 2021 | ||||||
(Unaudited)
Investment Transactions and Related Income:
Changes in holdings of investments are accounted for no later than one business day following the trade date. For financial reporting purposes, however, investment transactions are accounted for on trade date or the last business day of the reporting period. Interest income is determined on the basis of coupon interest accrued using the effective interest method which adjusts, where applicable, the amortization of premiums or accretion of discounts. Dividend income is recorded on the ex-dividend date. Gains or losses realized on sales of securities are recorded on the identified cost basis. Paydown gains or losses on applicable securities, if any, are recorded as components of Interest income on the Statements of Operations.
The Funds may receive other income from investments in loan assignments and/or unfunded commitments, including amendment fees, consent fees, and commitment fees. These fees are recorded as income when received. These amounts, if received, are included in Interest income on the Statements of Operations.
Securities Lending:
The Funds, through a Securities Lending Agreement with Citibank, N.A. ("Citibank"), may lend their securities to qualified financial institutions, such as certain broker-dealers and banks, to earn additional income, net of income retained by Citibank. Borrowers are required to initially secure their loans for collateral in the amount of at least 102% of the value of U.S. securities loaned or at least 105% of the value of non-U.S. securities loaned, marked-to-market daily. Any collateral shortfalls associated with increases in the valuation of the securities loaned are generally cured the next business day. The collateral can be received in the form of cash collateral and/or non-cash collateral. Non-cash collateral can include U.S. Government Securities and other securities as permitted by Securities and Exchange Commission ("SEC") guidelines. The cash collateral is invested in short-term instruments or cash equivalents, primarily open-end investment companies, as noted on the Funds' Schedules of Portfolio Investments. The Funds effectively do not have control of the non-cash collateral and therefore it is not disclosed on the Funds' Schedules of Portfolio Investments. Collateral requirements are determined daily based on the value of the Funds' securities on loan as of the end of the prior business day. During the time portfolio securities are on loan, the borrower will pay the Funds any dividends or interest paid on such securities plus any fee negotiated between the parties to the lending agreement. The Funds also earn a return from the collateral. The Funds pay Citibank various fees in connection with the investment of cash collateral and fees based on the investment income received from securities lending activities. Securities lending income (net of these fees) is disclosed on the Statements of Operations. Loans are terminable upon demand and the borrower must return the loaned securities within the lesser of one standard settlement period or five business days. Although risk is mitigated by the collateral, a Fund could experience a delay in recovering its securities and possible loss of income or value if the borrower fails to return them. In addition, there is a risk that the value of the short-term investments will be less than the amount of cash collateral required to be returned to the borrower.
The Funds' agreement with Citibank does not include master netting provisions. Non-cash collateral received by the Funds may not be sold or repledged, except to satisfy borrower default.
The following table is a summary of the Funds' securities lending transactions as of December 31, 2021.
| Value of Securities on Loan | Non-Cash Collateral | Cash Collateral | |||||||||||||
USAA Core Intermediate-Term Bond ETF | $ | 8,913,411 | $ | — | $ | 9,224,021 | |||||||||
52
Victory Portfolios II | Notes to Financial Statements — continued December 31, 2021 | ||||||
(Unaudited)
Federal Income Taxes:
It is each Fund's policy to continue to qualify as a regulated investment company by complying with the provisions available to certain investment companies, as defined in applicable sections of the Internal Revenue Code, and to make distributions of net investment income and net realized gains sufficient to relieve it from all, or substantially all, federal income taxes. Accordingly, no provision for federal income taxes is required in the financial statements. The Funds have a tax year end of June 30.
For the six months ended December 31, 2021, the Funds did not incur any income tax, interest, or penalties, and have recorded no liability for net unrecognized tax benefits relating to uncertain income tax positions.
Management of the Funds has reviewed tax positions taken in tax years that remain subject to examination by all major tax jurisdictions, including federal (i.e., the last four tax years, which includes the current fiscal tax year end). Management believes that there is no tax liability resulting from unrecognized tax benefits related to uncertain tax positions taken.
Allocations:
Expenses directly attributable to a Fund are charged to that Fund, while expenses that are attributable to more than one fund in the Trust, or jointly with an affiliated trust, are allocated among the respective funds in the Trust and/or an affiliated trust based upon net assets or another appropriate basis.
Cross-Trade Transactions:
Pursuant to Rule 17a-7 under the 1940 Act, the Funds may engage in securities transactions with affiliated investment companies and advisory accounts managed by the Adviser and any applicable sub-adviser. Any such purchase or sale transaction must be effected without brokerage commission or other remuneration, except for customary transfer fees. The transaction must be effected at the current market price, which is either the security's last sale price on an exchange or, if there are no transactions in the security that day, at the average of the highest bid and lowest asked price. For the year ended June 30, 2021, the Fund engaged in the following securities transactions with affiliated funds, which resulted in the following net realized gains (losses):
Purchases | Sales | Net Realized Gains (Losses) | |||||||||||||
USAA Core Intermediate-Term Bond ETF | $ | 2,881,243 | $ | — | $ | — | |||||||||
3. Purchases and Sales:
Purchases and sales of securities (excluding securities maturing less than one year from acquisition) for the six months ended December 31, 2021, were as follows:
| Excluding U.S. Government Securities | U.S. Government Securities | ||||||||||||||||||
Purchases | Sales | Purchases | Sales | ||||||||||||||||
USAA Core Short-Term Bond ETF | $ | 188,756,119 | $ | 75,750,542 | $ | 31,931,484 | $ | 22,878,086 | |||||||||||
| USAA Core Intermediate-Term Bond ETF | 220,077,849 | 46,939,311 | $ | 193,576,205 | 50,342,179 | ||||||||||||||
4. Fees and Transactions with Affiliates and Related Parties:
Investment Advisory Fees:
Investment advisory services are provided to the Funds by the Adviser, which is a New York corporation registered as an investment adviser with the SEC. The Adviser is an indirect wholly owned subsidiary of Victory Capital Holdings, Inc., a publicly traded Delaware corporation, and a wholly owned direct subsidiary of Victory Capital Operating, LLC.
53
Victory Portfolios II | Notes to Financial Statements — continued December 31, 2021 | ||||||
(Unaudited)
Under the terms of the Investment Advisory Agreement, the Adviser is entitled to receive fees based on a percentage of the average daily net assets of each Fund. The rates at which the Adviser is paid by each Fund are included in the table below.
Flat Rate | |||||||
USAA Core Short-Term Bond ETF | 0.25 | % | |||||
USAA Core Intermediate-Term Bond ETF | 0.30 | % | |||||
Amounts incurred and paid to VCM for the six months ended December 31, 2021, are reflected on the Statements of Operations as Investment advisory fees.
Administration and Servicing Fees:
VCM also serves as the Funds' administrator and fund accountant. Under the Administration and Fund Accounting Agreement, VCM is entitled to receive fees based on a percentage of the average daily net assets of the Trust, Victory Variable Insurance Funds and Victory Portfolios. The tiered rates at which VCM is paid by the Funds are shown in the table below:
Net Assets | |||||||||||
Up to $15 billion | $15 billion – $30 billion | Over $30 billion | |||||||||
0.08 | %, plus | 0.05 | %, plus | 0.04 | % | ||||||
Amounts incurred for the six months ended December 31, 2021, are reflected on the Statements of Operations as Administration fees.
Citi Fund Services Ohio, Inc. ("Citi"), an affiliate of Citibank, acts as sub-administrator and sub-fund accountant to the Funds pursuant to the Sub-Administration and Sub-Fund Accounting Services Agreement between VCM and Citi. VCM pays Citi a fee for providing these services. The Trust reimburses VCM and Citi for out-of-pocket expenses incurred in providing these services and certain other expenses specifically allocated to the Funds. Amounts incurred for the six months ended December 31, 2021, are reflected on the Statements of Operations as Sub-Administration fees.
The Funds (as part of the Trust) have entered into an agreement with the Adviser to provide compliance services, pursuant to which the Adviser furnishes its compliance personnel, including the services of the Chief Compliance Officer ("CCO"), and other resources reasonably necessary to provide the Trust with compliance oversight services related to the design, administration, and oversight of a compliance program for the Trust in accordance with Rule 38a-1 under the 1940 Act. The CCO is an employee of the Adviser, which pays the compensation of the CCO and support staff. The funds in the Trust, Victory Variable Insurance Funds, Victory Portfolios, and USAA Mutual Funds (collectively, the "Victory Funds Complex") in the aggregate, compensate the Adviser for these services. Amounts incurred for the six months ended December 31, 2021, are reflected on the Statements of Operations as Compliance fees.
Transfer Agency Fees:
Citibank serves as the Funds' Transfer Agent. Amounts incurred for the six months ended December 31, 2021, are reflected on the Statements of Operations as Transfer agent fees.
Distributor/Underwriting Services:
Foreside Fund Services, LLC ("Foreside") serves as the Funds' distributor.
Other Fees:
Citibank serves as the Funds' custodian. The Funds pay Citibank a fee for providing these services. Amounts incurred for the six months ended December 31, 2021, are reflected on the Statements of Operations as Custodian fees.
Sidley Austin LLP provides legal services to the Trust.
The Adviser has entered into expense limitation agreements with the Funds. Under the terms of the agreements, the Adviser has agreed to waive fees or reimburse certain expenses to the extent that ordinary operating expenses incurred by certain Funds in any fiscal year exceed the expense limit for
54
Victory Portfolios II | Notes to Financial Statements — continued December 31, 2021 | ||||||
(Unaudited)
such Fund. Such excess amounts will be the liability of the Adviser. Acquired fund fees and expenses, interest, taxes, brokerage commissions, other expenditures which are capitalized in accordance with GAAP, and other extraordinary expenses not incurred in the ordinary course of a Fund's business are excluded from the expense limits. As of December 31, 2021, the expense limits (excluding voluntary waivers) are as follows:
| In Effect Until October 31, 2022 | |||||||
USAA Core Short-Term Bond ETF | 0.35 | % | |||||
USAA Core Intermediate-Term Bond ETF | 0.40 | % | |||||
Under the terms of the expense limitation agreements, as amended May 1, 2021, the Funds have agreed to repay fees and expenses that were waived or reimbursed by the Adviser for a period of up to three years (thirty-six (36) months) after the waiver or reimbursement took place, subject to the lesser of any operating expense limits in effect at the time of: (a) the original waiver or expense reimbursement; or (b) the recoupment, after giving effect to the recoupment amount. Prior to May 1, 2021, the Funds were permitted to recoup fees waived and expenses reimbursed for up to three years after the fiscal year in which the waiver or reimbursement took place, subject to the limitations above. This change did not have any effect on the amounts previously reported for recoupment.
As of December 31, 2021, the following amounts are available to be repaid to the Adviser. The Funds have not recorded any amounts available to be repaid as a liability due to an assessment that repayments are not probable at December 31, 2021.
2023 | |||||||
| USAA Core Short-Term Bond ETF | $ | 41,935 | |||||
The Adviser may voluntarily waive or reimburse additional fees to assist the Funds in maintaining competitive expense ratios. Voluntary waivers and reimbursements applicable to the Funds are not available to be recouped at a future time and are reflected on the Statements of Operations as Expenses waived/reimbursed by Adviser. For the six months ended December 31, 2021, the Adviser voluntarily waived the following amounts:
USAA Core Short-Term Bond ETF | $ | 48,057 | |||||
USAA Core Intermediate-Term Bond ETF | 169,574 | ||||||
Certain officers and/or interested trustees of the Funds are also officers and/or employees of the Adviser, administrator, fund accountant, sub-administrator, sub-fund accountant, custodian, legal counsel, and distributor.
5. Risks:
The Funds may be subject to other risks in addition to these identified risks.
Debt Securities or Bond Risk — The Funds are subject to the risk that the market value of the bonds in the Funds' portfolios will fluctuate because of changes in interest rates, changes in the supply of and demand for debt securities, and other market factors. Bond prices generally are linked to the prevailing market interest rates. In general, when interest rates rise, bond prices typically fall; conversely, when interest rates fall, bond prices typically rise. The price volatility of a bond also depends on its duration, which is a measure of a bond's sensitivity to a change in interest rates. Generally, the longer the duration of a bond, the greater is its sensitivity to interest rates. To compensate investors for this higher interest rate risk, bonds with longer durations generally offer higher yields than bonds with shorter durations. Should the U.S. Federal Reserve raise interest rates, the Funds may be subject to risks associated with rising interest rates. The fixed-income securities in the Funds' portfolios also are subject to credit risk, which is the possibility that an issuer of a fixed-income security cannot make timely interest and principal payments on its securities or that negative market perceptions of the issuer's ability to make such payments will cause the price of that security to decline. The Funds accept some credit risk as a recognized means to enhance an investor's return.
55
Victory Portfolios II | Notes to Financial Statements — continued December 31, 2021 | ||||||
(Unaudited)
High-Yield Bond Risk — Fixed-income securities rated below investment grade, also known as "junk" or high-yield bonds, generally entail greater credit and liquidity risk than investment-grade securities. Their prices also may be more volatile, especially during economic downturns and financial setbacks or liquidity events. The Funds' values could be hurt by price declines due to actual or perceived changes in an issuer's ability to make such payments. These securities are considered by the major rating agencies to be predominantly speculative with respect to the issuer's continuing ability to pay principal and interest, and they carry a greater risk that the issuer of such securities will default on the timely payment of principal and interest. Issuers of securities that are in default or have defaulted may fail to resume principal or interest payments, in which case the Funds may lose their entire investment. The creditworthiness of issuers of these securities may be more complex to analyze than that of issuers of investment-grade debt securities, and the overreliance on credit ratings may present additional risks.
Asset-Backed and Mortgage-Backed Securities Risk — Mortgage- and asset-backed securities ("MBS" or "ABS," respectively) differ from conventional debt securities because principal is paid back over the life of the security rather than at maturity. MBS and ABS are subject to prepayment or call risk, which is the risk that a borrower's payments may be received earlier than expected due to changes in prepayment rates on underlying loans. As a result, the Funds may reinvest these early payments at lower interest rates, thereby reducing the Fund's income. These securities also are subject to extension risk, which is the risk that the life of the ABS or MBS may be extended due to higher interest rates and lower prepayments. As a result, the value of the securities will decrease. The value of MBS can be impacted by factors affecting the housing market, and MBS also are subject to the risk of high default rates on the mortgages within the mortgage pool. The liquidity of non-agency or privately issued ABS or MBS securities, in particular those that are rated as non-investment grade, may change dramatically over time.
LIBOR Discontinuation Risk — The London Interbank Offered Rate ("LIBOR") discontinuation may adversely affect the financial markets generally and the Funds' operations, finances and investments specifically. LIBOR has been the principal floating-rate benchmark in the financial markets, and a large portion of the Funds' assets are tied to LIBOR. However, LIBOR has been or will be discontinued as a floating rate benchmark. The date of discontinuation depends on the LIBOR currency and tenor. With limited exceptions, no new LIBOR obligations will be entered into after December 31, 2021. Existing LIBOR obligations have transitioned or will transition to another benchmark, depending on the LIBOR currency and tenor. For some existing LIBOR-based obligations, the contractual consequences of the discontinuation of LIBOR may not be clear.
Non-LIBOR floating-rate obligations, including Secured Overnight Financing Rate ("SOFR")-based obligations, may have returns and values that fluctuate more than those of floating-rate debt obligations that are based on LIBOR or other rates. Also, because SOFR and some alternative floating rates are relatively new market indexes, markets for certain non-LIBOR obligations may never develop or may not be liquid. Market terms for non-LIBOR floating rate obligations, such as the spread over the index reflected in interest-rate provisions, may evolve over time, and prices of non-LIBOR floating rate obligations may be different depending on when they are issued and changing views about correct spread levels.
Various SOFR-based rates, including SOFR-based term rates, and various non-SOFR-based rates are expected to develop in response to the discontinuation of U.S. dollar LIBOR, which may create various risks for the Funds and the financial markets more generally. There are non-LIBOR forward-looking floating rates that are not based on SOFR and that may be considered by participants in the financial markets as LIBOR alternatives. Such rates include Ameribor (American Interbank Offered Rate), BSBY (Bloomberg Short-Term Bank Yield Index) and BYI (Bank Yield Index). Unlike forward-looking SOFR-based term rates, such rates are intended to reflect a bank credit spread component.
It is not clear how replacement rates for LIBOR — including SOFR-based rates and non-SOFR-based rates — will develop and to what extent they will be used. There is no assurance that these replacement rates will be suitable substitutes for LIBOR, and thus the substitution of such rates for LIBOR could have an adverse effect on the Funds and the financial markets more generally. Concerns about market depth and stability could affect the development of non-SOFR-based term rates, and such rates may create various risks, which may or may not be similar to the risks relating to SOFR.
56
Victory Portfolios II | Notes to Financial Statements — continued December 31, 2021 | ||||||
(Unaudited)
6. Borrowing and Interfund Lending:
Line of Credit:
The Victory Funds Complex participates in a short-term demand note "Line of Credit" agreement with Citibank. The Line of Credit agreement with Citibank was renewed on June 28, 2021, with a termination date of June 27, 2022. Under the agreement with Citibank, the Victory Funds Complex may borrow up to $600 million, of which $300 million is committed and $300 million is uncommitted. $40 million of the Line of Credit is reserved for use by the Victory Floating Rate Fund, another series of the Victory Funds Complex, with Victory Floating Rate Fund paying the related commitment fees for that amount. The purpose of the Line of Credit is to meet temporary or emergency cash needs. For the six months ended December 31, 2021, Citibank received an annual commitment fee of 0.15% on $300 million for providing the Line of Credit. Each fund in the Victory Funds Complex pays a pro-rata portion of the commitment fees plus any interest (one-month LIBOR plus one percent, with LIBOR to be replaced by a different benchmark rate in accordance with the terms of the agreement) on amounts borrowed. Prior to June 28, 2021, the Victory Funds Complex paid an annual commitment fee of 0.15% and an upfront fee of 0.10%. Each fund in the Victory Funds Complex paid a pro-rata portion of the upfront fee. Interest charged to each fund during the period, if applicable, is reflected on the Statements of Operations under Line of credit fees.
The Funds had no borrowings under the Line of Credit agreement during the six months ended December 31, 2021.
7. Federal Income Tax Information:
Dividends from net investment income, if any, are declared and paid as noted in the table below. Distributable net realized gains, if any, are declared and distributed at least annually from each Fund.
Declared | Paid | ||||||||||
USAA Core Short-Term Bond ETF | Monthly | Monthly | |||||||||
USAA Core Intermediate-Term Bond ETF | Monthly | Monthly | |||||||||
The amounts of dividends from net investment income and distributions from net realized gains (collectively, distributions to shareholders) are determined in accordance with federal income tax regulations, which may differ from GAAP. To the extent these "book/tax" differences are permanent in nature (e.g., net operating loss and distribution reclassification), such amounts are reclassified within the components of net assets based on their federal tax-basis treatment; temporary differences (e.g., wash sales) do not require reclassification. To the extent dividends and distributions exceed net investment income and net realized gains for tax purposes, they are reported as distributions of capital. Net investment losses incurred by the Funds may be reclassified as an offset to capital on the accompanying Statements of Assets and Liabilities.
The tax character of current year distributions paid and the tax basis of the current components of accumulated earnings (deficit) will be determined at the end of the current tax year ending June 30, 2022.
As of June 30, 2021, the Funds had no capital loss carryforwards for federal income tax purposes.
57
Victory Portfolios II | Supplemental Information December 31, 2021 | ||||||
(Unaudited)
Proxy Voting and Portfolio Holdings Information
Proxy Voting:
Information regarding the policies and procedures each Fund uses to determine how to vote proxies relating to portfolio securities is available without charge, upon request, by calling 800-539-3863. The information is also included in the Funds' Statement of Additional Information, which is available on the SEC's website at www.sec.gov.
Information relating to how the Funds voted proxies relating to portfolio securities held during the most recent 12 months ended June 30 is available on the SEC's website at www.sec.gov.
Availability of Schedules of Portfolio Investments:
The Trust files a complete list of Schedules of Portfolio Investments with the SEC for the first and third quarter of each fiscal year on Form N-PORT. Forms N-PORT are available on the SEC's website at www.sec.gov.
Expense Examples
As a shareholder of the Fund, you may incur two types of costs: (1) transaction costs, and (2) ongoing costs, including management fees and other Fund expenses. These examples are intended to help you understand your ongoing costs (in dollars) of investing in the Fund and to compare these costs with the ongoing costs of investing in other mutual funds.
These examples are based on an investment of $1,000 invested at the beginning of the period and held for the entire period from July 1, 2021, through December 31, 2021.
The Actual Expense figures in the table below provide information about actual account values and actual expenses. You may use the information below, together with the amount you invested, to estimate the expenses that you paid over the period. Simply divide your account value by $1,000 (for example, an $8,600 account value divided by $1,000 = 8.6), then multiply the result by the number in the table under the heading entitled "Actual Expenses Paid During Period" to estimate the expenses you paid on your account during this period.
The Hypothetical Expense figures in the table below provide information about hypothetical account values and hypothetical expenses based on the Fund's actual expense ratio and an assumed rate of return of 5% per year before expenses, which is not the Fund's actual return. The hypothetical account values and expenses may not be used to estimate the actual ending account balance or expenses you paid for the period. You may use this information to compare this 5% hypothetical example with the 5% hypothetical examples that appear in shareholder reports of other funds.
Please note the expenses shown in the table below are meant to highlight your ongoing costs only and do not reflect any transactional costs. Therefore, the hypothetical expenses in the table are useful in comparing ongoing costs only and will not help you determine the relative total costs of owning different funds. In addition, if these transactional costs were included, your costs would have been higher.
| Beginning Account Value 7/1/21 | Actual Ending Account Value 12/31/21 | Hypothetical Ending Account Value 12/31/21 | Actual Expenses Paid During Period 7/1/21- 12/31/21* | Hypothetical Expenses Paid During Period 7/1/21- 12/31/21* | Annualized Expense Ratio During Period 7/1/21- 12/31/21 | ||||||||||||||||||||||
| USAA Core Short-Term Bond ETF | $ | 1,000.00 | $ | 1,000.40 | $ | 1,023.59 | $ | 1.61 | $ | 1.63 | 0.32 | % | |||||||||||||||
| USAA Core Intermediate- Term Bond ETF | 1,000.00 | 998.20 | 1,023.44 | 1.76 | 1.79 | 0.35 | % | ||||||||||||||||||||
* Expenses are equal to the average account value multiplied by the Fund's annualized expense ratio multiplied by 184/365 (the number of days in the most recent fiscal half-year divided by the number of days in the fiscal year).
58
Victory Portfolios II | Supplemental Information — continued December 31, 2021 | ||||||
(Unaudited)
Considerations of the Board in Continuing the Investment Advisory Agreement (the "Agreement")
The Board approved the Agreement on behalf of each of the Funds at a meeting, which was called for that purpose, on November 30, 2021. The Board also considered information relating to the Funds and the Agreement provided throughout the year and, more specifically, at the meetings on October 19, 2021, and November 30, 2021. In considering whether to approve the Agreement, the Board requested, and the Adviser provided, information that the Board believed to be reasonably necessary to reach its conclusions.
The Board, including the Independent Trustees, evaluated this information along with other information obtained throughout the year and was advised by legal counsel to the Funds and independent legal counsel to the Independent Trustees.
The Board noted that each Fund assumed the performance of its predecessor fund, that the Adviser became the investment adviser to each Fund on February 26, 2019, and that prior to that date each predecessor fund was managed by a different investment adviser.
The Board took into consideration regular reports from the Adviser throughout the COVID-19 pandemic public health crisis concerning how the ongoing pandemic has affected market volatility, investment risk, liquidity and valuation of portfolio securities, and the implementation and effectiveness of business continuity plans. These reports also had confirmed that the pandemic had no material impact on the Adviser's operations.
The Board considered each Fund's advisory fee, expense ratio and investment performance as significant factors in determining whether the Agreement should be continued. In considering whether the compensation paid to the Adviser was fair and reasonable, the Board also evaluated, among other things, the following factors:
• The requirements of the Funds for the services provided by the Adviser;
• The nature, quality and extent of the services provided and expected to be provided;
• The performance of the Funds as compared to comparable funds;
• The fees payable for the services and whether the fee arrangements provided for economies of scale that would benefit Fund shareholders as the Funds grow (acknowledging that economies of scale can be complex to assess and typically are not directly measurable);
• Whether the fee would be sufficient to enable the Adviser to attract and retain experienced personnel and continue to provide quality services to the Funds;
• Fees paid by other clients of the Adviser whose accounts are managed in a similar investment style and any differences in the services provided to the other clients compared to those provided to the Funds;
• Total expenses of each Fund;
• Management's commitment to operating the Funds at competitive expense levels;
• The profitability of the Adviser (as reflected by comparing fees earned against an estimate of the Adviser's costs) with respect to the Adviser's relationship with the Funds;
• The fact that the Funds are actively managed exchange-traded funds ("ETFs");
• Research and other service benefits received by the Adviser obtained through payment of client commissions for securities transactions;
• Other benefits received by the Adviser, and its affiliates, including revenues paid to the Adviser, or its affiliates, by the Funds for administration and fund accounting services, and distribution;
• The capabilities and financial condition of the Adviser;
• Current economic and industry trends; and
• The historical relationship between the Trust and the Adviser.
The Board reviewed each Fund's current management fee in the context of the Adviser's profitability with respect to each Fund. The Board retained a consultant to provide comparative information about fees and performance. The Board met with the consultant to review its inputs and methodologies, among other things. The Board compared each Fund's gross management fee and total expense ratio on a net and gross basis with
59
Victory Portfolios II | Supplemental Information — continued December 31, 2021 | ||||||
(Unaudited)
the median gross management fee and median expense ratio of a universe of comparable ETFs compiled by the consultant and a peer group of funds with similar investment strategies selected by that consultant from the universe. The Board reviewed the factors and methodology used by the consultant in the selection of each Fund's peer group, including the consultant's selection of a broad universe of funds, the more specific universe of comparable funds, and peer groups of funds with comparable investment strategies and asset levels, among other factors.
The Board noted that none of the advisory fee arrangements for the Funds included breakpoints, which would be a structure that results in reduced fees as a fund grows. The Board also considered the Adviser's commitment to limit expenses as discussed in more detail below.
The Board also reviewed the compliance and administrative services provided to the Funds by the Adviser and its affiliates, including the Adviser's oversight of the Funds' day-to-day operations and oversight of Fund accounting, assistance in meeting legal and regulatory requirements, and other services necessary for the operation of the Funds and the Trust.
The Board found that the gross annual management fee paid by each Fund was within the range of management fees paid by each Fund's respective peer group. The Board also found that each Fund's net annual expense ratio was reasonable as compared with each Fund's respective peer group. The Board considered the Adviser's contractual agreement with each Fund to waive its fees and reimburse expenses for a specified period of time, as described in the Fund's prospectus.
The Board reviewed each Fund's performance over the one-year period against the performance of the Fund's selected peer group and benchmark index. The Board recognized that the performance of the Funds and the peer group funds are net of expenses, while the performance of the benchmark index is gross returns.
The Board reviewed various other specific factors with respect to each Fund, as described below. In their deliberations, the Trustees did not rank the importance of any particular information or factor considered and each Trustee may have attributed different weights to various factors.
VictoryShares USAA Core Short-Term Bond ETF
Noting that the Fund commenced operations in 2017, the Board compared the Fund's one- and three-year performance for the periods ended June 30, 2021, to that of the median performance of the Fund's peer group and benchmark index for the same period and considered the fact that the Fund outperformed both the benchmark index and the peer group median for both of the periods reviewed.
Having considered, among other things: (1) the Fund's management fee compared to comparable ETFs; (2) the Fund's total expense ratio compared to comparable ETFs; (3) that the Adviser's willingness to limit the expenses for a period of time would provide stability to the Fund's expenses during that period; and (4) that the Fund's performance in relation to its benchmark index and peer group was within an acceptable range, the Board concluded that the Agreement continued to be in the best interests of the Fund's shareholders.
VictoryShares USAA Core Intermediate-Term Bond ETF
Noting that the Fund commenced operations in 2017, the Board compared the Fund's one- and three-year performance for the periods ended June 30, 2021, to that of the median performance of the Fund's peer group and benchmark index for the same period and considered the fact that the Fund outperformed both the benchmark index and the peer group median for both of the periods reviewed.
Having considered, among other things: (1) the Fund's management fee compared to comparable ETFs; (2) the Fund's total expense ratio compared to comparable ETFs; (3) that the Adviser's willingness to limit the expenses for a period of time would provide stability to the Fund's expenses during that period; and (4) that the Fund's performance in relation to its benchmark index and peer group was within an acceptable range, the Board concluded that the Agreement continued to be in the best interests of the Fund's shareholders.
Conclusion
Based on its review of the information requested and provided, and following extended discussions, the Board determined that the Agreement, on behalf of the Funds discussed above, was consistent with the best interests
60
Victory Portfolios II | Supplemental Information — continued December 31, 2021 | ||||||
(Unaudited)
of each Fund and its shareholders, and the Board unanimously approved the Agreement, on behalf of each Fund, for an additional annual period on the basis of the foregoing review and discussions and the following considerations, among others:
• The fairness and reasonableness of the investment advisory fee payable to the Adviser under the Agreement in light of the investment advisory services provided, the costs of these services, the profitability of the Adviser's relationship with the Fund and the comparability of the fee paid to the fees paid by other investment companies, to the extent applicable;
• The nature, quality and extent of the investment advisory services provided by the Adviser;
• The Adviser's entrepreneurial commitment to the management of the Funds and the creation of a broad-based family of funds, which could entail a substantial commitment of the Adviser's resources to the successful operation of the Funds;
• The Adviser's representations regarding its staffing and capabilities to manage the Funds, including the retention of personnel with relevant portfolio management experience;
• The Adviser's efforts to enhance investment results by, among other things, developing quality portfolio management teams; and
• The overall high quality of the personnel, operations, financial condition, investment management capabilities, methodologies and performance of the Adviser.
61
Privacy Policy
Protecting the Privacy of Information
The Trust respects your right to privacy. We also know that you expect us to conduct and process your business in an accurate and efficient manner. To do so, we must collect and maintain certain personal information about you. This is the information we collect from you on applications or other forms, and from the transactions you make with us or third parties. It may include your name, address, social security number, account transactions and balances, and information about investment goals and risk tolerance.
We do not disclose any information about you or about former customers to anyone except as permitted or required by law. Specifically, we may disclose the information we collect to companies that perform services on our behalf, such as the transfer agent that processes shareholder accounts and printers and mailers that assist us in the distribution of investor materials. We may also disclose this information to companies that perform marketing services on our behalf. This allows us to continue to offer you Victory investment products and services that meet your investing needs, and to effect transactions that you request or authorize. These companies will use this information only in connection with the services for which we hired them. They are not permitted to use or share this information for any other purpose.
To protect your personal information internally, we permit access only by authorized employees and maintain physical, electronic, and procedural safeguards to guard your personal information.*
* You may have received communications regarding information about privacy policies from other financial institutions which gave you the opportunity to "opt-out" of certain information sharing with companies which are not affiliated with that financial institution. The Trust does not share information with other companies for purposes of marketing solicitations for products other than the Trust. Therefore, the Trust does not provide opt-out options to their shareholders.
The Victory Funds
P.O. Box 182593
Columbus, Ohio 43218-2593

Visit our website at: | Call Victory at: | ||||||
www.vcm.com | 866-376-7890 | ||||||
VS-BOND-ETF-SAR (12/21)

December 31, 2021
Semi Annual Report
VictoryShares USAA MSCI USA Value Momentum ETF
VictoryShares USAA MSCI USA Small Cap Value Momentum ETF
VictoryShares USAA MSCI International Value Momentum ETF
VictoryShares USAA MSCI Emerging Markets Value Momentum ETF
www.vcm.com
News, Information And Education 24 Hours A Day, 7 Days A Week
The Victory Capital website gives fund shareholders, prospective shareholders, and investment professionals a convenient way to access fund information, get guidance, and track fund performance anywhere they can access the Internet. The site includes:
• Detailed performance records
• Daily share prices
• The latest fund news
• Investment resources to help you become a better investor
• A section dedicated to investment professionals
Whether you're a potential investor searching for the fund that matches your investment philosophy, a seasoned investor interested in planning tools, or an investment professional, www.vcm.com has what you seek. Visit us anytime. We're always open.
Victory Portfolios II
TABLE OF CONTENTS
| Investment Objective & Portfolio Holdings (Unaudited) | 2 | ||||||
Schedules of Portfolio Investments | |||||||
| VictoryShares USAA MSCI USA Value Momentum ETF | 6 | ||||||
| VictoryShares USAA MSCI USA Small Cap Value Momentum ETF | 12 | ||||||
| VictoryShares USAA MSCI International Value Momentum ETF | 25 | ||||||
| VictoryShares USAA MSCI Emerging Markets Value Momentum ETF | 38 | ||||||
Financial Statements | |||||||
Statements of Assets and Liabilities | 50 | ||||||
Statements of Operations | 52 | ||||||
Statements of Changes in Net Assets | 54 | ||||||
Financial Highlights | 56 | ||||||
Notes to Financial Statements | 60 | ||||||
Supplemental Information (Unaudited) | 71 | ||||||
Proxy Voting and Portfolio Holdings Information | 71 | ||||||
Expense Examples | 71 | ||||||
Advisory Contract Approval | 73 |
| |||||
Privacy Policy (inside back cover) | |||||||
1
| Victory Portfolios II VictoryShares USAA MSCI USA Value Momentum ETF | December 31, 2021 | ||||||
(Unaudited)
Investment Objective and Portfolio Holdings:
The Fund seeks to provide investment results that closely correspond, before fees and expenses, to the performance of the MSCI USA Select Value Momentum Blend Index.
Top 10 Holdings*:
December 31, 2021
(% of Net Assets)
The J.M. Smucker Co. | 1.1 | % | |||||
Public Storage | 1.1 | % | |||||
Oracle Corp. | 1.0 | % | |||||
Juniper Networks, Inc. | 1.0 | % | |||||
Extra Space Storage, Inc. | 0.9 | % | |||||
AbbVie, Inc. | 0.9 | % | |||||
Archer-Daniels-Midland Co. | 0.9 | % | |||||
Bristol-Myers Squibb Co. | 0.9 | % | |||||
Alphabet, Inc., Class A | 0.9 | % | |||||
The Kroger Co. | 0.9 | % | |||||
Sector Allocation*:
December 31, 2021
(% of Net Assets)

* Does not include futures contracts, money market instruments, and short-term investments purchased with cash collateral from securities loaned.
Percentages are of the net assets of the Fund and may not equal 100%.
Refer to the Schedule of Portfolio Investments for a complete list of securities.
2
| Victory Portfolios II VictoryShares USAA MSCI USA Small Cap Value Momentum ETF | December 31, 2021 | ||||||
(Unaudited)
Investment Objective and Portfolio Holdings:
The Fund seeks to provide investment results that closely correspond, before fees and expenses, to the performance of the MSCI USA Small Cap Select Value Momentum Blend Index.
Top 10 Holdings*:
December 31, 2021
(% of Net Assets)
National Fuel Gas Co. | 0.5 | % | |||||
Weis Markets, Inc. | 0.5 | % | |||||
Otter Tail Corp. | 0.5 | % | |||||
Encore Wire Corp. | 0.5 | % | |||||
Universal Corp. | 0.5 | % | |||||
STAG Industrial, Inc. | 0.5 | % | |||||
Life Storage, Inc. | 0.4 | % | |||||
Ingles Markets, Inc., Class A | 0.4 | % | |||||
Amphastar Pharmaceuticals, Inc. | 0.4 | % | |||||
National Storage Affiliates Trust | 0.4 | % | |||||
Sector Allocation*:
December 31, 2021
(% of Net Assets)

* Does not include futures contracts, money market instruments, and short-term investments purchased with cash collateral from securities loaned.
Percentages are of the net assets of the Fund and may not equal 100%.
Refer to the Schedule of Portfolio Investments for a complete list of securities.
3
| Victory Portfolios II VictoryShares USAA MSCI International Value Momentum ETF | December 31, 2021 | ||||||
(Unaudited)
Investment Objective and Portfolio Holdings:
The Fund seeks to provide investment results that closely correspond, before fees and expenses, to the performance of the MSCI World ex USA Select Value Momentum Blend Index.
Top 10 Holdings*:
December 31, 2021
(% of Net Assets)
Loblaw Cos. Ltd. | 1.1 | % | |||||
George Weston Ltd. | 1.0 | % | |||||
Segro PLC | 0.9 | % | |||||
Bank Leumi Le-Israel BM | 0.9 | % | |||||
Tesco PLC | 0.9 | % | |||||
Hermes International | 0.9 | % | |||||
Koninklijke Ahold Delhaize NV | 0.8 | % | |||||
Novo Nordisk A/S, Class B | 0.8 | % | |||||
Merck KGaA | 0.8 | % | |||||
Sofina SA | 0.7 | % | |||||
Sector Allocation*:
December 31, 2021
(% of Net Assets)

* Does not include futures contracts, money market instruments, and short-term investments purchased with cash collateral from securities loaned.
Percentages are of the net assets of the Fund and may not equal 100%.
Refer to the Schedule of Portfolio Investments for a complete list of securities.
4
| Victory Portfolios II VictoryShares USAA MSCI Emerging Markets Value Momentum ETF | December 31, 2021 | ||||||
(Unaudited)
Investment Objective and Portfolio Holdings:
The Fund seeks to provide investment results that closely correspond, before fees and expenses, to the performance of the MSCI Emerging Markets Select Value Momentum Blend Index.
Top 10 Holdings*:
December 31, 2021
(% of Net Assets)
China Power International Development Ltd. | 1.0 | % | |||||
Synnex Technology International Corp. | 1.0 | % | |||||
WPG Holdings Ltd. | 1.0 | % | |||||
Taishin Financial Holding Co. Ltd. | 1.0 | % | |||||
Compal Electronics, Inc. | 0.9 | % | |||||
Bank of China Ltd., Class H | 0.9 | % | |||||
China Development Financial Holding Corp. | 0.9 | % | |||||
Arca Continental SAB de CV | 0.9 | % | |||||
KT&G Corp. | 0.9 | % | |||||
Grupo Bimbo SAB de CV, Class A | 0.8 | % | |||||
Sector Allocation*:
December 31, 2021
(% of Net Assets)

* Does not include futures contracts, money market instruments, and short-term investments purchased with cash collateral from securities loaned.
Percentages are of the net assets of the Fund and may not equal 100%.
Refer to the Schedule of Portfolio Investments for a complete list of securities.
5
| Victory Portfolios II VictoryShares USAA MSCI USA Value Momentum ETF | Schedule of Portfolio Investments December 31, 2021 | ||||||
(Unaudited)
Security Description | Shares | Value | |||||||||
Common Stocks (99.7%) | |||||||||||
Communication Services (5.1%): | |||||||||||
Alphabet, Inc., Class A (a) | 1,177 | $ | 3,409,816 | ||||||||
AMC Entertainment Holdings, Inc. (a) (b) | 13,974 | 380,093 | |||||||||
AT&T, Inc. | 60,436 | 1,486,726 | |||||||||
Discovery, Inc., Class A (a) (b) | 64,310 | 1,513,857 | |||||||||
DISH Network Corp., Class A (a) (b) | 50,117 | 1,625,795 | |||||||||
Liberty Global PLC, Class C (a) | 90,634 | 2,545,909 | |||||||||
Lumen Technologies, Inc. (b) | 187,747 | 2,356,225 | |||||||||
News Corp., Class A | 105,735 | 2,358,948 | |||||||||
The Interpublic Group of Cos., Inc. | 60,671 | 2,272,129 | |||||||||
ViacomCBS, Inc., Class B | 40,676 | 1,227,602 | |||||||||
19,177,100 | |||||||||||
Consumer Discretionary (9.4%): | |||||||||||
Advance Auto Parts, Inc. | 4,950 | 1,187,406 | |||||||||
AutoZone, Inc. (a) | 738 | 1,547,136 | |||||||||
Bath & Body Works, Inc. | 17,486 | 1,220,348 | |||||||||
BorgWarner, Inc. | 45,583 | 2,054,426 | |||||||||
D.R. Horton, Inc. | 21,477 | 2,329,181 | |||||||||
DoorDash, Inc., Class A (a) | 4,356 | 648,608 | |||||||||
eBay, Inc. | 16,999 | 1,130,433 | |||||||||
Ford Motor Co. | 120,481 | 2,502,390 | |||||||||
Garmin Ltd. | 9,128 | 1,242,960 | |||||||||
General Motors Co. (a) | 33,916 | 1,988,495 | |||||||||
Genuine Parts Co. | 9,938 | 1,393,308 | |||||||||
Lear Corp. | 11,423 | 2,089,838 | |||||||||
Lennar Corp., Class A | 17,095 | 1,985,755 | |||||||||
LKQ Corp. | 32,919 | 1,976,128 | |||||||||
Mohawk Industries, Inc. (a) | 7,971 | 1,452,157 | |||||||||
Newell Brands, Inc. | 84,623 | 1,848,166 | |||||||||
PulteGroup, Inc. | 32,663 | 1,867,017 | |||||||||
Target Corp. (c) | 10,726 | 2,482,425 | |||||||||
Tesla, Inc. (a) | 602 | 636,182 | |||||||||
Tractor Supply Co. | 6,242 | 1,489,341 | |||||||||
Whirlpool Corp. | 9,290 | 2,179,991 | |||||||||
35,251,691 | |||||||||||
Consumer Staples (8.2%): | |||||||||||
Archer-Daniels-Midland Co. | 51,249 | 3,463,920 | |||||||||
Bunge Ltd. | 32,082 | 2,995,176 | |||||||||
Costco Wholesale Corp. | 3,895 | 2,211,191 | |||||||||
Keurig Dr Pepper, Inc. | 57,030 | 2,102,126 | |||||||||
Molson Coors Beverage Co., Class B | 54,078 | 2,506,515 | |||||||||
The Estee Lauder Cos., Inc. | 4,123 | 1,526,335 | |||||||||
The J.M. Smucker Co. | 30,020 | 4,077,316 | |||||||||
The Kraft Heinz Co. | 73,108 | 2,624,577 | |||||||||
The Kroger Co. | 73,940 | 3,346,524 | |||||||||
Tyson Foods, Inc., Class A | 35,317 | 3,078,230 | |||||||||
Walgreens Boots Alliance, Inc. | 52,395 | 2,732,923 | |||||||||
30,664,833 | |||||||||||
See notes to financial statements.
6
| Victory Portfolios II VictoryShares USAA MSCI USA Value Momentum ETF | Schedule of Portfolio Investments — continued December 31, 2021 | ||||||
(Unaudited)
Security Description | Shares | Value | |||||||||
Energy (3.0%): | |||||||||||
ConocoPhillips | 32,284 | $ | 2,330,259 | ||||||||
Devon Energy Corp. | 39,737 | 1,750,415 | |||||||||
Diamondback Energy, Inc. | 5,952 | 641,923 | |||||||||
EOG Resources, Inc. | 22,388 | 1,988,726 | |||||||||
Exxon Mobil Corp. | 42,899 | 2,624,990 | |||||||||
Pioneer Natural Resources Co. | 11,519 | 2,095,076 | |||||||||
11,431,389 | |||||||||||
Financials (12.1%): | |||||||||||
AGNC Investment Corp. | 136,035 | 2,045,966 | |||||||||
Ally Financial, Inc. | 31,379 | 1,493,954 | |||||||||
American Financial Group, Inc. | 6,663 | 914,963 | |||||||||
American International Group, Inc. | 32,163 | 1,828,788 | |||||||||
Athene Holding Ltd., Class A (a) | 19,189 | 1,599,019 | |||||||||
Bank of America Corp. | 25,787 | 1,147,264 | |||||||||
Blackstone, Inc. | 18,013 | 2,330,702 | |||||||||
Capital One Financial Corp. | 10,463 | 1,518,077 | |||||||||
Citigroup, Inc. | 29,149 | 1,760,308 | |||||||||
Citizens Financial Group, Inc. | 41,116 | 1,942,731 | |||||||||
Equitable Holdings, Inc. | 56,572 | 1,854,996 | |||||||||
Fifth Third Bancorp | 22,672 | 987,366 | |||||||||
Franklin Resources, Inc. | 34,691 | 1,161,801 | |||||||||
Invesco Ltd. | 76,892 | 1,770,054 | |||||||||
KKR & Co., Inc. | 32,031 | 2,386,309 | |||||||||
Lincoln National Corp. | 18,251 | 1,245,813 | |||||||||
Loews Corp. | 47,575 | 2,747,932 | |||||||||
MetLife, Inc. | 34,165 | 2,134,971 | |||||||||
Morgan Stanley | 23,917 | 2,347,693 | |||||||||
Prudential Financial, Inc. | 18,940 | 2,050,066 | |||||||||
Raymond James Financial, Inc. | 13,596 | 1,365,038 | |||||||||
Regions Financial Corp. | 84,081 | 1,832,966 | |||||||||
Signature Bank | 3,033 | 981,084 | |||||||||
Synchrony Financial | 15,898 | 737,508 | |||||||||
The Goldman Sachs Group, Inc. | 6,005 | 2,297,213 | |||||||||
Upstart Holdings, Inc. (a) | 5,202 | 787,063 | |||||||||
Wells Fargo & Co. | 42,720 | 2,049,706 | |||||||||
45,319,351 | |||||||||||
Health Care (15.4%): | |||||||||||
AbbVie, Inc. | 25,964 | 3,515,526 | |||||||||
Anthem, Inc. | 5,489 | 2,544,371 | |||||||||
Bio-Rad Laboratories, Inc., Class A (a) | 1,772 | 1,338,870 | |||||||||
Bio-Techne Corp. | 2,768 | 1,431,997 | |||||||||
Bristol-Myers Squibb Co. | 54,902 | 3,423,140 | |||||||||
Cardinal Health, Inc. | 24,813 | 1,277,621 | |||||||||
Centene Corp. (a) | 29,518 | 2,432,283 | |||||||||
Charles River Laboratories International, Inc. (a) | 5,840 | 2,200,395 | |||||||||
Cigna Corp. | 10,948 | 2,513,989 | |||||||||
CVS Health Corp. | 29,996 | 3,094,387 | |||||||||
Danaher Corp. | 5,232 | 1,721,380 | |||||||||
See notes to financial statements.
7
| Victory Portfolios II VictoryShares USAA MSCI USA Value Momentum ETF | Schedule of Portfolio Investments — continued December 31, 2021 | ||||||
(Unaudited)
Security Description | Shares | Value | |||||||||
Eli Lilly & Co. | 5,651 | $ | 1,560,919 | ||||||||
HCA Healthcare, Inc. | 8,316 | 2,136,547 | |||||||||
Horizon Therapeutics PLC (a) | 18,295 | 1,971,469 | |||||||||
Jazz Pharmaceuticals PLC (a) | 19,498 | 2,484,045 | |||||||||
Laboratory Corp. of America Holdings (a) | 7,857 | 2,468,748 | |||||||||
McKesson Corp. | 12,218 | 3,037,028 | |||||||||
Merck & Co., Inc. | 23,062 | 1,767,472 | |||||||||
Moderna, Inc. (a) | 8,120 | 2,062,318 | |||||||||
Molina Healthcare, Inc. (a) | 6,637 | 2,111,097 | |||||||||
Novavax, Inc. (a) (b) | 2,956 | 422,915 | |||||||||
PerkinElmer, Inc. | 7,612 | 1,530,469 | |||||||||
Pfizer, Inc. | 35,306 | 2,084,819 | |||||||||
Quest Diagnostics, Inc. | 9,061 | 1,567,644 | |||||||||
Universal Health Services, Inc., Class B | 15,939 | 2,066,651 | |||||||||
Viatris, Inc. | 151,460 | 2,049,254 | |||||||||
Waters Corp. (a) | 3,527 | 1,314,160 | |||||||||
West Pharmaceutical Services, Inc. | 3,244 | 1,521,469 | |||||||||
57,650,983 | |||||||||||
Industrials (14.2%): | |||||||||||
AMERCO, Inc. | 3,873 | 2,812,689 | |||||||||
Carrier Global Corp. | 43,781 | 2,374,682 | |||||||||
Deere & Co. | 3,313 | 1,135,995 | |||||||||
Eaton Corp. PLC | 15,998 | 2,764,774 | |||||||||
Expeditors International of Washington, Inc. | 13,555 | 1,820,301 | |||||||||
FedEx Corp. | 4,073 | 1,053,441 | |||||||||
Generac Holdings, Inc. (a) | 5,171 | 1,819,778 | |||||||||
General Dynamics Corp. | 14,492 | 3,021,147 | |||||||||
General Electric Co. | 8,807 | 831,997 | |||||||||
Huntington Ingalls Industries, Inc. | 6,660 | 1,243,688 | |||||||||
Ingersoll Rand, Inc. (c) | 21,045 | 1,302,054 | |||||||||
Jacobs Engineering Group, Inc. | 18,909 | 2,632,700 | |||||||||
Johnson Controls International PLC | 35,857 | 2,915,533 | |||||||||
Knight-Swift Transportation Holdings, Inc. | 47,344 | 2,885,143 | |||||||||
L3Harris Technologies, Inc. | 12,716 | 2,711,560 | |||||||||
Old Dominion Freight Line, Inc. | 4,439 | 1,590,849 | |||||||||
Owens Corning, Inc. | 21,424 | 1,938,872 | |||||||||
Parker-Hannifin Corp. | 3,626 | 1,153,503 | |||||||||
Raytheon Technologies Corp. | 26,236 | 2,257,870 | |||||||||
Republic Services, Inc. (c) | 14,233 | 1,984,792 | |||||||||
Robert Half International, Inc. | 22,342 | 2,491,580 | |||||||||
Sensata Technologies Holding PLC (a) | 18,692 | 1,153,110 | |||||||||
Snap-on, Inc. | 11,270 | 2,427,333 | |||||||||
Textron, Inc. | 27,424 | 2,117,133 | |||||||||
Trane Technologies PLC | 6,513 | 1,315,821 | |||||||||
United Rentals, Inc. (a) | 4,949 | 1,644,503 | |||||||||
Westinghouse Air Brake Technologies Corp. | 21,903 | 2,017,485 | |||||||||
53,418,333 | |||||||||||
See notes to financial statements.
8
| Victory Portfolios II VictoryShares USAA MSCI USA Value Momentum ETF | Schedule of Portfolio Investments — continued December 31, 2021 | ||||||
(Unaudited)
Security Description | Shares | Value | |||||||||
Information Technology (16.3%): | |||||||||||
Affirm Holdings, Inc. (a) | 8,460 | $ | 850,738 | ||||||||
Applied Materials, Inc. | 13,865 | 2,181,796 | |||||||||
Arrow Electronics, Inc. (a) | 21,376 | 2,870,156 | |||||||||
Asana, Inc., Class A (a) | 8,593 | 640,608 | |||||||||
Bill.com Holdings, Inc. (a) | 3,749 | 934,063 | |||||||||
Broadcom, Inc. | 2,734 | 1,819,231 | |||||||||
Cisco Systems, Inc. | 32,292 | 2,046,344 | |||||||||
Cloudflare, Inc., Class A (a) | 14,620 | 1,922,530 | |||||||||
Dell Technologies, Inc., Class C (a) | 32,920 | 1,849,116 | |||||||||
EPAM Systems, Inc. (a) | 4,201 | 2,808,158 | |||||||||
F5, Inc. (a) | 12,822 | 3,137,672 | |||||||||
Fortinet, Inc. (a) | 6,767 | 2,432,060 | |||||||||
Gartner, Inc. (a) | 6,648 | 2,222,559 | |||||||||
Hewlett Packard Enterprise Co. | 164,739 | 2,597,934 | |||||||||
HP, Inc. | 74,757 | 2,816,096 | |||||||||
Intel Corp. | 51,243 | 2,639,015 | |||||||||
International Business Machines Corp. | 10,647 | 1,423,078 | |||||||||
Intuit, Inc. | 2,440 | 1,569,457 | |||||||||
Juniper Networks, Inc. | 100,549 | 3,590,605 | |||||||||
Micron Technology, Inc. | 27,290 | 2,542,064 | |||||||||
NetApp, Inc. | 27,623 | 2,541,040 | |||||||||
NXP Semiconductors NV | 5,355 | 1,219,762 | |||||||||
ON Semiconductor Corp. (a) | 14,208 | 965,007 | |||||||||
Oracle Corp. | 41,307 | 3,602,384 | |||||||||
Qorvo, Inc. (a) | 13,890 | 2,172,257 | |||||||||
Seagate Technology Holdings PLC | 26,483 | 2,992,049 | |||||||||
TE Connectivity Ltd. | 8,169 | 1,317,986 | |||||||||
VMware, Inc., Class A | 5,122 | 593,537 | |||||||||
Western Digital Corp. (a) | 28,218 | 1,840,096 | |||||||||
Zebra Technologies Corp. (a) | 1,928 | 1,147,546 | |||||||||
61,284,944 | |||||||||||
Materials (4.6%): | |||||||||||
Albemarle Corp. | 3,454 | 807,442 | |||||||||
CF Industries Holdings, Inc. | 14,876 | 1,052,923 | |||||||||
Corteva, Inc. | 51,998 | 2,458,465 | |||||||||
Freeport-McMoRan, Inc. | 44,480 | 1,856,150 | |||||||||
International Paper Co. | 21,293 | 1,000,345 | |||||||||
LyondellBasell Industries NV, Class A | 19,911 | 1,836,392 | |||||||||
Nucor Corp. | 20,236 | 2,309,939 | |||||||||
Steel Dynamics, Inc. | 32,681 | 2,028,510 | |||||||||
The Mosaic Co. | 50,055 | 1,966,661 | |||||||||
Westrock Co. | 41,393 | 1,836,194 | |||||||||
17,153,021 | |||||||||||
Real Estate (6.6%): | |||||||||||
AvalonBay Communities, Inc. | 4,890 | 1,235,165 | |||||||||
Camden Property Trust | 16,792 | 3,000,394 | |||||||||
CBRE Group, Inc., Class A (a) | 22,007 | 2,387,980 | |||||||||
Equity Residential | 14,390 | 1,302,295 | |||||||||
See notes to financial statements.
9
| Victory Portfolios II VictoryShares USAA MSCI USA Value Momentum ETF | Schedule of Portfolio Investments — continued December 31, 2021 | ||||||
(Unaudited)
Security Description | Shares | Value | |||||||||
Extra Space Storage, Inc. | 15,519 | $ | 3,518,623 | ||||||||
Iron Mountain, Inc. | 54,494 | 2,851,671 | |||||||||
Mid-America Apartment Communities, Inc. | 12,671 | 2,907,234 | |||||||||
Public Storage | 10,555 | 3,953,481 | |||||||||
Regency Centers Corp. | 12,382 | 932,984 | |||||||||
Simon Property Group, Inc. | 9,084 | 1,451,351 | |||||||||
UDR, Inc. | 20,945 | 1,256,490 | |||||||||
24,797,668 | |||||||||||
Utilities (4.8%): | |||||||||||
CenterPoint Energy, Inc. | 38,416 | 1,072,191 | |||||||||
Duke Energy Corp. (c) | 14,564 | 1,527,764 | |||||||||
Edison International | 20,458 | 1,396,259 | |||||||||
Evergy, Inc. (c) | 19,782 | 1,357,243 | |||||||||
Exelon Corp. | 57,085 | 3,297,230 | |||||||||
FirstEnergy Corp. | 32,855 | 1,366,439 | |||||||||
NRG Energy, Inc. | 60,803 | 2,619,393 | |||||||||
PG&E Corp. (a) | 105,839 | 1,284,885 | |||||||||
UGI Corp. | 61,298 | 2,814,191 | |||||||||
Vistra Corp. | 58,382 | 1,329,358 | |||||||||
18,064,953 | |||||||||||
Total Common Stocks (Cost $313,473,773) | 374,214,266 | ||||||||||
Collateral for Securities Loaned^ (0.7%) | |||||||||||
BlackRock Liquidity Funds TempFund, Institutional Shares, 0.04% (d) | 60,722 | 60,722 | |||||||||
| Fidelity Investments Money Market Government Portfolio, Institutional Shares, 0.01% (d) | 1,192,583 | 1,192,583 | |||||||||
| Goldman Sachs Financial Square Prime Obligations Fund, Institutional Shares, 0.02% (d) | 30,303 | 30,303 | |||||||||
JPMorgan Prime Money Market Fund, Capital Shares, 0.07% (d) | �� | 241,628 | 241,628 | ||||||||
| Morgan Stanley Institutional Liquidity Prime Portfolio, Institutional Shares, 0.06% (d) | 1,086,406 | 1,086,406 | |||||||||
Total Collateral for Securities Loaned (Cost $2,611,642) | 2,611,642 | ||||||||||
Total Investments (Cost $316,085,415) — 100.4% | 376,825,908 | ||||||||||
Liabilities in excess of other assets — (0.4)% | (1,377,671 | ) | |||||||||
NET ASSETS — 100.00% | $ | 375,448,237 | |||||||||
^ Purchased with cash collateral from securities on loan.
(a) Non-income producing security.
(b) All or a portion of this security is on loan.
(c) All or a portion of this security has been segregated as collateral for derivative instruments.
(d) Rate disclosed is the daily yield on December 31, 2021.
PLC — Public Limited Company
See notes to financial statements.
10
| Victory Portfolios II VictoryShares USAA MSCI USA Value Momentum ETF | Schedule of Portfolio Investments — continued December 31, 2021 | ||||||
(Unaudited)
Futures Contracts Purchased
| Number of Contracts | Expiration Date | Notional Amount | Value | Unrealized Appreciation (Depreciation) | |||||||||||||||||||
E-Mini S&P 500 Futures | 4 | 3/18/22 | $ | 937,929 | $ | 951,700 | $ | 13,771 | |||||||||||||||
Total unrealized appreciation | $ | 13,771 | |||||||||||||||||||||
Total unrealized depreciation | — | ||||||||||||||||||||||
Total net unrealized appreciation (depreciation) | $ | 13,771 | |||||||||||||||||||||
See notes to financial statements.
11
| Victory Portfolios II VictoryShares USAA MSCI USA Small Cap Value Momentum ETF | Schedule of Portfolio Investments December 31, 2021 | ||||||
(Unaudited)
Security Description | Shares | Value | |||||||||
Common Stocks (99.7%) | |||||||||||
Communication Services (3.4%): | |||||||||||
AMC Networks, Inc., Class A (a) | 14,190 | $ | 488,704 | ||||||||
Cars.com, Inc. (a) | 19,133 | 307,850 | |||||||||
Consolidated Communications Holdings, Inc. (a) | 28,072 | 209,979 | |||||||||
Entercom Communications Corp. (a) | 150,656 | 387,186 | |||||||||
Gannett Co., Inc. (a) | 41,684 | 222,176 | |||||||||
Globalstar, Inc. (a) | 318,985 | 370,023 | |||||||||
Gray Television, Inc. | 29,231 | 589,297 | |||||||||
IDT Corp., Class B (a) | 4,026 | 177,788 | |||||||||
iHeartMedia, Inc., Class A (a) | 27,432 | 577,169 | |||||||||
John Wiley & Sons, Inc., Class A | 8,346 | 477,975 | |||||||||
Liberty Latin America Ltd., Class C (a) | 25,758 | 293,641 | |||||||||
Lions Gate Entertainment Corp., Class A (a) | 39,752 | 661,473 | |||||||||
Loyalty Ventures, Inc. (a) | 1,090 | 32,776 | |||||||||
Magnite, Inc. (a) | 8,740 | 152,950 | |||||||||
Nexstar Media Group, Inc., Class A | 2,348 | 354,501 | |||||||||
Scholastic Corp. | 22,483 | 898,421 | |||||||||
TechTarget, Inc. (a) | 3,315 | 317,113 | |||||||||
TEGNA, Inc. | 41,701 | 773,970 | |||||||||
Telephone & Data Systems, Inc. | 44,801 | 902,740 | |||||||||
The EW Scripps Co., Class A (a) | 27,263 | 527,539 | |||||||||
United States Cellular Corp. (a) | 27,850 | 877,832 | |||||||||
WideOpenWest, Inc. (a) | 13,660 | 293,963 | |||||||||
9,895,066 | |||||||||||
Consumer Discretionary (11.6%): | |||||||||||
Abercrombie & Fitch Co. (a) | 12,086 | 420,955 | |||||||||
Academy Sports & Outdoors, Inc. (a) | 5,911 | 259,493 | |||||||||
Adtalem Global Education, Inc. (a) | 14,990 | 443,104 | |||||||||
American Axle & Manufacturing Holdings, Inc. (a) | 22,965 | 214,263 | |||||||||
American Eagle Outfitters, Inc. (b) | 8,998 | 227,829 | |||||||||
Asbury Automotive Group, Inc. (a) | 1,943 | 335,614 | |||||||||
AutoNation, Inc. (a) | 6,206 | 725,171 | |||||||||
Big Lots, Inc. | 4,832 | 217,682 | |||||||||
Boot Barn Holdings, Inc. (a) | 5,007 | 616,111 | |||||||||
Caleres, Inc. | 16,680 | 378,302 | |||||||||
Capri Holdings Ltd. (a) | 8,142 | 528,497 | |||||||||
Carriage Services, Inc. | 8,036 | 517,840 | |||||||||
Century Communities, Inc. | 6,512 | 532,616 | |||||||||
Citi Trends, Inc. (a) | 6,310 | 597,873 | |||||||||
Clarus Corp. | 15,754 | 436,701 | |||||||||
Crocs, Inc. (a) | 3,035 | 389,148 | |||||||||
Dana, Inc. | 22,485 | 513,108 | |||||||||
Dick's Sporting Goods, Inc. (b) | 4,871 | 560,116 | |||||||||
Dillard's, Inc., Class A | 1,966 | 481,709 | |||||||||
Ethan Allen Interiors, Inc. | 34,025 | 894,517 | |||||||||
Foot Locker, Inc. | 12,183 | 531,544 | |||||||||
Funko, Inc., Class A (a) | 26,305 | 494,534 | |||||||||
See notes to financial statements.
12
| Victory Portfolios II VictoryShares USAA MSCI USA Small Cap Value Momentum ETF | Schedule of Portfolio Investments — continued December 31, 2021 | ||||||
(Unaudited)
Security Description | Shares | Value | |||||||||
GameStop Corp., Class A (a) (b) | 2,441 | $ | 362,220 | ||||||||
Genesco, Inc. (a) | 6,550 | 420,314 | |||||||||
G-III Apparel Group Ltd. (a) | 13,933 | 385,108 | |||||||||
Golden Entertainment, Inc. (a) | 9,141 | 461,895 | |||||||||
Graham Holdings Co., Class B | 1,775 | 1,117,948 | |||||||||
Green Brick Partners, Inc. (a) | 25,964 | 787,488 | |||||||||
Group 1 Automotive, Inc. | 3,080 | 601,278 | |||||||||
GrowGeneration Corp. (a) (c) | 9,658 | 126,037 | |||||||||
H&R Block, Inc. | 16,410 | 386,620 | |||||||||
Haverty Furniture Cos., Inc. (b) | 9,894 | 302,460 | |||||||||
Hibbett, Inc. | 5,731 | 412,231 | |||||||||
Houghton Mifflin Harcourt Co. (a) | 13,621 | 219,298 | |||||||||
Hovnanian Enterprises, Inc., Class A (a) | 4,540 | 577,897 | |||||||||
KB Home | 12,849 | 574,736 | |||||||||
Kohl's Corp. (c) | 7,521 | 371,462 | |||||||||
Laureate Education, Inc., Class A | 36,822 | 450,701 | |||||||||
M/I Homes, Inc. (a) | 8,343 | 518,768 | |||||||||
Macy's, Inc. | 18,772 | 491,451 | |||||||||
MarineMax, Inc. (a) (b) | 10,328 | 609,765 | |||||||||
MDC Holdings, Inc. | 13,131 | 733,104 | |||||||||
Meritage Homes Corp. (a) | 5,161 | 629,952 | |||||||||
Modine Manufacturing Co. (a) | 36,180 | 365,056 | |||||||||
Movado Group, Inc. | 16,291 | 681,453 | |||||||||
Penske Automotive Group, Inc. | 6,939 | 744,000 | |||||||||
Perdoceo Education Corp. (a) | 75,789 | 891,279 | |||||||||
PVH Corp. | 2,330 | 248,495 | |||||||||
Qurate Retail, Inc., Class A | 61,094 | 464,314 | |||||||||
Rent-A-Center, Inc. | 12,637 | 607,081 | |||||||||
Revolve Group, Inc. (a) | 8,273 | 463,619 | |||||||||
Service Corp. International | 8,043 | 570,973 | |||||||||
Shoe Carnival, Inc. | 6,511 | 254,450 | |||||||||
Shutterstock, Inc. | 7,277 | 806,874 | |||||||||
Signet Jewelers Ltd. | 5,201 | 452,643 | |||||||||
Skyline Champion Corp. (a) | 3,751 | 296,254 | |||||||||
Smith & Wesson Brands, Inc. | 26,065 | 463,957 | |||||||||
Sportsman's Warehouse Holdings, Inc. (a) | 17,598 | 207,656 | |||||||||
Tapestry, Inc. | 7,108 | 288,585 | |||||||||
Taylor Morrison Home Corp. (a) | 16,466 | 575,651 | |||||||||
Tenneco, Inc., Class A (a) | 31,461 | 355,509 | |||||||||
The Buckle, Inc. (b) | 8,128 | 343,896 | |||||||||
The Container Store Group, Inc. (a) | 16,877 | 168,432 | |||||||||
The Goodyear Tire & Rubber Co. (a) | 32,559 | 694,158 | |||||||||
The ODP Corp. (a) | 12,690 | 498,463 | |||||||||
Toll Brothers, Inc. | 10,050 | 727,520 | |||||||||
TravelCenters of America, Inc. (a) | 3,883 | 200,440 | |||||||||
Tri Pointe Homes, Inc. (a) | 24,156 | 673,711 | |||||||||
Vista Outdoor, Inc. (a) | 11,049 | 509,027 | |||||||||
XPEL, Inc. (a) | 3,913 | 267,180 | |||||||||
Zumiez, Inc. (a) | 12,580 | 603,714 | |||||||||
34,281,850 | |||||||||||
See notes to financial statements.
13
| Victory Portfolios II VictoryShares USAA MSCI USA Small Cap Value Momentum ETF | Schedule of Portfolio Investments — continued December 31, 2021 | ||||||
(Unaudited)
Security Description | Shares | Value | |||||||||
Consumer Staples (4.8%): | |||||||||||
Celsius Holdings, Inc. (a) | 6,273 | $ | 467,778 | ||||||||
Central Garden & Pet Co., Class A (a) | 9,880 | 472,758 | |||||||||
Coca-Cola Consolidated, Inc. | 1,718 | 1,063,768 | |||||||||
Coty, Inc., Class A (a) (c) | 20,513 | 215,386 | |||||||||
Darling Ingredients, Inc. (a) | 10,616 | 735,583 | |||||||||
Edgewell Personal Care Co. | 8,825 | 403,391 | |||||||||
Fresh Del Monte Produce, Inc. | 24,298 | 670,625 | |||||||||
Hostess Brands, Inc. (a) | 40,857 | 834,300 | |||||||||
Ingles Markets, Inc., Class A | 14,427 | 1,245,627 | |||||||||
Pilgrim's Pride Corp. (a) | 35,470 | 1,000,254 | |||||||||
Sanderson Farms, Inc. | 5,148 | 983,680 | |||||||||
Seaboard Corp. | 283 | 1,113,608 | |||||||||
SpartanNash Co. | 28,129 | 724,603 | |||||||||
The Andersons, Inc. | 20,926 | 810,045 | |||||||||
United Natural Foods, Inc. (a) | 10,851 | 532,567 | |||||||||
Universal Corp. | 24,625 | 1,352,405 | |||||||||
Weis Markets, Inc. (b) (c) | 22,261 | 1,466,555 | |||||||||
14,092,933 | |||||||||||
Energy (3.5%): | |||||||||||
Antero Resources Corp. (a) | 30,224 | 528,920 | |||||||||
Arch Resources, Inc. | 3,783 | 345,464 | |||||||||
Berry Corp. | 24,522 | 206,475 | |||||||||
Callon Petroleum Co. (a) (b) | 12,002 | 567,094 | |||||||||
Centennial Resource Development, Inc., Class A (a) | 83,046 | 496,615 | |||||||||
Civitas Resources, Inc. | 12,527 | 613,447 | |||||||||
CNX Resources Corp. (a) | 24,718 | 339,873 | |||||||||
CONSOL Energy, Inc. (a) | 9,345 | 212,225 | |||||||||
Dorian LPG Ltd. | 61,219 | 776,869 | |||||||||
EQT Corp. (a) | 14,981 | 326,736 | |||||||||
Gevo, Inc. (a) (b) | 42,821 | 183,274 | |||||||||
Helix Energy Solutions Group, Inc. (a) | 125,227 | 390,708 | |||||||||
International Seaways, Inc. | 39,836 | 584,792 | |||||||||
Laredo Petroleum, Inc. (a) (b) | 3,354 | 201,676 | |||||||||
Magnolia Oil & Gas Corp., Class A | 14,389 | 271,520 | |||||||||
Marathon Oil Corp. | 44,587 | 732,119 | |||||||||
Matador Resources Co. | 8,274 | 305,476 | |||||||||
Meta Materials, Inc. (a) (b) | 51,259 | 126,097 | |||||||||
Northern Oil and Gas, Inc. | 11,278 | 232,101 | |||||||||
Ovintiv, Inc. | 17,784 | 599,321 | |||||||||
PDC Energy, Inc. | 10,378 | 506,239 | |||||||||
Peabody Energy Corp. (a) (c) | 21,681 | 218,328 | |||||||||
SM Energy Co. | 20,593 | 607,082 | |||||||||
Transocean Ltd. (a) (b) | 144,331 | 398,354 | |||||||||
Whiting Petroleum Corp. (a) | 8,577 | 554,760 | |||||||||
10,325,565 | |||||||||||
See notes to financial statements.
14
| Victory Portfolios II VictoryShares USAA MSCI USA Small Cap Value Momentum ETF | Schedule of Portfolio Investments — continued December 31, 2021 | ||||||
(Unaudited)
Security Description | Shares | Value | |||||||||
Financials (11.8%): | |||||||||||
Affiliated Managers Group, Inc. | 2,428 | $ | 399,430 | ||||||||
A-Mark Precious Metals, Inc. | 4,384 | 267,862 | |||||||||
American Equity Investment Life Holding Co. | 14,185 | 552,080 | |||||||||
American National Group, Inc. | 4,597 | 868,098 | |||||||||
Ameris Bancorp | 7,517 | 373,445 | |||||||||
Assured Guaranty Ltd. | 12,452 | 625,090 | |||||||||
Atlanticus Holdings Corp. (a) | 3,188 | 227,368 | |||||||||
B Riley Financial, Inc. | 10,230 | 909,038 | |||||||||
Berkshire Hills Bancorp, Inc. | 12,903 | 366,832 | |||||||||
Brighthouse Financial, Inc. (a) | 10,430 | 540,274 | |||||||||
BrightSpire Capital, Inc. | 23,061 | 236,606 | |||||||||
Chimera Investment Corp. | 46,595 | 702,653 | |||||||||
CIT Group, Inc. | 9,710 | 498,511 | |||||||||
Cowen, Inc., Class A | 16,741 | 604,350 | |||||||||
Customers Bancorp, Inc. | 14,548 | 951,003 | |||||||||
Dime Community Bancshares, Inc. | 13,798 | 485,138 | |||||||||
Donnelley Financial Solutions, Inc. (a) | 15,453 | 728,454 | |||||||||
Encore Capital Group, Inc. (a) | 8,939 | 555,201 | |||||||||
Enova International, Inc. (a) | 14,477 | 592,978 | |||||||||
Enstar Group Ltd. (a) | 2,106 | 521,425 | |||||||||
First Bancorp/Puerto Rico | 25,041 | 345,065 | |||||||||
Flagstar Bancorp, Inc. | 16,613 | 796,427 | |||||||||
Flushing Financial Corp. | 16,941 | 411,666 | |||||||||
FNB Corp. | 68,697 | 833,295 | |||||||||
Genworth Financial, Inc. (a) | 155,973 | 631,691 | |||||||||
Granite Point Mortgage Trust, Inc. | 34,121 | 399,557 | |||||||||
Great Western Bancorp, Inc. | 9,740 | 330,770 | |||||||||
Hancock Whitney Corp. | 6,812 | 340,736 | |||||||||
HarborOne Bancorp, Inc. | 42,924 | 636,992 | |||||||||
HCI Group, Inc. | 7,463 | 623,459 | |||||||||
Hope Bancorp, Inc. | 58,303 | 857,637 | |||||||||
Houlihan Lokey, Inc. | 5,170 | 535,198 | |||||||||
Janus Henderson Group PLC | 18,896 | 792,498 | |||||||||
Jefferies Financial Group, Inc. | 22,295 | 865,046 | |||||||||
LendingClub Corp. (a) | 13,848 | 334,845 | |||||||||
Meta Financial Group, Inc. | 7,279 | 434,265 | |||||||||
Metropolitan Bank Holding Corp. (a) | 3,339 | 355,704 | |||||||||
MFA Financial, Inc. | 50,325 | 229,482 | |||||||||
MGIC Investment Corp. | 43,167 | 622,468 | |||||||||
Midland States Bancorp, Inc. | 18,236 | 452,070 | |||||||||
Mr. Cooper Group, Inc. (a) | 14,110 | 587,117 | |||||||||
National Western Life Group, Inc., Class A | 3,248 | 696,501 | |||||||||
Navient Corp. | 29,096 | 617,417 | |||||||||
New Residential Investment Corp. | 23,385 | 250,453 | |||||||||
New York Community Bancorp, Inc. | 39,212 | 478,779 | |||||||||
Northfield Bancorp, Inc. | 32,695 | 528,351 | |||||||||
OFG Bancorp | 13,217 | 351,044 | |||||||||
Old Republic International Corp. | 39,309 | 966,215 | |||||||||
See notes to financial statements.
15
| Victory Portfolios II VictoryShares USAA MSCI USA Small Cap Value Momentum ETF | Schedule of Portfolio Investments — continued December 31, 2021 | ||||||
(Unaudited)
Security Description | Shares | Value | |||||||||
PacWest Bancorp | 6,785 | $ | 306,478 | ||||||||
Pennymac Financial Services | 9,453 | 659,630 | |||||||||
Pinnacle Financial Partners, Inc. | 8,289 | 791,600 | |||||||||
Popular, Inc. | 10,120 | 830,245 | |||||||||
Radian Group, Inc. | 14,346 | 303,131 | |||||||||
Ready Capital Corp. | 16,933 | 264,663 | |||||||||
ServisFirst Bancshares, Inc. | 6,924 | 588,125 | |||||||||
Silvergate Capital Corp., Class A (a) | 5,975 | 885,495 | |||||||||
SiriusPoint Ltd. (a) | 98,163 | 798,065 | |||||||||
SLM Corp. | 21,407 | 421,076 | |||||||||
State Auto Financial Corp. | 8,553 | 442,105 | |||||||||
Sterling Bancorp | 25,877 | 667,368 | |||||||||
Triumph Bancorp, Inc. (a) | 4,225 | 503,113 | |||||||||
Universal Insurance Holdings, Inc. | 30,204 | 513,468 | |||||||||
Unum Group | 23,771 | 584,054 | |||||||||
34,869,200 | |||||||||||
Health Care (25.0%): | |||||||||||
Agios Pharmaceuticals, Inc. (a) | 7,407 | 243,468 | |||||||||
Alkermes PLC (a) | 31,476 | 732,132 | |||||||||
Anavex Life Sciences Corp. (a) | 22,593 | 391,763 | |||||||||
Atea Pharmaceuticals, Inc. (a) | 33,271 | 297,443 | |||||||||
Aurinia Pharmaceuticals, Inc. (a) | 7,449 | 170,359 | |||||||||
Avid Bioservices, Inc. (a) | 16,432 | 479,486 | |||||||||
Beam Therapeutics, Inc. (a) (b) | 5,985 | 476,945 | |||||||||
BioCryst Pharmaceuticals, Inc. (a) | 14,915 | 206,573 | |||||||||
Biohaven Pharmaceutical Holding Co. Ltd. (a) | 2,409 | 331,984 | |||||||||
C4 Therapeutics, Inc. (a) | 7,115 | 229,103 | |||||||||
CareDx, Inc. (a) | 3,387 | 154,041 | |||||||||
Castle Biosciences, Inc. (a) | 4,398 | 188,542 | |||||||||
Catalyst Pharmaceuticals, Inc. (a) | 78,759 | 533,198 | |||||||||
Celldex Therapeutics, Inc. (a) | 9,854 | 380,759 | |||||||||
Cerevel Therapeutics Holdings, Inc. (a) | 7,888 | 255,729 | |||||||||
Curis, Inc. (a) | 72,122 | 343,301 | |||||||||
Dynavax Technologies Corp. (a) (b) | 13,190 | 185,583 | |||||||||
Eagle Pharmaceuticals, Inc. (a) | 18,179 | 925,675 | |||||||||
Emergent BioSolutions, Inc. (a) | 13,109 | 569,848 | |||||||||
Enanta Pharmaceuticals, Inc. (a) | 5,120 | 382,874 | |||||||||
Exelixis, Inc. (a) | 20,995 | 383,789 | |||||||||
Fate Therapeutics, Inc. (a) | 2,480 | 145,105 | |||||||||
Halozyme Therapeutics, Inc. (a) | 10,183 | 409,458 | |||||||||
Humanigen, Inc. (a) | 18,131 | 67,447 | |||||||||
Ideaya Biosciences, Inc. (a) | 12,235 | 289,235 | |||||||||
Inhibrx, Inc. (a) | 6,699 | 292,545 | |||||||||
Intellia Therapeutics, Inc. (a) | 3,112 | 367,963 | |||||||||
Ironwood Pharmaceuticals, Inc. (a) | 63,201 | 736,924 | |||||||||
IVERIC bio, Inc. (a) | 13,646 | 228,161 | |||||||||
Ligand Pharmaceuticals, Inc. (a) | 2,052 | 316,952 | |||||||||
Morphic Holding, Inc. (a) | 4,840 | 229,319 | |||||||||
See notes to financial statements.
16
| Victory Portfolios II VictoryShares USAA MSCI USA Small Cap Value Momentum ETF | Schedule of Portfolio Investments — continued December 31, 2021 | ||||||
(Unaudited)
Security Description | Shares | Value | |||||||||
Myriad Genetics, Inc. (a) | 15,105 | $ | 416,898 | ||||||||
Natera, Inc. (a) | 2,909 | 271,672 | |||||||||
Ocugen, Inc. (a) (b) | 61,302 | 278,924 | |||||||||
OPKO Health, Inc. (a) | 112,822 | 542,674 | |||||||||
Organogenesis Holdings, Inc. (a) | 48,578 | 448,861 | |||||||||
Protagonist Therapeutics, Inc. (a) | 4,404 | 150,617 | |||||||||
Prothena Corp. PLC (a) | 8,137 | �� | 401,968 | ||||||||
Repligen Corp. (a) | 2,866 | 759,031 | |||||||||
Rubius Therapeutics, Inc. (a) | 13,444 | 130,138 | |||||||||
Sorrento Therapeutics, Inc. (a) (b) | 36,760 | 170,934 | |||||||||
SpringWorks Therapeutics, Inc. (a) | 3,716 | 230,318 | |||||||||
United Therapeutics Corp. (a) | 5,442 | 1,175,907 | |||||||||
Vanda Pharmaceuticals, Inc. (a) | 43,573 | 683,660 | |||||||||
Veracyte, Inc. (a) | 5,998 | 247,118 | |||||||||
Vericel Corp. (a) | 5,078 | 199,565 | |||||||||
Xenon Pharmaceuticals, Inc. (a) | 7,545 | 235,706 | |||||||||
AngioDynamics, Inc. (a) | 28,452 | 784,706 | |||||||||
Anika Therapeutics, Inc. (a) (b) | 7,989 | 286,246 | |||||||||
AtriCure, Inc. (a) | 11,056 | 768,724 | |||||||||
Atrion Corp. | 747 | 526,560 | |||||||||
Avanos Medical, Inc. (a) | 10,919 | 378,562 | |||||||||
BioLife Solutions, Inc. (a) | 10,898 | 406,168 | |||||||||
CONMED Corp. | 5,508 | 780,814 | |||||||||
CryoPort, Inc. (a) | 8,158 | 482,709 | |||||||||
Cutera, Inc. (a) | 5,647 | 233,334 | |||||||||
Envista Holdings Corp. (a) | 13,518 | 609,121 | |||||||||
Establishment Labs Holdings, Inc. (a) | 8,470 | 572,487 | |||||||||
Globus Medical, Inc. (a) | 5,860 | 423,092 | |||||||||
Heska Corp. (a) | 3,721 | 679,045 | |||||||||
ICU Medical, Inc. (a) | 1,881 | 446,437 | |||||||||
Inogen, Inc. (a) | 4,919 | 167,246 | |||||||||
Integer Holdings Corp. (a) | 7,780 | 665,890 | |||||||||
Integra LifeSciences Holdings Corp. (a) | 13,905 | 931,496 | |||||||||
Lantheus Holdings, Inc. (a) | 25,033 | 723,203 | |||||||||
LeMaitre Vascular, Inc. | 15,902 | 798,757 | |||||||||
LivaNova PLC (a) | 4,249 | 371,490 | |||||||||
Meridian Bioscience, Inc. (a) | 26,794 | 546,598 | |||||||||
Merit Medical Systems, Inc. (a) | 12,064 | 751,587 | |||||||||
Mesa Laboratories, Inc. | 1,657 | 543,645 | |||||||||
Natus Medical, Inc. (a) | 31,673 | 751,600 | |||||||||
NuVasive, Inc. (a) | 6,291 | 330,152 | |||||||||
OraSure Technologies, Inc. (a) | 56,165 | 488,074 | |||||||||
Orthofix Medical, Inc. (a) | 25,187 | 783,064 | |||||||||
OrthoPediatrics Corp. (a) | 5,868 | 351,258 | |||||||||
Quidel Corp. (a) | 1,973 | 266,335 | |||||||||
Senseonics Holdings, Inc. (a) (b) | 64,222 | 171,473 | |||||||||
Shockwave Medical, Inc. (a) | 2,840 | 506,457 | |||||||||
STAAR Surgical Co. (a) | 2,068 | 188,808 | |||||||||
Varex Imaging Corp. (a) | 26,606 | 839,419 | |||||||||
See notes to financial statements.
17
| Victory Portfolios II VictoryShares USAA MSCI USA Small Cap Value Momentum ETF | Schedule of Portfolio Investments — continued December 31, 2021 | ||||||
(Unaudited)
Security Description | Shares | Value | |||||||||
Acadia Healthcare Co., Inc. (a) | 8,734 | $ | 530,154 | ||||||||
Addus HomeCare Corp. (a) | 8,939 | 835,886 | |||||||||
AMN Healthcare Services, Inc. (a) | 7,366 | 901,083 | |||||||||
Apollo Medical Holdings, Inc. (a) (b) | 5,946 | 436,912 | |||||||||
CorVel Corp. (a) | 5,771 | 1,200,368 | |||||||||
Covetrus, Inc. (a) | 28,139 | 561,936 | |||||||||
Cross Country Healthcare, Inc. (a) | 13,454 | 373,483 | |||||||||
Encompass Health Corp. | 6,212 | 405,395 | |||||||||
Fulgent Genetics, Inc. (a) | 4,788 | 481,625 | |||||||||
Hanger, Inc. (a) | 12,477 | 226,208 | |||||||||
LHC Group, Inc. (a) | 2,881 | 395,360 | |||||||||
Magellan Health, Inc. (a) | 8,628 | 819,574 | |||||||||
MEDNAX, Inc. (a) | 19,038 | 518,024 | |||||||||
ModivCare, Inc. (a) | 5,043 | 747,826 | |||||||||
National HealthCare Corp. (c) | 15,625 | 1,061,562 | |||||||||
Option Care Health, Inc. (a) | 22,673 | 644,820 | |||||||||
Owens & Minor, Inc. | 10,974 | 477,369 | |||||||||
Patterson Cos., Inc. (c) | 12,597 | 369,722 | |||||||||
Premier, Inc., Class A | 25,322 | 1,042,507 | |||||||||
Progyny, Inc. (a) | 4,836 | 243,493 | |||||||||
RadNet, Inc. (a) | 20,512 | 617,616 | |||||||||
Select Medical Holdings Corp. | 19,094 | 561,364 | |||||||||
Surgery Partners, Inc. (a) | 9,420 | 503,122 | |||||||||
Tenet Healthcare Corp. (a) | 5,868 | 479,357 | |||||||||
The Ensign Group, Inc. | 9,939 | 834,478 | |||||||||
The Joint Corp. (a) | 6,933 | 455,429 | |||||||||
Tivity Health, Inc. (a) (b) | 17,691 | 467,750 | |||||||||
Triple-S Management Corp., Class B (a) | 20,018 | 714,242 | |||||||||
Allscripts Healthcare Solutions, Inc. (a) | 41,887 | 772,815 | |||||||||
Change Healthcare, Inc. (a) | 26,651 | 569,798 | |||||||||
Computer Programs and Systems, Inc. (a) (b) | 26,934 | 789,166 | |||||||||
Evolent Health, Inc., Class A (a) | 19,343 | 535,221 | |||||||||
HealthStream, Inc. (a) | 44,039 | 1,160,868 | |||||||||
NextGen Healthcare, Inc. (a) | 41,335 | 735,350 | |||||||||
Omnicell, Inc. (a) | 5,229 | 943,521 | |||||||||
OptimizeRx Corp. (a) | 7,638 | 474,396 | |||||||||
Phreesia, Inc. (a) | 4,192 | 174,639 | |||||||||
Vocera Communications, Inc. (a) | 14,748 | 956,260 | |||||||||
BioNano Genomics, Inc. (a) | 64,885 | 194,006 | |||||||||
Bruker Corp. | 12,010 | 1,007,759 | |||||||||
Codexis, Inc. (a) | 8,053 | 251,817 | |||||||||
Medpace Holdings, Inc. (a) | 3,837 | 835,085 | |||||||||
Pacific Biosciences of California, Inc. (a) | 8,226 | 168,304 | |||||||||
Syneos Health, Inc. (a) | 7,042 | 723,073 | |||||||||
Aclaris Therapeutics, Inc. (a) | 15,791 | 229,601 | |||||||||
Amneal Pharmaceuticals, Inc. (a) | 104,020 | 498,256 | |||||||||
Amphastar Pharmaceuticals, Inc. (a) | 52,298 | 1,218,020 | |||||||||
ANI Pharmaceuticals, Inc. (a) | 20,616 | 949,985 | |||||||||
Arvinas, Inc. (a) | 6,116 | 502,368 | |||||||||
See notes to financial statements.
18
| Victory Portfolios II VictoryShares USAA MSCI USA Small Cap Value Momentum ETF | Schedule of Portfolio Investments — continued December 31, 2021 | ||||||
(Unaudited)
Security Description | Shares | Value | |||||||||
BioDelivery Sciences International, Inc. (a) | 218,236 | $ | 676,532 | ||||||||
Cassava Sciences, Inc. (a) (b) | 6,659 | 290,998 | |||||||||
Collegium Pharmaceutical, Inc. (a) | 27,282 | 509,628 | |||||||||
Corcept Therapeutics, Inc. (a) | 26,904 | 532,699 | |||||||||
Endo International PLC (a) | 95,064 | 357,441 | |||||||||
Harmony Biosciences Holdings, Inc. (a) | 7,325 | 312,338 | |||||||||
Innoviva, Inc. (a) | 51,042 | 880,474 | |||||||||
Oramed Pharmaceuticals, Inc. (a) | 7,990 | 114,097 | |||||||||
Pacira BioSciences, Inc. (a) | 13,935 | 838,469 | |||||||||
Perrigo Co. PLC | 21,113 | 821,296 | |||||||||
Phibro Animal Health Corp., Class A | 15,693 | 320,451 | |||||||||
Prestige Consumer Healthcare, Inc. (a) | 17,921 | 1,086,909 | |||||||||
SIGA Technologies, Inc. (a) | 45,638 | 343,198 | |||||||||
Supernus Pharmaceuticals, Inc. (a) | 25,675 | 748,683 | |||||||||
Tilray, Inc., Class 2 (a) (b) | 20,268 | 142,484 | |||||||||
Zomedica Corp. (a) (b) | 480,271 | 147,203 | |||||||||
73,564,125 | |||||||||||
Industrials (13.3%): | |||||||||||
ACCO Brands Corp. | 73,243 | 604,987 | |||||||||
Acuity Brands, Inc. | 4,011 | 849,209 | |||||||||
Advanced Drainage Systems, Inc. | 3,251 | 442,559 | |||||||||
AGCO Corp. | 3,228 | 374,513 | |||||||||
Air Lease Corp. | 13,941 | 616,610 | |||||||||
Altra Industrial Motion Corp. | 5,119 | 263,987 | |||||||||
ArcBest Corp. | 9,030 | 1,082,245 | |||||||||
Argan, Inc. | 25,175 | 974,021 | |||||||||
Atkore, Inc. (a) | 5,909 | 657,022 | |||||||||
Atlas Air Worldwide Holdings, Inc. (a) | 7,163 | 674,182 | |||||||||
Avis Budget Group, Inc. (a) (c) | 795 | 164,859 | |||||||||
Beacon Roofing Supply, Inc. (a) | 5,680 | 325,748 | |||||||||
Boise Cascade Co. | 11,798 | 840,018 | |||||||||
Builders FirstSource, Inc. (a) | 10,500 | 899,955 | |||||||||
Comfort Systems USA, Inc. | 4,036 | 399,322 | |||||||||
CRA International, Inc. | 3,550 | 331,428 | |||||||||
DXP Enterprises, Inc. (a) | 17,443 | 447,762 | |||||||||
EMCOR Group, Inc. | 7,962 | 1,014,279 | |||||||||
Encore Wire Corp. | 9,627 | 1,377,624 | |||||||||
Genco Shipping & Trading Ltd. | 34,565 | 553,040 | |||||||||
GMS, Inc. (a) | 10,755 | 646,483 | |||||||||
GrafTech International Ltd. | 25,999 | 307,568 | |||||||||
Granite Construction, Inc. | 15,568 | 602,482 | |||||||||
Great Lakes Dredge & Dock Corp. (a) | 27,910 | 438,745 | |||||||||
Heidrick & Struggles International, Inc. | 19,159 | 837,823 | |||||||||
Herc Holdings, Inc. | 3,529 | 552,465 | |||||||||
Hub Group, Inc., Class A (a) | 6,143 | 517,486 | |||||||||
Insteel Industries, Inc. | 7,764 | 309,085 | |||||||||
Interface, Inc. | 17,980 | 286,781 | |||||||||
Kelly Services, Inc., Class A | 41,582 | 697,330 | |||||||||
See notes to financial statements.
19
| Victory Portfolios II VictoryShares USAA MSCI USA Small Cap Value Momentum ETF | Schedule of Portfolio Investments — continued December 31, 2021 | ||||||
(Unaudited)
Security Description | Shares | Value | |||||||||
Kforce, Inc. | 8,158 | $ | 613,645 | ||||||||
Korn Ferry | 10,655 | 806,903 | |||||||||
ManpowerGroup, Inc. | 3,774 | 367,323 | |||||||||
MasTec, Inc. (a) | 3,714 | 342,728 | |||||||||
Matson, Inc. | 10,090 | 908,403 | |||||||||
Matthews International Corp., Class A | 10,688 | 391,929 | |||||||||
Mueller Industries, Inc. | 16,573 | 983,773 | |||||||||
MYR Group, Inc. (a) | 7,057 | 780,151 | |||||||||
NOW, Inc. (a) | 79,922 | 682,534 | |||||||||
nVent Electric PLC | 24,962 | 948,556 | |||||||||
Primoris Services Corp. | 28,104 | 673,934 | |||||||||
Quanex Building Products Corp. | 14,077 | 348,828 | |||||||||
Quanta Services, Inc. | 8,710 | 998,689 | |||||||||
Regal Rexnord Corp. | 6,213 | 1,057,328 | |||||||||
Resideo Technologies, Inc. (a) | 20,507 | 533,797 | |||||||||
Resources Connection, Inc. | 57,459 | 1,025,069 | |||||||||
REV Group, Inc. | 30,919 | 437,504 | |||||||||
Rush Enterprises, Inc., Class A | 18,628 | 1,036,462 | |||||||||
Ryder System, Inc. | 8,762 | 722,252 | |||||||||
SkyWest, Inc. (a) | 12,518 | 491,957 | |||||||||
Sterling Construction Co., Inc. (a) | 25,515 | 671,044 | |||||||||
Terex Corp. | 7,233 | 317,890 | |||||||||
The Greenbrier Cos., Inc. | 14,501 | 665,451 | |||||||||
The Manitowoc Co., Inc. (a) | 26,835 | 498,863 | |||||||||
Triton International Ltd. | 16,196 | 975,485 | |||||||||
TrueBlue, Inc. (a) | 33,944 | 939,230 | |||||||||
Tutor Perini Corp. (a) | 37,189 | 460,028 | |||||||||
UFP Industries, Inc. | 4,353 | 400,519 | |||||||||
Veritiv Corp. (a) | 4,249 | 520,800 | |||||||||
Watts Water Technologies, Inc., Class A | 2,935 | 569,889 | |||||||||
WESCO International, Inc. (a) | 4,884 | 642,685 | |||||||||
Zurn Water Solutions Corp. | 11,744 | 427,482 | |||||||||
39,330,749 | |||||||||||
Information Technology (13.8%): | |||||||||||
A10 Networks, Inc. | 20,140 | 333,921 | |||||||||
Alliance Data Systems Corp. | 6,089 | 405,345 | |||||||||
Alpha & Omega Semiconductor Ltd. (a) | 17,794 | 1,077,605 | |||||||||
Ambarella, Inc. (a) | 1,730 | 351,000 | |||||||||
Amkor Technology, Inc. | 26,181 | 649,027 | |||||||||
Avaya Holdings Corp. (a) | 13,005 | 257,499 | |||||||||
Avid Technology, Inc. (a) | 9,443 | 307,558 | |||||||||
Avnet, Inc. | 25,012 | 1,031,245 | |||||||||
Axcelis Technologies, Inc. (a) | 5,068 | 377,870 | |||||||||
Belden, Inc. | 5,248 | 344,951 | |||||||||
Benchmark Electronics, Inc. | 36,150 | 979,665 | |||||||||
Calix, Inc. (a) | 9,603 | 767,952 | |||||||||
Cambium Networks Corp. (a) | 9,255 | 237,206 | |||||||||
Clearfield, Inc. (a) | 4,838 | 408,424 | |||||||||
See notes to financial statements.
20
| Victory Portfolios II VictoryShares USAA MSCI USA Small Cap Value Momentum ETF | Schedule of Portfolio Investments — continued December 31, 2021 | ||||||
(Unaudited)
Security Description | Shares | Value | |||||||||
CommScope Holding Co., Inc. (a) | 18,084 | $ | 199,647 | ||||||||
Comtech Telecommunications Corp. | 11,241 | 266,299 | |||||||||
Concentrix Corp. | 3,867 | 690,723 | |||||||||
Conduent, Inc. (a) | 71,514 | 381,885 | |||||||||
Consensus Cloud Solutions, Inc. (a) | 6,818 | 394,558 | |||||||||
Digi International, Inc. (a) | 14,422 | 354,348 | |||||||||
Digital Turbine, Inc. (a) | 4,434 | 270,430 | |||||||||
Diodes, Inc. (a) | 8,460 | 928,993 | |||||||||
DXC Technology Co. (a) | 16,872 | 543,110 | |||||||||
Ebix, Inc. | 14,042 | 426,877 | |||||||||
EchoStar Corp., Class A (a) | 34,539 | 910,103 | |||||||||
ExlService Holdings, Inc. (a) | 3,700 | 535,649 | |||||||||
Fabrinet (a) | 3,834 | 454,214 | |||||||||
First Solar, Inc. (a) | 3,717 | 323,974 | |||||||||
Grid Dynamics Holdings, Inc. (a) | 23,245 | 882,613 | |||||||||
Ichor Holdings Ltd. (a) | 5,349 | 246,214 | |||||||||
Insight Enterprises, Inc. (a) | 8,493 | 905,354 | |||||||||
Jabil, Inc. | 12,816 | 901,606 | |||||||||
Kimball Electronics, Inc. (a) | 17,568 | 382,280 | |||||||||
Knowles Corp. (a) | 44,144 | 1,030,762 | |||||||||
Kulicke & Soffa Industries, Inc. | 12,852 | 778,060 | |||||||||
Marathon Digital Holdings, Inc. (a) (b) | 10,970 | 360,474 | |||||||||
MaxLinear, Inc. (a) | 4,462 | 336,390 | |||||||||
Methode Electronics, Inc. | 18,453 | 907,334 | |||||||||
MicroStrategy, Inc. (a) (b) | 755 | 411,090 | |||||||||
MicroVision, Inc. (a) (b) | 16,426 | 82,294 | |||||||||
Mimecast Ltd. (a) | 4,976 | 395,940 | |||||||||
NCR Corp. (a) | 16,976 | 682,435 | |||||||||
NETGEAR, Inc. (a) | 14,610 | 426,758 | |||||||||
NetScout Systems, Inc. (a) | 33,824 | 1,118,898 | |||||||||
Onto Innovation, Inc. (a) | 9,135 | 924,736 | |||||||||
Perficient, Inc. (a) | 7,376 | 953,643 | |||||||||
Photronics, Inc. (a) | 56,131 | 1,058,069 | |||||||||
Rambus, Inc. (a) | 37,446 | 1,100,538 | |||||||||
Ribbon Communications, Inc. (a) | 46,225 | 279,661 | |||||||||
Riot Blockchain, Inc. (a) (b) | 13,190 | 294,533 | |||||||||
Sanmina Corp. (a) | 22,122 | 917,178 | |||||||||
ScanSource, Inc. (a) | 22,320 | 782,986 | |||||||||
SiTime Corp. (a) | 1,207 | 353,096 | |||||||||
SMART Global Holdings, Inc. (a) | 11,867 | 842,438 | |||||||||
Sprout Social, Inc., Class A (a) | 5,859 | 531,353 | |||||||||
Super Micro Computer, Inc. (a) | 7,980 | 350,721 | |||||||||
Synaptics, Inc. (a) | 3,090 | 894,586 | |||||||||
TD SYNNEX Corp. | 6,356 | 726,872 | |||||||||
Teradata Corp. (a) | 13,592 | 577,252 | |||||||||
The Hackett Group, Inc. | 20,780 | 426,613 | |||||||||
TTEC Holdings, Inc. | 3,809 | 344,905 | |||||||||
TTM Technologies, Inc. (a) | 64,958 | 967,874 | |||||||||
Ultra Clean Holdings, Inc. (a) | 10,835 | 621,496 | |||||||||
See notes to financial statements.
21
| Victory Portfolios II VictoryShares USAA MSCI USA Small Cap Value Momentum ETF | Schedule of Portfolio Investments — continued December 31, 2021 | ||||||
(Unaudited)
Security Description | Shares | Value | |||||||||
Vishay Intertechnology, Inc. | 20,097 | $ | 439,521 | ||||||||
Vishay Precision Group, Inc. (a) | 12,059 | 447,630 | |||||||||
Workiva, Inc. (a) | 2,693 | 351,410 | |||||||||
Xerox Holdings Corp. | 35,306 | 799,328 | |||||||||
Xperi Holding Corp. | 31,730 | 600,014 | |||||||||
Ziff Davis, Inc. (a) | 8,786 | 974,016 | |||||||||
40,619,049 | |||||||||||
Materials (4.0%): | |||||||||||
AdvanSix, Inc. | 14,766 | 697,693 | |||||||||
Alcoa Corp. | 12,492 | 744,273 | |||||||||
Alpha Metallurgical Resources, Inc. (a) | 7,705 | 470,390 | |||||||||
Clearwater Paper Corp. (a) | 15,907 | 583,310 | |||||||||
Cleveland-Cliffs, Inc. (a) | 22,328 | 486,081 | |||||||||
Commercial Metals Co. | 24,182 | 877,565 | |||||||||
Kraton Corp. (a) | 5,481 | 253,880 | |||||||||
Louisiana-Pacific Corp. | 10,623 | 832,312 | |||||||||
Mercer International, Inc. | 62,733 | 752,169 | |||||||||
Olin Corp. | 11,996 | 690,010 | |||||||||
Ranpak Holdings Corp. (a) | 8,711 | 327,359 | |||||||||
Reliance Steel & Aluminum Co. | 6,923 | 1,123,049 | |||||||||
Ryerson Holding Corp. | 9,829 | 256,045 | |||||||||
Schnitzer Steel Industries, Inc. | 13,484 | 700,089 | |||||||||
SunCoke Energy, Inc. | 85,984 | 566,635 | |||||||||
Trinseo PLC (a) | 12,228 | 641,481 | |||||||||
Tronox Holdings PLC, Class A | 24,103 | 579,195 | |||||||||
United States Steel Corp. | 19,279 | 459,033 | |||||||||
Warrior Met Coal, Inc. | 14,941 | 384,133 | |||||||||
Worthington Industries, Inc. | 7,180 | 392,459 | |||||||||
11,817,161 | |||||||||||
Real Estate (7.1%): | |||||||||||
American Homes 4 Rent, Class A | 12,612 | 550,009 | |||||||||
Brixmor Property Group, Inc. | 12,303 | 312,619 | |||||||||
Centerspace | 4,475 | 496,277 | |||||||||
City Office REIT, Inc. | 55,856 | 1,101,480 | |||||||||
CoreCivic, Inc. (a) | 62,347 | 621,600 | |||||||||
CorePoint Lodging, Inc. (a) | 17,788 | 279,272 | |||||||||
Cousins Properties, Inc. | 10,762 | 433,493 | |||||||||
CubeSmart | 20,335 | 1,157,265 | |||||||||
EastGroup Properties, Inc. | 2,673 | 609,043 | |||||||||
eXp World Holdings, Inc. (b) | 5,412 | 182,330 | |||||||||
First Industrial Realty Trust, Inc. | 10,619 | 702,978 | |||||||||
Independence Realty Trust, Inc. | 36,254 | 936,441 | |||||||||
Innovative Industrial Properties, Inc. | 1,139 | 299,454 | |||||||||
Jones Lang LaSalle, Inc. (a) | 3,062 | 824,719 | |||||||||
Kimco Realty Corp. | 12,860 | 316,999 | |||||||||
Life Storage, Inc. | 8,237 | 1,261,744 | |||||||||
LXP Industrial Trust | 40,524 | 632,985 | |||||||||
Marcus & Millichap, Inc. (a) | 10,289 | 529,472 | |||||||||
See notes to financial statements.
22
| Victory Portfolios II VictoryShares USAA MSCI USA Small Cap Value Momentum ETF | Schedule of Portfolio Investments — continued December 31, 2021 | ||||||
(Unaudited)
Security Description | Shares | Value | |||||||||
National Storage Affiliates Trust | 17,358 | $ | 1,201,174 | ||||||||
NETSTREIT Corp. | 13,738 | 314,600 | |||||||||
NexPoint Residential Trust, Inc. | 5,205 | 436,335 | |||||||||
One Liberty Properties, Inc. | 11,894 | 419,620 | |||||||||
Plymouth Industrial REIT, Inc. | 14,377 | 460,064 | |||||||||
PS Business Parks, Inc. | 3,037 | 559,324 | |||||||||
RE/MAX Holdings, Inc. | 20,251 | 617,453 | |||||||||
Realogy Holdings Corp. (a) | 26,570 | 446,642 | |||||||||
| RPT Realty | 18,968 | 253,792 | |||||||||
SITE Centers Corp. | 15,895 | 251,618 | |||||||||
STAG Industrial, Inc. | 27,906 | 1,338,372 | |||||||||
Tanger Factory Outlet Centers, Inc. (b) | 27,184 | 524,108 | |||||||||
The GEO Group, Inc. (b) | 38,084 | 295,151 | |||||||||
The RMR Group, Inc., Class A | 18,856 | 653,926 | |||||||||
UMH Properties, Inc. | 41,257 | 1,127,554 | |||||||||
Urban Edge Properties | 17,608 | 334,552 | |||||||||
Urstadt Biddle Properties, Inc., Class A | 15,705 | 334,516 | |||||||||
20,816,981 | |||||||||||
Utilities (1.4%): | |||||||||||
Hawaiian Electric Industries, Inc. | 15,499 | 643,209 | |||||||||
MDU Resources Group, Inc. | 15,287 | 471,451 | |||||||||
National Fuel Gas Co. | 24,548 | 1,569,599 | |||||||||
Otter Tail Corp. (c) | 19,370 | 1,383,405 | |||||||||
4,067,664 | |||||||||||
Total Common Stocks (Cost $249,242,669) | 293,680,343 | ||||||||||
Rights (0.0%) (d) | |||||||||||
Health Care (0.0%): (d) | |||||||||||
Achillion Pharmaceuticals (a) (e) (f) | 17,954 | 4,130 | |||||||||
Total Rights (Cost $—) | 4,130 | ||||||||||
Collateral for Securities Loaned^ (2.5%) | |||||||||||
BlackRock Liquidity Funds TempFund, Institutional Shares, 0.04% (g) | 172,164 | 172,164 | |||||||||
| Fidelity Investments Money Market Government Portfolio, Institutional Shares, 0.01% (g) | 3,381,329 | 3,381,329 | |||||||||
| Goldman Sachs Financial Square Prime Obligations Fund, Institutional Shares, 0.02% (g) | 85,918 | 85,918 | |||||||||
JPMorgan Prime Money Market Fund, Capital Shares, 0.07% (g) | 685,087 | 685,087 | |||||||||
| Morgan Stanley Institutional Liquidity Prime Portfolio, Institutional Shares, 0.06% (g) | 3,080,286 | 3,080,286 | |||||||||
Total Collateral for Securities Loaned (Cost $7,404,784) | 7,404,784 | ||||||||||
Total Investments (Cost $256,647,453) — 102.2% | 301,089,257 | ||||||||||
Liabilities in excess of other assets — (2.2)% | (6,348,801 | ) | |||||||||
NET ASSETS — 100.00% | $ | 294,740,456 | |||||||||
See notes to financial statements.
23
| Victory Portfolios II VictoryShares USAA MSCI USA Small Cap Value Momentum ETF | Schedule of Portfolio Investments — continued December 31, 2021 | ||||||
(Unaudited)
^ Purchased with cash collateral from securities on loan.
(a) Non-income producing security.
(b) All or a portion of this security is on loan.
(c) All or a portion of this security has been segregated as collateral for derivative instruments.
(d) Amount represents less than 0.05% of net assets.
(e) The Fund's Adviser has deemed this security to be illiquid based upon procedures approved by the Board of Trustees. As of December 31, 2021, illiquid securities were less than 0.05% of net assets.
(f) Security was fair valued based upon procedures approved by the Board of Trustees and represents less than 0.05% of net assets as of December 31, 2021. This security is classified as Level 3 within the fair value hierarchy. (See Note 2 in the Notes to Financial Statements)
(g) Rate disclosed is the daily yield on December 31, 2021.
PLC — Public Limited Company
REIT — Real Estate Investment Trust
Futures Contracts Purchased
| Number of Contracts | Expiration Date | Notional Amount | Value | Unrealized Appreciation (Depreciation) | |||||||||||||||||||
E-Mini Russell 2000 Index Futures | 8 | 3/18/22 | $ | 889,102 | $ | 897,120 | $ | 8,018 | |||||||||||||||
Total unrealized appreciation | $ | 8,018 | |||||||||||||||||||||
Total unrealized depreciation | — | ||||||||||||||||||||||
Total net unrealized appreciation (depreciation) | $ | 8,018 | |||||||||||||||||||||
See notes to financial statements.
24
| Victory Portfolios II VictoryShares USAA MSCI International Value Momentum ETF | Schedule of Portfolio Investments December 31, 2021 | ||||||
(Unaudited)
Security Description | Shares | Value | |||||||||
Common Stocks (99.4%) | |||||||||||
Australia (2.8%): | |||||||||||
Energy (0.3%): | |||||||||||
Washington H Soul Pattinson & Co. Ltd. (a) | 43,390 | $ | 934,099 | ||||||||
Health Care (0.4%): | |||||||||||
Sonic Healthcare Ltd. | 41,860 | 1,419,153 | |||||||||
Industrials (0.4%): | |||||||||||
Reece Ltd. | 65,006 | 1,277,510 | |||||||||
Materials (1.0%): | |||||||||||
BlueScope Steel Ltd. | 110,656 | 1,681,458 | |||||||||
Fortescue Metals Group Ltd. | 57,365 | 801,196 | |||||||||
South32 Ltd. | 352,920 | 1,028,929 | |||||||||
3,511,583 | |||||||||||
Real Estate (0.7%): | |||||||||||
Goodman Group | 69,390 | 1,336,926 | |||||||||
Stockland | 427,564 | 1,318,049 | |||||||||
2,654,975 | |||||||||||
9,797,320 | |||||||||||
Austria (1.6%): | |||||||||||
Energy (0.4%): | |||||||||||
OMV AG | 26,938 | 1,530,168 | |||||||||
Financials (0.7%): | |||||||||||
Erste Group Bank AG | 16,189 | 761,261 | |||||||||
Raiffeisen Bank International AG | 58,217 | 1,713,375 | |||||||||
2,474,636 | |||||||||||
Materials (0.2%): | |||||||||||
voestalpine AG | 18,837 | 685,488 | |||||||||
Utilities (0.3%): | |||||||||||
Verbund AG | 8,400 | 944,743 | |||||||||
5,635,035 | |||||||||||
Belgium (0.7%): | |||||||||||
Financials (0.7%): | |||||||||||
Sofina SA | 5,415 | 2,660,238 | |||||||||
Canada (10.2%): | |||||||||||
Communication Services (0.6%): | |||||||||||
Shaw Communications, Inc., Class B (b) | 69,294 | 2,106,002 | |||||||||
Consumer Discretionary (0.2%): | |||||||||||
Magna International, Inc. | 9,876 | 800,228 | |||||||||
See notes to financial statements.
25
| Victory Portfolios II VictoryShares USAA MSCI International Value Momentum ETF | Schedule of Portfolio Investments — continued December 31, 2021 | ||||||
(Unaudited)
Security Description | Shares | Value | |||||||||
Consumer Staples (2.4%): | |||||||||||
Empire Co. Ltd., Class A | 34,607 | $ | 1,055,895 | ||||||||
George Weston Ltd. | 31,548 | 3,662,930 | |||||||||
Loblaw Cos. Ltd. | 45,405 | 3,725,428 | |||||||||
8,444,253 | |||||||||||
Energy (0.8%): | |||||||||||
Cenovus Energy, Inc. | 36,235 | 444,923 | |||||||||
Imperial Oil Ltd. | 47,015 | 1,697,997 | |||||||||
Tourmaline Oil Corp. | 18,383 | 594,357 | |||||||||
2,737,277 | |||||||||||
Financials (1.8%): | |||||||||||
Bank of Montreal | 23,500 | 2,533,717 | |||||||||
Canadian Imperial Bank of Commerce | 11,981 | 1,398,566 | |||||||||
Fairfax Financial Holdings Ltd. | 2,379 | 1,171,919 | |||||||||
Power Corp. of Canada | 33,210 | 1,098,981 | |||||||||
6,203,183 | |||||||||||
Industrials (0.9%): | |||||||||||
TFI International, Inc. | 7,639 | 857,970 | |||||||||
WSP Global, Inc. | 16,795 | 2,441,567 | |||||||||
3,299,537 | |||||||||||
Information Technology (0.5%): | |||||||||||
Lightspeed Commerce, Inc. (c) | 21,678 | 876,628 | |||||||||
Nuvei Corp. (c) (d) | 16,014 | 1,039,582 | |||||||||
1,916,210 | |||||||||||
Materials (1.3%): | |||||||||||
First Quantum Minerals Ltd. | 24,996 | 599,002 | |||||||||
Nutrien Ltd. | 15,149 | 1,140,297 | |||||||||
Teck Resources Ltd., Class B | 55,091 | 1,588,857 | |||||||||
West Fraser Timber Co. Ltd. | 14,376 | 1,373,468 | |||||||||
4,701,624 | |||||||||||
Real Estate (1.2%): | |||||||||||
FirstService Corp. | 10,509 | 2,068,272 | |||||||||
RioCan Real Estate Investment Trust | 112,762 | 2,047,864 | |||||||||
4,116,136 | |||||||||||
Utilities (0.5%): | |||||||||||
AltaGas Ltd. | 83,006 | 1,794,636 | |||||||||
36,119,086 | |||||||||||
China (0.2%): | |||||||||||
Financials (0.2%): | |||||||||||
Futu Holdings Ltd., ADR (c) | 13,629 | 590,136 | |||||||||
Denmark (2.5%): | |||||||||||
Consumer Discretionary (0.3%): | |||||||||||
Pandora A/S | 9,263 | 1,154,856 | |||||||||
See notes to financial statements.
26
| Victory Portfolios II VictoryShares USAA MSCI International Value Momentum ETF | Schedule of Portfolio Investments — continued December 31, 2021 | ||||||
(Unaudited)
Security Description | Shares | Value | |||||||||
Financials (0.3%): | |||||||||||
Danske Bank A/S | 52,399 | $ | 904,930 | ||||||||
Health Care (1.0%): | |||||||||||
Demant A/S (c) | 15,896 | 814,457 | |||||||||
Novo Nordisk A/S, Class B | 23,999 | 2,697,032 | |||||||||
3,511,489 | |||||||||||
Industrials (0.9%): | |||||||||||
AP Moller — Maersk A/S, Class B | 606 | 2,172,807 | |||||||||
DSV A/S | 4,489 | 1,048,423 | |||||||||
3,221,230 | |||||||||||
8,792,505 | |||||||||||
Finland (1.3%): | |||||||||||
Consumer Staples (0.3%): | |||||||||||
Kesko Oyj, Class B | 24,852 | 829,201 | |||||||||
Industrials (0.2%): | |||||||||||
Wartsila Oyj Abp | 56,580 | 795,279 | |||||||||
Information Technology (0.2%): | |||||||||||
Nokia Oyj (c) | 129,603 | 821,524 | |||||||||
Utilities (0.6%): | |||||||||||
Fortum Oyj | 68,988 | 2,117,457 | |||||||||
4,563,461 | |||||||||||
France (9.9%): | |||||||||||
Communication Services (0.8%): | |||||||||||
Publicis Groupe SA | 24,209 | 1,629,810 | |||||||||
Vivendi SE | 99,001 | 1,338,627 | |||||||||
2,968,437 | |||||||||||
Consumer Discretionary (2.2%): | |||||||||||
Cie Generale des Etablissements Michelin SCA | 6,845 | 1,122,086 | |||||||||
Hermes International | 1,753 | 3,062,044 | |||||||||
LVMH Moet Hennessy Louis Vuitton SE | 2,991 | 2,472,800 | |||||||||
Renault SA (c) | 31,979 | 1,110,819 | |||||||||
7,767,749 | |||||||||||
Consumer Staples (0.7%): | |||||||||||
Carrefour SA | 125,735 | 2,302,794 | |||||||||
Energy (0.6%): | |||||||||||
Bollore SA | 374,318 | 2,094,325 | |||||||||
Financials (2.2%): | |||||||||||
AXA SA | 30,764 | 916,080 | |||||||||
BNP Paribas SA | 22,887 | 1,581,672 | |||||||||
CNP Assurances | 59,959 | 1,483,037 | |||||||||
Credit Agricole SA | 105,455 | 1,505,044 | |||||||||
Eurazeo SE | 10,311 | 900,534 | |||||||||
See notes to financial statements.
27
| Victory Portfolios II VictoryShares USAA MSCI International Value Momentum ETF | Schedule of Portfolio Investments — continued December 31, 2021 | ||||||
(Unaudited)
Security Description | Shares | Value | |||||||||
Societe Generale SA | 40,690 | $ | 1,397,670 | ||||||||
7,784,037 | |||||||||||
Health Care (0.5%): | |||||||||||
Ipsen SA | 7,813 | 715,240 | |||||||||
Sartorius Stedim Biotech | 1,541 | 845,373 | |||||||||
1,560,613 | |||||||||||
Industrials (0.9%): | |||||||||||
Bouygues SA | 47,535 | 1,702,254 | |||||||||
Cie de Saint-Gobain | 22,499 | 1,583,002 | |||||||||
3,285,256 | |||||||||||
Information Technology (0.5%): | |||||||||||
Capgemini SE | 7,476 | 1,832,124 | |||||||||
Materials (0.3%): | |||||||||||
EssilorLuxottica SA | 5,083 | 1,082,323 | |||||||||
Utilities (1.2%): | |||||||||||
Electricite de France SA | 110,067 | 1,292,992 | |||||||||
Suez SA | 41,508 | 935,092 | |||||||||
Veolia Environnement SA | 59,084 | 2,167,567 | |||||||||
4,395,651 | |||||||||||
35,073,309 | |||||||||||
Germany (6.6%): | |||||||||||
Consumer Discretionary (1.7%): | |||||||||||
Bayerische Motoren Werke AG | 19,116 | 1,923,665 | |||||||||
Daimler AG | 15,791 | 1,213,753 | |||||||||
Porsche Automobil Holding SE, Preference Shares | 15,611 | 1,481,301 | |||||||||
Volkswagen AG, Preference Shares | 6,946 | 1,401,917 | |||||||||
6,020,636 | |||||||||||
Financials (0.7%): | |||||||||||
Commerzbank AG (c) | 171,594 | 1,305,274 | |||||||||
Deutsche Bank AG, Registered Shares (c) | 107,016 | 1,340,879 | |||||||||
2,646,153 | |||||||||||
Health Care (1.9%): | |||||||||||
Bayer AG, Registered Shares | 31,830 | 1,701,268 | |||||||||
Carl Zeiss Meditec AG | 4,280 | 899,708 | |||||||||
Fresenius SE & Co. KGaA | 36,776 | 1,480,492 | |||||||||
Merck KGaA | 10,364 | 2,675,417 | |||||||||
6,756,885 | |||||||||||
Industrials (1.3%): | |||||||||||
Brenntag SE | 22,100 | 2,000,020 | |||||||||
Daimler Truck Holding AG (c) | 7,895 | 289,907 | |||||||||
Deutsche Post AG, Registered Shares | 34,299 | 2,205,340 | |||||||||
4,495,267 | |||||||||||
See notes to financial statements.
28
| Victory Portfolios II VictoryShares USAA MSCI International Value Momentum ETF | Schedule of Portfolio Investments — continued December 31, 2021 | ||||||
(Unaudited)
Security Description | Shares | Value | |||||||||
Materials (0.6%): | |||||||||||
Covestro AG (d) | 13,175 | $ | 812,060 | ||||||||
HeidelbergCement AG | 20,605 | 1,394,677 | |||||||||
2,206,737 | |||||||||||
Utilities (0.4%): | |||||||||||
Uniper SE | 29,786 | 1,415,881 | |||||||||
23,541,559 | |||||||||||
Hong Kong (4.9%): | |||||||||||
Consumer Discretionary (0.2%): | |||||||||||
Chow Tai Fook Jewellery Group Ltd. | 467,600 | 840,880 | |||||||||
Consumer Staples (0.5%): | |||||||||||
WH Group Ltd. (d) | 2,518,615 | 1,579,727 | |||||||||
Industrials (1.8%): | |||||||||||
CK Hutchison Holdings Ltd. | 341,805 | 2,205,250 | |||||||||
Jardine Matheson Holdings Ltd. | 38,300 | 2,106,883 | |||||||||
SITC International Holdings Co. Ltd. | 187,000 | 676,398 | |||||||||
Xinyi Glass Holdings Ltd. | 611,593 | 1,529,708 | |||||||||
6,518,239 | |||||||||||
Real Estate (1.5%): | |||||||||||
CK Asset Holdings Ltd. | 374,256 | 2,359,412 | |||||||||
Hongkong Land Holdings Ltd. | 203,700 | 1,059,240 | |||||||||
Sino Land Co. Ltd. | 783,629 | 975,980 | |||||||||
Sun Hung Kai Properties Ltd. | 87,560 | 1,062,450 | |||||||||
5,457,082 | |||||||||||
Utilities (0.9%): | |||||||||||
CK Infrastructure Holdings Ltd. | 207,500 | 1,321,444 | |||||||||
Power Assets Holdings Ltd. (b) | 276,500 | 1,723,626 | |||||||||
3,045,070 | |||||||||||
17,440,998 | |||||||||||
Israel (3.6%): | |||||||||||
Financials (2.0%): | |||||||||||
Bank Hapoalim BM | 134,722 | 1,389,467 | |||||||||
Bank Leumi Le-Israel BM | 297,275 | 3,194,913 | |||||||||
Israel Discount Bank Ltd., Class A | 176,392 | 1,186,753 | |||||||||
Mizrahi Tefahot Bank Ltd. | 33,636 | 1,296,851 | |||||||||
7,067,984 | |||||||||||
Health Care (0.4%): | |||||||||||
Inmode Ltd. (c) | 6,495 | 458,417 | |||||||||
Teva Pharmaceutical Industries Ltd., ADR (c) | 130,549 | 1,045,697 | |||||||||
1,504,114 | |||||||||||
Materials (0.6%): | |||||||||||
ICL Group Ltd. | 216,268 | 2,085,273 | |||||||||
See notes to financial statements.
29
| Victory Portfolios II VictoryShares USAA MSCI International Value Momentum ETF | Schedule of Portfolio Investments — continued December 31, 2021 | ||||||
(Unaudited)
Security Description | Shares | Value | |||||||||
Real Estate (0.6%): | |||||||||||
Azrieli Group Ltd. | 23,348 | $ | 2,227,977 | ||||||||
12,885,348 | |||||||||||
Italy (1.5%): | |||||||||||
Communication Services (0.6%): | |||||||||||
Telecom Italia SpA | 3,899,178 | 1,925,312 | |||||||||
Energy (0.2%): | |||||||||||
Eni SpA | 60,581 | 841,872 | |||||||||
Financials (0.7%): | |||||||||||
Intesa Sanpaolo SpA | 325,143 | 840,820 | |||||||||
UniCredit SpA | 111,418 | 1,716,092 | |||||||||
2,556,912 | |||||||||||
5,324,096 | |||||||||||
Japan (25.2%): | |||||||||||
Communication Services (0.8%): | |||||||||||
Dentsu Group, Inc. | 11,200 | 398,767 | |||||||||
KDDI Corp. | 23,800 | 694,851 | |||||||||
Konami Holdings Corp. | 6,900 | 330,754 | |||||||||
Nippon Telegraph & Telephone Corp. | 58,600 | 1,602,970 | |||||||||
3,027,342 | |||||||||||
Consumer Discretionary (3.6%): | |||||||||||
Aisin Corp. | 20,400 | 781,243 | |||||||||
Bridgestone Corp. | 29,700 | 1,276,413 | |||||||||
Denso Corp. | 13,100 | 1,084,016 | |||||||||
Honda Motor Co. Ltd. | 34,100 | 956,476 | |||||||||
Iida Group Holdings Co. Ltd. | 44,700 | 1,038,749 | |||||||||
Isuzu Motors Ltd. | 54,600 | 678,499 | |||||||||
Mazda Motor Corp. (c) | 83,800 | 644,028 | |||||||||
Nissan Motor Co. Ltd. (c) | 160,300 | 773,694 | |||||||||
Panasonic Corp. | 39,000 | 428,422 | |||||||||
Sekisui House Ltd. | 30,900 | 662,517 | |||||||||
Subaru Corp. | 21,500 | 384,052 | |||||||||
Sumitomo Electric Industries Ltd. | 74,200 | 966,201 | |||||||||
Toyota Industries Corp. | 12,200 | 973,627 | |||||||||
Toyota Motor Corp. | 72,800 | 1,331,079 | |||||||||
Yamaha Motor Co. Ltd. | 30,400 | 728,354 | |||||||||
12,707,370 | |||||||||||
Consumer Staples (1.5%): | |||||||||||
Asahi Group Holdings Ltd. | 26,800 | 1,041,233 | |||||||||
Japan Tobacco, Inc. (a) | 88,300 | 1,780,876 | |||||||||
Lawson, Inc. | 13,200 | 624,723 | |||||||||
Seven & i Holdings Co. Ltd. | 31,200 | 1,369,869 | |||||||||
Suntory Beverage & Food Ltd. | 17,100 | 617,741 | |||||||||
5,434,442 | |||||||||||
See notes to financial statements.
30
| Victory Portfolios II VictoryShares USAA MSCI International Value Momentum ETF | Schedule of Portfolio Investments — continued December 31, 2021 | ||||||
(Unaudited)
Security Description | Shares | Value | |||||||||
Energy (1.3%): | |||||||||||
Ajinomoto Co., Inc. | 44,600 | $ | 1,354,403 | ||||||||
ENEOS Holdings, Inc. | 273,800 | 1,023,109 | |||||||||
Idemitsu Kosan Co. Ltd. | 45,244 | 1,153,937 | |||||||||
Inpex Corp. | 107,100 | 931,911 | |||||||||
4,463,360 | |||||||||||
Financials (3.5%): | |||||||||||
Concordia Financial Group Ltd. | 239,700 | 870,085 | |||||||||
Japan Post Bank Co. Ltd. | 74,400 | 681,621 | |||||||||
Japan Post Holdings Co. Ltd. | 153,800 | 1,197,758 | |||||||||
Japan Post Insurance Co. Ltd. | 28,600 | 459,468 | |||||||||
Mitsubishi HC Capital, Inc. | 95,500 | 471,881 | |||||||||
Mitsubishi UFJ Financial Group, Inc. | 207,000 | 1,123,306 | |||||||||
Mizuho Financial Group, Inc. | 94,200 | 1,196,775 | |||||||||
ORIX Corp. | 46,900 | 956,083 | |||||||||
Resona Holdings, Inc. | 280,100 | 1,088,244 | |||||||||
Sumitomo Mitsui Financial Group, Inc. | 34,400 | 1,177,884 | |||||||||
Sumitomo Mitsui Trust Holdings, Inc. | 34,900 | 1,164,697 | |||||||||
The Chiba Bank Ltd. | 157,700 | 902,473 | |||||||||
The Shizuoka Bank Ltd. | 147,500 | 1,052,885 | |||||||||
12,343,160 | |||||||||||
Health Care (0.7%): | |||||||||||
Medipal Holdings Corp. | 68,000 | 1,272,546 | |||||||||
Shionogi & Co. Ltd. | 8,700 | 613,846 | |||||||||
Sumitomo Dainippon Pharma Co. Ltd. | 45,900 | 528,136 | |||||||||
2,414,528 | |||||||||||
Industrials (6.0%): | |||||||||||
AGC, Inc. | 20,800 | 991,637 | |||||||||
Benefit One, Inc. | 7,600 | 325,700 | |||||||||
Dai Nippon Printing Co. Ltd. | 42,700 | 1,072,738 | |||||||||
Fuji Electric Co. Ltd. | 18,200 | 992,541 | |||||||||
Hitachi Ltd. | 15,400 | 833,155 | |||||||||
ITOCHU Corp. | 45,800 | 1,399,196 | |||||||||
Kajima Corp. | 86,800 | 995,726 | |||||||||
Kurita Water Industries Ltd. | 19,700 | 934,063 | |||||||||
Lixil Corp. | 14,000 | 372,628 | |||||||||
Marubeni Corp. | 117,000 | 1,137,437 | |||||||||
Mitsubishi Corp. | 45,400 | 1,439,806 | |||||||||
Mitsubishi Heavy Industries Ltd. | 21,400 | 494,139 | |||||||||
Mitsui & Co. Ltd. | 53,600 | 1,267,679 | |||||||||
NGK Insulators Ltd. | 27,100 | 457,491 | |||||||||
Nippon Express Co. Ltd. (e) | 17,100 | 1,026,104 | |||||||||
Nippon Yusen KK | 11,600 | 882,428 | |||||||||
Obayashi Corp. | 130,300 | 1,007,051 | |||||||||
Shimizu Corp. | 157,400 | 974,566 | |||||||||
Sumitomo Corp. | 84,800 | 1,252,246 | |||||||||
Taisei Corp. | 33,800 | 1,025,843 | |||||||||
See notes to financial statements.
31
| Victory Portfolios II VictoryShares USAA MSCI International Value Momentum ETF | Schedule of Portfolio Investments — continued December 31, 2021 | ||||||
(Unaudited)
Security Description | Shares | Value | |||||||||
TOPPAN, Inc. | 58,700 | $ | 1,099,016 | ||||||||
Toshiba Corp. | 10,000 | 410,751 | |||||||||
Toyota Tsusho Corp. | 17,200 | 791,629 | |||||||||
21,183,570 | |||||||||||
Information Technology (3.5%): | |||||||||||
Brother Industries Ltd. | 47,300 | 908,170 | |||||||||
Canon, Inc. (a) | 50,400 | 1,225,916 | |||||||||
FUJIFILM Holdings Corp. | 15,600 | 1,155,014 | |||||||||
Fujitsu Ltd. | 6,200 | 1,062,273 | |||||||||
Hirose Electric Co. Ltd. | 3,600 | 604,611 | |||||||||
Ibiden Co. Ltd. | 14,600 | 867,214 | |||||||||
Kyocera Corp. | 20,300 | 1,266,954 | |||||||||
NEC Corp. | 21,200 | 977,569 | |||||||||
NTT Data Corp. | 22,100 | 473,263 | |||||||||
Renesas Electronics Corp. (c) | 28,800 | 355,889 | |||||||||
Ricoh Co. Ltd. | 87,000 | 809,144 | |||||||||
Rohm Co. Ltd. | 8,300 | 754,644 | |||||||||
Seiko Epson Corp. | 45,900 | 825,486 | |||||||||
SUMCO Corp. (b) | 15,400 | 314,138 | |||||||||
TDK Corp. | 10,800 | 421,102 | |||||||||
Tokyo Electron Ltd. | 800 | 460,458 | |||||||||
12,481,845 | |||||||||||
Materials (2.2%): | |||||||||||
JFE Holdings, Inc. | 58,900 | 750,348 | |||||||||
Mitsubishi Chemical Holdings Corp. | 140,200 | 1,037,301 | |||||||||
Mitsubishi Gas Chemical Co., Inc. | 51,600 | 872,883 | |||||||||
Mitsui Chemicals, Inc. | 31,100 | 834,519 | |||||||||
Nippon Steel Corp. | 48,700 | 794,433 | |||||||||
Oji Holdings Corp. | 182,200 | 881,294 | |||||||||
Sumitomo Chemical Co. Ltd. | 189,400 | 891,449 | |||||||||
Sumitomo Metal Mining Co. Ltd. | 21,300 | 804,611 | |||||||||
Tosoh Corp. | 62,400 | 924,444 | |||||||||
7,791,282 | |||||||||||
Real Estate (1.0%): | |||||||||||
Daito Trust Construction Co. Ltd. | 9,100 | 1,040,745 | |||||||||
Daiwa House Industry Co. Ltd. | 31,600 | 907,757 | |||||||||
Hulic Co. Ltd. | 110,200 | 1,045,012 | |||||||||
Japan Metropolitan Fund Invest | 390 | 335,626 | |||||||||
Open House Group Co. Ltd. | 5,500 | 287,526 | |||||||||
3,616,666 | |||||||||||
Utilities (1.1%): | |||||||||||
Chubu Electric Power Co., Inc. | 123,700 | 1,301,936 | |||||||||
Osaka Gas Co. Ltd. | 38,000 | 627,311 | |||||||||
The Kansai Electric Power Co., Inc. | 124,100 | 1,157,426 | |||||||||
Tokyo Electric Power Co. Holdings, Inc. (c) | 337,800 | 871,231 | |||||||||
3,957,904 | |||||||||||
89,421,469 | |||||||||||
See notes to financial statements.
32
| Victory Portfolios II VictoryShares USAA MSCI International Value Momentum ETF | Schedule of Portfolio Investments — continued December 31, 2021 | ||||||
(Unaudited)
Security Description | Shares | Value | |||||||||
Luxembourg (0.6%): | |||||||||||
Health Care (0.2%): | |||||||||||
Eurofins Scientific SE | 6,549 | $ | 810,293 | ||||||||
Materials (0.4%): | |||||||||||
ArcelorMittal SA | 36,987 | 1,183,828 | |||||||||
1,994,121 | |||||||||||
Netherlands (4.0%): | |||||||||||
Consumer Staples (0.8%): | |||||||||||
Koninklijke Ahold Delhaize NV | 82,138 | 2,814,839 | |||||||||
Energy (0.2%): | |||||||||||
Royal Dutch Shell PLC, Class B | 35,701 | 784,512 | |||||||||
Financials (1.3%): | |||||||||||
Aegon NV | 263,455 | 1,316,152 | |||||||||
ING Groep NV | 95,720 | 1,332,580 | |||||||||
NN Group NV | 36,520 | 1,977,275 | |||||||||
4,626,007 | |||||||||||
Industrials (0.7%): | |||||||||||
IMCD NV | 4,892 | 1,083,155 | |||||||||
Wolters Kluwer NV | 12,884 | 1,517,919 | |||||||||
2,601,074 | |||||||||||
Information Technology (1.0%): | |||||||||||
ASM International NV | 3,394 | 1,500,253 | |||||||||
| ASML Holding NV | 2,426 | 1,949,684 | |||||||||
3,449,937 | |||||||||||
14,276,369 | |||||||||||
Norway (0.7%): | |||||||||||
Communication Services (0.2%): | |||||||||||
Schibsted ASA, Class B | 19,760 | 665,516 | |||||||||
Materials (0.5%): | |||||||||||
Norsk Hydro ASA | 254,556 | 2,006,819 | |||||||||
2,672,335 | |||||||||||
Singapore (1.3%): | |||||||||||
Consumer Staples (0.7%): | |||||||||||
Wilmar International Ltd. | 759,100 | 2,331,101 | |||||||||
Real Estate (0.6%): | |||||||||||
CapitaLand Integrated Commercial Trust | 62,137 | 94,025 | |||||||||
CapitaLand Investment Ltd. (c) | 859,400 | 2,173,759 | |||||||||
2,267,784 | |||||||||||
4,598,885 | |||||||||||
See notes to financial statements.
33
| Victory Portfolios II VictoryShares USAA MSCI International Value Momentum ETF | Schedule of Portfolio Investments — continued December 31, 2021 | ||||||
(Unaudited)
Security Description | Shares | Value | |||||||||
Spain (2.3%): | |||||||||||
Communication Services (0.5%): | |||||||||||
Telefonica SA | 400,504 | $ | 1,754,411 | ||||||||
Energy (0.4%): | |||||||||||
Repsol SA | 133,041 | 1,578,911 | |||||||||
Financials (1.0%): | |||||||||||
Banco Bilbao Vizcaya Argentaria SA | 221,381 | 1,321,715 | |||||||||
Banco Santander SA | 380,422 | 1,272,111 | |||||||||
CaixaBank SA | 277,332 | 761,335 | |||||||||
3,355,161 | |||||||||||
Utilities (0.4%): | |||||||||||
Naturgy Energy Group SA | 44,501 | 1,448,870 | |||||||||
8,137,353 | |||||||||||
Sweden (4.8%): | |||||||||||
Consumer Discretionary (0.1%): | |||||||||||
Evolution AB (d) | 3,842 | 545,799 | |||||||||
Financials (2.3%): | |||||||||||
EQT AB | 40,264 | 2,192,454 | |||||||||
Industrivarden AB, Class A | 34,684 | 1,104,819 | |||||||||
Investor AB, Class B (a) | 113,122 | 2,913,153 | |||||||||
Kinnevik AB, Class B (c) | 22,608 | 805,926 | |||||||||
L E Lundbergforetagen AB, Class B (a) | 19,146 | 1,074,257 | |||||||||
8,090,609 | |||||||||||
Health Care (0.2%): | |||||||||||
Getinge AB, B Shares | 17,921 | 782,053 | |||||||||
Industrials (1.5%): | |||||||||||
Alfa Laval AB | 46,249 | 1,861,433 | |||||||||
Investment AB Latour, Class B | 31,230 | 1,271,780 | |||||||||
Nibe Industrier AB, Class B | 140,202 | 2,117,621 | |||||||||
5,250,834 | |||||||||||
Information Technology (0.3%): | |||||||||||
Hexagon AB, Class B | 59,116 | 937,945 | |||||||||
Real Estate (0.4%): | |||||||||||
Fastighets AB Balder, Class B (c) | 11,134 | 801,553 | |||||||||
Sagax AB, Class B | 21,636 | 728,859 | |||||||||
1,530,412 | |||||||||||
17,137,652 | |||||||||||
Switzerland (3.5%): | |||||||||||
Consumer Discretionary (0.9%): | |||||||||||
Cie Financiere Richemont SA, Registered Shares | 14,838 | 2,230,219 | |||||||||
The Swatch Group AG | 17,903 | 1,050,228 | |||||||||
3,280,447 | |||||||||||
See notes to financial statements.
34
| Victory Portfolios II VictoryShares USAA MSCI International Value Momentum ETF | Schedule of Portfolio Investments — continued December 31, 2021 | ||||||
(Unaudited)
Security Description | Shares | Value | |||||||||
Health Care (1.1%): | |||||||||||
Alcon, Inc. | 13,292 | $ | 1,177,848 | ||||||||
Bachem Holding AG, Registered Shares | 1,210 | 950,842 | |||||||||
Sonova Holding AG | 2,360 | 926,750 | |||||||||
Straumann Holding AG, Class R | 461 | 980,033 | |||||||||
4,035,473 | |||||||||||
Industrials (1.0%): | |||||||||||
Kuehne + Nagel International AG, Class R | 7,907 | 2,554,816 | |||||||||
VAT Group AG (d) | 1,756 | 875,736 | |||||||||
3,430,552 | |||||||||||
Materials (0.5%): | |||||||||||
Glencore PLC | 332,330 | 1,687,734 | |||||||||
12,434,206 | |||||||||||
United Kingdom (10.8%): | |||||||||||
Communication Services (1.7%): | |||||||||||
BT Group PLC | 730,469 | 1,677,493 | |||||||||
Pearson PLC | 90,087 | 748,214 | |||||||||
Vodafone Group PLC | 1,231,626 | 1,872,687 | |||||||||
WPP PLC | 118,549 | 1,797,559 | |||||||||
6,095,953 | |||||||||||
Consumer Discretionary (1.2%): | |||||||||||
Barratt Developments PLC | 72,771 | 737,261 | |||||||||
Entain PLC (c) | 21,566 | 491,603 | |||||||||
Kingfisher PLC | 372,006 | 1,704,564 | |||||||||
Stellantis NV | 75,551 | 1,433,609 | |||||||||
4,367,037 | |||||||||||
Consumer Staples (2.9%): | |||||||||||
British American Tobacco PLC | 57,377 | 2,124,311 | |||||||||
Coca-Cola Europacific Partners PLC | 16,433 | 919,098 | |||||||||
Imperial Brands PLC | 90,186 | 1,974,586 | |||||||||
J Sainsbury PLC | 558,719 | 2,087,127 | |||||||||
Tesco PLC | 793,971 | 3,117,555 | |||||||||
10,222,677 | |||||||||||
Financials (1.8%): | |||||||||||
| 3i Group PLC | 53,007 | 1,040,310 | |||||||||
Aviva PLC | 151,621 | 842,807 | |||||||||
Barclays PLC | 563,106 | 1,426,241 | |||||||||
Lloyds Banking Group PLC | 1,239,474 | 802,466 | |||||||||
NatWest Group PLC | 482,655 | 1,475,468 | |||||||||
Standard Chartered PLC | 135,883 | 825,262 | |||||||||
6,412,554 | |||||||||||
See notes to financial statements.
35
| Victory Portfolios II VictoryShares USAA MSCI International Value Momentum ETF | Schedule of Portfolio Investments — continued December 31, 2021 | ||||||
(Unaudited)
Security Description | Shares | Value | |||||||||
Industrials (0.7%): | |||||||||||
Ashtead Group PLC | 9,346 | $ | 752,177 | ||||||||
| CNH Industrial NV | 88,460 | 1,717,191 | |||||||||
2,469,368 | |||||||||||
Materials (1.6%): | |||||||||||
Anglo American PLC | 36,541 | 1,492,702 | |||||||||
Croda International PLC | 11,559 | 1,584,390 | |||||||||
Evraz PLC (b) | 193,560 | 1,577,192 | |||||||||
Rio Tinto PLC | 14,522 | 962,219 | |||||||||
5,616,503 | |||||||||||
Real Estate (0.9%): | |||||||||||
Segro PLC | 170,164 | 3,310,812 | |||||||||
38,494,904 | |||||||||||
United States (0.4%): | |||||||||||
Health Care (0.4%): | |||||||||||
Bausch Health Cos., Inc. (c) | 45,996 | 1,272,296 | |||||||||
Total Common Stocks (Cost $316,504,031) | 352,862,681 | ||||||||||
Collateral for Securities Loaned^ (0.8%) | |||||||||||
United States (0.8%): | |||||||||||
BlackRock Liquidity Funds TempFund, Institutional Shares, 0.04% (f) | 69,976 | 69,976 | |||||||||
| Fidelity Investments Money Market Government Portfolio, Institutional Shares, 0.01% (f) | 1,374,335 | 1,374,335 | |||||||||
| Goldman Sachs Financial Square Prime Obligations Fund, Institutional Shares, 0.02% (f) | 34,921 | 34,921 | |||||||||
JPMorgan Prime Money Market Fund, Capital Shares, 0.07% (f) | 278,453 | 278,453 | |||||||||
| Morgan Stanley Institutional Liquidity Prime Portfolio, Institutional Shares, 0.06% (f) | 1,251,977 | 1,251,977 | |||||||||
Total Collateral for Securities Loaned (Cost $3,009,662) | 3,009,662 | ||||||||||
Total Investments (Cost $319,513,693) — 100.2% | 355,872,343 | ||||||||||
Liabilities in excess of other assets — (0.2)% | (866,087 | ) | |||||||||
NET ASSETS — 100.00% | $ | 355,006,256 | |||||||||
^ Purchased with cash collateral from securities on loan.
(a) All or a portion of this security is on loan.
(b) All or a portion of this security has been segregated as collateral for derivative instruments.
(c) Non-income producing security.
(d) Rule 144A security or other security that is restricted as to resale to institutional investors. The Fund's Adviser has deemed this security to be liquid (unless otherwise noted as illiquid) based upon procedures approved by the Board of Trustees. As of December 31, 2021, the fair value of these securities was $4,852,904 and amounted to 1.4% of net assets.
(e) Security was fair valued based upon procedures approved by the Board of Trustees and represents 0.3% of net assets as of December 31, 2021. (See Note 2 in the Notes to Financial Statements)
See notes to financial statements.
36
| Victory Portfolios II VictoryShares USAA MSCI International Value Momentum ETF | Schedule of Portfolio Investments — continued December 31, 2021 | ||||||
(Unaudited)
(f) Rate disclosed is the daily yield on December 31, 2021.
ADR — American Depositary Receipt
PLC — Public Limited Company
Futures Contracts Purchased
| Number of Contracts | Expiration Date | Notional Amount | Value | Unrealized Appreciation (Depreciation) | |||||||||||||||||||
E-Mini MSCI EAFE Index Futures | 11 | 3/18/22 | $ | 1,256,434 | $ | 1,276,990 | $ | 20,556 | |||||||||||||||
Total unrealized appreciation | $ | 20,556 | |||||||||||||||||||||
Total unrealized depreciation | — | ||||||||||||||||||||||
Total net unrealized appreciation (depreciation) | $ | 20,556 | |||||||||||||||||||||
See notes to financial statements.
37
| Victory Portfolios II VictoryShares USAA MSCI Emerging Markets Value Momentum ETF | Schedule of Portfolio Investments December 31, 2021 | ||||||
(Unaudited)
Security Description | Shares | Value | |||||||||
Common Stocks (99.4%) | |||||||||||
Brazil (2.5%): | |||||||||||
Communication Services (0.4%): | |||||||||||
Telefonica Brasil SA | 111,800 | $ | 967,261 | ||||||||
Consumer Staples (0.5%): | |||||||||||
JBS SA | 164,552 | 1,121,140 | |||||||||
Financials (0.1%): | |||||||||||
Banco Inter SA | 46,100 | 236,459 | |||||||||
Materials (1.2%): | |||||||||||
Bradespar SA, Preference Shares | 1 | 4 | |||||||||
Braskem SA, Preference Shares | 31,900 | 330,053 | |||||||||
Cia Siderurgica Nacional SA | 161,800 | 725,922 | |||||||||
Vale SA | 127,092 | 1,778,832 | |||||||||
2,834,811 | |||||||||||
Utilities (0.3%): | |||||||||||
Centrais Eletricas Brasileiras SA | 122,848 | 736,867 | |||||||||
| 5,896,538 | ||||||||||
Chile (0.4%): | |||||||||||
Consumer Staples (0.4%): | |||||||||||
Cencosud SA | 627,977 | 1,050,314 | |||||||||
China (19.8%): | |||||||||||
Communication Services (0.4%): | |||||||||||
Hello Group, Inc., ADR | 64,258 | 577,037 | |||||||||
JOYY, Inc., ADR | 6,593 | 299,520 | |||||||||
| 876,557 | ||||||||||
Consumer Discretionary (1.6%): | |||||||||||
Brilliance China Automotive Holdings Ltd. (a) (b) (c) | 937,510 | 702,264 | |||||||||
BYD Co. Ltd., Class H | 11,489 | 392,874 | |||||||||
Dongfeng Motor Group Co. Ltd., Class H | 1,007,069 | 837,039 | |||||||||
Great Wall Motor Co. Ltd., Class H | 168,621 | 579,639 | |||||||||
Guangzhou Automobile Group Co. Ltd. | 958,228 | 945,163 | |||||||||
Li Ning Co. Ltd. | 38,000 | 416,005 | |||||||||
| 3,872,984 | ||||||||||
Energy (2.0%): | |||||||||||
China Coal Energy Co. Ltd., Class H | 1,018,000 | 587,586 | |||||||||
China Shenhua Energy Co. Ltd., Class H | 400,485 | 939,018 | |||||||||
China Suntien Green Energy Corp. Ltd., Class H | 569,000 | 443,739 | |||||||||
PetroChina Co. Ltd., Class H | 3,076,000 | 1,369,075 | |||||||||
Yankuang Energy Group Co. Ltd., Class H (d) | 706,574 | 1,404,756 | |||||||||
| 4,744,174 | ||||||||||
Financials (7.6%): | |||||||||||
360 DigiTech, Inc., ADR | 62,844 | 1,441,013 | |||||||||
Agricultural Bank of China Ltd., Class H (e) | 5,498,716 | 1,890,199 | |||||||||
See notes to financial statements.
38
| Victory Portfolios II VictoryShares USAA MSCI Emerging Markets Value Momentum ETF | Schedule of Portfolio Investments — continued December 31, 2021 | ||||||
(Unaudited)
Security Description | Shares | Value | |||||||||
Bank of China Ltd., Class H (d) (e) | 6,307,421 | $ | 2,273,367 | ||||||||
Bank of Communications Co. Ltd., Class H | 3,201,181 | 1,933,938 | |||||||||
China Cinda Asset Management Co. Ltd., Class H | 7,868,733 | 1,433,193 | |||||||||
China CITIC Bank Corp. Ltd., Class H | 4,082,138 | 1,769,766 | |||||||||
China Construction Bank Corp., Class H (e) | 2,666,416 | 1,846,856 | |||||||||
China Everbright Bank Co. Ltd., Class H | 4,072,267 | 1,441,640 | |||||||||
China Galaxy Securities Co. Ltd., Class H | 1,888,479 | 1,085,179 | |||||||||
China Huarong Asset Management Co. Ltd., Class H (a) (b) (c) (f) | 9,215,577 | 602,843 | |||||||||
China Minsheng Banking Corp. Ltd., Class H (d) | 4,225,374 | 1,615,076 | |||||||||
Industrial & Commercial Bank of China Ltd., Class H (d) | 1,558,962 | 879,832 | |||||||||
18,212,902 | |||||||||||
Health Care (2.6%): | |||||||||||
3SBio, Inc. (a) (f) | 458,000 | 381,848 | |||||||||
Cansino Biologics, Inc., Class H (a) (d) (f) | 33,273 | 769,057 | |||||||||
China Medical System Holdings Ltd. | 425,866 | 711,206 | |||||||||
Genscript Biotech Corp. (a) | 144,000 | 637,225 | |||||||||
I-Mab, ADR (a) | 7,859 | 372,438 | |||||||||
Pharmaron Beijing Co. Ltd., Class H (f) | 22,354 | 344,931 | |||||||||
Shanghai Fosun Pharmaceutical Group Co. Ltd., Class H | 66,500 | 292,995 | |||||||||
Shanghai Pharmaceuticals Holding Co. Ltd. | 809,322 | 1,534,289 | |||||||||
Sinopharm Group Co. Ltd., Class H | 494,890 | 1,076,579 | |||||||||
6,120,568 | |||||||||||
Industrials (2.3%): | |||||||||||
China Railway Group Ltd., Class H | 3,014,431 | 1,592,994 | |||||||||
China State Construction International Holdings Ltd. | 1,114,000 | 1,384,588 | |||||||||
COSCO SHIPPING Holdings Co. Ltd., Class H (a) | 459,907 | 891,935 | |||||||||
Country Garden Services Holdings Co. Ltd. | 69,696 | 417,480 | |||||||||
Fosun International Ltd. | 1,120,029 | 1,208,194 | |||||||||
5,495,191 | |||||||||||
Materials (1.5%): | |||||||||||
Aluminum Corp. of China Ltd., Class H (a) | 1,430,000 | 790,542 | |||||||||
China Hongqiao Group Ltd. | 772,711 | 815,696 | |||||||||
China National Building Material Co. Ltd., Class H | 731,535 | 897,025 | |||||||||
Dongyue Group Ltd. | 154,000 | 240,196 | |||||||||
Jiangxi Copper Co. Ltd., Class H | 569,929 | 912,319 | |||||||||
3,655,778 | |||||||||||
Utilities (1.8%): | |||||||||||
China Longyuan Power Group Corp. Ltd., Class H | 415,183 | 969,220 | |||||||||
China Power International Development Ltd. | 3,707,269 | 2,496,461 | |||||||||
Huaneng Power International, Inc., Class H | 1,243,183 | 830,777 | |||||||||
4,296,458 | |||||||||||
47,274,612 | |||||||||||
Cyprus (0.5%): | |||||||||||
Financials (0.5%): | |||||||||||
TCS Group Holding PLC, GDR | 15,820 | 1,287,135 | |||||||||
See notes to financial statements.
39
| Victory Portfolios II VictoryShares USAA MSCI Emerging Markets Value Momentum ETF | Schedule of Portfolio Investments — continued December 31, 2021 | ||||||
(Unaudited)
Security Description | Shares | Value | |||||||||
Greece (1.0%): | |||||||||||
Communication Services (0.3%): | |||||||||||
Hellenic Telecommunications Organization SA | 40,759 | $ | 753,440 | ||||||||
Consumer Discretionary (0.3%): | |||||||||||
FF Group (a) (b) (c) | 14,913 | 4,070 | |||||||||
OPAP SA | 38,316 | 543,357 | |||||||||
547,427 | |||||||||||
Financials (0.4%): | |||||||||||
Alpha Services and Holdings SA (a) | 237,897 | 291,369 | |||||||||
Eurobank Ergasias Services and Holdings SA (a) | 690,895 | 700,362 | |||||||||
991,731 | |||||||||||
2,292,598 | |||||||||||
Hong Kong (7.6%): | |||||||||||
Energy (0.2%): | |||||||||||
Kunlun Energy Co. Ltd. | 554,000 | 519,444 | |||||||||
Financials (0.3%): | |||||||||||
Far East Horizon Ltd. (d) | 680,586 | 604,089 | |||||||||
Health Care (0.6%): | |||||||||||
China Traditional Chinese Medicine Holdings Co. Ltd. | 2,256,525 | 1,496,381 | |||||||||
Industrials (2.3%): | |||||||||||
China Everbright Environment Group Ltd. | 1,772,652 | 1,423,342 | |||||||||
China Merchants Port Holdings Co. Ltd. | 924,514 | 1,683,888 | |||||||||
CITIC Ltd. | 1,562,682 | 1,543,380 | |||||||||
Sinotruk Hong Kong Ltd. | 523,775 | 806,190 | |||||||||
5,456,800 | |||||||||||
Information Technology (0.9%): | |||||||||||
Kingboard Holdings Ltd. | 233,314 | 1,135,701 | |||||||||
Kingboard Laminates Holdings Ltd. | 235,077 | 399,821 | |||||||||
Lenovo Group Ltd. | 499,516 | 574,075 | |||||||||
2,109,597 | |||||||||||
Materials (0.3%): | |||||||||||
Nine Dragons Paper Holdings Ltd. | 778,940 | 836,259 | |||||||||
Real Estate (1.5%): | |||||||||||
China Overseas Property Holdings Ltd. | 1,005,000 | 1,066,063 | |||||||||
The Wharf Holdings Ltd. | 304,783 | 936,284 | |||||||||
Yuexiu Property Co. Ltd. | 1,666,086 | 1,468,134 | |||||||||
3,470,481 | |||||||||||
Utilities (1.5%): | |||||||||||
Beijing Enterprises Holdings Ltd. | 496,847 | 1,714,298 | |||||||||
China Resources Power Holdings Co. Ltd. | 580,209 | 1,942,390 | |||||||||
3,656,688 | |||||||||||
18,149,739 | |||||||||||
See notes to financial statements.
40
| Victory Portfolios II VictoryShares USAA MSCI Emerging Markets Value Momentum ETF | Schedule of Portfolio Investments — continued December 31, 2021 | ||||||
(Unaudited)
Security Description | Shares | Value | |||||||||
Hungary (1.3%): | |||||||||||
Energy (0.6%): | |||||||||||
MOL Hungarian Oil & Gas PLC | 196,447 | $ | 1,527,456 | ||||||||
Health Care (0.7%): | |||||||||||
Richter Gedeon Nyrt | 61,118 | 1,645,346 | |||||||||
3,172,802 | |||||||||||
India (10.0%): | |||||||||||
Consumer Discretionary (0.6%): | |||||||||||
Tata Motors Ltd. (a) | 135,899 | 881,914 | |||||||||
Titan Co. Ltd. | 18,456 | 626,260 | |||||||||
1,508,174 | |||||||||||
Consumer Staples (0.8%): | |||||||||||
Avenue Supermarts Ltd. (a) (f) | 8,246 | 518,201 | |||||||||
Marico Ltd. | 119,572 | 824,619 | |||||||||
United Spirits Ltd. (a) | 52,601 | 635,615 | |||||||||
1,978,435 | |||||||||||
Energy (0.7%): | |||||||||||
Indian Oil Corp. Ltd. | 387,870 | 581,787 | |||||||||
Oil & Natural Gas Corp. Ltd. | 606,737 | 1,162,287 | |||||||||
1,744,074 | |||||||||||
Financials (0.6%): | |||||||||||
Bajaj Finserv Ltd. | 2,125 | 468,997 | |||||||||
State Bank of India | 157,067 | 972,904 | |||||||||
1,441,901 | |||||||||||
Health Care (1.0%): | |||||||||||
Apollo Hospitals Enterprise Ltd. | 17,176 | 1,158,396 | |||||||||
Divi's Laboratories Ltd. | 9,665 | 608,252 | |||||||||
Sun Pharmaceutical Industries Ltd. | 58,313 | 663,414 | |||||||||
2,430,062 | |||||||||||
Industrials (0.8%): | |||||||||||
Adani Enterprises Ltd. | 36,086 | 829,847 | |||||||||
Bharat Electronics Ltd. | 174,604 | 493,143 | |||||||||
Indian Railway Catering & Tourism Corp. Ltd. | 44,810 | 501,384 | |||||||||
1,824,374 | |||||||||||
Information Technology (1.4%): | |||||||||||
Larsen & Toubro Infotech Ltd. (f) | 6,081 | 599,791 | |||||||||
Mindtree Ltd. | 8,840 | 568,438 | |||||||||
Mphasis Ltd. | 14,375 | 656,853 | |||||||||
Tech Mahindra Ltd. | 34,142 | 822,391 | |||||||||
Wipro Ltd. | 80,026 | 770,110 | |||||||||
3,417,583 | |||||||||||
See notes to financial statements.
41
| Victory Portfolios II VictoryShares USAA MSCI Emerging Markets Value Momentum ETF | Schedule of Portfolio Investments — continued December 31, 2021 | ||||||
(Unaudited)
Security Description | Shares | Value | |||||||||
Materials (2.1%): | |||||||||||
Grasim Industries Ltd. | 24,957 | $ | 544,644 | ||||||||
Hindalco Industries Ltd. | 153,387 | 981,268 | |||||||||
JSW Steel Ltd. | 106,783 | 942,271 | |||||||||
SRF Ltd. | 21,173 | 689,316 | |||||||||
Tata Steel Ltd. | 57,276 | 856,378 | |||||||||
Vedanta Ltd. | 199,877 | 917,434 | |||||||||
4,931,311 | |||||||||||
Real Estate (0.6%): | |||||||||||
DLF Ltd. | 180,984 | 950,623 | |||||||||
Godrej Properties Ltd. (a) | 15,486 | 389,944 | |||||||||
1,340,567 | |||||||||||
Utilities (1.4%): | |||||||||||
Adani Total Gas Ltd. | 57,889 | 1,340,854 | |||||||||
Adani Transmission Ltd. (a) | 36,606 | 857,268 | |||||||||
NTPC Ltd. | 449,789 | 752,717 | |||||||||
The Tata Power Co. Ltd. | 145,073 | 431,205 | |||||||||
3,382,044 | |||||||||||
23,998,525 | |||||||||||
Indonesia (1.2%): | |||||||||||
Communication Services (0.2%): | |||||||||||
PT Tower Bersama Infrastructure Tbk | 2,038,000 | 421,828 | |||||||||
Consumer Staples (1.0%): | |||||||||||
PT Gudang Garam Tbk | 506,080 | 1,086,549 | |||||||||
PT Indofood Sukses Makmur Tbk | 2,952,881 | 1,310,435 | |||||||||
2,396,984 | |||||||||||
2,818,812 | |||||||||||
Isle of Man (0.2%): | |||||||||||
Real Estate (0.2%): | |||||||||||
NEPI Rockcastle PLC | 83,338 | 553,498 | |||||||||
Korea, Republic Of (19.3%): | |||||||||||
Communication Services (2.8%): | |||||||||||
HYBE Co. Ltd. (a) | 1,719 | 504,674 | |||||||||
Kakao Corp. | 4,569 | 432,398 | |||||||||
Kakao Games Corp. (a) | 6,529 | 499,802 | |||||||||
LG Uplus Corp. | 118,692 | 1,357,906 | |||||||||
NAVER Corp. | 3,775 | 1,201,966 | |||||||||
Pearl Abyss Corp. (a) | 11,709 | 1,362,233 | |||||||||
SK Telecom Co. Ltd. | 25,667 | 1,250,153 | |||||||||
6,609,132 | |||||||||||
Consumer Discretionary (2.7%): | |||||||||||
CJ ENM Co. Ltd. | 3,842 | 448,597 | |||||||||
F&F Co. Ltd. (a) | 507 | 403,041 | |||||||||
See notes to financial statements.
42
| Victory Portfolios II VictoryShares USAA MSCI Emerging Markets Value Momentum ETF | Schedule of Portfolio Investments — continued December 31, 2021 | ||||||
(Unaudited)
Security Description | Shares | Value | |||||||||
Hankook Tire & Technology Co. Ltd. | 27,884 | $ | 931,226 | ||||||||
Hyundai Mobis Co. Ltd. | 4,462 | 955,271 | |||||||||
Hyundai Motor Co. | 5,378 | 945,533 | |||||||||
Kia Corp. | 13,798 | 954,108 | |||||||||
LG Electronics, Inc. | 8,787 | 1,020,068 | |||||||||
Lotte Shopping Co. Ltd. | 12,551 | 920,671 | |||||||||
6,578,515 | |||||||||||
Consumer Staples (2.0%): | |||||||||||
BGF Retail Co. Ltd. | 4,491 | 549,687 | |||||||||
CJ CheilJedang Corp. | 3,647 | 1,188,822 | |||||||||
E-MART, Inc. | 8,481 | 1,077,292 | |||||||||
KT&G Corp. | 30,718 | 2,041,407 | |||||||||
4,857,208 | |||||||||||
Energy (0.9%): | |||||||||||
GS Holdings Corp. | 49,774 | 1,637,151 | |||||||||
S-Oil Corp. | 8,514 | 613,796 | |||||||||
2,250,947 | |||||||||||
Financials (4.7%): | |||||||||||
DB Insurance Co. Ltd. | 24,570 | 1,116,114 | |||||||||
Hana Financial Group, Inc. | 31,295 | 1,107,007 | |||||||||
Industrial Bank of Korea | 154,074 | 1,334,984 | |||||||||
KB Financial Group, Inc. | 28,296 | 1,309,173 | |||||||||
Korea Investment Holdings Co. Ltd. | 5,782 | 392,519 | |||||||||
Meritz Securities Co. Ltd. | 288,866 | 1,251,449 | |||||||||
NH Investment & Securities Co. Ltd. | 59,104 | 621,493 | |||||||||
Samsung Securities Co. Ltd. | 32,129 | 1,213,537 | |||||||||
Shinhan Financial Group Co. Ltd. | 42,780 | 1,324,336 | |||||||||
Woori Financial Group, Inc. | 140,604 | 1,502,142 | |||||||||
11,172,754 | |||||||||||
Health Care (0.1%): | |||||||||||
Seegene, Inc. | 4,725 | 242,461 | |||||||||
Industrials (2.0%): | |||||||||||
Doosan Bobcat, Inc. (a) | 14,143 | 484,818 | |||||||||
Ecopro BM Co. Ltd. | 1,019 | 429,287 | |||||||||
GS Engineering & Construction Corp. | 31,059 | 1,034,647 | |||||||||
HMM Co. Ltd. (a) | 26,124 | 591,155 | |||||||||
Hyundai Engineering & Construction Co. Ltd. | 25,212 | 942,732 | |||||||||
Hyundai Heavy Industries Holdings Co. Ltd. | 10,161 | 459,008 | |||||||||
LG Corp. | 6,387 | 434,665 | |||||||||
Pan Ocean Co. Ltd. | 82,967 | 377,583 | |||||||||
4,753,895 | |||||||||||
Information Technology (2.0%): | |||||||||||
L&F Co. Ltd. | 1,568 | 293,353 | |||||||||
LG Display Co. Ltd. (a) | 56,586 | 1,170,991 | |||||||||
LG Innotek Co. Ltd. | 5,214 | 1,596,548 | |||||||||
See notes to financial statements.
43
| Victory Portfolios II VictoryShares USAA MSCI Emerging Markets Value Momentum ETF | Schedule of Portfolio Investments — continued December 31, 2021 | ||||||
(Unaudited)
Security Description | Shares | Value | |||||||||
SK Hynix, Inc. | 12,479 | $ | 1,375,183 | ||||||||
SK Square Co. Ltd. (a) | 6,732 | 376,029 | |||||||||
4,812,104 | |||||||||||
Materials (1.6%): | |||||||||||
Hyundai Steel Co. | 23,518 | 811,136 | |||||||||
Kumho Petrochemical Co. Ltd. | 5,488 | 766,358 | |||||||||
Lotte Chemical Corp. | 5,719 | 1,043,973 | |||||||||
POSCO | 4,832 | 1,115,780 | |||||||||
3,737,247 | |||||||||||
Utilities (0.5%): | |||||||||||
Korea Electric Power Corp. | 67,703 | 1,258,663 | |||||||||
46,272,926 | |||||||||||
Malaysia (1.4%): | |||||||||||
Consumer Discretionary (0.5%): | |||||||||||
Genting Bhd | 1,064,700 | 1,193,507 | |||||||||
Financials (0.4%): | |||||||||||
CIMB Group Holdings Bhd | 714,400 | 934,585 | |||||||||
Health Care (0.5%): | |||||||||||
IHH Healthcare Bhd | 668,200 | 1,177,289 | |||||||||
3,305,381 | |||||||||||
Mexico (3.4%): | |||||||||||
Communication Services (0.6%): | |||||||||||
America Movil SAB de CV, Class L | 971,810 | 1,029,981 | |||||||||
Grupo Televisa SAB | 177,145 | 333,688 | |||||||||
1,363,669 | |||||||||||
Consumer Staples (2.8%): | |||||||||||
Arca Continental SAB de CV (d) | 342,696 | 2,185,618 | |||||||||
Coca-Cola Femsa SAB de CV | 159,370 | 869,857 | |||||||||
Fomento Economico Mexicano Sab de CV | 216,089 | 1,682,253 | |||||||||
Grupo Bimbo SAB de CV, Class A | 655,692 | 2,017,539 | |||||||||
6,755,267 | |||||||||||
8,118,936 | |||||||||||
Poland (3.8%): | |||||||||||
Communication Services (1.1%): | |||||||||||
Cyfrowy Polsat SA | 163,852 | 1,411,508 | |||||||||
Orange Polska SA (a) | 530,574 | 1,112,383 | |||||||||
2,523,891 | |||||||||||
Consumer Discretionary (0.5%): | |||||||||||
LPP SA | 308 | 1,314,411 | |||||||||
See notes to financial statements.
44
| Victory Portfolios II VictoryShares USAA MSCI Emerging Markets Value Momentum ETF | Schedule of Portfolio Investments — continued December 31, 2021 | ||||||
(Unaudited)
Security Description | Shares | Value | |||||||||
Energy (0.9%): | |||||||||||
Polski Koncern Naftowy ORLEN SA | 57,693 | $ | 1,064,137 | ||||||||
Polskie Gornictwo Naftowe i Gazownictwo SA | 722,460 | 1,129,292 | |||||||||
2,193,429 | |||||||||||
Financials (1.0%): | |||||||||||
Bank Polska Kasa Opieki SA | 42,110 | 1,274,667 | |||||||||
Powszechna Kasa Oszczednosci Bank Polski SA (a) | 57,587 | 641,967 | |||||||||
Santander Bank Polska SA | 5,965 | 515,781 | |||||||||
2,432,415 | |||||||||||
Utilities (0.3%): | |||||||||||
PGE Polska Grupa Energetyczna SA (a) | 299,246 | 598,581 | |||||||||
9,062,727 | |||||||||||
Russian Federation (2.5%): | |||||||||||
Consumer Staples (0.2%): | |||||||||||
Magnit PJSC, GDR | 32,007 | 480,105 | |||||||||
Energy (0.6%): | |||||||||||
Gazprom PJSC | 323,772 | 1,481,803 | |||||||||
Financials (0.3%): | |||||||||||
Sberbank of Russia PJSC | 177,348 | 694,248 | |||||||||
Materials (0.9%): | |||||||||||
PhosAgro PJSC, GDR (e) | 34,984 | 754,955 | |||||||||
Severstal PAO | 37,439 | 801,228 | |||||||||
United Co. RUSAL International PJSC (a) | 553,950 | 546,518 | |||||||||
2,102,701 | |||||||||||
Utilities (0.5%): | |||||||||||
Inter RAO UES PJSC | 23,404,572 | 1,333,169 | |||||||||
6,092,026 | |||||||||||
South Africa (2.7%): | |||||||||||
Communication Services (0.4%): | |||||||||||
MTN Group Ltd. (a) | 89,621 | 958,597 | |||||||||
Consumer Discretionary (0.2%): | |||||||||||
Pepkor Holdings Ltd. (a) (f) | 309,278 | 424,191 | |||||||||
Consumer Staples (0.3%): | |||||||||||
Shoprite Holdings Ltd. | 51,661 | 676,125 | |||||||||
Energy (0.4%): | |||||||||||
Exxaro Resources Ltd. | 99,585 | 953,857 | |||||||||
Health Care (0.4%): | |||||||||||
Aspen Pharmacare Holdings Ltd. | 71,376 | 1,003,736 | |||||||||
See notes to financial statements.
45
| Victory Portfolios II VictoryShares USAA MSCI Emerging Markets Value Momentum ETF | Schedule of Portfolio Investments — continued December 31, 2021 | ||||||
(Unaudited)
Security Description | Shares | Value | |||||||||
Materials (1.0%): | |||||||||||
African Rainbow Minerals Ltd. | 68,227 | $ | 988,437 | ||||||||
Impala Platinum Holdings Ltd. | 46,286 | 652,528 | |||||||||
Sasol Ltd. (a) | 36,283 | 588,803 | |||||||||
Sibanye Stillwater Ltd. | 87,400 | 268,881 | |||||||||
2,498,649 | |||||||||||
6,515,155 | |||||||||||
Taiwan (17.3%): | |||||||||||
Consumer Discretionary (1.0%): | |||||||||||
momo.com, Inc. | 17,000 | 998,482 | |||||||||
Pou Chen Corp. | 1,181,000 | 1,415,049 | |||||||||
2,413,531 | |||||||||||
Financials (4.9%): | |||||||||||
Cathay Financial Holding Co. Ltd. | 517,000 | 1,167,908 | |||||||||
Chailease Holding Co. Ltd. | 83,000 | 790,490 | |||||||||
China Development Financial Holding Corp. | 3,556,000 | 2,249,250 | |||||||||
Fubon Financial Holding Co. Ltd. | 692,100 | 1,908,672 | |||||||||
Shin Kong Financial Holding Co. Ltd. | 2,079,000 | 830,338 | |||||||||
SinoPac Financial Holdings Co. Ltd. | 2,318,000 | 1,353,081 | |||||||||
Taishin Financial Holding Co. Ltd. | 3,350,768 | 2,295,046 | |||||||||
Yuanta Financial Holding Co. Ltd. | 1,141,656 | 1,043,984 | |||||||||
11,638,769 | |||||||||||
Industrials (1.0%): | |||||||||||
Evergreen Marine Corp. Ltd. | 173,000 | 891,043 | |||||||||
Wan Hai Lines Ltd. | 111,900 | 802,839 | |||||||||
Yang Ming Marine Transport Corp. (a) | 140,000 | 612,282 | |||||||||
2,306,164 | |||||||||||
Information Technology (9.4%): | |||||||||||
Acer, Inc. | 1,530,000 | 1,683,901 | |||||||||
ASE Technology Holding Co. Ltd. | 294,000 | 1,131,709 | |||||||||
Asustek Computer, Inc. | 134,000 | 1,821,086 | |||||||||
AU Optronics Corp. | 1,227,000 | 1,015,589 | |||||||||
Catcher Technology Co. Ltd. | 106,000 | 599,595 | |||||||||
Compal Electronics, Inc. (e) | 2,609,000 | 2,282,062 | |||||||||
eMemory Technology, Inc. | 4,000 | 316,623 | |||||||||
Foxconn Technology Co. Ltd. | 579,000 | 1,358,192 | |||||||||
Hon Hai Precision Industry Co. Ltd. | 387,000 | 1,454,729 | |||||||||
Innolux Corp. | 1,293,000 | 915,994 | |||||||||
Lite-On Technology Corp. | 851,000 | 1,962,403 | |||||||||
Nan Ya Printed Circuit Board Corp. | 44,000 | 909,676 | |||||||||
Synnex Technology International Corp. | 1,021,000 | 2,442,990 | |||||||||
Unimicron Technology Corp. | 81,000 | 676,293 | |||||||||
United Microelectronics Corp. | 463,142 | 1,088,092 | |||||||||
Winbond Electronics Corp. | 412,000 | 506,307 | |||||||||
WPG Holdings Ltd. (e) | 1,243,000 | 2,363,169 | |||||||||
22,528,410 | |||||||||||
See notes to financial statements.
46
| Victory Portfolios II VictoryShares USAA MSCI Emerging Markets Value Momentum ETF | Schedule of Portfolio Investments — continued December 31, 2021 | ||||||
(Unaudited)
Security Description | Shares | Value | |||||||||
Materials (0.3%): | |||||||||||
China Steel Corp. | 636,000 | $ | 812,614 | ||||||||
Real Estate (0.7%): | |||||||||||
Ruentex Development Co. Ltd. | 699,000 | 1,611,892 | |||||||||
41,311,380 | |||||||||||
Thailand (1.5%): | |||||||||||
Consumer Staples (1.1%): | |||||||||||
Charoen Pokphand Foods PCL | 1,890,900 | 1,443,435 | |||||||||
Thai Union Group PCL | 2,169,800 | 1,266,610 | |||||||||
2,710,045 | |||||||||||
Health Care (0.3%): | |||||||||||
Sri Trang Gloves Thailand PCL | 690,500 | 625,284 | |||||||||
Information Technology (0.1%): | |||||||||||
Delta Electronics Thailand PCL | 15,950 | 196,719 | |||||||||
3,532,048 | |||||||||||
Turkey (1.8%): | |||||||||||
Communication Services (0.2%): | |||||||||||
Turkcell Iletisim Hizmetleri A/S | 454,675 | 632,038 | |||||||||
Financials (0.9%): | |||||||||||
Akbank TAS | 800,606 | 434,072 | |||||||||
Turkiye Garanti Bankasi A/S | 892,704 | 757,602 | |||||||||
Turkiye Is Bankasi A/S | 1,654,540 | 895,811 | |||||||||
2,087,485 | |||||||||||
Industrials (0.2%): | |||||||||||
KOC Holding AS | 231,201 | 494,097 | |||||||||
Materials (0.5%): | |||||||||||
Eregli Demir ve Celik Fabrikalari TAS | 550,385 | 1,167,103 | |||||||||
4,380,723 | |||||||||||
United Arab Emirates (1.0%): | |||||||||||
Communication Services (0.5%): | |||||||||||
Emirates Telecommunications Group Co. PJSC | 139,822 | 1,206,724 | |||||||||
Real Estate (0.5%): | |||||||||||
Aldar Properties PJSC | 1,062,426 | 1,154,103 | |||||||||
2,360,827 | |||||||||||
United States (0.2%): | |||||||||||
Health Care (0.2%): | |||||||||||
Legend Biotech Corp., ADR (a) | 8,086 | 376,888 | |||||||||
Total Common Stocks (Cost $215,196,045) | 237,823,590 | ||||||||||
See notes to financial statements.
47
| Victory Portfolios II VictoryShares USAA MSCI Emerging Markets Value Momentum ETF | Schedule of Portfolio Investments — continued December 31, 2021 | ||||||
(Unaudited)
Security Description | Shares | Value | |||||||||
Collateral for Securities Loaned^ (1.2%) | |||||||||||
United States (1.2%): | |||||||||||
BlackRock Liquidity Funds TempFund, Institutional Shares, 0.04% (g) | 64,235 | $ | 64,235 | ||||||||
| Fidelity Investments Money Market Government Portfolio, Institutional Shares, 0.01% (g) | 1,261,575 | 1,261,575 | |||||||||
| Goldman Sachs Financial Square Prime Obligations Fund, Institutional Shares, 0.02% (g) | 32,056 | 32,056 | |||||||||
JPMorgan Prime Money Market Fund, Capital Shares, 0.07% (g) | 255,606 | 255,606 | |||||||||
| Morgan Stanley Institutional Liquidity Prime Portfolio, Institutional Shares, 0.06% (g) | 1,149,255 | 1,149,255 | |||||||||
Total Collateral for Securities Loaned (Cost $2,762,727) | 2,762,727 | ||||||||||
Total Investments (Cost $217,958,772) — 100.6% | 240,586,317 | ||||||||||
Liabilities in excess of other assets — (0.6)% | (1,333,835 | ) | |||||||||
NET ASSETS — 100.00% | $ | 239,252,482 | |||||||||
^ Purchased with cash collateral from securities on loan.
(a) Non-income producing security.
(b) The Fund's Adviser has deemed this security to be illiquid based upon procedures approved by the Board of Trustees. As of December 31, 2021, illiquid securities were 0.5% of net assets.
(c) Security was fair valued based upon procedures approved by the Board of Trustees and represents 0.5% of net assets as of December 31, 2021. This security is classified as Level 3 within the fair value hierarchy. (See Note 2 in the Notes to Financial Statements)
(d) All or a portion of this security is on loan.
(e) All or a portion of this security has been segregated as collateral for derivative instruments.
(f) Rule 144A security or other security that is restricted as to resale to institutional investors. The Fund's Adviser has deemed this security to be liquid (unless otherwise noted as illiquid) based upon procedures approved by the Board of Trustees. As of December 31, 2021, the fair value of these securities was $3,640,862 and amounted to 1.5% of net assets.
(g) Rate disclosed is the daily yield on December 31, 2021.
ADR — American Depositary Receipt
GDR — Global Depositary Receipt
PCL — Public Company Limited
PLC — Public Limited Company
See notes to financial statements.
48
| Victory Portfolios II VictoryShares USAA MSCI Emerging Markets Value Momentum ETF | Schedule of Portfolio Investments — continued December 31, 2021 | ||||||
(Unaudited)
Futures Contracts Purchased
| Number of Contracts | Expiration Date | Notional Amount | Value | Unrealized Appreciation (Depreciation) | |||||||||||||||||||
| E-Mini MSCI Emerging Markets Index Futures | 17 | 3/18/22 | $ | 1,030,704 | $ | 1,042,355 | $ | 11,651 | |||||||||||||||
Total unrealized appreciation | $ | 11,651 | |||||||||||||||||||||
Total unrealized depreciation | — | ||||||||||||||||||||||
Total net unrealized appreciation (depreciation) | $ | 11,651 | |||||||||||||||||||||
See notes to financial statements.
49
Victory Portfolios II | Statements of Assets and Liabilities December 31, 2021 | ||||||
(Unaudited)
| VictoryShares USAA MSCI USA Value Momentum ETF | VictoryShares USAA MSCI USA Small Cap Value Momentum ETF | ||||||||||
Assets: | |||||||||||
Investments, at value (Cost $316,085,415 and $256,647,453) | $ | 376,825,908 | (a) | $ | 301,089,257 | (b) | |||||
Cash | 663,399 | 1,413,256 | |||||||||
Deposit with broker for futures contracts | 304,819 | 247,681 | |||||||||
Receivables: | |||||||||||
Interest and dividends | 346,836 | 196,485 | |||||||||
From Adviser | 9,843 | — | |||||||||
Prepaid expenses | 971 | 522 | |||||||||
Total Assets | 378,151,776 | 302,947,201 | |||||||||
Liabilities: | |||||||||||
Payables: | |||||||||||
Collateral received on loaned securities | 2,611,642 | 7,404,784 | |||||||||
Investments purchased | — | 728,620 | |||||||||
Variation margin on open futures contracts | 2,750 | 1,640 | |||||||||
Accrued expenses and other payables: | |||||||||||
Investment advisory fees | 47,161 | 36,632 | |||||||||
Administration fees | 6,112 | 5,116 | |||||||||
Custodian fees | 3,502 | 2,449 | |||||||||
Compliance fees | 290 | 205 | |||||||||
Trustees' fees | 57 | 182 | |||||||||
Other accrued expenses | 32,025 | 27,117 | |||||||||
Total Liabilities | 2,703,539 | 8,206,745 | |||||||||
Net Assets: | |||||||||||
Capital | 337,073,558 | 264,090,869 | |||||||||
Total accumulated earnings/(loss) | 38,374,679 | 30,649,587 | |||||||||
Net Assets | $ | 375,448,237 | $ | 294,740,456 | |||||||
Shares (unlimited shares authorized, no par value): | 5,300,000 | 4,000,000 | |||||||||
Net asset value: | $ | 70.84 | $ | 73.69 | |||||||
(a) Includes $2,442,929 of securities on loan.
(b) Includes $6,790,948 of securities on loan.
See notes to financial statements.
50
Victory Portfolios II | Statements of Assets and Liabilities December 31, 2021 | ||||||
(Unaudited)
| VictoryShares USAA MSCI International Value Momentum ETF | VictoryShares USAA MSCI Emerging Markets Value Momentum ETF | ||||||||||
Assets: | |||||||||||
| Investments, at value (Cost $319,513,693 and $217,958,772) | $ | 355,872,343 | (a) | $ | 240,586,317 | (b) | |||||
Foreign currency, at value (Cost $114,351 and $148,041) | 114,873 | 148,041 | |||||||||
Cash | 911,838 | 1,884,766 | |||||||||
Deposit with broker for futures contracts | 225,974 | 245,250 | |||||||||
Receivables: | |||||||||||
Interest and dividends | 484,780 | 938,387 | |||||||||
Reclaims | 526,636 | 7,092 | |||||||||
From Adviser | 9,578 | 13,903 | |||||||||
Prepaid expenses | 702 | 395 | |||||||||
Total Assets | 358,146,724 | 243,824,151 | |||||||||
Liabilities: | |||||||||||
Payables: | |||||||||||
Collateral received on loaned securities | 3,009,662 | 2,762,727 | |||||||||
Investments purchased | — | 1,242,490 | |||||||||
Variation margin on open futures contracts | 794 | 5,950 | |||||||||
Accrued foreign capital gains taxes | — | 388,906 | |||||||||
Accrued expenses and other payables: | |||||||||||
Investment advisory fees | 73,641 | 60,142 | |||||||||
Administration fees | 6,034 | 4,239 | |||||||||
Custodian fees | 31,864 | 62,749 | |||||||||
Compliance fees | 245 | 149 | |||||||||
Trustees' fees | 221 | — | |||||||||
Other accrued expenses | 18,007 | 44,317 | |||||||||
Total Liabilities | 3,140,468 | 4,571,669 | |||||||||
Net Assets: | |||||||||||
Capital | 371,548,061 | 235,681,076 | |||||||||
Total accumulated earnings/(loss) | (16,541,805 | ) | 3,571,406 | ||||||||
Net Assets | $ | 355,006,256 | $ | 239,252,482 | |||||||
Shares (unlimited shares authorized, no par value): | 7,200,000 | 4,950,000 | |||||||||
Net asset value: | $ | 49.31 | $ | 48.33 | |||||||
(a) Includes $2,864,892 of securities on loan.
(b) Includes $2,617,115 of securities on loan.
See notes to financial statements.
51
Victory Portfolios II | Statements of Operations For the Six Months Ended December 31, 2021 | ||||||
(Unaudited)
| VictoryShares USAA MSCI USA Value Momentum ETF | VictoryShares USAA MSCI USA Small Cap Value Momentum ETF | ||||||||||
Investment Income: | |||||||||||
Dividends | $ | 3,587,529 | $ | 2,178,857 | |||||||
Interest | 42 | 129 | |||||||||
Securities lending (net of fees) | 6,094 | 111,973 | |||||||||
Foreign tax withholding | (1,465 | ) | (2,390 | ) | |||||||
Total Income | 3,592,200 | 2,288,569 | |||||||||
Expenses: | |||||||||||
Investment advisory fees | 295,237 | 224,060 | |||||||||
Administration fees | 106,927 | 81,134 | |||||||||
Sub-Administration fees | 9,052 | 9,052 | |||||||||
Custodian fees | 9,953 | 7,535 | |||||||||
Servicing fees | 1,835 | 1,835 | |||||||||
Trustees' fees | 13,705 | 9,752 | |||||||||
Compliance fees | 1,496 | 1,077 | |||||||||
Legal and audit fees | 14,532 | 12,970 | |||||||||
Broker interest fees | 292 | 152 | |||||||||
Interest fees | 321 | — | |||||||||
Licensing fees | 49,160 | 37,340 | |||||||||
Other expenses | 21,047 | 14,613 | |||||||||
Total Expenses | 523,557 | 399,520 | |||||||||
Expenses waived/reimbursed by Adviser | (129,611 | ) | (47,377 | ) | |||||||
Net Expenses | 393,946 | 352,143 | |||||||||
Net Investment Income (Loss) | 3,198,254 | 1,936,426 | |||||||||
Realized/Unrealized Gains (Losses) from Investments: | |||||||||||
Net realized gains (losses) from investment securities | (2,638,865 | ) | (8,996,918 | ) | |||||||
Net realized gains (losses) from futures contracts | 258,550 | (13,092 | ) | ||||||||
Net realized gains (losses) from in-kind redemptions | 53,659,916 | 32,257,724 | |||||||||
| Net change in unrealized appreciation/depreciation on investment securities | (21,770,718 | ) | (17,978,661 | ) | |||||||
| Net change in unrealized appreciation/depreciation on futures contracts | (32,417 | ) | 15,069 | ||||||||
Net realized/unrealized gains (losses) on investments | 29,476,466 | 5,284,122 | |||||||||
Change in net assets resulting from operations | $ | 32,674,720 | $ | 7,220,548 | |||||||
See notes to financial statements.
52
Victory Portfolios II | Statements of Operations For the Six Months Ended December 31, 2021 | ||||||
(Unaudited)
| VictoryShares USAA MSCI International Value Momentum ETF | VictoryShares USAA MSCI Emerging Markets Value Momentum ETF | ||||||||||
Investment Income: | |||||||||||
Dividends | $ | 4,817,287 | $ | 5,922,276 | |||||||
Non-cash dividends | 249,914 | 896,433 | |||||||||
| Interest | 5,086 | — | |||||||||
Securities lending (net of fees) | 43,705 | 13,477 | |||||||||
Foreign tax withholding | (467,093 | ) | (819,375 | ) | |||||||
Total Income | 4,648,899 | 6,012,811 | |||||||||
Expenses: | |||||||||||
Investment advisory fees | 448,183 | 367,652 | |||||||||
Administration fees | 97,376 | 66,568 | |||||||||
Sub-Administration fees | 9,052 | 10,057 | |||||||||
Custodian fees | 62,876 | 142,059 | |||||||||
Servicing fees | 2,446 | 2,446 | |||||||||
Trustees' fees | 11,769 | 8,226 | |||||||||
Compliance fees | 1,311 | 890 | |||||||||
Legal and audit fees | 21,214 | 22,750 | |||||||||
Line of credit fees | — | 2,155 | |||||||||
Broker interest fees | 185 | 227 | |||||||||
Interest fees | 3,455 | 2,130 | |||||||||
Licensing fees | 62,743 | 42,867 | |||||||||
Other expenses | 12,957 | 10,690 | |||||||||
Total Expenses | 733,567 | 678,717 | |||||||||
Expenses waived/reimbursed by Adviser | (99,242 | ) | (123,067 | ) | |||||||
Net Expenses | 634,325 | 555,650 | |||||||||
Net Investment Income (Loss) | 4,014,574 | 5,457,161 | |||||||||
Realized/Unrealized Gains (Losses) from Investments: | |||||||||||
| Net realized gains (losses) from investment securities and foreign currency transactions | 9,282,023 | 6,199,893 | |||||||||
Foreign taxes on realized gains | — | (295,428 | ) | ||||||||
Net realized gains (losses) from futures contracts | (67,768 | ) | (72,685 | ) | |||||||
Net realized gains (losses) from in-kind redemptions | — | 480,667 | |||||||||
| Net change in unrealized appreciation/depreciation on investment securities and foreign currency translations | (9,117,973 | ) | (21,758,629 | ) | |||||||
| Net change in unrealized appreciation/depreciation on futures contracts | 57,196 | 7,001 | |||||||||
Net change in accrued foreign taxes on unrealized gains | — | (58,536 | ) | ||||||||
Net realized/unrealized gains (losses) on investments | 153,478 | (15,497,717 | ) | ||||||||
Change in net assets resulting from operations | $ | 4,168,052 | $ | (10,040,556 | ) | ||||||
See notes to financial statements.
53
Victory Portfolios II | Statements of Changes in Net Assets | ||||||
| VictoryShares USAA MSCI USA Value Momentum ETF | VictoryShares USAA MSCI USA Small Cap Value Momentum ETF | ||||||||||||||||||
| Six Months Ended December 31, 2021 (Unaudited) | Year Ended June 30, 2021 | Six Months Ended December 31, 2021 (Unaudited) | Year Ended June 30, 2021 | ||||||||||||||||
From Investment Activities: | |||||||||||||||||||
Operations: | |||||||||||||||||||
Net investment income (loss) | $ | 3,198,254 | $ | 7,298,240 | $ | 1,936,426 | $ | 2,465,298 | |||||||||||
| Net realized gains (losses) from investments | 51,279,601 | 91,664,113 | 23,247,714 | 68,043,756 | |||||||||||||||
| Net change in unrealized appreciation/depreciation on investments | (21,803,135 | ) | 93,224,120 | (17,963,592 | ) | 59,565,325 | |||||||||||||
| Change in net assets resulting from operations | 32,674,720 | 192,186,473 | 7,220,548 | 130,074,379 | |||||||||||||||
| Change in net assets resulting from distributions to shareholders | (3,945,776 | ) | (7,140,505 | ) | (1,462,984 | ) | (3,526,739 | ) | |||||||||||
| Change in net assets resulting from capital transactions | (96,494,071 | ) | (206,179,954 | ) | (10,648,389 | ) | (66,163,688 | ) | |||||||||||
Change in net assets | (67,765,127 | ) | (21,133,986 | ) | (4,890,825 | ) | 60,383,952 | ||||||||||||
Net Assets: | |||||||||||||||||||
Beginning of period | 443,213,364 | 464,347,350 | 299,631,281 | 239,247,329 | |||||||||||||||
End of period | $ | 375,448,237 | $ | 443,213,364 | $ | 294,740,456 | $ | 299,631,281 | |||||||||||
Capital Transactions: | |||||||||||||||||||
Proceeds from shares issued | 88,866,918 | 189,957,267 | 72,615,771 | 143,357,344 | |||||||||||||||
Cost of shares redeemed | (185,360,989 | ) | (396,137,221 | ) | (83,264,160 | ) | (209,521,032 | ) | |||||||||||
| Change in net assets resulting from capital transactions | (96,494,071 | ) | (206,179,954 | ) | (10,648,389 | ) | (66,163,688 | ) | |||||||||||
Share Transactions: | |||||||||||||||||||
Issued | 1,300,000 | 3,200,000 | 1,000,000 | 2,200,000 | |||||||||||||||
Redeemed | (2,750,000 | ) | (6,700,000 | ) | (1,150,000 | ) | (3,300,000 | ) | |||||||||||
Change in Shares | (1,450,000 | ) | (3,500,000 | ) | (150,000 | ) | (1,100,000 | ) | |||||||||||
See notes to financial statements.
54
Victory Portfolios II | Statements of Changes in Net Assets | ||||||
| VictoryShares USAA MSCI International Value Momentum ETF | VictoryShares USAA MSCI Emerging Markets Value Momentum ETF | ||||||||||||||||||
| Six Months Ended December 31, 2021 (Unaudited) | Year Ended June 30, 2021 | Six Months Ended December 31, 2021 (Unaudited) | Year Ended June 30, 2021 | ||||||||||||||||
From Investment Activities: | |||||||||||||||||||
Operations: | |||||||||||||||||||
Net investment income (loss) | $ | 4,014,574 | $ | 10,949,323 | $ | 5,457,161 | $ | 7,389,948 | |||||||||||
| Net realized gains (losses) from investments | 9,214,255 | 36,512,318 | 6,312,447 | 19,617,138 | |||||||||||||||
| Net change in unrealized appreciation/depreciation on investments | (9,060,777 | ) | 62,078,654 | (21,810,164 | ) | 61,071,078 | |||||||||||||
| Change in net assets resulting from operations | 4,168,052 | 109,540,295 | (10,040,556 | ) | 88,078,164 | ||||||||||||||
| Change in net assets resulting from distributions to shareholders | (6,542,244 | ) | (10,100,636 | ) | (9,058,794 | ) | (6,382,157 | ) | |||||||||||
| Change in net assets resulting from capital transactions | — | (57,063,375 | ) | (7,238,988 | ) | 19,002,805 | |||||||||||||
Change in net assets | (2,374,192 | ) | 42,376,284 | (26,338,338 | ) | 100,698,812 | |||||||||||||
Net Assets: | |||||||||||||||||||
Beginning of period | 357,380,448 | 315,004,164 | 265,590,820 | 164,892,008 | |||||||||||||||
End of period | $ | 355,006,256 | $ | 357,380,448 | $ | 239,252,482 | $ | 265,590,820 | |||||||||||
Capital Transactions: | |||||||||||||||||||
Proceeds from shares issued | — | 45,460,436 | — | 72,396,227 | |||||||||||||||
Cost of shares redeemed | — | (102,523,811 | ) | (7,238,988 | ) | (53,393,422 | ) | ||||||||||||
| Change in net assets resulting from capital transactions | — | (57,063,375 | ) | (7,238,988 | ) | 19,002,805 | |||||||||||||
Share Transactions: | |||||||||||||||||||
Issued | — | 1,100,000 | — | 1,800,000 | |||||||||||||||
Redeemed | — | (2,100,000 | ) | (150,000 | ) | (1,050,000 | ) | ||||||||||||
Change in Shares | — | (1,000,000 | ) | (150,000 | ) | 750,000 | |||||||||||||
See notes to financial statements.
55
Victory Portfolios II | Financial Highlights | ||||||
For a Share Outstanding Throughout Each Period
Investment Activities | Distributions to Shareholders From | ||||||||||||||||||||||||||||||||||
| Net Asset Value, Beginning of Period | Net Investment Income (Loss)(a) | Net Realized and Unrealized Gains (Losses) on Investments | Total from Investment Activities | Net Investment Income | Total Distributions | Net Asset Value, End of Period | Total Return(b) | ||||||||||||||||||||||||||||
VictoryShares USAA MSCI USA Value Momentum ETF | |||||||||||||||||||||||||||||||||||
| Six Months Ended December 31, 2021 (Unaudited) | $ | 65.66 | 0.55 | 5.32 | 5.87 | (0.69 | ) | (0.69 | ) | $ | 70.84 | 8.99 | % | ||||||||||||||||||||||
| Year Ended June 30, 2021 | $ | 45.30 | 0.81 | 20.32 | 21.13 | (0.77 | ) | (0.77 | ) | $ | 65.66 | 47.02 | % | ||||||||||||||||||||||
| Ten Months Ended June 30, 2020(e) | $ | 50.37 | 0.72 | (4.85 | ) | (4.13 | ) | (0.94 | ) | (0.94 | ) | $ | 45.30 | (8.31 | )% | ||||||||||||||||||||
| Year Ended August 31, 2019 | $ | 53.85 | 1.00 | (3.59 | ) | (2.59 | ) | (0.89 | ) | (0.89 | ) | $ | 50.37 | (4.79 | )% | ||||||||||||||||||||
| October 24, 2017(f) through August 31, 2018 | $ | 50.19 | 0.78 | 3.34 | 4.12 | (0.46 | ) | (0.46 | ) | $ | 53.85 | 8.23 | % | ||||||||||||||||||||||
VictoryShares USAA MSCI USA Small Cap Value Momentum ETF | |||||||||||||||||||||||||||||||||||
| Six Months Ended December 31, 2021 (Unaudited) | $ | 72.20 | 0.47 | 1.38 | 1.85 | (0.36 | ) | (0.36 | ) | $ | 73.69 | 2.57 | % | ||||||||||||||||||||||
| Year Ended June 30, 2021 | $ | 45.57 | 0.52 | 26.84 | 27.36 | (0.73 | ) | (0.73 | ) | $ | 72.20 | 60.47 | % | ||||||||||||||||||||||
| Ten Months Ended June 30, 2020(e) | $ | 49.54 | 0.60 | (3.74 | ) | (3.14 | ) | (0.83 | ) | (0.83 | ) | $ | 45.57 | (6.44 | )% | ||||||||||||||||||||
| Year Ended August 31, 2019 | $ | 57.21 | 1.00 | (7.86 | ) | (6.86 | ) | (0.81 | ) | (0.81 | ) | $ | 49.54 | (11.99 | )% | ||||||||||||||||||||
| October 24, 2017(f) through August 31, 2018 | $ | 50.13 | 0.57 | 6.81 | 7.38 | (0.30 | ) | (0.30 | ) | $ | 57.21 | 14.80 | % | ||||||||||||||||||||||
(a) Per share net investment income (loss) has been calculated using the average daily shares method.
(b) Not annualized for periods less than one year.
(c) Annualized for periods less than one year.
(d) Excludes impact of in-kind transactions.
(e) The Fund's fiscal year-end changed from August 31 to June 30, effective September 1, 2019.
(f) Commencement of operations.
(g) Includes impact of voluntary waivers. Without these voluntary waivers, the net expense ratio would have been at the contractual cap. (See note 4 in the Notes to Financial Statements)
See notes to financial statements.
56
Victory Portfolios II | Financial Highlights — continued | ||||||
For a Share Outstanding Throughout Each Period
Ratios to Average Net Assets | Supplemental Data | ||||||||||||||||||||||
| Net Expenses(c) | Net Investment Income (Loss)(c) | Gross Expenses(c) | Net Assets, End of Period (000's) | Portfolio Turnover(b)(d) | |||||||||||||||||||
VictoryShares USAA MSCI USA Value Momentum ETF | |||||||||||||||||||||||
| Six Months Ended December 31, 2021 (Unaudited) | 0.20 | % | 1.63 | % | 0.27 | % | $ | 375,448 | 24 | % | |||||||||||||
| Year Ended June 30, 2021 | 0.20 | % | 1.47 | % | 0.27 | % | $ | 443,213 | 76 | % | |||||||||||||
| Ten Months Ended June 30, 2020(e) | 0.20 | % | 1.80 | % | 0.28 | % | $ | 464,347 | 66 | % | |||||||||||||
| Year Ended August 31, 2019 | 0.20 | % | 2.00 | % | 0.25 | % | $ | 468,445 | 87 | % | |||||||||||||
| October 24, 2017(f) through August 31, 2018 | 0.20 | % | 1.76 | % | 0.25 | % | $ | 398,504 | 84 | % | |||||||||||||
VictoryShares USAA MSCI USA Small Cap Value Momentum ETF | |||||||||||||||||||||||
| Six Months Ended December 31, 2021 (Unaudited) | 0.24 | % | 1.30 | % | 0.27 | % | $ | 294,740 | 34 | % | |||||||||||||
| Year Ended June 30, 2021 | 0.24 | %(g) | 0.87 | % | 0.28 | % | $ | 299,631 | 78 | % | |||||||||||||
| Ten Months Ended June 30, 2020(e) | 0.25 | % | 1.53 | % | 0.31 | % | $ | 239,247 | 70 | % | |||||||||||||
| Year Ended August 31, 2019 | 0.25 | % | 1.98 | % | 0.30 | % | $ | 101,564 | 88 | % | |||||||||||||
| October 24, 2017(f) through August 31, 2018 | 0.25 | % | 1.25 | % | 0.30 | % | $ | 71,517 | 81 | % | |||||||||||||
See notes to financial statements.
57
Victory Portfolios II | Financial Highlights | ||||||
For a Share Outstanding Throughout Each Period
Investment Activities | Distributions to Shareholders From | ||||||||||||||||||||||||||||||||||
| Net Asset Value, Beginning of Period | Net Investment Income (Loss)(a) | Net Realized and Unrealized Gains (Losses) on Investments | Total from Investment Activities | Net Investment Income | Total Distributions | Net Asset Value, End of Period | Total Return(b) | ||||||||||||||||||||||||||||
VictoryShares USAA MSCI International Value Momentum ETF | |||||||||||||||||||||||||||||||||||
| Six Months Ended December 31, 2021 (Unaudited): | $ | 49.64 | 0.56 | 0.02 | 0.58 | (0.91 | ) | (0.91 | ) | $ | 49.31 | 1.17 | % | ||||||||||||||||||||||
| Year Ended June 30, 2021 | $ | 38.42 | 1.28 | 11.17 | 12.45 | (1.23 | ) | (1.23 | ) | $ | 49.64 | 32.66 | % | ||||||||||||||||||||||
| Ten Months Ended June 30, 2020(e) | $ | 43.16 | 0.83 | (4.35 | ) | (3.52 | ) | (1.22 | ) | (1.22 | ) | $ | 38.42 | (8.39 | )% | ||||||||||||||||||||
| Year Ended August 31, 2019 | $ | 48.10 | 1.30 | (4.99 | ) | (3.69 | ) | (1.25 | ) | (1.25 | ) | $ | 43.16 | (7.70 | )% | ||||||||||||||||||||
| October 24, 2017(f) through August 31, 2018 | $ | 50.08 | 1.34 | (2.64 | ) | (1.30 | ) | (0.68 | ) | (0.68 | ) | $ | 48.10 | (2.64 | )% | ||||||||||||||||||||
VictoryShares USAA MSCI Emerging Markets Value Momentum ETF | |||||||||||||||||||||||||||||||||||
| Six Months Ended December 31, 2021 (Unaudited): | $ | 52.08 | 1.10 | (3.03 | ) | (1.93 | ) | (1.82 | ) | (1.82 | ) | $ | 48.33 | (3.69 | )% | ||||||||||||||||||||
| Year Ended June 30, 2021 | $ | 37.91 | 1.36 | 14.10 | 15.46 | (1.29 | ) | (1.29 | ) | $ | 52.08 | 41.48 | % | ||||||||||||||||||||||
| Ten Months Ended June 30, 2020(e) | $ | 41.23 | 0.73 | (2.85 | ) | (2.12 | ) | (1.20 | ) | (1.20 | ) | $ | 37.91 | (5.47 | )% | ||||||||||||||||||||
| Year Ended August 31, 2019 | $ | 45.58 | 1.31 | (4.73 | ) | (3.42 | ) | (0.93 | ) | (0.93 | ) | $ | 41.23 | (7.62 | )% | ||||||||||||||||||||
| October 24, 2017(f) through August 31, 2018 | $ | 49.95 | 1.17 | (5.10 | ) | (3.93 | ) | (0.44 | ) | (0.44 | ) | $ | 45.58 | (7.95 | )% | ||||||||||||||||||||
(a) Per share net investment income (loss) has been calculated using the average daily shares method.
(b) Not annualized for periods less than one year.
(c) Annualized for periods less than one year.
(d) Excludes impact of in-kind transactions.
(e) The Fund's fiscal year-end changed from August 31 to June 30, effective September 1, 2019.
(f) Commencement of operations.
See notes to financial statements.
58
Victory Portfolios II | Financial Highlights — continued | ||||||
For a Share Outstanding Throughout Each Period
Ratios to Average Net Assets | Supplemental Data | ||||||||||||||||||||||
| Net Expenses(c) | Net Investment Income (Loss)(c) | Gross Expenses(c) | Net Assets, End of Period (000's) | Portfolio Turnover(b)(d) | |||||||||||||||||||
VictoryShares USAA MSCI International Value Momentum ETF | |||||||||||||||||||||||
| Six Months Ended December 31, 2021 (Unaudited): | 0.35 | % | 2.24 | % | 0.41 | % | $ | 355,006 | 36 | % | |||||||||||||
| Year Ended June 30, 2021 | 0.35 | % | 2.86 | % | 0.42 | % | $ | 357,380 | 90 | % | |||||||||||||
| Ten Months Ended June 30, 2020(e) | 0.35 | % | 2.41 | % | 0.41 | % | $ | 315,004 | 62 | % | |||||||||||||
| Year Ended August 31, 2019 | 0.35 | % | 2.90 | % | 0.40 | % | $ | 323,693 | 87 | % | |||||||||||||
| October 24, 2017(f) through August 31, 2018 | 0.35 | % | 3.12 | % | 0.40 | % | $ | 307,836 | 65 | % | |||||||||||||
VictoryShares USAA MSCI Emerging Markets Value Momentum ETF | |||||||||||||||||||||||
| Six Months Ended December 31, 2021 (Unaudited): | 0.45 | % | 4.46 | % | 0.55 | % | $ | 239,252 | 35 | % | |||||||||||||
| Year Ended June 30, 2021 | 0.45 | % | 2.98 | % | 0.56 | % | $ | 265,591 | 95 | % | |||||||||||||
| Ten Months Ended June 30, 2020(e) | 0.45 | % | 2.18 | % | 0.57 | % | $ | 164,892 | 51 | % | |||||||||||||
| Year Ended August 31, 2019 | 0.45 | % | 3.00 | % | 0.50 | % | $ | 169,051 | 67 | % | |||||||||||||
| October 24, 2017(f) through August 31, 2018 | 0.45 | % | 2.77 | % | 0.50 | % | $ | 154,974 | 58 | % | |||||||||||||
See notes to financial statements.
59
Victory Portfolios II | Notes to Financial Statements December 31, 2021 | ||||||
(Unaudited)
1. Organization:
Victory Portfolios II (the "Trust") is organized as a Delaware statutory trust and the Trust is registered under the Investment Company Act of 1940, as amended (the "1940 Act"), as an open-end investment company. The Trust is comprised of 25 funds, 23 of which are Exchange-Traded Funds ("ETFs"), and is authorized to issue an unlimited number of shares, which are units of beneficial interest with no par value.
The accompanying financial statements are those of the following four Funds (collectively, the "Funds" and individually, a "Fund"). Each Fund is classified as diversified under the 1940 Act.
Funds (Legal Name) | Funds (Short Name) | ||||||
| VictoryShares USAA MSCI USA Value Momentum ETF | USAA MSCI USA Value Momentum ETF | ||||||
| VictoryShares USAA MSCI USA Small Cap Value Momentum ETF | USAA MSCI USA Small Cap Value Momentum ETF | ||||||
| VictoryShares USAA MSCI International Value Momentum ETF | USAA MSCI International Value Momentum ETF | ||||||
| VictoryShares USAA MSCI Emerging Markets Value Momentum ETF | USAA MSCI Emerging Markets Value Momentum ETF | ||||||
Under the Trust's organizational documents, its officers and trustees are indemnified against certain liabilities arising out of the performance of their duties to the Funds. In addition, in the normal course of business, the Funds enter into contracts with their vendors and others that provide for general indemnifications. The Funds' maximum exposure under these arrangements is unknown, as this would involve future claims that may be made against the Fund. However, based on experience, the Funds expect that risk of loss to be remote.
2. Significant Accounting Policies:
The following is a summary of significant accounting policies followed by the Trust in the preparation of its financial statements. The policies are in conformity with Generally Accepted Accounting Principles in the United States of America ("GAAP"). The preparation of financial statements in accordance with GAAP requires management to make estimates and assumptions that affect the reported amounts of assets and liabilities and disclosure of contingent assets and liabilities at the date of the financial statements and the reported amounts of income and expenses for the period. Actual results could differ from those estimates. The Funds follow the specialized accounting and reporting requirements under GAAP that are applicable to investment companies under Accounting Standards Codification Topic 946.
Shares of the Funds are listed and traded on the NYSE Arca, Inc. (the "Exchange"). The Funds issue and redeem shares ("Shares") at net asset value ("NAV") only in aggregations of 50,000 shares, (each a "Creation Unit"). Creation Units are issued and redeemed in exchange for a basket of securities included in the respective Fund's Index (the "Deposit Securities"), and/or with the deposit of a specified cash payment (the "Cash Component"), plus a transaction fee. Shares trade on the Exchange at market prices that may be below, at, or above NAV. Shares of a Fund may only be purchased or redeemed by certain financial institutions ("Authorized Participants"). An Authorized Participant is either (i) a broker-dealer or other participant in the clearing process through the Continuous Net Settlement System of the National Securities Clearing Corporation or (ii) a DTC participant and, in each case, must have executed a Participant Agreement with the distributor. Only Authorized Participants may purchase or redeem the shares directly from a Fund. In addition, shares may be issued in advance of receipt of Deposit Securities subject to various conditions, including a requirement to maintain on deposit with the Trust cash equal to up to 105% of the market value of the missing Deposit Securities. In each instance of such cash creations or redemptions, transaction fees may be imposed and may be higher than the transaction fees associated with in-kind creations or redemptions.
Each Fund may issue an unlimited number of shares of beneficial interest, with no par value. Shares of each Fund have equal rights and privileges. A purchase (i.e., creation) transaction fee is imposed for
60
Victory Portfolios II | Notes to Financial Statements — continued December 31, 2021 | ||||||
(Unaudited)
the transfer and other transactional costs associated with the purchase of Creation Units. In addition, a variable fee may be charged on all cash transactions or substitutes for Creation Units. Variable fees received by each Fund are displayed in the Capital Transactions section of the Statements of Changes in Net Assets as an increase to Capital.
The transaction fees for each Fund are listed below:
| Fee for In-Kind and Cash Purchases and Redemptions | Maximum Additional Variable Charge for Cash Purchases and Redemptions* | ||||||||||
USAA MSCI USA Value Momentum ETF | $ | 500 | 2.00 | % | |||||||
USAA MSCI USA Small Cap Value Momentum ETF | 750 | 2.00 | % | ||||||||
USAA MSCI International Value Momentum ETF | 3,000 | 2.00 | % | ||||||||
USAA MSCI Emerging Markets Value Momentum ETF | 5,500 | 2.00 | % | ||||||||
* As a percentage of the amount invested.
Investment Valuation:
The Funds record investments at fair value. Fair value is defined as the price that would be received to sell an asset or paid to transfer a liability in an orderly transaction between market participants at the measurement date.
The valuation techniques described below maximize the use of observable inputs and minimize the use of unobservable inputs in determining fair value. The inputs used for valuing the Funds' investments are summarized in the three broad levels listed below:
• Level 1 — quoted prices in active markets for identical securities
• Level 2 — other significant observable inputs (including quoted prices for similar securities or interest rates applicable to those securities, etc.)
• Level 3 — significant unobservable inputs (including the Funds' own assumptions in determining the fair value of investments)
Changes in valuation techniques may result in transfers in or out of an assigned level within the disclosure hierarchy. The inputs or methodologies used for valuation techniques are not necessarily an indication of the risk associated with entering into those investments.
Victory Capital Management Inc. ("VCM" or the "Adviser") has established the Pricing and Liquidity Committee (the "Committee"), and subject to the Trust's Board of Trustees' (the "Board") oversight, the Committee administers and oversees the Funds' valuation policies and procedures, which are approved by the Board.
Portfolio securities listed or traded on securities exchanges, including ETFs, American Depositary Receipts ("ADRs"), and Rights, are valued at the closing price on the exchange or system where the security is principally traded, if available, or at the Nasdaq Official Closing Price. If there have been no sales for that day on the exchange or system, then a security is valued at the last available bid quotation on the exchange or system where the security is principally traded. In each of these situations, valuations are typically categorized as Level 1 in the fair value hierarchy.
Investments in open-end investment companies are valued at their NAV. These valuations are typically categorized as Level 1 in the fair value hierarchy.
Futures contracts are valued at the settlement price established each day by the board of trade or an exchange on which they are traded. These valuations are typically categorized as Level 1 in the fair value hierarchy.
In the event that price quotations or valuations are not readily available, investments are valued at fair value in accordance with procedures established by and under the general supervision and responsibility of the Board. These valuations are typically categorized as Level 2 or Level 3 in the fair
61
Victory Portfolios II | Notes to Financial Statements — continued December 31, 2021 | ||||||
(Unaudited)
value hierarchy, based on the observability of inputs used to determine the fair value. The effect of fair value pricing is that securities may not be priced on the basis of quotations from the primary market in which they are traded and the actual price realized from the sale of a security may differ materially from the fair value price. Valuing these securities at fair value is intended to cause the Fund's NAV to be more reliable than it otherwise would be.
In accordance with procedures adopted by the Board, fair value pricing may be used if events materially affecting the value of foreign securities occur between the time the exchange on which they are traded closes and the time a Fund's NAV is calculated. The Funds use a systematic valuation model, provided daily by an independent third party to fair value its international equity securities. The valuations are considered as Level 2 in the fair value hierarchy.
A summary of the valuations as of December 31, 2021, is included in the table below while the breakdown, by category, of investments is disclosed on the Schedules of Portfolio Investments:
Level 1 | Level 2 | Level 3 | Total | ||||||||||||||||
USAA MSCI USA Value Momentum ETF | |||||||||||||||||||
Common Stocks | $ | 374,214,266 | $ | — | $ | — | $ | 374,214,266 | |||||||||||
Collateral for Securities Loaned | 2,611,642 | — | — | 2,611,642 | |||||||||||||||
Total | $ | 376,825,908 | $ | — | $ | — | $ | 376,825,908 | |||||||||||
Other Financial Investments^: | |||||||||||||||||||
Assets: | |||||||||||||||||||
Futures | $ | 13,771 | $ | — | $ | — | $ | 13,771 | |||||||||||
Total | $ | 13,771 | $ | — | $ | — | $ | 13,771 | |||||||||||
USAA MSCI USA Small Cap Value Momentum ETF | |||||||||||||||||||
Common Stocks | $ | 293,680,343 | $ | — | $ | — | $ | 293,680,343 | |||||||||||
Rights | — | — | 4,130 | 4,130 | |||||||||||||||
Collateral for Securities Loaned | 7,404,784 | — | — | 7,404,784 | |||||||||||||||
Total | $ | 301,085,127 | $ | — | $ | 4,130 | $ | 301,089,257 | |||||||||||
Other Financial Investments^: | |||||||||||||||||||
Assets: | |||||||||||||||||||
Futures | $ | 8,018 | $ | — | $ | — | $ | 8,018 | |||||||||||
Total | $ | 8,018 | $ | — | $ | — | $ | 8,018 | |||||||||||
USAA MSCI International Value Momentum ETF | |||||||||||||||||||
Common Stocks | $ | 351,836,577 | $ | 1,026,104 | $ | — | $ | 352,862,681 | |||||||||||
Collateral for Securities Loaned | 3,009,662 | — | — | 3,009,662 | |||||||||||||||
Total | $ | 354,846,239 | $ | 1,026,104 | $ | — | $ | 355,872,343 | |||||||||||
Other Financial Investments^: | |||||||||||||||||||
Assets: | |||||||||||||||||||
Futures | $ | 20,556 | $ | — | $ | — | $ | 20,556 | |||||||||||
Total | $ | 20,556 | $ | — | $ | — | $ | 20,556 | |||||||||||
USAA MSCI Emerging Markets Value Momentum ETF | |||||||||||||||||||
Common Stocks | $ | 236,514,413 | $ | — | $ | 1,309,177 | $ | 237,823,590 | |||||||||||
Collateral for Securities Loaned | 2,762,727 | — | — | 2,762,727 | |||||||||||||||
Total | $ | 239,277,140 | $ | — | $ | 1,309,177 | $ | 240,586,317 | |||||||||||
Other Financial Investments^: | |||||||||||||||||||
Assets: | |||||||||||||||||||
Futures | $ | 11,651 | $ | — | $ | — | $ | 11,651 | |||||||||||
Total | $ | 11,651 | $ | — | $ | — | $ | 11,651 | |||||||||||
^ Futures contracts are valued at the unrealized appreciation (depreciation) on the investment.
62
Victory Portfolios II | Notes to Financial Statements — continued December 31, 2021 | ||||||
(Unaudited)
For the six months ended December 31, 2021, there were no transfers in or out of Level 3 in the fair value hierarchy.
As of December 31, 2021, there were no significant Level 3 holdings in the fair value hierarchy
Real Estate Investment Trusts ("REITs"):
The Funds may invest in REITs, which report information on the source of their distributions annually. REITs are pooled investment vehicles that invest primarily in income-producing real estate or real-estate related loans or interests (such as mortgages). Certain distributions received from REITs during the year are recorded as realized gains or return of capital as estimated by the Funds or when such information becomes known.
Investment Companies:
Open-End Funds:
The Funds may invest in portfolios of open-end investment companies. These investment companies value securities in their portfolios for which market quotations are readily available at their market values (generally the last reported sale price) and all other securities and assets at their fair value by the methods established by the board of directors of the underlying funds.
Derivative Instruments:
Foreign Exchange Currency Contracts:
The Funds may enter into foreign exchange currency contracts to convert U.S. dollars to and from various foreign currencies. A foreign exchange currency contract is an obligation by a Fund to purchase or sell a specific currency at a future date at a price (in U.S. dollars) set at the time of the contract. The Funds do not engage in "cross-currency" foreign exchange contracts (i.e., contracts to purchase or sell one foreign currency in exchange for another foreign currency). The Funds' foreign exchange currency contracts might be considered spot contracts (typically a contract of one week or less) or forward contracts (typically a contract term over one week). A spot contract is entered into for purposes of hedging against foreign currency fluctuations relating to a specific portfolio transaction, such as the delay between a security transaction trade date and settlement date. Forward contracts are entered into for purposes of hedging portfolio holdings or concentrations of such holdings. The Funds enter into foreign exchange currency contracts solely for spot or forward hedging purposes, and not for speculative purposes (i.e., the Funds do not enter into such contracts solely for the purpose of earning foreign currency gains). Each foreign exchange currency contract is adjusted daily by the prevailing spot or forward rate of the underlying currency, and any appreciation or depreciation is recorded for financial statement purposes as unrealized until the contract settlement date, at which time the Funds record realized gains or losses equal to the difference between the value of a contract at the time it was opened and the value at the time it was closed. The Funds could be exposed to risk if a counterparty is unable to meet the terms of a foreign exchange currency contract or if the value of the foreign currency changes unfavorably. In addition, the use of foreign exchange currency contracts does not eliminate fluctuations in the underlying prices of the securities. As of December 31, 2021, the Funds had no open forward foreign exchange currency contracts.
Futures Contracts:
The Funds may enter into contracts for the future delivery of securities or foreign currencies and futures contracts based on a specific security, class of securities, foreign currency or an index, and purchase or sell options on any such futures contracts. A futures contract on a securities index is an agreement obligating either party to pay, and entitling the other party to receive, while the contract is outstanding, cash payments based on the level of a specified securities index. No physical delivery of the underlying asset is made. The Funds may enter into futures contracts in an effort to hedge against market risks. The acquisition of put and call options on futures contracts will give the Funds the right (but not the obligation), for a specified price, to sell or to purchase the underlying futures contract, upon exercise of the option, at any time during the option period. Futures transactions involve brokerage costs and require
63
Victory Portfolios II | Notes to Financial Statements — continued December 31, 2021 | ||||||
(Unaudited)
the Funds to segregate assets to cover contracts that would require it to purchase securities or currencies. A good faith margin deposit, known as initial margin, of cash or government securities with a broker or custodian is required to initiate and maintain open positions in futures contracts. Subsequent payments, known as variation margin, are made or received by the Funds based on the change in the market value of the position and are recorded as unrealized appreciation or depreciation until the contract is closed out, at which time the gain or loss is realized. The Funds may lose the expected benefit of futures transactions if interest rates, exchange rates or securities prices change in an unanticipated manner. Such unanticipated changes may also result in lower overall performance than if the Funds had not entered into any futures transactions. In addition, the value of the Funds' futures positions may not prove to be perfectly or even highly correlated with the value of its portfolio securities or foreign currencies, limiting the Funds' ability to hedge effectively against interest rate, exchange rate and/or market risk and giving rise to additional risks. There is no assurance of liquidity in the secondary market for purposes of closing out futures positions. The collateral held by the Funds is reflected on the Statements of Assets and Liabilities under Deposit with broker for futures contracts.
Management has determined that no offsetting requirements exist as a result of their conclusion that the Funds are not subject to master netting agreements for futures contracts. As of December 31, 2021, the Funds entered into futures contracts primarily for the strategy of hedging or other purposes, including but not limited to, providing liquidity and equitizing cash.
Summary of Derivative Instruments:
The following table summarizes the fair values of derivative instruments on the Statements of Assets and Liabilities, categorized by risk exposure, as of December 31, 2021:
Asset | |||||||
| Variation Margin Receivable on Open Futures Contracts* | |||||||
Equity Risk Exposure: | |||||||
USAA MSCI USA Value Momentum ETF | $ | 13,771 | |||||
USAA MSCI USA Small Cap Value Momentum ETF | 8,018 | ||||||
USAA MSCI International Value Momentum ETF | 20,556 | ||||||
USAA MSCI Emerging Markets Value Momentum ETF | 11,651 | ||||||
* Includes cumulative appreciation (depreciation) of futures contracts as reported on the Schedules of Portfolio Investments. Only current day's variation margin for futures contracts is reported within the Statements of Assets and Liabilities.
The following table presents the effect of derivative instruments on the Statements of Operations, categorized by risk exposure, for the period ended December 31, 2021:
| Net Realized Gains (Losses) on Derivatives Recognized as a Result of Operations | Net Change in Unrealized Appreciation/Depreciation on Derivatives Recognized as a Result of Operations | ||||||||||
| Net Realized Gains (Losses) from Futures Contracts | Net Change in Unrealized Appreciation/ Depreciation on Futures Contracts | ||||||||||
Equity Risk Exposure: | |||||||||||
USAA MSCI USA Value Momentum ETF | $ | 258,550 | $ | (32,417 | ) | ||||||
| USAA MSCI USA Small Cap Value Momentum ETF | (13,092 | ) | 15,069 | ||||||||
| USAA MSCI International Value Momentum ETF | (67,768 | ) | 57,196 | ||||||||
| USAA MSCI Emerging Markets Value Momentum ETF | (72,685 | ) | 7,001 | ||||||||
64
Victory Portfolios II | Notes to Financial Statements — continued December 31, 2021 | ||||||
(Unaudited)
All open derivative positions at period end are reflected on each respective Fund's Schedule of Portfolio Investments. The underlying face value of open derivative positions relative to each Fund's net assets at period end is generally representative of the notional amount of open positions to net assets throughout the period.
Investment Transactions and Related Income:
Changes in holdings of investments are accounted for no later than one business day following the trade date. For financial reporting purposes, however, investment transactions are accounted for on trade date or the last business day of the reporting period. Interest income is determined on the basis of coupon interest accrued using the effective interest method which adjusts, where applicable, the amortization of premiums or accretion of discounts. Dividend income is recorded on the ex-dividend date. Gains or losses realized on sales of securities are recorded on the identified cost basis.
Withholding taxes on interest, dividends, and gains as a result of certain investments in ADRs by the Funds have been provided for in accordance with each investment's applicable country's tax rules and rates.
Securities Lending:
The Funds, through a Securities Lending Agreement with Citibank, N.A. ("Citibank"), may lend their securities to qualified financial institutions, such as certain broker-dealers and banks, to earn additional income, net of income retained by Citibank. Borrowers are required to initially secure their loans for collateral in the amount of at least 102% of the value of U.S. securities loaned or at least 105% of the value of non-U.S. securities loaned, marked-to-market daily. Any collateral shortfalls associated with increases in the valuation of the securities loaned are generally cured the next business day. The collateral can be received in the form of cash collateral and/or non-cash collateral. Non-cash collateral can include U.S. Government Securities and other securities as permitted by Securities and Exchange Commission ("SEC") guidelines. The cash collateral is invested in short-term instruments or cash equivalents, primarily open-end investment companies, as noted on the Funds' Schedules of Portfolio Investments. The Funds effectively do not have control of the non-cash collateral and therefore it is not disclosed on the Funds' Schedules of Portfolio Investments. Collateral requirements are determined daily based on the value of the Funds' securities on loan as of the end of the prior business day. During the time portfolio securities are on loan, the borrower will pay the Funds any dividends or interest paid on such securities plus any fee negotiated between the parties to the lending agreement. The Funds also earn a return from the collateral. The Funds pay Citibank various fees in connection with the investment of cash collateral and fees based on the investment income received from securities lending activities. Securities lending income (net of these fees) is disclosed on the Statements of Operations. Loans are terminable upon demand and the borrower must return the loaned securities within the lesser of one standard settlement period or five business days. Although risk is mitigated by the collateral, a Fund could experience a delay in recovering its securities and possible loss of income or value if the borrower fails to return them. In addition, there is a risk that the value of the short-term investments will be less than the amount of cash collateral required to be returned to the borrower.
The Funds' agreement with Citibank does not include master netting provisions. Non-cash collateral received by the Funds may not be sold or repledged, except to satisfy borrower default.
The following table is a summary of the Funds' securities lending transactions as of December 31, 2021.
| Value of Securities on Loan | Non-Cash Collateral | Cash Collateral | |||||||||||||
USAA MSCI USA Value Momentum ETF | $ | 2,442,929 | $ | — | $ | 2,611,642 | |||||||||
| USAA MSCI USA Small Cap Value Momentum ETF | 6,790,948 | — | 7,404,784 | ||||||||||||
USAA MSCI International Value Momentum ETF | 2,864,892 | — | 3,009,662 | ||||||||||||
| USAA MSCI Emerging Markets Value Momentum ETF | 2,617,115 | — | 2,762,727 | ||||||||||||
65
Victory Portfolios II | Notes to Financial Statements — continued December 31, 2021 | ||||||
(Unaudited)
Foreign Currency Translations:
The accounting records of the Funds are maintained in U.S. dollars. Investment securities and other assets and liabilities of a Fund denominated in a foreign currency are translated into U.S. dollars at current exchange rates. Purchases and sales of securities, income receipts and expense payments are translated into U.S. dollars at the exchange rates on the date of the transactions. The Funds do not isolate the portion of the results of operations resulting from changes in foreign exchange rates on investments from fluctuations arising from changes in market prices of securities held. Such fluctuations are disclosed as Net change in unrealized appreciation/depreciation on investment securities and foreign currency translations on the Statements of Operations. Any realized gains or losses from these fluctuations are disclosed as Net realized gains (losses) from investment securities and foreign currency transactions on the Statements of Operations.
Foreign Taxes:
The Funds may be subject to foreign taxes related to foreign income received (a portion of which may be reclaimable), capital gains on the sale of securities, and certain foreign currency transactions. All foreign taxes are recorded in accordance with the applicable regulations and rates that exist in the foreign jurisdictions in which the Funds invest.
Federal Income Taxes:
It is each Fund's policy to continue to qualify as a regulated investment company by complying with the provisions available to certain investment companies, as defined in applicable sections of the Internal Revenue Code, and to make distributions of net investment income and net realized gains sufficient to relieve it from all, or substantially all, federal income taxes. Accordingly, no provision for federal income taxes is required in the financial statements. The Funds have a tax year end of June 30.
For the six months ended December 31, 2021, the Funds did not incur any income tax, interest, or penalties, and have recorded no liability for net unrecognized tax benefits relating to uncertain income tax positions.
Management of the Funds has reviewed tax positions taken in tax years that remain subject to examination by all major tax jurisdictions, including federal (i.e., the last four tax years, which includes the current fiscal tax year end). Management believes that there is no tax liability resulting from unrecognized tax benefits related to uncertain tax positions taken.
Allocations:
Expenses directly attributable to a Fund are charged to that Fund, while expenses that are attributable to more than one fund in the Trust, or jointly with an affiliated trust, are allocated among the respective funds in the Trust and/or an affiliated trust based upon net assets or another appropriate basis.
3. Purchases and Sales:
Purchases and sales of securities (excluding securities maturing less than one year from acquisition) and purchases and sales of in-kind transactions for the six months ended December 31, 2021, were as follows. Any realized gains or losses from in-kind redemptions are reflected on the Statements of Operations as Net realized gains (losses) from in-kind redemptions.
| Excluding U.S. Government Securities | Associated with In-Kind Transactions | |||||||||||||||||
Purchases | Sales | Purchases | Sales | ||||||||||||||||
| USAA MSCI USA Value Momentum ETF | $ | 97,827,110 | $ | 96,624,071 | $ | 88,394,838 | $ | 184,614,477 | |||||||||||
| USAA MSCI USA Small Cap Value Momentum ETF | 105,655,096 | 103,987,208 | 72,084,817 | 83,159,228 | |||||||||||||||
| USAA MSCI International Value Momentum ETF | 125,443,623 | 126,901,097 | — | — | |||||||||||||||
| USAA MSCI Emerging Markets Value Momentum ETF | 85,161,164 | 91,760,025 | — | 3,587,996 | |||||||||||||||
66
Victory Portfolios II | Notes to Financial Statements — continued December 31, 2021 | ||||||
(Unaudited)
4. Fees and Transactions with Affiliates and Related Parties:
Investment Advisory Fees:
Investment advisory services are provided to the Funds by the Adviser, which is a New York corporation registered as an investment adviser with the SEC. The Adviser is an indirect wholly owned subsidiary of Victory Capital Holdings, Inc., a publicly traded Delaware corporation, and a wholly owned direct subsidiary of Victory Capital Operating, LLC.
Under the terms of the Investment Advisory Agreement, the Adviser is entitled to receive fees based on a percentage of the average daily net assets of each Fund. The rates at which the Adviser is paid by each Fund are included in the table below.
Flat Rate | |||||||
USAA MSCI USA Value Momentum Index ETF | 0.15 | % | |||||
USAA MSCI USA Small Cap Value Momentum ETF | 0.15 | % | |||||
USAA MSCI International Value Momentum ETF | 0.25 | % | |||||
USAA MSCI Emerging Markets Value Momentum ETF | 0.30 | % | |||||
Amounts incurred and paid to VCM for the six months ended December 31, 2021, are reflected on the Statements of Operations as Investment advisory fees.
Administration and Servicing Fees:
VCM also serves as the Funds' administrator and fund accountant. Under the Administration and Fund Accounting Agreement, VCM is entitled to receive fees based on a percentage of the average daily net assets of the Trust, Victory Variable Insurance Funds and Victory Portfolios. The tiered rates at which VCM is paid by the Funds are shown in the table below:
Net Assets | |||||||||||
Up to $15 billion | $15 billion – $30 billion | Over $30 billion | |||||||||
0.08 | %, plus | 0.05 | %, plus | 0.04 | % | ||||||
Amounts incurred for the six months ended December 31, 2021, are reflected on the Statements of Operations as Administration fees.
Citi Fund Services Ohio, Inc. ("Citi"), an affiliate of Citibank, acts as sub-administrator and sub-fund accountant to the Funds pursuant to the Sub-Administration and Sub-Fund Accounting Services Agreement between VCM and Citi. VCM pays Citi a fee for providing these services. The Trust reimburses VCM and Citi for out-of-pocket expenses incurred in providing these services and certain other expenses specifically allocated to the Funds. Amounts incurred for the six months ended December 31, 2021, are reflected on the Statements of Operations as Sub-Administration fees.
The Funds (as part of the Trust) have entered into an agreement with the Adviser to provide compliance services, pursuant to which the Adviser furnishes its compliance personnel, including the services of the Chief Compliance Officer ("CCO"), and other resources reasonably necessary to provide the Trust with compliance oversight services related to the design, administration, and oversight of a compliance program for the Trust in accordance with Rule 38a-1 under the 1940 Act. The CCO is an employee of the Adviser, which pays the compensation of the CCO and support staff. The funds in the Trust, Victory Variable Insurance Funds, Victory Portfolios, and USAA Mutual Funds (collectively, the "Victory Funds Complex") in the aggregate, compensate the Adviser for these services. Amounts incurred for the six months ended December 31, 2021, are reflected on the Statements of Operations as Compliance fees.
Transfer Agency Fees:
Citibank serves as the Funds' Transfer Agent. Amounts incurred for the six months ended December 31, 2021, are reflected on the Statements of Operations as Transfer agent fees.
Distributor/Underwriting Services:
Foreside Fund Services, LLC ("Foreside") serves as the Funds' distributor.
67
Victory Portfolios II | Notes to Financial Statements — continued December 31, 2021 | ||||||
(Unaudited)
Other Fees:
Citibank serves as the Funds' custodian. The Funds pay Citibank a fee for providing these services. Amounts incurred for the six months ended December 31, 2021, are reflected on the Statements of Operations as Custodian fees.
Sidley Austin LLP provides legal services to the Trust.
The Adviser has entered into expense limitation agreements with the Funds. Under the terms of the agreements, the Adviser has agreed to waive fees or reimburse certain expenses to the extent that ordinary operating expenses incurred by certain Funds in any fiscal year exceed the expense limit for such Fund. Such excess amounts will be the liability of the Adviser. Acquired fund fees and expenses, interest, taxes, brokerage commissions, other expenditures which are capitalized in accordance with GAAP, and other extraordinary expenses not incurred in the ordinary course of a Fund's business are excluded from the expense limits. As of December 31, 2021, the expense limits (excluding voluntary waivers) are as follows:
| In Effect Until October 31, 2022 | |||||||
USAA MSCI USA Value Momentum ETF | 0.20 | % | |||||
USAA MSCI USA Small Cap Value Momentum ETF | 0.25 | % | |||||
USAA MSCI International Value Momentum ETF | 0.35 | % | |||||
USAA MSCI Emerging Markets Value Momentum ETF | 0.45 | % | |||||
Under the terms of the expense limitation agreements, as amended May 1, 2021, the Funds have agreed to repay fees and expenses that were waived or reimbursed by the Adviser for a period of up to three years (thirty-six (36) months) after the waiver or reimbursement took place, subject to the lesser of any operating expense limits in effect at the time of: (a) the original waiver or expense reimbursement; or (b) the recoupment, after giving effect to the recoupment amount. Prior to May 1, 2021, the Funds were permitted to recoup fees waived and expenses reimbursed for up to three years after the fiscal year in which the waiver or reimbursement took place, subject to the limitations above. This change did not have any effect on the amounts previously reported for recoupment.
As of December 31, 2021, the following amounts are available to be repaid to the Adviser. The Funds have not recorded any amounts available to be repaid as a liability due to an assessment that repayments are not probable at December 31, 2021.
| Expires 2023 | Expires 2024 | Expires 2025 | Total | ||||||||||||||||
USAA MSCI USA Value Momentum ETF | $ | 197,876 | $ | 169,706 | $ | 56,677 | $ | 424,259 | |||||||||||
USAA MSCI USA Small Cap Value Momentum ETF | 40,487 | — | — | 40,487 | |||||||||||||||
USAA MSCI International Value Momentum ETF | 71,346 | 144,936 | 42,382 | 258,664 | |||||||||||||||
USAA MSCI Emerging Markets Value Momentum ETF | 114,888 | 195,585 | 84,196 | 394,669 | |||||||||||||||
The Adviser may voluntarily waive or reimburse additional fees to assist the Funds in maintaining competitive expense ratios. Voluntary waivers and reimbursements applicable to the Funds are not available to be recouped at a future time and are reflected on the Statements of Operations as Expenses waived/reimbursed by Adviser. For the six months ended December 31, 2021, the Adviser voluntarily waived the following amounts:
USAA MSCI USA Value Momentum ETF | $ | 72,934 | |||||
| USAA MSCI USA Small Cap Value Momentum ETF | 47,377 | ||||||
USAA MSCI International Value Momentum ETF | 56,860 | ||||||
USAA MSCI Emerging Markets Value Momentum ETF | 38,871 | ||||||
Certain officers and/or interested trustees of the Funds are also officers and/or employees of the Adviser, administrator, fund accountant, sub-administrator, sub-fund accountant, custodian, legal counsel, and distributor.
68
Victory Portfolios II | Notes to Financial Statements — continued December 31, 2021 | ||||||
(Unaudited)
5. Risks:
The Funds may be subject to other risks in addition to these identified risks.
Equity Risk — An investment in the Funds' shares represents an indirect investment in the securities owned by the Funds, some of which will be traded on a national securities exchange or in the over-the-counter markets. The value of the securities in which the Funds invest, like other market investments, may move up or down, sometimes rapidly and unpredictably. The value of the securities in which the Funds invest may affect the value of the Funds' shares. An investment in the Funds' shares at any point in time may be worth less than the original investment, even after taking into account the reinvestment of the Funds' distributions.
Foreign Securities Risk — The USAA MSCI Emerging Markets Value Momentum ETF and USAA MSCI International Value Momentum ETF invest in securities of foreign issuers in various countries. Investing on an international basis involves certain risks not involved in domestic investments including the risk of nationalization or expropriation of assets, imposition of currency exchange controls or restrictions on the repatriation of foreign currency, confiscatory taxation, political or financial instability and diplomatic developments, which could affect the value of a Fund's investments in certain foreign countries. Governments of many countries have exercised, and continue to exercise, substantial influence over many aspects of the private sector through the ownership or control of many companies, including some of the largest in these countries. As a result, government actions in the future could have a significant effect on economic conditions which may adversely affect prices of certain portfolio securities. There is also generally less government supervision and regulation of stock exchanges, brokers and listed companies than in the U.S. Dividends or interest on, or proceeds from the sale of, foreign securities may be subject to foreign withholding taxes, and special U.S. tax considerations may apply. Moreover, foreign economies may differ favorably or unfavorably from the U.S. economy in such respects as growth of gross national product, rate of inflation, capital reinvestment, resource self-sufficiency and balance of payments position. The Schedule of Portfolio Investments includes information on each Fund's holdings, including industry and/or geographic composition, as relevant.
Passive Investment Risk — Each Fund is designed to track its index and is not actively managed. A Fund will not buy or sell shares of an equity security due to current or projected performance of a security, industry or sector, unless that security is added to or removed, respectively, from its index. A Fund does not, therefore, seek returns in excess of its index, and does not attempt to take defensive positions or hedge against potential risks unless such defensive positions are also taken by its index. Different types of investment styles, for example passively managed or actively managed, or growth or value, tend to perform differently and shift into and out of favor with investors depending on changes in market and economic sentiment and conditions. As a result, a Fund's performance may at times be worse than the performance of other mutual funds that invest more broadly or that have different investment styles.
6. Borrowing and Interfund Lending:
Line of Credit:
The Victory Funds Complex participates in a short-term demand note "Line of Credit" agreement with Citibank. The Line of Credit agreement with Citibank was renewed on June 28, 2021, with a termination date of June 27, 2022. Under the agreement with Citibank, the Victory Funds Complex may borrow up to $600 million, of which $300 million is committed and $300 million is uncommitted. $40 million of the Line of Credit is reserved for use by the Victory Floating Rate Fund, another series of the Victory Funds Complex, with Victory Floating Rate Fund paying the related commitment fees for that amount. The purpose of the Line of Credit is to meet temporary or emergency cash needs. For the six months ended December 31, 2021, Citibank received an annual commitment fee of 0.15% on $300 million for providing the Line of Credit. Each fund in the Victory Funds Complex pays a pro-rata portion of the commitment fees plus any interest (one-month London InterBank Offered Rate ("LIBOR") plus one percent, with LIBOR to be replaced by a different benchmark rate in accordance with the terms of the agreement) on amounts borrowed. Prior to June 28, 2021, the Victory Funds Complex paid an annual commitment fee of 0.15% and an upfront fee of 0.10%. Each fund in the Victory Funds Complex paid a
69
Victory Portfolios II | Notes to Financial Statements — continued December 31, 2021 | ||||||
(Unaudited)
pro-rata portion of the upfront fee. Interest charged to each fund during the period, if applicable, is reflected on the Statement of Operations under Line of credit fees.
The average borrowing for the days outstanding and average interest rate for each Fund during the six months ended December 31, 2021, were as follows:
| Amount Outstanding at December 31, 2021 | Average Borrowing* | Days Borrowings Outstanding | Average Interest Rate | Maximum Borrowing During the Period | |||||||||||||||||||
| USAA MSCI Emerging Markets Value Momentum ETF | $ | — | $ | 14,200,000 | 4 | 1.15 | % | 18,000,000 | |||||||||||||||
* For the six months ended December 31, 2021, based on the number of days borrowings were outstanding.
7. Federal Income Tax Information:
Dividends from net investment income, if any, are declared and paid as noted in the table below. Distributable net realized gains, if any, are declared and distributed at least annually from each Fund.
Declared | Paid | ||||||||||
USAA MSCI USA Value Momentum ETF | Monthly | Monthly | |||||||||
USAA MSCI USA Small Cap Value Momentum ETF | Monthly | Monthly | |||||||||
USAA MSCI International Value Momentum ETF | Monthly | Monthly | |||||||||
USAA MSCI Emerging Markets Value Momentum ETF | Monthly | Monthly | |||||||||
The amounts of dividends from net investment income and distributions from net realized gains (collectively, distributions to shareholders) are determined in accordance with federal income tax regulations, which may differ from GAAP. To the extent these "book/tax" differences are permanent in nature (e.g., net operating loss and distribution reclassification), such amounts are reclassified within the components of net assets based on their federal tax-basis treatment; temporary differences (e.g., wash sales) do not require reclassification. To the extent dividends and distributions exceed net investment income and net realized gains for tax purposes, they are reported as distributions of capital. Net investment losses incurred by the Funds may be reclassified as an offset to capital on the accompanying Statements of Assets and Liabilities.
The tax character of current year distributions paid and the tax basis of the current components of accumulated earnings (deficit) will be determined at the end of the current tax year ending June 30, 2022.
As of June 30, 2021, the Funds had net capital loss carryforwards as shown in the table below. It is unlikely that the Board will authorize a distribution of capital gains realized in the future until the capital loss carryforwards have been used.
Short-Term | Long-Term | Total | |||||||||||||
USAA MSCI USA Value Momentum ETF | $ | 46,215,266 | $ | 27,236,702 | $ | 73,451,968 | |||||||||
USAA MSCI USA Small Cap Value Momentum ETF | 29,253,603 | 8,031,372 | 37,284,975 | ||||||||||||
USAA MSCI International Value Momentum ETF | 40,393,661 | 18,995,460 | 59,389,121 | ||||||||||||
USAA MSCI Emerging Markets Value Momentum ETF | 13,909,530 | 6,470,588 | 20,380,118 | ||||||||||||
70
Victory Portfolios II | Supplemental Information December 31, 2021 | ||||||
(Unaudited)
Proxy Voting and Portfolio Holdings Information
Proxy Voting:
Information regarding the policies and procedures each Fund uses to determine how to vote proxies relating to portfolio securities is available without charge, upon request, by calling 800-539-3863. The information is also included in the Funds' Statement of Additional Information, which is available on the SEC's website at www.sec.gov.
Information relating to how the Funds voted proxies relating to portfolio securities held during the most recent 12 months ended June 30 is available on the SEC's website at www.sec.gov.
Availability of Schedules of Portfolio Investments:
The Trust files a complete list of Schedules of Portfolio Investments with the SEC for the first and third quarter of each fiscal year on Form N-PORT. Forms N-PORT are available on the SEC's website at www.sec.gov.
Expense Examples
As a shareholder of the Fund, you may incur two types of costs: (1) transaction costs, and (2) ongoing costs, including management fees and other Fund expenses. These examples are intended to help you understand your ongoing costs (in dollars) of investing in the Fund and to compare these costs with the ongoing costs of investing in other mutual funds.
These examples are based on an investment of $1,000 invested at the beginning of the period and held for the entire period from July 1, 2021, through December 31, 2021.
The Actual Expense figures in the table below provide information about actual account values and actual expenses. You may use the information below, together with the amount you invested, to estimate the expenses that you paid over the period. Simply divide your account value by $1,000 (for example, an $8,600 account value divided by $1,000 = 8.6), then multiply the result by the number in the table under the heading entitled "Actual Expenses Paid During Period" to estimate the expenses you paid on your account during this period.
The Hypothetical Expense figures in the table below provide information about hypothetical account values and hypothetical expenses based on the Fund's actual expense ratio and an assumed rate of return of 5% per year before expenses, which is not the Fund's actual return. The hypothetical account values and expenses may not be used to estimate the actual ending account balance or expenses you paid for the period. You may use this information to compare this 5% hypothetical example with the 5% hypothetical examples that appear in shareholder reports of other funds.
Please note the expenses shown in the table below are meant to highlight your ongoing costs only and do not reflect any transactional costs. Therefore, the hypothetical expenses in the table are useful in comparing ongoing costs only and will not help you determine the relative total costs of owning different funds. In addition, if these transactional costs were included, your costs would have been higher.
| Beginning Account Value 7/1/21 | Actual Ending Account Value 12/31/21 | Hypothetical Ending Account Value 12/31/21 | Actual Expenses Paid During Period 7/1/21- 12/31/21* | Hypothetical Expenses Paid During Period 7/1/21- 12/31/21* | Annualized Expense Ratio During Period 7/1/21- 12/31/21 | ||||||||||||||||||||||
| USAA MSCI USA Value Momentum Index ETF | $ | 1,000.00 | $ | 1,089.90 | $ | 1,024.20 | $ | 1.05 | $ | 1.02 | 0.20 | % | |||||||||||||||
| USAA MSCI USA Small Cap Value Momentum ETF | 1,000.00 | 1,025.70 | 1,024.00 | 1.23 | 1.22 | 0.24 | % | ||||||||||||||||||||
71
Victory Portfolios II | Supplemental Information — continued December 31, 2021 | ||||||
(Unaudited)
| Beginning Account Value 7/1/21 | Actual Ending Account Value 12/31/21 | Hypothetical Ending Account Value 12/31/21 | Actual Expenses Paid During Period 7/1/21- 12/31/21* | Hypothetical Expenses Paid During Period 7/1/21- 12/31/21* | Annualized Expense Ratio During Period 7/1/21- 12/31/21 | ||||||||||||||||||||||
| USAA MSCI International Value Momentum ETF | $ | 1,000.00 | $ | 1,011.70 | $ | 1,023.44 | $ | 1.77 | $ | 1.79 | 0.35 | % | |||||||||||||||
| USAA MSCI Emerging Markets Value Momentum ETF | 1,000.00 | 963.10 | 1,022.94 | 2.23 | 2.29 | 0.45 | % | ||||||||||||||||||||
* Expenses are equal to the average account value multiplied by the Fund's annualized expense ratio multiplied by 184/365 (the number of days in the most recent fiscal half-year divided by the number of days in the fiscal year).
72
Victory Portfolios II | Supplemental Information — continued December 31, 2021 | ||||||
(Unaudited)
Considerations of the Board in Continuing the Investment Advisory Agreement (the "Agreement")
The Board approved the Agreement on behalf of each of the Funds at a meeting, which was called for that purpose, on November 30, 2021. The Board also considered information relating to the Funds and the Agreement provided throughout the year and, more specifically, at the meetings on October 19, 2021, and November 30, 2021. In considering whether to approve the Agreement, the Board requested, and the Adviser provided, information that the Board believed to be reasonably necessary to reach its conclusions.
The Board, including the Independent Trustees, evaluated this information along with other information obtained throughout the year and was advised by legal counsel to the Funds and independent legal counsel to the Independent Trustees.
The Board noted that each Fund assumed the performance of its predecessor fund, that the Adviser became the investment adviser to each Fund on February 26, 2019, and that prior to that date each predecessor fund was managed by a different investment adviser.
The Board took into consideration regular reports from the Adviser throughout the COVID-19 pandemic public health crisis concerning how the ongoing pandemic has affected market volatility, investment risk, liquidity and valuation of portfolio securities, and the implementation and effectiveness of business continuity plans. These reports also had confirmed that the pandemic had no material impact on the Adviser's operations.
The Board considered each Fund's advisory fee, expense ratio and investment performance as significant factors in determining whether the Agreement should be continued. In considering whether the compensation paid to the Adviser was fair and reasonable, the Board also evaluated, among other things, the following factors:
• The requirements of the Funds for the services provided by the Adviser;
• The nature, quality and extent of the services provided and expected to be provided;
• The performance of the Funds as compared to comparable funds;
• The fees payable for the services and whether the fee arrangements provided for economies of scale that would benefit Fund shareholders as the Funds grow (acknowledging that economies of scale can be complex to assess and typically are not directly measurable);
• Whether the fee would be sufficient to enable the Adviser to attract and retain experienced personnel and continue to provide quality services to the Funds;
• Fees paid by other clients of the Adviser whose accounts are managed in a similar investment style and any differences in the services provided to the other clients compared to those provided to the Funds;
• The total expenses of each Fund;
• Management's commitment to operating the Funds at competitive expense levels;
• The profitability of the Adviser (as reflected by comparing fees earned against an estimate of the Adviser's costs) with respect to the Adviser's relationship with the Funds;
• Research and other service benefits received by the Adviser obtained through payment of client commissions for securities transactions;
• Other benefits received by the Adviser, and its affiliates, including revenues paid to the Adviser, or its affiliates, by the Funds for administration and fund accounting services, and distribution;
• The capabilities and financial condition of the Adviser;
• Current economic and industry trends; and
• The historical relationship between the Trust and the Adviser.
The Board reviewed each Fund's current management fee in the context of the Adviser's profitability with respect to each Fund. The Board retained a consultant to provide comparative information about fees and performance. The Board met with the consultant to review its inputs and methodologies, among other things. The Board compared each Fund's gross management fee and total expense ratio on a net and gross basis with the median gross management fee and median expense ratio of a universe of comparable exchange-traded funds ("ETFs") compiled by the consultant and a peer group of funds with similar investment strategies selected
73
Victory Portfolios II | Supplemental Information — continued December 31, 2021 | ||||||
(Unaudited)
by that consultant from the universe. The Board reviewed the factors and methodology used by the consultant in the selection of each Fund's peer group, including the consultant's selection of a broad universe of funds, the more specific universe of comparable funds, and peer groups of funds with comparable investment strategies and asset levels, among other factors.
The Board noted that none of the advisory fee arrangements for the Funds included breakpoints, which would be a structure that results in reduced fees as a fund grows. The Board also considered the Adviser's commitment to limit expenses as discussed in more detail below.
The Board also reviewed the compliance and administrative services provided to the Funds by the Adviser and its affiliates, including the Adviser's oversight of the Funds' day-to-day operations and oversight of Fund accounting, assistance in meeting legal and regulatory requirements, and other services necessary for the operation of the Funds and the Trust.
The Board found that the gross annual management fee paid by each Fund was within the range of management fees paid by each Fund's respective peer group. The Board also found that each Fund's net annual expense ratio was reasonable as compared with each Fund's respective peer group. The Board considered the Adviser's contractual agreement with each Fund to waive its fees and reimburse expenses for a specified period of time, as described in the Fund's prospectus.
The Board reviewed each Fund's performance over the one-year period against the performance of the Fund's selected peer group and benchmark index, noting that each Fund's investment objective is to track its benchmark index before fees and expenses. The Board recognized that the performance of each Fund is net of expenses, while the performance of each benchmark index reflects gross returns, and as a result, each Fund will generally underperform its benchmark index due to fees and expenses. The Board also considered each Fund's tracking error as a factor in evaluating performance.
The Board reviewed various other specific factors with respect to each Fund, as described below. In their deliberations, the Trustees did not rank the importance of any particular information or factor considered and each Trustee may have attributed different weights to various factors.
VictoryShares USAA MSCI USA Value Momentum ETF
Noting that the Fund commenced operations in 2017, the Board compared the Fund's one-year and three-year performance for the periods ended June 30, 2021, to that of the median performance of the Fund's peer group and benchmark index for the same periods and considered the fact that the Fund outperformed the benchmark index for both of the periods reviewed, outperformed the peer group median for the one-year period and underperformed the peer group median for the three-year period.
Having considered, among other things: (1) the Fund's management fee compared to comparable ETFs; (2) the Fund's total expense ratio compared to comparable ETFs; (3) that the Adviser's willingness to limit the expenses for a period of time would provide stability to the Fund's expenses during that period; and (4) that the Fund's performance in relation to its benchmark index and peer group was within an acceptable range, the Board concluded that the Agreement continued to be in the best interests of the Fund's shareholders.
VictoryShares USAA MSCI USA Small Cap Value Momentum ETF
Noting that the Fund commenced operations in 2017, the Board compared the Fund's one-year and three-year performance for the periods ended June 30, 2021, to that of the median performance of the Fund's peer group and benchmark index for the same periods and considered the fact that the Fund outperformed both the benchmark index and the peer group median for both of the periods reviewed.
Having considered, among other things: (1) the Fund's management fee compared to comparable ETFs; (2) the Fund's total expense ratio compared to comparable ETFs; (3) that the Adviser's willingness to limit the expenses for a period of time would provide stability to the Fund's expenses during that period; and (4) that the Fund's performance in relation to its benchmark index and peer group was within an acceptable range, the Board concluded that the Agreement continued to be in the best interests of the Fund's shareholders.
74
Victory Portfolios II | Supplemental Information — continued December 31, 2021 | ||||||
(Unaudited)
VictoryShares USAA MSCI International Value Momentum ETF
Noting that the Fund commenced operations in 2017, the Board compared the Fund's one-year and three-year performance for the periods ended June 30, 2021, to that of the median performance of the Fund's peer group and benchmark index for the same periods and considered the fact that the Fund underperformed the benchmark index for both of the periods reviewed, outperformed the peer group median for the one-year period and underperformed the peer group median for the three-year period.
Having considered, among other things: (1) the Fund's management fee compared to comparable ETFs; (2) the Fund's total expense ratio compared to comparable ETFs; (3) that the Adviser's willingness to limit the expenses for a period of time would provide stability to the Fund's expenses during that period; and (4) that the Fund's performance in relation to its benchmark index and peer group was within an acceptable range, the Board concluded that the Agreement continued to be in the best interests of the Fund's shareholders.
VictoryShares USAA MSCI Emerging Markets Value Momentum ETF
Noting that the Fund commenced operations in 2017, the Board compared the Fund's one-year and three-year performance for the periods ended June 30, 2021, to that of the median performance of the Fund's peer group and benchmark index for the same periods and considered the fact that the Fund underperformed the benchmark index for both of the periods reviewed, outperformed the peer group median for the one-year period and underperformed the peer group median for the three-year period.
Having considered, among other things: (1) the Fund's management fee compared to comparable ETFs; (2) the Fund's total expense ratio compared to comparable ETFs; (3) that the Adviser's willingness to limit the expenses for a period of time would provide stability to the Fund's expenses during that period; and (4) that the Fund's performance in relation to its benchmark index and peer group was within an acceptable range, the Board concluded that the Agreement continued to be in the best interests of the Fund's shareholders.
Conclusion
Based on its review of the information requested and provided, and following extended discussions, the Board determined that the Agreement, on behalf of the Funds discussed above, was consistent with the best interests of each Fund and its shareholders, and the Board unanimously approved the Agreement, on behalf of each Fund, for an additional annual period on the basis of the foregoing review and discussions and the following considerations, among others:
• The fairness and reasonableness of the investment advisory fee payable to the Adviser under the Agreement in light of the investment advisory services provided, the costs of these services, the profitability of the Adviser's relationship with the Fund and the comparability of the fee paid to the fees paid by other investment companies, to the extent applicable;
• The nature, quality and extent of the investment advisory services provided by the Adviser;
• The Adviser's entrepreneurial commitment to the management of the Funds and the creation of a broad-based family of funds, which could entail a substantial commitment of the Adviser's resources to the successful operation of the Funds;
• The Adviser's representations regarding its staffing and capabilities to manage the Funds, including the retention of personnel with relevant portfolio management experience;
• The Adviser's efforts to enhance investment results by, among other things, developing quality portfolio management teams; and
• The overall high quality of the personnel, operations, financial condition, investment management capabilities, methodologies and performance of the Adviser.
75
Privacy Policy
Protecting the Privacy of Information
The Trust respects your right to privacy. We also know that you expect us to conduct and process your business in an accurate and efficient manner. To do so, we must collect and maintain certain personal information about you. This is the information we collect from you on applications or other forms, and from the transactions you make with us or third parties. It may include your name, address, social security number, account transactions and balances, and information about investment goals and risk tolerance.
We do not disclose any information about you or about former customers to anyone except as permitted or required by law. Specifically, we may disclose the information we collect to companies that perform services on our behalf, such as the transfer agent that processes shareholder accounts and printers and mailers that assist us in the distribution of investor materials. We may also disclose this information to companies that perform marketing services on our behalf. This allows us to continue to offer you Victory investment products and services that meet your investing needs, and to effect transactions that you request or authorize. These companies will use this information only in connection with the services for which we hired them. They are not permitted to use or share this information for any other purpose.
To protect your personal information internally, we permit access only by authorized employees and maintain physical, electronic, and procedural safeguards to guard your personal information.*
* You may have received communications regarding information about privacy policies from other financial institutions which gave you the opportunity to "opt-out" of certain information sharing with companies which are not affiliated with that financial institution. The Trust does not share information with other companies for purposes of marketing solicitations for products other than the Trust. Therefore, the Trust does not provide opt-out options to their shareholders.
The Victory Funds
P.O. Box 182593
Columbus, Ohio 43218-2593

Visit our website at: | Call Victory at: | ||||||
www.vcm.com | 866-376-7890 | ||||||
VS-MSCI-ETF-SAR (12/21)
Item 2. Code of Ethics.
Not applicable – only for annual reports.
Item 3. Audit Committee Financial Expert.
Not applicable – only for annual reports.
Item 4. Principal Accountant Fees and Services.
Not applicable – only for annual reports.
Item 5. Audit Committee of Listed Registrants.
Not applicable.
Item 6. Investments.
(a) Not applicable.
(b) Not applicable.
Item 7. Disclosure of Proxy Voting Policies and Procedures for Closed-End Management Investment Companies.
Not applicable.
Item 8. Portfolio Managers of Closed-End Management Investment Companies.
Not applicable.
Item 9. Purchases of Equity Securities by Closed-End Management Investment Company and Affiliated Purchasers.
Not applicable.
Item 10. Submission of Matters to a Vote of Security Holders.
Not applicable.
Item 11. Controls and Procedures.
(a) The registrant’s principal executive officer and principal financial officer have concluded, based on their evaluation of the registrant's disclosure controls and procedures as conducted within 90 days of the filing date of this report, that these disclosure controls and procedures are adequately designed and are operating effectively to ensure that information required to be disclosed by the registrant on Form N-CSR is recorded, processed, summarized and reported within the time periods specified in the Securities and Exchange Commission's rules and forms.
(b) There were no changes in the registrant’s internal control over financial reporting (as defined in Rule 30a-3(d) under the Investment Company Act of 1940 (17 CFR 270.30a-3(d)) that occurred during the period covered by this report that have materially affected or are reasonably likely to materially affect, the registrant’s internal control over financial reporting.
Item 12. Disclosure of Securities Lending Activities for Closed-End Management Investment Companies.
(a)(1) Not applicable.
(a)(2) Not applicable.
(a)(3) Not applicable.
(a)(4) Not applicable.
(b) Not applicable.
Item 13. Exhibits.
(a)(1) Not applicable.
(a)(2) Certifications pursuant to Rule 30a-2(a) are attached hereto.
(a)(3) Not applicable.
(b) Certifications pursuant to Rule 30a-2(b) are furnished herewith.
SIGNATURES
Pursuant to the requirements of the Securities Exchange Act of 1934 and the Investment Company Act of 1940, the registrant
has duly caused this report to be signed on its behalf by the undersigned, thereunto duly authorized.
| (Registrant) | Victory Portfolios II |
| By (Signature and Title)* | /s/ Allan Shaer | |
| Allan Shaer, Principal Financial Officer |
| Date | March 4, 2022 |
Pursuant to the requirements of the Securities Exchange Act of 1934 and the Investment Company Act of 1940, this report has been signed below by the following persons on behalf of the registrant and in the capacities and on the dates indicated.
| By (Signature and Title)* | /s/ Christopher K. Dyer | |
| Christopher K. Dyer, Principal Executive Officer |
| Date | March 4, 2022 |
| By (Signature and Title)* | /s/ Allan Shaer | |
| Allan Shaer, Principal Financial Officer |
| Date | March 4, 2022 |