united states
securities and exchange commission
washington, d.c. 20549
form n-csr
certified shareholder report of registered management
investment companies
Investment Company Act file number 811-22718
Two Roads Shared Trust
(Exact name of registrant as specified in charter)
225 Pictoria Drive, Suite 450, Cincinnati, OH 45246
(Address of principal executive offices) (Zip code)
The Corporation Trust Company
1209 Orange Street Wilmington, DE 19801
(Name and address of agent for service)
Registrant's telephone number, including area code: 631-470-2734
Date of fiscal year end: 10/31
Date of reporting period: 10/31/22
Item 1. Reports to Stockholders.
| Superfund Managed Futures Strategy Fund |
| Class A Shares (SUPRX) |
| Class I Shares (SUPIX) |
| Annual Report |
| October 31, 2022 |
| 1-855-61-SUPER |
| www.SuperfundUS.com |
(Unaudited)
Dear Shareholders:
We are pleased to provide you with the Annual Report for the Superfund Managed Futures Strategy Fund (the “Fund”). The Fund’s return for the twelve-month period ended October 31, 2022 was -8.31% for Class A shares and -8.41% for Class I Shares. The Fund underperformed its benchmark, the Bank of America Merrill Lynch 3-Month U.S. Treasury Bill Index*, which returned 0.79% for the same time period.
Performance Review
November 2021
The Fund underperformed in its Stock Indices positions in November, as market sentiments shifted negatively as news of the new COVID-19 omicron variant emerged; and undermined the gains achieved by major global indices earlier in the month. Inflation concerns prompted most major central banks to continue their rhetoric on tightening monetary policy, leading some 10-year government Bond yields to end the month lower as markets switched to risk-off mode over the new variant. As a result, Bonds proved to be the best performing sector for the Fund due to the taking advantage of rising prices. In the Commodities sector, the monthly decline for oil prices was the worst since March 2020 in response to both the new variant, and President Joe Biden’s announcement that the US will release barrels of oil from its oil reserves to address its nation’s lack of supply. This led to an underperformance of the Fund’s positions in the Energy sector. Other Commodities suffered due to weaker market sentiments and demand concerns, leaving the Fund to produce negative returns in this sector. As investors sought refuge in safe-haven currencies and positioned towards tighter monetary policies, the US dollar strengthened against most market currencies, as did the Japanese yen. Unfortunately, the Fund’s positions in the Currencies sector posted overall negative returns for November. The Fund ended the month with -5.87% and -5.90% for classes A and I, respectively.
December 2021
As with the beginning of 2021, the year came to an end with the new Covid-19 variant dominating the news. While the discovery of this new variant initially created strong market movements, its apparent weaker symptoms soon improved investor sentiments and translated to positive returns for major global indices. Stock Indices was the best performing sector for the Fund. These Stock Indices were bolstered by positions in European indices that performed strongly in December. In Bonds, U.S. yields rose on the back of the continued inflation surge, and the U.S. Federal Reserve hawkish outlook on rate hikes in 2022. The Bonds sector was the worst performing sector for the Fund, which was dragged down by performances in European Bonds. Commodities proved to be a positive performer for the Fund, as the sector saw strong positive price movements in meat and grain markets. Energy markets also had strong gains as natural gas supplies from Russia remained limited due to geopolitical tension. In Japan, while the yen’s depreciation has helped increased profits on overseas businesses and helped support a rise in stocks for the month, the fall in price of the safe-haven assets went against positions held by the Fund, and contributed to the
Investors cannot directly invest in an index and unmanaged index returns do not reflect any fees, expenses or sales charges. Past performance does not guarantee future results and there is no assurance that the Fund will achieve its investment objective.
1
overall negative returns experienced in the Currencies sector, and hence the Fund performed negatively for the month with -1.09% and -1.08% for classes A and I, respectively.
January 2022
The month of January saw markets heavily focused on inflation and geopolitical concerns. U.S. inflation rose as the U.S. economy expanded in the fourth quarter of 2021. Global Bond yields were propelled higher as U.S Treasuries ended the month in a slump, with the U.S. Federal Reserve leaving rates unchanged. For the Fund, the most notable performances were in its energy positions as oil prices reached their highest level since 2014 amid much concern that Russia may restrict energy supplies to Europe, if it is subjected to sanctions resulting from its recent moves to possibly invade Ukraine. Overall, the Fund ended the month positively for both classes A and I with 1.45% and 1.44% respectively.
February 2022
The Russia-Ukraine conflict heralded fresh challenges to a global recovery that was already struggling from the ongoing Covid-19 pandemic. As investors grappled to assess the potential impact of Russia’s invasion and consequent sanctions, equity markets tumbled and were the bottom performers for the Fund. Overall, the Fund underperformed in its Stock Indices positions for February. Bond yields saw some volatility through the month as yields initially rose due to hawkish moves by major central banks, but declined slightly as geopolitical tensions increased throughout the month. The Fund benefited and posted overall positive performance in its Bonds positions. In the Commodities sector, global wheat and oil prices soared as the conflict threatened to disrupt supply chains and induced fears of shortages. Gold also performed well, given its safe-haven status during this period of uncertainty. Overall, the Fund posted positive returns in the Commodities sector. In the Currencies sector, the US dollar weakened against the currencies of commodity producers such as Australia and South Africa, but remained flat against most major currencies. Meanwhile the Russian ruble collapsed after heavy sanctions were imposed. Overall, the Fund achieved positive performances for the month of 1.55% and 1.65% in class A and class I respectively.
March 2022
March’s financial headlines were dominated by the Ukrainian war, inflation, Covid resurgences, and the direct impacts on the markets. Even with current events however, global equities advanced this month, with some indices showing small gains for the first time in 2022. The Fund saw positive returns in its Stock Indices positions, with oversold equities in China. In the US, inflation remained persistent as Russia’s invasion of Ukraine continued to add supply chain and inflationary pressures, which left the US Federal Reserve - as well as other major central banks - with no choice but to continue with rate hikes this year. Global government Bond yields rose in March as a result, and with the resulting fall in Bond prices, the Fund’s short positions generated positive returns. Crude oil prices remained high this month, and western nations were driven to find alternatives to their dependence on Russian gas and oil. Overall, the Fund ended the month strong, with positive returns seen in all invested sectors. The Fund closed the month with 5.76% and 5.68% in both class A and class I respectively.
Investors cannot directly invest in an index and unmanaged index returns do not reflect any fees, expenses or sales charges. Past performance does not guarantee future results and there is no assurance that the Fund will achieve its investment objective.
2
April 2022
Within the month of April, global food costs continued to trend higher as fears of food insecurity in developing nations began to take hold. In the U.S, the economy contracted unexpectedly as government spending waned. Global equities declined as market volatility surged higher, while expectations that the U.S Federal Reserve will intensify its rate hike pace propelled the U.S dollar and Treasury yields higher; leading to losses on the Fund’s Bond positions. In commodities, Russia halted its natural gas shipments to Poland and Bulgaria as these nations refused to comply with Russia’s demand for paying for fuel in rubles. Furthermore, China continued to implement lockdown measures in an effort to curb new surges of the Coronavirus. While the strong performance of the Fund’s positions in gas and oil helped to limit losses, the Fund ended the month with an overall sub-par performance with -1.67% and -1.65% for classes A and I respectively.
May 2022
Despite fears of bear markets and recessions, most major indices ended the month roughly the same way these indices have begun, as the large sell-offs witnessed in April - which initially spilled into May - rebounded. US equities underperformed relative to most overseas markets, while emerging markets rallied near the month’s end, driven by positive sentiment in Chinese stocks due to the easing of Coronavirus restrictions in Shanghai and Beijing. Overall, the Fund underperformed in the Stock Indices sector. In the Bonds sector, major central banks raised interest rates, while US bond yields declined slightly as these benefitted from safe-haven flows in a month of volatility, resulting in the Fund returning losses this month in its bonds positions. The Fund’s performance in commodities was mostly flat this month, as losses in its agriculture and grains positions offset gains made in its energy positions. The US dollar weakened this month against most major and emerging national currencies, except against the Chinese renminbi, which saw considerable depreciation in value amidst an economic downturn in China. The Fund’s positions in the Currencies sector posted overall negative returns for May. The Fund closed the month with -1.58% and -1.56% in both Class A and I respectively.
June 2022
Geopolitical tension and record high inflation continued to place fears that the global market is possibly heading into bear market territory and recession. Despite better-than-expected economic job data, US equities were underpinned relative to Asian equities. European equities underperformed as tension on that side intensified leaving most major EU countries with supply chain issues due to sanctions place on Russia. Emerging markets continued their previous month’s rallies, driven by positive sentiments in Chinese stocks due to relaxed Coronavirus restrictions in China. In the Bonds sector, major central banks maintained hawkish overview and continued rate increases to help curb inflation worries. US bond yields declined slightly and benefitted from safe-haven flows which resulted in the Fund returning positive gains in the Bonds sector this month. The Fund’s Commodities sector suffered this month weighted down by the Energy sector, which saw significant negative returns as prices cratered due to the Organization of
Investors cannot directly invest in an index and unmanaged index returns do not reflect any fees, expenses or sales charges. Past performance does not guarantee future results and there is no assurance that the Fund will achieve its investment objective.
3
Petroleum Exporting Countries (OPEC+) decision to commit ramping up of production to curtail the rising energy prices. In the Currencies sector, the US dollar showed its dominance against most major and emerging national currencies and the Fund posted overall negative returns for June in that sector. Overall, the Fund ended the month negatively for both Classes A and I with -5.17% and -5.22% respectively.
July 2022
During the month of July 2022, the markets remained tethered to the headlines on rising inflation and fears of a global recession. Despite global equities surging with the release of strong earnings reports within the technology sector, the Fund returned overall modicum performance in Stock Indices as positions on CME Mini NASDAQ 100 Index underperformed. The U.S economy experienced two (2) consecutive quarter declines in its Gross Domestic Product (GDP) in 2022 with the latter contracting at an annualized rate of 0.9%. For the Fund, the most notable returns were produced from its Bond positions. U.S Treasuries ended the month higher as mounting inflationary pressures led to the U.S Federal reserve and the European Central Bank (ECB) raising interest rates. Moreover, the Bank of Canada followed suit and raised interest rates to its largest in twenty-four (24) years. The Euro fell briefly to parity against the U.S dollar for the first time in over twenty (20) years. The European Commission has made requests that countries scale back gas consumption by 15%, in a bid to preemptively deal with supply concerns as fears intensified that Russia may reduce the flow of gas into Europe even further as winter approaches. Overall, the Fund ended the month positively with +2.18% and +2.27% for Classes A and I, respectively.
August 2022
During the month of August, developed market equities resumed their declines as it became clear that further substantial interest rate increases would be needed to tame inflation. U.S equities reacted with sharp falls in share prices and volatile trading throughout the month, while emerging markets and Japanese shares posted modest gains. For the Fund, the Stock Indices sector posted overall negative returns. In the Bonds sector, government Bond yields rose sharply as central banks reaffirmed a commitment to rein in price increases. Shorter term maturities outperformed longer term maturities for the Fund. Overall, the Fund returned negative flows in the Bonds sector. The Fund’s performance in commodities was also negative, as losses were seen across the board in its Agriculture, Grains, Metals and Energy sectors. Despite the overall negative returns in commodities, COMEX Gold was among the Fund’s top performing markets. The U.S dollar Index made a new two-decade high in August, significantly outperforming the British pound and euro, while emerging market currencies were mixed versus the U.S dollar. The Fund returned a positive performance in its Currencies positions for the month. However, the Fund ended the month with negative returns of -6.29% and -6.43% for Classes A and I, respectively.
Investors cannot directly invest in an index and unmanaged index returns do not reflect any fees, expenses or sales charges. Past performance does not guarantee future results and there is no assurance that the Fund will achieve its investment objective.
4
September 2022
Global indices saw massive volatility this month, and ended the month lower on the backs of continued rising inflation, and fears that global markets are already in bear market territory. While all major Indices underperform during the month, Asian markets performed the worse, contributing to the overall negative performance in Stock Indices. Bond markets rallied this month resulting in higher yields globally as these became a more lucrative asset class due to hawkish moves by central banks on interest rates. While the United Kingdom (UK) had to intervene to stabilize the gilt that went into a freefall on policy proposals made by Prime Minister Truss, the Fund saw positive returns in its Bonds positions. The Fund’s commodities positions ended the month with positive returns, led by the strength of the Agriculture and Grains sectors. Energy positions took minor losses this month, with OPEC+’s decision to cut back on production in its next meeting to help get oil prices in line with current market conditions going against the Fund’s positions, and thus underperforming for the month. In the Currencies sector, the dollar showed its dominance against most major currencies thanks to the aggressive stances of the Federal Open Market Committee (FOMC), which made the dollar a safe-haven asset to acquire Bonds. Overall, the Fund’s Currency positions saw positive returns. The Fund ended the month with positive returns of 1.90% and 1.88% for both Classes A and I respectively.
October 2022
During October, markets were fettered with headlines on geopolitical risks, central bank’s monetary policies and global growth prospects. Even though global Stock Indices staged a bullish run, the Fund underperformed in this sector. OPEC+ came to an agreement on taking pre-emptive measures to slash oil production targets by two million barrels per day, while the European Union reached a consensus on placing a cap on natural gas prices to combat its energy crisis. For the Fund, though modicum; the most notable returns were produced in the Energy Sector. Another top performing sector for the Fund was the Agricultural Sector, as the commodity trended sharply lower. Bond yields rose with U.S Treasuries, whose prices ended the month lower, resulting in the Fund generating negative returns in its Bonds positions. The European Central Bank (ECB) raised interest rates by 0.75%, and it was expected that the U.S Federal Reserve would follow the same path. U.K financial markets welcomed the appointment of a new Prime Minister after much pressure was felt from the unpopular policies of former the Prime Minister. Overall, the Fund ended the month with a sub-par performance with -1.24% and -1.23% for Classes A and I, respectively.
Derivatives Risk Management Program
Superfund Advisors, Inc (the “Firm”), as the Investment Adviser to the Fund adopted a Derivatives Risk Management Program (“DRMP”) that was reasonably designed to manage and monitor the Fund’s derivatives exposure in accordance with SEC Rule 18f-4 (“the Rule”) beginning 19th August 2022. Pursuant to the Rule, a Derivatives Risk Manager (DRM) was appointed to the Fund. The Firm established a team to assist the DRM with the management of the DRMP.
Investors cannot directly invest in an index and unmanaged index returns do not reflect any fees, expenses or sales charges. Past performance does not guarantee future results and there is no assurance that the Fund will achieve its investment objective.
5
Portfolio Securities Valuation Procedures
The Firm has adopted these procedures for determining fair value in good faith to ensure that the Fund calculates its Net Asset Value (“NAV”) in a timely and accurate manner in accordance with SEC Rule 2a-5 with its companion Rule 31a-4 (together the “Valuation Rule”) commencing 08th September 2022. Pursuant to the Rule, the Adviser was appointed as the Valuation Designee for the Fund and is mainly responsible for fair value determination.
Shareholders’ Distributions or Yield Payouts
The Fund does not have a policy on nor practice the maintenance of specific level of distributions or yield payouts to shareholders.
Strategy Summary and Objectives
To pursue its investment objective, the Fund continues to use a managed futures strategy and principally invests in commodity, financial futures and foreign currency futures markets. The Fund seeks investment opportunities across many market sectors, including: currencies, interest rates, bonds, stock indices, metals, energy, grains and agricultural sectors. The Fund has been consistent with its strategy over the past financial year.
To implement its strategy, the Fund uses fully automated, proprietary, computerized trading systems that examine a broad array of investments around the world and seek to identify market trends and patterns that offer attractive investment opportunities. The Adviser’s trading strategy analyzes data from more than 120 different futures and forwards markets worldwide on an ongoing basis and also analyzes risks related to position size, market correlation, and market volatility of potential investments.
Thank you for your investment in Superfund Managed Futures Strategy Fund.
Mahendra Singh
President/CCO
Superfund Advisors, Inc.
Investors cannot directly invest in an index and unmanaged index returns do not reflect any fees, expenses or sales charges. Past performance does not guarantee future results and there is no assurance that the Fund will achieve its investment objective.
6
| * | Glossary of Indices mentioned in this document: |
| Bank of America Merrill Lynch 3- Month U.S. Treasury Bill Index | Tracks the performance of short-term U.S. Government securities with a remaining term to final maturity of less than 3 months. This is the primary benchmark for the Fund. |
| CME Mini NASDAQ 100 Index | Offers exposure to a modified capitalization-weighted index of 100 of the largest and most active non-financial, domestic stocks traded on the Nasdaq Stock Market |
| COMEX Gold | This is the primary futures and options market for the trading of metals. These metals include gold, silver, copper, and aluminum. |
| OPEC+ | A larger group of the Organization of the Petroleum Exporting Countries formed in 2016. |
The views in this report are those of the Fund’s management. This report contains certain forward-looking statements about factors that may affect the performance of the Fund in the future. These statements are based on the Fund’s management’s predictions and expectations concerning certain future events such as the performance of the economy as a whole and of specific industry sectors. Management believes these forward-looking statements are reasonable, although they are inherently uncertain and difficult to predict.
9569-NLD 12/23/2022
Investors cannot directly invest in an index and unmanaged index returns do not reflect any fees, expenses or sales charges. Past performance does not guarantee future results and there is no assurance that the Fund will achieve its investment objective.
7
Superfund Managed Futures Strategy Fund
PORTFOLIO REVIEW (Unaudited)
October 31, 2022
The Fund’s performance figures* for the year ended October 31, 2022, as compared to its benchmark:
| Annualized | ||||
| One Year | Three Years | Five Years | Since Inception(a) | |
| Class A | (8.31)% | 9.95% | 6.57% | 4.95% |
| Class A with 5.75 % load(b) | (13.55)% | 7.79% | 5.32% | 4.25% |
| Class I | (8.41)% | 9.93% | 6.62% | 5.08% |
| Bank of America Merrill Lynch 3-Month U.S. Treasury Bill Index(c) | 0.79% | 0.59% | 1.17% | 0.78% |
| * | The performance data quoted here represents past performance. Current performance may be lower or higher than the performance data quoted above. Investment return and principal value will fluctuate, so that shares, when redeemed, may be worth more or less than their original cost. The returns shown do not reflect the deduction of taxes that a shareholder would pay on Fund distributions or on the redemptions of Fund shares. Total returns would have been lower absent the fee waiver noted below. Past performance is no guarantee of future results. The Fund’s total annual operating expenses prior to expense waivers are 3.24% and 2.99% for Class A and Class I shares, respectively, per the March 1, 2022 prospectus (as amended). For performance information current to the most recent month-end, please call toll-free 1-855-61-SUPER. |
The Fund’s Advisor has contractually agreed to reduce the Fund’s fees and/or absorb expenses of the Fund, including distribution and service (12b-1) fees and acquired fund fees and expenses, until February 28, 2024 to ensure that total annual Fund operating expenses (exclusive of any front-end or contingent deferred loads; brokerage fees and commissions; borrowing costs, such as interest and dividend expense on securities sold short; taxes; and extraordinary expenses, such as litigation expenses) do not exceed 0.00% of average daily net assets attributable to each of Class A and Class I shares, respectively. The Fund’s Rule 12b-1 fee is contractually waived to 0.00% with respect to Class A until February 28, 2024. These agreements may be terminated by the Fund’s Board of Trustees on 60 days’ written notice to the Advisor. There is no guarantee that any of these expense limitation and fee waiver arrangements will continue in place after February 28, 2024, at which time it will be determined whether such agreements will be renewed or revised.
| (a) | Superfund Managed Futures Strategy Fund Class A shares and Class I shares commenced operations on December 31, 2013. |
| (b) | Effective as of February 28, 2020, the Fund has waived the front-end sales charge on all direct purchases of Fund shares and for certain other investors as described in the Fund’s prospectus. |
| (c) | The Bank of America Merrill Lynch 3-Month U.S. Treasury Bill Index is an index of short-term U.S. Government securities with a remaining term to final maturity of less than three months. Investors cannot invest directly in an index, and index performance does not reflect deductions for fees, expenses or taxes. Index returns are gross of any fees, brokerage commissions or other expenses of investing. |
Class A
Comparison of the Change in Value of a $10,000 Investment

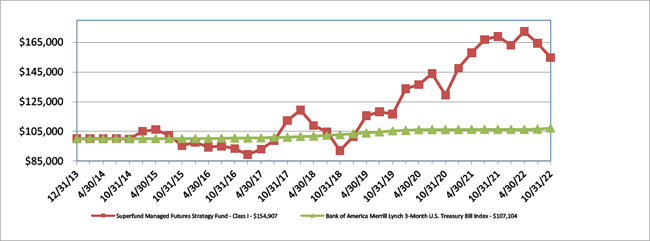
Class I
Comparison of the Change in Value of a $100,000 Investment
The Fund’s asset classes are as follows:
| Holdings by Asset Class | % of Net Assets | |||
| Other Assets Less Liabilities (1) | 100.0 | % | ||
| 100.0 | % | |||
| (1) | The value of the Fund’s derivative positions that provide exposure to a managed futures program is included in “other assets less liabilities”; however, the portfolio composition detailed above does not include derivatives exposure. See the accompanying notes for more information on the impact of the Fund’s derivative positions on the consolidated financial statements. |
8
SUPERFUND MANAGED FUTURES STRATEGY FUND
CONSOLIDATED SCHEDULE OF INVESTMENTS
October 31, 2022
OPEN FUTURES CONTRACTS
| Number of | Fair Value / Unrealized | |||||||||||||
| Contracts(a) | Open Long Futures Contracts | Expiration Date | Notional Amount | Appreciation (Depreciation) | ||||||||||
| 2 | CBOT $5 Mini Dow Jones Industrial Average e-CBOT Future | 12/16/2022 | 327,750 | $ | 5,840 | |||||||||
| 19 | CBOT Corn Future(b) | 12/14/2022 | 656,925 | 37,837 | ||||||||||
| 2 | CBOT Soybean Oil Future(b) | 12/14/2022 | 87,852 | 11,268 | ||||||||||
| 9 | CBOT US Long Bond Future(b) | 12/20/2022 | 1,084,500 | (4,938 | ) | |||||||||
| 3 | CBOT Wheat Future(b) | 12/14/2022 | 132,338 | 3,771 | ||||||||||
| 3 | CME Euro FX/Japanese Yen Cross Rate Currency Future(b) | 12/19/2022 | 55,001,250 | 8,642 | ||||||||||
| 2 | CME Feeder Cattle Future(b) | 01/26/2023 | 179,450 | (451 | ) | |||||||||
| 8 | CME Lean Hogs Future(b) | 12/14/2022 | 271,760 | (7,298 | ) | |||||||||
| 3 | CME Live Cattle Future(b) | 12/30/2022 | 182,970 | (495 | ) | |||||||||
| 2 | CME Live Cattle Future(b) | 02/28/2023 | 124,660 | 403 | ||||||||||
| 1 | CME Mexican Peso Currency Future(b) | 12/19/2022 | 25,020 | 133 | ||||||||||
| 9 | CME New Zealand Dollar Currency Future(b) | 12/19/2022 | 523,215 | 12,448 | ||||||||||
| 2 | CME Random Length Lumber Future(b) | 01/13/2023 | 99,880 | (10,758 | ) | |||||||||
| 2 | CME Swiss Franc Currency Future(b) | 12/19/2022 | 251,013 | (56 | ) | |||||||||
| 2 | CME Yen Denominated Nikkei 225 Index Future | 12/08/2022 | 27,550,000 | 901 | ||||||||||
| 3 | Cocoa Future(b) | 12/13/2022 | 57,570 | 292 | ||||||||||
| 1 | Eurex 10 Year Euro BUND Future(b) | 12/08/2022 | 138,440 | (1,547 | ) | |||||||||
| 1 | Eurex 30 Year Euro BUXL Future(b) | 12/08/2022 | 144,220 | 4,503 | ||||||||||
| 1 | Eurex DAX Index Future | 12/16/2022 | 332,225 | 17,373 | ||||||||||
| 1 | Euronext CAC 40 Index Future | 11/18/2022 | 62,685 | 723 | ||||||||||
| 6 | Euronext Maize Future(b) | 03/06/2023 | 102,000 | 1,693 | ||||||||||
| 6 | Euronext Rapeseed Future(b) | 01/31/2023 | 199,500 | 9,487 | ||||||||||
| 4 | French Government Bond Futures(b) | 12/08/2022 | 531,520 | (9,805 | ) | |||||||||
| 3 | FTSE 100 Index Future | 12/16/2022 | 213,225 | 905 | ||||||||||
| 5 | HKG Hang Seng China Enterprises Index Future | 11/29/2022 | 1,234,750 | (3,363 | ) | |||||||||
| 5 | ICE Brent Crude Oil Future(b) | 11/30/2022 | 464,050 | 8,790 | ||||||||||
| 1 | ICE Brent Crude Oil Future(b) | 12/29/2022 | 91,020 | 1,280 | ||||||||||
| 1 | ICE Gas Oil Future(b) | 11/10/2022 | 110,025 | 10,625 | ||||||||||
| 1 | ICE Gas Oil Future(b) | 12/12/2022 | 101,975 | (4,350 | ) | |||||||||
| 2 | KCBT Hard Red Winter Wheat Future(b) | 12/14/2022 | 97,875 | 7,163 | ||||||||||
| 2 | LME Lead Future(b) | 12/19/2022 | 98,729 | (1,471 | ) | |||||||||
| 8 | LME Primary Aluminum Future(b) | 12/19/2022 | 445,200 | (30,688 | ) | |||||||||
| 1 | LME Zinc Future(b) | 12/19/2022 | 67,875 | (11,013 | ) | |||||||||
| 4 | MDE Crude Palm Oil Future(b) | 01/13/2023 | 405,400 | 2,586 | ||||||||||
| 46 | MDE Kuala Lumpur Composite Index Future | 11/30/2022 | 3,360,300 | (669 | ) | |||||||||
| 1 | MEFF Madrid IBEX 35 Index Future | 11/18/2022 | 79,500 | 10 | ||||||||||
| 1 | MGE Red Wheat Future(b) | 12/14/2022 | 49,063 | 5,800 | ||||||||||
| 1 | Montreal Exchange 10 Year Canadian Bond Future(b) | 12/19/2022 | 123,030 | (93 | ) | |||||||||
| 2 | NYBOT CTN Frozen Concentrated Orange Juice A(b) | 01/10/2023 | 60,330 | (330 | ) | |||||||||
| 2 | NYBOT FINEX United States Dollar Index Future(b) | 12/19/2022 | 222,840 | (2,620 | ) | |||||||||
| 3 | NYMEX Brent Crude Oil Last Day Future Contract(b) | 11/30/2022 | 278,430 | (4,300 | ) | |||||||||
| 7 | NYMEX Light Sweet Crude Oil Future(b) | 11/21/2022 | 605,710 | 7,210 | ||||||||||
| 1 | NYMEX Light Sweet Crude Oil Future(b) | 12/20/2022 | 85,400 | (150 | ) | |||||||||
| 2 | NYMEX NY Harbor ULSD Futures(b) | 12/30/2022 | 294,042 | (340 | ) | |||||||||
| 3 | NYMEX Platinum Future(b) | 01/27/2023 | 139,515 | 1,870 | ||||||||||
| 2 | NYMEX Reformulated Gasoline Blendstock for Oxygen Blending RBOB Future(b) | 11/30/2022 | 212,159 | 2,587 | ||||||||||
| 3 | OSE Gold Future(b) | 08/28/2023 | 23,346,000 | (3,446 | ) | |||||||||
| 4 | OSE Nikkei 225 mini-Future | 12/08/2022 | 11,020,000 | 302 | ||||||||||
See accompanying notes to consolidated financial statements.
9
SUPERFUND MANAGED FUTURES STRATEGY FUND
CONSOLIDATED SCHEDULE OF INVESTMENTS (Continued)
October 31, 2022
OPEN FUTURES CONTRACTS (Continued)
| Number of | Fair Value / Unrealized | |||||||||||||
| Contracts(a) | Open Long Futures Contracts | Expiration Date | Notional Amount | Appreciation (Depreciation) | ||||||||||
| 6 | OSE Platinum Future(b) | 06/27/2023 | 12,831,000 | $ | 4,518 | |||||||||
| 10 | OSE Platinum Future(b) | 08/28/2023 | 21,320,000 | 6,948 | ||||||||||
| 1 | SFE 3 Year Australian Bond Future(b) | 12/15/2022 | 96,660 | (76 | ) | |||||||||
| 2 | SGX FTSE Taiwan Index Futures | 11/29/2022 | 91,540 | 1,640 | ||||||||||
| 1 | SGX Nifty 50 Index Futures | 11/24/2022 | 36,121 | 109 | ||||||||||
| 1 | SGX Nikkei 225 Stock Index Future | 12/08/2022 | 13,765,000 | 120 | ||||||||||
| 1 | TCM Crude Oil Future(b) | 03/31/2023 | 3,759,500 | (324 | ) | |||||||||
| 2 | TSE TOPIX (Tokyo Price Index) Future | 12/08/2022 | 38,520,000 | 1,718 | ||||||||||
| 7 | WCE Canola Future(b) | 01/13/2023 | 123,060 | 498 | ||||||||||
| 3 | White Sugar Future(b) | 11/15/2022 | 79,080 | (3,295 | ) | |||||||||
| Net Unrealized Appreciation on Long Futures Contracts | $ | 78,117 | ||||||||||||
OPEN FUTURES CONTRACTS
| Number of | Fair Value / Unrealized | |||||||||||||
| Contracts(a) | Open Short Futures Contracts | Expiration Date | Notional Amount | Appreciation (Depreciation) | ||||||||||
| 4 | CBOE Volatility Index Future | 11/16/2022 | 103,501 | $ | 8,349 | |||||||||
| 7 | CBOT 10 Year US Treasury Note(b) | 12/20/2022 | 774,158 | 20,600 | ||||||||||
| 17 | CBOT 2 Year US Treasury Note(b) | 12/30/2022 | 3,474,494 | 47,923 | ||||||||||
| 11 | CBOT 5 Year US Treasury Note(b) | 12/30/2022 | 1,172,534 | 19,471 | ||||||||||
| 2 | CBOT Soybean Future(b) | 01/13/2023 | 141,950 | (2,931 | ) | |||||||||
| 2 | CBOT Soybean Meal Future(b) | 12/14/2022 | 85,620 | (4,560 | ) | |||||||||
| 4 | CME British Pound Currency Future(b) | 12/19/2022 | 287,150 | (14,192 | ) | |||||||||
| 9 | CME Canadian Dollar Currency Future(b) | 12/20/2022 | 660,645 | 6,992 | ||||||||||
| 1 | CME E-mini Russell 2000 Index Futures | 12/16/2022 | 92,650 | (7,735 | ) | |||||||||
| 4 | CME Euro Foreign Exchange Currency Future(b) | 12/19/2022 | 496,175 | (5,764 | ) | |||||||||
| 1 | CME Euro FX/British Pound Cross Rate Currency Future(b) | 12/19/2022 | 107,994 | (189 | ) | |||||||||
| 4 | CME Japanese Yen Currency Future(b) | 12/19/2022 | 338,300 | 4,288 | ||||||||||
| 1 | COMEX Copper Future(b) | 12/28/2022 | 84,375 | (1,013 | ) | |||||||||
| 14 | COMEX Gold 100 Troy Ounces Future(b) | 12/28/2022 | 2,296,980 | 15,820 | ||||||||||
| 25 | Eurex 2 Year Euro SCHATZ Future(b) | 12/08/2022 | 2,673,375 | 10,976 | ||||||||||
| 8 | Eurex 5 Year Euro BOBL Future(b) | 12/08/2022 | 957,360 | (653 | ) | |||||||||
| 2 | Euronext Amsterdam Index Future | 11/18/2022 | 267,556 | (9,443 | ) | |||||||||
| 5 | Euronext Milling Wheat Future(b) | 12/12/2022 | 88,063 | (2,010 | ) | |||||||||
| 1 | FTSE/MIB Index Future | 12/16/2022 | 112,715 | (6,508 | ) | |||||||||
| 18 | FVSA Index - Mini-Futures on VSTOXX | 11/16/2022 | 45,450 | 3,459 | ||||||||||
| 2 | LME Copper Future(b) | 12/19/2022 | 374,950 | 25,300 | ||||||||||
| 2 | LME Lead Future (b) | 12/19/2022 | 98,729 | (5,729 | ) | |||||||||
| 8 | LME Primary Aluminum Future (b) | 12/19/2022 | 445,200 | (16,825 | ) | |||||||||
| 1 | LME Zinc Future (b) | 12/19/2022 | 67,875 | 10,800 | ||||||||||
| 1 | Long Gilt Future(b) | 12/28/2022 | 102,130 | (7,408 | ) | |||||||||
| 2 | NYBOT CSC C Coffee Future(b) | 12/19/2022 | 133,275 | 24,731 | ||||||||||
| 8 | NYBOT CSC Cocoa Future(b) | 12/14/2022 | 186,800 | (1,920 | ) | |||||||||
| 1 | NYBOT CSC Number 11 World Sugar Future(b) | 02/28/2023 | 20,126 | (370 | ) | |||||||||
| 7 | NYBOT CTN Number 2 Cotton Future(b) | 12/07/2022 | 252,000 | 69,440 | ||||||||||
| 4 | OML Stockholm OMXS30 Index Future | 11/18/2022 | 785,200 | (504 | ) | |||||||||
| 5 | SAFEX FTSE/JSE Top 40 Index Future | 12/15/2022 | 3,023,250 | (4,647 | ) | |||||||||
See accompanying notes to consolidated financial statements.
10
SUPERFUND MANAGED FUTURES STRATEGY FUND
CONSOLIDATED SCHEDULE OF INVESTMENTS (Continued)
October 31, 2022
OPEN FUTURES CONTRACTS (Continued)
| Number of | Fair Value / Unrealized | |||||||||||||
| Contracts(a) | Open Short Futures Contracts | Expiration Date | Notional Amount | Appreciation (Depreciation) | ||||||||||
| 7 | SFE 10 Year Australian Bond Future(b) | 12/15/2022 | 673,645 | $ | (9,760 | ) | ||||||||
| 1 | SFE S&P ASX Share Price Index 200 Future | 12/15/2022 | 171,400 | (1,572 | ) | |||||||||
| 20 | SGX FTSE China A50 Futures Contract | 11/29/2022 | 223,220 | 12,651 | ||||||||||
| 3 | SGX MSCI Singapore Index Future | 11/29/2022 | 83,400 | (1,737 | ) | |||||||||
| 1 | TSE Japanese 10 Year Bond Futures(b) | 12/13/2022 | 148,770,000 | (1,772 | ) | |||||||||
| Net Unrealized Appreciation on Short Futures Contracts | $ | 173,558 | ||||||||||||
| Net Unrealized Appreciation on Futures Contracts | $ | 251,675 | ||||||||||||
| (a) | All collateral for open futures contracts consists of cash included as deposits with the broker. |
| (b) | All portion of this investment is a holding of the Superfund Managed Futures Strategy (Cayman) Fund, Ltd. |
| BOBL | Bundes Obligation |
| CAC | French Stock Market Index |
| CBOE | Chicago Board Options Exchange |
| CBOT | Central Bank of Turkey |
| CME | Chicago Mercantile Exchange |
| COMEX | Commodity Exchange |
| CSC | Canadian Securities Course |
| CTN | Customer Transaction Note |
| DAX | Deutscher Aktienindex |
| FINEX | Financial Instruments Exchange |
| FTSE | Financial Times Stock Exchange |
| IBEX | Spanish Stock Index |
| ICE | Intercontinental Exchange Inc. |
| JSE | Johannesburg Stock Exchange |
| KCBT | Kansas City Board of Trade |
| LME | London Metal Exchange |
| MDE | Malaysia Derivatives Exchange |
| MEFF | Mercado Español de Futuros Financieros |
| MGE | Minneapolis Grain Exchange |
| NYBOT | The New York Board of Trade |
| NYMEX | The New York Mercantile Exchange |
| OMXS | Stockholm Index |
| OSE | Osaka Securities Exchange |
| RBOB | Reformulated Gasoline Blendstock for Oxygen Blending |
| S&P | Standard & Poor’s |
| SAFEX | South Asian Federation of Stock Exchanges |
| SFE | Sydney Futures Exchange |
| SGX | Stock Exchange of Singapore |
| STOXX | Stock Index of Eurozone Stocks |
| TSE | Tokyo Stock Exchange |
| ULSD | Ultra Low Sulfur Diesel |
| VSTOXX | Volatility Derivatives on Eurex Exchange |
| WCE | Winnipeg Commodity Exchange |
See accompanying notes to consolidated financial statements.
11
SUPERFUND MANAGED FUTURES STRATEGY FUND
CONSOLIDATED SCHEDULE OF INVESTMENTS (Continued)
October 31, 2022
Forward Foreign Currency Contracts
| Currency Units to | Unrealized | |||||||||||||||
| Foreign Currency | Settlement Date | Counterparty | Receive/Deliver | In Exchange For | Appreciation/(Depreciation) | |||||||||||
| To Buy: | ||||||||||||||||
| Brazilian Real | 12/21/2022 | INTL FCStone | 900,000 | $ | 172,401 | $ | 1,618 | |||||||||
| British Pound | 12/21/2022 | ADM | 200,000 | 229,752 | (794 | ) | ||||||||||
| Chinese Yuan | 12/21/2022 | INTL FCStone | 600,000 | 82,486 | (1,616 | ) | ||||||||||
| Columbian Peso | 12/21/2022 | INTL FCStone | 600,000,000 | 120,482 | (6,135 | ) | ||||||||||
| Euro | 12/21/2022 | ADM | 100,000 | 99,212 | (1,704 | ) | ||||||||||
| Hungarian Forints | 12/21/2022 | ADM | 40,000,000 | 95,164 | 495 | |||||||||||
| Indian Rupee | 12/21/2022 | INTL FCStone | 5,000,000 | 60,048 | (3,123 | ) | ||||||||||
| Indonesia Rupiah | 12/21/2022 | INTL FCStone | 1,000,000,000 | 63,860 | (1,671 | ) | ||||||||||
| Mexican Peso | 12/21/2022 | ADM | 7,500,000 | 375,111 | 4,942 | |||||||||||
| Peruvian Sole | 12/21/2022 | INTL FCStone | 800,000 | 200,119 | (4,296 | ) | ||||||||||
| Polish Zloty | 12/21/2022 | ADM | 400,000 | 83,025 | (844 | ) | ||||||||||
| Singapore Dollar | 12/21/2022 | ADM | 400,000 | 282,630 | 894 | |||||||||||
| South African Rand | 12/21/2022 | ADM | 1,000,000 | 54,238 | (384 | ) | ||||||||||
| Swedish Krona | 12/21/2022 | ADM | 600,000 | 54,570 | (314 | ) | ||||||||||
| Swiss Franc | 12/21/2022 | ADM | 500,000 | 502,415 | (20,236 | ) | ||||||||||
| $ | 2,475,513 | $ | (33,168 | ) | ||||||||||||
See accompanying notes to consolidated financial statements.
12
SUPERFUND MANAGED FUTURES STRATEGY FUND
CONSOLIDATED SCHEDULE OF INVESTMENTS (Continued)
October 31, 2022
Forward Foreign Currency Contracts (continued)
| Currency Units to | Unrealized | |||||||||||||||
| Foreign Currency | Settlement Date | Counterparty | Receive/Deliver | In Exchange For | Appreciation/(Depreciation) | |||||||||||
| To Sell: | ||||||||||||||||
| Brazilian Real | 12/21/2022 | INTL FCStone | 900,000 | $ | 172,402 | $ | (5,683 | ) | ||||||||
| British Pound | 12/21/2022 | ADM | 200,000 | 229,752 | (6,297 | ) | ||||||||||
| Canadian Dollar | 12/21/2022 | ADM. | 100,000 | 73,451 | (477 | ) | ||||||||||
| Chinese Yuan | 12/21/2022 | INTL FCStone | 1,200,000 | 164,971 | 8,960 | |||||||||||
| Columbian Peso | 12/21/2022 | INTL FCStone | 1,200,000,000 | 240,964 | 19,617 | |||||||||||
| Czech Koruna | 12/21/2022 | ADM | 6,000,000 | 241,497 | (1,842 | ) | ||||||||||
| Danish Krone | 12/21/2022 | ADM | 1,200,000 | 159,987 | (370 | ) | ||||||||||
| Euro | 12/21/2022 | ADM | 300,000 | 297,635 | 1,044 | |||||||||||
| Hungarian Forints | 12/21/2022 | ADM | 40,000,000 | 95,163 | (3,410 | ) | ||||||||||
| Indian Rupee | 12/21/2022 | INTL FCStone | 30,000,000 | 360,288 | 9,371 | |||||||||||
| Indonesia Rupiah | 12/21/2022 | INTL FCStone | 12,000,000,000 | 766,320 | 25,075 | |||||||||||
| Mexican Peso | 12/21/2022 | ADM | 3,000,000 | 150,044 | (4,734 | ) | ||||||||||
| Norwegian Krone | 12/21/2022 | ADM | 600,000 | 57,816 | (1,791 | ) | ||||||||||
| Peruvian Sole | 12/21/2022 | INTL FCStone | 1,200,000 | 300,179 | (21 | ) | ||||||||||
| Philippine Peso | 12/21/2022 | INTL FCStone | 18,000,000 | 308,309 | 3,651 | |||||||||||
| Polish Zloty | 12/21/2022 | ADM | 400,000 | 83,025 | (2,859 | ) | ||||||||||
| Singapore Dollar | 12/21/2022 | ADM | 400,000 | 282,630 | 2,933 | |||||||||||
| South African Rand | 12/21/2022 | ADM | 3,000,000 | 162,713 | 8,999 | |||||||||||
| South Korean Won | 12/21/2022 | INTL FCStone | 100,000,000 | 70,105 | 4,104 | |||||||||||
| Swedish Krona | 12/21/2022 | ADM | 1,200,000 | 109,141 | 3,641 | |||||||||||
| Swiss Franc | 12/21/2022 | ADM | 600,000 | 602,899 | 11,665 | |||||||||||
| $ | 4,929,291 | $ | 71,576 | |||||||||||||
| Net unrealized appreciation on forward foreign currency contracts | $ | 38,408 | ||||||||||||||
See accompanying notes to consolidated financial statements.
13
SUPERFUND MANAGED FUTURES STRATEGY FUND
CONSOLIDATED SCHEDULE OF INVESTMENTS (Continued)
October 31, 2022
Forward Foreign Currency Contracts (Continued)
Cross Currency Contracts:
| U.S. Dollar | U.S. Dollar | |||||||||||||||||||||||||
| Settlement | Local Currency | Local Currency | Market Value | Market | Unrealized | |||||||||||||||||||||
| Foreign Currency | Date | Counterparty | Amount Purchased | Amount Sell | Buy | Value Sell | Appreciation/(Depreciation) | |||||||||||||||||||
| To Buy: | To Sell: | |||||||||||||||||||||||||
| Australian Dollar | Canadian Dollar | 12/21/2022 | ADM | 100,000 | 88,042 | 64,059 | (64,668 | ) | $ | (609 | ) | |||||||||||||||
| Australian Dollar | Japanese Yen | 12/21/2022 | ADM | 400,000 | 37,704,000 | 256,234 | (255,230 | ) | 1,004 | |||||||||||||||||
| Australian Dollar | New Zealand Dollar | 12/21/2022 | ADM | 800,000 | 909,340 | 512,469 | (528,981 | ) | (16,512 | ) | ||||||||||||||||
| British Pound | Canadian Dollar | 12/21/2022 | ADM | 200,000 | 308,420 | 229,751 | (226,537 | ) | 3,214 | |||||||||||||||||
| British Pound | Euro | 12/21/2022 | ADM | 264,180 | 300,000 | 303,478 | (297,635 | ) | 5,843 | |||||||||||||||||
| British Pound | Japanese Yen | 12/21/2022 | ADM | 200,000 | 32,503,000 | 229,751 | (220,023 | ) | 9,728 | |||||||||||||||||
| British Pound | Swiss Franc | 12/21/2022 | ADM | 363,928 | 400,000 | 418,065 | (401,933 | ) | 16,132 | |||||||||||||||||
| Canadian Dollar | Australian Dollar | 12/21/2022 | ADM | 534,002 | 600,000 | 392,229 | (384,352 | ) | 7,877 | |||||||||||||||||
| Canadian Dollar | British Pound | 12/21/2022 | ADM | 299,860 | 200,000 | 220,250 | (229,752 | ) | (9,502 | ) | ||||||||||||||||
| Canadian Dollar | Japanese Yen | 12/21/2022 | ADM | 200,000 | 20,967,400 | 146,902 | (141,935 | ) | 4,967 | |||||||||||||||||
| Czech Koruna | Euro | 12/21/2022 | ADM | 12,000,000 | 481,174 | 482,994 | (477,381 | ) | 5,613 | |||||||||||||||||
| Euro | British Pound | 12/21/2022 | ADM | 500,000 | 438,972 | 496,059 | (504,273 | ) | (8,214 | ) | ||||||||||||||||
| Euro | Hungarian Forints | 12/21/2022 | ADM | 237,024 | 100,000,000 | 235,156 | (237,908 | ) | (2,752 | ) | ||||||||||||||||
| Euro | Japanese Yen | 12/21/2022 | ADM | 200,000 | 28,298,000 | 198,423 | (191,558 | ) | 6,865 | |||||||||||||||||
| Euro | Norwegian Krone | 12/21/2022 | ADM | 467,015 | 4,800,000 | 463,334 | (462,529 | ) | 805 | |||||||||||||||||
| Euro | Swedish Krona | 12/21/2022 | ADM | 665,278 | 7,200,000 | 660,033 | (654,844 | ) | 5,189 | |||||||||||||||||
| Euro | Swiss Franc | 12/21/2022 | ADM | 305,523 | 300,000 | 303,115 | (301,450 | ) | 1,665 | |||||||||||||||||
| Hungarian Forints | Euro | 12/21/2022 | ADM | 100,000,000 | 237,583 | 237,908 | (235,710 | ) | 2,198 | |||||||||||||||||
| Japanese Yen | Australian Dollar | 12/21/2022 | ADM | 37,264,569 | 400,000 | 252,256 | (256,234 | ) | (3,978 | ) | ||||||||||||||||
| Japanese Yen | British Pound | 12/21/2022 | ADM | 31,720,000 | 200,000 | 214,723 | (229,752 | ) | (15,029 | ) | ||||||||||||||||
| New Zealand Dollar | Australian Dollar | 12/21/2022 | ADM | 892,848 | 800,000 | 519,388 | (512,469 | ) | 6,919 | |||||||||||||||||
| Norwegian Krone | Euro | 12/21/2022 | ADM | 1,800,000 | 175,332 | 173,448 | (173,949 | ) | (501 | ) | ||||||||||||||||
| Swedish Krona | Euro | 12/21/2022 | ADM | 1,200,000 | 110,110 | 109,141 | (109,243 | ) | (102 | ) | ||||||||||||||||
| Swiss Franc | British Pound | 12/21/2022 | ADM | 400,000 | 366,668 | 401,933 | (421,213 | ) | (19,280 | ) | ||||||||||||||||
| Swiss Franc | Euro | 12/21/2022 | ADM | 300,000 | 308,903 | 301,449 | (306,467 | ) | (5,018 | ) | ||||||||||||||||
| 191,314,227 | 238,096,944 | $ | 7,822,548 | $ | (7,826,026 | ) | $ | (3,478 | ) | |||||||||||||||||
| Net unrealized appreciation on forward foreign currency contracts and forward foreign cross currency contracts | $ | 34,930 | ||||||||||||||||||||||||
ADM - ADM Investor Services, Inc.
INTL FCStone - International FCStoine, Inc.
See accompanying notes to consolidated financial statements.
14
| Superfund Managed Futures Strategy Fund |
| CONSOLIDATED STATEMENT OF ASSETS AND LIABILITIES |
| October 31, 2022 |
| ASSETS | ||||
| Cash | $ | 11,137,983 | ||
| Cash held for collateral at broker for futures and forward foreign currency contracts | 1,677,564 | |||
| Due from Advisor | 3,919 | |||
| Net unrealized appreciation on futures contracts | 460,793 | |||
| Net unrealized appreciation on forward foreign currency contracts | 185,028 | |||
| TOTAL ASSETS | 13,465,287 | |||
| LIABILITIES | ||||
| Payable for Fund shares redeemed | 9,245 | |||
| Net unrealized depreciation on futures contracts | 209,118 | |||
| Net unrealized depreciation on forward foreign currency contracts | 150,098 | |||
| TOTAL LIABILITIES | 368,461 | |||
| NET ASSETS | $ | 13,096,826 | ||
| Composition of Net Assets: | ||||
| Paid in capital ($0 par value, unlimited shares authorized) | $ | 14,217,221 | ||
| Accumulated losses | (1,120,395 | ) | ||
| NET ASSETS | $ | 13,096,826 | ||
| Net Asset Value Per Share: | ||||
| Class A Shares: | ||||
| Net Assets | $ | 4,423,512 | ||
| Shares of beneficial interest outstanding ($0 par value, unlimited shares authorized) | 556,490 | |||
| Net asset value (Net Assets ÷ Shares Outstanding) and redemption price per share (a) | $ | 7.95 | ||
| Maximum offering price per share (net asset value plus maximum sales charge of 5.75%) | $ | 8.44 | ||
| Class I Shares: | ||||
| Net Assets | $ | 8,673,314 | ||
| Shares of beneficial interest outstanding ($0 par value, unlimited shares authorized) | 1,076,875 | |||
| Net asset value (Net Assets ÷ Shares Outstanding), offering price and redemption price per share (a) | $ | 8.05 |
| (a) | Redemptions of shares held less than 30 days may be assessed a redemption fee of 1.00%. |
See accompanying notes to consolidated financial statements.
15
| Superfund Managed Futures Strategy Fund |
| CONSOLIDATED STATEMENT OF OPERATIONS |
| For the Year Ended October 31, 2022 |
| INVESTMENT INCOME | ||||
| Interest | $ | 2,255 | ||
| TOTAL INVESTMENT INCOME | 2,255 | |||
| EXPENSES | ||||
| Investment advisory fees | 447,122 | |||
| Distribution (12b-1) fees: Class A | 12,212 | |||
| TOTAL EXPENSES | 459,334 | |||
| Less: Advisory fees waived by the Advisor | (447,122 | ) | ||
| Less: 12b-1 fees waived by the Advisor | (12,212 | ) | ||
| NET EXPENSES | — | |||
| NET INVESTMENT INCOME | 2,255 | |||
| REALIZED AND UNREALIZED GAIN (LOSS) ON INVESTMENTS | ||||
| Net realized gain (loss) from: | ||||
| Futures contracts | (1,634,051 | ) | ||
| Forward foreign currency contracts | 32,213 | |||
| (1,601,838 | ) | |||
| Net change in unrealized appreciation on: | ||||
| Futures contracts | 151,317 | |||
| Foreign currency translations | 1,304 | |||
| Forward foreign currency contracts | 67,620 | |||
| 220,241 | ||||
| NET REALIZED AND UNREALIZED LOSS ON INVESTMENTS | (1,381,597 | ) | ||
| NET DECREASE IN NET ASSETS RESULTING FROM OPERATIONS | $ | (1,379,342 | ) |
See accompanying notes to consolidated financial statements.
16
| Superfund Managed Futures Strategy Fund |
| CONSOLIDATED STATEMENTS OF CHANGES IN NET ASSETS |
| For the | For the | |||||||
| Year Ended | Year Ended | |||||||
| October 31, 2022 | October 31, 2021 | |||||||
| FROM OPERATIONS | ||||||||
| Net investment income | $ | 2,255 | $ | 6,689 | ||||
| Net realized gain (loss) | (1,601,838 | ) | 3,681,755 | |||||
| Net change in unrealized appreciation | 220,241 | 235,626 | ||||||
| Net increase (decrease) in net assets resulting from operations | (1,379,342 | ) | 3,924,070 | |||||
| DISTRIBUTIONS TO SHAREHOLDERS | ||||||||
| Class A | (869,814 | ) | (495,941 | ) | ||||
| Class I | (2,208,306 | ) | (1,126,518 | ) | ||||
| Net decrease in net assets from distributions to shareholders | (3,078,120 | ) | (1,622,459 | ) | ||||
| FROM SHARES OF BENEFICIAL INTEREST | ||||||||
| Proceeds from shares sold: | ||||||||
| Class A | 269,326 | 470,210 | ||||||
| Class I | 678,139 | 3,434,288 | ||||||
| Net asset value of shares issued in reinvestment of distributions: | ||||||||
| Class A | 869,815 | 495,941 | ||||||
| Class I | 2,025,787 | 918,070 | ||||||
| Redemption fee proceeds: | ||||||||
| Class A | 3 | 348 | ||||||
| Class I | 9 | 789 | ||||||
| Payments for shares redeemed: | ||||||||
| Class A | (492,197 | ) | (335,025 | ) | ||||
| Class I | (3,923,044 | ) | (1,668,444 | ) | ||||
| Net increase (decrease) in net assets from shares of beneficial interest | (572,162 | ) | 3,316,177 | |||||
| TOTAL INCREASE (DECREASE) IN NET ASSETS | (5,029,624 | ) | 5,617,788 | |||||
| NET ASSETS | ||||||||
| Beginning of Year | 18,126,450 | 12,508,662 | ||||||
| End of Year | $ | 13,096,826 | $ | 18,126,450 | ||||
| SHARE ACTIVITY | ||||||||
| Class A: | ||||||||
| Shares Sold | 30,357 | 47,064 | ||||||
| Shares Reinvested | 105,305 | 55,043 | ||||||
| Shares Redeemed | (58,506 | ) | (33,793 | ) | ||||
| Net increase in shares of beneficial interest outstanding | 77,156 | 68,314 | ||||||
| Class I: | ||||||||
| Shares Sold | 78,488 | 335,593 | ||||||
| Shares Reinvested | 242,029 | 100,776 | ||||||
| Shares Redeemed | (466,750 | ) | (159,953 | ) | ||||
| Net increase (decrease) in shares of beneficial interest outstanding | (146,233 | ) | 276,416 | |||||
See accompanying notes to consolidated financial statements.
17
| Superfund Managed Futures Strategy Fund |
| CONSOLIDATED FINANCIAL HIGHLIGHTS |
Per Share Data and Ratios for a Share of Beneficial Interest Outstanding Throughout Each Year
| Class A | ||||||||||||||||||||
| Year Ended | Year Ended | Year Ended | Year Ended | Year Ended | ||||||||||||||||
| October 31, 2022 | October 31, 2021 | October 31, 2020 | October 31, 2019 | October 31, 2018 | ||||||||||||||||
| Net asset value, beginning of year | $ | 10.56 | $ | 9.15 | $ | 9.29 | $ | 7.34 | $ | 10.49 | ||||||||||
| Activity from investment operations: | ||||||||||||||||||||
| Net investment income (loss) (1) | 0.00 | (7) | 0.00 | (7) | 0.04 | 0.07 | (0.17 | ) | ||||||||||||
| Net realized and unrealized gain (loss) on investments (4) | (0.81 | ) | 2.59 | 0.93 | 1.88 | (1.45 | ) | |||||||||||||
| Total from investment operations | (0.81 | ) | 2.59 | 0.97 | 1.95 | (1.62 | ) | |||||||||||||
| Less distributions from: | ||||||||||||||||||||
| Net investment income | (1.13 | ) | (1.18 | ) | (1.11 | ) | — | — | ||||||||||||
| Net realized gains | (0.67 | ) | — | — | — | (1.53 | ) | |||||||||||||
| Total distributions | (1.80 | ) | (1.18 | ) | (1.11 | ) | — | (1.53 | ) | |||||||||||
| Paid in capital from redemption fees(1,7) | 0.00 | 0.00 | 0.00 | 0.00 | 0.00 | |||||||||||||||
| Net asset value, end of year | $ | 7.95 | $ | 10.56 | $ | 9.15 | $ | 9.29 | $ | 7.34 | ||||||||||
| Total return (2) | (8.31 | )% | 30.58 | % | 11.00 | % | 26.57 | % | (18.27 | )% | ||||||||||
| Net assets, at end of year (000s) | $ | 4,424 | $ | 5,064 | $ | 3,763 | $ | 2,926 | $ | 2,287 | ||||||||||
| Ratio of gross expenses to average net assets (6) | 3.24 | % | 3.24 | % | 3.24 | % | 3.24 | % | 3.24 | % (3) | ||||||||||
| Ratio of net expenses to average net assets (5) | 0.00 | % | 0.00 | % | 0.00 | % | 0.93 | % | 3.24 | % (3) | ||||||||||
| Ratio of net investment income (loss) to average net assets | 0.02 | % | 0.04 | % | 0.46 | % | 0.77 | % | (2.01 | )% (3) | ||||||||||
| Portfolio turnover rate | 0 | % | 0 | % | 0 | % | 0 | % | 0 | % | ||||||||||
| (1) | Per share amounts calculated using the average shares method. |
| (2) | Total return shown excludes the effect of applicable sales charges and redemption fees. Total returns are historical in nature and assume changes in sale price, reinvestment of dividends and capital gain distributions, if any. Had the Advisor not absorbed a portion of the expenses during certain periods, total returns would have been lower. |
| (3) | The ratios of expenses to average net assets and net investment income (loss) to average net assets do not reflect the expenses of the underlying investment companies in which the Fund invests. |
| (4) | Net realized and unrealized gain (loss) on investments per share are balancing amounts necessary to reconcile the change in net asset value per share for the period, and may not reconcile with aggregate gains (losses) in the Consolidated Statement of Operations due to the share transactions for the period. |
| (5) | Represents the ratio of expenses to average net assets inclusive of fee waivers and/or expense reimbursements by the Advisor. |
| (6) | Represents the ratio of expenses to average net assets absent fee waivers and/or expense reimbursements by the Advisor. |
| (7) | Amount is less than $0.005. |
See accompanying notes to consolidated financial statements.
18
| Superfund Managed Futures Strategy Fund |
| CONSOLIDATED FINANCIAL HIGHLIGHTS |
Per Share Data and Ratios for a Share of Beneficial Interest Outstanding Throughout Each Year
| Class I | ||||||||||||||||||||
| Year Ended | Year Ended | Year Ended | Year Ended | Year Ended | ||||||||||||||||
| October 31, 2022 | October 31, 2021 | October 31, 2020 | October 31, 2019 | October 31, 2018 | ||||||||||||||||
| Net asset value, beginning of year | $ | 10.68 | $ | 9.24 | $ | 9.37 | $ | 7.40 | $ | 10.54 | ||||||||||
| Activity from investment operations: | ||||||||||||||||||||
| Net investment income (loss) (1) | 0.00 | (7) | 0.00 | (7) | 0.05 | 0.10 | (0.15 | ) | ||||||||||||
| Net realized and unrealized gain (loss) on investments (4) | (0.83 | ) | 2.62 | 0.93 | 1.87 | (1.46 | ) | |||||||||||||
| Total from investment operations | (0.83 | ) | 2.62 | 0.98 | 1.97 | (1.61 | ) | |||||||||||||
| Less distributions from: | ||||||||||||||||||||
| Net investment income | (1.13 | ) | (1.18 | ) | (1.11 | ) | — | — | ||||||||||||
| Net realized gains | (0.67 | ) | — | — | — | (1.53 | ) | |||||||||||||
| Total distributions | (1.80 | ) | (1.18 | ) | (1.11 | ) | — | (1.53 | ) | |||||||||||
| Paid in capital from redemption fees(1) | 0.00 | (7) | 0.00 | (7) | 0.00 | (7) | 0.00 | (7) | — | |||||||||||
| Net asset value, end of year | $ | 8.05 | $ | 10.68 | $ | 9.24 | $ | 9.37 | $ | 7.40 | ||||||||||
| Total return (2) | (8.41 | )% | 30.61 | % | 11.05 | % | 26.62 | % | (18.07 | )% | ||||||||||
| Net assets, at end of year (000s) | $ | 8,673 | $ | 13,063 | $ | 8,747 | $ | 7,974 | $ | 2,310 | ||||||||||
| Ratio of gross expenses to average net assets (6) | 2.99 | % | 2.99 | % | 2.99 | % | 2.99 | % | 2.99 | % (3) | ||||||||||
| Ratio of net expenses to average net assets (5) | 0.00 | % | 0.00 | % | 0.00 | % | 0.46 | % | 2.99 | % (3) | ||||||||||
| Ratio of net investment income (loss) to average net assets | 0.01 | % | 0.04 | % | 0.48 | % | 1.16 | % | (1.76 | )% (3) | ||||||||||
| Portfolio turnover rate | 0 | % | 0 | % | 0 | % | 0 | % | 0 | % | ||||||||||
| (1) | Per share amounts calculated using the average shares method. |
| (2) | Total return shown excludes the effect of applicable redemption fees. Total returns are historical in nature and assume changes in sale price, reinvestment of dividends and capital gain distributions, if any. Had the Advisor not absorbed a portion of the expenses during certain periods, total returns would have been lower. |
| (3) | The ratios of expenses to average net assets and net investment income (loss) to average net assets do not reflect the expenses of the underlying investment companies in which the Fund invests. |
| (4) | Net realized and unrealized gain (loss) on investments per share are balancing amounts necessary to reconcile the change in net asset value per share for the period, and may not reconcile with aggregate gains (losses) in the Consolidated Statement of Operations due to the share transactions for the period. |
| (5) | Represents the ratio of expenses to average net assets inclusive of fee waivers and/or expense reimbursements by the Advisor. |
| (6) | Represents the ratio of expenses to average net assets absent fee waivers and/or expense reimbursements by the Advisor. |
| (7) | Amount is less than $0.005. |
See accompanying notes to consolidated financial statements.
19
| Superfund Managed Futures Strategy Fund |
| Notes to Consolidated Financial Statements |
| October 31, 2022 |
| 1. | ORGANIZATION |
The Superfund Managed Futures Strategy Fund (the “Fund”), is a series of shares of beneficial interest of the Two Roads Shared Trust (the “Trust”), a statutory trust organized under the laws of the State of Delaware on June 8, 2012, and is registered under the Investment Company Act of 1940, as amended (the “1940 Act”), as a diversified, open-end management investment company. The Fund commenced operations on December 31, 2013. The investment objective is to seek positive absolute returns.
The Fund offers Class A and Class I shares. Class A shares are offered at net asset value (“NAV”) plus a maximum sales charge of 5.75%. Investors that purchase $1,000,000 or more of the Fund’s Class A shares will pay an initial sales charge of 1.00% on the purchase. Effective as of February 28, 2020, the Fund waived the front-end sales charge on all direct purchases of Fund shares and for certain other investors as described in the Fund’s prospectus. Class I shares of the Fund are sold at NAV without an initial sales charge and are not subject to 12b-1 distribution fees, but have a higher minimum initial investment than Class A shares. All classes are subject to a 1.00% redemption fee on redemptions made within 30 days of the original purchase. Each share class represents an interest in the same assets of the Fund and classes are identical except for differences in their sales charge structures and ongoing service and distribution charges. All classes of shares have equal voting privileges except that each class has exclusive voting rights with respect to its service and/or distribution plans. The Fund’s income, expenses (other than class specific distribution fees) and realized and unrealized gains and losses are allocated proportionately each day based upon the relative net assets of each class.
| 2. | SUMMARY OF SIGNIFICANT ACCOUNTING POLICIES |
The following is a summary of significant accounting policies followed by the Fund in preparation of its financial statements. These policies are in conformity with accounting principles generally accepted in the United States of America (“GAAP”). The preparation of financial statements requires management to make estimates and assumptions that affect the reported amounts of assets and liabilities and disclosure of contingent assets and liabilities at the date of the financial statements and the reported amounts of income and expenses for the period. Actual results could differ from those estimates. The Fund is an investment company and accordingly follows the investment company accounting and reporting guidance of the Financial Accounting Standards Board (“FASB”) Accounting Standard Codification Topic 946 “Financial Services – Investment Companies”.
Security Valuation – Securities listed on an exchange are valued at the last reported sale price at the close of the regular trading session of the exchange on the business day the value is being determined, or in the case of securities listed on NASDAQ at the NASDAQ Official Closing Price. In the absence of a sale, such securities shall be valued at the mean between the last bid and ask prices on the day of valuation. Futures and future options are valued at the final settled price or, in the absence of a settled price, at the last sale price on the day of valuation. Investments valued in currencies other than the U.S. dollar are converted to U.S. dollars using exchange rates obtained from pricing services. Investments in open-end investment companies are valued at net asset value. Forward foreign exchange contracts are valued by reference to the forward foreign exchange rate corresponding to the remaining life of the contract. Short-term debt obligations having 60 days or less remaining until maturity, at time of purchase, may be valued at amortized cost which approximates fair value.
The Fund may hold securities, such as private investments, interests in commodity pools, other non-traded securities or temporarily illiquid securities, for which market quotations are not readily available or are determined to be unreliable. These securities are valued using the “fair value” procedures approved by the Board. The Board has designated Superfund Advisors Inc. (the “Advisor”) as its valuation designee (the “Valuation Designee”) to execute these procedures. The Board may also enlist third party consultants such as valuation specialist at a public accounting firm, a valuation consultant or financial officer of a security issuer on an as-needed basis to assist the Valuation Designee in determining a security-specific fair value. The Board is responsible for reviewing and approving fair value methodologies utilized by the Valuation Designee, approval of which shall be based upon whether the Valuation Designee followed the valuation procedures established by the Board.
20
| Superfund Managed Futures Strategy Fund |
| Notes to Consolidated Financial Statements (Continued) |
| October 31, 2022 |
Fair Valuation Process – The applicable investments are valued by the Valuation Designee pursuant to valuation procedures established by the Board. For example, fair value determinations are required for the following securities: (i) securities for which market quotations are insufficient or not readily available on a particular business day (including securities for which there is a short and temporary lapse in the provision of a price by the regular pricing source); (ii) securities for which, in the judgment of the Valuation Designee, the prices or values available do not represent the fair value of the instrument; factors which may cause the Valuation Designee to make such a judgment include, but are not limited to, the following: only a bid price or an asked price is available; the spread between bid and asked prices is substantial; the frequency of sales; the thinness of the market; the size of reported trades; and actions of the securities markets, such as the suspension or limitation of trading; (iii) securities determined to be illiquid; and (iv) securities with respect to which an event that affects the value thereof has occurred (a “significant event”) since the closing prices were established on the principal exchange on which they are traded, but prior to a Fund’s calculation of its net asset value. Specifically, interests in commodity pools or managed futures pools are valued on a daily basis by reference to the closing market prices of each futures contract or other asset held by a pool, as adjusted for pool expenses. Restricted or illiquid securities, such as private investments or non-traded securities are valued based upon the current bid for the security from two or more independent dealers or other parties reasonably familiar with the facts and circumstances of the security (who should take into consideration all relevant factors as may be appropriate under the circumstances). If a current bid from such independent dealers or other independent parties is unavailable, the Valuation Designee shall determine the fair value of such security using the following factors: (i) the type of security; (ii) the cost at date of purchase; (iii) the size and nature of the Fund’s holdings; (iv) the discount from market value of unrestricted securities of the same class at the time of purchase and subsequent thereto; (v) information as to any transactions or offers with respect to the security; (vi) the nature and duration of restrictions on disposition of the security and the existence of any registration rights; (vii) how the yield of the security compares to similar securities of companies of similar or equal creditworthiness; (viii) the level of recent trades of similar or comparable securities; (ix) the liquidity characteristics of the security; (x) current market conditions; and (xi) the market value of any securities into which the security is convertible or exchangeable.
The Fund utilizes various methods to measure the fair value of all of its investments on a recurring basis. GAAP establishes a hierarchy that prioritizes inputs to valuation methods. The three levels of input are:
Level 1 – Unadjusted quoted prices in active markets for identical assets and liabilities that the Fund has the ability to access.
Level 2 – Observable inputs other than quoted prices included in Level 1 that are observable for the asset or liability, either directly or indirectly. These inputs may include quoted prices for the identical instrument on an inactive market, prices for similar instruments, interest rates, prepayment speeds, credit risk, yield curves, default rates and similar data.
Level 3 – Unobservable inputs for the asset or liability, to the extent relevant observable inputs are not available, representing the Fund’s own assumptions about the assumptions a market participant would use in valuing the asset or liability, and would be based on the best information available.
The availability of observable inputs can vary from security to security and is affected by a wide variety of factors, including, for example, the type of security, whether the security is new and not yet established in the marketplace, the liquidity of markets, and other characteristics particular to the security. To the extent that valuation is based on models or inputs that are less observable or unobservable in the market, the determination of fair value requires more judgment. Accordingly, the degree of judgment exercised in determining fair value is greatest for instruments categorized in Level 3.
The inputs used to measure fair value may fall into different levels of the fair value hierarchy. In such cases, for disclosure purposes, the level in the fair value hierarchy within which the fair value measurement falls in its entirety, is determined based on the lowest level input that is significant to the fair value measurement in its entirety.
21
| Superfund Managed Futures Strategy Fund |
| Notes to Consolidated Financial Statements (Continued) |
| October 31, 2022 |
The inputs or methodology used for valuing securities are not necessarily an indication of the risk associated with investing in those securities. The following tables summarize the inputs used as of October 31, 2022 for the Fund’s assets and liabilities measured at fair value:
| Assets | Level 1 | Level 2 | Level 3 | Total | ||||||||||||
| Futures Contracts (1) | $ | 251,675 | $ | — | $ | — | $ | 251,675 | ||||||||
| Forward Foreign Currency Contracts (2) | — | 34,930 | — | 34,930 | ||||||||||||
| Total | $ | 251,675 | $ | 34,930 | $ | — | $ | 286,605 | ||||||||
| (1) | Represents net unrealized appreciation on futures contracts. |
| (2) | Represents net unrealized appreciation on forward foreign currency contracts. |
The Fund did not hold any Level 3 securities during the year.
See Consolidated Schedule of Investments for more information related to the Fund’s investments.
Futures Contracts – Among other risks, which are disclosed in the Fund’s prospectus and statements of the additional information, and certain of which are discussed below, the Fund is subject to equity price risk, interest rate risk, foreign currency exchange rate risk and volatility risk in the normal course of pursuing its investment objective. The Fund may purchase or sell futures contracts to gain exposure to, or hedge against, changes in the value of equities, interest rates or foreign currencies or commodities. Initial margin deposits required upon entering into futures contracts are satisfied by the segregation of specific securities or cash as collateral for the account of the broker (the Fund’s agent in acquiring the futures position). During the period the futures contracts are open, changes in the value of the contracts are recognized as unrealized gains or losses by “marking to market” on a daily basis to reflect the market value of the contracts at the end of each day’s trading. Variation margin payments are received or made depending upon whether unrealized gains or losses are incurred. When the contracts are closed, the Fund recognizes a realized gain or loss. For the year ended October 31, 2022, the Fund recognized realized losses of $1,634,051. If the Fund is unable to liquidate a futures contract and/or enter into an offsetting closing transaction, the Fund would continue to be subject to market risk with respect to the value of the contracts and continue to be required to maintain the margin deposits on the futures contracts. The Fund segregates liquid securities having a value at least equal to the amount of the current obligation under any open futures contract. Risks may exceed amounts recognized in the Consolidated Statement of Assets and Liabilities. With futures, there is minimal counterparty credit risk to the Fund since futures are exchange traded and the exchange’s clearinghouse, as counterparty to all exchange traded futures, guarantees the futures against default.
Forward Foreign Currency Contracts – The Fund may enter into forward currency exchange contracts in order to hedge against foreign currency exchange rate risks. A forward involves an obligation to purchase or sell a specific currency at a future date, which may be any fixed number of days from the date of the contract agreed upon by the parties, at a price set at the time of the contract. The market value of the contract fluctuates with changes in currency exchange rates. The contract is marked-to-market daily and the change in market value is recorded by the Fund as an unrealized gain or loss. As foreign securities are sold, a portion of the contract is generally closed and the Fund records a realized gain or loss equal to the difference between the value of the contract at the time it was opened and the value at the time it was closed. Realized gains and losses from contract transactions are included as a component of net realized gains/(losses) from forward foreign currency contracts in the Consolidated Statement of Operations.
Consolidation of Subsidiary – The consolidated financial statements of the Fund include Superfund Managed Futures Strategy (Cayman) Fund Ltd. (“Superfund-CFC”), a wholly-owned and controlled foreign subsidiary.
The Fund may invest up to 25% of its total assets in a controlled foreign corporation (“CFC”), which acts as an investment vehicle in order to effect certain investments consistent with the Fund’s investment objectives and policies. The Fund generally consolidates the results of subsidiaries in which the Fund holds a controlling economic interest. Controlling economic interest is generally deemed to exist with investment interests comprising greater than 50% of the net asset value of the subsidiary. However, the Fund may also consider qualitative aspects of control in determining if a controlling economic interest exists. These qualitative control considerations include the nature and organizational structure of the investment, as well as the Fund’s ability to control the circumstances leading to majority ownership. All significant inter-company accounts and transactions have been eliminated in consolidation.
22
| Superfund Managed Futures Strategy Fund |
| Notes to Consolidated Financial Statements (Continued) |
| October 31, 2022 |
A summary of the net assets of Superfund-CFC is as follows:
| CFC Net Assets | |||||||||||
| at October 31, | % of Fund Net Assets at | ||||||||||
| Inception Date of CFC | 2022 | October 31, 2022 | |||||||||
| Superfund-CFC | 6/20/2014 | $ | 2,550,142 | 19.47% | |||||||
For tax purposes, Superfund-CFC is an exempted Cayman investment company. Superfund-CFC has received an undertaking from the Government of the Cayman Islands exempting it from all local income, profits and capital gains taxes. No such taxes are levied in the Cayman Islands at the present time. For U.S. income tax purposes, Superfund-CFC is a CFC which generates and is allocated no income which is considered effectively connected with U.S. trade of business and as such is not subject to U.S. income tax. However, as a wholly-owned CFC, Superfund-CFC’s net income and capital gain, to the extent of its earnings and profits, will be included each year in the Fund’s investment company taxable income.
Please refer to the Fund’s prospectus and statement of additional information for further information regarding the risks associated with the Fund’s investments which include but are not limited to active trading risk, asset-backed securities risk, call option risk, commodities risk, counterparty credit risk, credit risk, currency risk, cybersecurity risk, derivatives risk, emerging markets risk, equity risk, expense waiver risk, fixed income risk, foreign (non-U.S.) investment risk, forward and futures contract risk, gap risk, hedging transactions risk, index risk, issuer-specific risk, leveraging risk, LIBOR risk, liquidity risk, management risk, market risk, market events risk, model risk, put option risk, regulatory risk, short sales risk, sovereign debt risk, subsidiary risk, tax risk, U.S. Government securities risk, valuation risk, volatility risk and written/sold options risk.
In accordance with its investment objective and through its exposure to the aforementioned managed futures program, the Fund may have increased or decreased exposure to one or more of the following risk factors defined below:
Commodities Risk – Exposure to commodities markets may subject the Fund to greater volatility than investments in traditional securities. The value of commodity-linked derivative instruments may be affected by changes in overall market movements, commodity index volatility, changes in interest rates, or factors affecting a particular industry or commodity, such as drought, floods, weather, livestock disease, embargoes, tariffs and international economic, political and regulatory developments. The prices of energy, industrial metals, precious metals, agriculture, and livestock sector commodities may fluctuate widely due to factors such as changes in value, supply and demand and governmental regulatory policies. The commodity-linked securities in which the Fund invests may be issued by companies in the financial services sector, and events affecting the financial services sector may cause the Fund’s share value to fluctuate.
Counterparty Credit Risk – The stability and liquidity of many derivative transactions depends in large part on the creditworthiness of the parties to the transactions. If a privately negotiated over-the-counter contract calls for payments by the Fund, the Fund must be prepared to make such payments when due. In addition, if a counterparty’s creditworthiness declines or if a counterparty becomes the subject of insolvency proceedings, the Fund may not receive payments owed under the contract, or such payments may be delayed under such circumstances and the value of agreements with such counterparty can be expected to decline, potentially resulting in losses to the Fund. The Advisor considers factors such as counterparty credit ratings and financial statements among others when determining whether a counterparty is creditworthy. The Advisor regularly monitors the creditworthiness of each counterparty with which the Fund enters into a transaction. In addition, the Fund may enter into derivative transactions with a limited number of counterparties, which may increase the Fund’s exposure to counterparty risk. There is the risk that a counterparty refuses to continue to enter into derivative transactions with the Fund in the future, or requires increased fees, which could impair the Fund’s ability to achieve its investment objective. A derivative counterparty may also increase its collateral or margin requirements, due to regulatory requirements or otherwise, which may limit or restrict the Fund’s ability to use, or increase the cost to the Fund of, leverage and thereby reduce the Fund’s investment returns. If the Fund is not able to enter into a particular derivatives transaction, the Fund’s investment performance and risk profile could be adversely affected as a result.
23
| Superfund Managed Futures Strategy Fund |
| Notes to Consolidated Financial Statements (Continued) |
| October 31, 2022 |
Currency Risk – The risk that foreign currencies will decline in value relative to the U.S. dollar and adversely affect the value of the Fund’s investments in foreign (non-U.S.) currencies or in securities that trade in, and receive revenues in, or in derivatives that provide exposure to, foreign (non-U.S.) currencies.
Derivatives Risk – The derivative instruments in which the Fund may invest, including futures, forwards, options, swaps, including total return swaps, repurchase agreements and other similar instruments, may be more volatile than other instruments and may be subject to unanticipated market movements, which are potentially unlimited. The risks associated with investments in derivatives also include liquidity, interest rate, market, credit and management risks, mispricing or improper valuation. Certain derivatives require the Fund to make margin payments and the Fund may have to post additional margin if the value of the derivative position changes in a manner adverse to the Fund. Changes in the market value of a derivative may not correlate perfectly with the underlying asset, rate or index, and the Fund could lose more than the principal amount invested. In addition, if a derivative is being used for hedging purposes there can be no assurance given that each derivative position will achieve a perfect correlation with the security or currency against which it is being hedged, or that a particular derivative position will be available when sought by the portfolio manager.
Expense Waiver Risk – The Advisor has agreed to waive all of the Fund’s unitary management fee and to absorb the Fund’s expenses (excluding front-end or contingent deferred loads; brokerage fees and commissions; borrowing costs, such as interest and dividend expense on securities sold short; taxes; and extraordinary expenses, such as litigation expenses) through February 28, 2024. There can be no assurance that the Advisor will continue to waive all or any portion of the unitary management fee and/or absorb Fund expenses beyond that date. Therefore, the fees and expenses applicable to your investment could increase significantly in the future.
Forward and Futures Contract Risk – The successful use of forward and futures contracts draws upon the Advisor’s skill and experience with respect to such instruments and is subject to special risk considerations. The primary risks associated with the use of futures contracts are (a) the imperfect correlation between the change in market value of the instruments held by the Fund and the price of the forward or futures contract; (b) possible lack of a liquid secondary market for a forward or futures contract and the resulting inability to close a forward or futures contract when desired; (c) losses caused by unanticipated market movements, which are potentially unlimited; (d) the Advisor’s inability to predict correctly the direction of securities prices, interest rates, currency exchange rates and other economic factors; (e) the possibility that the counterparty will default in the performance of its obligations; and (f) if the Fund has insufficient cash, it may have to sell securities from its portfolio to meet daily variation margin requirements, including increases to margin requirements by futures commission merchants as a result of market conditions or periods of high volatility, and the Fund may have to sell securities at a time when it may be disadvantageous to do so.
Gap Risk – The Fund is subject to the risk that a stock price or derivative value will change dramatically from one level to another with no trading in between and/or before the Fund can exit from the investment. Usually such movements occur when there are adverse news announcements, which can cause a stock price or derivative value to drop substantially from the previous day’s closing price. Trading halts may lead to gap risk.
Leveraging Risk – The use of certain derivatives may increase leveraging risk and adverse changes in the value or level of the underlying asset, rate, or index may result in a loss substantially greater than the amount paid for the derivative. The use of leverage may exaggerate any increase or decrease in the net asset value, causing the Fund to be more volatile. The use of leverage may increase expenses and increase the impact of the Fund’s other risks. The use of leverage may cause the Fund to liquidate portfolio positions when it may not be advantageous to do so to satisfy its obligations or to meet regulatory requirements resulting in increased volatility of returns. Leverage, including borrowing, may cause the Fund to be more volatile than if the Fund had not been leveraged.
Liquidity Risk – Liquidity risk exists when particular investments of the Fund would be difficult to purchase or sell, possibly preventing the Fund from selling such illiquid securities at an advantageous time or price, or possibly requiring the Fund to dispose of other investments at unfavorable times or prices in order to satisfy its obligations. In the past, in stressed markets,
24
| Superfund Managed Futures Strategy Fund |
| Notes to Consolidated Financial Statements (Continued) |
| October 31, 2022 |
certain types of securities suffered periods of illiquidity if disfavored by the market. All of these risks may increase during periods of market turmoil, such as that experienced in 2020 with COVID-19, and could have a negative effect on the Fund’s performance.
Market Risk – Overall market risk may affect the value of individual instruments in which the Fund invests. The Fund is subject to the risk that the securities markets will move down, sometimes rapidly and unpredictably, based on overall economic conditions and other factors, which may negatively affect the Fund’s performance. Factors such as domestic and foreign (non- U.S.) economic growth and market conditions, real or perceived adverse economic or political conditions, inflation, changes in interest rate levels, lack of liquidity in the bond or other markets, volatility in the equities or other securities markets, or adverse investor sentiment and political events affect the securities markets. U.S. and foreign stock markets have experienced periods of substantial price volatility in the past and may do so again in the future. Securities markets also may experience long periods of decline in value. When the value of the Fund’s investments goes down, your investment in the Fund decreases in value and you could lose money.
Local, state, regional, national or global events such as war, acts of terrorism, the spread of infectious illness or other public health issues, recessions, or other events could have a significant impact on the Fund and its investments and could result in decreases to the Fund’s net asset value. Political, geopolitical, natural and other events, including war, terrorism, trade disputes, government shutdowns, market closures, natural and environmental disasters, epidemics, pandemics and other public health crises and related events and governments’ reactions to such events have led, and in the future may lead, to economic uncertainty, decreased economic activity, increased market volatility and other disruptive effects on U.S. and global economies and markets. Such events may have significant adverse direct or indirect effects on the Fund and its investments. For example, a widespread health crisis such as a global pandemic could cause substantial market volatility, exchange trading suspensions and closures, impact the ability to complete redemptions, and affect Fund performance. A health crisis may exacerbate other pre-existing political, social and economic risks. In addition, the increasing interconnectedness of markets around the world may result in many markets being affected by events or conditions in a single country or region or events affecting a single or small number of issuers.
COVID-19 has resulted in travel restrictions, closed international borders, enhanced health screenings at ports of entry and elsewhere, disruption of and delays in healthcare service preparation and delivery, prolonged quarantines, cancellations, business and school closings, supply chain disruptions, and lower consumer demand, as well as general concern and uncertainty. The impact of COVID-19, and other infectious illness outbreaks that may arise in the future, could adversely affect the economies of many nations or the entire global economy, individual issuers and capital markets in ways that cannot necessarily be foreseen.
Model Risk – The Fund will use model-based strategies that, while historically effective, may not be successful on an ongoing basis or could contain unknown errors. Any imperfections or limitations in a model could affect the ability of the manager to implement strategies. By necessity, models make simplifying assumptions that limit their efficacy. Models relying on historical market data can fail to predict future market events. Further, the data used in models may be inaccurate and/or it may not include the most recent information about a company or a security. In addition, computer programming used to create quantitative models, or the data on which such models operate, might contain one or more errors. Such errors might never be detected, or might be detected only after the Fund has sustained a loss (or reduced performance) related to such errors. Moreover, an increasing number of market participants may rely on models that are similar to those used by the Advisor, which may result in a substantial number of market participants taking the same action with respect to an investment. Should one or more of these other market participants begin to divest themselves of one or more portfolio holdings, the Fund could suffer significant losses. In addition, changes in underlying market conditions can adversely affect the performance of a model.
Subsidiary Risk – By investing in the Superfund-CFC, the Fund is indirectly exposed to the risks associated with the Superfund- CFC’s investments. The commodity-related instruments held by the Superfund-CFC are generally similar to those that are permitted to be held by the Fund and are subject to the same risks that apply to similar investments if held directly by the
25
| Superfund Managed Futures Strategy Fund |
| Notes to Consolidated Financial Statements (Continued) |
| October 31, 2022 |
Fund (see “Commodities Risk” above). The Superfund-CFC is not registered under the 1940 Act, and, unless otherwise noted in the Fund’s prospectus, is not subject to all the investor protections of the 1940 Act. Changes in the laws of the United States and/or the Cayman Islands could result in the inability of the Fund and/or the Superfund-CFC to operate as described in the Fund’s prospectus and Statement of Additional Information and could adversely affect the Fund.
U.S. Government Securities Risk – Treasury obligations may differ in their interest rates, maturities, times of issuance and other characteristics. Obligations of U.S. Government agencies and authorities are supported by varying degrees of credit but generally are not backed by the full faith and credit of the U.S. Government. No assurance can be given that the U.S. Government will provide financial support to its agencies and authorities if it is not obligated by law to do so. In addition, the value of U.S. Government securities may be affected by changes in the credit rating of the U.S. Government.
Offsetting of Financial Assets and Derivative Assets
The following table presents the Fund’s asset and liability derivatives available for offset under a master netting arrangement net of collateral pledged as of October 31, 2022.
| Gross Amounts Not Offset in the | ||||||||||||||||||||||||
| Consolidated Statement of Assets & | ||||||||||||||||||||||||
| Assets: | Liabilities | |||||||||||||||||||||||
| Gross Amounts | Derivatives | |||||||||||||||||||||||
| of Recognized | available for | Net Amount of | Financial | Collateral | ||||||||||||||||||||
| Description | Assets | offset | Assets | Instruments | Pledged/Received (1) | Net Amount | ||||||||||||||||||
| Futures contracts | $ | 460,793 | $ | (209,118 | ) | $ | 251,675 | $ | — | $ | — | $ | 251,675 | |||||||||||
| Forward Foreign Currency Contracts | 185,028 | (150,098 | ) | 34,930 | — | — | 34,930 | |||||||||||||||||
| Total | $ | 645,821 | $ | (359,216 | ) | $ | 286,605 | $ | — | $ | — | $ | 286,605 | |||||||||||
| Gross Amounts Not Offset in the | ||||||||||||||||||||||||
| Consolidated Statement of Assets & | ||||||||||||||||||||||||
| Liabilities: | Liabilities | |||||||||||||||||||||||
| Gross Amounts | Derivatives | |||||||||||||||||||||||
| of Recognized | available for | Net Amount of | Financial | Collateral | ||||||||||||||||||||
| Description | Liabilities | offset | Liabilities | Instruments | Pledged/Received (1) | Net Amount | ||||||||||||||||||
| Futures contracts | $ | (209,118 | ) | $ | 209,118 | $ | — | $ | — | $ | — | $ | — | |||||||||||
| Forward Foreign Currency Contracts | (150,098 | ) | 150,098 | — | — | — | — | |||||||||||||||||
| Total | $ | (359,216 | ) | $ | 359,216 | $ | — | $ | — | $ | — | $ | — | |||||||||||
| (1) | Collateral pledged in table above is capped by the recorded investment balances related to futures contracts and forward foreign currency contracts based on the information that was available to the Fund as of October 31, 2022. Total collateral held by the broker as of October 31, 2022 in the form of cash was $1,677,564 as presented gross as cash held for collateral at broker for futures and forward foreign currency contracts on the Consolidated Statement of Assets and Liabilities. |
26
| Superfund Managed Futures Strategy Fund |
| Notes to Consolidated Financial Statements (Continued) |
| October 31, 2022 |
Impact of Derivatives on the Consolidated Statement of Assets and Liabilities:
The following is a summary of the location of derivative investments on the Fund’s Consolidated Statement of Assets and Liabilities as of October 31, 2022:
| Asset Derivatives | Liability Derivatives | |||||||||||
| Contract Type/ | Consolidated Statement of | Consolidated Statement of Assets | ||||||||||
| Primary Risk Exposure | Assets and Liabilities Location | Fair Value | and Liabilities Location | Fair Value | ||||||||
| Equity contracts: | Net unrealized appreciation on futures contracts | $ | 54,100 | Net unrealized depreciation on futures contracts | $ | (36,178 | ) | |||||
| Interest rate contracts: | Net unrealized appreciation on futures contracts | 103,473 | Net unrealized depreciation on futures contracts | (36,052 | ) | |||||||
| Commodity contracts: | Net unrealized appreciation on futures contracts | 270,717 | Net unrealized depreciation on futures contracts | (114,067 | ) | |||||||
| Foreign exchange contracts: | Net unrealized appreciation on futures contracts | 32,503 | Net unrealized depreciation on futures contracts | (22,821 | ) | |||||||
| Foreign exchange contracts: | Net unrealized appreciation on forward foreign currency contracts | 185,028 | Net unrealized depreciation on forward foreign currency contracts | (150,098 | ) | |||||||
| $ | 645,821 | $ | (359,216 | ) | ||||||||
Impact of Derivatives on the Consolidated Statement of Operations:
The following is a summary of the location of derivative investments on the Fund’s Consolidated Statement of Operations for the year ended October 31, 2022:
| Derivative Investment Type | Location of Gain (Loss) on Derivatives |
| Equity/Currency/Commodity/Interest Rate | Net realized gain (loss) from futures contracts |
| Equity/Currency/Commodity/Interest Rate | Net realized gain (loss) from forward foreign currency contracts |
The following is a summary of the Fund’s realized gain (loss) on derivative investments recognized in the Consolidated Statement of Operations categorized by primary risk exposure for the Fund for the year ended October 31, 2022:
| Net Change in Unrealized appreciation on derivatives recognized in the Consolidated Statement of Operations | ||||||||||||||||||||
| Total for the | ||||||||||||||||||||
| Year Ended | ||||||||||||||||||||
| Derivative Investment Type | Commodity | Currency | Equity | Interest Rate | October 31, 2022 | |||||||||||||||
| Futures Contracts | $ | 177,842 | $ | 10,422 | $ | (144,429 | ) | $ | 107,482 | $ | 151,317 | |||||||||
| Forward Foreign Currency Contracts | — | 67,620 | — | — | 67,620 | |||||||||||||||
| $ | 177,842 | $ | 78,042 | $ | (144,429 | ) | $ | 107,482 | $ | 218,937 | ||||||||||
| Realized gain/(loss) on derivatives recognized in the Consolidated Statement of Operations | ||||||||||||||||||||
| Total for the | ||||||||||||||||||||
| Year Ended | ||||||||||||||||||||
| Derivative Investment Type | Commodity | Currency | Equity | Interest Rate | October 31, 2022 | |||||||||||||||
| Futures Contracts | $ | (78,721 | ) | $ | 188,476 | $ | (2,040,056 | ) | $ | 296,250 | $ | (1,634,051 | ) | |||||||
| Forward Foreign Currency Contracts | — | 32,213 | — | — | 32,213 | |||||||||||||||
| $ | (78,721 | ) | $ | 220,689 | $ | (2,040,056 | ) | $ | 296,250 | $ | (1,601,838 | ) | ||||||||
The notional value of the derivative instruments outstanding as of October 31, 2022 as disclosed in the Consolidated Schedule of Investments and the amounts realized and changes in unrealized gains and losses on derivative instruments during the period as disclosed above and within the Consolidated Statement of Operations serve as indicators of the volume of derivative activity for the Fund.
27
| Superfund Managed Futures Strategy Fund |
| Notes to Consolidated Financial Statements (Continued) |
| October 31, 2022 |
Cash and Cash Equivalents – Cash and cash equivalents are held with a financial institution. The assets of the Fund may be placed in deposit accounts at U.S. banks and such deposits generally exceed Federal Deposit Insurance Corporation (“FDIC”) insurance limits. The FDIC insures deposit accounts up to $250,000 for each accountholder. The counterparty is generally a single bank rather than a group of financial institutions; thus there may be a greater counterparty credit risk. The Fund places deposits only with those counterparties which are believed to be creditworthy and there has been no history of loss.
Security Transactions and Related Income – Security transactions are accounted for on trade date basis. Interest income is recognized on an accrual basis. Discounts are accreted and premiums are amortized on securities purchased over the lives of the respective securities. Dividend income is recorded on the ex-dividend date. Realized gains or losses from sales of securities are determined using the first-in-first-out cost method.
Dividends and Distributions to Shareholders – Dividends from net investment income are declared and distributed annually. Distributable net realized capital gains are declared and distributed annually. Dividends from net investment income and distributions from net realized gains are recorded on ex dividend date and determined in accordance with federal income tax regulations, which may differ from GAAP. These “book/tax” differences are considered either temporary (i.e., deferred losses, capital loss carry forwards) or permanent in nature. To the extent these differences are permanent in nature, such amounts are reclassified within the composition of net assets based on their federal tax-basis treatment; temporary differences do not require reclassification.
Federal Income Taxes – It is the Fund’s policy to qualify as a regulated investment company by complying with the provisions of the Internal Revenue Code that are applicable to regulated investment companies and to distribute substantially all of its taxable income and net realized gains to shareholders. Therefore, no federal income tax provision has been recorded.
The Fund recognizes the tax benefits of uncertain tax positions only where the position is “more likely than not” to be sustained assuming examination by tax authorities. Management has analyzed the Fund’s tax positions and has concluded that no liability for unrecognized tax benefits should be recorded related to uncertain tax positions taken on returns filed for open tax years ended October 31, 2019 to October 31, 2021, or expected to be taken in the Fund’s October 31, 2022 year- end tax returns. The Fund identifies its major tax jurisdictions as U.S. Federal, and foreign jurisdictions where the Fund makes significant investments; however the Fund is not aware of any tax positions for which it is reasonably possible that the total amounts of unrecognized tax benefits will change materially in the next twelve months.
Foreign Currency – The accounting records of the Fund are maintained in U.S. dollars. Investment securities and other assets and liabilities denominated in a foreign currency, and income receipts and expense payments are translated into U.S. dollars using the prevailing exchange rate at the London market close. Purchases and sales of securities are translated into U.S. dollars at the contractual currency rates established at the approximate time of the trade. Net realized gains and losses on foreign currency transactions represent net gains and losses from currency realized between the trade and settlement dates on securities transactions and the difference between income accrued versus income received. The effects of changes in foreign currency exchange rates on investments in securities are included with the net realized and unrealized gain or loss on investment securities.
Expenses – Expenses of the Trust that are directly identifiable to a specific fund are charged to that fund. Expenses, which are not readily identifiable to a specific fund, are allocated in such a manner as deemed equitable, taking into consideration the nature and type of expense and the relative sizes of the funds in the Trust.
Indemnification – The Trust indemnifies its officers and trustees for certain liabilities that may arise from the performance of their duties to the Trust. Additionally, in the normal course of business, the Fund enters into contracts that contain a variety of representations and warranties and which provide general indemnities. The Fund’s maximum exposure under these arrangements is unknown, as this would involve future claims that may be made against the Fund that have not yet occurred. However, the risk of loss due to these warranties and indemnities appears to be remote.
28
| Superfund Managed Futures Strategy Fund |
| Notes to Consolidated Financial Statements (Continued) |
| October 31, 2022 |
| 3. | INVESTMENT TRANSACTIONS |
The cost of purchases and proceeds from the sale of securities, other than short-term securities and futures contracts, for the year ended October 31, 2022, amounted to $0 and $0, respectively.
| 4. | INVESTMENT ADVISORY AGREEMENT AND TRANSACTIONS WITH RELATED PARTIES |
Superfund Advisors Inc. serves as the Fund’s investment advisor. Pursuant to the Advisory Agreement, the Fund pays the Advisor a unitary management fee for the services and facilities it provides at the annual rate of 2.99% of the Fund’s average daily net assets. The unitary management fee is paid on a monthly basis. The Advisory Agreement will continue in effect year to year, provided that such continuation shall be specifically approved at least annually by the vote of a majority of the Trust’s Trustees who are not parties to the Advisory Agreement or “interested persons” (as defined in the 1940 Act) of any such party. The Board, shareholders of the Fund or the Advisor may terminate the Advisory Agreement upon sixty (60) day notice. For the year ended October 31, 2022, the Advisor earned advisory fees of $447,122.
Out of the unitary management fee, the Advisor pays substantially all expenses of the Fund, including the cost of transfer agency, custody, fund administration, legal, audit and other services, except for any taxes, short selling expenses, interest, brokerage commissions, expenses incurred in connection with any merger or reorganization, indirect expenses, expenses of other investment companies in which the Fund may invest, or extraordinary expenses such as litigation. The Advisor’s unitary management fee is designed to pay substantially all the Fund’s expenses and to compensate the Advisor for providing services to the Fund.
Effective February 26, 2019, the Advisor, pursuant to an Expense Limitation Agreement (the “Agreement”), has contractually agreed to reduce the Fund’s fees and/or absorb expenses of the Fund, including distribution and service (12b-1) fees and acquired fund fees and expenses, until February 28, 2024 to ensure that total annual Fund operating expenses (exclusive of any front-end or contingent deferred loads; brokerage fees and commissions; borrowing costs, such as interest and dividend expense on securities sold short; taxes; and extraordinary expenses, such as litigation expenses) do not exceed 0.00% of average daily net assets attributable to each of Class A and Class I shares, respectively. This Agreement may be terminated by the Board on 60 days’ written notice to the Advisor. There is no guarantee that this expense limitation arrangement will continue in place after February 28, 2024, at which time it will be determined whether such Agreement will be renewed or revised. For the year ended October 31, 2022, the Advisor waived advisory fees of $447,122. Waived fees are not subject to potential future recoupment.
The Board has adopted the Trust’s Master Distribution and Shareholder Service Plan (the “Plan”) pursuant to Rule 12b-1 under the 1940 Act. The Plan provides that a monthly service and/or distribution fee is calculated by the Fund at an annual rate of 0.25% of the average daily net assets for Class A and is paid to Northern Lights Distributors, LLC (the “Distributor” or “NLD”), to provide compensation for ongoing shareholder servicing and distribution-related activities or services and/or maintenance of the Fund’s shareholder accounts not otherwise required to be provided by the Advisor. The Plan is a compensation plan, which means that compensation is provided regardless of 12b-1 expenses incurred. The Fund’s Rule 12b-1 fee is contractually waived to 0.00% with respect to Class A until February 28, 2024. The agreement may be terminated by the Board on 60 days’ written notice to the Advisor. There is no guarantee that this fee waiver arrangement will continue in place after February 28, 2024, at which time it will be determined whether such arrangement will be renewed or revised. For the year ended October 31, 2022, pursuant to the Plan, Class A accrued $12,212 in 12b-1 fees, of which $12,212 was waived pursuant to the agreement. Waived Rule 12b-1 fees are not subject to potential future recoupment.
The Distributor acts as the Fund’s principal underwriter in a continuous public offering of the Fund’s Class A and Class I shares. For the year ended October 31, 2022, the Distributor received $352 in underwriting commissions for sales of Class A shares of which $45 was retained by the principal underwriter or other affiliated broker-dealers.
29
| Superfund Managed Futures Strategy Fund |
| Notes to Consolidated Financial Statements (Continued) |
| October 31, 2022 |
In addition, certain affiliates of the Distributor provide services to the Fund as follows:
Ultimus Fund Solutions, LLC (“UFS”), an affiliate of the Distributor, provides administration, fund accounting, and transfer agent services to the Trust. Pursuant to separate servicing agreements with UFS, the Fund pays UFS customary fees for providing administration, fund accounting and transfer agency services to the Fund. Certain officers of the Trust are also officers of UFS and are not paid any fees directly by the Fund for serving in such capacities.
Northern Lights Compliance Services, LLC (“NLCS”) – NLCS, an affiliate of UFS and the Distributor, provides a Chief Compliance Officer to the Trust, as well as related compliance services, pursuant to a consulting agreement between NLCS and the Trust. Under the terms of such agreement, NLCS receives customary fees from the Fund.
Blu Giant, LLC (“Blu Giant”) – Blu Giant, an affiliate of UFS and the Distributor, provides EDGAR conversion and filing services as well as print management services for the Fund on an ad-hoc basis. For the provision of these services, Blu Giant receives customary fees from the Fund.
| 5. | AGGREGATE UNREALIZED APPRECIATION AND DEPRECIATION – TAX BASIS |
The identified cost of investments in securities owned by the Fund for federal income tax purposes excluding futures and its respective gross unrealized appreciation and depreciation at October 31, 2022, was as follows:
| Gross Unrealized | Gross Unrealized | Net Unrealized | ||||||||||||
| Tax Cost | Appreciation | (Depreciation) | Depreciation | |||||||||||
| $ | — | $ | 462,472 | $ | (213,695 | ) | $ | 248,777 | ||||||
| 6. | DISTRIBUTIONS TO SHAREHOLDERS AND TAX COMPONENTS OF CAPITAL |
The tax character of fund distributions paid for the year ended October 31, 2022 and October 31, 2021 was as follows:
| Fiscal Year Ended | Fiscal Year Ended | |||||||
| October 31, 2022 | October 31, 2021 | |||||||
| Ordinary Income | $ | 2,430,212 | $ | 1,622,459 | ||||
| Long-Term Capital Gain | 647,908 | — | ||||||
| $ | 3,078,120 | $ | 1,622,459 | |||||
As of October 31, 2022, the components of accumulated earnings/(deficit) on a tax basis were as follows:
| Undistributed | Undistributed | Post October Loss | Capital Loss | Other | Unrealized | Total | ||||||||||||||||||||
| Ordinary | Long-Term | and | Carry | Book/Tax | Appreciation/ | Distributable Earnings/ | ||||||||||||||||||||
| Income | Gains | Late Year Loss | Forwards | Differences | (Depreciation) | (Accumulated Deficit) | ||||||||||||||||||||
| $ | 791,953 | $ | — | $ | — | $ | (2,162,429 | ) | $ | — | $ | 250,081 | $ | (1,120,395 | ) | |||||||||||
The difference between book basis and tax basis unrealized appreciation, accumulated net realized gain (loss) and accumulated net investment gain (loss) is primarily attributable to the mark-to-market on open futures contracts and forward foreign currency contracts. The unrealized appreciation (depreciation) in the table above includes unrealized foreign currency gains (losses) of $1,304.
30
| Superfund Managed Futures Strategy Fund |
| Notes to Consolidated Financial Statements (Continued) |
| October 31, 2022 |
At October 31, 2022, the Fund had capital loss carry forwards for federal income tax purposes available to offset future capital gains, as follows:
| CLCF | ||||||||||||||
| Short-Term | Long-Term | Total | Utilized | |||||||||||
| $ | 1,284,399 | $ | 878,030 | $ | 2,162,429 | $ | — | |||||||
Permanent book and tax differences, primarily attributable to the book/tax basis treatment of accumulated losses from the Fund’s wholly owned subsidiary, and adjustments for prior year tax returns, resulted in reclassifications for the Fund for the fiscal year ended October 31, 2022 as follows:
| Paid | ||||||
| In | Accumulated | |||||
| Capital | Loss | |||||
| $ | (636,057 | ) | $ | 636,057 | ||
| 7. | REDEMPTION FEES |
The Fund may assess a short-term redemption fee of 1.00% of the total redemption amount if a shareholder sells their shares after holding them for less than 30 days. For the year ended October 31, 2022 and 2021, the Fund assessed $12 and $1,137 respectively in redemption fees.
| 8. | CONTROL OWNERSHIP |
The beneficial ownership, either directly or indirectly, of more than 25% of the voting securities of a fund creates presumption of control of the fund, under Section 2(a) 9 of the 1940 Act. As of October 31, 2022, Superfund USA Holdings, Inc., an affiliate of the Advisor, held 76.83% of the voting securities of the Fund.
| 9. | SUBSEQUENT EVENTS |
Subsequent events after the Consolidated Statement of Assets and Liabilities date have been evaluated through the date the consolidated financial statements were available to be issued. Management has determined that no events or transactions occurred requiring adjustment or disclosure in the financial statements.
31

REPORT OF INDEPENDENT REGISTERED PUBLIC ACCOUNTING FIRM
To the Board of Trustees of Two Roads Shared Trust
and the Shareholders of Superfund Managed Futures Strategy Fund
Opinion on the Consolidated Financial Statements
We have audited the accompanying consolidated statement of assets and liabilities of Superfund Managed Futures Strategy Fund, a series of shares of beneficial interest in Two Roads Shared Trust (the “Fund”), including the consolidated schedule of investments, as of October 31, 2022, and the related consolidated statements of operations and changes in net assets and the consolidated financial highlights for the year then ended, and the related notes (collectively referred to as the “financial statements”). In our opinion, the financial statements present fairly, in all material respects, the financial position of the Fund as of October 31, 2022, and the results of its operations, the changes in its net assets and the financial highlights for the year then ended in conformity with accounting principles generally accepted in the United States of America. The consolidated statement of changes in net assets for the year ended October 31, 2021 and the consolidated financial highlights for each of the years in the four year period then ended were audited by other auditors, whose report dated December 28, 2021 expressed an unqualified opinion on such financial statement and financial highlights.
Basis for Opinion
These financial statements are the responsibility of the Fund’s management. Our responsibility is to express an opinion on the Fund’s financial statements based on our audit. We are a public accounting firm registered with the Public Company Accounting Oversight Board (United States) (“PCAOB”) and are required to be independent with respect to the Fund in accordance with the U.S. federal securities law and the applicable rules and regulations of the Securities and Exchange Commission and the PCAOB.
We conducted our audit in accordance with the standards of the PCAOB. Those standards require that we plan and perform the audit to obtain reasonable assurance about whether the financial statements are free of material misstatement, whether due to error or fraud. The Fund is not required to have, nor were we engaged to perform, an audit of its internal control over financial reporting. As part of our audit we are required to obtain an understanding of internal control over financial reporting but not for the purpose of expressing an opinion on the effectiveness of the Fund’s internal control over financial reporting. Accordingly, we express no such opinion.
32
Our audit included performing procedures to assess the risk of material misstatement of the financial statements, whether due to error or fraud, and performing procedures that respond to those risks. Such procedures included examining, on a test basis, evidence regarding the amounts and disclosures in the financial statements. Our procedures included confirmation of securities owned as of October 31, 2022 by correspondence with the custodian and brokers. Our audit also included evaluating the accounting principles used and significant estimates made by management, as well as evaluating the overall presentation of the financial statements. We believe that our audit provides a reasonable basis for our opinion.

BBD, LLP
We have served as the auditor of one or more of the Funds in the Two Roads Shared Trust since 2022.
Philadelphia, Pennsylvania
December 29, 2022
33
| Superfund Managed Futures Strategy Fund |
| EXPENSE EXAMPLES |
| October 31, 2022 (Unaudited) |
As a shareholder of Superfund Managed Futures Strategy Fund, you incur two types of costs: (1) transaction costs, including sales charges (loads) on purchases of Class A shares; (2) ongoing costs, including management fees; distribution and/or service (12b-1) fees; and other Fund expenses. This example is intended to help you understand your ongoing costs (in dollars) of investing in the Superfund Managed Futures Strategy Fund and to compare these costs with the ongoing costs of investing in other mutual funds.
The example is based on an investment of $1,000 invested at the beginning of the period and held for the entire period presented below.
Actual Expenses
The “Actual” line in the table below provides information about actual account values and actual expenses. You may use the information below together with the amount you invested, to estimate the expenses that you paid over the period. Simply divide your account value by $1,000 (for example, an $8,600 account value divided by $1,000 = 8.6), then multiply the result by the number in the table under the heading entitled “Expenses Paid During Period” to estimate the expenses you paid on your account during this period.
Hypothetical Example for Comparison Purposes
The “Hypothetical” line in the table below provides information about hypothetical account values and hypothetical expenses based on the Superfund Managed Futures Strategy Fund’s actual expense ratio and an assumed rate of return of 5% per year before expenses, which is not the Fund’s actual return. The hypothetical account values and expenses may not be used to estimate the actual ending account balances or expenses you paid for the period. You may use this information to compare this 5% hypothetical example with the 5% hypothetical examples that appear in the shareholder reports of other funds.
Please note that the expenses shown in the table are meant to highlight your ongoing costs only and do not reflect any transactional costs, such as sales charges (loads), or redemption fees. Therefore, the table is useful in comparing ongoing costs only, and will not help you determine the relative total costs of owning different funds. In addition, if these transactional costs were included, your costs would have been higher.
| Beginning | Ending | Expenses Paid | Expense Ratio | |||||
| Account Value | Account Value | During Period* | During Period** | |||||
| Actual | 5/1/22 | 10/31/22 | 5/1/22 – 10/31/22 | 5/1/22 – 10/31/22 | ||||
| Class A | $1,000.00 | $899.30 | $0.00 | 0.00%ǂ | ||||
| Class I | 1,000.00 | 898.40 | 0.00 | 0.00%ǂ | ||||
| Beginning | Ending | Expenses Paid | Expense Ratio | |||||
| Hypothetical | Account Value | Account Value | During Period* | During Period** | ||||
| (5% return before expenses) | 5/1/22 | 10/31/22 | 5/1/22 – 10/31/22 | 5/1/22 – 10/31/22 | ||||
| Class A | $1,000.00 | $1,025.21 | $0.00 | 0.00%ǂ | ||||
| Class I | 1,000.00 | 1,025.21 | 0.00 | 0.00%ǂ |
| * | Expenses are equal to the average account value over the period, multiplied by the Fund’s annualized expense ratio, multiplied by the number of days in the period (184) divided by the number of days in the fiscal year (365). |
| ** | Annualized. |
| ǂ | See Notes to Consolidated Financial Statements. |
34
Approval of Advisory Agreement (Unaudited)
Superfund Managed Futures Strategy Fund
At a meeting held on September 13-14, 2022 (the “Meeting”), the Board of Trustees (the “Board”) of Two Roads Shares Trust (the “Trust”), each of whom is not an “interested person” of the Trust (the “Independent Trustees” or the “Trustees”), as such term is defined under Section 2(a)(19) of the Investment Company Act of 1940, as amended (the “1940 Act”), considered the renewal of the investment advisory agreement (the “Advisory Agreement”) between Superfund Advisors, Inc. (“Superfund” or the “Adviser”) and the Trust, on behalf of the Superfund Managed Futures Strategy Fund (the “Fund”).
In connection with the Board’s consideration of the Advisory Agreement, the Board received written materials in advance of the Meeting, which included information regarding: (i) the nature, extent, and quality of services to be provided to the Fund by Superfund; (ii) a description of the Adviser’s investment management personnel; (iii) an overview of the Adviser’s operations and financial condition; (iv) a description of the Adviser’s brokerage practices (including any soft dollar arrangements); (v) a comparison of the Fund’s advisory fees and overall expenses with those of comparable mutual funds; (vi) the anticipated level of profitability from the Adviser’s fund-related operations; (vii) the Adviser’s compliance policies and procedures, including policies and procedures for personal securities transactions, business continuity and information security and (viii) information regarding the performance record of the Fund as compared to other mutual funds with similar investment strategies.
Throughout the process, including at the meeting, the Board had numerous opportunities to ask questions of and request additional materials from Superfund. During the Meeting, the Board was advised by, and met in executive session with, the Board’s independent legal counsel, and received a memorandum from such independent counsel regarding their responsibilities under applicable law. The Board also noted that the evaluation process with respect to the Adviser was an ongoing one and that in this regard, the Board took into account discussions with management and information provided to the Board at prior meetings with respect to the services provided by the Adviser, including quarterly performance reports prepared by management. The Board noted that information received and considered by the Board in connection with the Meeting and throughout the year was both written and oral.
Matters considered by the Board in connection with its approval of the Advisory Agreement included, among others, the following:
Nature, Extent and Quality of Services. The Board reviewed the materials provided by Superfund related to the services provided pursuant to the Advisory Agreement with the Trust on behalf of the Fund, including: the Advisory Agreement; a description of the manner in which investment decisions are made and executed; a review of the financial condition of Superfund; an overview of the personnel that perform advisory, compliance, and operational services for the Fund; a quarterly written report containing Superfund’s performance commentary; Superfund’s compliance program, including its business continuity policy and information systems security policy, and a Code of Ethics containing provisions reasonably necessary to prevent Access
35
Persons, as that term is defined in Rule 17j-1 under the Investment Company Act of 1940 Act, from engaging in conduct prohibited by Rule 17j-1(b); information regarding risk management processes and liquidity management; an annual review of the operation of Superfund’s compliance program; information regarding the Adviser’s and its affiliates’ compliance and regulatory history; and an independent report prepared by Broadridge analyzing the performance record and the fees and expenses of the Fund as compared to other mutual funds with similar investment strategies.
In considering the nature and quality of services to be provided by Superfund under the Advisory Agreement, the Board considered the level and sophistication of Superfund’s employees’ asset management, risk management, operations, and compliance experience.
The Board discussed Superfund’s investment strategy, noting that Superfund uses an automated proprietary trading system to which Superfund has not proposed any material changes or adjustments in its operation. The Board noted that because the Fund is generally invested in liquid commodity futures contracts, neither liquidity nor an inability to obtain market prices for the Fund’s holdings has generally been a significant factor in the Fund’s operation.
The Board also noted it has received and reviewed information from the Trust’s Chief Compliance Officer (CCO) regarding the Fund’s compliance policies and procedures established pursuant to Rule 38a-1 under the 1940 Act. The Board noted that the Trust’s CCO had not identified any significant matters relating to Superfund’s compliance program, and moreover, that Superfund appeared to be devoting adequate resources to its compliance program, including the engagement of an independent compliance consultant to perform reviews and risk assessments of Superfund’s compliance program. The Board noted that Superfund’s compliance, risk management and associated policies appeared to be operating effectively to identify and monitor risks and ensure compliance with the federal securities laws. The Board considered the effectiveness of Superfund’s cybersecurity and business continuity policies and procedures. The Board also considered the significant risks assumed by the Adviser in connection with the services provided to the Fund, including entrepreneurial risk and ongoing risks including investment, operational, enterprise, litigation, regulatory and compliance risks with respect to the Fund.
The Board considered the financial condition and operations of Superfund during the COVID-19 pandemic, and its financial wherewithal, and noted that there had been no material disruption of Superfund’s services to the Fund and that Superfund had continued to provide the same level, quality and extent of services to the Fund.
In considering the nature, extent, and quality of the services provided by Superfund, the Board also took into account its knowledge, acquired through discussions and reports during the preceding year and in past years, of Superfund’s management and the quality of the performance of Superfund’s duties. The Board concluded that Superfund had sufficient quality and depth of personnel, resources, investment methods, and compliance policies and procedures to perform its duties under the Advisory Agreement and that the nature, overall quality and extent of the advisory services provided by Superfund to the Fund were satisfactory and reliable.
Performance. In considering the Fund’s performance, the Board noted that it had reviewed at its regularly scheduled meetings information about the Fund’s performance results. Among
36
other data, the Board considered the performance of the Fund for the one-year, three-year, five-year, and since inception periods ended June 30, 2022, as compared to the Fund’s benchmark index (ICE Bank of America Merrill Lynch 3-Year Treasury Bill Total Return Index) and against the performance of a group of peer funds (the “Peer Group”) provided by Broadridge, an independent third-party data provider. The Board noted that while it found the data provided by the independent third-party generally useful it recognized its limitations, including in particular that the data may vary depending on the end date selected and that the results of the performance comparisons may vary depending on the selection of the Peer Group.
The Board considered that the Fund had underperformed the median of its Peer Group and Morningstar category as well as the Fund’s benchmark for the one-year period, but continued to outperform the median of its Peer Group and Morningstar category as well as the Fund’s benchmark for each of the three-year, five-year, and since inception periods, ranking first in its Peer Group for the five-year periods. The Board considered that the Fund’s return was augmented by its contractual waiver of its advisory fees, which reduced the Fund’s expenses to 0.00%. The Board noted that the Fund continued to maintain a five-star rating by Morningstar. The Board took into account Superfund’s discussion of the Fund’s performance, including the impact of current market conditions on the Fund’s more recent performance and any plans to address such performance. The Board also noted the differences in the Fund’s investment strategy relative to its Peer Group. The Board concluded that the overall performance of the Fund was satisfactory and noted the continued monitoring and review of the more recent performance by the Adviser.
Fees and Expenses. Regarding the costs of the services provided by Superfund with respect to the Fund, the Board considered a comparison of the Fund’s contractual advisory fee and net expense ratio to those of the funds within the Peer Group and to its Morningstar category. The Board noted that while it found the data provided by the independent third-party generally useful, it recognized its limitations, including potential differences in the investment strategies of the Fund relative to its Peer Group, as well as the level, quality and nature of the services provided by the Adviser with respect to the Fund.
The Board considered that the Fund’s contractual unitary fee was above the median of its category and the Peer Group. The Board noted the Fund’s unitary fee structure as compared to the more conventional fee structures used by others in the Peer Group. The Board also took into account that the Fund’s operating expense limitation agreement (the “Expense Limitation”) reduced the Fund’s total annual fund operating expenses to 0.00% and that Superfund had agreed to maintain this arrangement through at least February 28, 2023. The Board noted that the Fund’s net expense ratio under the Expense Limitation was the lowest in its Peer Group and Morningstar category. The Board also took into account management’s discussion of the status of the expense limitation agreement and also considered the Fund’s gross expense ratio relative to its Peer Group. The Board also took into account the size of the Fund. In considering the level of the unitary fee and expense ratio with respect to the Fund, the Board noted Superfund’s discussion as to the reasonableness and competitiveness of the Fund’s gross and net fees and expenses.
Based on the factors above, the Board concluded that the contractual unitary advisory fee of the Fund was not unreasonable.
37
Profitability. The Board considered Superfund’s profitability and whether these profits were reasonable in light of the services provided to the Fund. The Board reviewed a profitability analysis prepared by Superfund and considered that under the expense limitation currently in place, Superfund had not profited from its relationship with the Fund. The Board therefore concluded that the profitability of Superfund and its affiliates from their relationship with the Fund was not excessive.
Economies of Scale. The Board considered whether Superfund would realize economies of scale with respect to its management of the Fund as the Fund grows and whether fee levels reflected these economies of scale for the benefit of shareholders. The Board noted that the Fund currently charged a unitary fee that did not include breakpoints, but that the Adviser did not take a fee for its services pursuant to the expense limitation in place. The Board also took into consideration the relatively small level of assets in the Fund currently and determined that economies of scale were not a relevant consideration. The Board noted that it would revisit whether economies of scale exist in the future once the Fund has achieved sufficient size.
Other Benefits. The Board considered the character and amount of any other direct and incidental benefits to be received by Superfund from its association with the Fund. The Board considered that Superfund did not anticipate receiving any direct, indirect, or ancillary material “fall-out” benefits from its relationship with the Fund and no affiliate of Superfund was currently providing any services to the Fund.
Conclusion. The Board, having requested and received such information from Superfund as it believed reasonably necessary to evaluate the terms of the Advisory Agreement, and having been advised by independent counsel that the Board had appropriately considered and weighed all relevant factors, determined that approval of Advisory Agreement for an additional one-year term was in the best interests of the Fund and its shareholders.
In considering the Advisory Agreement renewal, the Board considered a variety of factors, including those discussed above, and also considered other factors (including conditions and trends prevailing generally in the economy, the securities markets, and the industry). The Board did not identify any one factor as determinative, and each Independent Trustee may have weighed each factor differently. The Board’s conclusions may be based in part on its consideration of the advisory arrangements in prior years and on the Board’s ongoing regular review of fund performance and operations throughout the year.
38
| Superfund Managed Futures Strategy Fund |
| SUPPLEMENTAL INFORMATION (Unaudited) |
| October 31, 2022 |
Trustees and Officers. The Trustees and officers of the Trust, together with information as to their principal business occupations during the past five years and other information, are shown below. Unless otherwise noted, the address of each Trustee and Officer is 225 Pictoria Drive, Suite 450, Cincinnati, OH 45246.
Independent Trustees *
| Name, Address, Year of Birth | Position(s) Held with Registrant | Term and Length Served | Principal Occupation(s) During Past 5 Years | Number of Portfolios Overseen In The Fund Complex** | Other Directorships Held During Past 5 Years |
| Mark Garbin Year of Birth: 1951 | Trustee | Indefinite, Since 2012 | Managing Principal, Coherent Capital Management LLC (since 2008), Independent Director, OCHEE LP (2021- present) | 1 | Northern Lights Fund Trust (since 2013); Northern Lights Variable Trust (since 2013); Forethought Variable Insurance Trust (since 2013); OHA Mortgage Strategies Fund (offshore), Ltd. (2014 – 2017); iCapital KKR Private Markets Fund (since 2014); Carlyle Tactical Private Credit Fund (since March 2018) and OHA CLO Enhanced Equity II Genpar LLP (since 2021) |
| Mark D. Gersten Year of Birth: 1950 | Chairman, Trustee | Indefinite, Since 2012 | Independent Consultant (since 2012); Senior Vice President – Global Fund Administration Mutual Funds & Alternative Funds, AllianceBernstein LP (1985 – 2011) | 1 | Northern Lights Fund Trust (since 2013); Northern Lights Variable Trust (since 2013); iCapital KKR Private Markets Fund (since 2014); previously, Ramius Archview Credit and Distressed Fund (2015-2017); and Schroder Global Series Trust (2012 to 2017) |
| Neil M. Kaufman Year of Birth: 1960 | Trustee, Audit Committee Chairman | Indefinite, Since 2012 | Managing Member, Kaufman, McGowan PLLC (legal services)(Since 2016); | 1 | iCapital KKR Private Markets Fund (since 2014) |
| Anita K. Krug Year of Birth: 1969 | Trustee | Indefinite, Since 2012 | Dean and Professor (since 2019) of Chicago-Kent College of Law, Illinois Institute of Technology; Interim Vice Chancellor for Academic Affairs (2018-2019) University of Washington Bothell; Interim Dean (2017- 2018), Professor (2016-2019), Associate Professor (2014-2016); and Assistant Professor (2010-2014), University of Washington School of Law | 1 | iCapital KKR Private Markets Fund (since 2014); Centerstone Investors Trust (2016-2021) |
| * | Information is as of October 31, 2022. |
| ** | As of October 31, 2022, the Trust was comprised of 25 active portfolios managed by seven unaffiliated investment advisers and two affiliated investment advisers. The term “Fund Complex” applies only to those funds that (i) are advised by a common investment adviser or by an investment adviser that is an affiliated person of the investment adviser of any of the other funds in the Trust or (ii) hold themselves out to investors as related companies for purposes of investment and investor services. The Fund does not share the same investment adviser with any other series of the Trust or hold itself out as related to any other series of the Trust for investment purposes. |
10/31/22 – Two Roads v2
39
| Superfund Managed Futures Strategy Fund |
| SUPPLEMENTAL INFORMATION (Unaudited)(Continued) |
| October 31, 2022 |
Officers of the Trust*
| Name, Address, Year of Birth | Position(s) Held with Registrant | Principal Occupation(s) During Past 5 Years | Number of Portfolios Overseen In The Fund Complex** | Other Directorships Held During Past 5 Years |
| James Colantino Year of Birth: 1969 | President Since Feb. 2017 Treasurer (2012 to 2017) | Senior Vice President (2012- present); Vice President (2004 to 2012); Ultimus Fund Solutions LLC | N/A | N/A |
| Laura Szalyga Year of Birth: 1978 | Treasurer Since Feb. 2017 | Vice President, Ultimus Fund Solutions LLC (since 2015); Assistant Vice President, Ultimus Fund Solutions LLC (2011-2014) | N/A | N/A |
| Timothy Burdick Year of Birth: 1986 | Vice President Since Aug. 2022 Secretary Since Aug. 2022 | Vice President and Managing Counsel, Ultimus Fund Solutions, LLC (2022 – present); Assistant Vice President and Counsel, Ultimus Fund Solutions, LLC (2019 – 2022); Senior Program Compliance Manager, CJ Affiliate (2016 –2019). | N/A | N/A |
| William B. Kimme Year of Birth: 1962 | Chief Compliance Officer Since Inception | Senior Compliance Officer, Northern Lights Compliance Services, LLC (September 2011 – present) | N/A | N/A |
| * | Information is as of October 31, 2022. |
| ** | As of October 31, 2022, the Trust was comprised of 25 active portfolios managed by seven unaffiliated investment advisers and two affiliated investment advisers. The term “Fund Complex” applies only to those funds that (i) are advised by a common investment adviser or by an investment adviser that is an affiliated person of the investment adviser of any of the other funds in the Trust or (ii) hold themselves out to investors as related companies for purposes of investment and investor services. The Fund does not share the same investment adviser with any other series of the Trust or hold itself out as related to any other series of the Trust for investment purposes. |
The Fund’s Statement of Additional Information (“SAI”) includes additional information about the Trustees and is available free of charge, upon request, by calling toll-free at 1-855-61-SUPER.
10/31/22 – Two Roads v2
40
LIQUIDITY RISK MANAGEMENT PROGRAM (Unaudited)
The Fund has adopted and implemented a written liquidity risk management program as required by Rule 22e-4 (the “Liquidity Rule”) under the 1940 Act. The program is reasonably designed to assess and manage the Fund’s liquidity risk, taking into consideration, among other factors, the Fund’s investment strategy and the liquidity of its portfolio investments during normal and reasonably foreseeable stressed conditions; its short and long-term cash flow projections; and its cash holdings and access to other funding sources.
During the fiscal period ended October 31, 2022, the Trust’s Liquidity Risk Management Program Committee (the “Committee”) reviewed the Fund’s investments and determined that the Fund held adequate levels of cash and highly liquid investments to meet shareholder redemption activities in accordance with applicable requirements. Accordingly, the Committee concluded that (i) the Fund’s liquidity risk management program is reasonably designed to prevent violations of the Liquidity Rule and (ii) the Fund’s liquidity risk management program has been effectively implemented.
41
PRIVACY NOTICE
| FACTS | WHAT DOES TWO ROADS SHARED TRUST DO WITH YOUR PERSONAL INFORMATION |
| Why? | Financial companies choose how they share your personal information. Federal law gives consumers the right to limit some but not all sharing. Federal law also requires us to tell you how we collect, share, and protect your personal information. Please read this notice carefully to understand what we do. |
| What? | THE TYPES OF PERSONAL INFORMATION WE COLLECT AND SHARE DEPENDS ON THE PRODUCT OR SERVICE THAT YOU HAVE WITH US. THIS INFORMATION CAN INCLUDE: |
| ● Social Security number and income | |
| ● Account transactions and transaction history | |
| ● Investment experience and purchase history | |
| When you are no longer our customer, we continue to share your information as described in this notice. | |
| How? | All financial companies need to share customers’ personal information to run their everyday business. In the section below, we list the reasons financial companies can share their customers’ personal information; the reason Two Roads Shared Trust chooses to share and whether you can limit this sharing. |
| Reasons we can share your personal information | Does Two Roads Shared Trust share? | Can you limit this sharing? |
| For our everyday business purposes – | ||
| such as to process your transactions, maintain your account(s), respond to court orders and legal investigations, or report to credit bureaus | YES | NO |
| For our marketing purposes – | NO | We do not share |
| to offer our products and services to you | ||
| For joint marketing with other financial companies | NO | We do not share |
| For our affiliates’ everyday business purposes – | NO | We do not share |
| information about your transactions and experiences | ||
| For our affiliates’ everyday business purposes – | NO | We do not share |
| information about your creditworthiness | ||
| For our affiliates to market to you | NO | We do not share |
| For nonaffiliates to market to you | NO | We do not share |
| Questions? | Call 1-402-895-1600 |
42
What we do
| How does Two Roads Shared Trust protect my personal information? | To protect your personal information from unauthorized access and use, we use security measures that comply with federal law. These measures include computer safeguards and secured files and buildings. |
| Our service providers are held accountable for adhering to strict policies and procedures to prevent any misuse of your nonpublic personal information. | |
| How does Two Roads Shared Trust | We collect your personal information, for example, when you |
| collect my personal information? | |
| ● open an account or give us contact information | |
| ● provide account information or give us your income information | |
| ● make deposits or withdrawals from your account | |
| We also collect your personal information from other companies. | |
| Why can’t I limit all sharing? | Federal law gives you the right to limit only |
| ● sharing for affiliates’ everyday business purposes – information about your creditworthiness | |
| ● affiliates from using your information to market to you | |
| ● sharing for nonaffiliates to market to you | |
| State laws and individual companies may give you additional rights to limit sharing | |
| Definitions | |
| Affiliates | Companies related by common ownership or control. They can be financial and nonfinancial companies. |
| ● Two Roads Shared Trust has no affiliates. | |
| Nonaffiliates | Companies not related by common ownership or control. They can be financial and nonfinancial companies. |
| ● Two Roads Shared Trust does not share with nonaffiliates so they can market to you. | |
| Joint marketing | A formal agreement between nonaffiliates financial companies that together market financial products or services to you. |
| ● Two Roads Shared Trust does not jointly market. |
43
Proxy Voting Policy
Information regarding how the Fund voted proxies relating to portfolio securities for the 12 month period ended June 30 as well as a description of the policies and procedures that the Fund used to determine how to vote proxies is available without charge, upon request, by calling 1-855-61-SUPER or by referring to the Securities and Exchange Commission’s (“SEC”) website at http://www.sec.gov.
Portfolio Holdings
The Fund files its complete schedule of portfolio holdings with the SEC for the first and third quarters of each fiscal year as an exhibit to its reports on Form N-PORT, within sixty days after the end of the period. Form N-PORT reports are available on the SEC’s website at http://www.sec.gov. The information on Form N-PORT is available without charge, upon request, by calling 1-855-61-SUPER.
| Investment Advisor |
| Superfund Advisors Inc. |
| P.O. Box 1568 |
| St. George’s |
| GRENADA |
| Administrator |
| Ultimus Fund Solutions, LLC |
| 225 Pictoria Drive, Suite 450 |
| Cincinnati, OH 45246 |
This report and the financial statements contained herein are submitted for the general information of shareholders and are not authorized for distribution to prospective investors unless preceded or accompanied by an effective prospectus, which contains information about the Fund’s investment objective, risks, fees, and expenses. Investors are reminded to read the prospectus carefully before investing in the Fund.
SUPERFD-AR22
(b) Not applicable.
Item 2. Code of Ethics.
(a) As of the end of the period covered by this report, the registrant has adopted a code of ethics that applies to the registrant's principal executive officer, principal financial officer, principal accounting officer or controller, or persons performing similar functions, regardless of whether these individuals are employed by the registrant or a third party.
(b) For purposes of this item, “code of ethics” means written standards that are reasonably designed to deter wrongdoing and to promote:
| (1) | Honest and ethical conduct, including the ethical handling of actual or apparent conflicts of interest between personal and professional relationships; |
| (2) | Full, fair, accurate, timely, and understandable disclosure in reports and documents that a registrant files with, or submits to, the Commission and in other public communications made by the registrant; |
(3) Compliance with applicable governmental laws, rules, and regulations;
| (4) | The prompt internal reporting of violations of the code to an appropriate person or persons identified in the code; and |
(5) Accountability for adherence to the code.
(c) Amendments: During the period covered by the report, there have not been any amendments to the provisions of the code of ethics.
(d) Waivers: During the period covered by the report, the registrant has not granted any express or implicit waivers from the provisions of the code of ethics.
(e) The Code of Ethics is not posted on Registrant’s website.
(f) A copy of the Code of Ethics is attached as an exhibit.
Item 3. Audit Committee Financial Expert.
(a)(1) The Registrant’s board of trustees has determined that Mark Gersten and Neil M. Kaufman are audit committee financial experts, as defined in Item 3 of Form N-CSR. Mr. Gersten and Mr. Kaufman are independent for purposes of this Item.
(a)(2) Not applicable.
(a)(3) Not applicable.
Item 4. Principal Accountant Fees and Services.
| (a) | Audit Fees |
2022 – $16,500
2021 – $16,000
| (b) | Audit-Related Fees |
2022 – None
2021 – None
| (c) | Tax Fees |
2022 – $4,500
2021 – $4,500
Preparation of Federal & State income tax returns, assistance with calculation of required income, capital gain and excise distributions and preparation of Federal excise tax returns.
| (d) | All Other Fees |
2022 - None
2021 - None
| (e) | (1) Audit Committee’s Pre-Approval Policies |
The registrant’s Audit Committee is required to pre-approve all audit services and, when appropriate, any non-audit services (including audit-related, tax and all other services) to the registrant. The registrant’s Audit Committee also is required to pre-approve, when appropriate, any non-audit services (including audit-related, tax and all other services) to its adviser, or any entity controlling, controlled by or under common control with the adviser that provides ongoing services to the registrant, to the extent that the services may be determined to have an impact on the operations or financial reporting of the
registrant. Services are reviewed on an engagement by engagement basis by the Audit Committee.
| (2) | Percentages of Services Approved by the Audit Committee |
2022 2021
Audit-Related Fees: 0.00% 0.00%
Tax Fees: 0.00% 0.00%
All Other Fees: 0.00% 0.00%
| (f) | During the audit of registrant's financial statements for the most recent fiscal year, less than 50 percent of the hours expended on the principal accountant's engagement were attributed to work performed by persons other than the principal accountant's full-time, permanent employees. |
| (g) | The aggregate non-audit fees billed by the registrant's accountant for services rendered to the registrant, and rendered to the registrant's investment adviser (not including any sub-adviser whose role is primarily portfolio management and is subcontracted with or overseen by another investment adviser), and any entity controlling, controlled by, or under common control with the adviser that provides ongoing services to the registrant: |
2022 - $4,500
2021 - $4,500
(h) The registrant's audit committee has considered whether the provision of non-audit services to the registrant's investment adviser (not including any sub-adviser whose role is primarily portfolio management and is subcontracted with or overseen by another investment adviser), and any entity controlling, controlled by, or under common control with the investment adviser that provides ongoing services to the registrant, that were not pre-approved pursuant to paragraph (c)(7)(ii) of Rule 2-01 of Regulation S-X, is compatible with maintaining the principal accountant's independence.
(i) Not applicable.
(j) Not applicable.
Item 5. Audit Committee of Listed Registrants. Not applicable.
Item 6. Investments. Schedule of investments in securities of unaffiliated issuers is included under Item 1.
Item 7. Disclosure of Proxy Voting Policies and Procedures for Closed-End Management Investment Companies. Not applicable to open-end investment companies.
Item 8. Portfolio Managers of Closed-End Management Investment Companies. Not applicable to open-end investment companies.
Item 9. Purchases of Equity Securities by Closed-End Management Investment Company and Affiliated Purchasers. Not applicable to open-end investment companies.
Item 10. Submission of Matters to a Vote of Security Holders. None
Item 11. Controls and Procedures.
(a) Based on an evaluation of the Registrant’s disclosure controls and procedures as of a date within 90 days of filing date of this Form N-CSR, the principal executive officer and principal financial officer of the Registrant have concluded that the disclosure controls and procedures of the Registrant are reasonably designed to ensure that the information required in filings on Form N-CSR is recorded, processed, summarized, and reported by the filing date, including that information required to be disclosed is accumulated and communicated to the Registrant’s management, including the Registrant’s principal executive officer and principal financial officer, as appropriate to allow timely decisions regarding required disclosure.
(b) There were no significant changes in the Registrant’s internal control over financial reporting that occurred during the period covered by this report that have materially affected, or are reasonably likely to materially affect, the Registrant’s internal control over financial reporting.
Item 12. Disclosure of Securities Lending Activities for Closed-End Management Investment Companies. Not applicable to open-end investment companies.
Item 13. Exhibits.
(a)(1) Code of Ethics filed herewith.
(a)(3) Not applicable to open-end investment companies.
SIGNATURES
Pursuant to the requirements of the Securities Exchange Act of 1934 and the Investment Company Act of 1940, the registrant has duly caused this report to be signed on its behalf by the undersigned, thereunto duly authorized.
(Registrant) Two Roads Shared Trust
By (Signature and Title)
/s/ Jim Colantino
Jim Colantino, President/Principal Executive Officer
Date 1/3/23
Pursuant to the requirements of the Securities Exchange Act of 1934 and the Investment Company Act of 1940, this report has been signed below by the following persons on behalf of the registrant and in the capacities and on the dates indicated.
By (Signature and Title)
/s/ Jim Colantino
Jim Colantino, President/Principal Executive Officer
Date 1/3/23
By (Signature and Title)
/s/ Laura Szalyga
Laura Szalyga, Treasurer/Principal Financial Officer
Date 1/3/23