united states
securities and exchange commission
washington, d.c. 20549
form n-csr
certified shareholder report of registered management
investment companies
Investment Company Act file number 811-22718
Two Roads Shared Trust
(Exact name of registrant as specified in charter)
225 Pictoria Drive, Suite 450 Cincinnati, OH 45246
(Address of principal executive offices) (Zip code)
Timothy Burdick, Ultimus Fund Solutions
4221 North 203rd St. Suite 100 Elkhorn, Nebraska 68022-3474
(Name and address of agent for service)
Registrant's telephone number, including area code: 631-470-2619
Date of fiscal year end: 4/30
Date of reporting period: 4/30/23
ITEM 1. REPORTS TO SHAREHOLDERS.

Holbrook Income Fund
Holbrook Structured Income Fund
Class I Shares
Investor Class Shares
Class A Shares
| Annual Report |
| April 30, 2023 |
Advised by:
Holbrook Holdings, Inc.
1032 Windy Elm Drive
Smyrna, GA 30082
www.holbrookholdings.com
1-877-345-8646
Distributed by Northern Lights Distributors, LLC
Member FINRA
Holbrook Income Fund / Holbrook Structured Income Fund Annual Shareholder Letter
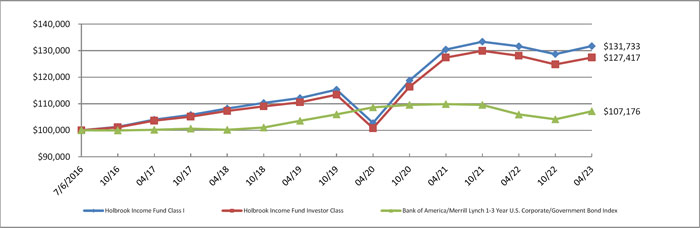
The Holbrook Income Fund (the “Income Fund”) remains committed to pursuing its investment objective of providing its shareholders current income and its secondary objective of providing its shareholders capital preservation in a rising interest rate environment. We seek to achieve these objectives without the use of derivatives or leverage. Since inception we have never had exposure to derivatives, nor do we plan to utilize them in the foreseeable future. To these ends, our trailing performance is as follows: For the 12-month reporting period ended April 30, 2023, the Holbrook Income Fund Class I had a one-year return of 0.07% net of fees versus its benchmark, the Bank of America/Merrill Lynch 1-3 Year U.S. Corporate/Government Bond Index1, which returned 1.16% over the same time-period. From its inception date of July 6, 2016 to April 30, 2023, the Holbrook Income Fund had an annualized gain of 4.13% versus its benchmark which had an annualized return of 1.02% for that same period.
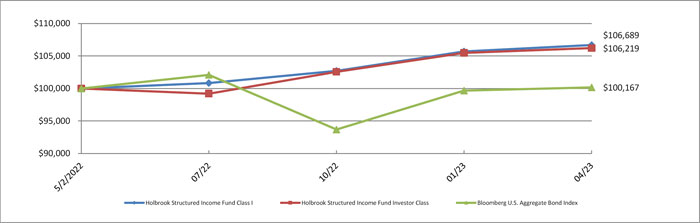
The Holbrook Structured Income Fund (the “Structured Income Fund”) remains committed to pursuing its investment objectives of providing its shareholders with current income and the opportunity for capital appreciation to produce a total return. Like the Income Fund, we seek to achieve these objectives without the use of derivatives or leverage. Since inception we have never had exposure to derivatives, nor do we plan to utilize them in the foreseeable future. To these ends, our performance since inception is as follows: From its inception date of May 2, 2022 to April 30, 2023, the Holbrook Structured Income Fund Class I had a total return of 6.69% net of fees versus its benchmark, the Bloomberg US Aggregate Bond Index2, which had a total return of 0.17% for that same period.
Inflation remained robust and Fed policy was more hawkish than our expectations. The 3-year treasury rose from 2.89% to 3.72% over the course of the year creating a sizeable headwind. Meanwhile, high yield corporate spreads (as measured by the Bloomberg US Corporate High Yield Average OAS Index) were wider – increasing from 3.79% at the beginning of the year to 4.52% on April 30, 2023. Investment grade corporate spreads (as measured by the Bloomberg US Agg Corporate Avg OAS) increased from 1.35% to 1.36%. While we remain confident in the fundamental ability of our issuers to repay their debt in full, underperformance in the Holbrook Income Fund can be attributed to increasing liquidity premiums in a couple of our subsectors. Our CMBS exposure (13% of the portfolio) remains primarily investment grade, and is short in nature, however underperformed over the last year. Similarly, baby bonds (26% of the portfolio) underperformed. We believe this sector was the victim of retail tax-loss selling at the end of the calendar year and believe the subsector offers a compelling risk/reward profile moving forward. Nevertheless, fund underperformance for the past twelve months can be attributed to these two subsectors. Within Holbrook Structured Income Fund, fund outperformance can be attributed to CLO and CMBS exposure which comprise over 90% of the portfolio. The CMBS exposure within the fund is mostly tied to multifamily and healthcare assets which have performed well. Over the past twelve months as the federal reserve has been raising interest rates, our CLO and CMBS positions, which are mostly floating rate, have seen their coupon rates almost double in some cases; this has been the main reason for outperformance as the yields on our holdings have increased.
Looking forward, it’s our opinion that macro-forecasts for the next 12 months are murky. While our expectations for core inflation are for it to settle in the 3- 4% range, recent readings have shown its resiliency and the Federal Reserve has made fighting inflation a high priority. While the Fed Fund Futures market is currently pricing in rate cuts by the end of the year, we believe it is more likely that the Fed will be on hold for an extended period of time. Elevated inflation and a deluge of treasury supply after the debt ceiling is raised poses additional risks to treasury yields which could potentially continue moving higher. Meanwhile, the fiscal stimulus impulse following Covid- 19 will continue to wane. In such an uncertain environment, we continue to execute our strategy of minimizing spread duration by shortening the maturity schedule for both funds. We are content to harvest yield at the short-end of the curve and to patiently wait for better opportunities in longer-dated and high yield paper for both funds.
| 1 | The Bank of America /Merrill Lynch 1-3 Year U.S. Corporate/Government Bond Index - The Bank of America /Merrill Lynch 1-3 Year U.S. Corporate/Government Bond Index is a subset of the Bank of America Merrill Lynch U.S. Government/Corporate Index and tracks the performance of investment-grade debt securities with a remaining term to final maturity of less than 3 years. Investors cannot invest directly in an index. Index returns are gross of any fees, brokerage commissions or other expenses of investing. |
| 2 | Bloomberg US Aggregate Bond Index - The Bloomberg US Aggregate Bond Index is a broad-based flagship benchmark that measures the investment grade, US dollar-denominated, fixed-rate taxable bond market. The index includes Treasuries, government-related and corporate securities, MBS (agency fixed-rate pass-throughs), ABS and CMBS (agency and non-agency). |
5478-NLD-05222023
1
Thank you for your support of the Holbrook Income Fund and the Holbrook Structured Income Fund,

Scott Carmack
CEO Holbrook Holdings Inc.
Portfolio Manager
The views in this report are those of the Funds’ management. This report contains certain forward-looking statements about factors that may affect the performance of the Funds in the future. These statements are based on the Funds’ management’s predictions and expectations concerning certain future events such as the performance of the economy as a whole and of specific industry sectors. Management believes these forward-looking statements are reasonable, although they are inherently uncertain and difficult to predict.
5478-NLD-05222023
2
Holbrook Income Fund
Portfolio Review (Unaudited)
April 30, 2023
The Fund’s performance figures* for each period ended April 30, 2023, compared to its benchmark:
| Annualized | Annualized | Annualized | ||
| 1 Year | 5 Year Return | Since Inception (a) | Since Inception (b) | |
| Class I | 0.07% | 4.02% | 4.13% | N/A |
| Investor Class | -0.50% | 3.50% | 3.62% | N/A |
| Class A | -0.10% | N/A | N/A | -0.53% |
| Class A with load | -1.35% | N/A | N/A | -1.26% |
| Bank of America/Merrill Lynch 1-3 Year U.S. Corporate/Government Bond Index (c) | 1.16% | 1.36% | 1.02% | -1.44% |
| * | The performance data quoted here represents past performance. Current performance may be lower or higher than the performance data quoted above. Investment return and principal value will fluctuate, so that shares, when redeemed, may be worth more or less than their original cost. The returns shown do not reflect the deduction of taxes that a shareholder would pay on Fund distributions or on the redemptions of Fund shares. Past performance is no guarantee of future results. Per the fee table in the prospectus dated August 31, 2022 the Fund’s total annual operating expenses are 1.10% for Class I, 1.60% for Investor Class and 1.37% for Class A shares. The Fund’s advisor has contractually agreed to reduce the Fund’s fees and/or absorb expenses of the Fund until at least September 1, 2023 to ensure that total annual Fund operating expenses after fee waiver and reimbursement (exclusive of any front-end or contingent deferred loads; brokerage fees and commissions; acquired fund fees and expenses, borrowing costs (such as interest and dividend expense on securities sold short); taxes; and extraordinary expenses (such as litigation) will not exceed 1.30%, 1.80% and 1.55% of average daily net assets attributable to Class I shares, Investor Class shares and Class A shares, respectively. This agreement may be terminated by the Fund’s Board of Trustees on 60 days’ written notice to the advisor. These fee waivers and expense reimbursements are subject to possible recoupment from the Fund in future years on a rolling three year basis (within the three years after the fees have been waived or reimbursed) if such recapture can be achieved within the foregoing expense limits as well as any expense limitation that was in effect at the time the waiver or reimbursement was made. For performance information current to the most recent month-end, please call toll-free 1-877-345-8646 or visit www.holbrookholdings.com. |
| (a) | Inception date is July 6, 2016 for Class I and Investor Class. |
| (b) | Inception date is July 23, 2021 for Class A. |
| (c) | Bank of America/Merrill Lynch 1-3 Year U.S. Corporate/Government Bond Index : The index is a subset of the Bank of America Merrill Lynch U.S. Government/Corporate Index and tracks the performance of investment-grade debt securities with a remaining term to final maturity of less than 3 years. Investors cannot invest directly in an index. Index returns are gross of any fees, brokerage commissions or other expenses of investing. |
Comparison of the Change in Value of a $100,000 Investment
| Top 10 Holdings by Industry | % of Net Assets | |||
| Asset Management | 27.2 | % | ||
| CLO | 22.4 | % | ||
| Specialty Finance | 11.1 | % | ||
| Non Agency CMBS | 9.8 | % | ||
| Oil & Gas Producers | 3.7 | % | ||
| Collateralized Mortgage Obligations | 2.8 | % | ||
| Fixed Income | 2.8 | % | ||
| Short-Term investments | 2.6 | % | ||
| Real Estate Services | 2.4 | % | ||
| Institutional Financial Services | 2.4 | % | ||
| Other Assets Less Liabilities | 12.8 | % | ||
| 100.0 | % | |||
Please refer to the Schedule of Investments in this report for a detailed analysis of the Fund’s holdings.
3
Holbrook Structured Income Fund
Portfolio Review (Unaudited)
April 30, 2023
The Fund’s performance figures* for each period ended April 30, 2023, compared to its benchmark:
| Since Inception (a) | |
| Class I | 6.69% |
| Investor Class | 6.22% |
| Class A | 6.32% |
| Class A with load | 3.93% |
| Bloomberg U.S. Aggregate Bond Index (b) | 0.17% |
| * | The performance data quoted here represents past performance. Current performance may be lower or higher than the performance data quoted above. Investment return and principal value will fluctuate, so that shares, when redeemed, may be worth more or less than their original cost. The returns shown do not reflect the deduction of taxes that a shareholder would pay on Fund distributions or on the redemptions of Fund shares. Past performance is no guarantee of future results. Per the fee table in the prospectus dated August 31, 2022 the Fund’s total annual operating expenses are 1.60% for Class I, 2.10% for Investor Class and 1.85% for Class A shares. The Fund’s advisor has contractually agreed to reduce the Fund’s fees and/or absorb expenses of the Fund until at least September 1, 2023 to ensure that total annual Fund operating expenses after fee waiver and reimbursement (exclusive of any front-end or contingent deferred loads; brokerage fees and commissions; acquired fund fees and expenses, borrowing costs (such as interest and dividend expense on securities sold short); taxes; and extraordinary expenses (such as litigation) will not exceed 1.50%, 2.00% and 1.75% of average daily net assets attributable to Class I shares, Investor Class shares and Class A shares, respectively. This agreement may be terminated by the Fund’s Board of Trustees on 60 days’ written notice to the advisor. These fee waivers and expense reimbursements are subject to possible recoupment from the Fund in future years on a rolling three year basis (within the three years after the fees have been waived or reimbursed) if such recapture can be achieved within the foregoing expense limits as well as any expense limitation that was in effect at the time the waiver or reimbursement was made. For performance information current to the most recent month-end, please call toll-free 1-877-345-8646 or visit www.holbrookholdings.com. |
| (a) | Inception date is May 2, 2022 for Class A, Class I and Investor Class. |
| (b) | The Bloomberg US Aggregate Bond Index : The index is an unmanaged index which represents the U.S. investment-grade fixed-rate bond market (including government and corporate securities, mortgage pass-through securities and asset backed securities). Investors cannot invest directly in an index or benchmark. |
Comparison of the Change in Value of a $100,000 Investment
| Top Holdings by Industry | % of Net Assets | |||
| Non Agency CMBS | 59.4 | % | ||
| CLO | 27.6 | % | ||
| Specialty Finance | 4.8 | % | ||
| Residential Mortgage | 3.0 | % | ||
| Collateralized Mortgage Obligations | 2.5 | % | ||
| Other Assets Less Liabilities | 2.7 | % | ||
| 100.0 | % | |||
Please refer to the Schedule of Investments in this report for a detailed analysis of the Fund’s holdings.
4
| HOLBROOK INCOME FUND |
| SCHEDULE OF INVESTMENTS |
| April 30, 2023 |
| Shares | Fair Value | |||||||||||
| OPEN END FUNDS — 2.8% | ||||||||||||
| FIXED INCOME - 2.8% | ||||||||||||
| 3,068,060 | Holbrook Structured Income Fund, Class I (h) | $ | 29,729,499 | |||||||||
| TOTAL OPEN END FUNDS (Cost $30,563,075) | 29,729,499 | |||||||||||
| Coupon Rate | ||||||||||||
| (%) | Maturity | |||||||||||
| PREFERRED STOCKS — 3.7% | ||||||||||||
| ASSET MANAGEMENT — 0.2% | ||||||||||||
| 89,817 | Gladstone Investment Corporation | 5.0000 | 05/01/26 | 2,133,154 | ||||||||
| INDUSTRIAL INTERMEDIATE PROD — 1.7% | ||||||||||||
| 792,586 | Steel Partners Holdings, L.P. | 6.0000 | 02/27/26 | 18,475,179 | ||||||||
| REAL ESTATE INVESTMENT TRUSTS — 0.3% | ||||||||||||
| 124,000 | Vinebrook Homes Trust, Inc. 144A(a),(i) | 6.5000 | 10/07/27 | 2,728,000 | ||||||||
| REAL ESTATE SERVICES — 1.4% | ||||||||||||
| 200,000 | Greystone SDOF Preferred Equity, LLC 144A(a),(i) | 6.7500 | 12/23/25 | 4,600,000 | ||||||||
| 3,000 | UIRC-GSA International, LLC 144A(a),(i) | 6.5000 | Perpetual | 2,970,000 | ||||||||
| 8,180 | UIRC-GSA International, LLC 144A(a),(i) | 6.0000 | Perpetual | 8,098,200 | ||||||||
| 15,668,200 | ||||||||||||
| SPECIALTY FINANCE — 0.1% | ||||||||||||
| 35,600 | Priority Income Fund, Inc. | 6.0000 | 12/31/26 | 818,444 | ||||||||
| 12,000 | Priority Income Fund, Inc. | 6.2500 | 06/30/26 | 281,760 | ||||||||
| 1,100,204 | ||||||||||||
| TOTAL PREFERRED STOCKS (Cost $41,152,507) | 40,104,737 | |||||||||||
| ASSET BACKED SECURITIES — 36.8% | ||||||||||||
| AUTO LOAN — 0.1% | ||||||||||||
| 1,250,000 | Luxury Lease Partners Auto Lease Trust Series 2021-ARC2 B(a) | 7.0000 | 07/15/27 | 1,201,736 | ||||||||
See accompanying notes which are an integral part of these financial statements.
5
| HOLBROOK INCOME FUND |
| SCHEDULE OF INVESTMENTS (Continued) |
| April 30, 2023 |
| Principal | Coupon Rate | |||||||||||||
| Amount ($) | Spread | (%) | Maturity | Fair Value | ||||||||||
| ASSET BACKED SECURITIES — 36.8% (Continued) | ||||||||||||||
| CLO — 22.4% | ||||||||||||||
| 17,800,000 | 610 Funding CLO 1 Ltd. Series 2015-1A BR(a),(b) | US0003M + 2.600% | 7.5580 | 09/21/29 | $ | 17,902,865 | ||||||||
| 5,000,000 | 610 Funding CLO 1 Ltd. Series 2015-1A CR(a),(b) | US0003M + 3.900% | 8.8580 | 09/21/29 | 5,011,950 | |||||||||
| 6,750,000 | Ammc Clo Ltd. Series 2017-20A DR(a),(b) | US0003M + 3.150% | 8.4100 | 04/17/29 | 6,733,544 | |||||||||
| 5,000,000 | Apres Static CLO Ltd. Series 2019-1A BR(a),(b) | US0003M + 2.400% | 7.6600 | 10/15/28 | 5,000,820 | |||||||||
| 3,975,000 | Apres Static CLO Ltd. Series 2019-1A DR(a),(b) | US0003M + 7.760% | 13.0200 | 10/15/28 | 3,959,712 | |||||||||
| 3,000,000 | Brightwood Capital MM CLO Ltd. Series 2021-2A C1(a),(b) | US0003M + 2.900% | 8.1600 | 11/15/30 | 2,933,727 | |||||||||
| 1,000,000 | Brightwood Capital MM CLO Ltd. Series 2021-2A D(a),(b) | US0003M + 4.000% | 9.2600 | 11/15/30 | 950,300 | |||||||||
| 5,061,024 | Cutwater Ltd. Series 2014-1A CR(a),(b) | US0003M + 3.600% | 8.8600 | 07/15/26 | 5,055,325 | |||||||||
| 6,000,000 | Greywolf CLO II Ltd. Series 2013-1A DRR(a),(b) | US0003M + 7.050% | 12.3100 | 04/15/34 | 5,312,298 | |||||||||
| 4,000,000 | Highbridge Loan Management Ltd. Series 7A-2015 DR(a),(b) | US0003M + 2.400% | 7.2640 | 03/15/27 | 4,001,572 | |||||||||
| 4,035,758 | Highbridge Loan Management Ltd. Series 7A-2015 ER(a),(b) | US0003M + 5.000% | 9.8640 | 03/15/27 | 4,023,966 | |||||||||
| 4,000,000 | JFIN CLO Ltd. Series 2012-1A BR(a),(b) | US0003M + 2.350% | 7.6000 | 07/20/28 | 4,004,400 | |||||||||
| 3,800,000 | KKR CLO Ltd. Series 13 ER(a),(b) | US0003M + 4.950% | 10.2100 | 01/16/28 | 3,781,312 | |||||||||
| 1,000,000 | LCM XX, L.P. Series 20A CR(a),(b) | US0003M + 1.950% | 7.2000 | 10/20/27 | 981,661 | |||||||||
| 3,895,000 | LCM XX, L.P. Series 20A DR(a),(b) | US0003M + 2.800% | 8.0500 | 10/20/27 | 3,806,210 | |||||||||
| 1,500,000 | LCM XXI, L.P. Series 21A DR(a),(b) | US0003M + 2.800% | 8.0500 | 04/20/28 | 1,488,327 | |||||||||
| 2,869,000 | Longfellow Place CLO Ltd. Series 2013-1A DRR(a),(b) | US0003M + 4.500% | 9.7600 | 04/15/29 | 2,851,720 | |||||||||
| 2,205,161 | Marathon CLO VII Ltd. Series 2014-7A C(a),(b) | US0003M + 3.800% | 9.0730 | 10/28/25 | 2,199,478 | |||||||||
| 7,100,000 | Mount Logan Funding LP Series 2018-1A DR(a),(b) | US0003M + 4.500% | 8.8250 | 01/22/33 | 6,541,791 | |||||||||
| 3,584,679 | Mountain View CLO Ltd. Series 2014-1A DRR(a),(b) | US0003M + 3.650% | 8.9100 | 10/15/26 | 3,580,916 | |||||||||
| 4,060,000 | Mountain View CLO X Ltd. Series 2015-10A CR(a),(b) | US0003M + 1.850% | 7.0920 | 10/13/27 | 4,054,539 | |||||||||
| 3,000,000 | Mountain View CLO X Ltd. Series 2015-10A DR(a),(b) | US0003M + 2.600% | 7.8420 | 10/13/27 | 3,001,524 | |||||||||
| 3,590,000 | Mountain View CLO, LLC Series 2017-1A CR(a),(b) | US0003M + 2.350% | 7.6100 | 10/16/29 | 3,575,259 | |||||||||
| 4,651,000 | Newfleet CLO Ltd. Series 2016-1A CR(a),(b) | US0003M + 2.000% | 7.2500 | 04/20/28 | 4,657,009 | |||||||||
| 7,700,000 | Newfleet CLO Ltd. Series 2016-1A DR(a),(b) | US0003M + 2.950% | 8.2000 | 04/20/28 | 7,669,500 | |||||||||
| 6,235,000 | Palmer Square Loan Funding Ltd. Series 2021-1A C(a),(b) | US0003M + 2.900% | 8.1500 | 04/20/29 | 6,236,079 | |||||||||
| 5,070,000 | Parallel Ltd. Series 2015-1A DR(a),(b) | US0003M + 2.550% | 7.8000 | 07/20/27 | 5,052,260 | |||||||||
| 1,825,000 | PennantPark CLO II Ltd. Series 2020-2A D(a),(b) | US0003M + 6.500% | 11.7600 | 01/15/32 | 1,748,186 | |||||||||
| 2,250,000 | PennantPark CLO Ltd. Series 2021-3A D(a),(b) | US0003M + 4.100% | 9.3730 | 10/22/32 | 2,060,116 | |||||||||
| 7,200,000 | Ready Capital Mortgage Financing, LLC Series 2023-FL11 A(a),(b) | TSFR1M + 2.374% | 7.3450 | 10/25/39 | 7,162,358 | |||||||||
| 5,000,000 | Saranac CLO III Ltd. Series 2014-3A CR(a),(b) | US0003M + 2.350% | 7.2970 | 06/22/30 | 4,589,370 | |||||||||
| 5,000,000 | Saranac Clo VII Ltd. Series 2014-2A CR(a),(b) | US0003M + 2.250% | 7.1650 | 11/20/29 | 4,875,260 | |||||||||
| 3,000,000 | Saratoga Investment Corp CLO Ltd. Series 2013-1A DR3(a),(b) | US0003M + 4.000% | 9.2500 | 04/20/33 | 2,695,935 | |||||||||
| 4,000,000 | Saratoga Investment Corporation CLO Ltd. Series 2013-1A ER3(a),(b) | US0003M + 7.500% | 12.7500 | 04/20/33 | 3,464,632 | |||||||||
See accompanying notes which are an integral part of these financial statements.
6
| HOLBROOK INCOME FUND |
| SCHEDULE OF INVESTMENTS (Continued) |
| April 30, 2023 |
| Principal | Coupon Rate | |||||||||||||
| Amount ($) | Spread | (%) | Maturity | Fair Value | ||||||||||
| ASSET BACKED SECURITIES — 36.8% (Continued) | ||||||||||||||
| CLO — 22.4% (Continued) | ||||||||||||||
| 6,032,500 | Shackleton CLO Ltd. Series 2015-8A CR(a),(b) | US0003M + 1.650% | 6.9000 | 10/20/27 | $ | 6,053,994 | ||||||||
| 363,425 | Silvermore CLO Ltd. Series 2014-1A C(a),(b) | US0003M + 3.450% | 8.3140 | 05/15/26 | 363,650 | |||||||||
| 2,000,000 | Sound Point Clo XII Ltd. Series 2016-2A DR(a),(b) | US0003M + 3.850% | 9.1000 | 10/20/28 | 1,994,942 | |||||||||
| 3,000,000 | Sound Point Clo XIV Ltd. Series 2016-3A DR(a),(b) | US0003M + 3.650% | 8.9230 | 01/23/29 | 2,993,496 | |||||||||
| 7,723,672 | Symphony CLO XIV Ltd. Series 2014-14A CR(a),(b) | US0003M + 2.100% | 7.3510 | 07/14/26 | 7,730,361 | |||||||||
| 1,500,000 | Symphony CLO XIV Ltd. Series 2014-14A E(a),(b) | US0003M + 4.600% | 9.8510 | 07/14/26 | 1,479,828 | |||||||||
| 12,650,000 | Symphony CLO XVII Ltd. Series 2016-17A DR(a),(b) | US0003M + 2.650% | 7.9100 | 04/15/28 | 12,709,884 | |||||||||
| 2,800,000 | Symphony CLO XVII Ltd. Series 2016-17A ER(a),(b) | US0003M + 5.550% | 10.8100 | 04/15/28 | 2,749,519 | |||||||||
| 6,768,874 | Telos Clo Ltd. Series 2013-3A CR(a),(b) | US0003M + 2.600% | 7.8600 | 07/17/26 | 6,778,121 | |||||||||
| 14,485,000 | Telos Clo Ltd. Series 2013-3A DR(a),(b) | US0003M + 3.750% | 9.0100 | 07/17/26 | 14,577,703 | |||||||||
| 10,410,000 | Telos CLO Ltd. Series 2014-6A DR(a),(b) | US0003M + 3.700% | 8.9600 | 01/17/27 | 10,389,326 | |||||||||
| 7,360,000 | Telos CLO Ltd. Series 2014-5A CR(a),(b) | US0003M + 2.150% | 7.4100 | 04/17/28 | 7,288,505 | |||||||||
| 992,000 | Telos CLO Ltd. Series 2014-5A DR(a),(b) | US0003M + 3.300% | 8.5600 | 04/17/28 | 955,371 | |||||||||
| 2,000,000 | Tiaa Clo III Ltd. Series 2017-2A B(a),(b) | US0003M + 1.500% | 6.7600 | 01/16/31 | 1,967,750 | |||||||||
| 3,000,000 | Wellfleet CLO Ltd. Series 2016-1A CR(a),(b) | US0003M + 2.000% | 7.2500 | 04/20/28 | 2,981,820 | |||||||||
| 868,698 | WhiteHorse X Ltd. Series 2015-10A DR(a),(b) | US0003M + 3.000% | 8.2600 | 04/17/27 | 869,311 | |||||||||
| 1,500,000 | Zais CLO 3 Ltd. Series 2015-3A BR(a),(b) | US0003M + 2.650% | 7.9100 | 07/15/31 | 1,415,202 | |||||||||
| 6,500,000 | Zais CLO 5 Ltd. Series 2016-2A B(a),(b) | US0003M + 3.300% | 8.5600 | 10/15/28 | 6,499,890 | |||||||||
| 240,762,594 | ||||||||||||||
| COLLATERALIZED MORTGAGE OBLIGATIONS — 2.8% | ||||||||||||||
| 3,600,000 | AREIT, LLC Series 2022-CRE7 A(a),(b) | TSFR1M + 2.242% | 7.1320 | 06/17/39 | 3,605,249 | |||||||||
| 4,089,352 | Cascade Funding Mortgage Trust Series 2022-AB2 M3(a),(c) | 2.0000 | 02/25/52 | 3,044,149 | ||||||||||
| 1,675,000 | CFMT, LLC Series 2022-EBO2 M3(a),(c) | 5.3280 | 07/25/54 | 1,614,879 | ||||||||||
| 1,000,000 | CHNGE Mortgage Trust Series 2022-1 B2(a),(c) | 4.5340 | 01/25/67 | 744,280 | ||||||||||
| 3,277,030 | Farmer Mac Agricultural Real Estate Trust Series 2021-1 B(a),(c) | 3.2370 | 01/25/51 | 2,246,532 | ||||||||||
| 2,865,364 | Imperial Fund Mortgage Trust Series 2022-NQM7 A1(a),(d) | 7.3690 | 11/25/67 | 2,935,412 | ||||||||||
| 2,000,000 | Lakeview Trust Series 2022-3 M3(a) | 5.4370 | 05/29/52 | 1,904,996 | ||||||||||
| 1,000,000 | MFA Trust Series 2023-RTL1 A1(a),(d) | 7.5750 | 08/25/27 | 995,342 | ||||||||||
| 1,000,000 | PRPM, LLC Series 2020-6 A2(a),(d) | 4.7030 | 11/25/25 | 881,565 | ||||||||||
| 5,000,000 | RMF Proprietary Issuance Trust Series 2022-2 M3(a),(c),(i) | 3.7500 | 06/25/62 | 3,150,000 | ||||||||||
| 12,500,000 | RMF Proprietary Issuance Trust Series 2022-3 M3(a),(c),(i) | 4.0000 | 08/25/62 | 8,625,001 | ||||||||||
| 491,892 | Verus Securitization Trust Series 2023-1 A1(a),(d) | 5.8500 | 12/25/67 | 492,186 | ||||||||||
| 250,000 | Verus Securitization Trust Series 2023-3 A2(a),(d),(i) | 6.4380 | 03/25/68 | 249,975 | ||||||||||
| 30,489,566 | ||||||||||||||
See accompanying notes which are an integral part of these financial statements.
7
| HOLBROOK INCOME FUND |
| SCHEDULE OF INVESTMENTS (Continued) |
| April 30, 2023 |
| Principal | Coupon Rate | |||||||||||||
| Amount ($) | Spread | (%) | Maturity | Fair Value | ||||||||||
| ASSET BACKED SECURITIES — 36.8% (Continued) | ||||||||||||||
| NON AGENCY CMBS — 9.8% | ||||||||||||||
| 2,200,000 | BB-UBS Trust Series 2012-TFT B(a),(c) | 3.6780 | 06/05/30 | $ | 1,950,737 | |||||||||
| 4,000,000 | Capital Funding Mortgage Trust Series 2021-19 B(a),(b) | US0001M + 15.210% | 20.0600 | 11/06/23 | 3,943,010 | |||||||||
| 253,500 | Capital Funding Mortgage Trust Series 2022-P01 B(a),(b) | TSFR1M + 13.700% | 18.5030 | 06/20/24 | 246,705 | |||||||||
| 12,684,554 | Capital Funding Multifamily Mortgage Trust Series 2022-PM01 B(a),(b) | TSFR1M + 9.500% | 14.1650 | 03/01/25 | 12,671,882 | |||||||||
| 800,000 | Capital Funding Multifamily Mortgage Trust Series 2022-MF03 B(a),(b) | TSFR1M + 9.380% | 14.0450 | 04/01/25 | 790,691 | |||||||||
| 800,000 | Capital Funding Multifamily Mortgage Trust Series 2022-MF05 B(a),(b) | TSFR1M + 10.420% | 15.0850 | 05/15/25 | 797,430 | |||||||||
| 3,695,000 | COMM Mortgage Trust Series 2012-CR5 F(a),(c),(i) | 4.4830 | 12/10/45 | 2,309,375 | ||||||||||
| 7,000,000 | GS Mortgage Securities Corp Trust Series 2018-3PCK B(a),(b) | US0001M + 2.750% | 7.6980 | 09/15/31 | 6,725,509 | |||||||||
| 4,000,000 | GS Mortgage Securities Corp Trust Series 2018-3PCK C(a),(b) | US0001M + 3.500% | 8.4480 | 09/15/31 | 3,713,551 | |||||||||
| 2,411,714 | GS Mortgage Securities Corporation II Series 2018-SRP5 A(a),(b) | US0001M + 1.800% | 6.7480 | 09/15/31 | 2,028,934 | |||||||||
| 912,296 | GS Mortgage Securities Corporation II Series 2018-SRP5 B(a),(b) | US0001M + 3.000% | 7.9480 | 09/15/31 | 469,833 | |||||||||
| 9,463,000 | GS Mortgage Securities Trust Series 2010-C1 C(a),(c) | 5.6350 | 08/10/43 | 9,212,918 | ||||||||||
| 1,113,001 | GS Mortgage Securities Trust Series 2011-GC5 AS(a),(c) | 5.2090 | 08/10/44 | 1,097,123 | ||||||||||
| 4,000,000 | Hudsons Bay Simon JV Trust Series 2015-HB10 A10(a) | 4.1540 | 08/05/34 | 3,471,241 | ||||||||||
| 3,072,000 | JPMBB Commercial Mortgage Securities Trust Series 2013-C12 D(c) | 4.2040 | 07/15/45 | 2,738,657 | ||||||||||
| 4,503,000 | JPMBB Commercial Mortgage Securities Trust Series 2014-C18 C(c) | 4.8930 | 02/15/47 | 3,691,110 | ||||||||||
| 1,000,000 | JPMBB Commercial Mortgage Securities Trust Series 2014-C25 B(c) | 4.3470 | 11/15/47 | 932,052 | ||||||||||
| 3,550,000 | Morgan Stanley Bank of America Merrill Lynch Trust Series 2013-C9 D(a),(c) | 4.1560 | 05/15/46 | 2,816,589 | ||||||||||
| 580,000 | Morgan Stanley Bank of America Merrill Lynch Trust Series 2014-C15 D(a),(c) | 5.0530 | 04/15/47 | 542,241 | ||||||||||
| 3,300,000 | Morgan Stanley Capital I Trust Series 2013-ALTM D(a),(c) | 3.8280 | 02/05/35 | 2,595,286 | ||||||||||
| 10,681,000 | Morgan Stanley Capital I Trust Series 2019-BPR B(a),(b) | US0001M + 2.350% | 7.2980 | 05/15/36 | 10,317,336 | |||||||||
| 7,576,000 | Morgan Stanley Capital I Trust Series 2019-BPR C(a),(b) | US0001M + 3.300% | 8.2480 | 05/15/36 | 7,189,430 | |||||||||
| 2,300,000 | Morgan Stanley Capital I Trust Series 2016-PSQ D(a),(c) | 3.9540 | 01/10/38 | 1,873,497 | ||||||||||
| 911,686 | Morgan Stanley Capital I Trust Series 2012-C4 D(a),(c) | 5.3360 | 03/15/45 | 861,274 | ||||||||||
| 4,405,000 | MSCG Trust Series 2015-ALDR B(a),(c) | 3.5770 | 06/07/35 | 3,939,753 | ||||||||||
| 2,022,047 | WFRBS Commercial Mortgage Trust Series 2012-C9 D(a),(c) | 4.8760 | 11/15/45 | 1,884,091 | ||||||||||
| 6,231,000 | WFRBS Commercial Mortgage Trust Series 2012-C9 E(a),(c) | 4.8760 | 11/15/45 | 5,624,141 | ||||||||||
| 3,110,000 | WFRBS Commercial Mortgage Trust Series 2013-C14 C(c) | 4.0780 | 06/15/46 | 2,013,343 | ||||||||||
| 2,000,000 | WFRBS Commercial Mortgage Trust Series 2013-C16 D(a),(c) | 5.1520 | 09/15/46 | 1,863,472 | ||||||||||
| 2,167,000 | WFRBS Commercial Mortgage Trust Series 2014-C21 C(c) | 4.2340 | 08/15/47 | 1,830,956 | ||||||||||
| 5,000,000 | XCALI Mortgage Trust Series 2020-5 A(a),(b) | US0001M + 3.250% | 8.1770 | 10/15/23 | 4,971,665 | |||||||||
| 250,000 | X-Caliber Funding, LLC Series 2021-7 B1(a),(b) | US0001M + 6.000% | 10.6620 | 01/06/26 | 235,540 | |||||||||
| 105,349,372 | ||||||||||||||
See accompanying notes which are an integral part of these financial statements.
8
| HOLBROOK INCOME FUND |
| SCHEDULE OF INVESTMENTS (Continued) |
| April 30, 2023 |
| Principal | Coupon Rate | |||||||||||||
| Amount ($) | Spread | (%) | Maturity | Fair Value | ||||||||||
| ASSET BACKED SECURITIES — 36.8% (Continued) | ||||||||||||||
| OTHER ABS — 0.9% | ||||||||||||||
| 4,039,180 | Coinstar Funding, LLC Series Series 2017-1A A2(a) | 5.2160 | 04/25/47 | $ | 3,147,191 | |||||||||
| 2,000,000 | FMC GMSR Issuer Trust Series 2022-GT1 A(a) | 6.1900 | 04/25/27 | 1,892,449 | ||||||||||
| 2,175,080 | HRR Funding, LLC Series 2021-1(a),(i) | 9.0000 | 12/20/36 | 1,966,490 | ||||||||||
| 2,383,421 | New Residential Mortgage, LLC Series 2020-FNT1 A(a) | 5.4370 | 06/25/25 | 2,284,544 | ||||||||||
| 1,210,762 | New Residential Mortgage, LLC Series 2020-FNT2 A(a) | 5.4370 | 07/25/25 | 1,164,252 | ||||||||||
| 10,454,926 | ||||||||||||||
| RESIDENTIAL MORTGAGE — 0.8% | ||||||||||||||
| 3,000,000 | VCAT, LLC Series 2021-NPL5 A2(a),(d) | 3.8440 | 09/25/51 | 2,579,233 | ||||||||||
| 3,615,885 | VOLT C, LLC Series 2021-NPL9 A1(a),(d) | 1.9920 | 05/25/51 | 3,354,773 | ||||||||||
| 2,500,000 | VOLT XCIV, LLC Series 2021-NPL3 A2(a),(d) | 4.9490 | 02/27/51 | 2,294,904 | ||||||||||
| 8,228,910 | ||||||||||||||
| TOTAL ASSET BACKED SECURITIES (Cost $407,901,887) | �� | 396,487,104 | ||||||||||||
| CORPORATE BONDS — 53.4% | ||||||||||||||
| ASSET MANAGEMENT — 27.0% | ||||||||||||||
| 16,907,000 | Apollo Investment Corporation | 5.2500 | 03/03/25 | 16,248,539 | ||||||||||
| 1,439,634 | B Riley Financial, Inc. | 5.5000 | 03/31/26 | 29,210,175 | ||||||||||
| 350,096 | B Riley Financial, Inc. | 6.5000 | 09/30/26 | 7,099,947 | ||||||||||
| 13,640,000 | Capital Southwest Corporation | 4.5000 | 01/31/26 | 12,780,680 | ||||||||||
| 3,873,000 | Capital Southwest Corporation | 3.3750 | 10/01/26 | 3,462,849 | ||||||||||
| 31,881 | Crescent Capital BDC, Inc. | 5.0000 | 05/25/26 | 746,015 | ||||||||||
| 19,920,000 | Fidus Investment Corporation | 4.7500 | 01/31/26 | 18,621,881 | ||||||||||
| 23,900,000 | Gladstone Capital Corporation | 5.1250 | 01/31/26 | 22,580,362 | ||||||||||
| 598,715 | Great Elm Capital Corporation | 5.8750 | 06/30/26 | 14,045,854 | ||||||||||
| 336,087 | Great Elm Capital Corporation | 6.7500 | 06/30/26 | 8,230,771 | ||||||||||
| 46,494 | Hennessy Advisors, Inc. | 4.8750 | 12/31/26 | 1,089,122 | ||||||||||
| 330,211 | Horizon Technology Finance Corporation | 4.8750 | 03/30/26 | 8,024,127 | ||||||||||
| 11,573,000 | Investcorp Credit Management BDC, Inc. | 4.8750 | 04/01/26 | 10,588,120 | ||||||||||
| 9,117,000 | Main Street Capital Corporation | 3.0000 | 07/14/26 | 8,019,780 | ||||||||||
| 2,000,000 | Medallion Financial Corporation(a),(i) | 7.5000 | 12/30/27 | 1,981,400 | ||||||||||
| 18,348,000 | Monroe Capital Corporation | 4.7500 | 02/15/26 | 17,084,491 | ||||||||||
| 10,000,000 | NewtekOne, Inc.(a) | 8.1250 | 02/01/25 | 9,878,051 | ||||||||||
See accompanying notes which are an integral part of these financial statements.
9
| HOLBROOK INCOME FUND |
| SCHEDULE OF INVESTMENTS (Continued) |
| April 30, 2023 |
| Principal | Coupon Rate | |||||||||||||
| Amount ($) | Spread | (%) | Maturity | Fair Value | ||||||||||
| CORPORATE BONDS — 53.4% (Continued) | ||||||||||||||
| ASSET MANAGEMENT — 27.0% (Continued) | ||||||||||||||
| 27,293 | Oxford Square Capital Corporation | 6.2500 | 04/30/26 | $ | 641,795 | |||||||||
| 20,655,000 | PennantPark Floating Rate Capital Ltd. | 4.2500 | 04/01/26 | 18,785,789 | ||||||||||
| 13,027,000 | PennantPark Investment Corporation | 4.5000 | 05/01/26 | 11,946,921 | ||||||||||
| 13,541,000 | PennantPark Investment Corporation | 4.0000 | 11/01/26 | 12,115,017 | ||||||||||
| 25,559,000 | Saratoga Investment Corporation | 4.3750 | 02/28/26 | 23,314,287 | ||||||||||
| 10,225,000 | Saratoga Investment Corporation | 4.3500 | 02/28/27 | 9,025,247 | ||||||||||
| 150,060 | Saratoga Investment Corporation | 6.0000 | 04/30/27 | 3,511,404 | ||||||||||
| 832,759 | Trinity Capital, Inc. | 7.0000 | 01/16/25 | 21,110,441 | ||||||||||
| 1,000,000 | WhiteHorse Finance, Inc. | 4.0000 | 12/15/26 | 855,349 | ||||||||||
| 290,998,414 | ||||||||||||||
| COMMERCIAL SUPPORT SERVICES — 2.1% | ||||||||||||||
| 1,794,238 | Charah Solutions, Inc. (i),(j) | 8.5000 | 08/31/26 | 22,876,534 | ||||||||||
| ELECTRICAL EQUIPMENT — 0.9% | ||||||||||||||
| 312,993 | Babcock & Wilcox Enterprises, Inc. | 8.1250 | 02/28/26 | 7,621,380 | ||||||||||
| 80,996 | Babcock & Wilcox Enterprises, Inc. | 6.5000 | 12/31/26 | 1,739,794 | ||||||||||
| 9,361,174 | ||||||||||||||
| ENTERTAINMENT CONTENT — 2.0% | ||||||||||||||
| 926,570 | Chicken Soup For The Soul Entertainment, Inc. | 9.5000 | 07/31/25 | 21,867,052 | ||||||||||
| INSTITUTIONAL FINANCIAL SERVICES — 2.4% | ||||||||||||||
| 181,651 | Arlington Asset Investment Corporation | 6.0000 | 08/01/26 | 4,177,973 | ||||||||||
| 1,020,960 | B Riley Financial, Inc. | 5.0000 | 12/31/26 | 19,449,288 | ||||||||||
| 1,938,000 | Morgan Stanley(b) | 5*(USISDA30 - USISDA02) | 0.3800 | 07/20/25 | 1,748,221 | |||||||||
| 25,375,482 | ||||||||||||||
| INSURANCE — 1.3% | ||||||||||||||
| 10,943,000 | AmTrust Financial Services, Inc. | 6.1250 | 08/15/23 | 10,788,671 | ||||||||||
| 1,710,685 | Atlas Financial Holdings, Inc. (i) | 7.2500 | 04/27/27 | 684,274 | ||||||||||
| 4,300,647 | ATLAS FINANCIAL HOLDINGS, INC. (i) | 12.0000 | 06/30/24 | 2,365,356 | ||||||||||
| 13,838,301 | ||||||||||||||
| MACHINERY — 0.0%(e) | ||||||||||||||
| 2,500,000 | Briggs & Stratton Corporation(f) | 6.8750 | 12/15/20 | 26,563 | ||||||||||
See accompanying notes which are an integral part of these financial statements.
10
| HOLBROOK INCOME FUND |
| SCHEDULE OF INVESTMENTS (Continued) |
| April 30, 2023 |
| Principal | Coupon Rate | |||||||||||||
| Amount ($) | Spread | (%) | Maturity | Fair Value | ||||||||||
| CORPORATE BONDS — 53.4% (Continued) | ||||||||||||||
| METALS & MINING — 0.4% | ||||||||||||||
| 189,109 | Ramaco Resources, Inc. | 9.0000 | 07/30/26 | $ | 4,831,735 | |||||||||
| OIL & GAS PRODUCERS — 3.7% | ||||||||||||||
| 15,609,000 | Talos Production, Inc. | 12.0000 | 01/15/26 | 16,521,424 | ||||||||||
| 22,989,000 | W&T Offshore, Inc.(a) | 11.7500 | 02/01/26 | 23,045,758 | ||||||||||
| 39,567,182 | ||||||||||||||
| REAL ESTATE INVESTMENT TRUSTS — 0.5% | ||||||||||||||
| 24,491 | Gladstone Land Corporation | 5.0000 | 01/31/26 | 578,722 | ||||||||||
| 210,500 | HC Government Realty Trust, Inc.(a) | 7.0000 | 08/14/27 | 5,254,607 | ||||||||||
| 5,833,329 | ||||||||||||||
| REAL ESTATE SERVICES — 1.0% | ||||||||||||||
| 10,500,000 | Carrington HLDG Company LLC(a) | 8.0000 | 01/01/26 | 10,250,625 | ||||||||||
| SOFTWARE — 0.8% | ||||||||||||||
| 449,382 | Synchronoss Technologies, Inc. | 8.3750 | 06/30/26 | 8,309,073 | ||||||||||
| SPECIALTY FINANCE — 11.0% | ||||||||||||||
| 11,000,000 | ACRES Commercial Realty Corporation | 5.7500 | 08/15/26 | 9,806,604 | ||||||||||
| 1,500,000 | Broadmark Realty Capital, Inc.(a) | 5.0000 | 11/15/26 | 1,336,744 | ||||||||||
| 1,000,000 | Dakota Financial, LLC(a) | 5.0000 | 09/30/26 | 890,626 | ||||||||||
| 2,000,000 | First Help Financial, LLC(a) | 6.0000 | 11/15/26 | 1,848,382 | ||||||||||
| �� | 4,000,000 | InvestCo, LLC / Preston Ventures, LLC / LS(a) | 5.1250 | 08/13/26 | 3,614,093 | |||||||||
| 3,250,000 | Medallion Financial Corporation B(a) | 7.2500 | 02/26/26 | 3,193,125 | ||||||||||
| 4,000,000 | National Funding, Inc.(a) | 5.7500 | 08/31/26 | 3,653,811 | ||||||||||
| 14,495,000 | Nexpoint Real Estate Finance, Inc. | 5.7500 | 05/01/26 | 12,992,026 | ||||||||||
| 18,000,000 | OWS Cre Funding I, LLC(a),(b) | US0001M + 4.900% | 9.7480 | 09/15/23 | 17,829,445 | |||||||||
| 5,000,000 | PDOF MSN Issuer, LLC(a),(b) | SOFRRATE + 4.500% | 9.3100 | 03/01/25 | 4,914,579 | |||||||||
| 1,616,153 | Ready Capital Corporation | 5.7500 | 02/15/26 | 37,171,518 | ||||||||||
| 99,634 | Ready Capital Corporation | 6.2000 | 07/30/26 | 2,316,491 | ||||||||||
| 2,000,000 | Regent Capital Corporation(a) | 6.0000 | 12/28/26 | 1,833,442 | ||||||||||
| 60,680 | Sachem Capital Corporation | 7.1250 | 06/30/24 | 1,495,155 | ||||||||||
| 77,468 | Sachem Capital Corporation | 6.8750 | 12/30/24 | 1,820,475 | ||||||||||
| 81,828 | Sachem Capital Corporation | 7.7500 | 09/30/25 | 1,918,875 | ||||||||||
See accompanying notes which are an integral part of these financial statements.
11
| HOLBROOK INCOME FUND |
| SCHEDULE OF INVESTMENTS (Continued) |
| April 30, 2023 |
| Principal | Coupon Rate | |||||||||||||
| Amount ($) | Spread | (%) | Maturity | Fair Value | ||||||||||
| CORPORATE BONDS — 53.4% (Continued) | ||||||||||||||
| SPECIALTY FINANCE — 11.0% (Continued) | ||||||||||||||
| 201,410 | Sachem Capital Corporation | 6.0000 | 12/30/26 | $ | 4,169,187 | |||||||||
| 20,000 | Sachem Capital Corporation | 6.0000 | 03/30/27 | 415,600 | ||||||||||
| 20,000 | Sachem Capital Corporation | 6.0000 | 09/30/27 | 438,000 | ||||||||||
| 3,000,000 | Synergy One Lending, Inc.(a) | 5.5000 | 10/14/26 | 2,709,927 | ||||||||||
| 3,000,000 | X-Caliber Funding, LLC(a) | 5.0000 | 09/24/24 | 2,741,869 | ||||||||||
| 2,000,000 | X-Caliber Funding, LLC(a) | 5.0000 | 03/01/25 | 1,909,221 | ||||||||||
| 119,019,195 | ||||||||||||||
| WHOLESALE - CONSUMER STAPLES — 0.3% | ||||||||||||||
| 3,412,500 | Cooks Venture, Inc.(a),(i) | 5.5000 | 01/15/25 | 3,378,375 | ||||||||||
| TOTAL CORPORATE BONDS (Cost $616,055,047) | 575,533,034 | |||||||||||||
| Shares | ||||||||||||||
| SHORT-TERM INVESTMENTS — 2.6% | ||||||||||||||
| MONEY MARKET FUNDS - 2.6% | ||||||||||||||
| 27,514,637 | First American Government Obligations Fund, Class X, 4.73% (Cost $27,514,637)(g) | 27,514,637 | ||||||||||||
| TOTAL INVESTMENTS - 99.3% (Cost $1,123,187,153) | $ | 1,069,369,011 | ||||||||||||
| OTHER ASSETS IN EXCESS OF LIABILITIES- 0.7% | 7,391,982 | |||||||||||||
| NET ASSETS - 100.0% | $ | 1,076,760,993 | ||||||||||||
| LLC | - Limited Liability Company |
| LP | - Limited Partnership |
| LTD | - Limited Company |
| REIT | - Real Estate Investment Trust |
| SOFRRATE | United States SOFR Secured Overnight Financing Rate |
| TSFR1M | Term Secured Overnight Financing Rate 1 Month |
| US0001M | ICE LIBOR USD 1 Month |
| USISDA02 | 2 Year USD ICE Swap Rate |
| USISDA30 | 30 Year USD ICE Swap Rate |
See accompanying notes which are an integral part of these financial statements.
12
| HOLBROOK INCOME FUND |
| SCHEDULE OF INVESTMENTS (Continued) |
| April 30, 2023 |
| (a) | Security exempt from registration under Rule 144A or Section 4(2) of the Securities Act of 1933. The security may be resold in transactions exempt from registration, normally to qualified institutional buyers. As of April 30, 2023 the total market value of 144A securities is $503,941,269 or 46.6% of net assets. Variable rate security; the |
| (b) | rate shown represents the rate on April 30, 2023 |
| (c) | Variable or floating rate security, the interest rate of which adjusts periodically based on changes in current interest rates and prepayments on the underlying pool of assets. |
| (d) | Step bond. Coupon rate is fixed rate that changes on a specified date. The rate shown is the current rate at April 30, 2023. |
| (e) | Percentage rounds to less than 0.1%. |
| (f) | Represents issuer in default on interest payments; non-income producing security. |
| (g) | Rate disclosed is the seven day effective yield as of April 30, 2023. |
| (h) | Affiliated issuer. |
| (i) | The value of this security has been determined in good faith under policies of the Board of Trustees. |
| (j) | The security is illiquid; total illiquid securities represent 2.1% of net assets. |
See accompanying notes which are an integral part of these financial statements.
13
| HOLBROOK STRUCTURED INCOME FUND |
| SCHEDULE OF INVESTMENTS |
| April 30, 2023 |
| Principal | Coupon Rate | |||||||||||||
| Amount ($) | Spread | (%) | Maturity | Fair Value | ||||||||||
| ASSET BACKED SECURITIES — 92.5% | ||||||||||||||
| CLO — 27.6% | ||||||||||||||
| 400,000 | Anchorage Capital Clo Ltd. Series 2019-11A E(a),(b) | US0003M + 7.050% | 12.3230 | 07/22/32 | $ | 353,946 | ||||||||
| 1,400,000 | Apres Static CLO Ltd. Series 2019-1A DR(a),(b) | US0003M + 7.760% | 13.0200 | 10/15/28 | 1,394,616 | |||||||||
| 1,000,000 | Gallatin CLO VIII Ltd. Series 2017-1A ER(a),(b) | US0003M + 6.920% | 12.1800 | 07/15/31 | 816,536 | |||||||||
| 1,000,000 | Highbridge Loan Management Ltd. Series 7A-2015 ER(a),(b) | US0003M + 5.000% | 9.8640 | 03/15/27 | 997,078 | |||||||||
| 1,200,000 | KKR CLO Ltd. Series 13 ER(a),(b) | US0003M + 4.950% | 10.2100 | 01/16/28 | 1,194,098 | |||||||||
| 1,000,000 | Longfellow Place CLO Ltd. Series 2013-1A DRR(a),(b) | US0003M + 4.500% | 9.7600 | 04/15/29 | 993,977 | |||||||||
| 500,000 | Mountain View CLO X Ltd. Series 2015-10A E(a),(b) | US0003M + 4.850% | 10.0920 | 10/13/27 | 499,077 | |||||||||
| 1,000,000 | Symphony CLO XIV Ltd. Series 2014-14A E(a),(b) | US0003M + 4.600% | 9.8510 | 07/14/26 | 986,552 | |||||||||
| 1,200,000 | Symphony CLO XVII Ltd. Series 2016-17A ER(a),(b) | US0003M + 5.550% | 10.8100 | 04/15/28 | 1,178,365 | |||||||||
| 8,414,245 | ||||||||||||||
| COLLATERALIZED MORTGAGE OBLIGATIONS — 2.5% | ||||||||||||||
| 1,022,338 | Cascade Funding Mortgage Trust Series 2022-AB2 M3(a),(c) | 2.0000 | 02/25/52 | 761,037 | ||||||||||
| NON AGENCY CMBS — 59.4% | ||||||||||||||
| 196,000 | BX Commercial Mortgage Trust Series 2019-IMC G(a),(b) | US0001M + 3.600% | 8.5480 | 04/15/34 | 186,964 | |||||||||
| 1,000,000 | Capital Funding Mortgage Trust Series 2021-19 B(a),(b) | US0001M + 15.210% | 20.0600 | 11/06/23 | 985,753 | |||||||||
| 750,000 | Capital Funding Mortgage Trust Series 2021-21 B(a),(b) | US0001M + 12.250% | 17.0980 | 11/15/23 | 739,870 | |||||||||
| 1,200,000 | Capital Funding Mortgage Trust Series 2022-P01 B(a),(b) | TSFR1M + 13.700% | 18.5030 | 06/20/24 | 1,167,835 | |||||||||
| 458,952 | Capital Funding Mortgage Trust Series 2022-27 B(a),(b) | TSFR1M + 9.910% | 14.5750 | 02/11/25 | 441,522 | |||||||||
| 1,200,000 | Capital Funding Multifamily Mortgage Trust Series 2022-PM01 B(a),(b) | TSFR1M + 9.500% | 14.1650 | 03/01/25 | 1,198,800 | |||||||||
| 1,200,000 | Capital Funding Multifamily Mortgage Trust Series 2022-MF03 B(a),(b) | TSFR1M + 9.380% | 14.0450 | 04/01/25 | 1,186,035 | |||||||||
| 1,200,000 | Capital Funding Multifamily Mortgage Trust Series 2022-MF05 B(a),(b) | TSFR1M + 10.420% | 15.0850 | 05/15/25 | 1,196,145 | |||||||||
| 1,000,000 | COMM Mortgage Trust Series 2012-CR5 F(a),(c),(g) | 4.4830 | 12/10/45 | 625,000 | ||||||||||
| 73,013,735 | COMM Mortgage Trust Series 2014-UBS5 XA(c),(d) | 0.9860 | 09/10/47 | 633,153 | ||||||||||
| 59,364,141 | COMM Mortgage Trust Series 2015-CR25 XA(c),(d) | 0.9480 | 08/10/48 | 890,124 | ||||||||||
| 4,636,529 | CSMC Trust Series 2016-NXSR XA(c),(d) | 0.8310 | 12/15/49 | 88,635 | ||||||||||
| 2,569,785 | GS Mortgage Securities Corporation II Series 2018-SRP5 C(a),(b),(g) | US0001M + 4.250% | 9.1980 | 09/15/31 | 899,425 | |||||||||
| 350,000 | GS Mortgage Securities Trust Series 2010-C1 D(a),(c) | 6.5680 | 08/10/43 | 279,488 | ||||||||||
| 32,530,528 | JPMBB Commercial Mortgage Securities Trust Series 2014-C18 XA(c),(d) | 0.8200 | 02/15/47 | 80,152 | ||||||||||
| 46,235,530 | JPMBB Commercial Mortgage Securities Trust Series 2014-C19 XA(c),(d) | 0.7680 | 04/15/47 | 104,423 | ||||||||||
| 29,803,047 | JPMBB Commercial Mortgage Securities Trust Series 2014-C21 XA(c),(d) | 1.0930 | 08/15/47 | 216,081 | ||||||||||
| 12,635,300 | JPMBB Commercial Mortgage Securities Trust Series 2014-C25 XA(c),(d) | 0.9530 | 11/15/47 | 118,047 | ||||||||||
| 4,500,947 | JPMBB Commercial Mortgage Securities Trust Series 2015-C27 XA(c),(d) | 1.2780 | 02/15/48 | 68,693 | ||||||||||
See accompanying notes which are an integral part of these financial statements.
14
| HOLBROOK STRUCTURED INCOME FUND |
| SCHEDULE OF INVESTMENTS (Continued) |
| April 30, 2023 |
| Principal | Coupon Rate | |||||||||||||
| Amount ($) | Spread | (%) | Maturity | Fair Value | ||||||||||
| ASSET BACKED SECURITIES — 92.5% (Continued) | ||||||||||||||
| NON AGENCY CMBS — 59.4% (Continued) | ||||||||||||||
| 70,917,890 | JPMBB Commercial Mortgage Securities Trust Series 2015-C30 XA(c),(d) | 0.5710 | 07/15/48 | $ | 570,045 | |||||||||
| 41,211,354 | JPMBB Commercial Mortgage Securities Trust Series 2015-C28 XA(c),(d) | 1.0640 | 10/15/48 | 506,657 | ||||||||||
| 1,000,000 | Morgan Stanley Bank of America Merrill Lynch Trust Series 2013-C9 D(a),(c) | 4.1560 | 05/15/46 | 793,405 | ||||||||||
| 16,398,526 | Morgan Stanley Bank of America Merrill Lynch Trust Series 2014-C19 XA(c),(d) | 1.1000 | 12/15/47 | 169,085 | ||||||||||
| 68,589,610 | Morgan Stanley Bank of America Merrill Lynch Trust Series 2015-C24 XA(c),(d) | 0.8290 | 05/15/48 | 868,633 | ||||||||||
| 3,744,419 | Wells Fargo Commercial Mortgage Trust Series 2015-LC22 XA(c),(d) | 0.9070 | 09/15/58 | 53,422 | ||||||||||
| 305,597 | WFRBS Commercial Mortgage Trust Series 2012-C9 D(a),(c) | 4.8760 | 11/15/45 | 284,748 | ||||||||||
| 1,000,000 | WFRBS Commercial Mortgage Trust Series 2012-C9 E(a),(c) | 4.8760 | 11/15/45 | 902,607 | ||||||||||
| 37,809,402 | WFRBS Commercial Mortgage Trust Series 2014-C20 XA(c),(d) | 1.0530 | 05/15/47 | 228,380 | ||||||||||
| 23,515,692 | WFRBS Commercial Mortgage Trust Series 2014-C21 XA(c),(d) | 1.1500 | 08/15/47 | 248,020 | ||||||||||
| 1,000,000 | XCALI Mortgage Trust Series 2020-5 B1(a),(b) | TSFR1M + 8.370% | 13.1770 | 10/15/23 | 988,030 | |||||||||
| 471,250 | XCALI Mortgage Trust Series 2021-10 B1(a),(b) | TSFR1M + 8.120% | 12.9270 | 05/26/24 | 461,003 | |||||||||
| 750,000 | X-Caliber Funding, LLC Series 2021-7 B1(a),(b) | US0001M + 6.000% | 10.6620 | 01/06/26 | 706,619 | |||||||||
| 18,053,835 | ||||||||||||||
| RESIDENTIAL MORTGAGE — 3.0% | ||||||||||||||
| 1,000,000 | VCAT, LLC Series 2021-NPL1 A2(a),(e) | 4.8260 | 12/26/50 | 925,251 | ||||||||||
| TOTAL ASSET BACKED SECURITIES (Cost $28,803,517) | 27,987,332 | |||||||||||||
| CORPORATE BONDS — 4.8% | ||||||||||||||
| SPECIALTY FINANCE — 4.8% | ||||||||||||||
| 500,000 | X-Caliber Funding, LLC(a) | 11.0000 | 09/24/24 | 487,598 | ||||||||||
| 1,000,000 | X-Caliber Funding, LLC(a) | 11.0000 | 03/01/25 | 981,550 | ||||||||||
| TOTAL CORPORATE BONDS (Cost $1,499,711) | 1,469,148 | |||||||||||||
See accompanying notes which are an integral part of these financial statements.
15
| HOLBROOK STRUCTURED INCOME FUND |
| SCHEDULE OF INVESTMENTS (Continued) |
| April 30, 2023 |
| Shares | Fair Value | |||||||
| SHORT-TERM INVESTMENTS — 0.9% | ||||||||
| MONEY MARKET FUNDS – 0.9% | ||||||||
| 279,686 | First American Government Obligations Fund, Class X, 4.73% (Cost $279,686)(f) | $ | 279,686 | |||||
| TOTAL INVESTMENTS - 98.2% (Cost $30,582,914) | $ | 29,736,166 | ||||||
| OTHER ASSETS IN EXCESS OF LIABILITIES- 1.8% | 530,613 | |||||||
| NET ASSETS - 100.0% | $ | 30,266,779 | ||||||
| LLC | - Limited Liability Company |
| LTD | - Limited Company |
| TSFR1M | Term Secured Overnight Financing Rate 1 Month |
| US0001M | ICE LIBOR USD 1 Month |
| US0003M | ICE LIBOR USD 3 Month |
| (a) | Security exempt from registration under Rule 144A or Section 4(2) of the Securities Act of 1933. The security may be resold in transactions exempt from registration, normally to qualified institutional buyers. As of April 30, 2023 the total market value of 144A securities is $24,779,966 or 81.4% of net assets. |
| (b) | Variable rate security; the rate shown represents the rate on April 30, 2023. |
| (c) | Variable or floating rate security, the interest rate of which adjusts periodically based on changes in current interest rates and prepayments on the underlying pool of assets. |
| (d) | Interest only securities. |
| (e) | Step bond. Coupon rate is fixed rate that changes on a specified date. The rate shown is the current rate at April 30, 2023. |
| (f) | Rate disclosed is the seven day effective yield as of April 30, 2023. |
| (g) | The value of this security has been determined in good faith under policies of the Board of Trustees. |
See accompanying notes which are an integral part of these financial statements.
16
| Holbrook Funds |
| Statements of Assets and Liabilities |
| April 30, 2023 |
| Holbrook Income Fund | Holbrook Structured Income Fund | |||||||
| ASSETS | ||||||||
| Investment securities: | ||||||||
| Investments in Affiliates, at cost | $ | 30,563,075 | $ | — | ||||
| Investments in Unaffiliated securities, at cost | 1,092,624,078 | 30,582,914 | ||||||
| Total Investments, at cost | $ | 1,123,187,153 | $ | 30,582,914 | ||||
| Investments in Affiliates, at value | $ | 29,729,499 | $ | — | ||||
| Investments in Unaffiliated securities, at value | 1,039,639,512 | 29,736,166 | ||||||
| Total Investments, at value | $ | 1,069,369,011 | $ | 29,736,166 | ||||
| Dividends and Interest receivable | 9,910,051 | 568,615 | ||||||
| Receivable for Fund shares sold | 1,997,854 | — | ||||||
| Receivable for securities sold | 2,584,054 | — | ||||||
| Prepaid expenses and other assets | 95,147 | 10,204 | ||||||
| TOTAL ASSETS | 1,083,956,117 | 30,314,985 | ||||||
| LIABILITIES | ||||||||
| Payable for securities purchased | $ | 1,646,189 | $ | — | ||||
| Payable for Fund shares redeemed | 3,008,456 | — | ||||||
| Dividends payable | 1,521,416 | — | ||||||
| Investment advisory fees payable | 676,867 | 1,767 | ||||||
| Distribution (12b-1) fees payable | 55,190 | 113 | ||||||
| Payable to related parties | 119,259 | 10,720 | ||||||
| Accrued expenses and other liabilities | 167,747 | 35,606 | ||||||
| TOTAL LIABILITIES | 7,195,124 | 48,206 | ||||||
| NET ASSETS | $ | 1,076,760,993 | $ | 30,266,779 | ||||
| NET ASSETS CONSIST OF: | ||||||||
| Paid in capital | $ | 1,150,390,550 | $ | 31,096,060 | ||||
| Accumulated losses | (73,629,557 | ) | (829,281 | ) | ||||
| NET ASSETS | $ | 1,076,760,993 | $ | 30,266,779 | ||||
| NET ASSET VALUE PER SHARE: | ||||||||
| Class I Shares: | ||||||||
| Net Assets | $ | 930,462,631 | $ | 29,720,674 | ||||
| Shares of beneficial interest outstanding [$0 par value, unlimited shares authorized] | 96,380,443 | 3,068,061 | ||||||
| Net asset value (Net Assets ÷ Shares Outstanding, Offering) and redemption price per share | $ | 9.65 | $ | 9.69 | ||||
| Investor Class Shares: | ||||||||
| Net Assets | $ | 124,059,585 | $ | 6,285 | ||||
| Shares of beneficial interest outstanding [$0 par value, unlimited shares authorized] | 12,795,437 | 649 | ||||||
| Net asset value (Net Assets ÷ Shares Outstanding, Offering) and redemption price per share | $ | 9.70 | $ | 9.69 | * | |||
| Class A Shares: | ||||||||
| Net Assets | $ | 22,238,777 | $ | 539,820 | ||||
| Shares of beneficial interest outstanding [$0 par value, unlimited shares authorized] | 2,303,344 | 55,738 | ||||||
| Net asset value (Net Assets ÷ Shares Outstanding) and redemption price per share | $ | 9.65 | $ | 9.68 | ||||
| Maximum offering price per share (net asset value plus maximum sales charge of 1.25% and 2.25%, respectively) | $ | 9.77 | $ | 9.90 | ||||
| * | Does not calculate due to rounding |
The accompanying notes are an integral part of these financial statements.
17
| Holbrook Funds |
| Statements of Operations |
| For the Year or Period Ended April 30, 2023 |
| Holbrook Structured | ||||||||
| Holbrook Income Fund | Income Fund (1) | |||||||
| INVESTMENT INCOME | ||||||||
| Interest | $ | 43,033,385 | $ | 2,874,877 | ||||
| Dividend | 16,777,806 | — | ||||||
| Dividend Income from Affiliates | 2,507,025 | — | ||||||
| TOTAL INVESTMENT INCOME | 62,318,216 | 2,874,877 | ||||||
| EXPENSES | ||||||||
| Investment advisory fees | 7,221,806 | 251,191 | ||||||
| Distribution (12b-1) fees: | ||||||||
| Investor Class | 599,139 | 22 | ||||||
| Class A | 42,940 | 684 | ||||||
| Administrative services fees | 599,153 | 70,757 | ||||||
| Third party Administration servicing fees | 1,009,015 | 23,372 | ||||||
| Transfer agent fees | 360,856 | 35,421 | ||||||
| Registration fees | 148,565 | 15,791 | ||||||
| Accounting services fees | 122,004 | 31,906 | ||||||
| Legal fees | 31,216 | 93,413 | ||||||
| Custodian fees | 91,077 | 2,548 | ||||||
| Printing and postage expenses | 71,450 | 10,864 | ||||||
| Compliance officer fees | 39,916 | 11,755 | ||||||
| Audit fees | 25,240 | 21,683 | ||||||
| Trustees fees and expenses | 15,104 | 14,962 | ||||||
| Insurance expense | 25,206 | 3,783 | ||||||
| Other expenses | 40,933 | 6,164 | ||||||
| TOTAL EXPENSES | 10,443,620 | 594,316 | ||||||
| Less: Expense voluntarily waived by the Advisor | (198,740 | ) | — | |||||
| Less: Fees waived by Advisor | — | (215,708 | ) | |||||
| NET EXPENSES | 10,244,880 | 378,608 | ||||||
| NET INVESTMENT INCOME | 52,073,336 | 2,496,269 | ||||||
| REALIZED AND UNREALIZED GAIN /(LOSS) ON INVESTMENTS | ||||||||
| Net realized gain (loss) from: | ||||||||
| Investments | (14,193,330 | ) | 17,372 | |||||
| Realized gain (loss) on investments | (14,193,330 | ) | 17,372 | |||||
| Net change in unrealized depreciation on: | ||||||||
| Investments | (38,051,801 | ) | (846,748 | ) | ||||
| Affiliated Investments | (833,576 | ) | — | |||||
| Unrealized depreciation on investments | (38,885,377 | ) | (846,748 | ) | ||||
| NET REALIZED AND UNREALIZED LOSS ON INVESTMENTS | (53,078,707 | ) | (829,376 | ) | ||||
| NET INCREASE/(DECREASE) IN NET ASSETS RESULTING FROM OPERATIONS | $ | (1,005,371 | ) | $ | 1,666,893 | |||
| (1) | Holbrook Structured Income commenced investment operations on May 2, 2022. |
The accompanying notes are an integral part of these financial statements.
18
| Holbrook Funds |
| Statements of Changes in Net Assets |
| Holbrook Structured | ||||||||||||
| Holbrook Income Fund | Income Fund (1) | |||||||||||
| For the | For the | For the | ||||||||||
| Year Ended | Year Ended | Period Ended | ||||||||||
| April 30, 2023 | April 30, 2022 | April 30, 2023 | ||||||||||
| FROM OPERATIONS | ||||||||||||
| Net investment income | $ | 52,073,336 | $ | 24,247,739 | $ | 2,496,269 | ||||||
| Net realized gain (loss) from investments | (14,193,330 | ) | 1,968,340 | 17,372 | ||||||||
| Unrealized depreciation from investments | (38,885,377 | ) | (25,179,014 | ) | (846,748 | ) | ||||||
| Net increase/(decrease) in net assets resulting from operations | (1,005,371 | ) | 1,037,065 | 1,666,893 | ||||||||
| DISTRIBUTIONS TO SHAREHOLDERS | ||||||||||||
| From return of capital: | ||||||||||||
| Class I | — | (668,236 | ) | — | ||||||||
| Investor Class | — | (140,640 | ) | — | ||||||||
| Class A(2) | — | (8,311 | ) | — | ||||||||
| Total Distributions paid: | ||||||||||||
| Class I | (46,216,210 | ) | (22,260,745 | ) | (2,492,277 | ) | ||||||
| Investor Class | (6,479,578 | ) | (4,161,291 | ) | (449 | ) | ||||||
| Class A(2) | (1,005,627 | ) | (210,114 | ) | (29,447 | ) | ||||||
| Net decrease in net assets resulting from distributions to shareholders | (53,701,415 | ) | (27,449,337 | ) | (2,522,173 | ) | ||||||
| FROM SHARES OF BENEFICIAL INTEREST | ||||||||||||
| Proceeds from shares sold: | ||||||||||||
| Class I | 627,129,084 | 549,615,625 | 28,071,032 | |||||||||
| Investor Class | 57,336,375 | 90,889,737 | 6,010 | |||||||||
| Class A(2) | 15,437,589 | 14,094,880 | 522,941 | |||||||||
| Net asset value of shares issued in reinvestment of distributions: | ||||||||||||
| Class I | 35,176,575 | 18,940,021 | 2,492,179 | |||||||||
| Investor Class | 6,396,684 | 4,175,184 | 449 | |||||||||
| Class A(2) | 783,197 | 181,840 | 29,448 | |||||||||
| Payments for shares redeemed: | ||||||||||||
| Class I | (292,473,007 | ) | (207,225,324 | ) | — | |||||||
| Investor Class | (46,902,969 | ) | (44,640,879 | ) | — | |||||||
| Class A(2) | (4,991,680 | ) | (1,893,032 | ) | — | |||||||
| Net increase in net assets from shares of beneficial interest | 397,891,848 | 424,138,052 | 31,122,059 | |||||||||
| TOTAL INCREASE IN NET ASSETS | 343,185,062 | 397,725,780 | 30,266,779 | |||||||||
| NET ASSETS | ||||||||||||
| Beginning of Period | 733,575,931 | 335,850,151 | — | |||||||||
| End of Period | $ | 1,076,760,993 | $ | 733,575,931 | $ | 30,266,779 | ||||||
| SHARE ACTIVITY | ||||||||||||
| Class I: | ||||||||||||
| Shares Sold | 63,366,646 | 51,992,257 | 2,814,701 | |||||||||
| Shares Reinvested | 3,579,612 | 1,797,308 | 253,360 | |||||||||
| Shares Redeemed | (29,642,025 | ) | (19,759,142 | ) | — | |||||||
| Net increase in shares of beneficial interest outstanding | 37,304,233 | 34,030,423 | 3,068,061 | |||||||||
| Investor Class: | ||||||||||||
| Shares Sold | 5,762,279 | 8,521,005 | 603 | |||||||||
| Shares Reinvested | 647,464 | 394,438 | 46 | |||||||||
| Shares Redeemed | (4,741,830 | ) | (4,204,292 | ) | — | |||||||
| Net increase in shares of beneficial interest outstanding | 1,667,913 | 4,711,151 | 649 | |||||||||
| Class A(2): | ||||||||||||
| Shares Sold | 1,560,840 | 1,336,941 | 52,734 | |||||||||
| Shares Reinvested | 79,786 | 17,411 | 3,004 | |||||||||
| Shares Redeemed | (508,698 | ) | (182,936 | ) | — | |||||||
| Net increase in shares of beneficial interest outstanding | 1,131,928 | 1,171,416 | 55,738 | |||||||||
| (1) | Holbrook Structured Income Fund commenced investment operations on May 2, 2022. |
| (2) | Holbrook Income Fund Class A commenced investment operations on July 23, 2021. |
The accompanying notes are an integral part of these financial statements.
19
| Holbrook Income Fund |
| Financial Highlights |
Per Share Data and Ratios for a Share of Beneficial Interest Outstanding Throughout each Year
| Class I | ||||||||||||||||||||
| Year Ended | Year Ended | Year Ended | Year Ended | Year Ended | ||||||||||||||||
| April 30, 2023 | April 30, 2022 | April 30, 2021 | April 30, 2020 | April 30, 2019 | ||||||||||||||||
| Net asset value, beginning of year | $ | 10.27 | $ | 10.67 | $ | 8.91 | $ | 10.13 | $ | 10.18 | ||||||||||
| Activity from investment operations: | ||||||||||||||||||||
| Net investment income (1) | 0.58 | 0.45 | 0.51 | 0.37 | 0.38 | |||||||||||||||
| Net realized and unrealized gain (loss) on investments | (0.62 | ) | (0.34 | ) | 1.86 | (1.20 | ) | (0.01 | ) | |||||||||||
| Total from investment operations | (0.04 | ) | 0.11 | 2.37 | (0.83 | ) | 0.37 | |||||||||||||
| Less distributions from: | ||||||||||||||||||||
| Net investment income | (0.58 | ) | (0.49 | ) | (0.61 | ) | (0.39 | ) | (0.39 | ) | ||||||||||
| Net realized gains | — | (0.01 | ) | — | — | (0.03 | ) | |||||||||||||
| Return of Capital | — | (0.01 | ) | — | — | — | ||||||||||||||
| Total distributions | (0.58 | ) | (0.51 | ) | (0.61 | ) | (0.39 | ) | (0.42 | ) | ||||||||||
| Net asset value, end of year | $ | 9.65 | $ | 10.27 | $ | 10.67 | $ | 8.91 | $ | 10.13 | ||||||||||
| Total return (2) | (0.34 | )% (6) | 0.92 | % | 27.10 | % (6) | (8.45 | )% (6) | 3.66 | % | ||||||||||
| Net assets, at end of year (000s) | $ | 930,463 | $ | 606,759 | $ | 267,123 | $ | 97,721 | $ | 40,723 | ||||||||||
| Ratio of gross expenses to average net assets (3) | 1.08 | % (4) | 1.09 | % | 1.13 | % | 1.16 | % (4) | 1.66 | % | ||||||||||
| Ratio of net expenses to average net assets | 1.06 | % (4) | 1.09 | % | 1.28 | % (7) | 1.30 | % (4,7) | 1.30 | % | ||||||||||
| Ratio of net investment income to average net assets | 5.85 | % (4,5) | 4.28 | % | 4.98 | % | 3.76 | % (4,5) | 3.78 | % | ||||||||||
| Portfolio Turnover Rate | 36 | % | 70 | % | 74 | % | 106 | % | 78 | % | ||||||||||
| Investor Class | ||||||||||||||||||||
| Year Ended | Year Ended | Year Ended | Year Ended | Year Ended | ||||||||||||||||
| April 30, 2023 | April 30, 2022 | April 30, 2021 | April 30, 2020 | April 30, 2019 | ||||||||||||||||
| Net asset value, beginning of year | $ | 10.32 | $ | 10.71 | $ | 8.92 | $ | 10.13 | $ | 10.19 | ||||||||||
| Activity from investment operations: | ||||||||||||||||||||
| Net investment income (1) | 0.52 | 0.40 | 0.46 | 0.33 | 0.33 | |||||||||||||||
| Net realized and unrealized gain (loss) on investments | (0.61 | ) | (0.33 | ) | 1.85 | (1.20 | ) | (0.02 | ) | |||||||||||
| Total from investment operations | (0.09 | ) | 0.07 | 2.31 | (0.87 | ) | 0.31 | |||||||||||||
| Less distributions from: | ||||||||||||||||||||
| Net investment income | (0.53 | ) | (0.44 | ) | (0.52 | ) | (0.34 | ) | (0.34 | ) | ||||||||||
| Net realized gains | — | (0.01 | ) | — | — | (0.03 | ) | |||||||||||||
| Return of Capital | — | (0.01 | ) | — | — | — | ||||||||||||||
| Total distributions | (0.53 | ) | (0.46 | ) | (0.52 | ) | (0.34 | ) | (0.37 | ) | ||||||||||
| Net asset value, end of year | $ | 9.70 | $ | 10.32 | $ | 10.71 | $ | 8.92 | $ | 10.13 | ||||||||||
| Total return (2) | (0.81 | )% (6) | 0.52 | % | 26.37 | % | (8.81 | )% | 3.05 | % | ||||||||||
| Net assets, at end of year (000s) | $ | 124,060 | $ | 114,783 | $ | 68,727 | $ | 22,184 | $ | 6,166 | ||||||||||
| Ratio of gross expenses to average net assets (3) | 1.58 | % (4) | 1.59 | % | 1.63 | % | 1.66 | % (4) | 2.16 | % | ||||||||||
| Ratio of net expenses to average net assets | 1.56 | % (4) | 1.59 | % | 1.78 | % (7) | 1.80 | % (4,7) | 1.80 | % | ||||||||||
| Ratio of net investment income to average net assets | 5.24 | % (4,5) | 3.77 | % | 4.50 | % | 3.38 | % (4,5) | 3.23 | % | ||||||||||
| Portfolio Turnover Rate | 36 | % | 70 | % | 74 | % | 106 | % | 78 | % | ||||||||||
| (1) | The net investment income per share data was determined using the average shares outstanding throughout each year. |
| (2) | Total returns are historical in nature and assume changes in share price and reinvestment of dividends and capital gains distributions, if any. Had the Advisor not absorbed a portion of Fund expenses, total returns would have been lower. |
| (3) | Represents the ratio of expenses to average net assets absent fee waivers and/or expense reimbursements by the Advisor. |
| (4) | Does not include expenses of other investment companies in which the Fund invests. |
| (5) | Recognition of net investment income by the Fund is affected by the timing of declaration of dividends by underlying investment companies in which the Fund invests. |
| (6) | Includes adjustments in accordance with accounting principles generally accepted in the United States and, consequently, the net asset values for financial reporting purposes and the returns based upon those net asset values may differ from the net asset values and returns for shareholder transactions. Adjustments may apply to some but not all years and classes. |
| (7) | Inclusive of Advisor’s recapture of waived/reimbursed fees from prior periods. |
The accompanying notes are an integral part of these financial statements.
20
| Holbrook Income Fund |
| Financial Highlights |
Per Share Data and Ratios for a Share of Beneficial Interest Outstanding Throughout each Period
| Class A | ||||||||
| Year Ended | Period Ended | |||||||
| April 30, 2023 | April 30, 2022 (1) | |||||||
| Net asset value, beginning of period | $ | 10.27 | $ | 10.68 | ||||
| Activity from investment operations: | ||||||||
| Net investment income (2) | 0.56 | 0.34 | ||||||
| Net realized and unrealized (loss) on investments | (0.62 | ) | (0.42 | ) | ||||
| Total from investment operations | (0.06 | ) | (0.08 | ) | ||||
| Less distributions from: | ||||||||
| Net investment income | (0.56 | ) | (0.31 | ) | ||||
| Net realized gains | — | (0.01 | ) | |||||
| Return of capital | — | (0.01 | ) | |||||
| Total distributions | (0.56 | ) | (0.33 | ) | ||||
| Net asset value, end of period | $ | 9.65 | $ | 10.27 | ||||
| Total return (3) | (0.52 | )% (6) | (0.84 | )% (4) | ||||
| Net assets, at end of period (000s) | $ | 22,239 | $ | 12,034 | ||||
| Ratio of gross expenses to average net assets | 1.33 | % (7) | 1.36 | % (5) | ||||
| Ratio of net expenses to average net assets | 1.31 | % (7) | 1.36 | % (5) | ||||
| Ratio of net investment income to average net assets | 5.66 | % (7,8) | 4.21 | % (5) | ||||
| Portfolio Turnover Rate | 36 | % | 70 | % (4) | ||||
| (1) | Class A commenced investment operations on July 23, 2021. |
| (2) | The net investment income per share data was determined using the average shares outstanding throughout each period. |
| (3) | Total returns are historical in nature and assume changes in share price and reinvestment of dividends and capital gains distributions, if any. |
| (4) | Not Annualized. |
| (5) | Annualized. |
| (6) | Includes adjustments in accordance with accounting principles generally accepted in the United States and, consequently, the net asset value for financial reporting purposes and the returns based upon those net asset values may differ from the net asset values and returns for shareholder transactions. |
| (7) | Does not include expenses of other investment companies in which the Fund invests. |
| (8) | Recognition of net investment income by the Fund is affected by the timing of declaration of dividends by underlying investment companies in which the Fund invests. |
The accompanying notes are an integral part of these financial statements.
21
| Holbrook Structured Income Fund (1) |
| Financial Highlights |
Per Share Data and Ratios for a Share of Beneficial Interest Outstanding Throughout the Period
| Class I | Investor Class | Class A | ||||||||||
| Period Ended | Period Ended | Period Ended | ||||||||||
| April 30, 2023 | April 30, 2023 | April 30, 2023 | ||||||||||
| Net asset value, beginning of period | $ | 10.00 | $ | 10.00 | $ | 10.00 | ||||||
| Activity from investment operations: | ||||||||||||
| Net investment income (2) | 0.97 | 0.99 | 1.03 | |||||||||
| Net realized and unrealized (loss) on investments | (0.33 | ) | (0.39 | ) | (0.42 | ) | ||||||
| Total from investment operations | 0.64 | 0.60 | 0.61 | |||||||||
| Less distributions from: | ||||||||||||
| Net investment income | (0.95 | ) | (0.91 | ) | (0.93 | ) | ||||||
| Total distributions | (0.95 | ) | (0.91 | ) | (0.93 | ) | ||||||
| Net asset value, end of period | $ | 9.69 | $ | 9.69 | $ | 9.68 | ||||||
| Total return (3) | 6.69 | % (5) | 6.22 | % (5) | 6.32 | % (5) | ||||||
| Net assets, at end of period (000s) | $ | 29,721 | $ | 6 | $ | 540 | ||||||
| Ratio of gross expenses to average net assets (4) | 2.36 | % (6) | 2.86 | % (6) | 2.61 | % (6) | ||||||
| Ratio of net expenses to average net assets | 1.50 | % (6) | 2.00 | % (6) | 1.75 | % (6) | ||||||
| Ratio of net investment income to average net assets | 9.90 | % (6) | 10.05 | % (6) | 10.56 | % (6) | ||||||
| Portfolio Turnover Rate | 8 | % (5) | 8 | % (5) | 8 | % (5) | ||||||
| (1) | Holbrook Structured Income commenced investment operations on May 2, 2022. |
| (2) | The net investment income per share data was determined using the average shares outstanding throughout the period. |
| (3) | Total returns are historical in nature and assume changes in share price and reinvestment of dividends and capital gains distributions, if any. Had the Advisor not absorbed a portion of Fund expenses, total returns would have been lower. |
| (4) | Represents the ratio of expenses to average net assets absent fee waivers and/or expense reimbursements by the Advisor. |
| (5) | Not annualized |
| (6) | Annualized |
The accompanying notes are an integral part of these financial statements.
22
Holbrook Funds
Notes to Financial Statements
April 30, 2023
| 1. | ORGANIZATION |
The Holbrook Income Fund and the Holbrook Structured Income Fund, each a “Fund” and collectively, the “Funds” are each a diversified series of shares of beneficial interest of the Two Roads Shared Trust (the “Trust”), a statutory trust organized under the laws of the State of Delaware on June 8, 2012, and registered under the Investment Company Act of 1940, as amended (the “1940 Act”), as an open-end management investment company. The Holbrook Income Fund Class I and Investor Class shares commenced investment operations on July 6, 2016. Class A shares commenced investment operations on July 23, 2021. The Holbrook Structured Income Fund Class I, Investor Class and Class A shares commenced investment operations on May 2, 2022. The investment objective of each Fund is as follows:
| Fund Name | Investment Objective |
| Holbrook Income Fund | Current income |
| Holbrook Structured Income Fund | Current income and the opportunity for capital appreciation to produce a total return |
The Funds offer Class I, Investor Class and Class A shares. Class A shares are offered at net asset value (“NAV”) plus a maximum sales charge of 1.25% and 2.25% for Holbrook Income Fund and Holbrook Structured Income Fund, respectively. All other classes of shares are sold at net asset value without an initial sales charge. Class I shares are not subject to 12b-1 distribution fees and have a higher minimum initial investment than the Investor Class and Class A shares. Each share class represents an interest in the same assets of that Fund and classes are identical except for differences in their ongoing service and distribution charges. All classes of shares of a Fund have equal voting privileges except that each class has exclusive voting rights with respect to its service and/or distribution plans. Each Fund’s income, expenses (other than class specific distribution fees) and realized and unrealized gains and losses are allocated proportionately each day based upon the relative net assets of each class.
| 2. | SUMMARY OF SIGNIFICANT ACCOUNTING POLICIES |
The following is a summary of significant accounting policies followed by each Fund in preparation of its financial statements. These policies are in conformity with accounting principles generally accepted in the United States of America (“GAAP”). The preparation of financial statements requires management to make estimates and assumptions that affect the reported amounts of assets and liabilities and disclosure of contingent assets and liabilities at the date of the financial statements and the reported amounts of increases and decreases in net assets from operations during the reporting period. Actual results could differ from those estimates. Each Fund is an investment company and accordingly follows the investment company accounting and reporting guidance of the Financial Accounting Standards Board (“FASB”) Accounting Standards Codification Topic 946 “Financial Services – Investment Companies”.
Security Valuation – Securities listed on an exchange are valued at the last quoted sales price at the close of the regular trading session of the exchange on the business day the value is being determined, or in the case of securities listed on NASDAQ at the NASDAQ Official Closing Price (“NOCP”). In the absence of a sale such securities shall be valued at the mean between the current bid and ask prices on the day of valuation. Debt securities (other than short-term obligations) are valued each day by an independent pricing service approved by the Trust’s Board of Trustees (the “Board”) based on methods which include consideration of: yields or prices of securities of comparable quality, coupon, maturity and type, indications as to values from dealers, and general market conditions or market quotations from a major market maker in the securities. The independent pricing service does not distinguish between smaller-sized bond positions known as “odd lots” and larger institutional-sized bond positions known as “round lots”. The Funds may fair value a particular bond if the adviser does not believe that the round lot value provided by the independent pricing service reflects fair value of the Fund’s holding. Short-term debt obligations having 60 days or less remaining until maturity, at time of purchase, may be valued at amortized cost.
Valuation of Underlying Funds – The Funds may invest in portfolios of open-end or closed-end investment companies (the “Underlying Funds”). The Underlying Funds value securities in their portfolios for which market quotations are readily
23
Holbrook Funds
Notes to Financial Statements (Continued)
April 30, 2023
available at their market values (generally the last reported sale price) and all other securities and assets at their fair value to the methods established by the board of directors of the Underlying Funds.
Open-end funds are valued at their respective net asset values as reported by such investment companies. The shares of many closed-end investment companies, after their initial public offering, frequently trade at a price per share, which is different than the net asset value per share. The difference represents a market premium or market discount of such shares. There can be no assurances that the market discount or premium on shares of any closed-end investment company purchased by the Funds will not change.
The Funds may hold securities, such as private investments, other non-traded securities or temporarily illiquid securities, for which market quotations are not readily available or are determined to be unreliable. These securities will be valued using the “fair value” procedures approved by the Board. The Board has delegated execution of these procedures to the Adviser as its valuation designee (the “Valuation Designee”). The Valuation Designee may also enlist third party consultants such a valuation specialist at a public accounting firm, valuation consultant or financial officer of a security issuer on an as-needed basis to assist in determining a security-specific fair value. The Board is responsible for reviewing and approving fair value methodologies utilized by the Valuation Designee, approval of which shall be based upon whether the Valuation Designee followed the valuation procedures established by the Board.
Fair Valuation Process – The applicable investments are valued by the Valuation Designee pursuant to valuation procedures approved by the Board. For example, fair value determinations are required for the following securities: (i) securities for which market quotations are insufficient or not readily available on a particular business day (including securities for which there is a short and temporary lapse in the provision of a price by the regular pricing source); (ii) securities for which, in the judgment of the Valuation Designee, the prices or values available do not represent the fair value of the instrument; factors which may cause the Valuation Designee to make such a judgment include, but are not limited to, the following: only a bid price or an asked price is available; the spread between bid and asked prices is substantial; the frequency of sales; the thinness of the market; the size of reported trades; and actions of the securities markets, such as the suspension or limitation of trading; (iii) securities determined to be illiquid; and (iv) securities with respect to which an event that affects the value thereof has occurred (a “significant event”) since the closing prices were established on the principal exchange on which they are traded, but prior to a Fund’s calculation of its net asset value. Specifically, interests in commodity pools or managed futures pools are valued on a daily basis by reference to the closing market prices of each futures contract or other asset held by a pool, as adjusted for pool expenses. Restricted or illiquid securities, such as private investments or non-traded securities are valued based upon the current bid for the security from two or more independent dealers or other parties reasonably familiar with the facts and circumstances of the security (who should take into consideration all relevant factors as may be appropriate under the circumstances). If a current bid from such independent dealers or other independent parties is unavailable, the Valuation Designee shall determine the fair value of such security using the following factors: (i) the type of security; (ii) the cost at date of purchase; (iii) the size and nature of the Fund’s holdings; (iv) the discount from market value of unrestricted securities of the same class at the time of purchase and subsequent thereto; (v) information as to any transactions or offers with respect to the security; (vi) the nature and duration of restrictions on disposition of the security and the existence of any registration rights; (vii) how the yield of the security compares to similar securities of companies of similar or equal creditworthiness; (viii) the level of recent trades of similar or comparable securities; (ix) the liquidity characteristics of the security; (x) current market conditions; and (xi) the market value of any securities into which the security is convertible or exchangeable.
The Funds utilize various methods to measure the fair value of all of their investments on a recurring basis. GAAP establishes a hierarchy that prioritizes inputs to valuation methods. The three levels of input are:
Level 1 – Unadjusted quoted prices in active markets for identical assets and liabilities that the Funds have the ability to access.
Level 2 – Observable inputs other than quoted prices included in Level 1 that are observable for the asset or liability, either directly or indirectly. These inputs may include quoted prices for the identical instrument on an inactive market, prices for similar instruments, interest rates, prepayment speeds, credit risk, yield curves, default rates and similar data.
24
Holbrook Funds
Notes to Financial Statements (Continued)
April 30, 2023
Level 3 – Unobservable inputs for the asset or liability, to the extent relevant observable inputs are not available, representing the Funds’ own assumptions about the assumptions a market participant would use in valuing the asset or liability, and would be based on the best information available.
The availability of observable inputs can vary from security to security and is affected by a wide variety of factors, including, for example, the type of security, whether the security is new and not yet established in the marketplace, the liquidity of markets, and other characteristics particular to the security. To the extent that valuation is based on models or inputs that are less observable or unobservable in the market, the determination of fair value requires more judgment. Accordingly, the degree of judgment exercised in determining fair value is greatest for instruments categorized in Level 3.
The inputs used to measure fair value may fall into different levels of the fair value hierarchy. In such cases, for disclosure purposes, the level in the fair value hierarchy within which the fair value measurement falls in its entirety, is determined based on the lowest level input that is significant to the fair value measurement in its entirety.
The inputs or methodology used for valuing securities are not necessarily an indication of the risk associated with investing in those securities. The following tables summarize the inputs used as of April 30, 2023, for the Funds’ assets measured at fair value:
Income Fund
| Assets * | Level 1 | Level 2 | Level 3 | Total | ||||||||||||
| Open End Funds | $ | 29,729,499 | $ | — | $ | — | $ | 29,729,499 | ||||||||
| Preferred Stocks | 21,708,537 | 18,396,200 | — | 40,104,737 | ||||||||||||
| Asset Backed Securities | — | 394,520,614 | 1,966,490 | 396,487,104 | ||||||||||||
| Corporate Bonds | 217,284,574 | 351,820,455 | 6,428,005 | 575,533,034 | ||||||||||||
| Short-Term Investments | 27,514,637 | — | — | 27,514,637 | ||||||||||||
| Total Assets | $ | 296,237,247 | $ | 764,737,269 | $ | 8,394,495 | $ | 1,069,369,011 | ||||||||
| Structured Income Fund | ||||||||||||||||
| Assets * | Level 1 | Level 2 | Level 3 | Total | ||||||||||||
| Asset Backed Securities | — | 27,987,332 | — | $ | 27,987,332 | |||||||||||
| Corporate Bonds | — | 1,469,148 | — | 1,469,148 | ||||||||||||
| Short-Term Investments | 279,686 | — | — | 279,686 | ||||||||||||
| Total Assets | $ | 279,686 | $ | 29,456,480 | $ | — | $ | 29,736,166 | ||||||||
| * | Refer to the Schedule of Investments for classifications. |
The following is a reconciliation for the Funds for which level 3 inputs were used in determining valuations.
| Change in | Net | |||||||||||||||||||||||||||||||
| Beginning | unrealized | Transfer | Ending | |||||||||||||||||||||||||||||
| balance April | Total realized | appreciation/ | Net Transfers | (out) of | Balance April | |||||||||||||||||||||||||||
| Holbrook Income Fund | 30, 2022 | gain/(Loss) | depreciation | Net Purchases | Net Sales | into Level 3 | Level 3 | 30, 2023 | ||||||||||||||||||||||||
| Atlas Financial Holding 7.25% | — | — | — | — | — | 684,274 | — | 684,274 | ||||||||||||||||||||||||
| Atlas Financial Holding 12.25% | — | — | — | — | — | 2,365,356 | — | 2,365,356 | ||||||||||||||||||||||||
| Cooks Venture Inc | — | — | — | — | — | 3,378,375 | — | 3,378,375 | ||||||||||||||||||||||||
| HRR Funding, LLC Series 2021-1 | — | — | — | — | — | 1,966,490 | — | 1,966,490 | ||||||||||||||||||||||||
25
Holbrook Funds
Notes to Financial Statements (Continued)
April 30, 2023
Quantitative disclosures of unobservable inputs and assumptions used by Holbrook Income Fund are below:
| Impact to valuation | ||||||||||||
| Fair Value | Valuation Techniques | Unobservable inputs | Input Range | from increase in input | ||||||||
| Atlas Holdings 7.25% | $ | 684,274 | Expected recovery value | Enterprise Value | 40 | Increase | ||||||
| Atlas Holdings 12.25% | 2,365,356 | Expected recovery value | Enterprise Value | 55 | Increase | |||||||
| Cooks Venture, Inc | 3,378,375 | Market Approach | Short Term holding | 100 | % | Increase | ||||||
| HHR Funding, LLC 2021-1 | 1,966,490 | Broker Quotes | Indictive value | 90.41 | Increase | |||||||
| $ | 8,394,495 | |||||||||||
Security Transactions and Related Income – Security transactions are accounted for on a trade date basis. Interest income is recognized on an accrual basis. Discounts are accreted and premiums are amortized on securities purchased over the lives of the respective securities using the effective yield method. Dividend income is recorded on the ex-dividend date. Realized gains or losses from sales of securities are determined by comparing the identified cost of the security lot sold with the net sales proceeds.
Dividends and Distributions to Shareholders – Dividends from net investment income are declared daily and distributed monthly. Distributable net realized capital gains are declared and distributed annually. Dividends from net investment income and distributions from net realized gains are recorded on ex dividend date and determined in accordance with federal income tax regulations, which may differ from GAAP. These “book/tax” differences are considered either temporary (i.e., deferred losses, capital loss carry forwards) or permanent in nature. To the extent these differences are permanent in nature, such amounts are reclassified within the composition of net assets based on their federal tax-basis treatment; temporary differences do not require reclassification.
Federal Income Taxes – It is each Fund’s policy to qualify as a regulated investment company by complying with the provisions of the Internal Revenue Code that are applicable to regulated investment companies and to distribute substantially all of its taxable income and net realized gains to shareholders. Therefore, no federal income tax provision has been recorded.
Each Fund recognizes the tax benefits of uncertain tax positions only where the position is “more likely than not” to be sustained assuming examination by tax authorities. Management has analyzed each Fund’s tax positions and has concluded that no liability for unrecognized tax benefits should be recorded related to uncertain tax positions taken for open tax years 2020-2022 for the Holbrook Income Fund or expected to be taken for each Fund’s April 30, 2023 tax returns. Each Fund identifies its major tax jurisdictions as U.S. Federal, Ohio and foreign jurisdictions where such Funds makes significant investments; however, each Fund is not aware of any tax positions for which it is reasonably expected that the total amounts of unrecognized tax benefits will change materially in the next twelve months. The Funds recognize interest and penalties, if any, related to unrecognized tax benefits, as income tax expense in the Statement of Operations. As of April 30, 2023, the Funds did not incur any interest or penalties.
Expenses – Expenses of the Trust that are directly identifiable to a specific fund are charged to that fund. Expenses, which are not readily identifiable to a specific fund, are allocated in such a manner as deemed equitable, taking into consideration the nature and type of expense and the relative sizes of the funds in the Trust.
Indemnification – The Trust indemnifies its officers and trustees for certain liabilities that may arise from the performance of their duties to the Trust. Additionally, in the normal course of business, the Funds enter into contracts that contain a variety of representations and warranties and which provide general indemnities. The Funds’ maximum exposure under these arrangements is unknown, as this would involve future claims that may be made against the Funds that have not yet occurred. However, the Funds expect the risk of loss due to these warranties and indemnities to be remote.
26
Holbrook Funds
Notes to Financial Statements (Continued)
April 30, 2023
| 3. | PRINCIPAL INVESTMENT RISKS |
The Funds’ investments in securities and financial instruments expose them to various risks, certain of which are discussed below. The Funds’ prospectus and statement of additional information include further information regarding the of risks associated with the Funds’ investments which include, but are not limited to:
Holbrook Structured Income Fund: Collateralized Loan Obligations Risk, Concentration in Certain Mortgage-Backed Securities Risk, Credit Risk, Currency Risk, Cybersecurity Risk, Emerging Markets Risk, Extension Risk, Fixed Income Securities Risk, Floating or Variable Rate Securities Risk, Foreign (Non-U.S.) Investment Risk, Gap Risk, High Yield Risk, Illiquid Investments Risks, Industry Concentration Risk, Interest Rate Risk, LIBOR Risk, Liquidity Risk, Management Risk, Market Risk, Market Events Risk, Mezzanine Securities Risk, Mortgage-Backed and Asset-Backed Securities Risk, New Fund Risk, Portfolio Turnover Risk, Prepayment Risk, Rating Agencies Risks, Residential Loans and Mortgages Risk, Sector Risk, Structured Products Risk, Treasury Inflation Protected Securities Risk, Unrated Securities Risks, U.S. Government Securities Risk, Valuation Risk and Volatility Risk.
Holbrook Income Fund: Baby Bond Risk, Business Development Company (“BDC”) Risk, Closed End Fund Risk, Collateralized Loan Obligations Risk, Credit Risk, Currency Risk, Cybersecurity Risk, Derivatives Risk, Emerging Markets Risk, Financial Services Sector Risk, Fixed Income Securities Risk, Foreign (Non-U.S.) Investment Risk, Gap Risk, High Yield Risk, Industry Concentration Risk, Investment Companies and Exchange-Traded Funds (“ETFs”) Risk, LIBOR Risk, Liquidity Risk, Management Risk, Market Risk, Market Events Risk, Portfolio Turnover Risk, Preferred Stock Risk, Quantitative Investing Risk, Treasury Inflation Protected Securities Risk, Underlying Fund Risk, U.S. Government Securities Risk, Valuation Risk and Volatility Risk.
Baby Bonds Risk – The primary risk associated with Holbrook Income Fund’s investments in baby bonds is that the issuer or insurer of a baby bond may default on principal and/or interest payments when due on the baby bond. Such a default would have the effect of lessening the income generated by the Fund and/or the value of the baby bonds. Baby bonds are also subject to typical credit ratings risks associated with other fixed-income instruments. Baby bond securities are classified as Corporate Bonds on the Schedule of Investments.
Collateralized Loan Obligations Risk – The Funds are subject to certain risks as a result of its investments in CLOs. The CLO’s performance is linked to the expertise of the CLO manager and its ability to manage the CLO portfolio. The experience of a CLO manager plays an important role in the rating and risk assessment of CLO debt securities. One of the primary risks to investors of a CLO is the potential change in CLO manager, over which the Funds will have no control. The Funds may be adversely affected by new (or revised) laws or regulations that may be imposed by government regulators or self-regulatory organizations that supervise the financial markets. Changes in the regulation of CLOs may adversely affect the value of the investments held by the Funds and the ability of the Funds to execute their investment strategies. CLO debt securities are limited recourse obligations of their issuers. CLO investors must rely solely on distributions from the underlying assets for payments on the CLO debt they hold. CLO debt is not guaranteed by the issuer or any other party. If income from the underlying loans is insufficient to make payments on the CLO debt, no other assets will be available for payment. CLO debt securities may be subject to redemption. In the event of an early redemption, holders of the CLO debt being redeemed will be repaid earlier than the stated maturity of the debt. The timing of redemptions may adversely affect the returns on CLO debt. The CLO manager may not find suitable assets in which to invest during the reinvestment period or to replace assets that the manager has determined are no longer suitable for investment. Additionally, there is a risk that the reinvestment period may terminate early if, for example, the CLO defaults on payments on the securities which it issues or if the CLO manager determines that it can no longer reinvest in underlying assets. Early termination of the reinvestment period could adversely affect a CLO investment.
Fixed Income Securities Risk – Fixed income securities are subject to interest rate risk, call risk, prepayment and extension risk, credit risk, duration, and liquidity risk. In addition, current market conditions may pose heightened risks for fixed income securities. When the Funds invest in fixed income securities or derivatives, the value of your investment in the Funds will fluctuate with changes in interest rates. Typically, a rise in interest rates causes a decline in the value of fixed
27
Holbrook Funds
Notes to Financial Statements (Continued)
April 30, 2023
income securities or derivatives owned by the Funds. Moreover, new regulations applicable to and changing business practices of financial intermediaries that make markets in fixed income securities have resulted in less market making activity for certain fixed income securities, which has reduced the liquidity and may increase the volatility for such fixed income securities. The fixed-income securities market can be susceptible to increases in volatility and decreases in liquidity. Liquidity may decline unpredictably in response to overall economic conditions or credit tightening. Longer-term securities may be more sensitive to interest rate changes.
LIBOR Risk – The Funds may invest in securities and other instruments whose interest payments are determined by references to the London Interbank Offered Rate (“LIBOR”). The United Kingdom Financial Conduct Authority, which regulates LIBOR, previously announced that after 2021 it would cease its active encouragement of banks to provide the quotations needed to sustain LIBOR. ICE Benchmark Administration Limited, the administrator of LIBOR, ceased publication of most LIBOR settings on a representative basis at the end of 2021 and is expected to cease publication of the remaining LIBOR settings on a representative basis after June 30, 2023. The U.S. Federal Reserve, based on the recommendations of the New York Federal Reserve’s Alternative Reference Rate Committee (comprised of major derivative market participants and their regulators), has begun publishing Secured Overnight Financing Rate (SOFR), a broad measure of secured overnight U.S. Treasury repo rates, that is intended to replace U.S. dollar LIBOR. Actions by regulators have resulted in the establishment of alternative reference rates to LIBOR in most major currencies. Markets are developing in response to these new rates, but questions around liquidity in these rates and how to appropriately adjust these rates to eliminate any economic value transfer at the time of transition remain a significant concern. The unavailability of LIBOR presents risks to the Funds, including the risk that any pricing or adjustments to the Funds’ investments resulting from a substitute or alternate reference rate may adversely affect the Funds’ performance and/or NAV. It remains uncertain how such changes would be implemented and the effects such changes would have on the Funds, including any negative effects on the Funds’ liquidity and valuation of the Funds’ investments, issuers of instruments in which the Fund invests and financial markets generally.
Market Risk – Overall market risk may affect the value of individual instruments in which the Fund invests. The Fund is subject to the risk that the securities markets will move down, sometimes rapidly and unpredictably, based on overall economic conditions and other factors, which may negatively affect the Funds’ performance. Factors such as domestic and foreign (non-U.S.) economic growth and market conditions, real or perceived adverse economic or political conditions, military conflict, acts of terrorism, social unrest, natural disasters, recessions, inflation, changes in interest rate levels, supply chain disruptions, sanctions, the spread of infectious illness or other public health threats, lack of liquidity in the bond and other markets, volatility in the securities markets, adverse investor sentiment and political events effect the securities markets. U.S. and foreign stock markets have experienced periods of substantial price volatility in the past and may do so again in the future. Securities markets also may experience long periods of decline in value. A change in financial condition or other event affecting a single issuer or market may adversely impact securities markets as a whole. Rates of inflation have recently risen. The value of assets or income from an investment may be worth less in the future as inflation decreases the value of money. As inflation increases, the real value of the Fund’s assets can decline as can the value of the Fund’s distributions. When the value of the Funds’ investments go down, your investment in the Funds decreases in value and you could lose money.
Local, state, regional, national or global events such as war, acts of terrorism, the spread of infectious illness or other public health issues, recessions, or other events could have a significant impact on the Funds and their investments and could result in decreases to the Funds’ net asset values. Political, geopolitical, natural and other events, including war, terrorism, trade disputes, government shutdowns, market closures, natural and environmental disasters, epidemics, pandemics and other public health crises and related events and governments’ reactions to such events have led, and in the future may lead, to economic uncertainty, decreased economic activity, increased market volatility and other disruptive effects on U.S. and global economies and markets. Such events may have significant adverse direct or indirect effects on the Funds and their investments. For example, a widespread health crisis such as a global pandemic could cause substantial market volatility, exchange trading suspensions and closures, impact the ability to complete redemptions, and affect the Funds’ performance. A health crisis may exacerbate other pre-existing political, social and economic risks. In addition, the increasing interconnectedness of markets around the world may result in many markets being affected by events or conditions in a single country or region or events affecting a single or small number of issuers.
28
Holbrook Funds
Notes to Financial Statements (Continued)
April 30, 2023
The impact of COVID-19, and other infectious illness outbreaks that may arise in the future, could adversely affect the economies of many nations or the entire global economy, individual issuers and capital markets in ways that cannot necessarily be foreseen.
Preferred Stock Risk – The value of preferred stocks will fluctuate with changes in interest rates. Typically, a rise in interest rates causes a decline in the value of preferred stock. Preferred stocks are also subject to credit risk, which is the possibility that an issuer of preferred stock will fail to make its dividend payments. Preferred stock prices tend to move more slowly upwards than common stock prices. Convertible preferred stock tends to be more volatile than non-convertible preferred stock, because its value is related to the price of the issuer’s common stock as well as the dividends payable on the preferred stock. The value of preferred stocks will usually react more strongly than bonds and other debt securities to actual or perceived changes in issuer’s financial condition or prospects and may be less liquid than common stocks.
Structured Products Risk – The Funds may invest in Structured Products, including CLOs, CDOs, CMOs, and other asset-backed securities and debt securitizations. Some Structured Products have credit ratings, but are typically issued in various classes with various priorities. Normally, Structured Products are privately offered and sold (that is, they are not registered under the securities laws) and may be characterized by the Funds as illiquid securities; however, an active dealer market may exist for Structured Products that qualify for Rule 144A transactions. The senior and junior tranches of Structured Products may have floating or variable interest rates based on LIBOR or an alternative reference rate and are subject to the risks associated with securities tied to LIBOR, including the risks associated with the future replacement of LIBOR with an alternative reference rate. The Funds may also invest in the equity tranches of a Structured Product, which typically represent the first loss position in the Structured Product, are unrated and are subject to higher risks. Equity tranches of Structured Products typically do not have a fixed coupon and payments on equity tranches will be based on the income received from the underlying collateral and the payments made to the senior tranches, both of which may be based on floating rates based on LIBOR or an alternative reference rate.
| 4. | INVESTMENT TRANSACTIONS |
For the year or period ended April 30, 2023, the cost of purchases and proceeds from sales of investment securities, other than short-term securities, for the Funds were as follows:
| Fund | Purchase | Sales | ||||||
| Holbrook Income Fund | $ | 794,220,632 | $ | 317,735,160 | ||||
| Holbrook Structured Income Fund | 41,300,184 | 1,935,000 | ||||||
| 5. | INVESTMENT ADVISORY AGREEMENT AND TRANSACTIONS WITH RELATED PARTIES |
Advisory Fees – Holbrook Holdings, Inc. serves as the Funds’ Investment Advisor (the “Advisor”). Pursuant to an Investment Advisory Agreement with the Funds, the Advisor, under the oversight of the Board, directs the daily operations of the Funds and supervises the performance of administrative and professional services provided by others. As compensation for its services and the related expenses borne by the Advisor, each Fund pays the Advisor an investment advisory fee, computed and accrued daily and paid monthly based on average daily net assets as shown in the table below.
The Advisor has contractually agreed to reduce its fees and/or absorb expenses of the Funds’ (The “Waiver Agreement”), until at least September 1, 2023, to ensure that Total Annual Fund Operating Expenses after fee waiver and/or reimbursement (exclusive of any front -end or contingent deferred loads; brokerage fees and commissions; acquired fund fees and expenses; borrowing costs (such as interest and dividend expense on securities sold short); taxes; and extraordinary expenses (such as litigation)) do not exceed the expense limitation shown in the table below, and is based on the Funds’ average daily net assets and is subject to possible recoupment (or recapture) from the Funds in future years on a rolling three year basis (within the three years after the fees have been waived or reimbursed) if such recoupment (or recapture) can be achieved within the foregoing expense limits as well as any expense limitation that was in effect at the time the waiver or reimbursement was made.
29
Holbrook Funds
Notes to Financial Statements (Continued)
April 30, 2023
If the Advisor waives any fee or reimburses any expense pursuant to the Waiver Agreement, and within three years of such waiver or reimbursement, the Funds’ Operating Expenses are subsequently less than what is shown in the table below of average daily net assets, the Advisor shall be entitled to recoupment or recapture from the Funds’ for such waived fees or reimbursed expenses provided that such recoupment (or recapture) does not cause the Funds’ expenses to exceed what is shown in the table below of average daily net assets. If Fund Operating Expenses attributable to Class I, Investor Class and Class A shares subsequently exceed what is shown in the table below per annum of the average daily net assets, the recoupment (or recapture) shall be suspended. During the period ended April 30, 2023, the Advisor waived the expenses in the table below.
| Managament | ||||||||||||||||||
| Fee Waived/ | ||||||||||||||||||
| Investment | Expenses Limitation | Expenses Reimbursed | Affiliated | |||||||||||||||
| Fund | Advisory Fee | Cl I | Cl INV | Cl A | Expires | YTD 4/30/2023 | Fees Waived | |||||||||||
| Holbrook Income Fund | 0.80% | 1.30% | 1.80% | 1.55% | 9/1/2023 | $ | — | $ | (198,740 | ) | ||||||||
| Holbrook Structured Income Fund | 1.00% | 1.50% | 2.00% | 1.75% | 9/1/2023 | (215,708 | ) | — | ||||||||||
The Holbrook Income Fund is invested in the Holbrook Structured Income Fund. The Advisor is waiving its investment advisory fee on the daily net assets of Holbrook Income Fund that are invested in the Holbrook Structured Income Fund. These fee waivers are not recapturable by the Advisor. The Advisor waived $215,708 in expenses for the Holbrook Structured Income Fund which may be recaptured by April 30, 2026.
The Board has adopted the Trust’s Master Distribution and Shareholder Servicing Plan (the “Plan”) pursuant to Rule 12b-1 under the 1940 Act. The Plan provides that a monthly service and/or distribution fee is calculated by the Funds at an annual of 0.50% of its average daily net assets for Class A and the Investor Class. Currently, the Funds’ Trustees have set the 12b-1 fee level at 0.25% for the Funds’ Class A shares. These fees are paid to Northern Lights Distributors, LLC (the “Distributor”) to provide compensation for ongoing shareholder servicing and distribution-related activities or services and/or maintenance of the Funds’ shareholder accounts not otherwise required to be provided by the Advisor. For the period ended April 30, 2023, pursuant to the Plan, the fund paid the following 12b-1 fees:
| Fund | Class A | Class Inv | ||||||
| Holbrook Income Fund | $ | 42,940 | $ | 599,139 | ||||
| Holbrook Structured Income Fund | 684 | 22 | ||||||
The Distributor acts as the Funds’ principal underwriter in a continuous public offering of the Funds’ Class I, Investor Class and Class A shares. For the year or period ended April 30, 2023, the Distributor received the following underwriter commissions:
| Fund | Class I | Class Inv | Class A | |||||||||
| Holbrook Income Fund | $ | — | $ | — | $ | 62,707 | ||||||
| Holbrook Structured Income Fund | — | — | — | |||||||||
In addition, certain affiliates of the Distributor provide services to the Funds as follows:
Ultimus Funds Solutions, LLC (“UFS”) – UFS, an affiliate of the Distributor, provides administration, fund accounting, and transfer agent services to the Trust. Pursuant to separate servicing agreements with UFS, the Funds pay UFS customary fees for providing administration, fund accounting and transfer agency services to the Funds. Certain officers of the Trust are also officers of UFS and are not paid any fees directly by the Funds for serving in such capacities.
Northern Lights Compliance Services, LLC (“NLCS”) – NLCS, an affiliate of UFS and the Distributor, provides a Chief Compliance Officer to the Trust, as well as related compliance services, pursuant to a consulting agreement between NLCS and the Trust. Under the terms of such agreement, NLCS receives customary fees from the Funds.
30
Holbrook Funds
Notes to Financial Statements (Continued)
April 30, 2023
Blu Giant, LLC (“Blu Giant”) – Blu Giant, an affiliate of UFS and the Distributor, provides EDGAR conversion and filing services as well as print management services for the Fund on an ad-hoc basis. For the provision of these services, Blu Giant receives customary fees from the Funds’.
| 6. | AFFILATED INVESTMENTS |
Investments which were affiliates of the Funds as of April 30, 2023 are noted in the Schedules of Investments. A summary of the investment in the affiliated investment; Holbrook Income Fund, which is managed by the Advisor, is detailed below:
| Amount of | ||||||||||||||||||||||||||||||||||
| Gain (Loss) | ||||||||||||||||||||||||||||||||||
| Change in | Dividends | Realized on | ||||||||||||||||||||||||||||||||
| Shares at | Shares at | Unrealized | Credited to | Sale of | ||||||||||||||||||||||||||||||
| Fund | Affiliated Holding | 4/30/22 | Purchases | Sales | 4/30/23 | Fair Value | Gain/(Loss) | Income | Shares | |||||||||||||||||||||||||
| Holbrook Income Fund | Holbrook Structured Income Fund | — | 3,068,060 | — | 3,068,060 | $ | 29,729,499 | (833,576 | ) | $ | 2,507,025 | — | ||||||||||||||||||||||
| 7. | AGGREGATE UNREALIZED APPRECIATION AND DEPRECIATION – TAX BASIS |
| Gross | Gross | Net Unrealized | ||||||||||||||
| Tax | Unrealized | Unrealized | Appreciation/ | |||||||||||||
| Fund | Cost | Appreciation | Depreciation | (Depreciation) | ||||||||||||
| Income Fund | $ | 1,124,448,351 | $ | 4,602,025 | $ | (59,681,365 | ) | $ | (55,079,340 | ) | ||||||
| Structured Income Fund | $ | 30,582,914 | $ | 196,817 | $ | (1,043,565 | ) | $ | (846,748 | ) | ||||||
| 8. | DISTRIBUTIONS TO SHAREHOLDERS AND TAX COMPONENTS OF CAPITAL |
The tax character of distributions paid during the years ended April 30, 2023 and April 30, 2022 for Holbrook Funds was as follows:
| For fiscal year ended | Ordinary | Long-Term | Return of | |||||||||||||
| 4/30/2023 | Income | Capital Gains | Capital | Total | ||||||||||||
| Holbrook Income Fund | $ | 53,802,047 | $ | — | $ | — | $ | 53,802,047 | ||||||||
| Holbrook Structured Income Fund | 2,522,173 | — | — | 2,522,173 | ||||||||||||
| For fiscal year ended | Ordinary | Long-Term | Return of | |||||||||||||
| 4/30/2022 | Income | Capital Gains | Capital | Total | ||||||||||||
| Holbrook Income Fund | $ | 23,891,898 | $ | 1,435,199 | $ | 817,187 | $ | 26,144,284 | ||||||||
| Holbrook Structured Income Fund | — | — | — | — | ||||||||||||
As of April 30, 2023, the components of accumulated earnings/ (deficit) on a tax basis were as follows:
| Undistributed | Undistributed | Post October Loss | Capital Loss | Other | Unrealized | Total | ||||||||||||||||||||||
| Ordinary | Long-Term | and | Carry | Book/Tax | Appreciation/ | Accumulated | ||||||||||||||||||||||
| Income | Gains | Late Year Loss | Forwards | Differences | (Depreciation) | Earnings/(Deficits) | ||||||||||||||||||||||
| Holbrook Income Fund | $ | 534,595 | $ | — | $ | (8,968,967 | ) | $ | (8,594,429 | ) | $ | (1,521,416 | ) | $ | (55,079,340 | ) | $ | (73,629,557 | ) | |||||||||
| Holbrook Structured Income Fund | 93,129 | — | — | (75,662 | ) | — | (846,748 | ) | $ | (829,281 | ) | |||||||||||||||||
The difference between book basis and tax basis undistributed net investment income/(loss), accumulated net realized losses, and unrealized depreciation from investments is primarily attributable to the tax deferral of losses on wash sales, trust preferred securities, partnerships and adjustments for accrued dividends payable.
31
Holbrook Funds
Notes to Financial Statements (Continued)
April 30, 2023
Capital losses incurred after October 31 within the fiscal year are deemed to arise on the first business day of the following fiscal year for tax purposes. The Funds incurred and elected to defer such capital losses as follows:
| Post October | ||||
| Losses | ||||
| Holbrook Income Fund | $ | 8,968,967 | ||
| Holbrook Structured Income Fund | — | |||
At April 30, 2023, the Funds had capital loss carry forwards for federal income tax purposes available to offset future capital gains, and utilized capital loss carryforwards as follows:
| Short-Term | Long-Term | Total | CLCF Utilized | |||||||||||||
| Holbrook Income Fund | $ | 7,683,979 | $ | 910,450 | $ | 8,594,429 | $ | — | ||||||||
| Holbrook Structured Income Fund | 75,662 | — | 75,662 | — | ||||||||||||
Permanent book and tax differences, primarily attributable to the book/tax basis treatment of non-deductible expenses resulted in reclassifications for the Funds for the fiscal year ended April 30, 2023, as follows:
| Paid | ||||||||
| In | Accumulated | |||||||
| Capital | Earnings (Losses) | |||||||
| Holbrook Income Fund | $ | — | $ | — | ||||
| Holbrook Structured Income Fund | (25,999 | ) | 25,999 | |||||
| 9. | CONTROL OWNERSHIP |
The beneficial ownership, either directly or indirectly, of more than 25% of the voting securities of a fund creates presumption of control of the fund, under Section 2(a)(9) of the 1940 Act. As of April 30, 2023, the shareholders that own 25% or more of the voting securities are as follows:
| Structured | ||||||||
| Owner | Income Fund | Income Fund | ||||||
| Charles Schwab & Co., Inc. | 45 | % | — | |||||
| National Financial Services LLC | 29 | % | — | |||||
| Holbrook Income Fund | — | 98 | % | |||||
| 10. | SUBSEQUENT EVENTS |
Subsequent events after the date of the Statement of Assets and Liabilities have been evaluated through the date the financial statements were issued. Management has determined that no events or transactions occurred requiring adjustment or disclosure in the financial statements.
32
REPORT OF INDEPENDENT REGISTERED PUBLIC ACCOUNTING FIRM
To the Shareholders and Board of Trustees of
Two Roads Shared Trust
Opinion on the Financial Statements
We have audited the accompanying statements of assets and liabilities, including the schedules of investments, of Two Roads Shared Trust, comprising the funds listed below (the “Funds”) as of April 30, 2023, and the related statements of operations, the statements of changes in net assets, the related notes, and the financial highlights for each of the periods indicated below (collectively referred to as the “financial statements”). In our opinion, the financial statements present fairly, in all material respects, the financial position of the Funds as of April 30, 2023, and the results of their operations, the changes in net assets and the financial highlights for each of the periods indicated below in conformity with accounting principles generally accepted in the United States of America.
| Fund Name | Statements of Operations | Statements of Changes in Net Assets | Financial Highlights | |||
| Holbrook Income Fund | For the year ended April 30, 2023 | For the years ended April 30, 2023 and 2022 | For the years ended April 30, 2023 and 2022 | |||
| Holbrook Structured Income Fund | For the period May 2, 2022 (commencement of operations) through April 30, 2023 | |||||
The Funds’ financial highlights for the years ended April 30, 2021, and prior, were audited by other auditors whose report dated June 29, 2021, expressed an unqualified opinion on those financial statements and financial highlights.
Basis for Opinion
These financial statements are the responsibility of the Funds’ management. Our responsibility is to express an opinion on the Funds’ financial statements based on our audits. We are a public accounting firm registered with the Public Company Accounting Oversight Board (United States) (“PCAOB”) and are required to be independent with respect to the Funds in accordance with the U.S. federal securities laws and the applicable rules and regulations of the Securities and Exchange Commission and the PCAOB.
We conducted our audits in accordance with the standards of the PCAOB. Those standards require that we plan and perform the audits to obtain reasonable assurance about whether the financial statements are free of material misstatement whether due to error or fraud.
Our audits included performing procedures to assess the risks of material misstatement of the financial statements, whether due to error or fraud, and performing procedures that respond to those risks. Such procedures included examining, on a test basis, evidence regarding the amounts and disclosures in the financial statements. Our procedures included confirmation of securities owned as of April 30, 2023, by
33
correspondence with the custodian and brokers; when replies were not received from brokers, we performed other auditing procedures. Our audits also included evaluating the accounting principles used and significant estimates made by management, as well as evaluating the overall presentation of the financial statements. We believe that our audits provide a reasonable basis for our opinion.
We have served as the Funds’ auditor since 2022.
COHEN & COMPANY, LTD.
Philadelphia, Pennsylvania
June 29, 2023
34
Holbrook Income Fund
Supplemental Information (Unaudited)
April 30, 2022
Approval of Advisory Agreement
Holbrook Funds
At a meeting held on March 27–28, 2023 (the “Meeting”), the Board of Trustees (the “Board”) of Two Roads Shared Trust (the “Trust”), each of whom is not an “interested person” of the Trust (the “Independent Trustees” or the “Trustees”), as such term is defined under Section 2(a)(19) of the Investment Company Act of 1940, as amended (the “1940 Act”), considered the renewal of the investment advisory agreement (the “Advisory Agreement”) between Holbrook Holdings, Inc. (“Holbrook” or the “Adviser”) and the Trust, on behalf of the Holbrook Income Fund and Holbrook Structured Income Fund (each a “Fund”, and together the “Holbrook Funds” or the “Funds”).
In connection with the Board’s consideration of the Advisory Agreement with respect to each of the Funds, the Board received written materials in advance of the Meeting, which included information regarding: (i) the nature, extent, and quality of services provided to the Funds by Holbrook; (ii) a description of the Adviser’s investment management personnel; (iii) an overview of the Adviser’s operations and financial condition; (iv) a description of the Adviser’s brokerage practices (including any soft dollar arrangements); (v) a comparison of each Fund’s advisory fees and overall expenses with those of comparable mutual funds; (vi) the level of profitability from the Adviser’s fund-related operations; (vii) the Adviser’s compliance policies and procedures, including policies and procedures for personal securities transactions, business continuity and information security and (viii) information regarding the performance record of the Fund as compared to other mutual funds with similar investment strategies.
Throughout the process, including at the Meeting, the Board had numerous opportunities to ask questions of and request additional materials from Holbrook. The Board was advised by, and met in executive sessions with, the Board’s independent legal counsel, and received a memorandum from such independent counsel regarding their responsibilities under applicable law. The Board also noted that the evaluation process with respect to the Adviser is an ongoing one and that in this regard, the Board took into account discussions with management and information provided to the Board at prior meetings with respect to the services provided by the Adviser, including quarterly performance reports prepared by management. The Board noted that the information received and considered by the Board in connection with the Meeting and throughout the year was both written and oral.
Matters considered by the Board in connection with its approval of the Advisory Agreement with respect to each of the Funds included, among others, the following:
Nature, Extent and Quality of Services. The Board reviewed materials provided by Holbrook related to the Advisory Agreement on behalf of each Fund, including: the Advisory Agreement; a description of the manner in which investment decisions are made and executed; a review of the financial condition of Holbrook; an overview of the personnel that perform advisory, compliance, and operational services for the Funds; a quarterly written report containing Holbrook’s performance commentary; Holbrook’s compliance program, including its business continuity policy and cybersecurity policies, and a code of ethics containing provisions reasonably necessary to prevent Access Persons, as that term is defined in Rule 17j-1 under the Investment Company Act of 1940 Act, from engaging in conduct prohibited by Rule 17j-1(b); information regarding risk management processes and liquidity management; an annual review of the operation of Holbrook’s compliance program; information regarding the Adviser’s compliance and regulatory history; and an independent report prepared by Broadridge analyzing the performance record, fees, and expenses of each of the Funds as compared to a respective peer group (“Peer Group”) of other mutual funds with similar investment strategies as selected by Broadridge.
In considering the nature and quality of services provided by Holbrook under the Advisory Agreement with respect to each Fund, the Board considered the level and sophistication of Holbrook’s employees’ asset management, risk management, operations, and compliance experience.
The Board also noted that it has received and reviewed information from the Trust’s Chief Compliance
35
Holbrook Income Fund
Supplemental Information (Unaudited) (Continued)
April 30, 2022
Officer (“CCO”) regarding the Funds’ compliance policies and procedures established pursuant to Rule 38a-1 under the 1940 Act, which included evaluating the regulatory compliance systems of the Adviser. The Board noted the CCO’s analysis that Holbrook’s compliance, risk management, and associated policies appeared to be operating effectively to identify and monitor risks and ensure compliance with the federal securities laws. The Board considered the effectiveness of Holbrook’s cybersecurity and business continuity policies and procedures. The Board also considered the significant risks assumed by Holbrook in connection with the services provided to the Funds, including entrepreneurial risk and ongoing risks including investment, operational, enterprise, litigation, regulatory, and compliance risks with respect to each Fund.
The Board also considered the financial condition and operations of the Adviser during the COVID-19 pandemic and noted no significant disruption or impact to the services provided by the Adviser as a result of the COVID-19 pandemic and that the Adviser had continued to provide the same level, quality and extent of services to each of the Funds. The Board noted that Holbrook retained the investment functions with respect to each Fund.
In considering the nature, extent, and quality of the services provided by Holbrook, the Board also took into account its knowledge, acquired through discussions and reports during the preceding year and in past years, of Holbrook’s management and the quality of the performance of Holbrook’s duties. The Board concluded that Holbrook had sufficient quality and depth of personnel, resources, investment methods, and compliance policies and procedures to perform its duties under the Advisory Agreement with respect to each of the Funds and that the nature, overall quality, and extent of the advisory services provided by Holbrook to each Fund were satisfactory and reliable.
Performance. In considering each Fund’s performance, the Board noted that it reviews information about each Fund’s performance results at its regularly scheduled meetings. Among other data, the Board considered each Fund’s performance as compared to a broad -based index and against the performance of its Peer Group and Morningstar category. The Board noted that while it found the data provided by the independent third-party generally useful, it recognized its limitations, including in particular that data may vary depending on the selected end date and that the results of the performance comparisons may vary depending on the selection of the Peer Group. The Board also noted differences in the investment strategies of the Funds relative to their respective Peer Groups.
The Board also took into account management’s discussion of the performance of each of the Funds, including the quarterly written reports containing the Adviser’s performance commentaries.
With respect to the Holbrook Income Fund ((the “Fund”) for purposes of this paragraph), the Board considered, among other data, the performance of the Fund for the one-year, three-year, five-year, and since inception periods ended November 30, 2022 as compared to the Fund’s Peer Group and Morningstar category and a benchmark index. The Board considered that the Fund outperformed the Peer Group median, Morningstar category median and the index for all such periods. The Board concluded that the performance of the Fund was satisfactory.
With respect to the Holbrook Structured Income Fund ((the “Fund”) for purposes of this paragraph), the Board considered, among other data, the performance of the Fund for the since inception period ended December 31, 2022 as compared to the Fund’s Peer Group and Morningstar category. The Board considered that the Fund outperformed its Peer Group median and Morningstar category median for the since inception period. The Board also took into account the relatively short operational history of the Fund. The Board concluded that the performance of the Fund was satisfactory.
Fees and Expenses. Regarding the costs of the services provided by Holbrook with respect to each Fund, the Board considered, among other data, a comparison of each Fund’s contractual advisory fee and net expense ratio to those of the funds in its Peer Group and Morningstar category. The Board noted that while it found the data provided
36
Holbrook Income Fund
Supplemental Information (Unaudited) (Continued)
April 30, 2022
by the independent third-party generally useful, it recognized its limitations, including potential differences in the investment strategies of each Fund relative to its Peer Group, as well as the level, quality, and nature of the services provided by the Adviser with respect to each Fund.
The Board noted that, with respect to the Holbrook Income Fund, that the Fund’s contractual advisory fee was above the median of each of its Peer Group and Morningstar category but was not the highest of its Morningstar category. The Board also considered that the net expenses of the Fund were above the median of its Peer Group and Morningstar category but were not the highest of its Peer Group or Morningstar category.
The Board also took into account a peer group prepared by Holbrook and noted that Holbrook had agreed to waive its fees and/or reimburse Fund expenses to limit total annual operating expenses (exclusive of (i) any front-end or contingent deferred loads; (ii) taxes; (iii) interest; (iv) brokerage commissions; (v) expenses incurred in connection with any merger or reorganization; (vi) underlying fund fees and expenses; or (vii) extraordinary expenses such as litigation) to 1.30%, 1.80% and 1.55% for Class I, Investor Class and Class A shares, respectively, although the Fund had operated below these expense limits in the prior year. The Board also considered the sophistication of the portfolio manager with respect to the Fund’s strategy.
The Board noted that, with respect to the Holbrook Structured Income Fund, that the Fund’s contractual advisory fee was above the median of each of its Peer Group and Morningstar category but was not the highest of its Morningstar category. The Board also considered that the net expenses of the Fund were above the median of its Peer Group and Morningstar category but were not the highest of its Peer Group or Morningstar category. The Board also took into account that Holbrook had agreed to waive its fees and/or reimburse Fund expenses to limit total annual operating expenses (exclusive of (i) any front-end or contingent deferred loads; (ii) taxes; (iii) interest; (iv) brokerage commissions; (v) expenses incurred in connection with any merger or reorganization; (vi) underlying fund fees and expenses; or (vii) extraordinary expenses such as litigation) to 1.50%, 2.00% and 1.75% for Class I, Investor Class and Class A shares, respectively. The Board also took into account the impact of the Fund’s current asset level on expenses given its limited operating history and considered the sophistication of the portfolio manager with respect to the Fund’s strategy.
Based on the factors above, the Board concluded that the advisory fee for each of the Funds was not unreasonable.
Profitability. The Board considered Holbrook’s profitability and whether these profits were excessive in light of the services provided to the Funds. The Board reviewed a profitability analysis prepared by Holbrook based on current asset levels of the Funds. The Board also took into account the Adviser’s discussion of its profitability as well as its past fee waivers and reimbursements with respect to each Fund. The Board noted the direct and indirect costs of operating the Funds in the Adviser’s analysis and concluded that, factoring all applicable costs, Holbrook’s net profitability from the Advisory Agreement with respect to each of the Funds, if any, and related to the Funds as a whole were not excessive.
Economies of Scale. The Board considered whether Holbrook would realize economies of scale with respect to its management of the Funds as the Funds grew and whether fee levels reflected these economies of scale for the benefit of shareholders. The Board noted that the advisory fee with respect to each Fund did not currently have breakpoints. The Board considered the profitability analysis provided by Holbrook and the Adviser’s discussion of the same, including both direct and indirect costs borne by the Adviser in managing the Funds, as well as the Adviser’s discussion of the current fee structure. The Board also took into account the Adviser’s view that as a Fund’s assets increase over time, a Fund may realize other economies of scale. The Board noted that it would continue to consider in the future the extent to which economies of scale may exist.
Other Benefits. The Board also considered the character and amount of any other direct and incidental benefits received by Holbrook from its association with the Funds. The Board noted certain benefits may result from
37
Holbrook Income Fund
Supplemental Information (Unaudited) (Continued)
April 30, 2022
the relationship as discussed by the Adviser, well as the use of soft dollars. The Board concluded that such benefits are reasonable.
Conclusion. The Board, having requested and received such information from Holbrook as it believed reasonably necessary to evaluate the terms of the Advisory Agreement with respect to each Fund, and having been advised by independent counsel that the Board had appropriately considered and weighed all relevant factors, determined that approval of Advisory Agreement for an additional one-year term was in the best interests of each of the Funds and its shareholders.
In considering the Advisory Agreement renewal with respect to each Fund, the Board considered a variety of factors, including those discussed above, and also considered other factors (including conditions and trends prevailing generally in the economy, the securities markets and the industry). The Board did not identify any one factor as determinative, and each Independent Trustee may have weighed each factor differently. The Board’s conclusions may be based in part on its consideration of the advisory arrangements in prior years and on the Board’s ongoing regular review of each Fund’s performance and operations throughout the year.
38
Holbrook Funds
Expense Example (Unaudited)
April 30, 2023
As a shareholder of the Holbrook Funds (the “Funds”), you incur two types of costs: (1) transaction costs, including sales charges (loads) on purchases, contingent deferred sales charges (CDSCs) and redemption fees; and (2) ongoing costs, including management fees, distribution and/or service (12b-1) fees, and other Funds’ expenses. This example is intended to help you understand your ongoing costs (in dollars) of investing in the Holbrook Funds and to compare these costs with the ongoing costs of investing in other mutual funds.
The example is based on an investment of $1,000 invested at the beginning of the period and held for the entire period from November 1, 2022, through April 30, 2023.
Actual Expenses
The “Actual Expenses” line in the table below provides information about actual account values and actual expenses. You may use the information below, together with the amount you invested, to estimate the expenses that you paid over the period. Simply divide your account value by $1,000 (for example, an $8,600 account value divided by $1,000 = 8.6), then multiply the result by the number in the table under the heading entitled “Expenses Paid During Period” to estimate the expenses you paid on your account during this period.
Hypothetical Example for Comparison Purposes
The “Hypothetical” line in the table below provides information about hypothetical account values and hypothetical expenses based on the Fund’s actual expense ratio and an assumed rate of return of 5% per year before expenses, which is not the Fund’s actual return. The hypothetical account values and expenses may not be used to estimate the actual ending account balances or expenses you paid for the period. You may use this information to compare this 5% hypothetical example with the 5% hypothetical examples that appear in the shareholder reports of other funds.
Please note that the expenses shown in the table are meant to highlight your ongoing costs only and do not reflect any transactional costs, such as redemption fees. Therefore, the table is useful in comparing ongoing costs only, and will not help you determine the relative total costs of owning different funds. In addition, if these transactional costs were included, your costs would have been higher.
| Beginning | Annualized | Ending | Expenses | |||||||||||||
| Account | Expense Ratio | Account | Paid During | |||||||||||||
| Value 11/1/2022 | For the period | Value 4/30/2023 | the Period* | |||||||||||||
| Actual | ||||||||||||||||
| Holbrook Income Fund - Class I | $ | 1,000.00 | 1.06 | % | $ | 1,023.60 | $ | 5.32 | ||||||||
| Holbrook Income Fund - Investor Class | 1,000.00 | 1.56 | % | 1,020.70 | 7.82 | |||||||||||
| Holbrook Income Fund - Class A | 1,000.00 | 1.31 | % | 1,023.00 | 6.57 | |||||||||||
| Holbrook Structured Income Fund - Class I | 1,000.00 | 1.50 | % | 1,042.90 | 7.60 | |||||||||||
| Holbrook Structured Income Fund - Investor Class | 1,000.00 | 2.00 | % | 1,040.00 | 10.12 | |||||||||||
| Holbrook Structured Income Fund - Class A | 1,000.00 | 1.75 | % | 1,041.40 | 8.86 | |||||||||||
| Beginning | Annualized | Ending | Expenses | |||||||||||||
| Account | Expense Ratio | Account | Paid During | |||||||||||||
| Value 11/1/2022 | For the period | Value 4/30/2023 | the Period* | |||||||||||||
| Hypothetical | ||||||||||||||||
| Holbrook Income Fund - Class I | $ | 1,000.00 | 1.06 | % | $ | 1,019.54 | $ | 5.31 | ||||||||
| Holbrook Income Fund - Investor Class | 1,000.00 | 1.56 | % | 1,017.06 | 7.80 | |||||||||||
| Holbrook Income Fund - Class A | 1,000.00 | 1.31 | % | 1,018.30 | 6.56 | |||||||||||
| Holbrook Structured Income Fund - Class I | 1,000.00 | 1.50 | % | 1,017.36 | 7.50 | |||||||||||
| Holbrook Structured Income Fund - Investor Class | 1,000.00 | 2.00 | % | 1,014.88 | 9.99 | |||||||||||
| Holbrook Structured Income Fund - Class A | 1,000.00 | 1.75 | % | 1,016.12 | 8.75 | |||||||||||
| * | Expenses are equal to the Fund’s annualized expense ratio, multiplied by the number of days in the period (181) divided by the number of days in the fiscal year (365). |
39
Holbrook Funds
SUPPLEMENTAL INFORMATION (Unaudited)
April 30, 2023
Trustees and Officers. The Trustees and officers of the Trust, together with information as to their principal business occupations during the past five years and other information, are shown below. Unless otherwise noted, the address of each Trustee and Officer is 225 Pictoria Drive, Suite 450, Cincinnati, OH 45246.
Independent Trustees *
| Name, Address, Year of Birth | Position(s) Held with Registrant | Term and Length Served | Principal Occupation(s) During Past 5 Years | Number of Portfolios Overseen In The Fund Complex** | Other Directorships Held During Past 5 Years |
| Mark Garbin Year of Birth: 1951 | Trustee | Indefinite, Since 2012 | Managing Principal, Coherent Capital Management LLC (since 2008), Independent Director, OCHEE LP (2021-present) | 2 | Northern Lights Fund Trust (since 2013); Northern Lights Variable Trust (since 2013); Forethought Variable Insurance Trust (since 2013); iCapital KKR Private Markets Fund (since 2014); Carlyle Tactical Private Credit Fund (since March 2018) and OHA CLO Enhanced Equity II Genpar LLP (since 2021) |
| Mark D. Gersten Year of Birth: 1950 | Chairman, Trustee | Indefinite, Since 2012 | Independent Consultant (since 2012); Senior Vice President – Global Fund Administration Mutual Funds & Alternative Funds, AllianceBernstein LP (1985 – 2011) | 2 | Northern Lights Fund Trust (since 2013); Northern Lights Variable Trust (since 2013); iCapital KKR Private Markets Fund (since 2014); previously, Ramius Archview Credit and Distressed Fund (2015-2017); and Schroder Global Series Trust (2012 to 2017) |
| Neil M. Kaufman Year of Birth: 1960 | Trustee, Audit Committee Chairman | Indefinite, Since 2012 | Managing Member, Kaufman McGowan PLLC (legal services)(Since 2016) | 2 | iCapital KKR Private Markets Fund (since 2014) |
| Anita K. Krug Year of Birth: 1969 | Trustee | Indefinite, Since 2012 | Dean and Professor (since 2019) of Chicago-Kent College of Law, Illinois Institute of Technology; Interim Vice Chancellor for Academic Affairs (2018-2019) University of Washington Bothell; Interim Dean (2017- 2018), Professor (2016-2019), Associate Professor (2014-2016); and Assistant Professor (2010-2014), University of Washington School of Law | 2 | iCapital KKR Private Markets Fund (since 2014); Centerstone Investors Trust (2016-2021) |
4/30/23 – Two Roads v1
40
Holbrook Funds
SUPPLEMENTAL INFORMATION (Unaudited)(Continued)
April 30, 2023
Officers of the Trust*
| Name, Address, Year of Birth | Position(s) Held with Registrant | Principal Occupation(s) During Past 5 Years | Number of Portfolios Overseen In The Fund Complex** | Other Directorships Held During Past 5 Years |
| James Colantino Year of Birth: 1969 | President Since Feb. 2017 Treasurer (2012 to 2017) | Senior Vice President (2012- present); Vice President (2004 to 2012); Ultimus Fund Solutions LLC | N/A | N/A |
| Laura Szalyga Year of Birth: 1978 | Treasurer Since Feb. 2017 | Vice President, Ultimus Fund Solutions LLC (since 2015); Assistant Vice President, Ultimus Fund Solutions LLC (2011-2014) | N/A | N/A |
| Timothy Burdick Year of Birth: 1986 | Vice President Since Aug. 2022 Secretary Since Aug. 2022 | Vice President and Managing Counsel, Ultimus Fund Solutions, LLC (2022 – present); Assistant Vice President and Counsel, Ultimus Fund Solutions, LLC (2019 – 2022); Senior Program Compliance Manager, CJ Affiliate (2016 – 2019). | N/A | N/A |
| William B. Kimme Year of Birth: 1962 | Chief Compliance Officer Since Inception | Senior Compliance Officer, Northern Lights Compliance Services, LLC (September 2011 - present) | N/A | N/A |
| * | Information is as of April 30, 2023. |
| ** | As of April 30, 2023, the Trust was comprised of 26 active portfolios managed by nine unaffiliated investment advisers and two affiliated investment advisers. The term “Fund Complex” applies only to those funds that (i) are advised by a common investment adviser or by an investment adviser that is an affiliated person of the investment adviser of any of the other funds in the Trust or (ii) hold themselves out to investors as related companies for purposes of investment and investor services. As of April 30, 2023, the Funds did not share the same investment adviser with any other series of the Trust or hold itself out as related to any other series of the Trust for investment purposes. |
The Funds Statement of Additional Information (“SAI”) includes additional information about the Trustees and is available free of charge, upon request, by calling toll-free at 1-877-345-8646.
4/30/23 – Two Roads v1
41
PRIVACY NOTICE
| FACTS | WHAT DOES TWO ROADS SHARED TRUST DO WITH YOUR PERSONAL INFORMATION |
| Why? | Financial companies choose how they share your personal information. |
| Federal law gives consumers the right to limit some but not all sharing. | |
| Federal law also requires us to tell you how we collect, share, and protect your personal information. Please read this notice carefully to understand what we do. | |
| What? | THE TYPES OF PERSONAL INFORMATION WE COLLECT AND SHARE DEPENDS ON THE PRODUCT OR SERVICE THAT YOU HAVE WITH US. THIS INFORMATION CAN INCLUDE: |
| ● Social Security number and income | |
| ● Account transactions and transaction history | |
| ● Investment experience and purchase history | |
| When you are no longer our customer, we continue to share your information as described in this notice. | |
| How? | All financial companies need to share customers’ personal information to run their everyday business. In the section below, we list the reasons financial companies can share their customers’ personal information; the reason Two Roads Shared Trust chooses to share and whether you can limit this sharing. |
| Reasons we can share your personal information | Does Two Roads Shared Trust share? | Can you limit this sharing? |
| For our everyday business purposes – | ||
| such as to process your transactions, maintain your account(s), respond to court orders and legal investigations, or report to credit bureaus | YES | NO |
| For our marketing purposes – | NO | We do not share |
| to offer our products and services to you | ||
| For joint marketing with other financial companies | NO | We do not share |
| For our affiliates’ everyday business purposes – | NO | We do not share |
| information about your transactions and experiences | ||
| For our affiliates’ everyday business purposes – | NO | We do not share |
| information about your creditworthiness | ||
| For our affiliates to market to you | NO | We do not share |
| For nonaffiliates to market to you | NO | We do not share |
| Questions? | Call 1-631-490-4300 |
42
What we do
| How does Two Roads Shared Trust protect my personal information? | To protect your personal information from unauthorized access and use, we use security measures that comply with federal law. These measures include computer safeguards and secured files and buildings. |
| Our service providers are held accountable for adhering to strict policies and procedures to prevent any misuse of your nonpublic personal information. | |
| How does Two Roads Shared Trust | We collect your personal information, for example, when you |
| collect my personal information? | |
| ● open an account or give us contact information | |
| ● provide account information or give us your income information | |
| ● make deposits or withdrawals from your account | |
| We also collect your personal information from other companies. | |
| Why can’t I limit all sharing? | Federal law gives you the right to limit only |
| ● sharing for affiliates’ everyday business purposes – information about your creditworthiness | |
| ● affiliates from using your information to market to you | |
| ● sharing for nonaffiliates to market to you | |
| State laws and individual companies may give you additional rights to limit sharing | |
| Definitions | |
| Affiliates | Companies related by common ownership or control. They can be financial and nonfinancial companies. |
| ● Two Roads Shared Trust has no affiliates. | |
| Nonaffiliates | Companies not related by common ownership or control. They can be financial and nonfinancial companies. |
| ● Two Roads Shared Trust does not share with nonaffiliates so they can market to you. | |
| Joint marketing | A formal agreement between nonaffiliates financial companies that together market financial products or services to you. |
| ● Two Roads Shared Trust does not jointly market. |
43
Proxy Voting Policy
Information regarding how the Funds votes proxies relating to portfolio securities for the 12 month period ended June 30th as well as a description of the policies and procedures that the Funds used to determine how to vote proxies is available without charge, upon request, by calling 1-877-345-8646 or by referring to the Securities and Exchange Commission’s (“SEC”) website at http://www.sec.gov.
Portfolio Holdings
Each Fund files its complete schedule of portfolio holdings with the SEC for the first and third quarters of each fiscal year on Form N-PORT. Form N-PORT is available on the SEC’s website at http://www.sec.gov. The information on Form N-PORT is available without charge, upon request, by calling 1-877-345-8646.
This report and the financial statements contained herein are submitted for the general information of shareholders and are not authorized for distribution to prospective investors unless preceded or accompanied by an effective prospectus, which contains information about the Funds’ investment objective, risks, fees and expenses. Investors are reminded to read the prospectus carefully before investing in the Fund.
| Investment Advisor |
| Holbrook Holdings Inc |
| 3225 Cumberland Blvd SE, Suite 100 |
| Atlanta, GA 30082 |
| Administrator |
| Ultimus Fund Solutions, LLC |
| 225 Pictoria Drive, Suite 450 |
| Cincinnati, OH 45246 |
| Holbrook-AR23 |
ITEM 2. CODE OF ETHICS.
| (a) | The registrant has, as of the end of the period covered by this report, adopted a code of ethics that applies to the registrant's principal executive officer, principal financial officer, and principal accounting officer or controller, or persons performing similar functions, regardless of whether these individuals are employed by the registrant or a third party. |
(b) N/A
| (c) | During the period covered by this report, there were no amendments to any provision of the code of ethics. |
| (d) | During the period covered by this report, there were no waivers or implicit waivers of a provision of the code of ethics. |
ITEM 3. AUDIT COMMITTEE FINANCIAL EXPERT.
| The registrant’s board of trustees has determined that Mark Gersten is an audit committee financial expert, as defined in Item 3 of Form N-CSR. Mr. Gersten is independent for purposes of this Item 3. |
ITEM 4. PRINCIPAL ACCOUNTANT FEES AND SERVICES.
| (a) | Audit Fees. The aggregate fees billed for each of the last two fiscal years for professional services rendered by the registrant's principal accountant for the audit of the registrant's annual financial statements or services that are normally provided by the accountant in connection with statutory and regulatory filings or engagements for those fiscal years are as follows:
|
| Trust Series | 2023 | 2022 |
| Holbrook Income Fund | 16,500 | 16,500 |
| Holbrook Structured Income Fund | 16,500 | N/A |
| (b) | Audit-Related Fees. There were no fees billed in each of the last two fiscal years for assurances and related services by the principal accountant that are reasonably related to the performance of the audit of the registrant’s financial statements and are not reported under paragraph (a) of this item. |
| (c) | Tax Fees. The aggregate fees billed in each of the last two fiscal years for professional services rendered by the principal accountant for tax compliance are as follows: |
| Trust Series | 2023 | 2022 |
| Holbrook Income Fund | 3,200 | 3,200 |
| Holbrook Structured Income Fund | 3,200 | N/A |
| (d) | All Other Fees. There were no fees billed in each of the last two fiscal years for products and services provided by the registrant’s principal accountant, other than the services reported in paragraphs (a) through (c) of this Item. |
| (e)(1) | The audit committee does not have pre-approval policies and procedures. Instead, the audit committee or audit committee chairman approves on a case-by-case basis each audit or non-audit service before the principal accountant is engaged by the registrant. |
| (e)(2) | There were no services described in each of paragraphs (b) through (d) of this Item that were approved by the audit committee pursuant to paragraph (c)(7)(i)(C) of Rule 2-01 of Regulation S-X. |
| (f) | Not applicable. The percentage of hours expended on the principal accountant's engagement to audit the registrant's financial statements for the most recent fiscal year that were attributed to work performed by persons other than the principal accountant's full-time, permanent employees was zero percent (0%). |
| (g) | All non-audit fees billed by the registrant's principal accountant for services rendered to the registrant for each of the last two fiscal years are disclosed in (b)-(d) above. There were no audit or non-audit services performed by the registrant's principal accountant for the registrant's adviser. |
| (h) | Not applicable. |
(i) (j) | Not applicable. Not applicable. |
ITEM 5. AUDIT COMMITTEE OF LISTED REGISTRANTS. Not applicable to open-end management investment companies.
ITEM 6. INVESTMENTS. - Schedule of investments in securities of unaffiliated issuers is included under Item 1.
ITEM 7. DISCLOSURE OF PROXY VOTING POLICIES AND PROCEDURES FOR CLOSED-END MANAGEMENT INVESTMENT COMPANIES.
Not applicable to open-end management investment companies.
ITEM 8. PORTFOLIO MANAGERS OF CLOSED-END MANAGEMENT INVESTMENT COMPANIES
Not applicable to open-end management investment companies.
ITEM 9. PURCHASES OF EQUITY SECURITIES BY CLOSED-END MANAGEMENT INVESTMENT COMPANY AND AFFILIATED PURCHASERS.
Not applicable to open-end management investment companies.
ITEM 10. SUBMISSION OF MATTERS TO A VOTE OF SECURITY HOLDERS.
Not applicable at this time.
ITEM 11. CONTROLS AND PROCEDURES.
| (a) | Based on an evaluation of the registrant’s disclosure controls and procedures (as defined in Rule 30a-3(c) under the 1940 Act, as of a date within 90 days of the filing date of this Form N-CSR, the principal executive officer and principal financial officer of the registrant have concluded that the disclosure controls and procedures of the registrant are reasonably designed to ensure that the information required in filings on Form N-CSR is recorded, processed, summarized, and reported by the filing date, including that information required to be disclosed is accumulated and communicated to the registrant’s management, including the registrant’s principal executive officer and principal financial officer, as appropriate to allow timely decisions regarding required disclosure. |
| (b) | There were no changes in the registrant’s internal control over financial reporting (as defined in Rule 30a-3(d) under the 1940 Act) that occurred during the period covered by this report that have materially affected, or are reasonably likely to materially affect, the registrant’s internal control over financial reporting. |
ITEM 12. DISCLOSURE OF SECURITIES LENDING ACTIVITIES FOR CLOSED-END MANAGEMENT INVESTMENT COMPANIES
Not applicable to open-end management investment companies.
ITEM 13. EXHIBITS
(a)(1) Code of Ethics for Principal Executive and Senior Financial Officers is attached hereto.
SIGNATURES
Pursuant to the requirements of the Securities Exchange Act of 1934 and the Investment Company Act of 1940, the registrant has duly caused this report to be signed on its behalf by the undersigned, thereunto duly authorized.
Two Roads Shared Trust
| By James Colantino | /s/ James Colantino |
| Principal Executive Officer/President | |
| Date: July 5, 2023 | |
Pursuant to the requirements of the Securities Exchange Act of 1934 and the Investment Company Act of 1940, this report has been signed below by the following person on behalf of the registrant and in the capacities and on the date indicated.
| By Laura Szalyga | /s/ Laura Szalyga |
| Principal Financial Officer/Treasurer | |
| Date: July 5, 2023 | |