UNITED STATES
SECURITIES AND EXCHANGE COMMISSION
Washington, D.C. 20549
FORM N-CSR
Certified Shareholder Report of
Registered Management Investment Companies
Investment Company Act File Number: 811-22744
American Funds Corporate Bond Fund
(Exact Name of Registrant as Specified in Charter)
6455 Irvine Center Drive
Irvine, California 92618
(Address of Principal Executive Offices)
Registrant's telephone number, including area code: (213) 486-9200
Date of fiscal year end: May 31
Date of reporting period: May 31, 2017
Steven I. Koszalka
American Funds Corporate Bond Fund
333 South Hope Street
Los Angeles, California 90071
(Name and Address of Agent for Service)
ITEM 1 – Reports to Stockholders
                                                    American Funds
                                                    Corporate Bond Fund(R)
                                                    Annual report
                                                    for the year ended
                                                    May 31, 2017

                   -------------------------------------------
                     We believe high-
                     conviction investing
                     and diverse
                     perspectives lead
                     to better results.
                   -------------------------------------------


American Funds Corporate Bond Fund seeks to provide maximum total return
consistent with capital preservation and prudent risk management.

This fund is one of more than 40 offered by one of the nation's largest mutual
fund families, American Funds, from Capital Group. For more than 85 years,
Capital has invested with a long-term focus based on thorough research and
attention to risk.
Fund results shown in this report, unless otherwise indicated, are for Class A
shares at net asset value. If a sales charge (maximum 3.75%) had been deducted,
the results would have been lower. Results are for past periods and are not
predictive of results for future periods. Current and future results may be
lower or higher than those shown. Share prices and returns will vary, so
investors may lose money. Investing for short periods makes losses more likely.
Investments are not FDIC-insured, nor are they deposits of or guaranteed by a
bank or any other entity, so they may lose value. For current information and
month-end results, visit americanfunds.com.
Here are total returns on a $1,000 investment with all distributions reinvested
for periods ended June 30, 2017 (the most recent calendar quarter-end):
Average annual
total return
Cumulative ----------------
total return
------------ Lifetime
Class A shares 1 year (since 12/14/12)
--------------------------------------------------------------------
Reflecting 3.75% maximum sales charge -2.14% 3.07%
The total annual fund operating expense ratio is 0.91% for Class A shares as of
the prospectus dated August 1, 2017. The net expense ratio is 0.87% (unaudited).
Investment results assume all distributions are reinvested and reflect
applicable fees and expenses. The investment adviser is currently reimbursing a
portion of other expenses. This reimbursement will be in effect through at
least August 1, 2018. After that time, the adviser may elect at its discretion
to extend, modify or terminate the reimbursement. Investment results and the
net expense ratio shown reflect the reimbursement, without which the results
would have been lower and the expenses would have been higher. Refer to the
fund's most recent prospectus for details. Visit americanfunds.com for more
information.
Although the fund has plans of distribution, fees for distribution services are
not paid by the fund on amounts invested in the fund by the fund's investment
adviser. Expenses shown assume fees for distribution services were charged on
these assets. However, because fees for distribution services were not charged
on these assets, actual fund expenses were lower and total return was higher.
See the "Plan of distribution" section of the prospectus for information on the
distribution service fees permitted to be charged by the fund.
The fund's 30-day yield for Class A shares as of June 30, 2017, reflecting the
3.75% maximum sales charge and calculated in accordance with the U.S.
Securities and Exchange Commission formula, was 2.18% (2.00% without the
reimbursement).
The return of principal for bond funds and for funds with significant
underlying bond holdings is not guaranteed. Fund shares are subject to the same
interest rate, inflation and credit risks associated with the underlying bond
holdings. Investing in bonds issued outside the U.S. may be subject to
additional risks. They include currency fluctuations, political and social
instability, differing securities regulations and accounting standards, higher
transaction costs, possible changes in taxation, illiquidity and price
volatility. These risks may be heightened in connection with investments in
developing countries. Refer to the fund prospectus and the Risk Factors section
of this report for more information on these and other risks associated with
investing in the fund.
Contents
1 Letter to investors
3 The value of a $10,000 investment
4 Summary investment portfolio
8 Financial statements
34 Board of trustees and other officers
Fellow investors:
We are pleased to present you with the annual report for American Funds
Corporate Bond Fund.
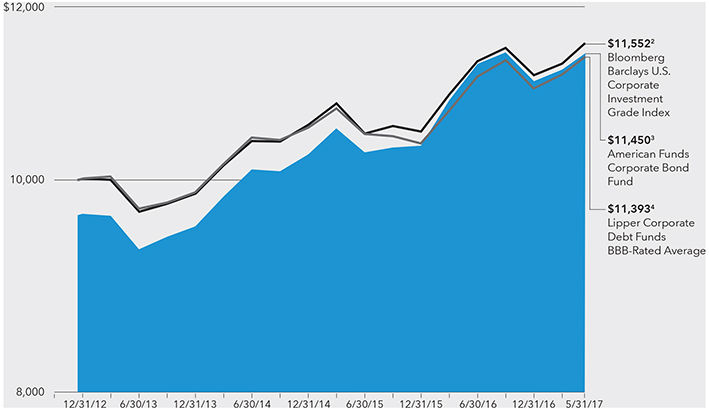
For the 12-month period ended May 31, 2017, the fund advanced 3.90%, with all
dividends reinvested. By way of comparison, the Bloomberg Barclays U.S.
Corporate Investment Grade Index rose 4.26%, while the fund's peer group, as
measured by the Lipper Corporate Debt Funds BBB-Rated Average, gained 4.16%.
During this time the fund generated dividends totaling about 23 cents a share,
providing investors who reinvested dividends with an income return of 2.26%.
The fund also paid a capital gain distribution of 11 cents a share.
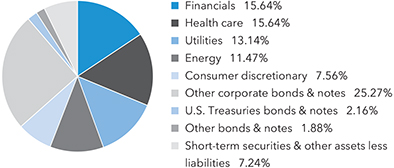
At the end of the period, the fund's corporate holdings - representing about
89% of the portfolio - were spread among a variety of sectors. Bonds in the
financials sector made up nearly 16% of the portfolio, just slightly more than
investments in the health care sector. Those were followed by utilities at
approximately 13% and energy at about 11%. Roughly 4% of the portfolio was
invested in government securities, primarily U.S. Treasury notes. A summary
list of fund holdings can be found beginning on page 4.
About 74% of the fund consisted of U.S. securities, with the rest chiefly
invested in bonds from Germany, the U.K. and Canada.
Corporate bonds navigate an uncertain environment
From practically start to finish of the period, geopolitical and macroeconomic
issues affected markets around the world. Investors have been confronted with
the British vote to leave the European Union, the election of President Trump
in the U.S., a contentious election in France and uncertainty about global
economic growth. In addition, the U.S. Federal Reserve was entering a period of
interest-rate increases.
In such an environment, the fund took slightly less credit risk than the index
when selecting issuers of the securities in which it invests. Indeed, corporate
bonds, and other types of fixed-income investments, declined in the wake of the
U.S. election. The decline was partly due to investor expectations for
administration fiscal stimulus, such as reductions in personal and corporate
taxes and regulations, that could increase growth, inflationary pressures and
interest rates.
But corporate bonds spent much of the second half of the period in positive
territory, as demand remained relatively strong and the sector continued to
appear fairly stable. Earlier in the period, some of that demand was due to the
Federal Reserve's decision to hold its key short-term rate steady, which helped
increase investors' appetite for corporate bonds.
--------------------------------------------------------------------------------
Results at a glance
For periods ended May 31, 2017, with all distributions reinvested
Average annual total
returns
Cumulative -----------------------
total returns
-------------- Lifetime
6 months 1 year 3 years (since 12/14/12)
--------------------------------------------------------------------------------------
American Funds Corporate Bond Fund
(Class A shares) 4.06% 3.90% 4.34% 3.97%
--------------------------------------------------------------------------------------
Bloomberg Barclays U.S. Corporate
Investment Grade Index* 4.17 4.26 3.53 3.29
--------------------------------------------------------------------------------------
Lipper Corporate Debt Funds BBB-Rated
Average+ 4.07 4.16 3.08 2.95
--------------------------------------------------------------------------------------
Lipper Corporate Debt Funds A-Rated Average+ 3.53 3.12 2.92 2.62
--------------------------------------------------------------------------------------
* Source: Bloomberg Index Services Ltd. The market index is unmanaged and,
therefore, has no expenses. Investors cannot invest directly in an index.
+ Source: Thomson Reuters Upper. Upper averages reflect the current composition
of all eligible mutual funds (all share classes) within a given category.
--------------------------------------------------------------------------------
Since the fund's inception through July 29, 2016, certain fees, such as 12b-1
fees, were not charged on Class A shares. If these expenses had been deducted,
results would have been lower.
American Funds Corporate Bond Fund 1
Even after the Fed raised rates in December and March, citing low unemployment
and healthy financial conditions, the yield on Treasuries remained relatively
low. That contributed to the continued demand for corporate debt, pushing down
the yield on investment- grade bonds (rated BBB/Baa and above). As a result,
near the end of the period, the "spread," or difference between yields offered
by U.S. corporate debt and Treasuries, was the lowest since 2014.
Inside the fund
Issuance of U.S. investment-grade corporate bonds remained robust during the
period, as companies continued to take advantage of low-cost financing. Total
issuance reached nearly $1.3 trillion for the 12-month period ended May 31.
One notable deal late in the period involved QUALCOMM's $11 billion offering.
The maker of digital wireless communications equipment will use the proceeds to
help finance its $47 billion purchase of NXP Semiconductors. In one of the
largest deals during the fund's reporting period, Microsoft raised $19.75
billion to fund part of its $26 billion purchase of Linkedln. Microsoft
contributed to the fund during the period. The fund's holdings in the
technology sector are based partly on the expectation that technology companies
will be significant participants in the debt market, in some cases growing
through acquisition of other companies.
A variety of issuers in the fund's top two sectors, financials and health care,
contributed to the fund. Among financials, the fund's investments in the
banking industry were one of the period's top contributors relative to the
index. The fund also benefited from some European bank bonds that were
purchased at relatively attractive valuations amid the uncertainty leading up
to the French election. When the outcome of the election reassured markets and
resulted in a rally, holdings among some of those institutions were pared back.
Our position in the health care sector is partly the result of finding
companies that we believe have the ability to generate cash and the intention
to reduce debt levels.
Bonds from such issuers have the potential to rise in value as companies pay
down debt. One notable issuance in the health care sector came from U.S.
medical device maker Abbott Laboratories, which issued $15.1 billion in bonds,
one of the period's largest offerings. The company intends to use the proceeds
to fund its $25 billion acquisition of St. Jude Medical Inc.
The fund also benefited from debt issued by companies in the energy sector. On
an absolute basis, our investments in Enbridge Energy Partners, Williams
Partners LP and Kinder Morgan all contributed to the fund. The fund's
investments among issuers in the oil, gas and consumable fuels industry helped
the fund outpace the index in that area.
The fund's allocation in some sectors lagged the returns of the index,
particularly the fund's position in U.S. Treasuries, which was larger than the
benchmark. Treasuries lost value during the post-election downturn, and our
position there detracted from relative returns. The fund reduced its position
in Treasuries during the period. Conversely, the fund benefited from an
underweight position in banks, which helped to offset the negative
contributions of the Treasuries allocation.
Looking ahead
The year covered by this report has been a period of intense political
volatility and uncertainty about the global economy. Nevertheless, recent
economic data has been relatively positive and it's possible we are entering a
new phase of higher, synchronized global growth. In the U.S., the Institute for
Supply Management surveys reveal a brighter outlook among both manufacturing
and service companies. Industrial sector measures have similarly risen in
Europe and Japan. Consumer sentiment has also improved and reached multiyear
highs.
While the macroeconomic and geopolitical issues are likely to make the
investment environment challenging, we continue to find opportunities to invest
in corporate bonds we believe have the potential to reward investors over the
long run.
American Funds Corporate Bond Fund seeks to achieve its investment objective by
investing primarily in investment-grade corporate debt securities. During the
period, exposure to corporate bonds proved to be a judicious strategy to
generate income and pursue total return while also aiming for capital
preservation.
In an environment of low to negative yields, investment-grade corporate bonds
can provide meaningful yield with relatively modest risk. Such bonds can also
provide relative stability, as well as diversification from equities. Recently,
corporate bonds have benefited from a high volume of issuance and now
constitute a broad investment universe, allowing managers to build broadly
diversified, robust portfolios.
The fund's focus on investment-grade corporate bonds provides investors with
dedicated exposure to the asset class. By pursuing total return and U.S.-dollar
denominated investment-grade credit, the fund can serve as a durable portfolio
building block.
Corporate bond investing in today's market requires deep credit research. Our
managers rely on rigorous research that seeks to determine which industry,
company or security mix in an expected economic environment will provide the
outcome that helps investors pursue their financial objectives.
We thank you for making American Funds Corporate Bond Fund part of your
portfolio and look forward to reporting to you again in six months.
Cordially,
 David S. Lee
President
July 17, 2017
For current information about the fund, visit americanfunds.com.
2 American Funds Corporate Bond Fund
David S. Lee
President
July 17, 2017
For current information about the fund, visit americanfunds.com.
2 American Funds Corporate Bond Fund
The value of a $10,000 investment
How a $10,000 investment has fared for the period December 14, 2012, to May 31,
2017, with all distributions reinvested.
Fund results shown reflect deduction of the maximum sales charge of 3.75% on
the $10,000 investment./1/ Thus, the net amount invested was $9,625.
 /1/As outlined in the prospectus, the sales charge is reduced for
accounts (and aggregated investments) of $100,000 or more and is
eliminated for purchases of $1 million or more. There is no sales
charge on dividends or capital gain distributions that are
reinvested in additional shares.
/2/Source: Bloomberg Index Services Ltd. The Bloomberg Barclays
U.S. Corporate Investment Grade Index is unmanaged and, therefore,
has no expenses. Investors cannot invest directly in an index.
/3/Includes reinvested dividends of $1,146 and reinvested capital
gain distributions of $319.
/4/Source: Thomson Reuters Lipper. Results of the Lipper Corporate
Debt Funds BBB-Rated Average do not reflect any sales charges.
Past results are not predictive of results for future periods. The
results shown are before taxes on fund distributions and sale of
fund shares.
Total returns based on a $1,000 investment (for the period ended May 31, 2017)*
Average annual
total return
Cumulative ----------------
total return
------------ Lifetime
1 year (since 12/14/12)
---------------------------------------------
Class A shares 0.01% 3.08%
* Assumes reinvestment of all distributions and payment of the maximum 3.75%
sales charge.
Investment results assume all distributions are reinvested and reflect
applicable fees and expenses. The investment adviser is currently reimbursing a
portion of other expenses. This reimbursement will be in effect through at
least August 1, 2018. After that time, the adviser may elect at its discretion
to extend, modify or terminate the reimbursement. Investment results shown
reflect the reimbursement, without which the results would have been lower.
Refer to the fund's most recent prospectus for details. Visit americanfunds.com
for more information.
Although the fund has plans of distribution for Class A shares, fees for
distribution services are not paid by the fund on amounts invested in the fund
by the fund's investment adviser. Because fees for distribution services were
not charged on these assets, total returns were higher. See the "Plans of
distribution" section of the prospectus for information on the distribution
service fees permitted to be charged by the fund.
American Funds Corporate Bond Fund 3
/1/As outlined in the prospectus, the sales charge is reduced for
accounts (and aggregated investments) of $100,000 or more and is
eliminated for purchases of $1 million or more. There is no sales
charge on dividends or capital gain distributions that are
reinvested in additional shares.
/2/Source: Bloomberg Index Services Ltd. The Bloomberg Barclays
U.S. Corporate Investment Grade Index is unmanaged and, therefore,
has no expenses. Investors cannot invest directly in an index.
/3/Includes reinvested dividends of $1,146 and reinvested capital
gain distributions of $319.
/4/Source: Thomson Reuters Lipper. Results of the Lipper Corporate
Debt Funds BBB-Rated Average do not reflect any sales charges.
Past results are not predictive of results for future periods. The
results shown are before taxes on fund distributions and sale of
fund shares.
Total returns based on a $1,000 investment (for the period ended May 31, 2017)*
Average annual
total return
Cumulative ----------------
total return
------------ Lifetime
1 year (since 12/14/12)
---------------------------------------------
Class A shares 0.01% 3.08%
* Assumes reinvestment of all distributions and payment of the maximum 3.75%
sales charge.
Investment results assume all distributions are reinvested and reflect
applicable fees and expenses. The investment adviser is currently reimbursing a
portion of other expenses. This reimbursement will be in effect through at
least August 1, 2018. After that time, the adviser may elect at its discretion
to extend, modify or terminate the reimbursement. Investment results shown
reflect the reimbursement, without which the results would have been lower.
Refer to the fund's most recent prospectus for details. Visit americanfunds.com
for more information.
Although the fund has plans of distribution for Class A shares, fees for
distribution services are not paid by the fund on amounts invested in the fund
by the fund's investment adviser. Because fees for distribution services were
not charged on these assets, total returns were higher. See the "Plans of
distribution" section of the prospectus for information on the distribution
service fees permitted to be charged by the fund.
American Funds Corporate Bond Fund 3
Summary investment portfolio May 31, 2017
--------------------------------------------------------------------------------
Industry sector diversification Percent of net assets
--------------------------------------------------------------------------------
 Portfolio quality summary* Percent of net assets
--------------------------------------------------------------------------------
U.S. Treasury and agency+ 2.16%
AAA/Aaa 2.11
AA/Aa 11.65
A/A 34.52
BBB/Baa 42.32
Short-term securities & other assets less liabilities 7.24
Portfolio quality summary* Percent of net assets
--------------------------------------------------------------------------------
U.S. Treasury and agency+ 2.16%
AAA/Aaa 2.11
AA/Aa 11.65
A/A 34.52
BBB/Baa 42.32
Short-term securities & other assets less liabilities 7.24
* Bond ratings, which typically range from AAA/Aaa (highest) to D (lowest), are
assigned by credit rating agencies such as Standard & Poor's, Moody's and/or
Fitch as an indication of an issuer's creditworthiness. In assigning a credit
rating to a security, the fund looks specifically to the ratings assigned to
the issuer of the security by Standard & Poor's, Moody's and/or Fitch. If
agency ratings differ, the security will be considered to have received the
highest of those ratings, consistent with the fund's investment policies. The
ratings are not covered by the Report of Independent Registered Public
Accounting Firm.
+These securities are guaranteed by the full faith and credit of the U.S.
government.
Principal amount Value
Bonds, notes & other debt instruments 92.76% (000) (000)
-------------------------------------------------------------------------------------------------
Corporate bonds & notes 88.72%
-------------------------------------------------------------------------------------------------
Financials Bank of Nova Scotia 2.70% 2022 $1,500 $ 1,517
15.64% Citigroup Inc. 3.20% 2026 1,675 1,630
Goldman Sachs Group, Inc. 2.908% 2023 1,750 1,750
Goldman Sachs Group, Inc. 3.50%-3.75% 2025-2028 2,036 2,034
Morgan Stanley, (3-month USD-LIBOR + 1.22%) 2.373% 2024/1/ 2,725 2,738
Morgan Stanley 3.625% 2027 1,352 1,365
Royal Bank of Canada 2.125% 2020 1,500 1,505
UniCredit SPA 4.625% 2027/2/ 1,575 1,611
Wells Fargo & Co. 3.584% 2028 1,575 1,595
Other securities 22,653
-------
38,398
-------
-------------------------------------------------------------------------------------------------
Health care Abbott Laboratories 2.90% 2021 1,535 1,560
15.64% Abbott Laboratories 3.75% 2026 1,930 1,972
Abbott Laboratories 3.40%-4.90% 2023-2046 1,750 1,816
AbbVie Inc. 3.20% 2026 1,900 1,879
AbbVie Inc. 2.30%-4.45% 2020-2046 2,625 2,629
Allergan PLC 3.80% 2025 2,475 2,559
Allergan PLC 2.35%-4.75% 2018-2045 713 740
Amgen Inc. 2.65% 2022 1,425 1,434
Becton, Dickinson and Co. 3.363% 2024 2,325 2,336
Becton, Dickinson and Co. 3.70% 2027 2,900 2,905
Becton, Dickinson and Co. 2.68%-4.67% 2019-2047 454 458
Shire PLC 2.40% 2021 1,400 1,392
Shire PLC 2.875% 2023 2,220 2,204
Shire PLC 3.20% 2026 605 592
4 American Funds Corporate Bond Fund
Principal amount Value
(000) (000)
----------------------------------------------------------------------------------------------------------------
Teva Pharmaceutical Finance Company BV 3.15% 2026 $1,815 $ 1,708
Teva Pharmaceutical Finance Company BV 2.20%-4.10% 2021-2046 2,265 2,138
Other securities 10,065
-------
38,387
-------
----------------------------------------------------------------------------------------------------------------
Utilities CMS Energy Corp. 2.95%-5.05% 2022-2027 2,475 2,561
13.14% Commonwealth Edison Company 2.55% 2026 75 73
Dominion Resources, Inc. 1.88%-2.75% 2018-2022/2/ 2,180 2,200
Exelon Corp. 3.497% 2022 3,325 3,408
FirstEnergy Corp. 7.375% 2031 1,050 1,404
Great Plains Energy Inc. 4.85% 2047 2,762 2,850
Public Service Enterprise Group Inc. 2.00% 2021 1,500 1,465
State Grid Overseas Investment Ltd. 3.50% 2027/2/ 1,570 1,576
Virginia Electric and Power Co. 2.95% 2026 1,000 994
Other securities 15,719
-------
32,250
-------
----------------------------------------------------------------------------------------------------------------
Energy Cenovus Energy Inc. 4.25% 2027/2/ 1,910 1,905
11.47% Chevron Corp. 1.56%-2.95% 2019-2026 3,985 4,002
Enbridge Energy Partners, LP 7.375% 2045 1,190 1,563
Other securities 20,686
-------
28,156
-------
----------------------------------------------------------------------------------------------------------------
Consumer Daimler Finance NA LLC 2.70% 2020/2/ 250 253
discretionary DaimlerChrysler North America Holding Corp. 2.85% 2022/2/ 1,350 1,373
7.56% DaimlerChrysler North America Holding Corp. 1.50%-2.25% 2019-2021/2/ 1,375 1,363
Ford Motor Co. 5.291% 2046 1,425 1,430
Other securities 14,133
-------
18,552
-------
----------------------------------------------------------------------------------------------------------------
Consumer staples Anheuser-Busch InBev NV 3.65% 2026 3,090 3,184
7.48% Anheuser-Busch InBev NV 2.50%-4.90% 2021-2046 675 686
Coca-Cola Co. 2.20% 2022 1,475 1,477
Costco Wholesale Corp. 2.75% 2024 1,550 1,558
Molson Coors Brewing Co. 2.25% 2020/2/ 1,525 1,531
PepsiCo, Inc. 2.25% 2022 1,650 1,653
Other securities 8,258
-------
18,347
-------
----------------------------------------------------------------------------------------------------------------
Real estate American Campus Communities, Inc. 3.75% 2023 1,350 1,403
5.26% Kimco Realty Corp. 3.40% 2022 1,540 1,583
Scentre Group 3.75% 2027/2/ 1,425 1,451
WEA Finance LLC 2.70%-4.75% 2019-2044/2/ 1,590 1,608
Westfield Corp. Ltd. 3.15% 2022/2/ 1,885 1,912
Other securities 4,952
-------
12,909
-------
----------------------------------------------------------------------------------------------------------------
Information Broadcom Ltd. 3.00% 2022/2/ 1,800 1,816
technology Broadcom Ltd. 3.625% 2024/2/ 475 484
4.90% Broadcom Ltd. 3.875% 2027/2/ 2,325 2,364
Cisco Systems, Inc. 1.85% 2021 1,700 1,684
Other securities 5,676
-------
12,024
-------
----------------------------------------------------------------------------------------------------------------
Industrials Siemens AG 2.70% 2022/2/ 2,000 2,040
3.76% Siemens AG 1.30%-2.00% 2019-2023/2/ 1,000 977
Other securities 6,207
-------
9,224
-------
American Funds Corporate Bond Fund 5
Principal amount Value
Bonds, notes & other debt instruments (continued) (000) (000)
-----------------------------------------------------------------------------------------------------------------
Corporate bonds & notes (continued)
-----------------------------------------------------------------------------------------------------------------
Telecommunication AT&T Inc. 5.45% 2047 $1,300 $ 1,378
services AT&T Inc. 4.25%-5.25% 2027-2037 1,098 1,136
2.39% Deutsche Telekom International Finance BV 2.82% 2022/2/ 1,575 1,592
Other securities 1,769
--------
5,875
--------
-----------------------------------------------------------------------------------------------------------------
Materials Other securities 3,637
--------
1.48% Total corporate bonds & notes 217,759
--------
U.S. Treasury bonds & notes 2.16%
-----------------------------------------------------------------------------------------------------------------
U.S. Treasury U.S. Treasury Inflation-Protected Security 0.625% 2026/3,4/ 1,565 1,600
inflation-protected U.S. Treasury Inflation-Protected Security 0.375% 2027/4/ 1,262 1,261
--------
securities 2,861
--------
1.16%
-----------------------------------------------------------------------------------------------------------------
U.S. Treasury U.S. Treasury 1.75% 2022 2,004 2,004
1.00% U.S. Treasury 1.13%-3.00% 2019-2047 438 441
--------
2,445
--------
Total U.S. Treasury bonds & notes 5,306
--------
Other bonds & notes 1.88%
-----------------------------------------------------------------------------------------------------------------
Other securities 4,624
--------
Total bonds, notes & other debt instruments (cost: $224,128,000) 227,689
--------
Short-term securities 9.33%
-----------------------------------------------------------------------------------------------------------------
BASF SE 0.89% due 6/6/2017/2/ 5,000 4,999
Colgate-Palmolive Co. 0.83% due 6/2/2017/2/ 3,300 3,300
Federal Home Loan Bank 0.91% due 7/19/2017 2,000 1,998
General Electric Co. 0.82% due 6/1/2017 5,600 5,600
Paccar Financial Corp. 0.88% due 6/30/2017 2,000 1,998
Wal-Mart Stores, Inc. 0.84% due 6/7/2017/2/ 5,000 4,999
--------
Total short-term securities (cost: $22,896,000) 22,894
--------
Total investment securities 102.09% (cost: $247,024,000) 250,583
Other assets less liabilities (2.09)% (5,140)
--------
Net assets 100.00% $245,443
========
This summary investment portfolio is designed to streamline the report and help
investors better focus on the fund's principal holdings. See the inside back
cover for details on how to obtain a complete schedule of portfolio holdings.
"Other securities" includes all issues that are not disclosed separately in the
summary investment portfolio.
6 American Funds Corporate Bond Fund
Futures contracts
--------------------------------------------------------------------------------
Unrealized
Notional Value at appreciation
Number of amount 5/31/2017 at 5/31/2017
Contracts Type contracts Expiration (000)/5/ (000)/6/ (000)
------------------------------------------------------------------------------------------------
5 Year U.S. Treasury Note Futures Long 47 October 2017 $4,700 $5,561 $10
Swap contracts
--------------------------------------------------------------------------------
Interest rate swaps
Unrealized
Upfront (depreciation)
Value at payments/ appreciation
Expiration Notional 5/31/2017 receipts at 5/31/2017
Receive Pay date (000) (000) (000) (000)
------------------------------------------------------------------------------------------------------
1.3555% 3-month USD-LIBOR 6/3/2021 $3,000 $(45) $- $ (45)
3-month USD-LIBOR 2.7945% 4/10/2024 1,500 (80) - (80)
3-month USD-LIBOR 2.396% 1/19/2046 500 4 - 4
--- -----
$- $(121)
=== =====
Credit default swaps
Centrally cleared credit default swaps on credit indices - sell protection
Unrealized
Value at appreciation
Receive/ Expiration Notional 5/31/2017 Upfront receipts at 5/31/2017
Payment frequency Pay date (000) (000) (000) (000)
--------------------------------------------------------------------------------------------------
1.00%/Quarterly CDX.NA.IG.28 6/20/2022 $7,500 $138 $113 $25
The following footnotes apply to either the individual securities noted or one
or more of the securities aggregated and listed as a single line item.
/1/ Coupon rate may change periodically.
/2/ Acquired in a transaction exempt from registration under Rule 144A or
Section 4(2) of the Securities Act of 1933. May be resold in the U.S. in
transactions exempt from registration, normally to qualified institutional
buyers. The total value of all such securities, including those in "Other
securities," was $64,504,000, which represented 26.28% of the net assets of
the fund.
/3/ All or a portion of this security was pledged as collateral. The total
value of pledged collateral was $285,000, which represented .12% of the net
assets of the fund.
/4/ Index-linked bond whose principal amount moves with a government price
index.
/5/ Notional amount is calculated based on the number of contracts and notional
contract size.
/6 /Value is calculated based on the notional amount and current market price.
Key to abbreviation
LIBOR = London Interbank Offered Rate
See Notes to Financial Statements
American Funds Corporate Bond Fund 7
Financial statements
Statement of assets and liabilities at May 31, 2017
-----------------------------------------------------------------------------------------------------
(dollars in thousands)
Assets:
Investment securities in unaffiliated issuers, at value (cost: $247,024) $250,583
Cash 92
Receivables for:
Sales of investments $ 3,217
Sales of fund's shares 3,164
Variation margin on futures contracts 2
Variation margin on swap contracts 3
Interest 1,560
Other 5 7,951
------- --------
258,626
Liabilities:
Payables for:
Purchases of investments 12,415
Repurchases of fund's shares 497
Dividends on fund's shares 107
Investment advisory services 89
Trustees' deferred compensation --*
Variation margin on swap contracts 2
Other 73 13,183
------- --------
Net assets at May 31, 2017 $245,443
========
Net assets consist of:
Capital paid in on shares of beneficial interest $242,702
Undistributed net investment income 19
Accumulated net realized loss (751)
Net unrealized appreciation 3,473
--------
Net assets at May 31, 2017 $245,443
========
--------------------------------------------------------------------------------
(dollars and shares in thousands, except per-share amounts)
Shares of beneficial interest issued and outstanding (no stated par value) -
unlimited shares authorized (23,769 total shares outstanding)
Shares Net asset value
Net assets outstanding per share
-------------------------------------------------------
Class A $211,328 20,465 $10.33
Class C 9,828 952 10.33
Class T 10 1 10.33
Class F-1 2,233 216 10.33
Class F-2 5,630 545 10.33
Class F-3 3,231 313 10.33
Class 529-A 6,448 625 10.33
Class 529-C 2,142 208 10.33
Class 529-E 617 60 10.33
Class 529-T 10 1 10.33
Class 529-F-1 767 74 10.33
Class R-1 65 6 10.33
Class R-2 1,096 106 10.33
Class R-2E 25 2 10.33
Class R-3 565 55 10.33
Class R-4 778 75 10.33
Class R-5E 25 2 10.33
Class R-5 111 11 10.33
Class R-6 534 52 10.33
* Amount less than one thousand.
See Notes to Financial Statements
8 American Funds Corporate Bond Fund
Statement of operations for the year ended May 31, 2017
---------------------------------------------------------------------------------------------------------------------
(dollars in thousands)
Investment income:
Income:
Interest $ 3,650
Fees and expenses*:
Investment advisory services $ 554
Distribution services 357
Transfer agent services 80
Administrative services 17
Reports to shareholders 27
Registration statement and prospectus 69
Trustees' compensation 1
Auditing and legal 93
Custodian --+
Other 17
--------
Total fees and expenses before reimbursements 1,215
Less other reimbursements 132
--------
Total fees and expenses after reimbursements 1,083
-------
Net investment income 2,567
-------
Net realized gain and unrealized appreciation:
Net realized gain on:
Investments in unaffiliated issuers 117
Futures contracts 94
Swap contracts 3 214
--------
Net unrealized appreciation on:
Investments in unaffiliated issuers 2,183
Futures contracts 10
Swap contracts 105 2,298
-------- -------
Net realized gain and unrealized appreciation 2,512
-------
Net increase in net assets resulting from operations $ 5,079
=======
*Additional information related to class-specific fees and expenses is included in the Notes to Financial Statements.
+ Amount less than one thousand.
Statements of changes in net assets
---------------------------------------------------------------------------------------------------------------------
(dollars in thousands)
Year ended May 31
2017 2016
---------------------
Operations:
Net investment income $ 2,567 $ 1,493
Net realized gain 214 118
Net unrealized appreciation 2,298 1,143
-------- -------
Net increase in net assets resulting from operations 5,079 2,754
-------- -------
Dividends and distributions paid or accrued to shareholders:
Dividends from net investment income (2,629) (1,455)
Distributions from net realized gain on investments (1,043) (975)
-------- -------
Total dividends and distributions paid or accrued to shareholders (3,672) (2,430)
-------- -------
Net capital share transactions 192,452 250
-------- -------
Total increase in net assets 193,859 574
Net assets:
Beginning of year 51,584 51,010
-------- -------
End of year (including undistributed net investment income: $19 and $25, respectively) $245,443 $51,584
======== =======
See Notes to Financial Statements
American Funds Corporate Bond Fund 9
Notes to financial statements
1. Organization
--------------------------------------------------------------------------------
American Funds Corporate Bond Fund (the "fund") is registered under the
Investment Company Act of 1940 as an open-end, diversified management
investment company. The fund seeks to provide maximum total return consistent
with capital preservation and prudent risk management.
The fund has 19 share classes consisting of six retail share classes (Classes
A, C, T, F-1, F-2 and F-3), five 529 college savings plan share classes
(Classes 529-A, 529-C, 529-E, 529-T and 529-F-1) and eight retirement plan
share classes (Classes R-1, R-2, R-2E, R-3, R-4, R-5E, R-5 and R-6). The 529
college savings plan share classes can be used to save for college education.
The retirement plan share classes are generally offered only through eligible
employer-sponsored retirement plans. The fund's share classes are described
further in the following table:
Contingent deferred sales
Share class Initial sales charge charge upon redemption Conversion feature
--------------------------------------------------------------------------------------------------------------------
Classes A and 529-A Up to 3.75% None (except 1% for certain None
redemptions within one year of
purchase without an initial sales
charge)
--------------------------------------------------------------------------------------------------------------------
Class C None 1% for redemptions Class C converts to Class F-1
within one year of purchase after 10 years
--------------------------------------------------------------------------------------------------------------------
Class 529-C None 1% for redemptions None
within one year of purchase
--------------------------------------------------------------------------------------------------------------------
Class 529-E None None None
--------------------------------------------------------------------------------------------------------------------
Classes T and 529-T* Up to 2.50% None None
--------------------------------------------------------------------------------------------------------------------
Classes F-1, F-2, F-3 and None None None
529-F-1
--------------------------------------------------------------------------------------------------------------------
Classes R-1, R-2, R-2E, None None None
R-3, R-4, R-5E, R-5 and R-
6
--------------------------------------------------------------------------------------------------------------------
*Class T and 529-T shares of the fund are not available for purchase.
Holders of all share classes have equal pro rata rights to the assets,
dividends and liquidation proceeds of the fund. Each share class has identical
voting rights, except for the exclusive right to vote on matters affecting only
its class. Share classes have different fees and expenses ("class-specific fees
and expenses"), primarily due to different arrangements for distribution,
transfer agent and administrative services. Differences in class-specific fees
and expenses will result in differences in net investment income and,
therefore, the payment of different per-share dividends by each share class.
2. Significant accounting policies
--------------------------------------------------------------------------------
The fund is an investment company that applies the accounting and reporting
guidance issued in Topic 946 by the U.S. Financial Accounting Standards Board.
The fund's financial statements have been prepared to comply with U.S.
generally accepted accounting principles ("U.S. GAAP"). These principles
require the fund's investment adviser to make estimates and assumptions that
affect reported amounts and disclosures. Actual results could differ from those
estimates. Subsequent events, if any, have been evaluated through the date of
issuance in the preparation of the financial statements. The fund follows the
significant accounting policies described in this section, as well as the
valuation policies described in the next section on valuation.
Security transactions and related investment income - Security transactions are
recorded by the fund as of the date the trades are executed with brokers.
Realized gains and losses from security transactions are determined based on
the specific identified cost of the securities. In the event a security is
purchased with a delayed payment date, the fund will segregate liquid assets
sufficient to meet its payment obligations. Interest income is recognized on an
accrual basis. Market discounts, premiums and original issue discounts on
fixed-income securities are amortized daily over the expected life of the
security.
Class allocations - Income, fees and expenses (other than class-specific fees
and expenses) are allocated daily among the various share classes based on the
relative value of their settled shares. Realized and unrealized gains and
losses are allocated daily among the various share classes based on their
relative net assets. Class-specific fees and expenses, such as distribution,
transfer agent and administrative services, are charged directly to the
respective share class.
Dividends and distributions to shareholders - Dividends to shareholders are
declared daily after the determination of the fund's net investment income and
are paid to shareholders monthly. Distributions to shareholders are recorded on
the ex-dividend date.
10 American Funds Corporate Bond Fund
3. Valuation
--------------------------------------------------------------------------------
Capital Research and Management Company ("CRMC"), the fund's investment
adviser, values the fund's investments at fair value as defined by U.S. GAAP.
The net asset value of each share class of the fund is generally determined as
of approximately 4:00 p.m. New York time each day the New York Stock Exchange
is open.
Methods and inputs - The fund's investment adviser uses the following methods
and inputs to establish the fair value of the fund's assets and liabilities.
Use of particular methods and inputs may vary over time based on availability
and relevance as market and economic conditions evolve.
Fixed-income securities, including short-term securities, are generally valued
at prices obtained from one or more pricing vendors. Vendors value such
securities based on one or more of the inputs described in the following table.
The table provides examples of inputs that are commonly relevant for valuing
particular classes of fixed-income securities in which the fund is authorized
to invest. However, these classifications are not exclusive, and any of the
inputs may be used to value any other class of fixed-income security.
Fixed-income class Examples of standard inputs
-----------------------------------------------------------------------------
All Benchmark yields, transactions, bids,
offers, quotations from dealers and
trading systems, new issues, spreads
and other relationships observed in
the markets among comparable
securities; and proprietary pricing
models such as yield measures
calculated using factors such as cash
flows, financial or collateral
performance and other reference data
(collectively referred to as
"standard inputs")
-----------------------------------------------------------------------------
Corporate bonds & notes; convertible Standard inputs and underlying equity
securities of the issuer
-----------------------------------------------------------------------------
Bonds & notes of governments & Standard inputs and interest rate
government agencies volatilities
-----------------------------------------------------------------------------
Mortgage-backed; asset-backed Standard inputs and cash flows,
obligations prepayment information, default
rates, delinquency and loss
assumptions, collateral
characteristics, credit enhancements
and specific deal information
-----------------------------------------------------------------------------
Municipal securities Standard inputs and, for certain
distressed securities, cash flows or
liquidation values using a net
present value calculation based on
inputs that include, but are not
limited to, financial statements and
debt contracts
-----------------------------------------------------------------------------
When the fund's investment adviser deems it appropriate to do so (such as when
vendor prices are unavailable or deemed to be not representative), fixed-income
securities will be valued in good faith at the mean quoted bid and ask prices
that are reasonably and timely available (or bid prices, if ask prices are not
available) or at prices for securities of comparable maturity, quality and type.
Exchange-traded futures are generally valued at the official settlement price
of, or the last reported sale price on, the exchange or market on which such
instruments are traded, as of the close of business on the day the futures are
being valued or, lacking any sales, at the last available bid price. Prices for
each future are taken from the exchange or market on which the security trades.
Interest rate swaps and credit default swaps are generally valued by pricing
vendors based on market inputs that include the index and term of index, reset
frequency, payer/receiver, currency and pay frequency.
Securities and other assets for which representative market quotations are not
readily available or are considered unreliable by the fund's investment adviser
are fair valued as determined in good faith under fair valuation guidelines
adopted by authority of the fund's board of trustees as further described. The
investment adviser follows fair valuation guidelines, consistent with U.S.
Securities and Exchange Commission rules and guidance, to consider relevant
principles and factors when making fair value determinations. The investment
adviser considers relevant indications of value that are reasonably and timely
available to it in determining the fair value to be assigned to a particular
security, such as the type and cost of the security; contractual or legal
restrictions on resale of the security; relevant financial or business
developments of the issuer; actively traded similar or related securities;
conversion or exchange rights on the security; related corporate actions;
significant events occurring after the close of trading in the security; and
changes in overall market conditions. In addition, the closing prices of equity
securities that trade in markets outside U.S. time zones may be adjusted to
reflect significant events that occur after the close of local trading but
before the net asset value of each share class of the fund is determined. Fair
valuations and valuations of investments that are not actively trading involve
judgment and may differ materially from valuations that would have been used
had greater market activity occurred.
Processes and structure - The fund's board of trustees has delegated authority
to the fund's investment adviser to make fair value determinations, subject to
board oversight. The investment adviser has established a Joint Fair Valuation
Committee (the "Fair Valuation Committee") to administer, implement and oversee
the fair valuation process, and to make fair value decisions. The Fair
Valuation Committee regularly reviews its own fair value decisions, as well as
decisions made under its standing instructions to the investment
American Funds Corporate Bond Fund 11
adviser's valuation teams. The Fair Valuation Committee reviews changes in fair
value measurements from period to period and may, as deemed appropriate, update
the fair valuation guidelines to better reflect the results of back testing and
address new or evolving issues. The Fair Valuation Committee reports any
changes to the fair valuation guidelines to the board of trustees with
supplemental information to support the changes. The fund's board and audit
committee also regularly review reports that describe fair value determinations
and methods.
The fund's investment adviser has also established a Fixed-Income Pricing
Review Group to administer and oversee the fixed-income valuation process,
including the use of fixed-income pricing vendors. This group regularly reviews
pricing vendor information and market data. Pricing decisions, processes and
controls over security valuation are also subject to additional internal
reviews, including an annual control self-evaluation program facilitated by the
investment adviser's compliance group.
Classifications - The fund's investment adviser classifies the fund's assets
and liabilities into three levels based on the inputs used to value the assets
or liabilities. Level 1 values are based on quoted prices in active markets for
identical securities. Level 2 values are based on significant observable market
inputs, such as quoted prices for similar securities and quoted prices in
inactive markets. Certain securities trading outside the U.S. may transfer
between Level 1 and Level 2 due to valuation adjustments resulting from
significant market movements following the close of local trading. Level 3
values are based on significant unobservable inputs that reflect the investment
adviser's determination of assumptions that market participants might
reasonably use in valuing the securities. The valuation levels are not
necessarily an indication of the risk or liquidity associated with the
underlying investment. For example, U.S. government securities are reflected as
Level 2 because the inputs used to determine fair value may not always be
quoted prices in an active market. The following tables present the fund's
valuation levels as of May 31, 2017 (dollars in thousands):
Investment securities
-------------------------------------------------------------------
Level 1 Level 2 Level 3 Total
----------------------------------------------------------------------------------------------------------------
Assets:
Bonds, notes & other debt instruments:
Corporate bonds & notes $- $217,759 $- $217,759
Other - 9,930 - 9,930
Short-term securities - 22,894 - 22,894
-- -------- -- --------
Total $- $250,583 $- $250,583
== ======== == ========
Other investments
---------------------------------------------------------------
Level 1 Level 2 Level 3 Total
---------------------------------------------------------------------------------------------------------------------
Assets:
Unrealized appreciation on futures contracts $10 $ - $- $ 10
Unrealized appreciation on interest rate swaps - 4 - 4
Unrealized appreciation on credit default swaps - 25 - 25
Liabilities:
Unrealized depreciation on interest rate swaps - (125) - (125)
--- ----- -- -----
Total $10 $ (96) $- $ (86)
=== ===== == =====
4. Risk factors
--------------------------------------------------------------------------------
Investing in the fund may involve certain risks including, but not limited to,
those described below.
Market conditions - The prices of, and the income generated by, the securities
held by the fund may decline - sometimes rapidly or unpredictably - due to
various factors, including events or conditions affecting the general economy
or particular industries; overall market changes; local, regional or global
political, social or economic instability; governmental or governmental agency
responses to economic conditions; and currency exchange rate, interest rate and
commodity price fluctuations.
Issuer risks - The prices of, and the income generated by, securities held by
the fund may decline in response to various factors directly related to the
issuers of such securities, including reduced demand for an issuer's goods or
services, poor management performance and strategic initiatives such as
mergers, acquisitions or dispositions and the market response to any such
initiatives.
Investing in debt instruments - The prices of, and the income generated by,
bonds and other debt securities held by the fund may be affected by changing
interest rates and by changes in the effective maturities and credit ratings of
these securities.
12 American Funds Corporate Bond Fund
Rising interest rates will generally cause the prices of bonds and other debt
securities to fall. Falling interest rates may cause an issuer to redeem, call
or refinance a debt security before its stated maturity, which may result in
the fund having to reinvest the proceeds in lower yielding securities. Longer
maturity debt securities generally have greater sensitivity to changes in
interest rates and may be subject to greater price fluctuations than shorter
maturity debt securities.
Bonds and other debt securities are also subject to credit risk, which is the
possibility that the credit strength of an issuer will weaken and/or an issuer
of a debt security will fail to make timely payments of principal or interest
and the security will go into default. Lower quality debt securities generally
have higher rates of interest and may be subject to greater price fluctuations
than higher quality debt securities. Credit risk is gauged, in part, by the
credit ratings of the debt securities in which the fund invests. However,
ratings are only the opinions of the rating agencies issuing them and are not
guarantees as to credit quality or an evaluation of market risk. The fund's
investment adviser relies on its own credit analysts to research issuers and
issues in seeking to mitigate various credit and default risks.
Investing in securities backed by the U.S. government - Securities backed by
the U.S. Treasury or the full faith and credit of the U.S. government are
guaranteed only as to the timely payment of interest and principal when held to
maturity. Accordingly, the current market values for these securities will
fluctuate with changes in interest rates. Securities issued by
government-sponsored entities and federal agencies and instrumentalities that
are not backed by the full faith and credit of the U.S. government are neither
issued nor guaranteed by the U.S. government.
Investing in derivatives - The use of derivatives involves a variety of risks,
which may be different from, or greater than, the risks associated with
investing in traditional cash securities, such as stocks and bonds. Changes in
the value of a derivative may not correlate perfectly with, and may be more
sensitive to market events than, the underlying asset, rate or index, and a
derivative instrument may expose the fund to losses in excess of its initial
investment. Derivatives may be difficult for the fund to buy or sell at an
opportune time or price and may be difficult to terminate or otherwise offset.
The fund's use of derivatives may result in losses to the fund, and investing
in derivatives may reduce the fund's returns and increase the fund's price
volatility. The fund's counterparty to a derivative transaction (including, if
applicable, the fund's clearing broker, the derivatives exchange or the
clearinghouse) may be unable or unwilling to honor its financial obligations in
respect of the transaction. A description of the derivative instruments in
which the fund may invest and the various risks associated with those
derivatives is included in the fund's statement of additional information under
"Description of certain securities, investment techniques and risks."
Liquidity risk - Certain fund holdings may be deemed to be less liquid or
illiquid because they cannot be readily sold without significantly impacting
the value of the holdings. Liquidity risk may result from the lack of an active
market for a holding, legal or contractual restrictions on resale, or the
reduced number and capacity of market participants to make a market in such
holding. Market prices for less liquid or illiquid holdings may be volatile,
and reduced liquidity may have an adverse impact on the market price of such
holdings. Additionally, the sale of less liquid or illiquid holdings may
involve substantial delays (including delays in settlement) and additional
costs and the fund may be unable to sell such holdings when necessary to meet
its liquidity needs.
Investing outside the U.S. - Securities of issuers domiciled outside the United
States, or with significant operations or revenues outside the United States,
may lose value because of adverse political, social, economic or market
developments (including social instability, regional conflicts, terrorism and
war) in the countries or regions in which the issuers operate or generate
revenue. These securities may also lose value due to changes in foreign
currency exchange rates against the U.S. dollar and/or currencies of other
countries. Issuers of these securities may be more susceptible to actions of
foreign governments, such as the imposition of price controls or punitive
taxes, that could adversely impact the value of these securities. Securities
markets in certain countries may be more volatile and/or less liquid than those
in the United States. Investments outside the United States may also be subject
to different accounting practices and different regulatory, legal and reporting
standards and practices, and may be more difficult to value, than those in the
United States. In addition, the value of investments outside the United States
may be reduced by foreign taxes, including foreign withholding taxes on
interest and dividends. Further, there may be increased risks of delayed
settlement of securities purchased or sold by the fund. The risks of investing
outside the United States may be heightened in connection with investments in
emerging markets.
Investing in emerging markets - Investing in emerging markets may involve risks
in addition to and greater than those generally associated with investing in
the securities markets of developed countries. For instance, developing
countries may have less developed legal and accounting systems than those in
developed countries. The governments of these countries may be less stable and
more likely to impose capital controls, nationalize a company or industry,
place restrictions on foreign ownership and on withdrawing sale proceeds of
securities from the country, and/or impose punitive taxes that could adversely
affect the prices of securities. In addition, the economies of these countries
may be dependent on relatively few industries that are more susceptible to
local and global changes. Securities markets in these countries can also be
relatively small and have substantially lower trading volumes. As a result,
securities issued in these countries may be more volatile and less liquid, and
may be more difficult to value, than securities issued in countries with more
American Funds Corporate Bond Fund 13
developed economies and/or markets. Less certainty with respect to security
valuations may lead to additional challenges and risks in calculating the
fund's net asset value. Additionally, there may be increased settlement risks
for transactions in local securities.
Management - The investment adviser to the fund actively manages the fund's
investments. Consequently, the fund is subject to the risk that the methods and
analyses employed by the investment adviser in this process may not produce the
desired results. This could cause the fund to lose value or its investment
results to lag relevant benchmarks or other funds with similar objectives.
5. Certain investment techniques
--------------------------------------------------------------------------------
Index-linked bonds - The fund has invested in index-linked bonds, which are
fixed-income securities whose principal value is periodically adjusted to a
government price index. Over the life of an index-linked bond, interest is paid
on the adjusted principal value. Increases or decreases in the principal value
of index-linked bonds are recorded as interest income in the fund's statement
of operations.
Futures contracts - The fund has entered into futures contracts, which provide
for the future sale by one party and purchase by another party of a specified
amount of a specific financial instrument for a specified price, date, time and
place designated at the time the contract is made. Futures contracts are used
to strategically manage portfolio volatility and downside equity risk.
Upon entering into futures contracts, and to maintain the fund's open positions
in futures contracts, the fund is required to deposit with a futures broker, or
FCM, in a segregated account in the name of the FCM an amount of cash, U.S.
government securities, suitable money market instruments, or other liquid
securities, known as initial margin. The margin required for a particular
futures contract is set by the exchange on which the contract is traded to
serve as collateral, and may be significantly modified from time to time by the
exchange during the term of the contract. When initial margin is deposited with
brokers, a receivable is recorded in the fund's statement of assets and
liabilities.
On a daily basis, the fund pays or receives variation margin based on the
increase or decrease in the value of the futures contracts and records
variation margin on futures contracts in the statement of assets and
liabilities. In addition, the fund segregates liquid assets equivalent to the
fund's outstanding obligations under the contract in excess of the initial
margin and variation margin, if any. Futures contracts may involve a risk of
loss in excess of the variation margin shown on the fund's statement of assets
and liabilities. The fund records realized gains or losses at the time the
futures contract is closed or expires. Net realized gains or losses and net
unrealized appreciation or depreciation from futures contracts are recorded in
the fund's statement of operations. The average month-end notional amount of
futures contracts while held was $5,742,000.
Interest rate swaps - The fund has entered into interest rate swap contracts,
which are agreements to exchange one stream of future interest payments for
another based on a specified notional amount. Typically, interest rate swaps
exchange a fixed interest rate for a payment that floats relative to a
benchmark or vice versa. The fund's investment adviser uses interest rate swaps
to seek to manage the interest rate sensitivity of the fund by increasing or
decreasing the duration of the fund or a portion of the fund's portfolio. Risks
may arise as a result of the fund's investment adviser incorrectly anticipating
changes in interest rates, increased volatility, reduced liquidity and the
potential inability of counterparties to meet the terms of their agreements.
Upon entering into an interest rate swap contract, the fund is required to
deposit cash, U.S. government securities or other liquid securities, which is
known as "initial margin." Generally, the initial margin required for a
particular interest rate swap is set and held as collateral by the
clearinghouse on which the contract is cleared. The amount of initial margin
required may be significantly modified from time to time by the clearinghouse
during the term of the contract.
On a daily basis, the fund's investment adviser records daily interest accruals
related to the exchange of future payments as a receivable and payable in the
fund's statement of assets and liabilities. The fund also pays or receives a
"variation margin" based on the increase or decrease in the value of the
interest rate swaps, including accrued interest, and records variation margin
on interest rate swaps in the statement of assets and liabilities. The fund
records realized gains and losses on both the net accrued interest and any gain
or loss recognized at the time the interest rate swap is closed or expires. Net
realized gains or losses, as well as any net unrealized appreciation or
depreciation, from interest rate swaps are recorded in the fund's statement of
operations. The average month-end notional amount of interest rate swaps while
held was $6,167,000.
Credit default swap indices -The fund has entered into centrally cleared credit
default swap agreements on credit indices ("CDSI") that involve one party (the
protection buyer) making a stream of payments to another party (the protection
seller) in exchange for the right to receive a specified return upon the
occurrence of a credit event, such as a default or restructuring, with respect
to any of the underlying issuers (reference obligations) in the referenced
index. The fund's investment adviser uses credit default swaps to assume
exposure to a diversified portfolio of credits or to hedge against existing
credit risks.
14 American Funds Corporate Bond Fund
CDSI are portfolios of credit instruments or exposures designed to be
representative of some part of the credit market, such as the high-yield or
investment-grade credit market. CDSI are generally traded using standardized
terms, including a fixed spread and standard maturity dates, and reference all
the names in the index. If there is a credit event, it is settled based on that
name's weight in the index. The composition of the underlying issuers or
obligations within a particular index may change periodically, usually every
six months. A specified credit event may affect all or individual underlying
reference obligations included in the index, and will be settled based upon the
relative weighting of the affected obligation(s) within the index. The value of
each CDSI can be used as a measure of the current payment/performance risk of
the CDSI and represents the likelihood of an expected liability or profit
should the notional amount of the CDSI be closed or sold as of the period end.
An increasing value, as compared to the notional amount of the CDSI, represents
a deterioration of the referenced indices' credit soundness and a greater
likelihood of risk of default or other credit event occurring as defined under
the terms of the agreement. When the fund provides sell protection, its maximum
exposure is the notional amount of the credit default swap agreement.
Upon entering into a centrally cleared CDSI contract, the fund is required to
deposit with a derivatives clearing member ("DCM") in a segregated account in
the name of the DCM an amount of cash, U.S. government securities or other
liquid securities, which is known as "initial margin." Generally, the initial
margin required for a particular credit default swap is set and held as
collateral by the clearinghouse on which the contract is cleared. The amount of
initial margin required may be significantly modified from time to time by the
clearinghouse during the term of the contract. Securities deposited as initial
margin are designated on the investment portfolio.
On a daily basis, interest accruals related to the exchange of future payments
are recorded as a receivable and payable in the fund's statement of assets and
liabilities. The fund also pays or receives a "variation margin" based on the
increase or decrease in the value of the CDSI, and records variation margin in
the statement of assets and liabilities. The fund records realized gains and
losses on both the net accrued interest and any gain or loss recognized at the
time the swap is closed or expires. Net realized gains or losses, as well as
any net unrealized appreciation or depreciation, from credit default swaps are
recorded in the fund's statement of operations. The average month-end notional
amount of credit default swaps while held was $5,750,000.
The following tables present the financial statement impacts resulting from the
fund's use of futures contracts, interest rate swaps and credit default swaps
as of, or for the year ended, May 31, 2017 (dollars in thousands):
Assets Liabilities
------------------------------------------ -------------------------------------
Location on statement of Location on statement of
Contract Risk type assets and liabilities Value assets and liabilities Value
---------------------------------------------------------------------------------------------------------------------
Futures contracts Interest Net unrealized appreciation* $10 Net unrealized depreciation* $ -
Interest rate swaps Interest Net unrealized appreciation* 4 Net unrealized depreciation* 125
Credit default swaps Credit Net unrealized appreciation* 25 Net unrealized depreciation* -
---- ----
$39 $125
==== ====
Net realized gain (loss) Net unrealized appreciation
------------------------------------------ -------------------------------------
Location on statement of Location on statement of
Contract Risk type operations Value operations Value
---------------------------------------------------------------------------------------------------------------------
Futures contracts Interest Net realized gain on futures $ 94 Net unrealized appreciation on $ 10
contracts futures contracts
Interest rate swaps Interest Net realized loss on interest rate (24) Net unrealized appreciation on 80
swaps interest rate swaps
Credit default swaps Credit Net realized gain on credit default 27 Net unrealized appreciation on 25
swaps credit default swaps
----- ----
$ 97 $115
===== ====
*Includes cumulative appreciation/depreciation on futures contracts, interest
rate swaps and credit default swaps as reported in the applicable tables
following the fund's investment portfolio. Only current day's variation
margin is reported within the statement of assets and liabilities.
Collateral - The fund participates in a collateral program due to its use of
futures contracts, interest rate swaps and credit default swaps. For futures
contracts, interest rate swaps and credit default swaps, the program calls for
the fund to pledge collateral for initial and variation margin by contract. The
purpose of the collateral is to cover potential losses that could occur in the
event that either party cannot meet its contractual obligations.
American Funds Corporate Bond Fund 15
6. Taxation and distributions
--------------------------------------------------------------------------------
Federal income taxation - The fund complies with the requirements under
Subchapter M of the Internal Revenue Code applicable to mutual funds and
intends to distribute substantially all of its net taxable income and net
capital gains each year. The fund is not subject to income taxes to the extent
such distributions are made. Therefore, no federal income tax provision is
required.
As of and during the period ended May 31, 2017, the fund did not have a
liability for any unrecognized tax benefits. The fund recognizes interest and
penalties, if any, related to unrecognized tax benefits as income tax expense
in the statement of operations. During the period, the fund did not incur any
interest or penalties.
The fund is not subject to examination by U.S. federal tax authorities for tax
years before 2013 and by state tax authorities for tax years before 2012.
Non-U.S. taxation - Interest income is recorded net of non-U.S. taxes paid. The
fund may file withholding tax reclaims in certain jurisdictions to recover a
portion of amounts previously withheld. These reclaims are recorded when the
amount is known and there are no significant uncertainties on collectability.
Gains realized by the fund on the sale of securities in certain countries, if
any, may be subject to non-U.S. taxes. If applicable, the fund records an
estimated deferred tax liability based on unrealized gains to provide for
potential non-U.S. taxes payable upon the sale of these securities.
Distributions - Distributions paid to shareholders are based on net investment
income and net realized gains determined on a tax basis, which may differ from
net investment income and net realized gains for financial reporting purposes.
These differences are due primarily to different treatment for items such as
short-term capital gains and losses; capital losses related to sales of certain
securities within 30 days of purchase; cost of investments sold; and income on
certain investments. The fiscal year in which amounts are distributed may
differ from the year in which the net investment income and net realized gains
are recorded by the fund for financial reporting purposes.
During the year ended May 31, 2017, the fund reclassified $56,000 from
accumulated net realized loss to undistributed net investment income to align
financial reporting with tax reporting.
As of May 31, 2017, the tax basis components of distributable earnings,
unrealized appreciation (depreciation) and cost of investment securities were
as follows (dollars in thousands):
------------------------------------------------------------------
Undistributed ordinary income $ 156
Post-October capital loss deferral* (712)
------------------------------------------------------------------
Gross unrealized appreciation on investment securities 3,904
Gross unrealized depreciation on investment securities (392)
Net unrealized appreciation on investment securities 3,512
------------------------------------------------------------------
Cost of investment securities 247,071
------------------------------------------------------------------
*This deferral is considered incurred in the subsequent year.
16 American Funds Corporate Bond Fund
The tax character of distributions paid or accrued to shareholders was as
follows (dollars in thousands):
Year ended May 31, 2017 Year ended May 31, 2016
------------------------------------- ----------------------------------------
Total Total
dividends and dividends and
distributions distributions
Ordinary Long-term paid or Ordinary Long-term paid or
Share class income capital gains accrued income capital gains accrued
-------------------------------------------------------------------------------------------------------
Class A $3,163 $145 $3,308 $2,395 $35 $2,430
Class B/1,2/ -/3/ -/3/ -/3/
Class C/1/ 90 3 93
Class T/4/ -/3/ - -/3/
Class F-1/1/ 25 1 26
Class F-2/1/ 101 2 103
Class F-3/5/ 9 - 9
Class 529-A/1/ 74 2 76
Class 529-B/1,2/ -/3/ -/3/ -/3/
Class 529-C/1/ 20 -/3/ 20
Class 529-E/1/ 7 -/3/ 7
Class 529-T/4/ -/3/ - -/3/
Class 529-F-1/1/ 11 -/3/ 11
Class R-1/1/ 1 -/3/ 1
Class R-2/1/ 4 -/3/ 4
Class R-2E/1/ 1 -/3/ 1
Class R-3/1/ 5 -/3/ 5
Class R-4/1/ 3 -/3/ 3
Class R-5E/1/ 1 -/3/ 1
Class R-5/1/ 1 -/3/ 1
Class R-6/1/ 3 -/3/ 3
------ ---- ------ ------ --- ------
Total $3,519 $153 $3,672 $2,395 $35 $2,430
====== ==== ====== ====== === ======
/1/This share class began investment operations on July 29, 2016.
/2/Class B and 529-B shares were fully liquidated on May 5, 2017.
/3/Amount less than one thousand.
/4/Class T and 529-T shares began investment operations on April 7, 2017.
/5/Class F-3 shares began investment operations on January 27, 2017.
7. Fees and transactions with related parties
--------------------------------------------------------------------------------
CRMC, the fund's investment adviser, is the parent company of American Funds
Distributors,(R) Inc. ("AFD"), the principal underwriter of the fund's shares,
and American Funds Service Company(R) ("AFS"), the fund's transfer agent. CRMC,
AFD and AFS are considered related parties to the fund.
Investment advisory services - The fund has an investment advisory and service
agreement with CRMC that provides for monthly fees accrued daily. These fees
are based on an annual rate of 0.460% of average daily net assets. For the year
ended May 31, 2017, the investment advisory services fee was $554,000.
Miscellaneous fee reimbursements - CRMC has agreed to reimburse a portion of
miscellaneous fees and expenses of the fund during its startup period. This
reimbursement may be adjusted or discontinued by CRMC, subject to any
restrictions in the fund's prospectus. For the year ended May 31, 2017, total
fees and expenses reimbursed by CRMC were $132,000. Fees and expenses in the
statement of operations are presented gross of any reimbursements from CRMC.
Class-specific fees and expenses - Expenses that are specific to individual
share classes are accrued directly to the respective share class. The principal
class-specific fees and expenses are further described below:
Distribution services - The fund has plans of distribution for all share
classes, except Class F-2, F-3, R-5E, R-5 and R-6 shares. Under the plans,
the board of trustees approves certain categories of expenses that are used
to finance activities primarily intended to sell fund shares and service
existing accounts. The plans provide for payments, based on an annualized
percentage of average daily net assets, ranging from 0.30% to 1.00% as noted
in this section. In some cases, the board of trustees has limited the
amounts that may be paid to less than the maximum allowed by the plans. All
share classes with a plan may use up to 0.25% of average daily net assets to
pay service fees, or to compensate AFD for paying service fees, to firms
that have entered into agreements with AFD to provide
American Funds Corporate Bond Fund 17
certain shareholder services. The remaining amounts available to be paid
under each plan are paid to dealers to compensate them for their sales
activities.
For Class A and 529-A shares, distribution-related expenses include the
reimbursement of dealer and wholesaler commissions paid by AFD for certain
shares sold without a sales charge. These share classes reimburse AFD for
amounts billed within the prior 15 months but only to the extent that the
overall annual expense limit of 0.30% is not exceeded. As of May 31, 2017,
there were no unreimbursed expenses subject to reimbursement for Class A or
529-A shares.
Share class Currently approved limits Plan limits
---------------------------------------------------------------------------------
Class A 0.30% 0.30%
Class 529-A 0.30 0.50
Classes C, 529-C and R-1 1.00 1.00
Class R-2 0.75 1.00
Class R-2E 0.60 0.85
Classes 529-E and R-3 0.50 0.75
Classes T, F-1, 529-T, 529-F-1 and R-4 0.25 0.50
---------------------------------------------------------------------------------
Transfer agent services - The fund has a shareholder services agreement with
AFS under which the fund compensates AFS for providing transfer agent
services to each of the fund's share classes. These services include
recordkeeping, shareholder communications and transaction processing. In
addition, the fund reimburses AFS for amounts paid to third parties for
performing transfer agent services on behalf of fund shareholders.
Administrative services - The fund has an administrative services agreement
with CRMC under which the fund compensates CRMC for providing administrative
services to Class A, C, T, F, 529 and R shares. These services include, but
are not limited to, coordinating, monitoring, assisting and overseeing third
parties that provide services to fund shareholders. Under the agreement,
Class A shares pay an annual fee of 0.01% and Class C, T, F, 529 and R
shares pay an annual fee of 0.05% of their respective average daily net
assets.
529 plan services - Each 529 share class is subject to service fees to
compensate the Virginia College Savings Plan ("Virginia529") for its
oversight and administration of the 529 college savings plan. From June 1,
2016 to June 30, 2016, the quarterly fee was based on a series of decreasing
annual rates beginning with 0.10% on the first $30 billion of the net assets
invested in Class 529 shares of the American Funds and decreasing to 0.05%
on such assets in excess of $70 billion. Effective July 1, 2016, the
quarterly fee was amended to annual rates of 0.10% on the first $20 billion
of the net assets invested in the Class 529 shares of the American Funds,
0.05% on such assets between $20 billion and $100 billion, and 0.03% on such
assets over $100 billion. The fee for any given calendar quarter is accrued
and calculated on the basis of the average net assets of Class 529 shares of
the American Funds for the last month of the prior calendar quarter. The fee
is included in other expenses in the fund's statement of operations.
Virginia529 is not considered a related party to the fund.
18 American Funds Corporate Bond Fund
For the year ended May 31, 2017, class-specific expenses under the
agreements were as follows (dollars in thousands):
Distribution Transfer agent Administrative 529 plan
Share class services services services services
------------------------------------------------------------------------------------------------------------
Class A $294 $69 $11 Not applicable
Class B/1,2/ -/3/ -/3/ Not applicable Not applicable
Class C/1/ 41 3 2 Not applicable
Class T/4/ - -/3/ -/3/ Not applicable
Class F-1/1/ 2 2 -/3/ Not applicable
Class F-2/1/ Not applicable 3 2 Not applicable
Class F-3/5/ Not applicable -/3/ -/3/ Not applicable
Class 529-A/1/ 8 2 1 $2
Class 529-B/1,2/ -/3/ -/3/ -/3/ -/3/
Class 529-C/1/ 9 1 1 1//
Class 529-E/1/ 1 -/3/ -/3/ -/3/
Class 529-T/4/ - -/3/ -/3/ -/3/
Class 529-F-1/1/ - -/3/ -/3/ -/3/
Class R-1/1/ -/3/ -/3/ -/3/ Not applicable
Class R-2/1/ 1 -/3/ -/3/ Not applicable
Class R-2E/1/ - -/3/ -/3/ Not applicable
Class R-3/1/ 1 -/3/ -/3/ Not applicable
Class R-4/1/ -/3/ -/3/ -/3/ Not applicable
Class R-5E/1/ Not applicable -/3/ -/3/ Not applicable
Class R-5/1/ Not applicable -/3/ -/3/ Not applicable
Class R-6/1/ Not applicable -/3/ -/3/ Not applicable
-------------- --- -------------- --------------
Total class-specific expenses $357 $80 $17 $3
============== === ============== ==============
/1/This share class began investment operations on July 29, 2016.
/2/Class B and 529-B shares were fully liquidated on May 5, 2017.
/3/Amount less than one thousand.
/4/Class T and 529-T shares began investment operations on April 7, 2017.
/5/Class F-3 shares began investment operations on January 27, 2017.
Trustees' deferred compensation - Trustees who are unaffiliated with CRMC may
elect to defer the cash payment of part or all of their compensation. These
deferred amounts, which remain as liabilities of the fund, are treated as if
invested in shares of the fund or other American Funds. These amounts represent
general, unsecured liabilities of the fund and vary according to the total
returns of the selected funds. Trustees' compensation of $1,000 in the fund's
statement of operations reflects $1,000 in current fees (either paid in cash or
deferred) and a net increase of less than $1,000 in the value of the deferred
amounts.
Affiliated officers and trustees - Officers and certain trustees of the fund
are or may be considered to be affiliated with CRMC, AFD and AFS. No affiliated
officers or trustees received any compensation directly from the fund.
Security transactions with related funds - The fund may purchase from, or sell
securities to, other funds managed by CRMC (or funds managed by certain
affiliates of CRMC) under procedures adopted by the fund's board of trustees.
The funds involved in such transactions are considered related by virtue of
having a common investment adviser (or affiliated investment advisers), common
trustees and/or common officers. When such transactions occur, each transaction
is executed at the current market price of the security and no brokerage
commissions or fees are paid in accordance with Rule 17a-7 of the 1940 Act.
Interfund lending - Pursuant to an exemptive order issued by the SEC, the fund,
along with other CRMC-managed funds (or funds managed by certain affiliates of
CRMC), may participate in an interfund lending program. The program provides an
alternate credit facility that permits the funds to lend or borrow cash for
temporary purposes directly to or from one another, subject to the conditions
of the exemptive order. The fund did not lend or borrow cash through the
interfund lending program at any time during the year ended May 31, 2017.
American Funds Corporate Bond Fund 19
8. Capital share transactions
--------------------------------------------------------------------------------
Capital share transactions in the fund were as follows (dollars and shares in
thousands):
Reinvestments of
Sales/1/ dividends and distributions Repurchases/1/ Net increase
--------------- -------------------- ------------------- -------------------
Share class Amount Shares Amount Shares Amount Shares Amount Shares
--------------------------------------------------------------------------------------------------------------------------------
Year ended May 31, 2017
Class A $183,941 17,934 $1,609 158 $(27,066) (2,651) $158,484 15,441
Class B/2,3/ 26 3 -/4/ -/4/ (25) (3) 1 -/4/
Class C/2/ 12,773 1,244 91 9 (3,060) (301) 9,804 952
Class T/5/ 10 1 - - - - 10 1
Class F-1/2/ 2,569 251 25 2 (381) (37) 2,213 216
Class F-2/2/ 9,457 919 100 10 (3,905) (384) 5,652 545
Class F-3/6/ 3,185 312 9 1 (1) -/4/ 3,193 313
Class 529-A/2/ 6,955 677 75 8 (611) (60) 6,419 625
Class 529-B/2,3/ 14 1 -/4/ -/4/ (14) (1) -/4/ -/4/
Class 529-C/2/ 2,305 224 21 2 (190) (18) 2,136 208
Class 529-E/2/ 608 59 7 1 -/4/ -/4/ 615 60
Class 529-T/5/ 10 1 -/4/ -/4/ - - 10 1
Class 529-F-1/2/ 813 80 12 1 (67) (7) 758 74
Class R-1/2/ 64 6 -/4/ -/4/ -/4/ -/4/ 64 6
Class R-2/2/ 1,083 106 4 -/4/ (3) -/4/ 1,084 106
Class R-2E/2/ 25 2 - - - - 25 2
Class R-3/2/ 553 55 3 -/4/ (2) -/4/ 554 55
Class R-4/2/ 768 75 3 -/4/ -/4/ -/4/ 771 75
Class R-5E/2/ 25 2 - - - - 25 2
Class R-5/2/ 110 11 -/4/ -/4/ -/4/ -/4/ 110 11
Class R-6/2/ 521 52 3 -/4/ -/4/ -/4/ 524 52
-------- ------ ------ --- -------- ------ -------- ------
Total net increase (decrease) $225,815 22,015 $1,962 192 $(35,325) (3,462) $192,452 18,745
======== ====== ====== === ======== ====== ======== ======
Year ended May 31, 2016
Class A
$ 250 24 $ -/4/ -/4/ $ - - $ 250 24
/1/Includes exchanges between share classes of the fund.
/2/This share class began investment operations on July 29, 2016.
/3/Class B and 529-B shares of the fund were fully liquidated on May 5, 2017.
/4/Amount less than one thousand.
/5/Class T and 529-T shares began investment operations on April 7, 2017.
/6/Class F-3 shares began investment operations on January 27, 2017.
9. Investment transactions
--------------------------------------------------------------------------------
The fund made purchases and sales of investment securities, excluding
short-term securities and U.S. government obligations, if any, of $289,689,000
and $115,920,000, respectively, during the year ended May 31, 2017.
10. Ownership concentration
--------------------------------------------------------------------------------
At May 31, 2017, CRMC held 21% of the fund's outstanding shares. The ownership
represents the seed money invested in the fund when it began operations on
December 14, 2012.
20 American Funds Corporate Bond Fund
Financial highlights
Income (loss) from
investment operations/1/ Dividends and distributions
------------------------------- -------------------------------------
Net gains
(losses) on Net
Net asset securities Dividends Total asset
value, Net (both Total from (from net Distributions dividends value,
beginning investment realized and investment investment (from capital and end of Total
of period income unrealized) operations income) gains) distributions period return/2,3/
---------------------------------------------------------------------------------------------------------------------------------
Class A:
Year ended 5/31/2017 $10.27 $.22 $.18 $.40 $(.23) $(.11) $(.34) $10.33 3.90%/4/
Year ended 5/31/2016 10.20 .30 .26 .56 (.29) (.20) (.49) 10.27 5.71
Year ended 5/31/2015 10.11 .26 .08 .34 (.25) _ (.25) 10.20 3.44
Year ended 5/31/2014 9.85 .26 .25 .51 (.25) _/5/ (.25) 10.11 5.36
Period from 12/14/2012
to 5/31/2013/6,7/ 10.00 .09 (.15) (.06) (.09) _ (.09) 9.85 (.60)/8/
---------------------------------------------------------------------------------------------------------------------------------
Class C:
Period from 7/29/2016
to 5/31/2017/6,9/ 10.57 .12 (.18) (.06) (.11) (.07) (.18) 10.33 (.47)/8/
---------------------------------------------------------------------------------------------------------------------------------
Class T:
Period from 4/7/2017 to
5/31/2017/6,10/ 10.17 .04 .16 .20 (.04) - (.04) 10.33 1.97/4,8/
---------------------------------------------------------------------------------------------------------------------------------
Class F-1:
Period from 7/29/2016
to 5/31/2017/6,9/ 10.57 .18 (.18) -/5/ (.17) (.07) (.24) 10.33 .09/8/
---------------------------------------------------------------------------------------------------------------------------------
Class F-2:
Period from 7/29/2016
to 5/31/2017/6,9/ 10.57 .20 (.17) .03 (.20) (.07) (.27) 10.33 .33/8/
---------------------------------------------------------------------------------------------------------------------------------
Class F-3:
Period from 1/27/2017
to 5/31/2017/6,12/ 10.09 .09 .24 .33 (.09) - (.09) 10.33 3.29/8/
---------------------------------------------------------------------------------------------------------------------------------
Class 529-A:
Period from 7/29/2016
to 5/31/2017/6,9/ 10.57 .17 (.17) _/5/ (.17) (.07) (.24) 10.33 .06/8/
---------------------------------------------------------------------------------------------------------------------------------
Ratio of Ratio of
expenses to expenses to
average net average net Ratio of
Net assets, assets before assets after net income
end of period reimburse- reimburse- to average
(in millions) ments ments/3/ net assets/3/
--------------------------------------------------------------------------------
Class A:
Year ended 5/31/2017 $211 .98%/4/ .87%/4/ 2.16%/4/
Year ended 5/31/2016 52 .75 .53 2.97
Year ended 5/31/2015 51 .71 .53 2.52
Year ended 5/31/2014 51 .69 .53 2.65
Period from 12/14/2012
to 5/31/2013/6,7/ 49 .33/8/ .24/8/ .91/8/
--------------------------------------------------------------------------------
Class C:
Period from 7/29/2016
to 5/31/2017/6,9/ 10 1.77 1.64 1.40
--------------------------------------------------------------------------------
Class T:
Period from 4/7/2017 to
5/31/2017/6,10/ _/11/ .15/4,8/ .10/4,8/ .37/4,8/
--------------------------------------------------------------------------------
Class F-1:
Period from 7/29/2016
to 5/31/2017/6,9/ 2 1.14 1.00 2.07
--------------------------------------------------------------------------------
Class F-2:
Period from 7/29/2016
to 5/31/2017/6,9/ 5 .77 .66 2.35
--------------------------------------------------------------------------------
Class F-3:
Period from 1/27/2017
to 5/31/2017/6,12/ 3 .32/8/ .20/8/ .89/8/
--------------------------------------------------------------------------------
Class 529-A:
Period from 7/29/2016
to 5/31/2017/6,9/ 6 1.15 1.01 2.06
--------------------------------------------------------------------------------
See page 23 for footnotes.
American Funds Corporate Bond Fund 21
Financial highlights (continued)
Income (loss) from
investment operations/1/ Dividends and distributions
--------------------------------- -------------------------------------
Net gains
(losses) on Net
Net asset securities Dividends Total asset
value, Net (both Total from (from net Distributions dividends value,
beginning investment realized and investment investment (from capital and end of Total
of period income unrealized) operations income) gains) distributions period return/2,3/
---------------------------------------------------------------------------------------------------------------------------------
Class 529-C:
Period from 7/29/2016
to 5/31/2017/6,9/ $10.57 $.12 $(.18) $(.06) $(.11) $(.07) $(.18) $10.33 (.48)%/8/
---------------------------------------------------------------------------------------------------------------------------------
Class 529-E:
Period from 7/29/2016
to 5/31/2017/6,9/ 10.57 .16 (.17) (.01) (.16) (.07) (.23) 10.33 (.02)/8/
---------------------------------------------------------------------------------------------------------------------------------
Class 529-T:
Period from 4/7/2017 to
5/31/2017/6,10/ 10.17 .04 .16 .20 (.04) - (.04) 10.33 1.96/4,8/
---------------------------------------------------------------------------------------------------------------------------------
Class 529-F-1:
Period from 7/29/2016
to 5/31/2017/6,9/ 10.57 .20 (.18) .02 (.19) (.07) (.26) 10.33 .30/8/
---------------------------------------------------------------------------------------------------------------------------------
Class R-1:
Period from 7/29/2016
to 5/31/2017/6,9/ 10.57 .18 (.17) .01 (.18) (.07) (.25) 10.33 .15/4,8/
---------------------------------------------------------------------------------------------------------------------------------
Class R-2:
Period from 7/29/2016
to 5/31/2017/6,9/ 10.57 .15 (.17) (.02) (.15) (.07) (.22) 10.33 (.11)/8/
---------------------------------------------------------------------------------------------------------------------------------
Class R-2E:
Period from 7/29/2016
to 5/31/2017/6,9/ 10.57 .20 (.17) .03 (.20) (.07) (.27) 10.33 .36/4,8/
---------------------------------------------------------------------------------------------------------------------------------
Ratio of Ratio of
expenses to expenses to
average net average net Ratio of
Net assets, assets before assets after net income
end of period reimburse- reimburse- to average
(in millions) ments ments/3/ net assets/3/
--------------------------------------------------------------------------------
Class 529-C:
Period from 7/29/2016
to 5/31/2017/6,9/ $2 1.82% 1.69% 1.36%
--------------------------------------------------------------------------------
Class 529-E:
Period from 7/29/2016
to 5/31/2017/6,9/ 1 1.27 1.13 1.93
--------------------------------------------------------------------------------
Class 529-T:
Period from 4/7/2017 to
5/31/2017/6,10/ -/11/ .16/4,8/ .11/4,8/ .36/4,8/
--------------------------------------------------------------------------------
Class 529-F-1:
Period from 7/29/2016
to 5/31/2017/6,9/ 1 .85 .71 2.36
--------------------------------------------------------------------------------
Class R-1:
Period from 7/29/2016
to 5/31/2017/6,9/ -/11/ 1.12/4/ .97/4/ 2.06/4/
--------------------------------------------------------------------------------
Class R-2:
Period from 7/29/2016
to 5/31/2017/6,9/ 1 1.64 1.39 1.75
--------------------------------------------------------------------------------
Class R-2E:
Period from 7/29/2016
to 5/31/2017/6,9/ -/11/ .75/4/ .63/4/ 2.33/4/
--------------------------------------------------------------------------------
22 American Funds Corporate Bond Fund
Income (loss) from
investment operations/1/ Dividends and distributions
------------------------------- -------------------------------------
Net gains
(losses) on Net
Net asset securities Dividends Total asset
value, Net (both Total from (from net Distributions dividends value,
beginning investment realized and investment investment (from capital and end of Total
of period income unrealized) operations income) gains) distributions period return/2,3/
------------------------------------------------------------------------------------------------------------------------------
Class R-3:
Period from 7/29/2016
to 5/31/2017/6,9/ $10.57 $.17 $(.17) $--/5/ $(.17) $(.07) $(.24) $10.33 .10%/8/
------------------------------------------------------------------------------------------------------------------------------
Class R-4:
Period from 7/29/2016
to 5/31/2017/6,9/ 10.57 .20 (.18) .02 (.19) (.07) (.26) 10.33 .26/8/
------------------------------------------------------------------------------------------------------------------------------
Class R-5E:
Period from 7/29/2016
to 5/31/2017/6,9/ 10.57 .20 (.17) .03 (.20) (.07) (.27) 10.33 .37/8/
------------------------------------------------------------------------------------------------------------------------------
Class R-5:
Period from 7/29/2016
to 5/31/2017/6,9/ 10.57 .21 (.18) .03 (.20) (.07) (.27) 10.33 .34/8/
------------------------------------------------------------------------------------------------------------------------------
Class R-6:
Period from 7/29/2016
to 5/31/2017/6,9/ 10.57 .21 (.19) .02 (.19) (.07) (.26) 10.33 .30/8/
------------------------------------------------------------------------------------------------------------------------------
Ratio of Ratio of
expenses to expenses to
average net average net Ratio of
Net assets, assets before assets after net income
end of period reimburse- reimburse- to average
(in millions) ments ments/3/ net assets/3/
-----------------------------------------------------------------------------
Class R-3:
Period from 7/29/2016
to 5/31/2017/6,9/ $1 1.29% 1.11% 2.02%
-----------------------------------------------------------------------------
Class R-4:
Period from 7/29/2016
to 5/31/2017/6,9/ 1 1.15 .85 2.31
-----------------------------------------------------------------------------
Class R-5E:
Period from 7/29/2016
to 5/31/2017/6,9/ --/11/ .73 .62 2.34
-----------------------------------------------------------------------------
Class R-5:
Period from 7/29/2016
to 5/31/2017/6,9/ --/11/ .81 .63 2.42
-----------------------------------------------------------------------------
Class R-6:
Period from 7/29/2016
to 5/31/2017/6,9/ 1 .84 .62 2.54
-----------------------------------------------------------------------------
Year ended
------------------------------------------ For the period
2017 2016 2015 2014 12/14/2012 to 5/31/2013/6,7/
--------------------------------------------------------------------------------------------------
Portfolio turnover rate for all share classes. 162% 295% 204% 178% 65%
/1/Based on average shares outstanding.
/2/Total returns exclude any applicable sales charges, including contingent
deferred sales charges.
/3/This column reflects the impact of a reimbursement from CRMC. During the
periods shown, CRMC reimbursed a portion of other fees and expenses.
/4/All or a significant portion of assets in this class consisted of seed
capital invested by CRMC and/or its affiliates. Fees for distribution services
are not charged or accrued on these seed capital assets. If such fees were
paid by the fund on seed capital assets, fund expenses would have been higher
and net income and total return would have been lower.
/5/Amount less than $.01.
/6/Based on operations for the period shown and, accordingly, is not
representative of a full year.
/7/For the period December 14, 2012, commencement of operations, through
May 31, 2013.
/8/Not annualized.
/9/This share class began investment operations on July 29, 2016.
/10/Classes T and 529-T shares began investment operations on April 7, 2017.
/11/Amount less than $1 million.
/12/Class F-3 shares began investment operations on January 27, 2017.
See Notes to Financial Statements
American Funds Corporate Bond Fund 23
Report of Independent Registered Public Accounting Firm -------------------------------------------------------------------------------- To the Board of Trustees and Shareholders of American Funds Corporate Bond Fund In our opinion, the accompanying statement of assets and liabilities, including the summary investment portfolio, and the related statements of operations and of changes in net assets and the financial highlights present fairly, in all material respects, the financial position of American Funds Corporate Bond Fund (the "Fund") as of May 31, 2017, the results of its operations for the year then ended, the changes in its net assets for each of the two years in the period then ended and the financial highlights for each of the periods presented, in conformity with accounting principles generally accepted in the United States of America. These financial statements and financial highlights (hereafter referred to as "financial statements") are the responsibility of the Fund's management. Our responsibility is to express an opinion on these financial statements based on our audits. We conducted our audits of these financial statements in accordance with the standards of the Public Company Accounting Oversight Board (United States). Those standards require that we plan and perform the audit to obtain reasonable assurance about whether the financial statements are free of material misstatement. An audit includes examining, on a test basis, evidence supporting the amounts and disclosures in the financial statements, assessing the accounting principles used and significant estimates made by management, and evaluating the overall financial statement presentation. We believe that our audits, which included confirmation of securities as of May 31, 2017 by correspondence with the custodian and brokers, provide a reasonable basis for our opinion. PricewaterhouseCoopers LLP Los Angeles, California July 17, 2017 24 American Funds Corporate Bond Fund Expense example unaudited -------------------------------------------------------------------------------- As a fund shareholder, you incur Actual expenses: two types of costs: The first line of each share class in the (1) transaction costs, such as table on the following page provides initial sales charges on information about actual account values and purchase payments and actual expenses. You may use the contingent deferred sales information in this line, together with the charges on redemptions (loads), amount you invested, to estimate the and (2) ongoing costs, including expenses that you paid over the period. management fees, distribution Simply divide your account value by $1,000 and service (12b-1) fees, and (for example, an $8,600 account value other expenses. This example is divided by $1,000 = 8.6), then multiply the intended to help you understand result by the number in the first line your ongoing costs (in dollars) of under the heading titled "Expenses paid investing in the fund so you can during period" to estimate the expenses you compare these costs with the paid on your account during this period. ongoing costs of investing in other mutual funds. The Hypothetical example for comparison example is based on an purposes: investment of $1,000 invested at The second line of each share class in the the beginning of the period and table on the following page provides held for the entire six-month information about hypothetical account period (December 1, 2016, values and hypothetical expenses based on through May 31, 2017). the actual expense ratio for the share class and an assumed rate of return of 5.00% per year before expenses, which is not the actual return of the share class. The hypothetical account values and expenses may not be used to estimate the actual ending account balance or expenses you paid for the period. You may use this information to compare the ongoing costs of investing in the fund and other funds. To do so, compare this 5.00% hypothetical example with the 5.00% hypothetical examples that appear in the shareholder reports of the other funds. Notes: Retirement plan participants may be subject to certain fees charged by the plan sponsor, and Class F-1, F-2, F-3 and 529-F-1 shareholders may be subject to fees charged by financial intermediaries, typically ranging from 0.75% to 1.50% of assets annually depending on services offered. You can estimate the impact of these fees by adding the amount of the fees to the total estimated expenses you paid on your account during the period as calculated above. In addition, your ending account value would be lower by the amount of these fees. Note that the expenses shown in the table on the following page are meant to highlight your ongoing costs only and do not reflect any transactional costs, such as sales charges (loads). Therefore, the second line of each share class in the table is useful in comparing ongoing costs only and will not help you determine the relative total costs of owning different funds. In addition, if these transactional costs were included, your costs would have been higher. American Funds Corporate Bond Fund 25 Beginning Ending account value account value Expenses paid Annualized 12/1/2016 5/31/2017 during period/1/ expense ratio ------------------------------------------------------------------------------------------------- Class A - actual return $1,000.00 $1,040.61 $4.63 .91% Class A - assumed 5% return 1,000.00 1,020.39 4.58 .91 ------------------------------------------------------------------------------------------------- Class C - actual return 1,000.00 1,036.81 8.38 1.65 Class C - assumed 5% return 1,000.00 1,016.70 8.30 1.65 ------------------------------------------------------------------------------------------------- Class T - actual return/2/ 1,000.00 1,019.73 1.02 .68 Class T - assumed 5% return/2/ 1,000.00 1,021.54 3.43 .68 ------------------------------------------------------------------------------------------------- Class F-1 - actual return 1,000.00 1,040.11 5.14 1.01 Class F-1 - assumed 5% return 1,000.00 1,019.90 5.09 1.01 ------------------------------------------------------------------------------------------------- Class F-2 - actual return 1,000.00 1,041.80 3.46 .68 Class F-2 - assumed 5% return 1,000.00 1,021.54 3.43 .68 ------------------------------------------------------------------------------------------------- Class F-3 - actual return/3/ 1,000.00 1,032.94 2.00 .58 Class F-3 - assumed 5% return/3/ 1,000.00 1,022.04 2.92 .58 ------------------------------------------------------------------------------------------------- Class 529-A - actual return 1,000.00 1,040.11 5.14 1.01 Class 529-A - assumed 5% return 1,000.00 1,019.90 5.09 1.01 ------------------------------------------------------------------------------------------------- Class 529-C - actual return 1,000.00 1,036.53 8.68 1.71 Class 529-C - assumed 5% return 1,000.00 1,016.40 8.60 1.71 ------------------------------------------------------------------------------------------------- Class 529-E - actual return 1,000.00 1,039.39 5.85 1.15 Class 529-E - assumed 5% return 1,000.00 1,019.20 5.79 1.15 ------------------------------------------------------------------------------------------------- Class 529-T - actual return/2/ 1,000.00 1,019.62 1.12 .75 Class 529-T - assumed 5% return/2/ 1,000.00 1,021.19 3.78 .75 ------------------------------------------------------------------------------------------------- Class 529-F-1 - actual return 1,000.00 1,041.63 3.66 .72 Class 529-F-1 - assumed 5% return 1,000.00 1,021.34 3.63 .72 ------------------------------------------------------------------------------------------------- Class R-1 - actual return 1,000.00 1,040.02 5.54 1.09 Class R-1 - assumed 5% return 1,000.00 1,019.50 5.49 1.09 ------------------------------------------------------------------------------------------------- Class R-2 - actual return 1,000.00 1,038.02 7.22 1.42 Class R-2 - assumed 5% return 1,000.00 1,017.85 7.14 1.42 ------------------------------------------------------------------------------------------------- Class R-2E - actual return 1,000.00 1,042.13 3.11 .61 Class R-2E - assumed 5% return 1,000.00 1,021.89 3.07 .61 ------------------------------------------------------------------------------------------------- Class R-3 - actual return 1,000.00 1,039.59 5.75 1.13 Class R-3 - assumed 5% return 1,000.00 1,019.30 5.69 1.13 ------------------------------------------------------------------------------------------------- Class R-4 - actual return 1,000.00 1,041.08 4.38 .86 Class R-4 - assumed 5% return 1,000.00 1,020.64 4.33 .86 ------------------------------------------------------------------------------------------------- Class R-5E - actual return 1,000.00 1,042.22 3.05 .60 Class R-5E - assumed 5% return 1,000.00 1,021.94 3.02 .60 ------------------------------------------------------------------------------------------------- Class R-5 - actual return 1,000.00 1,041.98 3.21 .63 Class R-5 - assumed 5% return 1,000.00 1,021.79 3.18 .63 ------------------------------------------------------------------------------------------------- Class R-6 - actual return 1,000.00 1,041.63 3.10 .61 Class R-6 - assumed 5% return 1,000.00 1,021.89 3.07 .61 ------------------------------------------------------------------------------------------------- /1/The "expenses paid during period" are equal to the "annualized expense ratio," multiplied by the average account value over the period, multiplied by the number of days in the period, and divided by 365 (to reflect the one-half year period). /2/The period for the "annualized expense ratio" and "actual return" line is based on the number of days since the share class began investment operations on April 7, 2017. The "assumed 5% return" line is based on 182 days. /3/The period for the "annualized expense ratio" and "actual return" line is based on the number of days since the share class began investment operations on January 27, 2017. The "assumed 5% return" line is based on 182 days. 26 American Funds Corporate Bond Fund Tax information unaudited -------------------------------------------------------------------------------- We are required to advise you of the federal tax status of certain distributions received by shareholders during the fiscal year. The fund hereby designates the following amounts for the fund's fiscal year ended May 31, 2017: Long-term capital gains $153,000 ------------------------------------------------------------------------ Qualified dividend income $47,000 ------------------------------------------------------------------------ Corporate dividends received deduction $28,000 ------------------------------------------------------------------------ U.S. government income that may be exempt from state taxation $84,000 ------------------------------------------------------------------------ Individual shareholders should refer to their Form 1099 or other tax information, which will be mailed in January 2018, to determine the calendar year amounts to be included on their 2017 tax returns. Shareholders should consult their tax advisors. American Funds Corporate Bond Fund 27 Approval of Investment Advisory and Service Agreement -------------------------------------------------------------------------------- American Funds Corporate Bond Fund's board has approved the fund's Investment Advisory and Service Agreement (the "agreement") with Capital Research and Management Company ("CRMC") for an additional one-year term through April 30, 2018. The board approved the agreement following the recommendation of the fund's Contracts Committee (the "committee"), which is composed of all of the fund's independent board members. The board and the committee determined that the fund's advisory fee structure was fair and reasonable in relation to the services provided, and that approving the agreement was in the best interests of the fund and its shareholders. In reaching this decision, the board and the committee took into account information furnished to them throughout the year and otherwise provided to them, as well as information prepared specifically in connection with their review of the agreement, and were advised by their independent counsel. They considered the following factors, among others, but did not identify any single issue or particular piece of information that, in isolation, was the controlling factor, and each board and committee member did not necessarily attribute the same weight to each factor. 1. Nature, extent and quality of services The board and the committee considered the depth and quality of CRMC's investment management process, including its global research capabilities; the experience, capability and integrity of its senior management and other personnel; the low turnover rates of its key personnel; the overall financial strength and stability of CRMC and the Capital Group organization; and the ongoing evolution of CRMC's organizational structure designed to maintain and strengthen these qualities. The board and the committee also considered the nature, extent and quality of administrative, compliance and shareholder services provided by CRMC to the fund under the agreement and other agreements, as well as the benefits to fund shareholders from investing in a fund that is part of a large family of funds. The board and the committee concluded that the nature, extent and quality of the services provided by CRMC have benefited and should continue to benefit the fund and its shareholders. 2. Investment results The board and the committee considered the investment results of the fund in light of its objective of seeking to provide maximum total return consistent with capital preservation and prudent risk management. They compared the fund's investment results with those of other funds (including funds that currently form the basis of the Lipper index for the category in which the fund is included), and data such as relevant market and fund indexes, over various periods through October 31, 2016. This report, including the letter to shareholders and related disclosures, contains certain information about the fund's investment results. The board and the committee reviewed the fund's investment results measured against the Lipper Corporate Debt Funds BBB-Rated Average, the Lipper Corporate Debt Funds A-Rated Average and the Bloomberg Barclays U.S. Corporate Investment Grade Index. They noted that for the fund's short history its investment results were above the results of the Lipper and Barclays indexes for all periods covered. The board and the committee concluded that the fund's investment results have been satisfactory for renewal of the agreement and that CRMC's record in managing the fund indicated that its continued management should benefit the fund and its shareholders. 3. Advisory fees and total expenses The board and the committee compared the advisory fees and total expense levels of the fund to those of other relevant funds. They observed that the fund's advisory fees and total expenses were in line with the median level of other funds in the Lipper Corporate Debt Funds BBB-Rated category. In addition, they reviewed information regarding the effective advisory fees charged to non-mutual fund clients by CRMC and its affiliates. They noted that, to the extent there were differences between the advisory fees paid by the fund and the advisory fees paid by those clients, the differences appropriately reflected the investment, operational, regulatory and market differences between advising the fund and the other clients. The board and the committee concluded that the fund's cost structure was fair and reasonable in relation to the services provided, and that the fund's shareholders receive reasonable value in return for the advisory fees and other amounts paid to CRMC by the fund. 28 American Funds Corporate Bond Fund -------------------------------------------------------------------------------- 4. Ancillary benefits The board and the committee considered a variety of other benefits that CRMC and its affiliates receive as a result of CRMC's relationship with the fund and other American Funds, including fees for administrative services provided to certain share classes; fees paid to CRMC's affiliated transfer agent; sales charges and distribution fees received and retained by the fund's principal underwriter, an affiliate of CRMC; and possible ancillary benefits to CRMC and its institutional management affiliates in managing other investment vehicles. The board and the committee reviewed CRMC's portfolio trading practices, noting the benefits CRMC receives from the research obtained with commissions from portfolio transactions made on behalf of the fund. The board and the committee took these ancillary benefits into account in evaluating the reasonableness of the advisory fees and other amounts paid to CRMC by the fund. 5. Adviser financial information The board and the committee reviewed information regarding CRMC's costs of providing services to the American Funds, including personnel, systems and resources of investment, compliance, trading, accounting and other administrative operations. They considered CRMC's costs and related cost allocation methodology as well as its willingness to invest in technology, infrastructure and staff to maintain and expand services and capabilities, respond to industry and regulatory developments, and attract and retain qualified personnel. They noted information regarding the compensation structure for CRMC's investment professionals. The board and the committee also compared CRMC's profitability and compensation data to the reported results and data of several large, publicly held investment management companies. The board and the committee noted the competitiveness and cyclicality of both the mutual fund industry and the capital markets, and the importance in that environment of CRMC's long-term profitability for maintaining its independence, company culture and management continuity. They further considered the breakpoint discounts in the fund's advisory fee structure. The board and the committee concluded that the fund's advisory fee structure reflected a reasonable sharing of benefits between CRMC and the fund's shareholders. American Funds Corporate Bond Fund 29 This page was intentionally left blank. 30 American Funds Corporate Bond Fund This page was intentionally left blank. American Funds Corporate Bond Fund 31 This page was intentionally left blank. 32 American Funds Corporate Bond Fund This page was intentionally left blank. American Funds Corporate Bond Fund 33 Board of trustees and other officers Independent trustees/1/ -------------------------------------------------------------------------------- Year first Number of elected a portfolios in fund trustee Principal occupation(s) during past complex overseen Other directorships/3/ Name and year of birth of the fund/2/ five years by trustee held by trustee --------------------------------------------------------------------------------------------------------------------------------- William H. Baribault, 2012 CEO and President, Richard Nixon 80 General Finance Corporation 1945 Foundation; Chairman of the Board and CEO, Oakwood Enterprises (private investment and consulting) --------------------------------------------------------------------------------------------------------------------------------- James G. Ellis, 1947 2012 Dean and Professor of Marketing, 80 Mercury General Corporation Marshall School of Business, University of Southern California --------------------------------------------------------------------------------------------------------------------------------- Leonard R. Fuller, 1946 2012 Private investor; former President 80 None and CEO, Fuller Consulting (financial management consulting) --------------------------------------------------------------------------------------------------------------------------------- Mary Davis Holt, 1950 2015-2016 Principal, Mary Davis Holt 77 None 2017 Enterprises, LLC (leadership development consulting); former Partner, Flynn Heath Holt Leadership, LLC (leadership consulting); former COO, Time Life Inc. --------------------------------------------------------------------------------------------------------------------------------- R. Clark Hooper, 1946 2012 Private investor 80 None Chairman of the Board (Independent and Non-Executive) --------------------------------------------------------------------------------------------------------------------------------- Merit E. Janow, 1958 2012 Dean and Professor, Columbia 79 MasterCard Incorporated; University, School of International Trimble Inc. and Public Affairs --------------------------------------------------------------------------------------------------------------------------------- Laurel B. Mitchell, PhD, 2012 Distinguished Professor of 76 None 1955 Accounting, University of Redlands; former Director, Accounting Program, University of Redlands --------------------------------------------------------------------------------------------------------------------------------- Frank M. Sanchez, 1943 2012 Principal, The Sanchez Family 76 None Corporation dba McDonald's Restaurants (McDonald's licensee) --------------------------------------------------------------------------------------------------------------------------------- Margaret Spellings, 2012 President, The University of North 81 ClubCorp Holdings, Inc. 1957 Carolina; former President, George W. Bush Foundation; former President and CEO, Margaret Spellings & Company (public policy and strategic consulting); former President, U.S. Chamber Foundation and Senior Advisor to the President and CEO, U.S. Chamber of Commerce --------------------------------------------------------------------------------------------------------------------------------- Steadman Upham, PhD, 2012 President Emeritus and University None 1949 Professor, The University 79 of Tulsa --------------------------------------------------------------------------------------------------------------------------------- Interested trustees/4,5/ Year first Principal occupation(s) during past elected five years Number of a trustee and positions held with affiliated portfolios in fund Name, year of birth and or officer entities or complex overseen Other directorships/3/ position with fund of the fund/2/ the principal underwriter of the fund by trustee held by trustee --------------------------------------------------------------------------------------------------------------------------------- John H. Smet, 1956 2012 Partner - Capital Fixed Income 22 None Vice Chairman of the Investors, Board Capital Research and Management Company; Director, Capital Research and Management Company --------------------------------------------------------------------------------------------------------------------------------- Michael C. Gitlin, 1970 2015 Partner - Capital Fixed Income 18 None Investors, Capital Research and Management Company; Director, The Capital Group Companies, Inc.;/6/ served as Head of Fixed Income at a large investment management firm prior to joining Capital Research and Management Company in 2015 --------------------------------------------------------------------------------------------------------------------------------- The fund's statement of additional information includes further details about fund trustees and is available without charge upon request by calling American Funds Service Company at (800) 421-4225 or by visiting the American Funds website at americanfunds.com. The address for all trustees and officers of the fund is 333 South Hope Street, Los Angeles, CA 90071, Attention: Secretary. See page 35 for footnotes. 34 American Funds Corporate Bond Fund Other officers/5/ -------------------------------------------------------------------------------- Year first elected an Principal occupation(s) during past five years and positions held with Name, year of birth and officer affiliated entities position with fund of the fund/2/ or the principal underwriter of the fund ----------------------------------------------------------------------------------------------------------------------------- David S. Lee, 1972 2015 Partner - Capital Fixed Income Investors, Capital Research and Management President Company; Partner - Capital Fixed Income Investors, Capital Bank and Trust Company/6/ ----------------------------------------------------------------------------------------------------------------------------- Kristine M. Nishiyama, 1970 2012 Senior Vice President and Senior Counsel - Fund Business Management Group, Senior Vice President Capital Research and Management Company; Senior Vice President and General Counsel, Capital Bank and Trust Company/6/ ----------------------------------------------------------------------------------------------------------------------------- Steven I. Koszalka, 1964 2012 Vice President - Fund Business Management Group, Capital Research and Secretary Management Company ----------------------------------------------------------------------------------------------------------------------------- Brian C. Janssen, 1972 2012 Vice President - Investment Operations, Capital Research and Management Company Treasurer ----------------------------------------------------------------------------------------------------------------------------- Jane Y. Chung, 1974 2014 Associate - Fund Business Management Group, Capital Research and Management Assistant Secretary Company ----------------------------------------------------------------------------------------------------------------------------- Dori Laskin, 1951 2012 Vice President - Investment Operations, Capital Research and Management Company Assistant Treasurer ----------------------------------------------------------------------------------------------------------------------------- Gregory F. Niland, 1971 2015 Vice President - Investment Operations, Capital Research and Management Company Assistant Treasurer ----------------------------------------------------------------------------------------------------------------------------- /1/ The term independent trustee refers to a trustee who is not an "interested person" of the fund within the meaning of the Investment Company Act of 1940. /2/ Trustees and officers of the fund serve until their resignation, removal or retirement. /3/ This includes all directorships/trusteeships (other than those in the American Funds or other funds managed by Capital Research and Management Company or its affiliates) that are held by each trustee as a trustee or director of a public company or a registered investment company. /4/ The term interested trustee refers to a trustee who is an "interested person" within the meaning of the Investment Company Act of 1940, on the basis of their affiliation with the fund's investment adviser, Capital Research and Management Company, or affiliated entities (including the fund's principal underwriter). /5/All of the trustees and/or officers listed are officers and/or directors/trustees of one or more of the other funds for which Capital Research and Management Company serves as investment adviser. /6/ Company affiliated with Capital Research and Management Company. American Funds Corporate Bond Fund 35 Offices of the fund and of the investment adviser Capital Research and Management Company 333 South Hope Street Los Angeles, CA 90071-1406 6455 Irvine Center Drive Irvine, CA 92618-4518 Transfer agent for shareholder accounts American Funds Service Company (Write to the address near you.) P.O. Box 6007 Indianapolis, IN 46206-6007 P.O. Box 2280 Norfolk, VA 23501-2280 Custodian of assets Bank of New York Mellon One Wall Street New York, NY 10286 Counsel Morgan, Lewis & Bockius LLP 300 South Grand Avenue, 22nd Floor Los Angeles, CA 90071-3132 Independent registered public accounting firm PricewaterhouseCoopers LLP 601 South Figueroa Street Los Angeles, CA 90017-3874 Principal underwriter American Funds Distributors, Inc. 333 South Hope Street Los Angeles, CA 90071-1406
Investors should carefully consider investment objectives, risks, charges and
expenses. This and other important information is contained in the fund
prospectus and summary prospectus, which can be obtained from your financial
professional and should be read carefully before investing. You may also call
American Funds Service Company (AFS) at (800) 421-4225 or visit the American
Funds website at americanfunds.com.
 "American Funds Proxy Voting Procedures and Principles" - which describes how
we vote proxies relating to portfolio securities - is available on the American
Funds website or upon request by calling AFS. The fund files its proxy voting
record with the U.S. Securities and Exchange Commission (SEC) for the 12 months
ended June 30 by August 31. The proxy voting record is available free of charge
on the SEC website at sec.gov and on the American Funds website.

A complete May 31, 2017, portfolio of American Funds Corporate Bond Fund's
investments is available free of charge by calling AFS or visiting the SEC
website (where it is part of Form N-CSR).

American Funds Corporate Bond Fund files a complete list of its portfolio
holdings with the SEC for the first and third quarters of each fiscal year on
Form N-Q. This filing is available free of charge on the SEC website. You may
also review or, for a fee, copy this filing at the SEC's Public Reference Room
in Washington, D.C. Additional information regarding the operation of the
Public Reference Room may be obtained by calling the SEC's Office of Investor
Education and Advocacy at (800) SEC-0330. Additionally, the list of portfolio
holdings is available by calling AFS.

This report is for the information of shareholders of American Funds Corporate
Bond Fund, but it also may be used as sales literature when preceded or
accompanied by the current prospectus or summary prospectus, which gives
details about charges, expenses, investment objectives and operating policies
of the fund. If used as sales material after September 30, 2017, this report
must be accompanied by an American Funds statistical update for the most
recently completed calendar quarter.

Bloomberg(R) is a trademark of Bloomberg Finance L.P. (collectively with its
affiliates, "Bloomberg"). Barclays(R) is a trademark of Barclays Bank Plc
(collectively with its affiliates, "Barclays"), used under license. Neither
Bloomberg nor Barclays approves or endorses this material, guarantees the
accuracy or completeness of any information herein and, to the maximum extent
allowed by law, neither shall have any liability or responsibility for injury
or damages arising in connection therewith.

                     36  American Funds Corporate Bond Fund


American Funds from Capital Group

The Capital Advantage/SM/

Since 1931, American Funds, part of Capital Group, has helped
investors pursue long-term investment success. Our consistent
approach - in combination with The Capital System/SM/ - has
resulted in a superior long-term track record.

Aligned with                              The Capital                              American Funds' superior
investor success                          System                                   long-term track record

We base our decisions on a long-term      The Capital System combines              Equity funds have beaten their
perspective, which we believe aligns      individual accountability with           Lipper peer indexes in 93% of
our goals with the interests of our       teamwork. Funds using The Capital        10-year periods and 98% of 20-year
clients. Our portfolio managers           System are divided into portions         periods. Fixed income funds have
average 27 years of investment            that are managed independently by        beaten their Lipper indexes in 80%
experience, including 21 years at our     investment professionals with            of 10-year periods and 80% of
company, reflecting a career              diverse backgrounds, ages and            20-year periods./2/ Fund management
commitment to our long-term               investment approaches. An extensive      fees have been among the lowest in
approach./1/                              global research effort is the            the industry./3/
                                          backbone of our system.


    /1/Portfolio manager experience as of December 31, 2016.

    /2/Based on Class F-2 share results for rolling periods through
     December 31, 2016. Periods covered are the shorter of the fund's lifetime
     or since the comparable Lipper index inception date (except Capital Income
     Builder and SMALLCAP World Fund, for which the Lipper average was used).
     Expenses differ for each share class, so results will vary. Class F-2
     shares were first offered on August 1, 2008. Class F-2 share results prior
     to the date of first sale are hypothetical based on Class A share results
     without a sales charge, adjusted for typical estimated expenses. Results
     for certain funds with an inception date after August 1, 2008, also
     include hypothetical returns because those funds' Class F-2 shares sold
     after the funds' date of first offering. Please see americanfunds.com for
     more information on specific expense adjustments and the actual dates of
     first sale.

    /3/On average, our management fees were in the lowest quintile 73% of the
     time, based on the 20-year period ended December 31, 2016, versus
     comparable Lipper categories, excluding funds of funds.


                   Printed on recycled paper.
Lit No. MFGEARX-032-0717P   Litho in USA   CT/RRD/10275-S61192
Printed on recycled paper.
Lit No. MFGEARX-032-0717P Litho in USA CT/RRD/10275-S61192
ITEM 2 – Code of Ethics
The Registrant has adopted a Code of Ethics that applies to its Principal Executive Officer and Principal Financial Officer. The Registrant undertakes to provide to any person without charge, upon request, a copy of the Code of Ethics. Such request can be made to American Funds Service Company at 800/421-9225 or to the Secretary of the Registrant, 6455 Irvine Center Drive, Irvine, California 92618.
ITEM 3 – Audit Committee Financial Expert
The Registrant’s board has determined that Laurel B. Mitchell, a member of the Registrant’s audit committee, is an “audit committee financial expert” and "independent," as such terms are defined in this Item. This designation will not increase the designee’s duties, obligations or liability as compared to his or her duties, obligations and liability as a member of the audit committee and of the board, nor will it reduce the responsibility of the other audit committee members. There may be other individuals who, through education or experience, would qualify as "audit committee financial experts" if the board had designated them as such. Most importantly, the board believes each member of the audit committee contributes significantly to the effective oversight of the Registrant’s financial statements and condition.
ITEM 4 – Principal Accountant Fees and Services
| Registrant: | ||
| a) Audit Fees: | ||
| 2016 | $79,000 | |
| 2017 | $83,000 | |
| b) Audit-Related Fees: | ||
| 2016 | None | |
| 2017 | None | |
| c) Tax Fees: | ||
| 2016 | $8,000 | |
| 2017 | $9,000 | |
| The tax fees consist of professional services relating to the preparation of the Registrant’s tax returns. | ||
| d) All Other Fees: | ||
| 2016 | None | |
| 2017 | None | |
| Adviser and affiliates (includes only fees for non-audit services billed to the adviser and affiliates for engagements that relate directly to the operations and financial reporting of the Registrant and were subject to the pre-approval policies described below): | ||
| a) Audit Fees: | ||
| Not Applicable | ||
| b) Audit-Related Fees: | ||
| 2016 | None | |
| 2017 | None | |
| The audit-related fees consist of assurance and related services relating to the examination of the Registrant’s transfer agent, principal underwriter and investment adviser conducted in accordance with Statement on Standards for Attestation Engagements Number 16 issued by the American Institute of Certified Public Accountants. | ||
| c) Tax Fees: | ||
| 2016 | $17,000 | |
| 2017 | None | |
| The tax fees consist of consulting services relating to the Registrant’s investments. | ||
| d) All Other Fees: | ||
| 2016 | $2,000 | |
| 2017 | $2,000 | |
| The other fees consist of subscription services related to an accounting research tool. | ||
| All audit and permissible non-audit services that the Registrant’s audit committee considers compatible with maintaining the independent registered public accounting firm’s independence are required to be pre-approved by the committee. The pre-approval requirement will extend to all non-audit services provided to the Registrant, the investment adviser, and any entity controlling, controlled by, or under common control with the investment adviser that provides ongoing services to the Registrant, if the engagement relates directly to the operations and financial reporting of the Registrant. The committee will not delegate its responsibility to pre-approve these services to the investment adviser. The committee may delegate to one or more committee members the authority to review and pre-approve audit and permissible non-audit services. Actions taken under any such delegation will be reported to the full committee at its next meeting. The pre-approval requirement is waived with respect to non-audit services if certain conditions are met. The pre-approval requirement was not waived for any of the non-audit services listed above provided to the Registrant, adviser and affiliates. | ||
| Aggregate non-audit fees paid to the Registrant’s auditors, including fees for all services billed to the Registrant, adviser and affiliates that provide ongoing services to the Registrant, were $27,000 for fiscal year 2016 and $11,000 for fiscal year 2017. The non-audit services represented by these amounts were brought to the attention of the committee and considered to be compatible with maintaining the auditors’ independence. | ||
-----------------------
ITEM 5 – Audit Committee of Listed Registrants
Not applicable to this Registrant, insofar as the Registrant is not a listed issuer as defined in Rule 10A-3 under the Securities Exchange Act of 1934.
ITEM 6 – Schedule of Investments

| Bonds, notes & other debt instruments92.76% Corporate bonds & notes88.72% Financials15.64% | Principal?amount (000) | Value (000) |
| ACE INA Holdings Inc. 2.30% 2020 | $200 | $202 |
| ACE INA Holdings Inc. 2.875% 2022 | 15 | 15 |
| ACE INA Holdings Inc. 3.35% 2026 | 100 | 103 |
| ACE INA Holdings Inc. 4.35% 2045 | 20 | 22 |
| Banco Santander, SA 3.70% 20221 | 900 | 909 |
| Bank of America Corp. 2.625% 2020 | 375 | 379 |
| Bank of America Corp. 3.50% 2026 | 250 | 251 |
| Bank of America Corp. 3.248% 2027 | 325 | 316 |
| Bank of America Corp. 3.705% 2028 | 1,225 | 1,237 |
| Bank of America Corp. 4.244% 2038 | 200 | 205 |
| Bank of Nova Scotia 2.70% 2022 | 1,500 | 1,517 |
| Barclays Bank PLC 4.375% 2026 | 1,000 | 1,045 |
| Barclays Bank PLC 4.95% 2047 | 250 | 268 |
| Berkshire Hathaway Inc. 2.20% 2021 | 125 | 126 |
| Berkshire Hathaway Inc. 3.125% 2026 | 150 | 153 |
| BPCE SA group 5.70% 20231 | 200 | 222 |
| BPCE SA group 5.15% 20241 | 200 | 213 |
| Citigroup Inc. 2.116% 20222 | 300 | 301 |
| Citigroup Inc. 2.75% 2022 | 325 | 326 |
| Citigroup Inc. 3.20% 2026 | 1,675 | 1,630 |
| Crédit Agricole SA 3.375% 20221 | 925 | 943 |
| Credit Suisse Group AG 3.80% 2023 | 725 | 746 |
| Credit Suisse Group AG 4.55% 2026 | 925 | 983 |
| Credit Suisse Group AG 4.282% 20281 | 600 | 620 |
| Danske Bank AS 2.70% 20221 | 200 | 202 |
| Goldman Sachs Group, Inc. 2.908% 2023 | 1,750 | 1,750 |
| Goldman Sachs Group, Inc. 3.75% 2025 | 188 | 193 |
| Goldman Sachs Group, Inc. 3.50% 2026 | 1,050 | 1,043 |
| Goldman Sachs Group, Inc. 3.691% 2028 | 798 | 798 |
| HSBC Holdings PLC 4.041% 2028 | 1,250 | 1,294 |
| Intesa Sanpaolo SpA 5.017% 20241 | 430 | 420 |
| JPMorgan Chase & Co. 3.54% 2028 | 295 | 297 |
| JPMorgan Chase & Co. 3.782% 2028 | 995 | 1,021 |
| MetLife Global Funding I 2.00% 20201 | 150 | 150 |
| MetLife Global Funding I 2.50% 20201 | 150 | 151 |
| MetLife Global Funding I 1.95% 20211 | 600 | 590 |
| Metropolitan Life Global Funding I, 3.45% 20261 | 150 | 155 |
| Morgan Stanley, (3-month USD-LIBOR + 1.22%) 2.373% 20242 | 2,725 | 2,738 |
| Morgan Stanley 3.625% 2027 | 1,352 | 1,365 |
| New York Life Global Funding 1.50% 20191 | 60 | 59 |
| New York Life Global Funding 1.70% 20211 | 900 | 879 |
| New York Life Global Funding 2.00% 20211 | 500 | 498 |
| QBE Insurance Group Ltd. 2.40% 20181 | 250 | 251 |
| Rabobank Nederland 4.375% 2025 | 250 | 263 |
| Royal Bank of Canada 2.125% 2020 | 1,500 | 1,505 |
| Royal Bank of Scotland PLC 3.498% 2023 | 1,250 | 1,254 |
| Bonds, notes & other debt instruments Corporate bonds & notes (continued) Financials (continued) | Principal?amount (000) | Value (000) |
| Swedbank AB 2.80% 20221 | $950 | $964 |
| TD Ameritrade Holding Co. 3.30% 2027 | 1,250 | 1,258 |
| Toronto-Dominion Bank 1.45% 2018 | 475 | 474 |
| Travelers Companies, Inc. 4.00% 2047 | 105 | 107 |
| U.S. Bancorp 3.15% 2027 | 1,100 | 1,107 |
| UniCredit SPA 4.625% 20271 | 1,575 | 1,611 |
| US Bancorp. 2.625% 2022 | 1,050 | 1,065 |
| Wells Fargo & Co. 3.00% 2026 | 625 | 609 |
| Wells Fargo & Co. 3.584% 2028 | 1,575 | 1,595 |
| 38,398 | ||
| Health care15.64% | ||
| Abbott Laboratories 2.90% 2021 | 1,535 | 1,560 |
| Abbott Laboratories 3.40% 2023 | 1,205 | 1,234 |
| Abbott Laboratories 3.75% 2026 | 1,930 | 1,972 |
| Abbott Laboratories 4.75% 2036 | 50 | 53 |
| Abbott Laboratories 4.90% 2046 | 495 | 529 |
| AbbVie Inc. 2.50% 2020 | 100 | 101 |
| AbbVie Inc. 2.30% 2021 | 330 | 330 |
| AbbVie Inc. 2.85% 2023 | 985 | 985 |
| AbbVie Inc. 3.20% 2026 | 1,900 | 1,879 |
| AbbVie Inc. 4.45% 2046 | 1,210 | 1,213 |
| Allergan PLC 2.35% 2018 | 100 | 100 |
| Allergan PLC 3.00% 2020 | 300 | 307 |
| Allergan PLC 3.80% 2025 | 2,475 | 2,559 |
| Allergan PLC 4.75% 2045 | 313 | 333 |
| Amgen Inc. 1.85% 2021 | 370 | 364 |
| Amgen Inc. 2.65% 2022 | 1,425 | 1,434 |
| AstraZeneca PLC 1.75% 2018 | 100 | 100 |
| AstraZeneca PLC 3.375% 2025 | 175 | 179 |
| AstraZeneca PLC 4.375% 2045 | 100 | 107 |
| Becton, Dickinson and Co. 2.675% 2019 | 49 | 50 |
| Becton, Dickinson and Co. 2.894% 2022 | 310 | 311 |
| Becton, Dickinson and Co. 3.363% 2024 | 2,325 | 2,336 |
| Becton, Dickinson and Co. 3.70% 2027 | 2,900 | 2,905 |
| Becton, Dickinson and Co. 4.669% 2047 | 95 | 97 |
| Biogen Inc. 3.625% 2022 | 525 | 552 |
| Biogen Inc. 5.20% 2045 | 400 | 446 |
| Boston Scientific Corp. 2.85% 2020 | 150 | 153 |
| Boston Scientific Corp. 3.375% 2022 | 200 | 207 |
| Boston Scientific Corp. 3.85% 2025 | 100 | 103 |
| Celgene Corp. 3.875% 2025 | 228 | 239 |
| Celgene Corp. 5.00% 2045 | 130 | 142 |
| EMD Finance LLC 2.40% 20201 | 50 | 50 |
| EMD Finance LLC 2.95% 20221 | 425 | 434 |
| EMD Finance LLC 3.25% 20251 | 625 | 629 |
| Humana Inc. 3.95% 2027 | 175 | 183 |
| Johnson & Johnson 1.125% 2019 | 400 | 398 |
| Laboratory Corporation of America Holdings 2.625% 2020 | 200 | 202 |
| Medtronic, Inc. 3.35% 2027 | 525 | 537 |
| Medtronic, Inc. 4.625% 2045 | 300 | 334 |
| Roche Holdings, Inc. 3.35% 20241 | 200 | 208 |
| Roche Holdings, Inc. 2.375% 20271 | 535 | 512 |
| Shire PLC 2.40% 2021 | 1,400 | 1,392 |
| Bonds, notes & other debt instruments Corporate bonds & notes (continued) Health care (continued) | Principal?amount (000) | Value (000) |
| Shire PLC 2.875% 2023 | $2,220 | $2,204 |
| Shire PLC 3.20% 2026 | 605 | 592 |
| Teva Pharmaceutical Finance Company BV 2.20% 2021 | 1,050 | 1,030 |
| Teva Pharmaceutical Finance Company BV 2.80% 2023 | 390 | 379 |
| Teva Pharmaceutical Finance Company BV 3.15% 2026 | 1,815 | 1,708 |
| Teva Pharmaceutical Finance Company BV 4.10% 2046 | 825 | 729 |
| UnitedHealth Group Inc. 2.125% 2021 | 100 | 100 |
| UnitedHealth Group Inc. 3.75% 2025 | 200 | 212 |
| UnitedHealth Group Inc. 3.375% 2027 | 850 | 872 |
| UnitedHealth Group Inc. 3.45% 2027 | 475 | 490 |
| WellPoint, Inc. 3.125% 2022 | 1,325 | 1,355 |
| Zimmer Holdings, Inc. 2.00% 2018 | 100 | 100 |
| Zimmer Holdings, Inc. 2.70% 2020 | 300 | 304 |
| Zimmer Holdings, Inc. 3.15% 2022 | 400 | 407 |
| Zimmer Holdings, Inc. 3.55% 2025 | 145 | 146 |
| 38,387 | ||
| Utilities13.14% | ||
| American Electric Power Co., Inc. 2.75% 2026 | 200 | 193 |
| American Electric Power Co., Inc. 3.30% 2027 | 500 | 510 |
| CMS Energy Corp. 5.05% 2022 | 1,175 | 1,298 |
| CMS Energy Corp. 3.00% 2026 | 700 | 684 |
| CMS Energy Corp. 2.95% 2027 | 600 | 579 |
| Colbun SA 6.00% 20201 | 300 | 326 |
| Comision Federal de Electricidad 4.75% 20271 | 500 | 510 |
| Commonwealth Edison Company 2.55% 2026 | 75 | 73 |
| Dominion Resources, Inc. 1.875% 20181 | 500 | 499 |
| Dominion Resources, Inc. 2.579% 2020 | 425 | 429 |
| Dominion Resources, Inc. 2.75% 2022 | 1,255 | 1,272 |
| Duke Energy Corp. 2.65% 2026 | 1,420 | 1,356 |
| EDP Finance BV 5.25% 20211 | 400 | 431 |
| Electricité de France SA 4.95% 20451 | 850 | 892 |
| Empresa Nacional de Electricidad SA 4.25% 2024 | 150 | 157 |
| Enel Finance International SA 6.00% 20391 | 250 | 294 |
| Enel Società per Azioni 8.75% 20731 | 400 | 474 |
| Entergy Corp. 2.95% 2026 | 950 | 919 |
| Eversource Energy 2.75% 2022 | 845 | 856 |
| Eversource Energy 2.80% 2023 | 500 | 504 |
| Exelon Corp. 3.497% 2022 | 3,325 | 3,408 |
| FirstEnergy Corp. 7.375% 2031 | 1,050 | 1,404 |
| FirstEnergy Corp., Series B, 4.25% 2023 | 675 | 705 |
| Great Plains Energy Inc. 4.85% 2047 | 2,762 | 2,850 |
| Iberdrola Finance Ireland 5.00% 20191 | 150 | 159 |
| Mississippi Power Co. 4.25% 2042 | 1,100 | 968 |
| National Rural Utilities Cooperative Finance Corp. 2.40% 2022 | 925 | 931 |
| New York State Electric & Gas Corp. 3.25% 20261 | 100 | 101 |
| NextEra Energy, Inc. 1.649% 2018 | 500 | 499 |
| Niagara Mohawk Power Corp. 3.508% 20241 | 300 | 311 |
| Pacific Gas and Electric Co. 3.30% 2027 | 1,075 | 1,101 |
| Public Service Co. of Colorado 2.25% 2022 | 250 | 248 |
| Public Service Co. of Colorado 2.50% 2023 | 300 | 299 |
| Public Service Enterprise Group Inc. 1.60% 2019 | 515 | 509 |
| Public Service Enterprise Group Inc. 2.00% 2021 | 1,500 | 1,465 |
| Puget Energy, Inc. 6.50% 2020 | 101 | 114 |
| Bonds, notes & other debt instruments Corporate bonds & notes (continued) Utilities (continued) | Principal?amount (000) | Value (000) |
| Puget Energy, Inc. 5.625% 2022 | $490 | $550 |
| Puget Energy, Inc. 3.65% 2025 | 275 | 278 |
| State Grid Overseas Investment Ltd. 3.50% 20271 | 1,570 | 1,576 |
| Teco Finance, Inc. 5.15% 2020 | 515 | 550 |
| Virginia Electric and Power Co. 2.95% 2026 | 1,000 | 994 |
| Xcel Energy Inc. 6.50% 2036 | 340 | 441 |
| Xcel Energy Inc. 4.80% 2041 | 500 | 533 |
| 32,250 | ||
| Energy11.47% | ||
| Anadarko Petroleum Corp. 4.85% 2021 | 45 | 48 |
| Anadarko Petroleum Corp. 5.55% 2026 | 345 | 388 |
| Anadarko Petroleum Corp. 6.60% 2046 | 130 | 162 |
| Canadian Natural Resources Ltd. 2.95% 2023 | 245 | 246 |
| Canadian Natural Resources Ltd. 3.85% 2027 | 805 | 807 |
| Canadian Natural Resources Ltd. 4.95% 2047 | 645 | 652 |
| Cenovus Energy Inc. 4.25% 20271 | 1,910 | 1,905 |
| Cenovus Energy Inc. 5.40% 20471 | 150 | 146 |
| Chevron Corp. 1.561% 2019 | 170 | 170 |
| Chevron Corp. 2.10% 2021 | 1,225 | 1,225 |
| Chevron Corp. 2.498% 2022 | 1,340 | 1,357 |
| Chevron Corp. 2.954% 2026 | 1,250 | 1,250 |
| ConocoPhillips 4.20% 2021 | 115 | 123 |
| ConocoPhillips 4.95% 2026 | 950 | 1,067 |
| Devon Energy Corp. 5.85% 2025 | 615 | 716 |
| Devon Energy Corp. 5.00% 2045 | 105 | 108 |
| Ecopetrol SA 5.875% 2023 | 30 | 33 |
| Enbridge Energy Partners, LP 4.375% 2020 | 60 | 63 |
| Enbridge Energy Partners, LP 5.875% 2025 | 85 | 98 |
| Enbridge Energy Partners, LP 7.375% 2045 | 1,190 | 1,563 |
| Enbridge Inc. 4.00% 2023 | 255 | 268 |
| Enbridge Inc. 4.25% 2026 | 300 | 317 |
| Enbridge Inc. 5.50% 2046 | 980 | 1,099 |
| Energy Transfer Partners, LP 4.75% 2026 | 75 | 79 |
| Energy Transfer Partners, LP 4.20% 2027 | 520 | 531 |
| Energy Transfer Partners, LP 6.125% 2045 | 215 | 240 |
| Energy Transfer Partners, LP 5.30% 2047 | 40 | 40 |
| EnLink Midstream Partners, LP 2.70% 2019 | 60 | 60 |
| EnLink Midstream Partners, LP 4.85% 2026 | 270 | 285 |
| EnLink Midstream Partners, LP 5.45% 2047 | 1,040 | 1,049 |
| Exxon Mobil Corp. 2.222% 2021 | 625 | 632 |
| Halliburton Co. 3.80% 2025 | 720 | 745 |
| Halliburton Co. 5.00% 2045 | 1,085 | 1,171 |
| Kinder Morgan Energy Partners, LP 5.40% 2044 | 25 | 26 |
| Kinder Morgan Finance Co. 5.05% 2046 | 1,060 | 1,072 |
| Kinder Morgan, Inc. 5.55% 2045 | 550 | 588 |
| MPLX LP 4.125% 2027 | 15 | 15 |
| MPLX LP 5.20% 2047 | 10 | 10 |
| Petróleos Mexicanos 5.375% 20221 | 350 | 373 |
| Petróleos Mexicanos 6.875% 2026 | 90 | 101 |
| Petróleos Mexicanos 6.50% 20271 | 495 | 540 |
| Petróleos Mexicanos 5.625% 2046 | 325 | 294 |
| Petróleos Mexicanos 6.75% 2047 | 1,075 | 1,108 |
| Phillips 66 Partners LP 3.55% 2026 | 10 | 10 |
| Bonds, notes & other debt instruments Corporate bonds & notes (continued) Energy (continued) | Principal?amount (000) | Value (000) |
| Phillips 66 Partners LP 4.90% 2046 | $10 | $10 |
| Royal Dutch Shell PLC 1.75% 2021 | 275 | 271 |
| Royal Dutch Shell PLC 2.50% 2026 | 300 | 289 |
| Royal Dutch Shell PLC 3.75% 2046 | 520 | 494 |
| Sabine Pass Liquefaction, LLC 5.625% 2025 | 607 | 675 |
| Sabine Pass Liquefaction, LLC 5.00% 2027 | 655 | 701 |
| Sabine Pass Liquefaction, LLC 4.20% 20281 | 75 | 76 |
| Schlumberger BV 3.625% 20221 | 965 | 1,012 |
| Schlumberger BV 4.00% 20251 | 205 | 217 |
| Shell International Finance BV 1.875% 2021 | 275 | 273 |
| Shell International Finance BV 2.875% 2026 | 55 | 55 |
| Shell International Finance BV 4.00% 2046 | 300 | 297 |
| Valero Energy Partners LP 4.375% 2026 | 45 | 47 |
| Western Gas Partners LP 4.65% 2026 | 390 | 412 |
| Williams Partners LP 4.00% 2025 | 370 | 381 |
| Williams Partners LP 5.40% 2044 | 135 | 144 |
| Williams Partners LP 5.10% 2045 | 21 | 22 |
| 28,156 | ||
| Consumer discretionary7.56% | ||
| Amazon.com, Inc. 4.95% 2044 | 275 | 323 |
| Bayerische Motoren Werke AG 2.15% 20201 | 100 | 101 |
| Bayerische Motoren Werke AG 1.85% 20211 | 1,000 | 981 |
| Bayerische Motoren Werke AG 2.00% 20211 | 500 | 497 |
| CCO Holdings LLC and CCO Holdings Capital Corp. 3.579% 2020 | 200 | 208 |
| CCO Holdings LLC and CCO Holdings Capital Corp. 4.908% 2025 | 590 | 640 |
| CCO Holdings LLC and CCO Holdings Capital Corp. 5.375% 20471 | 805 | 842 |
| Comcast Corp. 3.00% 2024 | 1,000 | 1,017 |
| Comcast Corp. 3.30% 2027 | 250 | 255 |
| Comcast Corp. 4.75% 2044 | 300 | 331 |
| Daimler Finance NA LLC 2.70% 20201 | 250 | 253 |
| DaimlerChrysler North America Holding Corp. 1.50% 20191 | 300 | 297 |
| DaimlerChrysler North America Holding Corp. 2.25% 20201 | 225 | 226 |
| DaimlerChrysler North America Holding Corp. 2.00% 20211 | 350 | 345 |
| DaimlerChrysler North America Holding Corp. 2.20% 20211 | 500 | 495 |
| DaimlerChrysler North America Holding Corp. 2.85% 20221 | 1,350 | 1,373 |
| Ford Motor Co. 4.346% 2026 | 400 | 409 |
| Ford Motor Co. 5.291% 2046 | 1,425 | 1,430 |
| Ford Motor Credit Co. 3.81% 2024 | 350 | 356 |
| Ford Motor Credit Co. 4.134% 2025 | 200 | 203 |
| General Motors Co. 6.60% 2036 | 45 | 52 |
| General Motors Co. 6.75% 2046 | 105 | 122 |
| General Motors Financial Co. 3.70% 2023 | 250 | 252 |
| General Motors Financial Co. 3.95% 2024 | 875 | 878 |
| General Motors Financial Co. 4.30% 2025 | 200 | 203 |
| Home Depot, Inc. 1.80% 2020 | 250 | 250 |
| Home Depot, Inc. 2.125% 2026 | 100 | 94 |
| Home Depot, Inc. 3.90% 2047 | 50 | 51 |
| Hyundai Capital America 2.55% 20201 | 960 | 963 |
| Lowe’s Companies, Inc. 3.10% 2027 | 125 | 125 |
| Lowe’s Companies, Inc. 4.05% 2047 | 685 | 696 |
| Marriott International, Inc., Series I, 6.375% 2017 | 80 | 80 |
| McDonald’s Corp. 2.625% 2022 | 75 | 76 |
| McDonald’s Corp. 3.70% 2026 | 25 | 26 |
| Bonds, notes & other debt instruments Corporate bonds & notes (continued) Consumer discretionary (continued) | Principal?amount (000) | Value (000) |
| McDonald’s Corp. 3.50% 2027 | $150 | $154 |
| McDonald’s Corp. 4.875% 2045 | 750 | 832 |
| McDonald’s Corp. 4.45% 2047 | 700 | 735 |
| NBC Universal Enterprise, Inc. 5.25% 20491 | 475 | 505 |
| Newell Rubbermaid Inc. 2.60% 2019 | 10 | 10 |
| Newell Rubbermaid Inc. 3.15% 2021 | 80 | 83 |
| Newell Rubbermaid Inc. 3.85% 2023 | 120 | 127 |
| Newell Rubbermaid Inc. 4.20% 2026 | 415 | 441 |
| Newell Rubbermaid Inc. 5.50% 2046 | 860 | 1,019 |
| Starbucks Corp. 2.70% 2022 | 25 | 26 |
| Starbucks Corp. 4.30% 2045 | 25 | 27 |
| Toyota Motor Credit Corp. 3.20% 2027 | 140 | 143 |
| 18,552 | ||
| Consumer staples7.48% | ||
| Altria Group, Inc. 2.625% 2020 | 175 | 178 |
| Altria Group, Inc. 2.625% 2026 | 20 | 19 |
| Altria Group, Inc. 3.875% 2046 | 1,125 | 1,077 |
| Anheuser-Busch InBev NV 2.65% 2021 | 100 | 102 |
| Anheuser-Busch InBev NV 2.50% 2022 | 500 | 501 |
| Anheuser-Busch InBev NV 3.65% 2026 | 3,090 | 3,184 |
| Anheuser-Busch InBev NV 4.90% 2046 | 75 | 83 |
| Coca-Cola Co. 2.20% 2022 | 1,475 | 1,477 |
| Constellation Brands, Inc. 2.70% 2022 | 20 | 20 |
| Constellation Brands, Inc. 3.50% 2027 | 65 | 65 |
| Constellation Brands, Inc. 4.50% 2047 | 15 | 15 |
| Costco Wholesale Corp. 2.15% 2021 | 150 | 151 |
| Costco Wholesale Corp. 2.30% 2022 | 150 | 151 |
| Costco Wholesale Corp. 2.75% 2024 | 1,550 | 1,558 |
| Costco Wholesale Corp. 3.00% 2027 | 125 | 126 |
| Kraft Foods Inc. 3.50% 2022 | 750 | 779 |
| Molson Coors Brewing Co. 1.45% 2019 | 100 | 99 |
| Molson Coors Brewing Co. 1.90% 20191 | 30 | 30 |
| Molson Coors Brewing Co. 2.25% 20201 | 1,525 | 1,531 |
| Molson Coors Brewing Co. 2.10% 2021 | 200 | 197 |
| Molson Coors Brewing Co. 3.00% 2026 | 125 | 122 |
| Molson Coors Brewing Co. 4.20% 2046 | 35 | 34 |
| PepsiCo, Inc. 2.25% 2022 | 1,650 | 1,653 |
| PepsiCo, Inc. 2.375% 2026 | 60 | 58 |
| PepsiCo, Inc. 3.45% 2046 | 40 | 37 |
| PepsiCo, Inc. 4.00% 2047 | 100 | 102 |
| Philip Morris International Inc. 2.00% 2020 | 695 | 698 |
| Philip Morris International Inc. 2.625% 2022 | 100 | 101 |
| Philip Morris International Inc. 3.875% 2042 | 150 | 145 |
| Philip Morris International Inc. 4.25% 2044 | 900 | 920 |
| Procter & Gamble Co. 1.90% 2019 | 350 | 353 |
| Reynolds American Inc. 4.45% 2025 | 350 | 377 |
| Reynolds American Inc. 5.85% 2045 | 225 | 273 |
| Smithfield Foods, Inc. 3.35% 20221 | 850 | 859 |
| Walgreens Boots Alliance, Inc. 2.60% 2021 | 75 | 76 |
| Walgreens Boots Alliance, Inc. 3.10% 2023 | 105 | 106 |
| Walgreens Boots Alliance, Inc. 3.45% 2026 | 115 | 115 |
| Walgreens Boots Alliance, Inc. 4.65% 2046 | 20 | 21 |
| Bonds, notes & other debt instruments Corporate bonds & notes (continued) Consumer staples (continued) | Principal?amount (000) | Value (000) |
| WM. Wrigley Jr. Co 2.90% 20191 | $300 | $306 |
| WM. Wrigley Jr. Co 3.375% 20201 | 625 | 648 |
| 18,347 | ||
| Real estate5.26% | ||
| Alexandria Real Estate Equities, Inc. 3.95% 2028 | 35 | 36 |
| American Campus Communities, Inc. 3.35% 2020 | 260 | 268 |
| American Campus Communities, Inc. 3.75% 2023 | 1,350 | 1,403 |
| American Campus Communities, Inc. 4.125% 2024 | 200 | 210 |
| Boston Properties, Inc. 3.65% 2026 | 575 | 588 |
| Corporate Office Properties LP 3.60% 2023 | 50 | 50 |
| Corporate Office Properties LP 5.25% 2024 | 100 | 107 |
| Corporate Office Properties LP 5.00% 2025 | 30 | 32 |
| DCT Industrial Trust Inc. 4.50% 2023 | 60 | 64 |
| DDR Corp. 4.70% 2027 | 380 | 386 |
| Developers Diversified Realty Corp. 7.875% 2020 | 150 | 173 |
| EPR Properties 4.50% 2025 | 80 | 82 |
| EPR Properties 4.75% 2026 | 275 | 283 |
| Essex Portfolio L.P. 3.625% 2022 | 200 | 207 |
| Essex Portfolio L.P. 3.50% 2025 | 70 | 71 |
| Hospitality Properties Trust 6.70% 2018 | 400 | 402 |
| Host Hotels & Resorts LP 4.50% 2026 | 40 | 42 |
| Kimco Realty Corp. 3.40% 2022 | 1,540 | 1,583 |
| Kimco Realty Corp. 3.80% 2027 | 105 | 105 |
| Prologis, Inc. 3.35% 2021 | 41 | 42 |
| Scentre Group 2.375% 20211 | 130 | 129 |
| Scentre Group 3.50% 20251 | 450 | 455 |
| Scentre Group 3.75% 20271 | 1,425 | 1,451 |
| Simon Property Group, LP 2.35% 2022 | 450 | 447 |
| Simon Property Group, LP 3.25% 2026 | 775 | 773 |
| WEA Finance LLC 2.70% 20191 | 1,000 | 1,009 |
| WEA Finance LLC 3.25% 20201 | 390 | 398 |
| WEA Finance LLC 4.75% 20441 | 200 | 201 |
| Westfield Corp. Ltd. 3.15% 20221 | 1,885 | 1,912 |
| 12,909 | ||
| Information technology4.90% | ||
| Analog Devices, Inc. 2.50% 2021 | 25 | 25 |
| Analog Devices, Inc. 3.125% 2023 | 40 | 41 |
| Analog Devices, Inc. 3.50% 2026 | 35 | 35 |
| Apple Inc. 2.85% 2024 | 900 | 909 |
| Apple Inc. 3.20% 2027 | 300 | 304 |
| Apple Inc. 3.35% 2027 | 370 | 380 |
| Apple Inc. 4.25% 2047 | 420 | 441 |
| Broadcom Ltd. 3.00% 20221 | 1,800 | 1,816 |
| Broadcom Ltd. 3.625% 20241 | 475 | 484 |
| Broadcom Ltd. 3.875% 20271 | 2,325 | 2,364 |
| Cisco Systems, Inc. 1.85% 2021 | 1,700 | 1,684 |
| Harris Corp. 5.054% 2045 | 50 | 56 |
| Microsoft Corp. 1.55% 2021 | 200 | 197 |
| Microsoft Corp. 2.875% 2024 | 135 | 138 |
| Microsoft Corp. 2.40% 2026 | 50 | 48 |
| Microsoft Corp. 3.30% 2027 | 305 | 316 |
| Microsoft Corp. 3.70% 2046 | 600 | 587 |
| Bonds, notes & other debt instruments Corporate bonds & notes (continued) Information technology (continued) | Principal?amount (000) | Value (000) |
| Microsoft Corp. 4.25% 2047 | $575 | $613 |
| Oracle Corp. 1.90% 2021 | 1,075 | 1,068 |
| Oracle Corp. 2.65% 2026 | 200 | 194 |
| Oracle Corp. 4.00% 2046 | 325 | 324 |
| 12,024 | ||
| Industrials3.76% | ||
| 3M Co. 1.625% 2021 | 40 | 40 |
| 3M Co. 2.25% 2026 | 80 | 76 |
| Burlington Northern Santa Fe LLC 3.45% 2021 | 70 | 74 |
| Canadian National Railway Co. 3.20% 2046 | 35 | 32 |
| Continental Airlines, Inc., Series 1997-4, Class A, 6.90% 20193 | 8 | 8 |
| Continental Airlines, Inc., Series 2000-2, Class A1, 7.707% 20223 | 54 | 57 |
| CSX Corp. 3.25% 2027 | 275 | 279 |
| ERAC USA Finance Co. 2.70% 20231 | 1,000 | 973 |
| Honeywell International Inc. 1.85% 2021 | 935 | 923 |
| Honeywell International Inc. 2.50% 2026 | 100 | 97 |
| Lockheed Martin Corp. 1.85% 2018 | 15 | 15 |
| Lockheed Martin Corp. 2.50% 2020 | 83 | 84 |
| Lockheed Martin Corp. 3.10% 2023 | 135 | 139 |
| Lockheed Martin Corp. 3.55% 2026 | 290 | 302 |
| Lockheed Martin Corp. 4.50% 2036 | 10 | 11 |
| Lockheed Martin Corp. 4.70% 2046 | 50 | 56 |
| Rockwell Collins, Inc. 2.80% 2022 | 1,215 | 1,234 |
| Roper Technologies, Inc. 2.80% 2021 | 25 | 25 |
| Roper Technologies, Inc. 3.80% 2026 | 50 | 52 |
| Siemens AG 1.30% 20191 | 500 | 494 |
| Siemens AG 2.70% 20221 | 2,000 | 2,040 |
| Siemens AG 2.00% 20231 | 500 | 483 |
| United Technologies Corp. 2.30% 2022 | 120 | 120 |
| United Technologies Corp. 2.80% 2024 | 1,325 | 1,333 |
| United Technologies Corp. 3.125% 2027 | 275 | 277 |
| 9,224 | ||
| Telecommunication services2.39% | ||
| AT&T Inc. 4.25% 2027 | 898 | 926 |
| AT&T Inc. 5.25% 2037 | 200 | 210 |
| AT&T Inc. 5.45% 2047 | 1,300 | 1,378 |
| Deutsche Telekom International Finance BV 1.95% 20211 | 250 | 244 |
| Deutsche Telekom International Finance BV 2.82% 20221 | 1,575 | 1,592 |
| France Télécom 9.00% 2031 | 210 | 321 |
| Verizon Communications Inc. 4.125% 2046 | 1,350 | 1,204 |
| 5,875 | ||
| Materials1.48% | ||
| Dow Chemical Co. 4.125% 2021 | 100 | 107 |
| Dow Chemical Co. 4.625% 2044 | 100 | 106 |
| LYB International Finance BV 3.50% 2027 | 575 | 572 |
| LYB International Finance BV 4.875% 2044 | 100 | 106 |
| LyondellBasell Industries NV 6.00% 2021 | 200 | 228 |
| Praxair, Inc. 3.00% 2021 | 100 | 103 |
| Rio Tinto Finance PLC 3.75% 2025 | 70 | 74 |
| Rio Tinto PLC 4.125% 2042 | 80 | 82 |
| Sherwin-Williams Co. 3.125% 2024 | 290 | 293 |
| Bonds, notes & other debt instruments Corporate bonds & notes (continued) Materials (continued) | Principal?amount (000) | Value (000) |
| Sherwin-Williams Co. 3.45% 2027 | $250 | $253 |
| Sherwin-Williams Co. 4.50% 2047 | 595 | 610 |
| Vale Overseas Ltd. 5.875% 2021 | 360 | 388 |
| Vale Overseas Ltd. 6.25% 2026 | 660 | 715 |
| 3,637 | ||
| Total corporate bonds & notes | 217,759 | |
| U.S. Treasury bonds & notes2.16% U.S. Treasury inflation-protected securities1.16% | ||
| U.S. Treasury Inflation-Protected Security 0.625% 20264,5 | 1,565 | 1,600 |
| U.S. Treasury Inflation-Protected Security 0.375% 20275 | 1,262 | 1,261 |
| 2,861 | ||
| U.S. Treasury1.00% | ||
| U.S. Treasury 1.125% 2019 | 135 | 135 |
| U.S. Treasury 1.75% 2022 | 2,004 | 2,004 |
| U.S. Treasury 2.00% 2026 | 60 | 59 |
| U.S. Treasury 2.375% 2027 | 121 | 123 |
| U.S. Treasury 2.875% 2046 | 22 | 22 |
| U.S. Treasury 3.00% 2047 | 100 | 102 |
| 2,445 | ||
| Total U.S. Treasury bonds & notes | 5,306 | |
| Asset-backed obligations1.06% | ||
| Aesop Funding LLC, Series 2016-1A, Class A, 2.99% 20221,3 | 350 | 354 |
| Hertz Vehicle Financing LLC, Rental Car Asset-backed Notes, Series 2016-2A, Class A, 2.95% 20221,3 | 350 | 348 |
| TAL Advantage V LLC, Series 2013-1A, Class A, 2.83% 20381,3 | 305 | 301 |
| TAL Advantage V LLC, Series 2017-1A, Class A, 4.50% 20421,3 | 1,013 | 1,056 |
| Textainer Marine Containers Limited, Series 2017-1A, Class A, 3.72% 20421,3 | 440 | 445 |
| Verizon Owner Trust, Series 2016-1A, Class A, 1.42% 20211,3 | 100 | 100 |
| 2,604 | ||
| Bonds & notes of governments & government agencies outside the U.S.0.73% | ||
| Saudi Arabia (Kingdom of) 2.894% 20221 | 850 | 853 |
| Saudi Arabia (Kingdom of) 3.25% 20261 | 950 | 940 |
| 1,793 | ||
| Municipals0.09% Florida0.09% | ||
| State Board of Administration Fin. Corp., Rev. Bonds, Series 2016-A, 2.638% 2021 | 225 | 227 |
| 227 | ||
| Total bonds, notes & other debt instruments (cost: $224,128,000) | 227,689 | |
| Short-term securities9.33% | ||
| BASF SE 0.89% due 6/6/20171 | 5,000 | 4,999 |
| Colgate-Palmolive Co. 0.83% due 6/2/20171 | 3,300 | 3,300 |
| Federal Home Loan Bank 0.91% due 7/19/2017 | 2,000 | 1,998 |
| General Electric Co. 0.82% due 6/1/2017 | 5,600 | 5,600 |
| Short-term securities | Principal?amount (000) | Value (000) |
| Paccar Financial Corp. 0.88% due 6/30/2017 | $2,000 | $1,998 |
| Wal-Mart Stores, Inc. 0.84% due 6/7/20171 | 5,000 | 4,999 |
| Total short-term securities (cost: $22,896,000) | 22,894 | |
| Total investment securities 102.09% (cost: $247,024,000) | 250,583 | |
| Other assets less liabilities (2.09)% | (5,140) | |
| Net assets 100.00% | $245,443 |
| Receive | Pay | Expiration date | Notional (000) | Value at 5/31/2017 (000) | Upfront payments/ receipts (000) | Unrealized (depreciation) appreciation at 5/31/2017 (000) |
| 1.3555% | 3-month USD-LIBOR | 6/3/2021 | $3,000 | $(45) | $— | $(45) |
| 3-month USD-LIBOR | 2.7945% | 4/10/2024 | 1,500 | (80) | — | (80) |
| 3-month USD-LIBOR | 2.396% | 1/19/2046 | 500 | 4 | — | 4 |
| $— | $(121) |
| Receive/ Payment frequency | Pay | Expiration date | Notional (000) | Value at 5/31/2017 (000) | Upfront receipts (000) | Unrealized appreciation at 5/31/2017 (000) |
| 1.00%/Quarterly | CDX.NA.IG.28 | 6/20/2022 | $7,500 | $138 | $113 | $25 |
| Contracts | Type | Number of contracts | Expiration | Notional amount (000)6 | Value at 5/31/2017 (000)7 | Unrealized appreciation at 5/31/2017 (000) |
| 5 Year U.S. Treasury Note Futures | Long | 47 | October 2017 | $4,700 | $5,561 | $10 |
| 1 | Acquired in a transaction exempt from registration under Rule 144A or Section 4(2) of the Securities Act of 1933. May be resold in the U.S. in transactions exempt from registration, normally to qualified institutional buyers. The total value of all such securities was $64,504,000, which represented 26.28% of the net assets of the fund. |
| 2 | Coupon rate may change periodically. |
| 3 | Principal payments may be made periodically. Therefore, the effective maturity date may be earlier than the stated maturity date. |
| 4 | All or a portion of this security was pledged as collateral. The total value of pledged collateral was $285,000, which represented .12% of the net assets of the fund. |
| 5 | Index-linked bond whose principal amount moves with a government price index. |
| 6 | Notional amount is calculated based on the number of contracts and notional contract size. |
| 7 | Value is calculated based on the notional amount and current market price. |
| Key to abbreviations and symbol |
| LIBOR = London Interbank Offered Rate |
| USD/$ = U.S. dollars |
| MFGEFPX-032-0717O-S60592 | American Funds Corporate Bond Fund — Page 11 of 11 |
Report of Independent Registered Public Accounting Firm
To the Board of Trustees and Shareholders of American Funds Corporate Bond Fund
In our opinion, the accompanying statement of assets and liabilities, including the summary investment portfolio, and the related statements of operations and of changes in net assets and the financial highlights (included in Item 1 of this Form N-CSR) and the investment portfolio (included in Item 6 of this Form N-CSR) present fairly, in all material respects, the financial position of American Funds Corporate Bond Fund (the "Fund") as of May 31, 2017, the results of its operations for the year then ended, the changes in its net assets for each of the two years in the period then ended and the financial highlights for each of the periods presented, in conformity with accounting principles generally accepted in the United States of America. These financial statements, financial highlights, and investment portfolio (hereafter referred to as "financial statements") are the responsibility of the Fund's management. Our responsibility is to express an opinion on these financial statements based on our audits. We conducted our audits of these financial statements in accordance with the standards of the Public Company Accounting Oversight Board (United States). Those standards require that we plan and perform the audit to obtain reasonable assurance about whether the financial statements are free of material misstatement. An audit includes examining, on a test basis, evidence supporting the amounts and disclosures in the financial statements, assessing the accounting principles used and significant estimates made by management, and evaluating the overall financial statement presentation. We believe that our audits, which included confirmation of securities as of May 31, 2017 by correspondence with the custodian and brokers, provide a reasonable basis for our opinion.
PricewaterhouseCoopers LLP
Los Angeles, California
July 17, 2017
ITEM 7 – Disclosure of Proxy Voting Policies and Procedures for Closed-End Management Investment Companies
Not applicable to this Registrant, insofar as the Registrant is not a closed-end management investment company.
ITEM 8 – Portfolio Managers of Closed-End Management Investment Companies
Not applicable to this Registrant, insofar as the Registrant is not a closed-end management investment company.
ITEM 9 – Purchases of Equity Securities by Closed-End Management Investment Company and Affiliated Purchasers
Not applicable to this Registrant, insofar as the Registrant is not a closed-end management investment company.
ITEM 10 – Submission of Matters to a Vote of Security Holders
There have been no material changes to the procedures by which shareholders may recommend nominees to the Registrant’s board of trustees since the Registrant last submitted a proxy statement to its shareholders. The procedures are as follows. The Registrant has a nominating and governance committee comprised solely of persons who are not considered ‘‘interested persons’’ of the Registrant within the meaning of the Investment Company Act of 1940, as amended. The committee periodically reviews such issues as the board’s composition, responsibilities, committees, compensation and other relevant issues, and recommends any appropriate changes to the full board of trustees. While the committee normally is able to identify from its own resources an ample number of qualified candidates, it will consider shareholder suggestions of persons to be considered as nominees to fill future vacancies on the board. Such suggestions must be sent in writing to the nominating and governance committee of the Registrant, c/o the Registrant’s Secretary, and must be accompanied by complete biographical and occupational data on the prospective nominee, along with a written consent of the prospective nominee for consideration of his or her name by the nominating and governance committee.
ITEM 11 – Controls and Procedures
| (a) | The Registrant’s Principal Executive Officer and Principal Financial Officer have concluded, based on their evaluation of the Registrant’s disclosure controls and procedures (as such term is defined in Rule 30a-3 under the Investment Company Act of 1940), that such controls and procedures are adequate and reasonably designed to achieve the purposes described in paragraph (c) of such rule. |
| (b) | There were no changes in the Registrant’s internal controls over financial reporting (as defined in Rule 30a-3(d) under the Investment Company Act of 1940) that occurred during the Registrant’s second fiscal quarter of the period covered by this report that has materially affected, or is reasonably likely to materially affect, the Registrant’s internal control over financial reporting. |
ITEM 12 – Exhibits
| (a)(1) | The Code of Ethics that is the subject of the disclosure required by Item 2 is attached as an exhibit hereto. |
| (a)(2) | The certifications required by Rule 30a-2 of the Investment Company Act of 1940 and Sections 302 and 906 of the Sarbanes-Oxley Act of 2002 are attached as exhibits hereto. |
SIGNATURES
Pursuant to the requirements of the Securities Exchange Act of 1934 and the Investment Company Act of 1940, the Registrant has duly caused this report to be signed on its behalf by the undersigned, thereunto duly authorized.
| AMERICAN FUNDS CORPORATE BOND FUND | |
| By /s/ David S. Lee | |
David S. Lee, President and Principal Executive Officer | |
| Date: July 31, 2017 |
Pursuant to the requirements of the Securities Exchange Act of 1934 and the Investment Company Act of 1940, this report has been signed below by the following persons on behalf of the Registrant and in the capacities and on the dates indicated.
| By /s/ David S. Lee |
David S. Lee, President and Principal Executive Officer |
| Date: July 31, 2017 |
| By /s/ Brian C. Janssen |
Brian C. Janssen, Treasurer and Principal Financial Officer |
| Date: July 31, 2017 |