UNITED STATES
SECURITIES AND EXCHANGE COMMISSION
Washington, D.C. 20549
FORM N-CSR
Certified Shareholder Report of
Registered Management Investment Companies
Investment Company Act File Number: 811-22744
American Funds Corporate Bond Fund
(Exact Name of Registrant as Specified in Charter)
6455 Irvine Center Drive
Irvine, California 92618
(Address of Principal Executive Offices)
Registrant's telephone number, including area code: (213) 486-9200
Date of fiscal year end: May 31
Date of reporting period: November 30, 2017
Steven I. Koszalka
American Funds Corporate Bond Fund
333 South Hope Street
Los Angeles, California 90071
(Name and Address of Agent for Service)
ITEM 1 – Reports to Stockholders
 | American Funds Corporate Bond Fund® Semi-annual report for the six months ended November 30, 2017 |

We believe high-
conviction investing
and diverse
perspectives lead
to better results.
American Funds Corporate Bond Fund seeks to provide maximum total return consistent with capital preservation and prudent risk management.
This fund is one of more than 40 offered by one of the nation’s largest mutual fund families, American Funds, from Capital Group. For more than 85 years, Capital has invested with a long-term focus based on thorough research and attention to risk.
Fund results shown in this report, unless otherwise indicated, are for Class A shares at net asset value. If a sales charge (maximum 3.75%) had been deducted, the results would have been lower. Results are for past periods and are not predictive of results for future periods. Current and future results may be lower or higher than those shown. Share prices and returns will vary, so investors may lose money. Investing for short periods makes losses more likely. For current information and month-end results, visit americanfunds.com.
Here are total returns on a $1,000 investment with all distributions reinvested for periods ended December 31, 2017 (the most recent calendar quarter-end):
| Cumulative total return | Average annual total return | |||||
| Lifetime | ||||||
| Class A shares | 1 year | 5 years | (since 12/14/12) | |||
| Reflecting 3.75% maximum sales charge | 1.67% | 3.16% | 3.16% | |||
The total annual fund operating expense ratio was 0.94% for Class A shares as of the prospectus dated August 1, 2017. The net expense ratio was 0.90%. Expense ratios are restated to reflect current fees.
Investment results assume all distributions are reinvested and reflect applicable fees and expenses. The investment adviser is currently reimbursing a portion of other expenses. This reimbursement will be in effect through at least August 1, 2018. After that time, the adviser may elect at its discretion to extend, modify or terminate the reimbursement. Investment results and the net expense ratio shown reflect the reimbursement, without which the results would have been lower and the expenses would have been higher. Refer to the fund’s most recent prospectus for details. Visit americanfunds.com for more information.
Investments are not FDIC-insured, nor are they deposits of or guaranteed by a bank or any other entity, so they may lose value.
Fellow investors:
We are pleased to present you with the semiannual report for American Funds Corporate Bond Fund.
For the six-month period ended November 30, 2017, the fund advanced 1.51%, with all dividends reinvested. By way of comparison, the Bloomberg Barclays U.S. Corporate Investment Grade Index rose 1.91%, while the fund’s peer group, as measured by the Lipper Corporate Debt Funds BBB-Rated Average, gained 1.67%. During this time the fund generated dividends totaling about 12 cents a share, providing investors who reinvested dividends with an income return of 1.13%.
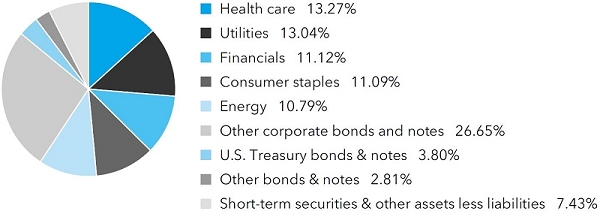
At the end of the period, the fund’s corporate holdings — representing about 86% of the portfolio — were spread among a variety of sectors. Bonds in the health care sector made up 13.3% of the portfolio, just slightly more than investments in the utilities sector. Those were followed by financials and consumer staples, both at about 11%. Roughly 5.7% of the portfolio was invested in government securities, primarily U.S. Treasury notes. About 71% of the fund consisted of U.S. securities, with the rest chiefly invested in bonds from the United Kingdom, Canada and Germany. A complete list of fund holdings begins on page 4.
Results at a glance
For periods ended November 30, 2017, with all distributions reinvested
| Cumulative total returns | Average annual total returns | |||||||||||||||
| Lifetime | ||||||||||||||||
| 6 months | 1 year | 3 years | (since 12/14/12) | |||||||||||||
| American Funds Corporate Bond Fund (Class A shares) | 1.51 | % | 5.64 | % | 4.20 | % | 3.88 | % | ||||||||
| Bloomberg Barclays U.S. Corporate Investment Grade Index* | 1.91 | 6.16 | 3.60 | 3.34 | ||||||||||||
| Lipper Corporate Debt Funds BBB-Rated Average† | 1.67 | 5.79 | 3.03 | 2.99 | ||||||||||||
| Lipper Corporate Debt Funds A-Rated Average† | 1.43 | 5.05 | 2.76 | 2.67 | ||||||||||||
| * | Source: Bloomberg Index Services Ltd. The market index is unmanaged and, therefore, has no expenses. Investors cannot invest directly in an index. |
| † | Source: Thomson Reuters Lipper. Lipper averages reflect the current composition of all eligible mutual funds (all share classes) within a given category. |
| American Funds Corporate Bond Fund | 1 |
Economy lifts valuations
During the six-month period the global economic environment has improved. Growth continues to be modestly above trend across many countries and regions. While we expect this dynamic to continue in the near term, we believe it is largely reflected in the current valuation of many fixed income assets, including investment-grade corporate bonds (rated BBB/Baa and above). Though fund managers are not inspired to take more credit risk, we continue to find opportunities to invest in corporate bonds we believe have the potential to reward investors.
Strong demand for corporate bonds
Corporate bonds spent much of the period in positive territory, as demand remained relatively strong. Even after the U.S. Federal Reserve raised rates in June 2017, citing low unemployment and healthy financial conditions, the yield on Treasuries remained relatively low. That contributed to the continued demand for corporate debt, pushing down the yield on investment-grade bonds.
As a result, during much of the period, the “spread” (or difference between yields offered by U.S. corporate debt and Treasuries) remained at one of the lowest levels in years. As spreads tighten, some valuations can become harder to justify.
Inside the fund
In such an environment, the fund managers continue to evaluate new issues carefully, focusing on companies with improving credit trajectories that can compensate for credit risk when spreads are so tight. Indeed, issuance of U.S. investment-grade corporate bonds remained robust. Total issuance reached nearly $654 billion for the six-month period ended November 30.
Notable new issues in which the fund participated included those from Amazon and British American Tobacco, both top 10 holdings at the end of the period. Both were related to acquisitions, with research indicating strong fundamentals for both companies. Amazon issued $16 billion in debt to help fund its $13.7 billion acquisition of Whole Foods. British American Tobacco (BAT) issued $17.3 billion to finance its purchase of the portion of Reynolds American Inc. that it didn’t already own. The acquisition makes BAT one of the top tobacco-related companies globally.
By sector, the fund was most heavily invested in bonds issued by health care companies. Our position in the sector is partly the result of finding companies we believe have the ability to generate cash and the intention to reduce debt. Bonds from such issuers have the potential to rise in value as companies pay down debt.
Teva Pharmaceutical, one of the fund’s largest issuers, struggled during the period due to challenges in its U.S. generics business. But the Israeli company is stabilizing its operations and reducing operating costs to strengthen its balance sheet. Other health care holdings include U.S. medical device makers Abbott Laboratories and Becton, Dickinson and Co., and AbbVie, a pharmaceutical company.
| 2 | American Funds Corporate Bond Fund |
The largest issuer among the fund’s holdings in the utilities sector is FirstEnergy, an electrical services company in Ohio. The company’s 10 electric companies form one of the nation’s largest investor-owned electric systems. FirstEnergy is a top holding due to its focus on reducing debt and improving its credit quality.
Other notable investments include sovereign debt issued by Saudi Arabia and government bonds issued by Illinois. Saudi Arabia sold $12.5 billion worth of bonds in September to shore up its finances, which have been stretched by the slump in oil prices. Higher energy prices should be supportive of their economy and increase the value of the bonds. Illinois, which faced having its bonds downgraded earlier this year, may have turned a corner during the summer when the state passed a budget and approved increases in both the income and corporate tax rates. Those moves bolstered the state’s finances and increased the value of its debt.
Outlook
Macroeconomic and geopolitical issues are likely to make the investment environment challenging. Corporate bond investing in today’s market requires deep credit research. Our managers rely on rigorous analysis that seeks to determine which industry, company or security mix in an expected economic environment will provide the outcome that helps investors pursue their financial objectives.
We thank you for making American Funds Corporate Bond Fund part of your portfolio.
Cordially,

David S. Lee
President
January 16, 2018
For current information about the fund, visit americanfunds.com.
The fund’s 30-day yield for Class A shares as of December 31, 2017, reflecting the 3.75% maximum sales charge and calculated in accordance with the U.S. Securities and Exchange Commission formula, was 2.24% (2.21% without the reimbursement).
The return of principal for bond funds and for funds with significant underlying bond holdings is not guaranteed. Fund shares are subject to the same interest rate, inflation and credit risks associated with the underlying bond holdings. Investing in bonds issued outside the U.S. may be subject to additional risks. They include currency fluctuations, political and social instability, differing securities regulations and accounting standards, higher transaction costs, possible changes in taxation, illiquidity and price volatility. These risks may be heightened in connection with investments in developing countries. Refer to the fund prospectus and the Risk Factors section of this report for more information on these and other risks associated with investing in the fund.
| American Funds Corporate Bond Fund | 3 |
| Summary investment portfolio November 30, 2017 | unaudited |
| Industry sector diversification | Percent of net assets |
| Portfolio quality summary* | Percent of net assets | |||
| U.S. Treasury and agency† | 3.80 | % | ||
| AAA/Aaa | 3.06 | |||
| AA/Aa | 12.55 | |||
| A/A | 27.36 | |||
| BBB/Baa | 45.80 | |||
| Short-term securities & other assets less liabilities | 7.43 | |||
| * | Bond ratings, which typically range from AAA/Aaa (highest) to D (lowest), are assigned by credit rating agencies such as Standard & Poor’s, Moody’s and/or Fitch as an indication of an issuer’s creditworthiness. In assigning a credit rating to a security, the fund looks specifically to the ratings assigned to the issuer of the security by Standard & Poor’s, Moody’s and/or Fitch. If agency ratings differ, the security will be considered to have received the highest of those ratings, consistent with the fund’s investment policies. |
| † | These securities are guaranteed by the full faith and credit of the U.S. government. |
| Bonds, notes & other debt instruments 92.57% | Principal amount (000) | Value (000) | ||||||
| Corporate bonds & notes 85.96% | ||||||||
| Health care 13.27% | ||||||||
| Abbott Laboratories 2.90% 2021 | $ | 2,360 | $ | 2,376 | ||||
| Abbott Laboratories 3.75% 2026 | 2,880 | 2,941 | ||||||
| Abbott Laboratories 3.40%–4.90% 2023–2046 | 2,350 | 2,478 | ||||||
| AbbVie Inc. 2.30%–4.45% 2020–2046 | 4,800 | 4,887 | ||||||
| AstraZeneca PLC 2.375% 2022 | 2,325 | 2,293 | ||||||
| Becton, Dickinson and Co. 3.363% 2024 | 2,825 | 2,827 | ||||||
| Becton, Dickinson and Co. 3.70% 2027 | 4,045 | 4,039 | ||||||
| Becton, Dickinson and Co. 2.68%–2.89% 2019–2022 | 759 | 755 | ||||||
| Shire PLC 2.40% 2021 | 3,575 | 3,520 | ||||||
| Shire PLC 2.88%–3.20% 2023–2026 | 1,950 | 1,885 | ||||||
| Teva Pharmaceutical Finance Company BV 2.20% 2021 | 2,605 | 2,396 | ||||||
| Teva Pharmaceutical Finance Company BV 2.80% 2023 | 4,940 | 4,367 | ||||||
| Teva Pharmaceutical Finance Company BV 3.15%–4.10% 2026–2046 | 3,640 | 2,903 | ||||||
| Other securities | 16,679 | |||||||
| 54,346 | ||||||||
| 4 | American Funds Corporate Bond Fund |
| Principal amount | Value | |||||||
| (000) | (000) | |||||||
| Utilities 13.04% | ||||||||
| Colbun SA 3.95% 20271 | $ | 2,725 | $ | 2,735 | ||||
| EDP Finance BV 3.625% 20241 | 3,550 | 3,580 | ||||||
| Enel Finance International SA 3.50% 20281 | 3,600 | 3,516 | ||||||
| Enel Finance International SA 6.00% 20391 | 250 | 304 | ||||||
| Enel Società per Azioni 8.75% 20731 | 400 | 495 | ||||||
| FirstEnergy Corp. 3.90% 2027 | 3,350 | 3,424 | ||||||
| FirstEnergy Corp. 3.50% 20281 | 2,445 | 2,441 | ||||||
| FirstEnergy Corp. 4.25%–4.85% 2023–2047 | 2,650 | 2,833 | ||||||
| IPALCO Enterprises, Inc. 3.70% 20241 | 2,200 | 2,193 | ||||||
| Pacific Gas and Electric Co. 3.30% 20271 | 2,500 | 2,489 | ||||||
| Pennsylvania Electric Co. 3.25% 20281 | 500 | 495 | ||||||
| Public Service Enterprise Group Inc. 2.65% 2022 | 2,500 | 2,486 | ||||||
| Public Service Enterprise Group Inc. 1.60%–2.00% 2019–2021 | 2,390 | 2,333 | ||||||
| SCANA Corp. 4.13%–6.25% 2020–2022 | 4,000 | 4,179 | ||||||
| South Carolina Electric & Gas Co. 4.10%–5.45% 2033–2046 | 1,346 | 1,488 | ||||||
| Other securities | 18,383 | |||||||
| 53,374 | ||||||||
| Financials 11.12% | ||||||||
| Citigroup Inc. 2.70%–3.20% 2022–2026 | 675 | 668 | ||||||
| Goldman Sachs Group, Inc. 2.905% 2023 | 2,836 | 2,812 | ||||||
| Goldman Sachs Group, Inc. 3.08%–3.75% 2023–20282 | 1,488 | 1,543 | ||||||
| New York Life Global Funding 1.50%–2.30% 2019–20221 | 4,460 | 4,392 | ||||||
| Wells Fargo & Co. 2.625% 2022 | 2,000 | 1,986 | ||||||
| Wells Fargo & Co. 3.584% 2028 | 2,700 | 2,733 | ||||||
| Other securities | 31,382 | |||||||
| 45,516 | ||||||||
| Consumer staples 11.09% | ||||||||
| Altria Group, Inc. 3.875% 2046 | 2,450 | 2,391 | ||||||
| Anheuser-Busch InBev NV 3.65% 2026 | 2,740 | 2,815 | ||||||
| British American Tobacco PLC 3.557% 20271 | 4,675 | 4,676 | ||||||
| British American Tobacco PLC 4.54% 20471 | 3,075 | 3,189 | ||||||
| British American Tobacco PLC 2.76%–3.22% 2022–20241 | 710 | 707 | ||||||
| Philip Morris International Inc. 2.375% 2022 | 2,835 | 2,794 | ||||||
| Philip Morris International Inc. 2.00%–4.25% 2020–2044 | 4,355 | 4,389 | ||||||
| Procter & Gamble Co. 1.75% 2019 | 3,450 | 3,440 | ||||||
| Reynolds American Inc. 4.45%–5.85% 2025–2045 | 450 | 516 | ||||||
| Wal-Mart Stores, Inc. 1.75% 2019 | 3,975 | 3,964 | ||||||
| Wal-Mart Stores, Inc. 2.35% 2022 | 200 | 199 | ||||||
| WM. Wrigley Jr. Co 3.375% 20201 | 2,950 | 3,027 | ||||||
| Other securities | 13,286 | |||||||
| 45,393 | ||||||||
| Energy 10.79% | ||||||||
| Cenovus Energy Inc. 4.25% 20271 | 3,155 | 3,127 | ||||||
| Cenovus Energy Inc. 3.00%–5.40% 2022–20471 | 1,441 | 1,464 | ||||||
| Chevron Corp. 2.498% 2022 | 2,990 | 3,001 | ||||||
| Chevron Corp. 1.56%–2.10% 2019–2021 | 1,595 | 1,582 | ||||||
| Energy Transfer Partners, LP 5.30% 2047 | 2,265 | 2,214 | ||||||
| Energy Transfer Partners, LP 4.00%–6.13% 2026–2047 | 2,558 | 2,576 | ||||||
| Other securities | 30,230 | |||||||
| 44,194 | ||||||||
| American Funds Corporate Bond Fund | 5 |
| Bonds, notes & other debt instruments (continued) | Principal amount (000) | Value (000) | ||||||
| Corporate bonds & notes (continued) | ||||||||
| Consumer discretionary 9.86% | ||||||||
| Amazon.com, Inc. 3.15% 20271 | $ | 3,850 | $ | 3,859 | ||||
| Amazon.com, Inc. 4.05% 20471 | 2,365 | 2,472 | ||||||
| Amazon.com, Inc. 2.80%–3.88% 2024–20371 | 447 | 463 | ||||||
| Comcast Corp. 3.15% 2028 | 2,500 | 2,473 | ||||||
| Ford Motor Co. 4.346% 2026 | 1,150 | 1,199 | ||||||
| Ford Motor Credit Co. 5.291% 2046 | 2,900 | 3,095 | ||||||
| Ford Motor Credit Co. 3.82%–4.13% 2025–2027 | 400 | 406 | ||||||
| General Motors Co. 5.40%–6.75% 2046–2048 | 1,755 | 1,928 | ||||||
| General Motors Financial Co. 3.50%–6.60% 2024–2036 | 2,310 | 2,334 | ||||||
| Nissan Motor Co., Ltd. 2.60% 20221 | 2,125 | 2,105 | ||||||
| Other securities | 20,046 | |||||||
| 40,380 | ||||||||
| Information technology 5.09% | ||||||||
| Apple Inc. 2.00%–4.25% 2020–2047 | 4,995 | 5,021 | ||||||
| Oracle Corp. 1.90% 2021 | 2,575 | 2,537 | ||||||
| Oracle Corp. 2.63%–4.00% 2023–2047 | 4,285 | 4,328 | ||||||
| Other securities | 8,972 | |||||||
| 20,858 | ||||||||
| Real estate 4.65% | ||||||||
| Scentre Group 3.75% 20271 | 2,150 | 2,181 | ||||||
| WEA Finance LLC 2.70%–3.25% 2019–20201 | 1,390 | 1,400 | ||||||
| Westfield Corp. Ltd. 3.15% 20221 | 3,335 | 3,353 | ||||||
| Other securities | 12,106 | |||||||
| 19,040 | ||||||||
| Telecommunication services 3.03% | ||||||||
| AT&T Inc. 5.15% 2050 | 2,491 | 2,476 | ||||||
| AT&T Inc. 3.90%–5.25% 2027–2048 | 3,339 | 3,134 | ||||||
| Other securities | 6,809 | |||||||
| 12,419 | ||||||||
| Industrials 2.64% | ||||||||
| Northrop Grumman Corp., 2.55% 2022 | 2,415 | 2,400 | ||||||
| Other securities | 8,394 | |||||||
| 10,794 | ||||||||
| Other 1.38% | ||||||||
| Other securities | 5,667 | |||||||
| Total corporate bonds & notes | 351,981 | |||||||
| U.S. Treasury bonds & notes 3.80% | ||||||||
| U.S. Treasury 2.88% | ||||||||
| U.S. Treasury 2.00% 2022 | 4,595 | 4,567 | ||||||
| U.S. Treasury 2.25% 2027 | 3,111 | 3,067 | ||||||
| U.S. Treasury 2.75% 2047 | 2,999 | 2,946 | ||||||
| U.S. Treasury 1.13%–3.00% 2019–2047 | 1,236 | 1,227 | ||||||
| 11,807 | ||||||||
| U.S. Treasury inflation-protected securities 0.92% | ||||||||
| U.S. Treasury Inflation-Protected Securities 0.38%–0.63% 2026–20273,4 | 3,768 | 3,743 | ||||||
| Total U.S. Treasury bonds & notes | 15,550 | |||||||
| 6 | American Funds Corporate Bond Fund |
| Principal amount (000) | Value (000) | |||||||
| Bonds & notes of governments & government agencies outside the U.S. 1.93% | ||||||||
| Saudi Arabia (Kingdom of) 2.894% 20221 | $ | 1,500 | $ | 1,498 | ||||
| Saudi Arabia (Kingdom of) 3.625% 20281 | 3,725 | 3,703 | ||||||
| Other securities | 2,682 | |||||||
| 7,883 | ||||||||
| Municipals 0.86% | ||||||||
| State of Illinois, G.O. Bonds, Pension Funding Series 2003, 5.10% 20335 | 3,150 | 3,136 | ||||||
| Other securities | 396 | |||||||
| 3,532 | ||||||||
| Asset-backed obligations 0.02% | ||||||||
| Other securities | 100 | |||||||
| Total bonds, notes & other debt instruments (cost: $377,110,000) | 379,046 | |||||||
| Short-term securities 6.74% | ||||||||
| CAFCO, LLC 1.30% due 12/5/20171 | 5,000 | 4,999 | ||||||
| General Electric Co. 1.10% due 12/1/2017 | 8,300 | 8,300 | ||||||
| IBM Credit Corp. 1.14% due 12/6/20171 | 2,100 | 2,100 | ||||||
| National Rural Utilities Cooperative Finance Corp. 1.16% due 12/11/2017 | 2,100 | 2,099 | ||||||
| NIKE, Inc. 1.15% due 12/8/20171 | 6,400 | 6,398 | ||||||
| Paccar Financial Corp. 1.13% due 12/11/2017 | 3,700 | 3,699 | ||||||
| Total short-term securities (cost: $27,596,000) | 27,595 | |||||||
| Total investment securities 99.31% (cost: $404,706,000) | 406,641 | |||||||
| Other assets less liabilities 0.69% | 2,813 | |||||||
| Net assets 100.00% | $ | 409,454 | ||||||
This summary investment portfolio is designed to streamline the report and help investors better focus on the fund’s principal holdings. See the inside back cover for details on how to obtain a complete schedule of portfolio holdings.
“Other securities” includes all issues that are not disclosed separately in the summary investment portfolio.
Swap contracts
Interest rate swaps
| Unrealized | ||||||||||||||||||||||||
| Upfront | (depreciation) | |||||||||||||||||||||||
| Value at | payments/ | appreciation | ||||||||||||||||||||||
| Expiration | Notional | 11/30/2017 | receipts | at 11/30/2017 | ||||||||||||||||||||
| Receive | Pay | date | (000) | (000) | (000) | (000) | ||||||||||||||||||
| 3-month USD-LIBOR | 2.7945% | 4/10/2024 | $1,500 | $(47 | ) | $ | — | $ | (48 | ) | ||||||||||||||
| 3-month USD-LIBOR | 2.51% | 11/10/2047 | 1,900 | 40 | — | 40 | ||||||||||||||||||
| $ | — | $ | (8 | ) | ||||||||||||||||||||
| American Funds Corporate Bond Fund | 7 |
Credit default swaps
Centrally cleared credit default swaps on credit indices — sell protection
| Unrealized | ||||||||||||||||||||||||
| Value at | Upfront | appreciation | ||||||||||||||||||||||
| Receive/ | Expiration | Notional | 11/30/2017 | receipts | at 11/30/2017 | |||||||||||||||||||
| Payment frequency | Pay | date | (000) | (000) | (000) | (000) | ||||||||||||||||||
| 1.00%/Quarterly | CDX.NA.IG.28 | 6/20/2022 | $7,500 | $161 | $ | 113 | $ | 48 | ||||||||||||||||
The following footnotes apply to either the individual securities noted or one or more of the securities aggregated and listed as a single line item.
| 1 | Acquired in a transaction exempt from registration under Rule 144A or Section 4(2) of the Securities Act of 1933. May be resold in the U.S. in transactions exempt from registration, normally to qualified institutional buyers. The total value of all such securities, including those in “Other securities,” was $116,198,000, which represented 28.38% of the net assets of the fund. |
| 2 | Coupon rate may change periodically. |
| 3 | A portion of this security was pledged as collateral. The total value of pledged collateral was $448,000, which represented .11% of the net assets of the fund. |
| 4 | Index-linked bond whose principal amount moves with a government price index. |
| 5 | Principal payments may be made periodically. Therefore, the effective maturity date may be earlier than the stated maturity date. |
Key to abbreviations and symbol
G.O. = General Obligation
LIBOR = London Interbank Offered Rate
USD/$ = U.S. dollars
See Notes to Financial Statements
| 8 | American Funds Corporate Bond Fund |
Financial statements
| Statement of assets and liabilities at November 30, 2017 | unaudited (dollars in thousands) |
| Assets: | ||||||||
| Investment securities in unaffiliated issuers, at value (cost: $404,706) | $ | 406,641 | ||||||
| Cash | 236 | |||||||
| Receivables for: | ||||||||
| Sales of investments | $ | 1,047 | ||||||
| Sales of fund’s shares | 2,478 | |||||||
| Variation margin on swap contracts | 18 | |||||||
| Interest | 3,085 | |||||||
| Other | 4 | 6,632 | ||||||
| 413,509 | ||||||||
| Liabilities: | ||||||||
| Payables for: | ||||||||
| Purchases of investments | 3,461 | |||||||
| Repurchases of fund’s shares | 346 | |||||||
| Dividends on fund’s shares | 82 | |||||||
| Investment advisory services | 149 | |||||||
| Services provided by related parties | 17 | |||||||
| Trustees’ deferred compensation | — | * | 4,055 | |||||
| Net assets at November 30, 2017 | $ | 409,454 | ||||||
| Net assets consist of: | ||||||||
| Capital paid in on shares of beneficial interest | $ | 406,103 | ||||||
| Undistributed net investment income | 56 | |||||||
| Undistributed net realized gain | 1,320 | |||||||
| Net unrealized appreciation | 1,975 | |||||||
| Net assets at November 30, 2017 | $ | 409,454 | ||||||
| * | Amount less than one thousand. |
See Notes to Financial Statements
| American Funds Corporate Bond Fund | 9 |
(dollars and shares in thousands, except per-share amounts)
Shares of beneficial interest issued and outstanding (no stated par value) —
unlimited shares authorized (39,492 total shares outstanding)
| Shares | Net asset value | |||||||||||
| Net assets | outstanding | per share | ||||||||||
| Class A | $ | 339,123 | 32,708 | $ | 10.37 | |||||||
| Class C | 15,353 | 1,481 | 10.37 | |||||||||
| Class T | 10 | 1 | 10.37 | |||||||||
| Class F-1 | 6,211 | 599 | 10.37 | |||||||||
| Class F-2 | 16,707 | 1,611 | 10.37 | |||||||||
| Class F-3 | 7,018 | 677 | 10.37 | |||||||||
| Class 529-A | 13,528 | 1,305 | 10.37 | |||||||||
| Class 529-C | 4,033 | 389 | 10.37 | |||||||||
| Class 529-E | 760 | 73 | 10.37 | |||||||||
| Class 529-T | 10 | 1 | 10.37 | |||||||||
| Class 529-F-1 | 1,024 | 99 | 10.37 | |||||||||
| Class R-1 | 171 | 17 | 10.37 | |||||||||
| Class R-2 | 1,856 | 179 | 10.37 | |||||||||
| Class R-2E | 93 | 9 | 10.37 | |||||||||
| Class R-3 | 1,542 | 149 | 10.37 | |||||||||
| Class R-4 | 992 | 96 | 10.37 | |||||||||
| Class R-5E | 25 | 2 | 10.37 | |||||||||
| Class R-5 | 487 | 47 | 10.37 | |||||||||
| Class R-6 | 511 | 49 | 10.37 | |||||||||
See Notes to Financial Statements
| 10 | American Funds Corporate Bond Fund |
| Statement of operations for the six months ended November 30, 2017 | unaudited (dollars in thousands) |
| Investment income: | ||||||||
| Income: | ||||||||
| Interest | $ | 5,113 | ||||||
| Fees and expenses*: | ||||||||
| Investment advisory services | $ | 749 | ||||||
| Distribution services | 445 | |||||||
| Transfer agent services | 161 | |||||||
| Administrative services | 27 | |||||||
| Reports to shareholders | 32 | |||||||
| Registration statement and prospectus | 359 | |||||||
| Trustees’ compensation | — | † | ||||||
| Auditing and legal | 36 | |||||||
| Custodian | — | † | ||||||
| Other | 14 | |||||||
| Total fees and expenses before reimbursements | 1,823 | |||||||
| Less miscellaneous reimbursements | 320 | |||||||
| Total fees and expenses after reimbursements | 1,503 | |||||||
| Net investment income | 3,610 | |||||||
| Net realized gain and unrealized depreciation: | ||||||||
| Net realized gain on: | ||||||||
| Investments in unaffiliated issuers | 1,919 | |||||||
| Futures contracts | 8 | |||||||
| Swap contracts | 144 | 2,071 | ||||||
| Net unrealized (depreciation) appreciation on: | ||||||||
| Investments in unaffiliated issuers | (1,624 | ) | ||||||
| Futures contracts | (10 | ) | ||||||
| Swap contracts | 136 | (1,498 | ) | |||||
| Net realized gain and unrealized depreciation | 573 | |||||||
| Net increase in net assets resulting from operations | $ | 4,183 |
| * | Additional information related to class-specific fees and expenses is included in the Notes to Financial Statements. |
| † | Amount less than one thousand. |
See Notes to Financial Statements
| American Funds Corporate Bond Fund | 11 |
| Statements of changes in net assets | |
| (dollars in thousands) |
| Six months ended November 30, 2017* | Year ended May 31, 2017 | ||||||||
| Operations: | |||||||||
| Net investment income | $ | 3,610 | $ | 2,567 | |||||
| Net realized gain | 2,071 | 214 | |||||||
| Net unrealized (depreciation) appreciation | (1,498 | ) | 2,298 | ||||||
| Net increase in net assets resulting from operations | 4,183 | 5,079 | |||||||
| Dividends and distributions paid or accrued to shareholders: | |||||||||
| Dividends from net investment income | (3,573 | ) | (2,629 | ) | |||||
| Distributions from net realized gain on investments | — | (1,043 | ) | ||||||
| Total dividends and distributions paid or accrued to shareholders | (3,573 | ) | (3,672 | ) | |||||
| Net capital share transactions | 163,401 | 192,452 | |||||||
| Total increase in net assets | 164,011 | 193,859 | |||||||
| Net assets: | |||||||||
| Beginning of period | 245,443 | 51,584 | |||||||
| End of period (including undistributed net investment income: $56 and $19, respectively) | $ | 409,454 | $ | 245,443 | |||||
| * | Unaudited. |
See Notes to Financial Statements
| 12 | American Funds Corporate Bond Fund |
| Notes to financial statements | unaudited |
1. Organization
American Funds Corporate Bond Fund (the “fund”) is registered under the Investment Company Act of 1940 as an open-end, diversified management investment company. The fund seeks to provide maximum total return consistent with capital preservation and prudent risk management.
The fund has 19 share classes consisting of six retail share classes (Classes A, C, T, F-1, F-2 and F-3), five 529 college savings plan share classes (Classes 529-A, 529-C, 529-E, 529-T and 529-F-1) and eight retirement plan share classes (Classes R-1, R-2, R-2E, R-3, R-4, R-5E, R-5 and R-6). The 529 college savings plan share classes can be used to save for college education. The retirement plan share classes are generally offered only through eligible employer-sponsored retirement plans. The fund’s share classes are described further in the following table:
| Share class | Initial sales charge | Contingent deferred sales charge upon redemption | Conversion feature | |||
| Classes A and 529-A | Up to 3.75% | None (except 1% for certain redemptions within one year of purchase without an initial sales charge1) | None | |||
| Class C | None | 1% for redemptions within one year of purchase | Class C converts to Class F-1 after 10 years | |||
| Class 529-C | None | 1% for redemptions within one year of purchase | Class 529-C converts to Class 529-A after 10 years2 | |||
| Class 529-E | None | None | None | |||
| Classes T and 529-T3 | Up to 2.50% | None | None | |||
| Classes F-1, F-2, F-3 and 529-F-1 | None | None | None | |||
| Classes R-1, R-2, R-2E, R-3, R-4, R-5E, R-5 and R-6 | None | None | None |
| 1 | 18 months for shares purchased on or after August 14, 2017. |
| 2 | Effective December 1, 2017. |
| 3 | Class T and 529-T shares are not available for purchase. |
Holders of all share classes have equal pro rata rights to the assets, dividends and liquidation proceeds of the fund. Each share class has identical voting rights, except for the exclusive right to vote on matters affecting only its class. Share classes have different fees and expenses (“class-specific fees and expenses”), primarily due to different arrangements for distribution, transfer agent and administrative services. Differences in class-specific fees and expenses will result in differences in net investment income and, therefore, the payment of different per-share dividends by each share class.
| American Funds Corporate Bond Fund | 13 |
2. Significant accounting policies
The fund is an investment company that applies the accounting and reporting guidance issued in Topic 946 by the U.S. Financial Accounting Standards Board. The fund’s financial statements have been prepared to comply with U.S. generally accepted accounting principles (“U.S. GAAP”). These principles require the fund’s investment adviser to make estimates and assumptions that affect reported amounts and disclosures. Actual results could differ from those estimates. Subsequent events, if any, have been evaluated through the date of issuance in the preparation of the financial statements. The fund follows the significant accounting policies described in this section, as well as the valuation policies described in the next section on valuation.
Security transactions and related investment income — Security transactions are recorded by the fund as of the date the trades are executed with brokers. Realized gains and losses from security transactions are determined based on the specific identified cost of the securities. In the event a security is purchased with a delayed payment date, the fund will segregate liquid assets sufficient to meet its payment obligations. Interest income is recognized on an accrual basis. Market discounts, premiums and original issue discounts on fixed-income securities are amortized daily over the expected life of the security.
Class allocations — Income, fees and expenses (other than class-specific fees and expenses) are allocated daily among the various share classes based on the relative value of their settled shares. Realized and unrealized gains and losses are allocated daily among the various share classes based on their relative net assets. Class-specific fees and expenses, such as distribution, transfer agent and administrative services, are charged directly to the respective share class.
Dividends and distributions to shareholders — Dividends to shareholders are declared daily after the determination of the fund’s net investment income and are paid to shareholders monthly. Distributions to shareholders are recorded on the ex-dividend date.
3. Valuation
Capital Research and Management Company (“CRMC”), the fund’s investment adviser, values the fund’s investments at fair value as defined by U.S. GAAP. The net asset value of each share class of the fund is generally determined as of approximately 4:00 p.m. New York time each day the New York Stock Exchange is open.
Methods and inputs — The fund’s investment adviser uses the following methods and inputs to establish the fair value of the fund’s assets and liabilities. Use of particular methods and inputs may vary over time based on availability and relevance as market and economic conditions evolve.
Fixed-income securities, including short-term securities, are generally valued at prices obtained from one or more pricing vendors. Vendors value such securities based on one
| 14 | American Funds Corporate Bond Fund |
or more of the inputs described in the following table. The table provides examples of inputs that are commonly relevant for valuing particular classes of fixed-income securities in which the fund is authorized to invest. However, these classifications are not exclusive, and any of the inputs may be used to value any other class of fixed-income security.
| Fixed-income class | Examples of standard inputs | |
| All | Benchmark yields, transactions, bids, offers, quotations from dealers and trading systems, new issues, spreads and other relationships observed in the markets among comparable securities; and proprietary pricing models such as yield measures calculated using factors such as cash flows, financial or collateral performance and other reference data (collectively referred to as “standard inputs”) | |
| Corporate bonds & notes; convertible securities | Standard inputs and underlying equity of the issuer | |
| Bonds & notes of governments & government agencies | Standard inputs and interest rate volatilities | |
| Mortgage-backed; asset-backed obligations | Standard inputs and cash flows, prepayment information, default rates, delinquency and loss assumptions, collateral characteristics, credit enhancements and specific deal information | |
| Municipal securities | Standard inputs and, for certain distressed securities, cash flows or liquidation values using a net present value calculation based on inputs that include, but are not limited to, financial statements and debt contracts |
When the fund’s investment adviser deems it appropriate to do so (such as when vendor prices are unavailable or deemed to be not representative), fixed-income securities will be valued in good faith at the mean quoted bid and ask prices that are reasonably and timely available (or bid prices, if ask prices are not available) or at prices for securities of comparable maturity, quality and type.
Exchange-traded futures are generally valued at the official settlement price of, or the last reported sale price on, the exchange or market on which such instruments are traded, as of the close of business on the day the futures are being valued or, lacking any sales, at the last available bid price. Prices for each future are taken from the exchange or market on which the security trades. Interest rate swaps and credit default swaps are generally valued by pricing vendors based on market inputs that include the index and term of index, reset frequency, payer/receiver, currency and pay frequency.
Securities and other assets for which representative market quotations are not readily available or are considered unreliable by the fund’s investment adviser are fair valued as determined in good faith under fair valuation guidelines adopted by authority of the fund’s board of trustees as further described. The investment adviser follows fair valuation guidelines, consistent with U.S. Securities and Exchange Commission rules and guidance, to consider relevant principles and factors when making fair value determinations. The investment adviser considers relevant indications of value that are reasonably and timely available to it in determining the fair value to be assigned to a particular security, such as
| American Funds Corporate Bond Fund | 15 |
the type and cost of the security; contractual or legal restrictions on resale of the security; relevant financial or business developments of the issuer; actively traded similar or related securities; conversion or exchange rights on the security; related corporate actions; significant events occurring after the close of trading in the security; and changes in overall market conditions. In addition, the closing prices of equity securities that trade in markets outside U.S. time zones may be adjusted to reflect significant events that occur after the close of local trading but before the net asset value of each share class of the fund is determined. Fair valuations and valuations of investments that are not actively trading involve judgment and may differ materially from valuations that would have been used had greater market activity occurred.
Processes and structure — The fund’s board of trustees has delegated authority to the fund’s investment adviser to make fair value determinations, subject to board oversight. The investment adviser has established a Joint Fair Valuation Committee (the “Fair Valuation Committee”) to administer, implement and oversee the fair valuation process, and to make fair value decisions. The Fair Valuation Committee regularly reviews its own fair value decisions, as well as decisions made under its standing instructions to the investment adviser’s valuation teams. The Fair Valuation Committee reviews changes in fair value measurements from period to period and may, as deemed appropriate, update the fair valuation guidelines to better reflect the results of back testing and address new or evolving issues. The Fair Valuation Committee reports any changes to the fair valuation guidelines to the board of trustees with supplemental information to support the changes. The fund’s board and audit committee also regularly review reports that describe fair value determinations and methods.
The fund’s investment adviser has also established a Fixed-Income Pricing Review Group to administer and oversee the fixed-income valuation process, including the use of fixed-income pricing vendors. This group regularly reviews pricing vendor information and market data. Pricing decisions, processes and controls over security valuation are also subject to additional internal reviews, including an annual control self-evaluation program facilitated by the investment adviser’s compliance group.
Classifications — The fund’s investment adviser classifies the fund’s assets and liabilities into three levels based on the inputs used to value the assets or liabilities. Level 1 values are based on quoted prices in active markets for identical securities. Level 2 values are based on significant observable market inputs, such as quoted prices for similar securities and quoted prices in inactive markets. Certain securities trading outside the U.S. may transfer between Level 1 and Level 2 due to valuation adjustments resulting from significant market movements following the close of local trading. Level 3 values are based on significant unobservable inputs that reflect the investment adviser’s determination of assumptions that market participants might reasonably use in valuing the securities. The valuation levels are not necessarily an indication of the risk or liquidity associated with the underlying investment. For example, U.S. government securities are reflected as Level 2 because the inputs used to determine fair value may not always be quoted prices in an active market. At November 30, 2017, all of the fund’s investments were classified as Level 2.
| 16 | American Funds Corporate Bond Fund |
4. Risk factors
Investing in the fund may involve certain risks including, but not limited to, those described below.
Market conditions — The prices of, and the income generated by, the securities held by the fund may decline – sometimes rapidly or unpredictably – due to various factors, including events or conditions affecting the general economy or particular industries; overall market changes; local, regional or global political, social or economic instability; governmental or governmental agency responses to economic conditions; and currency exchange rate, interest rate and commodity price fluctuations.
Issuer risks — The prices of, and the income generated by, securities held by the fund may decline in response to various factors directly related to the issuers of such securities, including reduced demand for an issuer’s goods or services, poor management performance and strategic initiatives such as mergers, acquisitions or dispositions and the market response to any such initiatives.
Investing in debt instruments — The prices of, and the income generated by, bonds and other debt securities held by the fund may be affected by changing interest rates and by changes in the effective maturities and credit ratings of these securities.
Rising interest rates will generally cause the prices of bonds and other debt securities to fall. Falling interest rates may cause an issuer to redeem, call or refinance a debt security before its stated maturity, which may result in the fund having to reinvest the proceeds in lower yielding securities. Longer maturity debt securities generally have greater sensitivity to changes in interest rates and may be subject to greater price fluctuations than shorter maturity debt securities.
Bonds and other debt securities are also subject to credit risk, which is the possibility that the credit strength of an issuer will weaken and/or an issuer of a debt security will fail to make timely payments of principal or interest and the security will go into default. Lower quality debt securities generally have higher rates of interest and may be subject to greater price fluctuations than higher quality debt securities. Credit risk is gauged, in part, by the credit ratings of the debt securities in which the fund invests. However, ratings are only the opinions of the rating agencies issuing them and are not guarantees as to credit quality or an evaluation of market risk. The fund’s investment adviser relies on its own credit analysts to research issuers and issues in seeking to mitigate various credit and default risks.
Investing in securities backed by the U.S. government — Securities backed by the U.S. Treasury or the full faith and credit of the U.S. government are guaranteed only as to the timely payment of interest and principal when held to maturity. Accordingly, the current market values for these securities will fluctuate with changes in interest rates.
| American Funds Corporate Bond Fund | 17 |
Securities issued by government-sponsored entities and federal agencies and instrumentalities that are not backed by the full faith and credit of the U.S. government are neither issued nor guaranteed by the U.S. government.
Investing in derivatives — The use of derivatives involves a variety of risks, which may be different from, or greater than, the risks associated with investing in traditional cash securities, such as stocks and bonds. Changes in the value of a derivative may not correlate perfectly with, and may be more sensitive to market events than, the underlying asset, rate or index, and a derivative instrument may expose the fund to losses in excess of its initial investment. Derivatives may be difficult for the fund to buy or sell at an opportune time or price and may be difficult to terminate or otherwise offset. The fund’s use of derivatives may result in losses to the fund, and investing in derivatives may reduce the fund’s returns and increase the fund’s price volatility. The fund’s counterparty to a derivative transaction (including, if applicable, the fund’s clearing broker, the derivatives exchange or the clearinghouse) may be unable or unwilling to honor its financial obligations in respect of the transaction. A description of the derivative instruments in which the fund may invest and the various risks associated with those derivatives is included in the fund’s statement of additional information under “Description of certain securities, investment techniques and risks.”
Liquidity risk — Certain fund holdings may be deemed to be less liquid or illiquid because they cannot be readily sold without significantly impacting the value of the holdings. Liquidity risk may result from the lack of an active market for a holding, legal or contractual restrictions on resale, or the reduced number and capacity of market participants to make a market in such holding. Market prices for less liquid or illiquid holdings may be volatile, and reduced liquidity may have an adverse impact on the market price of such holdings. Additionally, the sale of less liquid or illiquid holdings may involve substantial delays (including delays in settlement) and additional costs and the fund may be unable to sell such holdings when necessary to meet its liquidity needs.
Investing outside the U.S. — Securities of issuers domiciled outside the United States, or with significant operations or revenues outside the United States, may lose value because of adverse political, social, economic or market developments (including social instability, regional conflicts, terrorism and war) in the countries or regions in which the issuers operate or generate revenue. These securities may also lose value due to changes in foreign currency exchange rates against the U.S. dollar and/or currencies of other countries. Issuers of these securities may be more susceptible to actions of foreign governments, such as the imposition of price controls or punitive taxes, that could adversely impact the value of these securities. Securities markets in certain countries may be more volatile and/or less liquid than those in the United States. Investments outside the United States may also be subject to different accounting practices and different regulatory, legal and reporting standards and practices, and may be more difficult to value, than those in the United States. In addition, the value of investments outside the United States may be reduced by foreign taxes, including foreign withholding taxes on
| 18 | American Funds Corporate Bond Fund |
interest and dividends. Further, there may be increased risks of delayed settlement of securities purchased or sold by the fund. The risks of investing outside the United States may be heightened in connection with investments in emerging markets.
Investing in emerging markets — Investing in emerging markets may involve risks in addition to and greater than those generally associated with investing in the securities markets of developed countries. For instance, developing countries may have less developed legal and accounting systems than those in developed countries. The governments of these countries may be less stable and more likely to impose capital controls, nationalize a company or industry, place restrictions on foreign ownership and on withdrawing sale proceeds of securities from the country, and/or impose punitive taxes that could adversely affect the prices of securities. In addition, the economies of these countries may be dependent on relatively few industries that are more susceptible to local and global changes. Securities markets in these countries can also be relatively small and have substantially lower trading volumes. As a result, securities issued in these countries may be more volatile and less liquid, and may be more difficult to value, than securities issued in countries with more developed economies and/or markets. Less certainty with respect to security valuations may lead to additional challenges and risks in calculating the fund’s net asset value. Additionally, there may be increased settlement risks for transactions in local securities.
Management — The investment adviser to the fund actively manages the fund’s investments. Consequently, the fund is subject to the risk that the methods and analyses employed by the investment adviser in this process may not produce the desired results. This could cause the fund to lose value or its investment results to lag relevant benchmarks or other funds with similar objectives.
5. Certain investment techniques
Index-linked bonds — The fund has invested in index-linked bonds, which are fixed-income securities whose principal value is periodically adjusted to a government price index. Over the life of an index-linked bond, interest is paid on the adjusted principal value. Increases or decreases in the principal value of index-linked bonds are recorded as interest income in the fund’s statement of operations.
Futures contracts — The fund has entered into futures contracts, which provide for the future sale by one party and purchase by another party of a specified amount of a specific financial instrument for a specified price, date, time and place designated at the time the contract is made. Futures contracts are used to strategically manage portfolio volatility and downside equity risk.
Upon entering into futures contracts, and to maintain the fund’s open positions in futures contracts, the fund is required to deposit with a futures broker, or FCM, in a segregated account in the name of the FCM an amount of cash, U.S. government securities, suitable money market instruments, or other liquid securities, known as initial margin. The margin required for a particular futures contract is set by the exchange on which the contract is traded to serve as collateral, and may be significantly modified from time to time by the
| American Funds Corporate Bond Fund | 19 |
exchange during the term of the contract. When initial margin is deposited with brokers, a receivable is recorded in the fund’s statement of assets and liabilities.
On a daily basis, the fund pays or receives variation margin based on the increase or decrease in the value of the futures contracts and records variation margin on futures contracts in the statement of assets and liabilities. In addition, the fund segregates liquid assets equivalent to the fund’s outstanding obligations under the contract in excess of the initial margin and variation margin, if any. Futures contracts may involve a risk of loss in excess of the variation margin shown on the fund’s statement of assets and liabilities. The fund records realized gains or losses at the time the futures contract is closed or expires. Net realized gains or losses and net unrealized appreciation or depreciation from futures contracts are recorded in the fund’s statement of operations. As of November 30, 2017, the fund did not have any futures contracts. The average month-end notional amount of futures contracts while held was $5,665,000.
Interest rate swaps — The fund has entered into interest rate swap contracts, which are agreements to exchange one stream of future interest payments for another based on a specified notional amount. Typically, interest rate swaps exchange a fixed interest rate for a payment that floats relative to a benchmark or vice versa. The fund’s investment adviser uses interest rate swaps to seek to manage the interest rate sensitivity of the fund by increasing or decreasing the duration of the fund or a portion of the fund’s portfolio. Risks may arise as a result of the fund’s investment adviser incorrectly anticipating changes in interest rates, increased volatility, reduced liquidity and the potential inability of counterparties to meet the terms of their agreements.
Upon entering into an interest rate swap contract, the fund is required to deposit cash, U.S. government securities or other liquid securities, which is known as “initial margin.” Generally, the initial margin required for a particular interest rate swap is set and held as collateral by the clearinghouse on which the contract is cleared. The amount of initial margin required may be significantly modified from time to time by the clearinghouse during the term of the contract.
On a daily basis, the fund’s investment adviser records daily interest accruals related to the exchange of future payments as a receivable and payable in the fund’s statement of assets and liabilities. The fund also pays or receives a “variation margin” based on the increase or decrease in the value of the interest rate swaps, including accrued interest, and records variation margin on interest rate swaps in the statement of assets and liabilities. The fund records realized gains and losses on both the net accrued interest and any gain or loss recognized at the time the interest rate swap is closed or expires. Net realized gains or losses, as well as any net unrealized appreciation or depreciation, from interest rate swaps are recorded in the fund’s statement of operations. The average month-end notional amount of interest rate swaps while held was $3,929,000.
Credit default swap indices — The fund has entered into centrally cleared credit default swap agreements on credit indices (“CDSI”) that involve one party (the protection buyer) making a stream of payments to another party (the protection seller) in exchange for the right to receive a specified return upon the occurrence of a credit event, such as a default
| 20 | American Funds Corporate Bond Fund |
or restructuring, with respect to any of the underlying issuers (reference obligations) in the referenced index. The fund’s investment adviser uses credit default swaps to assume exposure to a diversified portfolio of credits or to hedge against existing credit risks.
CDSI are portfolios of credit instruments or exposures designed to be representative of some part of the credit market, such as the high-yield or investment-grade credit market. CDSI are generally traded using standardized terms, including a fixed spread and standard maturity dates, and reference all the names in the index. If there is a credit event, it is settled based on that name’s weight in the index. The composition of the underlying issuers or obligations within a particular index may change periodically, usually every six months. A specified credit event may affect all or individual underlying reference obligations included in the index, and will be settled based upon the relative weighting of the affected obligation(s) within the index. The value of each CDSI can be used as a measure of the current payment/performance risk of the CDSI and represents the likelihood of an expected liability or profit should the notional amount of the CDSI be closed or sold as of the period end. An increasing value, as compared to the notional amount of the CDSI, represents a deterioration of the referenced indices’ credit soundness and a greater likelihood of risk of default or other credit event occurring as defined under the terms of the agreement. When the fund provides sell protection, its maximum exposure is the notional amount of the credit default swap agreement.
Upon entering into a centrally cleared CDSI contract, the fund is required to deposit with a derivatives clearing member (“DCM”) in a segregated account in the name of the DCM an amount of cash, U.S. government securities or other liquid securities, which is known as “initial margin.” Generally, the initial margin required for a particular credit default swap is set and held as collateral by the clearinghouse on which the contract is cleared. The amount of initial margin required may be significantly modified from time to time by the clearinghouse during the term of the contract. Securities deposited as initial margin are designated on the investment portfolio.
On a daily basis, interest accruals related to the exchange of future payments are recorded as a receivable and payable in the fund’s statement of assets and liabilities. The fund also pays or receives a “variation margin” based on the increase or decrease in the value of the CDSI, and records variation margin in the statement of assets and liabilities. The fund records realized gains and losses on both the net accrued interest and any gain or loss recognized at the time the swap is closed or expires. Net realized gains or losses, as well as any net unrealized appreciation or depreciation, from credit default swaps are recorded in the fund’s statement of operations. The average month-end notional amount of credit default swaps while held was $6,875,000.
| American Funds Corporate Bond Fund | 21 |
The following tables present the financial statement impacts resulting from the fund’s use of futures contracts, interest rate swaps and credit default swaps as of, or for the six months ended, November 30, 2017 (dollars in thousands):
| Assets | Liabilities | |||||||||||||
| Contracts | Risk type | Location on statement of assets and liabilities | Value | Location on statement of assets and liabilities | Value | |||||||||
| Swap contracts | Interest | Net unrealized appreciation* | $ | 40 | Net unrealized depreciation* | $ | 48 | |||||||
| Swap contracts | Credit | Net unrealized appreciation* | 48 | Net unrealized depreciation* | — | |||||||||
| $ | 88 | $ | 48 | |||||||||||
| Net realized gain | Net unrealized (depreciation) appreciation | |||||||||||||
| Contracts | Risk type | Location on statement of operations | Value | Location on statement of operations | Value | |||||||||
| Futures contracts | Interest | Net realized gain on futures contracts | $ | 8 | Net unrealized depreciation on futures contracts | $ | (10 | ) | ||||||
| Swap contracts | Interest | Net realized gain on swap contracts | 144 | Net unrealized appreciation on swap contracts | 113 | |||||||||
| Swap contracts | Credit | Net realized gain on swap contracts | — | Net unrealized appreciation on swap contracts | 23 | |||||||||
| $ | 152 | $ | 126 | |||||||||||
| * | Includes cumulative appreciation/depreciation on interest rate swaps and credit default swaps as reported in the applicable tables following the fund’s investment portfolio. Only current day’s variation margin is reported within the statement of assets and liabilities. |
Collateral — The fund participates in a collateral program due to its use of interest rate swaps and credit default swaps. For interest rate swaps and credit default swaps, the program calls for the fund to pledge highly liquid assets, such as cash or U.S. Treasury bills, as collateral for initial and variation margin by contract. The purpose of the collateral is to cover potential losses that could occur in the event that either party cannot meet its contractual obligations.
6. Taxation and distributions
Federal income taxation — The fund complies with the requirements under Subchapter M of the Internal Revenue Code applicable to mutual funds and intends to distribute substantially all of its net taxable income and net capital gains each year. The fund is not subject to income taxes to the extent such distributions are made. Therefore, no federal income tax provision is required.
| 22 | American Funds Corporate Bond Fund |
As of and during the period ended November 30, 2017, the fund did not have a liability for any unrecognized tax benefits. The fund recognizes interest and penalties, if any, related to unrecognized tax benefits as income tax expense in the statement of operations. During the period, the fund did not incur any significant interest or penalties.
The fund’s tax returns are not subject to examination by federal, state and, if applicable, non-U.S. tax authorities after the expiration of each jurisdiction’s statute of limitations, which is generally three years after the date of filing but can be extended in certain jurisdictions.
Non-U.S. taxation — Interest income is recorded net of non-U.S. taxes paid. The fund may file withholding tax reclaims in certain jurisdictions to recover a portion of amounts previously withheld. These reclaims are recorded when the amount is known and there are no significant uncertainties on collectability. Gains realized by the fund on the sale of securities in certain countries, if any, may be subject to non-U.S. taxes. If applicable, the fund records an estimated deferred tax liability based on unrealized gains to provide for potential non-U.S. taxes payable upon the sale of these securities.
Distributions — Distributions paid to shareholders are based on net investment income and net realized gains determined on a tax basis, which may differ from net investment income and net realized gains for financial reporting purposes. These differences are due primarily to different treatment for items such as short-term capital gains and losses; capital losses related to sales of certain securities within 30 days of purchase; cost of investments sold and income on certain investments. The fiscal year in which amounts are distributed may differ from the year in which the net investment income and net realized gains are recorded by the fund for financial reporting purposes.
The components of distributable earnings on a tax basis are reported as of the fund’s most recent year-end. As of May 31, 2017, the components of distributable earnings on a tax basis were as follows (dollars in thousands):
| Undistributed ordinary income | $ | 156 | ||
| Post-October capital loss deferral* | (712 | ) |
| * | This deferral is considered incurred in the subsequent year. |
As of November 30, 2017, the tax basis unrealized appreciation (depreciation) and cost of investments were as follows (dollars in thousands):
| Gross unrealized appreciation on investments | $ | 3,956 | ||
| Gross unrealized depreciation on investments | (2,073 | ) | ||
| Net unrealized appreciation on investments | 1,883 | |||
| Cost of investments | 404,685 |
| American Funds Corporate Bond Fund | 23 |
Distributions paid or accrued were characterized for tax purposes as follows (dollars in thousands):
| Six months ended November 30, 2017 | Year ended May 31, 2017 | |||||||||||||||||||||||
| Share class | Ordinary income | Long-term capital gains | Total dividends paid or accrued | Ordinary income | Long-term capital gains | Total dividends and distributions paid or accrued | ||||||||||||||||||
| Class A | $ | 3,057 | $ | — | $ | 3,057 | $ | 3,163 | $ | 145 | $ | 3,308 | ||||||||||||
| Class B1,2 | — | 3 | — | 3 | — | 3 | ||||||||||||||||||
| Class C1 | 90 | — | 90 | 90 | 3 | 93 | ||||||||||||||||||
| Class T4 | — | 3 | — | — | 3 | — | 3 | — | — | 3 | ||||||||||||||
| Class F-11 | 43 | — | 43 | 25 | 1 | 26 | ||||||||||||||||||
| Class F-21 | 125 | — | 125 | 101 | 2 | 103 | ||||||||||||||||||
| Class F-35 | 70 | — | 70 | 9 | — | 9 | ||||||||||||||||||
| Class 529-A1 | 105 | — | 105 | 74 | 2 | 76 | ||||||||||||||||||
| Class 529-B1,2 | — | 3 | — | 3 | — | 3 | ||||||||||||||||||
| Class 529-C1 | 20 | — | 20 | 20 | — | 3 | 20 | |||||||||||||||||
| Class 529-E1 | 6 | — | 6 | 7 | — | 3 | 7 | |||||||||||||||||
| Class 529-T4 | — | 3 | — | — | 3 | — | 3 | — | — | 3 | ||||||||||||||
| Class 529-F-11 | 11 | — | 11 | 11 | — | 3 | 11 | |||||||||||||||||
| Class R-11 | 1 | — | 1 | 1 | — | 3 | 1 | |||||||||||||||||
| Class R-21 | 12 | — | 12 | 4 | — | 3 | 4 | |||||||||||||||||
| Class R-2E1 | 1 | — | 1 | 1 | — | 3 | 1 | |||||||||||||||||
| Class R-31 | 10 | — | 10 | 5 | — | 3 | 5 | |||||||||||||||||
| Class R-41 | 11 | — | 11 | 3 | — | 3 | 3 | |||||||||||||||||
| Class R-5E1 | — | 3 | — | — | 3 | 1 | — | 3 | 1 | |||||||||||||||
| Class R-51 | 4 | — | 4 | 1 | — | 3 | 1 | |||||||||||||||||
| Class R-61 | 7 | — | 7 | 3 | — | 3 | 3 | |||||||||||||||||
| Total | $ | 3,573 | $ | — | $ | 3,573 | $ | 3,519 | $ | 153 | $ | 3,672 | ||||||||||||
| 1 | This share class began investment operations on July 29, 2016. |
| 2 | Class B and 529-B shares were fully liquidated on May 5, 2017. |
| 3 | Amount less than one thousand. |
| 4 | Class T and 529-T shares began investment operations on April 7, 2017. |
| 5 | Class F-3 shares began investment operations on January 27, 2017. |
| 24 | American Funds Corporate Bond Fund |
7. Fees and transactions with related parties
CRMC, the fund’s investment adviser, is the parent company of American Funds Distributors,® Inc. (“AFD”), the principal underwriter of the fund’s shares, and American Funds Service Company® (“AFS”), the fund’s transfer agent. CRMC, AFD and AFS are considered related parties to the fund.
Investment advisory services — The fund has an investment advisory and service agreement with CRMC that provides for monthly fees accrued daily. These fees are based on an annual rate of 0.460% of average daily net assets. For the six months ended November 30, 2017, the investment advisory services fee was $749,000.
Miscellaneous fee reimbursements — CRMC has agreed to reimburse a portion of miscellaneous fees and expenses of the fund during its startup period. This reimbursement may be adjusted or discontinued by CRMC, subject to any restrictions in the fund’s prospectus. For the six months ended November 30, 2017, total fees and expenses reimbursed by CRMC were $320,000. Fees and expenses in the statement of operations are presented gross of any reimbursements from CRMC.
Class-specific fees and expenses — Expenses that are specific to individual share classes are accrued directly to the respective share class. The principal class-specific fees and expenses are further described below:
Distribution services — The fund has plans of distribution for all share classes, except Class F-2, F-3, R-5E, R-5 and R-6 shares. Under the plans, the board of trustees approves certain categories of expenses that are used to finance activities primarily intended to sell fund shares and service existing accounts. The plans provide for payments, based on an annualized percentage of average daily net assets, ranging from 0.30% to 1.00% as noted in this section. In some cases, the board of trustees has limited the amounts that may be paid to less than the maximum allowed by the plans. All share classes with a plan may use up to 0.25% of average daily net assets to pay service fees, or to compensate AFD for paying service fees, to firms that have entered into agreements with AFD to provide certain shareholder services. The remaining amounts available to be paid under each plan are paid to dealers to compensate them for their sales activities.
| Share class | Currently approved limits | Plan limits | ||||||
| Class A | 0.30 | % | 0.30 | % | ||||
| Class 529-A | 0.30 | 0.50 | ||||||
| Classes C, 529-C and R-1 | 1.00 | 1.00 | ||||||
| Class R-2 | 0.75 | 1.00 | ||||||
| Class R-2E | 0.60 | 0.85 | ||||||
| Classes 529-E and R-3 | 0.50 | 0.75 | ||||||
| Classes T, F-1, 529-T, 529-F-1 and R-4 | 0.25 | 0.50 | ||||||
| American Funds Corporate Bond Fund | 25 |
For Class A and 529-A shares, distribution-related expenses include the reimbursement of dealer and wholesaler commissions paid by AFD for certain shares sold without a sales charge. These share classes reimburse AFD for amounts billed within the prior 15 months but only to the extent that the overall annual expense limits are not exceeded. As of November 30, 2017, there were no unreimbursed expenses subject to reimbursement for Class A or 529-A shares.
Transfer agent services — The fund has a shareholder services agreement with AFS under which the fund compensates AFS for providing transfer agent services to each of the fund’s share classes. These services include recordkeeping, shareholder communications and transaction processing. In addition, the fund reimburses AFS for amounts paid to third parties for performing transfer agent services on behalf of fund shareholders.
Administrative services — The fund has an administrative services agreement with CRMC under which the fund compensates CRMC for providing administrative services to Class A, C, T, F, 529 and R shares. These services include, but are not limited to, coordinating, monitoring, assisting and overseeing third parties that provide services to fund shareholders. Under the agreement, Class A shares pay an annual fee of 0.01% and Class C, T, F, 529 and R shares pay an annual fee of 0.05% of their respective average daily net assets.
529 plan services — Each 529 share class is subject to service fees to compensate the Virginia College Savings Plan (“Virginia529”) for its oversight and administration of the 529 college savings plan. The quarterly fee is based on a series of decreasing annual rates beginning with 0.10% on the first $20 billion of the net assets invested in the Class 529 shares of the American Funds and decreasing to 0.03% on such assets in excess of $100 billion. The fee for any given calendar quarter is accrued and calculated on the basis of the average net assets of Class 529 shares of the American Funds for the last month of the prior calendar quarter. The fee is included in other expenses in the fund’s statement of operations. Virginia529 is not considered a related party to the fund.
| 26 | American Funds Corporate Bond Fund |
For the six months ended November 30, 2017, class-specific expenses under the agreements were as follows (dollars in thousands):
| Share class | Distribution services | Transfer agent services | Administrative services | 529 plan services | ||||||
| Class A | $336 | $137 | $14 | Not applicable | ||||||
| Class C | 63 | 7 | 3 | Not applicable | ||||||
| Class T | — | — | * | — | * | Not applicable | ||||
| Class F-1 | 5 | 2 | 1 | Not applicable | ||||||
| Class F-2 | Not applicable | 5 | 3 | Not applicable | ||||||
| Class F-3 | Not applicable | — | * | 1 | Not applicable | |||||
| Class 529-A | 15 | 5 | 3 | $4 | ||||||
| Class 529-C | 14 | 1 | 1 | 1 | ||||||
| Class 529-E | 2 | — | * | — | * | — | * | |||
| Class 529-T | — | — | * | — | * | — | * | |||
| Class 529-F-1 | — | — | * | — | * | — | * | |||
| Class R-1 | — | * | — | * | — | * | Not applicable | |||
| Class R-2 | 6 | 2 | 1 | Not applicable | ||||||
| Class R-2E | — | * | — | * | — | * | Not applicable | |||
| Class R-3 | 3 | 1 | — | * | Not applicable | |||||
| Class R-4 | 1 | 1 | — | * | Not applicable | |||||
| Class R-5E | Not applicable | — | * | — | * | Not applicable | ||||
| Class R-5 | Not applicable | — | * | — | * | Not applicable | ||||
| Class R-6 | Not applicable | — | * | — | * | Not applicable | ||||
| Total class-specific expenses | $445 | $161 | $27 | $5 |
| * | Amount less than one thousand. |
Trustees’ deferred compensation — Trustees who are unaffiliated with CRMC may elect to defer the cash payment of part or all of their compensation. These deferred amounts, which remain as liabilities of the fund, are treated as if invested in shares of the fund or other American Funds. These amounts represent general, unsecured liabilities of the fund and vary according to the total returns of the selected funds. Trustees’ compensation in the fund’s statement of operations reflects the current fees (either paid in cash or deferred) and the net increase or decrease in the value of the deferred amounts.
Affiliated officers and trustees — Officers and certain trustees of the fund are or may be considered to be affiliated with CRMC, AFD and AFS. No affiliated officers or trustees received any compensation directly from the fund.
Security transactions with related funds — The fund may purchase from, or sell securities to, other funds managed by CRMC (or funds managed by certain affiliates of CRMC) under procedures adopted by the fund’s board of trustees. The funds involved in such transactions are considered related by virtue of having a common investment adviser (or affiliated investment advisers), common trustees and/or common officers. When such transactions occur, each transaction is executed at the current market price of the security and no brokerage commissions or fees are paid in accordance with Rule 17a-7 of the 1940 Act.
| American Funds Corporate Bond Fund | 27 |
Interfund lending — Pursuant to an exemptive order issued by the SEC, the fund, along with other CRMC-managed funds (or funds managed by certain affiliates of CRMC), may participate in an interfund lending program. The program provides an alternate credit facility that permits the funds to lend or borrow cash for temporary purposes directly to or from one another, subject to the conditions of the exemptive order. The fund did not lend or borrow cash through the interfund lending program at any time during the six months ended November 30, 2017.
8. Capital share transactions
Capital share transactions in the fund were as follows (dollars and shares in thousands):
| Sales1 | Reinvestments of dividends | Repurchases1 | Net increase (decrease) | |||||||||||||||||||||||||||||
| Share class | Amount | Shares | Amount | Shares | Amount | Shares | Amount | Shares | ||||||||||||||||||||||||
| Six months ended November 30, 2017 | ||||||||||||||||||||||||||||||||
| Class A | $ | 152,773 | 14,698 | $ | 2,498 | 240 | $ | (28,033 | ) | (2,695 | ) | $ | 127,238 | 12,243 | ||||||||||||||||||
| Class C | 7,218 | 694 | 90 | 9 | (1,811 | ) | (174 | ) | 5,497 | 529 | ||||||||||||||||||||||
| Class T | — | — | — | — | — | — | — | — | ||||||||||||||||||||||||
| Class F-1 | 4,626 | 445 | 43 | 4 | (689 | ) | (66 | ) | 3,980 | 383 | ||||||||||||||||||||||
| Class F-2 | 12,467 | 1,199 | 125 | 12 | (1,504 | ) | (145 | ) | 11,088 | 1,066 | ||||||||||||||||||||||
| Class F-3 | 4,510 | 434 | 69 | 7 | (801 | ) | (77 | ) | 3,778 | 364 | ||||||||||||||||||||||
| Class 529-A | 7,801 | 751 | 104 | 10 | (837 | ) | (81 | ) | 7,068 | 680 | ||||||||||||||||||||||
| Class 529-C | 2,197 | 211 | 20 | 2 | (330 | ) | (32 | ) | 1,887 | 181 | ||||||||||||||||||||||
| Class 529-E | 213 | 20 | 6 | 1 | (79 | ) | (8 | ) | 140 | 13 | ||||||||||||||||||||||
| Class 529-T | — | — | — | 2 | — | 2 | — | — | — | 2 | — | 2 | ||||||||||||||||||||
| Class 529-F-1 | 387 | 37 | 11 | 1 | (144 | ) | (13 | ) | 254 | 25 | ||||||||||||||||||||||
| Class R-1 | 107 | 11 | 1 | — | 2 | — | 2 | — | 2 | 108 | 11 | |||||||||||||||||||||
| Class R-2 | 841 | 81 | 12 | 1 | (98 | ) | (9 | ) | 755 | 73 | ||||||||||||||||||||||
| Class R-2E | 68 | 7 | — | 2 | — | 2 | — | — | 68 | 7 | ||||||||||||||||||||||
| Class R-3 | 998 | 96 | 10 | 1 | (30 | ) | (3 | ) | 978 | 94 | ||||||||||||||||||||||
| Class R-4 | 248 | 24 | 10 | 1 | (47 | ) | (4 | ) | 211 | 21 | ||||||||||||||||||||||
| Class R-5E | — | — | — | — | — | — | — | — | ||||||||||||||||||||||||
| Class R-5 | 373 | 36 | 4 | — | 2 | (1 | ) | —2 | 376 | 36 | ||||||||||||||||||||||
| Class R-6 | 52 | 5 | 6 | — | 2 | (83 | ) | (8 | ) | (25 | ) | (3 | ) | |||||||||||||||||||
| Total net increase (decrease) | $ | 194,879 | 18,749 | $ | 3,009 | 289 | $ | (34,487 | ) | (3,315 | ) | $ | 163,401 | 15,723 | ||||||||||||||||||
| 28 | American Funds Corporate Bond Fund |
| Sales1 | Reinvestments of dividends and distributions | Repurchases1 | Net increase | |||||||||||||||||||||||||||||
| Share class | Amount | Shares | Amount | Shares | Amount | Shares | Amount | Shares | ||||||||||||||||||||||||
| Year ended May 31, 2017 | ||||||||||||||||||||||||||||||||
| Class A | $ | 183,941 | 17,934 | $ | 1,609 | 158 | $ | (27,066 | ) | (2,651 | ) | $ | 158,484 | 15,441 | ||||||||||||||||||
| Class B3,4 | 26 | 3 | — | 2 | — | 2 | (25 | ) | (3 | ) | 1 | — | 2 | |||||||||||||||||||
| Class C3 | 12,773 | 1,244 | 91 | 9 | (3,060 | ) | (301 | ) | 9,804 | 952 | ||||||||||||||||||||||
| Class T5 | 10 | 1 | — | — | — | — | 10 | 1 | ||||||||||||||||||||||||
| Class F-13 | 2,569 | 251 | 25 | 2 | (381 | ) | (37 | ) | 2,213 | 216 | ||||||||||||||||||||||
| Class F-23 | 9,457 | 919 | 100 | 10 | (3,905 | ) | (384 | ) | 5,652 | 545 | ||||||||||||||||||||||
| Class F-36 | 3,185 | 312 | 9 | 1 | (1 | ) | — | 2 | 3,193 | 313 | ||||||||||||||||||||||
| Class 529-A3 | 6,955 | 677 | 75 | 8 | (611 | ) | (60 | ) | 6,419 | 625 | ||||||||||||||||||||||
| Class 529-B3,4 | 14 | 1 | — | 2 | — | 2 | (14 | ) | (1 | ) | — | 2 | — | 2 | ||||||||||||||||||
| Class 529-C3 | 2,305 | 224 | 21 | 2 | (190 | ) | (18 | ) | 2,136 | 208 | ||||||||||||||||||||||
| Class 529-E3 | 608 | 59 | 7 | 1 | — | 2 | — | 2 | 615 | 60 | ||||||||||||||||||||||
| Class 529-T5 | 10 | 1 | — | 2 | — | 2 | — | — | 10 | 1 | ||||||||||||||||||||||
| Class 529-F-13 | 813 | 80 | 12 | 1 | (67 | ) | (7 | ) | 758 | 74 | ||||||||||||||||||||||
| Class R-13 | 64 | 6 | — | 2 | — | 2 | — | 2 | — | 2 | 64 | 6 | ||||||||||||||||||||
| Class R-23 | 1,083 | 106 | 4 | — | 2 | (3 | ) | — | 2 | 1,084 | 106 | |||||||||||||||||||||
| Class R-2E3 | 25 | 2 | — | — | — | — | 25 | 2 | ||||||||||||||||||||||||
| Class R-33 | 553 | 55 | 3 | — | 2 | (2 | ) | — | 2 | 554 | 55 | |||||||||||||||||||||
| Class R-43 | 768 | 75 | 3 | — | 2 | — | 2 | — | 2 | 771 | 75 | |||||||||||||||||||||
| Class R-5E3 | 25 | 2 | — | — | — | — | 25 | 2 | ||||||||||||||||||||||||
| Class R-53 | 110 | 11 | — | 2 | — | 2 | — | 2 | — | 2 | 110 | 11 | ||||||||||||||||||||
| Class R-63 | 521 | 52 | 3 | — | 2 | — | — | 2 | 524 | 52 | ||||||||||||||||||||||
| Total net increase (decrease) | $ | 225,815 | 22,015 | $ | 1,962 | 192 | $ | (35,325 | ) | (3,462 | ) | $ | 192,452 | 18,745 | ||||||||||||||||||
| 1 | Includes exchanges between share classes of the fund. |
| 2 | Amount less than one thousand. |
| 3 | This share class began investment operations on July 29, 2016. |
| 4 | Class B and 529-B shares of the fund were fully liquidated on May 5, 2017. |
| 5 | Class T and 529-T shares began investment operations on April 7, 2017. |
| 6 | Class F-3 shares began investment operations on January 27, 2017. |
9. Investment transactions
The fund made purchases and sales of investment securities, excluding short-term securities and U.S. government obligations, if any, of $293,453,000 and $152,667,000, respectively, during the six months ended November 30, 2017.
| American Funds Corporate Bond Fund | 29 |
Financial highlights
| Income (loss) from investment operations1 | ||||||||||||||||
| Net gains | ||||||||||||||||
| Net asset | (losses) on | |||||||||||||||
| value, | Net | securities (both | Total from | |||||||||||||
| beginning | investment | realized and | investment | |||||||||||||
| Period ended | of period | income | unrealized) | operations | ||||||||||||
| Class A: | ||||||||||||||||
| 11/30/20174,5 | $ | 10.33 | $ | .12 | $ | .04 | $ | .16 | ||||||||
| 5/31/2017 | 10.27 | .22 | .18 | .40 | ||||||||||||
| 5/31/2016 | 10.20 | .30 | .26 | .56 | ||||||||||||
| 5/31/2015 | 10.11 | .26 | .08 | .34 | ||||||||||||
| 5/31/2014 | 9.85 | .26 | .25 | .51 | ||||||||||||
| 5/31/20134,10 | 10.00 | .09 | (.15 | ) | (.06 | ) | ||||||||||
| Class C: | ||||||||||||||||
| 11/30/20174,5 | 10.33 | .07 | .04 | .11 | ||||||||||||
| 5/31/20174,11 | 10.57 | .12 | (.18 | ) | (.06 | ) | ||||||||||
| Class T: | ||||||||||||||||
| 11/30/20174,5 | 10.33 | .13 | .04 | .17 | ||||||||||||
| 5/31/20174,13 | 10.17 | .04 | .16 | .20 | ||||||||||||
| Class F-1: | ||||||||||||||||
| 11/30/20174,5 | 10.33 | .11 | .04 | .15 | ||||||||||||
| 5/31/20174,11 | 10.57 | .18 | (.18 | ) | — | 9 | ||||||||||
| Class F-2: | ||||||||||||||||
| 11/30/20174,5 | 10.33 | .13 | .04 | .17 | ||||||||||||
| 5/31/20174,11 | 10.57 | .20 | (.17 | ) | .03 | |||||||||||
| Class F-3: | ||||||||||||||||
| 11/30/20174,5 | 10.33 | .13 | .04 | .17 | ||||||||||||
| 5/31/20174,14 | 10.09 | .09 | .24 | .33 | ||||||||||||
| 30 | American Funds Corporate Bond Fund |
| Dividends and distributions | ||||||||||||||||||||||||||||||||||
| Dividends (from net investment income) | Distributions (from capital gains) | Total dividends and distributions | Net asset value, end of period | Total return2,3 | Net assets, end of period (in millions) | Ratio of expenses to average net assets before reimburse- ments | Ratio of expenses to average net assets after reimburse- ments3 | Ratio of net income to average net assets3 | ||||||||||||||||||||||||||
| $ | (.12 | ) | $ | — | $ | (.12 | ) | $ | 10.37 | 1.51 | %6 | $ | 339 | 1.08 | %7 | .89 | %7 | 2.25 | %7 | |||||||||||||||
| (.23 | ) | (.11 | ) | (.34 | ) | 10.33 | 3.90 | 8 | 211 | .98 | 8 | .87 | 8 | 2.16 | 8 | |||||||||||||||||||
| (.29 | ) | (.20 | ) | (.49 | ) | 10.27 | 5.71 | 52 | .75 | .53 | 2.97 | |||||||||||||||||||||||
| (.25 | ) | — | (.25 | ) | 10.20 | 3.44 | 51 | .71 | .53 | 2.52 | ||||||||||||||||||||||||
| (.25 | ) | — | 9 | (.25 | ) | 10.11 | 5.36 | 51 | .69 | .53 | 2.65 | |||||||||||||||||||||||
| (.09 | ) | — | (.09 | ) | 9.85 | (.60 | )6 | 49 | .33 | 6 | .24 | 6 | .91 | 6 | ||||||||||||||||||||
| (.07 | ) | — | (.07 | ) | 10.37 | 1.11 | 6 | 15 | 1.88 | 7 | 1.68 | 7 | 1.46 | 7 | ||||||||||||||||||||
| (.11 | ) | (.07 | ) | (.18 | ) | 10.33 | (.47 | )6 | 10 | 1.77 | 1.64 | 1.40 | ||||||||||||||||||||||
| (.13 | ) | — | (.13 | ) | 10.37 | 1.63 | 6,8 | — | 12 | .90 | 7,8 | .69 | 7,8 | 2.45 | 7,8 | |||||||||||||||||||
| (.04 | ) | — | (.04 | ) | 10.33 | 1.97 | 6,8 | — | 12 | .15 | 6,8 | .10 | 6,8 | .37 | 6,8 | |||||||||||||||||||
| (.11 | ) | — | (.11 | ) | 10.37 | 1.48 | 6 | 6 | 1.11 | 7 | .95 | 7 | 2.19 | 7 | ||||||||||||||||||||
| (.17 | ) | (.07 | ) | (.24 | ) | 10.33 | .09 | 6 | 2 | 1.14 | 1.00 | 2.07 | ||||||||||||||||||||||
| (.13 | ) | — | (.13 | ) | 10.37 | 1.62 | 6 | 17 | .82 | 7 | .67 | 7 | 2.46 | 7 | ||||||||||||||||||||
| (.20 | ) | (.07 | ) | (.27 | ) | 10.33 | .33 | 6 | 5 | .77 | .66 | 2.35 | ||||||||||||||||||||||
| (.13 | ) | — | (.13 | ) | 10.37 | 1.66 | 6 | 7 | .79 | 7 | .59 | 7 | 2.55 | 7 | ||||||||||||||||||||
| (.09 | ) | — | (.09 | ) | 10.33 | 3.29 | 6 | 3 | .32 | 6 | .20 | 6 | .89 | 6 | ||||||||||||||||||||
See end of table for footnotes.
| American Funds Corporate Bond Fund | 31 |
Financial highlights (continued)
| Income (loss) from investment operations1 | ||||||||||||||||
| Net gains | ||||||||||||||||
| Net asset | (losses) on | |||||||||||||||
| value, | Net | securities (both | Total from | |||||||||||||
| beginning | investment | realized and | investment | |||||||||||||
| Period ended | of period | income | unrealized) | operations | ||||||||||||
| Class 529-A: | ||||||||||||||||
| 11/30/20174,5 | $ | 10.33 | $ | .11 | $ | .04 | $ | .15 | ||||||||
| 5/31/20174,11 | 10.57 | .17 | (.17 | ) | — | 9 | ||||||||||
| Class 529-C: | ||||||||||||||||
| 11/30/20174,5 | 10.33 | .07 | .04 | .11 | ||||||||||||
| 5/31/20174,11 | 10.57 | .12 | (.18 | ) | (.06 | ) | ||||||||||
| Class 529-E: | ||||||||||||||||
| 11/30/20174,5 | 10.33 | .10 | .04 | .14 | ||||||||||||
| 5/31/20174,11 | 10.57 | .16 | (.17 | ) | (.01 | ) | ||||||||||
| Class 529-T: | ||||||||||||||||
| 11/30/20174,5 | 10.33 | .12 | .04 | .16 | ||||||||||||
| 5/31/20174,13 | 10.17 | .04 | .16 | .20 | ||||||||||||
| Class 529-F-1: | ||||||||||||||||
| 11/30/20174,5 | 10.33 | .12 | .04 | .16 | ||||||||||||
| 5/31/20174,11 | 10.57 | .20 | (.18 | ) | .02 | |||||||||||
| Class R-1: | ||||||||||||||||
| 11/30/20174,5 | 10.33 | .09 | .04 | .13 | ||||||||||||
| 5/31/20174,11 | 10.57 | .18 | (.17 | ) | .01 | |||||||||||
| 32 | American Funds Corporate Bond Fund |
| Dividends and distributions | ||||||||||||||||||||||||||||||||||
| Dividends (from net investment income) | Distributions (from capital gains) | Total dividends and distributions | Net asset value, end of period | Total return2,3 | Net assets, end of period (in millions) | Ratio of expenses to average net assets before reimburse- ments | Ratio of expenses to average net assets after reimburse- ments3 | Ratio of net income to average net assets3 | ||||||||||||||||||||||||||
| $ | (.11 | ) | $ | — | $ | (.11 | ) | $ | 10.37 | 1.44 | %6 | $ | 13 | 1.23 | %7 | 1.04 | %7 | 2.10 | %7 | |||||||||||||||
| (.17 | ) | (.07 | ) | (.24 | ) | 10.33 | .06 | 6 | 6 | 1.15 | 1.01 | 2.06 | ||||||||||||||||||||||
| (.07 | ) | — | (.07 | ) | 10.37 | 1.08 | 6 | 4 | 1.93 | 7 | 1.74 | 7 | 1.40 | 7 | ||||||||||||||||||||
| (.11 | ) | (.07 | ) | (.18 | ) | 10.33 | (.48 | )6 | 2 | 1.82 | 1.69 | 1.36 | ||||||||||||||||||||||
| (.10 | ) | — | (.10 | ) | 10.37 | 1.37 | 6 | 1 | 1.37 | 7 | 1.17 | 7 | 1.97 | 7 | ||||||||||||||||||||
| (.16 | ) | (.07 | ) | (.23 | ) | 10.33 | (.02 | )6 | 1 | 1.27 | 1.13 | 1.93 | ||||||||||||||||||||||
| (.12 | ) | — | (.12 | ) | 10.37 | 1.59 | 6,8 | — | 12 | .97 | 7,8 | .75 | 7,8 | 2.38 | 7,8 | |||||||||||||||||||
| (.04 | ) | — | (.04 | ) | 10.33 | 1.96 | 6,8 | — | 12 | .16 | 6,8 | .11 | 6,8 | .36 | 6,8 | |||||||||||||||||||
| (.12 | ) | — | (.12 | ) | 10.37 | 1.58 | 6 | 1 | .95 | 7 | .75 | 7 | 2.39 | 7 | ||||||||||||||||||||
| (.19 | ) | (.07 | ) | (.26 | ) | 10.33 | .30 | 6 | 1 | .85 | .71 | 2.36 | ||||||||||||||||||||||
| (.09 | ) | — | (.09 | ) | 10.37 | 1.25 | 6,8 | — | 12 | 1.60 | 7,8 | 1.41 | 7,8 | 1.74 | 7,8 | |||||||||||||||||||
| (.18 | ) | (.07 | ) | (.25 | ) | 10.33 | .15 | 6,8 | — | 12 | 1.12 | 8 | .97 | 8 | 2.06 | 8 | ||||||||||||||||||
See end of table for footnotes.
| American Funds Corporate Bond Fund | 33 |
Financial highlights (continued)
| Income (loss) from investment operations1 | ||||||||||||||||
| Net gains | ||||||||||||||||
| Net asset | (losses) on | |||||||||||||||
| value, | Net | securities (both | Total from | |||||||||||||
| beginning | investment | realized and | investment | |||||||||||||
| Period ended | of period | income | unrealized) | operations | ||||||||||||
| Class R-2: | ||||||||||||||||
| 11/30/20174,5 | $ | 10.33 | $ | .08 | $ | .04 | $ | .12 | ||||||||
| 5/31/20174,11 | 10.57 | .15 | (.17 | ) | (.02 | ) | ||||||||||
| Class R-2E: | ||||||||||||||||
| 11/30/20174,5 | 10.33 | .13 | .04 | .17 | ||||||||||||
| 5/31/20174,11 | 10.57 | .20 | (.17 | ) | .03 | |||||||||||
| Class R-3: | ||||||||||||||||
| 11/30/20174,5 | 10.33 | .10 | .04 | .14 | ||||||||||||
| 5/31/20174,11 | 10.57 | .17 | (.17 | ) | — | 9 | ||||||||||
| Class R-4: | ||||||||||||||||
| 11/30/20174,5 | 10.33 | .11 | .04 | .15 | ||||||||||||
| 5/31/20174,11 | 10.57 | .20 | (.18 | ) | .02 | |||||||||||
| Class R-5E: | ||||||||||||||||
| 11/30/20174,5 | 10.33 | .13 | .04 | .17 | ||||||||||||
| 5/31/20174,11 | 10.57 | .20 | (.17 | ) | .03 | |||||||||||
| Class R-5: | ||||||||||||||||
| 11/30/20174,5 | 10.33 | .13 | .04 | .17 | ||||||||||||
| 5/31/20174,11 | 10.57 | .21 | (.18 | ) | .03 | |||||||||||
| 34 | American Funds Corporate Bond Fund |
| Dividends and distributions | ||||||||||||||||||||||||||||||||||
| Dividends (from net investment income) | Distributions (from capital gains) | Total dividends and distributions | Net asset value, end of period | Total return2,3 | Net assets, end of period (in millions) | Ratio of expenses to average net assets before reimburse- ments | Ratio of expenses to average net assets after reimburse- ments3 | Ratio of net income to average net assets3 | ||||||||||||||||||||||||||
| $ | (.08 | ) | $ | — | $ | (.08 | ) | $ | 10.37 | 1.14 | %6 | $ | 2 | 1.83 | %7 | 1.62 | %7 | 1.51 | %7 | |||||||||||||||
| (.15 | ) | (.07 | ) | (.22 | ) | 10.33 | (.11 | )6 | 1 | 1.64 | 1.39 | 1.75 | ||||||||||||||||||||||
| (.13 | ) | — | (.13 | ) | 10.37 | 1.60 | 6,8 | — | 12 | 1.05 | 7,8 | .80 | 7,8 | 2.42 | 7,8 | |||||||||||||||||||
| (.20 | ) | (.07 | ) | (.27 | ) | 10.33 | .36 | 6,8 | — | 12 | .75 | 8 | .63 | 8 | 2.33 | 8 | ||||||||||||||||||
| (.10 | ) | — | (.10 | ) | 10.37 | 1.36 | 6 | 2 | 1.35 | 7 | 1.18 | 7 | 1.98 | 7 | ||||||||||||||||||||
| (.17 | ) | �� | (.07 | ) | (.24 | ) | 10.33 | .10 | 6 | 1 | 1.29 | 1.11 | 2.02 | |||||||||||||||||||||
| (.11 | ) | — | (.11 | ) | 10.37 | 1.49 | 6 | 1 | 1.15 | 7 | .93 | 7 | 2.20 | 7 | ||||||||||||||||||||
| (.19 | ) | (.07 | ) | (.26 | ) | 10.33 | .26 | 6 | 1 | 1.15 | .85 | 2.31 | ||||||||||||||||||||||
| (.13 | ) | — | (.13 | ) | 10.37 | 1.66 | 6 | — | 12 | .88 | 7 | .59 | 7 | 2.54 | 7 | |||||||||||||||||||
| (.20 | ) | (.07 | ) | (.27 | ) | 10.33 | .37 | 6 | — | 12 | .73 | .62 | 2.34 | |||||||||||||||||||||
| (.13 | ) | — | (.13 | ) | 10.37 | 1.64 | 6 | — | 12 | .82 | 7 | .64 | 7 | 2.51 | 7 | |||||||||||||||||||
| (.20 | ) | (.07 | ) | (.27 | ) | 10.33 | .34 | 6 | — | 12 | .81 | .63 | 2.42 | |||||||||||||||||||||
See end of table for footnotes.
| American Funds Corporate Bond Fund | 35 |
Financial highlights (continued)
| Income (loss) from investment operations1 | ||||||||||||||||
| Net gains | ||||||||||||||||
| Net asset | (losses) on | |||||||||||||||
| value, | Net | securities (both | Total from | |||||||||||||
| beginning | investment | realized and | investment | |||||||||||||
| Period ended | of period | income | unrealized) | operations | ||||||||||||
| Class R-6: | ||||||||||||||||
| 11/30/20174,5 | $ | 10.33 | $ | .13 | $ | .04 | $ | .17 | ||||||||
| 5/31/20174,11 | 10.57 | .21 | (.19 | ) | .02 | |||||||||||
| Six months ended | ||||||||||||
| November 30, | Year ended May 31 | For the period | ||||||||||
| 20174,5,6 | 2017 | 2016 | 2015 | 2014 | 12/14/2012 to 5/31/20134,10 | |||||||
| Portfolio turnover rate for all share classes | 77% | 162% | 295% | 204% | 178% | 65% | ||||||
See Notes to Financial Statements
| 36 | American Funds Corporate Bond Fund |
| Dividends and distributions | ||||||||||||||||||||||||||||||||||
| Dividends (from net investment income) | Distributions (from capital gains) | Total dividends and distributions | Net asset value, end of period | Total return2,3 | Net assets, end of period (in millions) | Ratio of expenses to average net assets before reimburse- ments | Ratio of expenses to average net assets after reimburse- ments3 | Ratio of net income to average net assets3 | ||||||||||||||||||||||||||
| �� | ||||||||||||||||||||||||||||||||||
| $ | (.13 | ) | $ | — | $ | (.13 | ) | $ | 10.37 | 1.65 | %6 | $ | 1 | .83 | %7 | .62 | %7 | 2.51 | %7 | |||||||||||||||
| (.19 | ) | (.07 | ) | (.26 | ) | 10.33 | .306 | 1 | .84 | .62 | 2.54 | |||||||||||||||||||||||
| 1 | Based on average shares outstanding. |
| 2 | Total returns exclude any applicable sales charges, including contingent deferred sales charges. |
| 3 | This column reflects the impact of a reimbursement from CRMC. During the periods shown, CRMC reimbursed a portion of miscellaneous fees and expenses. |
| 4 | Based on operations for the period shown and, accordingly, is not representative of a full year. |
| 5 | Unaudited. |
| 6 | Not annualized. |
| 7 | Annualized. |
| 8 | All or a significant portion of assets in this class consisted of seed capital invested by CRMC and/or its affiliates. Fees for distribution services are not charged or accrued on these seed capital assets. If such fees were paid by the fund on seed capital assets, fund expenses would have been higher and net income and total return would have been lower. |
| 9 | Amount less than $.01. |
| 10 | For the period December 14, 2012, commencement of operations, through May 31, 2013. |
| 11 | This share class began investment operations on July 29, 2016. |
| 12 | Amount less than $1 million. |
| 13 | Class T and 529-T shares began investment operations on April 7, 2017. |
| 14 | Class F-3 shares began investment operations on January 27, 2017. |
| American Funds Corporate Bond Fund | 37 |
| Expense example | unaudited |
As a fund shareholder, you incur two types of costs: (1) transaction costs, such as initial sales charges on purchase payments and contingent deferred sales charges on redemptions (loads), and (2) ongoing costs, including management fees, distribution and service (12b-1) fees, and other expenses. This example is intended to help you understand your ongoing costs (in dollars) of investing in the fund so you can compare these costs with the ongoing costs of investing in other mutual funds. The example is based on an investment of $1,000 invested at the beginning of the period and held for the entire six-month period (June 1, 2017, through November 30, 2017).
Actual expenses:
The first line of each share class in the table on the following page provides information about actual account values and actual expenses. You may use the information in this line, together with the amount you invested, to estimate the expenses that you paid over the period. Simply divide your account value by $1,000 (for example, an $8,600 account value divided by $1,000 = 8.6), then multiply the result by the number in the first line under the heading titled “Expenses paid during period” to estimate the expenses you paid on your account during this period.
Hypothetical example for comparison purposes:
The second line of each share class in the table on the following page provides information about hypothetical account values and hypothetical expenses based on the actual expense ratio for the share class and an assumed rate of return of 5.00% per year before expenses, which is not the actual return of the share class. The hypothetical account values and expenses may not be used to estimate the actual ending account balance or expenses you paid for the period. You may use this information to compare the ongoing costs of investing in the fund and other funds. To do so, compare this 5.00% hypothetical example with the 5.00% hypothetical examples that appear in the shareholder reports of the other funds.
Notes:
Retirement plan participants may be subject to certain fees charged by the plan sponsor, and Class F-1, F-2, F-3 and 529-F-1 shareholders may be subject to fees charged by financial intermediaries, typically ranging from 0.75% to 1.50% of assets annually depending on services offered. You can estimate the impact of these fees by adding the amount of the fees to the total estimated expenses you paid on your account during the period as calculated above. In addition, your ending account value would be lower by the amount of these fees.
Note that the expenses shown in the table on the following page are meant to highlight your ongoing costs only and do not reflect any transactional costs, such as sales charges (loads). Therefore, the second line of each share class in the table is useful in comparing ongoing costs only and will not help you determine the relative total costs of owning different funds. In addition, if these transactional costs were included, your costs would have been higher.
| 38 | American Funds Corporate Bond Fund |
| Beginning account value 6/1/2017 | Ending account value 11/30/2017 | Expenses paid during period* | Annualized expense ratio | |||||||||||||
| Class A – actual return | $ | 1,000.00 | $ | 1,015.13 | $ | 4.50 | .89 | % | ||||||||
| Class A – assumed 5% return | 1,000.00 | 1,020.61 | 4.51 | .89 | ||||||||||||
| Class C – actual return | 1,000.00 | 1,011.11 | 8.47 | 1.68 | ||||||||||||
| Class C – assumed 5% return | 1,000.00 | 1,016.65 | 8.49 | 1.68 | ||||||||||||
| Class T – actual return | 1,000.00 | 1,016.27 | 3.49 | .69 | ||||||||||||
| Class T – assumed 5% return | 1,000.00 | 1,021.61 | 3.50 | .69 | ||||||||||||
| Class F-1 – actual return | 1,000.00 | 1,014.81 | 4.80 | .95 | ||||||||||||
| Class F-1 – assumed 5% return | 1,000.00 | 1,020.31 | 4.81 | .95 | ||||||||||||
| Class F-2 – actual return | 1,000.00 | 1,016.21 | 3.39 | .67 | ||||||||||||
| Class F-2 – assumed 5% return | 1,000.00 | 1,021.71 | 3.40 | .67 | ||||||||||||
| Class F-3 – actual return | 1,000.00 | 1,016.63 | 2.98 | .59 | ||||||||||||
| Class F-3 – assumed 5% return | 1,000.00 | 1,022.11 | 2.99 | .59 | ||||||||||||
| Class 529-A – actual return | 1,000.00 | 1,014.37 | 5.25 | 1.04 | ||||||||||||
| Class 529-A – assumed 5% return | 1,000.00 | 1,019.85 | 5.27 | 1.04 | ||||||||||||
| Class 529-C – actual return | 1,000.00 | 1,010.81 | 8.77 | 1.74 | ||||||||||||
| Class 529-C – assumed 5% return | 1,000.00 | 1,016.34 | 8.80 | 1.74 | ||||||||||||
| Class 529-E – actual return | 1,000.00 | 1,013.71 | 5.91 | 1.17 | ||||||||||||
| Class 529-E – assumed 5% return | 1,000.00 | 1,019.20 | 5.92 | 1.17 | ||||||||||||
| Class 529-T – actual return | 1,000.00 | 1,015.93 | 3.79 | .75 | ||||||||||||
| Class 529-T – assumed 5% return | 1,000.00 | 1,021.31 | 3.80 | .75 | ||||||||||||
| Class 529-F-1 – actual return | 1,000.00 | 1,015.85 | 3.79 | .75 | ||||||||||||
| Class 529-F-1 – assumed 5% return | 1,000.00 | 1,021.31 | 3.80 | .75 | ||||||||||||
| Class R-1 – actual return | 1,000.00 | 1,012.53 | 7.11 | 1.41 | ||||||||||||
| Class R-1 – assumed 5% return | 1,000.00 | 1,018.00 | 7.13 | 1.41 | ||||||||||||
| Class R-2 – actual return | 1,000.00 | 1,011.42 | 8.17 | 1.62 | ||||||||||||
| Class R-2 – assumed 5% return | 1,000.00 | 1,016.95 | 8.19 | 1.62 | ||||||||||||
| Class R-2E – actual return | 1,000.00 | 1,016.04 | 4.04 | .80 | ||||||||||||
| Class R-2E – assumed 5% return | 1,000.00 | 1,021.06 | 4.05 | .80 | ||||||||||||
| Class R-3 – actual return | 1,000.00 | 1,013.63 | 5.96 | 1.18 | ||||||||||||
| Class R-3 – assumed 5% return | 1,000.00 | 1,019.15 | 5.97 | 1.18 | ||||||||||||
| Class R-4 – actual return | 1,000.00 | 1,014.89 | 4.70 | .93 | ||||||||||||
| Class R-4 – assumed 5% return | 1,000.00 | 1,020.41 | 4.71 | .93 | ||||||||||||
| Class R-5E – actual return | 1,000.00 | 1,016.62 | 2.98 | .59 | ||||||||||||
| Class R-5E – assumed 5% return | 1,000.00 | 1,022.11 | 2.99 | .59 | ||||||||||||
| Class R-5 – actual return | 1,000.00 | 1,016.36 | 3.24 | .64 | ||||||||||||
| Class R-5 – assumed 5% return | 1,000.00 | 1,021.86 | 3.24 | .64 | ||||||||||||
| Class R-6 – actual return | 1,000.00 | 1,016.52 | 3.13 | .62 | ||||||||||||
| Class R-6 – assumed 5% return | 1,000.00 | 1,021.96 | 3.14 | .62 | ||||||||||||
| * | The “expenses paid during period” are equal to the “annualized expense ratio,” multiplied by the average account value over the period, multiplied by the number of days in the period, and divided by 365 (to reflect the one-half year period). |
| American Funds Corporate Bond Fund | 39 |
This page was intentionally left blank.
| 40 | American Funds Corporate Bond Fund |
This page was intentionally left blank.
| American Funds Corporate Bond Fund | 41 |
This page was intentionally left blank.
| 42 | American Funds Corporate Bond Fund |
This page was intentionally left blank.
| American Funds Corporate Bond Fund | 43 |
Offices of the fund and of the investment adviser
Capital Research and Management Company
333 South Hope Street
Los Angeles, CA 90071-1406
6455 Irvine Center Drive
Irvine, CA 92618-4518
Transfer agent for shareholder accounts
American Funds Service Company
(Write to the address near you.)
P.O. Box 6007
Indianapolis, IN 46206-6007
P.O. Box 2280
Norfolk, VA 23501-2280
Custodian of assets
Bank of New York Mellon
One Wall Street
New York, NY 10286
Counsel
Morgan, Lewis & Bockius LLP
300 South Grand Avenue, 22nd Floor
Los Angeles, CA 90071-3132
Independent registered public accounting firm
PricewaterhouseCoopers LLP
601 South Figueroa Street
Los Angeles, CA 90017-3874
Principal underwriter
American Funds Distributors, Inc.
333 South Hope Street
Los Angeles, CA 90071-1406
| 44 | American Funds Corporate Bond Fund |
Investors should carefully consider investment objectives, risks, charges and expenses. This and other important information is contained in the fund prospectus and summary prospectus, which can be obtained from your financial professional and should be read carefully before investing. You may also call American Funds Service Company (AFS) at (800) 421-4225 or visit the American Funds website at americanfunds.com. Fund shares offered through American Funds Distributors, Inc.
“American Funds Proxy Voting Procedures and Principles” — which describes how we vote proxies relating to portfolio securities — is available on the American Funds website or upon request by calling AFS. The fund files its proxy voting record with the U.S. Securities and Exchange Commission (SEC) for the 12 months ended June 30 by August 31. The proxy voting record is available free of charge on the SEC website at sec.gov and on the American Funds website.
A complete November 30, 2017, portfolio of American Funds Corporate Bond Fund’s investments is available free of charge by calling AFS or visiting the SEC website (where it is part of Form N-CSR).
American Funds Corporate Bond Fund files a complete list of its portfolio holdings with the SEC for the first and third quarters of each fiscal year on Form N-Q. This filing is available free of charge on the SEC website. You may also review or, for a fee, copy this filing at the SEC’s Public Reference Room in Washington, D.C. Additional information regarding the operation of the Public Reference Room may be obtained by calling the SEC’s Office of Investor Education and Advocacy at (800) SEC-0330. Additionally, the list of portfolio holdings is available by calling AFS.
This report is for the information of shareholders of American Funds Corporate Bond Fund, but it also may be used as sales literature when preceded or accompanied by the current prospectus or summary prospectus, which gives details about charges, expenses, investment objectives and operating policies of the fund. If used as sales material after March 31, 2018, this report must be accompanied by an American Funds statistical update for the most recently completed calendar quarter.
Bloomberg® is a trademark of Bloomberg Finance L.P. (collectively with its affiliates, “Bloomberg”). Barclays® is a trademark of Barclays Bank Plc (collectively with its affiliates, “Barclays”), used under license. Neither Bloomberg nor Barclays approves or endorses this material, guarantees the accuracy or completeness of any information herein and, to the maximum extent allowed by law, neither shall have any liability or responsibility for injury or damages arising in connection therewith.
American Funds from Capital Group
The Capital AdvantageSM
Since 1931, American Funds, part of Capital Group, has helped investors pursue long-term investment success. Our consistent approach — in combination with The Capital SystemSM — has resulted in a superior long-term track record.
| Aligned with investor success | |
| We base our decisions on a long-term perspective, which we believe aligns our goals with the interests of our clients. Our portfolio managers average 27 years of investment experience, including 21 years at our company, reflecting a career commitment to our long-term approach.1 | |
| The Capital System | |
| The Capital System combines individual accountability with teamwork. Funds using The Capital System are divided into portions that are managed independently by investment professionals with diverse backgrounds, ages and investment approaches. An extensive global research effort is the backbone of our system. | |
| American Funds’ superior long-term track record | |
| Equity funds have beaten their Lipper peer indexes in 93% of 10-year periods and 98% of 20-year periods. Fixed income funds have beaten their Lipper indexes in 80% of 10-year periods and 80% of 20-year periods.2 Fund management fees have been among the lowest in the industry.3 |
| 1 | Portfolio manager experience as of December 31, 2016. | |
| 2 | Based on Class F-2 share results for rolling periods through December 31, 2016. Periods covered are the shorter of the fund’s lifetime or since the comparable Lipper index inception date (except Capital Income Builder and SMALLCAP World Fund, for which the Lipper average was used). Expenses differ for each share class, so results will vary. Class F-2 shares were first offered on August 1, 2008. Class F-2 share results prior to the date of first sale are hypothetical based on Class A share results without a sales charge, adjusted for typical estimated expenses. Results for certain funds with an inception date after August 1, 2008, also include hypothetical returns because those funds’ Class F-2 shares sold after the funds’ date of first offering. Please see americanfunds.com for more information on specific expense adjustments and the actual dates of first sale. | |
| 3 | On average, our management fees were in the lowest quintile 73% of the time, based on the 20-year period ended December 31, 2016, versus comparable Lipper categories, excluding funds of funds. |

ITEM 2 – Code of Ethics
Not applicable for filing of semi-annual reports to shareholders.
ITEM 3 – Audit Committee Financial Expert
Not applicable for filing of semi-annual reports to shareholders.
ITEM 4 – Principal Accountant Fees and Services
Not applicable for filing of semi-annual reports to shareholders.
ITEM 5 – Audit Committee of Listed Registrants
Not applicable to this Registrant, insofar as the Registrant is not a listed issuer as defined in Rule 10A-3 under the Securities Exchange Act of 1934.
ITEM 6 – Schedule of Investments

American Funds Corporate Bond Fund®
Investment portfolio
November 30, 2017
unaudited
| Bonds, notes & other debt instruments 92.57% Corporate bonds & notes 85.96% Health care 13.27% | Principal?amount (000) | Value (000) |
| Abbott Laboratories 2.90% 2021 | $2,360 | $2,376 |
| Abbott Laboratories 3.40% 2023 | 1,505 | 1,530 |
| Abbott Laboratories 3.75% 2026 | 2,880 | 2,941 |
| Abbott Laboratories 4.90% 2046 | 845 | 948 |
| AbbVie Inc. 2.50% 2020 | 100 | 101 |
| AbbVie Inc. 2.30% 2021 | 330 | 327 |
| AbbVie Inc. 2.85% 2023 | 385 | 385 |
| AbbVie Inc. 3.20% 2026 | 2,000 | 1,979 |
| AbbVie Inc. 4.45% 2046 | 1,985 | 2,095 |
| Allergan PLC 2.35% 2018 | 100 | 100 |
| Allergan PLC 3.00% 2020 | 300 | 303 |
| Allergan PLC 3.80% 2025 | 1,000 | 1,008 |
| Allergan PLC 4.75% 2045 | 100 | 105 |
| Amgen Inc. 1.85% 2021 | 370 | 361 |
| Amgen Inc. 2.65% 2022 | 1,675 | 1,670 |
| Anthem, Inc. 2.95% 2022 | 475 | 475 |
| AstraZeneca PLC 1.75% 2018 | 100 | 100 |
| AstraZeneca PLC 2.375% 2022 | 2,325 | 2,293 |
| AstraZeneca PLC 3.375% 2025 | 175 | 178 |
| AstraZeneca PLC 4.375% 2045 | 200 | 213 |
| Becton, Dickinson and Co. 2.675% 2019 | 49 | 49 |
| Becton, Dickinson and Co. 2.894% 2022 | 710 | 706 |
| Becton, Dickinson and Co. 3.363% 2024 | 2,825 | 2,827 |
| Becton, Dickinson and Co. 3.70% 2027 | 4,045 | 4,039 |
| Biogen Inc. 3.625% 2022 | 900 | 933 |
| Boston Scientific Corp. 2.85% 2020 | 150 | 151 |
| Boston Scientific Corp. 3.375% 2022 | 400 | 408 |
| EMD Finance LLC 2.40% 20201 | 50 | 50 |
| EMD Finance LLC 2.95% 20221 | 425 | 429 |
| EMD Finance LLC 3.25% 20251 | 425 | 428 |
| HCA Inc. 4.75% 2023 | 1,000 | 1,046 |
| Johnson & Johnson 1.125% 2019 | 400 | 397 |
| Johnson & Johnson 2.625% 2025 | 1,985 | 1,976 |
| Johnson & Johnson 2.90% 2028 | 500 | 500 |
| Johnson & Johnson 3.50% 2048 | 345 | 344 |
| Laboratory Corporation of America Holdings 2.625% 2020 | 200 | 201 |
| Laboratory Corporation of America Holdings 3.60% 2027 | 600 | 601 |
| Medtronic, Inc. 4.625% 2045 | 300 | 343 |
| Roche Holdings, Inc. 2.25% 20191 | 400 | 401 |
| Roche Holdings, Inc. 3.35% 20241 | 400 | 413 |
| Roche Holdings, Inc. 2.375% 20271 | 935 | 887 |
| Shire PLC 2.40% 2021 | 3,575 | 3,520 |
| Shire PLC 2.875% 2023 | 470 | 460 |
| Shire PLC 3.20% 2026 | 1,480 | 1,425 |
| Teva Pharmaceutical Finance Company BV 2.20% 2021 | 2,605 | 2,396 |
| Teva Pharmaceutical Finance Company BV 2.80% 2023 | 4,940 | 4,367 |
American Funds Corporate Bond Fund — Page 1 of 12
unaudited
| Bonds, notes & other debt instruments Corporate bonds & notes (continued) Health care (continued) | Principal?amount (000) | Value (000) |
| Teva Pharmaceutical Finance Company BV 3.15% 2026 | $1,790 | $1,496 |
| Teva Pharmaceutical Finance Company BV 4.10% 2046 | 1,850 | 1,407 |
| UnitedHealth Group Inc. 2.125% 2021 | 100 | 99 |
| UnitedHealth Group Inc. 3.75% 2025 | 400 | 421 |
| WellPoint, Inc. 3.125% 2022 | 1,325 | 1,337 |
| Zimmer Holdings, Inc. 2.00% 2018 | 100 | 100 |
| Zimmer Holdings, Inc. 2.70% 2020 | 300 | 300 |
| Zimmer Holdings, Inc. 3.15% 2022 | 400 | 401 |
| 54,346 | ||
| Utilities 13.04% | ||
| Alliant Energy Corporation 3.25% 2024 | 850 | 862 |
| Ameren Corp. 3.70% 2047 | 150 | 150 |
| American Electric Power Co., Inc. 3.20% 2027 | 1,600 | 1,585 |
| Centerpoint Energy, Inc., 2.50% 2022 | 440 | 435 |
| CMS Energy Corp. 3.00% 2026 | 600 | 589 |
| CMS Energy Corp. 2.95% 2027 | 1,000 | 964 |
| Colbun SA 3.95% 20271 | 2,725 | 2,735 |
| Comision Federal de Electricidad 4.75% 20271 | 500 | 526 |
| Dominion Resources, Inc. 2.579% 2020 | 425 | 425 |
| Duke Energy Carolinas, Inc. 3.70% 2047 | 300 | 302 |
| Duke Energy Corp. 3.75% 2046 | 500 | 488 |
| Duke Energy Corp. 3.95% 2047 | 625 | 632 |
| EDP Finance BV 5.25% 20211 | 400 | 431 |
| EDP Finance BV 3.625% 20241 | 3,550 | 3,580 |
| Electricité de France SA 4.95% 20451 | 200 | 219 |
| Emera Inc. 6.75% 2076 | 400 | 452 |
| Empresa Nacional de Electricidad SA 4.25% 2024 | 150 | 157 |
| Enel Finance International SA 3.50% 20281 | 3,600 | 3,516 |
| Enel Finance International SA 6.00% 20391 | 250 | 304 |
| Enel Società per Azioni 8.75% 20731 | 400 | 495 |
| Entergy Corp. 2.95% 2026 | 1,150 | 1,116 |
| Exelon Corp. 3.497% 2022 | 2,000 | 2,049 |
| FirstEnergy Corp. 3.90% 2027 | 3,350 | 3,424 |
| FirstEnergy Corp. 3.50% 20281 | 2,445 | 2,441 |
| FirstEnergy Corp. 4.85% 2047 | 1,600 | 1,731 |
| FirstEnergy Corp., Series B, 4.25% 2023 | 1,050 | 1,102 |
| Great Plains Energy Inc. 4.20% 2047 | 900 | 933 |
| Iberdrola Finance Ireland 5.00% 20191 | 150 | 157 |
| Indiana Michigan Power Co. 3.75% 2047 | 165 | 163 |
| IPALCO Enterprises, Inc. 3.70% 20241 | 2,200 | 2,193 |
| Mississippi Power Co. 4.25% 2042 | 1,825 | 1,759 |
| New York State Electric & Gas Corp. 3.25% 20261 | 100 | 101 |
| NextEra Energy, Inc. 1.649% 2018 | 500 | 499 |
| Niagara Mohawk Power Corp. 3.508% 20241 | 300 | 310 |
| NiSource Finance Corp. 2.65% 2022 | 100 | 100 |
| Pacific Gas and Electric Co. 3.30% 20271 | 2,500 | 2,489 |
| Pacific Gas and Electric Co. 3.95% 20471 | 500 | 490 |
| Pennsylvania Electric Co. 3.25% 20281 | 500 | 495 |
| Progress Energy, Inc. 7.00% 2031 | 300 | 401 |
| Public Service Enterprise Group Inc. 1.60% 2019 | 515 | 507 |
| Public Service Enterprise Group Inc. 2.00% 2021 | 1,875 | 1,826 |
| Public Service Enterprise Group Inc. 2.65% 2022 | 2,500 | 2,486 |
| Puget Energy, Inc. 6.50% 2020 | 101 | 112 |
American Funds Corporate Bond Fund — Page 2 of 12
unaudited
| Bonds, notes & other debt instruments Corporate bonds & notes (continued) Utilities (continued) | Principal?amount (000) | Value (000) |
| Puget Energy, Inc. 5.625% 2022 | $490 | $544 |
| Puget Energy, Inc. 3.65% 2025 | 275 | 280 |
| SCANA Corp. 6.25% 2020 | 1,775 | 1,887 |
| SCANA Corp. 4.75% 2021 | 1,950 | 2,013 |
| SCANA Corp. 4.125% 2022 | 275 | 279 |
| South Carolina Electric & Gas Co. 5.30% 2033 | 846 | 946 |
| South Carolina Electric & Gas Co. 5.45% 2041 | 300 | 345 |
| South Carolina Electric & Gas Co. 4.10% 2046 | 200 | 197 |
| Teco Finance, Inc. 5.15% 2020 | 810 | 858 |
| Xcel Energy Inc. 3.35% 2026 | 290 | 294 |
| 53,374 | ||
| Financials 11.12% | ||
| ACE INA Holdings Inc. 2.30% 2020 | 200 | 200 |
| ACE INA Holdings Inc. 2.875% 2022 | 15 | 15 |
| ACE INA Holdings Inc. 3.15% 2025 | 250 | 252 |
| ACE INA Holdings Inc. 3.35% 2026 | 100 | 102 |
| ACE INA Holdings Inc. 4.35% 2045 | 20 | 22 |
| American Express Co. 2.20% 2020 | 500 | 497 |
| Banco Santander, SA 3.70% 20221 | 1,450 | 1,475 |
| Bank of America Corp. 2.816% 2023 | 625 | 624 |
| Bank of America Corp. 3.593% 2028 | 675 | 687 |
| Barclays Bank PLC 4.375% 2026 | 1,500 | 1,561 |
| Berkshire Hathaway Inc. 2.20% 2021 | 125 | 125 |
| Berkshire Hathaway Inc. 3.125% 2026 | 150 | 151 |
| BPCE SA group 5.70% 20231 | 200 | 222 |
| BPCE SA group 5.15% 20241 | 620 | 670 |
| CBOE Holdings, Inc. 1.95% 2019 | 850 | 846 |
| Citigroup Inc. 2.70% 2022 | 300 | 298 |
| Citigroup Inc. 3.20% 2026 | 375 | 370 |
| Crédit Agricole SA 4.375% 20251 | 480 | 502 |
| Credit Suisse Group AG 2.997% 20231 | 1,250 | 1,237 |
| Credit Suisse Group AG 3.80% 2023 | 725 | 750 |
| Credit Suisse Group AG 4.55% 2026 | 500 | 536 |
| Danske Bank AS 2.70% 20221 | 200 | 200 |
| Goldman Sachs Group, Inc. 2.905% 2023 | 2,836 | 2,812 |
| Goldman Sachs Group, Inc. 3.077% 20232 | 1,100 | 1,148 |
| Goldman Sachs Group, Inc. 3.75% 2025 | 188 | 193 |
| Goldman Sachs Group, Inc. 3.691% 2028 | 200 | 202 |
| HSBC Holdings PLC 3.033% 2023 | 1,350 | 1,356 |
| HSBC Holdings PLC 4.041% 2028 | 830 | 863 |
| Intesa Sanpaolo SpA 5.017% 20241 | 870 | 891 |
| JPMorgan Chase & Co. 3.54% 2028 | 695 | 703 |
| MetLife Global Funding I 2.00% 20201 | 150 | 149 |
| MetLife Global Funding I 2.50% 20201 | 150 | 151 |
| MetLife Global Funding I 1.95% 20211 | 1,250 | 1,227 |
| MetLife, Inc. 2.05% 20201 | 1,350 | 1,342 |
| Metropolitan Life Global Funding I, 3.45% 20261 | 150 | 154 |
| Mitsubishi UFJ Financial Group, Inc. 2.665% 2022 | 2,000 | 1,985 |
| Morgan Stanley 3.625% 2027 | 402 | 409 |
| Morgan Stanley 3.591% 2028 | 100 | 101 |
| New York Life Global Funding 1.50% 20191 | 60 | 59 |
| New York Life Global Funding 1.95% 20201 | 1,000 | 991 |
| New York Life Global Funding 1.70% 20211 | 900 | 875 |
American Funds Corporate Bond Fund — Page 3 of 12
unaudited
| Bonds, notes & other debt instruments Corporate bonds & notes (continued) Financials (continued) | Principal?amount (000) | Value (000) |
| New York Life Global Funding 2.00% 20211 | $500 | $493 |
| New York Life Global Funding 2.30% 20221 | 2,000 | 1,974 |
| PRICOA Global Funding I 2.45% 20221 | 865 | 859 |
| QBE Insurance Group Ltd. 2.40% 20181 | 250 | 250 |
| Rabobank Nederland 4.375% 2025 | 250 | 264 |
| Royal Bank of Canada 2.125% 2020 | 1,500 | 1,499 |
| Royal Bank of Scotland PLC 3.498% 2023 | 1,975 | 1,979 |
| Sumitomo Mitsui Banking Corp. 2.784% 2022 | 2,000 | 1,993 |
| Toronto-Dominion Bank 1.90% 2019 | 1,025 | 1,021 |
| Travelers Companies, Inc. 3.75% 2046 | 150 | 149 |
| Travelers Companies, Inc. 4.00% 2047 | 105 | 110 |
| UniCredit SPA 4.625% 20271 | 605 | 639 |
| UniCredit SPA 5.861% 20321 | 200 | 214 |
| US Bancorp. 2.05% 2020 | 1,650 | 1,644 |
| US Bancorp. 2.625% 2022 | 750 | 756 |
| Wells Fargo & Co. 2.625% 2022 | 2,000 | 1,986 |
| Wells Fargo & Co. 3.584% 2028 | 2,700 | 2,733 |
| 45,516 | ||
| Consumer staples 11.09% | ||
| Altria Group, Inc. 2.625% 2020 | 175 | 176 |
| Altria Group, Inc. 2.625% 2026 | 20 | 19 |
| Altria Group, Inc. 3.875% 2046 | 2,450 | 2,391 |
| Anheuser-Busch InBev NV 2.65% 2021 | 200 | 202 |
| Anheuser-Busch InBev NV 3.65% 2026 | 2,740 | 2,815 |
| Anheuser-Busch InBev NV 4.90% 2046 | 450 | 509 |
| British American Tobacco PLC 2.764% 20221 | 310 | 308 |
| British American Tobacco PLC 3.222% 20241 | 400 | 399 |
| British American Tobacco PLC 3.557% 20271 | 4,675 | 4,676 |
| British American Tobacco PLC 4.54% 20471 | 3,075 | 3,189 |
| Coca-Cola Co. 2.20% 2022 | 1,250 | 1,242 |
| Colgate-Palmolive Co. 2.25% 2022 | 1,925 | 1,907 |
| Constellation Brands, Inc. 2.25% 2020 | 500 | 497 |
| Constellation Brands, Inc. 2.65% 2022 | 700 | 693 |
| Constellation Brands, Inc. 2.70% 2022 | 20 | 20 |
| Constellation Brands, Inc. 3.50% 2027 | 65 | 65 |
| Constellation Brands, Inc. 4.50% 2047 | 15 | 16 |
| Costco Wholesale Corp. 2.15% 2021 | 150 | 149 |
| Costco Wholesale Corp. 2.30% 2022 | 150 | 149 |
| Costco Wholesale Corp. 2.75% 2024 | 1,550 | 1,550 |
| Costco Wholesale Corp. 3.00% 2027 | 125 | 125 |
| Kraft Foods Inc. 3.50% 2022 | 1,750 | 1,792 |
| Molson Coors Brewing Co. 1.45% 2019 | 100 | 99 |
| Molson Coors Brewing Co. 1.90% 20191 | 30 | 30 |
| Molson Coors Brewing Co. 2.25% 20201 | 325 | 324 |
| Molson Coors Brewing Co. 2.10% 2021 | 200 | 196 |
| Molson Coors Brewing Co. 3.00% 2026 | 125 | 122 |
| Molson Coors Brewing Co. 4.20% 2046 | 585 | 582 |
| Pernod Ricard SA 4.45% 20221 | 400 | 427 |
| Philip Morris International Inc. 2.00% 2020 | 80 | 80 |
| Philip Morris International Inc. 2.375% 2022 | 2,835 | 2,794 |
| Philip Morris International Inc. 2.50% 2022 | 750 | 742 |
| Philip Morris International Inc. 3.125% 2028 | 1,775 | 1,758 |
| Philip Morris International Inc. 3.875% 2042 | 150 | 148 |
American Funds Corporate Bond Fund — Page 4 of 12
unaudited
| Bonds, notes & other debt instruments Corporate bonds & notes (continued) Consumer staples (continued) | Principal?amount (000) | Value (000) |
| Philip Morris International Inc. 4.25% 2044 | $1,600 | $1,661 |
| Procter & Gamble Co. 1.75% 2019 | 3,450 | 3,440 |
| Reckitt Benckiser Group PLC 2.375% 20221 | 1,775 | 1,738 |
| Reckitt Benckiser Group PLC 2.75% 20241 | 225 | 220 |
| Reynolds American Inc. 4.45% 2025 | 225 | 241 |
| Reynolds American Inc. 5.85% 2045 | 225 | 275 |
| Walgreens Boots Alliance, Inc. 3.45% 2026 | 115 | 113 |
| Walgreens Boots Alliance, Inc. 4.65% 2046 | 20 | 21 |
| Wal-Mart Stores, Inc. 1.75% 2019 | 3,975 | 3,964 |
| Wal-Mart Stores, Inc. 2.35% 2022 | 200 | 199 |
| WM. Wrigley Jr. Co 2.90% 20191 | 300 | 303 |
| WM. Wrigley Jr. Co 3.375% 20201 | 2,950 | 3,027 |
| 45,393 | ||
| Energy 10.79% | ||
| Anadarko Petroleum Corp. 4.85% 2021 | 275 | 291 |
| Anadarko Petroleum Corp. 5.55% 2026 | 565 | 629 |
| Anadarko Petroleum Corp. 6.20% 2040 | 150 | 178 |
| Anadarko Petroleum Corp. 6.60% 2046 | 430 | 541 |
| Andeavor Logistics LP 3.50% 2022 | 985 | 985 |
| Andeavor Logistics LP 4.25% 2027 | 335 | 335 |
| Andeavor Logistics LP 5.20% 2047 | 50 | 50 |
| Canadian Natural Resources Ltd. 2.95% 2023 | 245 | 244 |
| Canadian Natural Resources Ltd. 3.85% 2027 | 1,330 | 1,349 |
| Canadian Natural Resources Ltd. 4.95% 2047 | 945 | 1,017 |
| Cenovus Energy Inc. 3.00% 2022 | 260 | 257 |
| Cenovus Energy Inc. 4.25% 20271 | 3,155 | 3,127 |
| Cenovus Energy Inc. 5.25% 20371 | 107 | 109 |
| Cenovus Energy Inc. 5.40% 20471 | 1,074 | 1,098 |
| Chevron Corp. 1.561% 2019 | 370 | 368 |
| Chevron Corp. 2.10% 2021 | 1,225 | 1,214 |
| Chevron Corp. 2.498% 2022 | 2,990 | 3,001 |
| ConocoPhillips 4.20% 2021 | 91 | 96 |
| Devon Energy Corp. 5.85% 2025 | 750 | 871 |
| Devon Energy Corp. 5.00% 2045 | 255 | 277 |
| Ecopetrol SA 5.875% 2023 | 30 | 34 |
| Enbridge Energy Partners, LP 4.375% 2020 | 60 | 63 |
| Enbridge Energy Partners, LP 5.875% 2025 | 85 | 96 |
| Enbridge Energy Partners, LP 7.375% 2045 | 1,190 | 1,558 |
| Enbridge Inc. 2.90% 2022 | 902 | 898 |
| Enbridge Inc. 4.00% 2023 | 150 | 156 |
| Enbridge Inc. 4.25% 2026 | 105 | 110 |
| Enbridge Inc. 3.70% 2027 | 1,589 | 1,587 |
| Energy Transfer Partners, LP 4.75% 2026 | 75 | 78 |
| Energy Transfer Partners, LP 4.00% 2027 | 72 | 71 |
| Energy Transfer Partners, LP 4.20% 2027 | 870 | 870 |
| Energy Transfer Partners, LP 6.125% 2045 | 215 | 232 |
| Energy Transfer Partners, LP 5.30% 2047 | 2,265 | 2,214 |
| Energy Transfer Partners, LP 5.40% 2047 | 1,326 | 1,325 |
| EnLink Midstream Partners, LP 2.70% 2019 | 60 | 60 |
| EnLink Midstream Partners, LP 4.85% 2026 | 270 | 282 |
| EnLink Midstream Partners, LP 5.45% 2047 | 285 | 294 |
| EQT Corp. 3.00% 2022 | 980 | 971 |
| EQT Corp. 3.90% 2027 | 685 | 673 |
American Funds Corporate Bond Fund — Page 5 of 12
unaudited
| Bonds, notes & other debt instruments Corporate bonds & notes (continued) Energy (continued) | Principal?amount (000) | Value (000) |
| Exxon Mobil Corp. 2.222% 2021 | $2,000 | $2,002 |
| Halliburton Co. 3.80% 2025 | 705 | 727 |
| Halliburton Co. 5.00% 2045 | 760 | 834 |
| Kinder Morgan Finance Co. 5.05% 2046 | 1,675 | 1,695 |
| Kinder Morgan, Inc. 3.15% 2023 | 535 | 532 |
| Kinder Morgan, Inc. 4.30% 2025 | 315 | 325 |
| Kinder Morgan, Inc. 5.55% 2045 | 750 | 802 |
| Marathon Oil Corp. 4.40% 2027 | 500 | 514 |
| MPLX LP 4.125% 2027 | 155 | 158 |
| MPLX LP 5.20% 2047 | 110 | 117 |
| Noble Energy, Inc. 4.95% 2047 | 325 | 338 |
| Petróleos Mexicanos 6.875% 2026 | 315 | 360 |
| Petróleos Mexicanos 6.50% 20271 | 270 | 298 |
| Petróleos Mexicanos 5.625% 2046 | 25 | 23 |
| Petróleos Mexicanos 6.75% 20471 | 1,600 | 1,696 |
| Petróleos Mexicanos 6.75% 2047 | 625 | 663 |
| Phillips 66 Partners LP 3.55% 2026 | 185 | 182 |
| Phillips 66 Partners LP 3.75% 2028 | 345 | 343 |
| Phillips 66 Partners LP 4.90% 2046 | 10 | 10 |
| Royal Dutch Shell PLC 1.75% 2021 | 50 | 49 |
| Royal Dutch Shell PLC 3.75% 2046 | 45 | 44 |
| Sabine Pass Liquefaction, LLC 5.625% 2021 | 380 | 409 |
| Sabine Pass Liquefaction, LLC 5.625% 2025 | 607 | 669 |
| Sabine Pass Liquefaction, LLC 5.00% 2027 | 430 | 458 |
| Sabine Pass Liquefaction, LLC 4.20% 2028 | 100 | 101 |
| Schlumberger BV 3.625% 20221 | 1,625 | 1,677 |
| Schlumberger BV 4.00% 20251 | 205 | 214 |
| Valero Energy Partners LP 4.375% 2026 | 120 | 125 |
| Western Gas Partners LP 4.65% 2026 | 585 | 608 |
| Williams Partners LP 4.50% 2023 | 50 | 53 |
| Williams Partners LP 4.00% 2025 | 149 | 152 |
| Williams Partners LP 3.75% 2027 | 409 | 407 |
| 44,194 | ||
| Consumer discretionary 9.86% | ||
| Amazon.com, Inc. 2.80% 20241 | 100 | 100 |
| Amazon.com, Inc. 3.15% 20271 | 3,850 | 3,859 |
| Amazon.com, Inc. 3.875% 20371 | 347 | 363 |
| Amazon.com, Inc. 4.05% 20471 | 2,365 | 2,472 |
| American Honda Finance Corp. 1.65% 2021 | 200 | 195 |
| American Honda Finance Corp. 2.60% 2022 | 100 | 100 |
| Bayerische Motoren Werke AG 2.15% 20201 | 100 | 100 |
| Bayerische Motoren Werke AG 1.85% 20211 | 850 | 830 |
| Bayerische Motoren Werke AG 2.00% 20211 | 400 | 394 |
| CCO Holdings LLC and CCO Holdings Capital Corp. 3.579% 2020 | 200 | 203 |
| CCO Holdings LLC and CCO Holdings Capital Corp. 4.908% 2025 | 200 | 212 |
| CCO Holdings LLC and CCO Holdings Capital Corp. 3.75% 2028 | 200 | 190 |
| CCO Holdings LLC and CCO Holdings Capital Corp. 4.20% 2028 | 1,890 | 1,862 |
| CCO Holdings LLC and CCO Holdings Capital Corp. 5.375% 2047 | 805 | 816 |
| Comcast Corp. 3.30% 2027 | 250 | 252 |
| Comcast Corp. 3.15% 2028 | 2,500 | 2,473 |
| Comcast Corp. 4.75% 2044 | 300 | 333 |
| Comcast Corp. 4.00% 2047 | 490 | 492 |
| Daimler Finance North America Holding Corp. 2.70% 20201 | 1,250 | 1,260 |
American Funds Corporate Bond Fund — Page 6 of 12
unaudited
| Bonds, notes & other debt instruments Corporate bonds & notes (continued) Consumer discretionary (continued) | Principal?amount (000) | Value (000) |
| DaimlerChrysler North America Holding Corp. 2.25% 20201 | $425 | $424 |
| DaimlerChrysler North America Holding Corp. 2.20% 20211 | 725 | 713 |
| DaimlerChrysler North America Holding Corp. 2.30% 20211 | 400 | 397 |
| DaimlerChrysler North America Holding Corp. 3.50% 20251 | 300 | 308 |
| Discovery Communications, Inc. 3.95% 2028 | 750 | 735 |
| Ford Motor Co. 4.346% 2026 | 1,150 | 1,199 |
| Ford Motor Credit Co. 4.134% 2025 | 200 | 206 |
| Ford Motor Credit Co. 3.815% 2027 | 200 | 200 |
| Ford Motor Credit Co. 5.291% 2046 | 2,900 | 3,095 |
| General Motors Co. 6.75% 2046 | 305 | 378 |
| General Motors Co. 5.40% 2048 | 1,450 | 1,550 |
| General Motors Financial Co. 3.50% 2024 | 1,490 | 1,489 |
| General Motors Financial Co. 4.00% 2025 | 775 | 791 |
| General Motors Financial Co. 6.60% 2036 | 45 | 54 |
| Home Depot, Inc. 2.80% 2027 | 500 | 490 |
| Home Depot, Inc. 3.90% 2047 | 50 | 51 |
| Hyundai Capital America 2.55% 20201 | 1,235 | 1,226 |
| Hyundai Capital America 3.25% 20221 | 1,625 | 1,626 |
| McDonald’s Corp. 2.625% 2022 | 75 | 75 |
| McDonald’s Corp. 3.70% 2026 | 25 | 26 |
| McDonald’s Corp. 3.50% 2027 | 75 | 77 |
| McDonald’s Corp. 4.875% 2045 | 1,050 | 1,193 |
| McDonald’s Corp. 4.45% 2047 | 850 | 910 |
| NBC Universal Enterprise, Inc. 5.25% 20491 | 475 | 507 |
| Newell Rubbermaid Inc. 2.60% 2019 | 10 | 10 |
| Newell Rubbermaid Inc. 3.15% 2021 | 380 | 385 |
| Newell Rubbermaid Inc. 3.85% 2023 | 835 | 867 |
| Newell Rubbermaid Inc. 4.20% 2026 | 275 | 288 |
| Newell Rubbermaid Inc. 5.50% 2046 | 1,310 | 1,555 |
| Nissan Motor Co., Ltd. 2.60% 20221 | 2,125 | 2,105 |
| Starbucks Corp. 2.20% 2020 | 165 | 165 |
| Starbucks Corp. 4.30% 2045 | 125 | 136 |
| Starbucks Corp. 3.75% 2047 | 100 | 100 |
| Toyota Motor Credit Corp. 2.15% 2022 | 200 | 197 |
| Toyota Motor Credit Corp. 3.20% 2027 | 340 | 346 |
| 40,380 | ||
| Information technology 5.09% | ||
| Analog Devices, Inc. 2.50% 2021 | 25 | 25 |
| Analog Devices, Inc. 3.125% 2023 | 40 | 40 |
| Analog Devices, Inc. 3.50% 2026 | 35 | 35 |
| Apple Inc. 2.00% 2020 | 2,075 | 2,065 |
| Apple Inc. 2.30% 2022 | 250 | 249 |
| Apple Inc. 2.90% 2027 | 675 | 667 |
| Apple Inc. 3.20% 2027 | 800 | 810 |
| Apple Inc. 3.35% 2027 | 370 | 379 |
| Apple Inc. 3.75% 2047 | 350 | 348 |
| Apple Inc. 3.75% 2047 | 75 | 75 |
| Apple Inc. 4.25% 2047 | 400 | 428 |
| Broadcom Ltd. 3.00% 20221 | 1,025 | 1,014 |
| Broadcom Ltd. 3.625% 20241 | 575 | 570 |
| Broadcom Ltd. 3.875% 20271 | 1,070 | 1,052 |
| Broadcom Ltd. 3.50% 20281 | 250 | 238 |
| Microsoft Corp. 1.55% 2021 | 350 | 341 |
American Funds Corporate Bond Fund — Page 7 of 12
unaudited
| Bonds, notes & other debt instruments Corporate bonds & notes (continued) Information technology (continued) | Principal?amount (000) | Value (000) |
| Microsoft Corp. 2.40% 2022 | $550 | $552 |
| Microsoft Corp. 2.875% 2024 | 135 | 137 |
| Microsoft Corp. 2.40% 2026 | 50 | 48 |
| Microsoft Corp. 3.30% 2027 | 455 | 469 |
| Microsoft Corp. 3.70% 2046 | 600 | 613 |
| Microsoft Corp. 4.25% 2047 | 575 | 641 |
| Oracle Corp. 1.90% 2021 | 2,575 | 2,537 |
| Oracle Corp. 2.625% 2023 | 1,125 | 1,127 |
| Oracle Corp. 2.65% 2026 | 400 | 388 |
| Oracle Corp. 3.25% 2027 | 2,035 | 2,063 |
| Oracle Corp. 4.00% 2046 | 400 | 414 |
| Oracle Corp. 4.00% 2047 | 325 | 336 |
| Visa Inc. 2.15% 2022 | 1,320 | 1,302 |
| Visa Inc. 2.75% 2027 | 1,930 | 1,895 |
| 20,858 | ||
| Real estate 4.65% | ||
| Alexandria Real Estate Equities, Inc. 3.95% 2028 | 35 | 36 |
| American Campus Communities, Inc. 3.35% 2020 | 110 | 112 |
| American Campus Communities, Inc. 3.75% 2023 | 1,350 | 1,390 |
| American Campus Communities, Inc. 4.125% 2024 | 200 | 209 |
| American Campus Communities, Inc. 3.625% 2027 | 1,890 | 1,878 |
| DCT Industrial Trust Inc. 4.50% 2023 | 60 | 63 |
| Developers Diversified Realty Corp. 3.90% 2024 | 1,265 | 1,262 |
| EPR Properties 4.75% 2026 | 275 | 284 |
| Essex Portfolio L.P. 3.625% 2022 | 200 | 206 |
| Essex Portfolio L.P. 3.50% 2025 | 70 | 71 |
| Essex Portfolio L.P. 3.375% 2026 | 200 | 198 |
| Hospitality Properties Trust 3.95% 2028 | 125 | 122 |
| Host Hotels & Resorts LP 4.50% 2026 | 40 | 42 |
| Kimco Realty Corp. 3.40% 2022 | 1,850 | 1,890 |
| Kimco Realty Corp. 3.30% 2025 | 1,000 | 991 |
| Prologis, Inc. 3.35% 2021 | 41 | 42 |
| Public Storage 3.094% 2027 | 100 | 99 |
| Scentre Group 2.375% 20211 | 130 | 129 |
| Scentre Group 3.50% 20251 | 450 | 451 |
| Scentre Group 3.75% 20271 | 2,150 | 2,181 |
| Simon Property Group, LP 2.35% 2022 | 925 | 918 |
| Simon Property Group, LP 3.375% 2027 | 1,250 | 1,240 |
| UDR, Inc. 3.50% 2028 | 475 | 473 |
| WEA Finance LLC 2.70% 20191 | 1,000 | 1,005 |
| WEA Finance LLC 3.25% 20201 | 390 | 395 |
| Westfield Corp. Ltd. 3.15% 20221 | 3,335 | 3,353 |
| 19,040 | ||
| Telecommunication services 3.03% | ||
| AT&T Inc. 3.90% 2027 | 650 | 647 |
| AT&T Inc. 4.90% 2037 | 140 | 140 |
| AT&T Inc. 5.25% 2037 | 200 | 209 |
| AT&T Inc. 4.35% 2045 | 1,663 | 1,508 |
| AT&T Inc. 4.50% 2048 | 686 | 630 |
| AT&T Inc. 5.15% 2050 | 2,491 | 2,476 |
| Deutsche Telekom International Finance BV 1.95% 20211 | 250 | 243 |
| Deutsche Telekom International Finance BV 2.82% 20221 | 1,750 | 1,754 |
American Funds Corporate Bond Fund — Page 8 of 12
unaudited
| Bonds, notes & other debt instruments Corporate bonds & notes (continued) Telecommunication services (continued) | Principal?amount (000) | Value (000) |
| Deutsche Telekom International Finance BV 2.485% 20231 | $925 | $897 |
| Deutsche Telekom International Finance BV 3.60% 20271 | 350 | 352 |
| France Télécom 9.00% 2031 | 385 | 576 |
| Verizon Communications Inc. 4.50% 2033 | 1,025 | 1,064 |
| Verizon Communications Inc. 4.125% 2046 | 1,350 | 1,230 |
| Verizon Communications Inc. 4.862% 2046 | 298 | 305 |
| Verizon Communications Inc. 4.522% 2048 | 400 | 388 |
| 12,419 | ||
| Industrials 2.64% | ||
| 3M Co. 2.25% 2023 | 1,486 | 1,471 |
| 3M Co. 2.25% 2026 | 80 | 76 |
| Burlington Northern Santa Fe LLC 3.45% 2021 | 70 | 73 |
| Canadian National Railway Co. 3.20% 2046 | 35 | 33 |
| Continental Airlines, Inc., Series 1997-4, Class A, 6.90% 20193 | 8 | 8 |
| Continental Airlines, Inc., Series 2000-2, Class A1, 7.707% 20223 | 40 | 45 |
| ERAC USA Finance Co. 2.70% 20231 | 1,675 | 1,630 |
| Lockheed Martin Corp. 1.85% 2018 | 15 | 15 |
| Lockheed Martin Corp. 2.50% 2020 | 83 | 84 |
| Lockheed Martin Corp. 3.10% 2023 | 135 | 137 |
| Lockheed Martin Corp. 3.55% 2026 | 290 | 301 |
| Lockheed Martin Corp. 4.50% 2036 | 10 | 11 |
| Lockheed Martin Corp. 4.70% 2046 | 150 | 171 |
| Northrop Grumman Corp., 2.55% 2022 | 2,415 | 2,400 |
| Northrop Grumman Corp., 3.25% 2028 | 400 | 401 |
| Northrop Grumman Corp., 4.03% 2047 | 190 | 194 |
| Rockwell Collins, Inc. 2.80% 2022 | 390 | 392 |
| Roper Technologies, Inc. 2.80% 2021 | 25 | 25 |
| Roper Technologies, Inc. 3.80% 2026 | 50 | 51 |
| Siemens AG 2.70% 20221 | 975 | 982 |
| Siemens AG 2.00% 20231 | 500 | 480 |
| Siemens AG 3.125% 20241 | 1,100 | 1,119 |
| United Technologies Corp. 2.30% 2022 | 320 | 316 |
| United Technologies Corp. 3.125% 2027 | 275 | 275 |
| United Technologies Corp. 4.15% 2045 | 100 | 104 |
| 10,794 | ||
| Materials 1.32% | ||
| Anglo American Capital PLC 3.625% 20241 | 1,800 | 1,789 |
| Anglo American Capital PLC 4.00% 20271 | 300 | 295 |
| Dow Chemical Co. 4.125% 2021 | 100 | 105 |
| Dow Chemical Co. 4.625% 2044 | 100 | 107 |
| LYB International Finance BV 3.50% 2027 | 25 | 25 |
| LYB International Finance BV 4.875% 2044 | 100 | 110 |
| LyondellBasell Industries NV 6.00% 2021 | 200 | 222 |
| Mosaic Co. 4.05% 2027 | 200 | 199 |
| Praxair, Inc. 3.00% 2021 | 100 | 102 |
| Rio Tinto Finance PLC 3.75% 2025 | 70 | 74 |
| Rio Tinto PLC 4.125% 2042 | 80 | 84 |
| Sherwin-Williams Co. 2.75% 2022 | 350 | 348 |
| Sherwin-Williams Co. 3.45% 2027 | 450 | 455 |
| Sherwin-Williams Co. 4.50% 2047 | 745 | 787 |
| Vale SA 5.875% 2021 | 360 | 396 |
American Funds Corporate Bond Fund — Page 9 of 12
unaudited
| Bonds, notes & other debt instruments Corporate bonds & notes (continued) Materials (continued) | Principal?amount (000) | Value (000) |
| Vale SA 6.25% 2026 | $60 | $70 |
| Westlake Chemical Corp. 4.375% 2047 | 235 | 236 |
| 5,404 | ||
| Municipals 0.06% | ||
| National Grid Plc 3.15% 20271 | 265 | 263 |
| Total corporate bonds & notes | 351,981 | |
| U.S. Treasury bonds & notes 3.80% U.S. Treasury 2.88% | ||
| U.S. Treasury 1.125% 2019 | 135 | 134 |
| U.S. Treasury 1.50% 2019 | 451 | 449 |
| U.S. Treasury 1.875% 2022 | 600 | 593 |
| U.S. Treasury 2.00% 2022 | 4,595 | 4,567 |
| U.S. Treasury 2.25% 2027 | 3,111 | 3,067 |
| U.S. Treasury 2.75% 2047 | 2,999 | 2,946 |
| U.S. Treasury 3.00% 2047 | 50 | 51 |
| 11,807 | ||
| U.S. Treasury inflation-protected securities 0.92% | ||
| U.S. Treasury Inflation-Protected Security 0.625% 20264,5 | 1,584 | 1,596 |
| U.S. Treasury Inflation-Protected Security 0.375% 20275 | 1,175 | 1,154 |
| U.S. Treasury Inflation-Protected Security 0.375% 20275 | 1,009 | 993 |
| 3,743 | ||
| Total U.S. Treasury bonds & notes | 15,550 | |
| Bonds & notes of governments & government agencies outside the U.S. 1.93% | ||
| Portuguese Republic 5.125% 2024 | 1,500 | 1,602 |
| Saudi Arabia (Kingdom of) 2.894% 20221 | 1,500 | 1,498 |
| Saudi Arabia (Kingdom of) 3.625% 20281 | 3,725 | 3,703 |
| United Mexican States 4.60% 2048 | 1,075 | 1,080 |
| 7,883 | ||
| Municipals 0.86% Illinois 0.76% | ||
| State of Illinois, G.O. Bonds, Pension Funding Series 2003, 5.10% 20333 | 3,150 | 3,136 |
| South Carolina 0.10% | ||
| Public Service Auth., Rev. Obligations (Santee Cooper), Series 2015-E, 5.25% 2055 | 350 | 396 |
| 3,532 | ||
| Asset-backed obligations 0.02% | ||
| Verizon Owner Trust, Series 2016-1A, Class A, 1.42% 20211,3 | 100 | 100 |
| Total bonds, notes & other debt instruments (cost: $377,110,000) | 379,046 | |
| Short-term securities 6.74% | ||
| CAFCO, LLC 1.30% due 12/5/20171 | 5,000 | 4,999 |
| General Electric Co. 1.10% due 12/1/2017 | 8,300 | 8,300 |
| IBM Credit Corp. 1.14% due 12/6/20171 | 2,100 | 2,100 |
| National Rural Utilities Cooperative Finance Corp. 1.16% due 12/11/2017 | 2,100 | 2,099 |
American Funds Corporate Bond Fund — Page 10 of 12
unaudited
| Short-term securities | Principal?amount (000) | Value (000) |
| NIKE, Inc. 1.15% due 12/8/20171 | $6,400 | $6,398 |
| Paccar Financial Corp. 1.13% due 12/11/2017 | 3,700 | 3,699 |
| Total short-term securities (cost: $27,596,000) | 27,595 | |
| Total investment securities 99.31% (cost: $404,706,000) | 406,641 | |
| Other assets less liabilities 0.69% | 2,813 | |
| Net assets 100.00% | $409,454 |
Swap contracts
Interest rate swaps
| Receive | Pay | Expiration date | Notional (000) | Value at 11/30/2017 (000) | Upfront payments/ receipts (000) | Unrealized (depreciation) appreciation at 11/30/2017 (000) |
| 3-month USD-LIBOR | 2.7945% | 4/10/2024 | $1,500 | $(47) | $— | $(48) |
| 3-month USD-LIBOR | 2.51% | 11/10/2047 | 1,900 | 40 | — | 40 |
| $— | $(8) |
Credit default swaps
Centrally cleared credit default swaps on credit indices — sell protection
| Receive/ Payment frequency | Pay | Expiration date | Notional (000) | Value at 11/30/2017 (000) | Upfront receipts (000) | Unrealized appreciation at 11/30/2017 (000) |
| 1.00%/Quarterly | CDX.NA.IG.28 | 6/20/2022 | $7,500 | $161 | $113 | $48 |
| 1 | Acquired in a transaction exempt from registration under Rule 144A or Section 4(2) of the Securities Act of 1933. May be resold in the U.S. in transactions exempt from registration, normally to qualified institutional buyers. The total value of all such securities was $116,198,000, which represented 28.38% of the net assets of the fund. |
| 2 | Coupon rate may change periodically. |
| 3 | Principal payments may be made periodically. Therefore, the effective maturity date may be earlier than the stated maturity date. |
| 4 | A portion of this security was pledged as collateral. The total value of pledged collateral was $448,000, which represented .11% of the net assets of the fund. |
| 5 | Index-linked bond whose principal amount moves with a government price index. |
| Key to abbreviations and symbol |
| Auth. = Authority |
| G.O. = General Obligation |
| LIBOR = London Interbank Offered Rate |
| Rev. = Revenue |
| USD/$ = U.S. dollars |
American Funds Corporate Bond Fund — Page 11 of 12
unaudited
Additional financial disclosures are included in the fund’s current shareholder report and should be read in conjunction with this report.
Investments are not FDIC-insured, nor are they deposits of or guaranteed by a bank or any other entity, so they may lose value.
Investors should carefully consider investment objectives, risks, charges and expenses. This and other important information is contained in the fund prospectus and summary prospectus, which can be obtained from your financial professional and should be read carefully before investing. You may also call American Funds Service Company (AFS) at (800) 421-4225 or visit the American Funds website at americanfunds.com. Fund shares offered through American Funds Distributors, Inc.
| MFGEFPX-032-0118O-S60591 | American Funds Corporate Bond Fund — Page 12 of 12 |
ITEM 7 – Disclosure of Proxy Voting Policies and Procedures for Closed-End Management Investment Companies
Not applicable to this Registrant, insofar as the Registrant is not a closed-end management investment company.
ITEM 8 – Portfolio Managers of Closed-End Management Investment Companies
Not applicable to this Registrant, insofar as the Registrant is not a closed-end management investment company.
ITEM 9 – Purchases of Equity Securities by Closed-End Management Investment Company and Affiliated Purchasers
Not applicable to this Registrant, insofar as the Registrant is not a closed-end management investment company.
ITEM 10 – Submission of Matters to a Vote of Security Holders
There have been no material changes to the procedures by which shareholders may recommend nominees to the Registrant’s board of trustees since the Registrant last submitted a proxy statement to its shareholders. The procedures are as follows. The Registrant has a nominating and governance committee comprised solely of persons who are not considered ‘‘interested persons’’ of the Registrant within the meaning of the
Investment Company Act of 1940, as amended. The committee periodically reviews such issues as the board’s composition, responsibilities, committees, compensation and other relevant issues, and recommends any appropriate changes to the full board of trustees. While the committee normally is able to identify from its own resources an ample number of qualified candidates, it will consider shareholder suggestions of persons to be considered as nominees to fill future vacancies on the board. Such suggestions must be sent in writing to the nominating and governance committee of the Registrant, c/o the Registrant’s Secretary, and must be accompanied by complete biographical and occupational data on the prospective nominee, along with a written consent of the prospective nominee for consideration of his or her name by the nominating and governance committee.
ITEM 11 – Controls and Procedures
| (a) | The Registrant’s Principal Executive Officer and Principal Financial Officer have concluded, based on their evaluation of the Registrant’s disclosure controls and procedures (as such term is defined in Rule 30a-3 under the Investment Company Act of 1940), that such controls and procedures are adequate and reasonably designed to achieve the purposes described in paragraph (c) of such rule. |
| (b) | There were no changes in the Registrant’s internal controls over financial reporting (as defined in Rule 30a-3(d) under the Investment Company Act of 1940) that occurred during the Registrant’s second fiscal quarter of the period covered by this report that has materially affected, or is reasonably likely to materially affect, the Registrant’s internal control over financial reporting. |
ITEM 12 – Exhibits
| (a)(1) | Not applicable for filing of semi-annual reports to shareholders. |
| (a)(2) | The certifications required by Rule 30a-2 of the Investment Company Act of 1940 and Sections 302 and 906 of the Sarbanes-Oxley Act of 2002 are attached as exhibits hereto. |
SIGNATURES
Pursuant to the requirements of the Securities Exchange Act of 1934 and the Investment Company Act of 1940, the Registrant has duly caused this report to be signed on its behalf by the undersigned, thereunto duly authorized.
| AMERICAN FUNDS CORPORATE BOND FUND | |
| By /s/ David S. Lee | |
David S. Lee, President and Principal Executive Officer | |
| Date: January 31, 2017 |
Pursuant to the requirements of the Securities Exchange Act of 1934 and the Investment Company Act of 1940, this report has been signed below by the following persons on behalf of the Registrant and in the capacities and on the dates indicated.
| By /s/ David S. Lee |
David S. Lee, President and Principal Executive Officer |
| Date: January 31, 2017 |
| By /s/ Brian C. Janssen |
Brian C. Janssen, Treasurer and Principal Financial Officer |
| Date: January 31, 2017 |