united states
securities and exchange commission
washington, d.c. 20549
form n-csr
certified shareholder report of registered management
investment companies
Investment Company Act file number 811-22756
Advisors Preferred Trust
(Exact name of registrant as specified in charter)
1445 Research Blvd, Suite 530, Rockville, MD 20850
(Address of principal executive offices) (Zip code)
The Corporation Trust Company
1209 Orange Street Wilmington, DE 19801
(Name and address of agent for service)
Registrant's telephone number, including area code: 631-470-2734
Date of fiscal year end: 12/31
Date of reporting period: 12/31/21
Item 1. Reports to Stockholders.
 |
| Annual Report |
| December 31, 2021 |
| Kensington Managed Income Fund |
| Class A Shares (KAMAX) Class C Shares (KAMCX) Institutional Class Shares (KAMIX) |
| Kensington Dynamic Growth Fund |
| Class A Shares (KAGAX) Class C Shares (KAGCX) Institutional Class Shares (KAGIX) |
| 1-855-375-3060 |
| www.kensingtonanalytics.com |
| Distributed by Ceros Financial Services, Inc. |
February 14, 2022
Dear Shareholders,
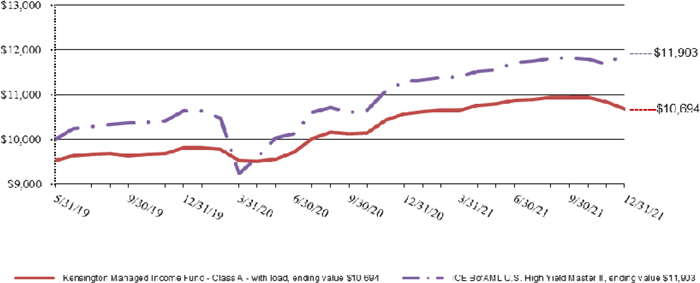
This annual report for the Kensington Funds focuses on the period from January 1, 2021 to December 31, 2021. Kensington Asset Management, LLC serves as sub-advisor to the Funds. The Kensington Managed Income Fund seeks income. During the period, the Institutional Class Shares of the Fund increased by 1.29%; the load waived Class A Shares of the Fund increased by 1.05%; the Class A (with load) Shares declined by 3.77%, and the Class C Shares increased by 0.35%. The Bloomberg U.S. Aggregate Bond Index declined by 1.54% for the period, and the ICE BofAML High Yield Master II Index increased by 5.36% for the period.
The sub-advisor uses its “Managed Income” quantitative model to determine overall buy/sell decisions for the Fund. This investment process seeks to recognize and select opportunities to allocate into potentially higher yielding fixed-income securities when the signal is “Risk On” and allocate to U.S. Treasuries, U.S. government securities and cash equivalents when the signal is “Risk Off.”
Increasing inflation and the reopening of the economy sparked a rise in rates during the first quarter of 2021, which placed downward pressure on the price of higher quality debt. The Managed Income model was strongly “Risk On” during the period, and the sub-advisor responded to the rising rate environment by reducing credit quality of the portfolio, thereby increasing exposure to higher yielding debt, and reducing exposure to multisector bond holdings. Lower quality debt is less sensitive to rising rates when the economy is expanding. During the second and third quarters, the sub-advisor remained in a “Risk On” stance.
The ICE BofAML High Yield Master II Index peaked in November 2021, with the U.S. High Yield asset class deteriorating from that point. In response to weakening market conditions, the Managed Income model moved to a “Risk Off” stance in late November. In response, the Fund shifted into cash and cash equivalents, subsequently allocating a portion of the Fund’s assets to U.S. Treasuries in early December. Later in the month, the Fund reduced its exposure to U.S. Treasuries in response to declining values driven by rising interest rates.
The sub-advisor’s outlook is cautious in the short term. Increased market volatility, along with further deterioration in U.S. high yield fixed income, continue to be observed. The sub-advisor will continue to monitor overall market conditions and stands ready to reposition the portfolio should conditions improve. However, principal protection remains the sub-advisor’s primary objective currently.
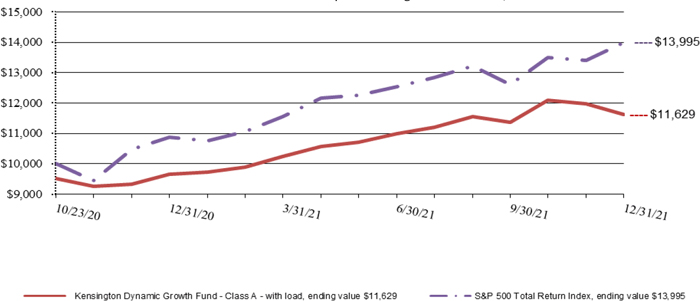
The Kensington Dynamic Growth Fund seeks capital gains. The sub-advisor’s strategy is principally driven by a proprietary “Dynamic Growth” model designed to tactically alternate between a “Risk On” state in response to advancing equity markets and a “Risk Off” state during times of market weakness. During the period, the Institutional Class Shares of the Fund increased by 20.76%; the load waived Class A Shares of the Fund increased by 20.48%; the Class A (with load) Shares had a return of 14.80%, and the Class C Shares increased by 19.57%. The S&P 500 Total Return Index increased by 28.71% for the period.
To begin the year, the Fund was positioned predominately in large cap growth equity ETFs, as the growth sector remained strong during the “reopening trade” of the first quarter. In March 2021, the Dynamic Growth model was in a “Risk Off” stance for two weeks out of the month, as volatility increased. The Fund re-entered a “Risk On” position in April. The sub-advisor remained in a “Risk On” stance in equities until May 2021, when the model signal reverted to “Risk Off.” Subsequently
1
in late May, the Fund re-entered a “Risk On” trade, allocating back predominately to large cap growth equity ETFs. The Fund has maintained this allocation through the end of the second quarter.
In the third quarter, the Dynamic Growth model briefly shifted to “Risk Off” as volatility increased in late September, before resuming a “Risk On” posture in early October. The Fund made one final movement to “Risk Off” in early December due to increased market volatility.
The sub-advisor’s outlook remains very cautious for the equity markets going forward, as market volatility and the risk of decline remain elevated. However, the sub-advisor remains vigilant, and stands ready to reposition the Fund into a “Risk On” stance should the Dynamic Growth model dictate such a move. However, principal protection remains the sub-advisor’s primary objective currently.
Thank you for your confidence in our investment management. If you would like further information on the Kensington Funds, please visit kensingtonassetmanagement.com.
| Kensington Asset Management | Advisors Preferred, LLC |
| Sub-advisor to the Funds | Advisor to the Funds |
2
| Kensington Managed Income Fund |
| Portfolio Review (Unaudited) |
| December 31, 2021 |
The Fund’s performance figures* for the period ended December 31, 2021, as compared to its benchmarks:
| Annualized | |||
| One | Since Inception | Since Inception | |
| Year | May 31, 2019 | August 27, 2019 | |
| Kensington Managed Income Fund - Class A | 1.05% | 4.58% | — |
| Kensington Managed Income Fund - Class A with load | (3.77)% | 2.63% | — |
| Kensington Managed Income Fund - Class C | 0.35% | — | 3.54% |
| Kensington Managed Income Fund - Institutional Class | 1.29% | 4.85% | — |
| ICE BofAML U.S. High Yield Master II ** | 5.36% | 6.97% | 6.35% |
| Bloomberg U.S. Aggregate Bond Index *** | (1.54)% | 3.68% | 2.31% |
| * | The Performance data quoted is historical. Past performance is no guarantee of future results. Current performance may be higher or lower than the performance data quoted. The principal value and investment return of an investment will fluctuate so that your shares, when redeemed, may be worth more or less than their original cost. The returns shown do not reflect the deduction of taxes that a shareholder would pay on Fund distributions or on the redemptions of Fund shares. Returns greater than one year are annualized. The total gross operating expenses including underlying funds as stated in the fee table of the Fund’s prospectus dated May 1, 2021 is 2.30% for Class A, 3.08% for Class C and 2.12% for Institutional Class. Class A shares are subject to a maximum sales charge (load) of 4.75%. Class C shares are subject to a 1% deferred sales charge if redeemed prior to 12 months, under certain conditions. Investors should consider the investment objectives, risks, and charges and expenses of the Fund carefully before investing. The Fund’s prospectus and summary prospectus contain these as well as other information about the Fund and should be read carefully before investing. A prospectus or summary prospectus and current performance may be obtained by calling 1-855-375-3060. |
| ** | ICE BofAML US High Yield Master II Index measures the performance of below investment grade $US-denominated corporate bonds publicly issued in the US market. The index is unmanaged; includes net reinvested dividends; does not reflect fees or expenses; and is not available for direct investment. Investors cannot invest directly in an index. |
| *** | The Bloomberg U.S. Aggregate Bond Index is an unmanaged index comprised of U.S. investment grade, fixed rate bond market securities, including government, government agency, corporate and mortgage-backed securities. Investors cannot invest directly in an index. It is also known as Barclays U.S. Aggregate Bond Index. |
| Portfolio Composition | % of Net Assets | |||
| Exchange Traded Funds - Fixed Income | 34.2 | % | ||
| Money Market Fund | 50.1 | % | ||
| Other Assets in Excess of Liabilities | 15.7 | % | ||
| 100.0 | % | |||
Please refer to the Schedule of Investments and the Shareholder Letter in this report for a detailed listing of the Fund’s holdings.
Comparison of the Change in Value of a $10,000 Investment
Since Inception through December 31, 2021 +
3
| Kensington Managed Income Fund |
| Portfolio Review (Unaudited)(Continued) |
| December 31, 2021 |
Comparison of the Change in Value of a $25,000 Investment
Since Inception through December 31, 2021 +
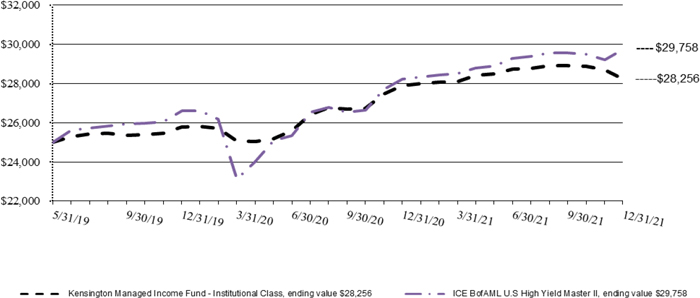
| + | Inception date is May 31, 2019, for Class A and Institutional Class. |
4
| Kensington Dynamic Growth Fund |
| Portfolio Review (Unaudited) |
| December 31, 2021 |
The Fund’s performance figures* for the period ended December 31, 2021, as compared to its benchmarks:
| One | Since Inception | |
| Year | October 23, 2020 | |
| Kensington Dynamic Growth Fund - Class A | 20.48% | 18.29% |
| Kensington Dynamic Growth Fund - Class A with load | 14.80% | 13.53% |
| Kensington Dynamic Growth Fund - Class C | 19.57% | 17.58% |
| Kensington Dynamic Growth Fund - Institutional Class | 20.76% | 18.64% |
| S&P 500 Total Return Index ** | 28.71% | 32.67% |
| * | The Performance data quoted is historical. Past performance is no guarantee of future results. Current performance may be higher or lower than the performance data quoted. The principal value and investment return of an investment will fluctuate so that your shares, when redeemed, may be worth more or less than their original cost. The returns shown do not reflect the deduction of taxes that a shareholder would pay on Fund distributions or on the redemptions of Fund shares. Returns greater than one year are annualized. The total gross estimated operating expenses including underlying funds as stated in the fee table of the Fund’s prospectus dated May 1, 2021 is 2.06% for Class A, 2.66% for Class C and 1.66% for Institutional Class. Class A shares are subject to a maximum sales charge (load) of 4.75%. Class C shares are subject to a 1% deferred sales charge if redeemed prior to 12 months, under certain conditions. Investors should consider the investment objectives, risks, and charges and expenses of the Fund carefully before investing. The Fund’s prospectus and summary prospectus contain these as well as other information about the Fund and should be read carefully before investing. A prospectus or summary prospectus and current performance may be obtained by calling 1-855-375-3060. |
| ** | The S&P 500 Total Return Index is an unmanaged market capitalization-weighted index which is comprised of 500 of the largest U.S. domiciled companies and includes the reinvestment of all dividends. Investors cannot invest directly in an index or benchmark. |
| Portfolio Composition | % of Net Assets | |||
| Exchange Traded Funds - Fixed Income | 60.0 | % | ||
| Money Market Fund | 40.0 | % | ||
| Liabilities In Excess of Other Assets | 0.0 | % | ||
| 100.0 | % | |||
Please refer to the Schedule of Investments and the Shareholder Letter in this report for a detailed listing of the Fund’s holdings.
5
| Kensington Dynamic Growth Fund |
| Portfolio Review (Unaudited)(Continued) |
| December 31, 2021 |
Comparison of the Change in Value of a $10,000 Investment
Since Inception through December 31, 2021 +
Comparison of the Change in Value of a $25,000 Investment
Since Inception through December 31, 2021 +
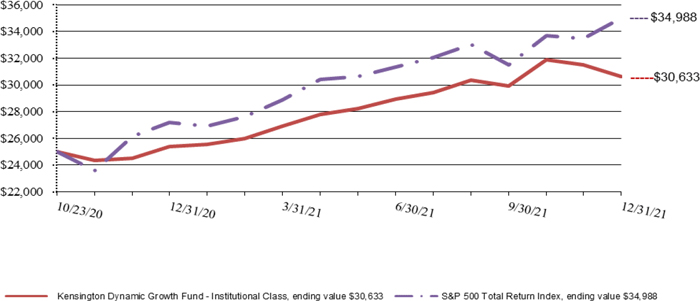
| + | Inception date is October 23, 2020 for Class A and Institutional Class. |
6
| KENSINGTON MANAGED INCOME FUND |
| SCHEDULE OF INVESTMENTS |
| December 31, 2021 |
| Shares | Value | |||||||
| EXCHANGE TRADED FUNDS - 34.2% | ||||||||
| FIXED INCOME - 34.2% | ||||||||
| 506,150 | iShares 20+ Year Treasury Bond ETF | $ | 75,006,368 | |||||
| 613,900 | iShares 3 -7 Year Treasury Bond ETF | 78,990,513 | ||||||
| 1,036,140 | iShares 7 -10 Year Treasury Bond ETF | 119,156,100 | ||||||
| 273,152,981 | ||||||||
| TOTAL EXCHANGE TRADED FUNDS (Cost $278,253,240) | 273,152,981 | |||||||
| SHORT-TERM INVESTMENT - 50.1% | ||||||||
| MONEY MARKET FUND - 50.1% | ||||||||
| 400,472,938 | First American Government Obligations Fund, Class X, 0.02%(a) | 400,472,938 | ||||||
| TOTAL SHORT-TERM INVESTMENT (Cost $400,472,938) | 400,472,938 | |||||||
| TOTAL INVESTMENTS - 84.3% (Cost $678,726,178) | $ | 673,625,919 | ||||||
| OTHER ASSETS IN EXCESS OF LIABILITIES - 15.7% | 125,675,451 | |||||||
| NET ASSETS - 100.0% | $ | 799,301,370 | ||||||
ETF - Exchange Traded Fund
| (a) | Money market fund; interest rate reflects seven-day effective yield on December 31, 2021. |
The accompanying notes are an integral part of these financial statements.
7
| KENSINGTON DYNAMIC GROWTH FUND |
| SCHEDULE OF INVESTMENTS |
| December 31, 2021 |
| Shares | Value | |||||||
| EXCHANGE TRADED FUNDS - 60.0% | ||||||||
| FIXED INCOME - 60.0% | ||||||||
| 490,400 | iShares 20+ Year Treasury Bond ETF | $ | 72,672,376 | |||||
| 439,060 | iShares 3 -7 Year Treasury Bond ETF | 56,493,850 | ||||||
| 813,370 | iShares 7 -10 Year Treasury Bond ETF | 93,537,550 | ||||||
| 222,703,776 | ||||||||
| TOTAL EXCHANGE TRADED FUNDS (Cost $227,248,388) | 222,703,776 | |||||||
| SHORT-TERM INVESTMENT - 40.0% | ||||||||
| MONEY MARKET FUND - 40.0% | ||||||||
| 148,338,132 | First American Government Obligations Fund, Class X, 0.02%(a) | 148,338,132 | ||||||
| TOTAL SHORT-TERM INVESTMENT (Cost $148,338,132) | 148,338,132 | |||||||
| TOTAL INVESTMENTS - 100.0% (Cost$375,586,520) | $ | 371,041,908 | ||||||
| LIABILITIES IN EXCESS OF OTHER ASSETS - 0.0% | (26,570 | ) | ||||||
| NET ASSETS - 100.0% | $ | 371,015,338 | ||||||
ETF - Exchange Traded Fund
| (a) | Money market fund; interest rate reflects seven-day effective yield on December 31, 2021. |
The accompanying notes are an integral part of these financial statements.
8
| Kensington Funds |
| STATEMENTS OF ASSETS AND LIABILITIES |
| December 31, 2021 |
| Kensington Managed | Kensington Dynamic | |||||||
| Income Fund | Growth Fund | |||||||
| Assets: | ||||||||
| Investments Securities: | ||||||||
| At Cost | $ | 678,726,178 | $ | 375,586,520 | ||||
| At Value | $ | 673,625,919 | $ | 371,041,908 | ||||
| Dividends and Interest Receivable | 9,047 | 2,683 | ||||||
| Receivable for Fund Shares Sold | 1,280,430 | 493,302 | ||||||
| Receivable for Securities Sold | 126,668,934 | — | ||||||
| Prepaid Expenses and Other Assets | 55,159 | 46,452 | ||||||
| Total Assets | 801,639,489 | 371,584,345 | ||||||
| Liabilities: | ||||||||
| Payable for Fund Shares Redeemed | 1,338,087 | 99,532 | ||||||
| Accrued Advisory Fees | 840,766 | 392,088 | ||||||
| Payable to Related Parties | 79,000 | 35,197 | ||||||
| Accrued Distribution Fees | 27,195 | 14,876 | ||||||
| Accrued Expenses and Other Liabilities | 53,071 | 27,314 | ||||||
| Total Liabilities | 2,338,119 | 569,007 | ||||||
| Net Assets | $ | 799,301,370 | $ | 371,015,338 | ||||
| Composition of Net Assets: | ||||||||
| Net Assets consisted of: | ||||||||
| Paid in Capital | $ | 806,506,567 | $ | 366,435,340 | ||||
| Distributable Earnings (Accumulated Loss) | (7,205,197 | ) | 4,579,998 | |||||
| Net Assets | $ | 799,301,370 | $ | 371,015,338 | ||||
| Net Asset Value,Offering Price and Redemption Price Per Share | ||||||||
| Class A: | ||||||||
| Net Assets | $ | 61,129,619 | $ | 20,412,703 | ||||
| Shares of beneficial interest outstanding (unlimited shares of no par beneficial interest authorized) | 5,788,983 | 1,813,412 | ||||||
| Net Asset Value (Net Assets ÷ Shares Outstanding) and Redemption Price Per Share | $ | 10.56 | $ | 11.26 | ||||
| Maximum Offering Price Per Share (Maximum sales charge of 4.75%)(a) | $ | 11.09 | $ | 11.82 | ||||
| Institutional Class: | ||||||||
| Net Assets | $ | 721,444,909 | $ | 339,323,597 | ||||
| Shares of beneficial interest outstanding(unlimited shares of no par beneficial interest authorized) | 68,195,120 | 30,027,156 | ||||||
| Net Asset Value (Net Assets ÷ Shares Outstanding), Offering and Redemption Price Per Share | $ | 10.58 | $ | 11.30 | ||||
| Class C: | ||||||||
| Net Assets | $ | 16,726,842 | $ | 11,279,038 | ||||
| Shares of beneficial interest outstanding(unlimited shares of no par beneficial interest authorized) | 1,590,560 | 1,009,246 | ||||||
| Net Asset Value (Net Assets ÷ Shares Outstanding),Offering and Redemption Price Per Share (b) | $ | 10.52 | $ | 11.18 | ||||
| (a) | On investments of $50,000 or more,the offering price is reduced. |
| (b) | Investments in Class C shares maybe subject to a 1% contingent deferred sales charge on shares redeemed less than 12 months after purchase. |
The accompanying notes are an integral part of these financial statements.
9
| Kensington Funds |
| STATEMENTS OF OPERATIONS |
| For the Year Ended December 31, 2021 |
| Kensington Managed | Kensington Dynamic | |||||||
| Income Fund | Growth Fund | |||||||
| Investment Income: | ||||||||
| Dividend Income | $ | 23,434,520 | $ | 1,646,177 | ||||
| Interest Income | 14,003 | 6,455 | ||||||
| Total Investment Income | 23,448,523 | 1,652,632 | ||||||
| Expenses: | ||||||||
| Investment Advisory Fees | 7,419,009 | 2,828,517 | ||||||
| Distribution (12b -1) Fees - Class A | 130,149 | 25,289 | ||||||
| Distribution (12b -1) Fees - Class C | 140,088 | 61,324 | ||||||
| Administration Fees | 375,155 | 164,838 | ||||||
| Transfer Agent Fees | 240,906 | 95,918 | ||||||
| Registration and Filing Fees | 136,195 | 94,334 | ||||||
| Custody Fees | 69,761 | 23,962 | ||||||
| Printing Expense | 62,029 | 19,846 | ||||||
| Legal Fees | 25,708 | 20,057 | ||||||
| Chief Compliance Officer Fees | 20,000 | 20,000 | ||||||
| Audit Fees | 19,000 | 15,750 | ||||||
| Trustees’ Fees | 1,000 | — | ||||||
| Insurance Expense | 3,959 | 1,105 | ||||||
| Miscellaneous Expenses | 3,158 | 5,278 | ||||||
| Total Expenses | 8,646,117 | 3,376,218 | ||||||
| Add: Expenses Recaptured by Advisor | — | 35,854 | ||||||
| Net Expenses | 8,646,117 | 3,412,072 | ||||||
| Net Investment Income (Loss) | 14,802,406 | (1,759,440 | ) | |||||
| Realized and Unrealized Gain (Loss) on Investments: | ||||||||
| Net Realized Gain from Investments | 4,216,178 | 38,567,920 | ||||||
| Capital Gain Distributions from Underlying Investment Companies | 826,908 | — | ||||||
| Net Change in Unrealized (Depreciation) on Investments | (19,613,093 | ) | (6,513,138 | ) | ||||
| Net Realized and Unrealized Gain(Loss) on Investments | (14,570,007 | ) | 32,054,782 | |||||
| Net Increase in Net Assets Resulting From Operations | $ | 232,399 | $ | 30,295,342 | ||||
The accompanying notes are an integral part of these financial statements.
10
Kensington Funds |
| STATEMENTS OF CHANGES IN NET ASSETS |
| Kensington Managed Income Fund | ||||||||
| For the Year | For the Year | |||||||
| Ended | Ended | |||||||
| December 31, 2021 | December 31, 2020 | |||||||
| Increase in Net Assets from Operations: | ||||||||
| Net Investment Income | $ | 14,802,406 | $ | 4,657,033 | ||||
| Net Realized Gain from Investments | 4,216,178 | 645,986 | ||||||
| Capital Gain Distributions from Underlying Investment Companies | 826,908 | — | ||||||
| Net Change in Unrealized Appreciation (Depreciation) on Investments | (19,613,093 | ) | 13,906,775 | |||||
| Net Increase in Net Assets Resulting From Operations | 232,399 | 19,209,794 | ||||||
| Distributions to Shareholders: | ||||||||
| From Distributable Earnings: | ||||||||
| Class A | (1,789,734 | ) | (589,489 | ) | ||||
| Class C | (371,543 | ) | (138,314 | ) | ||||
| Institutional Class | (20,347,069 | ) | (4,500,398 | ) | ||||
| From Return of Capital: | ||||||||
| Class A | — | (15,392 | ) | |||||
| Class C | — | (5,105 | ) | |||||
| Institutional Class | — | (113,474 | ) | |||||
| Total Distributions to Shareholders | (22,508,346 | ) | (5,362,172 | ) | ||||
| Shares of Beneficial Interest Transactions: | ||||||||
| Class A Shares: | ||||||||
| Proceeds from Shares Issued | 50,723,419 | 45,965,577 | ||||||
| Distributions Reinvested | 1,656,457 | 527,198 | ||||||
| Cost of Shares Redeemed | (27,691,206 | ) | (15,002,794 | ) | ||||
| 24,688,670 | 31,489,981 | |||||||
| Institutional Class Shares: | ||||||||
| Proceeds from Shares Issued | 575,574,722 | 306,600,055 | ||||||
| Distributions Reinvested | 15,937,627 | 3,231,654 | ||||||
| Cost of Shares Redeemed | (146,512,492 | ) | (79,453,022 | ) | ||||
| 444,999,857 | 230,378,687 | |||||||
| Class C Shares: | ||||||||
| Proceeds from Shares Issued | 8,398,109 | 9,815,211 | ||||||
| Distributions Reinvested | 347,280 | 138,244 | ||||||
| Cost of Shares Redeemed | (3,375,996 | ) | (896,475 | ) | ||||
| 5,369,393 | 9,056,980 | |||||||
| Net Increase from Beneficial Interest Transactions | 475,057,920 | 270,925,648 | ||||||
| Net Increase in Net Assets | 452,781,973 | 284,773,270 | ||||||
| Net Assets: | ||||||||
| Beginning of Year | $ | 346,519,397 | 61,746,127 | |||||
| End of Year | $ | 799,301,370 | $ | 346,519,397 | ||||
| Share Activity: | ||||||||
| Class A Shares: | ||||||||
| Shares Issued | 4,649,893 | 4,457,650 | ||||||
| Shares Reinvested | 153,890 | 49,742 | ||||||
| Shares Redeemed | (2,550,368 | ) | (1,449,019 | ) | ||||
| Net increase in shares of beneficial interest outstanding | 2,253,415 | 3,058,373 | ||||||
| Institutional Class Shares: | ||||||||
| Shares Issued | 52,663,848 | 29,482,190 | ||||||
| Shares Reinvested | 1,479,504 | 304,961 | ||||||
| Shares Redeemed | (13,426,701 | ) | (7,667,430 | ) | ||||
| Net increase in shares of beneficial interest outstanding | 40,716,651 | 22,119,721 | ||||||
| Class C Shares: | ||||||||
| Shares Issued | 775,632 | 955,998 | ||||||
| Shares Reinvested | 32,465 | 13,054 | ||||||
| Shares Redeemed | (311,460 | ) | (86,635 | ) | ||||
| Net increase in shares of beneficial interest outstanding | 496,637 | 882,417 | ||||||
The accompanying notes are an integral part of these financial statements.
11
| Kensington Funds |
| STATEMENTS OF CHANGES IN NET ASSETS (Continued) |
| Kensington Dynamic Growth Fund | ||||||||
| For the Year | For the Period * | |||||||
| Ended | Ended | |||||||
| December 31, 2021 | December 31, 2020 | |||||||
| Increase in Net Assets from Operations: | ||||||||
| Net Investment Income (Loss) | $ | (1,759,440 | ) | $ | 171,979 | |||
| Net Realized Gain from Investments | 38,567,920 | 1,886 | ||||||
| Net Change in Unrealized Appreciation (Depreciation) on Investments | (6,513,138 | ) | 1,968,526 | |||||
| Net Increase in Net Assets Resulting From Operations | 30,295,342 | 2,142,391 | ||||||
| Distributions to Shareholders: | ||||||||
| From Distributable Earnings: | ||||||||
| Class A | (1,541,537 | ) | (11,728 | ) | ||||
| Class C | (866,507 | ) | (5,603 | ) | ||||
| Institutional Class | (25,264,064 | ) | (204,128 | ) | ||||
| Total Distributions to Shareholders | (27,672,108 | ) | (221,459 | ) | ||||
| Shares of Beneficial Interest Transactions: | ||||||||
| Class A Shares: | ||||||||
| Proceeds from Shares Issued | 19,200,985 | 3,448,894 | ||||||
| Distributions Reinvested | 1,267,298 | 10,412 | ||||||
| Cost of Shares Redeemed | (3,141,753 | ) | — | |||||
| 17,326,530 | 3,459,306 | |||||||
| Institutional Class Shares: | ||||||||
| Proceeds from Shares Issued | 316,815,125 | 60,060,389 | ||||||
| Distributions Reinvested | 19,265,419 | 70,182 | ||||||
| Cost of Shares Redeemed | (59,194,427 | ) | (2,989,991 | ) | ||||
| 276,886,117 | 57,140,580 | |||||||
| Class C Shares: | ||||||||
| Proceeds from Shares Issued | 11,496,433 | 2,062,124 | ||||||
| Distributions Reinvested | 728,659 | 5,302 | ||||||
| Cost of Shares Redeemed | (2,633,879 | ) | — | |||||
| 9,591,213 | 2,067,426 | |||||||
| Net Increase from Beneficial Interest Transactions | 303,803,860 | 62,667,312 | ||||||
| Net Increase in Net Assets | 306,427,094 | 64,588,244 | ||||||
| Net Assets: | ||||||||
| Beginning of Year/Period | $ | 64,588,244 | — | |||||
| End of Year/Period | $ | 371,015,338 | $ | 64,588,244 | ||||
| Share Activity: | ||||||||
| Class A Shares: | ||||||||
| Shares Issued | 1,618,214 | 354,244 | ||||||
| Shares Reinvested | 112,349 | 1,038 | ||||||
| Shares Redeemed | (272,433 | ) | — | |||||
| Net increase in shares of beneficial interest outstanding | 1,458,130 | 355,282 | ||||||
| Institutional Class Shares: | ||||||||
| Shares Issued | 27,537,835 | 6,119,403 | ||||||
| Shares Reinvested | 1,701,892 | 6,990 | ||||||
| Shares Redeemed | (5,038,215 | ) | (300,749 | ) | ||||
| Net increase in shares of beneficial interest outstanding | 24,201,512 | 5,825,644 | ||||||
| Class C Shares: | ||||||||
| Shares Issued | 958,354 | 205,883 | ||||||
| Shares Reinvested | 65,059 | 529 | ||||||
| Shares Redeemed | (220,579 | ) | — | |||||
| Net increase in shares of beneficial interest outstanding | 802,834 | 206,412 | ||||||
| * | For the period October 23, 2020 (commencement of operations) through December 31, 2020. |
The accompanying notes are an integral part of these financial statements.
12
| Kensington Funds |
| FINANCIAL HIGHLIGHTS |
| The table below sets forth financial data for one share of beneficial interest outstanding throughout each year/period presented. |
| Kensington Managed Income Fund | ||||||||||||
| Class A | ||||||||||||
| For the Year | For the Year | For the Period * | ||||||||||
| Ended | Ended | Ended | ||||||||||
| December 31, 2021 | December 31, 2020 | December 31, 2019 | ||||||||||
| Net Asset Value, Beginning of Year/Period | $ | 10.78 | $ | 10.20 | $ | 10.00 | ||||||
| From Operations: | ||||||||||||
| Net investment income (a) | 0.25 | 0.31 | 0.15 | |||||||||
| Net gain (loss) from investments (realized and unrealized) | (0.13 | ) | 0.49 | 0.15 | ||||||||
| Total from operations | 0.12 | 0.80 | 0.30 | |||||||||
| Distributions to shareholders from: | ||||||||||||
| Net investment income | (0.24 | ) | (0.19 | ) | (0.10 | ) | ||||||
| Net realized gains | (0.10 | ) | (0.02 | ) | — | |||||||
| Return of capital | — | (0.01 | ) | — | ||||||||
| Total distributions | (0.34 | ) | (0.22 | ) | (0.10 | ) | ||||||
| Net Asset Value, End of Year/Period | $ | 10.56 | $ | 10.78 | $ | 10.20 | ||||||
| Total Return (b) | 1.05 | % | 7.87 | % | 3.01 | % (c) | ||||||
| Ratios/Supplemental Data | ||||||||||||
| Net assets, end of year/period (in 000’s) | $ | 61,130 | $ | 38,110 | $ | 4,867 | ||||||
| Ratio of expenses to average net assets, | ||||||||||||
| before reimbursement/recapture | 1.66 | % | 1.77 | % | 2.42 | % (d) | ||||||
| net of reimbursement/recapture | 1.66 | % | 1.79 | % | 2.39 | % (d) | ||||||
| Ratio of net investment income to average net assets | 2.31 | % | 2.93 | % | 2.44 | % (d) | ||||||
| Portfolio turnover rate | 220 | % | 233 | % | 61 | % (c) | ||||||
| * | For the period May 28, 2019 (commencement of operations) through December 31, 2019. Trading commenced on May 31, 2019. |
| (a) | Per share amounts are calculated using the average shares method, which more appropriately presents the per share data for the year/period. |
| (b) | Total returns are historical in nature and assume changes in share price, reinvestment of dividends and capital gains distributions, if any, and excludes sales charges. Had the Adviser not absorbed a portion of the Fund’s expenses, total returns would have been lower for the period ended December 31, 2019. |
| (c) | Not annualized. |
| (d) | Annualized. |
The accompanying notes are an integral part of these financial statements.
13
| Kensington Funds |
| FINANCIAL HIGHLIGHTS (Continued) |
| The table below sets forth financial data for one share of beneficial interest outstanding throughout each year/period presented. |
| Kensington Managed Income Fund | ||||||||||||
| Institutional Class | ||||||||||||
| For the Year | For the Year | For the Period * | ||||||||||
| Ended | Ended | Ended | ||||||||||
| December 31, 2021 | December 31, 2020 | December 31, 2019 | ||||||||||
| Net Asset Value, Beginning of Year/Period | $ | 10.80 | $ | 10.21 | $ | 10.00 | ||||||
| From Operations: | ||||||||||||
| Net investment income (a) | 0.28 | 0.32 | 0.17 | |||||||||
| Net gain (loss) from investments (realized and unrealized) | (0.13 | ) | 0.51 | 0.15 | ||||||||
| Total from operations | 0.15 | 0.83 | 0.32 | |||||||||
| Distributions to shareholders from: | ||||||||||||
| Net investment income | (0.27 | ) | (0.21 | ) | (0.11 | ) | ||||||
| Net realized gains | (0.10 | ) | (0.02 | ) | — | |||||||
| Return of capital | — | (0.01 | ) | — | ||||||||
| Total distributions | (0.37 | ) | (0.24 | ) | (0.11 | ) | ||||||
| Net Asset Value, End of Year/Period | $ | 10.58 | $ | 10.80 | $ | 10.21 | ||||||
| Total Return (b) | 1.29 | % | 8.13 | % | 3.20 | % (c) | ||||||
| Ratios/Supplemental Data | ||||||||||||
| Net assets, end of year/period (in 000’s) | $ | 721,445 | $ | 296,660 | $ | 54,723 | ||||||
| Ratio of expenses to average net assets, | ||||||||||||
| before reimbursement/recapture | 1.41 | % | 1.59 | % | 2.20 | % (d) | ||||||
| net of reimbursement/recapture | 1.41 | % | 1.61 | % | 1.99 | % (d) | ||||||
| Ratio of net investment income to average net assets | 2.54 | % | 3.06 | % | 2.83 | % (d) | ||||||
| Portfolio turnover rate | 220 | % | 233 | % | 61 | % (c) | ||||||
| * | For the period May 28, 2019 (commencement of operations) through December 31, 2019. Trading commenced on May 31, 2019. |
| (a) | Per share amounts are calculated using the average shares method, which more appropriately presents the per share data for the year/period |
| (b) | Total returns are historical in nature and assume changes in share price, reinvestment of dividends and capital gains distributions, if any. Had the Adviser not absorbed a portion of the Fund’s expenses, total returns would have been lower for the period ended December 31, 2019. |
| (c) | Not annualized. |
| (d) | Annualized. |
The accompanying notes are an integral part of these financial statements.
14
| Kensington Funds |
| FINANCIAL HIGHLIGHTS (Continued) |
| The table below sets forth financial data for one share of beneficial interest outstanding throughout each year/period presented. |
| Kensington Managed Income Fund | ||||||||||||
| Class C | ||||||||||||
| For the Year | For the Year | For the Period * | ||||||||||
| Ended | Ended | Ended | ||||||||||
| December 31, 2021 | December 31, 2020 | December 31, 2019 | ||||||||||
| Net Asset Value, Beginning of Year/Period | $ | 10.74 | $ | 10.19 | $ | 10.17 | ||||||
| From Operations: | ||||||||||||
| Net investment income (a) | 0.17 | 0.22 | 0.06 | |||||||||
| Net gain (loss) from investments (realized and unrealized) | (0.13 | ) | 0.49 | 0.05 | ||||||||
| Total from operations | 0.04 | 0.71 | 0.11 | |||||||||
| Distributions to shareholders from: | ||||||||||||
| Net investment income | (0.16 | ) | (0.13 | ) | (0.09 | ) | ||||||
| Net realized gains | (0.10 | ) | (0.02 | ) | — | |||||||
| Return of capital | — | (0.01 | ) | — | ||||||||
| Total distributions | (0.26 | ) | (0.16 | ) | (0.09 | ) | ||||||
| Net Asset Value, End of Year/Period | $ | 10.52 | $ | 10.74 | $ | 10.19 | ||||||
| Total Return (b) | 0.35 | % | 6.95 | % | 1.09 | % (c) | ||||||
| Ratios/Supplemental Data | ||||||||||||
| Net assets, end of year/period (in 000’s) | $ | 16,727 | $ | 11,749 | $ | 2,156 | ||||||
| Ratio of expenses to average net assets, | ||||||||||||
| before reimbursement/recapture | 2.41 | % | 2.55 | % | 3.03 | % (d) | ||||||
| net of reimbursement/recapture | 2.41 | % | 2.57 | % | 2.99 | % (d) | ||||||
| Ratio of net investment income to average net assets | 1.59 | % | 2.07 | % | 2.22 | % (d) | ||||||
| Portfolio turnover rate | 220 | % | 233 | % | 61 | % (c) | ||||||
| * | For the period August 27, 2019 (commencement of operations) through December 31, 2019. |
| (a) | Per share amounts are calculated using the average shares method, which more appropriately presents the per share data for the year/period. |
| (b) | Total returns are historical in nature and assume changes in share price, reinvestment of dividends and capital gains distributions, if any, and excludes sales charges. Had the Adviser not absorbed a portion of the Fund’s expenses, total returns would have been lower for the period ended December 31, 2019. |
| (c) | Not annualized. |
| (d) | Annualized. |
The accompanying notes are an integral part of these financial statements.
15
Kensington Funds |
| FINANCIAL HIGHLIGHTS (Continued) |
| The table below sets forth financial data for one share of beneficial interest outstanding throughout the year/period presented. |
| Kensington Dynamic Growth Fund | ||||||||
| Class A | ||||||||
| For the Year | For the Period * | |||||||
| Ended | Ended | |||||||
| December 31, 2021 | December 31, 2020 | |||||||
| Net Asset Value, Beginning of Year/Period | $ | 10.10 | $ | 10.00 | ||||
| From Operations: | ||||||||
| Net investment income (loss) (a) | (0.13 | ) | 0.05 | |||||
| Net gain from investments (realized and unrealized) | 2.20 | 0.08 | ||||||
| Total from operations | 2.07 | 0.13 | ||||||
| Distributions to shareholders from: | ||||||||
| Net investment income | — | (0.03 | ) | |||||
| Net realized gains | (0.91 | ) | — | |||||
| Total distributions | (0.91 | ) | (0.03 | ) | ||||
| Net Asset Value, End of Year/Period | $ | 11.26 | $ | 10.10 | ||||
| Total Return (b) | 20.48 | % | 1.35 | % (c) | ||||
| Ratios/Supplemental Data | ||||||||
| Net assets, end of year/period (in 000’s) | $ | 20,413 | $ | 3,588 | ||||
| Ratio of expenses to average net assets, | ||||||||
| before reimbursement/recapture | 1.70 | % | 2.36 | % (d) | ||||
| net of reimbursement/recapture | 1.72 | % | 2.04 | % (d) | ||||
| Ratio of net investment income (loss) to average net assets | (1.06 | %) | 2.71 | % (d) | ||||
| Portfolio turnover rate | 786 | % | 277 | % (c) | ||||
| * | For the period October 23, 2020 (commencement of operations) through December 31, 2020. |
| (a) | Per share amounts are calculated using the average shares method, which more appropriately presents the per share data for the year/period. |
| (b) | Total returns are historical in nature and assume changes in share price, reinvestment of dividends and capital gains distributions, if any, and excludes sales charges. Had the advisor and subadvisor not absorbed a portion of the Fund’s expenses, total returns would have been lower for the period ended December 31, 2020. |
| (c) | Not annualized. |
| (d) | Annualized. |
The accompanying notes are an integral part of these financial statements.
16
| Kensington Funds |
| FINANCIAL HIGHLIGHTS (Continued) |
| The table below sets forth financial data for one share of beneficial interest outstanding throughout the year/period presented. |
| Kensington Dynamic Growth Fund | ||||||||
| Institutional Class | ||||||||
| For the Year | For the Period * | |||||||
| Ended | Ended | |||||||
| December 31, 2021 | December 31, 2020 | |||||||
| Net Asset Value, Beginning of Year/Period | $ | 10.11 | $ | 10.00 | ||||
| From Operations: | ||||||||
| Net investment income (loss) (a) | (0.09 | ) | 0.04 | |||||
| Net gain from investments (realized and unrealized) | 2.19 | 0.11 | ||||||
| Total from operations | 2.10 | 0.15 | ||||||
| Distributions to shareholders from: | ||||||||
| Net investment income | — | (0.04 | ) | |||||
| Net realized gains | (0.91 | ) | — | |||||
| Total distributions | (0.91 | ) | (0.04 | ) | ||||
| Net Asset Value, End of Year/Period | $ | 11.30 | $ | 10.11 | ||||
| Total Return (b) | 20.76 | % | 1.47 | % (c) | ||||
| Ratios/Supplemental Data | ||||||||
| Net assets, end of year/period (in 000’s) | $ | 339,324 | $ | 58,914 | ||||
| Ratio of expenses to average net assets, | ||||||||
| before reimbursement/recapture | 1.45 | % | 2.12 | % (d) | ||||
| net of reimbursement/recapture | 1.47 | % | 1.64 | % (d) | ||||
| Ratio of net investment income (loss) to average net assets | (0.73 | %) | 2.20 | % (d) | ||||
| Portfolio turnover rate | 786 | % | 277 | % (c) | ||||
| * | For the period October 23, 2020 (commencement of operations) through December 31, 2020. |
| (a) | Per share amounts are calculated using the average shares method, which more appropriately presents the per share data for the year/period. |
| (b) | Total returns are historical in nature and assume changes in share price, reinvestment of dividends and capital gains distributions, if any, and excludes sales charges. Had the advisor and subadvisor not absorbed a portion of the Fund’s expenses, total returns would have been lower for the period ended December 31, 2020. |
| (c) | Not annualized. |
| (d) | Annualized. |
The accompanying notes are an integral part of these financial statements.
17
| Kensington Funds |
| FINANCIAL HIGHLIGHTS (Continued) |
| The table below sets forth financial data for one share of beneficial interest outstanding throughout the year/period presented. |
| Kensington Dynamic Growth Fund | ||||||||
| Class C | ||||||||
| For the Year | For the Period * | |||||||
| Ended | Ended | |||||||
| December 31, 2021 | December 31, 2020 | |||||||
| Net Asset Value, Beginning of Year/Period | $ | 10.11 | $ | 10.00 | ||||
| From Operations: | ||||||||
| Net investment income (loss) (a) | (0.21 | ) | 0.05 | |||||
| Net gain from investments (realized and unrealized) | 2.19 | 0.09 | ||||||
| Total from operations | 1.98 | 0.14 | ||||||
| Distributions to shareholders from: | ||||||||
| Net investment income | — | (0.03 | ) | |||||
| Net realized gains | (0.91 | ) | — | |||||
| Total distributions | (0.91 | ) | (0.03 | ) | ||||
| Net Asset Value, End of Year/Period | $ | 11.18 | $ | 10.11 | ||||
| Total Return (b) | 19.57 | % | 1.39 | % (c) | ||||
| Ratios/Supplemental Data | ||||||||
| Net assets, end of year/period (in 000’s) | $ | 11,279 | $ | 2,086 | ||||
| Ratio of expenses to average net assets, | ||||||||
| before reimbursement/recapture | 2.44 | % | 2.96 | % (d) | ||||
| net of reimbursement/recapture | 2.47 | % | 2.64 | % (d) | ||||
| Ratio of net investment income (loss) to average net assets | (1.77 | %) | 2.50 | % (d) | ||||
| Portfolio turnover rate | 786 | % | 277 | % (c) | ||||
| * | For the period October 23, 2020 (commencement of operations) through December 31, 2020. |
| (a) | Per share amounts are calculated using the average shares method, which more appropriately presents the per share data for the year/period. |
| (b) | Total returns are historical in nature and assume changes in share price, reinvestment of dividends and capital gains distributions, if any, and excludes sales charges. Had the advisor and subadvisor not absorbed a portion of the Fund’s expenses, total returns would have been lower for the period ended December 31, 2020. |
| (c) | Not annualized. |
| (d) | Annualized. |
The accompanying notes are an integral part of these financial statements.
18
| Kensington Funds |
| NOTES TO FINANCIAL STATEMENTS |
| December 31, 2021 |
| 1. | ORGANIZATION |
Kensington Managed Income Fund (“Managed Income Fund”) and Kensington Dynamic Growth Fund (“Dynamic Growth Fund”) (each a “Fund” and collectively, the “Funds”) are non- diversified series of shares of Advisors Preferred Trust (the “Trust”), a statutory trust organized under the laws of the State of Delaware on August 15, 2012 and registered under the Investment Company Act of 1940, as amended (the “1940 Act”), as an open-end management investment company. The Managed Income Fund seeks income and the Dynamic Growth Fund seeks capital gains. The Managed Income Fund and the Dynamic Growth Fund commenced operations on May 28, 2019 and October 23, 2020, respectively.
The Funds currently offers three classes of shares: Class A, Class C and Institutional Class. Class A and Institutional Class shares of the Managed Income Fund commenced operations on May 28, 2019; Class C shares of the Managed Income Fund commenced operations on August 27, 2019. The Class A, Class C and Institutional Class shares of the Dynamic Growth Fund commenced operations on October 23, 2020. Class A shares of each Fund are offered at net asset value (“NAV”) plus a maximum sales charge of 4.75%. Class C and Institutional Class shares of each Fund are offered at net asset value. Class C shares are subject to a 1% deferred sales charge if redeemed prior to 12 months, under certain conditions. Each class represents an interest in the same assets of the respective Fund and classes are identical except for differences in their ongoing service and distribution charges. All classes of shares have equal voting privileges except that each class has exclusive voting rights with respect to its service and/or distribution plans. Each Fund’s income, expenses (other than class specific shareholder servicing and distribution fees) and realized and unrealized gains and losses are allocated proportionately each day based upon the relative net assets of each class.
| 2. | SIGNIFICANT ACCOUNTING POLICIES |
The following is a summary of significant accounting policies followed by the Funds in preparation of their financial statements. These policies are in conformity with accounting principles generally accepted in the United States of America (“GAAP”). The preparation of financial statements in conformity with GAAP requires management to make estimates and assumptions that affect the reported amounts of assets and liabilities and disclosure of contingent assets and liabilities at the date of the financial statements and the reported amounts of increases and decreases in net assets from operations during the reporting period. Actual results could differ from those estimates. Each Fund is an investment company and accordingly follows the Investment Company accounting and reporting guidance of the Financial Accounting Standards Board (“FASB”) Accounting Standards Codification Topic 946 Financial Services – Investment Companies.
Securities Valuation – Securities listed on an exchange are valued at the last reported sale price at the close of the regular trading session of the exchange on the business day the value is being determined, or in the case of securities listed on NASDAQ, at the NASDAQ Official Closing Price (“NOCP”). In the absence of a sale, such securities shall be valued at the mean between the current bid and ask prices on the day of valuation. Short-term debt obligations, excluding U.S. Treasury Bills, having 60 days or less remaining until maturity, at time of purchase, may be valued at amortized cost.
Each Fund may hold securities, such as private investments, interests in commodity pools, other non-traded securities or temporarily illiquid securities, for which market quotations are not readily available or are determined to be unreliable. These securities will be valued using the “fair value” procedures approved by the Trust’s Board of Trustees (the “Board”) . The Board has delegated execution of these procedures to a fair value committee composed of one or more representatives from each of the (i) Trust, (ii) administrator, and (iii) advisor and/or sub-advisor. The committee may also enlist third party consultants such as a valuation specialist at a public accounting firm, valuation consultant or financial officer of a security issuer on an as-needed basis to assist in determining a security-specific fair value. The Board reviews and ratifies the execution of this process and the resultant fair value prices at least quarterly to assure the process produces reliable results.
Fair Valuation Process – As noted above, the fair value committee is composed of one or more representatives from each of the (i) Trust, (ii) administrator, and (iii) advisor and/or sub-advisor. The applicable investments are
19
| Kensington Funds |
| NOTES TO FINANCIAL STATEMENTS (Continued) |
| December 31, 2021 |
valued collectively via inputs from each of these groups. For example, fair value determinations are required for the following securities: (i) securities for which market quotations are insufficient or not readily available on a particular business day (including securities for which there is a short and temporary lapse in the provision of a price by the regular pricing source), (ii) securities for which, in the judgment of the advisor or sub-advisor, the prices or values available do not represent the fair value of the instrument. Factors which may cause the advisor or sub-advisor to make such a judgment include, but are not limited to, the following: only a bid price or an asked price is available; the spread between bid and asked prices is substantial; the frequency of sales; the thinness of the market; the size of reported trades; and actions of the securities markets, such as the suspension or limitation of trading; (iii) securities determined to be illiquid; (iv) securities with respect to which an event that will affect the value thereof has occurred (a “significant event”) since the closing prices were established on the principal exchange on which they are traded, but prior to a Fund’s calculation of its net asset value. Specifically, interests in commodity pools or managed futures pools are valued on a daily basis by reference to the closing market prices of each futures contract or other asset held by a pool, as adjusted for pool expenses. Restricted or illiquid securities, such as private investments or non-traded securities are valued via inputs from the advisor or sub-advisor based upon the current bid for the security from two or more independent dealers or other parties reasonably familiar with the facts and circumstances of the security (who should take into consideration all relevant factors as may be appropriate under the circumstances). If the advisor or sub-advisor is unable to obtain a current bid from such independent dealers or other independent parties, the fair value committee shall determine the fair value of such security using the following factors: (i) the type of security; (ii) the cost at date of purchase; (iii) the size and nature of a Fund’s holdings; (iv) the discount from market value of unrestricted securities of the same class at the time of purchase and subsequent thereto; (v) information as to any transactions or offers with respect to the security; (vi) the nature and duration of restrictions on disposition of the security and the existence of any registration rights; (vii) how the yield of the security compares to similar securities of companies of similar or equal creditworthiness; (viii) the level of recent trades of similar or comparable securities; (ix) the liquidity characteristics of the security; (x) current market conditions; and (xi) the market value of any securities into which the security is convertible or exchangeable.
Valuation of Fund of Funds – Each Fund may invest in portfolios of open-end or closed-end investment companies (the “Underlying Funds”). The Underlying Funds value securities in their portfolios for which market quotations are readily available at their market values (generally the last reported sale price) and all other securities and assets at their fair value by the methods established by the board of directors/trustees of the Underlying Funds.
Open-ended investment companies are valued at their respective NAVs as reported by such investment companies. The shares of many closed-end investment companies, after their initial public offering, frequently trade at a price per share, which is different than the NAV per share. The difference represents a market premium or market discount of such shares. There can be no assurances that the market discount or market premium on shares of any closed-end investment company purchased by a Fund will not change.
Each Fund utilizes various methods to measure the fair value of all of its investments on a recurring basis. GAAP establishes a hierarchy that prioritizes inputs to valuation methods. The three levels of input are:
Level 1 – Unadjusted quoted prices in active markets for identical assets and liabilities that the Fund has the ability to access.
Level 2 – Observable inputs other than quoted prices included in Level 1 that are observable for the asset or liability, either directly or indirectly. These inputs may include quoted prices for the identical instrument on an inactive market, prices for similar instruments, interest rates, prepayment speeds, credit risk, yield curves, default rates and similar data.
Level 3 – Unobservable inputs for the asset or liability, to the extent relevant observable inputs are not available, representing the Fund’s own assumptions about the assumptions a market participant would use in valuing the asset or liability, and would be based on the best information available.
20
| Kensington Funds |
| NOTES TO FINANCIAL STATEMENTS (Continued) |
| December 31, 2021 |
The availability of observable inputs can vary from security to security and is affected by a wide variety of factors, including, for example, the type of security, whether the security is new and not yet established in the marketplace, the liquidity of markets, and other characteristics particular to the security. To the extent that valuation is based on models or inputs that are less observable or unobservable in the market, the determination of fair value requires more judgment. Accordingly, the degree of judgment exercised in determining fair value is greatest for instruments categorized in Level 3.
The inputs used to measure fair value may fall into different levels of the fair value hierarchy. In such cases, for disclosure purposes, the level in the fair value hierarchy within which the fair value measurement falls in its entirety, is determined based on the lowest level input that is significant to the fair value measurement in its entirety.
The inputs or methodology used for valuing securities are not necessarily an indication of the risk associated with investing in those securities. The following tables summarize the inputs used as of December 31, 2021 for the respective Fund’s assets measured at fair value:
Managed Income Fund
| Assets * | Level 1 | Level 2 | Level 3 | Total | ||||||||||||
| Investments: | ||||||||||||||||
| Exchange Traded Funds | $ | 273,152,981 | — | — | $ | 273,152,981 | ||||||||||
| Short-Term Investment | 400,472,938 | — | — | 400,472,938 | ||||||||||||
| Total Investments | $ | 673,625,919 | $ | — | $ | — | $ | 673,625,919 | ||||||||
Dynamic Growth Fund
| Assets * | Level 1 | Level 2 | Level 3 | Total | ||||||||||||
| Investments: | ||||||||||||||||
| Exchange Traded Funds | $ | 222,703,776 | $ | — | $ | — | $ | 222,703,776 | ||||||||
| Short-Term Investment | 148,338,132 | — | — | 148,338,132 | ||||||||||||
| Total Investments | $ | 371,041,908 | $ | — | $ | — | $ | 371,041,908 | ||||||||
| * | Refer to the Schedule of Investments for industry classifications. |
The Funds did not hold any Level 3 securities during the period.
Security Transactions and Investment Income – Security transactions are accounted for on the trade date. Interest income is recognized on an accrual basis. Discounts are accreted and premiums are amortized on securities purchased over the lives of the respective securities using the effective yield method. Dividend income is recorded on the ex-dividend date. Realized gains or losses from sales of securities are determined by comparing the identified cost of the security lot sold with the net sales proceeds. The accounting records are maintained in U.S. Dollars.
Dividends and Distributions to Shareholders – Dividends from net investment income, if any, are declared and paid quarterly. Distributable net realized capital gains, if any, are declared and distributed annually. Dividends and distributions to shareholders are recorded on the ex-dividend date. Dividends from net investment income and distributions from net realized gains are determined in accordance with federal income tax regulations, which may differ from GAAP. These “book/tax” differences are considered either temporary (e.g., deferred losses, capital loss carryforwards) or permanent in nature. To the extent these differences are permanent in nature, such amounts are reclassified within the composition of net assets based on their federal tax-basis treatment; temporary differences do not require reclassification. These reclassifications have no effect on net assets, results from operations or net asset values per share of a Fund.
Federal Income Tax – It is each Fund’s policy to continue to qualify as a regulated investment company by complying with the provisions of Subchapter M of the Internal Revenue Code that are applicable to regulated investment companies and to distribute substantially all of its taxable income and net realized gains to shareholders. Therefore, no federal income tax provision is required.
21
| Kensington Funds |
| NOTES TO FINANCIAL STATEMENTS (Continued) |
| December 31, 2021 |
Each Fund recognizes the tax benefits of uncertain tax positions only where the position is “more likely than not” to be sustained assuming examination by tax authorities Management has analyzed the Funds’ tax positions and has concluded that no liability for unrecognized tax benefits should be recorded related to uncertain tax positions taken on returns filed for open tax year ended December 31, 2019, December 31, 2020, or expected to be taken in the Funds’ December 31, 2021, year-end tax returns. The Funds have identified their major tax jurisdictions as U.S. Federal and foreign jurisdictions where the Funds makes significant investments; however the Funds are not aware of any tax positions for which it is reasonably possible that the total amounts of unrecognized tax benefits will change materially in the next twelve months.
The Funds recognize interest and penalties, if any, related to unrecognized tax benefits as income tax expense in the Statement of Operations. During the year, the Funds did not incur any interest or penalties.
Expenses – Expenses of the Trust that are directly identifiable to a specific fund are charged to that fund. Expenses, which are not readily identifiable to a specific fund, are allocated in such a manner as deemed equitable, taking into consideration the nature and type of expense and the relative sizes of the funds in the Trust.
Indemnification – The Trust indemnifies its officers and trustees for certain liabilities that may arise from the performance of their duties to the Trust. Additionally, in the normal course of business, each Fund enters into contracts that contain a variety of representations and warranties and which provide general indemnities. Each Fund’s maximum exposure under these arrangements is unknown, as this would involve future claims that may be made against a Fund that have not yet occurred. However, based on experience, the risk of loss due to these warranties and indemnities appears to be remote.
Exchange Traded Funds (“ETFs”) – The Funds may invest in ETFs. ETFs are typically a type of index bought and sold on a securities exchange. An ETF trades like common stock and typically represents a fixed portfolio of securities. The Funds may purchase an ETF to temporarily gain exposure to a portion of the U.S. or a foreign market. The risks of owning an ETF generally reflect the risks of owning the underlying securities they are designed to track, although the lack of liquidity on an ETF could result in it being more volatile. Additionally, ETFs have fees and expenses that reduce their value.
Mutual Fund and Exchange Traded Notes (“ETNs”) Risk: Mutual funds and ETNs are subject to investment advisory or management and other expenses, which will be indirectly paid by the Funds. Each is subject to specific risks, depending on investment strategy. Also, each may be subject to leverage risk, which will magnify losses. ETNs are subject to default risks.
Market Risk: Unexpected local, regional or global events, such as war; acts of terrorism; financial, political or social disruptions; natural, environmental or man-made disasters; the spread of infectious illnesses or other public health issues; and recessions and depressions could have a significant impact on the Fund and its investments and may impair market liquidity. Such events can cause investor fear, which can adversely affect the economies of nations, regions and the market in general, in ways that cannot necessarily be foreseen. An outbreak of infectious respiratory illness known as COVID-19, which is caused by a novel coronavirus (SARS-CoV-2), was first detected in China in December 2019 and subsequently spread globally. This coronavirus has resulted in, among other things, travel restrictions, closed international borders, enhanced health screenings at ports of entry and elsewhere, disruption of and delays in healthcare service preparation and delivery, prolonged quarantines, significant disruptions to business operations, market closures, cancellations and restrictions, supply chain disruptions, lower consumer demand, and significant volatility and declines in global financial markets, as well as general concern and uncertainty. The impact of COVID-19 has adversely affected, and other infectious illness outbreaks that may arise in the future could adversely affect, the economies of many nations and the entire global economy, individual issuers and capital markets in ways that cannot necessarily be foreseen. Public health crises caused by the COVID-19 outbreak may exacerbate other pre-existing political, social and economic risks in certain countries or globally. The duration of the COVID-19 outbreak and its effects cannot be determined with certainty.
22
| Kensington Funds |
| NOTES TO FINANCIAL STATEMENTS (Continued) |
| December 31, 2021 |
| 3. | INVESTMENT TRANSACTIONS |
For the year ended December 31, 2021, the cost of purchases and proceeds from sales of portfolio securities, other than short-term investments and U.S. Government securities, for the Managed Income Fund and the Dynamic Growth Fund, amounted to $1,074,643,222 and $1,130,569,735 and $1,647,030,227 and $1,519,585,644, respectively.
| 4. | INVESTMENT ADVISORY AGREEMENTS AND TRANSACTIONS WITH RELATED PARTIES |
Advisors Preferred LLC (“Advisor”), serves as investment advisor to the Funds. The Advisor has engaged Kensington Asset Management LLC (the “Sub-Advisor”) to serve as the sub-advisor to the Funds whereby the Sub-Advisor will direct investment activities of the Funds. The Sub-Advisor is paid by the Advisor and not the Funds
Pursuant to an Investment Advisory Agreement with the Funds, the Advisor, under the oversight of the Board, directs the daily operations of the Funds and supervises the performance of administrative and professional services provided by others. As compensation for its services and the related expenses borne by the Advisor, the Funds pays the Advisor an investment advisory fee, computed and accrued daily and paid monthly, at an annual rate of 1.25% of the Funds’ average daily net assets. For the year ended December 31, 2021, the Managed Income Fund and the Dynamic Growth Fund paid $7,419,009 and $2,828,517, respectively, in advisory fees.
The Advisor and Sub-Advisor have contractually agreed to waive all or part of its advisory fees (or sub-advisory fees) and/or make payments to limit the expenses of the Managed Income Fund (exclusive of any front-end or contingent deferred loads, taxes, leverage interest, brokerage commissions, expenses incurred in connection with any merger or reorganization, dividend expense on securities sold short, expenses of investing in underlying funds, or extraordinary expenses such as litigation) at least until January 14, 2022 for Class A and April 30, 2022 for Institutional Class so that the total annual operating expenses do not exceed 2.05% and 1.45% (previously 1.55% through January 14, 2021) of the average daily net assets of the Class A and Institutional Class shares of the Managed Income Fund, respectively. Through August 20, 2020, the total annual operating expenses was limited to 2.99% of the average daily nets of the Class C shares of the Managed Income Fund
The Advisor and Sub-Advisor had contractually waived all or part of its advisory fees (or sub-advisory fees) and/or make payments to limit the expenses of the Dynamic Growth Fund (exclusive of any front-end or contingent deferred loads, taxes, leverage interest, brokerage commissions, expenses incurred in connection with any merger or reorganization, dividend expense on securities sold short, expenses of investing in underlying funds, or extraordinary expenses such as litigation) through October 19, 2021, so that the total annual operating expenses did not exceed 2.04%, 2.64% and 1.64% of the average daily net assets of the Class A, Class C and Institutional Class shares of the Dynamic Growth Fund, respectively.
Waivers and expense payments may be recouped by the Advisor and/or Sub-Advisor from a Fund, to the extent that overall expenses fall below the expense limitation, within three years of when the amounts were waived or reimbursed. During the year ended December 31, 2021, the Advisor and Sub-Advisor collectively recaptured fees of $35,854 from the Dynamic Growth Fund.
Ultimus Fund Solutions, LLC (“UFS”), provides administration, fund accounting, and transfer agent services to the Trust. Pursuant to separate servicing agreements with UFS, UFS provides administration, fund accounting and transfer agent services to the Funds. Certain officers of the Trust are also officers of UFS, and are not paid any fees directly by the Funds for serving in such capacities.
In addition, certain affiliates of UFS provide services to the Fund as follows:
23
| Kensington Funds |
| NOTES TO FINANCIAL STATEMENTS (Continued) |
| December 31, 2021 |
BluGiant, LLC (“Blu Giant”), an affiliate of UFS, provides EDGAR conversion and filing services as well as print management services for the Funds on an ad-hoc basis.
The Trust has adopted a Distribution Plan and Agreement (the “Rule 12b-1 Plan”) pursuant to Rule 12b-1 under the 1940 Act for each Fund’s Class A shares pursuant to which the Funds pay fees to Ceros Financial Services, Inc. (“Ceros” or “Distributor”), an affiliate of the Advisor, to provide distribution and/or shareholder services to each Fund. Under the Rule 12b-1 Plan, Class A and Class C shares of the Funds may pay an account maintenance fee for account maintenance services and/or distribution fee at an annual rate of up to 0.25% and 1.00% of the Funds’ average net assets attributable to Class A and Class C shares, respectively, as compensation for the Distributor providing account maintenance and distribution services to shareholders. The Rule 12b-1 Plan is a compensation plan, which means that compensation is provided regardless of 12b-1 expenses incurred. During the year ended December 31, 2021 pursuant to the Rule 12b-1 Plan, the Class A and Class C shares of the Managed Income Fund paid $130,149 and $140,088, respectively, and the Class A and Class C shares of the Dynamic Growth Fund paid $25,289 and $61,324, respectively, which was paid out to brokers and dealers.
The Distributor acts as the Funds’ principal underwriter in a continuous public offering of the Funds’ shares. For the year ended December 31, 2021, the Distributor received $443,228 and $282,184, respectively, in underwriting commissions for sales of shares of the Managed Income Fund and the Dynamic Growth Fund, of which $58,700 and $28,541, respectively, was retained by the principal underwriter.
Each Trustee who is not an “interested person” of the Trust or Advisor is compensated at a rate of $ 50,000 per year plus $2,500 minimum per meeting for certain special meetings, which varies based on the matters submitted, as well as for reimbursement for any reasonable expenses incurred attending the meetings, paid quarterly. The “interested persons” who serve as Trustees of the Trust receive no compensation for their services as Trustees. None of the executive officers receive compensation from the Trust. Interested trustees of the Trust are also officers or employees of the Advisor and its affiliates.
During the year ended December 31, 2021, Ceros, a registered broker/dealer and an affiliate of the Advisor, executed trades on behalf of the Managed Income Fund and Dynamic Growth Fund and received $81,904 and $171,826 in trade commissions, respectively.
| 5. | AGGREGATE UNREALIZED APPRECIATION AND DEPRECIATION – TAX BASIS |
The identified cost of investments in securities owned by the Funds for federal income tax purposes and its respective gross unrealized appreciation and depreciation at December 31, 2021, were as follows:
| Gross Unrealized | Gross Unrealized | Net Unrealized | ||||||||||||||
| Fund | Tax Cost | Appreciation | (Depreciation) | (Depreciation) | ||||||||||||
| Managed Income Fund | $ | 678,726,178 | — | $ | (5,100,259 | ) | $ | (5,100,259 | ) | |||||||
| Dynamic Growth Fund | 375,586,520 | — | (4,544,612 | ) | (4,544,612 | ) | ||||||||||
| 6. | DISTRIBUTIONS TO SHAREHOLDERS AND TAX COMPONENTS OF CAPITAL |
The tax character of fund distributions paid for the year ended December 31, 2021, and period ended December 31, 2020, for the Kensington Funds was as follows:
24
| Kensington Funds |
| NOTES TO FINANCIAL STATEMENTS (Continued) |
| December 31, 2021 |
| For fiscal year ended | Ordinary | Long-Term | Return of | |||||||||||||
| 12/31/2021 | Income | Capital Gains | Capital | Total | ||||||||||||
| Managed Income Fund | $ | 19,935,950 | $ | 2,572,396 | $ | — | $ | 22,508,346 | ||||||||
| Dynamic Growth Fund | 27,672,108 | — | — | 27,672,108 | ||||||||||||
| For fiscal year ended | Ordinary | Long-Term | Return of | |||||||||||||
| 12/31/2020 | Income | Capital Gains | Capital | Total | ||||||||||||
| Managed Income Fund | $ | 5,039,251 | $ | 188,950 | $ | 133,971 | $ | 5,362,172 | ||||||||
| Dynamic Growth Fund | 221,459 | — | — | 221,459 | ||||||||||||
As of December 31, 2021, the components of distributable earnings/(accumulated deficit) on a tax basis were as follows:
| Undistributed | Undistributed | Post October Loss | Capital Loss | Other | Unrealized | Total | ||||||||||||||||||||||
| Ordinary | Long-Term | and | Carry | Book/Tax | Appreciation/ | Accumulated | ||||||||||||||||||||||
| Income | Capital Gains | Late Year Loss | Forwards | Differences | (Depreciation) | Earnings/(Deficits) | ||||||||||||||||||||||
| Managed Income Fund | $ | — | $ | — | $ | (2,104,938 | ) | $ | — | $ | — | $ | (5,100,259 | ) | $ | (7,205,197 | ) | |||||||||||
| Dynamic Growth Fund | 9,124,610 | — | — | — | — | (4,544,612 | ) | 4,579,998 | ||||||||||||||||||||
The difference between book basis and tax basis accumulated net realized gain/(loss) and unrealized appreciation/(depreciation) from investments is primarily attributable to the tax deferral of losses on wash sales.
Capital losses incurred after October 31 within the fiscal year are deemed to arise on the first business day of the following fiscal year for tax purposes. The Kensington Managed Income Fund incurred and elected to defer such capital losses of $2,104,938.
Permanent book and tax differences, primarily attributable to the book/tax basis treatment of distributions in excess, resulted in reclassifications for the Funds for the year ended December 31, 2021, as follows:
| Paid | ||||||||
| In | Distributable Earnings/ | |||||||
| Capital | (Accumulated Losses) | |||||||
| Managed Income Fund | $ | (557,916 | ) | $ | 557,916 | |||
| Dynamic Growth Fund | — | — | ||||||
| 7. | CONTROL OWNERSHIP |
The beneficial ownership, either directly or indirectly, of more than 25% of the voting securities of a fund creates presumption of control of the fund pursuant to Section 2(a)(9) of the 1940 Act. As of December 31, 2021, TD Ameritrade held approximately 31.32% of the Dynamic Growth Fund for the benefit of its customers.
| 8. | INVESTMENTS IN UNDERLYING INVESTMENT COMPANIES |
The Funds currently invest a portion of their assets in First American Government Obligations Fund (“First American”) and the Dynamic Growth Fund currently invests a portion of its assets in iShares 7-10 Year Treasury Bond ETF (“iShares”). The Funds may redeem their investment at any time if the Advisor or Sub-Advisor determines that it is in the best interest of the Funds and its shareholders to do so.
25
| Kensington Funds |
| NOTES TO FINANCIAL STATEMENTS (Continued) |
| December 31, 2021 |
The performance of the Funds will be directly affected by the performance of First American and iShares 7-10 Year Treasury Bond ETF. The financial statements of First American and iShares 7-10 Year Treasury Bond ETF, including the portfolio of investments, can be found at the Securities and Exchange Commission’s website www.sec.gov and should be read in conjunction with the Funds’ financial statements. As of December 31, 2021, the percentage of the Managed Income Fund’s and Dynamic Growth Fund’s net assets invested in First American was 50.1% and 40.0%, respectively; the percentage of the Dynamic Growth fund’s net assets invested in iShares 7-10 Year Treasury Bond ETF was 25.2%.
| 9. | SUBSEQUENT EVENTS |
Subsequent events after the date of the Statements of Assets and Liabilities have been evaluated through the date the financial statements were issued. Management has determined that no events or transactions occurred requiring adjustment or disclosure in the financial statements.
26

REPORT OF INDEPENDENT REGISTERED PUBLIC ACCOUNTING FIRM
To the Board of Trustees of Advisors’ Preferred Trust
and the Shareholders of Kensington Managed Income Fund and
Kensington Dynamic Growth Fund
Opinion on the Financial Statements
We have audited the accompanying statements of assets and liabilities of Kensington Managed Income Fund and Kensington Dynamic Growth Fund, each a series of shares of beneficial interest in Advisors’ Preferred Trust (the “Funds”), including the schedules of investments, as of December 31, 2021, and the related statements of operations and changes in net assets and the financial highlights for the year then ended, and the related notes (collectively referred to as the “financial statements”). In our opinion, the financial statements present fairly, in all material respects, the financial position of the Funds as of December 31, 2021, and the results of their operations, the changes in their net assets and their financial highlights for the year then ended, in conformity with accounting principles generally accepted in the United States of America. The statements of changes in net assets and financial highlights as presented in the table below were audited by other auditors, whose report dated March 1, 2021, expressed an unqualified opinion on such financial statements and financial highlights.
| Fund | Changes In Net Assets and Financial Highlights Presented |
| Kensington Managed Income Fund | The changes in net assets for the year ended December 31, 2020, the financial highlights for Class A and Institutional Class for the year ended December 31, 2020 and for the period from May 28, 2019 (commencement of operations) through December 31, 2019, and the financial highlights for Class C for the year ended December 31, 2020 and for the period from August 27, 2019 (commencement of operations) through December 31, 2019. |
| Kensington Dynamic Growth Fund | The changes in net assets and the financial highlights for the period from October 23, 2020 (commencement of operations) through December 31, 2020. |
27
Basis for Opinion
These financial statements are the responsibility of the Funds’ management. Our responsibility is to express an opinion on the Funds’ financial statements based on our audits. We are a public accounting firm registered with the Public Company Accounting Oversight Board (United States) (“PCAOB”) and are required to be independent with respect to the Funds in accordance with the U.S. federal securities law and the applicable rules and regulations of the Securities and Exchange Commission and the PCAOB.
We conducted our audits in accordance with the standards of the PCAOB. Those standards require that we plan and perform the audits to obtain reasonable assurance about whether the financial statements are free of material misstatement, whether due to error or fraud. The Funds are not required to have, nor were we engaged to perform, an audit of their internal control over financial reporting. As part of our audits we are required to obtain an understanding of internal control over financial reporting but not for the purpose of expressing an opinion on the effectiveness of the Funds’ internal control over financial reporting. Accordingly, we express no such opinion.
Our audits included performing procedures to assess the risk of material misstatement of the financial statements, whether due to error or fraud, and performing procedures that respond to those risks. Such procedures included examining, on a test basis, evidence regarding the amounts and disclosures in the financial statements. Our procedures included confirmation of securities owned as of December 31, 2021 by correspondence with the custodian, brokers, or by other appropriate auditing procedures where replies from brokers were not received. Our audits also included evaluating the accounting principles used and significant estimates made by management, as well as evaluating the overall presentation of the financial statements. We believe that our audits provide a reasonable basis for our opinion.

BBD, LLP
We have served as the auditor of one or more of the Funds in the Advisors’ Preferred Trust since 2021.
Philadelphia, Pennsylvania
February 25, 2022
28
| Kensington Funds |
| EXPENSE EXAMPLE (Unaudited) |
| December 31, 2021 |
As a shareholder of the Kensington Funds, you incur two types of costs: (1) transaction costs including sales charges (loads) on purchase payments; (2) ongoing costs, including management fees; distribution and/or service (12b-1) fees; and other Fund expenses. This example is intended to help you understand your ongoing costs (in dollars) of investing in the Kensington Funds and to compare these costs with the ongoing costs of investing in other mutual funds.
The example is based on an investment of $1,000 invested at the beginning of the period and held for the entire period from July 1, 2021 through December 31, 2021.
Table 1. Actual Expenses
The “Actual Expenses” tables below provide information about actual account values and actual expenses. You may use the information below; together with the amount you invested, to estimate the expenses that you paid over the period. Simply divide your account value by $1,000 (for example, an $8,600 account value divided by $1,000 = 8.6), then multiply the result by the number in the table under the heading entitled “Expenses Paid During Period” to estimate the expenses you paid on your account during this period.
Table 2. Hypothetical Example for Comparison Purposes
The “Hypothetical” tables below provide information about hypothetical account values and hypothetical expenses based on the Funds’ actual expense ratio and an assumed rate of return of 5% per year before expenses, which is not the Fund’s actual return. The hypothetical account values and expenses may not be used to estimate the actual ending account balances or expenses you paid for the period. You may use this information to compare this 5% hypothetical example with the 5% hypothetical examples that appear in the shareholder reports of other funds.
Please note that the expenses shown in the table are meant to highlight your ongoing costs only and do not reflect any transactional costs, such as sales charges (loads), or redemption fees. Therefore, the table is useful in comparing ongoing costs only, and will not help you determine the relative total costs of owning different funds. In addition, if these transactional costs were included, your costs would have been higher.
| Kensington Managed Income Fund | ||||||||||
| Table 1 | ||||||||||
| Annualized | Beginning | Ending Account | ||||||||
| Actual | Expense | Account Value | Value | Expenses Paid During Period * | ||||||
| Expenses | Ratio | 7/1/2021 | 12/31/2021 | 7/1/2021-12/31/2021 | ||||||
| Class A | 1.67% | $1,000.00 | $982.30 | $8.34 | ||||||
| Institutional Class | 1.42% | $1,000.00 | $983.60 | $7.10 | ||||||
| Class C | 2.42% | $1,000.00 | $978.80 | $12.07 | ||||||
| Table 2 | ||||||||||
| Hypothetical | Annualized | Beginning | Ending Account | |||||||
| (5% return before | Expense | Account Value | Value | Expenses Paid During Period * | ||||||
| expenses) | Ratio | 7/1/2021 | 12/31/2021 | 7/1/2021-12/31/2021 | ||||||
| Class A | 1.67% | $1,000.00 | $1,016.79 | $8.49 | ||||||
| Institutional Class | 1.42% | $1,000.00 | $1,018.05 | $7.22 | ||||||
| Class C | 2.42% | $1,000.00 | $1,013.01 | $12.28 | ||||||
| * | Expenses are equal to the average account value over the period, multiplied by the Fund’s annualized expense ratio, multiplied by the number of days in the period (184) divided by the numbers of days in the fiscal year (365). |
29
| Kensington Funds |
| EXPENSE EXAMPLE (Unaudited) (Continued) |
| December 31, 2021 |
| Kensington Dynamic Growth Fund | ||||||||||
| Table 1 | ||||||||||
| Beginning | Ending Account | |||||||||
| Actual | Annualized | Account Value | Value | Expenses Paid During Period * | ||||||
| Expenses | Expense Ratio | 7/1/2021 | 12/31/2021 | 7/1/2021-12/31/2021 | ||||||
| Class A | 1.71% | $1,000.00 | $1,057.20 | $8.87 | ||||||
| Institutional Class | 1.46% | $1,000.00 | $1,057.90 | $7.57 | ||||||
| Class C | 2.46% | $1,000.00 | $1,053.00 | $12.73 | ||||||
| Table 2 | ||||||||||
| Hypothetical (5% | Beginning | Ending Account | ||||||||
| return before | Annualized | Account Value | Value | Expenses Paid During Period * | ||||||
| expenses) | Expense Ratio | 7/1/2021 | 12/31/2021 | 7/1/2021-12/31/2021 | ||||||
| Class A | 1.71% | $1,000.00 | $1,016.59 | $8.69 | ||||||
| Institutional Class | 1.46% | $1,000.00 | $1,017.85 | $7.43 | ||||||
| Class C | 2.46% | $1,000.00 | $1,012.80 | $12.48 | ||||||
| * | Expenses are equal to the average account value over the period, multiplied by the Fund’s annualized expense ratio, multiplied by the number of days in the period (184) divided by the numbers of days in the fiscal year (365). |
30
| Kensington Funds |
| Change in Accountants (Unaudited) |
| December 31, 2021 |
On October 26, 2021, the Audit Committee of Advisors Preferred Trust (“Committee”) appointed and formally engaged BBD, LLP (“BBD”) as the Funds’ independent registered public accounting firm for the fiscal year ending December 31, 2021.
Cohen & Company, Ltd. (“Cohen”) reports on the Funds’ financial statements for the periods prior to December 31, 2021 did not contain an adverse opinion or a disclaimer of opinion, nor were such reports qualified or modified as to uncertainty, audit scope or accounting principles.
During the years or periods ended prior to December 31, 2021, there were no disagreements between the Funds and Cohen on any matter of accounting principles or practices, financial statement disclosure, or auditing scope or procedure, which disagreements, if not resolved to the satisfaction of Cohen, would have caused it to make reference to the subject matter of the disagreement in its report on the financial statements for such period. During the years or periods ended prior to December 31, 2021, there were no reportable events (as defined in Item 304(a)(1)(v) of Regulation S-K).
During the years or periods ended prior to December 31, 2021, neither the Funds nor anyone on its behalf has consulted with Cohen regarding; (i) the application of accounting principles to a specified transaction, either completed or proposed; or the type of audit opinion that might be rendered on the Funds’ financial statements, and neither a written report was provided to the Funds nor oral advice was provided that Cohen concluded was an important factor considered by the Funds in reaching a decision as to any accounting, auditing or financial reporting issue; or (ii) any matter that was the subject of a disagreement (as that term is defined in Item 304 (a)(1)(iv) of Regulation S-K and the related instructions to Item 304 of Regulation S-K) or a reportable event (as that term is defined in Item 304 (a)(1)(v) of Regulation S-K).
31
| Kensington Funds |
| SUPPLEMENTAL INFORMATION (Unaudited) |
| December 31, 2021 |
Independent Trustees
The following table provides information regarding each Trustee who is not an “interested person” of the Trust, as defined in the 1940 Act.
| Name, Address 1 and Year of Birth | Position(s) Held with the Trust | Term of Office/Length of Time Served | Principal Occupation(s) During Past 5 Years | Number of Portfolios in Fund Complex Overseen by Trustee 2 | Other Directorships Held by Trustee |
| Charles R. Ranson Born: 1947 | Trustee | Indefinite, since November 2012 | Principal, Ranson & Associates (business consultancy) (since 2003); | 23 | Northern Lights Fund Trust IV (27 series) (since July 2015) |
| Felix Rivera Born: 1963 | Trustee | Indefinite, since November 2012 | Managing Partner, Independent Channel Advisors, LLC (Consultancy Practice), (since January 2011) | 23 | Centerstone Investors Trust (2 series) (2016-Mar. 2021) BlueArc Multi- Strategy Fund (2014-2017) |
| David Feldman Born: 1963 | Trustee | Indefinite, Since September 2017 | Independent Consultant (since January 2015); Head of Intermediary Sales, Baron Capital Inc., (February 2010 to December 2014) | 23 | None |
| 1 | Unless otherwise specified, the mailing address of each Trustee is c/o Advisors Preferred Trust,1445 Research Blvd., Suite 530, Rockville, MD 20850. |
| 2 | The “Fund Complex” consists of the series of the Trust. |
32
| Kensington Funds |
| SUPPLEMENTAL INFORMATION (Unaudited) (Continued) |
| December 31, 2021 |
Interested Trustees and Officers
The following table provides information regarding each Trustee who is an “interested person” of the Trust, as defined in the 1940 Act, and each officer of the Trust.
| Name, Address 1 And Year of Birth | Position(s) Held with the Fund | Term of Office/ Length of Time Served | Principal Occupation(s) During Past 5 Years | Number of Portfolios in Fund Complex Overseen by Trustee 2 | Other Directorships Held by Trustee |
| Catherine Ayers-Rigsby (3) Born: 1948 | Trustee, Chairman, President | Indefinite; since November 2012 | CEO, Advisors Preferred, LLC (since June 2011); President, Ceros Financial Services, Inc., (since August 2009); President AtCap Partners, LLC (since July 2011) | 23 | None |
| Brian S. Humphrey (4) Born: 1972 | Trustee | Indefinite; since November 2012 | Managing Director, Ceros Financial Services, Inc., (since January 2011) | 23 | None |
| Christine Casares Born: 1975 | Treasurer | Indefinite; since May 2019 | Vice President, Tax Administration, Ultimus Fund Solutions, LLC (since February 2016); Assistant Vice President, Tax Administration (February 2012 January 2016) | N/A | N/A |
| Angela Holland Born 1970 | Chief Compliance Officer | Indefinite; since July 1, 2020 | Chief Compliance Officer, Ceros Financial Services, Inc. (since January 2016); Sales Supervisor/AML Compliance Officer, Ceros Financial Services, Inc. (April 2012 – January 2016); Compliance Manager, Advisors Preferred, LLC (April 2012 to Present); Compliance Manager, AtCap Partners, LLC (since April 2012) | N/A | N/A |
| Richard Malinowski Born: 1983 | Secretary | Indefinite; since November 2012 | Senior Vice President and Senior Managing Counsel, Ultimus Fund Solutions, LLC; (since February 2020); Senior Vice President, Legal Administration, and Counsel (February 2017-January 2019); Vice President and Counsel (April 2016– 2017): and AVP and Staff Attorney (September 2012 – March.2016) | N/A | N/A |
| Jeff Meacham Born: 1976 | Assistant Treasurer | Indefinite, since November 2021 | Trader, Ceros Financial Services, Inc. | N/A | N/A |
| Daniel Gibson Born: 1984 | Assistant Treasurer | Indefinite, since November 2021 | Trader, Ceros Financial Services, Inc. | N/A | N/A |
| 1 | Unless otherwise specified, the address of each Trustee and officer is Advisors Preferred Trust, 1445 Research Blvd., Suite 530, Rockville, MD 20850. |
| 2 | The “Fund Complex” consists of the series of the Trust. |
| 3 | Ms. Ayers-Rigsby is an interested person Trustee because she is an officer of the Trust, an officer of the Trust’s investment adviser, and an officer of the Trust’s principal underwriter. |
| 4 | Mr. Humphrey is an interested person Trustee because he is an officer of the Trust’s principal underwriter. |
The Funds’ Statement of Additional Information includes additional information about the Trustees and is available free of charge by calling toll- free 1-855-375-3060.
33
PRIVACY NOTICE
Rev. May 2014
| FACTS | WHAT DOES ADVISORS PREFERRED TRUST DO WITH YOUR PERSONAL INFORMATION? | |||
| Why? | Financial companies choose how they share your personal information. Federal law gives consumers the right to limit some but not all sharing. Federal law also requires us to tell you how we collect, share, and protect your personal information. Please read this notice carefully to understand what we do. | |||
| What? | The types of personal information we collect and share depend on the product or service you have with us. This information can include: | |||
| ■ | Social Security number | ■ | Purchase History | |
| ■ | Assets | ■ | Account Balances | |
| ■ | Retirement Assets | ■ | Account Transactions | |
| ■ | Transaction History | ■ | Wire Transfer Instructions | |
| ■ | Checking Account Information | |||
| When you are no longer our customer, we continue to share your information as described in this notice. | ||||
| How? | All financial companies need to share customers’ personal information to run their everyday business. In the section below, we list the reasons financial companies can share their customers’ personal information; the reasons Advisors Preferred Trust chooses to share; and whether you can limit this sharing. | |||
| Reasons we can share your personal information | Does Advisors Preferred Trust share? | Can you limit this sharing? |
For our everyday business purposes – such as to process your transactions, maintain your account(s), respond to court orders and legal investigations, or report to credit bureaus | Yes | No |
For our marketing purposes – to offer our products and services to you | No | We don’t share |
| For joint marketing with other financial companies | No | We don’t share |
For our affiliates’ everyday business purposes – information about your transactions and experiences | No | We don’t share |
For our affiliates’ everyday business purposes – information about your creditworthiness | No | We don’t share |
| For nonaffiliates to market to you | No | We don’t share |
| Questions? | Call 1-866-862-9686 |
34
| Who we are | |||||
Who is providing this notice?
| Advisors Preferred Trust | ||||
| What we do | |||||
| How does Advisors Preferred Trust protect my personal information? | To protect your personal information from unauthorized access and use, we use security measures that comply with federal law. These measures include computer safeguards and secured files and buildings.
Our service providers are held accountable for adhering to strict policies and procedures to prevent any misuse of your nonpublic personal information. | ||||
| How does Advisors Preferred Trust collect my personal information? | We collect your personal information, for example, when you
■ Open an account
■ Provide account information
■ Give us your contact information
■ Make deposits or withdrawals from your account
■ Make a wire transfer
■ Tell us where to send the money
■ Tells us who receives the money
■ Show your government-issued ID
■ Show your driver’s license
We also collect your personal information from other companies. | ||||
| Why can’t I limit all sharing? | Federal law gives you the right to limit only ■ Sharing for affiliates’ everyday business purposes – information about your creditworthiness ■ Affiliates from using your information to market to you
■ Sharing for nonaffiliates to market to you
State laws and individual companies may give you additional rights to limit sharing. | ||||
| Definitions | |||||
| Affiliates | Companies related by common ownership or control. They can be financial and nonfinancial companies.
■ Advisors Preferred Trust does not share with our affiliates. | ||||
| Nonaffiliates | Companies not related by common ownership or control. They can be financial and nonfinancial companies. ■ Advisors Preferred Trust does not share with nonaffiliates so they can market to you. | ||||
| Joint marketing | A formal agreement between nonaffiliated financial companies that together market financial products or services to you.
■ Advisors Preferred Trust doesn’t jointly market. | ||||
35
PROXY VOTING POLICY
Information regarding how the Funds voted proxies relating to portfolio securities for the most recent twelve month period ended June 30 as well as a description of the policies and procedures that the Funds use to determine how to vote proxies is available without charge, upon request, by calling 1-855-375-3060 or by referring to the Security and Exchange Commission’s (“SEC”) website at http://www.sec.gov.
PORTFOLIO HOLDINGS
The Funds file their complete schedule of portfolio holdings with the SEC for the first and third quarters of each fiscal year as an exhibit to its reports on Form N-PORT, within sixty days after the end of the period. Form N-PORT reports are available on the SEC’s website at http://www.sec.gov. The information on Form N-PORT is available without charge, upon request, by calling 1-855-375-3060.
| INVESTMENT ADVISOR |
| Advisors Preferred LLC |
| 1445 Research Blvd., Suite 530 |
| Rockville, MD 20850 |
| SUB-ADVISOR |
| Kensington Asset Management LLC |
| 3811 Bee Caves Road, Suite 210 |
| Austin, TX 78746 |
| ADMINISTRATOR |
| Ultimus Fund Solutions, LLC |
| 225 Pictoria Drive, Suite 450 |
| Cincinnati, OH 45246 |
| KENSGTN-AR21 |
(b) Not applicable.
Item 2. Code of Ethics.
(a) As of the end of the period covered by this report, the registrant has adopted a code of ethics that applies to the registrant's principal executive officer, principal financial officer, principal accounting officer or controller, or persons performing similar functions, regardless of whether these individuals are employed by the registrant or a third party.
(b) For purposes of this item, “code of ethics” means written standards that are reasonably designed to deter wrongdoing and to promote:
| (1) | Honest and ethical conduct, including the ethical handling of actual or apparent conflicts of interest between personal and professional relationships; |
| (2) | Full, fair, accurate, timely, and understandable disclosure in reports and documents that a registrant files with, or submits to, the Commission and in other public communications made by the registrant; |
(3) Compliance with applicable governmental laws, rules, and regulations;
| (4) | The prompt internal reporting of violations of the code to an appropriate person or persons identified in the code; and |
(5) Accountability for adherence to the code.
(c) Amendments: During the period covered by the report, there have not been any amendments to the provisions of the code of ethics.
(d) Waivers: During the period covered by the report, the registrant has not granted any express or implicit waivers from the provisions of the code of ethics.
(e) The Code of Ethics is not posted on Registrant’ website.
(f) A copy of the Code of Ethics is attached as an exhibit.
Item 3. Audit Committee Financial Expert.
| (a) | The Registrant’s board of trustees has determined that Felix Rivera is the audit committee financial expert, as defined in Item 3 of Form N-CSR. Mr. Rivera is independent for purposes of this Item 3. |
Item 4. Principal Accountant Fees and Services.
| (a) | Audit Fees |
2021 - $27,000
2020 - $21,500
| (b) | Audit-Related Fees |
2021 – None
2020 – None
| (c) | Tax Fees |
2021 - $6,000
2020 - $5,500
Preparation of Federal & State income tax returns, assistance with calculation of required income, capital gain and excise distributions and preparation of Federal excise tax returns.
| (d) | All Other Fees |
2021 – None
2020 – None
| (e) | (1) Audit Committee’s Pre-Approval Policies |
The registrant’s Audit Committee is required to pre-approve all audit services and, when appropriate, any non-audit services (including audit-related, tax and all other services) to the registrant. The registrant’s Audit Committee also is required to pre-approve, when appropriate, any non-audit services (including audit-related, tax and all other services) to its adviser, or any entity controlling, controlled by or under common control with the adviser that provides ongoing services to the registrant, to the extent that the services may be determined to have an impact on the operations or financial reporting of the registrant. Services are reviewed on an engagement by engagement basis by the Audit Committee.
| (2) | Percentages of Services Approved by the Audit Committee |
| 2021 | 2020 | |||||||
| Audit-Related Fees: | 100 | % | 100 | % | ||||
| Tax Fees: | 100 | % | 100 | % | ||||
| All Other Fees: | 100 | % | 100 | % | ||||
| (f) | During the audit of registrant's financial statements for the most recent fiscal year, less than 50 percent of the hours expended on the principal accountant's engagement were attributed to work performed by persons other than the principal accountant's full-time, permanent employees. |
| (g) | The aggregate non-audit fees billed by the registrant's accountant for services rendered to the registrant, and rendered to the registrant's investment adviser (not including any sub-adviser whose role is primarily portfolio management and is subcontracted with or overseen by another investment adviser), and any entity controlling, controlled by, or under common control with the adviser that provides ongoing services to the registrant: |
2021 - $6,000
2020 - $5,500
(h) The registrant's audit committee has considered whether the provision of non-audit services to the registrant's investment adviser (not including any sub-adviser whose role is primarily portfolio management and is subcontracted with or overseen by another investment adviser), and any entity controlling, controlled by, or under common control with the investment adviser that provides ongoing services to the registrant, that were not pre-approved pursuant to paragraph (c)(7)(ii) of Rule 2-01 of Regulation S-X, is compatible with maintaining the principal accountant's independence.
Item 5. Audit Committee of Listed Companies. Not applicable to open-end investment companies.
Item 6. Schedule of Investments. Schedule of investments in securities of unaffiliated issuers is included under Item 1.
Item 7. Disclosure of Proxy Voting Policies and Procedures for Closed-End Funds. Not applicable to open-end investment companies.
Item 8. Portfolio Managers of Closed-End Management Investment Companies. Not applicable to open-end investment companies.
Item 9. Purchases of Equity Securities by Closed-End Funds. Not applicable to open-end investment companies.
Item 10. Submission of Matters to a Vote of Security Holders. Vote of security holders is included under item 1.
Item 11. Controls and Procedures.
(a) Based on an evaluation of the Registrant’s disclosure controls and procedures as of a date within 90 days of filing date of this Form N-CSR, the principal executive officer and principal financial officer of the Registrant have concluded that the disclosure controls and procedures of the Registrant are reasonably designed to ensure that the information required in filings on Form N-CSR is recorded, processed, summarized, and reported by the filing date, including that information required to be disclosed is accumulated and communicated to the Registrant’s management, including the Registrant’s principal executive officer and principal financial officer, as appropriate to allow timely decisions regarding required disclosure.
(b) There were no significant changes in the Registrant’s internal control over financial reporting that occurred during the Registrant’s last fiscal half-year that have materially affected, or are reasonably likely to materially affect, the Registrant’s internal control over financial reporting.
Item 12. Disclosure of Securities Lending Activities for Closed-End Management Investment Companies. Not applicable.
Item 13. Exhibits.
(a)(1) Code of Ethics filed herewith.
(a)(3) Not applicable for open-end investment companies.
SIGNATURES
Pursuant to the requirements of the Securities Exchange Act of 1934 and the Investment Company Act of 1940, the registrant has duly caused this report to be signed on its behalf by the undersigned, thereunto duly authorized.
(Registrant) Advisors Preferred Trust
By (Signature and Title)
/s/ Catherine Ayers-Rigsby
Catherine Ayer-Rigsby, President/Principal Executive Officer
Date 3/4/22
Pursuant to the requirements of the Securities Exchange Act of 1934 and the Investment Company Act of 1940, this report has been signed below by the following persons on behalf of the registrant and in the capacities and on the dates indicated.
By (Signature and Title)
/s/Catherine Ayers-Rigsby
Catherine Ayers-Rigsby, President/Principal Executive Officer
Date 3/4/22
By (Signature and Title)
/s/ Christine Casares
Christine Casares, Treasurer/Principal Financial Officer
Date 3/4/22