UNITED STATES
SECURITIES AND EXCHANGE COMMISSION
Washington, D.C. 20549
FORM N-CSR
CERTIFIED SHAREHOLDER REPORT OF REGISTERED
MANAGEMENT INVESTMENT COMPANIES
Investment Company Act file number: 811-22747
ALPS SERIES TRUST
(Exact name of registrant as specified in charter)
1290 Broadway, Suite 1100, Denver, Colorado 80203
(Address of principal executive offices) (Zip code)
303.623.5277
(Registrant’s telephone number, including area code)
Richard C. Noyes, Esq., Secretary
ALPS Series Trust
1290 Broadway, Suite 1100
Denver, CO 80203
(Name and address of agent for service)
Date of fiscal year end: September 30
Date of reporting period: October 1, 2017 – September 30, 2018
Item 1. Reports to Stockholders.
Table of Contents
| Shareholder Letter | 1 |
| Portfolio Updates | 3 |
| Disclosure of Fund Expenses | 11 |
| Portfolio of Investments | 12 |
| Statements of Assets and Liabilities | 19 |
| Statements of Operations | 20 |
| Statements of Changes in Net Assets | 22 |
| Financial Highlights | 24 |
| Notes to Financial Statements | 28 |
| Report of Independent Registered Public Accounting Firm | 38 |
| Additional Information | 39 |
| Privacy Policy | 42 |
| Trustees & Officers | 44 |
| American Independence Funds | Shareholder Letter |
September 30, 2018 (Unaudited)
Dear Shareholder,
We are pleased to present you with the Annual Report for the American Independence Global Tactical Allocation Fund and the American Independence Kansas Tax-Exempt Bond Fund (each a “Fund” and collectively “Funds”) for the year ended September 30, 2018. The Annual Report period is a shorter period as a result of the reorganization of the Funds into a series of ALPS Series Trust (“AST”).
In the fiscal 11 months, we’ve seen the strongest corporate profits in seven years, which drove the drove the equity market higher, while volatility dramatically increased in February, and continued rising interest rates constrained bond returns. Though the market’s appetite for risk remained, it was moderated as risk-taking was tempered somewhat, as shorter term, higher quality securities led the bond market and U.S. equities outperformed most international stock markets.
Relatively strong equity performance worldwide was driven by synchronized economic growth across the most influential economies and industry sectors. However, volatility around the globe rose, as U. S. and China trade relations and debt concerns weighed heavily on stock markets.
In addition, the following factors were of concern: (i) there were increased tensions between the U.S. and China that affected the Chinese stock market, (ii) Turkey became embroiled in a currency crisis shortly after the end of the reporting period, and (iii) Brexit concerns and uncertainties remain in the market.
In terms of interest rates, short-term interest rates for U.S. Treasuries rose the fastest, while longer-term rates slightly increased, heading to a negative return for long-term U.S. Treasuries and a substantial flattening of the yield curve. As discussed by industry commentators, many investors are concerned that the flattening of the yield curve is as a harbinger of a possible recession. But, given the extraordinary monetary measures and fiscal policy in the last decade, we believe a more accurate barometer of the economy are returns along the “risk spectrum” in stock and bond markets. Although the fundamentals in credit markets remained relatively solid, investment grade bonds declined slightly, and high-yield and tax-exempt bonds posted moderate returns.
In response to rising growth inflation, the U.S. Federal Reserve (“Fed”) increased short-term interest rates four times during the reporting period. Meanwhile, the European Central Bank announced a bond purchase program that would conclude at year end of 2018, while also expressing its commitment to low interest rates. In contrast, the Bank of Japan continued to expand its balance sheet through bond purchasing while lowering its expectation for inflation.
The U.S. economy continued to gain momentum despite the Fed’s reduction of economic stimulus. The national unemployment rate has continued to decline, with wages increasing and the number of job openings reaching record highs.
While U.S. monetary policy is seeking to restrain growth and inflation, fiscal policy has produced new sources of growth that could nourish the economy for the next few years. Corporate tax cuts and lower individual tax cuts could encourage the robust job market and refresh consumer spending.
We continue to believe the primary risks to economic expansion are trade protectionism, rapidly rising interest rates, and geo-political tensions. Given the deflationary forces of technology and globalization, we are encouraged. In this environment, investors need to think globally, extend their scope of diversification across an array of asset classes and be nimble with downside protection products.
We encourage you to talk to your financial advisor for further insights about investing in today’s markets.
As always, our mission is to continue to provide quality investment outcomes for clients and shareholders. The Funds’ sub-advisers bring expertise in significant disciplines – including macroeconomics, behavioral finance, and asset allocations using Exchange Traded Funds (ETFs) – to provide a unique lineup of investment solutions for shareholders, advisors, and institutions.
Portfolio reviews written by each sub-adviser follow this letter.
Thank you for your continued support.
Sincerely,
Jane A. Kanter
Managing Partner and Chief Counsel
Manifold Partners LLC
| Annual Report | September 30, 2018 | 1 |
| American Independence Funds | Shareholder Letter |
September 30, 2018 (Unaudited)
Basis Points: One hundredth of one percent.
Yield Curve: a line that plots the interest rates, at a set point in time, of bonds having equal credit quality but differing maturity dates.
Diversification does not eliminate the risk of experiencing investment losses.
The views and information discussed in this commentary are as of the date of publication, are subject to change, and may not reflect the writer’s current views. The views expressed are those of the Adviser only, and represent an assessment of market conditions at a specific point in time, are opinions only and should not be relied upon as investment advice regarding a particular investment or markets in general. Such information does not constitute a recommendation to buy or sell specific securities or investment vehicles. It should not be assumed that any investment will be profitable or will equal the performance of the fund(s) or any securities or any sectors mentioned in this letter. The subject matter contained in this letter has been derived from several sources believed to be reliable and accurate at the time of compilation. Neither the Fund nor the Adviser accepts any liability for losses either direct or consequential caused by the use of this information.
Not FDIC Insured – No Bank Guarantee – May Lose Value
Past performance does not guarantee future results.
ALPS Distributors, Inc. is not affiliated with Manifold Partners LLC, the investment adviser to the Funds.
| 2 | www.americanindependence.com |
| American Independence Global Tactical Allocation Fund | Portfolio Update |
September 30, 2018 (Unaudited)
2018 Commentary
The Institutional Class of the American Independence Global Tactical Allocation Fund (“GTA Fund” or “Fund”) returned 1.53% for the 11-month fiscal year ended September 30, 2018. Over the same period, the GTA Fund’s benchmark, the MSCI All Country World Index (“MSCI ACWI”), returned 7.54% and the Blended Benchmark (a monthly rebalanced mix comprised of 60% of the MSCI ACWI and 40% of the Bloomberg Barclays US Aggregate Bond Index) returned 4.03%.
The GTA Fund invests in equities and fixed income, targeting exposures in five regions for equities as well as global and domestic fixed income indices. It uses a quantitative model to determine the portfolio balances among these asset classes that best fits the current market climate. All non-cash positions are invested in exchange traded funds (“ETFs”), which gives the GTA Fund significant flexibility in terms of low-cost asset allocation.
Year in Review
Fiscal 2018 was notably a transition year for the markets, and it was also a transition year for the management of the Fund. As of January 19, 2018, Manifold Fund Advisors, LLC (“MFA”), the prior adviser to the Fund, assumed sole responsibility for the management of the Fund and the prior sub-adviser to the Fund continued to provide advice to MFA as to the management of the Fund on an interim basis. As of March 24, 2018, MFA managed the Fund without advice from the Fund’s prior sub-adviser and began to accept research suggestions and trading signals from Lee Capital Management (“LCM”). On September 24, 2018, LCM assumed the role of sub-adviser to the Fund, in connection with the reorganization of the Fund as a series of ALPS Series Trust, and Manifold Partners LLC became the adviser to the Fund. Management of the Fund’s assets did not change as a result of the reorganization of the Fund into the ALPS Series Trust, and the GTA Fund continues to have substantially the same objective, strategies and risks as it did prior to the reorganization.
On the market side, the last several years’ relatively tranquil appreciation in global equities, supported by historically low capital market interest rates, persisted through January of 2018. However, that benign environment gave way for the rest of the fiscal year to higher bond yields and elevated equity volatility as central banks in major economies around the world went about removing, or making preparations to remove, the extraordinary monetary stimulus that was put in place following the global financial crisis of 2008. In early February, the accumulated increases in interest rates and anticipation of further monetary policy tightening led to a major spike of volatility. This ushered in declines in domestic and global equity markets that persisted for over two months; the start of the decline coincided with the start of Jerome Powell’s tenure as chairman of the Federal Reserve. Evidence of ebbing speculative enthusiasm was exhibited by dramatic (and widely reported) reversals in the prices of crypto-currencies such as Bitcoin, and later disclosure that margin borrowing in January (reported by U.S. securities dealers) had peaked at a level that exceeded the previous record (dating back to early 2000) before backing down as the markets declined.
November 2017 to March 2018
The Fund’s positioning at the start of the fiscal year showed relative caution, particularly with respect to bond yields, with 10% set aside as a cash cushion, 35% in fixed income, and 50% in equities (evenly split between domestic and international). Over the three months leading up to February’s selloff, equity exposure crept up to 55%, but the defensive “alternatives” allocation was doubled from 5% to 10% by adding diversified commodity exposure to the Fund’s longstanding position in gold, while the fixed income exposure and cash buffer were reduced to 30% and 5%, respectively.
What became clear during the February selloff was that the Fund’s fixed income allocation was no longer providing a defensive ballast to the portfolio’s equity positions. This challenge to maintaining stable performance through a relatively steady balance of stocks and bonds was exacerbated by the lackluster (or worse) performance of other “defensive” positions, in gold and other commodities. Based on guidance and advice from LCM, in late March, the Fund’s allocation to equity securities was significantly increased and all fixed income and alternatives holdings in the Fund were sold. The Fund’s new 75% equity allocation was split between 45% domestic and 30% international, and cash was raised to 25%, effectively assuming the defensive role formerly played by fixed income and alternatives. This repositioning of the Fund’s assets resulted in the realization of capital gains by the Fund, which will be passed through to the Fund’s shareholders.
Fund Changes
In addition to the changes to the Fund’s portfolio described above, there were some other changes to the Fund’s investments, although the objective, strategy, goals and restrictions of the Fund remained constant. The two most significant changes are that (i) the Fund no longer utilized alternative investments (such as commodities) and (ii) positions in the Fund would no longer be updated on a fixed monthly schedule. In contrast to the prior methodology’s monthly allocation procedure, the Fund’s new approach continually reviews market developments, meaning that the Fund can rebalance holdings on any day, as needed. This decision to engage in more frequent trading also contributed to more portfolio turnover and increased trading costs and tax consequences.
| Annual Report | September 30, 2018 | 3 |
| American Independence Global Tactical Allocation Fund | Portfolio Update |
September 30, 2018 (Unaudited)
LCM believes that although risky assets, such as fixed income and equity, are almost certainly profitable in the long run, there are periods in which the risk of certain assets is not justified. During these periods, LCM seeks to reallocate in favor of other asset classes or cash.
April 2018 to September 2018
There was a consistent underweight in the Fund to fixed income securities throughout the final six months of the Fund’s fiscal year. Only briefly, for a few days in early July, did the portfolio approach its normal (calm market) fixed income weight of 40%. On average, the fixed income weight was just under 19% for the six months ended September 30, 2018.
In general, this was a successful positioning, as the Bloomberg Barclays US Aggregate was close to flat over the period (down -0.14%) while equities rose sharply (S&P 500 up 12.95%, MSCI All Country World up 5.22%).
In contrast, the US equity allocation for the Fund, although variable, averaged under its normal weighting of 30% for US equity securities, at 25% for the six months, reached its allowed maximum of 45% in April and went as low as just over 14% in early August.
Although a larger allocation of the GTA Fund’s assets to US equity securities would have been more beneficial to the Fund, LCM believes that the significant exposure to US stocks had a positive impact on performance.
Emerging Market and Asia ex-Japan equity securities both spent April through July at or above their normal weightings of 6%. Then, in early and mid-August, as “trade war” concerns began to weigh heavily on export-driven economies, the Fund reduced its allocations to assets in both of those jurisdictions to approximately 1% of the portfolio, where both remained through September.
As measured by the MSCI Pacific ex-Japan Index, Asia ex-Japan equities gained 1.81% over the April-July (inclusive) period, and then fell -2.42% in August and September. The MSCI Emerging Markets Index declined in both periods, by -5.64% and -3.16% respectively.
The remaining equity asset classes, Japan and developed Europe, spent nearly the entire April to September period fully invested, with weightings between their normal targets and their maximums. The MSCI Japan Index gained 1.61% over the six months, while the MSCI Europe was almost perfectly flat, losing -0.03%.
Except for a brief period in early April, the Fund held meaningful cash positions throughout April to September, reaching a peak of over 40% in late May, and averaging approximately 20% throughout the period. Much of this cash holding was due to the underweighting of fixed income securities in the Fund, although it could also be said that had LCM’s view been more positive on equities, cash holdings would have been smaller. Relative to fixed income, the cash positioning had a neutral effect on performance, while relative to equity it was largely a drag.
LCM’s Outlook
As the fourth calendar quarter begins, LCM believes that storm clouds are gathering on the horizon. Central banks worldwide seem to have become comfortable with tightening what had been notably lax and long-standing monetary policy. Fixed income markets appear to be settling in for years of rate increases.
Non-US equity appears to be under pressure. In Europe, Italian political and budgetary woes weigh heavily, and a disaster-averting Brexit deal continues to be elusive. Asia and Emerging markets are threatened by trade disputes with the United States.
LCM believes that the US equity market remains the only bright spot, and then partially by elimination. There are certainly reasons to suspect that the almost decade long bull market is showing its age. Media talk of “peak earnings” underlines the unspecific feeling that this is as good as it gets, that conditions cannot improve further so can only deteriorate.
LCM’s outlook for the coming fiscal year is the same as its outlook for most years: cautious optimism. Markets are more likely to be higher in a year than lower, but the wise investor understands that there are no guarantees and stands ready to exit if conditions make a turn for the worse.
| 4 | www.americanindependence.com |
| American Independence Global Tactical Allocation Fund | Portfolio Update |
September 30, 2018 (Unaudited)
| Average Annual Total Returns (as of September 30, 2018) | ||||
| 1 Year | 3 Year | 5 Year | Since Inception* | |
| American Independence Global Tactical Allocation Fund - Institutional Class | 2.81% | 7.81% | 5.89% | 5.69% |
| American Independence Global Tactical Allocation Fund - Class A | 2.38% | 7.43% | 5.50% | 5.31% |
| MSCI All Country World Index(a) | 9.77% | 13.40% | 8.67% | 8.33% |
| 60% MSCI ACWI / 40% Bloomberg Barclays US Agg Bond Index(b) | 5.35% | 8.53% | 6.15% | 5.99% |
The performance data quoted above represents past performance. Past performance is not a guarantee of future results. Investment return and value of the Fund shares will fluctuate so that an investor’s shares, when sold or redeemed, may be worth more or less than their original cost. Performance may be lower or higher than performance data quoted. Fund performance current to the most recent month-end is available by calling (833) 287-7933 or by visiting www.americanindependence.com.
| * | The Fund commenced operations on September 20, 2013. The Predecessor Fund, American Independence JAForlines Global Tactical Allocation Fund, managed by Manifold Fund Advisors, LLC, was reorganized into the American Independence Global Tactical Allocation Fund on September 24, 2018. Manifold Partners, LLC has been the Fund’s investment adviser since September 24, 2018, with Lee Capital Management, L.P. serving as sub-adviser. Fund performance prior to September 24, 2018 is reflective of the past performance of the Predecessor Fund. |
| (a) | The MSCI All Country World Index (“ACWI”) is a free float-adjusted market capitalization weighted index that is designed to measure the equity market performance of developed and emerging markets. The MSCI ACWI consists of 46 country indexes comprising 23 developed and 23 emerging market country indexes. |
| (b) | The Bloomberg Barclays U.S. Aggregate Bond Index is a broad-based benchmark that measures the investment grade, U.S. dollar-denominated, fixed-rate taxable bond market, including Treasuries, government-related and corporate securities, MBS (agency fixed-rate and hybrid ARM pass-throughs), ABS, and CMBS (agency and non-agency). The index is not actively managed and does not reflect any deductions for fees, expenses or taxes. |
Returns of less than 1 year are cumulative.
Indices are not actively managed and do not reflect deduction for fees, expenses or taxes. An investor cannot invest directly in an index.
The returns shown above do not reflect the deduction of taxes a shareholder would pay on Fund distributions or redemption of Fund shares.
The total annual operating expenses and total annual operating expenses after fee waivers and/or reimbursement you may pay as an investor in the Fund’s Institutional Class and Class A shares (as reported in the September 24, 2018 Prospectus) are 1.44% and 1.27% and 1.69% and 1.52%, respectively. The Fund’s investment adviser has contractually agreed to limit expenses through January 31, 2021.
Performance of $3,000,000 Initial Investment (as of September 30, 2018)

The graph shown above represents historical performance of a hypothetical investment of $3,000,000 in the Institutional Class. Due to differing expenses, performance of Class A will vary. Past performance does not guarantee future results. Returns do not reflect the deduction of fees, sales charges, or taxes that a shareholder would pay on Fund distributions or the redemption of Fund shares.
| Annual Report | September 30, 2018 | 5 |
| American Independence Global Tactical Allocation Fund | Portfolio Update |
September 30, 2018 (Unaudited)
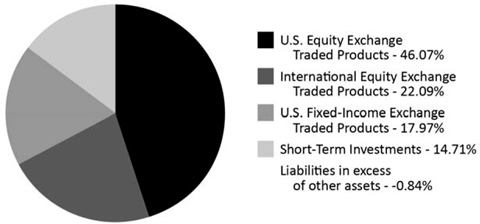
Portfolio Diversification (% of Net Assets as of September 30, 2018)
| 6 | www.americanindependence.com |
| American Independence Kansas Tax-Exempt Bond Fund | Portfolio Update |
September 30, 2018 (Unaudited)
2018 Commentary
2018 will likely be defined by several factors, including (i) much-improved economic conditions, (ii) record low unemployment, (iii) increasing wage growth, and (iv) rising U.S. interest rates. However, many questions remain unanswered including how far will the Federal Reserve (Fed) raise short-term interest rates year and what steps may be taken to achieve the Fed’s goal of “normalization”? Will these Fed moves create an “inverted” yield curve? And, ultimately, will a meaningful rise in interest rates bring an end to the U.S. equity markets’ 9-year bull run?
There have been a handful of noticeable “fits and starts” to U.S. equity markets so far this calendar year. Over that time, interest rates have tended to grind higher, albeit slowly. The yield on the 10- year U.S. Treasury Bond ended both fiscal 2017 and calendar 2017 at a yield of about 2.40% and was approximately 65 basis points higher (3.05%) at the end of September 2018. The 2-year to 10-year yield spread for U.S. Treasuries stood at just +25 basis points, close to its tightest this year.
Municipal bond yields tended to drift higher in sympathy with U.S. Treasuries. However, the municipal bond market has historically been driven more by supply and demand dynamics, than by interest rates specifically. Municipal bond new issuance set records in the fourth quarter of 2017 due to forward looking uncertainty about advance refundings [Pre Res] and marginal tax rates. The supply in 2018 has been relatively modest - far below annual averages – while demand has remained robust. Thus, municipal bonds have tended to be “rich” compared to U.S. Treasuries (lower yields relative to Treasuries than historical averages), especially in the short-end of the yield curve (inside 5 years). The 2-year-to 10-year spread in municipal bonds at the end of the third quarter of 2018 was much wider than that for U.S. Treasuries at +65 basis points.
In 2018, rating agencies such as Moody’s and S&P both issued reports noting solid improvements to municipal credit at the state and local levels, with the recovery in property values, higher tax receipts, increased reserves, stable direct debt, and accelerating economic growth all key factors.
In Kansas, the challenges to the various local economies mirror many of those at the national level, with “trade wars” and tariffs now taking center stage. Unemployment across the state has fallen to 3.3% with major strides coming specifically from nonfarm employment.
Unemployment Rate – State of Kansas [through 09/30/18]
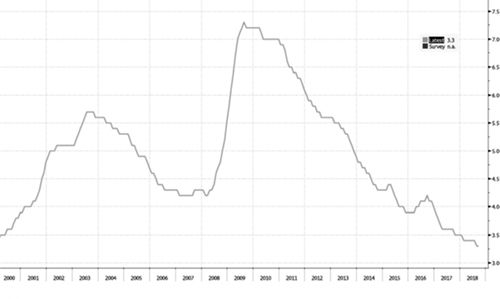
Source: Bloomberg
The Kansas manufacturing sector has been a bright spot so far in 2018. Export sales in transportation and food products were major contributors, as were higher soybean exports. One thing to note: agriculture, while still a solid contributor to Gross Domestic Product ("GDP"), has decreased by over 40% over the last 5 years.
There is growing concern that tariffs might dampen productivity, and cause wages and personal income growth to stagnate. In late July, the Federal Reserve Bank of Kansas City’s monthly manufacturing survey reported strong activity and increased optimism, while labor shortages and tariffs remained top-of-mind.
Annual Report | September 30, 2018 | 7 |
American Independence Kansas | Portfolio Update |
September 30, 2018 (Unaudited)
One important issue to note is the state’s budget deficit. Kansas will continue to battle potential spending cuts, while trying to keep K-12 education funding a top priority. Thus, we would expect school districts across the state to continue to issue municipal bonds for that funding.
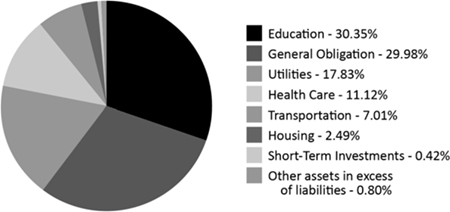
The Kansas Tax-Exempt Bond Fund focuses on preservation of capital while producing cash flows that are fully exempt from Federal taxes and Kansas state tax. The Fund continues to seek premium coupon general obligation (GO) and essential service revenue bonds in the investment grade rating category. Representative bond issues in the Fund include Kansas Department of Transportation Revenue, City of Wichita GO, Topeka Utility Revenue, Kansas Department of Finance Authority Revenue, and Wichita Water & Sewer Revenue. The Fund’s largest sector allocations are to School Districts (21%), Pre-Refunded bonds (16%), Utility Revenue bonds (13%), and General Obligation bonds (11%).
The Fund’s modified duration is 4.35 years, which is slightly longer than a year ago. We may look to alter the Fund’s duration over the next several quarters should value-added opportunities arise. The Fund holds 179 different bond issues, and over 60% of those are rated AA or better. The Institutional Share Class (I shares) return was essentially unchanged over the 12 month period ending September 30, 2018. Over this same time period, however, the Barclays Capital 7 year Municipal Bond Index returned a negative -0.59%. Over a 5-year time horizon, the I shares returned an average of 2.76% (annualized), compared to the comparable Barclays Index 2.62% annual average return.
The Fund did not employ any derivative investments during the fiscal year ending September 30, 2018.
8 | www.americanindependence.com |
American Independence Kansas | Portfolio Update |
September 30, 2018 (Unaudited)
| Average Annual Total Returns (as of September 30, 2018) | ||||||||||||||||
| 1 Year | 5 Year | 10 Year | Since Inception* | |||||||||||||
| American Independence Kansas Tax | ||||||||||||||||
| Exempt Bond Fund - Institutional Class | 0.00% | 2.76% | 3.63% | 4.50% | ||||||||||||
| American Independence Kansas Tax | ||||||||||||||||
| Exempt Bond Fund – Class A | -0.39% | 2.37% | 3.23% | 4.16% | ||||||||||||
| Bloomberg Barclays US Municipal | ||||||||||||||||
| Bond: 7 Year (6-8) Index(a) | -0.59% | 2.62% | 4.20% | 2.43% | ||||||||||||
The performance data quoted above represents past performance. Past performance is not a guarantee of future results. Investment return and value of the Fund shares will fluctuate so that an investor’s shares, when sold or redeemed, may be worth more or less than their original cost. Performance may be lower or higher than performance data quoted. Fund performance current to the most recent month-end is available by calling (833) 287-7933 or by visiting www.americanindependence.com.
| * | The Fund commenced operations on May 22, 2007. The Predecessor Fund, American Independence Kansas Tax-Exempt Bond Fund, managed by Manifold Fund Advisors, LLC, was reorganized into the American Independence Kansas Tax-Exempt Bond Fund on September 24, 2018. Manifold Partners, LLC has been the Fund’s investment adviser since September 24, 2018, with Carret Asset Management, LLC serving as sub-adviser. Fund performance prior to September 24, 2018, is reflective of the past performance of the Predecessor Fund. |
| (a) | The Bloomberg Barclays 7-Year Municipal Bond Index is a total return performance benchmark for the investment-grade, geographically unrestricted 7-year tax-exempt bond market, consisting of municipal bonds with maturities of 6 to 8 years. |
Returns of less than 1 year are cumulative.
Indices are not actively managed and do not reflect deduction for fees, expenses or taxes. An investor cannot invest directly in an index.
The returns shown above do not reflect the deduction of taxes a shareholder would pay on Fund distributions or redemption of Fund shares.
The total annual operating expenses and total annual operating expenses after fee waivers and/or reimbursement you may pay as an investor in the Fund’s Institutional Class and Class A shares (as reported in the September 24, 2018 Prospectus) are 0.57% and 0.48% and 0.82% and 0.73%, respectively. The Fund’s investment adviser has contractually agreed to limit expenses through January 31, 2021.
Performance of $3,000,000 Initial Investment (as of September 30, 2018)
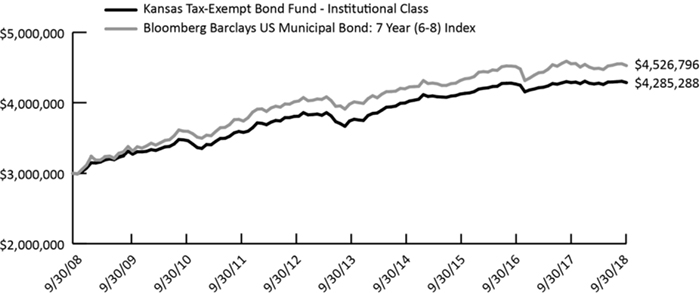
The graph shown above represents historical performance of a hypothetical investment of $3,000,000 in the Institutional Class. Due to differing expenses, performance of Class A will vary. Past performance does not guarantee future results. Returns do not reflect the deduction of fees, sales charges, or taxes that a shareholder would pay on Fund distributions or the redemption of Fund shares.
Annual Report | September 30, 2018 | 9 |
American Independence Kansas | Portfolio Update |
September 30, 2018 (Unaudited)
Portfolio Diversification (% of Net Assets as of September 30, 2018)
10 | www.americanindependence.com |
American Independence Funds | Disclosure of Fund Expenses |
September 30, 2018 (Unaudited)
Examples. As a shareholder of the American Independence Global Tactical Allocation Fund or American Independence Kansas Tax-Exempt Bond Fund, you incur two types of costs: (1) transaction costs, including applicable redemption fees; and (2) ongoing costs, including management fees, distribution and service (12b-1) fees and other Fund expenses. The following examples are intended to help you understand your ongoing costs (in dollars) of investing in the Fund and to compare these costs with the ongoing costs of investing in other mutual funds. The examples are based on an investment of $1,000 invested on April 1, 2018 and held through September 30, 2018.
Actual Expenses. The first line under each class in the table below provides information about actual account values and actual expenses. You may use the information in this line, together with the amount you invested, to estimate the expenses that you paid over the period. Simply divide your account value by $1,000 (for example, an $8,600 account value divided by $1,000 = 8.6), then multiply the result by the number in the first line under the heading “Expenses Paid During Period April 1, 2018 – September 30, 2018” to estimate the expenses you paid on your account during this period.
Hypothetical Example for Comparison Purposes. The second line under each class in the table below provides information about hypothetical account values and hypothetical expenses based on each Fund’s actual expense ratio and an assumed rate of return of 5% per year before expenses, which is not each Fund’s actual return. The hypothetical account values and expenses may not be used to estimate the actual ending account balance or expenses you paid for the period. You may use this information to compare the ongoing costs of investing in each Fund and other mutual funds. To do so, compare this 5% hypothetical example with the 5% hypothetical examples that appear in the shareholder reports of the other funds.
Please note that the expenses shown in the table are meant to highlight your ongoing Fund costs only and do not reflect any transactional costs, such as redemption fees. Therefore, the second line under each class in the table below is useful in comparing ongoing costs only and will not help you determine the relative total costs of owning different funds. In addition, if these transactional costs were included, your costs would have been higher.
| Beginning Account Value April 1, 2018 | Ending Account Value September 30, 2018 | Expense Ratio(a) | Expenses Paid During Period April 1, 2018 - September 30, 2018(b) | |
| American Independence Global Tactical Allocation Fund | ||||
| Institutional Class | ||||
| Actual | $ 1,000.00 | $999.20 | 1.11% | $5.56 |
| Hypothetical (5% return before expenses) | $ 1,000.00 | $1,019.50 | 1.11% | $5.62 |
| Class A | ||||
| Actual | $ 1,000.00 | $996.60 | 1.49% | $7.46 |
| Hypothetical (5% return before expenses) | $ 1,000.00 | $1,017.60 | 1.49% | $7.54 |
| American Independence Kansas Tax-Exempt Bond Fund | ||||
| Institutional Class | ||||
| Actual | $ 1,000.00 | $1,002.20 | 0.64% | $3.21 |
| Hypothetical (5% return before expenses) | $ 1,000.00 | $1,021.86 | 0.64% | $3.24 |
| Class A | ||||
| Actual | $ 1,000.00 | $1,000.20 | 1.03% | $5.16 |
| Hypothetical (5% return before expenses) | $ 1,000.00 | $1,019.90 | 1.03% | $5.22 |
| (a) | Each Fund's expense ratios have been annualized based on the Fund's actual expenses for the 6 month period ending September 30, 2018. |
| (b) | Expenses are equal to the annualized expense ratio shown above for the applicable class, multiplied by the average account value over the period, multiplied by the number of days in the most recent fiscal half year (183), divided by 365. |
Annual Report | September 30, 2018 | 11 |
| American Independence Global Tactical Allocation Fund | Portfolio of Investments |
September 30, 2018
| Security Description | Shares | Value (Note 2) | ||||||
| EXCHANGE TRADED PRODUCTS (86.13%) | ||||||||
| International Equity Exchange Traded Products (22.09%) | ||||||||
| Global X Scientific Beta Asia ex-Japan ETF | 8,800 | $ | 219,983 | |||||
| Global X Scientific Beta Europe ETF | 43,594 | 1,181,031 | ||||||
| Global X Scientific Beta Japan ETF | 34,600 | 1,067,465 | ||||||
| iShares® Europe ETF | 104,600 | 4,714,322 | ||||||
| iShares® MSCI Emerging Markets ETF | 11,500 | 493,580 | ||||||
| iShares® MSCI Japan ETF | 30,900 | 1,861,107 | ||||||
| iShares® MSCI Pacific ex Japan ETF | 1,000 | 45,420 | ||||||
| 9,582,908 | ||||||||
| U.S. Equity Exchange Traded Products (46.07%) | ||||||||
| Global X Scientific Beta US ETF(a) | 444,245 | 14,710,329 | ||||||
| SPDR® Doubleline Total Return Tactical ETF | 59,300 | 2,801,925 | ||||||
| SPDR® S&P 500® ETF Trust | 8,500 | 2,471,120 | ||||||
| 19,983,374 | ||||||||
| U.S. Fixed-Income Exchange Traded Products (17.97%) | ||||||||
| iShares® Core U.S. Aggregate Bond ETF | 73,900 | 7,797,928 | ||||||
| Total Exchange Traded Products (Cost $37,033,487) | 37,364,210 | |||||||
| 7 - Day Yield | Shares | Value | ||||||||||
| SHORT TERM INVESTMENT (14.71%) | ||||||||||||
| Money Market Fund (14.71%) | ||||||||||||
| Federated Government Obligations Fund, Premier Shares | 1.939 | % | 6,380,332 | 6,380,332 | ||||||||
| TOTAL SHORT TERM INVESTMENT (Cost $6,380,332) | 6,380,332 | |||||||||||
| TOTAL INVESTMENTS (100.84%) (Cost $43,413,819) | $ | 43,744,542 | ||||||||||
| Total Liabilities in Excess of Other Assets (-0.84%) | (365,297 | ) | ||||||||||
| NET ASSETS (100.00%) | $ | 43,379,245 | ||||||||||
| (a) | Represents an investment greater than 25% of the Fund's net assets. Performance of the Fund may be adversely impacted by concentrated investments in securities. The financial statements and portfolio holdings for these securities can be found at www.sec.gov. |
Summary of Abbreviations
ETF - Exchange Traded Funds
See Notes to Financial Statements.
| 12 | www.americanindependence.com |
| American Independence Kansas Tax-Exempt Bond Fund | Portfolio of Investments |
September 30, 2018
| Security Description | Principal | Value (Note 2) | ||||||
| MUNICIPAL BONDS (98.78%) | ||||||||
| Education (30.35%) | ||||||||
| Barton Community College, Certificate Participation, | ||||||||
| 4.00%, 12/01/32 | $ | 555,000 | $ | 584,298 | ||||
| 4.00%, 12/01/34 | 250,000 | 259,780 | ||||||
| Bourbon County Unified School District No. 234-Fort Scott, General Obligation Unlimited, | ||||||||
| 5.00%, 09/01/25 | 355,000 | 398,108 | ||||||
| Butler County Unified School District No. 385 Andover, General Obligation Unlimited, | ||||||||
| 4.00%, 09/01/30 | 690,000 | 737,472 | ||||||
| 4.00%, 09/01/31 | 500,000 | 530,795 | ||||||
| 5.00%, 09/01/34 | 2,000,000 | 2,282,220 | ||||||
| Butler County Unified School District No. 490 El Dorado, General Obligation Unlimited, | ||||||||
| 4.00%, 09/01/36 | 500,000 | 515,395 | ||||||
| Dodge City Community College, Higher Education, Revenue Bonds, 5.13%, 04/01/30 | 250,000 | 261,315 | ||||||
| Douglas County Unified School District No. 497 Lawrence, General Obligation Unlimited, | ||||||||
| 4.00%, 09/01/31 | 1,500,000 | 1,609,245 | ||||||
| 4.00%, 09/01/33 | 500,000 | 517,835 | ||||||
| Finney County Unified School District No. 457 Garden City, General Obligation Unlimited, | ||||||||
| 4.00%, 09/01/31 | 500,000 | 519,945 | ||||||
| Ford County Unified School District No. 443 Dodge City, General Obligation Unlimited, | ||||||||
| 4.00%, 03/01/34 | 1,000,000 | 1,034,670 | ||||||
| Franklin County Unified School District No. 290 Ottawa, General Obligation Unlimited, | ||||||||
| 4.00%, 09/01/40 | 250,000 | 253,770 | ||||||
| 5.00%, 09/01/31 | 1,715,000 | 1,926,545 | ||||||
| 5.00%, 09/01/32 | 150,000 | 168,204 | ||||||
| 5.00%, 09/01/33 | 1,000,000 | 1,119,380 | ||||||
| Geary County Unified School District No. 475, General Obligation Unlimited, 4.00%, | ||||||||
| 09/01/38 | 2,000,000 | 2,049,760 | ||||||
| Hutchinson Community College & Area Vocational School, Certificate Participation, 4.00%, | ||||||||
| 10/01/37 | 1,700,000 | 1,720,128 | ||||||
| Johnson & Miami Counties Unified School District No. 230 Spring Hills, General Obligation Unlimited, | ||||||||
| 4.00%, 09/01/33 | 1,000,000 | 1,044,130 | ||||||
| 4.00%, 09/01/35 | 1,000,000 | 1,030,790 | ||||||
| 5.25%, 09/01/29 | 1,500,000 | 1,620,465 | ||||||
| Johnson County Unified School District No. 231 Gardner - Edgerton, General Obligation Unlimited, | ||||||||
| 2.00%, 10/01/18 | 185,000 | 185,000 | ||||||
| 4.00%, 10/01/18 | 200,000 | 200,000 | ||||||
| Johnson County Unified School District No. 233 Olathe, General Obligation Unlimited, | ||||||||
| 4.00%, 09/01/31 | 1,000,000 | 1,060,550 | ||||||
| 4.00%, 09/01/33 | 175,000 | 182,677 | ||||||
| 4.00%, 09/01/33 | 730,000 | 759,967 | ||||||
| 4.00%, 09/01/35 | 790,000 | 818,472 | ||||||
| 4.00%, 09/01/36 | 480,000 | 495,806 | ||||||
| Johnson County Unified School District No. 512 Shawnee Mission, General Obligation | ||||||||
| Unlimited, 5.00%, 10/01/32 | 1,000,000 | 1,152,640 | ||||||
| Kansas Development Finance Authority, Revenue Bonds, | ||||||||
| 4.00%, 05/01/34 | 1,000,000 | 1,034,380 | ||||||
| 5.00%, 05/15/35 | 330,000 | 336,161 | ||||||
| 5.38%, 03/01/30 | 1,000,000 | 1,043,800 | ||||||
See Notes to Financial Statements.
| Annual Report | September 30, 2018 | 13 |
| American Independence Kansas Tax-Exempt Bond Fund | Portfolio of Investments |
September 30, 2018
| Security Description | Principal | Value (Note 2) | ||||||
| Leavenworth County Unified School District No. 453, General Obligation Unlimited, | ||||||||
| 4.00%, 09/01/36 | $ | 1,000,000 | $ | 1,034,280 | ||||
| 4.75%, 03/01/25 | 535,000 | 548,690 | ||||||
| 5.25%, 09/01/23 | 60,000 | 61,751 | ||||||
| Leavenworth County Unified School District No. 458, General Obligation Unlimited, | ||||||||
| 5.00%, 09/01/29 | 395,000 | 405,815 | ||||||
| 5.00%, 09/01/30 | 215,000 | 220,887 | ||||||
| Rice County Unified School District No. 376 Sterling, General Obligation Unlimited, | ||||||||
| 5.25%, 09/01/35 | 165,000 | 169,693 | ||||||
| 5.25%, 09/01/35 | 335,000 | 344,527 | ||||||
| Riley County Unified School District No. 383 Manhattan-Ogden, General Obligation | ||||||||
| Unlimited, 5.00%, 09/01/23 | 1,000,000 | 1,026,190 | ||||||
| Scott County Unified School District No. 466 Scott City, General Obligation Unlimited, | ||||||||
| 4.00%, 09/01/37 | 1,000,000 | 1,004,780 | ||||||
| Sedgwick County Unified School District No. 259 Wichita, General Obligation Unlimited, | ||||||||
| 3.00%, 10/01/21 | 500,000 | 511,540 | ||||||
| 5.00%, 10/01/21 | 30,000 | 30,000 | ||||||
| 5.00%, 10/01/21 | 55,000 | 55,000 | ||||||
| Sedgwick County Unified School District No. 260 Derby, General Obligation Unlimited, | ||||||||
| 5.00%, 10/01/29 | 340,000 | 377,063 | ||||||
| Sedgwick County Unified School District No. 261 Haysville, General Obligation Unlimited, | ||||||||
| 5.00%, 11/01/19 | 20,000 | 20,050 | ||||||
| 5.00%, 11/01/23 | 5,000 | 5,012 | ||||||
| Sedgwick County Unified School District No. 262 Valley Center, General Obligation Unlimited, | ||||||||
| 4.00%, 09/01/30 | 500,000 | 520,840 | ||||||
| 5.00%, 09/01/33 | 750,000 | 831,143 | ||||||
| Sedgwick County Unified School District No. 264 Clearwater, General Obligation Unlimited, | ||||||||
| 4.00%, 09/01/29 | 530,000 | 558,286 | ||||||
| Sedgwick County Unified School District No. 265 Goddard, General Obligation Unlimited, | ||||||||
| 4.50%, 10/01/24 | 250,000 | 250,000 | ||||||
| 5.00%, 10/01/24 | 370,000 | 421,219 | ||||||
| Sedgwick County Unified School District No. 266 Maize, General Obligation Unlimited, | ||||||||
| 5.00%, 09/01/21 | 500,000 | 539,150 | ||||||
| Seward County Unified School District No. 480 Liberal, General Obligation Unlimited, | ||||||||
| 5.00%, 09/01/29 | 1,500,000 | 1,684,035 | ||||||
| Shawne County Unified School District No. 437 Auburn - Washburn, General Obligation | ||||||||
| Unlimited, 3.95%, 09/01/28 | 825,000 | 854,576 | ||||||
| Sumner County Unified School District No. 353 Wellington, General Obligation Unlimited, | ||||||||
| 5.00%, 09/01/26 | 230,000 | 254,297 | ||||||
| University of Kansas Hospital Authority, Revenue Bonds, | ||||||||
| 5.00%, 09/01/28 | 250,000 | 283,173 | ||||||
| 5.00%, 09/01/30 | 350,000 | 393,638 | ||||||
| 5.00%, 09/01/31 | 500,000 | 560,680 | ||||||
| Washburn University/Topeka, Revenue Bonds, | ||||||||
| 4.00%, 07/01/41 | 330,000 | 334,274 | ||||||
| 5.00%, 07/01/35 | 500,000 | 556,450 | ||||||
| Wyandotte County Unified School District No. 500 Kansas City, General Obligation | ||||||||
| Unlimited, 5.00%, 09/01/30 | 500,000 | 571,105 | ||||||
| 41,881,847 | ||||||||
See Notes to Financial Statements.
| 14 | www.americanindependence.com |
| American Independence Kansas Tax-Exempt Bond Fund | Portfolio of Investments |
September 30, 2018
| Security Description | Principal | Value (Note 2) | ||||||
| General Obligation (29.98%) | ||||||||
| Ashland Public Building Commission, Revenue Bonds, | ||||||||
| 4.00%, 09/01/19 | $ | 100,000 | $ | 100,974 | ||||
| 4.00%, 09/01/20 | 110,000 | 112,028 | ||||||
| 5.00%, 09/01/35 | 720,000 | 748,872 | ||||||
| City of Abilene, General Obligation Unlimited, | ||||||||
| 4.30%, 09/01/27 | 150,000 | 156,358 | ||||||
| 4.60%, 09/01/30 | 500,000 | 523,995 | ||||||
| City of Abilene, Revenue Bonds, | ||||||||
| 4.00%, 12/01/29 | 325,000 | 344,172 | ||||||
| 4.00%, 12/01/31 | 445,000 | 466,569 | ||||||
| City of Dodge City, Revenue Bonds, 4.00%, 06/01/24 | 230,000 | 246,475 | ||||||
| City of Haysville, Certificate Participation, 4.13%, 11/01/32 | 460,000 | 465,203 | ||||||
| City of Junction City, General Obligation Unlimited, 4.50%, 09/01/31 | 1,000,000 | 1,027,300 | ||||||
| City of Lawrence, General Obligation Unlimited, | ||||||||
| 4.00%, 09/01/30 | 470,000 | 505,969 | ||||||
| 4.00%, 09/01/31 | 445,000 | 476,782 | ||||||
| City of Leawood, General Obligation Unlimited, 5.00%, 09/01/25 | 665,000 | 775,915 | ||||||
| City of Manhattan, General Obligation Unlimited, 5.00%, 11/01/25 | 570,000 | 660,733 | ||||||
| City of Merriam, General Obligation Unlimited, 5.00%, 10/01/27 | 1,670,000 | 1,995,617 | ||||||
| City of Newton, General Obligation Unlimited, 4.00%, 09/01/23 | 250,000 | 267,235 | ||||||
| City of Olathe, General Obligation Unlimited, | ||||||||
| 4.00%, 10/01/28 | 1,315,000 | 1,434,258 | ||||||
| 5.00%, 10/01/24 | 535,000 | 603,362 | ||||||
| City of Park City, General Obligation Unlimited, | ||||||||
| 5.38%, 12/01/25 | 495,000 | 514,053 | ||||||
| 5.38%, 12/01/25 | 5,000 | 5,101 | ||||||
| City of Phillipsburg, Revenue Bonds, 4.50%, 10/01/28 | 545,000 | 564,380 | ||||||
| City of Shawnee, General Obligation Unlimited, 4.00%, 12/01/27 | 425,000 | 456,917 | ||||||
| City of Topeka, General Obligation Unlimited, 4.50%, 08/15/30 | 450,000 | 457,875 | ||||||
| City of Wichita, General Obligation Unlimited, | ||||||||
| 4.00%, 06/01/26 | 475,000 | 493,938 | ||||||
| 4.00%, 06/01/27 | 780,000 | 811,099 | ||||||
| 4.00%, 12/01/29 | 250,000 | 261,025 | ||||||
| 4.00%, 06/01/30 | 820,000 | 889,298 | ||||||
| 5.00%, 12/01/25 | 500,000 | 579,730 | ||||||
| County of Clay, General Obligation Unlimited, 4.00%, 10/01/36 | 750,000 | 775,875 | ||||||
| County of Johnson, General Obligation Unlimited, | ||||||||
| 3.00%, 09/01/30 | 400,000 | 391,344 | ||||||
| 4.00%, 09/01/28 | 1,125,000 | 1,222,571 | ||||||
| County of Scott, General Obligation Unlimited, 5.00%, 04/01/28 | 500,000 | 522,090 | ||||||
| County of Sedgwick / County of Shawnee, Revenue Bonds, 6.70%, 06/01/29 | 5,000 | 5,038 | ||||||
| Crawford County Public Building Commission, Revenue Bonds, 5.38%, 09/01/24 | 1,300,000 | 1,339,390 | ||||||
| Johnson County Public Building Commission, Revenue Bonds, | ||||||||
| 4.00%, 09/01/24 | 500,000 | 517,340 | ||||||
| 4.00%, 09/01/29 | 650,000 | 703,092 | ||||||
| 4.00%, 09/01/31 | 1,500,000 | 1,611,510 | ||||||
| 4.50%, 09/01/27 | 955,000 | 1,008,891 | ||||||
See Notes to Financial Statements.
| Annual Report | September 30, 2018 | 15 |
| American Independence Kansas Tax-Exempt Bond Fund | Portfolio of Investments |
September 30, 2018
| Security Description | Principal | Value (Note 2) | ||||||
| Kansas Development Finance Authority, Revenue Bonds, | ||||||||
| 4.00%, 10/01/20 | $ | 250,000 | $ | 258,547 | ||||
| 4.00%, 03/01/27 | 775,000 | 781,177 | ||||||
| 4.75%, 09/01/34 | 360,000 | 367,924 | ||||||
| 5.00%, 11/01/18 | 200,000 | 200,502 | ||||||
| 5.00%, 04/01/25 | 800,000 | 884,576 | ||||||
| 5.00%, 04/01/26 | 1,485,000 | 1,641,326 | ||||||
| 5.00%, 11/01/29 | 2,060,000 | 2,121,450 | ||||||
| 5.00%, 04/01/31 | 1,000,000 | 1,098,120 | ||||||
| 5.00%, 04/01/34 | 2,000,000 | 2,177,660 | ||||||
| 5.13%, 11/01/25 | 100,000 | 100,269 | ||||||
| 5.25%, 11/15/21 | 25,000 | 25,849 | ||||||
| 5.25%, 11/15/21 | 1,275,000 | 1,317,878 | ||||||
| 5.25%, 11/01/28 | 305,000 | 305,851 | ||||||
| 5.50%, 11/15/22 | 20,000 | 20,734 | ||||||
| 5.50%, 11/15/22 | 980,000 | 1,017,985 | ||||||
| Overland Park Transportation Development District, Revenue Bonds, 5.90%, 04/01/32 | 1,025,000 | 1,052,429 | ||||||
| Unified Government of Greeley County, General Obligation Unlimited, | ||||||||
| 4.00%, 12/01/29 | 250,000 | 260,102 | ||||||
| 4.00%, 12/01/32 | 100,000 | 102,439 | ||||||
| Wyandotte County-Kansas City Unified Government, General Obligation Unlimited, | ||||||||
| 4.00%, 08/01/30 | 500,000 | 516,505 | ||||||
| 4.00%, 08/01/31 | 930,000 | 972,650 | ||||||
| 5.00%, 08/01/29 | 1,000,000 | 1,051,230 | ||||||
| Wyandotte County-Kansas City Unified Government, Revenue Bonds, | ||||||||
| 4.88%, 10/01/28 | 415,000 | 411,278 | ||||||
| 5.00%, 12/01/23 | 570,000 | 638,320 | ||||||
| 41,367,175 | ||||||||
| Health Care (11.12%) | ||||||||
| Allen County Public Building Commission, Revenue Bonds, | ||||||||
| 5.05%, 12/01/31 | 1,310,000 | 1,458,292 | ||||||
| 5.15%, 12/01/36 | 500,000 | 558,580 | ||||||
| City of Manhattan, Revenue Bonds, 5.00%, 11/15/29 | 680,000 | 734,502 | ||||||
| City of Olathe, Revenue Bonds, | ||||||||
| 4.00%, 09/01/30 | 450,000 | 461,695 | ||||||
| 5.25%, 09/01/25 | 580,000 | 596,652 | ||||||
| City of Wichita, Revenue Bonds, | ||||||||
| 4.75%, 11/15/24 | 810,000 | 834,430 | ||||||
| 5.00%, 11/15/29 | 3,070,000 | 3,332,546 | ||||||
| County of Franklin, Certificate Participation, 4.75%, 09/01/21 | 525,000 | 525,494 | ||||||
| Kansas Development Finance Authority, Revenue Bonds, | ||||||||
| 4.00%, 04/01/24 | 230,000 | 235,688 | ||||||
| 4.50%, 04/01/22 | 225,000 | 232,918 | ||||||
| 5.00%, 02/01/22 | 555,000 | 575,624 | ||||||
| 5.00%, 11/15/27 | 1,000,000 | 1,030,210 | ||||||
| 5.00%, 04/01/29 | 650,000 | 677,839 | ||||||
| 5.00%, 11/15/32 | 1,500,000 | 1,618,695 | ||||||
| 5.00%, 11/15/34 | 350,000 | 376,568 | ||||||
| 5.25%, 01/01/25 | 200,000 | 207,532 | ||||||
| 5.25%, 11/15/30 | 250,000 | 258,323 | ||||||
| Lyon County Public Building Commission, Revenue Bonds, 5.00%, 12/01/35 | 1,335,000 | 1,475,068 | ||||||
| Pawnee County Public Building Commission, Revenue Bonds, 4.00%, 02/15/31 | 145,000 | 146,544 | ||||||
| 15,337,200 | ||||||||
See Notes to Financial Statements.
| 16 | www.americanindependence.com |
| American Independence Kansas Tax-Exempt Bond Fund | Portfolio of Investments |
September 30, 2018
| Security Description | Principal | Value (Note 2) | ||||||
| Housing (2.49%) | ||||||||
| La Cygne Public Building Commission, Revenue Bonds, 5.00%, 11/01/29 | $ | 375,000 | $ | 385,616 | ||||
| Pratt County Public Building Commission, Revenue Bonds, 3.25%, 12/01/32 | 655,000 | 649,099 | ||||||
| Topeka Public Building Commission, Revenue Bonds, 5.00%, 06/01/27 | 2,355,000 | 2,407,328 | ||||||
| 3,442,043 | ||||||||
| Transportation (7.01%) | ||||||||
| Kansas Turnpike Authority, Revenue Bonds, 4.00%, 09/01/26 | 1,000,000 | 1,023,880 | ||||||
| State of Kansas Department of Transportation, Revenue Bonds, | ||||||||
| 5.00%, 09/01/23 | 200,000 | 225,944 | ||||||
| 5.00%, 09/01/24 | 500,000 | 574,240 | ||||||
| 5.00%, 09/01/28 | 1,500,000 | 1,780,815 | ||||||
| 5.00%, 09/01/29 | 1,000,000 | 1,147,550 | ||||||
| 5.00%, 09/01/31 | 1,000,000 | 1,172,460 | ||||||
| 5.00%, 09/01/34 | 1,260,000 | 1,428,034 | ||||||
| 5.00%, 09/01/34 | 2,000,000 | 2,320,960 | ||||||
| 9,673,883 | ||||||||
| Utilities (17.83%) | ||||||||
| City of Lawrence Water & Sewage System, Revenue Bonds, | ||||||||
| 4.00%, 11/01/38 | 1,000,000 | 1,023,520 | ||||||
| 4.30%, 11/01/22 | 235,000 | 235,477 | ||||||
| City of Olathe Water & Sewer System, Revenue Bonds, 4.00%, 07/01/24 | 250,000 | 269,602 | ||||||
| City of Topeka Combined Utility, Revenue Bonds, | ||||||||
| 3.38%, 08/01/32 | 1,335,000 | 1,329,834 | ||||||
| 3.50%, 08/01/33 | 2,285,000 | 2,286,531 | ||||||
| 4.00%, 08/01/26 | 2,600,000 | 2,716,740 | ||||||
| 4.50%, 08/01/33 | 650,000 | 659,847 | ||||||
| City of Wichita Water & Sewer Utility, Revenue Bonds, | ||||||||
| 3.25%, 10/01/31 | 1,070,000 | 1,065,506 | ||||||
| 4.00%, 10/01/20 | 500,000 | 519,085 | ||||||
| 4.00%, 10/01/29 | 1,000,000 | 1,039,170 | ||||||
| 4.00%, 10/01/30 | 1,000,000 | 1,039,170 | ||||||
| 5.00%, 10/01/25 | 1,000,000 | 1,079,270 | ||||||
| 5.00%, 10/01/28 | 2,650,000 | 2,855,296 | ||||||
| Kansas Power Pool, Revenue Bonds, | ||||||||
| 5.00%, 12/01/19 | 600,000 | 621,222 | ||||||
| 5.00%, 12/01/23 | 200,000 | 218,324 | ||||||
| 5.00%, 12/01/28 | 700,000 | 784,350 | ||||||
| 5.00%, 12/01/31 | 1,000,000 | 1,061,230 | ||||||
| Kansas Rural Water Finance Authority, Revenue Bonds, 4.10%, 09/01/34 | 270,000 | 271,350 | ||||||
| Wyandotte County-Kansas City Unified Government Utility System, Revenue Bonds, | ||||||||
| 4.25%, 09/01/23 | 500,000 | 512,355 | ||||||
| 5.00%, 09/01/24 | 800,000 | 810,456 | ||||||
| 5.00%, 09/01/27 | 1,300,000 | 1,393,795 | ||||||
| 5.00%, 09/01/31 | 850,000 | 949,229 | ||||||
| 5.00%, 09/01/31 | 500,000 | 561,725 | ||||||
| 5.00%, 09/01/32 | 1,090,000 | 1,185,462 | ||||||
| 5.00%, 09/01/33 | 100,000 | 111,279 | ||||||
| 24,599,825 | ||||||||
| TOTAL MUNICIPAL BONDS (Cost $135,491,962) | 136,301,973 | |||||||
See Notes to Financial Statements.
| Annual Report | September 30, 2018 | 17 |
| American Independence Kansas Tax-Exempt Bond Fund | Portfolio of Investments |
September 30, 2018
7 - Day Yield | Shares | Value | ||||||||||
| SHORT TERM INVESTMENT (0.42%) | ||||||||||||
| Money Market Fund (0.42%) | ||||||||||||
| Federated Treasury Obligations Fund, Institutional Shares | 1.936 | % | 579,959 | $ | 579,959 | |||||||
| TOTAL SHORT TERM INVESTMENT (Cost $579,959) | 579,959 | |||
| TOTAL INVESTMENTS (99.20%) (Cost $136,071,921) | $ | 136,881,932 | ||
| Other Assets in Excess of Liabilities (0.80%) | 1,101,598 | |||
| NET ASSETS (100.00%) | $ | 137,983,530 |
See Notes to Financial Statements.
| 18 | swww.americanindependence.com |
| American Independence Funds | Statements of Assets and Liabilities |
| September 30, 2018 |
| AMERICAN INDEPENDENCE GLOBAL TACTICAL ALLOCATION FUND | AMERICAN INDEPENDENCE KANSAS TAX- EXEMPT BOND FUND | |||||||
| ASSETS: | ||||||||
| Investments, at value (Cost $43,413,819 and $136,071,921) | $ | 43,744,542 | $ | 136,881,932 | ||||
| Cash | 10,003 | 4,297 | ||||||
| Receivable for shares sold | 6,980 | 54,824 | ||||||
| Receivable due from adviser | 6,243 | – | ||||||
| Dividends and interest receivable | 11,591 | 1,553,618 | ||||||
| Other Assets | 1,309 | 1,137 | ||||||
| Total Assets | 43,780,668 | 138,495,808 | ||||||
| LIABILITIES: | ||||||||
| Distributions payable | – | 321,898 | ||||||
| Administration and transfer agency fees payable | 30,504 | 21,521 | ||||||
| Payable for shares redeemed | 276,608 | 7,398 | ||||||
| Payable to adviser | – | 16,847 | ||||||
| Payable for distribution and service fees | 14,022 | 6,188 | ||||||
| Payable for printing | 2,681 | 3,979 | ||||||
| Payable for professional fees | 36,454 | 47,990 | ||||||
| Payable to trustees | 54 | 168 | ||||||
| Payable to Chief Compliance Officer | 1,975 | 2,938 | ||||||
| Accrued expenses and other liabilities | 39,125 | 83,351 | ||||||
| Total Liabilities | 401,423 | 512,278 | ||||||
| NET ASSETS | $ | 43,379,245 | $ | 137,983,530 | ||||
| NET ASSETS CONSIST OF: | ||||||||
| Paid-in capital (Note 5) | $ | 37,753,000 | $ | 136,710,892 | ||||
| Total distributable earnings (Note 3) | 5,626,245 | 1,272,638 | ||||||
| NET ASSETS | $ | 43,379,245 | $ | 137,983,530 | ||||
| PRICING OF SHARES | ||||||||
| Institutional Class: | ||||||||
| Net Asset Value, offering and redemption price per share | $ | 11.83 | $ | 10.59 | ||||
| Net Assets | $ | 31,417,371 | $ | 133,235,166 | ||||
| Shares of beneficial interest outstanding | 2,655,093 | 12,584,917 | ||||||
| Class A: | ||||||||
| Net Asset Value, offering and redemption price per share | $ | 11.75 | $ | 10.59 | ||||
| Net Assets | $ | 11,961,874 | $ | 4,748,364 | ||||
| Shares of beneficial interest outstanding | 1,017,731 | 448,473 | ||||||
| Maximum offering price per share(a) | $ | 12.47 | $ | 11.06 | ||||
| (a) | Net Asset Value/100% minus maximum sales charge of net asset value, 5.75% and 4.25% respectively for the Funds, adjusted to the nearest cent. |
| See Notes to Financial Statements. |
| Annual Report | September 30, 2018 | 19 |
| American Independence Global Tactical Allocation Fund | Statements of Operations |
| For the Period Ended September 30, 2018(a) | For the Year Ended October 31, 2017 | |||||||
| INVESTMENT INCOME: | ||||||||
| Dividends | $ | 2,186,914 | $ | 3,269,954 | ||||
| Interest | 120,298 | 15,501 | ||||||
| Total Investment Income | 2,307,212 | 3,285,455 | ||||||
| EXPENSES: | ||||||||
| Investment advisory fees (Note 6) | 676,287 | 849,169 | ||||||
| Accounting fees | – | 38,239 | ||||||
| Administration fees | 150,025 | 141,528 | ||||||
| Shareholder service fees | ||||||||
| Class A | 85,340 | 134,254 | ||||||
| Class C | 7,228 | 11,192 | ||||||
| Distribution fees | ||||||||
| Class A | 85,917 | 134,254 | ||||||
| Class C | 21,685 | 33,575 | ||||||
| Custodian fees | 18,083 | 22,621 | ||||||
| Legal fees | 49,349 | 6,928 | ||||||
| Audit and tax fees | 25,980 | 31,679 | ||||||
| Transfer agent fees | 185,377 | 188,528 | ||||||
| Trustees fees and expenses | 17,575 | 16,053 | ||||||
| Registration and filing fees | 50,540 | 46,649 | ||||||
| Printing fees | 20,093 | 18,026 | ||||||
| Chief Compliance Officer fees | 26,374 | 17,371 | ||||||
| Insurance expense | 38,716 | 10,577 | ||||||
| Other expenses | 12,604 | 5,660 | ||||||
| Total Expenses | 1,471,173 | 1,706,303 | ||||||
| Expenses reduced by: Adviser (Note 6) | (370,184 | ) | (317,597 | ) | ||||
| Distribution/service fees (Class A) (Note 6) | (40,963 | ) | (64,442 | ) | ||||
| Net Expenses | 1,060,026 | 1,324,264 | ||||||
| NET INVESTMENT INCOME | 1,247,186 | 1,961,191 | ||||||
| REALIZED AND UNREALIZED GAIN/(LOSS) ON INVESTMENTS: | ||||||||
| Net realized gain/(loss) on: | ||||||||
| Investments | 10,687,068 | 3,920,283 | ||||||
| Long-term capital gain distributions from other investment companies | 6,094 | – | ||||||
| Net realized gain | 10,693,162 | 3,920,283 | ||||||
| Change in unrealized appreciation/(depreciation) on: | ||||||||
| Investments | (10,162,136 | ) | 9,660,783 | |||||
| Net change | (10,162,136 | ) | 9,660,783 | |||||
| NET REALIZED AND UNREALIZED GAIN ON INVESTMENTS | 531,026 | 13,581,066 | ||||||
| NET INCREASE IN NET ASSETS RESULTING FROM OPERATIONS | $ | 1,778,212 | $ | 15,542,257 | ||||
| (a) | Effective September 24, 2018, the American Independence Global Tactical Allocation Fund merged with and into a clone series of ALPS Series Trust. The Funds were previously advised by Manifold Fund Advisors, LLC. In connection with the merger, the fiscal year-end changed from October 31 to September 30. |
| See Notes to Financial Statements. |
| 20 | www.americanindependence.com |
| American Independence Kansas Tax-Exempt Bond Fund | Statements of Operations |
| For the Period Ended September 30, 2018(a) | For the Year Ended October 31, 2017 | |||||||
| INVESTMENT INCOME: | ||||||||
| Dividends | $ | 3,444 | $ | – | ||||
| Interest | 4,800,452 | 6,308,485 | ||||||
| Total Investment Income | 4,803,896 | 6,308,485 | ||||||
| EXPENSES: | ||||||||
| Investment advisory fees (Note 6) | 429,057 | 552,112 | ||||||
| Accounting fees | – | 86,478 | ||||||
| Administration fees | 251,944 | 230,047 | ||||||
| Shareholder service fees | ||||||||
| Class A | 18,403 | 28,725 | ||||||
| Class C | 1,179 | 2,418 | ||||||
| Distribution fees | ||||||||
| Class A | 18,630 | 28,725 | ||||||
| Class C | 3,536 | 7,256 | ||||||
| Custodian fees | 28,623 | 36,824 | ||||||
| Legal fees | 86,175 | 13,882 | ||||||
| Audit and tax fees | 26,422 | 35,355 | ||||||
| Transfer agent fees | 50,888 | 51,405 | ||||||
| Trustees fees and expenses | 23,110 | 26,794 | ||||||
| Registration and filing fees | 28,142 | 16,230 | ||||||
| Printing fees | 16,670 | 15,964 | ||||||
| Chief Compliance Officer fees | 33,951 | 23,954 | ||||||
| Insurance expense | 91,159 | 21,243 | ||||||
| Other expenses | 7,551 | 9,762 | ||||||
| Total Expenses | 1,115,440 | 1,187,174 | ||||||
| Expenses reduced by: Adviser (Note 6) | (271,478 | ) | (236,681 | ) | ||||
| Distribution/service fees (Class A) (Note 6) | (8,097 | ) | (12,639 | ) | ||||
| Net Expenses | 835,865 | 937,854 | ||||||
| NET INVESTMENT INCOME | 3,968,031 | 5,370,631 | ||||||
| REALIZED AND UNREALIZED GAIN/(LOSS) ON INVESTMENTS: | ||||||||
| Net realized gain/(loss) on: | ||||||||
| Investments | 1,077,483 | (244,507 | ) | |||||
| Net realized gain/(loss) | 1,077,483 | (244,507 | ) | |||||
| Change in unrealized appreciation/(depreciation) on: | ||||||||
| Investments | (5,413,242 | ) | (3,649,118 | ) | ||||
| Net change | (5,413,242 | ) | (3,649,118 | ) | ||||
| NET REALIZED AND UNREALIZED LOSS ON INVESTMENTS | (4,335,759 | ) | (3,893,625 | ) | ||||
| NET INCREASE/(DECREASE) IN NET ASSETS RESULTING FROM OPERATIONS | $ | (367,728 | ) | $ | 1,477,006 | |||
| (a) | Effective September 24, 2018, the American Independence Kansas Tax-Exempt Bond Fund merged with and into a clone series of ALPS Series Trust. The Funds were previously advised by Manifold Fund Advisors, LLC. In connection with the merger, the fiscal year-end changed from October 31 to September 30. |
| See Notes to Financial Statements. |
| Annual Report | September 30, 2018 | 21 |
| American Independence Global Tactical Allocation Fund | Statements of Changes in Net Assets |
| For the Period Ended September 30, 2018(a) | For the Year Ended October 31, 2017 | For the Year Ended October 31, 2016 | ||||||||||
| OPERATIONS: | ||||||||||||
| Net investment income | $ | 1,247,186 | $ | 1,961,191 | $ | 1,887,661 | ||||||
| Net realized gain/(loss) on investments | 10,693,162 | 3,920,283 | (869,006 | ) | ||||||||
| Net change in unrealized appreciation/(depreciation) on investments | (10,162,136 | ) | 9,660,783 | 1,212,214 | ||||||||
| Net increase in net assets resulting from operations | 1,778,212 | 15,542,257 | 2,230,869 | |||||||||
| TOTAL DISTRIBUTIONS TO SHAREHOLDERS:(b) | ||||||||||||
| Institutional Class | (2,800,890 | ) | (720,260 | ) | (484,129 | ) | ||||||
| Class A(c) | (2,261,503 | ) | (563,180 | ) | (680,507 | ) | ||||||
| Class C(c) | (145,462 | ) | (17,786 | ) | (69,943 | ) | ||||||
| Total distributions | (5,207,855 | ) | (1,301,226 | ) | (1,234,579 | ) | ||||||
| BENEFICIAL SHARE TRANSACTIONS (Note 5): | ||||||||||||
| Institutional Class | ||||||||||||
| Shares sold | 24,535,873 | 30,834,298 | 30,189,836 | |||||||||
| Dividends reinvested | 1,859,235 | 490,606 | 367,108 | |||||||||
| Shares redeemed | (65,522,791 | ) | (11,783,964 | ) | (5,318,822 | ) | ||||||
| Net increase/(decrease) from beneficial share transactions | (39,127,683 | ) | 19,540,940 | 25,238,122 | ||||||||
| Class A (c) | ||||||||||||
| Shares sold | 9,225,330 | 24,876,625 | 32,234,644 | |||||||||
| Dividends reinvested | 1,790,835 | 281,975 | 281,631 | |||||||||
| Shares redeemed | (59,181,296 | ) | (26,350,301 | ) | (14,830,497 | ) | ||||||
| Net increase/(decrease) from beneficial share transactions | (48,165,131 | ) | (1,191,701 | ) | 17,685,778 | |||||||
| Class C (c) | ||||||||||||
| Shares sold | 221,432 | 540,680 | 2,075,353 | |||||||||
| Dividends reinvested | 116,345 | 15,079 | 57,172 | |||||||||
| Shares redeemed | (4,373,476 | ) | (2,146,016 | ) | (2,168,925 | ) | ||||||
| Net decrease from beneficial share transactions | (4,035,699 | ) | (1,590,257 | ) | (36,400 | ) | ||||||
| Net increase/(decrease) in net assets | (94,758,156 | ) | 31,000,013 | 43,883,790 | ||||||||
| NET ASSETS: | ||||||||||||
| Beginning of year | 138,137,401 | 107,137,388 | 63,253,598 | |||||||||
| End of period(b) | $ | 43,379,245 | $ | 138,137,401 | $ | 107,137,388 | ||||||
| (a) | Effective September 24, 2018, the American Independence Global Tactical Allocation Fund merged with and into a clone series of ALPS Series Trust. The Funds were previously advised by Manifold Fund Advisors, LLC. In connection with the merger, the fiscal year-end changed from October 31 to September 30. |
| (b) | For the prior year ended October 31, 2017, American Independence Global Tactical Allocation Fund had Total Distributions consisting of Net Investment Income of $1,301,226, and Net Realized Gains of $0 and Net Assets included accumulated net investment income of $798,190. For the prior year ended October 31, 2016, The Fund had Total Distributions consisting of Net Investment Income of $1,234,579, and Net Realized Gains of $0 and Net Assets included accumulated net investment income of $406,016. |
| (c) | Class C shares were merged into Class A on September 24, 2018. The amounts presented represent the results of the Class A shares for the periods prior to the merger and the results of the combined share class for the period subsequent the merger. As a result of the merger, Shareholder equity in Class A increased by $2,040,463 and 172,662 shares |
| See Notes to Financial Statements. |
| 22 | www.americanindependence.com |
| American Independence Kansas Tax-Exempt Bond Fund | Statements of Changes in Net Assets |
| For the Period Ended September 30, 2018(a) | For the Year Ended October 31, 2017 | For the Year Ended October 31, 2016 | ||||||||||
| OPERATIONS: | ||||||||||||
| Net investment income | $ | 3,968,031 | $ | 5,370,631 | $ | 5,686,354 | ||||||
| Net realized gain/(loss) on investments | 1,077,483 | (244,507 | ) | 3,335 | ||||||||
| Net change in unrealized depreciation on investments | (5,413,242 | ) | (3,649,118 | ) | (477,351 | ) | ||||||
| Net increase/(decrease) in net assets resulting from operations | (367,728 | ) | 1,477,006 | 5,212,338 | ||||||||
| TOTAL DISTRIBUTIONS TO SHAREHOLDERS:(b) | ||||||||||||
| Institutional Class | (3,771,175 | ) | (5,057,517 | ) | (5,380,356 | ) | ||||||
| Class A(c) | (180,929 | ) | (294,193 | ) | (287,049 | ) | ||||||
| Class C(c) | (8,545 | ) | (18,921 | ) | (20,356 | ) | ||||||
| Total distributions | (3,960,649 | ) | (5,370,631 | ) | (5,687,761 | ) | ||||||
| BENEFICIAL SHARE TRANSACTIONS (Note 5): | ||||||||||||
| Institutional Class | ||||||||||||
| Shares sold | 28,106,930 | 28,351,865 | 32,270,430 | |||||||||
| Dividends reinvested | 384,039 | 453,721 | 326,415 | |||||||||
| Shares redeemed | (58,543,555 | ) | (48,557,589 | ) | (23,352,111 | ) | ||||||
| Net increase/(decrease) from beneficial share transactions | (30,052,586 | ) | (19,752,003 | ) | 9,244,734 | |||||||
| Class A (c) | ||||||||||||
| Shares sold | 651,534 | 381,419 | 1,874,639 | |||||||||
| Dividends reinvested | 113,411 | 164,729 | 168,088 | |||||||||
| Shares redeemed | (7,251,264 | ) | (374,573 | ) | (1,131,127 | ) | ||||||
| Net increase/(decrease) from beneficial share transactions | (6,486,319 | ) | 171,575 | 911,600 | ||||||||
| Class C (c) | ||||||||||||
| Shares sold | 27,246 | 1,536 | 231,744 | |||||||||
| Dividends reinvested | 4,246 | 8,118 | 12,414 | |||||||||
| Shares redeemed | (710,429 | ) | (459,797 | ) | (152,035 | ) | ||||||
| Net increase/(decrease) from beneficial share transactions | (678,937 | ) | (450,143 | ) | 92,123 | |||||||
| Net increase/(decrease) in net assets | (41,546,219 | ) | (23,924,196 | ) | 9,773,034 | |||||||
| NET ASSETS: | ||||||||||||
| Beginning of year | 179,529,749 | 203,453,945 | 193,680,911 | |||||||||
| End of period(b) | $ | 137,983,530 | $ | 179,529,749 | $ | 203,453,945 | ||||||
| (a) | Effective September 24, 2018, the American Independence Kansas Tax-Exempt Bond Fund merged with and into a clone series of ALPS Series Trust. The Funds were previously advised by Manifold Fund Advisors, LLC. In connection with the merger, the fiscal year-end changed from October 31 to September 30. |
| (b) | For the prior year ended October 31, 2017, American Independence Kansas Tax-Exempt Bond Fund had Total Distributions consisting of Net Investment Income of $5,370,631, and Net Realized Gains of $0 and Net Assets included accumulated net investment income of $72,211. For the prior year ended October 31, 2016, The Fund had Total Distributions consisting of Net Investment Income of $5,687,761, and Net Realized Gains of $0 and Net Assets included accumulated net investment income of $72,211. |
| (c) | Class C shares were merged into Class A on September 24, 2018. The amounts presented represent the results of the Class A shares for the periods prior to the merger and the results of the combined share class for the period subsequent the merger. As a result of the merger, Shareholder equity in Class A increased by $342,954 and 32,402 shares. |
| See Notes to Financial Statements. |
| Annual Report | September 30, 2018 | 23 |
| American Independence Global Tactical Allocation Fund | Financial Highlights |
| Institutional Class | For a Share Outstanding Throughout the Periods Presented |
| For the Period Ended September 30, 2018(a) | For the Year Ended October 31, 2017 | For the Year Ended October 31, 2016 | For the Year Ended October 31, 2015 | For the Year Ended October 31, 2014 | For the Period Ended October 31, 2013(b) | |||||||||||||||||||
| NET ASSET VALUE, BEGINNING OF PERIOD | $ | 12.09 | $ | 10.68 | $ | 10.52 | $ | 10.69 | $ | 10.18 | $ | 10.00 | ||||||||||||
| INCOME/(LOSS) FROM OPERATIONS: | ||||||||||||||||||||||||
| Net investment income(c) | 0.17 | 0.22 | 0.26 | 0.32 | 0.21 | 0.01 | (d) | |||||||||||||||||
| Net realized and unrealized gain/(loss) on investments | 0.01 | (e) | 1.34 | 0.09 | (0.10 | ) | 0.35 | 0.17 | ||||||||||||||||
| Total from investment operations | 0.18 | 1.56 | 0.35 | 0.22 | 0.56 | 0.18 | ||||||||||||||||||
| LESS DISTRIBUTIONS: | ||||||||||||||||||||||||
| From net investment income | (0.15 | ) | (0.15 | ) | (0.19 | ) | (0.39 | ) | (0.05 | ) | – | |||||||||||||
| From net realized gains on investments | (0.29 | ) | – | – | – | – | – | |||||||||||||||||
| Total Distributions | (0.44 | ) | (0.15 | ) | (0.19 | ) | (0.39 | ) | (0.05 | ) | – | |||||||||||||
| NET INCREASE/(DECREASE) IN NET ASSET VALUE | (0.26 | ) | 1.41 | 0.16 | (0.17 | ) | 0.51 | 0.18 | ||||||||||||||||
| NET ASSET VALUE, END OF PERIOD | $ | 11.83 | $ | 12.09 | $ | 10.68 | $ | 10.52 | $ | 10.69 | $ | 10.18 | ||||||||||||
| TOTAL RETURN(f) | 1.53 | % | 14.78 | % | 3.34 | % | 2.10 | % | 5.52 | % | 1.80 | % | ||||||||||||
| SUPPLEMENTAL DATA: | ||||||||||||||||||||||||
| Net assets, end of period (in 000s) | $ | 31,417 | $ | 72,454 | $ | 45,813 | $ | 20,028 | $ | 6,329 | $ | 6,934 | ||||||||||||
| RATIOS TO AVERAGE NET ASSETS | ||||||||||||||||||||||||
| Operating expenses excluding reimbursement/waiver | 1.42 | %(g) | 1.23 | % | 1.27 | % | 1.33 | % | 1.73 | % | 10.18 | %(g) | ||||||||||||
| Operating expenses including reimbursement/waiver | 1.01 | %(g) | 0.95 | % | 0.95 | % | 0.94 | % | 0.90 | % | 0.90 | %(g) | ||||||||||||
| Net investment income including reimbursement/waiver | 1.52 | %(g) | 1.93 | % | 2.48 | % | 2.98 | % | 2.00 | % | 6.14 | %(g)(h) | ||||||||||||
| PORTFOLIO TURNOVER RATE(i) | 193 | % | 138 | % | 129 | % | 98 | % | 166 | % | 19 | % | ||||||||||||
| (a) | Effective September 24, 2018, the American Independence Global Tactical Allocation Fund merged with and into a clone series of ALPS Series Trust. The Funds were previously advised by Manifold Fund Advisors, LLC. In connection with the merger, the fiscal year-end changed from October 31 to September 30. |
| (b) | Commenced operations on September 20, 2013. |
| (c) | Per share amounts are based upon average shares outstanding, unless otherwise noted. |
| (d) | Calculated based on ending shares outstanding during the period. |
| (e) | Realized and unrealized gains and losses per share in this caption are balancing amounts necessary to reconcile the change in net asset value per share for the period and may not reconcile with the aggregate gains and losses in the Statement of Operations due to share transactions for the period. |
| (f) | Assumes an initial investment on the business day before the first day of the fiscal period, with all dividends and distributions reinvested in additional shares on the reinvestment date, and redemption at the net asset value calculated on the last business day of the fiscal period. Total returns are for the period indicated and have not been annualized. Total returns would have been lower had certain expenses not been waived during the period. Returns shown do not reflect the deduction of taxes that a shareholder would pay on Fund distributions or the redemption of Fund shares. |
| (g) | Annualized. |
| (h) | Due to the short life of the Fund and significant cash inflows into the Institutional Class at the end of the year in question; the ratio of net investment income is not indicative of future results. |
| (i) | Portfolio turnover rate for periods less than one full year have not been annualized. |
See Notes to Financial Statements.
| 24 | www.americanindependence.com |
| American Independence Global Tactical Allocation Fund | Financial Highlights |
| Class A | For a Share Outstanding Throughout the Periods Presented |
| For the Period Ended September 30, 2018(a)(b) | For the Year Ended October 31, 2017 | For the Year Ended October 31, 2016 | For the Year Ended October 31, 2015 | For the Year Ended October 31, 2014 | For the Period Ended October 31, 2013(c) | |||||||||||||||||||
| NET ASSET VALUE, BEGINNING OF PERIOD | $ | 12.04 | $ | 10.64 | $ | 10.50 | $ | 10.65 | $ | 10.18 | $ | 10.00 | ||||||||||||
| INCOME/(LOSS) FROM OPERATIONS: | ||||||||||||||||||||||||
| Net investment income(d) | 0.14 | 0.18 | 0.23 | 0.29 | 0.24 | 0.00 | (e)(f) | |||||||||||||||||
| Net realized and unrealized gain/(loss) on investments | 0.00 | (g)(h) | 1.33 | 0.08 | (0.10 | ) | 0.27 | 0.18 | ||||||||||||||||
| Total from investment operations | 0.14 | 1.51 | 0.31 | 0.19 | 0.51 | 0.18 | ||||||||||||||||||
| LESS DISTRIBUTIONS: | ||||||||||||||||||||||||
| From net investment income | (0.14 | ) | (0.11 | ) | (0.17 | ) | (0.34 | ) | (0.04 | ) | – | |||||||||||||
| From net realized gains on investments | (0.29 | ) | – | – | – | – | – | |||||||||||||||||
| Total Distributions | (0.43 | ) | (0.11 | ) | (0.17 | ) | (0.34 | ) | (0.04 | ) | – | |||||||||||||
| NET INCREASE/(DECREASE) IN NET ASSET VALUE | (0.29 | ) | 1.40 | 0.14 | (0.15 | ) | 0.47 | 0.18 | ||||||||||||||||
| NET ASSET VALUE, END OF PERIOD | $ | 11.75 | $ | 12.04 | $ | 10.64 | $ | 10.50 | $ | 10.65 | $ | 10.18 | ||||||||||||
| TOTAL RETURN(i) | 1.19 | % | 14.34 | % | 2.99 | % | 1.75 | % | 5.07 | % | 1.80 | % | ||||||||||||
| SUPPLEMENTAL DATA: | ||||||||||||||||||||||||
| Net assets, end of period (in 000s) | $ | 11,962 | $ | 61,546 | $ | 56,135 | $ | 38,019 | $ | 21,684 | $ | 3,876 | ||||||||||||
| RATIOS TO AVERAGE NET ASSETS | ||||||||||||||||||||||||
| Operating expenses excluding reimbursement/waiver | 1.91 | %(j) | 1.73 | % | 1.77 | % | 1.75 | % | 2.23 | % | 10.77 | %(j) | ||||||||||||
| Operating expenses including reimbursement/waiver | 1.37 | %(j) | 1.33 | % | 1.33 | % | 1.28 | % | 1.28 | % | 1.28 | %(j) | ||||||||||||
| Net investment income including reimbursement/waiver | 1.25 | %(j) | 1.59 | % | 2.23 | % | 2.70 | % | 2.32 | % | 0.25 | %(j)(k) | ||||||||||||
| PORTFOLIO TURNOVER RATE(l) | 193 | % | 138 | % | 129 | % | 98 | % | 166 | % | 19 | % | ||||||||||||
| (a) | Effective September 24, 2018, the American Independence Global Tactical Allocation Fund merged with and into a clone series of ALPS Series Trust. The Funds were previously advised by Manifold Fund Advisors, LLC. In connection with the merger, the fiscal year-end changed from October 31 to September 30. |
| (b) | Class C shares were merged into Class A on September 24, 2018. The amounts presented represent the results of the Class A shares for the periods prior to the merger and the results of the combined share class for the period subsequent the merger. |
| (c) | Commenced operations on September 20, 2013. |
| (d) | Per share amounts are based upon average shares outstanding, unless otherwise noted. |
| (e) | Calculated based on ending shares outstanding during the period. |
| (f) | Amount less than $0.005 per share. |
| (g) | Less than $0.005 per share. |
| (h) | Realized and unrealized gains and losses per share in this caption are balancing amounts necessary to reconcile the change in net asset value per share for the period and may not reconcile with the aggregate gains and losses in the Statement of Operations due to share transactions for the period. |
| (i) | Assumes an initial investment on the business day before the first day of the fiscal period, with all dividends and distributions reinvested in additional shares on the reinvestment date, and redemption at the net asset value calculated on the last business day of the fiscal period. Total returns are for the period indicated and have not been annualized. Total returns would have been lower had certain expenses not been waived during the period. Returns shown do not reflect the deduction of taxes that a shareholder would pay on Fund distributions or the redemption of Fund shares. |
| (j) | Annualized. |
| (k) | Due to the short life of the Fund and significant cash inflows into the Institutional Class at the end of the year in question; the ratio of net investment income is not indicative of future results. |
| (l) | Portfolio turnover rate for periods less than one full year have not been annualized. |
See Notes to Financial Statements.
| Annual Report | September 30, 2018 | 25 |
| American Independence Kansas Tax-Exempt Bond Fund | Financial Highlights |
| Institutional Class | For a Share Outstanding Throughout the Periods Presented |
| For the Period Ended September 30, 2018(a) | For the Year Ended October 31, 2017 | For the Year Ended October 31, 2016 | For the Year Ended October 31, 2015 | For the Year Ended October 31, 2014 | For the Year Ended October 31, 2013 | |||||||||||||||||||
| NET ASSET VALUE, BEGINNING OF PERIOD | $ | 10.88 | $ | 11.09 | $ | 11.11 | $ | 11.16 | $ | 10.80 | $ | 11.28 | ||||||||||||
| INCOME/(LOSS) FROM OPERATIONS: | ||||||||||||||||||||||||
| Net investment income(b) | 0.27 | 0.32 | 0.33 | 0.35 | 0.37 | (c) | 0.35 | (c) | ||||||||||||||||
| Net realized and unrealized gain/(loss) on investments | (0.29 | ) | (0.21 | ) | (0.02 | ) | (0.05 | ) | 0.36 | (0.48 | ) | |||||||||||||
| Total from investment operations | (0.02 | ) | 0.11 | 0.31 | 0.30 | 0.73 | (0.13 | ) | ||||||||||||||||
| LESS DISTRIBUTIONS: | ||||||||||||||||||||||||
| From net investment income | (0.27 | ) | (0.32 | ) | (0.33 | ) | (0.35 | ) | (0.37 | ) | (0.35 | ) | ||||||||||||
| Total Distributions | (0.27 | ) | (0.32 | ) | (0.33 | ) | (0.35 | ) | (0.37 | ) | (0.35 | ) | ||||||||||||
| NET INCREASE/(DECREASE) IN NET ASSET VALUE | (0.29 | ) | (0.21 | ) | (0.02 | ) | (0.05 | ) | 0.36 | (0.48 | ) | |||||||||||||
| NET ASSET VALUE, END OF PERIOD | $ | 10.59 | $ | 10.88 | $ | 11.09 | $ | 11.11 | $ | 11.16 | $ | 10.80 | ||||||||||||
| TOTAL RETURN(d) | (0.15 | %) | 1.04 | % | 2.80 | % | 2.70 | % | 6.89 | % | (1.13 | %) | ||||||||||||
| SUPPLEMENTAL DATA: | ||||||||||||||||||||||||
| Net assets, end of period (in 000s) | $ | 133,235 | $ | 167,374 | $ | 190,780 | $ | 181,983 | $ | 183,423 | $ | 232,502 | ||||||||||||
| RATIOS TO AVERAGE NET ASSETS | ||||||||||||||||||||||||
| Operating expenses excluding reimbursement/waiver | 0.75 | %(e) | 0.61 | % | 0.60 | % | 0.60 | % | 0.58 | % | 0.55 | % | ||||||||||||
| Operating expenses including reimbursement/waiver | 0.56 | %(e) | 0.48 | % | 0.48 | % | 0.48 | % | 0.48 | % | 0.48 | % | ||||||||||||
| Net investment income including reimbursement/waiver | 2.80 | %(e) | 2.95 | % | 2.94 | % | 3.12 | % | 3.39 | % | 3.20 | % | ||||||||||||
| PORTFOLIO TURNOVER RATE(f) | 14 | % | 9 | % | 10 | % | 13 | % | 1 | % | 8 | % | ||||||||||||
| (a) | Effective September 24, 2018, the American Independence Kansas Tax-Exempt Bond Fund merged with and into a clone series of ALPS Series Trust. The Funds were previously advised by Manifold Fund Advisors, LLC. In connection with the merger, the fiscal year-end changed from October 31 to September 30. |
| (b) | Per share amounts are based upon average shares outstanding, unless otherwise noted. |
| (c) | Calculated based on ending shares outstanding during the period. |
| (d) | Assumes an initial investment on the business day before the first day of the fiscal period, with all dividends and distributions reinvested in additional shares on the reinvestment date, and redemption at the net asset value calculated on the last business day of the fiscal period. Total returns are for the period indicated and have not been annualized. Total returns would have been lower had certain expenses not been waived during the period. Returns shown do not reflect the deduction of taxes that a shareholder would pay on Fund distributions or the redemption of Fund shares. |
| (e) | Annualized. |
| (f) | Portfolio turnover rate for periods less than one full year have not been annualized. |
See Notes to Financial Statements.
| 26 | www.americanindependence.com |
| American Independence Kansas Tax-Exempt Bond Fund | Financial Highlights |
| Class A | For a Share Outstanding Throughout the Periods Presented |
| For the Period Ended September 30, 2018(a)(b) | For the Year Ended October 31, 2017 | For the Year Ended October 31, 2016 | For the Year Ended October 31, 2015 | For the Year Ended October 31, 2014 | For the Year Ended October 31, 2013 | |||||||||||||||||||
| NET ASSET VALUE, BEGINNING OF PERIOD | $ | 10.88 | $ | 11.09 | $ | 11.11 | $ | 11.16 | $ | 10.80 | $ | 11.28 | ||||||||||||
| INCOME/(LOSS) FROM OPERATIONS: | ||||||||||||||||||||||||
| Net investment income(c) | 0.24 | 0.28 | 0.29 | 0.31 | 0.33 | (d) | 0.31 | (d) | ||||||||||||||||
| Net realized and unrealized gain/(loss) on investments | (0.29 | ) | (0.21 | ) | (0.02 | ) | (0.05 | ) | 0.36 | (0.48 | ) | |||||||||||||
| Total from investment operations | (0.05 | ) | 0.07 | 0.27 | 0.26 | 0.69 | (0.17 | ) | ||||||||||||||||
| LESS DISTRIBUTIONS: | ||||||||||||||||||||||||
| From net investment income | (0.24 | ) | (0.28 | ) | (0.29 | ) | (0.31 | ) | (0.33 | ) | (0.31 | ) | ||||||||||||
| Total Distributions | (0.24 | ) | (0.28 | ) | (0.29 | ) | (0.31 | ) | (0.33 | ) | (0.31 | ) | ||||||||||||
| NET INCREASE/(DECREASE) IN NET ASSET VALUE | (0.29 | ) | (0.21 | ) | (0.02 | ) | (0.05 | ) | 0.36 | (0.48 | ) | |||||||||||||
| NET ASSET VALUE, END OF PERIOD | $ | 10.59 | $ | 10.88 | $ | 11.09 | $ | 11.11 | $ | 11.16 | $ | 10.80 | ||||||||||||
| TOTAL RETURN(e) | (0.51 | %) | 0.65 | % | 2.41 | % | 2.34 | % | 6.47 | % | (1.52 | %) | ||||||||||||
| SUPPLEMENTAL DATA: | ||||||||||||||||||||||||
| Net assets, end of period (in 000s) | $ | 4,748 | $ | 11,462 | $ | 11,509 | $ | 10,620 | $ | 10,186 | $ | 9,815 | ||||||||||||
| RATIOS TO AVERAGE NET ASSETS | ||||||||||||||||||||||||
| Operating expenses excluding reimbursement/waiver | 1.25 | %(f) | 1.11 | % | 1.10 | % | 1.03 | % | 1.08 | % | 1.05 | % | ||||||||||||
| Operating expenses including reimbursement/waiver | 0.94 | %(f) | 0.87 | % | 0.87 | % | 0.83 | % | 0.87 | % | 0.87 | % | ||||||||||||
| Net investment income including reimbursement/waiver | 2.43 | %(f) | 2.56 | % | 2.55 | % | 2.76 | % | 3.00 | % | 2.82 | % | ||||||||||||
| PORTFOLIO TURNOVER RATE(g) | 14 | % | 9 | % | 10 | % | 13 | % | 1 | % | 8 | % | ||||||||||||
| (a) | Effective September 24, 2018, the American Independence Kansas Tax-Exempt Bond Fund merged with and into a clone series of ALPS Series Trust. The Funds were previously advised by Manifold Fund Advisors, LLC. In connection with the merger, the fiscal year-end changed from October 31 to September 30. |
| (b) | Class C shares were merged into Class A on September 24, 2018. The amounts presented represent the results of the Class A shares for the periods prior to the merger and the results of the combined share class for the period subsequent the merger. |
| (c) | Per share amounts are based upon average shares outstanding, unless otherwise noted. |
| (d) | Calculated based on ending shares outstanding during the period. |
| (e) | Assumes an initial investment on the business day before the first day of the fiscal period, with all dividends and distributions reinvested in additional shares on the reinvestment date, and redemption at the net asset value calculated on the last business day of the fiscal period. Total returns are for the period indicated and have not been annualized. Total returns would have been lower had certain expenses not been waived during the period. Returns shown do not reflect the deduction of taxes that a shareholder would pay on Fund distributions or the redemption of Fund shares. |
| (f) | Annualized. |
| (g) | Portfolio turnover rate for periods less than one full year have not been annualized. |
See Notes to Financial Statements.
| Annual Report | September 30, 2018 | 27 |
| American Independence Funds | Notes to Financial Statements |
September 30, 2018
1. ORGANIZATION
ALPS Series Trust (the “Trust”), a Delaware statutory trust, is an open-end management investment company registered under the Investment Company Act of 1940, as amended (“1940 Act”). The Trust consists of multiple separate portfolios or series. This annual report describes the American Independence Global Tactical Allocation Fund ("Global Tactical Allocation Fund") (previously American Independence Global Tactical Allocation Fund) and American Independence Kansas Tax-Exempt Bond Fund ("Kansas Tax-Exempt Bond Fund") (previously American Independence Kansas Tax-Exempt Bond Fund) (each individually “Fund” or collectively “Funds”). Prior to September 24, 2018, the Funds were a series of American Independence Funds Trust. The Global Tactical Allocation Fund’s primary investment objective is to seek to provide long-term capital appreciation. The Kansas Tax-Exempt Bond Fund’s primary investment objective is to preserve capital while producing current income for the investor that is exempt from both federal and Kansas state income taxes. The Funds currently offer Institutional Class Shares and Class A Shares. Each share class has identical rights to earnings, assets and voting privileges, except for class specific expenses and exclusive rights to vote on matters affecting only individual classes. The Board of Trustees (“Board”) may establish additional funds and classes of shares at any time in the future without shareholder approval.
The Global Tactical Allocation Fund is the successor in interest to the American Independence Global Tactical Allocation Fund (“Predecessor GTA Fund”), and was a series of another investment company, American Independence Funds Trust (“Predecessor Trust”), which was advised by Manifold Fund Advisors, LLC. On September 18, 2018, the shareholders of the Predecessor GTA Fund approved the reorganization of the Institutional Class Shares, Class A Shares and Class C Shares of the Predecessor Fund with and into the Institutional Class Shares and Class A Shares of the American Independence Global Tactical Allocation Fund and Class C Shares exchanged for load-waived Class A Shares of the Global Tactical Allocation Fund, and effective as of the close of business on September 21, 2018, the assets and liabilities of the Predecessor GTA Fund were transferred to the Trust in exchange for designated shares of American Independence Global Tactical Allocation Fund. Costs incurred by the American Independence Global Tactical Allocation Fund in connection with the reorganization were paid by Manifold Partners, the new Adviser. The prior fiscal year end of the Predecessor GTA Fund was October 31, 2017. The reporting period for the American Independence Global Tactical Allocation Fund was an 11 month period from November 1, 2017 through September 30, 2018. Operations prior to September 24, 2018 were for the Predecessor GTA Fund. The reorganization was accomplished by a tax-free exchange of 3,758,879 shares of the Predecessor Fund’s shares, valued at $44,591,158 for the exact same shares (except for of Class C shares that were exchanged for load waived Class A shares) and value of the Global Tactical Allocation Fund’s shares. For financial reporting purposes, assets received and shares issued by the Global Tactical Allocation Fund were recorded at fair value; however, the cost basis of the investments received from the Predecessor GTA Fund was carried forward to align ongoing reporting of the Global Tactical Allocation Fund’s realized and unrealized gains and losses with amounts distributable to shareholders for tax purposes. Immediately prior to the reorganization, the net assets of the Predecessor GTA Fund were $44,591,158, including $563,467 of net unrealized appreciation, $310,072 of undistributed (accumulated) net investment income, and $10,558,043 of undistributed (accumulated) net realized gain.
The Kansas Tax-Exempt Bond Fund is the successor in interest to the American Independence Kansas Tax-Exempt Bond Fund (“Predecessor Kansas Fund”), and was a series of another investment company, American Independence Funds Trust (“Predecessor Trust”), which was advised by Manifold Fund Advisors, LLC. On September 18, 2018, the shareholders of the Predecessor Kansas Fund approved the reorganization of the Institutional Class Shares, Class A Shares and Class C Shares of the Predecessor Fund with and into the Institutional Class Shares and Class A Shares of the Kansas Tax Exempt Bond Fund and Class C Shares exchanged for load-waived Class A Shares in the Kansas Tax Exempt Bond Fund, and effective as of the close of business on September 21, 2018, the assets and liabilities of the Predecessor Kansas Fund were transferred to the Trust in exchange for shares of the Kansas Tax-Exempt Bond Fund. Costs incurred by the Kansas Tax-Exempt Bond Fund in connection with the reorganization were paid by Manifold Partners, the new Adviser. The prior fiscal year end of the Predecessor Kansas Fund was October 31, 2017. The reporting period for the Kansas Tax-Exempt Bond Fund was an 11 month period from November 1, 2017 through September 30, 2018. Operations prior to September 24, 2018 were for the Predecessor Kansas Fund. The reorganization was accomplished by a tax-free exchange of 13,125,721 shares of the Predecessor Tax-Exempt Bond Fund’s shares, valued at $138,912,350 for the exact same shares (except for of Class C shares that were exchanged for load waived Class A shares) and value of the Kansas Tax-Exempt Bond Fund’s shares. For financial reporting purposes, assets received and shares issued by the Kansas Tax-Exempt Bond Fund were recorded at fair value; however, the cost basis of the investments received from the Predecessor Kansas Fund was carried forward to align ongoing reporting of the Kansas Tax-Exempt Bond Fund’s realized and unrealized gains and losses with amounts distributable to shareholders for tax purposes. Immediately prior to the reorganization, the net assets of the Predecessor Kansas Fund were $138,912,350, including $757,310 of net unrealized appreciation, $72,211 of undistributed (accumulated) net investment income, and $383,483 of undistributed (accumulated) net realized gain.
The reorganizations did not result in any material changes to either of the existing Funds’ investment objectives or principal investment strategies or fundamental investment restrictions. However, upon completion of the reorganization, Manifold Partners, LLC (“Adviser”), an affiliate of the previous adviser, became the new investment adviser for the Funds and Lee Capital Management, L.P. became the new sub-adviser to the Global Tactical Allocation Fund. Carret Asset Management, LLC will continue to be the sub-adviser to the Kansas Tax-Exempt Bond Fund.
| 28 | www.americanindependence.com |
| American Independence Funds | Notes to Financial Statements |
September 30, 2018
The primary purpose of the reorganizations was to move the existing Funds from their existing trust to another multi-series trust, which the Adviser believed would allow the Funds to (i) lower total net annual fund operating expenses for each Fund and the potential for even lower total net annual fund expenses if the assets of the Funds grow as expected; and (ii) become part of a series of a stable fund family with significantly greater asset under management and potential economies of scale. Shareholders are expected to benefit accordingly and to enjoy an improvement in the level and quality of services provided to them and the Funds.
2. SIGNIFICANT ACCOUNTING POLICIES
The accompanying financial statements were prepared in accordance with accounting principles generally accepted in the United States of America for investment companies (“U.S. GAAP”). The Funds are considered registered investment companies under U.S. GAAP and follow the accounting and reporting guidance applicable to registered investment companies in the Financial Accounting Standards Board Accounting Standards Codification Topic 946. The preparation of financial statements in conformity with U.S. GAAP requires management to make certain estimates and assumptions that affect the reported amounts of assets and liabilities and disclosures of contingent assets and liabilities at the date of the financial statements and the reported amounts of revenue and expenses during the period. Actual results could differ from those estimates. The following is a summary of significant accounting policies consistently followed by the Funds in preparation of their financial statements.
Investment Valuation: The Funds generally value their securities based on market prices determined at the close of regular trading on the New York Stock Exchange (“NYSE”), normally 4:00 p.m. Eastern Time, on each day the NYSE is open for trading.
For equity securities and shares of registered investment companies that are traded on an exchange, the market price is usually the closing sale or official closing price on that exchange. In the case of equity securities not traded on an exchange, or if such closing prices are not otherwise available, the securities are valued at the mean of the most recent bid and ask prices on such day.
The market price for debt obligations is generally the price supplied by an independent third-party pricing service approved by the Board, which may use a matrix, formula or other objective method that takes into consideration quotations from dealers, market transactions in comparable investments, market indices and yield curves. If vendors are unable to supply a price, or if the price supplied is deemed to be unreliable, the market price may be determined using quotations received from one or more broker-dealers that make a market in the security.
Most securities listed on a foreign exchange are valued either at the last sale price at the close of the exchange on which the security is principally traded or at fair value (see description below). Foreign securities, currencies, and other assets and liabilities denominated in foreign currencies are translated into U.S. Dollars at the exchange rate of said currencies against the U.S. Dollar, as of Valuation Time, as provided by an independent pricing service approved by the Board.
Redeemable securities issued by open-end registered investment companies are valued at the investment company’s applicable net asset value, with the exception of exchange-traded open-end investment companies, which are priced as equity securities.
When such prices or quotations are not available, or when the Fair Value Committee appointed by the Board believes that they are unreliable, securities may be priced using fair value procedures approved by the Board.
Fair Value Measurements: The Funds disclose the classification of their fair value measurements following a three-tier hierarchy based on the inputs used to measure fair value. Inputs refer broadly to the assumptions that market participants would use in pricing the asset or liability, including assumptions about risk. Inputs may be observable or unobservable. Observable inputs reflect the assumptions market participants would use in pricing the asset or liability that are developed based on market data obtained from sources independent of the reporting entity. Unobservable inputs reflect the reporting entity’s own assumptions about the assumptions market participants would use in pricing the asset or liability that are developed based on the best information available.
| Annual Report | September 30, 2018 | 29 |
| American Independence Funds | Notes to Financial Statements |
September 30, 2018
Various inputs are used in determining the value of the Funds’ investments as of the end of the reporting period. When inputs used fall into different levels of the fair value hierarchy, the level in the hierarchy within which the fair value measurement falls is determined based on the lowest level input that is significant to the fair value measurement in its entirety. The designated input levels are not necessarily an indication of the risk or liquidity associated with these investments. These inputs are categorized in the following hierarchy under applicable financial accounting standards:
| Level 1 – | Unadjusted quoted prices in active markets for identical investments, unrestricted assets or liabilities that the Fund has the ability to access at the measurement date; |
| Level 2 – | Quoted prices which are not active, quoted prices for similar assets or liabilities in active markets or inputs other than quoted prices that are observable (either directly or indirectly); and |
| Level 3 – | Significant unobservable prices or inputs (including the Fund’s own assumptions in determining the fair value of investments) where there is little or no market activity for the asset or liability at the measurement date. |
The following is a summary of the inputs used to value the Funds’ investments as of September 30, 2018:
Global Tactical Allocation Fund
| Investments in Securities at Value | Level 1 - Unadjusted Quoted Prices | Level 2 - Other Significant Observable Inputs | Level 3 - Significant Unobservable Inputs | Total | ||||||||||||
| International Equity Exchange Traded Products | $ | 9,582,908 | $ | – | $ | – | $ | 9,582,908 | ||||||||
| U.S. Equity Exchange Traded Products | 19,983,374 | – | – | 19,983,374 | ||||||||||||
| U.S. Fixed-Income Exchange Traded Products | 7,797,928 | – | – | 7,797,928 | ||||||||||||
| Short Term Investment | 6,380,332 | – | – | 6,380,332 | ||||||||||||
| TOTAL | $ | 43,744,542 | $ | – | $ | – | $ | 43,744,542 | ||||||||
Kansas Tax-Exempt Bond Fund
| Investments in Securities at Value | Level 1 - Unadjusted Quoted Prices | Level 2 - Other Significant Observable Inputs | Level 3 - Significant Unobservable Inputs | Total | ||||||||||||
| Municipal Bonds | $ | – | $ | 136,301,973 | $ | – | $ | 136,301,973 | ||||||||
| Short Term Investment | 579,959 | – | – | 579,959 | ||||||||||||
| TOTAL | $ | 579,959 | $ | 136,301,973 | $ | – | $ | 136,881,932 | ||||||||
The Funds recognize transfers between levels as of the end of the period. For the period ended September 30, 2018, the Funds did not have any transfers between Level 1 and Level 2 securities. There were no Level 3 securities held in either of the Funds at September 30, 2018.
Securities Purchased on a When-Issued Basis: Each Fund may purchase securities on a “when-issued” basis. When-issued securities are securities purchased for delivery beyond the normal settlement date at a stated price and/or yield, thereby involving the risk that the price and/or yield obtained may be more or less than those available in the market when delivery takes place. At the time a Fund makes the commitment to purchase a security on a when-issued basis, the Fund records the transaction and reflects the value of the security in determining net asset value. Normally, the settlement date occurs within one month of the purchase. No payment is made by the Fund and no interest accrues to the Fund during the period between purchase and settlement.
Cash & Cash Equivalents: The Funds consider their investment in a Federal Deposit Insurance Corporation ("FDIC") insured interest bearing account to be cash and cash equivalents. Cash and cash equivalents are valued at cost plus any accrued interest. The Funds maintain cash balances, which, at times may exceed federally insured limits. The Funds maintain these balances with a high-quality financial institution.
Concentration of Credit Risk: The Fund places its cash with a banking institution, which is insured by FDIC. The FDIC limit is $250,000. At various times throughout the year, the amount on deposit may exceed the FDIC limit and subject the Fund to a credit risk. The Funds do not believe that such deposits are subject to any unusual risk associated with investment activities.
| 30 | www.americanindependence.com |
| American Independence Funds | Notes to Financial Statements |
September 30, 2018
The Kansas Tax-Exempt Bond Fund invests primarily in debt obligations issued by the State of Kansas and its respective political subdivisions, agencies and public authorities. The Fund is more susceptible to economic and political factors adversely affecting issuers of Kansas specific municipal securities than are municipal bond funds that are not concentrated in these issuers to the same extent.
Trust Expenses: Some expenses of the Trust can be directly attributed to a Fund. Expenses that cannot be directly attributed to a Fund are apportioned among all funds in the Trust based on average net assets of each fund, including Trustees’ fees and expenses.
Fund Expenses: Some expenses can be directly attributed to a Fund and are apportioned among the classes based on average net assets of each class.
Class Expenses: Expenses that are specific to a class of shares are charged directly to that share class. Fees provided under the distribution (Rule 12b-1) and/or shareholder service plans for a particular class of each Fund are charged to the operations of such class.
Federal Income Taxes: The Funds intend to comply with the requirements under Subchapter M of the Internal Revenue Code of 1986, as amended, applicable to regulated investment companies and intend to distribute substantially all of their net taxable income and net capital gains, if any, each year so that it will not be subject to excise tax on undistributed income and gains. The Funds are not subject to income taxes to the extent such distributions are made.
As of and during the period ended September 30, 2018, the Funds did not have a liability for any unrecognized tax benefits in the accompanying financial statements. The Funds recognize interest and penalties, if any, related to tax liabilities as income tax expense in the Statements of Operations. The Funds file U.S. federal, state and local income tax returns as required. The Funds’ tax returns are subject to examination by the relevant tax authorities until expiration of the applicable statute of limitations, which is generally three years after the filing of the tax return for federal purposes and four years for most state returns. The Funds’ administrator has analyzed the Funds’ tax positions taken on federal and state income tax returns for all open tax years and has concluded that, as of September 30, 2018, no provision for income tax is required in the Funds’ financial statements related to these tax positions.
Investment Transactions and Investment Income: Investment transactions are accounted for on the date the investments are purchased or sold (trade date basis for financial reporting purposes). Realized gains and losses from investment transactions are reported on an identified cost basis. Interest income, which includes accretion of discounts and amortization of premiums, is accrued and recorded as earned based on the effective yield method. Dividend income and realized gain distributions from underlying investments are recognized on the ex-dividend date. All of the realized and unrealized gains and losses and net investment income are allocated daily to each class in proportion to its average daily net assets.
Distributions to Shareholders: Distributions from net investment income for the Kansas Tax-Exempt Bond Fund are declared daily and paid monthly. Distributions from net investment income, if any, for the Global Tactical Allocation Fund are declared and paid quarterly. Distributions from net realized capital gains, if any, are distributed at least annually. Income dividend distributions are derived from interest, dividends and other income the Funds receive from their investments, including short- term capital gains. Long term capital gain distributions are derived from gains realized when a Fund sells a security it has owned for more than one year. A Fund may make additional distributions and dividends at other times if its portfolio manager or managers believe doing so may be necessary for the Fund to avoid or reduce taxes. Net investment income/(loss) and net realized gain/(loss) may differ for financial statement and tax purposes.
New Accounting Pronouncements: In March 2017, the Financial Accounting Standards Board (“FASB”) issued Accounting Standards Update (“ASU”) No. 2017-08, “Premium Amortization on Purchased Callable Debt Securities.” This ASU shortens the amortization period for the premium on certain purchased callable debt securities to the earliest call date. Today, entities generally amortize the premium over the contractual life of the security. This guidance does not change the accounting for purchased callable debt securities held at a discount; the discount continues to be amortized to maturity. ASU No. 2017-08 is effective for interim and annual reporting periods beginning after December 15, 2018; early adoption is permitted. The guidance calls for a modified retrospective transition approach under which a cumulative effect adjustment will be made to retained earnings as of the beginning of the first reporting period in which the guidance is adopted. Management is currently evaluating the provisions of ASU No. 2017-08 to determine the potential impact the new standard will have on the Kansas Tax Exempt Bond Fund's Financial Statements.
| Annual Report | September 30, 2018 | 31 |
| American Independence Funds | Notes to Financial Statements |
September 30, 2018
3. TAX BASIS INFORMATION
Tax Basis of Distributions to Shareholders: The character of distributions made during the period from net investment income or net realized gains may differ from its ultimate characterization for federal income tax purposes. Also, due to the timing of dividend distributions, the fiscal year in which amounts are distributed may differ from the fiscal year in which the income or realized gain were recorded by the Funds. The amounts and characteristics of tax basis distributions are estimated at the time of distribution and composition of distributable earnings/(accumulated losses) are finalized at fiscal year-end.
The tax character of distributions paid by the Funds for the fiscal periods or years ended September 30, 2018, October 31, 2017 and October 31, 2016 respectively, were as follows:
| Ordinary Income | Tax-Exempt Income | Long-Term Capital Gains | ||||||||||
| Global Tactical Allocation Fund | $ | 5,006,179 | $ | – | $ | 201,676 | ||||||
| Kansas Tax-Exempt Bond Fund | 49,064 | 3,911,585 | – | |||||||||
| Ordinary Income | Tax-Exempt Income | Long-Term Capital Gains | ||||||||||
| Global Tactical Allocation Fund | $ | 1,301,226 | $ | – | $ | – | ||||||
| Kansas Tax-Exempt Bond Fund | – | 5,370,631 | – | |||||||||
| Ordinary Income | Tax-Exempt Income | Long-Term Capital Gains | ||||||||||
| Global Tactical Allocation Fund | $ | 1,234,579 | $ | – | $ | – | ||||||
| Kansas Tax-Exempt Bond Fund | 308 | 5,687,453 | – | |||||||||
Reclassifications: As of September 30, 2018, permanent differences in book and tax accounting were reclassified. The following reclassifications, which had no impact on results of operations or net assets, were recorded to reflect tax character:
| Paid-in Capital | Total Distributable Earnings | |||||||
| Global Tactical Allocation Fund | $ | 5,566,466 | $ | (5,566,466 | ) | |||
The primary reasons for the permanent differences is due to equalization and commodities in the Fund.
Unrealized Appreciation and Depreciation on Investments: As of September 30, 2018, the aggregate costs of investments, gross unrealized appreciation/(depreciation) and net unrealized appreciation for Federal tax purposes were as follows:
| Global Tactical Allocation Fund | Kansas Tax-Exempt Bond Fund | |||||||
| Gross unrealized appreciation (excess of value over tax cost) | $ | 495,048 | $ | 2,219,762 | ||||
| Gross unrealized depreciation (excess of tax cost over value) | (349,513 | ) | (1,409,751 | ) | ||||
| Net unrealized appreciation | $ | 145,535 | $ | 810,011 | ||||
| Cost of investments for income tax purposes | $ | 43,599,007 | $ | 136,071,921 | ||||
The primary reason for the temporary differences is due to wash sales.
| 32 | www.americanindependence.com |
| American Independence Funds | Notes to Financial Statements |
September 30, 2018
Components of Distributable Earnings: At September 30, 2018, components of distributable earnings were as follows:
| Global Tactical Allocation Fund | Kansas Tax-Exempt Bond Fund | |||||||
| Undistributed ordinary income | $ | 4,551,049 | $ | 396,517 | ||||
| Tax-Exempt Undistributed Income | – | 4,974 | ||||||
| Accumulated capital gains | 929,661 | 383,034 | ||||||
| Net unrealized appreciation | 145,535 | 810,011 | ||||||
| Other cumulative effect of timing differences | – | (321,898 | ) | |||||
| Total | $ | 5,626,245 | $ | 1,272,638 | ||||
Capital loss carryovers used during the period ended September 30, 2018 were:
| Fund | Amount | |||
| Kansas Tax-Exempt Bond Fund | $ | 694,449 | ||
4. SECURITIES TRANSACTIONS
Purchases and sales of securities, excluding short-term securities, during the period ended September 30, 2018 were as follows:
| Purchases of Securities | Proceeds from Sales of Securities | |||||||
| Global Tactical Allocation Fund | $ | 170,724,951 | $ | 268,777,085 | ||||
| Kansas Tax-Exempt Bond Fund | 20,101,983 | 53,422,577 | ||||||
5. BENEFICIAL SHARE TRANSACTIONS
The capitalization of the Trust consists of an unlimited number of shares of beneficial interest with no par value per share. Holders of the shares of the Funds have one vote for each share held and a proportionate fraction of a vote for each fractional share. All shares issued and outstanding are fully paid and are transferable and redeemable at the option of the shareholder. Shares have no pre-emptive rights. Neither the Funds nor any of their creditors have the right to require shareholders to pay any additional amounts solely because the shareholder owns the shares.
| Annual Report | September 30, 2018 | 33 |
| American Independence Funds | Notes to Financial Statements |
September 30, 2018
Transactions in common shares were as follows:
| For the Period Ended September 30, 2018(a) | For the Year Ended October 31, 2017 | For the Year Ended October 31, 2016 | ||||||||||
| Global Tactical Allocation Fund | ||||||||||||
| Institutional Class | ||||||||||||
| Shares sold | 2,040,221 | 2,718,628 | 2,852,595 | |||||||||
| Shares issued in reinvestment of distributions to shareholders | 156,547 | 45,399 | 35,067 | |||||||||
| Shares redeemed | (5,533,403 | ) | (1,062,820 | ) | (501,530 | ) | ||||||
| Net increase/(decrease) in shares outstanding | (3,336,635 | ) | 1,701,207 | 2,386,132 | ||||||||
| Class A | ||||||||||||
| Shares sold | 774,392 | 2,203,305 | 3,056,585 | |||||||||
| Shares issued in reinvestment of distributions to shareholders | 151,407 | 26,027 | 27,068 | |||||||||
| Shares redeemed | (5,018,761 | ) | (2,395,818 | ) | (1,427,253 | ) | ||||||
| Net increase/(decrease) in shares outstanding | (4,092,962 | ) | (166,486 | ) | 1,656,400 | |||||||
| Class C | ||||||||||||
| Shares sold | 18,642 | 48,482 | 198,648 | |||||||||
| Shares issued in reinvestment of distributions to shareholders | 10,002 | 1,324 | 5,602 | |||||||||
| Shares redeemed | (377,558 | ) | (196,239 | ) | (210,633 | ) | ||||||
| Net decrease in shares outstanding | (348,914 | ) | (146,433 | ) | (6,383 | ) | ||||||
| Kansas Tax-Exempt Bond Fund | ||||||||||||
| Institutional Class | ||||||||||||
| Shares sold | 2,618,566 | 2,598,718 | 2,882,357 | |||||||||
| Shares issued in reinvestment of distributions to shareholders | 35,603 | 41,610 | 29,217 | |||||||||
| Shares redeemed | (5,458,564 | ) | (4,458,454 | ) | (2,089,537 | ) | ||||||
| Net increase/(decrease) in shares outstanding | (2,804,395 | ) | (1,818,126 | ) | 822,037 | |||||||
| Class A | ||||||||||||
| Shares sold | 61,220 | 34,999 | 167,895 | |||||||||
| Shares issued in reinvestment of distributions to shareholders | 10,574 | 15,117 | 15,045 | |||||||||
| Shares redeemed | (677,021 | ) | (34,278 | ) | (101,132 | ) | ||||||
| Net increase/(decrease) in shares outstanding | (605,227 | ) | 15,838 | 81,808 | ||||||||
| Class C | ||||||||||||
| Shares sold | 2,509 | 142 | 20,631 | |||||||||
| Shares issued in reinvestment of distributions to shareholders | 396 | 745 | 1,111 | |||||||||
| Shares redeemed | (66,742 | ) | (42,133 | ) | (13,672 | ) | ||||||
| Net increase/(decrease) in shares outstanding | (63,837 | ) | (41,246 | ) | 8,070 | |||||||
| (a) | Effective September 24, 2018, the Predecessor Kansas Fund and Predecessor GTA Fund merged with and into clone series of ALPS Series Trust. The Funds were previously advised by Manifold Fund Advisors, LLC. In connection with the merger, the fiscal year-end changed from October 31 to September 30. |
Control is defined by the 1940 Act as the beneficial ownership, either directly or through one or more controlled companies, of more than 25% of the voting securities of a company. Approximately 57% of the shares outstanding of the Global Tactical Allocation Fund are owned by two omnibus accounts. Approximately 93% of the shares outstanding of the Kansas Tax-Exempt Bond Fund are owned by one omnibus account.
6. MANAGEMENT AND RELATED PARTY TRANSACTIONS
Investment Advisory: Effective September 24, 2018, Manifold Partners LLC (“Adviser” or "Manifold Partners"), subject to the authority of the Board, is responsible for the overall management and administration of the Funds’ business affairs. The Adviser manages the investments of the Funds in accordance with each Fund’s investment objective, policies and limitations and investment guidelines established jointly by the Adviser and the Board.
Effective September 24, 2018, pursuant to the Investment Advisory Agreement (“Advisory Agreement”) with the Adviser, the Global Tactical Allocation Fund pays the Adviser an annual management fee of 0.75% based on the Fund’s average daily net assets, and the Kansas Tax-Exempt Bond Fund pays the Adviser an annual management fee of 0.30% based on the Fund’s average daily net assets. The management fees are paid on a monthly basis. The initial term of the Advisory Agreement is two years and the Board may extend the Advisory Agreement for additional one-year terms by approval at an in-person meeting called for the purpose of considering such matters. The Board and shareholders of the Funds may terminate the Advisory Agreement upon 30 days’ prior written notice. The Adviser may terminate the Advisory Agreement upon 60 days’ prior written notice.
| 34 | www.americanindependence.com |
| American Independence Funds | Notes to Financial Statements |
September 30, 2018
Effective September 24, 2018, pursuant to a fee waiver letter agreement (“Fee Waiver Agreement”), the Adviser has contractually agreed to limit the amount of the Total Annual Fund Operating Expenses, exclusive of interest, dividend expense on short sales/interest expense, taxes, brokerage commissions, other investment related costs, acquired fund fees and expenses, distribution service fees (i.e., Rule 12b-1 fees), shareholder service fee, and extraordinary expenses, such as litigation and other expenses not incurred in the ordinary course of business, for the Global Tactical Allocation Fund and Kansas Fund to 0.95% and 0.48%, respectively, of each Fund’s average daily net assets for Institutional Class shares and Class A shares. The Fee Waiver Agreement is in effect through January 31, 2021. The Adviser will be permitted to recover, on a class-by-class basis, expenses it has borne through the Fee Waiver Agreement only to the extent that each Fund's expenses in later periods do not exceed the lesser of: (1) the contractual expense limit in effect at the time the Adviser waives or limits the expenses; or (2) the contractual expense limit in effect at the time the Adviser seeks to recover the expenses; provided, however, that the Fund will not be obligated to reimburse any such expenses borne by the Adviser more than three years after the date on which the fee or expense was waived or limited or assumed and paid by the Adviser, as calculated on a monthly basis. The Adviser may not discontinue this waiver without the approval by the Trust's Board. Fees waived or reimbursed for the period ended September 30, 2018 are disclosed in the Statements of Operations.
Prior to September 24, 2018, Manifold Fund Advisors, LLC. (“MFA”) served as the investment adviser to the Funds pursuant to an investment advisory agreement between the American Independence Funds Trust and MFA, under which MFA was entitled to receive an annual fee of 0.75% and 0.30% for Predecessor GTA Fund and the Predecessor Kansas Fund, respectively, computed daily and paid monthly.
Effective March 1, 2018 and through September 21, 2018, MFA voluntarily agreed to waive a portion of its investment advisory fee and to reimburse fees and expenses of the Funds in order to maintain the Funds’ total operating expenses (excluding of interest, dividend expense on short sales/interest expense, taxes, brokerage commissions, other investment related costs, acquired fund fees and expenses, distribution services fees (i.e., Rule 12b-1 fees), shareholder service fees, and extraordinary expenses, legal fees and expenses of counsel to the Independent Trustees that are unrelated to the reorganization of the Funds, or extraordinary expenses, at not more than the following percentages of average annual net assets:
| Fund | Institutional Class | Class A |
| Predecessor GTA Fund | 0.95% | 1.33% |
| Predecessor Kansas Fund | 0.48% | 0.87% |
Under the Expense Limitation Agreement that was in effect until March 1, 2018, the waivers and reimbursements by the Adviser are subject to later adjustment to allow the Adviser to recoup amounts waived or reimbursed to the extent total annual operating expenses (excluding any taxes, interest expenses and dividends relating to short sales, brokerage fees, acquired fund fees and expenses and extraordinary expenses) for a fiscal year do not exceed the expense limit that was in place at the time the fees were waived or expenses were assumed. The Adviser was only entitled to recoup amounts for a period of three years from the date such amount was waived or reimbursed.
Effective September 24, 2018, Lee Capital Management, L.P. became sub-adviser (“Sub-Adviser”) to the Global Tactical Allocation Fund. Prior to that, J.A. Forlines, LLC (“JAF”) was the sub-adviser to the American Independence JAForlines Global Tactical Allocation Fund. As of December 31, 2017, JAF merged with and into W. E. Donoghue & Co., LLC.
Carret Asset Management, LLC is the Sub-Adviser (“Sub-Adviser”) to the Kansas Tax-Exempt Bond Fund.
Administrator: Effective September 24, 2018, ALPS Fund Services, Inc. (“ALPS”) (an affiliate of ALPS Distributors, Inc.) serves as administrator to the Funds. The Funds have agreed to pay expenses incurred in connection with its administrative activities. Pursuant to the Administration, Bookkeeping and Pricing Services Agreement with the Trust, ALPS will provide operational services to the Funds including, but not limited to, fund accounting and fund administration, and will generally assist in the Funds’ operations. The Funds’ administration fee is accrued on a daily basis and paid monthly. The officers and an Interested Trustee of the Trust are employees of ALPS. ALPS is reimbursed by the Funds for certain out of pocket expenses.
| Annual Report | September 30, 2018 | 35 |
| American Independence Funds | Notes to Financial Statements |
September 30, 2018
For the period from September 24, 2018 through September 30, 2018, the Global Tactical Allocation Fund and Kansas Tax- Exempt Bond Fund incurred Fund Administration and Accounting fees of $1,013 and $3,180, respectively, relating to services provided by ALPS.
Prior to September 24, 2018, MFA provided certain administrative services necessary for the Funds’ operations. The Funds were charged a fee for the services provided, and this fee was calculated based on each Fund's average daily net assets at an annual rate of 0.125%. MFA had entered into an agreement with UMB Fund Services, Inc. (“UMBFS”) whereby UMBFS provided the Funds with sub-administration services pursuant to sub-administrative services agreement with MFA.
Prior to September 24, 2018 and pursuant to the prior Fund Accounting Services Agreement, UMBFS served as the Predecessor Trust’s fund accounting agent. For the period from November 1, 2017 through September 21, 2018, the Global Tactical Allocation Fund and the Kansas Tax-Exempt Bond Fund incurred Fund Administration and Accounting fees of $36,689 and $72,346, respectively, relating to services provided by UMBFS. An officer of the Predecessor Trust is an employee of UMBFS.
Transfer Agent: Effective September 24, 2018, ALPS serves as transfer agent for the Funds under a Transfer Agency and Services Agreement with the Trust. Under this agreement, ALPS is paid an annual fee for services performed on behalf of the Funds plus fees for open accounts and is reimbursed for certain out-of-pocket expenses. For the period from September 24, 2018 through September 30, 2018, the Global Tactical Allocation Fund and Kansans Tax- Exempt Bond Fund incurred Transfer Agent fees of $348 and $467, respectively, relating to services provided by ALPS.
Prior to September 24, 2018, DST Systems Inc. served as the Funds’ transfer agent and dividend disbursing agent.
Compliance Services: Effective September 24, 2018, ALPS provides services as the Funds’ Chief Compliance Officer to monitor and test the policies and procedures of each Fund in conjunction with requirements under Rule 38a-1 of the 1940 Act pursuant to a Chief Compliance Officer Services Agreement with the Trust. Under this agreement, ALPS is paid an annual fee for services performed on behalf of the Funds and is reimbursed for certain out-of-pocket expenses. For the period from September 24, 2018 through September 30, 2018, the American Independence Global Tactical Allocation Fund and American Independence Kansans Tax- Exempt Bond Fund incurred Compliance Service fees of $447 and $618, respectively, relating to services provided by ALPS.
Prior to September 24, 2018, the Predecessor Trust had contracted with Compliance Solutions Associates LLC (“CSA”) to provide services with respect to the evaluation and monitoring of the Trust’s compliance program pursuant to Rule 38a-1 of the 1940 Act.
Distribution: Effective September 24, 2018, ALPS Distributors, Inc. (“Distributor”) (an affiliate of ALPS) acts as the principal underwriter of each Fund’s shares pursuant to a Distribution Agreement with the Trust. Shares of each Fund are offered on a continuous basis through the Distributor, as agent of the Funds. The Distributor is not obligated to sell any particular amount of shares of the Funds and is not entitled to any compensation for its services as the Fund’s principal underwriter pursuant to the Distribution Agreement.
Each Fund has adopted a shareholder services plan (“Shareholder Services Plan”) for its Class A Shares. Under the Shareholder Services Plan each Fund is authorized to pay banks and their affiliates and other institutions, including broker-dealers and Fund affiliates (“Participating Organizations”), an aggregate fee in an amount not to exceed on an annual basis 0.25% of the average daily net asset value of each Fund’s Class A Shares to Participating Organizations as compensation for providing shareholder service activities, which do not include distribution services, pursuant to an agreement with a Participating Organization. Each Fund can pay distribution and service fees at an annual rate of up to 0.25% of its Class A share assets. Effective September 24, 2018 Class C merged into (load waived) Class A and the Class C shares no longer exist. Prior to September 24, 2018, the Class C shares could pay distribution and service fees at an annual rate of up to 1.00% of the Class C assets.
For the period ended September 30, 2018, a portion of the distribution or service fees were waived and/or assumed and paid by the prior Adviser, MFA, for the Class A shares assets. As of September 30, 2018, both Funds assessed the full 0.25% of distribution fees. For the period ended September 30, 2018, the Global Tactical Allocation Fund and Kansas Tax-Exempt Bond Fund Class A shares assessed 0.12% and 0.13%, respectively, of the shareholder services fees. As of October 31, 2017, the Global Tactical Allocation Fund and Kansas Tax-Exempt Bond Fund, assessed 0.13%, and 0.14%, respectively, of the shareholder services fees. Shareholder Services Plan fees are included on the Statements of Operations. Starting as of September 24, 2018 the board authorized 0.00% to be paid on shareholder servicing fees.
| 36 | www.americanindependence.com |
| American Independence Funds | Notes to Financial Statements |
September 30, 2018
Prior to September 24, 2018, Matrix 360 Distributors, LLC served as the Predecessor Funds' distributor pursuant to a prior Distribution Agreement.
Each Predecessor Fund has adopted a plan pursuant to Rule 12b-1 under the 1940 Act (the “Plan”) that allows its Class A shares and Class C shares to pay a distribution and service fee, as defined by the Financial Industry Regulatory Authority (“FINRA”), from its assets for selling and distributing its shares. Each Fund were permitted to pay distribution and service fees at an annual rate of up to 0.50% of its Class A share assets, and up to 1.00% of its Class C share assets. These fees consisted of up to 0.25% for shareholder services of the Class A share assets and Class C share assets, and up to 0.25% for distribution expenses, as defined by FINRA, of Class A share assets and up to 0.75% of Class C share assets. During the period ended September 21, 2018, a portion of the distribution or service fees were waived and/or assumed and paid by the prior Adviser, MFA, for the Class A shares assets of the Predecessor Funds. Effective September 24, 2018, the Funds adopted a plan pursuant to Rule 12b-1 under the 1940 Act (“Plan”) that allows its Class A shares to pay a distribution and service fee, as defined by the FINRA from its assets for selling and distributing its shares.
7. TRUSTEES
As of September 30, 2018, there were four Trustees, three of whom are not “interested persons” (as defined in the 1940 Act) of the Trust (“Independent Trustees”). Effective November 16, 2017, the Independent Trustees of the Trust receive a quarterly retainer of $6,000, plus $4,000 for each regular Board or Committee meeting attended and $2,000 for each special telephonic or in-person Board or Committee meeting attended. Additionally, the Audit Committee Chair receives a quarterly retainer of $1,250 and an Independent Chair receives a quarterly retainer of $2,500. The Independent Trustees are also reimbursed for all reasonable out-of-pocket expenses relating to attendance at meetings and for meeting-related expenses. Officers of the Trust and Trustees who are interested persons of the Trust receive no salary or fees from the Trust.
8. INDEMNIFICATIONS
Under the Trust’s organizational documents, its officers and Trustees are indemnified against certain liabilities arising out of the performance of their duties to the Trust. Additionally, in the normal course of business, the Trust enters into contracts with service providers that may contain general indemnification clauses which may permit indemnification to the extent permissible under applicable law. The Trust’s maximum exposure under these arrangements is unknown, as such exposure would involve future claims that may be made against the Trust that have not yet occurred.
9. SUBSEQUENT EVENTS
Subsequent events after the date of the Statements of Assets and Liabilities have been evaluated through the date the financial statements were issued.
On October 4, 2018, the SEC amended Regulation S-X to require certain financial statement disclosure requirements to conform them to US Generally Accepted Accounting Principles for investment companies. Effective November 4, 2018, the Funds adopted disclosure requirement changes for Regulation S-X and these changes are reflected throughout this report. The Funds’ adoption of those amendments, effective with the financial statements prepared as of September 30, 2018, had no effect on the Funds’ net assets or results of operations.
| Annual Report | September 30, 2018 | 37 |
| American Independence Funds | Report of Independent Registered Public Accounting Firm |
To the Shareholders of American Independence Global Tactical Allocation Fund and
American Independence Kansas Tax-Exempt Bond Fund and
Board of Trustees of ALPS Series Trust
Opinion on the Financial Statements
We have audited the accompanying statements of assets and liabilities, including the portfolios of investments, of American Independence Global Tactical Allocation Fund (formerly, American Independence JAForlines Global Tactical Allocation Fund) and American Independence Kansas Tax-Exempt Bond Fund (the “Funds”), each a series of ALPS Series Trust, as of September 30, 2018, and the related statements of operations and changes in net assets, including the related notes, and the financial highlights for the period November 1, 2017 through September 30, 2018 (collectively referred to as the “financial statements”). In our opinion, the financial statements present fairly, in all material respects, the financial position of each of the Funds as of September 30, 2018, the results of their operations, the changes in their net assets, and the financial highlights for the period indicated above, in conformity with accounting principles generally accepted in the United States of America.
The Funds’ financial statements and financial highlights for the years or periods ended October 31, 2017, and prior, were audited by other auditors whose report dated December 28, 2017, expressed an unqualified opinion on those financial statements and financial highlights.
Basis for Opinion
These financial statements are the responsibility of the Funds’ management. Our responsibility is to express an opinion on the Funds’ financial statements based on our audit. We are a public accounting firm registered with the Public Company Accounting Oversight Board (United States) (“PCAOB”) and are required to be independent with respect to the Funds in accordance with the U.S. federal securities laws and the applicable rules and regulations of the Securities and Exchange Commission and the PCAOB.
We conducted our audit in accordance with the standards of the PCAOB. Those standards require that we plan and perform the audit to obtain reasonable assurance about whether the financial statements are free of material misstatement, whether due to error or fraud.
Our audit included performing procedures to assess the risks of material misstatement of the financial statements, whether due to error or fraud, and performing procedures that respond to those risks. Such procedures included examining, on a test basis, evidence regarding the amounts and disclosures in the financial statements. Our procedures included confirmation of securities owned as of September 30, 2018, by correspondence with the custodian. Our audit also included evaluating the accounting principles used and significant estimates made by management, as well as evaluating the overall presentation of the financial statements. We believe that our audit provides a reasonable basis for our opinion.
We have served as the Funds’ auditor since 2018.

COHEN & COMPANY, LTD.
Cleveland, Ohio
November 29, 2018
| 38 | www.americanindependence.com |
| American Independence Funds | Additional Information |
September 30, 2018 (Unaudited)
1. PROXY VOTING POLICIES AND VOTING RECORD
A description of the policies and procedures that the Funds use to determine how to vote proxies relating to portfolio securities is available without charge, upon request, (i) by calling the Funds (toll-free) at 1-833-287-7933 or (ii) on the website of the Securities and Exchange Commission (“SEC”) at http://www.sec.gov.
Information regarding how the Funds voted proxies relating to portfolio securities during the most recent 12-month period ended June 30 is available (i) without charge, upon request, by calling the Funds (toll-free) at 1-833-287-7933 or (ii) on the SEC’s website at http://www.sec.gov.
2. PORTFOLIO HOLDINGS
The Funds file their complete schedule of portfolio holdings with the SEC for the first and third quarters of each fiscal year on Form N-Q. The Funds Forms N-Q are available on the SEC website at http://www.sec.gov. The Funds Forms N-Q may be reviewed and copied at the SEC’s Public Reference Room in Washington, D.C., and information on the operation of the Public Reference Room may be obtained by calling 1-800-SEC-0330.
3. TAX DESIGNATIONS
Qualified Dividend Income
The percentage of ordinary income dividends distributed during the calendar year ended December 31, 2017 are designated as qualified dividend income (QDI) as defined in Section 1(h)(11) of the Internal Revenue Code in the following percentages:
| Amount | |||
| Global Tactical Allocation Fund | 33.77% | ||
Dividends Received Deduction
For corporate shareholders, the following ordinary dividends paid during the calendar year ended December 31, 2017 qualify for the corporate dividends received deduction:
| Amount | |||
| Global Tactical Allocation Fund | 1.71% | ||
Pursuant to Section 852(b)(3) of the Internal Revenue Code, the Global Tactical Allocation Fund designated $201,676 as long-term capital gain dividends.
For the year ended September 30, 2018, 98.76% of the distributions from net investment income for Kansas Tax Exempt Bond Fund are exempt from federal income tax.
4. SHAREHOLDER PROXY RESULTS
At a Joint Special Meeting of Shareholders of the Predecessor Funds, held at the offices of American Independence Funds Trust at 75 Virginia Road, Box 14, North White Plains, New York 10603 on September 18, 2018, shareholders of record as of the close of business on July 16, 2018 voted to approve the following proposals:
Proposal 1: To approve an Agreement and Plan of Reorganization for the Predecessor GTA Fund.
| Shares Voted In Favor | Shares Voted Against or Abstentions | ||||||||
| 1,840,456 | 519,240 | ||||||||
Proposal 2: To approve an Agreement and Plan of Reorganization for the Predecessor Kansas Fund.
| Shares Voted In Favor | Shares Voted Against or Abstentions | ||||||||
| 12,105,731 | 13,325 | ||||||||
| Annual Report | September 30, 2018 | 39 |
| American Independence Funds | Additional Information |
September 30, 2018 (Unaudited)
5. DISCLOSURE REGARDING RENEWAL AND APPROVAL OF FUND ADVISORY AGREEMENT
On May 24, 2018, the Board of Trustees (“Board”) of ALPS Series Trust (“Trust”) met in person to discuss, among other things, the approval of the Investment Advisory Agreement between the Trust and Manifold Partners LLC (“Manifold Partners”), the Investment Sub-Advisory Agreement between Manifold Partners and Carret Asset Management (“Carret”), and the Investment Sub-Advisory Agreement between Manifold Partners and Lee Capital Management, LP (“Lee Capital”) in accordance with Section 15(c) of the 1940 Act. The Independent Trustees met with independent legal counsel during executive session and discussed the Investment Advisory Agreement and Investment Sub-Advisory Agreements and other related materials.
In approving the Investment Advisory Agreement with Manifold Partners, the Investment Sub-Advisory Agreement between Manifold Partners and Carret Asset Management with respect to the Kansas Tax Exempt Bond Fund, and the Investment Sub-Advisory Agreement between Manifold Partners and Lee Capital with respect to the Global Tactical Allocation Fund (together, “Funds”), the Trustees, including a majority of all the Independent Trustees, considered the following factors with respect to the Funds:
Investment Advisory Fee Rate: The Trustees reviewed and considered the proposed contractual annual advisory fees to be paid by the Trust of 0.75% of the Global Tactical Allocation Fund’s average daily net assets and 0.30% of the Kansas Bond Fund’s average daily net assets, considering the nature, extent and quality of the advisory services to be provided by Manifold Partners to the Funds. The Trustees considered that Manifold Partners would pay Lee Capital an annual fee of 0.375% of the Global Tactical Fund’s average daily net (less 50% of the total amount of waivers and reimbursement made to the Fund by the adviser), and that Manifold Partners would pay Carret an annual fee of 0.15% of the Kansas Bond Fund’s average daily net assets(less 50% of the total amount of waivers and reimbursement made to the Fund by the adviser).
The Trustees considered the information they received comparing each Fund’s contractual annual advisory fees and overall expenses with those of funds in each expense group and universe of funds provided by the Data Provider, an independent provider of investment company data (the “Data Provider”). The peer group for Global Tactical Allocation Fund consisted of tactical allocation funds identified by the Data Provider, and the peer group for Kansas Bond Fund consisted of single-state municipal bond funds identified by the Data Provider.
The Trustees noted that the Global Tactical Allocation Fund’s contractual advisory fee of 0.75% was below the Data Provider peer group median of 1.08% for Class A, and that the Fund’s projected total net expenses (after fee waiver and expense reimbursement) of 1.49% for Class A was below the Data Provider peer group average of 1.58%.
The Trustees noted that the Kansas Tax Exempt Bond Fund’s contractual advisory fee of .30% was below the Data Provider peer group median of 0.45% for Class A, and that the Fund’s projected total net expenses (after fee waiver and expense reimbursement) of .96% for Class A was above the Data Provider peer group average of 0.83%.
Nature, Extent and Quality of the Services under the Investment Advisory Agreement and Investment Sub-Advisory Agreements:
The Trustees received and considered information regarding the nature, extent and quality of services provided to the Funds under the Investment Advisory Agreement with Manifold Partners. The Trustees reviewed certain background materials supplied by Manifold Partners and each sub-adviser in its presentation, including each respective Form ADV and ownership structure.
The Trustees reviewed and considered Manifold Partners’ and each sub-adviser’s respective investment advisory personnel and its short history as an asset manager. The Trustees also discussed the research and decision-making processes utilized by Manifold Partners and each sub-adviser, including the methods adopted to seek to achieve compliance with the investment objectives, policies and restrictions of the Funds.
The Trustees considered the background and experience of Manifold Partners’ and each sub-adviser’s management relating to the Funds, including reviewing the qualifications, background and responsibilities of the portfolio managers primarily responsible for the day-to-day portfolio management of the Funds. The Trustees also considered the reputation of Manifold Partners and key personnel generally and its investment techniques, strategies, risk management controls and decision-making processes.
Performance: The Board noted that each Fund would be new and did not have a current track record, although each Fund intended to incorporate the track record of its Predecessor Fund upon completion of the contemplated reorganization into clone series of the Trust. They noted that the existing Kansas Tax-Exempt Bond Fund is currently sub-advised by Carret, and while the performance of the Predecessor Fund had trailed the peer group, the anticipated lower expenses after the contemplated reorganization could positively impact performance. The also discussed that the Predecessor Global Tactical Allocation Fund is not currently sub-advised. The Trustees noted that Lee Capital had provided performance information that indicated the firm could provide acceptable sub-advisory services to the Fund and its shareholders.
| 40 | www.americanindependence.com |
| American Independence Funds | Additional Information |
September 30, 2018 (Unaudited)
Comparable Accounts: The Board discussed the comparable accounts to be managed by Manifold Partners, as well as those managed by Carret, and the fee structure and servicing requirements for these products;
The Adviser’s and Sub-Advisers’ Profitability: The Trustees received and considered an estimated profitability analysis prepared by Manifold Partners based on the estimated fees to be paid under each Investment Advisory Agreement. The Trustees considered the profits, if any, anticipated to be realized by Manifold Partners and each sub-adviser relating to the operation of each Fund, noting that the Funds were not yet operational. The Trustees then reviewed and discussed Manifold Partners’ and each sub-adviser’s financial statements to analyze the financial condition and stability and profitability of each entity.
Economies of Scale: The Trustees considered whether economies of scale in the provision of services to each Fund would be passed along to the shareholders under the Investment Advisory Agreement. However, economies of scale were not anticipated at projected asset levels in the near term for either Fund, and the Board recommended Manifold Partners to consider breakpoints in the future if conditions warrant such a discussion.
Other Benefits to the Adviser and Sub-Advisers: The Trustees reviewed and considered any other incidental benefits derived or to be derived by Manifold Partners and each sub-adviser from its relationship with each Fund, including research and other support services.
The Board summarized its deliberations with respect to the Investment Advisory Agreement and each Investment Sub-Advisory Agreement. In evaluating Manifold Partners, Lee Capital, and Carret and the fees to be charged under each respective Investment Advisory Agreement and Investment Sub-Advisory Agreements, the Trustees concluded that no single factor reviewed by the Trustees was identified by the Trustees to be determinative as the principal factor in whether to approve the Investment Advisory Agreement and each Investment Sub-Advisory Agreement. Further, the Independent Trustees were advised by independent legal counsel throughout the process.
The Trustees, including all the Independent Trustees, concluded that:
| ● | The Trustees determined that the proposed annual advisory and sub-advisory fees for each Fund were not unreasonable; |
| ● | the terms of the fee waiver/expense reimbursement letter agreement between the Trust (on behalf of each Fund) and Manifold Partners were reasonable; |
| ● | the nature, extent and quality of services to be rendered by Manifold Partners and each sub-adviser under the Investment Advisory Agreement and Investment Sub-advisory Agreements were adequate; |
| ● | the performance of each Predecessor Fund was acceptable; |
| ● | bearing in mind the limitations of comparing different types of accounts and the different levels of service typically associated with such accounts, the fee structures applicable to Manifold Partners other clients employing a comparable strategy to each Fund was not indicative of any unreasonableness with respect to the advisory fee payable by such Fund. |
| ● | the estimated profitability of Manifold Partners and each sub-adviser relating to the management of each Fund was not unreasonable; and |
| ● | there were no material economies of scale or other material incidental benefits expected to accrue to Manifold Partners or either sub-adviser because of their respective relationships with the Funds during the initial term of the Investment Advisory Agreement and Investment Sub-Advisory Agreements. |
Based on the Trustees’ deliberations and their evaluation of the information described above, the Trustees, including a majority of the Independent Trustees, concluded each approval of the advisory agreement with Manifold Partners, and the sub-advisory agreement between Manifold Partners and each of Lee Capital and Carret’s was consistent with the best interests of each respective Fund and its shareholders.
| Annual Report | September 30, 2018 | 41 |
| American Independence Funds | Privacy Policy |
September 30, 2018 (Unaudited)
| FACTS | WHAT DO THE FUNDS DO WITH YOUR PERSONAL INFORMATION? |
| WHY? | Financial companies choose how they share your personal information. Federal law gives consumers the right to limit some but not all sharing. Federal law also requires us to tell you how we collect, share and protect your personal information. Please read this notice carefully to understand what we do. |
| WHAT? | The types of personal information we collect and share depend on the product or service you have with us. This information can include: |
● Social Security number and account transactions ● Account balances and transaction history ● Wire transfer instructions | |
| HOW? | All financial companies need to share customers’ personal information to run their everyday business. In the section below, we list the reasons financial companies can share their customers’ personal information, the reasons a Fund chooses to share, and whether you can limit this sharing. |
| REASONS WE CAN SHARE YOUR PERSONAL INFORMATION | DO THE FUNDS SHARE? | CAN YOU LIMIT THIS SHARING? |
For our everyday business purposes – such as to process your transactions, maintain your account(s), respond to court orders and legal investigations, or report to credit bureaus | Yes | No |
For our marketing purposes – to offer our products and services to you | No | We do not share. |
| For joint marketing with other financial companies | No | We do not share. |
For our affiliates’ everyday business purposes – information about your transactions and experiences | Yes | No |
For our affiliates’ everyday business purposes – information about your creditworthiness | No | We do not share. |
| For non-affiliates to market to you | No | We do not share. |
| QUESTIONS? | Call 1-888-266-8787 or go to www.americanindependence.com. |
| 42 | www.americanindependence.com |
| American Independence Funds | Privacy Policy |
September 30, 2018 (Unaudited)
| WHO WE ARE | |
| Who is providing this notice? | American Independence Global Tactical Allocation Fund and American Independence Kansas Tax-Exempt Bond Fund (the “Fund”) |
| WHAT WE DO | |
How do the Funds protect my personal information? | To protect your personal information from unauthorized access and use, we use security measures that comply with federal law. These measures include computer safeguards and secured files and buildings. |
How do the Funds collect my personal information? | We collect your personal information, for example, when you
● open an account ● provide account information or give us your contact information ● make a wire transfer or deposit money |
| Why can’t I limit all sharing? | Federal law gives you the right to limit only
● sharing for affiliates’ everyday business purposes-information about your creditworthiness ● affiliates from using your information to market to you ● sharing for non-affiliates to market to you
State laws and individual companies may give you additional rights to limit sharing. |
| DEFINITIONS | |
| Affiliates | Companies related by common ownership or control. They can be financial and nonfinancial companies. |
| Non-affiliates | Companies not related by common ownership or control. They can be financial and nonfinancial companies.
● The Funds do not share with non-affiliates so they can market to you. |
| Joint marketing | A formal agreement between non-affiliated financial companies that together market financial products or services to you.
● The Funds do not jointly market. |
| OTHER IMPORTANT INFORMATION | |
| California Residents | If your account has a California home address, your personal information will not be disclosed to nonaffiliated third parties except as permitted by applicable California law, and we will limit sharing such personal information with our affiliates to comply with California privacy laws that apply to us. |
| Annual Report | September 30, 2018 | 43 |
| American Independence Funds | Trustees & Officers |
September 30, 2018 (Unaudited)
INDEPENDENT TRUSTEES
| Name, Birth Year & Address* | Position(s) Held with Fund | Term of Office and Length of Time Served** | Principal Occupation(s) During Past 5 Years*** | Number of Funds in Fund Complex Overseen by Trustee**** | Other Directorships Held by Trustee During Past 5 Years*** |
| Ward D. Armstrong, Birth year: 1954 | Trustee and Chairman | Mr. Armstrong was appointed to the Board on May 27, 2016. Mr. Armstrong was appointed Chairman of the Board at the August 24, 2017 meeting of the Board of Trustees. | Retired; Managing Partner, NorthRock Partners, LLC (October 2013 to July 2015); Managing Director, NorthRock Partners, a Private Wealth Advisory Practice of Ameriprise Financial (February 2010 to October 2013); Senior Vice President, Ameriprise Financial, Inc. (November 1984 to May 2007); President, American Express Asset Management (2002 to 2004); and Chairman, Ameriprise Trust Company (November 1996 to May 2007). | 12 | Mr. Armstrong is a Director of the Heartland Group, Inc. (5 funds). |
| J. Wayne Hutchens, Birth year: 1944 | Trustee | Mr. Hutchens was elected to the Board on October 30, 2012. | Mr. Hutchens is currently retired. From April 2006 to December 2012, he served as President and CEO of the University of Colorado (CU) Foundation and from April 2009 to December 2012, he was Executive Director of the CU Real Estate Foundation. Mr. Hutchens is also Trustee of the Denver Museum of Nature and Science (2000 to present), Director of AMG National Trust Bank (June 2012 to present) and Trustee of Children’s Hospital Colorado (May 2012 to present). Prior to these positions, Mr. Hutchens spent 29 years in the banking industry, retiring as Chairman of Chase Bank Colorado. | 12 | Mr. Hutchens is a Director of RiverNorth Opportunities Fund, Inc. (2013 to present) |
| Patrick Seese, Birth year: 1971 | Trustee | Mr. Seese was elected to the Board on October 30, 2012. | Mr. Seese is an owner and a Managing Director of Integris Partners, a middle-market investment banking firm serving closely-held companies, financial sponsors and public companies (February 2008 to present). Prior to this, Mr. Seese was a Managing Director of Headwaters MB, a middle-market investing banking firm (December 2003 to February 2008). Prior to that, Mr. Seese worked in Credit Suisse First Boston’s Mergers and Acquisitions Group and served as Head of Corporation Development, Katy Industries, a publicly traded industrial and consumer products company and at Deloitte & Touche LLP, where he began his career in 1994. | 12 | Mr. Seese is a Director of The Mile High Five Foundation (2013 to present) and SJ Panthers Foundation (2016 to present) |
| 44 | www.americanindependence.com |
| American Independence Funds | Trustees & Officers |
September 30, 2018 (Unaudited)
INTERESTED TRUSTEE
| Name, Birth Year & Address* | Position(s) Held with Fund | Term of Office Time Served** | Principal Occupation(s) During Past 5 Years*** | Number of Funds in Fund Complex Overseen by Trustee**** | Other Directorships Held by Trustee During Past 5 Years*** |
| Jeremy O. May, Birth year: 1970 | Trustee and President | Mr. May was elected Trustee and President on October 30, 2012. Mr. May was Chairman from October 30, 2012 to August 24, 2017. | Mr. May joined ALPS in 1995 and is currently President and Director of ALPS Fund Services, Inc., ALPS Distributors, Inc., and ALPS Portfolio Solutions Distributor, Inc., Executive Vice President and Director of ALPS Holdings, Inc. and ALPS Advisors, Inc. Because of his positions with these entities, Mr. May is deemed an affiliate of the Trust as defined under the 1940 Act. Mr. May is also on the Board of Directors of the University of Colorado Foundation and the AV Hunter Trust. | 12 | Mr. May is Trustee of the Reaves Utility Income Fund (1 fund) and Elevation ETF Trust (1 ETF) and President and Director of RiverNorth Opportunities Fund, Inc. |
| Annual Report | September 30, 2018 | 45 |
| American Independence Funds | Trustees & Officers |
September 30, 2018 (Unaudited)
OFFICERS
| Name, Birth Year & Address* | Position(s) Held with Fund | Term of Office and Length of Time Served** | Principal Occupation(s) During Past 5 Years*** |
| Kimberly R. Storms, Birth year: 1972 | Treasurer | Ms. Storms was elected Treasurer of the Trust on October 30, 2012. | Ms. Storms is Senior Vice President and Director of Fund Administration of ALPS. Because of her position with ALPS, Ms. Storms is deemed an affiliate of the Trust as defined under the 1940 Act. Ms. Storms is also Treasurer of Financial Investors Trust, Liberty All-Star Equity Fund and Liberty All-Star Growth Fund, Inc. |
| Richard C. Noyes, Birth year: 1970 | Secretary | Mr. Noyes was elected Secretary of the Trust on November 14, 2016. | Mr. Noyes joined ALPS in 2015 and is Senior Vice President and General Counsel of ALPS. Prior to joining ALPS, Mr. Noyes served as Assistant Vice President and Senior Counsel of Janus Capital Management LLC. Mr. Noyes is deemed an affiliate of the Trust as defined under the 1940 Act. |
| Anne M. Berg, Birth year: 1973 | Assistant Secretary | Ms. Berg was elected Assistant Secretary of the Trust on August 23, 2018. | Ms. Berg joined ALPS as Senior Investment Company Act Paralegal in February 2017. Prior to joining ALPS, Anne was a Senior Legal Manager at Janus Capital Group Inc., a global investment manager in Denver, Colorado. Because of her position with ALPS, Ms. Berg is deemed an affiliate of the Trust as defined under the 1940 Act. |
| Alan Gattis*****, Birth year: 1980 | Assistant Treasurer | Mr. Gattis was elected Assistant Treasurer of the Trust on August 9, 2016. | Mr. Gattis joined ALPS in 2011 and is currently Vice President and Fund Controller of ALPS. Prior to joining ALPS, Mr. Gattis was an Auditor at Spicer Jeffries LLP (2009 through 2011) and an Auditor at PricewaterhouseCoopers LLP (2004 - 2009). Because of his position with ALPS, Mr. Gattis is deemed an affiliate of the Trust as defined under the 1940 Act. Mr. Gattis is also Assistant Treasurer of Elevation ETF Trust and Financial Investors Trust. |
| Lucas D. Foss, Birth Year: 1977 | Chief Compliance Officer (“CCO”) | Mr. Foss was elected CCO of the Trust on January 22, 2018. | Mr. Foss joined ALPS in November 2017 as Vice President and Deputy Chief Compliance Officer. Prior to his current role, Mr. Foss served as the Director of Compliance at Transamerica Asset Management (July 2015-November 2017). Deputy Chief Compliance Officer at ALPS (September 2012 – June 2015) Compliance Manager at ALPS (January 2010 - August 2012) and a Senior Compliance Analyst at ALPS (November 2006 – December 2009). Before joining ALPS, Mr. Foss held positions at Bisys Hedge Fund Services and Deutsche Asset Management. Because of his position with ALPS, Mr. Foss is deemed an affiliate of the Trust as defined under the 1940 Act. Mr. Foss is also CCO of Harvest Volatility Edge Trust and Goehring & Rozencwajg Investment Funds. |
| * | All communications to Trustees and Officers may be directed to ALPS Series Trust c/o 1290 Broadway, Suite 1100, Denver, CO 80203. |
| ** | This is the period for which the Trustee or Officer began serving the Trust. Each Trustee serves an indefinite term, until such Trustee’s successor is elected and appointed, or such Trustee resigns or is deceased. Officers are elected on an annual basis. |
| *** | Except as otherwise indicated, each individual has held the office shown or other offices in the same company for the last five years. |
| **** | The Fund Complex currently consists of 12 series of the Trust and any other investment companies for which Manifold Partners LLC, Lee Capital Management, L.P., or Carret Asset Management, LLC provides investment advisory services, currently none. |
| ***** | Mr. Gattis resigned effective November 15, 2018. |
| 46 | www.americanindependence.com |
Intentionally Left Blank
This material must be preceded or accompanied by a prospectus.
The American Independence Funds are distributed by ALPS Distributors, Inc
Table of Contents
| Shareholder Letter | 2 |
| Portfolio Update | |
| Beacon Accelerated Return Strategy Fund | 4 |
| Beacon Planned Return Strategy Fund | 6 |
| Disclosure of Fund Expenses | 8 |
| Portfolios of Investments | |
| Beacon Accelerated Return Strategy Fund | 10 |
| Beacon Planned Return Strategy Fund | 12 |
| Statements of Assets and Liabilities | 15 |
| Statements of Operations | 17 |
| Statement of Changes in Net Assets | |
| Beacon Accelerated Return Strategy Fund | 18 |
| Beacon Planned Return Strategy Fund | 19 |
| Financial Highlights | 20 |
| Notes to Financial Statements | 24 |
| Report of Independent Registered Public Accounting Firm | 38 |
| Additional Information | 39 |
| Privacy Policy | 40 |
| Trustees and Officers | 43 |
| Beacon Trust Funds | Shareholder Letter |
September 30, 2018 (Unaudited)
Through a disciplined process of trading options on market exposure, the Beacon Accelerated Return Strategy Fund and the Beacon Planned Return Strategy Fund (the “Beacon Funds”) seek to provide investors with targeted, stable returns based upon a particular market outlook. The strategies employ directional/enhanced, income and hedge return drivers to control risk, mitigate volatility and seek to deliver superior Sharpe Ratios over a full market cycle. The Beacon strategies manage both the upside potential and downside risk around a specific index to fit the market outlook, and risk and return boundaries of each investor. Our goal is to help investors avoid the irrational decision-making traps predicted by the study of behavioral finance by eliminating the temptation to market time or to make hasty, emotionally driven tactical asset allocation adjustments.
Since inception of the Beacon Funds on 10/2/17 through 9/30/18, BARLX was up 13.70% and BPRLX was up 7.64% versus the benchmark returns of 9.65% for the CBOE S&P 500 BuyWrite index and 0.11% for the HFRX Global Hedge Fund index. Both Funds maintain a top quartile peer group ranking since inception within their Morningstar category group. We attribute the outperformance of the Funds to the disciplined investment strategy that avoids behavioral mistakes and tactical errors through systematic monthly implementation and re-balancing process. Our directional market exposure, which we achieve through long call positions, added the most value, while portfolio hedges, or the long put positions, detracted from performance.
Funds maintained a steady risk profile, with Accelerated Return Strategy having a 0.7 beta to S&P 500, and Planned Return Strategy carrying a 0.4 beta to S&P 500. Both strategies continue to be negatively correlated to the Barclays Aggregate Bond index. We are proud of the risk mitigation provided by the Beacon Funds. During the 1/26/18 -2/8/18 market selloff when S&P 500 lost more than 10% of its value, BPRLX added 7% alpha and BARLX added 3% alpha, cushioning against a good portion of the market losses, while preserving a decent upside capture during the recovery. With the recent pick-up in market volatility (VIX), we expect to take advantage of lower valuations in equity markets through monthly options rolls and at the same time maintain a higher upside potential during the eventual recovery from the market lows.
As we enter the last quarter of 2018, several macro risks linger: global trade wars, the Fed's monetary tightening, flattening yield curve, rising retail bankruptcies, and geopolitical risks, to name a few. While we don't expect an imminent recession, we think that it is an appropriate time for investors to review the risk profile of their portfolios and to make sure that they have enough ballasts and hedges in place to protect the principal value of their portfolios during a downturn.
Historically, investors relied on fixed income instruments, such as Treasuries and corporate bonds, to diversify market risk. However, during a rising interest rate environment such as the one we are currently in, fixed income holdings no longer offer the protection that investors need. This is evidenced by the negative returns most fixed income sectors posted year-to-date.
We believe that Beacon Funds offer a superior solution to the dilemma investors face today, when traditional tools for portfolio diversification no longer work as intended. The Funds not only have very low sensitivity to interest rates, but they also benefit from rising rates by virtue of potentially higher payoff amounts from the systematic monthly investments, while maintaining a low risk profile.
Sincerely,
The Beacon Funds Management Team
| 2 | www.beacontrust.com |
| Beacon Trust Funds | Shareholder Letter |
September 30, 2018 (Unaudited)
Alpha is a measure of performance. It is the excess return of an investment relative to the return of a benchmark index.
Barclays Aggregate Bond index is a broad base index, often used to represent investment grade bonds being traded in United States.
Beta is a measure of volatility. It measures the systematic risk of a portfolio in comparison the market as a whole.
HFRX Global Hedge Fund index is an index that is designed to be representative of the overall composition of the hedge fund universe.
S&P 500 is an American stock market index based on the market capitalizations of 500 large companies having common stock listed on the NYSE or NASDAQ.
| Annual Report | September 30, 2018 | 3 |
| Beacon Accelerated Return Strategy Fund | Portfolio Update |
September 30, 2018 (Unaudited)
Performance of a Hypothetical $10,000 Initial Investment (at Inception* through September 30, 2018)
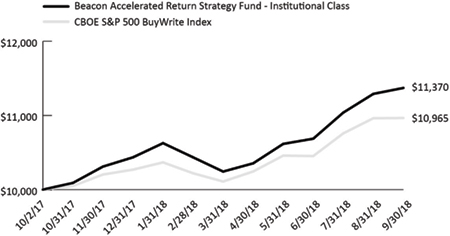
The graph shown above represents historical performance of a hypothetical investment of $10,000 in the Institutional Class. Due to differing expenses, performance of Class A will vary. Past performance does not guarantee future results. All returns reflect reinvested dividends, but do not reflect the deduction of taxes that a shareholder would pay on Fund distributions or the redemption of Fund shares.
Performance (as of September 30, 2018)
| 1 Month | 3 Month | 6 Month | YTD | Since Inception* | |
| Beacon Accelerated Return Strategy Fund – Class A | 0.71% | 6.31% | – | – | 4.73% |
| CBOE S&P 500 BuyWrite Index | 0.03% | 4.91% | – | – | 3.76% |
| Beacon Accelerated Return Strategy Fund – Institutional Class | 0.71% | 6.40% | 11.00% | 8.97% | 13.70% |
| CBOE S&P 500 BuyWrite Index | 0.03% | 4.91% | 8.47% | 6.78% | 9.65% |
The performance data quoted above represents past performance. Past performance is not a guarantee of future results. Investment return and value of the Fund shares will fluctuate so that an investor’s shares, when sold or redeemed, may be worth more or less than their original cost. Performance may be lower or higher than performance data quoted. Fund performance current to the most recent month end is available by calling (844) 814-9222 or by visiting www.beacontrust.com.
| * | Inception date of October 2, 2017 for Institutional Class. Inception date of June 8, 2018 for Class A. |
The Cboe S&P 500 BuyWrite Index (BXM) is a benchmark index designed to track the performance of a hypothetical buy-write strategy on the S&P 500 Index. The BXM is a passive total return index based on (1) buying an S&P 500 stock index portfolio, and (2) “writing” (or selling) the near-term S&P 500 Index (SPXSM) “covered” call option, generally on the third Friday of each month. The SPX call written will have about one month remaining to expiration, with an exercise price just above the prevailing index level (i.e., slightly out of the money). The SPX call is held until expiration and cash settled, at which time a new one-month, near-the-money call is written.
| 4 | www.beacontrust.com |
| Beacon Accelerated Return Strategy Fund | Portfolio Update |
September 30, 2018 (Unaudited)
Returns of less than 1 year are cumulative.
Indices are not actively managed and do not reflect a deduction for fees, expenses or taxes. An investor cannot invest directly in an index.
The returns shown above do not reflect the deduction of taxes a shareholder would pay on Fund distributions or redemption of Fund shares.
The total annual operating expenses and total annual operating expenses after fee waivers and/or reimbursement you may pay as an investor in the Fund’s Institutional Class shares (as reported in the January 29, 2018 Prospectus), are 1.37% and 1.37%, respectively. The Fund’s investment adviser has contractually agreed to limit expenses through January 31, 2019.
Top Ten Holdings (as a % of Net Assets)*
| Option Contract | Expiration Date | Strike Price | |
| S&P 500 Mini Index | 6/14/19 | 0.01 | 8.50% |
| S&P 500 Mini Index | 11/14/18 | 0.01 | 8.47% |
| S&P 500 Mini Index | 3/14/19 | 0.01 | 8.43% |
| S&P 500 Mini Index | 4/12/19 | 0.01 | 8.43% |
| S&P 500 Mini Index | 5/14/19 | 0.01 | 8.42% |
| S&P 500 Mini Index | 10/12/18 | 0.01 | 8.10% |
| S&P 500 Mini Index | 2/14/19 | 0.01 | 8.07% |
| S&P 500 Mini Index | 7/12/19 | 0.01 | 8.03% |
| S&P 500 Mini Index | 8/14/19 | 0.01 | 7.92% |
| S&P 500 Mini Index | 12/14/18 | 0.01 | 7.90% |
| Top Ten Holdings | 82.27% |
| Asset Allocation (as a % of Net Assets)* | |
| Purchased Option Contracts | 105.60% |
| Written Option Conctracts | (7.02)% |
| Cash, Cash Equivalents, & Other Assets in Excess of Liabilities | 1.42% |
| Total | 100.00% |
| * | Holdings are subject to change, and may not reflect the current or future position of the portfolio. |
| Annual Report | September 30, 2018 | 5 |
| Beacon Planned Return Strategy Fund | Portfolio Update |
September 30, 2018 (Unaudited)
Performance of a Hypothetical $10,000 Initial Investment (at Inception* through September 30, 2018)
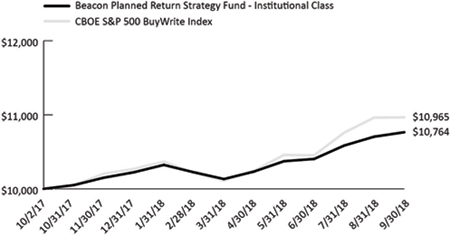
The graph shown above represents historical performance of a hypothetical investment of $10,000 in the Institutional Class. Due to differing expenses, performance of the Class A will vary. Past performance does not guarantee future results. All returns reflect reinvested dividends, but do not reflect the deduction of taxes that a shareholder would pay on Fund distributions or the redemption of Fund shares.
Performance (as of September 30, 2018)
| 1 Month | 3 Month | 6 Month | YTD | Since Inception* | |
| Beacon Planned Return Strategy Fund – Class A | 0.56% | 3.38% | – | – | 2.58% |
| CBOE S&P 500 BuyWrite Index | 0.03% | 4.91% | – | – | 3.76% |
| Beacon Planned Return Strategy Fund – Institutional Class | 0.56% | 3.47% | 6.24% | 5.30% | 7.64% |
| CBOE S&P 500 BuyWrite Index | 0.03% | 4.91% | 8.47% | 6.78% | 9.65% |
The performance data quoted above represents past performance. Past performance is not a guarantee of future results. Investment return and value of the Fund shares will fluctuate so that an investor’s shares, when sold or redeemed, may be worth more or less than their original cost. Performance may be lower or higher than performance data quoted. Fund performance current to the most recent month end is available by calling (844) 894-9222 or by visiting www.beacontrust.com.
| * | Inception date of October 2, 2017 for Institutional Class. Inception date of June 8, 2018 for Class A. |
The Cboe S&P 500 BuyWrite Index (BXM) is a benchmark index designed to track the performance of a hypothetical buy-write strategy on the S&P 500 Index. The BXM is a passive total return index based on (1) buying an S&P 500 stock index portfolio, and (2) “writing” (or selling) the near-term S&P 500 Index (SPXSM) “covered” call option, generally on the third Friday of each month. The SPX call written will have about one month remaining to expiration, with an exercise price just above the prevailing index level (i.e., slightly out of the money). The SPX call is held until expiration and cash settled, at which time a new one-month, near-the-money call is written.
| 6 | www.beacontrust.com |
| Beacon Planned Return Strategy Fund | Portfolio Update |
September 30, 2018 (Unaudited)
Returns of less than 1 year are cumulative.
Indices are not actively managed and do not reflect a deduction for fees, expenses or taxes. An investor cannot invest directly in an index.
The returns shown above do not reflect the deduction of taxes a shareholder would pay on Fund distributions or redemption of Fund shares.
The total annual operating expenses and total annual operating expenses after fee waivers and/or reimbursement you may pay as an investor in the Fund’s Institutional Class shares (as reported in the January 29, 2018 Prospectus), 1.32% and 1.32%, respectively. The Fund’s investment adviser has contractually agreed to limit expenses through January 31, 2019.
Top Ten Holdings (as a % of Net Assets)*
| Option Contract | Expiration Date | Strike Price | |
| S&P 500 Mini Index | 4/12/19 | 34.9 | 8.88% |
| S&P 500 Mini Index | 5/14/19 | 35.3 | 8.32% |
| S&P 500 Mini Index | 7/12/19 | 36.5 | 7.90% |
| S&P 500 Mini Index | 8/14/19 | 36.5 | 7.89% |
| S&P 500 Mini Index | 9/13/19 | 37.8 | 7.88% |
| S&P 500 Mini Index | 6/14/19 | 36.12 | 7.20% |
| S&P 500 Mini Index | 2/14/19 | 33.6 | 6.93% |
| S&P 500 Mini Index | 10/12/18 | 33.35 | 6.02% |
| S&P 500 Mini Index | 11/14/18 | 33.35 | 6.01% |
| S&P 500 Mini Index | 12/14/18 | 33.35 | 6.00% |
| Top Ten Holdings | 73.03% |
| Asset Allocation (as a % of Net Assets)* | |
| Purchased Option Contracts | 116.07% |
| Written Option Contracts | (17.24)% |
| Cash, Cash Equivalents, & Other Assets in Excess of Liabilities | 1.17% |
| Total | 100.00% |
| * | Holdings are subject to change, and may not reflect the current or future position of the portfolio. |
| Annual Report | September 30, 2018 | 7 |
| Beacon Trust Funds | Disclosure of Fund Expenses |
September 30, 2018 (Unaudited)
Example. As a shareholder of the Beacon Accelerated Return Strategy Fund or Beacon Planned Return Strategy Fund (the “Funds”), you incur two types of costs: (1) transaction costs; and (2) ongoing costs, including management fees and other Fund expenses. The following examples are intended to help you understand your ongoing costs (in dollars) of investing in a Fund and to compare these costs with the ongoing costs of investing in other mutual funds. The examples are based on an investment of $1,000 invested on April 1, 2018 and held through September 30, 2018.
Actual Expenses. The first line under each class in the following table provides information about actual account values and actual expenses. You may use the information in this line, together with the amount you invested, to estimate the expenses that you paid over the period. Simply divide your account value by $1,000 (for example, an $8,600 account value divided by $1,000 = 8.6), then multiply the result by the number in the first line under the heading “Expenses Paid During Period April 1, 2018 – September 30, 2018” to estimate the expenses you paid on your account during this period.
Hypothetical Example for Comparison Purposes. The second line under each class in the following table provides information about hypothetical account values and hypothetical expenses based on a Fund's actual expense ratio and an assumed rate of return of 5% per year before expenses, which is not the Fund's actual return. The hypothetical account values and expenses may not be used to estimate the actual ending account balance or expenses you paid for the period. You may use this information to compare the ongoing costs of investing in a Fund and other mutual funds. To do so, compare this 5% hypothetical example with the 5% hypothetical examples that appear in the shareholder reports of the other funds.
Please note that the expenses shown in the table are meant to highlight your ongoing Fund costs only and do not reflect any transactional costs. Therefore, the second line under each class in the table below is useful in comparing ongoing costs only and will not help you determine the relative total costs of owning different funds. In addition, if these transactional costs were included, your costs would have been higher.
| 8 | www.beacontrust.com |
| Beacon Trust Funds | Disclosure of Fund Expenses |
September 30, 2018 (Unaudited)
| Beginning Account Value April 1, 2018 | Ending Account Value September 30, 2018 | Expense Ratio(a) | Expenses Paid During Period April 1, 2018 - September 30, 2018(b) | |
| Beacon Accelerated Return Strategy Fund Class A | ||||
| Actual(c) | $1,000.00 | $1,047.30 | 1.61% | $5.01 |
| Hypothetical (5% return before expenses) | $1,000.00 | $1,017.00 | 1.61% | $8.14 |
| Institutional Class | ||||
| Actual | $1,000.00 | $1,110.00 | 1.25% | $6.61 |
| Hypothetical (5% return before expenses) | $1,000.00 | $1,018.80 | 1.25% | $6.33 |
| Beacon Planned Return Strategy Fund Class A | ||||
| Actual(c) | $1,000.00 | $1,025.80 | 1.56% | $4.81 |
| Hypothetical (5% return before expenses) | $1,000.00 | $1,017.25 | 1.56% | $7.89 |
| Institutional Class | ||||
| Actual | $1,000.00 | $1,062.40 | 1.22% | $6.31 |
| Hypothetical (5% return before expenses) | $1,000.00 | $1,018.95 | 1.22% | $6.17 |
| (a) | Each Fund’s expense ratios have been annualized based on the Fund’s actual expenses for the 6 month period ending September 30, 2018. |
| (b) | Expenses are equal to the annualized expense ratio shown above for the applicable class, multiplied by the average account value over the period, multiplied by the number of days in the most recent fiscal half year (183), divided by 365. |
| (c) | The actual expenses paid during the period is based on the commencement of operations on June 11th, 2018. |
| Annual Report | September 30, 2018 | 9 |
| Beacon Accelerated Return Strategy Fund | Portfolio of Investments |
September 30, 2018
| Counterparty | Expiration Date | Strike Price | Contracts | Notional Value | Value (Note 2) | |||||||||||||||
| PURCHASED OPTION CONTRACTS (105.60%) | ||||||||||||||||||||
| Call Option Contracts (105.60%) | ||||||||||||||||||||
| S&P 500® Mini Index: | ||||||||||||||||||||
| Jefferies | 10/12/2018 | $ | 0.01 | 430 | $ | 12,530,200 | $ | 12,523,169 | ||||||||||||
| Jefferies | 10/12/2018 | 255.15 | 240 | 6,993,600 | 871,964 | |||||||||||||||
| Jefferies | 10/12/2018 | 255.60 | 190 | 5,536,600 | 681,783 | |||||||||||||||
| Jefferies | 11/14/2018 | 0.01 | 450 | 13,113,000 | 13,090,027 | |||||||||||||||
| Jefferies | 11/14/2018 | 257.00 | 450 | 13,113,000 | 1,578,355 | |||||||||||||||
| Jefferies | 12/14/2018 | 0.01 | 420 | 12,238,800 | 12,202,996 | |||||||||||||||
| Jefferies | 12/14/2018 | 267.30 | 420 | 12,238,800 | 1,098,431 | |||||||||||||||
| Jefferies | 01/14/2019 | 0.01 | 415 | 12,093,100 | 12,047,895 | |||||||||||||||
| Jefferies | 01/14/2019 | 279.38 | 415 | 12,093,100 | 702,714 | |||||||||||||||
| Jefferies | 02/14/2019 | 0.01 | 430 | 12,530,200 | 12,467,922 | |||||||||||||||
| Jefferies | 02/14/2019 | 271.27 | 430 | 12,530,200 | 1,073,974 | |||||||||||||||
| Jefferies | 03/14/2019 | 0.01 | 450 | 13,113,000 | 13,031,971 | |||||||||||||||
| Jefferies | 03/14/2019 | 275.98 | 450 | 13,113,000 | 992,505 | |||||||||||||||
| Jefferies | 04/12/2019 | 0.01 | 450 | 13,113,000 | 13,022,544 | |||||||||||||||
| Jefferies | 04/12/2019 | 268.35 | 450 | 13,113,000 | 1,329,608 | |||||||||||||||
| Jefferies | 05/14/2019 | 0.01 | 450 | 13,113,000 | 13,007,278 | |||||||||||||||
| Jefferies | 05/14/2019 | 270.50 | 450 | 13,113,000 | 1,300,735 | |||||||||||||||
| Jefferies | 06/14/2019 | 0.01 | 455 | 13,258,700 | 13,134,587 | |||||||||||||||
| Jefferies | 06/14/2019 | 276.97 | 455 | 13,258,700 | 1,130,118 | |||||||||||||||
| Jefferies | 07/12/2019 | 0.01 | 430 | 12,530,200 | 12,402,933 | |||||||||||||||
| Jefferies | 07/12/2019 | 279.74 | 430 | 12,530,200 | 1,024,312 | |||||||||||||||
| Jefferies | 08/14/2019 | 0.01 | 425 | 12,384,500 | 12,242,639 | |||||||||||||||
| Jefferies | 08/14/2019 | 281.20 | 425 | 12,384,500 | 1,016,706 | |||||||||||||||
| Jefferies | 09/13/2019 | 0.01 | 365 | 10,636,100 | 10,501,986 | |||||||||||||||
| Jefferies | 09/13/2019 | 289.57 | 365 | 10,636,100 | 699,393 | |||||||||||||||
| 301,307,600 | 163,176,545 | |||||||||||||||||||
| TOTAL PURCHASED OPTION CONTRACTS (Cost $146,412,139) | 301,307,600 | 163,176,545 | ||||||||||||||||||
| 7 - Day Yield | Shares | Value (Note 2) | ||||||||||
| SHORT TERM INVESTMENTS (1.19%) | ||||||||||||
| Money Market Funds (1.19%) | ||||||||||||
| BlackRock Liquidity Funds, T-Fund Portfolio(a) | 1.43857 | % | 449,139 | 449,139 | ||||||||
| Invesco Short-Term Investments Trust Government & Agency Portfolio - Institutional Class | 1.92429 | % | 1,387,122 | 1,387,122 | ||||||||
| 1,836,261 | ||||||||||||
| TOTAL SHORT TERM INVESTMENTS (Cost $1,836,261) | 1,836,261 | |||||||||||
See Notes to Financial Statements.
| 10 | www.beacontrust.com |
| Beacon Accelerated Return Strategy Fund | Portfolio of Investments |
September 30, 2018
| TOTAL INVESTMENTS (106.79%) (Cost $148,248,400) | $ | 165,012,806 | ||
| Total Liabilities in Excess of Other Assets (-6.79%) | (10,484,515 | ) | ||
| NET ASSETS (100.00%) | $ | 154,528,291 |
| (a) | All or a portion is held as collateral at broker for written options. |
WRITTEN OPTION CONTRACTS (7.02%)
| Counterparty | Expiration Date | Strike Price | Contracts | Premiums Received | Notional Value | Value (Note 2) | ||||||||||||||||
| Call Option Contracts - (7.02%) | ||||||||||||||||||||||
| S&P 500® Mini Index: | ||||||||||||||||||||||
| Jefferies | 10/12/2018 | $ | 272.98 | (480 | ) | $ | 169,770 | $ | (13,987,200 | ) | $ | (894,386 | ) | |||||||||
| Jefferies | 10/12/2018 | 273.13 | (380 | ) | 140,099 | (11,073,200 | ) | (702,452 | ) | |||||||||||||
| Jefferies | 11/14/2018 | 275.80 | (900 | ) | 406,763 | (26,226,000 | ) | (1,554,334 | ) | |||||||||||||
| Jefferies | 12/14/2018 | 286.10 | (840 | ) | 369,555 | (24,477,600 | ) | (839,531 | ) | |||||||||||||
| Jefferies | 01/14/2019 | 299.66 | (830 | ) | 396,488 | (24,186,200 | ) | (288,040 | ) | |||||||||||||
| Jefferies | 02/14/2019 | 294.11 | (860 | ) | 538,102 | (25,060,400 | ) | (664,951 | ) | |||||||||||||
| Jefferies | 03/14/2019 | 298.42 | (900 | ) | 564,932 | (26,226,000 | ) | (577,395 | ) | |||||||||||||
| Jefferies | 04/12/2019 | 291.25 | (900 | ) | 596,432 | (26,226,000 | ) | (1,086,559 | ) | |||||||||||||
| Jefferies | 05/14/2019 | 292.50 | (900 | ) | 527,131 | (26,226,000 | ) | (1,134,658 | ) | |||||||||||||
| Jefferies | 06/14/2019 | 299.59 | (910 | ) | 470,198 | (26,517,400 | ) | (869,912 | ) | |||||||||||||
| Jefferies | 07/12/2019 | 301.00 | (860 | ) | 480,482 | (25,060,400 | ) | (852,832 | ) | |||||||||||||
| Jefferies | 08/14/2019 | 303.32 | (850 | ) | 486,798 | (24,769,000 | ) | (843,451 | ) | |||||||||||||
| Jefferies | 09/13/2019 | 311.03 | (730 | ) | 414,422 | (21,272,200 | ) | (537,737 | ) | |||||||||||||
| TOTAL WRITTEN OPTION CONTRACTS | $ | 5,561,172 | $ | (301,307,600 | ) | $ | (10,846,238 | ) | ||||||||||||||
See Notes to Financial Statements.
| Annual Report | September 30, 2018 | 11 |
| Beacon Planned Return Strategy Fund | Portfolio of Investments |
September 30, 2018
| Counterparty | Expiration Date | Strike Price | Contracts | Notional Value | Value (Note 2) | |||||||||||||
| PURCHASED OPTION CONTRACTS (116.07%) | ||||||||||||||||||
| Call Option Contracts (113.95%) | ||||||||||||||||||
| S&P 500® Mini Index: | ||||||||||||||||||
| Jefferies | 10/12/2018 | $ | 33.05 | 410 | $ | 11,947,400 | $ | 10,587,203 | ||||||||||
| Jefferies | 10/12/2018 | 33.35 | 820 | 23,894,800 | 21,149,826 | |||||||||||||
| Jefferies | 10/12/2018 | 254.60 | 410 | 11,947,400 | 1,512,082 | |||||||||||||
| Jefferies | 10/12/2018 | 255.63 | 820 | 23,894,800 | 2,939,981 | |||||||||||||
| Jefferies | 11/14/2018 | 33.05 | 410 | 11,947,400 | 10,575,678 | |||||||||||||
| Jefferies | 11/14/2018 | 33.35 | 820 | 23,894,800 | 21,126,826 | |||||||||||||
| Jefferies | 11/14/2018 | 254.60 | 410 | 11,947,400 | 1,533,555 | |||||||||||||
| Jefferies | 11/14/2018 | 255.63 | 820 | 23,894,800 | 2,985,060 | |||||||||||||
| Jefferies | 12/14/2018 | 33.05 | 410 | 11,947,400 | 10,564,136 | |||||||||||||
| Jefferies | 12/14/2018 | 33.35 | 820 | 23,894,800 | 21,103,787 | |||||||||||||
| Jefferies | 12/14/2018 | 254.60 | 410 | 11,947,400 | 1,560,037 | |||||||||||||
| Jefferies | 12/14/2018 | 255.63 | 820 | 23,894,800 | 3,039,872 | |||||||||||||
| Jefferies | 01/14/2019 | 33.05 | 410 | 11,947,400 | 10,557,090 | |||||||||||||
| Jefferies | 01/14/2019 | 33.35 | 820 | 23,894,800 | 21,089,744 | |||||||||||||
| Jefferies | 01/14/2019 | 254.60 | 410 | 11,947,400 | 1,597,033 | |||||||||||||
| Jefferies | 01/14/2019 | 255.63 | 820 | 23,894,800 | 3,115,510 | |||||||||||||
| Jefferies | 02/14/2019 | 33.60 | 950 | 27,683,000 | 24,382,012 | |||||||||||||
| Jefferies | 02/14/2019 | 35.35 | 270 | 7,867,800 | 6,882,784 | |||||||||||||
| Jefferies | 02/14/2019 | 257.80 | 950 | 27,683,000 | 3,503,781 | |||||||||||||
| Jefferies | 02/14/2019 | 271.50 | 270 | 7,867,800 | 669,054 | |||||||||||||
| Jefferies | 03/14/2019 | 35.35 | 460 | 13,404,400 | 11,713,017 | |||||||||||||
| Jefferies | 03/14/2019 | 35.94 | 775 | 22,583,500 | 19,688,642 | |||||||||||||
| Jefferies | 03/14/2019 | 271.50 | 460 | 13,404,400 | 1,184,525 | |||||||||||||
| Jefferies | 03/14/2019 | 275.50 | 775 | 22,583,500 | 1,739,513 | |||||||||||||
| Jefferies | 04/12/2019 | 34.90 | 1,225 | 35,696,500 | 31,229,533 | |||||||||||||
| Jefferies | 04/12/2019 | 267.60 | 1,225 | 35,696,500 | 3,696,717 | |||||||||||||
| Jefferies | 05/14/2019 | 35.30 | 1,150 | 33,511,000 | 29,242,090 | |||||||||||||
| Jefferies | 05/14/2019 | 270.80 | 1,150 | 33,511,000 | 3,296,039 | |||||||||||||
| Jefferies | 06/14/2019 | 36.12 | 1,000 | 29,140,000 | 25,317,208 | |||||||||||||
| Jefferies | 06/14/2019 | 276.97 | 1,000 | 29,140,000 | 2,483,777 | |||||||||||||
| Jefferies | 07/12/2019 | 36.50 | 1,100 | 32,054,000 | 27,790,405 | |||||||||||||
| Jefferies | 07/12/2019 | 280.00 | 1,100 | 32,054,000 | 2,598,962 | |||||||||||||
| Jefferies | 08/14/2019 | 36.50 | 1,100 | 32,054,000 | 27,758,410 | |||||||||||||
| Jefferies | 08/14/2019 | 281.40 | 1,100 | 32,054,000 | 2,615,507 | |||||||||||||
| Jefferies | 09/13/2019 | 37.80 | 1,105 | 32,199,700 | 27,716,060 | |||||||||||||
| Jefferies | 09/13/2019 | 289.70 | 1,105 | 32,199,700 | 2,107,770 | |||||||||||||
| 819,125,400 | 400,653,226 | |||||||||||||||||
| Put Option Contracts (2.12%) | ||||||||||||||||||
| S&P 500® Mini Index: | ||||||||||||||||||
| Jefferies | 10/12/2018 | 254.60 | 410 | 11,947,400 | 738 | |||||||||||||
| Jefferies | 10/12/2018 | 255.63 | 820 | 23,894,800 | 1,682 | |||||||||||||
| Jefferies | 11/14/2018 | 254.60 | 410 | 11,947,400 | 15,621 | |||||||||||||
| Jefferies | 11/14/2018 | 255.63 | 820 | 23,894,800 | 33,411 | |||||||||||||
See Notes to Financial Statements.
| 12 | www.beacontrust.com |
| Beacon Planned Return Strategy Fund | Portfolio of Investments |
September 30, 2018
| Jefferies | 12/14/2018 | 254.60 | 410 | 11,947,400 | 37,024 | |||||||||||||||
| Jefferies | 12/14/2018 | 255.63 | 820 | 23,894,800 | 77,910 | |||||||||||||||
| Jefferies | 01/14/2019 | 254.60 | 410 | 11,947,400 | 63,206 | |||||||||||||||
| Jefferies | 01/14/2019 | 255.63 | 820 | 23,894,800 | 131,754 | |||||||||||||||
| Jefferies | 02/14/2019 | 257.80 | 950 | 27,683,000 | 236,201 | |||||||||||||||
| Jefferies | 02/14/2019 | 271.50 | 270 | 7,867,800 | 107,068 | |||||||||||||||
| Jefferies | 03/14/2019 | 271.50 | 460 | 13,404,400 | 220,233 | |||||||||||||||
| Jefferies | 03/14/2019 | 275.50 | 775 | 22,583,500 | 421,632 | |||||||||||||||
| Jefferies | 04/12/2019 | 267.60 | 1,225 | 35,696,500 | 617,438 | |||||||||||||||
| Jefferies | 05/14/2019 | 270.80 | 1,150 | 33,511,000 | 738,587 | |||||||||||||||
| Jefferies | 06/14/2019 | 276.97 | 1,000 | 29,140,000 | 844,814 | |||||||||||||||
| Jefferies | 07/12/2019 | 280.00 | 1,100 | 32,054,000 | 1,087,259 | |||||||||||||||
| Jefferies | 08/14/2019 | 281.40 | 1,100 | 32,054,000 | 1,222,400 | |||||||||||||||
| Jefferies | 09/13/2019 | 289.70 | 1,105 | 32,199,700 | 1,572,266 | |||||||||||||||
| 409,562,700 | 7,429,244 | |||||||||||||||||||
| TOTAL PURCHASED OPTION CONTRACTS (Cost $364,506,870) | 1,228,688,100 | 408,082,470 | ||||||||||||||||||
| 7 - Day Yield | Shares | Value (Note 2) | ||||||||||
| SHORT TERM INVESTMENTS (1.30%) | ||||||||||||
| Money Market Funds (1.30%) | ||||||||||||
| BlackRock Liquidity Funds, T-Fund Portfolio(a) | 1.43857 | % | 842,231 | 842,231 | ||||||||
| Invesco Short-Term Investments Trust Government & Agency Portfolio - Institutional Class | 1.92429 | % | 3,743,222 | 3,743,222 | ||||||||
| 4,585,453 | ||||||||||||
| TOTAL SHORT TERM INVESTMENTS (Cost $4,585,453) | 4,585,453 | |||||||||||
| TOTAL INVESTMENTS (117.37%) (Cost $369,092,323) | $ | 412,667,923 | ||||||||||
| Total Liabilities in Excess of Other Assets (-17.37%) | (61,062,736 | ) | ||||||||||
| NET ASSETS (100.00%) | $ | 351,605,187 | ||||||||||
| (a) | All or a portion is held as collateral at broker for written options. |
See Notes to Financial Statements.
| Annual Report | September 30, 2018 | 13 |
| Beacon Planned Return Strategy Fund | Portfolio of Investments |
September 30, 2018
WRITTEN OPTION CONTRACTS (17.24%)
| Counterparty | Expiration Date | Strike Price | Contracts | Premiums Received | Notional Value | Value (Note 2) | ||||||||||||||||
| Put Option Contracts - (0.92%) | ||||||||||||||||||||||
| S&P 500® Mini Index: | ||||||||||||||||||||||
| Jefferies | 10/12/2018 | $ | 229.14 | (410 | ) | $ | 263,910 | $ | (11,947,400 | ) | $ | (13 | ) | |||||||||
| Jefferies | 10/12/2018 | 230.07 | (820 | ) | 534,596 | (23,894,800 | ) | (31 | ) | |||||||||||||
| Jefferies | 11/14/2018 | 229.14 | (410 | ) | 286,460 | (11,947,400 | ) | (2,783 | ) | |||||||||||||
| Jefferies | 11/14/2018 | 230.07 | (820 | ) | 583,796 | (23,894,800 | ) | (5,904 | ) | |||||||||||||
| Jefferies | 12/14/2018 | 229.14 | (410 | ) | 306,550 | (11,947,400 | ) | (11,189 | ) | |||||||||||||
| Jefferies | 12/14/2018 | 230.07 | (820 | ) | 627,256 | (23,894,800 | ) | (23,254 | ) | |||||||||||||
| Jefferies | 01/14/2019 | 229.14 | (410 | ) | 323,360 | (11,947,400 | ) | (22,634 | ) | |||||||||||||
| Jefferies | 01/14/2019 | 230.07 | (820 | ) | 658,416 | (23,894,800 | ) | (46,923 | ) | |||||||||||||
| Jefferies | 02/14/2019 | 232.02 | (950 | ) | 801,761 | (27,683,000 | ) | (93,487 | ) | |||||||||||||
| Jefferies | 02/14/2019 | 244.35 | (270 | ) | 239,942 | (7,867,800 | ) | (42,010 | ) | |||||||||||||
| Jefferies | 03/14/2019 | 244.35 | (460 | ) | 435,938 | (13,404,400 | ) | (95,448 | ) | |||||||||||||
| Jefferies | 03/14/2019 | 247.95 | (775 | ) | 689,517 | (22,583,500 | ) | (180,611 | ) | |||||||||||||
| Jefferies | 04/12/2019 | 240.84 | (1,225 | ) | 1,073,054 | (35,696,500 | ) | (284,203 | ) | |||||||||||||
| Jefferies | 05/14/2019 | 243.72 | (1,150 | ) | 890,909 | (33,511,000 | ) | (356,654 | ) | |||||||||||||
| Jefferies | 06/14/2019 | 249.27 | (1,000 | ) | 747,702 | (29,140,000 | ) | (421,045 | ) | |||||||||||||
| Jefferies | 07/12/2019 | 252.00 | (1,100 | ) | 804,058 | (32,054,000 | ) | (554,680 | ) | |||||||||||||
| Jefferies | 08/14/2019 | 253.26 | (1,100 | ) | 889,577 | (32,054,000 | ) | (642,246 | ) | |||||||||||||
| Jefferies | 09/13/2019 | 260.73 | (1,105 | ) | 791,961 | (32,199,700 | ) | (465,255 | ) | |||||||||||||
| 10,948,763 | (409,562,700 | ) | (3,248,370 | ) | ||||||||||||||||||
| Call Option Contracts - (16.32%) | ||||||||||||||||||||||
| S&P 500® Mini Index: | ||||||||||||||||||||||
| Jefferies | 10/12/2018 | 263.71 | (820 | ) | 604,911 | (23,894,800 | ) | (2,280,447 | ) | |||||||||||||
| Jefferies | 10/12/2018 | 264.90 | (1,640 | ) | 1,264,362 | (47,789,600 | ) | (4,366,938 | ) | |||||||||||||
| Jefferies | 11/14/2018 | 264.43 | (820 | ) | 627,871 | (23,894,800 | ) | (2,289,307 | ) | |||||||||||||
| Jefferies | 11/14/2018 | 266.00 | (1,640 | ) | 1,323,402 | (47,789,600 | ) | (4,332,705 | ) | |||||||||||||
| Jefferies | 12/14/2018 | 265.22 | (820 | ) | 648,371 | (23,894,800 | ) | (2,302,120 | ) | |||||||||||||
| Jefferies | 12/14/2018 | 266.85 | (1,640 | ) | 1,357,842 | (47,789,600 | ) | (4,357,081 | ) | |||||||||||||
| Jefferies | 01/14/2019 | 265.90 | (820 | ) | 668,051 | (23,894,800 | ) | (2,344,616 | ) | |||||||||||||
| Jefferies | 01/14/2019 | 267.75 | (1,640 | ) | 1,384,082 | (47,789,600 | ) | (4,417,102 | ) | |||||||||||||
| Jefferies | 02/14/2019 | 270.40 | (1,900 | ) | 1,652,921 | (55,366,000 | ) | (4,887,070 | ) | |||||||||||||
| Jefferies | 02/14/2019 | 284.72 | (540 | ) | 569,535 | (15,735,600 | ) | (762,876 | ) | |||||||||||||
| Jefferies | 03/14/2019 | 285.75 | (920 | ) | 996,085 | (26,808,800 | ) | (1,334,563 | ) | |||||||||||||
| Jefferies | 03/14/2019 | 288.48 | (1,550 | ) | 1,644,094 | (45,167,000 | ) | (1,947,082 | ) | |||||||||||||
| Jefferies | 04/12/2019 | 280.25 | (2,450 | ) | 2,626,308 | (71,393,000 | ) | (4,888,675 | ) | |||||||||||||
| Jefferies | 05/14/2019 | 283.13 | (2,300 | ) | 2,126,828 | (67,022,000 | ) | (4,387,934 | ) | |||||||||||||
| Jefferies | 06/14/2019 | 289.25 | (2,000 | ) | 2,043,414 | (58,280,000 | ) | (3,185,642 | ) | |||||||||||||
| Jefferies | 07/12/2019 | 292.00 | (2,200 | ) | 2,158,117 | (64,108,000 | ) | (3,355,861 | ) | |||||||||||||
| Jefferies | 08/14/2019 | 293.89 | (2,200 | ) | 2,234,565 | (64,108,000 | ) | (3,367,855 | ) | |||||||||||||
| Jefferies | 09/13/2019 | 302.10 | (2,210 | ) | 2,025,932 | (64,399,400 | ) | (2,564,170 | ) | |||||||||||||
| 25,956,691 | (819,125,400 | ) | (57,372,044 | ) | ||||||||||||||||||
| TOTAL WRITTEN OPTION CONTRACTS | $ | 36,905,454 | $ | (1,228,688,100 | ) | $ | (60,620,414 | ) | ||||||||||||||
See Notes to Financial Statements.
| 14 | www.beacontrust.com |
| Beacon Trust Funds | Statements of Assets and Liabilities |
September 30, 2018
| BEACON ACCELERATED RETURN STRATEGY FUND | BEACON PLANNED RETURN STRATEGY FUND | |||||||
| ASSETS: | ||||||||
| Investments, at value (Cost $148,248,400 and $369,092,323) | $ | 165,012,806 | $ | 412,667,923 | ||||
| Cash | 3,209 | 6,775 | ||||||
| Cash held at broker for written options | 609,720 | 107,804 | ||||||
| Receivable for shares sold | 6,500 | – | ||||||
| Dividends receivable | 119 | 241 | ||||||
| Prepaid offering cost | 233 | 230 | ||||||
| Other assets | 8,658 | 23,336 | ||||||
| Total Assets | 165,641,245 | 412,806,309 | ||||||
| LIABILITIES: | ||||||||
| Written options, at value (premiums received $5,561,172 and $36,905,454) | 10,846,238 | 60,620,414 | ||||||
| Administration and transfer agency fees payable | 38,069 | 84,473 | ||||||
| Payable to adviser | 126,935 | 288,156 | ||||||
| Payable for distribution and service fees | 57,833 | 131,992 | ||||||
| Payable for printing | 531 | 1,178 | ||||||
| Payable for professional fees | 22,181 | 27,498 | ||||||
| Payable to trustees | 3,597 | 8,172 | ||||||
| Payable to chief compliance officer | 1,528 | 3,472 | ||||||
| Accrued expenses and other liabilities | 16,042 | 35,767 | ||||||
| Total Liabilities | 11,112,954 | 61,201,122 | ||||||
| NET ASSETS | $ | 154,528,291 | $ | 351,605,187 | ||||
| NET ASSETS CONSIST OF: | ||||||||
| Paid-in capital (Note 6) | $ | 136,544,775 | $ | 327,199,049 | ||||
| Total distributable earnings | 17,983,516 | 24,406,138 | ||||||
| NET ASSETS | $ | 154,528,291 | $ | 351,605,187 | ||||
| PRICING OF SHARES | ||||||||
| Class A: | ||||||||
| Net Asset Value, offering and redemption price per share | $ | 11.29 | $ | 10.72 | ||||
| Net Assets | $ | 10,470 | $ | 10,257 | ||||
| Shares of beneficial interest outstanding | 927 | 957 | ||||||
| Maximum offering price per share (NAV/0.95, based on maximum sales charge of 5.00% of the offering price) | $ | 11.89 | $ | 11.28 | ||||
See Notes to Financial Statements.
| Annual Report | September 30, 2018 | 15 |
| Beacon Trust Funds | Statements of Assets and Liabilities |
September 30, 2018
BEACON | BEACON PLANNED RETURN STRATEGY FUND | |||||||
| Institutional Class: | ||||||||
| Net Asset Value, offering and redemption price per share | $ | 11.30 | $ | 10.73 | ||||
| Net Assets | $ | 154,517,821 | $ | 351,594,930 | ||||
| Shares of beneficial interest outstanding | 13,669,359 | 32,764,886 | ||||||
See Notes to Financial Statements.
| 16 | www.beacontrust.com |
| Beacon Trust Funds | Statements of Operations |
For the Period October 2, 2017 (Commencement of Operations) to September 30, 2018
| BEACON ACCELERATED RETURN STRATEGY FUND | BEACON PLANNED RETURN STRATEGY FUND | |||||||
| INVESTMENT INCOME: | ||||||||
| Dividends | $ | 53,464 | $ | 87,955 | ||||
| Total Investment Income | 53,464 | 87,955 | ||||||
| EXPENSES: | ||||||||
| Investment advisory fees (Note 7) | 1,414,516 | 3,372,905 | ||||||
| Administration fees | 115,293 | 269,694 | ||||||
| Distribution and Shareholder service fees: | ||||||||
| Class A | 12 | 12 | ||||||
| Institutional Class | 129,783 | 314,397 | ||||||
| Custodian fees | 5,096 | 7,009 | ||||||
| Legal fees | 13,040 | 31,238 | ||||||
| Audit and tax fees | 19,000 | 19,000 | ||||||
| Transfer agent fees | 28,927 | 68,279 | ||||||
| Trustees fees and expenses | 10,784 | 25,459 | ||||||
| Registration and filing fees | 22,577 | 29,012 | ||||||
| Printing fees | 3,024 | 7,344 | ||||||
| Chief compliance officer fees | 8,824 | 21,015 | ||||||
| Insurance expense | 2,035 | 6,372 | ||||||
| Offering costs | 50,245 | 50,150 | ||||||
| Other expenses | 3,791 | 6,127 | ||||||
| Total Expenses | 1,826,947 | 4,228,013 | ||||||
| NET INVESTMENT LOSS | (1,773,483 | ) | (4,140,058 | ) | ||||
| REALIZED AND UNREALIZED GAIN/(LOSS) ON INVESTMENTS AND WRITTEN OPTIONS: | ||||||||
| Net realized gain/(loss) on: | ||||||||
| Investments | 15,737,296 | 26,398,586 | ||||||
| Written options | (6,639,638 | ) | (16,633,484 | ) | ||||
| Net realized gain | 9,097,658 | 9,765,102 | ||||||
| Change in unrealized appreciation/depreciation) on: | ||||||||
| Investments | 16,764,406 | 43,575,600 | ||||||
| Written options | (5,285,066 | ) | (23,714,960 | ) | ||||
| Net change | 11,479,340 | 19,860,640 | ||||||
| NET REALIZED AND UNREALIZED GAIN ON INVESTMENTS AND WRITTEN OPTIONS | 20,576,998 | 29,625,742 | ||||||
| NET INCREASE IN NET ASSETS RESULTING FROM OPERATIONS | $ | 18,803,515 | $ | 25,485,684 | ||||
See Notes to Financial Statements.
| Annual Report | September 30,2018 | 17 |
Beacon Accelerated
| Return Strategy Fund | Statement of Changes in Net Assets |
| For the Period Ended September 30, 2018(a) | ||||
| OPERATIONS: | ||||
| Net investment loss | $ | (1,773,483 | ) | |
| Net realized gain on investments and written options | 9,097,658 | |||
| Net change in unrealized appreciation on investments and written options | 11,479,340 | |||
| Net increase in net assets resulting from operations | 18,803,515 | |||
| DISTRIBUTIONS TO SHAREHOLDERS: | ||||
| Class A | – | |||
| Class I | (870,244 | ) | ||
| Total distributions | (870,244 | ) | ||
| BENEFICIAL SHARE TRANSACTIONS (Note 6): | ||||
| Class A:(b) | ||||
| Shares sold | 10,000 | |||
| Net increase from beneficial share transactions | 10,000 | |||
| Institutional Class: | ||||
| Shares sold | 151,518,922 | |||
| Dividends reinvested | 153,524 | |||
| Shares redeemed | (15,087,426 | ) | ||
| Net increase from beneficial share transactions | 136,585,020 | |||
| Net increase in net assets | 154,528,291 | |||
| NET ASSETS: | ||||
| Beginning of period | – | |||
| End of period | $ | 154,528,291 | ||
| (a) | Commenced operations October 2, 2017. |
| (b) | Commenced operations June 11, 2018. |
See Notes to Financial Statements.
| 18 | www.beacontrust.com |
Beacon Planned
| Return Strategy Fund | Statement of Changes in Net Assets |
| For the Period Ended September 30, 2018(a) | ||||
| OPERATIONS: | ||||
| Net investment loss | $ | (4,140,058 | ) | |
| Net realized gain on investments and written options | 9,765,102 | |||
| Net change in unrealized appreciation on investments and written options | 19,860,640 | |||
| Net increase in net assets resulting from operations | 25,485,684 | |||
| DISTRIBUTIONS TO SHAREHOLDERS: | ||||
| Class A | – | |||
| Class I | (1,129,696 | ) | ||
| Total distributions | (1,129,696 | ) | ||
| BENEFICIAL SHARE TRANSACTIONS (Note 6): | ||||
| Class A:(b) | ||||
| Shares sold | 10,000 | |||
| Net increase from beneficial share transactions | 10,000 | |||
| Institutional Class: | ||||
| Shares sold | 370,673,094 | |||
| Dividends reinvested | 293,880 | |||
| Shares redeemed | (43,727,775 | ) | ||
| Net increase from beneficial share transactions | 327,239,199 | |||
| Net increase in net assets | 351,605,187 | |||
| NET ASSETS: | ||||
| Beginning of period | – | |||
| End of period | $ | 351,605,187 | ||
| (a) | Commenced operations October 2, 2017. |
| (b) | Commenced operations June 11, 2018. |
See Notes to Financial Statements.
| Annual Report | September 30, 2018 | 19 |
Beacon Accelerated
| Return Strategy Fund – Class A | Financial Highlights |
For a Share Outstanding Throughout the Period Presented
For the Period June 11, 2018 | ||||
| NET ASSET VALUE, BEGINNING OF PERIOD | $ | 10.78 | ||
| INCOME/(LOSS) FROM OPERATIONS: | ||||
| Net investment loss(a) | (0.05 | ) | ||
| Net realized and unrealized gain on investments and written options | 0.56 | |||
| Total from investment operations | 0.51 | |||
| NET INCREASE IN NET ASSET VALUE | 0.51 | |||
| NET ASSET VALUE, END OF PERIOD | $ | 11.29 | ||
| TOTAL RETURN(b) | 4.73 | % | ||
| SUPPLEMENTAL DATA: | ||||
| Net assets, end of period (in 000s) | $ | 10 | ||
| RATIOS TO AVERAGE NET ASSETS | ||||
| Operating expenses | 1.61 | %(c)(d) | ||
| Net investment loss | (1.57 | %)(c) | ||
| PORTFOLIO TURNOVER RATE(e)(f) | 0 | % | ||
| (a) | Per share amounts are based upon average shares outstanding. |
| (b) | Assumes an initial investment on the business day before the first day of the fiscal period, with all dividends and distributions reinvested in additional shares on the reinvestment date, and redemption at the net asset value calculated on the last business day of the fiscal year. Total returns are for the period indicated and have not been annualized. Returns shown do not reflect the deduction of taxes that a shareholder would pay on Fund distributions or the redemption of Fund share. Returns shown exclude any applicable sales charge. |
| (c) | Annualized. |
| (d) | According to the Fund's shareholder services plan with respect to the Fund's Class A shares, any amount of fees accrued according to the plan but not paid during the Fund's fiscal year for such service activities shall be reimbursed to the Fund as soon as practical. Fees were reimbursed to the Fund during the period ended September 30, 2018, respectively, in the amount of 0.11% (annualized) and 0.11% of average net assets of Class A shares. |
| (e) | Portfolio turnover rate for periods less than one full year have not been annualized. |
| (f) | All securities whose maturity or expiration date at time of acquisition were one year or less are excluded from the portfolio turnover calculation. |
See Notes to Financial Statements.
| 20 | www.beacontrust.com |
Beacon Accelerated
| Return Strategy Fund – Institutional Class | Financial Highlights |
For a Share Outstanding Throughout the Period Presented
| For the Period October 2, 2017 (Commencement of Operations) to September 30, 2018 | ||||
| NET ASSET VALUE, BEGINNING OF PERIOD | $ | 10.00 | ||
| INCOME/(LOSS) FROM OPERATIONS: | ||||
| Net investment loss(a) | (0.13 | ) | ||
| Net realized and unrealized gain on investments and written options | 1.49 | |||
| Total from investment operations | 1.36 | |||
| LESS DISTRIBUTIONS: | ||||
| From net realized gains on investments | (0.06 | ) | ||
| Total distributions | (0.06 | ) | ||
| NET INCREASE IN NET ASSET VALUE | 1.30 | |||
| NET ASSET VALUE, END OF PERIOD | $ | 11.30 | ||
| TOTAL RETURN(b) | 13.70 | % | ||
| SUPPLEMENTAL DATA: | ||||
| Net assets, end of period (in 000s) | $ | 154,518 | ||
| RATIOS TO AVERAGE NET ASSETS | ||||
| Operating expenses | 1.29 | %(c)(d) | ||
| Net investment loss | (1.25 | %)(c) | ||
| PORTFOLIO TURNOVER RATE(e)(f) | 0 | % | ||
| (a) | Per share amounts are based upon average shares outstanding. |
| (b) | Assumes an initial investment on the business day before the first day of the fiscal period, with all dividends and distributions reinvested in additional shares on the reinvestment date, and redemption at the net asset value calculated on the last business day of the fiscal year. Total returns are for the period indicated and have not been annualized. Returns shown do not reflect the deduction of taxes that a shareholder would pay on Fund distributions or the redemption of Fund share. |
| (c) | Annualized. |
| (d) | According to the Fund's shareholder services plan with respect to the Fund's Institutional Class shares, any amount of fees accrued according to the plan but not paid during the Fund's fiscal year for such service activities shall be reimbursed to the Fund as soon as practical. Fees were reimbursed to the Fund during the period ended September 30, 2018, respectively, in the amount of 0.06% (annualized) and 0.06% of average net assets of Institutional Class shares. |
| (e) | Portfolio turnover rate for periods less than one full year have not been annualized. |
| (f) | All securities whose maturity or expiration date at time of acquisition were one year or less are excluded from the portfolio turnover calculation. |
See Notes to Financial Statements.
| Annual Report | September 30, 2018 | 21 |
Beacon Planned
| Return Strategy Fund – Class A | Financial Highlights |
For a Share Outstanding Throughout the Period Presented
| For the Period June 11, 2018 (Commencement of Operations) to September 30, 2018 | ||||
| NET ASSET VALUE, BEGINNING OF PERIOD | $ | 10.45 | ||
| INCOME/(LOSS) FROM OPERATIONS: | ||||
| Net investment loss(a) | (0.05 | ) | ||
| Net realized and unrealized gain on investments and written options | 0.32 | |||
| Total from investment operations | 0.27 | |||
| NET INCREASE IN NET ASSET VALUE | 0.27 | |||
| NET ASSET VALUE, END OF PERIOD | $ | 10.72 | ||
| TOTAL RETURN(b) | 2.58 | % | ||
| SUPPLEMENTAL DATA: | ||||
| Net assets, end of period (in 000s) | $ | 10 | ||
| RATIOS TO AVERAGE NET ASSETS | ||||
| Operating expenses | 1.56 | %(c)(d) | ||
| Net investment loss | (1.53 | %)(c) | ||
| PORTFOLIO TURNOVER RATE(e)(f) | 0 | % | ||
| (a) | Per share amounts are based upon average shares outstanding. |
| (b) | Assumes an initial investment on the business day before the first day of the fiscal period, with all dividends and distributions reinvested in additional shares on the reinvestment date, and redemption at the net asset value calculated on the last business day of the fiscal year. Total returns are for the period indicated and have not been annualized. Returns shown do not reflect the deduction of taxes that a shareholder would pay on Fund distributions or the redemption of Fund share. Returns shown exclude any applicable sales charge. |
| (c) | Annualized. |
| (d) | According to the Fund's shareholder services plan with respect to the Fund's Class A shares, any amount of fees accrued according to the plan but not paid during the Fund's fiscal year for such service activities shall be reimbursed to the Fund as soon as practical. Fees were reimbursed to the Fund during the period ended September 30, 2018, respectively, in the amount of 0.11% (annualized) and 0.11% of average net assets of Class A shares. |
| (e) | Portfolio turnover rate for periods less than one full 'year have not been annualized. |
| (f) | All securities whose maturity or expiration date at time of acquisition were one year or less are excluded from the portfolio turnover calculation. |
See Notes to Financial Statements.
| 22 | www.beacontrust.com |
Beacon Planned
| Return Strategy Fund – Institutional Class | Financial Highlights |
For a Share Outstanding Throughout the Period Presented
| For the Period October 2, 2017 (Commencement of Operations) to September 30, 2018 | ||||
| NET ASSET VALUE, BEGINNING OF PERIOD | $ | 10.00 | ||
| INCOME/(LOSS) FROM OPERATIONS: | ||||
| Net investment loss(a) | (0.13 | ) | ||
| Net realized and unrealized gain on investments and written options | 0.89 | |||
| Total from investment operations | 0.76 | |||
| LESS DISTRIBUTIONS: | ||||
| From net realized gains on investments | (0.03 | ) | ||
| Total distributions | (0.03 | ) | ||
| NET INCREASE IN NET ASSET VALUE | 0.73 | |||
| NET ASSET VALUE, END OF PERIOD | $ | 10.73 | ||
| TOTAL RETURN(b) | 7.64 | % | ||
| SUPPLEMENTAL DATA: | ||||
| Net assets, end of period (in 000s) | $ | 351,595 | ||
| RATIOS TO AVERAGE NET ASSETS | ||||
| Operating expenses | 1.25 | %(c)(d) | ||
| Net investment loss | (1.23 | %)(c) | ||
| PORTFOLIO TURNOVER RATE(e)(f) | 0 | % | ||
| (a) | Per share amounts are based upon average shares outstanding. |
| (b) | Assumes an initial investment on the business day before the first day of the fiscal period, with all dividends and distributions reinvested in additional shares on the reinvestment date, and redemption at the net asset value calculated on the last business day of the fiscal year. Total returns are for the period indicated and have not been annualized. Returns shown do not reflect the deduction of taxes that a shareholder would pay on Fund distributions or the redemption of Fund share. |
| (c) | Annualized. |
| (d) | According to the Fund's shareholder services plan with respect to the Fund's Institutional Class shares, any amount of fees accrued according to the plan but not paid during the Fund's fiscal year for such service activities shall be reimbursed to the Fund as soon as practical. Fees were reimbursed to the Fund during the period ended September 30, 2018, respectively, in the amount of 0.06% (annualized) and 0.06% of average net assets of Institutional Class shares. |
| (e) | Portfolio turnover rate for periods less than one full year have not been annualized. |
| (f) | All securities whose maturity or expiration date at time of acquisition were one year or less are excluded from the portfolio turnover calculation. |
See Notes to Financial Statements.
| Annual Report | September 30, 2018 | 23 |
| Beacon Trust Funds | Notes to Financial Statements |
September 30, 2018
1. ORGANIZATION
ALPS Series Trust (the "Trust"), a Delaware statutory trust, is an open-end management investment company registered under the Investment Company Act of 1940, as amended (the "1940 Act"). The Trust consists of multiple separate portfolios or series. This Annual Report describes the Beacon Accelerated Return Strategy Fund and the Beacon Planned Return Strategy Fund (each, a "Fund" and collectively, the "Funds"). The Funds are non-diversified and the primary investment objectives are to deliver capital appreciation and generate positive alpha for the Beacon Accelerated Return Strategy Fund, and capital preservation and capital appreciation for the Beacon Planned Return Strategy Fund. The Funds currently offer Class A shares and Institutional Class shares. Each share class of the Funds has identical rights to earnings, assets and voting privileges, except for class-specific expenses and exclusive rights to vote on matters affecting only individual classes. The Board of Trustees (the "Board") may establish additional funds and classes of shares at any time in the future without shareholder approval.
The Funds commenced operations on October 2, 2017.
2. SIGNIFICANT ACCOUNTING POLICIES
The accompanying financial statements were prepared in accordance with accounting principles generally accepted in the United States of America for investment companies ("U.S. GAAP"). The Funds are considered investment companies under U.S. GAAP and follow the accounting and reporting guidance applicable to investment companies in the Financial Accounting Standards Board Accounting Standards Codification Topic 946. The preparation of financial statements in conformity with U.S. GAAP requires management to make certain estimates and assumptions that affect the reported amounts of assets and liabilities and disclosures of contingent assets and liabilities at the date of the financial statements and the reported amounts of revenue and expenses during the period. Actual results could differ from those estimates. The following is a summary of significant accounting policies consistently followed by the Funds in preparation of their financial statements.
Investment Valuation: The Funds generally value their securities based on market prices determined at the close of regular trading on the New York Stock Exchange ("NYSE"), normally 4:00 p.m. Eastern Time, on each day the NYSE is open for trading.
FLEX Options are customized option contracts available through the Chicago Board Options Exchange ("CBOE"). Flexible Exchange Options are valued based on prices supplied by an independent third-party pricing service, which utilizes pricing models that incorporate various inputs such as interest rates, credit spreads currency exchange rates and volatility measurements for in-the-money, at-the-money, and out-of-money contracts on a given strike price.
Redeemable securities issued by open-end registered investment companies are valued at the investment company's applicable net asset value ("NAV"), with the exception of exchange-traded open-end investment companies, which are priced as equity securities. Money market funds, representing short-term investments, are valued at their net asset value.
| 24 | www.beacontrust.com |
| Beacon Trust Funds | Notes to Financial Statements |
September 30, 2018
When such prices or quotations are not available, or when the Fair Value Committee appointed by the Board believes that they are unreliable, securities may be priced using fair value procedures approved by the Board.
Fair Value Measurements: The Funds disclose the classification of their fair value measurements following a three-tier hierarchy based on the inputs used to measure fair value. Inputs refer broadly to the assumptions that market participants would use in pricing the asset or liability, including assumptions about risk. Inputs may be observable or unobservable. Observable inputs reflect the assumptions market participants would use in pricing the asset or liability that are developed based on market data obtained from sources independent of the reporting entity. Unobservable inputs reflect the reporting entity's own assumptions about the assumptions market participants would use in pricing the asset or liability that are developed based on the best information available.
Various inputs are used in determining the value of the Funds' investments as of the end of the reporting period. When inputs used fall into different levels of the fair value hierarchy, the level in the hierarchy within which the fair value measurement falls is determined based on the lowest level input that is significant to the fair value measurement in its entirety. The designated input levels are not necessarily an indication of the risk or liquidity associated with these investments. These inputs are categorized in the following hierarchy under applicable financial accounting standards:
| Level 1 – | Unadjusted quoted prices in active markets for identical investments, unrestricted assets or liabilities that the Fund has the ability to access at the measurement date; |
| Level 2 – | Quoted prices which are not active, quoted prices for similar assets or liabilities in active markets or inputs other than quoted prices that are observable (either directly or indirectly); and |
| Level 3 – | Significant unobservable prices or inputs (including the Fund's own assumptions in determining the fair value of investments) where there is little or no market activity for the asset or liability at the measurement date. |
| Annual Report | September 30, 2018 | 25 |
| Beacon Trust Funds | Notes to Financial Statements |
September 30, 2018
The following is a summary of the inputs used to value the Funds' investments as of September 30, 2018:
Beacon Accelerated Return Strategy Fund
| Investments in Securities at Value | Level 1 - Unadjusted Quoted Prices | Level 2 - Other Significant Observable Inputs | Level 3 - Significant Unobservable Inputs | Total | ||||||||||||
| Purchased Option Contracts | $ | – | $ | 163,176,545 | $ | – | $ | 163,176,545 | ||||||||
| Short Term Investments | 1,836,261 | – | – | 1,836,261 | ||||||||||||
| TOTAL | $ | 1,836,261 | $ | 163,176,545 | $ | – | $ | 165,012,806 | ||||||||
| Valuation Inputs | ||||||||||||||||
| Other Financial Instruments | Level 1 | Level 2 | Level 3 | Total | ||||||||||||
| Liabilities | ||||||||||||||||
| Written Option Contracts | $ | – | $ | (10,846,238 | ) | $ | – | $ | (10,846,238 | ) | ||||||
| TOTAL | $ | – | $ | (10,846,238 | ) | $ | – | $ | (10,846,238 | ) | ||||||
Beacon Planned Return Strategy Fund
| Investments in Securities at Value | Level 1 - Unadjusted Quoted Prices | Level 2 - Other Significant Observable Inputs | Level 3 - Significant Unobservable Inputs | Total | ||||||||||||
| Purchased Option Contracts | $ | – | $ | 408,082,470 | $ | – | $ | 408,082,470 | ||||||||
| Short Term Investments | 4,585,453 | – | – | 4,585,453 | ||||||||||||
| TOTAL | $ | 4,585,453 | $ | 408,082,470 | $ | – | $ | 412,667,923 | ||||||||
| Valuation Inputs | ||||||||||||||||
| Other Financial Instruments | Level 1 | Level 2 | Level 3 | Total | ||||||||||||
| Liabilities | ||||||||||||||||
| Written Option Contracts | $ | – | $ | (60,620,414 | ) | $ | – | $ | (60,620,414 | ) | ||||||
| TOTAL | $ | – | $ | (60,620,414 | ) | $ | – | $ | (60,620,414 | ) | ||||||
The Funds recognize transfers between levels as of the end of the period. For the fiscal period ended September 30, 2018, the Funds did not have any transfers between Level 1 and Level 2 securities. There were no Level 3 securities held during the period.
Cash & Cash Equivalents: The Funds consider their investment in a Federal Deposit Insurance Corporation ("FDIC") insured interest bearing account to be cash and cash equivalents. Cash and cash equivalents are valued at cost plus any accrued interest. The Funds maintains cash balances, which, at times may exceed federally insured limits. The Funds maintains these balances with a high quality financial institution.
Concentration of Credit Risk: The Funds place their cash with a banking institution, which is insured by FDIC. The FDIC limit is $250,000. At various times throughout the year, the amount on deposit may exceed the FDIC limit and subject the Funds to a credit risk. The Funds do not believe that such deposits are subject to any unusual risk associated with investment activities.
| 26 | www.beacontrust.com |
| Beacon Trust Funds | Notes to Financial Statements |
September 30, 2018
Offering Costs: The Funds incurred offering costs during the period ended September 30, 2018. These offering costs, including fees for printing initial prospectuses, legal and registration fees, are being amortized over the first twelve months from the inception date of the Funds. Amounts amortized through September 30, 2018 are expensed in the Funds' Statements of Operations and amounts that remain to be amortized are shown on the Funds' Statements of Assets and Liabilities.
Trust Expenses: Some expenses of the Trust can be directly attributed to a Fund. Expenses that cannot be directly attributed to a Fund are apportioned among all funds in the Trust based on average net assets of each fund.
Fund Expenses: Some expenses can be directly attributed to a Fund and are apportioned among the classes based on average net assets of each class.
Class Expenses: Expenses that are specific to a class of shares are charged directly to that share class. Fees provided under the distribution and services plan for a particular class of a Fund are charged to the operations of such class.
Federal Income Taxes: The Funds comply with the requirements under Subchapter M of the Internal Revenue Code of 1986, as amended, applicable to regulated investment companies and intend to distribute substantially all of their net taxable income and net capital gains, if any, each year so that they will not be subject to excise tax on undistributed income and gains. The Funds are not subject to income taxes to the extent such distributions are made.
As of and during the period ended September 30, 2018, the Funds did not have a liability for any unrecognized tax benefits in the accompanying financial statements. The Funds recognize interest and penalties, if any, related to tax liabilities as income tax expense in the Statements of Operations. The Funds file U.S. federal, state and local income tax returns as required. The Funds' tax returns are subject to examination by the relevant tax authorities until expiration of the applicable statute of limitations, which is generally three years after the filing of the tax return for federal purposes and four years for most state returns. The Funds' administrator has analyzed the Funds' tax positions and has concluded that as of September 30, 2018, no provision for income tax is required in the Funds' financial statements related to these tax positions.
Investment Transactions and Investment Income: Investment transactions are accounted for on the date the investments are purchased or sold (trade date basis) for financial reporting purposes. Realized gains and losses from investment transactions are reported on an identified cost basis. Interest income, which includes accretion of discounts and amortization of premiums, is accrued and recorded as earned. Dividend income is recognized on the ex-dividend date, or for certain foreign securities, as soon as information is available to a Fund. Withholding taxes on foreign dividends are paid (a portion of which may be reclaimable) or provided for in accordance with the applicable country's tax rules and rates and are disclosed in the Statements of Operations. All of the realized and unrealized gains and losses and net investment income are allocated daily to each class in proportion to its average daily net assets.
Distributions to Shareholders: The Funds normally pay dividends, if any, and distribute capital gains, if any, on an annual basis. Income dividend distributions are derived from interest, dividends and other income the Funds receive from their investments, including short-term capital gains.
| Annual Report | September 30, 2018 | 27 |
| Beacon Trust Funds | Notes to Financial Statements |
September 30, 2018
Long-term capital gain distributions are derived from gains realized when a Fund sells a security it has owned for more than one year. A Fund may make additional distributions and dividends at other times if its portfolio manager or managers believe doing so may be necessary for the Fund to avoid or reduce taxes. Net investment income/(loss) and net realized gain/(loss) may differ for financial statement and tax purposes.
3. DERIVATIVE INSTRUMENTS
The Funds' investment objectives permit the Funds to enter into various types of derivatives contracts, including, but not limited to, futures contracts, forward foreign currency contracts, currency swaps and purchased and written options. In doing so, the Funds may employ strategies in differing combinations to permit it to increase, decrease, or change the level or types of exposure to market factors. Central to those strategies are features inherent in derivatives that make them more attractive for this purpose than equity or debt securities; they require little or no initial cash investment, they can focus exposure on only certain selected risk factors, and they may not require the ultimate receipt or delivery of the underlying security (or securities) to the contract. This may allow the Funds to pursue their objectives more quickly and efficiently than if they were to make direct purchases or sales of securities capable of affecting a similar response to market factors.
Risk of Investing in Derivatives: The Funds' use of derivatives can result in losses due to unanticipated changes in the market risk factors and the overall market. In instances where the Funds are using derivatives to decrease, or hedge, exposures to market risk factors for securities held by the Funds, there are also risks that those derivatives may not perform as expected resulting in losses for the combined or hedged positions.
Derivatives may have little or no initial cash investment relative to their market value exposure and therefore can produce significant gains or losses in excess of their cost. This use of embedded leverage allows the Funds to increase their market value exposure relative to their net assets and can substantially increase the volatility of the Funds' performance.
Additional associated risks from investing in derivatives also exist and potentially could have significant effects on the valuation of the derivative and the Funds. Typically, the associated risks are not the risks that the Funds are attempting to increase or decrease exposure to, per their investment objectives, but are the additional risks from investing in derivatives.
Examples of these associated risks are liquidity risk, which is the risk that the Funds will not be able to sell or close out the derivative in a timely manner, and counterparty credit risk, which is the risk that the counterparty will not fulfill its obligation to the Funds. In addition, use of derivatives may increase or decrease exposure to the following risk factors:
Equity Risk: Equity risk relates to the change in value of equity securities as they relate to increases or decreases in the general market. Associated risks can be different for each type of derivative.
Option Contracts: Each Fund may enter into options transactions for hedging purposes and for nonhedging purposes such as seeking to enhance return. Each Fund may write covered put and call options on any stocks or stock indices, currencies traded on domestic and foreign securities exchanges, or futures contracts on stock indices, interest rates and currencies traded on domestic and, to the extent permitted by the U.S. Commodity Futures Trading Commission, foreign exchanges. A call option on an asset written by a Fund obligates the Fund to sell the specified asset to the holder (purchaser) at a stated price (the exercise price) if the option is exercised before a specified date (the expiration date). A put option on an asset written by a Fund obligates the Fund to buy the specified asset from the purchaser at the exercise price if the option is exercised before the expiration date. Premiums received when writing options are recorded as liabilities and are subsequently adjusted to the current value of the options written. Premiums received from writing options that expire are treated as realized gains. Premiums received from writing options, which are either exercised or closed, are offset against the proceeds received or amount paid on the transaction to determine realized gains or losses.
| 28 | www.beacontrust.com |
| Beacon Trust Funds | Notes to Financial Statements |
September 30, 2018
The Funds use FLEX Options, which are customized equity or index option contracts that trade on an exchange, but that provide investors with the ability to customize key contract terms like exercise prices, styles and expiration dates. Like standardized exchange-traded options, FLEX Options are guaranteed for settlement by The Options Clearing Corporation ("OCC"), a market clearinghouse. The OCC guarantees performance by each of the counterparties to the FLEX Options, becoming the "buyer for every seller and the seller for every buyer," protecting clearing members and options traders from counterparty risk. FLEX Options provide investors with the ability to customize key terms, while achieving price discovery in competitive, transparent auctions markets and avoiding the counterparty exposure of Over-the-Counter ("OTC") options positions. The Funds bear the risk that the OCC will be unable or unwilling to perform its obligations under the FLEX Options contracts. Additionally, FLEX Options may be less liquid than certain other securities such as standardized options. In a less liquid market for the FLEX Options, the Funds may have difficulty closing out certain FLEX Options positions at desired times and prices.
Purchased Options: When the Funds purchase an option, an amount equal to the premium paid by the Funds are recorded as an investment and is subsequently adjusted to the current value of the option purchased. If an option expires on the stipulated expiration date or if the Funds enter into a closing sale transaction, a gain or loss is realized. If a call option is exercised, the cost of the security acquired is increased by the premium paid for the call. If a put option is exercised, a gain or loss is realized from the sale of the underlying security, and the proceeds from such sale are decreased by the premium originally paid. Purchased options are non-income producing securities.
Written Options: When the Funds write an option, an amount equal to the premium received by the Funds are recorded as a liability and is subsequently adjusted to the current value of the option written. Premiums received from writing options that expire unexercised are treated by the Funds on the expiration date as realized gain from written options. The difference between the premium and the amount paid on effecting a closing purchase transaction, including brokerage commissions, is also treated as a realized gain, or if the premium is less than the amount paid for the closing purchase transaction, as a realized loss. If a call option is exercised, the premium is added to the proceeds from the sale of the underlying security in determining whether the Funds have realized a gain or loss. If a put option is exercised, the premium reduces the cost basis of the securities purchased by the Funds. The Funds, as writers of an option, bear the market risk of an unfavorable change in the price of the security underlying the written option.
| Annual Report | September 30, 2018 | 29 |
| Beacon Trust Funds | Notes to Financial Statements |
| September 30, 2018 |
The average option contract notional amount during the period ended September 30, 2018, is noted below for each of the Funds.
| Derivative Type | Unit of Measurement | Monthly Average | |||||
| Beacon Accelerated Return Strategy Fund | |||||||
| Purchased Option Contracts | Notional value of contracts outstanding | $ | 9,456,350 | ||||
| Written Option Contracts | Notional value of contracts outstanding | $ | 16,003,800 | ||||
| Derivative Type | Unit of Measurement | Monthly Average | |||||
| Beacon Planned Return Strategy Fund | |||||||
| Purchased Option Contracts | Notional value of contracts outstanding | $ | 18,250,430 | ||||
| Written Option Contracts | Notional value of contracts outstanding | $ | 27,375,645 | ||||
Derivative Instruments: The following tables disclose the amounts related to the Funds’ use of Derivative instruments.
The effect of derivative instruments on the Statements of Assets and Liabilities as of September 30, 2018:
| Risk Exposure | Statements of Assets and Liabilities Location | Fair Value of Asset Derivatives | Statements of Assets and Liabilities Location | Fair Value of Liability Derivatives | ||||||||
| Beacon Accelerated Return Strategy Fund | ||||||||||||
| Equity Contracts (Purchased Options/ Written Options) | Investments, at value | $ | 163,176,545 | Written Options, at value | $ | 10,846,238 | ||||||
| $ | 163,176,545 | $ | 10,846,238 | |||||||||
| Beacon Planned Return Strategy Fund | ||||||||||||
| Equity Contracts (Purchased Options/ Written Options) | Investments, at value | $ | 408,082,469 | Written Options, at value | $ | 60,620,414 | ||||||
| $ | 408,082,469 | $ | 60,620,414 | |||||||||
| 30 | www.beacontrust.com |
| Beacon Trust Funds | Notes to Financial Statements |
| September 30, 2018 |
The effect of derivative instruments on the Statements of Operations for the period ended September 30, 2018:
| Risk Exposure | Statements of Operations Location | Realized Gain (Loss) on Derivatives Recognized in Income | Change in Unrealized Gain (Loss) on Derivatives Recognized in Income | |||||||
| Beacon Accelerated Return Strategy Fund | ||||||||||
| Equity Contracts (Purchased Options) | Net realized gain/(loss) on investments/Net change in unrealized appreciation/ (depreciation) on investments | $ | 15,737,296 | $ | 16,764,406 | |||||
| Equity Contracts (Written Options) | Net realized gain/(loss) on written option contracts/Net change in unrealized appreciation/ (depreciation) on written option contracts | (6,639,638 | ) | (5,285,066 | ) | |||||
| Total | $ | 9,097,658 | $ | 11,479,340 | ||||||
| Beacon Planned Return Strategy Fund | ||||||||||
| Equity Contracts (Purchased Options) | Net realized gain/(loss) on investments/Net change in unrealized appreciation/ (depreciation) on investments | $ | 26,398,586 | $ | 43,575,600 | |||||
| Equity Contracts (Written Options) | Net realized gain/(loss) on written option contracts/Net change in unrealized appreciation/ (depreciation) on written option contracts | (16,633,484 | ) | (23,714,960 | ) | |||||
| Total | $ | 9,765,102 | $ | 19,860,640 | ||||||
4. TAX BASIS INFORMATION
Tax Basis of Distributions to Shareholders: The character of distributions made during the period from net investment income or net realized gains may differ from its ultimate characterization for Federal income tax purposes. Also, due to the timing of dividend distributions, the fiscal year in which amounts are distributed may differ from the fiscal year in which the income or realized gain were recorded by the Funds. The amounts and characteristics of tax basis distributions and composition of distributable earnings/(accumulated losses) are finalized at fiscal year-end.
| Annual Report | September 30, 2018 | 31 |
| Beacon Trust Funds | Notes to Financial Statements |
| September 30, 2018 |
The tax character of distributions paid during the fiscal period ended September 30, 2018, were as follows:
| Ordinary Income | Long-Term Capital Gains | |||||||
| Beacon Accelerated Return Strategy Fund | $ | 101,843 | $ | 768,401 | ||||
| Beacon Planned Return Strategy Fund | – | 1,129,696 | ||||||
Reclassifications: As of September 30, 2018, permanent differences in book and tax accounting were reclassified. The following reclassifications have been made on the Statements of Assets and Liabilities and have no impact on the net asset value of the Funds:
| Paid-in Capital | Distributable Earnings | |||||||
| Beacon Accelerated Return Strategy Fund | $ | (50,245 | ) | $ | 50,245 | |||
| Beacon Planned Return Strategy Fund | (50,150 | ) | 50,150 | |||||
These reclassifications were primarily attributable to offering expenses that are non-deductible for tax.
Unrealized Appreciation and Depreciation on Investments and Derivative Instruments: As of September 30, 2018, the aggregate costs of investments, gross unrealized appreciation/(depreciation) and net unrealized appreciation of instruments and derivative instruments for Federal tax purposes were as follows:
| Beacon Accelerated Return Strategy Fund | Beacon Planned Return Strategy Fund | |||||||
| Gross unrealized appreciation (excess of value over tax cost)(a) | $ | – | $ | – | ||||
| Gross unrealized depreciation (excess of tax cost over value)(a) | – | – | ||||||
| Net unrealized appreciation/(depreciation) | $ | – | $ | – | ||||
| Cost of investments for income tax purposes | $ | 165,012,806 | $ | 412,667,923 | ||||
| (a) | Includes appreciation/(depreciation) on written options. |
| 32 | www.beacontrust.com |
| Beacon Trust Funds | Notes to Financial Statements |
| September 30, 2018 |
Components of Distributable Earnings: At September 30, 2018, components of distributable earnings were as follows:
| Beacon Accelerated Return Strategy Fund | Beacon Planned Return Strategy Fund | |||||||
| Undistributed ordinary income | $ | 6,405,718 | $ | 7,760,389 | ||||
| Accumulated capital gains | 11,577,798 | 16,645,749 | ||||||
| Total | $ | 17,983,516 | $ | 24,406,138 | ||||
5. SECURITIES TRANSACTIONS
Purchases and sales of securities, excluding short-term securities, during the period ended September 30, 2018 were as follows:
| Purchases of Securities | Proceeds from Sales of Securities | |||||||
| Beacon Accelerated Return Strategy Fund | $ | – | $ | – | ||||
| Beacon Planned Return Strategy Fund | – | – | ||||||
6. BENEFICIAL SHARE TRANSACTIONS
The capitalization of the Trust consists of an unlimited number of shares of beneficial interest with no par value per share. Holders of the shares of the Funds have one vote for each share held and a proportionate fraction of a vote for each fractional share. All shares issued and outstanding are fully paid and are transferable and redeemable at the option of the shareholder. Shares have no pre-emptive rights. Neither the Funds nor any of their creditors have the right to require shareholders to pay any additional amounts solely because the shareholder owns the shares.
Shares redeemed within 60 days of purchase may incur a 2.00% short-term redemption fee deducted from the redemption amount. For the period ended September 30, 2018, the redemption fees charged by the Funds, if any, are presented in the Statements of Changes in Net Assets.
| Annual Report | September 30, 2018 | 33 |
| Beacon Trust Funds | Notes to Financial Statements |
| September 30, 2018 |
Transactions in common shares were as follows:
| For the Period Ended September 30, 2018 | ||||
| Beacon Accelerated Return Strategy Fund | ||||
| Class A(a) | ||||
| Shares sold | 927 | |||
| Shares issued in reinvestment of distributions to shareholders | – | |||
| Shares redeemed | – | |||
| Net increase in shares outstanding | 927 | |||
| Institutional Class(b) | ||||
| Shares sold | 15,086,370 | |||
| Shares issued in reinvestment of distributions to shareholders | 14,805 | |||
| Shares redeemed | (1,431,816 | ) | ||
| Net increase in shares outstanding | 13,669,359 | |||
| Beacon Planned Return Strategy Fund | ||||
| Class A(a) | ||||
| Shares sold | 957 | |||
| Shares issued in reinvestment of distributions to shareholders | – | |||
| Shares redeemed | – | |||
| Net increase in shares outstanding | 957 | |||
| Institutional Class(b) | ||||
| Shares sold | 37,004,843 | |||
| Shares issued in reinvestment of distributions to shareholders | 28,840 | |||
| Shares redeemed | (4,268,797 | ) | ||
| Net increase in shares outstanding | 32,764,886 | |||
| (a) | Commenced operations June 11, 2018. |
| (b) | Commenced operations October 2, 2017. |
Control is defined by the 1940 Act as the beneficial ownership, either directly or through one or more controlled companies, of more than 25% of the voting securities of a company. Approximately 96% of the outstanding shares of the Beacon Accelerated Return Fund are held by one omnibus account. Approximately 86% of the outstanding shares of the Beacon Planned Return Strategy Fund are owned by one omnibus account. Share transaction activities of these shareholders could have a material impact on the Funds.
7. MANAGEMENT AND RELATED PARTY TRANSACTIONS
Investment Advisory: Beacon Investment Advisory Services, Inc. (the “Adviser”), subject to the authority of the Board, is responsible for the management of the Funds’ portfolios. The Adviser manages the investments of the Funds in accordance with the Funds’ investment objectives, policies and limitations and investment guidelines established jointly by the Adviser and the Board.
| 34 | www.beacontrust.com |
| Beacon Trust Funds | Notes to Financial Statements |
| September 30, 2018 |
Pursuant to the Investment Advisory Agreement (the “Advisory Agreement”) with the Adviser, each Fund pays the Adviser an annual management fee that is based on the Fund’s average daily net assets. The management fee is paid on a monthly basis. The contractual management fee rate is 1.00% for the Beacon Accelerated Return Strategy Fund and Beacon Planned Return Strategy Fund. The initial term of the Advisory Agreement is two years. The Board may extend the Advisory Agreement for additional one-year terms. The Board and shareholders of a Fund may terminate the Advisory Agreement upon 30 days’ written notice. The Adviser may terminate the Advisory Agreement upon 60 days’ notice.
Pursuant to a fee waiver letter agreement (the “Fee Waiver Agreement”), the Adviser has contractually agreed to limit the amount of each Fund’s Total Annual Fund Operating Expenses, exclusive of Rule 12b-1 Fees, Acquired Fund Fees and Expenses, brokerage expenses, interest expenses, taxes and extraordinary expenses to an annual rate of 1.40% of the Beacon Accelerated Return Strategy Fund’s average daily net assets for each of the Class A shares and the Institutional Class shares and 1.40% of the Beacon Planned Return Strategy Fund’s average daily net assets for the Class A shares and the Institutional Class shares. The Fee Waiver Agreement is in effect through January 31, 2019. The Adviser may not terminate the Fee Waiver Agreement without the approval of the Trust’s Board. The Adviser will be permitted to recover, on a class-by-class basis, expenses it has borne through the Fee Waiver Agreement only to the extent that the Fund’s expenses in later periods do not exceed the lesser of: (1) the contractual expense limit in effect at the time the Adviser waives or limits the expenses; or (2) the contractual expense limit in effect at the time the Adviser seeks to recover the expenses; provided, however, that the Funds will not be obligated to reimburse any such expenses borne by the Adviser more than three years after the date on which the fee or expense was waived or limited or assumed and paid by the Adviser, as calculated on a monthly basis. There were no fees waived or reimbursed for the period ended September 30, 2018.
Administrator: ALPS Fund Services, Inc. (“ALPS”) (an affiliate of ALPS Distributors, Inc.) serves as administrator to each Fund. The Funds have agreed to pay expenses incurred in connection with its administrative activities. Pursuant to the Administration, Bookkeeping and Pricing Services Agreement with the Trust, ALPS will provide operational services to the Funds including, but not limited to, fund accounting and fund administration and generally assist in each Fund’s operations. Each Fund’s administration fee is accrued on a daily basis and paid monthly. The officers and an Interested Trustee of the Trust are employees of ALPS. Administration fees paid by the Funds for the period ended September 30, 2018 are disclosed in the Statements of Operations. ALPS is reimbursed by the Funds for certain out-of-pocket expenses.
Transfer Agent: ALPS serves as transfer agent for each Fund under a Transfer Agency and Services Agreement with the Trust. Under this agreement, ALPS is paid an annual fee for services performed on behalf of the Funds plus fees for open accounts and is reimbursed for certain out-of-pocket expenses.
Compliance Services: ALPS provides services as each Fund’s Chief Compliance Officer to monitor and test the policies and procedures of each Fund in conjunction with requirements under Rule 38a-l of the 1940 Act pursuant to a Chief Compliance Officer Services Agreement with the Trust. Under this agreement, ALPS is paid an annual fee for services performed on behalf of the Funds and is reimbursed for certain out-of-pocket expenses.
| Annual Report | September 30, 2018 | 35 |
| Beacon Trust Funds | Notes to Financial Statements |
| September 30, 2018 |
Distribution: ALPS Distributors, Inc. (the “Distributor”) (an affiliate of ALPS) acts as the principal underwriter of each Fund’s shares pursuant to a Distribution Agreement with the Trust. Shares of each Fund are offered on a continuous basis through the Distributor, as agent of the Funds. The Distributor is not obligated to sell any particular amount of shares and is not entitled to any compensation for its services as the Funds’ principal underwriter pursuant to the Distribution Agreement.
Each Fund has adopted a Distribution and Services Plan (the “Plan”) pursuant to Rule 12b-1 of the 1940 Act for their Class A shares. The Plan allows the Funds to use Class A assets to pay fees in connection with the distribution and marketing of Class A shares and/or the provision of shareholder services to Class A shareholders. The Plan permits payment for services in connection with the administration of plans or programs that use Class A shares of the Funds, if any, as their funding medium and for related expenses. The Plan permits the Funds to make total payments at an annual rate of up to 0.25% of the Fund’s average daily net assets attributable to its Class A shares. Because these fees are paid out of the Fund’s Class A assets, if any, on an ongoing basis, over time they will increase the cost of an investment in the Class A shares, if any, and Class A Plan fees may cost an investor more than other types of sales charges. Plan fees are shown as distribution and service fees on the Statements of Operations.
Each Fund has adopted a shareholder services plan (“Shareholder Services Plan”) for its Class A shares and Institutional Class. Under the Shareholder Services Plan each Fund is authorized to pay banks and their affiliates and other institutions, including broker-dealers and Fund affiliates (“Participating Organizations”), an aggregate fee in an amount not to exceed on an annual basis 0.15% of the average daily net assets of each Fund’s Class A shares and Institutional Class shares, respectively, to Participating Organizations as compensation for providing shareholder service activities, which do not include distribution services, pursuant to an agreement with a Participating Organization.
8. TRUSTEES
As of September 30, 2018, there were four Trustees, three of whom are not “interested persons” (as defined in the 1940 Act) of the Trust (the “Independent Trustees”). Effective November 16, 2017, the Independent Trustees of the Trust receive a quarterly retainer of $6,000, plus $4,000 for each regular Board or Committee meeting attended and $2,000 for each special telephonic or in-person Board or Committee meeting attended. Additionally, the Audit Committee Chair receives a quarterly retainer of $1,250 and an Independent Chair receives a quarterly retainer of $2,500. Prior to November 16, 2017, the Independent Trustees received a quarterly retainer of $5,000, plus $4,000 for each regular Board or Committee meeting attended, $2,000 for each special telephonic Board or Committee meeting attended and $2,000 for each special in-person Board meeting attended. The Independent Trustees are also reimbursed for all reasonable out-of-pocket expenses relating to attendance at meetings and for meeting-related expenses. Officers of the Trust and Trustees who are interested persons of the Trust receive no salary or fees from the Trust.
| 36 | www.beacontrust.com |
| Beacon Trust Funds | Notes to Financial Statements |
| September 30, 2018 |
9. INDEMNIFICATIONS
Under the Trust’s organizational documents, its officers and Trustees are indemnified against certain liabilities arising out of the performance of their duties to the Trust. Additionally, in the normal course of business, the Trust enters into contracts with service providers that may contain general indemnification clauses which may permit indemnification to the extent permissible under applicable law. The Trust’s maximum exposure under these arrangements is unknown, as this would involve future claims that may be made against the Trust that have not yet occurred.
10. SUBSEQUENT EVENTS
Subsequent events after the date of the Statements of Assets and Liabilities have been evaluated through the date the financial statements were issued.
On October 4, 2018, the SEC amended Regulation S-X to require certain financial statement disclosure requirements to conform them to US Generally Accepted Accounting Principles for investment companies. Effective November 4, 2018, the Funds adopted disclosure requirement changes for Regulation S-X and these changes are reflected throughout this report. The Funds’ adoption of those amendments, effective with the financial statements prepared as of September 30, 2018, had no effect on the Funds’ net assets or results of operations.
| Annual Report | September 30, 2018 | 37 |
| Report of Independent Registered | |
| Beacon Trust Funds | Public Accounting Firm |
To the of Shareholders of Beacon Accelerated Return Strategy Fund and Beacon Planned Return Strategy Fund and Board of Trustees of ALPS Series Trust
Opinion on the Financial Statements
We have audited the accompanying statements of assets and liabilities, including the portfolios of investments, of Beacon Accelerated Return Strategy Fund and Beacon Planned Return Strategy Fund (the “Funds”), each a series of ALPS Series Trust, as of September 30, 2018, and the related statements of operations and changes in net assets, including the related notes, and the financial highlights for the period October 2, 2017 (commencement of operations) through September 30, 2018 (collectively referred to as the “financial statements”). In our opinion, the financial statements present fairly, in all material respects, the financial position of each of the Funds as of September 30, 2018, the results of their operations, the changes in their net assets, and the financial highlights for the period indicated above, in conformity with accounting principles generally accepted in the United States of America.
Basis for Opinion
These financial statements are the responsibility of the Funds’ management. Our responsibility is to express an opinion on the Funds’ financial statements based on our audit. We are a public accounting firm registered with the Public Company Accounting Oversight Board (United States) (“PCAOB”) and are required to be independent with respect to the Funds in accordance with the U.S. federal securities laws and the applicable rules and regulations of the Securities and Exchange Commission and the PCAOB.
We conducted our audit in accordance with the standards of the PCAOB. Those standards require that we plan and perform the audit to obtain reasonable assurance about whether the financial statements are free of material misstatement, whether due to error or fraud.
Our audit included performing procedures to assess the risks of material misstatement of the financial statements, whether due to error or fraud, and performing procedures that respond to those risks. Such procedures included examining, on a test basis, evidence regarding the amounts and disclosures in the financial statements. Our procedures included confirmation of securities owned as of September 30, 2018, by correspondence with the custodian and broker. Our audit also included evaluating the accounting principles used and significant estimates made by management, as well as evaluating the overall presentation of the financial statements. We believe that our audit provides a reasonable basis for our opinion.
We have served as the Funds’ auditor since 2018.
COHEN & COMPANY, LTD.
Cleveland, Ohio
November 29, 2018
| 38 | www.beacontrust.com |
| Beacon Trust Funds | Additional Information |
September 30, 2018 (Unaudited)
1. PROXY VOTING POLICIES AND VOTING RECORD
A description of the policies and procedures that the Funds use to determine how to vote proxies relating to portfolio securities is available without charge, upon request, (i) by calling the Funds (toll-free) at 1-844-894-9222 or (ii) on the website of the Securities and Exchange Commission (the “SEC”) at http://www.sec.gov.
Information regarding how each Fund voted proxies relating to portfolio securities during the most recent 12-month period ended June 30 is available (i) without charge, upon request, by calling the Funds (toll-free) at 1-844-894-9222 or (ii) on the SEC’s website at http://www.sec.gov.
2. PORTFOLIO HOLDINGS
The Funds file their complete schedule of portfolio holdings with the SEC for the first and third quarters of each fiscal year on Form N-Q. The Funds’ Form N-Qs are available on the SEC website at http://www.sec.gov. The Funds’ Form N-Qs may be reviewed and copied at the SEC’s Public Reference Room in Washington, D.C., and information on the operation of the Public Reference Room may be obtained by calling 1-800-SEC-0330.
3. TAX DESIGNATIONS
Pursuant to Section 852(b)(3) of the Internal Revenue Code the following Funds designate the amounts listed below as long-term capital gain dividends:
Beacon Accelerated Return Strategy: $768,401
Beacon Planned Return Strategy Fund: $1,129,696
The following Funds designate the percentages listed below of the income dividends distributed in 2017 as qualified dividend income (QDI) as defined in Section l(h)(ll) of the Internal Revenue Code:
Beacon Accelerated Return Strategy: 0.00%
Beacon Planned Return Strategy Fund: 0.00%
The following Funds designate the percentages listed below of the income dividends distributed in 2017 as qualifying for the corporate dividends received deduction (DRD) as defined in Section 854(b)(2) of the Internal Revenue Code:
Beacon Accelerated Return Strategy: 0.00%
Beacon Planned Return Strategy Fund: 0.00%
| Annual Report | September 30, 2018 | 39 |
| Beacon Trust Funds | Privacy Policy |
September 30, 2018 (Unaudited)
| FACTS | WHAT DOES THE FUND DO WITH YOUR PERSONAL INFORMATION? |
WHY?
| Financial companies choose how they share your personal information. Federal law gives consumers the right to limit some but not all sharing. Federal law also requires us to tell you how we collect, share, and protect your personal information. Please read this notice carefully to understand what we do. |
| WHAT? | The types of personal information we collect and share depend on the product or service you have with us. This information can include:
● Social Security number and account transactions ● Account balances and transaction history ● Wire transfer instructions |
| HOW? | All financial companies need to share customers’ personal information to run their everyday business. In the section below, we list the reasons financial companies can share their customers’ personal information, the reasons a Fund chooses to share, and whether you can limit this sharing. |
| REASONS WE CAN SHARE YOUR PERSONAL INFORMATION | DOES THE FUND SHARE: | CAN YOU LIMIT THIS SHARING? |
For our everyday business purposes - such as to process your transactions, maintain your account(s), respond to court orders and legal investigations, or report to credit bureaus | Yes | No |
For our marketing purposes - to offer our products and services to you | No | We do not share. |
| For joint marketing with other financial companies | No | We do not share. |
For our affiliates’ everyday business purposes - information about your transactions and experiences | Yes | No |
For our affiliates’ everyday business purposes - information about your creditworthiness | No | We do not share. |
| For non-affiliates to market to you | No | We do not share. |
| QUESTIONS? | Call 1-844-894-9222 or go to www.beacontrust.com. |
| 40 | www.beacontrust.com |
| Beacon Trust Funds | Privacy Policy |
September 30, 2018 (Unaudited)
| WHO WE ARE | |
| Who is providing this notice? | Beacon Accelerated Return Strategy fund and Beacon Planned Return Strategy fund (each, a “Fund”) |
| WHAT WE DO | |
| How does the Fund protect my personal information? | To protect your personal information from unauthorized access and use, we use security measures that comply with federal law. These measures include computer safeguards and secured files and buildings. |
| How does the Fund collect my personal information? | We collect your personal information, for example, when you
● open an account ● provide account information or give us your contact information ● make a wire transfer or deposit money |
| Why can’t I limit all sharing? | Federal law gives you the right to limit only
● sharing for affiliates’ everyday business purposes-information about your creditworthiness ● affiliates from using your information to market to you ● sharing for non-affiliates to market to you ● State laws and individual companies may give you additional rights to limit sharing |
| DEFINITIONS | |
| Affiliates | Companies related by common ownership or control. They can be financial and nonfinancial companies. |
| Non-affiliates | Companies not related by common ownership or control. They can be financial and nonfinancial companies.
● The Fund does not share with non-affiliates so they can market to you. |
| Joint marketing | A formal agreement between non-affiliated financial companies that together market financial products or services to you.
● The Fund does not jointly market. |
| Annual Report | September 30, 2018 | 41 |
| Beacon Trust Funds | Privacy Policy |
September 30, 2018 (Unaudited)
| OTHER IMPORTANT INFORMATION | |
| California Residents | If your account has a California home address, your personal information will not be disclosed to nonaffiliated third parties except as permitted by applicable California law, and we will limit sharing such personal information with our affiliates to comply with California privacy laws that apply to us. |
| Vermont Residents | The State of Vermont requires financial institutions to obtain your consent prior to sharing personal information that they collect about you with affiliated companies and nonaffiliated third parties other than in certain limited circumstances. Except as permitted by law, we will not share personal information we collect about you with nonaffiliated third parties or other affiliated companies unless you provide us with your written consent to share such information. |
| 42 | www.beacontrust.com |
| Beacon Trust Funds | Trustees and Officers |
September 30, 2018 (Unaudited)
INDEPENDENT TRUSTEES
| Name, Birth Year & Address* | Position(s) Held with Fund | Term of Office and Length of Time Served** | Principal Occupation(s) During Past 5 Years*** | Number of Funds in Fund Complex Overseen by Trustee**** | Other Directorships Held by Trustee During Past 5 Years*** |
Ward D. Armstrong Birth year: 1954
| Trustee and Chairman | Mr. Armstrong was appointed to the Board on May 27, 2016. Mr. Armstrong was appointed Chairman of the Board at the August 24, 2017 meeting of the Board of Trustees. | Retired; Managing Partner, NorthRock Partners, LLC (October 2013 to July 2015); Managing Director, NorthRock Partners, a Private Wealth Advisory Practice of Ameriprise Financial (February 2010 to October 2013); Senior Vice President, Ameriprise Financial, Inc. (November 1984 to May 2007); President, American Express Asset Management (2002 to 2004); and Chairman, Ameriprise Trust Company (November 1996 to May 2007). | 12 | Mr. Armstrong is a Director of the Heartland Group, Inc. (5 funds). |
| * | All communications to Trustees and Officers may be directed to ALPS Series Trust c/o 1290 Broadway, Suite 1100, Denver, CO 80203. |
| ** | This is the period for which the Trustee or Officer began serving the Trust. Each Trustee serves an indefinite term, until such Trustee’s successor is elected and appointed, or such Trustee resigns or is deceased. Officers are elected on an annual basis. |
| *** | Except as otherwise indicated, each individual has held the office shown or other offices in the same company for the last five years. |
| **** | The Fund Complex currently consists of 12 series of the Trust and any other investment companies for which Beacon Investment Advisory Services, Inc. provides investment advisory services, currently none. |
| Annual Report | September 30, 2018 | 43 |
| Beacon Trust Funds | Trustees and Officers |
September 30, 2018 (Unaudited)
| Name, Birth Year & Address* | Position(s) Held with Fund | Term of Office and Length of Time Served** | Principal Occupation(s) During Past 5 Years*** | Number of Funds in Fund Complex Overseen by Trustee**** | Other Directorships Held by Trustee During Past 5 Years*** |
J. Wayne Hutchens Birth year: 1944
| Trustee | Mr. Hutchens was elected to the Board on October 30, 2012. | Mr. Hutchens is currently retired. From April 2006 to December 2012, he served as President and CEO of the University of Colorado (CU) Foundation and from April 2009 to December 2012, he was Executive Director of the CU Real Estate Foundation. Mr. Hutchens is also Trustee of the Denver Museum of Nature and Science (2000 to present), Director of AMG National Trust Bank (June 2012 to present) and Trustee of Children’s Hospital Colorado (May 2012 to present). Prior to these positions, Mr. Hutchens spent 29 years in the banking industry, retiring as Chairman of Chase Bank Colorado. | 12 | Mr. Hutchens is a Director of RiverNorth Opportunities Fund, Inc. (2013 to present) |
Patrick Seese Birth year: 1971
| Trustee | Mr. Seese was elected to the Board on October 30, 2012. | Mr. Seese is an owner and a Managing Director of Integris Partners, a middle-market investment banking firm serving closely-held companies, financial sponsors and public companies (February 2008 to present). Prior to this, Mr. Seese was a Managing Director of Headwaters MB, a middle-market investing banking firm (December 2003 to February 2008). Prior to that, Mr. Seese worked in Credit Suisse First Boston’s Mergers and Acquisitions Group and served as Head of Corporation Development, Katy Industries, a publicly traded industrial and consumer products company and at Deloitte & Touche LLP, where he began his career in 1994. | 12 | Mr. Seese is a Director of The Mile High Five Foundation (2013 to present) and SJ Panthers Foundation (2016 to present) |
| * | All communications to Trustees and Officers may be directed to ALPS Series Trust c/o 1290 Broadway, Suite 1100, Denver, CO 80203. |
| ** | This is the period for which the Trustee or Officer began serving the Trust. Each Trustee serves an indefinite term, until such Trustee’s successor is elected and appointed, or such Trustee resigns or is deceased. Officers are elected on an annual basis. |
| *** | Except as otherwise indicated, each individual has held the office shown or other offices in the same company for the last five years. |
| **** | The Fund Complex currently consists of 12 series of the Trust and any other investment companies for which Beacon Investment Advisory Services, Inc. provides investment advisory services, currently none. |
| 44 | www.beacontrust.com |
| Beacon Trust Funds | Trustees and Officers |
September 30, 2018 (Unaudited)
INTERESTED TRUSTEE
| Name, Birth Year & Address* | Position(s) Held with Fund | Term of Office and Length of Time Served** | Principal Occupation(s) During Past 5 Years*** | Number of Funds in Fund Complex Overseen by Trustee**** | Other Directorships Held by Trustee During Past 5 Years*** |
Jeremy O. May Birth year: 1970
| Trustee and President | Mr. May was elected Trustee and President on October 30, 2012. Mr. May was Chairman from October 30, 2012 to August 24, 2017. | Mr. May joined ALPS in 1995 and is currently President and Director of ALPS Fund Services, Inc., ALPS Distributors, Inc., and ALPS Portfolio Solutions Distributor, Inc., Executive Vice President and Director of ALPS Holdings, Inc. and ALPS Advisors, Inc. Because of his positions with these entities, Mr. May is deemed an affiliate of the Trust as defined under the 1940 Act. Mr. May is also on the Board of Directors of the University of Colorado Foundation and the AV Hunter Trust. | 12 | Mr. May is Trustee of the Reaves Utility Income Fund (1 fund) and Elevation ETF Trust (1 ETF) and President and Director of RiverNorth Opportunities Fund, Inc. |
| * | All communications to Trustees and Officers may be directed to ALPS Series Trust c/o 1290 Broadway, Suite 1100, Denver, CO 80203. |
| ** | This is the period for which the Trustee or Officer began serving the Trust. Each Trustee serves an indefinite term, until such Trustee’s successor is elected and appointed, or such Trustee resigns or is deceased. Officers are elected on an annual basis. |
| *** | Except as otherwise indicated, each individual has held the office shown or other offices in the same company for the last five years. |
| **** | The Fund Complex currently consists of 12 series of the Trust and any other investment companies for which Beacon Investment Advisory Services, Inc. provides investment advisory services, currently none. |
| Annual Report | September 30, 2018 | 45 |
| Beacon Trust Funds | Trustees and Officers |
September 30, 2018 (Unaudited)
OFFICERS
| Name, Birth Year & Address* | Position(s) Held with Fund | Term of Office and Length of Time Served** | Principal Occupation(s) During Past 5 Years*** |
Kimberly R. Storms Birth year: 1972
| Treasurer | Ms. Storms was elected Treasurer of the Trust on October 30, 2012. | Ms. Storms is Senior Vice President and Director of Fund Administration of ALPS. Because of her position with ALPS, Ms. Storms is deemed an affiliate of the Trust as defined under the 1940 Act. Ms. Storms is also Treasurer of Financial Investors Trust, Liberty All-Star Equity Fund and Liberty All-Star Growth Fund, Inc. |
Richard C. Noyes Birth year: 1970
| Secretary | Mr. Noyes was elected Secretary of the Trust on November 14, 2016. | Mr. Noyes joined ALPS in 2015 and is Senior Vice President and General Counsel of ALPS. Prior to joining ALPS, Mr. Noyes served as Assistant Vice President and Senior Counsel of Janus Capital Management LLC. Mr. Noyes is deemed an affiliate of the Trust as defined under the 1940 Act. |
Anne M. Berg Birth year: 1973
| Assistant Secretary | Ms. Berg was elected Assistant Secretary of the Trust on August 23, 2018. | Ms. Berg joined ALPS as Senior Investment Company Act Paralegal in February 2017. Prior to joining ALPS, Anne was a Senior Legal Manager at Janus Capital Group Inc., a global investment manager in Denver, Colorado. Because of her position with ALPS, Ms. Berg is deemed an affiliate of the Trust as defined under the 1940 Act. |
Alan Gattis**** Birth year: 1980
| Assistant Treasurer | Mr. Gattis was elected Assistant Treasurer of the Trust on August 9, 2016. | Mr. Gattis joined ALPS in 2011 and is currently Vice President and Fund Controller of ALPS. Prior to joining ALPS, Mr. Gattis was an Auditor at Spicer Jeffries LLP (2009 through 2011) and an Auditor at PricewaterhouseCoopers LLP (2004 - 2009). Because of his position with ALPS, Mr. Gattis is deemed an affiliate of the Trust as defined under the 1940 Act. Mr. Gattis is also Assistant Treasurer of Elevation ETF Trust and Financial Investors Trust. |
| * | All communications to Trustees and Officers may be directed to ALPS Series Trust c/o 1290 Broadway, Suite 1100, Denver, CO 80203. |
| ** | This is the period for which the Trustee or Officer began serving the Trust. Each Trustee serves an indefinite term, until such Trustee’s successor is elected and appointed, or such Trustee resigns or is deceased. Officers are elected on an annual basis. |
| *** | Except as otherwise indicated, each individual has held the office shown or other offices in the same company for the last five years. |
| **** | Mr. Gattis resigned effective November 15, 2018. |
| 46 | www.beacontrust.com |
| Beacon Trust Funds | Trustees and Officers |
September 30, 2018 (Unaudited)
| Name, Birth Year & Address* | Position(s) Held with Fund | Term of Office and Length of Time Served** | Principal Occupation(s) During Past 5 Years*** |
Lucas D. Foss Birth year: 1977
| Chief Compliance Officer (“CCO”) | Mr. Foss was elected CCO of the Trust on January 22, 2018. | Mr. Foss joined ALPS in November 2017 as Vice President and Deputy Chief Compliance Officer. Prior to his current role, Mr. Foss served as the Director of Compliance at Transamerica Asset Management (July 2015-November 2017). Deputy Chief Compliance Officer at ALPS (September 2012 - June 2015) Compliance Manager at ALPS (January 2010 -August 2012) and a Senior Compliance Analyst at ALPS (November 2006 - December 2009). Before joining ALPS, Mr. Foss held positions at Bisys Hedge Fund Services and Deutsche Asset Management. Because of his position with ALPS, Mr. Foss is deemed an affiliate of the Trust as defined under the 1940 Act. Mr. Foss is also CCO of Harvest Volatility Edge Trust and Goehring & Rozencwajg Investment Funds. |
| * | All communications to Trustees and Officers may be directed to ALPS Series Trust c/o 1290 Broadway, Suite 1100, Denver, CO 80203. |
| ** | This is the period for which the Trustee or Officer began serving the Trust. Each Trustee serves an indefinite term, until such Trustee’s successor is elected and appointed, or such Trustee resigns or is deceased. Officers are elected on an annual basis. |
| *** | Except as otherwise indicated, each individual has held the office shown or other offices in the same company for the last five years. |
Additional information about members of the Board of Trustees and officers of the Trust is available in the Statement of Additional Information and is available, without charge, upon request, by calling the Fund (toll-free) at 1-844-894-9222.
| Annual Report | September 30, 2018 | 47 |

This material must be preceded by a prospectus.
The Beacon Investment Funds are distributed by ALPS Distributors, Inc.
Table of Contents
| Shareholder Letter | 2 |
| Portfolio Update | |
| Clarkston Partners Fund | 7 |
| Clarkston Fund | 12 |
| Clarkston Select Fund | 17 |
| Clarkston Founders Fund | 22 |
| Disclosure of Fund Expenses | 27 |
| Portfolios of Investments | |
| Clarkston Partners Fund | 29 |
| Clarkston Fund | 31 |
| Clarkston Select Fund | 33 |
| Clarkston Founders Fund | 35 |
| Statements of Assets and Liabilities | 37 |
| Statements of Operations | 39 |
| Statements of Changes in Net Assets | |
| Clarkston Partners Fund | 41 |
| Clarkston Fund | 42 |
| Clarkston Select Fund | 43 |
| Clarkston Founders Fund | 44 |
| Financial Highlights | 45 |
| Notes to Financial Statements | 53 |
| Report of Independent Registered Public Accounting Firm | 65 |
| Additional Information | 66 |
| Privacy Policy | 71 |
| Trustees and Officers | 74 |
| Clarkston Funds | Shareholder Letter |
September 30, 2018 (Unaudited)
Introduction
On August 22, 2018, this current bull market, which began March 9, 2009, reached 3,452 days, becoming the longest running bull since World War II. By definition, a bull market is a market that has not experienced a 20% or more decline. As of September 30, 2018, the broader U.S. market was up more than 300 percent since its low almost nine and a half years ago.
The market refused to lose steam as evidenced by the Russell 3000® Index. We looked at the Index in 12-month increments as of the end of September 30, 2018.
| ● | The nine-year annualized return (beginning September 30, 2009) was 14.3%; a significant four points higher than the approximate average 10% annual nominal return for equities since 1928. |
| ● | The three-year annualized return for the Russell 3000® Index was 17%. |
| ● | In the last 12 years, the Russell 3000® Index experienced only three negative one-year returns as of September 30: 2008, 2009, and 2015 when it was down only 50 basis points (0.50%). |
Growth businesses shined during the last nine years as evidenced by the performance of the Russell 3000® Growth Index versus the Russell 3000® Value Index.
| ● | During the nine years ended September 30, 2018, the Growth Index grew 16.2% annually versus the Value Index’s annual growth of 12.3%, a significant average difference of four points for each of those years. |
| ● | An outsized portion of the growth-value performance delta occurred over the last three years. Growth trounced Value with three-year annualized returns of 20.4% vs. 13.8% as of September 30, 2018. |
| ● | The Value Index outperformed the Growth Index in only three of the last 12 twelve-month periods. Shares of growth businesses outperformed value shares in both up and down markets. |
On a relative basis, the performance of the Clarkston Funds (the “Funds”) more closely resembled that of the Russell 3000® Value Index, with all four Funds underperforming their respective benchmarks for the twelve-month period ended September 30, 2018.
Is Value Investing Dead?
Based on the above data we are not surprised that people might ask themselves, “Is value investing dead?” For reasons, obvious to us, we disagree with that sentiment, but we realize that a discussion of why we disagree would be helpful.
The modern-day value investor is difficult to classify. There was a time when value investors sat behind desks thumbing through the pages of Value Line Investment Survey in search of stocks trading below book value. Technology has rendered that competency less useful and value investors have been forced to evolve. While value investors subscribe to some or all of Benjamin Graham’s founding axioms, many have designed and/or adopted some concepts of their own. This evolution of value investing has resulted in a diverse lot who possess slightly different philosophies and processes. Low price-book investors still exist, but modern value investors are looking for investments in non-traditional value sectors such as technology and biotech.
| 2 | www.clarkstonfunds.com |
| Clarkston Funds | Shareholder Letter |
September 30, 2018 (Unaudited)
Clarkston’s Quality and Value investment philosophy does not discriminate based on growth or value; we invest in businesses in both indices. If you asked our investment team, we might have a difficult time identifying which index holds the businesses in the Funds’ portfolios. We focus our time on individual businesses and their fundamentals and pay little attention to index membership.
We evaluate our performance similarly to how we evaluate performance of the businesses we own. We do so over long-time horizons; at least five years. Over short time periods, markets can be influenced by extremes. In such periods, the only thing we can control is the steady application of our investment process and philosophy. As such, we feel it is important to remind shareholders about our Quality and Value investment philosophy. For the purposes of this Letter, we have chosen to focus on how we handle uncertainty and risk and then why we execute with a defensive investment style.
Modelling for Uncertainty
We believe the value of a business is a function of the future cash flows it will generate. The challenge is that the future is unknowable and therefore, valuing a business is difficult and uncertain. It is dependent upon assumptions and forecasts, some of which are more difficult to make than others. We believe that simplicity is the best way to deconstruct a complex world. Therefore, over time, our legacy discounted free cash flow model evolved into an internal rate of return (IRR) model, requiring fewer assumptions and estimates.
In Clarkston’s valuation model, the value of a business is driven by two distinct components: the normalized earnings power of the business, as defined by free cash flow yield, and the future growth in those earnings. The two components added together equal an estimated internal rate of return (IRR) that we think an investment can achieve over a five- to seven-year time horizon. Normalized earnings, while not entirely objective, are less difficult for us to estimate. The challenge is determining whether the company is currently over or underearning. Therefore, earnings power must be adjusted or “normalized” for things such as cyclicality, one-time and/or special accounting items, over or underinvestment in the business (capital expenditures, marketing, pricing, etc.), interest expense, and taxes. We have a healthy level of confidence in our ability to produce a normalized earnings estimate.
The growth component is more uncertain and therefore difficult to estimate. Growth is subjective and dependent on estimable but unknowable or unreliable factors, such as the economy, management’s skill, existing competition, new entrants, new technology, future pricing power, governmental regulation, central bank administration, global unrest, and wars. Many of these items cannot be controlled by us, management, or anyone.
Good investors understand that the future is uncertain. Great investors proceed with humility. They not only understand that we live in an uncertain world but are also unafraid of uttering the words, “I don’t know.” We, as value investors, believe that it is extremely difficult to know what a business will look like ten or even five years into the future, but that does not preclude us from investing successfully. What we think makes us capable investors is our humility, a healthy respect for the risk that comes with buying a business in the face of uncertainty, and demanding a “margin of safety”, as conceptualized by Benjamin Graham almost 70 years ago.
| Annual Report | September 30, 2018 | 3 |
| Clarkston Funds | Shareholder Letter |
September 30, 2018 (Unaudited)
Risk and the Margin of Safety
While academics have long defined and measured risk via volatility, it is not share price fluctuations that scare us. We fear the destruction of capital and therefore, we define risk as the permanent loss of capital. Capital can be destroyed in one of two ways. First, we can incorrectly assess quality. This means we overestimated financial strength, the durability of the business model, and/or management’s competence (a discussion for future letters). The second way we may destroy capital, and the focus for the rest of this section, is if we incorrectly estimate the intrinsic value of a business and pay too much. This highlights the importance of valuing a business conservatively and buying with a margin of safety to compensate for knowable and unknowable risks.
For Clarkston, a healthy margin of safety is achieved when we pay only for the normalized earnings power of a high-quality business. We will not pay much for growth; and better yet, we like to get the growth for free. We do not get overly excited about valuation until we start to see high-single-digit earnings yields. Ideally, we would like a 10% earnings yield or greater, which happens to be equal to our absolute hurdle rate; the rate we have chosen to be a reasonable return on owning a high-quality business. This 10% earnings yield would also suggest, if our normalized earnings power estimates are conservative, that we are paying nothing for the growth of the business.
This margin of safety methodology is a direct reflection of the earlier discussion on risk. Earnings yield is easier to calculate. We have confidence in our estimate of current earnings and are willing to pay for it. Growth is difficult. Instead of making precisely wrong estimates, we try to make conservative approximations of growth and then refuse to pay for it.
Defense
Through the steady application of our process; buying high-quality businesses and only paying for their normalized earnings, we believe we increase the probability of winning over longer time horizons. This is a conservative philosophy and defensive in nature and therefore, we typically underperform in rising markets and outperform in down markets.
Our primary focus is on protecting capital; and after that, we pursue returns. Our view of defensive investing is not that you can’t win, it’s that you win by avoiding losses.
In the recent market environment, we have been using very conservative normalized earnings and growth estimates in our valuation model for the following reasons:
| ● | While the economy seems to be performing well, there is still much uncertainty surrounding the unwinding of easy money policies facilitated by central banks almost a decade ago. It is also difficult to understand the long-term effects these policies will have on investors and their attitudes toward risks. |
| 4 | www.clarkstonfunds.com |
| Clarkston Funds | Shareholder Letter |
September 30, 2018 (Unaudited)
| ● | It is difficult to know how rising interest rates will ultimately affect individuals, corporations, and governments; many of which have taken on record amounts of leverage. |
| ● | Investment in growthy companies during the last nine years, and particularly during the last three years, gives us some indication that investors have been feeling positive about the market and economy. While this optimistic environment is not necessarily a contrarian sign that all investors should turn negative, we believe valuations are becoming increasingly less attractive. |
Consequently, we have found margin of safety harder to come by in the recent environment. The nine year plus run-up in broader markets has stretched valuations. As we look at businesses on the Clarkston bench, most of them are trading at free cash flow yields under 5%. That means if we invested in them at this time, the Funds would be paying for at least 5% growth; a little pricey given our preference for paying little to nothing for growth.
Our defensive nature has likely muted recent performance of the Funds. We would rather endure the pain of missing some of the upside than endure the pain of destroying capital because we purchased shares of a company knowing it was overvalued, and the share price fell. We are continually working to identify new investment ideas, but there are times like now when valuations may be stretched, and we view the opportunities as scarce. During these environments we do not feel it is necessary for the Funds to be fully invested. There is simply too much risk in the pursuit of every last bit of return a market has to offer.
On the positive side, some businesses on our bench are becoming more attractive, especially those operating in unexciting end markets that are being ignored by other investors. These businesses tend to operate in smaller, low-growth niche markets that typically are characterized by high returns on capital. We like these types of businesses, especially when we can buy them for just their normalized earnings power. We continue to focus intently on the businesses in the Funds’ portfolios and look for new opportunities as they become available. We will do so with the primary goal of protecting capital via careful execution of our investment philosophy with a healthy respect for risk.
| Sincerely, | |
| Jeffrey A. Hakala, CFA, CPA | Jerry W. Hakala, CFA |
 |  |
The Russell 3000® Index measures the performance of the largest 3,000 U.S. companies representing approximately 98% of the investable U.S. equity market. Russell defines growth companies as those with relatively strong growth characteristics assessed on various criteria related to past and expected future revenue and earnings growth. Value companies are defined as those with relatively low valuation measures. You cannot invest directly in an index. Although reinvestment of dividend and interest payments is assumed, no expenses are netted against an index’s return. Index performance information was furnished by sources deemed reliable and is believed to be accurate, however, no warranty or representation is made as to the accuracy thereof and the information is subject to correction.
| Annual Report | September 30, 2018 | 5 |
| Clarkston Funds | Shareholder Letter |
September 30, 2018 (Unaudited)
Frank Russell Company is the source and owner of the trademarks, service marks and copyrights related to the Russell Indexes. Russell® is a trademark of Frank Russell Company. Neither Russell nor its licensors accept any liability for any errors or omissions in the Russell Indexes and/ or Russell ratings or underlying data and no party may rely on any Russell Indexes and/or Russell ratings and/or underlying data contained in this communication. No further distribution of Russell Data is permitted without Russell’s express written consent. Russell does not promote, sponsor or endorse the content of this communication.
The Russell 3000® Growth Index is an unmanaged index comprised of those Russell 3000 companies with higher price-to-book ratios and higher forecasted growth values. The stocks in this index are also members of either the Russell 1000 Growth or the Russell 2000 Growth indices. It is not possible to invest directly in an index.
The Russell 3000® Value Index is an unmanaged market-capitalization weighted equity index based on the Russell 3000 Index, which measures how U.S. stocks in the equity value segment perform. It is not possible to invest directly in an index.
Value Line Investment Survey is a stock analysis newsletter widely used as an independent investment research resource.
Benjamin Graham’s investment philosophy stressed investor psychology, minimal debt, buy-and-hold investing, fundamental analysis, concentrated diversification, buying within the margin of safety, activist investing, and contrarian mindsets.
Free cash flow yield is a financial ratio that standardizes the free cash flow a company is expected to earn by dividing it by its market capitalization.
Past performance does not guarantee future results. The views and information discussed in this letter are as of the date of publication, are subject to change, and may not reflect the writer’s current views. The views expressed are those of Clarkston Capital Partners, LLC, the investment adviser to the Clarkston Funds, and represent an assessment of market conditions at a specific point in time, are opinions only and should not be relied upon as investment advice regarding a particular investment or markets in general. The information provided does not constitute a recommendation to buy or sell specific securities or investment vehicles. It should not be assumed that any investment will be profitable or will equal the performance of any securities or any sectors mentioned in this letter. The subject matter contained in this letter has been derived from several sources believed to be reliable and accurate at the time of compilation. Neither the Clarkston Funds nor Clarkston Capital Partners, LLC accepts any liability for losses, either direct or consequential, caused by the use of this information.
| 6 | www.clarkstonfunds.com |
| Clarkston Partners Fund | Portfolio Update |
September 30, 2018 (Unaudited)
Partners Fund Commentary
For the twelve months ended September 30, 2018, the Clarkston Partners Fund – Institutional Class (the “Fund”) gained 8.52%. The Russell 2500TM Index gained 16.19% during the same period.
The large majority of the Fund’s underperformance relative to the Index was the result of exclusion, not inclusion. Our inability to find what we considered to be attractive values, or as we like to say, our refusal to overpay for businesses, resulted in most of the underperformance. We chose to hold cash (about 30% of the Fund’s portfolio) and the interest earned on this cash position was much less than the return on the average stock in the Index. A smaller but significant portion of the underperformance was the result of the Fund’s lack of exposure to technology and health care companies, which were the two best performing sectors in the Russell 2500 TM Index during the period.
The two largest individual detractors from the Fund’s performance over the past twelve months were Legg Mason, Inc. (LM) and Stericycle, Inc. (SRCL). For Legg, the continued shift in the investment management industry of assets from actively managed to passively managed, muted asset flow growth, and the perceived impact of rising rates on Legg’s fixed income affiliates were the primary drivers behind the 20% plus drop in the company’s shares. While we recognize these concerns, we feel investors are ignoring management’s exceptional use of capital, which in our opinion has positioned Legg for long-term growth.
Over the past five years, Legg has invested in its global distribution platform, made acquisitions to optimize its affiliate line-up, and diversified its assets under management with new asset classes and vehicles; all of which have positively contributed to the company’s free cash flow. Further, management has financed most of these acquisitions with low interest rate debt, half of which matures in over two decades. Finally, Legg structured acquisitions in a tax-efficient manner, which further facilitates strong free cash flow generation and capital return to shareholders.
Still, there continues to be a widening disconnect between the transformative actions Legg has taken and its share price, which has been trading at less than book value. We applaud management’s execution and believe Legg is well-positioned to navigate and ultimately benefit in an environment of lower fees and consolidating customer platforms.
We believe Stericycle is a high-quality business facing temporary challenges self-inflicted from past acquisitions made outside of its core competency; all of which occurred prior to the Fund’s investment in Stericycle’s shares. Because of these acquisitions, Stericycle’s business became operationally complex, more exposed to cyclical end markets, and incurred higher than historical debt levels. Additionally, a portion of Stericycle’s core regulated medical waste business is facing pricing headwinds in certain customer segments.
Stericycle, to address these challenges, has implemented a business transformation plan that includes streamlining operations, implementing a new enterprise resource planning system, and divesting non-core assets. The combination of the investments in these initiatives, pricing pressure, and cyclical end markets is temporarily suppressing cash earnings. We believe the quality of the company’s core businesses is being masked by the “noise.”
| Annual Report | September 30, 2018 | 7 |
| Clarkston Partners Fund | Portfolio Update |
September 30, 2018 (Unaudited)
Stericycle’s regulated medical waste and document destruction businesses have leading positions in their end markets with 50% and 30% market share, respectively. These businesses operate in micro-niche industries, have attractive returns on capital and difficult-to-impossible to replicate assets, and benefit from scale economies and some degree of cost advantage. In addition, we believe the document destruction business has respectable growth potential. Competition is highly fragmented, enabling Stericycle to continue its roll-up strategy through low-risk, tuck-in acquisitions.
Lastly, we are encouraged by the engagement of Stericycle’s board of directors in the company’s business transformation plan. This coupled with our belief in the quality of the core businesses and attractive valuation of the company’s shares, leads us to be optimistic about the Fund’s investment in Stericycle.
The largest contributors to Fund performance during the quarter were Broadridge Financial Solutions, Inc. (BR) and LPL Financial Holdings, Inc. (LPLA).
During the twelve months ended September 30, 2018, we added three new holding to the Fund: Nielsen Holdings Plc (NLSN), CDK Global, Inc. (CDK), and Artisan Partners Asset Management, Inc. (APAM). We also added capital to several existing holdings. We eliminated Cintas Corporation (CTAS) and Equifax, Inc. (EFX) and trimmed several other existing holdings due to what we considered to be excessive valuations.
Past performance does not guarantee future results. The views and information discussed in this letter are as of the date of publication, are subject to change, and may not reflect the writer’s current views. The views expressed are those of Clarkston Capital Partners, LLC, the investment adviser to the Clarkston Funds, and represent an assessment of market conditions at a specific point in time, are opinions only and should not be relied upon as investment advice regarding a particular investment or markets in general. The information provided does not constitute a recommendation to buy or sell specific securities or investment vehicles. It should not be assumed that any investment will be profitable or will equal the performance of any securities or any sectors mentioned in this letter. The subject matter contained in this letter has been derived from several sources believed to be reliable and accurate at the time of compilation. Neither the Clarkston Funds nor Clarkston Capital Partners, LLC accepts any liability for losses, either direct or consequential, caused by the use of this information.
| 8 | www.clarkstonfunds.com |
| Clarkston Partners Fund | Portfolio Update |
September 30, 2018 (Unaudited)
Top Ten Holdings (as a % of Net Assets)*
| The Western Union Co. | 5.88% |
| Stericycle, Inc. | 5.36% |
| Brown & Brown, Inc. | 5.30% |
| Legg Mason, Inc. | 5.12% |
| Nielsen Holdings PLC | 5.06% |
| Willis Towers Watson PLC | 4.83% |
| LPL Financial Holdings, Inc. | 3.69% |
| CH Robinson Worldwide, Inc. | 3.02% |
| Broadridge Financial Solutions, Inc. | 3.02% |
| John Wiley & Sons, Inc. | 3.00% |
| Top Ten Holdings | 44.28% |
Sector Allocation (as a % of Net Assets)*
| Financial Services | 30.43% |
| Producer Durables | 18.56% |
| Consumer Discretionary | 10.78% |
| Consumer Staples | 4.09% |
| Technology | 3.79% |
| Materials & Processing | 1.72% |
| Cash, Cash Equivalents, & Other Net Assets | 30.63% |
| Total | 100.00% |
| * | Holdings are subject to change, and may not reflect the current or future position of the portfolio. |
| Annual Report | September 30, 2018 | 9 |
| Clarkston Partners Fund | Portfolio Update |
September 30, 2018 (Unaudited)
Performance of a Hypothetical $25,000 Initial Investment (at Inception* through September 30, 2018)
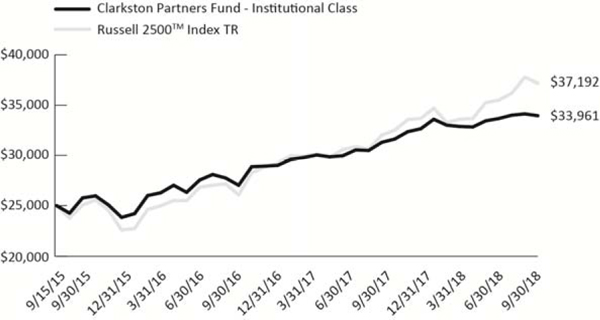
The graph shown above represents historical performance of a hypothetical investment of $25,000 in the Institutional Class. Due to differing expenses, performance of the Founders Class will vary. Past performance does not guarantee future results. All returns reflect reinvested dividends, but do not reflect the deduction of taxes that a shareholder would pay on Fund distributions or the redemption of Fund shares.
Average Annual Total Returns (as of September 30, 2018)
| 3 Month | 6 Month | 1 Year | 3 Year | Since Inception* | |
| Clarkston Partners Fund – Founders Class | 0.91% | 3.42% | 8.70% | 12.07% | 10.78% |
| Clarkston Partners Fund – Institutional Class | 0.84% | 3.28% | 8.52% | 11.88% | 10.60% |
| Russell 2500TM Index TR | 4.70% | 10.67% | 16.19% | 16.13% | 13.95% |
The performance data quoted above represents past performance. Past performance is not a guarantee of future results. Investment return and value of the Fund shares will fluctuate so that an investor’s shares, when sold or redeemed, may be worth more or less than their original cost. Performance may be lower or higher than performance data quoted. Fund performance current to the most recent month end is available by calling (844) 680-6562 or by visiting www.clarkstonfunds.com.
| * | Fund’s inception date is September 15, 2015. |
The Russell 2500TM Index TR measures the performance of the small- to mid-cap segment of the U.S. equity universe, commonly referred to as “smid” cap. The Russell 2500TM Index TR is a subset of the Russell 3000® Index. It includes approximately 2,500 of the smallest securities based on a combination of their market cap and current index membership. The Russell 2500TM Index TR is constructed to provide a comprehensive and unbiased barometer for the small- to mid-cap segment. The Russell 3000® Index measures the performance of the largest 3,000 U.S. companies representing approximately 98% of the investable U.S. equity market.
| 10 | www.clarkstonfunds.com |
| Clarkston Partners Fund | Portfolio Update |
September 30, 2018 (Unaudited)
Frank Russell Company (“Russell”) is the source and owner of the trademarks, service marks and copyrights related to the Russell Indexes. Russell® is a trademark of Frank Russell Company. Neither Russell nor its licensors accept any liability for any errors or omissions in the Russell Indexes or underlying data and no party may rely on any Russell Indexes and/or underlying data contained in this communication. No further distribution of Russell Data is permitted without Russell’s express written consent. Russell does not promote, sponsor or endorse the content of this communication.
Returns of less than 1 year are cumulative.
Indices are not actively managed and do not reflect a deduction for fees, expenses or taxes. An investor cannot invest directly in an index.
The returns shown above do not reflect the deduction of taxes a shareholder would pay on Fund distributions or redemption of Fund shares.
The total annual operating expenses and total annual operating expenses after fee waivers and/or reimbursement you may pay as an investor in the Fund’s Founders Class and Institutional Class shares (as reported in the January 29, 2018 Prospectus), are 0.96% and 0.85% and 1.11% and 1.00%, respectively. The Fund’s investment adviser has contractually agreed to limit expenses through January 31, 2019.
| Annual Report | September 30, 2018 | 11 |
| Clarkston Fund | Portfolio Update |
September 30, 2018 (Unaudited)
Clarkston Fund Commentary
For the twelve months ended September 30, 2018, the Clarkston Fund – Institutional Class (the “Fund”) gained 5.99%. The Russell 1000® Index gained 17.76% during the same period.
Most of the relative underperformance of the Fund was due to three measures: continuing to hold General Electric Company (GE) while it experienced challenges resulting in pressure on its share price, the Fund’s mid-teens average cash position, and an overweight to consumer defensive businesses and underweight to consumer cyclicals. While all three weighed on short-term performance, we believe these decisions will benefit the Fund longer-term.
General Electric was the worst performer and largest detractor from the Fund’s performance during the last twelve months. The company struggled with the complexity of its business model, legacy issues in GE Capital related to its long-term care insurance portfolio, and a top-line growth and marketing culture that arguably led to untimely expensive acquisitions and overcapacity in its Power business. These issues culminated in a new CEO, a dividend cut, a restructuring plan, and cash infusion into GE Capital.
We continued to hold GE in the Fund’s portfolio for several reasons. First, the company was simplifying the business and cutting its net-debt and pension obligations. In the summer of 2018, CEO John Flannery introduced a restructuring plan that highlighted three industrial core businesses (Aviation, Power, and Renewables), the separation of GE Healthcare into an independent company, the merger of GE Transportation with a third party, the orderly separation of Baker Hughes, and the shrinking of GE Capital.
Second, we believe GE owns world-class assets. The Aviation, Power, and Renewables businesses each have leading positions in their end markets with 60%, 55% and 35% market share, respectively. Healthcare is the market share leader in several of its categories with more than 30% share in U.S. medical diagnostic imaging. These businesses have attractive returns on capital, high customer switching costs, substantial after the sale contractual revenue streams, and each benefits from scale economies, customer captivity, and some degree of cost advantage.
Lastly, we believe GE’s shares are inexpensive and the company’s assets are worth much more than the current share price reflects. We acknowledge GE does have challenges ahead. There is no quick fix and GE will surely encounter additional challenges. We believe, however, that patient investors who possess the ability to see this turnaround all the way through will be rewarded.
On October 1, 2018, GE named Lead Director and retired Danaher CEO and Chairman Larry Culp as Chairman and CEO. At the writing of this commentary, we know little about his plans, however, we view Culp’s appointment as a positive due to his previous experience and success at Danaher. Additionally, we like the fact that Culp is viewed as an outsider and can bring a fresh perspective to GE’s turnaround. He may also have an advantage over insiders in that he may be better positioned to make unemotionally-tied decisions in the best interest of GE shareholders.
Anheuser-Busch InBev SA/NV Sponsored ADR (BUD-US) was the second largest detractor from the Fund’s performance during the quarter. While the company has been challenged by volume declines in the United States, we believe much of the recent pressure on its shares was due to a sharp depreciation of emerging-market currencies against the U.S. dollar, AB InBev’s reporting currency. While this was unwelcomed, we believe AB InBev’s share price more than reflects this currency devaluation in emerging markets. We believe the company’s geographical diversification is a positive in this environment.
| 12 | www.clarkstonfunds.com |
| Clarkston Fund | Portfolio Update |
September 30, 2018 (Unaudited)
The largest contributors to Fund performance during the quarter were Microsoft Corporation (MSFT) and Cisco Systems, Inc. (CSCO).
During the twelve months ended September 30, 2018, we added one new holding to the Fund, Nestle S.A. Sponsored ADR (NSRGY), and added capital to several existing holdings. We eliminated Anthem, Inc. (ANTM) and Emerson Electric Co. (EMR) and trimmed other existing holdings due to what we considered to be excessive valuations.
Past performance does not guarantee future results. The views and information discussed in this letter are as of the date of publication, are subject to change, and may not reflect the writer’s current views. The views expressed are those of Clarkston Capital Partners, LLC, the investment adviser to the Clarkston Funds, and represent an assessment of market conditions at a specific point in time, are opinions only and should not be relied upon as investment advice regarding a particular investment or markets in general. The information provided does not constitute a recommendation to buy or sell specific securities or investment vehicles. It should not be assumed that any investment will be profitable or will equal the performance of any securities or any sectors mentioned in this letter. The subject matter contained in this letter has been derived from several sources believed to be reliable and accurate at the time of compilation. Neither the Clarkston Funds nor Clarkston Capital Partners, LLC accepts any liability for losses, either direct or consequential, caused by the use of this information.
| Annual Report | September 30, 2018 | 13 |
| Clarkston Fund | Portfolio Update |
September 30, 2018 (Unaudited)
Top Ten Holdings (as a % of Net Assets)*
| The Procter & Gamble Co. | 6.44% |
| General Electric Co. | 6.31% |
| The Western Union Co. | 4.93% |
| Willis Towers Watson PLC | 4.67% |
| Microsoft Corp. | 4.51% |
| American Express Co. | 4.37% |
| Johnson & Johnson | 4.36% |
| PepsiCo, Inc. | 4.24% |
| Sysco Corp. | 4.16% |
| Cisco Systems, Inc. | 4.07% |
| Top Ten Holdings | 48.06% |
Sector Allocation (as a % of Net Assets)*
| Consumer Staples | 27.75% |
| Financial Services | 24.88% |
| Technology | 12.40% |
| Producer Durables | 11.27% |
| Health Care | 9.90% |
| Consumer Discretionary | 3.81% |
| Cash, Cash Equivalents, & Other Net Assets | 9.99% |
| Total | 100.00% |
| * | Holdings are subject to change, and may not reflect the current or future position of the portfolio. |
| 14 | www.clarkstonfunds.com |
| Clarkston Fund | Portfolio Update |
September 30, 2018 (Unaudited)
Performance of a Hypothetical $10,000 Initial Investment (at Inception* through September 30, 2018)
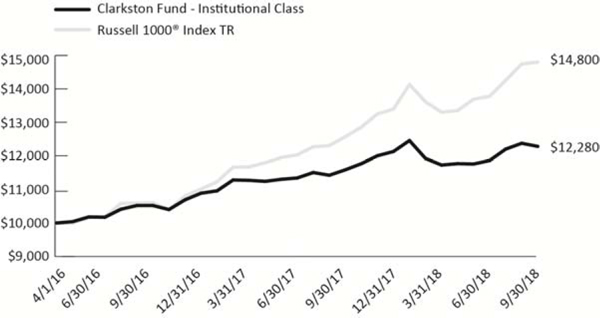
The graph shown above represents historical performance of a hypothetical investment of $10,000 in the Institutional Class. Past performance does not guarantee future results. All returns reflect reinvested dividends, but do not reflect the deduction of taxes that a shareholder would pay on Fund distributions or the redemption of Fund shares.
Average Annual Total Returns (as of September 30, 2018)
| 3 Month | 6 Month | 1 Year | Since Inception* | |
| Clarkston Fund – Institutional Class | 3.54% | 4.72% | 5.99% | 8.57% |
| Russell 1000® Index TR | 7.42% | 11.25% | 17.76% | 16.99% |
The performance data quoted above represents past performance. Past performance is not a guarantee of future results. Investment return and value of the Fund shares will fluctuate so that an investor’s shares, when sold or redeemed, may be worth more or less than their original cost. Performance may be lower or higher than performance data quoted. Fund performance current to the most recent month-end is available by calling (844) 680-6562 or by visiting www.clarkstonfunds.com.
| * | Fund’s inception date is April 1, 2016. |
The Russell 1000® Index TR measures the performance of the large-cap segment of the U.S. equity universe. It is a subset of the Russell 3000® Index and includes approximately 1,000 of the largest securities based on a combination of their market cap and current index membership. The Russell 1000® Index TR represents approximately 92% of the U.S. market. The Russell 1000® Index TR is constructed to provide a comprehensive and unbiased barometer for the large-cap segment and is completely reconstituted annually to ensure new and growing equities are reflected.
Frank Russell Company (“Russell”) is the source and owner of the trademarks, service marks and copyrights related to the Russell Indexes. Russell® is a trademark of Frank Russell Company. Neither Russell nor its licensors accept any liability for any errors or omissions in the Russell Indexes or underlying data and no party may rely on any Russell Indexes and/or underlying data contained in this communication. No further distribution of Russell Data is permitted without Russell’s express written consent. Russell does not promote, sponsor or endorse the content of this communication.
| Annual Report | September 30, 2018 | 15 |
| Clarkston Fund | Portfolio Update |
September 30, 2018 (Unaudited)
Returns of less than 1 year are cumulative.
Indices are not actively managed and do not reflect a deduction for fees, expenses or taxes. An investor cannot invest directly in an index.
The returns shown above do not reflect the deduction of taxes a shareholder would pay on Fund distributions or redemption of Fund shares.
The total annual operating expenses and total annual operating expenses after fee waivers and/or reimbursement you may pay as an investor in the Fund’s Institutional Class shares (as reported in the January 29, 2018 Prospectus), are 1.00% and 0.70%, respectively. The Fund’s investment adviser has contractually agreed to limit expenses through January 31, 2019.
| 16 | www.clarkstonfunds.com |
| Clarkston Select Fund | Portfolio Update |
September 30, 2018 (Unaudited)
Select Fund Commentary
For the twelve months ended September 30, 2018, the Clarkston Select Fund – Institutional Class (the “Fund”) gained 6.02%. The Russell 1000® Index gained 17.76% during the same period.
Most of the relative underperformance of the Fund was due to three measures: continuing to hold General Electric Company (GE) while it experienced challenges resulting in pressure on its share price, the Fund’s mid-teens average cash position, and an overweight to consumer defensive businesses and underweight to consumer cyclicals. While all three weighed on short-term performance, we believe these decisions will benefit the Fund longer-term.
General Electric was the worst performer and largest detractor from the Fund’s performance during the last twelve months. The company struggled with the complexity of its business model, legacy issues in GE Capital related to its long-term care insurance portfolio, and a top-line growth and marketing culture that arguably led to untimely expensive acquisitions and overcapacity in its Power business. These issues culminated in a new CEO, a dividend cut, a restructuring plan, and cash infusion into GE Capital.
We continued to hold GE in the Fund’s portfolio for several reasons. First, the company was simplifying the business and cutting its net-debt and pension obligations. In the summer of 2018, CEO John Flannery introduced a restructuring plan that highlighted three industrial core businesses (Aviation, Power, and Renewables), the separation of GE Healthcare into an independent company, the merger of GE Transportation with a third party, the orderly separation of Baker Hughes, and the shrinking of GE Capital.
Second, we believe GE owns world-class assets. The Aviation, Power, and Renewables businesses each have leading positions in their end markets with 60%, 55% and 35% market share, respectively. Healthcare is the market share leader in several of its categories with more than 30% share in U.S. medical diagnostic imaging. These businesses have attractive returns on capital, high customer switching costs, substantial after the sale contractual revenue streams, and each benefits from scale economies, customer captivity, and some degree of cost advantage.
Lastly, we believe GE’s shares are inexpensive and the company’s assets are worth much more than the current share price reflects. We acknowledge GE does have challenges ahead. There is no quick fix and GE will surely encounter additional challenges. We believe, however, that patient investors who possess the ability to see this turnaround all the way through will be rewarded.
On October 1, 2018, GE named Lead Director and retired Danaher CEO and Chairman Larry Culp as Chairman and CEO. At the writing of this commentary, we know little about his plans, however, we view Culp’s appointment as a positive due to his previous experience and success at Danaher. Additionally, we like the fact that Culp is viewed as an outsider and can bring a fresh perspective to GE’s turnaround. He may also have an advantage over insiders in that he may be better positioned to make unemotionally-tied decisions in the best interest of GE shareholders.
Anheuser-Busch InBev SA/NV Sponsored ADR (BUD-US) was the second largest detractor from the Fund’s performance during the quarter. While the company has been challenged by volume declines in the United States, we believe much of the recent pressure on its shares was due to a sharp depreciation of emerging-market currencies against the U.S. dollar, AB InBev’s reporting currency. While this was unwelcomed, we believe AB InBev’s share price more than reflects this currency devaluation in emerging markets. We believe the company’s geographical diversification is a positive in this environment.
| Annual Report | September 30, 2018 | 17 |
| Clarkston Select Fund | Portfolio Update |
September 30, 2018 (Unaudited)
The largest contributors to Fund performance during the quarter were Microsoft Corporation (MSFT) and Cisco Systems, Inc. (CSCO).
During the twelve months ended September 30, 2018, we added one new holding to the Fund, Nestle S.A. Sponsored ADR (NSRGY), and added capital to several existing holdings. We eliminated Emerson Electric Co. (EMR) and trimmed other existing holdings due to what we considered to be excessive valuations.
Past performance does not guarantee future results. The views and information discussed in this letter are as of the date of publication, are subject to change, and may not reflect the writer’s current views. The views expressed are those of Clarkston Capital Partners, LLC, the investment adviser to the Clarkston Funds, and represent an assessment of market conditions at a specific point in time, are opinions only and should not be relied upon as investment advice regarding a particular investment or markets in general. The information provided does not constitute a recommendation to buy or sell specific securities or investment vehicles. It should not be assumed that any investment will be profitable or will equal the performance of any securities or any sectors mentioned in this letter. The subject matter contained in this letter has been derived from several sources believed to be reliable and accurate at the time of compilation. Neither the Clarkston Funds nor Clarkston Capital Partners, LLC accepts any liability for losses, either direct or consequential, caused by the use of this information.
| 18 | www.clarkstonfunds.com |
| Clarkston Select Fund | Portfolio Update |
September 30, 2018 (Unaudited)
Top Ten Holdings (as a % of Net Assets)*
| The Procter & Gamble Co. | 7.18% |
| General Electric Co. | 6.25% |
| Nielsen Holdings PLC | 5.07% |
| International Business Machines Corp. | 4.89% |
| PepsiCo, Inc. | 4.83% |
| The Western Union Co. | 4.66% |
| Cisco Systems, Inc. | 4.55% |
| Microsoft Corp. | 4.52% |
| Paychex, Inc. | 4.50% |
| Sysco Corp. | 4.22% |
| Top Ten Holdings | 50.67% |
Sector Allocation (as a % of Net Assets)*
| Consumer Staples | 26.62% |
| Producer Durables | 16.99% |
| Financial Services | 15.34% |
| Technology | 13.97% |
| Health Care | 7.28% |
| Consumer Discretionary | 7.10% |
| Materials & Processing | 3.09% |
| Cash, Cash Equivalents, & Other Net Assets | 9.61% |
| Total | 100.00% |
| * | Holdings are subject to change, and may not reflect the current or future position of the portfolio. |
| Annual Report | September 30, 2018 | 19 |
| Clarkston Select Fund | Portfolio Update |
September 30, 2018 (Unaudited)
Performance of a Hypothetical $10,000 Initial Investment (at Inception* through September 30, 2018)
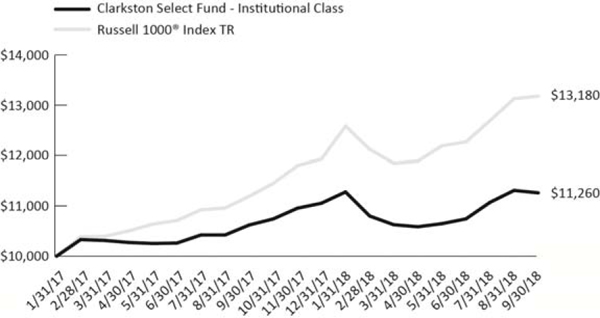
The graph shown above represents historical performance of a hypothetical investment of $10,000 in the Institutional Class. Past performance does not guarantee future results. All returns reflect reinvested dividends, but do not reflect the deduction of taxes that a shareholder would pay on Fund distributions or the redemption of Fund shares.
Average Annual Total Returns (as of September 30, 2018)
| 3 Month | 6 Month | 1 Year | Since Inception* | |
| Clarkston Select Fund – Institutional Class | 4.82% | 5.97% | 6.02% | 7.40% |
| Russell 1000® Index TR | 7.42% | 11.25% | 17.76% | 18.06% |
The performance data quoted above represents past performance. Past performance is not a guarantee of future results. Investment return and value of the Fund shares will fluctuate so that an investor’s shares, when sold or redeemed, may be worth more or less than their original cost. Performance may be lower or higher than performance data quoted. Fund performance current to the most recent month end is available by calling (844) 680-6562 or by visiting www.clarkstonfunds.com.
| * | Fund’s inception date is January 31, 2017. |
The Russell 1000® Index TR measures the performance of the large-cap segment of the U.S. equity universe. It is a subset of the Russell 3000® Index and includes approximately 1,000 of the largest securities based on a combination of their market cap and current index membership. The Russell 1000® represents approximately 92% of the U.S. market. The Russell 1000® Index TR is constructed to provide a comprehensive and unbiased barometer for the large-cap segment and is completely reconstituted annually to ensure new and growing equities are reflected.
Frank Russell Company (“Russell”) is the source and owner of the trademarks, service marks and copyrights related to the Russell Indexes. Russell® is a trademark of Frank Russell Company. Neither Russell nor its licensors accept any liability for any errors or omissions in the Russell Indexes or underlying data and no party may rely on any Russell Indexes and/or underlying data contained in this communication. No further distribution of Russell Data is permitted without Russell’s express written consent. Russell does not promote, sponsor or endorse the content of this communication.
| 20 | www.clarkstonfunds.com |
| Clarkston Select Fund | Portfolio Update |
September 30, 2018 (Unaudited)
Returns of less than 1 year are cumulative.
Indices are not actively managed and do not reflect a deduction for fees, expenses or taxes. An investor cannot invest directly in an index.
The returns shown above do not reflect the deduction of taxes a shareholder would pay on Fund distributions or redemption of Fund shares.
The total annual operating expenses and total annual operating expenses after fee waivers and/or reimbursement you may pay as an investor in the Fund’s Institutional Class shares (as reported in the January 29, 2018 Prospectus), are 1.62% and 0.70%, respectively. The Fund’s investment adviser has contractually agreed to limit expenses through January 31, 2019.
| Annual Report | September 30, 2018 | 21 |
| Clarkston Founders Fund | Portfolio Update |
September 30, 2018 (Unaudited)
Founders Fund Commentary
For the twelve months ended September 30, 2018, the Clarkston Founders Fund – Institutional Class (the “Fund”) gained 7.01%. The Russell Midcap® Index gained 13.98% during the same period.
The large majority of the Fund’s underperformance relative to the Index over the past twelve months was the result of exclusion, not inclusion. Our inability to find what we considered to be attractive values, or as we like to say, our refusal to overpay for businesses, resulted in most of the underperformance. We chose to hold cash (about one-third of the Fund’s portfolio) and the interest earned on this cash position was much less than the return on the average stock in the Index. A smaller but significant portion of the underperformance was the result of the Fund’s lack of exposure to technology, which was by far the best performing sector in the Russell Midcap® Index during the period.
The two largest individual detractors from the Fund’s performance over the past twelve months were Legg Mason, Inc. (LM) and Stericycle, Inc. (SRCL). For Legg, the continued shift in the investment management industry of assets from actively managed to passively managed, muted asset flow growth, and the perceived impact of rising rates on Legg’s fixed income affiliates were the primary drivers behind the 20% plus drop in the company’s shares. While we recognize these concerns, we feel investors are ignoring management’s exceptional use of capital, which in our opinion has positioned Legg for long-term growth.
Over the past five years, Legg has invested in its global distribution platform, made acquisitions to optimize its affiliate line-up, and diversified its assets under management with new asset classes and vehicles; all of which have positively contributed to the company’s free cash flow. Further, management has financed most of these acquisitions with low interest rate debt, half of which matures in over two decades. Finally, Legg structured acquisitions in a tax-efficient manner, which further facilitates strong free cash flow generation and capital return to shareholders.
Still, there continues to be a widening disconnect between the transformative actions Legg has taken and its share price, which has been trading at less than book value. We applaud management’s execution and believe Legg is well-positioned to navigate and ultimately benefit in an environment of lower fees and consolidating customer platforms.
We believe Stericycle is a high-quality business facing temporary challenges self-inflicted from past acquisitions made outside of its core competency; all of which occurred prior to the Fund’s investment in Stericycle’s shares. Because of these acquisitions, Stericycle’s business became operationally complex, more exposed to cyclical end markets, and incurred higher than historical debt levels. Additionally, a portion of Stericycle’s core regulated medical waste business is facing pricing headwinds in certain customer segments.
Stericycle, to address these challenges, has implemented a business transformation plan that includes streamlining operations, implementing a new enterprise resource planning system, and divesting non-core assets. The combination of the investments in these initiatives, pricing pressure, and cyclical end markets is temporarily suppressing cash earnings. We believe the quality of the company’s core businesses is being masked by the “noise.”
| 22 | www.clarkstonfunds.com |
| Clarkston Founders Fund | Portfolio Update |
September 30, 2018 (Unaudited)
Stericycle’s regulated medical waste and document destruction businesses have leading positions in their end markets with 50% and 30% market share, respectively. These businesses operate in micro-niche industries, have attractive returns on capital and difficult-to-impossible to replicate assets, and benefit from scale economies and some degree of cost advantage. In addition, we believe the document destruction business has respectable growth potential. Competition is highly fragmented, enabling Stericycle to continue its roll-up strategy through low-risk, tuck-in acquisitions.
Lastly, we are encouraged by the engagement of Stericycle’s board of directors in the company’s business transformation plan. This coupled with our belief in the quality of the core businesses and attractive valuation of the company’s shares, leads us to be optimistic about the Fund’s investment in Stericycle.
The largest contributors to Fund performance during the quarter were Broadridge Financial Solutions, Inc. (BR) and Sysco Corporation (SYY).
During the twelve-months ended September 30, 2018, we added one new holding to the Fund, CDK Global, Inc. (CDK), and added capital to several existing holdings. We eliminated Equifax, Inc. (EFX) and trimmed several other existing holdings due to what we considered to be excessive valuations.
Past performance does not guarantee future results. The views and information discussed in this letter are as of the date of publication, are subject to change, and may not reflect the writer’s current views. The views expressed are those of Clarkston Capital Partners, LLC, the investment adviser to the Clarkston Funds, and represent an assessment of market conditions at a specific point in time, are opinions only and should not be relied upon as investment advice regarding a particular investment or markets in general. The information provided does not constitute a recommendation to buy or sell specific securities or investment vehicles. It should not be assumed that any investment will be profitable or will equal the performance of any securities or any sectors mentioned in this letter. The subject matter contained in this letter has been derived from several sources believed to be reliable and accurate at the time of compilation. Neither the Clarkston Funds nor Clarkston Capital Partners, LLC accepts any liability for losses, either direct or consequential, caused by the use of this information.
| Annual Report | September 30, 2018 | 23 |
| Clarkston Founders Fund | Portfolio Update |
September 30, 2018 (Unaudited)
Top Ten Holdings (as a % of Net Assets)*
| The Western Union Co. | 6.13% |
| Stericycle, Inc. | 5.49% |
| Nielsen Holdings PLC | 5.18% |
| Willis Towers Watson PLC | 4.95% |
| Brown & Brown, Inc. | 4.84% |
| Legg Mason, Inc. | 4.11% |
| Sysco Corp. | 4.07% |
| McKesson Corp. | 3.10% |
| Broadridge Financial Solutions, Inc. | 3.01% |
| CH Robinson Worldwide, Inc. | 2.86% |
| Top Ten Holdings | 43.74% |
Sector Allocation (as a % of Net Assets)*
| Financial Services | 28.20% |
| Producer Durables | 15.29% |
| Consumer Discretionary | 7.12% |
| Consumer Staples | 6.11% |
| Health Care | 5.28% |
| Technology | 3.67% |
| Materials & Processing | 2.04% |
| Cash, Cash Equivalents, & Other Net Assets | 32.29% |
| Total | 100.00% |
| * | Holdings are subject to change, and may not reflect the current or future position of the portfolio. |
| 24 | www.clarkstonfunds.com |
| Clarkston Founders Fund | Portfolio Update |
September 30, 2018 (Unaudited)
Performance of a Hypothetical $10,000 Initial Investment (at Inception* through September 30, 2018)
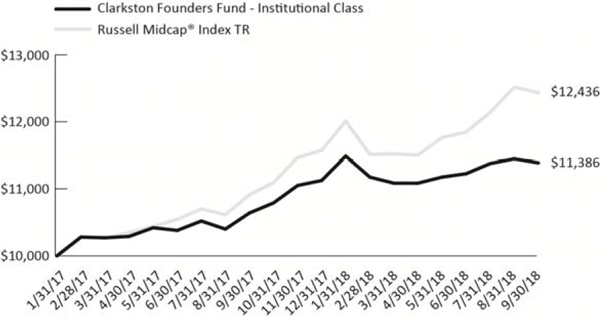
The graph shown above represents historical performance of a hypothetical investment of $10,000 in the Institutional Class. Past performance does not guarantee future results. All returns reflect reinvested dividends, but do not reflect the deduction of taxes that a shareholder would pay on Fund distributions or the redemption of Fund shares.
Average Annual Total Returns (as of September 30, 2018)
| 3 Month | 6 Month | 1 Year | Since Inception* | |
| Clarkston Founders Fund – Institutional Class | 1.43% | 2.72% | 7.01% | 8.12% |
| Russell Midcap® Index TR | 5.00% | 7.96% | 13.98% | 14.01% |
The performance data quoted above represents past performance. Past performance is not a guarantee of future results. Investment return and value of the Fund shares will fluctuate so that an investor’s shares, when sold or redeemed, may be worth more or less than their original cost. Performance may be lower or higher than performance data quoted. Fund performance current to the most recent month end is available by calling (844) 680-6562 or by visiting www.clarkstonfunds.com.
| * | Fund’s inception date is January 31, 2017. |
The Russell Midcap® Index is a market capitalization weighted index that measures the performance of the mid-capitalization sector of the U.S. equity market and includes approximately 800 of the smallest issuers in the Russell 1000® Index. The Russell 1000® Index includes the 1,000 largest stocks in the Russell 3000® Index, which consists of the 3,000 largest U.S. public companies.
Frank Russell Company (“Russell”) is the source and owner of the trademarks, service marks and copyrights related to the Russell Indexes. Russell® is a trademark of Frank Russell Company. Neither Russell nor its licensors accept any liability for any errors or omissions in the Russell Indexes or underlying data and no party may rely on any Russell Indexes and/or underlying data contained in this communication. No further distribution of Russell Data is permitted without Russell’s express written consent. Russell does not promote, sponsor or endorse the content of this communication.
| Annual Report | September 30, 2018 | 25 |
| Clarkston Founders Fund | Portfolio Update |
September 30, 2018 (Unaudited)
Returns of less than 1 year are cumulative.
Indices are not actively managed and do not reflect a deduction for fees, expenses or taxes. An investor cannot invest directly in an index.
The returns shown above do not reflect the deduction of taxes a shareholder would pay on Fund distributions or redemption of Fund shares.
The total annual operating expenses and total annual operating expenses after fee waivers and/or reimbursement you may pay as an investor in the Fund’s Institutional Class shares (as reported in the January 29, 2018 Prospectus), are 1.43% and 0.95%, respectively. The Fund’s investment adviser has contractually agreed to limit expenses through January 31, 2019.
| 26 | www.clarkstonfunds.com |
| Clarkston Funds | Disclosure of Fund Expenses |
September 30, 2018
Example. As a shareholder of the Clarkston Partners Fund, Clarkston Fund, Clarkston Select Fund, or Clarkston Founders Fund (the “Funds”), you incur two types of costs: (1) transaction costs; and (2) ongoing costs, including management fees and other Fund expenses. The following examples are intended to help you understand your ongoing costs (in dollars) of investing in a Fund and to compare these costs with the ongoing costs of investing in other mutual funds. The examples are based on an investment of $1,000 invested on April 1, 2018 and held through September 30, 2018.
Actual Expenses. The first line under each class in the following table provides information about actual account values and actual expenses. You may use the information in this line, together with the amount you invested, to estimate the expenses that you paid over the period. Simply divide your account value by $1,000 (for example, an $8,600 account value divided by $1,000 = 8.6), then multiply the result by the number in the first line under the heading “Expenses Paid During Period April 1, 2018 – September 30, 2018” to estimate the expenses you paid on your account during this period.
Hypothetical Example for Comparison Purposes. The second line under each class in the following table provides information about hypothetical account values and hypothetical expenses based on a Fund’s actual expense ratio and an assumed rate of return of 5% per year before expenses, which is not the Fund’s actual return. The hypothetical account values and expenses may not be used to estimate the actual ending account balance or expenses you paid for the period. You may use this information to compare the ongoing costs of investing in a Fund and other mutual funds. To do so, compare this 5% hypothetical example with the 5% hypothetical examples that appear in the shareholder reports of the other funds.
Please note that the expenses shown in the table are meant to highlight your ongoing Fund costs only and do not reflect any transactional costs. Therefore, the second line under each class in the table below is useful in comparing ongoing costs only and will not help you determine the relative total costs of owning different funds. In addition, if these transactional costs were included, your costs would have been higher.
| Annual Report | September 30, 2018 | 27 |
| Clarkston Funds | Disclosure of Fund Expenses |
| September 30, 2018 |
| Beginning Account Value April 1, 2018 | Ending Account Value September 30, 2018 | Expense Ratio(a) | Expenses Paid During Period April 1, 2018 -September 30, 2018(b) | |
| Clarkston Partners Fund | ||||
| Founders Class | ||||
| Actual | $1,000.00 | $1,034.20 | 0.85% | $4.33 |
| Hypothetical (5% return before expenses) | $1,000.00 | $1,020.81 | 0.85% | $4.31 |
| Institutional Class | ||||
| Actual | $1,000.00 | $1,032.80 | 0.99% | $5.04 |
| Hypothetical (5% return before expenses) | $1,000.00 | $1,020.10 | 0.99% | $5.01 |
| Clarkston Fund | ||||
| Institutional Class | ||||
| Actual | $1,000.00 | $1,047.20 | 0.65% | $3.34 |
| Hypothetical (5% return before expenses) | $1,000.00 | $1,021.81 | 0.65% | $3.29 |
| Clarkston Select Fund | ||||
| Institutional Class | ||||
| Actual | $1,000.00 | $1,059.70 | 0.65% | $3.36 |
| Hypothetical (5% return before expenses) | $1,000.00 | $1,021.81 | 0.65% | $3.29 |
| Clarkston Founders Fund | ||||
| Institutional Class | ||||
| Actual | $1,000.00 | $1,027.20 | 0.91% | $4.62 |
| Hypothetical (5% return before expenses) | $1,000.00 | $1,020.51 | 0.91% | $4.61 |
| (a) | Each Fund's expense ratios have been annualized based on the Fund's actual expenses for the 6 month period ending September 30, 2018. |
| (b) | Expenses are equal to the annualized expense ratio shown above for the applicable class, multiplied by the average account value over the period, multiplied by the number of days in the most recent fiscal half year (183), divided by 365. |
| 28 | www.clarkstonfunds.com |
| Clarkston Partners Fund | Portfolio of Investments |
| September 30, 2018 |
| Shares | Value (Note 2) | |||||||
| COMMON STOCKS (69.37%) | ||||||||
| Consumer Discretionary (10.78%) | ||||||||
| John Wiley & Sons, Inc., Class A | 433,307 | $ | 26,258,404 | |||||
| Matthews International Corp., Class A | 475,000 | 23,821,250 | ||||||
| Nielsen Holdings PLC | 1,600,000 | 44,256,000 | ||||||
| Total Consumer Discretionary | 94,335,654 | |||||||
| Consumer Staples (4.09%) | ||||||||
| McCormick & Co., Inc. | 130,000 | 17,127,500 | ||||||
| Post Holdings, Inc.(a) | 190,000 | 18,627,600 | ||||||
| Total Consumer Staples | 35,755,100 | |||||||
| Financial Services (30.43%) | ||||||||
| Artisan Partners Asset Management, Inc., Class A | 260,180 | 8,429,832 | ||||||
| Broadridge Financial Solutions, Inc. | 200,000 | 26,390,000 | ||||||
| Brown & Brown, Inc. | 1,570,000 | 46,424,900 | ||||||
| Legg Mason, Inc. | 1,435,000 | 44,815,050 | ||||||
| LPL Financial Holdings, Inc. | 500,000 | 32,255,000 | ||||||
| Markel Corp.(a) | 12,000 | 14,261,880 | ||||||
| The Western Union Co. | 2,700,000 | 51,462,000 | ||||||
| Willis Towers Watson PLC | 300,000 | 42,282,000 | ||||||
| Total Financial Services | 266,320,662 | |||||||
| Materials & Processing (1.72%) | ||||||||
| Fastenal Co. | 260,000 | 15,085,200 | ||||||
| Total Materials & Processing | 15,085,200 | |||||||
| Producer Durables (18.56%) | ||||||||
| Actuant Corp., Class A | 864,610 | 24,122,619 | ||||||
| CH Robinson Worldwide, Inc. | 270,000 | 26,438,400 | ||||||
| Graco, Inc. | 165,000 | 7,646,100 | ||||||
| Hillenbrand, Inc. | 330,000 | 17,259,000 | ||||||
| Landstar System, Inc. | 205,000 | 25,010,000 | ||||||
| Stericycle, Inc.(a) | 800,000 | 46,944,000 | ||||||
| Waters Corp.(a) | 77,000 | 14,990,360 | ||||||
| Total Producer Durables | 162,410,479 | |||||||
| Technology (3.79%) | ||||||||
| CDK Global, Inc. | 271,281 | 16,971,340 | ||||||
| IHS Markit, Ltd.(a) | 300,000 | 16,188,000 | ||||||
| Total Technology | 33,159,340 | |||||||
| TOTAL COMMON STOCKS (Cost $478,830,332) | 607,066,435 | |||||||
| See Notes to Financial Statements. |
| Annual Report | September 30, 2018 | 29 |
| Clarkston Partners Fund | Portfolio of Investments |
| September 30, 2018 |
| Value (Note 2) | ||||
| TOTAL INVESTMENTS (69.37%) (Cost 478,830,332) | $ | 607,066,435 | ||
| Other Assets In Excess Of Liabilities (30.63%) | 268,071,975 | |||
| NET ASSETS (100.00%) | $ | 875,138,410 | ||
| (a) | Non-income producing security. |
For Fund compliance purposes, the Fund’s industry classifications refer to any one or more of the industry sub-classifications used by one or more widely recognized market indices or ratings group indices and/or as defined by Fund management. This definition may not apply for purposes of this report, which may use a different classification system or may combine industry sub-classifications for reporting ease. Industries are shown as a percent of the Fund's net assets. (Unaudited)
| See Notes to Financial Statements. |
| 30 | www.clarkstonfunds.com |
| Clarkston Fund | Portfolio of Investments |
| September 30, 2018 |
| Shares | Value (Note 2) | |||||||
| COMMON STOCKS (90.01%) | ||||||||
| Consumer Discretionary (3.81%) | ||||||||
| Walmart, Inc. | 8,500 | $ | 798,235 | |||||
| The Walt Disney Co. | 3,500 | 409,290 | ||||||
| Total Consumer Discretionary | 1,207,525 | |||||||
| Consumer Staples (27.75%) | ||||||||
| Anheuser-Busch InBev SA/NV, Sponsored ADR | 14,200 | 1,243,494 | ||||||
| Diageo PLC, Sponsored ADR | 8,500 | 1,204,195 | ||||||
| Mondelez International, Inc., Class A | 15,000 | 644,400 | ||||||
| Nestle SA ADR | 12,000 | 998,400 | ||||||
| PepsiCo, Inc. | 12,000 | 1,341,600 | ||||||
| The Procter & Gamble Co. | 24,500 | 2,039,135 | ||||||
| Sysco Corp. | 18,000 | 1,318,500 | ||||||
| Total Consumer Staples | 8,789,724 | |||||||
| Financial Services (24.88%) | ||||||||
| American Express Co. | 13,000 | 1,384,370 | ||||||
| Capital One Financial Corp. | 9,000 | 854,370 | ||||||
| The Charles Schwab Corp. | 18,000 | 884,700 | ||||||
| Markel Corp.(a) | 275 | 326,835 | ||||||
| Mastercard, Inc., Class A | 3,500 | 779,135 | ||||||
| US Bancorp | 11,500 | 607,315 | ||||||
| The Western Union Co. | 82,000 | 1,562,920 | ||||||
| Willis Towers Watson PLC | 10,500 | 1,479,870 | ||||||
| Total Financial Services | 7,879,515 | |||||||
| Health Care (9.90%) | ||||||||
| AmerisourceBergen Corp. | 4,200 | 387,324 | ||||||
| Johnson & Johnson | 10,000 | 1,381,700 | ||||||
| McKesson Corp. | 5,100 | 676,515 | ||||||
| Medtronic PLC | 7,000 | 688,590 | ||||||
| Total Health Care | 3,134,129 | |||||||
| Producer Durables (11.27%) | ||||||||
| CH Robinson Worldwide, Inc. | 6,500 | 636,480 | ||||||
| General Electric Co. | 177,000 | 1,998,330 | ||||||
| United Parcel Service, Inc., Class B | 8,000 | 934,000 | ||||||
| Total Producer Durables | 3,568,810 | |||||||
| Technology (12.40%) | ||||||||
| Cisco Systems, Inc. | 26,500 | 1,289,225 | ||||||
| International Business Machines Corp. | 8,000 | 1,209,680 | ||||||
| See Notes to Financial Statements. |
| Annual Report | September 30, 2018 | 31 |
| Clarkston Fund | Portfolio of Investments |
| September 30, 2018 |
| Shares | Value (Note 2) | |||||||
| Technology (continued) | ||||||||
| Microsoft Corp. | 12,500 | $ | 1,429,625 | |||||
| Total Technology | 3,928,530 | |||||||
| TOTAL COMMON STOCKS (Cost $25,157,058) | 28,508,233 | |||||||
| TOTAL INVESTMENTS (90.01%) (Cost 25,157,058) | $ | 28,508,233 | ||||||
| Other Assets In Excess Of Liabilities (9.99%) | 3,164,735 | |||||||
| NET ASSETS (100.00%) | $ | 31,672,968 | ||||||
| (a) | Non-income producing security. |
For Fund compliance purposes, the Fund’s industry classifications refer to any one or more of the industry sub-classifications used by one or more widely recognized market indices or ratings group indices and/or as defined by Fund management. This definition may not apply for purposes of this report, which may use a different classification system or may combine industry sub-classifications for reporting ease. Industries are shown as a percent of the Fund's net assets. (Unaudited)
| See Notes to Financial Statements. |
| 32 | www.clarkstonfunds.com |
| Clarkston Select Fund | Portfolio of Investments |
| September 30, 2018 |
| Shares | Value (Note 2) | |||||||
| COMMON STOCKS (90.39%) | ||||||||
| Consumer Discretionary (7.10%) | ||||||||
| Nielsen Holdings PLC | 25,500 | $ | 705,330 | |||||
| Walmart, Inc. | 3,000 | 281,730 | ||||||
| Total Consumer Discretionary | 987,060 | |||||||
| Consumer Staples (26.62%) | ||||||||
| Anheuser-Busch InBev SA/NV, Sponsored ADR | 6,100 | 534,177 | ||||||
| Diageo PLC, Sponsored ADR | 3,200 | 453,344 | ||||||
| Nestle SA ADR | 5,500 | 457,600 | ||||||
| PepsiCo, Inc. | 6,000 | 670,800 | ||||||
| The Procter & Gamble Co. | 12,000 | 998,760 | ||||||
| Sysco Corp. | 8,000 | 586,000 | ||||||
| Total Consumer Staples | 3,700,681 | |||||||
| Financial Services (15.34%) | ||||||||
| American Express Co. | 4,000 | 425,960 | ||||||
| Capital One Financial Corp. | 3,800 | 360,734 | ||||||
| T Rowe Price Group, Inc. | 3,000 | 327,540 | ||||||
| US Bancorp | 7,000 | 369,670 | ||||||
| The Western Union Co. | 34,000 | 648,040 | ||||||
| Total Financial Services | 2,131,944 | |||||||
| Health Care (7.28%) | ||||||||
| Johnson & Johnson | 3,500 | 483,595 | ||||||
| Pfizer, Inc. | 12,000 | 528,840 | ||||||
| Total Health Care | 1,012,435 | |||||||
| Materials & Processing (3.09%) | ||||||||
| Fastenal Co. | 7,400 | 429,348 | ||||||
| Total Materials & Processing | 429,348 | |||||||
| Producer Durables (16.99%) | ||||||||
| 3M Co. | 500 | 105,355 | ||||||
| CH Robinson Worldwide, Inc. | 3,000 | 293,760 | ||||||
| General Electric Co. | 77,000 | 869,330 | ||||||
| Paychex, Inc. | 8,500 | 626,025 | ||||||
| United Parcel Service, Inc., Class B | 4,000 | 467,000 | ||||||
| Total Producer Durables | 2,361,470 | |||||||
| Technology (13.97%) | ||||||||
| Cisco Systems, Inc. | 13,000 | 632,450 | ||||||
| International Business Machines Corp. | 4,500 | 680,445 | ||||||
| See Notes to Financial Statements. |
| Annual Report | September 30, 2018 | 33 |
| Clarkston Select Fund | Portfolio of Investments |
| September 30, 2018 |
| Shares | Value (Note 2) | |||||||
| Technology (continued) | ||||||||
| Microsoft Corp. | 5,500 | $ | 629,035 | |||||
| Total Technology | 1,941,930 | |||||||
| TOTAL COMMON STOCKS (Cost $11,922,775) | 12,564,868 | |||||||
| TOTAL INVESTMENTS (90.39%) (Cost 11,922,775) | $ | 12,564,868 | ||||||
| Other Assets In Excess Of Liabilities (9.61%) | 1,336,487 | |||||||
| NET ASSETS (100.00%) | $ | 13,901,355 | ||||||
For Fund compliance purposes, the Fund’s industry classifications refer to any one or more of the industry sub-classifications used by one or more widely recognized market indices or ratings group indices and/or as defined by Fund management. This definition may not apply for purposes of this report, which may use a different classification system or may combine industry sub-classifications for reporting ease. Industries are shown as a percent of the Fund's net assets. (Unaudited)
| See Notes to Financial Statements. |
| 34 | www.clarkstonfunds.com |
| Clarkston Founders Fund | Portfolio of Investments |
| September 30, 2018 |
| Shares | Value (Note 2) | |||||||
| COMMON STOCKS (67.71%) | ||||||||
| Consumer Discretionary (7.12%) | ||||||||
| LKQ Corp.(a) | 21,000 | $ | 665,070 | |||||
| Nielsen Holdings PLC | 64,000 | 1,770,240 | ||||||
| Total Consumer Discretionary | 2,435,310 | |||||||
| Consumer Staples (6.11%) | ||||||||
| McCormick & Co., Inc. | 5,300 | 698,275 | ||||||
| Sysco Corp. | 19,000 | 1,391,750 | ||||||
| Total Consumer Staples | 2,090,025 | |||||||
| Financial Services (28.20%) | ||||||||
| Broadridge Financial Solutions, Inc. | 7,800 | 1,029,210 | ||||||
| Brown & Brown, Inc. | 56,000 | 1,655,920 | ||||||
| The Charles Schwab Corp. | 17,000 | 835,550 | ||||||
| FactSet Research Systems, Inc. | 1,500 | 335,565 | ||||||
| Legg Mason, Inc. | 45,000 | 1,405,350 | ||||||
| Markel Corp.(a) | 500 | 594,245 | ||||||
| The Western Union Co. | 110,000 | 2,096,600 | ||||||
| Willis Towers Watson PLC | 12,000 | 1,691,280 | ||||||
| Total Financial Services | 9,643,720 | |||||||
| Health Care (5.28%) | ||||||||
| AmerisourceBergen Corp. | 4,000 | 368,880 | ||||||
| DENTSPLY SIRONA, Inc. | 10,000 | 377,400 | ||||||
| McKesson Corp. | 8,000 | 1,061,200 | ||||||
| Total Health Care | 1,807,480 | |||||||
| Materials & Processing (2.04%) | ||||||||
| Fastenal Co. | 12,000 | 696,240 | ||||||
| Total Materials & Processing | 696,240 | |||||||
| Producer Durables (15.29%) | ||||||||
| CH Robinson Worldwide, Inc. | 10,000 | 979,200 | ||||||
| Cintas Corp. | 3,000 | 593,430 | ||||||
| Paychex, Inc. | 11,000 | 810,150 | ||||||
| Roper Technologies, Inc. | 1,300 | 385,073 | ||||||
| Stericycle, Inc.(a) | 32,000 | 1,877,760 | ||||||
| Waters Corp.(a) | 3,000 | 584,040 | ||||||
| Total Producer Durables | 5,229,653 | |||||||
| Technology (3.67%) | ||||||||
| CDK Global, Inc. | 9,290 | 581,182 | ||||||
| See Notes to Financial Statements. |
| Annual Report | September 30, 2018 | 35 |
| Clarkston Founders Fund | Portfolio of Investments |
| September 30, 2018 |
| Shares | Value (Note 2) | |||||||
| Technology (continued) | ||||||||
| IHS Markit, Ltd.(a) | 12,500 | $ | 674,500 | |||||
| Total Technology | 1,255,682 | |||||||
| TOTAL COMMON STOCKS (Cost $20,701,980) | 23,158,110 | |||||||
| TOTAL INVESTMENTS (67.71%) (Cost 20,701,980) | $ | 23,158,110 | ||||||
| Other Assets In Excess Of Liabilities (32.29%) | 11,042,470 | |||||||
| NET ASSETS (100.00%) | $ | 34,200,580 | ||||||
| (a) | Non-income producing security. |
For Fund compliance purposes, the Fund’s industry classifications refer to any one or more of the industry sub-classifications used by one or more widely recognized market indices or ratings group indices and/or as defined by Fund management. This definition may not apply for purposes of this report, which may use a different classification system or may combine industry sub-classifications for reporting ease. Industries are shown as a percent of the Fund's net assets. (Unaudited)
| See Notes to Financial Statements. |
| 36 | www.clarkstonfunds.com |
| Clarkston Funds | Statements of Assets and Liabilities |
| September 30, 2018 |
| CLARKSTON PARTNERS FUND | CLARKSTON FUND | |||||||
| ASSETS: | ||||||||
| Investments, at value (Cost $478,830,332 and $25,157,058) | $ | 607,066,435 | $ | 28,508,233 | ||||
| Cash & Cash Equivalents | 269,550,293 | 3,335,834 | ||||||
| Receivable for shares sold | 995,476 | 9,980 | ||||||
| Dividends receivable | 627,441 | 60,313 | ||||||
| Other Assets | 30,885 | 4,999 | ||||||
| Total Assets | 878,270,530 | 31,919,359 | ||||||
| LIABILITIES: | ||||||||
| Administration and transfer agency fees payable | 139,279 | 8,643 | ||||||
| Payable for investments purchased | 1,940,500 | – | ||||||
| Payable for shares redeemed | 197,848 | 201,300 | ||||||
| Payable to adviser | 505,452 | 5,290 | ||||||
| Payable for distribution and service fees | 244,714 | 11,956 | ||||||
| Payable for printing | 10,079 | 390 | ||||||
| Payable for professional fees | 39,290 | 15,887 | ||||||
| Payable to trustees | 20,046 | 768 | ||||||
| Payable to Chief Compliance Officer | 7,893 | 288 | ||||||
| Accrued expenses and other liabilities | 27,019 | 1,869 | ||||||
| Total Liabilities | 3,132,120 | 246,391 | ||||||
| NET ASSETS | $ | 875,138,410 | $ | 31,672,968 | ||||
| NET ASSETS CONSIST OF: | ||||||||
| Paid-in capital (Note 5) | $ | 699,013,158 | $ | 27,107,959 | ||||
| Total distributable earnings | 176,125,252 | 4,565,009 | ||||||
| NET ASSETS | $ | 875,138,410 | $ | 31,672,968 | ||||
| PRICING OF SHARES | ||||||||
| Founders Class: | ||||||||
| Net Asset Value, offering and redemption price per share | $ | 13.29 | N/A | |||||
| Net Assets | $ | 445,515,956 | N/A | |||||
| Shares of beneficial interest outstanding | 33,532,850 | N/A | ||||||
| Institutional Class: | ||||||||
| Net Asset Value, offering and redemption price per share | $ | 13.24 | $ | 11.99 | ||||
| Net Assets | $ | 429,622,454 | $ | 31,672,968 | ||||
| Shares of beneficial interest outstanding | 32,438,961 | 2,641,849 | ||||||
| See Notes to Financial Statements. |
| Annual Report | September 30, 2018 | 37 |
| Clarkston Funds | Statements of Assets and Liabilities |
| September 30, 2018 |
| CLARKSTON SELECT FUND | CLARKSTON FOUNDERS FUND | |||||||
| ASSETS: | ||||||||
| Investments, at value (Cost $11,922,775 and $20,701,980) | $ | 12,564,868 | $ | 23,158,110 | ||||
| Cash & Cash Equivalents | 1,163,149 | 11,112,870 | ||||||
| Receivable for shares sold | 179,980 | 48,960 | ||||||
| Receivable due from adviser | 1,269 | – | ||||||
| Dividends receivable | 19,014 | 27,768 | ||||||
| Other Assets | 3,002 | 3,334 | ||||||
| Total Assets | 13,931,282 | 34,351,042 | ||||||
| LIABILITIES: | ||||||||
| Administration and transfer agency fees payable | 6,772 | 8,812 | ||||||
| Payable for investments purchased | – | 61,878 | ||||||
| Payable for shares redeemed | – | 34,157 | ||||||
| Payable to adviser | – | 12,975 | ||||||
| Payable for distribution and service fees | 5,264 | 12,699 | ||||||
| Payable for printing | 164 | 343 | ||||||
| Payable for professional fees | 15,393 | 15,947 | ||||||
| Payable to trustees | 319 | 806 | ||||||
| Payable to Chief Compliance Officer | 127 | 308 | ||||||
| Accrued expenses and other liabilities | 1,888 | 2,537 | ||||||
| Total Liabilities | 29,927 | 150,462 | ||||||
| NET ASSETS | $ | 13,901,355 | $ | 34,200,580 | ||||
| NET ASSETS CONSIST OF: | ||||||||
| Paid-in capital (Note 5) | $ | 12,951,639 | $ | 31,157,497 | ||||
| Total distributable earnings | 949,716 | 3,043,083 | ||||||
| NET ASSETS | $ | 13,901,355 | $ | 34,200,580 | ||||
| PRICING OF SHARES | ||||||||
| Institutional Class: | ||||||||
| Net Asset Value, offering and redemption price per share | $ | 10.89 | $ | 11.34 | ||||
| Net Assets | $ | 13,901,355 | $ | 34,200,580 | ||||
| Shares of beneficial interest outstanding | 1,276,350 | 3,016,498 | ||||||
| See Notes to Financial Statements. |
| 38 | www.clarkstonfunds.com |
| Clarkston Funds | Statements of Operations |
| For the Year Ended September 30, 2018 |
| CLARKSTON PARTNERS FUND | CLARKSTON FUND | |||||||
| INVESTMENT INCOME: | ||||||||
| Dividends | $ | 11,848,761 | $ | 707,241 | ||||
| Foreign taxes withheld | – | (20,107 | ) | |||||
| Total Investment Income | 11,848,761 | 687,134 | ||||||
| EXPENSES: | ||||||||
| Investment advisory fees (Note 6) | 6,513,596 | 152,489 | ||||||
| Administration fees | 500,259 | 20,121 | ||||||
| Shareholder service fees | ||||||||
| Institutional Class | 516,419 | 31,278 | ||||||
| Custodian fees | 74,951 | 5,000 | ||||||
| Legal fees | 82,863 | 3,156 | ||||||
| Audit and tax fees | 15,000 | 15,000 | ||||||
| Transfer agent fees | 226,710 | 25,670 | ||||||
| Trustees fees and expenses | 86,129 | 3,198 | ||||||
| Registration and filing fees | 77,555 | 22,122 | ||||||
| Printing fees | 31,981 | 1,318 | ||||||
| Chief Compliance Officer fees | 46,551 | 1,745 | ||||||
| Insurance expense | 21,079 | 864 | ||||||
| Other expenses | 8,926 | 1,781 | ||||||
| Total Expenses | 8,202,019 | 283,742 | ||||||
| Less fees waived by investment adviser | ||||||||
| Founders Class (Note 6) | (399,992 | ) | N/A | |||||
| Institutional Class (Note 6) | (361,957 | ) | (84,677 | ) | ||||
| Total fees waived by investment adviser | (761,949 | ) | (84,677 | ) | ||||
| Net Expenses | 7,440,070 | 199,065 | ||||||
| NET INVESTMENT INCOME | 4,408,691 | 488,069 | ||||||
| REALIZED AND UNREALIZED GAIN ON INVESTMENTS: | ||||||||
| Net realized gain on: | ||||||||
| Investments | 45,315,879 | 818,342 | ||||||
| Net realized gain | 45,315,879 | 818,342 | ||||||
| Change in unrealized appreciation on: | ||||||||
| Investments | 12,796,620 | 542,726 | ||||||
| Net change | 12,796,620 | 542,726 | ||||||
| NET REALIZED AND UNREALIZED GAIN ON INVESTMENTS | 58,112,499 | 1,361,068 | ||||||
| NET INCREASE IN NET ASSETS RESULTING FROM OPERATIONS | $ | 62,521,190 | $ | 1,849,137 | ||||
| See Notes to Financial Statements. |
| Annual Report | September 30, 2018 | 39 | |||
| Clarkston Funds | Statements of Operations |
For the Year Ended September 30, 2018 |
| CLARKSTON SELECT FUND | CLARKSTON FOUNDERS FUND | |||||||
| INVESTMENT INCOME: | ||||||||
| Dividends | $ | 383,123 | $ | 454,790 | ||||
| Foreign taxes withheld | (11,668 | ) | – | |||||
| Total Investment Income | 371,455 | 454,790 | ||||||
| EXPENSES: | ||||||||
| Investment advisory fees (Note 6) | 71,621 | 227,155 | ||||||
| Administration fees | 9,926 | 19,674 | ||||||
| Shareholder service fees | ||||||||
| Institutional Class | 14,738 | 32,514 | ||||||
| Custodian fees | 5,000 | 5,000 | ||||||
| Legal fees | 1,462 | 3,010 | ||||||
| Audit and tax fees | 15,000 | 15,000 | ||||||
| Transfer agent fees | 25,530 | 25,580 | ||||||
| Trustees fees and expenses | 1,436 | 3,119 | ||||||
| Registration and filing fees | 20,111 | 19,882 | ||||||
| Printing fees | 588 | 1,082 | ||||||
| Chief Compliance Officer fees | 823 | 1,730 | ||||||
| Insurance expense | 265 | 474 | ||||||
| Offering costs | 13,247 | 13,255 | ||||||
| Other expenses | 2,649 | 2,788 | ||||||
| Total Expenses | 182,396 | 370,263 | ||||||
| Less fees waived/reimbursed by investment adviser | ||||||||
| Institutional Class (Note 6) | (88,815 | ) | (95,166 | ) | ||||
| Net Expenses | 93,581 | 275,097 | ||||||
| NET INVESTMENT INCOME | 277,874 | 179,693 | ||||||
| REALIZED AND UNREALIZED GAIN ON INVESTMENTS: | ||||||||
| Net realized gain on: | ||||||||
| Investments | 298,485 | 477,317 | ||||||
| Net realized gain | 298,485 | 477,317 | ||||||
| Change in unrealized appreciation on: | ||||||||
| Investments | 236,480 | 1,228,620 | ||||||
| Net change | 236,480 | 1,228,620 | ||||||
| NET REALIZED AND UNREALIZED GAIN ON INVESTMENTS | 534,965 | 1,705,937 | ||||||
| NET INCREASE IN NET ASSETS RESULTING FROM OPERATIONS | $ | 812,839 | $ | 1,885,630 | ||||
| See Notes to Financial Statements. |
| 40 | www.clarkstonfunds.com |
| Clarkston Partners Fund | Statements of Changes in Net Assets |
| For the Year Ended September 30, 2018 | For the Year Ended September 30, 2017 | |||||||
| OPERATIONS: | ||||||||
| Net investment income | $ | 4,408,691 | $ | 2,234,810 | ||||
| Net realized gain on investments | 45,315,879 | 7,147,287 | ||||||
| Net change in unrealized appreciation on investments | 12,796,620 | 71,238,487 | ||||||
| Net increase in net assets resulting from operations | 62,521,190 | 80,620,584 | ||||||
| DISTRIBUTIONS TO SHAREHOLDERS(a) | ||||||||
| Founders Class | (5,470,612 | ) | (3,851,676 | ) | ||||
| Institutional Class | (4,232,656 | ) | (3,331,547 | ) | ||||
| Total distributions | (9,703,268 | ) | (7,183,223 | ) | ||||
| BENEFICIAL SHARE TRANSACTIONS (Note 5): | ||||||||
| Founders Class | ||||||||
| Shares sold | 45,054,690 | 73,621,564 | ||||||
| Dividends reinvested | 187,284 | 122,627 | ||||||
| Shares redeemed | (26,289,800 | ) | (23,374,148 | ) | ||||
| Net increase from beneficial share transactions | 18,952,174 | 50,370,043 | ||||||
| Institutional Class | ||||||||
| Shares sold | 168,049,486 | 150,671,817 | ||||||
| Dividends reinvested | 3,956,110 | 3,265,521 | ||||||
| Shares redeemed | (133,503,789 | ) | (63,780,279 | ) | ||||
| Net increase from beneficial share transactions | 38,501,807 | 90,157,059 | ||||||
| Net increase in net assets | 110,271,903 | 213,964,463 | ||||||
| NET ASSETS: | ||||||||
| Beginning of year | 764,866,507 | 550,902,044 | ||||||
| End of year(a) | $ | 875,138,410 | $ | 764,866,507 | ||||
| (a) | For the prior year ended September 30, 2017, Total Distributions consisted of Net Investment Income $2,952,933, and Net Realized Gains $4,230,290 and Net Assets included accumulated net investment income of $1,172,608 |
| See Notes to Financial Statements. |
| Annual Report | September 30, 2018 | 41 |
| Clarkston Fund | Statements of Changes in Net Assets |
| For the Year Ended September 30, 2018 | For the Year Ended September 30, 2017 | |||||||
| OPERATIONS: | ||||||||
| Net investment income | $ | 488,069 | $ | 364,120 | ||||
| Net realized gain on investments | 818,342 | 48,652 | ||||||
| Net change in unrealized appreciation on investments | 542,726 | 2,041,410 | ||||||
| Net increase in net assets resulting from operations | 1,849,137 | 2,454,182 | ||||||
| DISTRIBUTIONS TO SHAREHOLDERS(a) | ||||||||
| Institutional Class | (400,570 | ) | (254,491 | ) | ||||
| Total distributions | (400,570 | ) | (254,491 | ) | ||||
| BENEFICIAL SHARE TRANSACTIONS (Note 5): | ||||||||
| Institutional Class | ||||||||
| Shares sold | 8,817,309 | 9,872,180 | ||||||
| Dividends reinvested | 398,503 | 254,490 | ||||||
| Shares redeemed | (8,398,319 | ) | (3,092,454 | ) | ||||
| Net increase from beneficial share transactions | 817,493 | 7,034,216 | ||||||
| Net increase in net assets | 2,266,060 | 9,233,907 | ||||||
| NET ASSETS: | ||||||||
| Beginning of year | 29,406,908 | 20,173,001 | ||||||
| End of year(a) | $ | 31,672,968 | $ | 29,406,908 | ||||
| (a) | For the prior year ended September 30, 2017, Total Distributions consisted of Net Investment Income $206,855, and Net Realized Gains $47,636 and Net Assets included accumulated net investment income of $306,977 |
| See Notes to Financial Statements. |
| 42 | www.clarkstonfunds.com |
| Clarkston Select Fund | Statements of Changes in Net Assets |
| For the Year Ended September 30, 2018 | For the Period Ended September 30, 2017(a) | |||||||
| OPERATIONS: | ||||||||
| Net investment income | $ | 277,874 | $ | 115,546 | ||||
| Net realized gain on investments | 298,485 | 24,677 | ||||||
| Net change in unrealized appreciation on investments | 236,480 | 405,613 | ||||||
| Net increase in net assets resulting from operations | 812,839 | 545,836 | ||||||
| DISTRIBUTIONS TO SHAREHOLDERS(b) | ||||||||
| Institutional Class | (311,567 | ) | (122,180 | ) | ||||
| Total distributions | (311,567 | ) | (122,180 | ) | ||||
| BENEFICIAL SHARE TRANSACTIONS (Note 5): | ||||||||
| Institutional Class | ||||||||
| Shares sold | 4,687,258 | 12,545,640 | ||||||
| Dividends reinvested | 311,566 | 122,057 | ||||||
| Shares redeemed | (3,383,951 | ) | (1,306,143 | ) | ||||
| Net increase from beneficial share transactions | 1,614,873 | 11,361,554 | ||||||
| Net increase in net assets | 2,116,145 | 11,785,210 | ||||||
| NET ASSETS: | ||||||||
| Beginning of year | 11,785,210 | – | ||||||
| End of year(b) | $ | 13,901,355 | $ | 11,785,210 | ||||
| (a) | Commenced operations on February 1, 2017. |
| (b) | For the prior year ended September 30, 2017, Total Distributions consisted of Net Investment Income $122,180, and Net Realized Gains $0 and Net Assets included accumulated net investment income of $8,019 |
| See Notes to Financial Statements. |
| Annual Report | September 30, 2018 | 43 |
| Clarkston Founders Fund | Statements of Changes in Net Assets |
| For the Year Ended September 30, 2018 | For the Period Ended September 30, 2017(a) | |||||||
| OPERATIONS: | ||||||||
| Net investment income | $ | 179,693 | $ | 39,562 | ||||
| Net realized gain/(loss) on investments | 477,317 | (38,987 | ) | |||||
| Net change in unrealized appreciation on investments | 1,228,620 | 1,227,510 | ||||||
| Net increase in net assets resulting from operations | 1,885,630 | 1,228,085 | ||||||
| DISTRIBUTIONS TO SHAREHOLDERS | ||||||||
| Institutional Class | (111,451 | ) | – | |||||
| Total distributions | (111,451 | ) | – | |||||
| BENEFICIAL SHARE TRANSACTIONS (Note 5): | ||||||||
| Institutional Class | ||||||||
| Shares sold | 11,412,364 | 24,019,280 | ||||||
| Dividends reinvested | 111,451 | – | ||||||
| Shares redeemed | (3,244,063 | ) | (1,100,716 | ) | ||||
| Net increase from beneficial share transactions | 8,279,752 | 22,918,564 | ||||||
| Net increase in net assets | 10,053,931 | 24,146,649 | ||||||
| NET ASSETS: | ||||||||
| Beginning of year | 24,146,649 | – | ||||||
| End of year | $ | 34,200,580 | $ | 24,146,649 | ||||
| (a) | Commenced operations on February 1, 2017. |
| See Notes to Financial Statements. |
| 44 | www.clarkstonfunds.com |
| Clarkston Partners Fund — Founders Class | Financial Highlights |
| For a Share Outstanding Throughout the Periods Presented |
| For the Year Ended September 30, 2018 | For the Year Ended September 30, 2017 | For the Year Ended September 30, 2016 | For the Period Ended September 30, 2015(a) | |||||||||||||
| NET ASSET VALUE, BEGINNING OF PERIOD | $ | 12.39 | $ | 11.11 | $ | 9.70 | $ | 10.00 | ||||||||
| INCOME/(LOSS) FROM OPERATIONS: | ||||||||||||||||
| Net investment income(b) | 0.08 | 0.05 | 0.06 | 0.00 | (c) | |||||||||||
| Net realized and unrealized gain/(loss) on investments | 0.99 | 1.37 | 1.37 | (0.30 | ) | |||||||||||
| Total from investment operations | 1.07 | 1.42 | 1.43 | (0.30 | ) | |||||||||||
| LESS DISTRIBUTIONS: | ||||||||||||||||
| From net investment income | (0.04 | ) | (0.06 | ) | (0.02 | ) | – | |||||||||
| From net realized gains on investments | (0.13 | ) | (0.08 | ) | – | – | ||||||||||
| Total Distributions | (0.17 | ) | (0.14 | ) | (0.02 | ) | – | |||||||||
| NET INCREASE/(DECREASE) IN NET | ||||||||||||||||
| ASSET VALUE | 0.90 | 1.28 | 1.41 | (0.30 | ) | |||||||||||
| NET ASSET VALUE, END OF PERIOD | $ | 13.29 | $ | 12.39 | $ | 11.11 | $ | 9.70 | ||||||||
| TOTAL RETURN(d) | 8.70 | % | 12.86 | % | 14.73 | %(e) | (3.00 | %) | ||||||||
| SUPPLEMENTAL DATA: | ||||||||||||||||
| Net assets, end of period (in 000s) | $ | 445,516 | $ | 397,474 | $ | 308,607 | $ | 126,281 | ||||||||
| RATIOS TO AVERAGE NET ASSETS | ||||||||||||||||
| Operating expenses excluding reimbursement/waiver | 0.94 | % | 0.96 | % | 1.02 | % | 1.81 | %(f) | ||||||||
| Operating expenses including reimbursement/waiver | 0.85 | % | 0.85 | % | 0.85 | % | 0.85 | %(f) | ||||||||
| Net investment income including reimbursement/waiver | 0.60 | % | 0.40 | % | 0.62 | % | 0.05 | %(f) | ||||||||
| PORTFOLIO TURNOVER RATE(g) | 23 | % | 13 | % | 16 | % | 0 | % | ||||||||
| (a) | Commenced operations on September 16, 2015. |
| (b) | Per share amounts are based upon average shares outstanding. |
| (c) | Less than $0.005 per share. |
| (d) | Assumes an initial investment on the business day before the first day of the fiscal period, with all dividends and distributions reinvested in additional shares on the reinvestment date, and redemption at the net asset value calculated on the last business day of the fiscal period. Total returns are for the period indicated and have not been annualized. Total returns would have been lower had certain expenses not been waived during the period. Returns shown do not reflect the deduction of taxes that a shareholder would pay on Fund distributions or the redemption of Fund shares. |
| See Notes to Financial Statements. |
| Annual Report | September 30, 2018 | 45 |
| Clarkston Partners Fund — Founders Class | Financial Highlights |
| For a Share Outstanding Throughout the Periods Presented |
| (e) | In 2016, the Fund's total return consists of a voluntary/unvoluntary reimbursement by the adviser for a realized investment loss. Excluding this item, total return would not change as the impact is less than 0.005%. |
| (f) | Annualized. |
| (g) | Portfolio turnover rate for periods less than one full year have not been annualized. |
| See Notes to Financial Statements. |
| 46 | www.clarkstonfunds.com |
| Clarkston Partners Fund — Institutional Class | Financial Highlights |
| For a Share Outstanding Throughout the Periods Presented |
| For the Year Ended September 30, 2018 | For the Year Ended September 30, 2017 | For the Year Ended September 30, 2016 | For the Period Ended September 30, 2015(a) | |||||||||||||
| NET ASSET VALUE, BEGINNING OF PERIOD | $ | 12.36 | $ | 11.09 | $ | 9.70 | $ | 10.00 | ||||||||
| INCOME/(LOSS) FROM OPERATIONS: | ||||||||||||||||
| Net investment income/(loss)(b) | 0.06 | 0.03 | 0.05 | (0.00 | )(c) | |||||||||||
| Net realized and unrealized gain/(loss) on investments | 0.99 | 1.37 | 1.35 | (0.30 | ) | |||||||||||
| Total from investment operations | 1.05 | 1.40 | 1.40 | (0.30 | ) | |||||||||||
| LESS DISTRIBUTIONS: | ||||||||||||||||
| From net investment income | (0.04 | ) | (0.05 | ) | (0.01 | ) | – | |||||||||
| From net realized gains on investments | (0.13 | ) | (0.08 | ) | – | – | ||||||||||
| Total Distributions | (0.17 | ) | (0.13 | ) | (0.01 | ) | – | |||||||||
| NET INCREASE/(DECREASE) IN NET | ||||||||||||||||
| ASSET VALUE | 0.88 | 1.27 | 1.39 | (0.30 | ) | |||||||||||
| NET ASSET VALUE, END OF PERIOD | $ | 13.24 | $ | 12.36 | $ | 11.09 | $ | 9.70 | ||||||||
| TOTAL RETURN(d) | 8.52 | % | 12.75 | % | 14.47 | %(e) | (3.00 | %) | ||||||||
| SUPPLEMENTAL DATA: | ||||||||||||||||
| Net assets, end of period (in 000s) | $ | 429,622 | $ | 367,393 | $ | 242,295 | $ | 24 | ||||||||
| RATIOS TO AVERAGE NET ASSETS | ||||||||||||||||
| Operating expenses excluding reimbursement/waiver | 1.08 | % | 1.09 | % | 1.16 | % | 1.96 | %(f) | ||||||||
| Operating expenses including reimbursement/waiver | 0.98 | %(g) | 0.98 | %(g) | 1.00 | % | 1.00 | %(f) | ||||||||
| Net investment income including reimbursement/waiver | 0.47 | % | 0.27 | % | 0.46 | % | (0.10 | %)(f) | ||||||||
| PORTFOLIO TURNOVER RATE(h) | 23 | % | 13 | % | 16 | % | 0 | % | ||||||||
| (a) | Commenced operations on September 16, 2015. |
| (b) | Per share amounts are based upon average shares outstanding. |
| (c) | Less than ($0.005) per share. |
| (d) | Assumes an initial investment on the business day before the first day of the fiscal period, with all dividends and distributions reinvested in additional shares on the reinvestment date, and redemption at the net asset value calculated on the last business day of the fiscal period. Total returns are for the period indicated and have not been annualized. Total returns would have been lower had certain expenses not been waived during the period. Returns shown do not reflect the deduction of taxes that a shareholder would pay on Fund distributions or the redemption of Fund shares. |
| See Notes to Financial Statements. |
| Annual Report | September 30, 2018 | 47 |
| Clarkston Partners Fund — Institutional Class | Financial Highlights |
| For a Share Outstanding Throughout the Periods Presented |
| (e) | In 2016, the Fund's total return consists of a voluntary/unvoluntary reimbursement by the adviser for a realized investment loss. Excluding this item, total return would not change as the impact is less than 0.005%. |
| (f) | Annualized. |
| (g) | According to the Fund's shareholder services plan with respect to the Fund's Institutional shares, any amount of fees accrued according to the plan but not paid during the Fund's fiscal year for such service activities shall be reimbursed to the Fund as soon as practical. Fees were reimbursed to the Fund during the year ended September 30, 2017 and the year ended September 30, 2018, respectively, in the amount of 0.02% (annualized) and 0.02% of average net assets of Institutional shares. |
| (h) | Portfolio turnover rate for periods less than one full year have not been annualized. |
| See Notes to Financial Statements. |
| 48 | www.clarkstonfunds.com |
| Clarkston Fund — Institutional Class | Financial Highlights |
| For a Share Outstanding Throughout the Periods Presented |
| For the Year Ended September 30, 2018 | For the Year Ended September 30, 2017 | For the Period Ended September 30, 2016(a) | ||||||||||
| NET ASSET VALUE, BEGINNING OF PERIOD | $ | 11.46 | $ | 10.52 | $ | 10.00 | ||||||
| INCOME/(LOSS) FROM OPERATIONS: | ||||||||||||
| Net investment income(b) | 0.19 | 0.16 | 0.08 | |||||||||
| Net realized and unrealized gain on investments | 0.49 | 0.90 | 0.44 | |||||||||
| Total from investment operations | 0.68 | 1.06 | 0.52 | |||||||||
| LESS DISTRIBUTIONS: | ||||||||||||
| From net investment income | (0.15 | ) | (0.10 | ) | – | |||||||
| From net realized gains on investments | (0.00 | )(c) | (0.02 | ) | – | |||||||
| Total Distributions | (0.15 | ) | (0.12 | ) | – | |||||||
| NET INCREASE IN NET ASSET VALUE | 0.53 | 0.94 | 0.52 | |||||||||
| NET ASSET VALUE, END OF PERIOD | $ | 11.99 | $ | 11.46 | $ | 10.52 | ||||||
| TOTAL RETURN(d) | 5.99 | % | 10.13 | % | 5.20 | % | ||||||
| SUPPLEMENTAL DATA: | ||||||||||||
| Net assets, end of period (in 000s) | $ | 31,673 | $ | 29,407 | $ | 20,173 | ||||||
| RATIOS TO AVERAGE NET ASSETS | ||||||||||||
| Operating expenses excluding reimbursement/waiver | 0.93 | % | 1.04 | % | 1.48 | %(e) | ||||||
| Operating expenses including reimbursement/waiver | 0.65 | %(f) | 0.65 | %(f) | 0.70 | %(e) | ||||||
| Net investment income including reimbursement/waiver | 1.60 | % | 1.41 | % | 1.36 | %(e) | ||||||
| PORTFOLIO TURNOVER RATE(g) | 11 | % | 5 | % | 0 | % | ||||||
| (a) | Commenced operations on April 4, 2016. |
| (b) | Per share amounts are based upon average shares outstanding. |
| (c) | Less than ($0.005) per share. |
| (d) | Assumes an initial investment on the business day before the first day of the fiscal period, with all dividends and distributions reinvested in additional shares on the reinvestment date, and redemption at the net asset value calculated on the last business day of the fiscal period. Total returns are for the period indicated and have not been annualized. Total returns would have been lower had certain expenses not been waived during the period. Returns shown do not reflect the deduction of taxes that a shareholder would pay on Fund distributions or the redemption of Fund shares. |
| (e) | Annualized. |
| See Notes to Financial Statements. |
| Annual Report | September 30, 2018 | 49 |
| Clarkston Fund — Institutional Class | Financial Highlights |
| For a Share Outstanding Throughout the Periods Presented |
| (f) | According to the Fund's shareholder services plan with respect to the Fund's Institutional shares, any amount of fees accrued according to the plan but not paid during the Fund's fiscal year for such service activities shall be reimbursed to the Fund as soon as practical. Fees were reimbursed to the Fund during the year ended September 30, 2017 and the year ended September 30, 2018, respectively, in the amount of 0.05% (annualized) and 0.05% of average net assets of Institutional shares. |
| (g) | Portfolio turnover rate for periods less than one full year have not been annualized. |
| See Notes to Financial Statements. |
| 50 | www.clarkstonfunds.com |
| Clarkston Select Fund — Institutional Class | Financial Highlights |
| For a Share Outstanding Throughout the Periods Presented |
| For the Year Ended September 30, 2018 | For the Period Ended September 30, 2017(a) | |||||||
| NET ASSET VALUE, BEGINNING OF PERIOD | $ | 10.50 | $ | 10.00 | ||||
| INCOME/(LOSS) FROM OPERATIONS: | ||||||||
| Net investment income(b) | 0.21 | 0.12 | ||||||
| Net realized and unrealized gain on investments | 0.42 | 0.50 | ||||||
| Total from investment operations | 0.63 | 0.62 | ||||||
| LESS DISTRIBUTIONS: | ||||||||
| From net investment income | (0.22 | ) | (0.12 | ) | ||||
| From net realized gains on investments | (0.02 | ) | – | |||||
| Total Distributions | (0.24 | ) | (0.12 | ) | ||||
| NET INCREASE IN NET ASSET VALUE | 0.39 | 0.50 | ||||||
| NET ASSET VALUE, END OF PERIOD | $ | 10.89 | $ | 10.50 | ||||
| TOTAL RETURN(c) | 6.02 | % | 6.21 | % | ||||
| SUPPLEMENTAL DATA: | ||||||||
| Net assets, end of period (in 000s) | $ | 13,901 | $ | 11,785 | ||||
| RATIOS TO AVERAGE NET ASSETS | ||||||||
| Operating expenses excluding reimbursement/waiver | 1.27 | % | 1.72 | %(d) | ||||
| Operating expenses including reimbursement/waiver | 0.65 | %(e) | 0.67 | %(d)(e) | ||||
| Net investment income including reimbursement/waiver | 1.94 | % | 1.76 | %(d) | ||||
| PORTFOLIO TURNOVER RATE(f) | 11 | % | 3 | % | ||||
| (a) | Commenced operations on February 1, 2017. |
| (b) | Per share amounts are based upon average shares outstanding. |
| (c) | Assumes an initial investment on the business day before the first day of the fiscal period, with all dividends and distributions reinvested in additional shares on the reinvestment date, and redemption at the net asset value calculated on the last business day of the fiscal period. Total returns are for the period indicated and have not been annualized. Total returns would have been lower had certain expenses not been waived during the period. Returns shown do not reflect the deduction of taxes that a shareholder would pay on Fund distributions or the redemption of Fund shares. |
| (d) | Annualized. |
| (e) | According to the Fund's shareholder services plan with respect to the Fund's Institutional shares, any amount of fees accrued according to the plan but not paid during the Fund's fiscal year for such service activities shall be reimbursed to the Fund as soon as practical. Fees were reimbursed to the Fund during the year ended September 30, 2017 and the year ended September 30, 2018, respectively, in the amount of 0.03% (annualized) and 0.04% of average net assets of Institutional shares. |
| (f) | Portfolio turnover rate for periods less than one full year have not been annualized. |
| See Notes to Financial Statements. |
| Annual Report | September 30, 2018 | 51 |
| Clarkston Founders Fund — Institutional Class | Financial Highlights |
| For a Share Outstanding Throughout the Periods Presented |
| For the Year Ended September 30, 2018 | For the Period Ended September 30, 2017(a) | |||||||
| NET ASSET VALUE, BEGINNING OF PERIOD | $ | 10.64 | $ | 10.00 | ||||
| INCOME/(LOSS) FROM OPERATIONS: | ||||||||
| Net investment income(b) | 0.07 | 0.02 | ||||||
| Net realized and unrealized gain on investments | 0.67 | 0.62 | ||||||
| Total from investment operations | 0.74 | 0.64 | ||||||
| LESS DISTRIBUTIONS: | ||||||||
| From net investment income | (0.04 | ) | – | |||||
| Total Distributions | (0.04 | ) | – | |||||
| NET INCREASE IN NET ASSET VALUE | 0.70 | 0.64 | ||||||
| NET ASSET VALUE, END OF PERIOD | $ | 11.34 | $ | 10.64 | ||||
| TOTAL RETURN(c) | 7.01 | % | 6.40 | % | ||||
| SUPPLEMENTAL DATA: | ||||||||
| Net assets, end of period (in 000s) | $ | 34,201 | $ | 24,147 | ||||
| RATIOS TO AVERAGE NET ASSETS | ||||||||
| Operating expenses excluding reimbursement/waiver | 1.22 | % | 1.46 | %(d) | ||||
| Operating expenses including reimbursement/waiver | 0.91 | %(e) | 0.92 | %(d)(e) | ||||
| Net investment income including reimbursement/waiver | 0.59 | % | 0.29 | %(d) | ||||
| PORTFOLIO TURNOVER RATE(f) | 9 | % | 4 | % | ||||
| (a) | Commenced operations on February 1, 2017. |
| (b) | Per share amounts are based upon average shares outstanding. |
| (c) | Assumes an initial investment on the business day before the first day of the fiscal period, with all dividends and distributions reinvested in additional shares on the reinvestment date, and redemption at the net asset value calculated on the last business day of the fiscal period. Total returns are for the period indicated and have not been annualized. Total returns would have been lower had certain expenses not been waived during the period. Returns shown do not reflect the deduction of taxes that a shareholder would pay on Fund distributions or the redemption of Fund shares. |
| (d) | Annualized. |
| (e) | According to the Fund's shareholder services plan with respect to the Fund's Institutional shares, any amount of fees accrued according to the plan but not paid during the Fund's fiscal year for such service activities shall be reimbursed to the Fund as soon as practical. Fees were reimbursed to the Fund during the year ended September 30, 2017 and the year ended September 30, 2018, respectively, in the amount of 0.03% (annualized) and 0.04% of average net assets of Institutional shares. |
| (f) | Portfolio turnover rate for periods less than one full year have not been annualized. |
| See Notes to Financial Statements. |
| 52 | www.clarkstonfunds.com |
| Clarkston Funds | Notes to Financial Statements |
| September 30, 2018 |
1. ORGANIZATION
ALPS Series Trust (the “Trust”), a Delaware statutory trust, is an open-end management investment company registered under the Investment Company Act of 1940, as amended (the “1940 Act”). The Trust consists of multiple separate portfolios or series. This Annual Report describes the Clarkston Partners Fund, the Clarkston Fund, the Clarkston Select Fund and the Clarkston Founders Fund (each, a “Fund” and collectively, the “Funds”). The Funds are non-diversified and the primary investment objectives are to achieve long-term capital appreciation, as well as current income for the Clarkston Select Fund. The Clarkston Partners Fund currently offers Founders Class shares and Institutional Class shares, and the Clarkston Fund, the Clarkston Select Fund and the Clarkston Founders Fund currently offer Institutional Class shares. Each share class of the Clarkston Partners Fund has identical rights to earnings, assets and voting privileges, except for class-specific expenses and exclusive rights to vote on matters affecting only individual classes. The Board of Trustees (the “Board”) may establish additional funds and classes of shares at any time in the future without shareholder approval.
2. SIGNIFICANT ACCOUNTING POLICIES
The accompanying financial statements were prepared in accordance with accounting principles generally accepted in the United States of America for investment companies (“U.S. GAAP”). The Funds are considered investment companies under U.S. GAAP and follow the accounting and reporting guidance applicable to investment companies in the Financial Accounting Standards Board Accounting Standards Codification Topic 946. The preparation of financial statements in conformity with U.S. GAAP requires management to make certain estimates and assumptions that affect the reported amounts of assets and liabilities and disclosures of contingent assets and liabilities at the date of the financial statements and the reported amounts of revenue and expenses during the period. Actual results could differ from those estimates. The following is a summary of significant accounting policies consistently followed by the Funds in preparation of their financial statements.
Investment Valuation: The Funds generally value their securities based on market prices determined at the close of regular trading on the New York Stock Exchange (“NYSE”), normally 4:00 p.m. Eastern Time, on each day the NYSE is open for trading.
Securities traded on a registered U.S. securities exchange (including exchange-traded derivatives other than futures and futures options) are valued based on the last sale price of the security reported on the principal exchange on which it is traded, prior to the time when the Funds’ assets are valued. In the case of equity securities not traded on an exchange, or if such closing prices are not otherwise available, the securities are valued at the mean of the most recent bid and ask prices on such day.
Redeemable securities issued by open-end registered investment companies are valued at the investment company’s applicable net asset value (“NAV”), with the exception of exchange-traded open-end investment companies, which are priced as equity securities.
When such prices or quotations are not available, or when the Fair Value Committee appointed by the Board believes that they are unreliable, securities may be priced using fair value procedures approved by the Board.
| Annual Report | September 30, 2018 | 53 |
| Clarkston Funds | Notes to Financial Statements |
| September 30, 2018 |
Fair Value Measurements: The Funds disclose the classification of their fair value measurements following a three-tier hierarchy based on the inputs used to measure fair value. Inputs refer broadly to the assumptions that market participants would use in pricing the asset or liability, including assumptions about risk. Inputs may be observable or unobservable. Observable inputs reflect the assumptions market participants would use in pricing the asset or liability that are developed based on market data obtained from sources independent of the reporting entity. Unobservable inputs reflect the reporting entity’s own assumptions about the assumptions market participants would use in pricing the asset or liability that are developed based on the best information available.
Various inputs are used in determining the value of the Funds’ investments as of the end of the reporting period. When inputs used fall into different levels of the fair value hierarchy, the level in the hierarchy within which the fair value measurement falls is determined based on the lowest level input that is significant to the fair value measurement in its entirety. The designated input levels are not necessarily an indication of the risk or liquidity associated with these investments. These inputs are categorized in the following hierarchy under applicable financial accounting standards:
| Level 1 – | Unadjusted quoted prices in active markets for identical investments, unrestricted assets or liabilities that the Fund has the ability to access at the measurement date; |
| Level 2 – | Quoted prices which are not active, quoted prices for similar assets or liabilities in active markets or inputs other than quoted prices that are observable (either directly or indirectly); and |
| Level 3 – | Significant unobservable prices or inputs (including the Fund’s own assumptions in determining the fair value of investments) where there is little or no market activity for the asset or liability at the measurement date. |
The following is a summary of the inputs used to value the Funds’ investments as of September 30, 2018:
Clarkston Partners Fund
| Investments in Securities at Value | Level 1 - Unadjusted Quoted Prices | Level 2 - Other Significant Observable Inputs | Level 3 - Significant Unobservable Inputs | Total | |||||||||
| Common Stocks | |||||||||||||
| Consumer Discretionary | $ | 94,335,654 | $ | – | $ | – | $ | 94,335,654 | |||||
| Consumer Staples | 35,755,100 | – | – | 35,755,100 | |||||||||
| Financial Services | 266,320,662 | – | – | 266,320,662 | |||||||||
| Materials & Processing | 15,085,200 | – | – | 15,085,200 | |||||||||
| Producer Durables | 162,410,479 | – | – | 162,410,479 | |||||||||
| Technology | 33,159,340 | – | – | 33,159,340 | |||||||||
| Total | $ | 607,066,435 | $ | – | $ | – | $ | 607,066,435 | |||||
| 54 | www.clarkstonfunds.com |
| Clarkston Funds | Notes to Financial Statements |
| September 30, 2018 |
Clarkston Fund
| Investments in Securities at Value | Level 1 - Unadjusted Quoted Prices | Level 2 - Other Significant Observable Inputs | Level 3 - Significant Unobservable Inputs | Total | |||||||||
| Common Stocks | |||||||||||||
| Consumer Discretionary | $ | 1,207,525 | $ | – | $ | – | $ | 1,207,525 | |||||
| Consumer Staples | 8,789,724 | – | – | 8,789,724 | |||||||||
| Financial Services | 7,879,515 | – | – | 7,879,515 | |||||||||
| Health Care | 3,134,129 | – | – | 3,134,129 | |||||||||
| Producer Durables | 3,568,810 | – | – | 3,568,810 | |||||||||
| Technology | 3,928,530 | – | – | 3,928,530 | |||||||||
| Total | $ | 28,508,233 | $ | – | $ | – | $ | 28,508,233 | |||||
Clarkston Select Fund
| Investments in Securities at Value | Level 1 - Unadjusted Quoted Prices | Level 2 - Other Significant Observable Inputs | Level 3 - Significant Unobservable Inputs | Total | |||||||||
| Common Stocks | |||||||||||||
| Consumer Discretionary | $ | 987,060 | $ | – | $ | – | $ | 987,060 | |||||
| Consumer Staples | 3,700,681 | – | – | 3,700,681 | |||||||||
| Financial Services | 2,131,944 | – | – | 2,131,944 | |||||||||
| Health Care | 1,012,435 | – | – | 1,012,435 | |||||||||
| Materials & Processing | 429,348 | – | – | 429,348 | |||||||||
| Producer Durables | 2,361,470 | – | – | 2,361,470 | |||||||||
| Technology | 1,941,930 | – | – | 1,941,930 | |||||||||
| Total | $ | 12,564,868 | $ | – | $ | – | $ | 12,564,868 | |||||
| Annual Report | September 30, 2018 | 55 |
| Clarkston Funds | Notes to Financial Statements |
| September 30, 2018 |
Clarkston Founders Fund
| Investments in Securities at Value | Level 1 - Unadjusted Quoted Prices | Level 2 - Other Significant Observable Inputs | Level 3 - Significant Unobservable Inputs | Total | |||||||||
| Common Stocks | |||||||||||||
| Consumer Discretionary | $ | 2,435,310 | $ | – | $ | – | $ | 2,435,310 | |||||
| Consumer Staples | 2,090,025 | – | – | 2,090,025 | |||||||||
| Financial Services | 9,643,720 | – | – | 9,643,720 | |||||||||
| Health Care | 1,807,480 | – | – | 1,807,480 | |||||||||
| Materials & Processing | 696,240 | – | – | 696,240 | |||||||||
| Producer Durables | 5,229,653 | – | – | 5,229,653 | |||||||||
| Technology | 1,255,682 | – | – | 1,255,682 | |||||||||
| Total | $ | 23,158,110 | $ | – | $ | – | $ | 23,158,110 | |||||
The Funds recognize transfers between levels as of the end of the period. For the fiscal year ended September 30, 2018, the Funds did not have any transfers between Level 1 and Level 2 securities. There were no Level 3 securities held during the year.
Offering Costs: The Clarkston Select Fund and the Clarkston Founders Fund incurred offering costs during the fiscal year ended September 30, 2018. These offering costs, including fees for printing initial prospectuses, legal and registration fees, were amortized over the first twelve months from the inception date of each Fund. Amounts amortized through September 30, 2018 are expensed in the Funds’ Statements of Operations.
Cash & Cash Equivalents: The Funds consider their investment in a Federal Deposit Insurance Corporation (FDIC) insured interest bearing account to be cash and cash equivalents. Cash and cash equivalents are valued at cost plus any accrued interest. The Funds maintain cash balances, which, at times may exceed federally insured limits. The Funds maintain these balances with a high quality financial institution.
Concentration of Credit Risk: Each Fund places its cash with a banking institution, which is insured by Federal Deposit Insurance Corporation (FDIC). The FDIC limit is $250,000. At various times throughout the period, the amount on deposit may exceed the FDIC limit and subject the Fund to a credit risk. The Funds do not believe that such deposits are subject to any unusual risk associated with investment activities.
Trust Expenses: Some expenses of the Trust can be directly attributed to a Fund. Expenses that cannot be directly attributed to a Fund are apportioned among all funds in the Trust based on average net assets of each fund.
Fund Expenses: Some expenses can be directly attributed to a Fund and are apportioned among the classes based on average net assets of each class.
| 56 | www.clarkstonfunds.com |
| Clarkston Funds | Notes to Financial Statements |
| September 30, 2018 |
Class Expenses: Expenses that are specific to a class of shares are charged directly to that share class. Fees provided under the shareholder service plan for a particular class of a Fund are charged to the operations of such class.
Federal Income Taxes: The Funds comply with the requirements under Subchapter M of the Internal Revenue Code of 1986, as amended, applicable to regulated investment companies and intend to distribute substantially all of their net taxable income and net capital gains, if any, each year so that they will not be subject to excise tax on undistributed income and gains. The Funds are not subject to income taxes to the extent such distributions are made.
As of and during the fiscal year ended September 30, 2018, the Funds did not have a liability for any unrecognized tax benefits in the accompanying financial statements. The Funds recognize interest and penalties, if any, related to tax liabilities as income tax expense in the Statements of Operations. The Funds file U.S. federal, state and local income tax returns as required. The Funds’ tax returns are subject to examination by the relevant tax authorities until expiration of the applicable statute of limitations, which is generally three years after the filing of the tax return for federal purposes and four years for most state returns. The Funds’ administrator has analyzed the Funds’ tax positions taken on federal and state income tax returns for all open tax years and has concluded that as of September 30, 2018, no provision for income tax is required in the Funds’ financial statements related to these tax positions.
Investment Transactions and Investment Income: Investment transactions are accounted for on the date the investments are purchased or sold (trade date basis) for financial reporting purposes. Realized gains and losses from investment transactions are reported on an identified cost basis. Interest income, which includes accretion of discounts and amortization of premiums, is accrued and recorded as earned. Dividend income is recognized on the ex-dividend date, or for certain foreign securities, as soon as information is available to a Fund. Withholding taxes on foreign dividends are paid (a portion of which may be reclaimable) or provided for in accordance with the applicable country’s tax rules and rates and are disclosed in the Statements of Operations. All of the realized and unrealized gains and losses and net investment income are allocated daily to each class in proportion to its average daily net assets.
Distributions to Shareholders: The Clarkston Partners Fund, Clarkston Fund and Clarkston Founders Fund normally pay dividends, if any, and distribute capital gains, if any, on an annual basis. The Clarkston Select Fund normally pays dividends, if any, on a quarterly basis and distributes capital gains, if any, on an annual basis. Income dividend distributions are derived from interest, dividends and other income the Funds receive from their investments, including short-term capital gains. Long-term capital gain distributions are derived from gains realized when a Fund sells a security it has owned for more than one year. A Fund may make additional distributions and dividends at other times if its portfolio manager or managers believe doing so may be necessary for the Fund to avoid or reduce taxes. Net investment income/(loss) and net realized gain/(loss) may differ for financial statement and tax purposes.
3. TAX BASIS INFORMATION
Tax Basis of Distributions to Shareholders: The character of distributions made during the period from net investment income or net realized gains may differ from its ultimate characterization for Federal income tax purposes. Also, due to the timing of dividend distributions, the fiscal year in which amounts are distributed may differ from the fiscal year in which the income or realized gain were recorded by the Funds. The amounts and characteristics of tax basis distributions and composition of distributable earnings/(accumulated losses) are finalized at fiscal year-end.
| Annual Report | September 30, 2018 | 57 |
| Clarkston Funds | Notes to Financial Statements |
| September 30, 2018 |
The tax character of distributions paid during the fiscal year ended September 30, 2018, were as follows:
| Ordinary Income | Long-Term Capital Gains | |||||||
| Clarkston Partners Fund | $ | 2,206,133 | $ | 7,497,135 | ||||
| Clarkston Fund | 400,570 | – | ||||||
| Clarkston Select Fund | 311,567 | – | ||||||
| Clarkston Founders Fund | 111,451 | – | ||||||
The tax character of distributions paid during the fiscal year or period ended September 30, 2017 were as follows:
| Ordinary Income | Long-Term Capital Gains | |||||||
| Clarkston Partners Fund | $ | 7,091,111 | $ | 92,112 | ||||
| Clarkston Fund | 254,491 | – | ||||||
| Clarkston Select Fund | 122,180 | – | ||||||
There were no distributions paid by the Clarkston Founders Fund during the fiscal period ended September 30, 2017.
Reclassifications: As of September 30, 2018, permanent differences in book and tax accounting were reclassified. The following reclassifications, which had no impact on results of operations or net assets, were recorded to reflect tax character:
| Paid-in Capital | Total Distributable Earnings | |||||||
| Clarkston Select Fund | $ | (10,135 | ) | $ | 10,135 | |||
| Clarkston Founders Fund | (13,362 | ) | 13,362 | |||||
These differences are primarily attributable to offering expenses that are non-deductible for tax.
| 58 | www.clarkstonfunds.com |
| Clarkston Funds | Notes to Financial Statements |
| September 30, 2018 |
Unrealized Appreciation and Depreciation on Investments: As of September 30, 2018, the aggregate costs of investments, gross unrealized appreciation/(depreciation) and net unrealized appreciation for Federal tax purposes were as follows:
| Clarkston Partners Fund | Clarkston Fund | Clarkston Select Fund | Clarkston Founders Fund | |||||||||||||
| Gross unrealized appreciation (excess of value over tax cost) | $ | 145,583,800 | $ | 5,413,201 | $ | 1,793,830 | $ | 3,498,786 | ||||||||
| Gross unrealized depreciation (excess of tax cost over value) | (17,594,025 | ) | (2,062,026 | ) | (1,151,737 | ) | (1,042,656 | ) | ||||||||
| Net unrealized appreciation | $ | 127,989,775 | $ | 3,351,175 | $ | 642,093 | $ | 2,456,130 | ||||||||
| Cost of investments for income tax purposes | $ | 479,076,660 | $ | 25,157,058 | $ | 11,922,775 | $ | 20,701,980 | ||||||||
This temporary differences are primarily attributed to wash sales.
Components of Distributable Earnings: As of September 30, 2018, components of distributable earnings were as follows:
| Clarkston Partners Fund | Clarkston Fund | Clarkston Select Fund | Clarkston Founders Fund | |||||||||||||
| Undistributed ordinary income | $ | 3,375,166 | $ | 433,495 | $ | 23,041 | $ | 148,623 | ||||||||
| Accumulated capital gains | 44,760,311 | 780,339 | 284,582 | 438,330 | ||||||||||||
| Net unrealized appreciation | 127,989,775 | 3,351,175 | 642,093 | 2,456,130 | ||||||||||||
| Total | $ | 176,125,252 | $ | 4,565,009 | $ | 949,716 | $ | 3,043,083 | ||||||||
Capital Losses: Capital loss carryovers used during the period ended September 30, 2018 were:
| Fund | ||||
| Clarkston Founders Fund | $ | (38,987 | ) | |
Under the Regulated Investment Company Modernization Act of 2010, a Fund will be permitted to carry forward capital losses incurred in taxable years beginning after December 22, 2010 for an unlimited period. Post-enactment losses that are carried forward will retain their character as either short-term or long-term capital losses rather than being considered all short-term as under previous law.
| Annual Report | September 30, 2018 | 59 |
| Clarkston Funds | Notes to Financial Statements |
| September 30, 2018 |
4. SECURITIES TRANSACTIONS
Purchases and sales of securities, excluding short-term securities, during the fiscal year ended September 30, 2018 were as follows:
| Purchases of Securities | Proceeds from Sales of Securities | |||||||
| Clarkston Partners Fund | $ | 141,784,420 | $ | 129,994,266 | ||||
| Clarkston Fund | 5,442,144 | 2,952,542 | ||||||
| Clarkston Select Fund | 3,630,632 | 1,336,776 | ||||||
| Clarkston Founders Fund | 6,946,824 | 1,776,604 | ||||||
5. BENEFICIAL SHARE TRANSACTIONS
The capitalization of the Trust consists of an unlimited number of shares of beneficial interest with no par value per share. Holders of the shares of the Funds have one vote for each share held and a proportionate fraction of a vote for each fractional share. All shares issued and outstanding are fully paid and are transferable and redeemable at the option of the shareholder. Shares have no pre-emptive rights. Neither the Funds nor any of their creditors have the right to require shareholders to pay any additional amounts solely because the shareholder owns the shares.
| 60 | www.clarkstonfunds.com |
| Clarkston Funds | Notes to Financial Statements |
September 30, 2018
Transactions in common shares were as follows:
| For the Year Ended September 30, 2018 | For the Year or Period Ended September 30, 2017 | |||||||
| Clarkston Partners Fund | ||||||||
| Founders Class | ||||||||
| Shares sold | 3,460,916 | 6,286,064 | ||||||
| Shares issued in reinvestment of distributions to shareholders | 14,712 | 10,663 | ||||||
| Shares redeemed | (2,019,083 | ) | (1,999,988 | ) | ||||
| Net increase in shares outstanding | 1,456,545 | 4,296,739 | ||||||
| Institutional Class | ||||||||
| Shares sold | 13,016,378 | 13,053,266 | ||||||
| Shares issued in reinvestment of distributions to shareholders | 311,259 | 284,204 | ||||||
| Shares redeemed | (10,603,468 | ) | (5,461,351 | ) | ||||
| Net increase in shares outstanding | 2,724,169 | 7,876,119 | ||||||
| Clarkston Fund | ||||||||
| Institutional Class | ||||||||
| Shares sold | 754,271 | 904,686 | ||||||
| Shares issued in reinvestment of distributions to shareholders | 33,601 | 23,542 | ||||||
| Shares redeemed | (712,502 | ) | (279,399 | ) | ||||
| Net increase in shares outstanding | 75,370 | 648,829 | ||||||
| Clarkston Select Fund(a) | ||||||||
| Institutional Class | ||||||||
| Shares sold | 439,209 | 1,237,139 | ||||||
| Shares issued in reinvestment of distributions to shareholders | 29,310 | 11,806 | ||||||
| Shares redeemed | (314,905 | ) | (126,209 | ) | ||||
| Net increase in shares outstanding | 153,614 | 1,122,736 | ||||||
| Clarkston Founders Fund(a) | ||||||||
| Institutional Class | ||||||||
| Shares sold | 1,025,855 | 2,374,806 | ||||||
| Shares issued in reinvestment of distributions to shareholders | 10,050 | – | ||||||
| Shares redeemed | (288,005 | ) | (106,208 | ) | ||||
| Net increase in shares outstanding | 747,900 | 2,268,598 | ||||||
| (a) | Commenced operations on February 1, 2017. |
| Annual Report | September 30, 2018 | 61 |
| Clarkston Funds | Notes to Financial Statements |
September 30, 2018
Control is defined by the 1940 Act as the beneficial ownership, either directly or through one or more controlled companies, of more than 25% of the voting securities of a company. Approximately 49% of the outstanding shares of the Clarkston Partners Fund are held by one record shareholder that owns shares on behalf of its underlying beneficial owners. Approximately 78% of the outstanding shares of the Clarkston Fund are owned by one omnibus account. Approximately 85% of the outstanding shares of the Clarkston Select Fund are owned by one omnibus account. Approximately 96% of the outstanding shares of the Clarkston Founders Fund are owned by two omnibus accounts. Share transaction activities of these shareholders could have a material impact on the Funds.
6. MANAGEMENT AND RELATED PARTY TRANSACTIONS
Investment Advisory: Clarkston Capital Partners, LLC (“Clarkston” or the “Adviser”), subject to the authority of the Board, is responsible for the management of the Funds’ portfolios. The Adviser manages the investments of the Funds in accordance with the Funds’ investment objectives, policies and limitations and investment guidelines established jointly by the Adviser and the Board.
Pursuant to the Investment Advisory Agreement (the “Advisory Agreement”) with the Adviser, each Fund pays the Adviser an annual management fee that is based on each Fund’s average daily net assets. The management fee is paid on a monthly basis. The contractual management fee rates are 0.80%, 0.50%, 0.50% and 0.75% for the Clarkston Partners Fund, the Clarkston Fund, the Clarkston Select Fund and the Clarkston Founders Fund, respectively. The initial term of the Advisory Agreement is two years. The Board may extend the Advisory Agreement for additional one-year terms. The Board and shareholders of a Fund may terminate the Advisory Agreement upon 30 days’ written notice. The Adviser may terminate the Advisory Agreement upon 60 days’ notice.
Pursuant to a fee waiver letter agreement (the “Fee Waiver Agreement”), the Adviser has contractually agreed to limit the amount of each Fund’s Total Annual Fund Operating Expenses, exclusive of shareholder servicing fees, brokerage expenses, interest expenses, acquired fund fees and expenses and extraordinary expenses to an annual rate of 0.85% of the Clarkston Partners Fund’s average daily net assets for each of the Founders Class shares and the Institutional Class shares, 0.55% of the Clarkston Fund’s average daily net assets for the Institutional Class shares, 0.55% of the Clarkston Select Fund’s average daily net assets for the Institutional Class shares and 0.80% of the Clarkston Founders Fund’s average daily net assets for the Institutional Class shares. The Fee Waiver Agreement is in effect through January 31, 2019. The Adviser may not terminate the Fee Waiver Agreement without the approval of the Trust’s Board. The Adviser will be permitted to recover, on a class-by-class basis, expenses it has borne through the Fee Waiver Agreement only to the extent that the Fund’s expenses in later periods do not exceed the lesser of: (1) the contractual expense limit in effect at the time the Adviser waives or limits the expenses; or (2) the contractual expense limit in effect at the time the Adviser seeks to recover the expenses; provided, however, that the Funds will not be obligated to reimburse any such expenses borne by the Adviser more than three years after the date on which the fee or expense was waived or limited or assumed and paid by the Adviser, as calculated on a monthly basis.
| 62 | www.clarkstonfunds.com |
| Clarkston Funds | Notes to Financial Statements |
September 30, 2018
For the fiscal year ended September 30, 2018, the fee waivers and/or reimbursements were $399,992, $361,957, $84,677, $88,815, and $95,166 for the Clarkston Partners Fund Founders Class, Clarkston Partners Fund Institutional Class, Clarkston Fund Institutional Class, Clarkston Select Fund Institutional Class and Clarkston Founders Fund Institutional Class, respectively.
As of September 30, 2018, the balances of recoupable expenses for each Fund were as follows:
| Expiring in 2019 | Expiring in 2020 | Expiring in 2021 | |||||||||||
| Clarkston Partners Fund | |||||||||||||
| Founders | $ | 368,096 | $ | 389,579 | $ | 399,992 | |||||||
| Institutional | 301,646 | 349,038 | 361,957 | ||||||||||
| Clarkston Fund | |||||||||||||
| Institutional | 64,723 | 101,949 | 84,677 | ||||||||||
| Clarkston Select Fund | |||||||||||||
| Institutional | – | 68,518 | 88,815 | ||||||||||
| Clarkston Founders Fund | |||||||||||||
| Institutional | – | 73,077 | 95,166 | ||||||||||
Administrator: ALPS Fund Services, Inc. (ALPS) (an affiliate of ALPS Distributors, Inc.) serves as administrator to each Fund. The Funds have agreed to pay expenses incurred in connection with their administrative activities. Pursuant to the Administration, Bookkeeping and Pricing Services Agreement with the Trust, ALPS provides operational services to the Funds including, but not limited to, fund accounting and fund administration and generally assists in each Fund’s operations. Each Fund’s administration fee is accrued on a daily basis and paid monthly. The officers and an Interested Trustee of the Trust are employees of ALPS. Administration fees paid by the Funds for the fiscal year ended September 30, 2018 are disclosed in the Statements of Operations. ALPS is reimbursed by the Funds for certain out-of-pocket expenses.
Transfer Agent: ALPS serves as transfer agent for each Fund under a Transfer Agency and Services Agreement with the Trust. Under this agreement, ALPS is paid an annual fee for services performed on behalf of the Funds plus fees for open accounts and is reimbursed for certain out-of-pocket expenses.
Compliance Services: ALPS provides services as each Fund’s Chief Compliance Officer to monitor and test the policies and procedures of each Fund in conjunction with requirements under Rule 38a-1 of the 1940 Act pursuant to a Chief Compliance Officer Services Agreement with the Trust. Under this agreement, ALPS is paid an annual fee for services performed on behalf of the Funds and is reimbursed for certain out-of-pocket expenses.
Distribution: ALPS Distributors, Inc. (the “Distributor”) (an affiliate of ALPS) acts as the principal underwriter of each Fund’s shares pursuant to a Distribution Agreement with the Trust. Shares of each Fund are offered on a continuous basis through the Distributor, as agent of the Funds. The Distributor is not obligated to sell any particular amount of shares and is not entitled to any compensation for its services as the Funds’ principal underwriter pursuant to the Distribution Agreement.
Each Fund has adopted a shareholder services plan (“Shareholder Services Plan”) for its Institutional Class. Under the Shareholder Services Plan each Fund is authorized to pay banks and their affiliates and other institutions, including broker-dealers and Fund affiliates (“Participating Organizations”), an aggregate fee in an amount not to exceed on an annual basis 0.15% of the average daily net asset value of each Fund’s Institutional Class shares to Participating Organizations as compensation for providing shareholder service activities, which do not include distribution services, pursuant to an agreement with a Participating Organization.
| Annual Report | September 30, 2018 | 63 |
| Clarkston Funds | Notes to Financial Statements |
September 30, 2018
7. TRUSTEES
As of September 30, 2018, there were four Trustees, three of whom are not “interested persons” (as defined in the 1940 Act) of the Trust (the “Independent Trustees”). Effective November 16, 2017, the Independent Trustees of the Trust receive a quarterly retainer of $6,000, plus $4,000 for each regular Board or Committee meeting attended and $2,000 for each special telephonic or in-person Board or Committee meeting attended. Additionally, the Audit Committee Chair receives a quarterly retainer of $1,250 and the Independent Chair receives a quarterly retainer of $2,500. Prior to November 16, 2017, the Independent Trustees received a quarterly retainer of $5,000, plus $4,000 for each regular Board or Committee meeting attended, $2,000 for each special telephonic Board or Committee meeting attended and $2,000 for each special in-person Board meeting attended. The Independent Trustees are also reimbursed for all reasonable out-of-pocket expenses relating to attendance at meetings and for meeting-related expenses. Officers of the Trust and Trustees who are interested persons of the Trust receive no salary or fees from the Trust.
8. INDEMNIFICATIONS
Under the Trust’s organizational documents, its officers and Trustees are indemnified against certain liabilities arising out of the performance of their duties to the Trust. Additionally, in the normal course of business, the Trust enters into contracts with service providers that may contain general indemnification clauses which may permit indemnification to the extent permissible under applicable law. The Trust’s maximum exposure under these arrangements is unknown, as this would involve future claims that may be made against the Trust that have not yet occurred.
9. SUBSEQUENT EVENTS
Subsequent events after the date of the Statements of Assets and Liabilities have been evaluated through the date the financial statements were issued.
On October 4, 2018, the SEC amended Regulation S-X to require certain financial statement disclosure requirements to conform to US Generally Accepted Accounting Principles for investment companies. Effective November 4, 2018, the Funds adopted disclosure requirement changes for Regulation S-X and these changes are reflected throughout this report. The Funds’ adoption of those amendments, effective with the financial statements prepared as of September 30, 2018, had no effect on the Funds’ net assets or results of operations.
| 64 | www.clarkstonfunds.com |
| Clarkston Funds | Report of Independent Registered Public Accounting Firm |
To the Shareholders of Clarkston Partners Fund, Clarkston Fund, Clarkston Select Fund, and Clarkston Founders Fund and Board of Trustees of ALPS Series Trust
Opinion on the Financial Statements
We have audited the accompanying statements of assets and liabilities, including the portfolios of investments, of Clarkston Partners Fund, Clarkston Fund, Clarkston Select Fund, and Clarkston Founders Fund (the “Funds”), each a series of ALPS Series Trust, as of September 30, 2018, and the related statements of operations for the year then ended, and the statements of changes in net assets, including the related notes, and the financial highlights for each of the two years or periods in the period then ended (collectively referred to as the “financial statements”). In our opinion, the financial statements present fairly, in all material respects, the financial position of each of the Funds as of September 30, 2018, the results of their operations for the year then ended, the changes in their net assets and the financial highlights for each of the two years or periods in the period then ended, in conformity with accounting principles generally accepted in the United States of America.
The Funds’ financial highlights for the years or periods ended September 30, 2016, and prior, were audited by other auditors whose report dated December 2, 2016, expressed an unqualified opinion on those financial highlights.
Basis for Opinion
These financial statements are the responsibility of the Funds’ management. Our responsibility is to express an opinion on the Funds’ financial statements based on our audits. We are a public accounting firm registered with the Public Company Accounting Oversight Board (United States) (“PCAOB”) and are required to be independent with respect to the Funds in accordance with the U.S. federal securities laws and the applicable rules and regulations of the Securities and Exchange Commission and the PCAOB.
We conducted our audits in accordance with the standards of the PCAOB. Those standards require that we plan and perform the audit to obtain reasonable assurance about whether the financial statements are free of material misstatement, whether due to error or fraud.
Our audits included performing procedures to assess the risks of material misstatement of the financial statements, whether due to error or fraud, and performing procedures that respond to those risks. Such procedures included examining, on a test basis, evidence regarding the amounts and disclosures in the financial statements. Our procedures included confirmation of securities owned as of September 30, 2018, by correspondence with the custodian and brokers. Our audits also included evaluating the accounting principles used and significant estimates made by management, as well as evaluating the overall presentation of the financial statements. We believe that our audits provide a reasonable basis for our opinion.
We have served as the Funds’ auditor since 2017.
COHEN & COMPANY, LTD.
Cleveland, Ohio
November 29, 2018
| Annual Report | September 30, 2018 | 65 |
| Clarkston Funds | Additional Information |
September 30, 2018 (Unaudited)
1. PROXY VOTING POLICIES AND VOTING RECORD
A description of the policies and procedures that the Funds use to determine how to vote proxies relating to portfolio securities is available without charge, upon request, (i) by calling the Funds (toll-free) at 1-844-680-6562 or (ii) on the website of the Securities and Exchange Commission (the “SEC”) at http://www.sec.gov.
Information regarding how each Fund voted proxies relating to portfolio securities during the most recent 12-month period ended June 30 is available (i) without charge, upon request, by calling the Funds (toll-free) at 1-844-680-6562 or (ii) on the SEC’s website at http://www.sec.gov.
2. PORTFOLIO HOLDINGS
The Funds file their complete schedule of portfolio holdings with the SEC for the first and third quarters of each fiscal year on Form N-Q. The Funds’ Forms N-Q are available on the SEC website at http://www.sec.gov. The Funds’ Forms N-Q may be reviewed and copied at the SEC’s Public Reference Room in Washington, D.C., and information on the operation of the Public Reference Room may be obtained by calling 1-800-SEC-0330.
3. TAX DESIGNATIONS
Qualified Dividend Income
The percentage of ordinary income dividends distributed during the calendar year ended December 31, 2017 are designated as qualified dividend income (QDI) as defined in Section 1(h)(11) of the Internal Revenue Code in the following percentages:
| Amount | |
| Clarkston Partners Fund | 100.00% |
| Clarkston Fund | 100.00% |
| Clarkston Founders Fund | 100.00% |
| Clarkston Select Fund | 100.00% |
Dividends Received Deduction
For corporate shareholders, the following ordinary dividends paid during the calendar year ended December 31, 2017 qualify for the corporate dividends received deduction:
| Amount | |
| Clarkston Partners Fund | 100.00% |
| Clarkston Fund | 100.00% |
| Clarkston Founders Fund | 100.00% |
| Clarkston Select Fund | 96.74% |
Pursuant to Section 852(b)(3) of the Internal Revenue Code, the Clarkston Partners Fund designated $7,497,135 as long-term capital gain dividends.
| 66 | www.clarkstonfunds.com |
| Clarkston Funds | Additional Information |
September 30, 2018 (Unaudited)
4. DISCLOSURE REGARDING RENEWAL AND APPROVAL OF FUND ADVISORY AGREEMENT
On August 23, 2018, the Board of Trustees (the “Board”) of ALPS Series Trust (the “Trust”) met in person to discuss, among other things, the renewal and approval of the Investment Advisory Agreement between the Trust and Clarkston Capital Partners, LLC (“Clarkston Capital”) in accordance with Section 15(c) of the 1940 Act. The Independent Trustees met with independent legal counsel during executive session and discussed the Investment Advisory Agreement and other related materials.
In approving the Investment Advisory Agreement with Clarkston Capital, the Trustees, including all the Independent Trustees, considered the following factors with respect to the Clarkston Partners Fund, Clarkston Fund, Clarkston Founders Fund and Clarkston Select Fund (the “Clarkston Funds”):
Investment Advisory Fee Rate: The Trustees reviewed and considered the contractual annual advisory fee paid by the Trust on behalf of each Clarkston Fund to Clarkston Capital, considering the nature, extent and quality of the advisory services to be provided by Clarkston Capital to the Clarkston Funds.
The Trustees considered the information they received comparing each Clarkston Fund’s contractual annual advisory fees and overall expenses with those of funds in the expense group and universe of funds provided by FUSE, an independent provider of investment company data, which screened retail and institutional funds with similar strategies and comparable fee structures of the Clarkston Funds, and excluded all others.
Each FUSE peer group consisted of the applicable Clarkston Fund and several other funds identified by FUSE using similar strategies with comparable fee structures. The Trustees also noted that Clarkston Capital had institutional accounts and clients using model delivery services for some or all fund strategies.
With respect to the Clarkston Founders Fund (Institutional Class), the Trustees noted that the fund’s contractual advisory fee of 0.75% was slightly below the FUSE peer group median of 0.77%, and that the fund’s total net expenses (after fee waiver and expense reimbursement) of 0.92% for the Institutional Class was below the FUSE peer group median of 1.08%.
With respect to the Clarkston Fund (Institutional Class), the Trustees noted that the fund’s contractual advisory fee of 0.50% was lower than the peer group median of 0.65%, and that the fund’s total net expenses (after fee waiver and expense reimbursement) of 0.65% for the Institutional Class was substantially below the FUSE peer group median of 0.99%.
With respect to the Clarkston Partners Fund, the Trustees noted that the fund’s contractual advisory fee of 0.80% was slightly above the FUSE peer group median of 0.78% for both the Institutional class and Founders class, and that the fund’s total net expenses (after fee waiver and expense reimbursement) of 0.98% for the Institutional Class was slightly higher than the FUSE peer group median of 0.95%, while the total net expenses of 0.85% for the Founders class were slightly below the FUSE peer group median of 0.94%.
| Annual Report | September 30, 2018 | 67 |
| Clarkston Funds | Additional Information |
September 30, 2018 (Unaudited)
With respect to the Clarkston Select Fund (Institutional Class), the Trustees noted that the fund’s contractual advisory fee of 0.50% was below the FUSE peer group median of 0.70%, and that the fund’s total net expenses (after fee waiver and expense reimbursement) of 0.67% for the Institutional Class was below the FUSE peer group median of 0.99%.
The Trustees also noted that Clarkston Capital managed other institutional and strategic accounts, and model delivery service clients, using investment strategies similar to the strategies of the Clarkston Funds, and reviewed the fee structures for, and services rendered to, such clients.
After further consideration, the Trustees determined that the contractual annual advisory fees for each Fund were not unreasonable.
Nature, Extent and Quality of the Services under the Investment Advisory Agreement: The Trustees received and considered information regarding the nature, extent and quality of services provided to the Clarkston Funds under the Investment Advisory Agreement with Clarkston Capital. The Trustees reviewed certain background materials supplied by Clarkston Capital in its presentation, including its Form ADV.
The Trustees reviewed and considered Clarkston Capital’s investment advisory personnel, its history as an asset manager and its performance. The Trustees also reviewed the research and decision-making processes utilized by Clarkston Capital, including the methods adopted to seek to achieve compliance with the investment objectives, policies and restrictions of the Clarkston Funds.
The Trustees reviewed the background and experience of Clarkston Capital’s management relating to the Clarkston Funds, including the qualifications, background and responsibilities of the portfolio managers primarily responsible for the day-to-day portfolio management of the Clarkston Funds and the extent of the resources devoted to research and analysis of actual and potential investments. They considered the Trust’s experience with Clarkston Capital, including the Clarkston Capital’s responsiveness and compliance record. The Trustees also reviewed, among other things, Clarkston Capital’s Code of Ethics. The Trustees also considered Clarkston Capital’s reputation generally and its investment techniques, strategies, risk management controls and decision-making processes.
Performance: The Trustees reviewed and considered each Clarkston Fund’s performance, noting that the performance of the Clarkston Founders Fund since inception (January 2017) was slightly below median relative to the Fund’s universe, but slightly better than the median for the 3-month period; the Clarkston Fund since inception (April 2016) was in the fourth quartile of the Fund’s universe; the Clarkston Partners Fund since inception (September 2015) was slightly above median relative to the Fund’s universe for the Founders Class and the Institutional Class; and the Clarkston Select Fund since inception (January 2017) was below median relative to the Fund’s universe. The Trustees also discussed the relatively short performance period for all the Clarkston Funds, especially the Clarkston Founders Fund and the Clarkston Select Fund. They discussed the significant cash allocation in each Fund’s portfolio and the impact on performance. They considered Clarkston Capital’s emphasis on strong dividend paying companies, and the adviser’s confidence that the valuations of the companies in the portfolios will be realized over the long term, and concluded that the performance of each Fund was acceptable based on its stated strategy.
| 68 | www.clarkstonfunds.com |
| Clarkston Funds | Additional Information |
September 30, 2018 (Unaudited)
The Adviser’s Profitability: The Trustees received and considered actual and estimated profitability analyses prepared by Clarkston Capital based on the fees paid under the Investment Advisory Agreement. The Trustees considered the profits, if any, realized and anticipated to be realized by Clarkston Capital relating to the operation of each Clarkston Fund. The Trustees then reviewed and discussed Clarkston Capital’s income statement (and other financial information made available at the meeting) to consider the financial condition, stability and profitability of Clarkston Capital. They observed that some distribution costs were included in the profit analysis, and concluded that any profits would remain reasonable even if those distribution expenses were excluded from the adviser’s expenses.
Economies of Scale: The Trustees considered whether economies of scale in the provision of services to each Clarkston Fund would be passed along to the shareholders under the Investment Advisory Agreement. The Trustees concluded that the expense limitation provided by Clarkston Capital was a benefit to shareholders.
Other Benefits to the Adviser: The Trustees reviewed and considered any other incidental benefits derived or to be derived by Clarkston Capital from its relationship with each Clarkston Fund, including research and other support services.
The Board summarized its deliberations with respect to the Investment Advisory Agreement with Clarkston Capital. In evaluating Clarkston Capital and the fees charged under the Investment Advisory Agreement, the Trustees concluded that no single factor reviewed by the Trustees was identified by the Trustees to be determinative as the principal factor in whether to approve the Investment Advisory Agreement. Further, the Independent Trustees were advised by independent legal counsel throughout the process. The Trustees, including all the Independent Trustees, concluded that:
| ● | each Clarkston Fund’s contractual advisory fee was below or slightly above (but within an acceptable range of) the peer group median, and was not unreasonable; |
| ● | bearing in mind the limitations of comparing different types of accounts and the different levels of service typically associated with such accounts, the fee structures applicable to Clarkston Capital’s other clients employing a comparable strategy to any Clarkston Fund were not indicative of any unreasonableness with respect to the advisory fee payable by such Clarkston Fund; |
| ● | the nature, extent and quality of services rendered by Clarkston Capital under the Investment Advisory Agreement were adequate; |
| ● | bearing in mind the relatively short performance history of the Clarkston Funds (especially the Clarkston Founders Fund and the Clarkston Select Fund), the performance of each Clarkston Fund was acceptable; |
| ● | the estimated profitability of Clarkston Capital relating to the management of each Clarkston Fund was not unreasonable; and |
| Annual Report | September 30, 2018 | 69 |
| Clarkston Funds | Additional Information |
September 30, 2018 (Unaudited)
| ● | there were no material economies of scale or other material incidental benefits accruing to Clarkston Capital because of its relationship with each Clarkston Fund. |
Based on the Trustees’ deliberations and their evaluation of the information described above, the Trustees, including all the Independent Trustees, concluded that Clarkston Capital’s compensation for investment advisory services is consistent with the best interests of each Clarkston Fund and its shareholders.
| 70 | www.clarkstonfunds.com |
| Clarkston Funds | Privacy Policy |
| FACTS | WHAT DO THE FUNDS DO WITH YOUR PERSONAL INFORMATION? | ||
| WHY? | Financial companies choose how they share your personal information. Federal law gives consumers the right to limit some but not all sharing. Federal law also requires us to tell you how we collect, share and protect your personal information. Please read this notice carefully to understand what we do. | ||
| WHAT? | The types of personal information we collect and share depend on the product or service you have with us. This information can include:
● Social Security number and account transactions ● Account balances and transaction history ● Wire transfer instructions | ||
| HOW? | All financial companies need to share customers’ personal information to run their everyday business. In the section below, we list the reasons financial companies can share their customers’ personal information, the reasons a Fund chooses to share, and whether you can limit this sharing. | ||
| REASONS WE CAN SHARE YOUR PERSONAL INFORMATION | DO THE FUNDS SHARE? | CAN YOU LIMIT THIS SHARING? | |
For our everyday business purposes – such as to process your transactions, maintain your account(s), respond to court orders and legal investigations, or report to credit bureaus | Yes | No | |
For our marketing purposes – to offer our products and services to you | No | We do not share. | |
| For joint marketing with other financial companies | No | We do not share. | |
For our affiliates’ everyday business purposes – information about your transactions and experiences | Yes | No | |
For our affiliates’ everyday business purposes – information about your creditworthiness | No | We do not share. | |
| For non-affiliates to market to you | No | We do not share. | |
| QUESTIONS? | Call 1-844-680-6562 or go to www.clarkstonfunds.com | ||
| Annual Report | September 30, 2018 | 71 |
| Clarkston Funds | Privacy Policy |
| WHO WE ARE | ||
| Who is providing this notice? | Clarkston Partners Fund, Clarkston Fund, Clarkston Select Fund and Clarkston Founders Fund (the “Funds”) | |
| WHAT WE DO | ||
| How do the Funds protect my personal information? | To protect your personal information from unauthorized access and use, we use security measures that comply with federal law. These measures include computer safeguards and secured files and buildings. | |
| How do the Funds collect my personal information? | We collect your personal information, for example, when you
● open an account ● provide account information or give us your contact information ● make a wire transfer or deposit money | |
| Why can’t I limit all sharing? | Federal law gives you the right to limit only
● sharing for affiliates’ everyday business purposes-information about your creditworthiness ● affiliates from using your information to market to you ● sharing for non-affiliates to market to you
State laws and individual companies may give you additional rights to limit sharing. | |
| DEFINITIONS | ||
| Affiliates | Companies related by common ownership or control. They can be financial and nonfinancial companies. | |
| Non-affiliates | Companies not related by common ownership or control. They can be financial and nonfinancial companies.
● The Funds do not share with non-affiliates so they can market to you.
| |
| Joint marketing | A formal agreement between non-affiliated financial companies that together market financial products or services to you.
● The Funds do not jointly market. |
| 72 | www.clarkstonfunds.com |
| Clarkston Funds | Privacy Policy |
| OTHER IMPORTANT INFORMATION | ||
| California Residents | If your account has a California home address, your personal information will not be disclosed to nonaffiliated third parties except as permitted by applicable California law, and we will limit sharing such personal information with our affiliates to comply with California privacy laws that apply to us. | |
| Vermont Residents | The State of Vermont requires financial institutions to obtain your consent prior to sharing personal information that they collect about you with affiliated companies and nonaffiliated third parties other than in certain limited circumstances. Except as permitted by law, we will not share personal information we collect about you with nonaffiliated third parties or other affiliated companies unless you provide us with your written consent to share such information. | |
| Annual Report | September 30, 2018 | 73 |
| Clarkston Funds | Trustees and Officers |
September 30, 2018 (Unaudited)
INDEPENDENT TRUSTEES
| Name, Birth Year & Address* | Position(s) Held with Fund | Term of Office and Length of Time Served** | Principal Occupation(s) During Past 5 Years*** | Number of Funds in Fund Complex Overseen by Trustee**** | Other Directorships Held by Trustee During Past 5 Years*** |
Ward D. Armstrong Birth year: 1954
| Trustee and Chairman | Mr. Armstrong was appointed to the Board on May 27, 2016. Mr. Armstrong was appointed Chairman of the Board at the August 24, 2017 meeting of the Board of Trustees. | Retired; Managing Partner, NorthRock Partners, LLC (October 2013 to July 2015); Managing Director, NorthRock Partners, a Private Wealth Advisory Practice of Ameriprise Financial (February 2010 to October 2013); Senior Vice President, Ameriprise Financial, Inc. (November 1984 to May 2007); President, American Express Asset Management (2002 to 2004); and Chairman, Ameriprise Trust Company (November 1996 to May 2007). | 12
| Mr. Armstrong is a Director of the Heartland Group, Inc. (5 funds).
|
| * | All communications to Trustees and Officers may be directed to ALPS Series Trust c/o 1290 Broadway, Suite 1100, Denver, CO 80203. |
| ** | This is the period for which the Trustee or Officer began serving the Trust. Each Trustee serves an indefinite term, until such Trustee’s successor is elected and appointed, or such Trustee resigns or is deceased. Officers are elected on an annual basis. |
| *** | Except as otherwise indicated, each individual has held the office shown or other offices in the same company for the last five years. |
| **** | The Fund Complex currently consists of 12 series of the Trust and any other investment companies for which Clarkston Capital Partners, LLC provides investment advisory services, currently none. |
| 74 | www.clarkstonfunds.com |
| Clarkston Funds | Trustees and Officers |
September 30, 2018 (Unaudited)
| Name, Birth Year & Address* | Position(s) Held with Fund | Term of Office and Length of Time Served** | Principal Occupation(s) During Past 5 Years*** | Number of Funds in Fund Complex Overseen by Trustee**** | Other Directorships Held by Trustee During Past 5 Years*** |
J. Wayne Hutchens Birth year: 1944 | Trustee | Mr. Hutchens was elected to the Board on October 30, 2012. | Mr. Hutchens is currently retired. From April 2006 to December 2012, he served as President and CEO of the University of Colorado (CU) Foundation and from April 2009 to December 2012, he was Executive Director of the CU Real Estate Foundation. Mr. Hutchens is also Trustee of the Denver Museum of Nature and Science (2000 to present), Director of AMG National Trust Bank (June 2012 to present) and Trustee of Children’s Hospital Colorado (May 2012 to present). Prior to these positions, Mr. Hutchens spent 29 years in the banking industry, retiring as Chairman of Chase Bank Colorado. | 12 | Mr. Hutchens is a Director of RiverNorth Opportunities Fund, Inc. (2013 to present) |
Patrick Seese Birth year: 1971 | Trustee | Mr. Seese was elected to the Board on October 30, 2012. | Mr. Seese is an owner and a Managing Director of Integris Partners, a middle-market investment banking firm serving closely-held companies, financial sponsors and public companies (February 2008 to present). Prior to this, Mr. Seese was a Managing Director of Headwaters MB, a middle-market investing banking firm (December 2003 to February 2008). Prior to that, Mr. Seese worked in Credit Suisse First Boston’s Mergers and Acquisitions Group and served as Head of Corporation Development, Katy Industries, a publicly traded industrial and consumer products company and at Deloitte & Touche LLP, where he began his career in 1994. | 12 | Mr. Seese is a Director of The Mile High Five Foundation (2013 to present) and SJ Panthers Foundation (2016 to present) |
| * | All communications to Trustees and Officers may be directed to ALPS Series Trust c/o 1290 Broadway, Suite 1100, Denver, CO 80203. |
| ** | This is the period for which the Trustee or Officer began serving the Trust. Each Trustee serves an indefinite term, until such Trustee’s successor is elected and appointed, or such Trustee resigns or is deceased. Officers are elected on an annual basis. |
| *** | Except as otherwise indicated, each individual has held the office shown or other offices in the same company for the last five years. |
| **** | The Fund Complex currently consists of 12 series of the Trust and any other investment companies for which Clarkston Capital Partners, LLC provides investment advisory services, currently none |
| Annual Report | September 30, 2018 | 75 |
| Clarkston Funds | Trustees and Officers |
September 30, 2018 (Unaudited)
INTERESTED TRUSTEE
| Name, Birth Year & Address* | Position(s) Held with Fund | Term of Office and Length of Time Served** | Principal Occupation(s) During Past 5 Years*** | Number of Funds in Fund Complex Overseen by Trustee**** | Other Directorships Held by Trustee During Past 5 Years*** |
Jeremy O. May Birth year: 1970 | Trustee and President | Mr. May was elected Trustee and President on October 30, 2012. Mr. May was Chairman from October 30, 2012 to August 24, 2017. | Mr. May joined ALPS in 1995 and is currently President and Director of ALPS Fund Services, Inc., ALPS Distributors, Inc., and ALPS Portfolio Solutions Distributor, Inc., Executive Vice President and Director of ALPS Holdings, Inc. and ALPS Advisors, Inc. Because of his positions with these entities, Mr. May is deemed an affiliate of the Trust as defined under the 1940 Act. Mr. May is also on the Board of Directors of the University of Colorado Foundation and the AV Hunter Trust. | 12 | Mr. May is Trustee of the Reaves Utility Income Fund (1 fund)and Elevation ETF Trust (1 ETF) and President and Director of RiverNorth Opportunities Fund, Inc. |
| * | All communications to Trustees and Officers may be directed to ALPS Series Trust c/o 1290 Broadway, Suite 1100, Denver, CO 80203. |
| ** | This is the period for which the Trustee or Officer began serving the Trust. Each Trustee serves an indefinite term, until such Trustee’s successor is elected and appointed, or such Trustee resigns or is deceased. Officers are elected on an annual basis. |
| *** | Except as otherwise indicated, each individual has held the office shown or other offices in the same company for the last five years. |
| **** | The Fund Complex currently consists of 12 series of the Trust and any other investment companies for which Clarkston Capital Partners, LLC provides investment advisory services, currently none |
| 76 | www.clarkstonfunds.com |
| Clarkston Funds | Trustees and Officers |
September 30, 2018 (Unaudited)
OFFICERS
| Name, Birth Year & Address* | Position(s) Held with Fund | Term of Office and Length of Time Served** | Principal Occupation(s) During Past 5 Years*** |
Kimberly R. Storms Birth year: 1972 | Treasurer | Ms. Storms was elected Treasurer of the Trust on October 30, 2012. | Ms. Storms is Senior Vice President and Director of Fund Administration of ALPS. Because of her position with ALPS, Ms. Storms is deemed an affiliate of the Trust as defined under the 1940 Act. Ms. Storms is also Treasurer of Financial Investors Trust, Liberty All-Star Equity Fund and Liberty All-Star Growth Fund, Inc. |
Richard C. Noyes Birth year: 1970 | Secretary | Mr. Noyes was elected Secretary of the Trust on November 14, 2016. | Mr. Noyes joined ALPS in 2015 and is Senior Vice President and General Counsel of ALPS. Prior to joining ALPS, Mr. Noyes served as Assistant Vice President and Senior Counsel of Janus Capital Management LLC. Mr. Noyes is deemed an affiliate of the Trust as defined under the 1940 Act. |
Anne M. Berg Birth year: 1973 | Assistant Secretary | Ms. Berg was elected Assistant Secretary of the Trust on August 23, 2018. | Ms. Berg joined ALPS as Senior Investment Company Act Paralegal in February 2017. Prior to joining ALPS, Anne was a Senior Legal Manager at Janus Capital Group Inc., a global investment manager in Denver, Colorado. Because of her position with ALPS, Ms. Berg is deemed an affiliate of the Trust as defined under the 1940 Act. |
Alan Gattis**** Birth year: 1980 | Assistant Treasurer | Mr. Gattis was elected Assistant Treasurer of the Trust on August 9, 2016. | Mr. Gattis joined ALPS in 2011 and is currently Vice President and Fund Controller of ALPS. Prior to joining ALPS, Mr. Gattis was an Auditor at Spicer Jeffries LLP (2009 through 2011) and an Auditor at PricewaterhouseCoopers LLP (2004 -2009). Because of his position with ALPS, Mr. Gattis is deemed an affiliate of the Trust as defined under the 1940 Act. Mr. Gattis is also Assistant Treasurer of Elevation ETF Trust and Financial Investors Trust. |
| * | All communications to Trustees and Officers may be directed to ALPS Series Trust c/o 1290 Broadway, Suite 1100, Denver, CO 80203. |
| ** | This is the period for which the Trustee or Officer began serving the Trust. Each Trustee serves an indefinite term, until such Trustee’s successor is elected and appointed, or such Trustee resigns or is deceased. Officers are elected on an annual basis. |
| *** | Except as otherwise indicated, each individual has held the office shown or other offices in the same company for the last five years. |
| **** | Mr. Gattis resigned effective November 15, 2018. |
| Annual Report | September 30, 2018 | 77 |
| Clarkston Funds | Trustees and Officers |
September 30, 2018 (Unaudited)
| Name, Birth Year & Address* | Position(s) Held with Fund | Term of Office and Length of Time Served** | Principal Occupation(s) During Past 5 Years*** |
Lucas D. Foss Birth year: 1977 | Chief Compliance Officer (“CCO”) | Mr. Foss was elected CCO of the Trust on January 22, 2018. | Mr. Foss joined ALPS in November 2017 as Vice President and Deputy Chief Compliance Officer. Prior to his current role, Mr. Foss served as the Director of Compliance at Transamerica Asset Management (July 2015-November 2017). Deputy Chief Compliance Officer at ALPS (September 2012 – June 2015) Compliance Manager at ALPS (January 2010 - August 2012) and a Senior Compliance Analyst at ALPS (November 2006 – December 2009). Before joining ALPS, Mr. Foss held positions at Bisys Hedge Fund Services and Deutsche Asset Management. Because of his position with ALPS, Mr. Foss is deemed an affiliate of the Trust as defined under the 1940 Act. Mr. Foss is also CCO of Harvest Volatility Edge Trust and Goehring & Rozencwajg Investment Funds. |
| * | All communications to Trustees and Officers may be directed to ALPS Series Trust c/o 1290 Broadway, Suite 1100, Denver, CO 80203. |
| ** | This is the period for which the Trustee or Officer began serving the Trust. Each Trustee serves an indefinite term, until such Trustee’s successor is elected and appointed, or such Trustee resigns or is deceased. Officers are elected on an annual basis. |
| *** | Except as otherwise indicated, each individual has held the office shown or other offices in the same company for the last five years. |
Additional information about members of the Board of Trustees and officers of the Trust is available in the Statement of Additional Information and is available, without charge, upon request, by calling the Fund (toll-free) at 1-855-254-6467.
| 78 | www.clarkstonfunds.com |
Intentionally Left Blank

This material must be preceded or accompanied by a prospectus.
The Clarkston Funds are distributed by ALPS Distributors, Inc.

Table of Contents
| Shareholder Letter | 1 |
| Portfolio Update | 3 |
| Disclosure of Fund Expenses | 5 |
| Portfolio of Investments | 6 |
| Statement of Assets and Liabilities | 11 |
| Statement of Operations | 12 |
| Statements of Changes in Net Assets | 13 |
| Statement of Cash Flows | 14 |
| Financial Highlights | 15 |
| Notes to Financial Statements | 18 |
| Report of Independent Registered Public Accounting Firm | 26 |
| Disclosure Regarding Renewal and Approval of Fund Advisory Agreement | 27 |
| Additional Information | 29 |
| Privacy Policy | 30 |
| Trustees & Officers | 32 |
| DDJ Opportunistic High Yield Fund | Shareholder Letter |
September 30, 2018 (Unaudited)
Message from the President: 12-Month Review as of 9/30/18
Performance for the market segments on which we primarily focus, namely high yield bonds and leveraged loans, has been positive with the latter outperforming the former over the past year. In addition, performance in the domestic equity markets in particular has been very strong, supported by a strengthening U.S. economy.
At DDJ, our outlook for the U.S. economy and leveraged credit market remains favorable; however, risks to such outlook continue to persist. DDJ believes that pro-growth policies favored by the current presidential administration (e.g., tax reform passed at the end of 2017) will likely continue to drive fundamental improvements in the U.S. economy, including with respect to high yield issuers. That said, the current tariff negotiations by the Trump administration pose risks that could result in a trade war, which in all likelihood would negatively affect current economic growth. During the third quarter, market participants received some positive news on this front as trade tensions between the U.S., Mexico, and Canada thawed, and ultimately resulted in a re-tooled trade agreement (i.e., “new-NAFTA”). Nevertheless, the possibility of escalating trade tensions that may result in an all-out trade war with China, DDJ’s worst case scenario, will likely continue to influence performance for all markets through the end of 2018 and beyond. However, DDJ’s base case scenario assumes tariffs are used as leverage in negotiations to ultimately achieve more favorable trade agreements for the United States.
While the high yield market experienced a period of relatively low volatility in 2017, volatility increased significantly at times in 2018, as investors reacted to changing inflation expectations and concerns over tariffs, amongst other factors. Increased volatility is expected as this historically long credit cycle continues. A meaningful uptick in volatility has a tendency to induce outflows from high yield bond mutual funds, which can accelerate quickly, resulting in pressure on high yield bond prices and potentially leading to exaggerated price movements. From DDJ’s perspective, market price volatility has its benefit, as these exaggerated price movements often create mispriced investment opportunities in the short-term to support long-term alpha generation. DDJ expects periods of increased volatility to continue in the coming quarters as investors digest the latest economic and inflation related data, the results of the mid-term elections, and the potential impact of key policies, such as the imposition of tariffs described above. To help mitigate such risks, DDJ maintains a significant allocation to leveraged loans in the Fund, which are senior in the capital structure, and generally exhibit less price volatility than high yield bonds, particularly in a rising rate environment due to the floating-rate nature of most leveraged loans.
With respect to fundamentals, DDJ believes that the overall picture for the leveraged credit market is stable and, in many cases, improving compared to earlier in the year. Leverage levels continue to decline modestly and interest coverage for the broader high yield market continues to improve. One concerning factor that DDJ is monitoring is the growth of the BBB-rated segment of the investment grade credit market. This market segment has undergone massive growth since the credit crisis and any macroeconomic weakness could result in a wave of downgrades flooding the high yield market with additional supply, pressuring bond prices. However, DDJ’s base case for the remainder of 2018 and into early 2019 provides that the enactment of pro-growth policies will increase economic growth and therefore continue to result in an improvement in high yield issuer fundamentals in the aggregate. Accordingly, DDJ expects that default rates will remain below longer-term averages, with a meaningful pick-up in defaults looking less likely to occur until no earlier than the second half of 2019. That said, favorable economic conditions continue to be disproportionately enjoyed by the lower tier of the high yield market relative to their higher quality peers - at least from a credit spread perspective - a theme that has moderated more recently, but that DDJ believes is likely to persist for the remainder of the year. Finally, while the high yield market offers an attractive coupon relative to most other fixed income markets, its ability to generate meaningful price appreciation for the remainder of this year is likely hindered by a combination of relatively tight current spread levels and a reduction in accommodative monetary policy. As a result, DDJ believes that its focus on maintaining a yield premium in the Fund relative to the benchmark should result in attractive relative performance.
The Fund outperformed the BofA Merrill Lynch U.S. High Yield Non-Financials Index for the twelve months ending September 30, 2018. This outperformance was primarily the result of the Fund’s income advantage relative to the index, a characteristic the Fund will typically exhibit as a result of its higher average coupon, as well as the Fund’s significant allocation to leveraged loans, which benefited performance in the rising rate environment experienced over the past year. In addition, the Fund’s underweight across the BB rated spectrum and overweight across the CCC rated spectrum generated positive quality allocation effects. From a sector perspective, security selection detracted, driven primarily by a small number of the Fund’s holdings, particularly in the Automotive and Consumer Good sectors. However, these negative effects were partially offset by the positive security selection effects generated by the Fund’s Insurance and Media sector holdings, which outperformed those of the benchmark.
DDJ remains focused on maintaining a yield premium in the Fund relative to the broader high yield market, while at the same time seeking to minimize realized credit losses by investing in companies that our research demonstrates have a better fundamental profile than that of the overall high yield market. Generally speaking, the high yield bonds and leveraged loans held by the Fund display less sensitivity to movements in the overall high yield bond and loan market as a result of its focus on less followed, middle market companies; this typically is true regardless of whether the market is producing gains or losses. By adhering to our investment philosophy and process, we believe that the Fund will be well positioned to withstand short-term price movements and accordingly outperform its benchmark with less volatility over the long term. Regardless of the state of the leveraged credit markets, DDJ will continue to apply our bottom-up fundamental research process to identify those credits that offer the most attractive risk-versus-reward in an effort to outperform the broader high yield market over a full credit cycle.
Sincerely,

David J. Breazzano
President, Chief Investment Officer and Portfolio Manager
DDJ Capital Management, LLC
| Annual Report | September 30, 2018 | 1 |
| DDJ Opportunistic High Yield Fund | Shareholder Letter |
September 30, 2018 (Unaudited)
The ICE BofA Merrill Lynch U.S. High Yield Non-Financial Index is a subset of The BofA Merrill Lynch US High Yield Index but that excludes all securities of financial issuers.
Alpha: the excess return of an individual investment or the Fund in aggregate relative to the return on the specified benchmark.
Coupon: The stated interest rate paid on a bond. Coupon payments for high yield bonds are typically made semi-annually.
Leveraged Loan: A commercial loan provided to a borrower by a group of lenders that has an investment grade rating.
Spread: The yield of a bond minus the yield of the government bond that matches the maturity (or appropriate call date) of the bond.
Yield: The yield is the income return on an investment, such as interest or dividends received from holding a particular security.
Yield Premium: As referenced in this letter, refers to the yield of individual investments in the Fund, or the yield of the Fund in aggregate, being higher than the yield of the Fund’s benchmark.
The views and information discussed in this commentary are as of the date of publication, are subject to change, and may not reflect the writer’s current views. The views expressed are those of the Adviser only, and represent an assessment of market conditions at a specific point in time, are opinions only and should not be relied upon as investment advice regarding a particular investment or markets in general. Such information does not constitute a recommendation to buy or sell specific securities or investment vehicles. It should not be assumed that any investment will be profitable or will equal the performance of the fund(s) or any securities or any sectors mentioned in this letter. The subject matter contained in this letter has been derived from several sources believed to be reliable and accurate at the time of compilation. Neither the Fund nor the Adviser accepts any liability for losses either direct or consequential caused by the use of this information.
Credit ratings are measured on a scale that generally ranges from AAA (highest) to D (lowest). All Fund securities except for those labeled “Not Rated” and “Other” have been rated by Moody’s, S&P or Fitch, which are each a Nationally Recognized Statistical Rating Organization (“NRSRO”). All Index securities except for those labeled “Not Rated” have been rated by Moody’s or S&P. Credit ratings are subject to change. One cannot invest directly into an index.
Not FDIC Insured – No Bank Guarantee – May Lose Value
Past performance does not guarantee future results.
ALPS Distributors, Inc. is not affiliated with DDJ Capital Management, LLC, the investment adviser to the Fund.
| 2 | www.ddjcap.com |
| DDJ Opportunistic High Yield Fund | Portfolio Update |
September 30, 2018 (Unaudited)
Average Annual Total Returns (as of September 30, 2018)
| 3 Month | 6 Month | 1 Year | 3 Year | Since Inception* | |
| DDJ Opportunistic High Yield Fund – Institutional Class | 2.40% | 0.62% | 4.26% | 8.41% | 7.24% |
| DDJ Opportunistic High Yield Fund – Class I | 2.58% | 0.89% | 4.42% | 8.44% | 7.28% |
| DDJ Opportunistic High Yield Fund – Class II | 2.28% | 0.48% | 3.97% | 8.08% | 6.93% |
| ICE BofA ML U.S. High Yield Non-Financial Index(a) | 2.46% | 3.58% | 3.01% | 8.31% | 5.88% |
The performance data quoted above represents past performance. Past performance is not a guarantee of future results. Investment return and value of the Fund shares will fluctuate so that an investor’s shares, when sold or redeemed, may be worth more or less than their original cost. Performance may be lower or higher than performance data quoted. Fund performance current to the most recent month-end is available by calling (844) 363-4898 or by visiting www.ddjfunds.com.
| * | Fund’s inception date is July 16, 2015. |
| (a) | The ICE BofA Merrill Lynch U.S. High Yield Non-Financial Index is a subset of The BofA Merrill Lynch US High Yield Index but that excludes all securities of financial issuers. |
Returns of less than 1 year are cumulative.
Indices are not actively managed and do not reflect deduction for fees, expenses or taxes. An investor cannot invest directly in an index.
The returns shown above do not reflect the deduction of taxes a shareholder would pay on Fund distributions or redemption of Fund shares.
The total annual operating expenses and total annual operating expenses after fee waivers and/or reimbursement you may pay as an investor in the Fund’s Institutional Class, Class I and Class II shares (as reported in the January 29, 2018 Prospectus) are 4.61% and 0.79%, 4.72% and 0.89% and 4.95% and 1.14% respectively. The Fund’s investment adviser has contractually agreed to limit expenses through January 31, 2019.
Performance of $10,000 Initial Investment (as of September 30, 2018)

The graph shown above represents historical performance of a hypothetical investment of $10,000 in the Fund since inception. Past performance does not guarantee future results. All returns reflect reinvested dividends, but do not reflect the deduction of taxes that a shareholder would pay on Fund distributions or the redemption of Fund shares.
| Annual Report | September 30, 2018 | 3 |
| DDJ Opportunistic High Yield Fund | Portfolio Update |
September 30, 2018 (Unaudited)
Top Ten Holdings (as a % of Net Assets)*
| U.S. Renal Care, Inc. | 3.11% |
| Asurion LLC | 2.62% |
| Alliant Holdings Intermediate LLC / Alliant Holdings Co.-Issuer | 2.59% |
| GTT Communications, Inc. | 2.53% |
| Specialty Steel Holdco, Inc. | 2.50% |
| Hexion, Inc. | 2.35% |
| MPH Acquisition Holdings, LLC | 2.31% |
| One Call Corp. | 2.26% |
| AssuredPartners, Inc. | 2.20% |
| RegionalCare Hospital Partners Holdings, Inc. | 2.19% |
| Top Ten Holdings | 24.66% |
| * | Holdings are subject to change, and may not reflect the current or future position of the portfolio. Tables present indicative values only. |
Portfolio Composition (as a % of Net Assets)*

| 4 | www.ddjcap.com |
| DDJ Opportunistic High Yield Fund | Disclosure of Fund Expenses |
September 30, 2018 (Unaudited)
Examples. As a shareholder of the DDJ Opportunistic High Yield Fund (the “Fund”), you incur two types of costs: (1) transaction costs, including applicable redemption fees; and (2) ongoing costs, including management fees, distribution and service (12b-1) fees and other Fund expenses. The following examples are intended to help you understand your ongoing costs (in dollars) of investing in the Fund and to compare these costs with the ongoing costs of investing in other mutual funds. The examples are based on an investment of $1,000 invested on April 1, 2018 and held through September 30, 2018.
Actual Expenses. The first line under each class in the table below provides information about actual account values and actual expenses. You may use the information in this line, together with the amount you invested, to estimate the expenses that you paid over the period. Simply divide your account value by $1,000 (for example, an $8,600 account value divided by $1,000 = 8.6), then multiply the result by the number in the first line under the heading “Expenses Paid During Period April 1, 2018 - September 30, 2018” to estimate the expenses you paid on your account during this period.
Hypothetical Example for Comparison Purposes. The second line under each class in the table below provides information about hypothetical account values and hypothetical expenses based on the Fund’s actual expense ratio and an assumed rate of return of 5% per year before expenses, which is not the Fund’s actual return. The hypothetical account values and expenses may not be used to estimate the actual ending account balance or expenses you paid for the period. You may use this information to compare the ongoing costs of investing in the Fund and other mutual funds. To do so, compare this 5% hypothetical example with the 5% hypothetical examples that appear in the shareholder reports of the other funds.
Please note that the expenses shown in the table are meant to highlight your ongoing Fund costs only and do not reflect any transactional costs, such as redemption fees. Therefore, the second line under each class in the table below is useful in comparing ongoing costs only and will not help you determine the relative total costs of owning different funds. In addition, if these transactional costs were included, your costs would have been higher.
| Beginning Account Value April 1, 2018 | Ending Account Value September 30, 2018 | Expense Ratio(a) | Expense Paid During Period April 1, 2018 - September 30, 2018(b) | |
| DDJ Opportunistic High Yield Fund | ||||
| Institutional Class | ||||
| Actual | $1,000.00 | $1,006.20 | 0.79% | $3.97 |
| Hypothetical (5% return before expenses) | $1,000.00 | $1,021.11 | 0.79% | $4.00 |
| Class I | ||||
| Actual | $1,000.00 | $1,008.90 | 0.77% | $3.88 |
| Hypothetical (5% return before expenses) | $1,000.00 | $1,021.21 | 0.77% | $3.90 |
| Class II | ||||
| Actual | $1,000.00 | $1,004.80 | 1.09% | $5.48 |
| Hypothetical (5% return before expenses) | $1,000.00 | $1,019.60 | 1.09% | $5.52 |
| (a) | The Fund’s expense ratios have been annualized based on the Fund’s most recent fiscal half-year expenses after any applicable waivers and reimbursements. |
| (b) | Expenses are equal to the Fund’s annualized expense ratio multiplied by the average account value over the period, multiplied by the number of days in the most recent fiscal half year (183), divided by 365. |
| Annual Report | September 30, 2018 | 5 |
| DDJ Opportunistic High Yield Fund | Portfolio of Investments |
September 30, 2018
| Shares | Value (Note 2) | |||||||
| COMMON STOCKS (3.48%) | ||||||||
| Materials (3.48%) | ||||||||
| Real Alloy Holding, Inc.(a)(b)(c)(d)(e) | 3 | $ | 106,203 | |||||
| Specialty Steel Holdco, Inc.(a)(b)(c)(d)(e) | 1 | 270,348 | ||||||
| Total Materials | 376,551 | |||||||
| TOTAL COMMON STOCKS (Cost $237,204) | 376,551 | |||||||
| Rate | Maturity Date | Principal Amount | Value (Note 2) | |||||||||
| BANK LOANS (34.48%) | ||||||||||||
| Aerospace & Defense (0.09%) | ||||||||||||
| Jazz Acquisition, Inc. - Term Loan (Second Lien) | 3M US L + 6.75%, 1.00% Floor | 06/19/2022 | $ | 10,000 | $ | 9,625 | ||||||
| Total Aerospace & Defense | 9,625 | |||||||||||
| Communications (2.51%) | ||||||||||||
| MH Sub I LLC - Amendment No. 2 Initial Term Loan (Second Lien) | 1M US L + 7.50%, 1.00% Floor | 09/15/2025 | 90,000 | 91,125 | ||||||||
| Ten-X LLC - Term Loan (Second Lien)(a)(d)(e) | 1M US L + 8.00%, 1.00% Floor | 09/29/2025 | 180,000 | 180,000 | ||||||||
| Total Communications | 271,125 | |||||||||||
| Consumer, Cyclical (4.19%) | ||||||||||||
| DexKo Global, Inc. - B Term Loan (Second Lien)(a) | 3M US L + 8.25%, 1.00% Floor | 07/24/2025 | 110,000 | 112,200 | ||||||||
| KUEHG Corp - Tranche B Term Loan (Second Lien)(a) | 3M US L + 8.25%, 1.00% Floor | 08/22/2025 | 70,000 | 71,050 | ||||||||
| Parq Holdings LP - Closing Date Term Loan (First Lien)(a)(d) | 3M US L + 7.50%, 1.00% Floor | 12/17/2020 | 158,714 | 158,714 | ||||||||
| Truck Hero, Inc. - Initial Term Loan (Second Lien)(a) | 1M US L + 8.25%, 1.00% Floor | 04/21/2025 | 110,000 | 111,100 | ||||||||
| Total Consumer, Cyclical | 453,064 | |||||||||||
See Notes to Financial Statements.
| 6 | www.ddjcap.com |
| DDJ Opportunistic High Yield Fund | Portfolio of Investments |
September 30, 2018
| Rate | Maturity Date | Principal Amount | Value (Note 2) | |||||||||
| Consumer, Non-cyclical (12.56%) | ||||||||||||
| Aveanna Healthcare LLC - Incremental Term Loan (First Lien)(a)(f)(g) | 1M US L + 5.50%, 1.00% Floor | 03/15/2024 | $ | 129,439 | $ | 128,954 | ||||||
| Aveanna Healthcare LLC - Initial Term Loan (Second Lien)(a)(d) | 1M US L + 8.00%, 1.00% Floor | 03/17/2025 | 120,000 | 118,800 | ||||||||
| Dentalcorp of Canada ULC - Delayed Draw Term Loan (Second Lien)(a) | 1M US L + 7.50%, 1.00% Floor | 06/08/2026 | 5,080 | 5,144 | ||||||||
| Lanai Holdings III, Inc. - Initial Term Loan (Second Lien)(a)(e) | 3M US L + 8.50%, 1.00% Floor | 08/28/2023 | 160,000 | 152,800 | ||||||||
| Learning Care Group No. 2, Inc. - Initial Term Loan (Second Lien)(a)(e) | 1M US L + 7.50%, 1.00% Floor | 03/13/2026 | 110,000 | 110,550 | ||||||||
| One Call Corp. - Extended Term Loan (First Lien) | 1M US L + 5.25%, 1.00% Floor | 11/27/2022 | 256,701 | 244,219 | ||||||||
| Packaging Coordinators Midco, Inc. - Initial Term Loan (Second Lien)(a)(d)(f) | 3M US L + 8.75%, 1.00% Floor | 07/01/2024 | 160,000 | 160,000 | ||||||||
| Parfums Holding Co., Inc. - Initial Term Loan (Second Lien) | 1M US L + 8.75%, 1.00% Floor | 06/30/2025 | 100,000 | 101,125 | ||||||||
| U.S. Renal Care, Inc. - Term Loan (Second Lien)(a) | 3M US L + 8.00%, 1.00% Floor | 12/29/2023 | 350,000 | 336,874 | ||||||||
| Total Consumer, Non-cyclical | 1,358,466 | |||||||||||
| Energy (0.66%) | ||||||||||||
| Foresight Energy LLC - Term Loan (First Lien) | 1M US L + 5.75%, 1.00% Floor | 03/28/2022 | 71,539 | 71,618 | ||||||||
| Total Energy | 71,618 | |||||||||||
| Financials (3.44%) | ||||||||||||
| Asurion LLC - Replacement B-2 Term Loan (Second Lien) | 1M US L + 6.50% | 08/04/2025 | 275,000 | 283,164 | ||||||||
| Zest Acquisition Corp. - Initial Term Loan (Second Lien) | 3M US L + 7.50%, 1.00% Floor | 03/13/2026 | 90,000 | 89,438 | ||||||||
| Total Financials | 372,602 | |||||||||||
| Health Care (1.54%) | ||||||||||||
| Dentalcorp Perfect Smile ULC - Initial Term Loan (Second Lien)(a)(f)(g) | 1M US L + 7.50%, 1.00% Floor | 06/08/2026 | 94,920 | 96,107 | ||||||||
| PharMerica Corp. - Initial Term Loan (Second Lien) | 1M US L + 7.75% | 12/05/2025 | 70,000 | 69,956 | ||||||||
| Total Health Care | 166,063 | |||||||||||
| Industrials (3.09%) | ||||||||||||
| Deliver Buyer, Inc. - Term Loan (First Lien) | 3M US L + 5.00%, 1.00% Floor | 05/01/2024 | 79,798 | 80,546 | ||||||||
| Engineered Machinery Holdings, Inc. - Initial Term Loan (Second Lien) | 3M US L + 7.25%, 1.00% Floor | 07/18/2025 | 115,812 | 115,667 | ||||||||
| Utex Industries, Inc. - Initial Term Loan (Second Lien) | 1M US L + 7.25%, 1.00% Floor | 05/20/2022 | 140,000 | 138,484 | ||||||||
| Total Industrials | 334,697 | |||||||||||
| Materials (0.08%) | ||||||||||||
| Miami Valley Steel Service, Inc. - Term Loan (First Lien)(a)(d)(e) | 3M US L + 9.00%, 1.00% Floor | 01/20/2023 | 8,990 | 8,990 | ||||||||
| Total Materials | 8,990 | |||||||||||
See Notes to Financial Statements.
| Annual Report | September 30, 2018 | 7 |
| DDJ Opportunistic High Yield Fund | Portfolio of Investments |
September 30, 2018
| Rate | Maturity Date | Principal Amount | Value (Note 2) | |||||||||||
| Technology (6.32%) | ||||||||||||||
| Evergreen Skills Lux S.A R.L. - Initial Term Loan (First Lien) | 1M US L + 4.75%, 1.00% Floor | 04/28/2021 | $ | 191,491 | $ | 182,634 | ||||||||
| Evergreen Skills Lux S.A R.L. - Initial Term Loan (Second Lien) | 1M US L + 8.25%, 1.00% Floor | 04/28/2022 | 59,990 | 51,179 | ||||||||||
| Masergy Holdings, Inc. - Initial Term Loan (Second Lien) | 3M US L + 7.50%, 1.00% Floor | 12/16/2024 | 125,585 | 126,109 | ||||||||||
| Optiv, Inc. - Initial Term Loan (Second Lien) | 1M US L + 7.25%, 1.00% Floor | 01/31/2025 | 50,000 | 48,500 | ||||||||||
| Peak 10 Holding Corp. - Initial Term Loan (Second Lien) | 3M US L + 7.25%, 1.00% Floor | 08/01/2025 | 110,000 | 107,360 | ||||||||||
| TierPoint LLC - Initial Term Loan (Second Lien) | 1M US L + 7.25%, 1.00% Floor | 05/05/2025 | 170,000 | 167,610 | ||||||||||
| Total Technology | 683,392 | |||||||||||||
| TOTAL BANK LOANS (Cost $3,699,440) | 3,729,642 | |||||||||||||
| HIGH YIELD BONDS AND NOTES (57.52%) | ||||||||||||||
| Basic Materials (2.35%) | ||||||||||||||
| Big River Steel LLC / BRS Finance Corp.(h) | 7.250% | 09/01/2025 | 50,000 | $ | 53,125 | |||||||||
| Cornerstone Chemical Co.(h) | 6.750% | 08/15/2024 | 200,000 | 200,544 | ||||||||||
| Total Basic Materials | 253,669 | |||||||||||||
| Communications (7.76%) | ||||||||||||||
| CenturyLink, Inc., Series G | 6.875% | 01/15/2028 | 180,000 | 173,718 | ||||||||||
| GTT Communications, Inc.(h) | 7.875% | 12/31/2024 | 280,000 | 273,699 | ||||||||||
| Sirius XM Radio, Inc.(h) | 5.375% | 07/15/2026 | 40,000 | 39,800 | ||||||||||
| Townsquare Media, Inc.(h) | 6.500% | 04/01/2023 | 120,000 | 111,450 | ||||||||||
| Urban One, Inc.(h) | 9.250% | 02/15/2020 | 195,000 | 193,538 | ||||||||||
| Zayo Group LLC / Zayo Capital, Inc. | 6.375% | 05/15/2025 | 45,000 | 46,925 | ||||||||||
| Total Communications | 839,130 | |||||||||||||
| Consumer, Cyclical (6.21%) | ||||||||||||||
| American Tire Distributors, Inc.(e)(h)(j) | 10.250% | 03/01/2022 | 325,000 | 87,750 | ||||||||||
| BCD Acquisition, Inc.(h) | 9.625% | 09/15/2023 | 100,000 | 107,125 | ||||||||||
| Carlson Travel, Inc.(h) | 9.500% | 12/15/2024 | 210,000 | 203,175 | ||||||||||
| Jack Ohio Finance LLC / Jack Ohio Finance 1 Corp.(h) | 10.250% | 11/15/2022 | 155,000 | 170,919 | ||||||||||
| Sportsnet(a)(c)(d)(e) | 10.250% | 01/15/2025 | 100,000 | 102,500 | ||||||||||
| Total Consumer, Cyclical | 671,469 | |||||||||||||
See Notes to Financial Statements.
| 8 | www.ddjcap.com |
| DDJ Opportunistic High Yield Fund | Portfolio of Investments |
September 30, 2018
| Rate | Maturity Date | Principal Amount | Value (Note 2) | |||||||||||
| Consumer, Non-cyclical (15.53%) | ||||||||||||||
| Eagle Holding Co. II LLC(h)(i) | Cash 7.625% + PIK 8.375% | 05/15/2022 | $ | 180,000 | $ | 182,700 | ||||||||
| High Ridge Brands Co.(h) | 8.875% | 03/15/2025 | 145,000 | 70,869 | ||||||||||
| Midas Intermediate Holdco II LLC / Midas Intermediate Holdco II Finance, Inc.(h) | 7.875% | 10/01/2022 | 95,000 | 84,550 | ||||||||||
| MPH Acquisition Holdings, LLC(h) | 7.125% | 06/01/2024 | 240,000 | 250,079 | ||||||||||
| One Call Corp., Series AI(e) | 7.500% | 07/01/2024 | 64,000 | 63,360 | ||||||||||
| One Call Corp., Series AI | 10.000% | 10/01/2024 | 166,000 | 139,440 | ||||||||||
| RegionalCare Hospital Partners Holdings, Inc.(h) | 8.250% | 05/01/2023 | 225,000 | 237,375 | ||||||||||
| Surgery Center Holdings, Inc.(h) | 6.750% | 07/01/2025 | 175,000 | 168,438 | ||||||||||
| Team Health Holdings, Inc.(h) | 6.375% | 02/01/2025 | 190,000 | 165,300 | ||||||||||
| Vizient, Inc.(h) | 10.375% | 03/01/2024 | 195,000 | 214,256 | ||||||||||
| West Street Merger Sub, Inc.(h) | 6.375% | 09/01/2025 | 110,000 | 104,775 | ||||||||||
| Total Consumer, Non-cyclical | 1,681,142 | |||||||||||||
| Energy (3.18%) | ||||||||||||||
| Foresight Energy LLC / Foresight Energy(h) | 11.500% | 04/01/2023 | 170,000 | 151,300 | ||||||||||
| MEG Energy Corp.(h) | 7.000% | 03/31/2024 | 210,000 | 192,150 | ||||||||||
| Total Energy | 343,450 | |||||||||||||
| Financials (9.79%) | ||||||||||||||
| Alliant Holdings Intermediate LLC / Alliant Holdings Co.-Issuer(h) | 8.250% | 08/01/2023 | 270,000 | 280,125 | ||||||||||
| AssuredPartners, Inc.(h) | 7.000% | 08/15/2025 | 240,000 | 238,200 | ||||||||||
| NFP Corp.(h) | 6.875% | 07/15/2025 | 170,000 | 170,850 | ||||||||||
| Uniti Group LP / Uniti Fiber Holdings, Inc. / CSL Capital LLC(h) | 7.125% | 12/15/2024 | 75,000 | 69,000 | ||||||||||
| Uniti Group LP / Uniti Group Finance, Inc. / CSL Capital LLC | 8.250% | 10/15/2023 | 240,000 | 230,400 | ||||||||||
| USIS Merger Sub, Inc.(h) | 6.875% | 05/01/2025 | 70,000 | 70,000 | ||||||||||
| Total Financials | 1,058,575 | |||||||||||||
| Industrials (4.16%) | ||||||||||||||
| JPW Industries Holding Corp.(h) | 9.000% | 10/01/2024 | 160,000 | 163,200 | ||||||||||
| Material Sciences Corp.(a)(c)(d)(e)(i) | L + 8.25 or PIK 2.00% | 01/09/2024 | 107,945 | 107,945 | ||||||||||
| Optimas OE Solutions Holding LLC / Optimas OE Solutions, Inc.(h) | 8.625% | 06/01/2021 | 180,000 | 179,100 | ||||||||||
| Total Industrials | 450,245 | |||||||||||||
| Materials (7.31%) | ||||||||||||||
| Century Aluminum Co.(h) | 7.500% | 06/01/2021 | 150,000 | 152,250 | ||||||||||
| Hexion, Inc. | 6.625% | 04/15/2020 | 270,000 | 254,475 | ||||||||||
| Joseph T Ryerson & Son, Inc.(h) | 11.000% | 05/15/2022 | 40,000 | 43,756 | ||||||||||
| Real Alloy Holding, Inc.(a)(c)(d)(e)(i) | 3M US L +10.00% or PIK L+12.00%, 1.00% Floor | 11/28/2023 | 130,000 | 130,000 | ||||||||||
| Real Alloy Holding, Inc.(a)(b)(c)(d)(e)(j) | 10.000% | 01/15/2019 | 77,000 | – | ||||||||||
| Specialty Steel Holdco, Inc.(a)(c)(d)(e)(h) | 11.620% | 11/15/2022 | 210,000 | 210,000 | ||||||||||
| Total Materials | 790,481 | |||||||||||||
| Utilities (1.23%) | ||||||||||||||
| Calpine Corp. | 5.750% | 01/15/2025 | 150,000 | 133,313 | ||||||||||
| Total Utilities | 133,313 | |||||||||||||
See Notes to Financial Statements.
| Annual Report | September 30, 2018 | 9 |
| DDJ Opportunistic High Yield Fund | Portfolio of Investments |
September 30, 2018
| Value (Note 2) | ||||
| TOTAL HIGH YIELD BONDS AND NOTES (Cost $6,527,991) | $ | 6,221,474 | ||
| Shares | Value (Note 2) | |||||||
| WARRANT (0.18%) | ||||||||
| Industrials (0.18%) | ||||||||
| Material Sciences Corp., Strike Price: $0.01, Expires 12/22/2036(a)(b)(c)(d)(e) | 5,549 | 19,532 | ||||||
| TOTAL WARRANT (Cost $9,863) | 19,532 | |||||||
| TOTAL INVESTMENTS (95.66%) (Cost $10,474,498) | $ | 10,347,199 | ||||||
| Other Assets In Excess Of Liabilities (4.34%) | 469,364 | |||||||
| NET ASSETS (100.00%) | $ | 10,816,563 | ||||||
| (a) | As a result of the use of significant unobservable inputs to determine fair value, these investments have been classified as Level 3 assets. See also note 2 to the financial statements for additional information. |
| (b) | Non-income producing security. |
| (c) | Security deemed to be restricted as of September 30, 2018. As of September 30, 2018, the market value of restricted securities in the aggregate was $946,528, representing 8.75% of the Fund’s net assets. Additional information on restricted securities can be found in Note 2. Significant Accounting Policies. |
| (d) | Fair valued security under the procedures approved by the Fund’s Board of Trustees. |
| (e) | Security deemed to be illiquid under the procedures approved by the Fund’s Board of Trustees. As of September 30, 2018, the market value of illiquid securities in the aggregate was $1,549,978, representing 14.33% of the Fund’s net assets. |
| (f) | All or a portion of this position has not settled as of September 30, 2018. The interest rate shown represents the stated spread over the London Interbank Offered Rate (“LIBOR” or “L”) or the applicable LIBOR floor; the Fund will not accrue interest until the settlement date, at which point LIBOR will be established. |
| (g) | A portion of these positions were not funded as of September 30, 2018. The Fund had approximately $44,205 in unfunded commitments pursuant to Delayed Draw Term Loan facilities. The Portfolio of Investments records each of these investments as fully funded and accordingly, a corresponding payable for investments purchased has also been recorded which represents the actual unfunded amount on the balance sheet date. |
| (h) | Security exempt from registration under Rule 144A of the Securities Act of 1933. This security may be resold in transactions exempt from registration, normally to qualified institutional buyers. As of September 30, 2018, the market value of securities restricted under Rule 144A in the aggregate was $4,629,398, representing 42.80% of the Fund’s net assets. These securities have been determined to be liquid pursuant to procedures adopted by the Board unless indicated as illiquid as denoted in footnote (e). |
| (i) | Payment in-kind. |
| (j) | Security is currently in default. |
Investment Abbreviations:
LIBOR - London Interbank Offered Rate
PIK - Payment in-kind
LIBOR Rates:
1M US L - 1 Month LIBOR as of September 30, 2018 was 2.26%
3M US L - 3 Month LIBOR as of September 30, 2018 was 2.40%
For Fund compliance purposes, the Fund’s industry classifications refer to any one or more of the industry sub-classifications used by one or more widely recognized market indices or ratings group indices, and/or as defined by Fund’s management. This definition may not apply for purposes of this report, which may combine industry sub-classifications for reporting ease. Industries are shown as a percentage of the Fund’s net assets. (Unaudited)
See Notes to Financial Statements.
| 10 | www.ddjcap.com |
| DDJ Opportunistic High Yield Fund | Statement of Assets and Liabilities |
September 30, 2018
| ASSETS: | ||||
| Investments, at value (Cost $10,474,498) | $ | 10,347,199 | ||
| Cash and cash equivalents | 341,404 | |||
| Receivable for investments sold | 17,615 | |||
| Receivable for shares sold | 10,500 | |||
| Interest receivable | 174,728 | |||
| Receivable due from adviser | 24,072 | |||
| Prepaid expenses | 19,807 | |||
| Total Assets | 10,935,325 | |||
| LIABILITIES: | ||||
| Payable for investments purchased | 63,905 | |||
| Payable for administration and transfer agency fees | 27,324 | |||
| Payable for distribution and services fees | ||||
| Class I | 505 | |||
| Payable for 12b-1 fees | ||||
| Class II | 250 | |||
| Payable for Trustees’ fees and expenses | 5 | |||
| Payable for Chief Compliance Officer fees | 2,500 | |||
| Payable for legal fees | 133 | |||
| Payable for audit and tax fees | 20,000 | |||
| Accrued expenses and other liabilities | 4,140 | |||
| Total Liabilities | 118,762 | |||
| NET ASSETS | $ | 10,816,563 | ||
| NET ASSETS CONSIST OF: | ||||
| Paid-in capital (Note 5) | $ | 11,230,958 | ||
| Total distributable earnings | (414,395 | ) | ||
| NET ASSETS | $ | 10,816,563 | ||
| PRICING OF SHARES | ||||
| Institutional Class: | ||||
| Net Asset Value, offering and redemption price per share | $ | 9.53 | ||
| Net Assets | $ | 8,801,192 | ||
| Shares of beneficial interest outstanding | 923,133 | |||
| Class I: | ||||
| Net Asset Value, offering and redemption price per share | $ | 9.54 | ||
| Net Assets | $ | 722,940 | ||
| Shares of beneficial interest outstanding | 75,765 | |||
| Class II: | ||||
| Net Asset Value, offering and redemption price per share | $ | 9.55 | ||
| Net Assets | $ | 1,292,431 | ||
| Shares of beneficial interest outstanding | 135,301 | |||
| Commitments and Contingencies (Note 8) | ||||
See Notes to Financial Statements.
| Annual Report | September 30, 2018 | 11 |
| DDJ Opportunistic High Yield Fund | Statement of Operations |
For the Year Ended September 30, 2018
| INVESTMENT INCOME: | ||||
| Interest income | $ | 1,019,437 | ||
| Total Investment Income | 1,019,437 | |||
| EXPENSES: | ||||
| Investment advisory fees (Note 6) | 76,839 | |||
| Administrative fees | 161,804 | |||
| Distribution and service fees | ||||
| Class I | 59 | |||
| Class II | 341 | |||
| 12b-1 fees | ||||
| Class II | 1,942 | |||
| Transfer agent fees | 45,252 | |||
| Legal fees | 6,026 | |||
| Audit and tax fees | 20,000 | |||
| Printing fees | 4,052 | |||
| Insurance fees | 300 | |||
| Custody fees | 4,840 | |||
| Trustees’ fees and expenses | 1,137 | |||
| Chief Compliance Officer fees | 22,319 | |||
| State registration fees | 46,873 | |||
| Other expenses | 8,213 | |||
| Total Expenses | 399,997 | |||
| Less fees waived/reimbursed by investment adviser (Note 6) | ||||
| Institutional Class | (234,535 | ) | ||
| Class I | (54,953 | ) | ||
| Class II | (21,371 | ) | ||
| Net Expenses | 89,138 | |||
| NET INVESTMENT INCOME | 930,299 | |||
| REALIZED AND UNREALIZED GAIN/(LOSS) ON INVESTMENTS: | ||||
| Net realized gain(loss) on: | ||||
| Investments | (302,081 | ) | ||
| Net realized gain/(loss) | (302,081 | ) | ||
| Net change in unrealized appreciation/(depreciation) on: | ||||
| Investments | (347,937 | ) | ||
| Net Change | (347,937 | ) | ||
| NET REALIZED AND UNREALIZED LOSS ON INVESTMENTS | (650,018 | ) | ||
| NET INCREASE IN NET ASSETS RESULTING FROM OPERATIONS | $ | 280,281 | ||
See Notes to Financial Statements.
| 12 | www.ddjcap.com |
| DDJ Opportunistic High Yield Fund | Statements of Changes in Net Assets |
| For the Year Ended September 30, 2018 | For the Year Ended September 30, 2017 | |||||||
| OPERATIONS: | ||||||||
| Net investment income | $ | 930,299 | $ | 677,697 | ||||
| Net realized gain/(loss) | (302,081 | ) | 70,887 | |||||
| Net change in unrealized appreciation/(depreciation) | (347,937 | ) | 166,494 | |||||
| Net increase in net assets resulting from operations | 280,281 | 915,078 | ||||||
| DISTRIBUTIONS TO SHAREHOLDERS(a) | ||||||||
| Institutional Class | (720,503 | ) | (681,967 | ) | ||||
| Class I | (210,379 | ) | (68,115 | ) | ||||
| Class II | (67,029 | ) | (12,048 | ) | ||||
| Total distributions | (997,911 | ) | (762,130 | ) | ||||
| BENEFICIAL SHARE TRANSACTIONS (NOTE 5): | ||||||||
| Institutional Class | ||||||||
| Shares sold | 1,590,038 | 80,081 | ||||||
| Dividends reinvested | 664,896 | 671,353 | ||||||
| Shares redeemed | (158,328 | ) | (1,702,459 | ) | ||||
| Net Increase/(Decrease) from beneficial share transactions | 2,096,606 | (951,025 | ) | |||||
| Class I | ||||||||
| Shares sold | 7,730,002 | – | ||||||
| Dividends reinvested | 210,379 | 68,115 | ||||||
| Shares redeemed | (7,688,156 | ) | – | |||||
| Redemption fees | 20 | – | ||||||
| Net Increase from beneficial share transactions | 252,245 | 68,115 | ||||||
| Class II | ||||||||
| Shares sold | 2,121,691 | 81,617 | ||||||
| Dividends reinvested | 67,028 | 12,048 | ||||||
| Shares redeemed | (1,038,479 | ) | (621 | ) | ||||
| Redemption fees | 156 | – | ||||||
| Net Increase from beneficial share transactions | 1,150,396 | 93,044 | ||||||
| Net increase/(decrease) in net assets | 2,781,617 | (636,918 | ) | |||||
| NET ASSETS: | ||||||||
| Beginning of year | 8,034,946 | 8,671,864 | ||||||
| End of year(a) | $ | 10,816,563 | $ | 8,034,946 | ||||
| (a) | For the prior year ended September 30, 2017, Total Distributions consisted of Net Investment Income $682,341, and Net Realized Gains $79,789 and Net Assets included accumulated net investment income of $12,711. |
See Notes to Financial Statements.
| Annual Report | September 30, 2018 | 13 |
| DDJ Opportunistic High Yield Fund | Statement of Cash Flows |
For the Year Ended September 30, 2018
| CASH FLOWS FROM OPERATING ACTIVITIES: | ||||
| Net increase in net assets resulting from operations | $ | 280,281 | ||
| Adjustments to reconcile net increase in net assets from operations to net cash used in operating activities: | ||||
| Purchases of investment securities | (17,886,087 | ) | ||
| Proceeds from disposition of investment securities | 14,844,467 | |||
| Amortization of premium and accretion of discount on investments | (91,456 | ) | ||
| Net realized loss on: | ||||
| Investments | 302,081 | |||
| Net change in unrealized depreciation on: | ||||
| Investments | 347,937 | |||
| (Increase)/Decrease in assets: | ||||
| Receivable for investments sold | 448,061 | |||
| Interest receivable | (69,242 | ) | ||
| Receivable due from adviser | (6,932 | ) | ||
| Prepaid expenses | 1,631 | |||
| Increase/(Decrease) in liabilities: | ||||
| Payable for investments purchased | (665,870 | ) | ||
| Payable for 12b-1 Fees | ||||
| Class II | 210 | |||
| Payable for distribution and service fees | ||||
| Class I | 59 | |||
| Class II | (136 | ) | ||
| Payable for administration and transfer agency fees | 5,135 | |||
| Payable for trustees’ fees and expenses | (39 | ) | ||
| Payable for Chief Compliance Officer fees | 833 | |||
| Payable for legal fees | (3,439 | ) | ||
| Payable for audit and tax fees | – | |||
| Accrued expenses and other liabilities | (363 | ) | ||
| Net cash used in operating activities | (2,492,869 | ) | ||
| CASH FLOWS FROM FINANCING ACTIVITIES: | ||||
| Proceeds from sale of shares | 11,431,231 | |||
| Payment on shares redeemed | (8,884,787 | ) | ||
| Cash distributions paid | (55,608 | ) | ||
| Net cash provided by financing activities | 2,490,836 | |||
| Net Change in cash & cash equivalents | (2,033 | ) | ||
| Cash & cash equivalents, beginning of year | $ | 343,437 | ||
| Cash & cash equivalents, end of year | $ | 341,404 | ||
| Non-cash financing activities not included herein consist of reinvestment of distributions of: | $ | 942,303 | ||
See Notes to Financial Statements.
| 14 | www.ddjcap.com |
| DDJ Opportunistic High Yield Fund | Financial Highlights |
| Institutional Class | For a Share Outstanding Throughout the Periods Presented |
| For the Year Ended September 30, 2018 | For the Year Ended September 30, 2017 | For the Year Ended September 30, 2016 | For the Period Ended September 30, 2015(a) | |||||||||||||
| NET ASSET VALUE, BEGINNING OF PERIOD | $ | 10.04 | $ | 9.84 | $ | 9.76 | $ | 10.00 | ||||||||
| INCOME/(LOSS) FROM INVESTMENT OPERATIONS: | ||||||||||||||||
| Net investment income(b) | 0.84 | 0.87 | 0.72 | 0.08 | ||||||||||||
| Net realized and unrealized gain/(loss) on investments | (0.43 | ) | 0.33 | 0.06 | (0.26 | ) | ||||||||||
| Total from investment operations | 0.41 | 1.20 | 0.78 | (0.18 | ) | |||||||||||
| LESS DISTRIBUTIONS: | ||||||||||||||||
| From net investment income | (0.82 | ) | (0.89 | ) | (0.70 | ) | (0.06 | ) | ||||||||
| From net realized gains | (0.10 | ) | (0.11 | ) | – | – | ||||||||||
| Total distributions | (0.92 | ) | (1.00 | ) | (0.70 | ) | (0.06 | ) | ||||||||
| NET INCREASE/(DECREASE) IN NET ASSET VALUE | (0.51 | ) | 0.20 | 0.08 | (0.24 | ) | ||||||||||
| NET ASSET VALUE, END OF PERIOD | $ | 9.53 | $ | 10.04 | $ | 9.84 | $ | 9.76 | ||||||||
| TOTAL RETURN(c) | 4.26 | % | 12.73 | % | 8.41 | % | (1.77 | )% | ||||||||
| SUPPLEMENTAL DATA: | ||||||||||||||||
| Net assets, end of period (000s) | $ | 8,801 | $ | 7,101 | $ | 7,916 | $ | 2,968 | ||||||||
| RATIOS TO AVERAGE NET ASSETS | ||||||||||||||||
| Operating expenses excluding reimbursement/waiver | 3.81 | % | 4.61 | % | 5.19 | % | 14.66 | %(d) | ||||||||
| Operating expenses including reimbursement/waiver | 0.79 | % | 0.79 | % | 0.79 | % | 0.79 | %(d) | ||||||||
| Net investment income – including reimbursement/waiver | 8.56 | % | 8.67 | % | 7.55 | % | 3.71 | %(d) | ||||||||
| PORTFOLIO TURNOVER RATE(e) | 147 | % | 86 | % | 72 | % | 4 | % | ||||||||
| (a) | Commenced operations on July 17, 2015. |
| (b) | Calculated using the average shares method. |
| (c) | Assumes an initial investment on the business day before the first day of the fiscal period, with all dividends and distributions reinvested in additional shares on the reinvestment date, and redemption at the net asset value calculated on the last business day of the fiscal year. Total returns are for the period indicated and have not been annualized. Total returns would have been lower had certain expenses not been waived during the period. Returns shown do not reflect the deduction of taxes that a shareholder would pay on Fund distributions or the redemption of Fund shares. |
| (d) | Annualized. |
| (e) | Portfolio turnover rate for periods less than one full year have not been annualized. |
| See Notes to Financial Statements. |
| Annual Report | September 30, 2018 | 15 |
| DDJ Opportunistic High Yield Fund | Financial Highlights |
| Class I | For a Share Outstanding Throughout the Periods Presented |
| For the Year Ended September 30, 2018 | For the Year Ended September 30, 2017 | For the Year Ended September 30, 2016 | For the Period Ended September 30, 2015(a) | |||||||||||||
| NET ASSET VALUE, BEGINNING OF PERIOD | $ | 10.04 | $ | 9.84 | $ | 9.76 | $ | 10.00 | ||||||||
| INCOME/(LOSS) FROM INVESTMENT OPERATIONS: | ||||||||||||||||
| Net investment income(b) | 0.81 | 0.86 | 0.73 | 0.07 | ||||||||||||
| Net realized and unrealized gain/(loss) on investments | (0.39 | ) | 0.33 | 0.05 | (0.24 | ) | ||||||||||
| Total from investment operations | 0.42 | 1.19 | 0.78 | (0.17 | ) | |||||||||||
| LESS DISTRIBUTIONS: | ||||||||||||||||
| From net investment income | (0.82 | ) | (0.88 | ) | (0.70 | ) | (0.07 | ) | ||||||||
| From net realized gains | (0.10 | ) | (0.11 | ) | – | – | ||||||||||
| Total distributions | (0.92 | ) | (0.99 | ) | (0.70 | ) | (0.07 | ) | ||||||||
| REDEMPTION FEES ADDED TO PAID-IN CAPITAL (NOTE 5) | 0.00 | (c) | – | – | – | |||||||||||
| NET INCREASE/(DECREASE) IN NET ASSET VALUE | (0.50 | ) | 0.20 | 0.08 | (0.24 | ) | ||||||||||
| NET ASSET VALUE, END OF PERIOD | $ | 9.54 | $ | 10.04 | $ | 9.84 | $ | 9.76 | ||||||||
| TOTAL RETURN(d) | 4.42 | % | 12.63 | % | 8.43 | % | (1.76 | )% | ||||||||
| SUPPLEMENTAL DATA: | ||||||||||||||||
| Net assets, end of period (000s) | $ | 723 | $ | 732 | $ | 650 | $ | 98 | ||||||||
| RATIOS TO AVERAGE NET ASSETS | ||||||||||||||||
| Operating expenses excluding reimbursement/waiver | 3.04 | % | 4.63 | % | 5.10 | % | 14.74 | %(e) | ||||||||
| Operating expenses including reimbursement/waiver | 0.79 | %(f) | 0.80 | %(f) | 0.89 | % | 0.89 | %(e) | ||||||||
| Net investment income – including reimbursement/waiver | 8.29 | % | 8.66 | % | 7.55 | % | 3.47 | %(e) | ||||||||
| PORTFOLIO TURNOVER RATE(g) | 147 | % | 86 | % | 72 | % | 4 | % | ||||||||
| (a) | Commenced operations on July 17, 2015. |
| (b) | Calculated using the average shares method. |
| (c) | Less than $0.005 per share. |
| (d) | Assumes an initial investment on the business day before the first day of the fiscal period, with all dividends and distributions reinvested in additional shares on the reinvestment date, and redemption at the net asset value calculated on the last business day of the fiscal year. Total returns are for the period indicated and have not been annualized. Total returns would have been lower had certain expenses not been waived during the period. Returns shown do not reflect the deduction of taxes that a shareholder would pay on Fund distributions or the redemption of Fund shares. |
| (e) | Annualized. |
| (f) | According to the Fund's shareholder services plan with respect to the Fund's Class I shares, any amount of such payment not paid during the Fund's fiscal year for such services activities shall be reimbursed to the Fund as soon as practical after the end of the fiscal year. Fees were reimbursed to the Fund during the years ended September 30, 2018 and September 30, 2017, in the amounts of 0.10% and 0.09% of average net assets of Class I shares. |
| (g) | Portfolio turnover rate for periods less than one full year have not been annualized. |
| See Notes to Financial Statements. |
| 16 | www.ddjcap.com |
| DDJ Opportunistic High Yield Fund | Financial Highlights |
| Class II | For a Share Outstanding Throughout the Periods Presented |
| For the Year Ended September 30, 2018 | For the Year Ended September 30, 2017 | For the Year Ended September 30, 2016 | For the Period Ended September 30, 2015(a) | |||||||||||||
| NET ASSET VALUE, BEGINNING OF PERIOD | $ | 10.04 | $ | 9.83 | $ | 9.76 | $ | 10.00 | ||||||||
| INCOME/(LOSS) FROM INVESTMENT OPERATIONS: | ||||||||||||||||
| Net investment income(b) | 0.79 | 0.84 | 0.68 | 0.07 | ||||||||||||
| Net realized and unrealized gain/(loss) on investments | (0.41 | ) | 0.32 | 0.06 | (0.25 | ) | ||||||||||
| Total from investment operations | 0.38 | 1.16 | 0.74 | (0.18 | ) | |||||||||||
| LESS DISTRIBUTIONS: | ||||||||||||||||
| From net investment income | (0.77 | ) | (0.84 | ) | (0.67 | ) | (0.06 | ) | ||||||||
| From net realized gains | (0.10 | ) | (0.11 | ) | – | – | ||||||||||
| Total distributions | (0.87 | ) | (0.95 | ) | (0.67 | ) | (0.06 | ) | ||||||||
| REDEMPTION FEES ADDED TO PAID-IN CAPITAL (NOTE 5) | 0.00 | (c) | – | – | – | |||||||||||
| NET INCREASE/(DECREASE) IN NET ASSET VALUE | (0.49 | ) | 0.21 | 0.07 | (0.24 | ) | ||||||||||
| NET ASSET VALUE, END OF PERIOD | $ | 9.55 | $ | 10.04 | $ | 9.83 | $ | 9.76 | ||||||||
| TOTAL RETURN(d) | 3.97 | % | 12.38 | % | 8.06 | % | (1.80 | )% | ||||||||
| SUPPLEMENTAL DATA: | ||||||||||||||||
| Net assets, end of period (000s) | $ | 1,292 | $ | 201 | $ | 106 | $ | 98 | ||||||||
| RATIOS TO AVERAGE NET ASSETS | ||||||||||||||||
| Operating expenses excluding reimbursement/waiver | 3.83 | % | 4.86 | % | 6.18 | % | 14.99 | %(e) | ||||||||
| Operating expenses including reimbursement/waiver | 1.08 | %(f) | 1.05 | %(f) | 1.14 | % | 1.14 | %(e) | ||||||||
| Net investment income – including reimbursement/waiver | 8.16 | % | 8.41 | % | 7.15 | % | 3.22 | %(e) | ||||||||
| PORTFOLIO TURNOVER RATE(g) | 147 | % | 86 | % | 72 | % | 4 | % | ||||||||
| (a) | Commenced operations on July 17, 2015. |
| (b) | Calculated using the average shares method. |
| (c) | Less than $0.005 per share. |
| (d) | Assumes an initial investment on the business day before the first day of the fiscal period, with all dividends and distributions reinvested in additional shares on the reinvestment date, and redemption at the net asset value calculated on the last business day of the fiscal year. Total returns are for the period indicated and have not been annualized. Total returns would have been lower had certain expenses not been waived during the period. Returns shown do not reflect the deduction of taxes that a shareholder would pay on Fund distributions or the redemption of Fund shares. |
| (e) | Annualized. |
| (f) | According to the Fund's shareholder services plan with respect to the Fund's Class II shares, any amount of such payment not paid during the Fund's fiscal year for such services activities shall be reimbursed to the Fund as soon as practical after the end of the fiscal year. Fees were reimbursed to the Fund during the years ended September 30, 2018 and September 30, 2017, in the amounts of 0.06% and 0.09% of average net assets of Class II shares. |
| (g) | Portfolio turnover rate for periods less than one full year have not been annualized. |
| See Notes to Financial Statements. |
| Annual Report | September 30, 2018 | 17 |
| DDJ Opportunistic High Yield Fund | Notes to Financial Statements |
| September 30, 2018 |
1. ORGANIZATION
ALPS Series Trust (the “Trust”), a Delaware statutory trust, is an open-end management investment company registered under the Investment Company Act of 1940, as amended (the “1940 Act”). The Trust consists of multiple separate portfolios or series. This annual report describes the DDJ Opportunistic High Yield Fund (the “Fund”). The Fund is diversified, and it’s primary investment objective is overall total return consisting of a high level of current income together with long-term capital appreciation. The Fund currently offers Class I shares, Class II shares and Institutional Class shares. Each share class has identical rights to earnings, assets and voting privileges, except for class specific expenses and exclusive rights to vote on matters affecting only individual classes. The Board of Trustees (the “Board”) may establish additional funds and classes of shares at any time in the future without shareholder approval.
2. SIGNIFICANT ACCOUNTING POLICIES
The accompanying financial statements were prepared in accordance with accounting principles generally accepted in the United States of America for investment companies (“U.S. GAAP”). The Fund is considered an investment company under U.S. GAAP and follows the accounting and reporting guidance applicable to investment companies in the Financial Accounting Standards Board Accounting Standards Codification Topic 946. The preparation of financial statements in conformity with U.S. GAAP requires management to make certain estimates and assumptions that affect the reported amounts of assets and liabilities and disclosures of contingent assets and liabilities at the date of the financial statements and the reported amounts of revenue and expenses during the period. Actual results could differ from those estimates. The following is a summary of significant accounting policies consistently followed by the Fund in preparation of its financial statements.
Investment Valuation: The Fund generally values its securities based on market prices determined at the close of regular trading on the New York Stock Exchange (“NYSE”), normally 4:00 p.m. Eastern Time, on each day the NYSE is open for trading.
For equity securities and mutual funds that are traded on an exchange, the market price is usually the closing sale or official closing price on that exchange. In the case of equity securities not traded on an exchange, or if such closing prices are not otherwise available, the securities are valued at the mean of the most recent bid and ask prices on such day.
The market price for debt obligations is generally the price supplied by an independent third-party pricing service approved by the Board, which may use a matrix, formula or other objective method that takes into consideration quotations from dealers, market transactions in comparable investments, market indices and yield curves. If vendors are unable to supply a price, or if the price supplied is deemed to be unreliable, the market price may be determined using quotations received from one or more broker-dealers that make a market in the security.
Loans are primarily valued by using a composite loan price from a nationally recognized loan pricing service. The methodology used by the Fund’s nationally recognized loan pricing provider for composite loan prices is to value loans at the mean of the bid and ask prices from one or more third party pricing services or dealers.
Redeemable securities issued by open-end registered investment companies are valued at the investment company’s applicable NAV, with the exception of exchange-traded open-end investment companies, which are priced as equity securities.
When such prices or quotations are not available, or when the Fair Value Committee appointed by the Board believes that they are unreliable, securities may be priced using fair value procedures approved by the Board.
Fair Value Measurements: The Fund discloses the classification of its fair value measurements following a three-tier hierarchy based on the inputs used to measure fair value. Inputs refer broadly to the assumptions that market participants would use in pricing the asset or liability, including assumptions about risk. Inputs may be observable or unobservable. Observable inputs reflect the assumptions market participants would use in pricing the asset or liability that are developed based on market data obtained from sources independent of the reporting entity. Unobservable inputs reflect the reporting entity’s own assumptions about the assumptions market participants would use in pricing the asset or liability that are developed based on the best information available.
| 18 | www.ddjcap.com |
| DDJ Opportunistic High Yield Fund | Notes to Financial Statements |
| September 30, 2018 |
Various inputs are used in determining the value of the Fund’s investments as of the end of the reporting period. When inputs used fall into different levels of the fair value hierarchy, the level in the hierarchy within which the fair value measurement falls is determined based on the lowest level input that is significant to the fair value measurement in its entirety. The designated input levels are not necessarily an indication of the risk or liquidity associated with these investments. These inputs are categorized in the following hierarchy under applicable financial accounting standards:
| Level 1 – | Unadjusted quoted prices in active markets for identical investments, unrestricted assets or liabilities that the Fund has the ability to access at the measurement date; |
| Level 2 – | Quoted prices which are not active, quoted prices for similar assets or liabilities in active markets or inputs other than quoted prices that are observable (either directly or indirectly); and |
| Level 3 – | Significant unobservable prices or inputs (including the Fund’s own assumptions in determining the fair value of investments) where there is little or no market activity for the asset or liability at the measurement date. |
The following is a summary of the inputs used to value the Fund’s investments as of September 30, 2018:
| Investments in Securities at Value | Level 1 - Unadjusted Quoted Prices | Level 2 - Other Significant | Level 3 - Unobservable | Total | ||||||||||||
| Common Stocks | ||||||||||||||||
| Materials | $ | – | $ | – | $ | 376,551 | $ | 376,551 | ||||||||
| Bank Loans | ||||||||||||||||
| Aerospace & Defense | – | 9,625 | – | 9,625 | ||||||||||||
| Communications | – | 91,125 | 180,000 | 271,125 | ||||||||||||
| Consumer, Cyclical | – | – | 453,064 | 453,064 | ||||||||||||
| Consumer, Non-cyclical | – | 345,344 | 1,013,122 | 1,358,466 | ||||||||||||
| Energy | – | 71,618 | – | 71,618 | ||||||||||||
| Financials | – | 372,602 | – | 372,602 | ||||||||||||
| Health Care | – | 69,956 | 96,107 | 166,063 | ||||||||||||
| Industrials | – | 334,697 | – | 334,697 | ||||||||||||
| Materials | – | – | 8,990 | 8,990 | ||||||||||||
| Technology | – | 683,392 | – | 683,392 | ||||||||||||
| High Yield Bonds And Notes | ||||||||||||||||
| Basic Materials | – | 253,669 | – | 253,669 | ||||||||||||
| Communications | – | 839,130 | – | 839,130 | ||||||||||||
| Consumer, Cyclical | – | 568,969 | 102,500 | 671,469 | ||||||||||||
| Consumer, Non-cyclical | – | 1,681,142 | – | 1,681,142 | ||||||||||||
| Energy | – | 343,450 | – | 343,450 | ||||||||||||
| Financials | – | 1,058,575 | – | 1,058,575 | ||||||||||||
| Industrials | – | 342,300 | 107,945 | 450,245 | ||||||||||||
| Materials | – | 450,481 | 340,000 | 790,481 | ||||||||||||
| Utilities | – | 133,313 | – | 133,313 | ||||||||||||
| Warrant | ||||||||||||||||
| Industrials | – | – | 19,532 | 19,532 | ||||||||||||
| TOTAL | $ | – | $ | 7,649,388 | $ | 2,697,811 | $ | 10,347,199 | ||||||||
| Annual Report | September 30, 2018 | 19 |
| DDJ Opportunistic High Yield Fund | Notes to Financial Statements |
| September 30, 2018 |
The Fund recognizes transfers between levels as of the end of the period. For the fiscal year ended September 30, 2018, the Fund did not have any transfers between Level 1 and Level 2 securities. The following is a reconciliation of assets in which Level 3 inputs were used in determining value:
| DDJ Opportunistic High Yield Fund | Common Stocks | Bank Loans | High Yield Bonds And Notes | Warrants | Total | |||||||||||||||
| Balance as of September 30, 2017 | $ | – | $ | 1,543,825 | $ | 243,155 | $ | 7,436 | $ | 1,794,416 | ||||||||||
| Accrued discount/ premium | – | 2,220 | 1,148 | – | 3,368 | |||||||||||||||
| Realized Gain/(Loss) | – | 5,037 | 6,265 | – | 11,302 | |||||||||||||||
| Change in Unrealized Appreciation/(Depreciation) | 139,347 | 10,599 | (14,536 | ) | 12,096 | 147,506 | ||||||||||||||
| Purchases | 237,204 | 458,030 | 556,234 | – | 1,251,468 | |||||||||||||||
| Sales Proceeds | – | (758,102 | ) | (241,821 | ) | – | (999,923 | ) | ||||||||||||
| Transfer into Level 3 | – | 489,674 | – | – | 489,674 | |||||||||||||||
| Transfer out of Level 3 | – | – | – | – | – | |||||||||||||||
| Balance as of September 30, 2018 | $ | 376,551 | $ | 1,751,283 | $ | 550,445 | $ | 19,532 | $ | 2,697,811 | ||||||||||
| Net change in unrealized appreciation/(depreciation) included in the Statement of Operations attributable to Level 3 investments held at September 30, 2018 | $ | 139,347 | $ | (6,181 | ) | $ | (63,356 | ) | $ | 12,096 | $ | 81,906 | ||||||||
Information about Level 3 measurements as of September 30, 2018:
| Asset Class | Market Value | Valuation Technique(s) | Unobservable Input(s)(a) | Value/Range | ||||||||
| Common Stock | $ | 376,551 | Market Analysis, Discounted Cash Flow Analysis | Discount Rate, EBITDA Multiple | 15.8%-16.8%/5.25x-6.5x | |||||||
| Bank Loans | $ | 1,124,779 | Third-Party Vendor Pricing Service | Vendor Quotes | N/A | |||||||
| Bank Loans | $ | 626,504 | Market Analysis | Market Data of Similar Companies | N/A | |||||||
| High Yield Bonds | $ | 550,445 | Market Analysis | Market Data of Similar Companies | N/A | |||||||
| Warrants | $ | 19,532 | Market Analysis, Discounted Cash Flow Analysis | Discount Rate, EBITDA Multiple | 11.9%/6.25x | |||||||
| (a) | A change to the unobservable input may result in a significant change to the value of the investment as follows: |
| Unobservable Input | Impact to Value if Input Increases | Impact to Value if Input Decreases |
| Market Data of Similar Companies | Increase | Decrease |
| Vendor Quotes | Increase | Decrease |
| Discount Rate | Decrease | Increase |
| EBITDA Multiple | Increase | Decrease |
| Intrinsic Value | Increase | Decrease |
Cash & Cash Equivalents: The Fund considers its investment in a Federal Deposit Insurance Corporation ("FDIC") insured interest bearing account to be cash and cash equivalents. Cash and cash equivalents are valued at cost plus any accrued interest. The Fund maintains cash balances, which, at times may exceed federally insured limits. The Fund maintains these balances with a high quality financial institution.
Concentration of Credit Risk: The Fund places its cash with a banking institution, which is insured by FDIC. The FDIC limit is $250,000. At various times throughout the year, the amount on deposit may exceed the FDIC limit and subject the Fund to a credit risk. The Fund does not believe that such deposits are subject to any unusual risk associated with investment activities.
Trust Expenses: Some expenses of the Trust can be directly attributed to the Fund. Expenses that cannot be directly attributed to the Fund are apportioned among all funds in the Trust based on average net assets of each fund, including Trustees’ fees and expenses.
Fund Expenses: Some expenses can be directly attributed to the Fund and are apportioned among the classes based on average net assets of each class.
Class Expenses: Expenses that are specific to a class of shares are charged directly to that share class. Fees provided under the distribution (Rule 12b-1) and/or shareholder service plans for a particular class of the Fund are charged to the operations of such class.
| 20 | www.ddjcap.com |
| DDJ Opportunistic High Yield Fund | Notes to Financial Statements |
September 30, 2018
Federal Income Taxes: The Fund complies with the requirements under Subchapter M of the Internal Revenue Code of 1986, as amended, applicable to regulated investment companies and intends to distribute substantially all of its net taxable income and net capital gains, if any, each year so that it will not be subject to excise tax on undistributed income and gains. The Fund is not subject to income taxes to the extent such distributions are made.
As of and during the fiscal year ended September 30, 2018, the Fund did not have a liability for any unrecognized tax benefits in the accompanying financial statements. The Fund recognizes interest and penalties, if any, related to tax liabilities as income tax expense in the Statement of Operations. The Fund files U.S. federal, state and local income tax returns as required. The Fund’s tax returns are subject to examination by the relevant tax authorities until expiration of the applicable statute of limitations, which is generally three years after the filing of the tax return for federal purposes and four years for most state returns. The Fund’s administrator has analyzed the Fund’s tax positions taken on federal and state income tax returns for all open tax years and has concluded that as of September 30, 2018, no provision for income tax is required in the Fund’s financial statements related to these tax positions.
Investment Transactions and Investment Income: Investment transactions are accounted for on the date the investments are purchased or sold (trade date basis) for financial reporting purposes. Realized gains and losses from investment transactions are reported on an identified cost basis. Interest income, which includes accretion of discounts and amortization of premiums, is accrued and recorded as earned using the effective yield method. Dividend income is recognized on the ex-dividend date, or for certain foreign securities, as soon as information is available to the Fund. All of the realized and unrealized gains and losses and net investment income are allocated daily to each class in proportion to its average daily net assets.
Distributions to Shareholders: The Fund normally pays dividends, if any, monthly, and distributes capital gains, if any, on an annual basis. Income dividend distributions are derived from interest and other income the Fund receives from its investments, including short term capital gains. Long term capital gain distributions are derived from gains realized when the Fund sells a security it has owned for more than one year. The Fund may make additional distributions and dividends at other times if its investment advisor has determined that doing so may be necessary for the Fund to avoid or reduce taxes. Net investment income/(loss) and net realized gain/(loss) may differ for financial statement and tax purposes.
Loan Assignments: The Fund acquires loans via loan assignments. The Fund considers loans acquired via assignment to be investments in debt instruments. When the Fund purchases loans from lenders via assignment, the Fund will acquire direct rights against the borrower on the loan except that under certain circumstances such rights may be more limited than those held by the assigning lender.
Loans and debt instruments are subject to credit risk. Credit risk relates to the ability of the borrower under such fixed income instruments to make interest and principal payments as they become due.
As of September 30, 2018, the Fund held $3,729,642, or 34.48% of the Fund’s net assets, in loans acquired via assignment.
Liquidity Risk: Liquidity risk exists when particular investments are difficult to sell. The Fund may not be able to sell these investments at the best prices or at the value the Fund places on them. In such a market, the value of such investments, and as a result the Fund’s share price, may fall dramatically, even during periods of declining interest rates. Investments that are illiquid or that trade in lower volumes may be more difficult to value. The market for high yield securities in particular may be less liquid than higher quality fixed income securities, and therefore these securities may be harder to value or sell at an acceptable price, especially during times of market volatility or decline.
Restricted securities: Restricted securities are securities that may only be resold upon registration under federal securities laws or in transactions exempt from such registration. In some cases, the issuer of restricted securities has agreed to register such securities for resale, at the issuer’s expense, either upon demand by a fund or in connection with another registered offering of the securities. Many restricted securities may be resold in the secondary market in transactions exempt from registration. Such restricted securities may be determined to be liquid. The Fund will not incur any registration costs upon such resale. The Fund’s restricted securities are valued at the price provided by pricing services or dealers in the secondary market or, if no market prices are available, at the fair value price as determined by the Fund’s Adviser or pursuant to the Fund’s fair value policy, subject to oversight by the Board. The Fund has acquired certain securities, the sale of which is restricted under applicable provisions of the Securities Act of 1933. It is possible that the fair value price may differ significantly from the amount that may ultimately be realized in the near term, and the difference could be material.
| Annual Report | September 30, 2018 | 21 |
| DDJ Opportunistic High Yield Fund | Notes to Financial Statements |
September 30, 2018
The below securities restricted from resale as of September 30, 2018:
| Acquisition Date | Shares or Principal Amount | Amortized Cost | Fair Value | |||||||||||
| Material Sciences Corp. FLT% or PIK 2.00% 01/09/2024 | 7/9/2018 | 107,945 | $ | 107,945 | $ | 107,945 | ||||||||
| Material Sciences Corp., Strike Price: $0.01, Expires 12/22/2036 (Warrants) | 12/22/2016 | 5,549 | $ | 9,863 | $ | 19,532 | ||||||||
| Real Alloy Holding, Inc. (Common Stock) | 5/31/2018 | 3 | $ | 103,329 | $ | 106,203 | ||||||||
| Real Alloy Holding, Inc. 3M US L + 10.00% or PIK L + 12.00%, 1.00% Floor 11/28/2023 | 5/31/2018 | 130,000 | $ | 130,000 | $ | 130,000 | ||||||||
| Real Alloy Holding, Inc. 10.000% 01/15/2019 | 5/31/2018 | 77,000 | $ | 76,995 | $ | 0 | ||||||||
| Sportnet 10.250% 01/15/2025 | 12/27/2017 | 100,000 | $ | 98,614 | $ | 102,500 | ||||||||
| Specialty Steel Holdco, Inc. (Common Stock) | 11/15/2017 | 1 | $ | 133,875 | $ | 270,348 | ||||||||
| Specialty Steel Holdco, Inc. 11.620% 11/15/2022 | 11/15/2017 | 210,000 | $ | 210,000 | $ | 210,000 | ||||||||
Restricted securities under Rule 144A, including the aggregate value and percentage of net assets of the Fund, have been identified in the Portfolio of Investments.
3. TAX BASIS INFORMATION
Tax Basis of Distributions to Shareholders: The character of distributions made during the period from net investment income or net realized gains may differ from its ultimate characterization for federal income tax purposes. Also, due to the timing of dividend distributions, the fiscal year in which amounts are distributed may differ from the fiscal year in which the income or realized gain were recorded by the Fund. The amounts and characteristics of tax basis distributions are estimated at the time of distribution and composition of distributable earnings/(accumulated losses) are finalized at fiscal year-end.
The tax character of distributions paid by the Fund for the fiscal years ended September 30 were as follows:
| Distributions Paid From: | 2018 | 2017 | ||||||
| Ordinary Income | $ | 982,156 | $ | 762,130 | ||||
| Capital Gains | 15,755 | – | ||||||
| Total | $ | 997,911 | $ | 762,130 | ||||
Reclassifications: As of September 30, 2018, there were no permanent reclassifications.
Unrealized Appreciation and Depreciation on Investments: As of September 30, 2018, the aggregate costs of investments, gross unrealized appreciation/(depreciation) and net unrealized appreciation for Federal tax purposes were as follows:
| Gross unrealized appreciation (excess of value over tax cost) | $ | 303,868 | ||
| Gross unrealized depreciation (excess of tax cost over value) | (443,157 | ) | ||
| Net unrealized appreciation | (139,289 | ) | ||
| Cost of investments for income tax purposes | $ | 10,486,488 |
Temporary differences are attributed to wash sales.
Components of Distributable Earnings: As of September 30, 2018, components of distributable earnings were as follows:
| Undistributed ordinary income | $ | 10,565 | ||
| Accumulated capital losses | (285,671 | ) | ||
| Net unrealized depreciation on investments | (139,289 | ) | ||
| Total | $ | (414,395 | ) |
| 22 | www.ddjcap.com |
| DDJ Opportunistic High Yield Fund | Notes to Financial Statements |
September 30, 2018
Capital Losses: The Fund has elected to defer to the twelve month period ending September 30, 2019, capital losses recognized during the period November 1, 2017 to September 30, 2018 in the amount of $285,671. Capital losses arising in the post-October period of the current fiscal year may be deferred to the next fiscal year if the fund elects to defer the recognition of these losses. When this election is made any losses recognized during the period are treated as having occurred on the first day of the next fiscal year separate from and in addition to the application of normal capital loss carryovers as described above.
4. SECURITIES TRANSACTIONS
Purchases and sales of securities, excluding short-term securities, during the fiscal year ended September 30, 2018 were as follows:
| Purchases of Securities | Proceeds from Sales of Securities | |||||||
| $ | 17,886,087 | $ | 14,844,467 | |||||
5. BENEFICIAL SHARE TRANSACTIONS
The capitalization of the Trust consists of an unlimited number of shares of beneficial interest with no par value per share. Holders of the shares of the Fund have one vote for each share held and a proportionate fraction of a vote for each fractional share. All shares issued and outstanding are fully paid and are transferable and redeemable at the option of the shareholder. Shares have no pre-emptive rights. Neither the Fund nor any of its creditors has the right to require shareholders to pay any additional amounts solely because the shareholder owns the shares.
Shares redeemed within 60 days of purchase may incur a 1.00% short-term redemption fee deducted from the redemption amount. For the fiscal year ended September 30, 2018, the redemption fees charged by the Fund, if any, are presented in the Statements of Changes in Net Assets.
Transactions in common shares were as follows:
| For the Year Ended September 30, 2018 | For the Year Ended September 30, 2017 | |||||||
| Institutional Class | ||||||||
| Shares sold | 164,309 | 8,001 | ||||||
| Dividends reinvested | 68,135 | 67,601 | ||||||
| Shares redeemed | (16,270 | ) | (172,889 | ) | ||||
| Net increase/(decrease) in shares outstanding | 216,174 | (97,287 | ) | |||||
| Class I | ||||||||
| Shares sold | 779,553 | – | ||||||
| Dividends reinvested | 21,650 | 6,860 | ||||||
| Shares redeemed | (798,363 | ) | – | |||||
| Net increase in shares outstanding | 2,840 | 6,860 | ||||||
| Class II | ||||||||
| Shares sold | 216,025 | 8,099 | ||||||
| Dividends reinvested | 6,921 | 1,213 | ||||||
| Shares redeemed | (107,689 | ) | (63 | ) | ||||
| Net increase in shares outstanding | 115,257 | 9,248 | ||||||
Control is defined by the 1940 Act as the beneficial ownership, either directly or through one or more controlled companies, of more than 25% of the voting securities of a company. Approximately 80% of the shares outstanding are held by two record shareholders: one is an omnibus account and one is an affiliated account. Share transaction activities of these shareholders could have a material impact on the Fund.
6. MANAGEMENT AND RELATED PARTY TRANSACTIONS
Investment Advisory: DDJ Capital Management, LLC (“DDJ” or the “Adviser”), subject to the authority of the Board, is responsible for the overall management and administration of the Fund’s business affairs. The Adviser manages the investments of the Fund in accordance with the Fund’s investment objective, policies and limitations and investment guidelines established jointly by the Adviser and the Board.
| Annual Report | September 30, 2018 | 23 |
| DDJ Opportunistic High Yield Fund | Notes to Financial Statements |
September 30, 2018
Pursuant to the Investment Advisory Agreement (the “Advisory Agreement”) with the Adviser, the Fund pays the Adviser an annual management fee of 0.70% based on the Fund’s average daily net assets. The management fee is paid on a monthly basis. The Board may extend the Advisory Agreement for additional one-year terms. The Board and the shareholders of the Fund may terminate the Advisory Agreement upon 30 days’ written notice. The Adviser may terminate the Advisory Agreement upon 60 days’ written notice.
Pursuant to a fee waiver letter agreement (the “Fee Waiver Agreement”), the Adviser has contractually agreed to limit the amount of the Fund’s Total Annual Fund Operating Expenses, exclusive of Distribution and Service (12b-1) Fees, Shareholder Servicing expenses, acquired fund fees and expenses, brokerage expenses, interest expenses, taxes and extraordinary expenses, to 0.79% of the Fund’s average daily net assets of each of the Institutional Class, Class I and Class II shares. The Fee Waiver Agreement is in effect through January 31, 2019. The Adviser will be permitted to recover, on a class-by-class basis, expenses it has borne through the Fee Waiver Agreement only to the extent that the Fund's expenses in later periods do not exceed the lesser of: (1) the contractual expense limit in effect at the time the Adviser waives or limits the expenses; or (2) the contractual expense limit in effect at the time the Adviser seeks to recover the expenses; provided, however, that the Fund will not be obligated to reimburse any such expenses borne by the Adviser more than three years after the date on which the fee or expense was waived or limited or assumed and paid by the Adviser, as calculated on a monthly basis. The Adviser may not discontinue this waiver without the approval by the Trust's Board. Fees waived or reimbursed for the fiscal year ended September 30, 2018 are disclosed in the Statement of Operations.
As of September 30, 2018, the balance of recoupable expenses was as follows:
| Expiring in 2019 | Expiring in 2020 | Expiring in 2021 | ||||||||||
| Institutional Class | $ | 319,671 | $ | 267,174 | $ | 234,535 | ||||||
| Class I | 15,385 | 26,613 | 54,953 | |||||||||
| Class II | 5,004 | 4,896 | 21,371 | |||||||||
Such amounts include waived advisory fees (with respect to each of the aforementioned three Classes of the Fund's shares) of $50,807, $2,595 and $694, respectively expiring in 2019; $48,952, $4,857 and $899, respectively expiring in 2020; and $54,305, $17,070 and $5,464, respectively expiring in 2021.
Administrator: ALPS Fund Services, Inc. (“ALPS”) (an affiliate of ALPS Distributors, Inc.) serves as administrator to the Fund. The Fund has agreed to pay expenses incurred in connection with its administrative activities. Pursuant to the Administration, Bookkeeping and Pricing Services Agreement with the Trust, ALPS will provide operational services to the Fund including, but not limited to, fund accounting and fund administration, and will generally assist in the Fund’s operations. The Fund’s administration fee is accrued on a daily basis and paid monthly. The officers and an Interested Trustee of the Trust are employees of ALPS. Administration fees paid by the Fund for the fiscal year ended September 30, 2018 are disclosed in the Statement of Operations.
ALPS is reimbursed by the Fund for certain out of pocket expenses.
Transfer Agent: ALPS serves as transfer agent for the Fund under a Transfer Agency and Services Agreement with the Trust. Under this agreement, ALPS is paid an annual fee for services performed on behalf of the Fund plus fees for open accounts and is reimbursed for certain out-of-pocket expenses.
Compliance Services: ALPS provides services as the Fund’s Chief Compliance Officer to monitor and test the policies and procedures of the Fund in conjunction with requirements under Rule 38a-1 of the 1940 Act pursuant to a Chief Compliance Officer Services Agreement with the Trust. Under this agreement, ALPS is paid an annual fee for services performed on behalf of the Fund and is reimbursed for certain out-of-pocket expenses.
Distribution: ALPS Distributors, Inc. (the “Distributor”) (an affiliate of ALPS) acts as the principal underwriter of the Fund’s shares pursuant to a Distribution Agreement with the Trust. Shares of the Fund are offered on a continuous basis through the Distributor, as agent of the Fund. The Distributor is not obligated to sell any particular amount of shares and is not entitled to any compensation for its services as the Fund’s principal underwriter pursuant to the Distribution Agreement.
The Fund has adopted a Distribution and Services Plan (the “Plan”) pursuant to Rule 12b-1 of the 1940 Act for its Class II shares. The Plan allows the Fund to use Class II assets to pay fees in connection with the distribution and marketing of Class II shares and/or the provision of shareholder services to Class II shareholders. The Plan permits payment for services in connection with the administration of plans or programs that use Class II shares of the Fund, if any, as their funding medium and for related expenses. The Plan permits the Fund to make total payments at an annual rate of up to 0.25% of the Fund’s average daily net assets attributable to its Class II shares. Because these fees are paid out of the Fund’s Class II assets, if any, on an ongoing basis, over time they will increase the cost of an investment in the Class II shares, if any, and Class II Plan fees may cost an investor more than other types of sales charges. Plan fees are shown as distribution and service fees on the Statement of Operations.
| 24 | www.ddjcap.com |
| DDJ Opportunistic High Yield Fund | Notes to Financial Statements |
September 30, 2018
The Fund has adopted a shareholder services plan (“Shareholder Services Plan”) with respect to the Fund’s Class I and Class II shares. Under the Shareholder Services Plan, the Fund is authorized to pay banks and their affiliates and other institutions, including broker-dealers and Fund affiliates (“Participating Organizations”), an aggregate fee in an amount not to exceed on an annual basis 0.15% of the average daily net asset value of the Class I shares and Class II shares, respectively, attributable to or held in the name of a Participating Organization for its clients as compensation for providing shareholder service activities, which do not include distribution services, pursuant to an agreement with a Participating Organization. Shareholder Services Plan fees are included with distribution and service fees on the Statement of Operations. The Fund's Class I and Class II Shareholder Services Plan fees are currently accruing at 0.10% of the average daily net asset value of each share class, respectively, on an annual basis.
7. TRUSTEES
As of September 30, 2018, there were four Trustees, three of whom are not “interested persons” (as defined in the 1940 Act) of the Trust (the “Independent Trustees”). Effective November 16, 2017, the Independent Trustees of the Trust receive a quarterly retainer of $6,000, plus $4,000 for each regular Board or Committee meeting attended and $2,000 for each special telephonic or in-person Board or Committee meeting attended. Additionally, the Audit Committee Chair receives a quarterly retainer of $1,250 and an Independent Chair receives a quarterly retainer of $2,500. Prior to November 16, 2017, the Independent Trustees received a quarterly retainer of $5,000, plus $4,000 for each regular Board or Committee meeting attended, $2,000 for each special telephonic Board or Committee meeting attended and $2,000 for each special in-person Board meeting attended. The Independent Trustees are also reimbursed for all reasonable out-of-pocket expenses relating to attendance at meetings and for meeting-related expenses. Officers of the Trust and Trustees who are interested persons of the Trust receive no salary or fees from the Trust.
8. COMMITMENTS AND CONTINGENCIES
The Fund may make commitments pursuant to bridge loan facilities. In this case, such commitments typically remain off balance sheet as it is more likely than not, based on the good faith judgement of the Adviser, that such bridge facility will not ever fund. At September 30, 2018, the Fund has $170,000 in bridge facility commitments.
9. INDEMNIFICATIONS
Under the Trust’s organizational documents, its officers and Trustees are indemnified against certain liabilities arising out of the performance of their duties to the Trust. Additionally, in the normal course of business, the Trust enters into contracts with service providers that may contain general indemnification clauses which may permit indemnification to the extent permissible under applicable law. The Trust’s maximum exposure under these arrangements is unknown, as such exposure would involve future claims that may be made against the Trust that have not yet occurred.
10. SUBSEQUENT EVENTS
Subsequent events after the date of the Statements of Assets and Liabilities have been evaluated through the date the financial statements were issued.
On October 4, 2018, the SEC amended Regulation S-X to require certain financial statement disclosure requirements to conform them to US Generally Accepted Accounting Principles for investment companies. Effective November 4, 2018, the Fund adopted disclosure requirement changes for Regulation S-X and these changes are reflected throughout this report. The Fund’s adoption of those amendments, effective with the financial statements prepared as of September 30, 2018, had no effect on the Fund’s net assets or results of operations.
| Annual Report | September 30, 2018 | 25 |
| Report of Independent Registered | |
| DDJ Opportunistic High Yield Fund | Public Accounting Firm |
To the Shareholders of DDJ Opportunistic High Yield Fund and
Board of Trustees of ALPS Series Trust
Opinion on the Financial Statements
We have audited the accompanying statement of assets and liabilities, including the portfolio of investments, of DDJ Opportunistic High Yield Fund (the “Fund”), a series of ALPS Series Trust, as of September 30, 2018, and the related statements of operations and cash flows for the year then ended, and the statements of changes in net assets, including the related notes, and financial highlights for each of the two years in the period then ended (collectively referred to as the “financial statements”). In our opinion, the financial statements present fairly, in all material respects, the financial position of the Fund as of September 30, 2018, the results of its operations and its cash flows for the year then ended, the changes in its net assets and financial highlights for each of the two years in the period then ended, in conformity with accounting principles generally accepted in the United States of America.
The Fund’s financial highlights for the years or periods ended September 30, 2016, and prior, were audited by other auditors whose report dated December 2, 2016, expressed an unqualified opinion on those financial highlights.
Basis for Opinion
These financial statements are the responsibility of the Fund’s management. Our responsibility is to express an opinion on the Fund’s financial statements based on our audits. We are a public accounting firm registered with the Public Company Accounting Oversight Board (United States) (“PCAOB”) and are required to be independent with respect to the Fund in accordance with the U.S. federal securities laws and the applicable rules and regulations of the Securities and Exchange Commission and the PCAOB.
We conducted our audits in accordance with the standards of the PCAOB. Those standards require that we plan and perform the audit to obtain reasonable assurance about whether the financial statements are free of material misstatement, whether due to error or fraud.
Our audits included performing procedures to assess the risks of material misstatement of the financial statements, whether due to error or fraud, and performing procedures that respond to those risks. Such procedures included examining, on a test basis, evidence regarding the amounts and disclosures in the financial statements. Our procedures included confirmation of securities owned as of September 30, 2018, by correspondence with the custodian, agent banks and brokers or by other appropriate auditing procedures where replies from agent banks or brokers were not received. Our audits also included evaluating the accounting principles used and significant estimates made by management, as well as evaluating the overall presentation of the financial statements. We believe that our audits provide a reasonable basis for our opinion.
We have served as the Fund’s auditor since 2017.

COHEN & COMPANY, LTD.
Cleveland, Ohio
November 29, 2018
| 26 | www.ddjcap.com |
| DDJ Opportunistic High Yield Fund | Disclosure Regarding Renewal and Approval of Fund Advisory Agreement |
September 30, 2018 (Unaudited)
On May 24, 2018, the Board of Trustees (the “Board”) of ALPS Series Trust (the “Trust”) met in person to discuss, among other things, the renewal and approval of the Investment Advisory Agreement between the Trust and DDJ Capital Management, LLC (“DDJ Capital”) in accordance with Section 15(c) of the 1940 Act. The Independent Trustees met with independent legal counsel during executive session and discussed the Investment Advisory Agreement and other related materials.
In approving the renewal of the Investment Advisory Agreement with DDJ Capital, the Trustees, including all of the Independent Trustees, considered the following factors with respect to the DDJ Opportunistic High Yield Fund (the “DDJ Fund”):
Investment Advisory Fee Rate: The Trustees reviewed and considered the contractual annual advisory fee paid by the Trust on behalf of the DDJ Fund to DDJ Capital of 0.70% of the Fund’s daily average net assets, in light of the nature, extent and quality of the advisory services provided by DDJ Capital to the DDJ Fund.
The Trustees considered the information they received comparing the DDJ Fund’s contractual annual advisory fee and overall expenses with those of funds in the universe of funds provided by the Data Provider, an independent provider of investment company data (the “Data Provider”). The Data Provider peer group consisted of the DDJ Fund and 8 other high yield bond funds identified by the Data Provider. The Trustees also considered the comparative fee data provided by DDJ Capital.
The Trustees noted that DDJ Capital’s contractual advisory fee of 0.70% was above the Data Provider peer group median of 0.64%, and that the DDJ Fund’s Institutional Class total net expense of 0.79% (after fee waiver and expense reimbursement) was above the Data Provider peer group median of 0.75%. They discussed the extensive research efforts of DDJ to source investment opportunities for the Fund, focusing on bottom-up, fundamental analysis, with internal analysts assigned to specific sectors.
Nature, Extent and Quality of the Services under the Investment Advisory Agreement: The Trustees received and considered information regarding the nature, extent and quality of services provided to the DDJ Fund under the Investment Advisory Agreement with DDJ Capital. The Trustees reviewed information supplied by DDJ Capital in its presentation, including its Form ADV.
The Trustees reviewed and considered DDJ Capital’s investment advisory personnel, its history as an asset manager, and its experience with other accounts. The Trustees also reviewed the research and decision-making processes utilized by DDJ Capital, including the methods adopted to seek to achieve compliance with the investment objective, policies and restrictions of the DDJ Fund.
The Trustees considered the background and experience of DDJ Capital’s management in connection with the DDJ Fund, including reviewing the qualifications, background and responsibilities of the portfolio manager primarily responsible for the day-to-day portfolio management of the DDJ Fund, and the extent of the resources devoted to research and analysis of actual and potential investments. They considered the Trust’s experience with DDJ Capital, including DDJ Capital’s responsiveness and compliance record, as well as the firm’s internal legal team that evaluates the structural aspects of the fixed income instruments in which the Fund invests. The Trustees also considered DDJ Capital’s reputation generally and its investment techniques, strategies, risk management controls and decision-making processes.
Performance: The Trustees reviewed performance information for the DDJ Fund’s Class I, Class II and Institutional Class shares for the one-year and three-month periods ended March 31, 2018, as well as the since-inception performance (July 16, 2015) through March 31, 2018. The review included a comparison of the DDJ Fund’s performance to the performance of a peer group of comparable funds, as identified by a third-party data provider. The Trustees noted in particular that for the since inception period ended March 31, 2018, the performance of the DDJ Fund’s Class I and Class II each ranked second in its peer group, and the performance of the DDJ Fund’s Institutional Class ranked first in its peer group. The Trustees noted DDJ’s observation that reasonable interest payments combined with some price appreciation and low default rates had resulted in favorable returns.
The Adviser’s Profitability: The Trustees received and considered an estimated profitability analysis prepared by DDJ Capital based on the fees paid (and to be paid) under the Investment Advisory Agreement. The Trustees considered the profits, if any, anticipated to be realized by DDJ Capital in connection with the operation of the DDJ Fund, noting that DDJ Capital had not yet earned a profit from managing the DDJ Fund. The Trustees then reviewed and discussed DDJ Capital’s financial statements in order to analyze the financial condition and stability and profitability of DDJ Capital.
Economies of Scale: The Trustees considered whether economies of scale in the provision of services to the DDJ Fund would be passed along to the shareholders under the Investment Advisory Agreement. However, economies of scale were not anticipated at projected DDJ Fund asset levels in the near term.
Other Benefits to the Adviser: The Trustees reviewed and considered any other incidental benefits derived or to be derived by DDJ Capital from its relationship with the DDJ Fund. They noted that, because the DDJ Fund is pursuing an investment strategy that is primarily fixed income in nature, rather than equity oriented, soft dollars were not a material consideration.
| Annual Report | September 30, 2018 | 27 |
| Disclosure Regarding Renewal and | |
| DDJ Opportunistic High Yield Fund | Approval of Fund Advisory Agreement |
September 30, 2018 (Unaudited)
The Board summarized its deliberations with respect to the Investment Advisory Agreement with DDJ Capital. In evaluating DDJ Capital and the fees charged under the Investment Advisory Agreement, the Trustees concluded that no single factor reviewed by the Trustees was identified by the Trustees to be determinative as the principal factor in whether to approve the Investment Advisory Agreement. Further, the Independent Trustees were advised by independent legal counsel throughout the process. The Trustees, including all of the Independent Trustees, concluded that:
| ● | the contractual annual advisory fees of 0.70% of the DDJ Fund’s daily average net assets were not unreasonable; |
| ● | the terms of the fee waiver/expense reimbursement letter agreement between the Trust, on behalf of the DDJ Fund, and DDJ Capital, were reasonable; |
| ● | the nature, extent and quality of services rendered by DDJ Capital under the Investment Advisory Agreement were adequate; |
| ● | the performance for the DDJ Fund was acceptable; |
| ● | the estimated profitability of DDJ Capital in connection with the management of the DDJ Fund was not unreasonable; and |
| ● | there were no material economies of scale or other material incidental benefits accruing to DDJ Capital in connection with its relationship with the DDJ Fund. |
Based on the Trustees’ deliberations and their evaluation of the information described above, the Trustees, including all of the Independent Trustees, concluded that renewal of the Investment Advisory Agreement with DDJ Capital was consistent with the best interests of the DDJ Fund and its shareholders.
| 28 | www.ddjcap.com |
| DDJ Opportunistic High Yield Fund | Additional Information |
September 30, 2018 (Unaudited)
1. PROXY VOTING POLICIES AND VOTING RECORD
A description of the policies and procedures that the Fund uses to determine how to vote proxies relating to portfolio securities is available without charge, upon request, (i) by calling the Fund (toll-free) at 1-844-363-4898 or (ii) on the website of the Securities and Exchange Commission (the “SEC”) at http://www.sec.gov.
Information regarding how the Fund voted proxies relating to portfolio securities during the most recent 12-month period ended June 30 is available (i) without charge, upon request, by calling the Fund (toll-free) at 1-844-363-4898 or (ii) on the SEC’s website at http://www.sec.gov.
2. PORTFOLIO HOLDINGS
The Fund files its complete schedule of portfolio holdings with the SEC for the first and third quarters of each fiscal year on Form N-Q. The Fund’s Forms N-Q are available on the SEC website at http://www.sec.gov. The Fund’s Forms N-Q may be reviewed and copied at the SEC’s Public Reference Room in Washington, D.C., and information on the operation of the Public Reference Room may be obtained by calling 1-800-SEC-0330.
3. TAX DESIGNATIONS
Pursuant to Section 852(b)(3) of the Internal Revenue Code, the DDJ Opportunistic High Yield Fund designated $15,755 as long-term capital gain dividends.
| Annual Report | September 30, 2018 | 29 |
| DDJ Opportunistic High Yield Fund | Privacy Policy |
September 30, 2018 (Unaudited)
| FACTS | WHAT DOES THE FUND DO WITH YOUR PERSONAL INFORMATION? |
| WHY? | Financial companies choose how they share your personal information. Federal law gives consumers the right to limit some but not all sharing. Federal law also requires us to tell you how we collect, share and protect your personal information. Please read this notice carefully to understand what we do. |
| WHAT? | The types of personal information we collect and share depend on the product or service you have with us. This information can include: |
● Social Security number and account transactions ● Account balances and transaction history ● Wire transfer instructions | |
| HOW? | All financial companies need to share customers’ personal information to run their everyday business. In the section below, we list the reasons financial companies can share their customers’ personal information, the reasons a Fund chooses to share, and whether you can limit this sharing. |
REASONS WE CAN SHARE YOUR PERSONAL INFORMATION | DOES THE FUND SHARE? | CAN YOU LIMIT THIS SHARING? |
For our everyday business purposes – such as to process your transactions, maintain your account(s), respond to court orders and legal investigations, or report to credit bureaus | Yes | No |
For our marketing purposes – to offer our products and services to you | No | We do not share. |
| For joint marketing with other financial companies | No | We do not share. |
For our affiliates’ everyday business purposes – information about your transactions and experiences | Yes | No |
For our affiliates’ everyday business purposes – information about your creditworthiness | No | We do not share. |
| For non-affiliates to market to you | No | We do not share. |
| QUESTIONS? | Call 1-844-363-4898 or go to www.ddjfunds.com. |
| 30 | www.ddjcap.com |
| DDJ Opportunistic High Yield Fund | Privacy Policy |
September 30, 2018 (Unaudited)
| WHO WE ARE | |
| Who is providing this notice? | DDJ Opportunistic High Yield Fund (the “Fund”) |
| WHAT WE DO | |
How does the Fund protect my personal information? | To protect your personal information from unauthorized access and use, we use security measures that comply with federal law. These measures include computer safeguards and secured files and buildings. |
How does the Fund collect my personal information? | We collect your personal information, for example, when you
● open an account ● provide account information or give us your contact information ● make a wire transfer or deposit money |
| Why can’t I limit all sharing? | Federal law gives you the right to limit only
● sharing for affiliates’ everyday business purposes-information about your creditworthiness ● affiliates from using your information to market to you ● sharing for non-affiliates to market to you
State laws and individual companies may give you additional rights to limit sharing. |
| DEFINITIONS | |
| Affiliates | Companies related by common ownership or control. They can be financial and nonfinancial companies. |
| Non-affiliates | Companies not related by common ownership or control. They can be financial and nonfinancial companies.
● The Fund does not share with non-affiliates so they can market to you. |
| Joint marketing | A formal agreement between non-affiliated financial companies that together market financial products or services to you.
● The Fund does not jointly market. |
| OTHER IMPORTANT INFORMATION | |
| California Residents | If your account has a California home address, your personal information will not be disclosed to nonaffiliated third parties except as permitted by applicable California law, and we will limit sharing such personal information with our affiliates to comply with California privacy laws that apply to us. |
| Vermont Residents | The State of Vermont requires financial institutions to obtain your consent prior to sharing personal information that they collect about you with affiliated companies and nonaffiliated third parties other than in certain limited circumstances. Except as permitted by law, we will not share personal information we collect about you with nonaffiliated third parties or other affiliated companies unless you provide us with your written consent to share such information. |
| Annual Report | September 30, 2018 | 31 |
| DDJ Opportunistic High Yield Fund | Trustees & Officers |
September 30, 2018 (Unaudited)
INDEPENDENT TRUSTEES
| Name, Birth Year & Address* | Position(s) Held with Fund | Term of Office and Length of Time Served** | Principal Occupation(s) During Past 5 Years*** | Number of Funds in Fund Complex Overseen by Trustee**** | Other Directorships Held by Trustee During Past 5 Years*** |
| Ward D. Armstrong, Birth year: 1954 | Trustee and Chairman | Mr. Armstrong was appointed to the Board on May 27, 2016. Mr. Armstrong was appointed Chairman of the Board at the August 24, 2017 meeting of the Board of Trustees. | Retired; Managing Partner, NorthRock Partners, LLC (October 2013 to July 2015); Managing Director, NorthRock Partners, a Private Wealth Advisory Practice of Ameriprise Financial (February 2010 to October 2013); Senior Vice President, Ameriprise Financial, Inc. (November 1984 to May 2007); President, American Express Asset Management (2002 to 2004); and Chairman, Ameriprise Trust Company (November 1996 to May 2007). | 12 | Mr. Armstrong is a Director of the Heartland Group, Inc. (5 funds). |
| J. Wayne Hutchens, Birth year: 1944 | Trustee | Mr. Hutchens was elected to the Board on October 30, 2012. | Mr. Hutchens is currently retired. From April 2006 to December 2012, he served as President and CEO of the University of Colorado (CU) Foundation and from April 2009 to December 2012, he was Executive Director of the CU Real Estate Foundation. Mr. Hutchens is also Trustee of the Denver Museum of Nature and Science (2000 to present), Director of AMG National Trust Bank (June 2012 to present) and Trustee of Children’s Hospital Colorado (May 2012 to present). Prior to these positions, Mr. Hutchens spent 29 years in the banking industry, retiring as Chairman of Chase Bank Colorado. | 12 | Mr. Hutchens is a Director of RiverNorth Opportunities Fund, Inc. (2013 to present) |
| Patrick Seese, Birth year: 1971 | Trustee | Mr. Seese was elected to the Board on October 30, 2012. | Mr. Seese is an owner and a Managing Director of Integris Partners, a middle-market investment banking firm serving closely-held companies, financial sponsors and public companies (February 2008 to present). Prior to this, Mr. Seese was a Managing Director of Headwaters MB, a middle-market investing banking firm (December 2003 to February 2008). Prior to that, Mr. Seese worked in Credit Suisse First Boston’s Mergers and Acquisitions Group and served as Head of Corporation Development, Katy Industries, a publicly traded industrial and consumer products company and at Deloitte & Touche LLP, where he began his career in 1994. | 12 | Mr. Seese is a Director of The Mile High Five Foundation (2013 to present) and SJ Panthers Foundation (2016 to present) |
| 32 | www.ddjcap.com |
| DDJ Opportunistic High Yield Fund | Trustees & Officers |
September 30, 2018 (Unaudited)
INTERESTED TRUSTEE
| Name, Birth Year & Address* | Position(s) Held with Fund | Term of Office and Length of Time Served** | Principal Occupation(s) During Past 5 Years*** | Number of Funds in Fund Complex Overseen by Trustee**** | Other Directorships Held by Trustee During Past 5 Years*** |
| Jeremy O. May, Birth year: 1970 | Trustee and President | Mr. May was elected Trustee and President on October 30, 2012. Mr. May was Chairman from October 30, 2012 to August 24, 2017. | Mr. May joined ALPS in 1995 and is currently President and Director of ALPS Fund Services, Inc., ALPS Distributors, Inc., and ALPS Portfolio Solutions Distributor, Inc., Executive Vice President and Director of ALPS Holdings, Inc. and ALPS Advisors, Inc. Because of his positions with these entities, Mr. May is deemed an affiliate of the Trust as defined under the 1940 Act. Mr. May is also on the Board of Directors of the University of Colorado Foundation and the AV Hunter Trust. | 12 | Mr. May is Trustee of the Reaves Utility Income Fund (1 fund) and Elevation ETF Trust (1 ETF) and President and Director of RiverNorth Opportunities Fund, Inc. |
| Annual Report | September 30, 2018 | 33 |
| DDJ Opportunistic High Yield Fund | Trustees & Officers |
September 30, 2018 (Unaudited)
OFFICERS
| Name, Birth Year & Address* | Position(s) Held with Fund | Term of Office and Length of Time Served** | Principal Occupation(s) During Past 5 Years*** |
| Kimberly R. Storms, Birth year: 1972 | Treasurer | Ms. Storms was elected Treasurer of the Trust on October 30, 2012. | Ms. Storms is Senior Vice President and Director of Fund Administration of ALPS. Because of her position with ALPS, Ms. Storms is deemed an affiliate of the Trust as defined under the 1940 Act. Ms. Storms is also Treasurer of Financial Investors Trust, Liberty All-Star Equity Fund and Liberty All-Star Growth Fund, Inc. |
| Richard C. Noyes, Birth year: 1970 | Secretary | Mr. Noyes was elected Secretary of the Trust on November 14, 2016. | Mr. Noyes joined ALPS in 2015 and is Senior Vice President and General Counsel of ALPS. Prior to joining ALPS, Mr. Noyes served as Assistant Vice President and Senior Counsel of Janus Capital Management LLC. Mr. Noyes is deemed an affiliate of the Trust as defined under the 1940 Act. |
| Anne M. Berg, Birth year: 1973 | Assistant Secretary | Ms. Berg was elected Assistant Secretary of the Trust on August 23, 2018. | Ms. Berg joined ALPS as Senior Investment Company Act Paralegal in February 2017. Prior to joining ALPS, Anne was a Senior Legal Manager at Janus Capital Group Inc., a global investment manager in Denver, Colorado. Because of her position with ALPS, Ms. Berg is deemed an affiliate of the Trust as defined under the 1940 Act. |
| Alan Gattis,***** Birth year: 1980 | Assistant Treasurer | Mr. Gattis was elected Assistant Treasurer of the Trust on August 9, 2016. | Mr. Gattis joined ALPS in 2011 and is currently Vice President and Fund Controller of ALPS. Prior to joining ALPS, Mr. Gattis was an Auditor at Spicer Jeffries LLP (2009 through 2011) and an Auditor at PricewaterhouseCoopers LLP (2004 - 2009). Because of his position with ALPS, Mr. Gattis is deemed an affiliate of the Trust as defined under the 1940 Act. Mr. Gattis is also Assistant Treasurer of Elevation ETF Trust and Financial Investors Trust. |
| Lucas D. Foss, Birth Year: 1977 | Chief Compliance Officer (“CCO”) | Mr. Foss was elected CCO of the Trust on January 22, 2018. | Mr. Foss joined ALPS in November 2017 as Vice President and Deputy Chief Compliance Officer. Prior to his current role, Mr. Foss served as the Director of Compliance at Transamerica Asset Management (July 2015-November 2017). Deputy Chief Compliance Officer at ALPS (September 2012 – June 2015) Compliance Manager at ALPS (January 2010 - August 2012) and a Senior Compliance Analyst at ALPS (November 2006 – December 2009). Before joining ALPS, Mr. Foss held positions at Bisys Hedge Fund Services and Deutsche Asset Management. Because of his position with ALPS, Mr. Foss is deemed an affiliate of the Trust as defined under the 1940 Act. Mr. Foss is also CCO of Harvest Volatility Edge Trust and Goehring & Rozencwajg Investment Funds. |
| * | All communications to Trustees and Officers may be directed to ALPS Series Trust c/o 1290 Broadway, Suite 1100, Denver, CO 80203. |
| ** | This is the period for which the Trustee or Officer began serving the Trust. Each Trustee serves an indefinite term, until such Trustee’s successor is elected and appointed, or such Trustee resigns or is deceased. Officers are elected on an annual basis. |
| *** | Except as otherwise indicated, each individual has held the office shown or other offices in the same company for the last five years. |
| **** | The Fund Complex currently consists of 12 series of the Trust and any other investment companies for which DDJ Capital Management, LLC provides investment advisory services, currently none. |
| ***** | Mr. Gattis resigned effective November 15, 2018. |
Additional information about members of the Board of Trustees and officers of the Trust is available in the Statement of Additional Information and is available, without charge, upon request, by calling the Fund (toll-free) 1-844-363-4898.
| 34 | www.ddjcap.com |
Intentionally Left Blank

TABLE OF CONTENTS
| Shareholder Letter | 1 |
| Portfolio Update | 6 |
| Disclosure of Fund Expenses | 8 |
| Consolidated Portfolio of Investments | 9 |
| Consolidated Statement of Assets and Liabilities | 19 |
| Consolidated Statement of Operations | 20 |
| Consolidated Statements of Changes in Net Assets | 21 |
| Consolidated Financial Highlights | 22 |
| Notes to Consolidated Financial Statements | 29 |
| Report of Independent Registered Public Accounting Firm | 43 |
| Additional Information | 44 |
| Privacy Policy | 49 |
| Trustees and Officers | 52 |
| Insignia Macro Fund | Shareholder Letter |
September 30, 2018 (Unaudited)
Investment Objective
The Insignia Macro Fund (the “Fund”) is an actively managed, open-end mutual fund that seeks long-term risk-adjusted total returns. The Fund is a combination of distinct global macro/managed futures investment strategies that are globally focused on commodities, currencies, equity indexes and fixed income. Historically, global macro/managed futures have had low correlation to equities and fixed income. Adding uncorrelated investments can potentially increase portfolio diversification in a traditional mix of equity and fixed income investments and can potentially reduce risk and improve returns.
Market Summary
For the fiscal year-ended September 30, 2018, global capital markets climbed higher as market volatility was muted with a few moderate spikes. Investors experienced a spike in volatility in the first quarter of 2018 as interest rates moved higher and resulted in a re-pricing of many risk assets. Investors also experienced short periods of intermittent volatility this year related to trade tensions. Thus far, the U.S equity market has been more resilient in handling trade tensions than other developed and emerging markets around the world. Investors have remained optimistic this year as global growth has been strong and inflation has remained low. The optimism around global growth has overpowered negative undercurrents in markets including escalating trade tensions. The U.S. Federal Reserve (the “Fed”) is gradually shifting towards tighter monetary policy as economic data continues to be strong. Other central banks including the European Central Bank (“ECB”) and the Bank of Japan (“BOJ”) continue to have accommodative monetary policy. The economic data specifically out of Europe this year has been weaker than investors expected which has pushed back ECB tapering expectations into 2019. Overall, global risk assets delivered positive returns during the fiscal year. We believe our managers are well positioned to take advantage of global central banks normalizing policies which could create relative opportunities going forward.
Emerging markets equities have been one of the biggest stories of the year as they have lagged developed markets. The global trade tensions and large currency moves have been unfavorable for emerging markets. Commodities saw a good amount of dispersion over the fiscal year, particularly with most industrial metals down double digits while most energy products were up double digits. In currencies, the U.S. Dollar was very strong against developed and emerging currency pairs as investors have feared the possibility of slowing growth outside of the U.S. as a result of trade tensions.
Fund Overview
The Insignia Macro Fund allocates to managers across a broad spectrum of global macro/managed futures strategies. These managers include traders who employ a quantitative approach, discretionary macro managers whose top-down global economic analysis drives their trading themes and momentum-based trend followers. The Fund’s primary underlying exposures are in very liquid markets including commodities, currencies, equity indexes and fixed income. The Fund’s objective is to profit from directional opportunities seeking returns that are uncorrelated to traditional long-only and other hedged strategies. As such, the Fund is designed to complement investors’ existing investment portfolios. The Fund will typically average between 5-15 managers.
The Fund provides global macro/managed futures exposure through investments in Commodity Trading Advisors (CTAs). We generally invest in three sub-strategies of managers: quantitative, discretionary macro and trend following. As of September 30, 2018, the quantitative, factor-based managers made up 72.66% of the Fund, effectively keeping this sub-strategy allocation steady over the fiscal year. These managers take positions not solely based on price. They may look at economic data and other factors in determining which markets and direction in which they trade. As of September 30, 2018, the discretionary macro managers made up 27.84% of the Fund. These managers take positions based on their proprietary views of global economic activity. As of September 30, 2018, the Fund does not have an allocation to any trend following managers. Outside of equity indexes, there are very few financial securities trending today. We continue to evaluate the current environment and will look to allocate to trend following managers when the environment becomes more favorable.
| Annual Report | September 30, 2018 | 1 |
| Insignia Macro Fund | Shareholder Letter |
September 30, 2018 (Unaudited)
Global Macro/Managed Futures Strategy Exposure
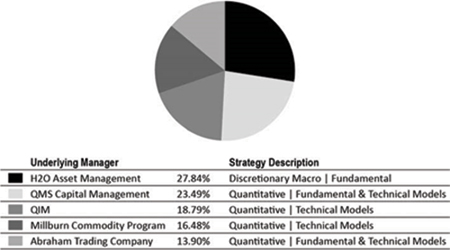
The global macro/managed futures managers selected by Meritage Capital, LLC (the “Adviser”) to gain exposure to the global macro/managed futures managers, sub strategies and programs are subject to change at any time, and any such change may alter the Fund’s access and percentage exposures to each such manager, sub-strategy and program. Although the Fund intends to pursue its global macro/managed futures strategy by investing up to 25% of its total assets in a wholly-owned subsidiary, the Fund may also make global macro/managed futures investments directly, outside of such subsidiary.
Performance Review
For the fiscal year-ended September 30, 2018, the Insignia Macro Fund (I Shares) return was +1.68%. During the same period, the HFRI Macro (Total) Index returned +0.54%. During the period, we terminated one discretionary manager due to portfolio construction with the Fund and two quantitative managers due to organizational and structural concerns. We did not hire any new managers and effectively concentrated the Fund’s allocations across five managers.
Across the Fund, two of the five current managers reported positive performance for the fiscal period. In terms of attribution, the largest contributor to the Fund’s performance was Millburn Commodity Program, returning +17.83% for the fiscal year. A large portion of this gain was attributed to a long position in energy products and short positioning in metals. The largest detractor to the Fund’s performance was Abraham Trading Company, returning -11.71%. Negative attribution for Abraham was derived from long positions in base metals and grains.
| 2 | www.insigniafunds.com |
| Insignia Macro Fund | Shareholder Letter |
September 30, 2018 (Unaudited)
For the Fund in aggregate, gains for the period were driven from energy commodities and currency positions. Additionally, the Fund benefitted from long U.S. interest rate positions. Losses for the period were suffered in positions in European and Asian equities. Despite the challenging market conditions, the Fund controlled volatility well with an annualized standard deviation of 6.48%, which was roughly 2/3 the volatility seen in global equities according to the MSCI ACWI - All Country World Index.
Market Outlook
As of September 30, 2018, the Fund’s composition remains diversified primarily across a complementary roster of quantitative and discretionary macro managers. The Fund has maintained minimal directionality, either long or short, to global equity markets. With muted market volatility we are pleased the Fund delivered positive performance with primary contributors from currency and commodity positions. Losses were derived primarily from long positions in European equities. Looking ahead, we anticipate balancing allocations between the Fund’s three sub-strategies based on changing market conditions.
Global macro/managed futures strategies play a valuable diversification role in strategic asset allocations over the long-term. As volatility returns to global markets, we believe now is an opportune time to evaluate portfolio diversification and increase allocations to these strategies. We believe the Insignia Macro Fund is well-positioned as we look forward to the opportunities that lie ahead across the investment landscape.
We remain focused on our mission of compounding wealth through delivering positive risk-adjusted returns. Thank you for your continuing support and for investing in the Insignia Macro Fund.
Sincerely,

Joe Wade
Chief Investment Officer
Portfolio Manager
| Annual Report | September 30, 2018 | 3 |
| Insignia Macro Fund | Shareholder Letter |
September 30, 2018 (Unaudited)
Advice, articles and commentary included herein do not constitute an opinion and are not intended or written to be used, and they cannot be used, by any taxpayer for the purpose of avoiding penalties that may be imposed on the taxpayer.
Performance may vary based on fees specific to the share class in which you are invested, timing of your investment and high-water marks. More information is available upon request.
The Global Industry Classification Standard (GICS) was developed by and is the exclusive property of MSCI and Standard & Poor’s. “Global Industry Classification Standard (GICS), “GICS” and “GICS Direct” are service marks of Standard & Poor’s and MSCI . “GICS” is a trademark of MSCI and Standard & Poor’s.
BLOOMBERG is a trademark and service mark of Bloomberg Finance L.P.
Definitions of statistics and indices used are below. An investor cannot invest directly into an index.
A Commodity Trading Advisor (CTA) is a US financial regulatory term for an individual or organization who is retained by a fund or individual client to provide advice and services related to trading in futures contracts, commodity options and/or swaps.
Deleveraging is when a company or individual attempts to decrease its total financial leverage. The most direct way for an entity to deleverage is to immediately pay off any existing debt on its balance sheet. If unable to do this, the company or individual may be in a position that increases its risk of default.
Discretionary Macro Strategy deploys directional positions at the asset class level to express a positive or negative top-down view on a market, using a methodology that applies priced-based trend-following algorithms to the trading of futures contracts. Of all of the strategies, discretionary macro provides the most flexibility, including the ability to express either long or short views, across any asset class, and in any region.
MSCI ACWI - All Country World Index is a market capitalization weighted index designed to provide a broad measure of equity-market performance throughout the world. The MSCI ACWI is maintained by Morgan Stanley Capital International (MSCI), and is comprised of stocks from both developed and emerging markets.
Quantitative Strategy uses computer-based models to inform investor decisions on whether to buy or sell securities. This strategy offers de-correlation benefits in that managers are not stock picking and instead relying on a computer’s dispassionate assessment of price and value criteria.
Standard Deviation is the measure of dispersion of a set of data from its mean. It measures the absolute variability of a distribution; the higher the dispersion or variability, the greater is the standard deviation and greater will be the magnitude of the deviation of the value from their mean.
Trend-Following Strategy seeks to capitalize on momentum or price trends across global asset classes by taking either long or short positions as a trend is underway. Price trends are created when investors are slow to act on new information or sell prematurely and hold on to losing investments to long. Price trends continue when investors continue to buy and investment that is going up in price or sell an investment that is going down in price.
Volatility is a statistical measure of the dispersion of returns for a given security or market index. Volatility can either be measured by using the standard deviation or variance between returns from that same security or market index. Commonly, the higher the volatility, the riskier the security.
Diversification does not eliminate the risk of experiencing investment losses.
| 4 | www.insigniafunds.com |
| Insignia Macro Fund | Shareholder Letter |
September 30, 2018 (Unaudited)
The views and information discussed in this commentary are as of the date of publication, are subject to change, and may not reflect the writer’s current views. The views expressed are those of the Fund’s adviser only, and represent an assessment of market conditions at a specific point in time, are opinions only and should not be relied upon as investment advice regarding a particular investment or markets in general. Such information does not constitute a recommendation to buy or sell specific securities or investment vehicles. It should not be assumed that any investment will be profitable or will equal the performance of the fund(s) or any securities or any sectors mentioned in this letter. The subject matter contained in this letter has been derived from several sources believed to be reliable and accurate at the time of compilation. Neither the Fund nor the Adviser accepts any liability for losses either direct or consequential caused by the use of this information.
Not FDIC Insured – No Bank Guarantee – May Lose Value
Past performance does not guarantee future results.
ALPS Distributors, Inc. is not affiliated with Meritage Capital, LLC or Sage Advisory Services, Ltd.
| Annual Report | September 30, 2018 | 5 |
| Insignia Macro Fund | Portfolio Update |
September 30, 2018 (Unaudited)
Average Annual Total Returns (as of September 30, 2018)
| 3 Month | 6 Month | 1 Year | 3 Year | Since Inception* | |
| Insignia Macro Fund - Class A - NAV | 0.31% | 1.68% | 1.61%** | -1.61% | 0.74% |
| Insignia Macro Fund - Class A - LOAD | -5.19% | -3.87% | -4.01%** | -3.45% | -0.45% |
| Insignia Macro Fund - Class I - NAV | 0.31% | 1.68% | 1.68%** | -1.55% | 0.79% |
| HFRI Macro (Total) Index(a) | -0.03% | -0.22% | 0.54% | 0.41% | 1.17% |
| S&P 500® Total Return Index(b) | 7.71% | 11.41% | 17.91% | 17.31% | 12.35% |
The performance data quoted above represents past performance. Past performance is not a guarantee of future results. Investment return and value of the Fund shares will fluctuate so that an investor’s shares, when sold or redeemed, may be worth more or less than their original cost. Performance may be lower or higher than performance data quoted. Fund performance current to the most recent month-end is available by calling (855) 674-4642 or by visiting www.insigniafunds.com.
| * | Fund’s inception date is December 31, 2013. |
| ** | Excludes adjustments in accordance with accounting principles generally accepted in the United States of America and as such, the net asset value and total return for shareholder transactions reported to the market may differ from the net asset value for financial reporting purposes. |
| (a) | The HFR1 Macro (Total) Index is an equally weighted performance index. It uses the HFR database and consists only of macro funds with a minimum of US$50 million AUM or a 12-month track record and that report assets in USD. It is calculated and rebalanced monthly and shown net of all fees and expenses. It is an index comprising investment managers that trade a broad range of strategies in which the investment process is predicated on movements in underlying economic variables and the impact these have on equity, fixed income, hard currency and commodity markets. Managers employ a variety of techniques, both discretionary and systematic analysis, combinations of top down and bottom up theses, quantitative and fundamental approaches and long and short term holding periods. Investors cannot invest directly in an index. |
| (b) | S&P 500® Total Return Index is the Standard & Poor’s composite index of 500 stocks, a widely recognized, unmanaged index of common stock prices. |
Returns of less than 1 year are cumulative.
Indices are not actively managed and do not reflect deduction for fees, expenses or taxes. An investor cannot invest directly in an index.
The returns shown above do not reflect the deduction of taxes a shareholder would pay on Fund distributions or redemption of Fund shares.
Maximum Offering Price (MOP) for Class A shares includes the Fund’s maximum sales charge of 5.50%. Performance shown at NAV does not include these sales charges and would have been lower had it been taken into account. If you invest $1 million or more, either as a lump sum or through the Fund’s accumulation or letter of intent programs, you can purchase Class A shares without an initial sales charge (Load); however, a Contingent Deferred Sales Charge (“CDSC”) of 1.00% may apply to Class A shares redeemed within the first 18 months after a purchase in excess of $1 million. The total annual operating expenses and total annual operating expenses after fee waivers and/or reimbursement you may pay as an investor in the Fund’s Class A and Class I shares (as reported in the January 29, 2018 Prospectus) are 2.20% and 1.95% and 2.00% and 1.75%, respectively. The Fund’s investment adviser has contractually agreed to limit expenses through January 31, 2019.
| 6 | www.insigniafunds.com |
| Insignia Macro Fund | Portfolio Update |
September 30, 2018 (Unaudited)
Performance of $10,000 Initial Investment (as of September 30, 2018)

The graph shown above represents historical performance of a hypothetical investment of $10,000 in the Fund since inception. Past performance does not guarantee future results. All returns reflect reinvested dividends, but do not reflect the deduction of taxes that a shareholder would pay on Fund distributions or the redemption of Fund shares.
Asset Allocation (as a % of Net Assets) *
| Corporate Bond | 45.64% |
| Asset-Backed Securities | 20.07% |
| Collateralized Loan Obligations | 4.85% |
| Government Bond | 2.27% |
| Short Term Security and Other Net Assets | 27.17% |
| Total | 100.00% |
| * | Holdings are subject to change, and may not reflect the current or future position of the portfolio. Tables present indicative values only. |
| Annual Report | September 30, 2018 | 7 |
| Insignia Macro Fund | Disclosure of Fund Expenses |
September 30, 2018 (Unaudited)
Examples. As a shareholder of the Insignia Macro Fund (the “Fund”), you incur two types of costs: (1) transaction costs, including applicable redemption fees; and (2) ongoing costs, including management fees, distribution and service (12b-l) fees and other Fund expenses. The following examples are intended to help you understand your ongoing costs (in dollars) of investing in the Fund and to compare these costs with the ongoing costs of investing in other mutual funds. The examples are based on an investment of $1,000 invested on April 1, 2018 and held through September 30, 2018.
Actual Expenses. The first line under each class in the table below provides information about actual account values and actual expenses. You may use the information in this line, together with the amount you invested, to estimate the expenses that you paid over the period. Simply divide your account value by $1,000 (for example, an $8,600 account value divided by $1,000 = 8.6), then multiply the result by the number in the first line under the heading “Expenses Paid During Period April 1, 2018 – September 30, 2018” to estimate the expenses you paid on your account during this period.
Hypothetical Example for Comparison Purposes. The second line under each class in the table below provides information about hypothetical account values and hypothetical expenses based on the Fund's actual expense ratio and an assumed rate of return of 5% per year before expenses, which is not the Fund's actual return. The hypothetical account values and expenses may not be used to estimate the actual ending account balance or expenses you paid for the period. You may use this information to compare the ongoing costs of investing in the Fund and other mutual funds. To do so, compare this 5% hypothetical example with the 5% hypothetical examples that appear in the shareholder reports of the other funds.
Please note that the expenses shown in the table are meant to highlight your ongoing Fund costs only and do not reflect any transactional costs, such as redemption fees. Therefore, the second line under each class in the table below is useful in comparing ongoing costs only and will not help you determine the relative total costs of owning different funds. In addition, if these transactional costs were included, your costs would have been higher.
| Beginning Account Value April 1, 2018 | Ending Account Value September 30, 2018 | Expense Ratio(a)(b) | Expenses Paid, and During Period April 1, 2018 - September 30, 2018(c) | |
| Class A | ||||
| Actual | $1,000.00 | $1,016.80 | 2.00% | $10.11 |
| Hypothetical (5% return before expenses) | $1,000.00 | $1,015.04 | 2.00% | $10.10 |
| Class 1 | ||||
| Actual | $1,000.00 | $1,016.80 | 1.75% | $8.85 |
| Hypothetical (5% return before expenses) | $1,000.00 | $1,016.29 | 1.75% | $8.85 |
| (a) | The Fund's expense ratios have been annualized based on the Fund's most recent fiscal half-year expenses. |
| (b) | Includes expenses of the Insignia Macro Cayman Fund (wholly-owned subsidiary). |
| (c) | Expenses are equal to the Fund’s annualized expense ratio, multiplied by the average account value over the period, multiplied by the number of days in the most recent fiscal half year (183), divided by 365. |
| 8 | www.insigniafunds.com |
| Insignia Macro Fund | Consolidated Portfolio of Investments |
September 30, 2018
| Principal Amount | Value (Note 2) | |||||||
| ASSET-BACKED SECURITIES (20.07%) | ||||||||
| Automobile (11.22%) | ||||||||
| Ally Master Owner Trust | ||||||||
| Series 2015-2, 1.830% 01/15/2021 | $ | 95,000 | $ | 94,814 | ||||
| CarMax Auto Owner Trust | ||||||||
| Series 2016-2, 1.520% 10/15/2019 | 74,166 | 73,722 | ||||||
| Series 2015-4, 1.560% 05/15/2019 | 149,210 | 148,647 | ||||||
| Ford Credit Auto Owner Trust | ||||||||
| Series 2016-A, 1.390% 07/15/2020 | 67,382 | 67,170 | ||||||
| Series 2014-C, 1.970% 04/15/2020 | 230,000 | 229,650 | ||||||
| Ford Credit Floorplan Master Owner Trust | ||||||||
| Series 2016-5, 1M US L + 0.46% 11/15/2019(a) | 170,000 | 170,625 | ||||||
| Honda Auto Receivables Trust | ||||||||
| Series 2016-4, 1.210% 12/18/2019 | 338,048 | 335,019 | ||||||
| Hyundai Auto Receivables Trust | ||||||||
| Series 2015-B A3, 1.120% 11/15/2019 | 3,918 | 3,915 | ||||||
| Series 2015-C, 1.460% 02/18/2020 | 15,022 | 15,000 | ||||||
| Series 2016-A, 1.560% 09/15/2020 | 214,481 | 213,650 | ||||||
| Series 2017-B, 1.570% 08/17/2020 | 58,326 | 58,130 | ||||||
| Nissan Auto Receivables Owner Trust | ||||||||
| Series 2016-C, 1.180% 11/15/2019 | 122,118 | 121,011 | ||||||
| Series 2016-A, 1.340% 10/15/2020 | 147,765 | 147,041 | ||||||
| Nissan Master Owner Trust Receivables | ||||||||
| Series 2016-A, 1M US L + 0.64% 06/17/2019(a) | 125,000 | 125,440 | ||||||
| Toyota Auto Receivables Owner Trust | ||||||||
| Series 2016-D, 1.230% 10/15/2020 | 370,081 | 367,567 | ||||||
| World Omni Auto Receivables Trust | ||||||||
| Series 2015-B, 1.490% 12/15/2020 | 58,703 | 58,553 | ||||||
| Series 2015-A, 2.040% 01/18/2022 | 100,000 | 99,604 | ||||||
| Total Automobile | 2,329,558 | |||||||
| Credit Card (8.85%) | ||||||||
| Bank of America Credit Card Trust | ||||||||
| Series 2014-Al, 1M US L + 0.38% 01/15/2019(a) | 360,000 | 360,371 | ||||||
| Capital One Multi-Asset Execution Trust | ||||||||
| Series 2016-A3, 1.340% 06/15/2019 | 230,000 | 227,809 | ||||||
| Series 2015-A7, 1.450% 10/15/2018 | 120,000 | 120,106 | ||||||
| Chase Issuance Trust | ||||||||
| Series 2016-A2, 1.370% 06/15/2019 | 420,000 | 416,033 | ||||||
| Citibank Credit Card Issuance Trust | ||||||||
| Series 2017-A2, 1.740% 01/17/2019 | 390,000 | 389,154 | ||||||
| Discover Card Execution Note Trust | ||||||||
| Series 2016-A2, 1M US L + 0.54% 03/15/2019(a) | 155,000 | 155,356 | ||||||
See Notes to Consolidated Financial Statements.
| Annual Report | September 30, 2018 | 9 |
| Insignia Macro Fund | Consolidated Portfolio of Investments |
September 30, 2018
| Principal Amount | Value (Note 2) | |||||||
| Credit Card (continued) | ||||||||
| World Financial Network Credit Card Master Trust | ||||||||
| Series 2012-C, 2.230% 10/15/2018 | $ | 170,000 | $ | 169,986 | ||||
| Total Credit Card | 1,838,815 | |||||||
| TOTAL ASSET-BACKED SECURITIES (Cost $4,174,315) | 4,168,373 | |||||||
| CORPORATE BONDS (45.64%) | ||||||||
| Basic Materials (1.04%) | ||||||||
| Eastman Chemical Co., Sr. Unsec. Notes | ||||||||
| 2.700% 01/15/2020 | 137,000 | 136,317 | ||||||
| Monsanto Co., Sr. Unsec. Notes | ||||||||
| 2.125% 07/15/2019 | 80,000 | 79,542 | ||||||
| Total Basic Materials | 215,859 | |||||||
| Communications (3.17%) | ||||||||
| AT&T, Inc., Sr. Unsec. Notes | ||||||||
| 3M US L + 0.93% 06/30/2020(a) | 455,000 | 459,651 | ||||||
| Warner Media LLC, Sr. Unsec. Notes | ||||||||
| 2.100% 06/01/2019 | 200,000 | 199,001 | ||||||
| Total Communications | 658,652 | |||||||
| Consumer, Cyclical (2.93%) | ||||||||
| Dollar Tree, Inc., Sr. Unsec. Notes | ||||||||
| 3M US L + 0.70% 04/17/2020(a) | 105,000 | 105,168 | ||||||
| General Motors Co., Sr. Unsec. Notes | ||||||||
| 3M US L + 0.80% 08/07/2020(a) | 105,000 | 105,381 | ||||||
| Newell Brands, Inc., Sr. Unsec. Notes | ||||||||
| 2.600% 03/29/2019 | 221,000 | 220,708 | ||||||
| Whirlpool Corp., Sr. Unsec. Notes | ||||||||
| 2.400% 03/01/2019 | 177,000 | 176,705 | ||||||
| Total Consumer, Cyclical | 607,962 | |||||||
| Consumer, Non-cyclical (9.55%) | ||||||||
| Allergan Funding SCS, Sr. Unsec. Notes | ||||||||
| 3M US L + 1.225% 03/12/2020(a) | 395,000 | 400,488 | ||||||
| Becton Dickinson and Co., Sr. Unsec. Notes | ||||||||
| 3M US L + 0.875% 12/29/2020(a) | 130,000 | 130,201 | ||||||
| Constellation Brands, Inc., Sr. Unsec. Notes | ||||||||
| 2.000% 11/07/2019 | 173,000 | 172,353 | ||||||
| CVS Health Corp., Sr. Unsec. Notes | ||||||||
| 3M US L + 0.63% 03/09/2020(a) | 39,000 | 39,209 | ||||||
| Equifax, Inc., Sr. Unsec. Notes | ||||||||
| 3M US L + 0.87% 08/15/2021(a) | 214,000 | 215,365 | ||||||
See Notes to Consolidated Financial Statements.
| 10 | www.insigniafunds.com |
| Insignia Macro Fund | Consolidated Portfolio of Investments |
September 30, 2018
| Principal Amount | Value (Note 2) | |||||||
| Consumer, Non-cyclical (continued) | ||||||||
| Kraft Heinz Foods Co., Sr. Unsec. Notes | ||||||||
| 3M US L + 0.42% 08/09/2019(a) | $ | 200,000 | $ | 200,315 | ||||
| Kroger Co., Sr. Unsec. Notes | ||||||||
| 2.000% 01/15/2019 | 250,000 | 249,462 | ||||||
| Moody's Corp., Sr. Unsec. Notes | ||||||||
| 2.750% 07/15/2019 | 171,000 | 170,974 | ||||||
| Tyson Foods, Inc., Sr. Unsec. Notes | ||||||||
| 3M US L + 0.55% 06/02/2020(a) | 285,000 | 285,917 | ||||||
| Zimmer Biomet Holdings, Inc., Sr. Unsec. Notes | ||||||||
| 3M US L + 0.75% 03/19/2021(a) | 120,000 | 120,119 | ||||||
| Total Consumer, Non-cyclical | 1,984,403 | |||||||
| Energy (2.68%) | ||||||||
| Buckeye Partners LP, Sr. Unsec. Notes | ||||||||
| 2.650% 11/15/2018 | 195,000 | 194,973 | ||||||
| Cenovus Energy, Inc., Sr. Unsec. Notes | ||||||||
| 5.700% 10/15/2019 | 77,000 | 78,830 | ||||||
| Enbridge Energy Partners LP, Sr. Unsec. Notes | ||||||||
| 5.200% 03/15/2020 | 76,000 | 77,899 | ||||||
| EnLink Midstream Partners LP, Sr. Unsec. Notes | ||||||||
| 2.700% 04/01/2019 | 130,000 | 129,593 | ||||||
| Phillips 66, Sr. Unsec. Notes | ||||||||
| 3M US L + 0.60% 02/26/2021(a) | 75,000 | 75,097 | ||||||
| Total Energy | 556,392 | |||||||
| Financial (21.42%) | ||||||||
| American Express Credit Corp., Sr. Unsec. Notes | ||||||||
| Series F, 3M US L+1.05% 09/14/2020(a) | 195,000 | 197,939 | ||||||
| Bank of America Corp., Sr. Unsec. Notes | ||||||||
| 3M US L + 1.00% 04/24/2023(a) | 290,000 | 294,010 | ||||||
| Barclays Bank PLC, Sr. Unsec. Notes | ||||||||
| Series GMTN, 3M US L + 0.55% 08/07/2019(a) | 180,000 | 180,434 | ||||||
| BB&T Corp., Sr. Unsec. Notes | ||||||||
| Series C, 2.250% 02/01/2019 | 175,000 | 174,816 | ||||||
| Branch Banking & Trust Co., Sr. Unsec. Notes | ||||||||
| 3M US L + 0.45% 01/15/2020(a) | 250,000 | 250,961 | ||||||
| Charles Schwab Corp., Sr. Unsec. Notes | ||||||||
| 3M US L + 0.32% 05/21/2021(a) | 115,000 | 115,295 | ||||||
| Citigroup, Inc., Sr. Unsec. Notes | ||||||||
| 3M US L + 1.07% 12/08/2021(a) | 290,000 | 295,201 | ||||||
| Credit Suisse AG, Unsecured | ||||||||
| 5.400% 01/14/2020 | 90,000 | 92,395 | ||||||
| Goldman Sachs Group, Inc., Sr. Unsec. Notes | ||||||||
| Series FRN, 3M US L + 1.77% 02/25/2021(a) | 340,000 | 350,982 | ||||||
See Notes to Consolidated Financial Statements.
| Annual Report | September 30, 2018 | 11 |
| Insignia Macro Fund | Consolidated Portfolio of Investments |
September 30, 2018
| Principal Amount | Value (Note 2) | |||||||
| Financial (continued) | ||||||||
| International Lease Finance Corp., Sr. Unsec. Notes | ||||||||
| 5.875% 04/01/2019 | $ | 145,000 | $ | 147,021 | ||||
| Jefferies Group LLC, Sr. Unsec. Notes | ||||||||
| 8.500% 07/15/2019 | 130,000 | 135,466 | ||||||
| JPMorgan Chase & Co., Sr. Unsec. Notes | ||||||||
| 3M US L + 1.48% 03/01/2021(a) | 455,000 | 467,230 | ||||||
| Nomura Holdings, Inc., Sr. Unsec. Notes | ||||||||
| Series GMTN, 2.750% 03/19/2019 | 195,000 | 195,099 | ||||||
| Senior Housing Properties Trust, Sr. Unsec. Notes | ||||||||
| 3.250% 05/01/2019 | 195,000 | 194,947 | ||||||
| Sumitomo Mitsui Financial Group, Inc., Sr. Unsec. Notes | ||||||||
| 3M US L + 1.68% 03/09/2021(a) | 285,000 | 293,443 | ||||||
| Toronto-Dominion Bank, Sr. Unsec. Notes | ||||||||
| 3M US L + 0.15% 10/24/2019(a) | 245,000 | 245,127 | ||||||
| US Bancorp, Sr. Unsec. Notes | ||||||||
| 3M US L + 0.64% 01/24/2022(a) | 525,000 | 529,849 | ||||||
| Wells Fargo & Co., Sr. Unsec. Notes | ||||||||
| 2.125% 04/22/2019 | 195,000 | 194,400 | ||||||
| Welltower, Inc., Sr. Unsec. Notes | ||||||||
| 4.125% 04/01/2019 | 95,000 | 95,319 | ||||||
| Total Financial | 4,449,934 | |||||||
| Industrial (4.47%) | ||||||||
| Spirit AeroSystems, Inc., Sr. Unsec. Notes | ||||||||
| 3M US L + 0.80% 06/15/2021(a) | 200,000 | 200,452 | ||||||
| United Technologies Corp., Sr. Unsec. Notes | ||||||||
| 3M US L + 0.35% 11/01/2019(a) | 410,000 | 411,117 | ||||||
| Vulcan Materials Co., Sr. Unsec. Notes | ||||||||
| 3M US L + 0.60% 06/15/2020(a) | 210,000 | 210,594 | ||||||
| 3M US L + 0.65% 03/01/2021(a) | 105,000 | 105,424 | ||||||
| Total Industrial | 927,587 | |||||||
| Technology (0.38%) | ||||||||
| Hewlett Packard Enterprise Co., Sr. Unsec. Notes | ||||||||
| 3.600% 10/15/2020 | 78,000 | 78,405 | ||||||
| TOTAL CORPORATE BONDS (Cost $9,440,321) | 9,479,194 | |||||||
| MORTGAGE-BACKED SECURITIES (4.85%) | ||||||||
| Commercial (0.01%) | ||||||||
| COMM Mortgage Trust | ||||||||
| Series 2013-LC13, 3.009% 10/10/2018 | 1,096 | 1,096 | ||||||
See Notes to Consolidated Financial Statements.
| 12 | www.insigniafunds.com |
| Insignia Macro Fund | Consolidated Portfolio of Investments |
September 30, 2018
| Principal Amount | Value (Note 2) | |||||||
| U.S. Government Agency (4.84%) | ||||||||
| Fannie Mae Connecticut Avenue Securities | ||||||||
| Series 2017-C05, IM US L + O.55% 01/25/2030(a) | $ | 203,562 | $ | 203,800 | ||||
| Series 2018-C05, IM US L + 0.72% 01/25/2031(a) | 88,592 | 88,789 | ||||||
| Series 2014-C02, IM US L + 0.95% 05/25/2024(a) | 65,869 | 65,995 | ||||||
| Series 2017-C03, IM US L + 0.95% 10/25/2029(a) | 186,152 | 187,373 | ||||||
| Series 2016-C06, IM US L + 1.30% 04/25/2029(a) | 243,533 | 245,695 | ||||||
| Series 2013-C01, IM US L + 2.00% 10/25/2023(a) | 22,131 | 22,179 | ||||||
| Freddie Mac Structured Agency Credit Risk Debt Notes | ||||||||
| Series 2018-HQA1, IM US L + 0.70% 09/25/2030(a) | 191,335 | 191,801 | ||||||
| Total U.S. Government Agency | 1,005,632 | |||||||
| TOTAL MORTGAGE-BACKED SECURITIES (Cost $1,002,907) | 1,006,728 | |||||||
| U.S. TREASURY NOTES & BONDS (2.27%) | ||||||||
| U.S. Treasury Note, | ||||||||
| 0.875% 04/15/2019 | 475,000 | 471,122 | ||||||
| TOTAL U.S. TREASURY NOTES & BONDS (Cost $471,243) | 471,122 | |||||||
| TOTAL INVESTMENTS (72.83%) (Cost $15,088,786) | $ | 15,125,417 | ||||||
| Other Assets In Excess Of Liabilities (27.17%) | 5,641,603 | (b) | ||||||
| NET ASSETS (100.00%) | $ | 20,767,020 | ||||||
| (a) | Floating or variable rate security. The reference rate is described below. The rate in effect as of September 30, 2018 is based on the reference rate plus the displayed spread as of the security’s last reset date. |
| (b) | Includes cash which is being held as collateral for swap contracts. |
Investment Abbreviations:
LIBOR - London Interbank Offered Rate
LIBOR Rates:
IM US L - 1 Month LIBOR as of September 30, 2018 was 2.26%
3M US L - 3 Month LIBOR as of September 30, 2018 was 2.40%
See Notes to Consolidated Financial Statements.
| Annual Report | September 30, 2018 | 13 |
| Insignia Macro Fund | Consolidated Portfolio of Investments |
September 30, 2018
Common Abbreviations:
GMTN - Global Medium Term Notes.
For Fund compliance purposes, the Fund's industry classifications refer to any one or more of the industry sub-classifications used by one or more widely recognized market indices or ratings group indices, and/or as defined by Fund management. This definition may not apply for purposes of this report, which may combine industry sub-classifications for reporting ease. Industries are shown as a percentage of the Fund's net assets. (Unaudited)
See Notes to Consolidated Financial Statements.
| 14 | www.insigniafunds.com |
| Insignia Macro Fund | Consolidated Portfolio of Investments |
September 30, 2018
TOTAL RETURN SWAP CONTRACTS
Total return swap with Deutsche Bank AG, London Branch. The swap provides exposure to the total returns on a basket of independent managers that is calculated on a daily basis with reference to a customized index that is also proprietary to Deutsche Bank. The basket is comprised of a diversified collection of global macroeconomic and managed futures trading strategies including discretionary and systematic trading programs. Under the terms of the swap, the Adviser has the ability to periodically adjust the notional level of the swap, the allocation to each manager and the mix of trading programs. The swap was effective on March 5, 2014 and has a term of five years unless earlier terminated. Early termination may be triggered by either party. In addition, the swap provides for a 0.50% fee paid to Deutsche Bank in exchange for the return on the custom basket. (Notional Value $17,945,354) (Value $20,966,819)
| Exposure by Manager Underlying Manager | Exposure* | Strategy Description |
| H2O Asset Management | 27.84% | Discretionary Macro | Fundamental |
| QMS Capital Management | 23.49% | Quantitative | Fundamental & Technical Models |
| Quantitative Investment Mgmt. | 18.79% | Quantitative | Technical Models |
| Abraham Trading Company | 13.90% | Quantitative | Fundamental & Technical Models |
| Millburn Ridgefield Corporation | 16.48% | Quantitative | Technical Models |
Custom Index Exposure by Type
| Number of Contracts | Notional Value | Percentage Value | Expiration Date | ||||||||||
| Agricultural Futures | |||||||||||||
| Short | |||||||||||||
| Corn Future | 45.00 | 820,406 | 0.49% | 12/14/2018 | |||||||||
| 45.00 | 820,406 | 0.49% | |||||||||||
| Bond Futures | |||||||||||||
| Long | |||||||||||||
| 10 year Australian | |||||||||||||
| Treasury Bond Future | 7.80 | 5,572,835 | 3.30% | 12/17/2018 | |||||||||
| 10 year Italian | |||||||||||||
| Bond Future | 27.90 | 4,013,765 | 2.38% | 12/6/2018 | |||||||||
| Euro-BOBL Future | 18.30 | 2,779,855 | 1.64% | 12/6/2018 | |||||||||
| Euro-BUND Future | 8.80 | 1,624,035 | 0.96% | 12/6/2018 | |||||||||
| 62.80 | 13,990,490 | 8.28% | |||||||||||
See Notes to Consolidated Financial Statements.
| Annual Report | September 30, 2018 | 15 |
| Insignia Macro Fund | Consolidated Portfolio of Investments |
September 30, 2018
| Number of Contracts | Notional Value | Percentage Value | Expiration Date | |||||||||||
| Short | ||||||||||||||
| 10 year Canadian Govt Bond Future | 32.20 | 3,305,056 | 1.96 | % | 12/18/2018 | |||||||||
| 10 year Japanese Government Bond Future | 2.90 | 3,833,890 | 2.27 | % | 12/13/2018 | |||||||||
| 10 year US Treasury Notes Future | 48.70 | 5,786,169 | 3.42 | % | 12/19/2018 | |||||||||
| 2 year Euro-Schatz Future | 132.80 | 17,250,629 | 10.21 | % | 12/6/2018 | |||||||||
| 3 year Australian Treasury Bond Future | 9.70 | 2,122,024 | 1.26 | % | 12/17/2018 | |||||||||
| 30 year US Treasury Bonds Future | 17.00 | 2,390,625 | 1.41 | % | 12/19/2018 | |||||||||
| 5 year US Treasury Notes Future | 87.20 | 9,808,638 | 5.80 | % | 12/31/2018 | |||||||||
| Long Gilt Future | 23.60 | 3,723,876 | 2.20 | % | 12/27/2018 | |||||||||
| 2 year US Treasury Notes Future | 4.80 | 1,011,450 | 0.60 | % | 12/31/2018 | |||||||||
| Euro-OAT Futures | 4.10 | 719,725 | 0.43 | % | 12/6/2018 | |||||||||
| 363.00 | 49,952,082 | 29.56 | % | |||||||||||
| Energy Futures | ||||||||||||||
| Long | ||||||||||||||
| Light Sweet Crude Oil (WTI) Future | 40.90 | 2,986,927 | 1.77 | % | 11/19/2018 | |||||||||
| Gasoil Monthly Future | 19.70 | 1,424,556 | 0.84 | % | 11/12/2018 | |||||||||
| Gasoline RBOB Future | 15.30 | 1,339,982 | 0.79 | % | 11/30/2018 | |||||||||
| Brent Crude Monthly Future | 13.30 | 1,093,726 | 0.65 | % | 11/30/2018 | |||||||||
| NY Harbour ULSD Future | 10.30 | 969,972 | 0.57 | % | 11/30/2018 | |||||||||
| 99.50 | 7,815,162 | 4.62 | % | |||||||||||
| Short | ||||||||||||||
| Light Sweet Crude Oil (WTI) Future | 36.30 | 2,656,979 | 1.57 | % | 10/22/2018 | |||||||||
| Gasoil Monthly Future | 14.80 | 1,070,040 | 0.63 | % | 10/11/2018 | |||||||||
| Gasoline RBOB Future | 7.30 | 643,553 | 0.38 | % | 10/31/2018 | |||||||||
| Brent Crude Monthly Future | 4.70 | 388,925 | 0.23 | % | 10/31/2018 | |||||||||
| NY Harbour ULSD Future | 8.00 | 752,144 | 0.45 | % | 10/31/2018 | |||||||||
| 71.10 | 5,511,641 | 3.26 | % | |||||||||||
See Notes to Consolidated Financial Statements.
| 16 | www.insigniafunds.com |
| Insignia Macro Fund | Consolidated Portfolio of Investments |
September 30, 2018
| Number of Contracts | Notional Value | Percentage Value | Expiration Date | |||||||||||
| Equity Futures | ||||||||||||||
| Long | ||||||||||||||
| Nikkei 225 Future | 4.90 | 1,041,754 | 0.62 | % | 12/13/2018 | |||||||||
| Nikkei 225 Mini (JPY) Future | 30.40 | 646,447 | 0.38 | % | 12/13/2018 | |||||||||
| TOPIX Future | 7.60 | 1,218,530 | 0.72 | % | 12/13/2018 | |||||||||
| DJ EURO STOXX Banks Future | 259.20 | 1,602,540 | 0.95 | % | 12/21/2018 | |||||||||
| DAX Index Future | 3.30 | 1,175,169 | 0.70 | % | 12/21/2018 | |||||||||
| EURO STOXX 50 Index Future | 29.20 | 1,151,746 | 0.68 | % | 12/21/2018 | |||||||||
| SPI 200 Index | 10.00 | 1,119,347 | 0.66 | % | 12/20/2018 | |||||||||
| FTSE 100 Index Future | 6.70 | 654,819 | 0.39 | % | 12/21/2018 | |||||||||
| 351.30 | 8,610,352 | 5.09 | % | |||||||||||
| Short | ||||||||||||||
| CME E-Mini Russell 2000 Index | 32.50 | 2,769,975 | 1.64 | % | 12/21/2018 | |||||||||
| E-Mini Nasdaq-100 | 21.10 | 3,237,901 | 1.92 | % | 12/21/2018 | |||||||||
| E-Mini S&P 500 | 33.80 | 4,941,983 | 2.92 | % | 12/21/2018 | |||||||||
| Nikkei 225 (JPY) Future | 4.30 | 457,191 | 0.27 | % | 12/13/2018 | |||||||||
| E-mini Dow | 4.50 | 596,543 | 0.35 | % | 12/21/2018 | |||||||||
| 96.20 | 12,003,591 | 7.10 | % | |||||||||||
| FX Futures | ||||||||||||||
| Short | ||||||||||||||
| EUR/USD | 19.90 | 2,908,509 | 1.72 | % | 12/17/2018 | |||||||||
| JPY/USD | 11.00 | 1,217,906 | 0.72 | % | 12/17/2018 | |||||||||
| GBP/USD | 13.60 | 1,112,650 | 0.66 | % | 12/17/2018 | |||||||||
| 44.50 | 5,239,066 | 3.10 | % | |||||||||||
| Interest Rate Futures | ||||||||||||||
| Short | ||||||||||||||
| 3 month Euro (EURIBOR) | 22.40 | 6,519,754 | 3.86 | % | 9/16/2019 | |||||||||
| 3 month Sterling | 43.80 | 7,061,258 | 4.18 | % | 9/18/2019 | |||||||||
| 90 Day Bank Accepted Bill Future | 18.80 | 3,258,776 | 1.93 | % | 3/7/2019 | |||||||||
| Eurodollar | 5.00 | 1,214,500 | 0.72 | % | 3/18/2019 | |||||||||
| Eurodollar | 120.10 | 29,101,731 | 17.22 | % | 9/16/2019 | |||||||||
| Three Month | ||||||||||||||
| Canadian Bankers | ||||||||||||||
| Acceptance Future | 3.80 | 717,277 | 0.42 | % | 3/18/2019 | |||||||||
| 213.90 | 47,873,298 | 28.33 | % | |||||||||||
See Notes to Consolidated Financial Statements.
| Annual Report | September 30, 2018 | 17 |
| Insignia Macro Fund | Consolidated Portfolio of Investments |
September 30, 2018
| Number of Contracts | Notional Value | Percentage Value | Expiration Date | |||||||||||||
| Precious Metal Futures | ||||||||||||||||
| Short | ||||||||||||||||
| Gold | 19.60 | 2,343,082 | 1.39 | % | 12/27/2018 | |||||||||||
| Silver | 8.40 | 617,715 | 0.37 | % | 12/27/2018 | |||||||||||
| 28.00 | 2,960,797 | 1.75 | % | |||||||||||||
| Base Metal Futures | ||||||||||||||||
| Short | ||||||||||||||||
| Copper Future | 5.80 | 407,486 | 0.24 | % | 12/27/2018 | |||||||||||
| 5.80 | 407,486 | 0.24 | % | |||||||||||||
| Unrealized Depreciation | ||||||||||||||||
| $ | (83,834 | ) | ||||||||||||||
See Notes to Consolidated Financial Statements.
| 18 | www.insigniafunds.com |
| Insignia Macro Fund | Consolidated Statement of Assets and Liabilities |
September 30, 2018
| ASSETS: | ||||
| Investments, at value (cost $15,088,786) | $ | 15,125,417 | ||
| Cash and cash equivalents | 1,160,799 | |||
| Deposit with broker for swap contracts (Note 3) | 5,411,574 | |||
| Advance receipt on swap contract | 4,050,000 | |||
| Receivable for investments sold | 186,616 | |||
| Receivable due from adviser | 7,054 | |||
| Receivable from related party | 100,048 | |||
| Interest and dividends receivable | 62,866 | |||
| Prepaid expenses and other assets | 5,625 | |||
| Total Assets | 26,109,999 | |||
| LIABILITIES: | ||||
| Payable for advance payment on swap contract | 4,050,000 | |||
| Payable for swap contract payments | 1,106,241 | |||
| Unrealized depreciation on swap contracts | 83,834 | |||
| Payable for shares redeemed | 34,140 | |||
| Professional fees payable | 24,646 | |||
| Payable for administration fees | 21,693 | |||
| Payable for distribution and service fees | 67 | |||
| Payable to Trustees | 12 | |||
| Payable to Chief Compliance Officer | 2,917 | |||
| Accrued expenses and other liabilities | 19,429 | |||
| Total Liabilities | 5,342,979 | |||
| NET ASSETS | $ | 20,767,020 | ||
| NET ASSETS CONSIST OF: | ||||
| Paid-in capital (Note 7) | $ | 21,097,005 | ||
| Total distributable earnings | (329,985 | ) | ||
| NET ASSETS | $ | 20,767,020 | ||
| PRICING OF SHARES | ||||
| Class A: | ||||
| Net Asset Value, offering and redemption price per share | $ | 9.65 | ||
| Net Assets | $ | 325,657 | ||
| Shares of beneficial interest outstanding | 33,762 | |||
| Maximum offering price per share (NAV/0.945, based on maximum sales charge of 5.50% of the offering price) | $ | 10.21 | ||
| Class I: | ||||
| Net Asset Value, offering and redemption price per share | $ | 9.65 | ||
| Net Assets | $ | 20,441,363 | ||
| Shares of beneficial interest outstanding | 2,117,973 | |||
See Notes to Consolidated Financial Statements.
| Annual Report | September 30, 2018 | 19 |
| Insignia Macro Fund | Consolidated Statement of Operations |
For the Year ended September 30, 2018
| INVESTMENT INCOME: | ||||
| Interest | $ | 449,924 | ||
| Total Investment Income | 449,924 | |||
| EXPENSES: | ||||
| Investment advisory fee (Note 8) | 368,010 | |||
| Administration fee | ||||
| Distribution and service fees | ||||
| Class A | 836 | |||
| Custodian fee | 14,154 | |||
| Legal fees | 13,994 | |||
| Audit and tax fees | 23,000 | |||
| Transfer agent fee | 48,866 | |||
| Trustees fees and expenses | 3,940 | |||
| Registration fees | 33,229 | |||
| Printing fees | 11,232 | |||
| Chief Compliance Officer fee | 32,934 | |||
| Insurance expense | 1,426 | |||
| Other expenses | 10,602 | |||
| Total Expenses | 753,339 | |||
| Less fees (waived)/reimbursed by investment adviser | ||||
| Class A | (2,922 | ) | ||
| Class I | (235,081 | ) | ||
| Total fees (waived)/reimbursed by investment adviser (Note 8) | (238,003 | ) | ||
| Net Expenses | 515,336 | |||
| NET INVESTMENT LOSS | (65,412 | ) | ||
| REALIZED AND UNREALIZED GAIN/(LOSS) ON INVESTMENTS: | ||||
| Net realized gain/(loss) on: | ||||
| Investments | (16,643 | ) | ||
| Swap contracts | (3,626,371 | ) | ||
| Reimbursement from Related Party | 100,048 | |||
| Net realized loss | (3,542,966 | ) | ||
| Change in unrealized appreciation/(depreciation) on: | ||||
| Investments | (10,048 | ) | ||
| Swap contracts | 4,087,360 | |||
| Net change | 4,077,312 | |||
| NET REALIZED AND UNREALIZED GAIN ON INVESTMENTS | 534,346 | |||
| NET INCREASE IN NET ASSETS RESULTING FROM OPERATIONS | $ | 468,934 | ||
See Notes to Consolidated Financial Statements.
| 20 | www.insigniafunds.com |
| Insignia Macro Fund | Consolidated Statements of Changes in Net Assets |
| For the Year Ended September 30, 2018 | For the Year Ended 2017 | |||||||
| OPERATIONS: | ||||||||
| Net investment loss | $ | (65,412 | ) | $ | (385,173 | ) | ||
| Net realized gain/(loss) | (3,542,966 | ) | 650,728 | |||||
| Net change in unrealized appreciation/(depreciation) | 4,077,312 | (1,842,756 | ) | |||||
| Net increase/(decrease) in net assets resulting from operations | 468,934 | (1,577,201 | ) | |||||
| TOTAL DISTRIBUTIONS TO SHAREHOLDERS:(a) | ||||||||
| Class A | (1,449 | ) | (340 | ) | ||||
| Class I | (175,482 | ) | (86,251 | ) | ||||
| Total distributions | (176,931 | ) | (86,591 | ) | ||||
| BENEFICIAL SHARE TRANSACTIONS (Note 7): | ||||||||
| Class A | ||||||||
| Shares sold | 95,078 | 165,735 | ||||||
| Dividends reinvested | 1,033 | 340 | ||||||
| Shares redeemed | (180,091 | ) | (62,945 | ) | ||||
| Redemption fees | 952 | – | ||||||
| Net increase/(decrease) from beneficial share transactions | (83,028 | ) | 103,130 | |||||
| Class I | ||||||||
| Shares sold | 204,522 | 5,031,639 | ||||||
| Dividends reinvested | 160,222 | 5,877 | ||||||
| Shares redeemed | (27,180,015 | ) | (14,600,869 | ) | ||||
| Redemption fees | 114 | 5 | ||||||
| Net decrease from beneficial share transactions | (26,815,157 | ) | (9,563,348 | ) | ||||
| Net decrease in net assets | (26,606,182 | ) | (11,124,010 | ) | ||||
| NET ASSETS: | ||||||||
| Beginning of year | 47,373,202 | 58,497,212 | ||||||
| End of year(a) | $ | 20,767,020 | $ | 47,373,202 | ||||
| (a) | For the prior year ended September 30, 2017, total distributions consisted of Net Investment Income of $(340) for Class A and $(86,251) for Class I and Net Assets included accumulated net investment income of $l74,053. |
See Notes to Consolidated Financial Statements.
| Annual Report | September 30, 2018 | 21 |
| Insignia Macro Fund - Class A | Consolidated Financial Highlights |
For a share outstanding through the periods presented.
| NET ASSET VALUE, BEGINNING OF PERIOD |
| INCOME/(LOSS) FROM OPERATIONS: |
| Net investment loss(b) |
| Net realized and unrealized gain/(loss) on investments and swap contracts |
| Total from investment operations |
| LESS DISTRIBUTIONS: |
| From investment income |
| From net realized gain on investments |
| Total distributions |
| REDEMPTION FEES (Note 7) |
| NET INCREASE/(DECREASE) IN NET ASSET VALUE |
| NET ASSET VALUE, END OF PERIOD |
| TOTAL RETURN(C) |
| SUPPLEMENTAL DATA: |
| Net assets, end of period (in 000s) |
| RATIOS TO AVERAGE NET ASSETS |
| Operating expenses excluding reimbursement/waiver |
| Operating expenses including reimbursement/waiver |
| Net investment loss including reimbursement/waiver |
| PORTFOLIO TURNOVER RATE(h) |
See Notes to Consolidated Financial Statements.
| 22 | www.insigniafunds.com |
| Insignia Macro Fund - Class A | Consolidated Financial Highlights |
For a share outstanding through the periods presented.
For the Year Ended | For the Year Ended September 30, 2017 | For the Year Ended September 30, 2016 | For the Year Ended September 30, 2015 | For the Period | ||||||||||||||
| $ | 9.57 | $ | 9.90 | $ | 10.82 | $ | 10.42 | $ | 10.00 | |||||||||
| (0.04 | ) | (0.09 | ) | (0.13 | ) | (0.16 | ) | (0.08 | ) | |||||||||
| 0.13 | (0.23 | ) | (0.21 | ) | 0.61 | 0.50 | ||||||||||||
| 0.09 | (0.32 | ) | (0.34 | ) | 0.45 | 0.42 | ||||||||||||
| (0.04 | ) | (0.01 | ) | (0.60 | ) | (0.04 | ) | – | ||||||||||
| – | – | – | (0.01 | ) | – | |||||||||||||
| (0.04 | ) | (0.01 | ) | (0.60 | ) | (0.05 | ) | – | ||||||||||
| 0.03 | – | 0.02 | – | – | ||||||||||||||
| 0.08 | (0.33 | ) | (0.92 | ) | 0.40 | 0.42 | ||||||||||||
| $ | 9.65 | $ | 9.57 | $ | 9.90 | $ | 10.82 | $ | 10.42 | |||||||||
| 1.29 | %(d) | (3.25 | %) | (3.12 | %)(e) | 4.34 | % | 4.20 | % | |||||||||
| $ | 326 | $ | 407 | $ | 319 | $ | 274 | $ | 85 | |||||||||
| 2.87 | % | 2.20 | % | 2.20 | % | 2.40 | % | 80.48 | %(f) | |||||||||
| 2.00 | % | 2.00 | % | 2.00 | % | 1.96 | %(g) | 1.75 | %(f) | |||||||||
| (0.42 | %) | (0.95 | %) | (1.26 | %) | (1.44 | %) | (1.03 | %)(f) | |||||||||
| 70 | % | 129 | % | 132 | % | 119 | % | 43 | % | |||||||||
See Notes to Consolidated Financial Statements.
| Annual Report | September 30, 2018 | 23 |
| Insignia Macro Fund - Class A | Consolidated Financial Highlights |
For a share outstanding through the periods presented.
| (a) | Commenced operations on January 2, 2014. |
| (b) | Calculated using the average shares method. |
| (c) | Assumes an initial investment on the business day before the first day of the fiscal period, with all dividends and distributions reinvested in additional shares on the reinvestment date, and redemption at the net asset value calculated on the last business day of the fiscal year. Total returns are for the period indicated and have not been annualized. Total returns would have been lower had certain expenses not been waived during the period. Returns shown do not reflect the deduction of taxes that a shareholder would pay on Fund distributions or the redemption of Fund shares. Returns shown exclude any applicable sales charge. |
| (d) | 0.21% of the Fund's total return consists of a reimbursement by related parties for a valuation correction. Excluding this item, total return would have been 1.08%. |
| (e) | In 2016, the Fund's total return includes a voluntary reimbursement by the adviser for a realized investment loss. Excluding this item, total return would not change as the impact is less than 0.05%. |
| (f) | Annualized. |
| (g) | Contractual expense limitation changed from 1.75% to 2.00% effective February 1, 2015. |
| (h) | Portfolio turnover rate for periods less than one full year have not been annualized. |
See Notes to Consolidated Financial Statements.
| 24 | www.insigniafunds.com |
Page Intentionally Left Blank
| Insignia Macro Fund - Class I | Consolidated Financial Highlights |
For a share outstanding through the periods presented.
| NET ASSET VALUE, BEGINNING OF PERIOD |
| INCOME/(LOSS) FROM OPERATIONS: |
| Net investment loss(b) |
| Net realized and unrealized gain/(loss) on investments and swap contracts |
| Total from investment operations |
| LESS DISTRIBUTIONS: |
| From investment income |
| From net realized gain on investments |
| Total distributions |
| REDEMPTION FEES (Note 7) |
| NET INCREASE/(DECREASE) IN NET ASSET VALUE |
| NET ASSET VALUE, END OF PERIOD |
| TOTAL RETURN(d) |
| SUPPLEMENTAL DATA: |
| Net assets, end of period (in 000s) |
| RATIOS TO AVERAGE NET ASSETS |
| Operating expenses excluding reimbursement/waiver |
| Operating expenses including reimbursement/waiver |
| Net investment loss including reimbursement/waiver |
| PORTFOLIO TURNOVER RATE(1) |
See Notes to Consolidated Financial Statements.
| 26 | www.insigniafunds.com |
| Insignia Macro Fund - Class I | Consolidated Financial Highlights |
For a share outstanding through the periods presented.
| For the Year Ended September 30, 2018 | For the Year Ended September 30, 2017 | For the Year Ended September 30, 2016 | For the Year Ended September 30, 2015 | For the Period Ended September 30, 2014(a) | ||||||||||||||
| $ | 9.58 | $ | 9.90 | $ | 10.82 | $ | 10.42 | $ | 10.00 | |||||||||
| (0.02 | ) | (0.07 | ) | (0.10 | ) | (0.13 | ) | (0.06 | ) | |||||||||
| 0.14 | (0.24 | ) | (0.21 | ) | 0.59 | 0.48 | ||||||||||||
| 0.12 | (0.31 | ) | (0.31 | ) | 0.46 | 0.42 | ||||||||||||
| (0.05 | ) | (0.01 | ) | (0.61 | ) | (0.05 | ) | |||||||||||
| – | – | – | (0.01 | ) | – | |||||||||||||
| (0.05 | ) | (0.01 | ) | (0.61 | ) | (0.06 | ) | – | ||||||||||
| 0.00 | (c) | 0.00 | (c) | 0.00 | (c) | 0.00 | (c) | 0.00 | (c) | |||||||||
| 0.07 | (0.32 | ) | (0.92 | ) | 0.40 | 0.42 | ||||||||||||
| $ | 9.65 | $ | 9.58 | $ | 9.90 | $ | 10.82 | $ | 10.42 | |||||||||
| 1.26 | %(e) | (3.09 | %) | (3.06 | %)(f) | 4.39 | % | 4.20 | % | |||||||||
| $ | 20,441 | $ | 46,966 | $ | 58,178 | $ | 64,252 | $ | 24,017 | |||||||||
| 2.56 | % | 1.95 | % | 1.94 | % | 2.17 | % | 3.62 | %(g) | |||||||||
| 1.75 | % | 1.75 | % | 1.75 | % | 1.69 | %(h) | 1.50 | %(g) | |||||||||
| (0.22 | %) | (0.72 | %) | (1.01 | %) | (1.18 | %) | (0.85 | %)(g) | |||||||||
| 70 | % | 129 | % | 132 | % | 119 | % | 43 | % | |||||||||
See Notes to Consolidated Financial Statements.
| Annual Report | September 30, 2018 | 27 |
| Insignia Macro Fund - Class I | Consolidated Financial Highlights |
For a share outstanding through the periods presented.
| (a) | Commenced operations on January 2, 2014. |
| (b) | Calculated using the average shares method. |
| (c) | Less than $0.005 per share. |
| (d) | Assumes an initial investment on the business day before the first day of the fiscal period, with all dividends and distributions reinvested in additional shares on the reinvestment date, and redemption at the net asset value, calculated on the last business day of the fiscal year. Total returns are for the period indicated and have not been annualized. Total returns would have been lower had certain expenses not been waived during the period. Returns shown do not reflect the deduction of taxes that a shareholder would pay on Fund distributions or the redemption of Fund shares. |
| (e) | 0.31% of the Fund's total return consists of a reimbursement by related parties for a valuation correction. Excluding this item, total return would have been 0.95%. |
| (f) | In 2016, the Fund's total return includes a voluntary reimbursement by the adviser for a realized investment loss. Excluding this item, total return would not change as the impact is less than 0.05%. |
| (g) | Annualized. |
| (h) | Contractual expense limitation changed from 1.50% to 1.75% effective February 1, 2015. |
| (i) | Portfolio turnover rate for periods less than one full year have not been annualized. |
See Notes to Consolidated Financial Statements.
| 28 | www.insigniafunds.com |
| Insignia Macro Fund | Notes to Consolidated Financial Statements |
September 30, 2018
1. ORGANIZATION
ALPS Series Trust (the "Trust"), a Delaware statutory trust, is an open-end management investment company registered under the Investment Company Act of 1940, as amended (the "1940 Act"). The Trust consists of multiple separate portfolios or series. This annual report describes the Insignia Macro Fund (the "Fund"). The Fund's primary investment objective is to seek long-term risk-adjusted total return and is classified as diversified under the 1940 Act. The Fund currently offers Class A shares and Class I shares. Each share class has identical rights to earnings, assets and voting privileges, except for class specific expenses and exclusive rights to vote on matters affecting only individual classes. The Board of Trustees (the "Board") may establish additional funds and classes of shares at any time in the future without shareholder approval.
Basis of Consolidation: Insignia Global Macro Offshore Ltd. (the "Subsidiary"), a Cayman Islands exempted company, was incorporated on September 27, 2013 and is a wholly owned subsidiary of the Fund. The Subsidiary acts as an investment vehicle for the Fund in order to affect certain commodity-related investments on behalf of the Fund. The Fund is the sole shareholder of the Subsidiary, and it is intended that the Fund will remain the sole shareholder and will continue to wholly own and control the Subsidiary. Under the Articles of Association of the Subsidiary, shares issued by the Subsidiary confer upon a shareholder the right to vote at general meetings of the Subsidiary and certain rights in connection with any winding-up or repayment of capital, as well as the right to participate in the profits or assets of the Subsidiary. The Fund may invest up to 25% of its total assets in shares of the Subsidiary. As a wholly owned subsidiary of the Fund, the investments of the Subsidiary are included in the Consolidated Portfolio of Investments, Consolidated Financial Statements and Financial Highlights of the Fund. All investments held by the Subsidiary are disclosed in the accounts of the Fund. All intercompany accounts and transactions have been eliminated in consolidation. The Subsidiary will be subject to the same investment restrictions and limitations, and follow the same compliance policies and procedures, as the Fund when viewed on a consolidation basis. As of September 30, 2018, net assets of the Fund were $20,767,020, of which $4,441,947, or 21.39%, represented the Fund's ownership of all issued shares and voting rights of the Subsidiary. The Fund and the Subsidiary are "commodity pools" under the U.S. Commodity Exchange Act, and Meritage Capital, LLC ("Meritage Capital" or the "Adviser") is a "commodity pool operator" registered with and regulated by the CFTC. In addition, Sage Advisory Services, Ltd. Co. ("Sage" or the "Sub-Advisor") is a "commodity trading adviser" registered and regulated by the CFTC.
2. SIGNIFICANT ACCOUNTING POLICIES
The accompanying consolidated financial statements were prepared in accordance with accounting principles generally accepted in the United States of America for investment companies ("U.S. GAAP"). The Fund is considered an investment company under U.S. GAAP and follows the accounting and reporting guidance applicable to investment companies in the Financial Accounting Standards Board Accounting Standards Codification Topic 946. The preparation of financial statements in conformity with U.S. GAAP requires management to make certain estimates and assumptions that affect the reported amounts of assets and liabilities and disclosures of contingent assets and liabilities at the date of the financial statements and the reported amounts of revenue and expenses during the period. Actual results could differ from those estimates. The following is a summary of significant accounting policies consistently followed by the Fund in preparation of its consolidated financial statements.
| Annual Report | September 30, 2018 | 29 |
| Insignia Macro Fund | Notes to Consolidated Financial Statements |
September 30, 2018
Investment Valuation: The Fund generally values its securities based on market prices determined at the close of regular trading on the New York Stock Exchange ("NYSE"), normally 4:00 p.m. Eastern Time, on each day the NYSE is open for trading.
Over-the-counter swap contracts for which market quotations are readily available are valued based on quotes received from independent pricing services or dealers that make markets in such securities. Total return swap contracts are stated at fair value daily based on the underlying futures, foreign currency, forward currency and options contracts constituting the contracts' stated index, taking into account fees and expenses associated with the swap agreement.
Redeemable securities issued by open-end registered investment companies are valued at the investment company's applicable net asset value with the exception of exchange-traded open-end investment companies, which are priced as equity securities.
The market price for debt obligations is generally the price supplied by an independent third-party pricing service approved by the Board, which may use a matrix, formula or other objective method that takes into consideration quotations from dealers, market transactions in comparable investments, market indices and yield curves. If vendors are unable to supply a price, or if the price supplied is deemed to be unreliable, the market price may be determined using quotations received from one or more broker dealers that make a market in the security.
When such prices or quotations are not available, or when the Fair Value Committee appointed by the Board believes that they are unreliable, securities may be priced using fair value procedures approved by the Board.
Fair Value Measurements: The Fund discloses the classification of its fair value measurements following a three-tier hierarchy based on the inputs used to measure fair value. Inputs refer broadly to the assumptions that market participants would use in pricing the asset or liability, including assumptions about risk. Inputs may be observable or unobservable. Observable inputs reflect the assumptions market participants would use in pricing the asset or liability that are developed based on market data obtained from sources independent of the reporting entity. Unobservable inputs reflect the reporting entity's own assumptions about the assumptions market participants would use in pricing the asset or liability that are developed based on the best information available.
Various inputs are used in determining the value of the Fund's investments as of the end of the reporting period. When inputs used fall into different levels of the fair value hierarchy, the level in the hierarchy within which the fair value measurement falls is determined based on the lowest level input that is significant to the fair value measurement in its entirety. The designated input levels are not necessarily an indication of the risk or liquidity associated with these investments. These inputs are categorized in the following hierarchy under applicable financial accounting standards:
| Level 1- | Unadjusted quoted prices in active markets for identical investments, unrestricted assets or liabilities that the Fund has the ability to access at the measurement date; |
| Level 2 - | Quoted prices which are not active, quoted prices for similar assets or liabilities in active markets or inputs other than quoted prices that are observable (either directly or indirectly); and |
| 30 | www.insigniafunds.com |
| Insignia Macro Fund | Notes to Consolidated Financial Statements |
September 30, 2018
| Level 3- | Significant unobservable prices or inputs (including the Fund's own assumptions in determining the fair value of investments) where there is little or no market activity for the asset or liability at the measurement date. |
The following is a summary of the inputs used to value the Fund's investments as of September 30, 2018:
| Investments in Securities at Value | Level 1 - Unadjusted Quoted Prices | Level 2 - Other Significant Observable Inputs | Level 3 - Significant Unobservable Inputs | Total | ||||||||||||
| Asset-Backed Securities | $ | – | $ | 4,168,373 | $ | – | $ | 4,168,373 | ||||||||
| Corporate Bonds | ||||||||||||||||
| Basic Materials | – | 215,859 | – | 215,859 | ||||||||||||
| Communications | – | 658,652 | – | 658,652 | ||||||||||||
| Consumer, Cyclical | – | 607,962 | – | 607,962 | ||||||||||||
| Consumer, Non-cyclical | – | 1,984,403 | – | 1,984,403 | ||||||||||||
| Energy | – | 556,392 | – | 556,392 | ||||||||||||
| Financial | – | 4,449,934 | – | 4,449,934 | ||||||||||||
| Industrial | – | 927,587 | – | 927,587 | ||||||||||||
| Technology | – | 78,405 | – | 78,405 | ||||||||||||
| Mortgage-Backed Securities | – | 1,006,728 | – | 1,006,728 | ||||||||||||
| U.S. Treasury Notes & Bonds | – | 471,122 | – | 471,122 | ||||||||||||
| TOTAL | $ | – | $ | 15,125,417 | $ | – | $ | 15,125,417 | ||||||||
| Valuation Inputs | ||||||||||||||||
| Other Financial Instruments | Level 1 | Level 2 | Level 3 | Total | ||||||||||||
| Liabilities: | ||||||||||||||||
| Total Return Swap Contracts | $ | – | $ | (83,834 | ) | $ | – | $ | (83,834 | ) | ||||||
| Total | $ | – | $ | (83,834 | ) | $ | – | $ | (83,834 | ) | ||||||
The Fund recognizes transfers between levels as of the end of the period. For the fiscal year ended September 30, 2018, the Fund did not have any transfers between Level 1 and Level 2 securities. There were no Level 3 securities held during the period.
Cash & Cash Equivalents: The Fund considers its investment in a Federal Deposit Insurance Corporation ("FDIC") insured interest bearing account to be cash and cash equivalents. Cash and cash equivalents are valued at cost plus any accrued interest. The Fund maintains cash balances, which, at times may exceed federally insured limits. The Fund maintains these balances with a high quality financial institution.
Concentration of Credit Risk: The Fund places its cash with a banking institution, which is insured by FDIC. The FDIC limit is $250,000. At various times throughout the year, the amount on deposit may exceed the FDIC limit and subject the Fund to a credit risk. The Fund does not believe that such deposits are subject to any unusual risk associated with investment activities.
Trust Expenses: Some expenses of the Trust can be directly attributed to the Fund. Expenses that cannot be directly attributed to the Fund are apportioned among all funds in the Trust based on average net assets of each fund.
| Annual Report | September 30, 2018 | 31 |
| Insignia Macro Fund | Notes to Consolidated Financial Statements |
September 30, 2018
Fund Expenses: Some expenses can be directly attributed to the Fund and are apportioned among the classes based on average net assets of each class.
Class Expenses: Expenses that are specific to a class of shares are charged directly to that share class. Fees provided under the distribution (Rule 12b-l) and/or shareholder service plans for a particular class of the Fund are charged to the operations of such class.
Federal Income Taxes: The Fund complies with the requirements under Subchapter M of the Internal Revenue Code of 1986, as amended, applicable to regulated investment companies and intends to distribute substantially all of its net taxable income and net capital gains, if any, each year so that it will not be subject to excise tax on undistributed income and gains. The Fund is not subject to income taxes to the extent such distributions are made.
As of and during the fiscal year ended September 30, 2018, the Fund did not have a liability for any unrecognized tax benefits in the accompanying consolidated financial statements. The Funds recognize interest and penalties, if any, related to tax liabilities as income tax expense in the Consolidated Statement of Operations. The Fund files U.S. federal, state and local income tax returns as required. The Fund's tax returns are subject to examination by the relevant tax authorities until expiration of the applicable statute of limitations, which is generally three years after the filing of the tax return for federal purposes and four years for most state returns. The Fund's administrator has analyzed the Fund's tax positions taken on federal and state income tax returns for all open tax years and has concluded that as of September 30, 2018, no provision for income tax is required in the Fund's consolidated financial statements related to these tax positions. For tax purposes, the Subsidiary is an exempt Cayman Islands investment company and has received an undertaking from the Government of the Cayman Islands exempting it from all local income, profits, and capital gains taxes. No such taxes are levied in the Cayman Islands at the present time. For U.S. income tax purposes, the Subsidiary is a controlled foreign corporation ("CFC") and as such is not subject to U.S. income tax. However, as a wholly-owned CFC, the net income and capital gain of the CFC, to the extent of its earnings and profits, will be included each year in the Fund’s taxable income.
Investment Transactions and Investment Income: Investment transactions are accounted for on the date the investments are purchased or sold (trade date basis) for financial reporting purposes. Realized gains and losses from investment transactions are reported on an identified cost basis. Interest income, which includes accretion of discounts and amortization of premiums, is accrued and recorded as earned using the effective yield method. Dividend income is recognized on the ex-dividend date, or for certain foreign securities, as soon as information is available to the Fund. Withholding taxes on foreign dividends have been provided for in accordance with the Fund’s understanding of the applicable country’s tax rules and rates. All of the realized and unrealized gains and losses and net investment income are allocated daily to each class in proportion to its daily net assets.
Foreign Securities: The Fund may directly purchase securities of foreign issuers. Investing in securities of foreign issuers involves special risks not typically associated with investing in securities of U.S. issuers. The risks include possible re-evaluation of currencies, the inability to repatriate foreign currency, less complete financial information about companies and possible future adverse political and economic developments. Moreover, securities of many foreign issuers and their markets may be less liquid and their prices more volatile than those of securities of comparable U.S. issuers.
| 32 | www.insigniafunds.com |
| Insignia Macro Fund | Notes to Consolidated Financial Statements |
September 30, 2018
Foreign Currency: Investment securities and other assets and liabilities denominated in foreign currencies are translated into U.S. dollar amounts at the date of valuation. Purchases and sales of investment securities and income and expense items denominated in foreign currencies are translated into U.S. dollar amounts on the respective dates of such transactions.
The Fund does not isolate that portion of the results of operations resulting from changes in foreign exchange rates on investments from the fluctuations arising from changes in market prices of securities held. Such fluctuations are included with the net realized and unrealized gain or loss from investments.
Reported net realized foreign exchange gains or losses arise from sales of foreign currencies, currency gains or losses realized between the trade and settlement dates on securities transactions, and the difference between the amounts of dividends, interest, and foreign withholding taxes recorded on the Fund's books and the U.S. dollar equivalent of the amounts actually received or paid. Net unrealized foreign exchange gains and losses arise from changes in the fair values of assets and liabilities, other than investments in securities at fiscal year-end, resulting from changes in exchange rates.
Foreign Exchange Transactions: The Fund may enter into foreign currency spot contracts to facilitate transactions in foreign securities or to convert foreign currency receipts into U.S. dollars. A foreign currency spot contract is an agreement between two parties to buy and sell currencies at the current market rate, for settlement generally within two business days. The U.S. dollar value of the contracts is determined using current currency exchange rates supplied by a pricing service. The contract is marked-to-market daily for settlements beyond one day and any change in market value is recorded as an unrealized gain or loss. When the contract is closed, the Fund records a realized gain or loss equal to the difference between the value on the open and close date. Losses may arise from changes in the value of the foreign currency, or if the counterparties do not perform under the contract's terms. The maximum potential loss from such contracts is the aggregate face value in U.S. dollars at the time the contract was opened.
Distributions to Shareholders: The Fund normally pays dividends, if any, and distributes capital gains, if any, on an annual basis. Income dividend distributions are derived from interest and other income the Fund receives from its investments, including short term capital gains. Long term capital gain distributions are derived from gains realized when the Fund sells a security it has owned for more than one year. The Fund may make additional distributions and dividends at other times if its portfolio manager or managers believe doing so may be necessary for the Fund to avoid or reduce taxes. Net investment income/(loss) and net realized gain/(loss) may differ for financial statement and tax purposes.
3. DERIVATIVE INSTRUMENTS
The Fund's investment objectives permit the Fund to enter into various types of derivatives contracts, including, but not limited to, total return swaps and structured notes. In doing so, the Fund will employ strategies in differing combinations to permit it to increase, decrease, or change the level or types of exposure to market factors. Central to those strategies are features inherent in derivatives that make them more attractive for this purpose than equity or debt securities; they require little or no initial cash investment, they can focus exposure on only certain selected risk factors, and they may not require the ultimate receipt or delivery of the underlying security (or securities) to the contract. This may allow the Fund to pursue its objectives more quickly and efficiently than if it were to make direct purchases or sales of securities capable of affecting a similar response to market factors.
| Annual Report | September 30, 2018 | 33 |
| Insignia Macro Fund | Notes to Consolidated Financial Statements |
September 30, 2018
Risk of Investing in Derivatives: The Fund’s use of derivatives can result in losses due to unanticipated changes in the market risk factors and the overall market. In instances where the Fund is using derivatives to decrease, or hedge, exposures to market risk factors for securities held by the Fund, there are also risks that those derivatives may not perform as expected resulting in losses for the combined or hedged positions.
Derivatives may have little or no initial cash investment relative to their market value exposure and therefore can produce significant gains or losses in excess of their cost. This use of embedded leverage allows the Fund to increase its market value exposure relative to its net assets and can substantially increase the volatility of the Fund’s performance.
Additional associated risks from investing in derivatives also exist and potentially could have significant effects on the valuation of the derivative and the Fund. Typically, the associated risks are not the risks that the Fund is attempting to increase or decrease exposure to, per its investment objective, but are the additional risks from investing in derivatives.
Examples of these associated risks are liquidity risk, which is the risk that the Fund will not be able to sell or close out the derivative in a timely manner, and counterparty credit risk, which is the risk that the counterparty will not fulfill its obligation to the Fund. In addition, use of derivatives may increase or decrease exposure to the following risk factors:
Equity Risk: Equity risk relates to the change in value of equity securities as they relate to increases or decreases in the general market. Associated risks can be different for each type of derivative and are discussed by each derivative type in the notes that follow.
Commodity Risk: Exposure to the commodities markets may subject the Fund to greater volatility than investments in traditional securities. Prices of various commodities may also be affected by factors, such as drought, floods, weather, livestock disease, embargoes, tariffs and other regulatory developments, which are unpredictable. The prices of commodities can also fluctuate widely due to supply and demand disruptions in major producing or consuming regions.
Foreign Currency Risk: Currency trading involves significant risks, including market risk, interest rate risk, country risk, counterparty credit risk and short sale risk. Market risk results from the price movement of foreign currency values in response to shifting market supply and demand.
Interest Rate Risk: Interest rate risk is the risk that fixed income securities will decline in value because of changes in interest rates. As nominal interest rates rise, the value of fixed income securities held by the Fund are likely to decrease. Securities with longer durations tend to be more sensitive to changes in interest rates, and are usually more volatile than equity securities.
Swap Contracts: The Fund enters into swap transactions to seek to increase total return. A total return swap entered into by the Fund is a derivative contract that transfers the market risk of underlying portfolios of futures, foreign currency, forward currency and options contracts (considered the “index” within each total return swap contract) between counterparties. The “notional amount” of each total return swap agreement is the agreed upon amount or value of the index used for calculating the returns that the parties to a swap agreement have agreed to exchange. Risks may arise as a result of the failure of the counterparty to the swap contract to comply with the terms of the swap contract. The loss incurred by the failure of a counterparty is generally limited to the net payment to be received by the Fund and/or the termination value at the end of the contract.
| 34 | www.insigniafunds.com |
| Insignia Macro Fund | Notes to Consolidated Financial Statements |
September 30, 2018
The Fund considers the creditworthiness of each counterparty to a contract in evaluating potential credit risk. Additionally, risks may arise from unanticipated movements in interest rates or in the value of the underlying reference asset or index. Entering into these agreements involves, to varying degrees, market risk, liquidity risk and elements of credit, legal and documentation risk that are not directly reflected in the amounts recognized in the Consolidated Statement of Assets and Liabilities.
The Fund may pay or receive cash as collateral on these contracts which may be recorded as an asset and/or liability. The Fund must set aside liquid assets, or engage in other appropriate measures, to cover its obligations under these contracts. Swaps are marked-to-market daily and changes in value, including the accrual of periodic amounts of interest, are recorded daily based on the value of the index on which the total return swap is referenced, as defined within the total return swap agreement between the counterparties. The composition of the index may vary based on how the underlying portfolio of futures, foreign currency, forward currency and options contracts is traded. OTC swap payments received or paid at the beginning of the measurement period represent premiums paid or received upon entering into the swap agreement to compensate for differences between the stated terms of the swap agreement and prevailing market conditions (credit spreads, interest rates, and other relevant factors).
Generally, the basis of the OTC swaps is the unamortized premium received or paid. The periodic swap payments received or made by the Fund are recorded in the Consolidated Statement of Operations as realized gains or losses, respectively. Cash settlement transfers are recorded as prepaid swap premiums on the Consolidated Statement of Assets and Liabilities and are recognized as realized gains and losses at the termination of the swap. Any upfront fees paid are recorded as assets and any upfront fees received are recorded as liabilities. When the swap is terminated, the Fund will record a realized gain or loss equal to the difference between the proceeds from (or cost of) the closing transaction and the Fund’s basis in the contract, if any. In addition, changes in notional value and any cash holding adjustments, which represent voluntary realizations by a Fund of swap value at any point in time, are also presented as net realized gain or loss on swap contracts on the Consolidated Statement of Operations. A corresponding asset or liability for “advance receipt on swap contracts” or “advance payment on swap contracts”, respectively, is recorded on the Consolidated Statement of Assets and Liabilities for the gain or loss realized on changes in notional value. Total return swaps outstanding at year- end, if any, are listed after the Fund’s Consolidated Portfolio of Investments.
The Fund invests in total return swaps to obtain exposure to a security or market without owning such security or investing directly in that market. Total return swaps are agreements in which there is an exchange of cash flows whereby one party commits to make payments based on the total return (coupons plus capital gains/losses) of an underlying instrument in exchange for fixed or floating rate interest payments. To the extent the total return of the instrument or index underlying the transaction exceeds or falls short of the offsetting interest rate obligation, the Fund will receive a payment from or make a payment to the counterparty. Swap agreements held at September 30, 2018 are disclosed in the Consolidated Portfolio of Investments.
| Annual Report | September 30, 2018 | 35 |
| Insignia Macro Fund | Notes to Consolidated Financial Statements |
September 30, 2018
The average notional I value of the Fund’s swap positions for the fiscal year ended September 30, 2018 was $26,150,417.
Derivative Instruments: The following tables disclose the amounts related to the Fund’s use of derivative instruments.
The effect of derivative instruments on the Consolidated Statement of Assets and Liabilities as of September 30, 2018:
| Derivatives Not Accounted for As Hedging Instruments | Consolidated Statement of Assets and Liabilities Location | Asset Derivatives Gross Unrealized Appreciation/ (Depreciation) | Liability Derivatives Gross Unrealized Appreciation/ (Depreciation) | |||||||
| Commodity Contracts (total return swap contracts) | Unrealized depreciation on swap contracts | $ | – | $ | (83,834 | ) | ||||
| Total | $ | – | $ | (83,834 | ) | |||||
The effect of derivative instruments on the Consolidated Statement of Operations for the fiscal year ended September 30, 2018:
| Derivatives Not Accounted for As Hedging Instruments | Consolidated Statement of Operations Location | Realized Loss on Derivatives Recognized | Change in Unrealized Appreciation on Derivatives Recognized | |||||||
| Commodity Contracts (total return swap contracts) | Net realized gain/(loss) on Swap contracts/ Change in unrealized appreciation/ (depreciation) on Swap contracts | $ | (3,626,371 | ) | $ | 4,087,360 | ||||
| Total | $ | (3,626,371 | ) | $ | 4,087,360 | |||||
4. OFFSETTING AGREEMENTS
Certain derivative contracts are executed under standardized netting agreements. A derivative netting arrangement creates an enforceable right of set-off that becomes effective, and affects the realization of settlement on individual assets, liabilities and collateral amounts, only following a specified event of default or early termination. Default events may include the failure to make payments or deliver securities timely, material adverse changes in financial condition or insolvency, the breach of minimum regulatory capital requirements, or loss of license, charter or other legal authorization necessary to perform under the contract. The Fund may manage counterparty risk by entering into enforceable collateral arrangements with counterparties. These agreements mitigate counterparty credit risk by providing for a single net settlement with a counterparty of all financial transactions covered by the agreement in an event of default as defined under such agreement.
| 36 | www.insigniafunds.com |
| Insignia Macro Fund | Notes to Consolidated Financial Statements |
September 30, 2018
The following table presents derivative financial instruments that are subject to enforceable netting arrangements, collateral arrangements or other similar agreements as of September 30, 2018.
| Gross Amounts Not Offset in the Consolidated Statement of Assets and Liabilities | ||||||||||||||||||||||||
| Gross Amounts of Recognized Liabilities | Gross Amounts Offset in the Consolidated Statement of Assets and Liabilities | Net Amounts Presented in the Consolidated Statement of Assets and Liabilities | Financial Instruments(a) | Cash Collateral Pledged(a) | Net Amounts Payable | |||||||||||||||||||
| Liabilities | ||||||||||||||||||||||||
| Total Return Swap Contracts | $ | 83,834 | $ | – | $ | 83,834 | $ | – | $ | 83,834 | $ | – | ||||||||||||
| Total | $ | 83,834 | $ | – | $ | 83,834 | $ | – | $ | 83,834 | $ | – | ||||||||||||
(a) | These amounts are limited to the derivative liability balance and, accordingly, do not include excess collateral pledged. |
5. TAX BASIS INFORMATION
Tax Basis of Distributions to Shareholders: The character of distributions made during the period from net investment income or net realized gains may differ from its ultimate characterization for federal income tax purposes. Also, due to the timing of dividend distributions, the fiscal year in which amounts are distributed may differ from the fiscal year in which the income or realized gain were recorded by the Fund. The amounts and characteristics of tax basis distributions are estimated at the time of distribution and composition of distributable earnings/(accumulated losses) are finalized at fiscal year-end.
The tax characters of distributions paid by the Fund for the fiscal years ended September 30 were as follows:
| Distributions Paid From: | 2018 | 2017 | ||||||
| Ordinary Income | $ | 176,931 | $ | 86,591 | ||||
| Total | $ | 176,931 | $ | 86,591 | ||||
| Annual Report | September 30, 2018 | 37 |
| Insignia Macro Fund | Notes to Consolidated Financial Statements |
September 30, 2018
Reclassifications: As of September 30, 2018, permanent differences in book and tax accounting were reclassified. The following reclassifications have been made on the Consolidated Statement of Assets and Liabilities and have no impact on the net asset value of the Fund:
| Paid-in Capital | Total Distributable Earnings | |||||||
| $ | (3,684,554 | ) | $ | 3,684,554 | ||||
The reclassifications were primarily attributable to differing book and tax treatment of paydowns and income from CFC, and net operating losses.
Unrealized Appreciation and Depreciation on Investments and Derivative Instruments:
As of September 30, 2018, the aggregate cost of investments, gross unrealized appreciation / (deprecation) and net unrealized depreciation of investments and derivative instruments for Federal tax purposes were as follows:
| Gross unrealized appreciation (excess of value over tax cost)(a) | $ | 21,016,738 | ||
| Gross unrealized depreciation (excess of tax cost over value)(a) | (21,064,086 | ) | ||
| Net unrealized depreciation | $ | (47,348 | ) | |
| Cost of investments for income tax purposes | $ | 15,088,931 |
| (a) | Includes appreciation/(depreciation) on Total Return Swap Contracts. |
These temporary differences are primarily attributable to wash sales.
Components of Distributable Earnings: At September 30, 2018, components of distributable earnings were as follows:
| Accumulated capital losses | $ | (282,637 | ) | |
| Net unrealized depreciation | (47,348 | ) | ||
| Total | $ | (329,985 | ) |
Capital Losses: As of September 30, 2018, the Fund had capital loss carry forwards which may reduce the Fund’s taxable income arising from future net realized gains on investments, if any, to the extent permitted by the Code and thus may reduce the amount of the distributions to shareholders which would otherwise be necessary to relieve the Fund of any liability for federal tax.
Under current law, capital losses maintain their character as short-term or long-term and are carried forward to the next tax year without expiration. As of September 30, 2018, the following amounts are available as carry forwards to the next tax year:
| Short-Term | Long-Term | ||||||||
| $ | 165,031 | $ | 117,606 | ||||||
Capital loss carryovers used during the period ended September 30, 2018 were $7,181.
| 38 | www.insigniafunds.com |
| Insignia Macro Fund | Notes to Consolidated Financial Statements |
September 30, 2018
6. SECURITIES TRANSACTIONS
Purchases and sales of securities, excluding short-term securities, during the fiscal year ended September 30, 2018 were as follows:
Purchases of Securities | Proceeds From Sales of Securities | |||||||
| $ | 11,297,282 | $ | 29,733,573 | |||||
Purchases and sales of U.S. Government Obligations during the fiscal year ended September 30, 2018 were as follows:
Purchases of Securities | Proceeds From Sales of Securities | ||||||||
| $ | 4,183,731 | $ | 6,024,345 | ||||||
7. BENEFICIAL SHARE TRANSACTIONS
The capitalization of the Trust consists of an unlimited number of shares of beneficial interest with no par value per share. Holders of the shares of the Fund have one vote for each share held and a proportionate fraction of a vote for each fractional share. All shares issued and outstanding are fully paid and are transferable and redeemable at the option of the shareholder. Shares have no pre-emptive rights. Neither the Fund nor any of its creditors has the right to require shareholders to pay any additional amounts solely because the shareholder owns the shares.
Shares redeemed within 60 days of purchase may incur a 1.00% short-term redemption fee deducted from the redemption amount. For the fiscal year ended September 30, 2018, the redemption fees charged by the Fund are presented in the Consolidated Statements of Changes in Net Assets.
Transactions in common shares were as follows:
| For the Year Ended September 30, 2018 | For the Year Ended September 30, 2017 | |||||||
| Class A: | ||||||||
| Shares sold | 9,914 | 16,593 | ||||||
| Shares issued in reinvestment of distributions to shareholders | 108 | 34 | ||||||
| Shares redeemed | (18,787 | ) | (6,346 | ) | ||||
| Net increase/(decrease) from share transactions | (8,765 | ) | 10,281 | |||||
| Class 1: | ||||||||
| Shares sold | 21,584 | 507,349 | ||||||
| Shares issued in reinvestment of distributions to shareholders | 16,795 | 589 | ||||||
| Shares redeemed | (2,825,188 | ) | (1,482,425 | ) | ||||
| Net decrease from share transactions | (2,786,809 | ) | (974,487 | ) | ||||
| Annual Report | September 30, 2018 | 39 |
| Insignia Macro Fund | Notes to Consolidated Financial Statements |
September 30, 2018
Control is defined by the 1940 Act as the beneficial ownership, either directly or through one or more controlled companies, of more than 25% of the voting securities of a company. The Fund has two unaffiliated shareholder representing approximately 89% of total Fund shares. Share transaction activities of this shareholder could have a material impact on the Fund.
8. MANAGEMENT AND RELATED PARTY TRANSACTIONS
Investment Advisory: Meritage Capital, LLC (“Meritage Capital” or the “Adviser”), subject to the authority of the Board, has served as the Fund’s investment adviser since Fund inception and is responsible for the overall management and administration of the Fund’s business affairs. The Adviser has delegated a portion of the daily management of the Fund to Sage Advisory Services, Ltd. Co. (“Sage” or the “Sub-Adviser”). Effective May 3, 2018, the Adviser was acquired by an affiliated holding company of Brown Advisory, LLC, a SEC-registered investment adviser. At the Board Meeting, the Board also approved interim investment advisory agreements between the Adviser and the Trust, on behalf of the Fund, and interim investment sub-advisory agreement among the Advisor, the Trust, on behalf of the Fund, and the Sub-Adviser (the “Interim Advisory Agreements”). The Interim Advisory Agreements were effective for the earlier of 150 days from the close of the Transaction on May 3, 2018 or the date of shareholder approval of the New Advisory Agreements. The Interim Advisory Agreements were similar in all material respects to the prior advisory agreements. Any shareholder who owned shares of the Fund as of the close of business on May 7, 2018 received notice of the meeting and was entitled to vote to approve new investment advisory and investment sub-advisory agreements at the meeting. Under the new agreements, the Adviser continues to provide investment advisory services to the Fund and the Sub-Adviser will continue to provide sub-advisory services for the Fund’s fixed income strategy, both subject to the oversight of the Board, under terms that are similar in all material respects to the prior investment advisory and sub-advisory agreements and for the same fees that are currently in effect. The Fund Shareholder Meeting occurred on July 6, 2018 and all measures passed. The Adviser and the Sub-Adviser continue to manage the investments of the Fund in accordance with the Fund’s investment objective, policies and limitations and investment guidelines established jointly by the Adviser and the Board.
Pursuant to the Investment Advisory Agreement (the “Advisory Agreement”) with the Adviser, the Fund pays the Adviser an annual management fee of 1.25% based on the Fund’s average daily net assets during the month. Pursuant to an Investment Sub-Advisory Agreement (the “Sub-Advisory Agreement”), the Adviser pays the Sub-Adviser an annual sub-advisory management fee of 0.10% for the first $25 million, 0.18% for the subsequent $25 million and 0.10% once assets have reached over $50 million, with a minimum annual fee of $25,000. These management fees are based on the assets they manage and are paid on a quarterly basis. The Adviser is required to pay all fees due to the Sub-Adviser out of the management fee the Adviser receives from the Fund. The initial term for both the Advisory Agreement and Sub-Advisory Agreement was two years. The Board may extend the Advisory Agreement and/or the Sub-Advisory Agreement for additional one-year terms. The Board, shareholders of the Fund or the Adviser may terminate the Advisory Agreement or the Sub-Advisory Agreement upon 60 days’ notice.
Pursuant to a fee waiver letter agreement (the “Fee Waiver Agreement”), the Adviser has contractually agreed to limit the amount of the Fund’s Total Annual Fund Operating Expenses, exclusive of Distribution and Service (12b-l) fees, Shareholder Service Fees, Acquired Fund Fees and Expenses, brokerage expenses, interest expenses, taxes and extraordinary expenses, to 1.75% of the Fund’s average daily net assets for Class A and Class I shares. The Fee Waiver Agreement is in effect through January 31, 2019. The Adviser will be permitted to recover, on a class-by-class basis, expenses it has borne through the Fee Waiver Agreement only to the extent that the Fund’s expenses in later periods do not exceed the lesser of: (1) the contractual expense limit in effect at the time the Adviser waives or limits the expenses; or (2) the contractual expense limit in effect at the time the Adviser seeks to recover the expenses; provided, however, that the Fund will not be obligated to reimburse any such expenses borne by the Adviser more than three years after the date on which the fee or expense was waived or limited or assumed and paid by the Adviser, as calculated on a monthly basis. The Adviser may not discontinue the Fee Waiver Agreement without the approval by the Fund’s Board.
| 40 | www.insigniafunds.com |
| Insignia Macro Fund | Notes to Consolidated Financial Statements |
September 30, 2018
For the fiscal year ended September 30, 2018, the fee waivers and/or reimbursements were $2,922 and $235,081 for the Class A and Class I, respectively.
As of September 30, 2018, the balances of recoupable expenses for each class were as follows:
| Expiring in 2019 | Expiring in 2020 | Expiring in 2021 | ||||||||||
| Class A | $ | 574 | $ | 791 | $ | 2,922 | ||||||
| Class 1 | 115,010 | 108,036 | 235,081 | |||||||||
As of September 30, 2018 there is a receivable due from the adviser and administrator as reimbursement from a valuation correction.
Administrator: ALPS Fund Services, Inc (“ALPS”) (an affiliate of ALPS Distributors, Inc.) serves as administrator to the Fund. The Fund has agreed to pay expenses incurred in connection with its administrative activities. Pursuant to the Administration, Bookkeeping and Pricing Services Agreement with the Trust, ALPS will provide operational services to the Fund including, but not limited to, fund accounting and fund administration and generally assist in the Fund’s operations. The Fund’s administration fee is accrued on a daily basis and paid monthly. The officers of the Trust and an Interested Trustee are employees of ALPS. Administration fees paid by the Fund for the fiscal year ended September 30, 2018 are disclosed in the Consolidated Statement of Operations. ALPS is reimbursed by the Fund for certain out-of-pocket expenses.
Transfer Agent: ALPS serves as transfer agent for the Fund under a Transfer Agency and Services Agreement with the Trust. Under this agreement, ALPS is paid an annual fee for services performed on behalf of the Fund plus fees for open accounts and is reimbursed for certain out-of-pocket expenses.
Compliance Services: ALPS provides services as the Fund’s Chief Compliance Officer to monitor and test the policies and procedures of the Fund in conjunction with requirements under Rule 38a-l of the 1940 Act pursuant to a Chief Compliance Officer Services Agreement with the Trust. Under this agreement, ALPS is paid an annual fee for services performed on behalf of the Fund and is reimbursed for certain out-of-pocket expenses.
Distribution: ALPS Distributors, Inc. (the “Distributor”) (an affiliate of ALPS) acts as the principal underwriter of the Fund’s shares pursuant to a Distribution Agreement with the Trust. Shares of the Fund are offered on a continuous basis through the Distributor, as agent of the Fund. The Distributor is not obligated to sell any particular amount of shares and is not entitled to any compensation for its services as the Fund’s principal underwriter pursuant to the Distribution Agreement.
| Annual Report | September 30, 2018 | 41 |
| Insignia Macro Fund | Notes to Consolidated Financial Statements |
September 30, 2018
The Fund has adopted a separate plan of distribution for Class A shares pursuant to Rule 12b-l under the 1940 Act (the “Plan”). The Plan allows the Fund to use Class A assets to pay fees in connection with the distribution and marketing of Class A shares and/or the provision of shareholder services to Class A shareholders. The Plan permits payment for services in connection with the administration of plans or programs that use Class A shares of the Fund as their funding medium and for related expenses. The Plan permits the Fund to make total payments at an annual rate of up to 0.25% of a Fund’s average daily net assets attributable to its Class A shares. Because these fees are paid out of the Fund’s Class A assets on an ongoing basis, over time they will increase the cost of an investment in Class A shares, and Plan fees may cost an investor more than other types of sales charges. Plan fees are shown as distribution and service fees on the Consolidated Statement of Operations.
9. TRUSTEES
As of September 30, 2018, there were four Trustees, three of whom are not “interested persons” (as defined in the 1940 Act) of the Trust (the “Independent Trustees”). Effective November 16, 2017, the Independent Trustees of the Trust receive a quarterly retainer of $6,000, plus $4,000 for each regular Board or Committee meeting attended and $2,000 for each special telephonic or in-person Board or Committee meeting attended. Additionally, the Audit Committee Chair receives a quarterly retainer of $1,250 and an Independent Chair receives a quarterly retainer of $2,500. Prior to November 16, 2017, the Independent Trustees received a quarterly retainer of $5,000, plus $4,000 for each regular Board or Committee meeting attended, $2,000 for each special telephonic Board or Committee meeting attended and $2,000 for each special in-person Board meeting attended. The Independent Trustees are also reimbursed for all reasonable out-of-pocket expenses relating to attendance at meetings and for meeting-related expenses. Officers of the Trust and Trustees who are interested persons of the Trust receive no salary or fees from the Trust.
10. INDEMNIFICATIONS
Under the Trust’s organizational documents, its officers and Trustees are indemnified against certain liabilities arising out of the performance of their duties to the Trust. Additionally, in the normal course of business, the Trust enters into contracts with service providers that may contain general indemnification clauses which may permit indemnification to the extent permissible under applicable law. The Trust’s maximum exposure under these arrangements is unknown, as this would involve future claims that may be made against the Trust that have not yet occurred.
11. SUBSEQUENT EVENTS
Subsequent events after the date of the Statements of Assets and Liabilities have been evaluated through the date the financial statements were issued.
On October 4, 2018, the SEC amended Regulation S-X to require certain financial statement disclosure requirements to conform them to US Generally Accepted Accounting Principles for investment companies. Effective November 4, 2018, the Fund adopted disclosure requirement changes for Regulation S-X and these changes are reflected throughout this report. The Funds’ adoption of those amendments, effective with the financial statements prepared as of September 30, 2018, had no effect on the Funds’ net assets or results of operations.
| 42 | www.insigniafunds.com |
| Report of Independent Registered | |
| Insignia Macro Fund | Public Accounting Firm |
To the Shareholders of Insignia Macro Fund and
Board of Trustees of ALPS Series Trust
Opinion on the Financial Statements
We have audited the accompanying consolidated statement of assets and liabilities, including the consolidated portfolio of investments, of Insignia Macro Fund (the “Fund”), a series of ALPS Series Trust, as of September 30, 2018, and the related consolidated statement of operations for the year then ended, and the consolidated statements of changes in net assets, including the related notes, and consolidated financial highlights for each of the two years in the period then ended (collectively referred to as the “financial statements”). In our opinion, the financial statements present fairly, in all material respects, the financial position of the Fund as of September 30, 2018, the results of its operations for the year then ended, and the changes in its net assets and financial highlights for each of the two years in the period then ended, in conformity with accounting principles generally accepted in the United States of America.
The Fund’s financial highlights for the years or periods ended September 30, 2016, and prior, were audited by other auditors whose report dated December 2, 2016, expressed an unqualified opinion on those financial highlights.
Basis for Opinion
These financial statements are the responsibility of the Fund’s management. Our responsibility is to express an opinion on the Fund’s financial statements based on our audits. We are a public accounting firm registered with the Public Company Accounting Oversight Board (United States) (“PCAOB”) and are required to be independent with respect to the Fund in accordance with the U.S. federal securities laws and the applicable rules and regulations of the Securities and Exchange Commission and the PCAOB.
We conducted our audits in accordance with the standards of the PCAOB. Those standards require that we plan and perform the audit to obtain reasonable assurance about whether the financial statements are free of material misstatement, whether due to error or fraud.
Our audits included performing procedures to assess the risks of material misstatement of the financial statements, whether due to error or fraud, and performing procedures that respond to those risks. Such procedures included examining, on a test basis, evidence regarding the amounts and disclosures in the financial statements and confirmation of securities owned as of September 30, 2018, by correspondence with the custodian and brokers. Our audits also included evaluating the accounting principles used and significant estimates made by management, as well as evaluating the overall presentation of the financial statements. We believe that our audits provide a reasonable basis for our opinion.
We have served as the Fund’s auditor since 2017.
COHEN & COMPANY, LTD.
Cleveland, Ohio
November 29, 2018
| Annual Report | September 30, 2018 | 43 |
| Insignia Macro Fund | Additional Information |
September 30, 2018 (Unaudited)
1. PROXY VOTING POLICIES AND VOTING RECORD
A description of the policies and procedures that the Fund uses to determine how to vote proxies relating to portfolio securities is available without charge, upon request, (i) by calling the Fund (toll-free) at 1-855-674-4642 or (ii) on the website of the Securities and Exchange Commission (the “SEC”) at http://www.sec.gov.
Information regarding how the Fund voted proxies relating to portfolio securities during the most recent 12-month period ended June 30 is available (i) without charge, upon request, by calling the Fund (toll-free) at 1-855-674-4642 or (ii) on the SEC’s website at http://www.sec.gov.
2. PORTFOLIO HOLDINGS
The Fund files its complete schedule of portfolio holdings with the SEC for the first and third quarters of each fiscal year on Form N-Q. The Fund’s Forms N-Q are available on the SEC website at http://www.sec.gov. The Fund’s Forms N-Q may be reviewed and copied at the SEC’s Public Reference Room in Washington, D.C., and information on the operation of the Public Reference Room may be obtained by calling 1-800-SEC-0330.
3. SHAREHOLDER MEETING RESULTS
At a Special Meeting of Shareholders of the Insignia Macro Fund, held at the offices of ALPS Fund Services, Inc., at 1290 Broadway, Suite 1100, Denver, CO 80203 on July 6, 2018, shareholders of record as of the close of business on May 7, 2018 voted to approve the following proposals:
Proposal 1: To approve a New Investment Advisory Agreement.
| Shares Voted In Favor | Shares Voted Against or Abstentions | |
| 2,424,457 | 5,230 |
Proposal 2: To approve a New Investment Sub-Advisory Agreement.
| Shares Voted In Favor | Shares Voted Against or Abstentions | |
| 2,399,879 | 29,808 |
4. DISCLOSURE REGARDING RENEWAL AND APPROVAL OF FUND ADVISORY AGREEMENT
On May 1, 2018, the Board of Trustees (the “Board”) of ALPS Series Trust (the “Trust”) met in person to discuss, among other things, the approval of the Interim and New Investment Advisory Agreement with Meritage Capital, LLC (“Meritage Capital”), the Interim and New Investment Sub-Advisory Agreement with Sage Advisory Services, Ltd. Co. (“Sage Advisory”), and the New Management Agreement between Meritage Capital and Insignia Global Macro Offshore Ltd. (the “Cayman Company”) (the “New Agreements”), in accordance with Section 15(c) of the 1940 Act.
| 44 | www.insigniafunds.com |
| Insignia Macro Fund | Additional Information |
September 30, 2018 (Unaudited)
The Independent Trustees met with independent legal counsel during executive session and discussed the New Agreements and other related materials.
In approving the New Agreements, the Trustees, including all of the Independent Trustees, did not identify any single factor as all-important or controlling. The following summary does not identify all the matters considered by the Trustees, but provides a summary of the principal matters it considered. The Trustees considered whether the New Agreements would be in the best interests of the Insignia Macro Fund (the “Fund”) and its shareholders, based on: (i) the nature, extent and quality of the services to be provided under the New Agreements; (ii) the investment performance of the Fund; (iii) the expenses borne by the Fund (including management fees and other expenses), the fees directly and indirectly charged by Meritage Capital and Sage Advisory to the Fund and to their respective other clients, and projected profits to be realized by Meritage Capital and Sage Advisory and each of their affiliates, if applicable, from their respective relationships with the Fund; (iv) the fact that economies of scale may be realized as the Fund grows and whether fee levels will reflect economies of scale for the benefit of shareholders; (v) potential fall-out benefits to Meritage Capital and Sage Advisory from their relationships with the Fund; and (vi) other general information about Meritage Capital and Sage Advisory. The following is a summary of the Board’s consideration and conclusions regarding these matters.
Investment Advisory and Sub-Advisory Fee Rates: The Trustees reviewed and considered (i) the contractual annual advisory fee paid by the Insignia Fund to Meritage Capital of 1.25% of the Insignia Fund’s daily average net assets, and (ii) the contractual annual sub-advisory fee paid by Meritage Capital to Sage Advisory of 0.10% on the first $25 million, 0.18% on the next $25 million and 0.10% over $50 million, with an annual minimum of $25,000, in light of the extent and quality of the advisory services provided by each of Meritage Capital and Sage Advisory to the Insignia Fund.
The Trustees considered the information they received comparing the Insignia Fund’s contractual annual advisory fee and overall expenses with those of funds in the peer group selected by an independent consultant. The Trustees noted that the Insignia Fund’s contractual annual advisory fee of 1.25% was below the peer group average and the peer group median. The Trustees noted that no fees were paid to Meritage Capital pursuant to the Management Agreement with the Cayman Company.
Nature, Extent and Quality of the Services under the Interim and New Investment Advisory and Sub-Advisory Agreements: The Trustees received and considered information regarding the nature, extent and quality of services provided to the Insignia Fund under the Interim and New Investment Advisory Agreement with Meritage Capital, under the Interim and New Investment Sub-Advisory Agreement with Sage Advisory, and under the Management Agreement with the Cayman Company. The Trustees reviewed certain background materials supplied by Meritage Capital and Sage Advisory in their presentations, including their Form ADVs. They considered similar information provided by Brown Advisory.
The Trustees reviewed and considered Meritage Capital’s and Sage Advisory’s respective investment advisory personnel, their history as asset managers and their performance and the amount of assets currently under management by Meritage Capital and Sage Advisory. The Trustees also discussed the research and decision-making processes utilized by Meritage Capital and Sage Advisory, including the methods adopted to seek to achieve compliance with the investment objective, policies and restrictions of the Insignia Fund and the Cayman Company.
| Annual Report | September 30, 2018 | 45 |
| Insignia Macro Fund | Additional Information |
September 30, 2018 (Unaudited)
The Trustees considered the background and experience of Meritage Capital’s and Sage Advisory’s management in connection with the Insignia Fund and the Cayman Company, including reviewing the qualifications, backgrounds and responsibilities of the management team primarily responsible for the day-to-day portfolio management of the Insignia Fund and the Cayman Company and the extent of the resources devoted to research and analysis of actual and potential investments. They discussed the respective duties of each firm.
The Board observed that the transaction would have no impact on Sage Advisory and its operations, and that they were satisfied with the nature, extent and quality of services currently being provided by Sage Advisory to the Fund. As for Meritage Capital, the Trustees noted that the transaction was not expected to result in any change in the management team primarily responsible for the day-to-day portfolio management of the Fund, that the Fund would continue to receive a high level of service. They agreed that the additional resources of Brown Advisory, as the parent company, including resources in the area of legal support, compliance infrastructure, and cybersecurity programs, could benefit the Fund’s shareholders.
Performance: The Board reviewed performance information provided for the Fund for the 3-month, 1-year, 3-year and since inception date periods ended December 30, 2017 compared to a peer group selected by an independent consultant, as well as the HFRI Macro (Total) Index. They observed the Fund’s returns for each period presented trailed the Index and peer group average returns. They considered information presented by Meritage Capital regarding the volatility of the Fund, and agreed that, on a risk adjusted basis, the Fund’s performance appeared more favorable. A representative of Sage Advisory reported on the performance of the fixed income portion of the Fund, providing year to date and quarterly performance data. The Trustees agreed that the fixed income portfolio had performed well relative to Treasury securities, and that the short duration of the fixed income securities had served the Fund well.
Accounts Using Comparable Strategies: The Board received and considered certain information provided by Meritage Capital and Sage Advisory regarding fees charged and types of services provided to certain of its other clients utilizing strategies similar to those employed for the Fund. They noted the fee arrangement with Meritage Capital was favorable when compared to a privately offered fund that employs a strategy comparable to the Fund. They discussed the Sage Advisory fee that is paid by Meritage Capital, noting its various breakpoints, and concluded that the fee was reasonable when compared to Sage Advisory’s typical fee for portfolio management.
The Adviser’s Profitability: The Board considered statements by Meritage Capital and Sage Advisory regarding the anticipated similarity between the profitability profile of the Fund as managed by Meritage Capital and as managed by Meritage Capital and Sage Advisory in light of the fees payable under each New Agreement, and also considered information regarding the financial condition of Meritage Capital and Sage Advisory. They reviewed profit projections provided by Meritage Capital and Sage Advisory. The Trustees agreed that the profitability of each of Meritage Capital and Sage Advisory appeared reasonable.
Economies of Scale: The Board considered whether economies of scale in the provision of services to the Fund was being passed along to the shareholders. They discussed the unique breakpoint structure afforded by Sage Advisory, which provided some benefit to Meritage Capital at lower asset levels. They concluded that the expense limitation agreement was adequate at current asset levels, and economies of scale would be revisited as Fund asset levels increase.
| 46 | www.insigniafunds.com |
| Insignia Macro Fund | Additional Information |
September 30, 2018 (Unaudited)
Other Benefits to the Adviser: The Board also reviewed and considered any other benefits derived or to be derived by Meritage Capital and Sage Advisory from their relationship with the Fund noting that neither Meritage Capital nor Sage Advisory engaged in soft dollar arrangements, and neither firm identified any material additional benefits from their respective relationship with the Fund.
During the review process, the Trustees noted certain instances where clarification or follow-up was appropriate. In those instances where clarification or follow-up was requested, the Board determined that in each case either information responsive to its requests had been provided, or where any request was outstanding in whole or in part, given the totality of the information provided, the Board had received sufficient information to approve the Interim and New Investment Advisory Agreement with Meritage Capital, the Interim and New Investment Sub-Advisory Agreement with Sage Advisory, and the Management Agreement with the Cayman Company.
The Board summarized its deliberations with respect to the Interim and New Investment Advisory Agreement with Meritage Capital, the Interim and New Investment Sub-Advisory Agreement with Sage Advisory, and the Management Agreement with the Cayman Company. In selecting Meritage Capital as the Insignia Fund’s adviser and the fees charged under the Interim and New Investment Advisory Agreement and Sage Advisory as the Insignia Fund’s sub-adviser and the fees charged under the Interim and New Investment Sub-Advisory Agreement, the Trustees concluded that no single factor reviewed by the Trustees was identified by the Trustees to be determinative as the principal factor in whether to approve the Interim and New Investment Advisory Agreement and the Interim and New Investment Sub-Advisory Agreement. Further, the Independent Trustees were advised by separate independent legal counsel throughout the process.
In connection with the Board’s recommendation that shareholders of the Fund approve the New Agreements, the Board considered, among others, the following factors, but without identifying any single factor as all-important or controlling:
| (i) | the assurances from Brown Advisory and Meritage Capital that the manner in which the Fund’s assets are managed will not change in any material manner, that the personnel who currently manage the Fund’s assets will remain substantially the same after the Transaction, and that there is not expected to be any diminution in the nature, quality and extent of services provided to any Fund; |
| (ii) | the fact that the material terms of each New Agreement is substantively identical to the material terms of its related prior agreements; |
| (iii) | the agreement by Meritage Capital to cause the Fund’s current contractual fee waiver/expense reimbursement arrangement to continue through May 2, 2020, for a period of two (2) years from the date of the Transaction; |
| (iv) | the history, reputation, qualifications and background of Meritage Capital and its key personnel; |
| Annual Report | September 30, 2018 | 47 |
| Insignia Macro Fund | Additional Information |
September 30, 2018 (Unaudited)
| (v) | the fact that shareholders of the Fund will not bear any costs in connection with the Transaction, insofar as Meritage Capital has agreed to pay such expenses, including proxy solicitation expenses; |
| (vi) | other information provided by representatives of Meritage Capital, Brown Advisory and Sage Advisory regarding the anticipated impact of the Transaction, including with respect to the operational, administrative and compliance services expected to be provided to the Fund |
Based on the Trustees’ deliberations and their evaluation of the information described above, the Trustees, including all of the Independent Trustees, concluded that the terms of the New Agreements with Meritage Capital and Sage Advisory for investment advisory and sub-advisory services, respectively, were reasonable and fair, and approval was in the best interests of the Insignia Fund and its shareholders.
| 48 | www.insigniafunds.com |
| Insignia Macro Fund | Privacy Policy |
FACTS | WHAT DOES THE FUND DO WITH YOUR PERSONAL INFORMATION? | ||
| WHY? | Financial companies choose how they share your personal information. Federal law gives consumers the right to limit some but not all sharing. Federal law also requires us to tell you how we collect, share and protect your personal information. Please read this notice carefully to understand what we do. | ||
| WHAT? | The types of personal information we collect and share depend on the product or service you have with us. This information can include: ● Social Security number and account transactions ● Account balances and transaction history ● Wire transfer instructions | ||
| HOW? | All financial companies need to share customers’ personal information to run their everyday business. In the section below, we list the reasons financial companies can share their customers’ personal information, the reasons the Fund chooses to share, and whether you can limit this sharing. | ||
| REASONS WE CAN SHARE YOUR PERSONAL INFORMATION | DOES THE FUND SHARE: | CAN YOU LIMIT THIS SHARING? | |
For our everyday business purposes – such as to process your transactions, maintain your account(s), respond to court orders and legal investigations, or report to credit bureaus | Yes | No | |
| For our marketing purposes – to offer our products and services to you | No | We do not share. | |
| For joint marketing with other financial companies | No | We do not share. | |
| For our affiliates’ everyday business purposes – information about your transactions and experiences | Yes | No | |
| For our affiliates’ everyday business purposes – information about your creditworthiness | No | We do not share. | |
| For non-affiliates to market to you | No | We do not share. | |
| QUESTIONS? | Call 1-855-674-4642 or go to www.insigniafunds.com. | ||
| Annual Report | September 30, 2018 | 49 |
| Insignia Macro Fund | Privacy Policy |
| WHO WE ARE | |
| Who is providing this notice? | Insignia Macro Fund (the “Fund”) |
| WHAT WE DO | |
| How does the Fund protect my personal information? | To protect your personal information from unauthorized access and use, we use security measures that comply with federal law. These measures include computer safeguards and secured files and buildings. |
| How does the Fund collect my personal information? | We collect your personal information, for example, when you ● open an account ● provide account information or give us your contact information ● make a wire transfer or deposit money |
| Why can’t I limit all sharing? | Federal law gives you the right to limit only ● sharing for affiliates’ everyday business purposes-information about your creditworthiness ● affiliates from using your information to market to you ● sharing for non-affiliates to market to you ● State laws and individual companies may give you additional rights to limit sharing |
| DEFINITIONS | |
| Affiliates | Companies related by common ownership or control. They can be financial and nonfinancial companies. |
| Non-affiliates | Companies not related by common ownership or control. They can be financial and nonfinancial companies. ● The Fund does not shore with non-affiliates so they con market to you. |
| Joint marketing | A formal agreement between non-affiliated financial companies that together market financial products or services to you. ● The Fund does not jointly market. |
| 50 | www.insigniafunds.com |
| Insignia Macro Fund | Privacy Policy |
| OTHER IMPORTANT INFORMATION | |
| California Residents | If your account has a California home address, your personal information will not be disclosed to nonaffiliated third parties except as permitted by applicable California law, and we will limit sharing such personal information with our affiliates to comply with California privacy laws that apply to us. |
| Vermont Residents | The State of Vermont requires financial institutions to obtain your consent prior to sharing personal information that they collect about you with affiliated companies and nonaffiliated third parties other than in certain limited circumstances. Except as permitted by law, we will not share personal information we collect about you with nonaffiliated third parties or other affiliated companies unless you provide us with your written consent to share such information. |
| Annual Report | September 30, 2018 | 51 |
| Insignia Macro Fund | Trustees and Officers |
September 30, 2018 (Unaudited)
INDEPENDENT TRUSTEES
| Name, Birth Year & Address* | Position(s) Held with Fund | Term of Office and Length of Time Served** | Principal Occupation(s) During Past 5 Years*** | Number of Funds in Fund Complex Overseen by Trustee**** | Other Directorships Held by Trustee During Past 5 Years*** |
| Ward D. Armstrong Birth year: 1954 | Trustee and Chairman | Mr. Armstrong was appointed to the Board on May 27, 2016. Mr. Armstrong was appointed Chairman of the Board at the August 24, 2017 meeting of the Board of Trustees. | Retired; Managing Partner, NorthRock Partners, LLC (October 2013 to July 2015); Managing Director, NorthRock Partners, a Private Wealth Advisory Practice of Ameriprise Financial (February 2010 to October 2013); Senior Vice President, Ameriprise Financial, Inc. (November 1984 to May 2007); President, American Express Asset Management (2002 to 2004); and Chairman, Ameriprise Trust Company (November 1996 to May 2007). | 12 | Mr. Armstrong is a Director of the Heartland Group, Inc. (5 funds). |
| * | All communications to Trustees and Officers may be directed to ALPS Series Trust c/o 1290 Broadway, Suite 1100, Denver, CO 80203. |
| ** | This is the period for which the Trustee or Officer began serving the Trust. Each Trustee serves an indefinite term, until such Trustee’s successor is elected and appointed, or such Trustee resigns or is deceased. Officers are elected on an annual basis. |
| *** | Except as otherwise indicated, each individual has held the office shown or other offices in the same company for the last five years. |
| **** | The Fund Complex currently consists of 12 series of the Trust and any other investment companies for which Meritage Capital, LCC provides investment advisory services, currently none. |
| 52 | www.insigniafunds.com |
| Insignia Macro Fund | Trustees and Officers |
September 30, 2018 (Unaudited)
| Name, Birth Year & Address* | Position(s) Held with Fund | Term of Office and Length of Time Served** | Principal Occupation(s) During Past 5 Years*** | Number of Funds in Fund Complex Overseen by Trustee**** | Other Directorships Held by Trustee During Past 5 Years*** |
| J. Wayne Hutchens Birth year: 1944 | Trustee | Mr. Hutchens was elected to the Board on October 30, 2012. | Mr. Hutchens is currently retired. From April 2006 to December 2012, he served as President and CEO of the University of Colorado (CU) Foundation and from April 2009 to December 2012, he was Executive Director of the CU Real Estate Foundation. Mr. Hutchens is also Trustee of the Denver Museum of Nature and Science (2000 to present), Director of AMG National Trust Bank (June 2012 to present) and Trustee of Children’s Hospital Colorado (May 2012 to present). Prior to these positions, Mr. Hutchens spent 29 years in the banking industry, retiring as Chairman of Chase Bank Colorado. | 12 | Mr. Hutchens is a Director of RiverNorth Opportunities Fund, Inc. (2013 to present) |
| Patrick Seese Birth year: 1971 | Trustee | Mr. Seese was elected to the Board on October 30, 2012. | Mr. Seese is an owner and a was elected Managing Director of Integris to the Board Partners, a middle-market on October investment banking firm serving 30, 2012. closely-held companies, financial sponsors and public companies (February 2008 to present). Prior to this, Mr. Seese was a Managing Director of Headwaters MB, a middle-market investing banking firm (December 2003 to February 2008). Prior to that, Mr. Seese worked in Credit Suisse First Boston’s Mergers and Acquisitions Group and served as Head of Corporation Development, Katy Industries, a publicly traded industrial and consumer products company and at Deloitte & Touche LLP, where he began his career in 1994. | 12 | Mr. Seese is a Director of The Mile High Five Foundation (2013 to present) and SJ Panthers Foundation (2016 to present) |
| * | All communications to Trustees and Officers may be directed to ALPS Series Trust c/o 1290 Broadway, Suite 1100, Denver, CO 80203. |
| ** | This is the period for which the Trustee or Officer began serving the Trust. Each Trustee serves an indefinite term, until such Trustee’s successor is elected and appointed, or such Trustee resigns or is deceased. Officers are elected on an annual basis. |
| *** | Except as otherwise indicated, each individual has held the office shown or other offices in the same company for the last five years. |
| **** | The Fund Complex currently consists of 12 series of the Trust and any other investment companies for which Meritage Capital, LCC provides investment advisory services, currently none. |
| Annual Report | September 30, 2018 | 53 |
| Insignia Macro Fund | Trustees and Officers |
September 30, 2018 (Unaudited)
INDEPENDENT TRUSTEES
| Name, Birth Year & Address* | Position(s) Held with Fund | Term of Office and Length of Time Served** | Principal Occupation(s) During Past 5 Years*** | Number of Funds in Fund Complex Overseen by Trustee**** | Other Directorships Held by Trustee During Past 5 Years*** |
| Jeremy O. May Birth year: 1970 | Trustee and President | Mr. May was elected Trustee and President on October 30, 2012. Mr. May was Chairman from October 30, 2012 to August 24, 2017. | Mr. May joined ALPS in 1995 and is currently President and Director of ALPS Fund Services, Inc., ALPS Distributors, Inc., and ALPS Portfolio Solutions Distributor, Inc., Executive Vice President and Director of ALPS Holdings, Inc. and ALPS Advisors, Inc. Because of his positions with these entities, Mr. May is deemed an affiliate of the Trust as defined under the 1940 Act. Mr. May is also on the Board of Directors of the University of Colorado Foundation and the AV Hunter Trust. | 12 | Mr. May is Trustee of the Reaves Utility Income Fund (1 fund) and Elevation ETF Trust (1 ETF) and President and Director of RiverNorth Opportunities Fund, Inc. |
| * | All communications to Trustees and Officers may be directed to ALPS Series Trust c/o 1290 Broadway, Suite 1100, Denver, CO 80203. |
| ** | This is the period for which the Trustee or Officer began serving the Trust. Each Trustee serves an indefinite term, until such Trustee’s successor is elected and appointed, or such Trustee resigns or is deceased. Officers are elected on an annual basis. |
| *** | Except as otherwise indicated, each individual has held the office shown or other offices in the same company for the last five years. |
| **** | The Fund Complex currently consists of 12 series of the Trust and any other investment companies for which Meritage Capital, LCC provides investment advisory services, currently none. |
| 54 | www.insigniafunds.com |
| Insignia Macro Fund | Trustees and Officers |
September 30, 2018 (Unaudited)
OFFICERS
| Name, Birth Year & Address* | Position(s) Held with Fund | Term of Office and Length of Time Served** | Principal Occupation(s) During Past 5 Years*** |
| Kimberly R. Storms Birth year: 1972 | Treasurer | Ms. Storms was elected Treasurer of the Trust on October 30, 2012. | Ms. Storms is Senior Vice President and Director of Fund Administration of ALPS. Because of her position with ALPS, Ms. Storms is deemed an affiliate of the Trust as defined under the 1940 Act. Ms. Storms is also Treasurer of Financial Investors Trust, Liberty All-Star Equity Fund and Liberty All-Star Growth Fund, Inc. |
| Richard C. Noyes Birth year: 1970 | Secretary | Mr. Noyes was elected Secretary of the Trust on November 14, 2016. | Mr. Noyes joined ALPS in 2015 and is Senior Vice President and General Counsel of ALPS. Prior to joining ALPS, Mr. Noyes served as Assistant Vice President and Senior Counsel of Janus Capital Management LLC. Mr. Noyes is deemed an affiliate of the Trust as defined under the 1940 Act. |
| Anne M. Berg Birth year: 1973 | Assistant Secretary | Ms. Berg was elected Assistant Secretary of the Trust on August 23, 2018. | Ms. Berg joined ALPS as Senior Investment Company Act Paralegal in February 2017. Prior to joining ALPS, Anne was a Senior Legal Manager at Janus Capital Group Inc., a global investment manager in Denver, Colorado. Because of her position with ALPS, Ms. Berg is deemed an affiliate of the Trust as defined under the 1940 Act. |
| Alan Gattis**** Birth year: 1980 | Assistant Treasurer | Mr. Gattis was elected Assistant Treasurer of the Trust on August 9, 2016. | Mr. Gattis joined ALPS in 2011 and is currently Vice President and Fund Controller of ALPS. Prior to joining ALPS, Mr. Gattis was an Auditor at Spicer Jeffries LLP (2009 through 2011) and an Auditor at PricewaterhouseCoopers LLP (2004 - 2009). Because of his position with ALPS, Mr. Gattis is deemed an affiliate of the Trust as defined under the 1940 Act. Mr. Gattis is also Assistant Treasurer of Elevation ETF Trust and Financial Investors Trust. |
| * | All communications to Trustees and Officers may be directed to ALPS Series Trust c/o 1290 Broadway, Suite 1100, Denver, CO 80203. |
| ** | This is the period for which the Trustee or Officer began serving the Trust. Each Trustee serves an indefinite term, until such Trustee’s successor is elected and appointed, or such Trustee resigns or is deceased. Officers are elected on an annual basis. |
| *** | Except as otherwise indicated, each individual has held the office shown or other offices in the same company for the last five years. |
| **** | The Fund Complex currently consists of 12 series of the Trust and any other investment companies for which Meritage Capital, LCC provides investment advisory services, currently none. |
| Annual Report | September 30, 2018 | 55 |
| Insignia Macro Fund | Trustees and Officers |
September 30, 2018 (Unaudited)
| Name, Birth Year & Address* | Position(s) Held with Fund | Term of Office and Length of Time Served** | Principal Occupation(s) During Past 5 Years*** |
| Lucas D. Foss Birth Year: 1977 | Chief Compliance Officer (“CCO”) | Mr. Foss was elected CCO of the Trust on January 22, 2018. | Mr. Foss joined ALPS in November 2017 as Vice President and Deputy Chief Compliance Officer. Prior to his current role, Mr. Foss served as the Director of Compliance at Transamerica Asset Management (July 2015-November 2017). Deputy Chief Compliance Officer at ALPS (September 2012 – June 2015) Compliance Manager at ALPS (January 2010 - August 2012) and a Senior Compliance Analyst at ALPS (November 2006 – December 2009). Before joining ALPS, Mr. Foss held positions at Bisys Hedge Fund Services and Deutsche Asset Management. Because of his position with ALPS, Mr. Foss is deemed an affiliate of the Trust as defined under the 1940 Act. Mr. Foss is also CCO of Harvest Volatility Edge Trust and Goehring & Rozencwajg Investment Funds. |
| * | All communications to Trustees and Officers may be directed to ALPS Series Trust c/o 1290 Broadway, Suite 1100, Denver, CO 80203. |
| ** | This is the period for which the Trustee or Officer began serving the Trust. Each Trustee serves an indefinite term, until such Trustee’s successor is elected and appointed, or such Trustee resigns or is deceased. Officers are elected on an annual basis. |
| *** | Except as otherwise indicated, each individual has held the office shown or other offices in the same company for the last five years. |
Additional information about members of the Board of Trustees and officers of the Trust is available in the Statement of Additional Information and is available, without charge, upon request, by calling the Fund (toll-free) at 1-855-674-4642.
| 56 | www.insigniafunds.com |
The following Supplement dated December 10, 2018 to the Insignia Macro Fund Annual Report dated September 30, 2018 was sent to shareholders of the Fund on or about December 10, 2018
INSIGNIA MACRO FUND
(THE “FUND”)
SUPPLEMENT DATED DECEMBER 10, 2018 TO THE ANNUAL REPORT DATED
SEPTEMBER 30, 2018
The table on page 6 under “Average Annual Total Returns” in the Fund’s Annual Report is hereby deleted and replaced in its entirety with the following:
| 3 Month | 6 Month | 1 Year | 3 Year | Since Inception* | |
| Insignia Macro Fund - Class A - NAV | 0.00% | 1.37% | 1.29%** | -1.71% | 0.67% |
| Insignia Macro Fund - Class A - LOAD | -5.48% | -4.17% | -4.31%** | -3.55% | -0.52% |
| Insignia Macro Fund - Class I - NAV | 0.00% | 1.37% | 1.37%** | -1.65% | 0.72% |
| HFRI Macro (Total) Index(a) | -0.03% | -0.22% | 0.54% | 0.41% | 1.17% |
| S&P 500® Total Return Index(b) | 7.71% | 11.41% | 17.91% | 17.31% | 12.35% |
INVESTORS SHOULD RETAIN THIS SUPPLEMENT
FOR FUTURE REFERENCE.

Table of Contents
| Shareholder Letter | 1 |
| Portfolio Update | |
| Seven Canyons Strategic Income Fund | 3 |
| Seven Canyons World Innovators Fund | 5 |
| Disclosure of Fund Expenses | 7 |
| Portfolios of Investments | |
| Seven Canyons Strategic Income Fund | 9 |
| Seven Canyons World Innovators Fund | 14 |
| Statements of Assets and Liabilities | 19 |
| Statements of Operations | 21 |
| Statements of Changes in Net Assets | |
| Seven Canyons Strategic Income Fund | 23 |
| Seven Canyons World Innovators Fund | 24 |
| Financial Highlights | 26 |
| Notes to Financial Statements | 32 |
| Report of Independent Registered Public Accounting Firm | 48 |
| Additional Information | 49 |
| Privacy Policy | 54 |
| Trustees and Officers | 57 |
| Seven Canyons Advisors | Shareholder Letter |
September 30, 2018 (Unaudited)
Dear Fellow Shareholders:
For many years, I have written my letter to shareholders as Chairman of Wasatch Advisors. Recently I left Wasatch to help start, Seven Canyons Advisors, with my two sons, Josh and Spence, my son-in-law Eric Moessing and Wes Golby. I made this change not due to any dissatisfaction with Wasatch but for the opportunity to have a new adventure in my life after the 42 years I spent there.
This is my first letter written as a partner of Seven Canyons Advisors. I always like to start this commentary with an overview of the economy, as most stock market events are driven by economic events. Rarely does the market encounter “clear air turbulence” during which the market reacts without any economic prodding.
As we look over the global economy today, we note there is substantial bifurcation between what is occurring in the U.S. and what is occurring in many other countries around the globe. In the U.S. everything seems just fine. Our economy is humming. Employment is overflowing as there are more jobs than job seekers. Wages are rising yet inflation remains contained.
However, as we expand our horizons to view the global economy, the picture is not so rosy. Europe is troubled by Brexit and Italian woes. Japan is plagued by mounting debt. China seems to alternate between stepping on the brake and stepping on the gas as it tries to navigate towards a growing consumer-led economy. And many emerging economies are suffering from weak currencies and inflation.
One explanation for this global economic mix is unanticipated effects from the strange brew of responses to the global financial crisis (GFC). The classic prescription for a financial crisis is easy money to halt the panic, followed by fiscal stimulus to get the economy going. Instead of following that pattern post the GFC, central banks around the world continued easing monetary policy in the absence of fiscal stimulus. Normally fiscal and monetary policies work in tandem with fiscal gas and monetary brake. However, post the GFC most economies relied on continued easing from central banks to stimulate the economy. Perhaps the absence of fiscal policy was a side effect of an overly debt-laden world.
Central banks, led by the U.S., are now finally withdrawing liquidity as the global economy appears strong enough to withstand diminished liquidity. However, as liquidity is the grease to the global economy, less grease is causing “hot spots” to develop (most notable in Argentina and Turkey).
Unlike the rest of the world, the U.S. is adding a large dose of fiscal stimulus at a time when it would normally be backing off the gas. Fiscal ease rarely occurs near the peak of a cycle. So far the U.S. has benefited from the very late application of fiscal stimulus. Tighter money has so far prevented inflation from expanding. This policy has led to expanding debt levels, which in turn has led to higher rates. Higher rates have led to a stronger dollar.
A strong dollar is often cited as the cause of emerging economy woes, especially if a country has high levels of debt. A strong dollar makes high levels of dollar debt more difficult to service as the dollar liabilities are now more expensive relative to the local currency. Also, efforts to repay the debt exert a depressing effect on those economies. This is because the now more expensive debt has the same economic impact as tighter credit.
| Annual Report | September 30, 2018 | 1 |
| Seven Canyons Advisors | Shareholder Letter |
September 30, 2018 (Unaudited)
The role of Chinese currency weakness should not be overlooked. As the Yuan shifted from appreciating in the early part of this year to depreciating, emerging economies seemed to take another leg down. China, with an economy of a similar size to that of the U.S., appears to have a major impact on emerging economies. This is because China is a large market for many emerging economies. When China reversed course this spring from supporting a stronger Yuan to encouraging a weaker Yuan, many emerging economies turned on a dime due to suffering from a more competitive currency.
To summarize, even if it causes short term pain, a strong U.S. economy with rising rates and a strong dollar will benefit emerging economies in the long run. In contrast, a sputtering Chinese economy with a weak currency will hurt emerging economies. It is China, rather than the U.S., which bears much of the responsibility for problems in emerging economies. However, Chinese weakness will come to an end as China’s global aspirations require it to keep its currency in line with that of its major trading partners.
Despite the headlines, during our visits to emerging economies, we are not detecting excessive concern about their progress. Business seems more normal than anything else.
Recent market fluctuations reflect concern that the economy will be unable to deal with current problems. But I remain firm in my belief that these concerns are misplaced. I believe that the market is taking a healthy breather. I believe that the economy will continue to move forward and that the market will follow.
I am grateful for your investment in Seven Canyons. I pledge to do all in my power to make your loyalty worthwhile.

Sam Stewart
Partner
This letter is for informational purposes only and does not constitute investment advice or a recommendation of any particular security, strategy, or investment product. The expressed views and opinions presented are for informational purposes only, are based on current market conditions, and are subject to change without notice. Although information and statistics contained herein have been obtained from sources believed to be reliable and are accurate to the best of our knowledge, Seven Canyons Advisors cannot and does not guarantee the accuracy, validity, timeliness, or completeness of such information and statistics made available to you for any particular purpose. Past performance is not indicative of future results.
All investing involves risk. Investments in securities of foreign companies involve additional risks, including less liquidity, currency-rate fluctuations, political and economic instability and differences in financial reporting standards and securities market regulation. Investing in small and micro-cap funds will be more volatile and loss of principal could be greater than investing in large cap or more diversified funds.
An investor should consider investment objectives, risks, charges and expenses carefully before investing.
| 2 | www.sevencanyonsadvisors.com |
| Seven Canyons Strategic Income Fund | Portfolio Update |
September 30, 2018 (Unaudited)
Performance of a Hypothetical $10,000 Initial Investment (September 30, 2008 through September 30, 2018)
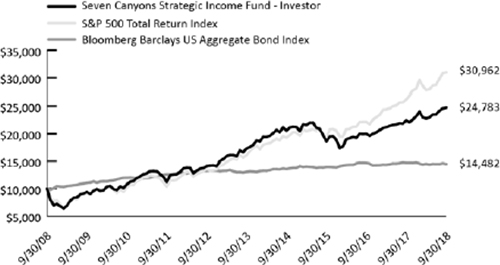
The graph shown above represents historical performance of a hypothetical investment of $10,000 in the Investor Class. Past performance does not guarantee future results. All returns reflect reinvested dividends, but do not reflect the deduction of fees or taxes that a shareholder would pay on Fund distributions or the redemption of Fund shares.
Average Annual Total Returns (as of September 30, 2018)
| 1 Year | 5 Year | 10 Year | Since Inception* | |
| Seven Canyons Strategic Income Fund -Investor | 10.71% | 7.46% | 9.50% | 7.14% |
| S&P 500 Total Return Index(a) | 17.91% | 13.95% | 11.97% | 8.97% |
| Bloomberg Barclays US Aggregate Bond Index(b) | -1.22% | 2.16% | 3.77% | 3.93% |
The performance data quoted above represents past performance. Past performance is not a guarantee of future results. Investment return and value of the Fund shares will fluctuate so that an investor’s shares, when sold or redeemed, may be worth more or less than their original cost. Performance may be lower or higher than performance data quoted. Fund performance current to the most recent month-end is available by calling (801) 349-2718 or by visiting www.sevencanyonsadvisors.com.
| * | The Fund commenced operations on February 1, 2006. The Predecessor Fund, Wasatch Strategic Income Fund, managed by Wasatch Advisors, Inc., was reorganized into the Seven Canyons Strategic Income Fund on September 10, 2018. Seven Canyons Advisors, LLC has been the Fund’s investment adviser since September 10, 2018. Fund performance prior to September 10, 2018 is reflective of the past performance of the Predecessor Fund. |
| (a) | The S&P 500® Total Return Index is the Standard & Poor's composite index of 500 stocks, a widely recognized, unmanaged index of common stock prices. |
| (b) | The Bloomberg Barclays U.S. Aggregate Bond Index is a broad-based benchmark that measures the investment grade, U.S. dollar-denominated, fixed-rate taxable bond market, including Treasuries, government-related and corporate securities, MBS (agency fixed-rate and hybrid ARM pass-throughs), ABS, and CMBS (agency and non-agency). The index is not actively managed and does not reflect any deductions for fees, expenses or taxes. |
| Annual Report | September 30, 2018 | 3 |
| Seven Canyons Strategic Income Fund | Portfolio Update |
September 30, 2018 (Unaudited)
Returns of less than 1 year are cumulative.
Indices are not actively managed and do not reflect deduction for fees, expenses or taxes. An investor cannot invest directly in an index.
The returns shown above do not reflect the deduction of taxes a shareholder would pay on Fund distributions or redemption of Fund shares.
The total annual operating expenses and total annual operating expenses after fee waivers and/or reimbursement you may pay as an investor in the Fund’s Investor Class (as reported in the September 10, 2018 Prospectus) are 1.79% and 1.43%, respectively. The Fund’s investment adviser has contractually agreed to limit expenses through January 31, 2020.
Top Ten Equity Holdings (as a % of Net Assets)*
| Mastercard, Inc. | 4.32% |
| Visa, Inc. | 4.25% |
| UnitedHealth Group, Inc. | 4.12% |
| Home Depot, Inc. | 3.87% |
| Microchip Technology, Inc. | 3.80% |
| Comcast Corp. | 3.74% |
| Cognizant Technology Solutions Corp. | 3.50% |
| Canadian National Railway Co. | 3.21% |
| Magellan Midstream Partners LP | 2.95% |
| Suncor Energy, Inc. | 2.94% |
| Top Ten Holdings | 36.70% |
Sector Allocation (as a % of Net Assets)*
| Financials | 23.06% |
| Information Technology | 20.04% |
| Consumer Discretionary | 12.74% |
| Industrials | 8.30% |
| Communication Services | 7.95% |
| Energy | 7.68% |
| Health Care | 6.41% |
| Consumer Staples | 6.03% |
| Real Estate | 2.42% |
| Cash | 5.37% |
| Total | 100.00% |
| * | Holdings are subject to change, and may not reflect the current or future position of the portfolio. |
| 4 | www.sevencanyonsadvisors.com |
| Seven Canyons World Innovators Fund | Portfolio Update |
September 30, 2018 (Unaudited)
Performance of a Hypothetical $10,000 Initial Investment (September 30, 2008 through September 30, 2018)
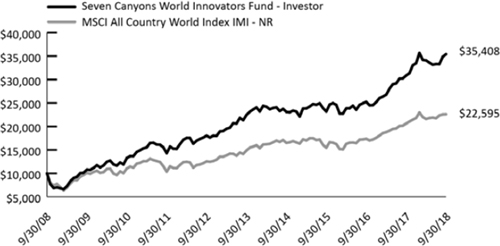
The graph shown above represents historical performance of a hypothetical investment of $10,000 in the Investor Class. Due to differing expenses, performance of the Institutional Class will vary. Past performance does not guarantee future results. Returns do not reflect the deduction of fees, sales charges, or taxes that a shareholder would pay on Fund distributions or the redemption of Fund shares.
Average Annual Total Returns (as of September 30, 2018)
| 1 Year | 5 Year | 10 Year | Since Inception* | |
| Seven Canyons World Innovators Fund - Investor | 14.77% | 9.51% | 13.48% | 8.60% |
| Seven Canyons World Innovators Fund - Institutional | 15.03% | 9.66% | 13.56% | 8.64% |
| MSCI All Country World Index IMI(a) | 9.63% | 8.69% | 8.49% | 5.98% |
The performance data quoted above represents past performance. Past performance is not a guarantee of future results. Investment return and value of the Fund shares will fluctuate so that an investor’s shares, when sold or redeemed, may be worth more or less than their original cost. Performance may be lower or higher than performance data quoted. Fund performance current to the most recent month-end is available by calling (801) 349-2718 or by visiting www.sevencanyonsadvisors.com.
| * | Seven Canyons World Innovators Fund – Investor Class has an inception date of December 19, 2000. Seven Canyons World Innovators Fund – Institutional Class has an inception date of February 1, 2016. Performance for the Institutional Class prior to 2/1/2016 is based on the performance of the Investor Class. Performance of the Fund’s Institutional Class prior to 2/1/2016 uses the actual expenses of the Fund’s Investor Class without any adjustments. For any such period of time, the performance of the Fund’s Institutional Class would have been substantially similar to, yet higher than, the performance of the Fund’s Investor Class, because the shares of both classes are invested in the same portfolio of securities, but the classes bear different expenses. The Predecessor Fund, Wasatch World Innovators Fund, managed by Wasatch Advisors, Inc., was reorganized into the Seven Canyons World Innovators Fund on September 10, 2018. Seven Canyons Advisors, LLC has been the Fund’s investment adviser since September 10, 2018. Fund performance prior to September 10, 2018 is reflective of the past performance of the Predecessor Fund. |
| Annual Report | September 30, 2018 | 5 |
| Seven Canyons World Innovators Fund | Portfolio Update |
September 30, 2018 (Unaudited)
| (a) | The MSCI ACWI (All Country World Index) IMI (Investable Market Index) is designed to measure the equity market performance of large, mid, and small cap securities across developed and emerging markets throughout the world. |
Returns of less than 1 year are cumulative.
Indices are not actively managed and do not reflect deduction for fees, expenses or taxes. An investor cannot invest directly in an index.
The returns shown above do not reflect the deduction of taxes a shareholder would pay on Fund distributions or redemption of Fund shares.
The total annual operating expenses and total annual operating expenses after fee waivers and/or reimbursement you may pay as an investor in the Fund’s Investor Class and Institutional Class shares (as reported in the September 24, 2018 Prospectus) are 1.94% and 1.75% and 1.94% and 1.55%, respectively. The Fund’s investment adviser has contractually agreed to limit expenses through January 31, 2020.
Top Ten Equity Holdings (as a % of Net Assets)*
| Gamma Communications PLC | 5.99% |
| Sony Corp. | 4.56% |
| Cineworld Group PLC | 4.08% |
| Roku, Inc. | 3.62% |
| Vilmorin & Cie SA | 3.46% |
| Nintendo Co., Ltd. | 3.39% |
| Bandai Namco Holdings, Inc. | 2.89% |
| Skellerup Holdings, Ltd. | 2.81% |
| GAME Digital PLC | 2.81% |
| Advanced Medical Solutions Group PLC | 2.68% |
| Top Ten Holdings | 36.29% |
Sector Allocation (as a % of Net Assets)*
| Communication Services | 29.14% |
| Consumer Discretionary | 24.75% |
| Health Care | 11.59% |
| Information Technology | 9.56% |
| Industrials | 8.03% |
| Consumer Staples | 5.67% |
| Financials | 1.82% |
| Materials | 1.23% |
| Cash | 8.21% |
| Total | 100.00% |
| * | Holdings are subject to change, and may not reflect the current or future position of the portfolio. |
| 6 | www.sevencanyonsadvisors.com |
| Seven Canyons Advisors | Disclosure of Fund Expenses |
September 30, 2018 (Unaudited)
Example. As a shareholder of the Seven Canyons Strategic Income Fund or Seven Canyons World Innovators Fund (the “Funds”), you incur two types of costs: (1) transaction costs; and (2) ongoing costs, including management fees and other Fund expenses. The following examples are intended to help you understand your ongoing costs (in dollars) of investing in a Fund and to compare these costs with the ongoing costs of investing in other mutual funds. The examples are based on an investment of $1,000 invested on April 1, 2018 and held through September 30, 2018.
Actual Expenses. The first line under each class in the following table provides information about actual account values and actual expenses. You may use the information in this line, together with the amount you invested, to estimate the expenses that you paid over the period. Simply divide your account value by $1,000 (for example, an $8,600 account value divided by $1,000 = 8.6), then multiply the result by the number in the first line under the heading “Expenses Paid During Period April 1, 2018 – September 30, 2018” to estimate the expenses you paid on your account during this period.
Hypothetical Example for Comparison Purposes. The second line under each class in the following table provides information about hypothetical account values and hypothetical expenses based on a Fund’s actual expense ratio and an assumed rate of return of 5% per year before expenses, which is not the Fund’s actual return. The hypothetical account values and expenses may not be used to estimate the actual ending account balance or expenses you paid for the period. You may use this information to compare the ongoing costs of investing in a Fund and other mutual funds. To do so, compare this 5% hypothetical example with the 5% hypothetical examples that appear in the shareholder reports of the other funds.
Please note that the expenses shown in the table are meant to highlight your ongoing Fund costs only and do not reflect any transactional costs. Therefore, the second line under each class in the table below is useful in comparing ongoing costs only and will not help you determine the relative total costs of owning different funds. In addition, if these transactional costs were included, your costs would have been higher.
| Annual Report | September 30, 2018 | 7 |
| Seven Canyons Advisors | Disclosure of Fund Expenses |
September 30, 2018 (Unaudited)
| Beginning Account Value April 1, 2018 | Ending Account Value September 30, 2018 | Expense Ratio(a) | Expenses Paid During Period April 1, 2018 - September 30, 2018(b) | |
| Seven Canyons Strategic Income Fund | ||||
| Investor Class | ||||
| Actual | $1,000.00 | $1,089.70 | 0.92% | $4.82 |
| Hypothetical (5% return before expenses) | $1,000.00 | $1,020.46 | 0.92% | $4.66 |
| Seven Canyons World Innovators Fund | ||||
| Investor Class | ||||
| Actual | $1,000.00 | $1,039.60 | 1.83% | $9.36 |
| Hypothetical (5% return before expenses) | $1,000.00 | $1,015.89 | 1.83% | $9.25 |
| Institutional Class | ||||
| Actual | $1,000.00 | $1,041.10 | 1.55% | $7.93 |
| Hypothetical (5% return before expenses) | $1,000.00 | $1,017.30 | 1.55% | $7.84 |
| (a) | Each Fund's expense ratios have been annualized based on the Fund's actual expenses for the 6 month period ending September 30, 2018. |
| (b) | Expenses are equal to the annualized expense ratio shown above for the applicable class, multiplied by the average account value over the period, multiplied by the number of days in the most recent fiscal half year (183), divided by 365. |
| 8 | www.sevencanyonsadvisors.com |
| Seven Canyons Strategic Income Fund | Portfolio of Investments |
September 30, 2018
| Shares | Value (Note 2) | |||||||
| COMMON STOCKS (94.47%) | ||||||||
| Aerospace & Defense (0.08%) | ||||||||
| Avon Rubber PLC | 2,000 | $ | 33,628 | |||||
| Air Freight & Logistics (2.01%) | ||||||||
| FedEx Corp. | 3,300 | 794,607 | ||||||
| Apparel Retail (2.17%) | ||||||||
| Ross Stores, Inc. | 8,668 | 858,999 | ||||||
| Asset Management & Custody Banks (11.12%) | ||||||||
| Ameriprise Financial, Inc. | 3,850 | 568,491 | ||||||
| Ares Capital Corp. | 36,155 | 621,505 | ||||||
| Ares Management LP | 39,500 | 916,400 | ||||||
| Blackstone Group LP | 6,500 | 247,520 | ||||||
| Ellington Financial LLC | 50,100 | 802,101 | ||||||
| Fondul Proprietatea SA GDR | 20,000 | 230,000 | ||||||
| KKR & Co., Inc., Class A | 10,094 | 275,263 | ||||||
| Solar Capital, Ltd. | 34,740 | 742,741 | ||||||
| Total Asset Management & Custody Banks | 4,404,021 | |||||||
| Auto Parts & Equipment (0.93%) | ||||||||
| Aptiv PLC | 4,400 | 369,160 | ||||||
| Broadcasting (1.86%) | ||||||||
| CBS Corp., Class B | 12,860 | 738,807 | ||||||
| Cable & Satellite (5.04%) | ||||||||
| Comcast Corp., Class A | 41,800 | 1,480,138 | ||||||
| Naspers, Ltd., Class N | 2,400 | 517,913 | ||||||
| Total Cable & Satellite | 1,998,051 | |||||||
| Consumer Finance (2.70%) | ||||||||
| Medallion Financial Corp.(a) | 35,913 | 238,821 | ||||||
| SLM Corp.(a) | 18,000 | 200,700 | ||||||
| Transaction Capital, Ltd. | 503,000 | 629,228 | ||||||
| Total Consumer Finance | 1,068,749 | |||||||
| Data Processing & Outsourced Services (8.57%) | ||||||||
| Mastercard, Inc., Class A | 7,685 | 1,710,758 | ||||||
| Visa, Inc. | 11,225 | 1,684,760 | ||||||
| Total Data Processing & Outsourced Services | 3,395,518 | |||||||
| Diversified Banks (2.25%) | ||||||||
| TBC Bank Group PLC | 40,600 | 891,141 | ||||||
See Notes to Financial Statements.
| Annual Report | September 30, 2018 | 9 |
| Seven Canyons Strategic Income Fund | Portfolio of Investments |
September 30, 2018
| Shares | Value (Note 2) | |||||||
| Diversified Banks (continued) | ||||||||
| TCS Group Holding PLC GDR | 100 | $ | 1,850 | |||||
| Total Diversified Banks | 892,991 | |||||||
| Diversified REITs (3.36%) | ||||||||
| Colony Capital, Inc. | 91,000 | 554,190 | ||||||
| Star Asia Capital Corp.(a)(b)(c)(d)(e)(f) | 355,714 | 775,456 | ||||||
| Total Diversified REITs | 1,329,646 | |||||||
| Diversified Support Services (0.03%) | ||||||||
| Self Storage Group ASA | 5,601 | 11,183 | ||||||
| Drug Retail (2.92%) | ||||||||
| Walgreens Boots Alliance, Inc. | 15,879 | 1,157,579 | ||||||
| Financial Exchanges & Data (0.07%) | ||||||||
| MSCI, Inc. | 91 | 16,144 | ||||||
| OTC Markets Group, Inc., Class A | 300 | 8,625 | ||||||
| Warsaw Stock Exchange | 100 | 1,206 | ||||||
| Total Financial Exchanges & Data | 25,975 | |||||||
| Health Care Distributors (0.03%) | ||||||||
| McKesson Corp. | 100 | 13,265 | ||||||
| Health Care Services (2.25%) | ||||||||
| CVS Health Corp. | 11,316 | 890,795 | ||||||
| Home Improvement Retail (3.87%) | ||||||||
| Home Depot, Inc. | 7,400 | 1,532,910 | ||||||
| Homebuilding (0.07%) | ||||||||
| Dom Development SA | 1,598 | 29,474 | ||||||
| Hotels, Resorts & Cruise Lines (2.05%) | ||||||||
| Extended Stay America, Inc. | 40,158 | 812,396 | ||||||
| Industrial Machinery (1.62%) | ||||||||
| Snap-on, Inc. | 3,500 | 642,600 | ||||||
| Integrated Oil & Gas (2.94%) | ||||||||
| Suncor Energy, Inc. | 30,062 | 1,163,240 | ||||||
| IT Consulting & Other Services (3.50%) | ||||||||
| Cognizant Technology Solutions Corp., Class A | 17,950 | 1,384,842 | ||||||
See Notes to Financial Statements.
| 10 | www.sevencanyonsadvisors.com |
| Seven Canyons Strategic Income Fund | Portfolio of Investments |
September 30, 2018
| Shares | Value (Note 2) | |||||||
| Leisure Products (1.39%) | ||||||||
| Photo-Me International PLC | 340,000 | $ | 551,286 | |||||
| Managed Health Care (4.12%) | ||||||||
| UnitedHealth Group, Inc. | 6,140 | 1,633,486 | ||||||
| Mortgage REITs (4.97%) | ||||||||
| Arbor Realty Trust, Inc. | 90 | 1,033 | ||||||
| Blackstone Mortgage Trust, Inc., Class A | 150 | 5,027 | ||||||
| Granite Point Mortgage Trust, Inc. | 100 | 1,928 | ||||||
| Great Ajax Corp. | 62,400 | 849,264 | ||||||
| Starwood Property Trust, Inc. | 51,700 | 1,112,584 | ||||||
| Total Mortgage REITs | 1,969,836 | |||||||
| Movies & Entertainment (1.04%) | ||||||||
| Twenty-First Century Fox, Inc., Class B | 9,000 | 412,380 | ||||||
| Oil & Gas Equipment & Services (0.55%) | ||||||||
| Ocean Yield ASA | 26,600 | 217,670 | ||||||
| Oil & Gas Storage & Transportation (4.19%) | ||||||||
| Golar LNG Partners LP | 34,300 | 491,519 | ||||||
| Magellan Midstream Partners LP | 17,271 | 1,169,592 | ||||||
| Total Oil & Gas Storage & Transportation | 1,661,111 | |||||||
| Personal Products (2.97%) | ||||||||
| Herbalife Nutrition, Ltd.(a) | 9,400 | 512,770 | ||||||
| Nu Skin Enterprises, Inc., Class A | 8,071 | 665,212 | ||||||
| Total Personal Products | 1,177,982 | |||||||
| Railroads (3.21%) | ||||||||
| Canadian National Railway Co. | 14,167 | 1,271,208 | ||||||
| Retail REITs (1.02%) | ||||||||
| Simon Property Group, Inc. | 2,285 | 403,874 | ||||||
| Semiconductor Equipment (1.53%) | ||||||||
| BE Semiconductor Industries NV | 18,955 | 399,880 | ||||||
| Micro-Mechanics Holdings, Ltd. | 155,000 | 206,357 | ||||||
| Total Semiconductor Equipment | 606,237 | |||||||
| Semiconductors (6.44%) | ||||||||
| Microchip Technology, Inc. | 19,050 | 1,503,236 | ||||||
| QUALCOMM, Inc. | 3,000 | 216,090 | ||||||
See Notes to Financial Statements.
| Annual Report | September 30, 2018 | 11 |
| Seven Canyons Strategic Income Fund | Portfolio of Investments |
September 30, 2018
| Shares | Value (Note 2) | |||||||||||
| Semiconductors (continued) | ||||||||||||
| Taiwan Semiconductor Manufacturing Co., Ltd. ADR | 18,815 | $ | 830,870 | |||||||||
| Total Semiconductors | 2,550,196 | |||||||||||
| Specialty Stores (2.25%) | ||||||||||||
| Tractor Supply Co. | 9,800 | 890,624 | ||||||||||
| Trading Companies & Distributors (1.35%) | ||||||||||||
| MSC Industrial Direct Co., Inc., Class A | 5,830 | 513,681 | ||||||||||
| Triton International, Ltd. | 100 | 3,327 | ||||||||||
| WW Grainger, Inc. | 49 | 17,513 | ||||||||||
| Total Trading Companies & Distributors | 534,521 | |||||||||||
| TOTAL COMMON STOCKS (Cost $30,597,237) | 37,428,847 | |||||||||||
| RIGHTS (0.13%) Personal Products (0.13%) | ||||||||||||
| Herbalife Nutrition, Ltd.(a)(b)(c)(d)(e)(f) | 14,761 | $ | 50,926 | |||||||||
| TOTAL RIGHTS (Cost $–) | 50,926 | |||||||||||
| 7-Day Yield | Shares | Value | ||||||||||
| Short Term Investment (5.42%) | ||||||||||||
| Money Market Fund (5.42%) | ||||||||||||
| State Street Institutional US Government Money Market Fund | 1.856 | % | 2,147,766 | 2,147,766 | ||||||||
| TOTAL SHORT TERM INVESTMENT (Cost $2,147,766) | 2,147,766 | |||||||||||
| TOTAL INVESTMENTS (100.02%) (Cost $32,745,003) | $ | 39,627,539 | ||||||||||
| Liabilities in Excess of Other Assets (-0.02%) | (9,645 | ) | ||||||||||
| NET ASSETS (100.00%) | $ | 39,617,894 | ||||||||||
| (a) | Non-income producing security. |
| (b) | As a result of the use of significant unobservable inputs to determine fair value, these investments have been classified as Level 3 assets. See also Note 2 to the financial statements for additional information. |
| (c) | Fair valued security; valued by management in accordance with procedures approved by the Board. As of September 30, 2018, these securities had an aggregate value of $826,382 or 2.09% of total net assets. |
See Notes to Financial Statements.
| 12 | www.sevencanyonsadvisors.com |
| Seven Canyons Strategic Income Fund | Portfolio of Investments |
September 30, 2018
| (d) | Security deemed to be restricted as of As of September 30, 2018. As of September 30, 2018, the market value of restricted securities in the aggregate was $826,382 representing 2.09% of the Fund's net assets. Additional information on restricted securities can be found in Notes 2 and 8. |
| (e) | Security exempt from registration under Rule 144A of the Securities Act of 1933. These securities may be resold in the ordinary course of business in transactions exempt from registration, normally to qualified institutional buyers. As of September 30, 2018, these securities had a total aggregate market value of $826,382 representing 2.09% of net assets. |
| (f) | Illiquid security. |
ADR -American Depositary Receipt.
GDR - Global Depositary Receipt.
REIT - Real Estate Investment Trust.
At September 30, 2018, Seven Canyons Strategic Income Fund's investments, excluding short-term investments, were in the following countries:
| Country | % of Net Assets |
| Bermuda | 0.0(a) |
| Canada | 6.5 |
| Cyprus | 0.0(a) |
| Georgia | 2.4 |
| Great Britain | 2.9 |
| Ireland | 1.0 |
| Netherlands | 1.1 |
| Norway | 0.6 |
| Poland | 0.1 |
| Romania | 0.6 |
| Singapore | 0.6 |
| South Africa | 3.1 |
| Taiwan | 2.2 |
| United States | 78.9 |
| 100.0% |
| (a) | Less than 0.005%. |
See Notes to Financial Statements.
| Annual Report | September 30, 2018 | 13 |
| Seven Canyons World Innovators Fund | Portfolio of Investments |
September 30, 2018
| Shares | Value (Note 2) | |||||||
| COMMON STOCKS (91.63%) | ||||||||
| Aerospace & Defense (2.08%) | ||||||||
| Avon Rubber PLC | 200,000 | $ | 3,362,775 | |||||
| Agricultural Products (5.00%) | ||||||||
| BISI International Tbk PT | 6,000,000 | 684,495 | ||||||
| Sakata Seed Corp. | 50,000 | 1,799,859 | ||||||
| Vilmorin & Cie SA | 80,000 | 5,582,331 | ||||||
| Total Agricultural Products | 8,066,685 | |||||||
| Airport Services (0.44%) | ||||||||
| AGP Corp. | 83,700 | 710,883 | ||||||
| Alternative Carriers (5.99%) | ||||||||
| Gamma Communications PLC | 866,181 | 9,664,080 | ||||||
| Application Software (2.06%) | ||||||||
| eGain Corp.(a) | 103,654 | 839,598 | ||||||
| Tracsis PLC | 265,000 | 2,476,527 | ||||||
| Total Application Software | 3,316,125 | |||||||
| Biotechnology (0.88%) | ||||||||
| BBI Life Sciences Corp. | 2,800,500 | 1,008,822 | ||||||
| Bioventix PLC | 10,000 | 414,481 | ||||||
| Total Biotechnology | 1,423,303 | |||||||
| Computer & Electronics Retail (2.81%) | ||||||||
| GAME Digital PLC(a)(b) | 11,300,000 | 4,528,993 | ||||||
| Construction Machinery & Heavy Trucks (0.70%) | ||||||||
| Morita Holdings Corp. | 50,000 | 1,131,843 | ||||||
| Consumer Electronics (8.56%) | ||||||||
| Fireangel Safety Technology Group PLC | 700,000 | 615,857 | ||||||
| Roku, Inc.(a) | 80,000 | 5,842,400 | ||||||
| Sony Corp. | 120,000 | 7,357,156 | ||||||
| Total Consumer Electronics | 13,815,413 | |||||||
| Data Processing & Outsourced Services (2.97%) | ||||||||
| My EG Services Bhd | 7,000,000 | 2,960,010 | ||||||
| Pagseguro Digital, Ltd.(a) | 66,051 | 1,827,631 | ||||||
| Total Data Processing & Outsourced Services | 4,787,641 | |||||||
See Notes to Financial Statements.
| 14 | www.sevencanyonsadvisors.com |
| Seven Canyons World Innovators Fund | Portfolio of Investments |
September 30, 2018
| Shares | Value (Note 2) | |||||||
| Distributors (0.01%) | ||||||||
| Catur Sentosa Adiprana Tbk PT | 254,100 | $ | 10,061 | |||||
| Electronic Equipment & Instruments (3.31%) | ||||||||
| Catapult Group International, Ltd.(a) | 2,652,485 | 2,109,084 | ||||||
| Eroad, Ltd.(a) | 1,453,358 | 3,236,884 | ||||||
| Total Electronic Equipment & Instruments | 5,345,968 | |||||||
| Fertilizers & Agricultural Chemicals (1.07%) | ||||||||
| Nutrien, Ltd. | 30,000 | 1,731,000 | ||||||
| Financial Exchanges & Data (1.71%) | ||||||||
| Infront ASA | 800,000 | 2,752,265 | ||||||
| Food Retail (0.63%) | ||||||||
| Majestic Wine PLC | 200,000 | 1,016,653 | ||||||
| Health Care Distributors (1.22%) | ||||||||
| PetIQ, Inc.(a) | 50,000 | 1,965,500 | ||||||
| Health Care Facilities (2.01%) | ||||||||
| Japan Animal Referral Medical Center Co., Ltd.(a) | 130,000 | 3,236,842 | ||||||
| Health Care Supplies (3.09%) | ||||||||
| Advanced Medical Solutions Group PLC | 1,002,308 | 4,317,683 | ||||||
| Guerbet | 8,866 | 669,102 | ||||||
| Total Health Care Supplies | 4,986,785 | |||||||
| Health Care Technology (1.66%) | ||||||||
| Computer Programs & Systems, Inc. | 100,000 | 2,685,000 | ||||||
| Home Improvement Retail (0.43%) | ||||||||
| Italtile, Ltd. | 700,000 | 698,453 | ||||||
| Household Appliances (2.22%) | ||||||||
| SodaStream International, Ltd.(a) | 25,000 | 3,577,000 | ||||||
| Industrial Machinery (3.25%) | ||||||||
| Sansei Technologies, Inc. | 50,000 | 710,702 | ||||||
| Skellerup Holdings, Ltd. | 3,200,000 | 4,539,197 | ||||||
| Total Industrial Machinery | 5,249,899 | |||||||
| Interactive Home Entertainment (7.58%) | ||||||||
| Nintendo Co., Ltd. | 15,000 | 5,473,508 | ||||||
| Square Enix Holdings Co., Ltd. | 80,000 | 3,309,277 | ||||||
See Notes to Financial Statements.
| Annual Report | September 30, 2018 | 15 |
| Seven Canyons World Innovators Fund | Portfolio of Investments |
September 30, 2018
| Shares | Value (Note 2) | |||||||
| Interactive Home Entertainment (continued) | ||||||||
| Take-Two Interactive Software, Inc.(a) | 25,000 | $ | 3,449,750 | |||||
| Total Interactive Home Entertainment | 12,232,535 | |||||||
| Internet & Direct Marketing Retail (2.06%) | ||||||||
| AO World PLC(a) | 700,000 | 1,277,333 | ||||||
| Kogan.com, Ltd. | 500,000 | 2,045,666 | ||||||
| Total Internet & Direct Marketing Retail | 3,322,999 | |||||||
| Leisure Facilities (1.29%) | ||||||||
| Goals Soccer Centres PLC(a) | 2,217,500 | 2,081,010 | ||||||
| Leisure Products (4.90%) | ||||||||
| Bandai Namco Holdings, Inc. | 120,000 | 4,662,912 | ||||||
| Photo-Me International PLC | 2,000,000 | 3,242,862 | ||||||
| Total Leisure Products | 7,905,774 | |||||||
| Life Sciences Tools & Services (2.72%) | ||||||||
| Horizon Discovery Group PLC(a) | 600,000 | 1,642,285 | ||||||
| Sartorius Stedim Biotech | 20,000 | 2,751,690 | ||||||
| Total Life Sciences Tools & Services | 4,393,975 | |||||||
| Movies & Entertainment (11.88%) | ||||||||
| AFC Ajax NV | 72,577 | 1,065,959 | ||||||
| Borussia Dortmund GmbH & Co. KGaA | 100,000 | 891,106 | ||||||
| Celtic PLC(a) | 11,649 | 25,128 | ||||||
| Cineplex, Inc. | 130,000 | 3,522,626 | ||||||
| Cineworld Group PLC | 1,600,000 | 6,581,655 | ||||||
| Juventus Football Club SpA(a) | 900,000 | 1,535,025 | ||||||
| Toho Co., Ltd. | 65,000 | 2,039,474 | ||||||
| Walt Disney Co. | 30,000 | 3,508,200 | ||||||
| Total Movies & Entertainment | 19,169,173 | |||||||
| Publishing (1.86%) | ||||||||
| New York Times Co. | 130,000 | 3,009,500 | ||||||
| Research & Consulting Services (1.55%) | ||||||||
| nearmap, Ltd.(a) | 2,000,000 | 2,493,833 | ||||||
| Specialty Chemicals (0.16%) | ||||||||
| Polygiene AB(a) | 357,571 | 255,885 | ||||||
| Specialty Stores (2.47%) | ||||||||
| Fenix Outdoor International AG | 35,000 | 3,993,294 | ||||||
See Notes to Financial Statements.
| 16 | www.sevencanyonsadvisors.com |
| Seven Canyons World Innovators Fund | Portfolio of Investments |
September 30, 2018
| Shares | Value (Note 2) | |||||||
| Technology Hardware, Storage & Peripherals (1.23%) | ||||||||
| MIMAKI ENGINEERING Co., LTD. | 200,000 | $ | 1,978,525 | |||||
| Wireless Telecommunication Services (1.83%) | ||||||||
| Sarana Menara Nusantara Tbk PT | 90,000,000 | 2,947,354 | ||||||
| TOTAL COMMON STOCKS (Cost $126,372,347) | 147,847,024 | |||||||
| LIMITED PARTNERSHIP INTEREST (0.12%) | ||||||||
| Greenspring Global Partners II LP(c)(d)(e)(f) | 1 | 183,043 | ||||||
| TOTAL LIMITED PARTNERSHIP INTEREST (Cost $185,658) | 183,043 | |||||||
| RIGHTS (0.04%) | ||||||||
| Personal Products (0.04%) | ||||||||
| Herbalife Nutrition, Ltd.(a)(c)(d)(e)(f)(g) | 19,023 | $ | 65,629 | |||||
| TOTAL RIGHTS (Cost $–) | 65,629 | |||||||
| 7-Day Yield | Shares | Value | ||||||||||
| Short Term Investment (7.55%) | ||||||||||||
| Money Market Fund (7.55%) | ||||||||||||
| State Street Institutional US Government Money Market Fund | 1.856 | % | 12,190,491 | 12,190,491 | ||||||||
| TOTAL SHORT TERM INVESTMENT (Cost $12,190,491) | 12,190,491 | |||||||||||
| TOTAL INVESTMENTS (99.34%) (Cost $138,748,496) | $ | 160,286,187 | ||||||||||
| Other Assets In Excess Of Liabilities (0.66%) | 1,061,519 | |||||||||||
| NET ASSETS (100.00%) | $ | 161,347,706 |
| (a) | Non-income producing security. |
| (b) | Affiliated security. See Note 9 in Notes to Financial Statements. |
| (c) | Fair valued security; valued by management in accordance with procedures approved by the Board. As of September 30, 2018, these securities had an aggregate value of $248,672 or 0.16% of total net assets. |
See Notes to Financial Statements.
| Annual Report | September 30, 2018 | 17 |
| Seven Canyons World Innovators Fund | Portfolio of Investments |
September 30, 2018
| (d) | Security deemed to be restricted as of As of September 30, 2018. As of September 30, 2018, the market value of restricted securities in the aggregate was $248,672 representing 0.16% of the Fund's net assets. Additional information on restricted securities can be found in Notes 2 and 8. |
| (e) | Security exempt from registration under Rule 144A of the Securities Act of 1933. These securities may be resold in the ordinary course of business in transactions exempt from registration, normally to qualified institutional buyers. As of September 30, 2018, these securities had a total aggregate market value of $248,672 representing 0.16% of net assets. |
| (f) | Illiquid security. |
| (g) | As a result of the use of significant unobservable inputs to determine fair value, these investments have been classified as Level 3 assets. See also Note 2 to the financial statements for additional information. |
At September 30, 2018, Seven Canyons World Innovators Fund's investments, excluding short-term investments, were in the following countries:
| Country | % of Net Assets |
| Australia | 4.5 |
| Brazil | 1.2 |
| Canada | 3.5 |
| China | 0.7 |
| France | 6.1 |
| Germany | 0.6 |
| Great Britain | 27.9 |
| Indonesia | 2.5 |
| Israel | 2.4 |
| Italy | 1.0 |
| Japan | 21.9 |
| Malaysia | 2.0 |
| Netherlands | 0.7 |
| New Zealand | 5.3 |
| Norway | 1.9 |
| South Africa | 0.5 |
| Sweden | 0.2 |
| Switzerland | 2.7 |
| United States | 14.4 |
| 100.0% |
See Notes to Financial Statements.
| 18 | www.sevencanyonsadvisors.com |
| Seven Canyons Advisors | Statements of Assets and Liabilities |
September 30, 2018
| SEVEN CANYONS STRATEGIC INCOME FUND | SEVEN CANYONS WORLD INNOVATORS FUND | |||||||
| ASSETS: | ||||||||
| Investments, at value (Cost $32,745,003 and $133,580,403) | $ | 39,627,539 | $ | 155,757,194 | ||||
| Investments in affiliates, at value (Cost $– and $5,168,093) | – | 4,528,993 | ||||||
| Cash & Cash Equivalents | 4,679 | 23,983 | ||||||
| Foreign currency, at value (Cost $523 and $222,251, respectively) | 884 | 217,967 | ||||||
| Receivable for investments sold | – | 628,095 | ||||||
| Receivable for shares sold | – | 52,303 | ||||||
| Dividends and interest receivable | 67,618 | 474,373 | ||||||
| Other Assets | 6,911 | 17,935 | ||||||
| Total Assets | 39,707,631 | 161,700,843 | ||||||
| LIABILITIES: | ||||||||
| Payable for administration and transfer agency fees | 25,444 | 98,597 | ||||||
| Payable for shares redeemed | 21,244 | 29 | ||||||
| Payable to adviser | 12,194 | 172,160 | ||||||
| Payable for printing | 6,552 | 17,275 | ||||||
| Payable for professional fees | 21,041 | 24,290 | ||||||
| Payable to trustees | 62 | 248 | ||||||
| Payable to Chief Compliance Officer | 397 | 1,937 | ||||||
| Accrued expenses and other liabilities | 2,803 | 38,601 | ||||||
| Total Liabilities | 89,737 | 353,137 | ||||||
| NET ASSETS | $ | 39,617,894 | $ | 161,347,706 | ||||
| NET ASSETS CONSIST OF: | ||||||||
| Paid-in capital (Note 5) | $ | 34,060,372 | $ | 112,518,640 | ||||
| Total distributable earnings | 5,557,522 | 48,829,066 | ||||||
| NET ASSETS | $ | 39,617,894 | $ | 161,347,706 | ||||
See Notes to Financial Statements.
| Annual Report | September 30, 2018 | 19 |
| Seven Canyons Advisors | Statements of Assets and Liabilities |
September 30, 2018
| SEVEN CANYONS STRATEGIC INCOME FUND | SEVEN CANYONS WORLD INNOVATORS FUND | |||||||
| PRICING OF SHARES | ||||||||
| Investor Class: | ||||||||
| Net Asset Value, offering and redemption price per share | $ | 12.74 | $ | 22.59 | ||||
| Net Assets | $ | 39,617,894 | $ | 153,187,228 | ||||
| Shares of beneficial interest outstanding | 3,110,329 | 6,782,026 | ||||||
| Institutional Class: | ||||||||
| Net Asset Value, offering and redemption price per share | N/A | $ | 22.78 | |||||
| Net Assets | N/A | $ | 8,160,478 | |||||
| Shares of beneficial interest outstanding | N/A | 358,304 | ||||||
See Notes to Financial Statements.
| 20 | www.sevencanyonsadvisors.com |
| Seven Canyons Advisors | Statements of Operations |
For the Year Ended September 30, 2018
SEVEN CANYONS | SEVEN CANYONS | |||||||
| INVESTMENT INCOME: | ||||||||
| Interest | $ | 14,847 | $ | 96,756 | ||||
| Dividends from unaffiliated issuers | 1,356,089 | 2,468,756 | ||||||
| Foreign taxes withheld | (35,344 | ) | (187,947 | ) | ||||
| Total Investment Income | 1,335,592 | 2,377,565 | ||||||
| EXPENSES: | ||||||||
| Investment advisory fees (Note 6) | 353,231 | 3,080,911 | ||||||
| Administration fees | 31,133 | 88,666 | ||||||
| Custodian fees | 5,472 | 76,887 | ||||||
| Legal fees | 4,249 | 17,396 | ||||||
| Audit and tax fees | 25,028 | 19,551 | ||||||
| Transfer agent fees | 68,495 | 314,996 | ||||||
| Trustees fees and expenses | 6,649 | 28,913 | ||||||
| Registration and filing fees | 18,608 | 42,822 | ||||||
| Printing fees | 11,354 | 33,524 | ||||||
| Chief Compliance Officer fees | 397 | 1,937 | ||||||
| Insurance expense | 927 | 3,652 | ||||||
| Interest on loan | 3,410 | 6,028 | ||||||
| Other expenses | 9,425 | 32,439 | ||||||
| Total Expenses | 538,378 | 3,747,722 | ||||||
| Less fees waived/reimbursed by investment adviser | ||||||||
| Investor Class (Note 6) | (65,279 | ) | (23,137 | ) | ||||
| Institutional Class (Note 6) | – | (29,310 | ) | |||||
| Total fees waived/reimbursed by investment adviser | (65,279 | ) | (52,447 | ) | ||||
| Net Expenses | 473,099 | 3,695,275 | ||||||
| NET INVESTMENT INCOME/(LOSS) | 862,493 | (1,317,710 | ) | |||||
| REALIZED AND UNREALIZED GAIN/(LOSS) ON INVESTMENTS AND FOREIGN CURRENCY: | ||||||||
| Net realized gain/(loss) on: | ||||||||
| Unaffiliated Investments | 4,716,690 | 40,185,226 | ||||||
| Foreign currency transactions | (1,440 | ) | (114,320 | ) | ||||
| Net realized gain | 4,715,250 | 40,070,906 | ||||||
| Change in unrealized appreciation/(depreciation) on: | ||||||||
| Unaffiliated Investments | (319,193 | ) | (13,312,134 | ) | ||||
| Affiliated Investments | – | (639,100 | ) | |||||
| Translation of asset and liabilities denominated in foreign currency | 308 | (5,647 | ) | |||||
| Net change | (318,885 | ) | (13,956,881 | ) | ||||
See Notes to Financial Statements.
| Annual Report | September 30, 2018 | 21 |
| Seven Canyons Advisors | Statements of Operations |
For the Year Ended September 30, 2018
SEVEN CANYONS | SEVEN CANYONS | |||||||
| NET REALIZED AND UNREALIZED GAIN ON INVESTMENTS AND FOREIGN CURRENCY | 4,396,365 | 26,114,025 | ||||||
| NET INCREASE IN NET ASSETS RESULTING FROM OPERATIONS | $ | 5,258,858 | $ | 24,796,315 | ||||
| (a) | Effective September 10, 2018, the Seven Canyons Strategic Income Fund merged into the ALPS Series Trust. The Fund was previously advised by Wasatch Advisors, Inc., and was recognized as the Wasatch Strategic Income Fund. |
| (b) | Effective September 10, 2018, the Seven Canyons World Innovators Fund merged into the ALPS Series Trust. The Fund was previously advised by Wasatch Advisors, Inc., and was recognized as the Wasatch World Innovators Fund. |
See Notes to Financial Statements.
| 22 | www.sevencanyonsadvisors.com |
| Seven Canyons | |
| Strategic Income Fund | Statements of Changes in Net Assets |
For the Year | For the Year Ended September 30, 2017 | |||||||
| OPERATIONS: | ||||||||
| Net investment income | $ | 862,493 | $ | 721,341 | ||||
| Net realized gain | 4,715,250 | 2,719,511 | ||||||
| Net change in unrealized appreciation/(depreciation) | (318,885 | ) | 2,097,330 | |||||
| Net increase in net assets resulting from operations | 5,258,858 | 5,538,182 | ||||||
| TOTAL DISTRIBUTIONS TO SHAREHOLDERS:(b) | ||||||||
| Investor Class | (1,098,927 | ) | (516,716 | ) | ||||
| Total distributions | (1,098,927 | ) | (516,716 | ) | ||||
| BENEFICIAL SHARE TRANSACTIONS (Note 5): | ||||||||
| Investor Class | ||||||||
| Shares sold | 16,148,550 | 3,250,647 | ||||||
| Dividends reinvested | 1,082,568 | 509,614 | ||||||
| Shares redeemed | (26,818,552 | ) | (18,849,418 | ) | ||||
| Redemption fees | 695 | 561 | ||||||
| Net decrease from beneficial share transactions | (9,586,739 | ) | (15,088,596 | ) | ||||
| Net decrease in net assets | (5,426,808 | ) | (10,067,130 | ) | ||||
| NET ASSETS: | ||||||||
| Beginning of year | 45,044,702 | 55,111,832 | ||||||
| End of year(b) | $ | 39,617,894 | $ | 45,044,702 | ||||
| (a) | Effective September 10, 2018, the Seven Canyons Strategic Income Fund merged into the ALPS Series Trust. The Fund was previously advised by Wasatch Advisors, Inc., and was recognized as the Wasatch Strategic Income Fund. |
| (b) | For the prior year ended September 30, 2017, Seven Canyons Strategic Income Fund had Total Distributions consisting of Net Investment Income of $516,716, and Net Realized Gains of $0 and Net Assets included accumulated net investment loss of $69,552. |
See Notes to Financial Statements.
| Annual Report | September 30, 2018 | 23 |
| Seven Canyons | |
| World Innovators Fund | Statements of Changes in Net Assets |
For the Year | For the Year Ended September 30, 2017 | |||||||
| OPERATIONS: | ||||||||
| Net investment loss | $ | (1,317,710 | ) | $ | (1,034,505 | ) | ||
| Net realized gain | 40,070,906 | 21,819,097 | ||||||
| Net change in unrealized appreciation/(depreciation) | (13,956,881 | ) | 15,415,124 | |||||
| Net increase in net assets resulting from operations | 24,796,315 | 36,199,716 | ||||||
| TOTAL DISTRIBUTIONS TO SHAREHOLDERS:(b) | ||||||||
| Investor Class | (27,785,763 | ) | (6,256,560 | ) | ||||
| Institutional Class | (635,561 | ) | (128,118 | ) | ||||
| Total distributions | (28,421,324 | ) | (6,384,678 | ) | ||||
| BENEFICIAL SHARE TRANSACTIONS (Note 5): | ||||||||
| Investor Class | ||||||||
| Shares sold | 41,810,867 | 18,432,994 | ||||||
| Dividends reinvested | 27,070,171 | 6,041,921 | ||||||
| Shares redeemed | (102,936,752 | ) | (56,466,951 | ) | ||||
| Redemption fees | 12,022 | 2,501 | ||||||
| Net decrease from beneficial share transactions | (34,043,692 | ) | (31,989,535 | ) | ||||
| Institutional Class | ||||||||
| Shares sold | 4,386,142 | 5,854,133 | ||||||
| Dividends reinvested | 621,806 | 128,118 | ||||||
| Shares redeemed | (848,095 | ) | (8,754,213 | ) | ||||
| Net increase/(decrease) from beneficial share transactions | 4,159,853 | (2,771,262 | ) | |||||
| Net decrease in net assets | (33,508,848 | ) | (4,946,459 | ) | ||||
| NET ASSETS: | ||||||||
| Beginning of year | 194,856,554 | 199,803,013 | ||||||
| End of year(b) | $ | 161,347,706 | $ | 194,856,554 | ||||
| (a) | Effective September 10, 2018, the Seven Canyons World Innovators Fund merged into the ALPS Series Trust. The Fund was previously advised by Wasatch Advisors, Inc., and was recognized as the Wasatch World Innovators Fund. |
| (b) | For the prior year ended September 30, 2017, Seven Canyons World Innovators Fund had Total Distributions consisting of Net Investment Income of $0, and Net Realized Gains of $6,384,678 and Net Assets included accumulated net investment loss of $41,744. |
See Notes to Financial Statements.
| 24 | www.sevencanyonsadvisors.com |
Page Intentionally Left Blank
| Seven Canyons | |
| Strategic Income Fund – Investor Class | Financial Highlights |
For a Share Outstanding Throughout the Years Presented
| NET ASSET VALUE, BEGINNING OF YEAR |
| INCOME/(LOSS) FROM OPERATIONS: |
| Net investment income |
| Net realized and unrealized gain/(loss) on investments |
| Total from investment operations |
| LESS DISTRIBUTIONS: |
| From net investment income |
| From net realized gains on investments |
| Tax return of capital |
| Total distributions |
| REDEMPTION FEES ADDED TO PAID IN CAPITAL |
| NET INCREASE/(DECREASE) IN NET ASSET VALUE |
| NET ASSET VALUE, END OF YEAR |
| TOTAL RETURN(d) |
| SUPPLEMENTAL DATA: |
| Net assets, end of year (in 000s) |
| RATIOS TO AVERAGE NET ASSETS |
| Operating expenses excluding reimbursement/waiver |
| Operating expenses including reimbursement/waiver |
| Net investment income including reimbursement/waiver |
| PORTFOLIO TURNOVER RATE |
See Notes to Financial Statements.
| 26 | www.sevencanyonsadvisors.com |
| Seven Canyons | |
| Strategic Income Fund – Investor Class | Financial Highlights |
For a Share Outstanding Throughout the Years Presented
For the Year | For the Year Ended September 30, 2017 | For the Year | For the Year Ended September 30, 2015 | For the Year Ended September 30, 2014 | ||||||||||||||
| $ | 11.78 | $ | 10.62 | $ | 10.49 | $ | 12.63 | $ | 11.08 | |||||||||
| 0.21 | (b) | 0.16 | 0.26 | 0.30 | 0.32 | |||||||||||||
| 1.04 | 1.12 | 0.49 | (1.38 | ) | 1.74 | |||||||||||||
| 1.25 | 1.28 | 0.75 | (1.08 | ) | 2.06 | |||||||||||||
| (0.29 | ) | (0.12 | ) | (0.23 | ) | (0.44 | ) | (0.35 | ) | |||||||||
| – | – | (0.35 | ) | (0.62 | ) | (0.16 | ) | |||||||||||
| – | – | (0.04 | ) | – | – | |||||||||||||
| (0.29 | ) | (0.12 | ) | (0.62 | ) | (1.06 | ) | (0.51 | ) | |||||||||
| 0.00 | (c) | – | – | – | – | |||||||||||||
| 0.96 | 1.16 | 0.13 | (2.14 | ) | 1.55 | |||||||||||||
| $ | 12.74 | $ | 11.78 | $ | 10.62 | $ | 10.49 | $ | 12.63 | |||||||||
| 10.71 | % | 12.09 | % | 7.38 | % | (9.54 | %) | 18.94 | % | |||||||||
| $ | 39,618 | $ | 45,045 | $ | 55,112 | $ | 88,661 | $ | 94,958 | |||||||||
| 1.08 | % | 1.10 | % | 1.04 | % | 0.95 | % | 0.96 | % | |||||||||
| 0.95 | % | 0.95 | % | 0.95 | % | 0.95 | % | 0.95 | % | |||||||||
| 1.71 | % | 1.12 | % | 2.50 | % | 2.51 | % | 2.59 | % | |||||||||
| 72 | % | 34 | % | 45 | % | 78 | % | 69 | % | |||||||||
| (a) | Effective September 10, 2018, the Seven Canyons Strategic Income Fund merged into the ALPS Series Trust. The Fund was previously advised by Wasatch Advisors, Inc., and was recognized as the Wasatch Strategic Income Fund. |
| (b) | Per share amounts are based upon average shares outstanding. |
| (c) | Less than $0.005 per share. |
| (d) | Assumes an initial investment on the business day before the first day of the fiscal period, with all dividends and distributions reinvested in additional shares on the reinvestment date, and redemption at the net asset value calculated on the last business day of the fiscal period. Total returns are for the period indicated and have not been annualized. Total returns would have been lower had certain expenses not been waived during the period. Returns shown do not reflect the deduction of taxes that a shareholder would pay on Fund distributions or the redemption of Fund shares. |
See Notes to Financial Statements.
| Annual Report | September 30, 2018 | 27 |
| Seven Canyons World Innovators Fund – Investor Class | Financial Highlights |
For a Share Outstanding Throughout the Years Presented
| NET ASSET VALUE, BEGINNING OF YEAR |
| INCOME/(LOSS) FROM OPERATIONS: |
| Net investment loss |
| Net realized and unrealized gain on investments |
| Total from investment operations |
| LESS DISTRIBUTIONS: |
| From net realized gains on investments |
| Total distributions |
| REDEMPTION FEES ADDED TO PAID IN CAPITAL |
| NET INCREASE/(DECREASE) IN NET ASSET VALUE |
| NET ASSET VALUE, END OF YEAR |
| TOTAL RETURN(d) |
| SUPPLEMENTAL DATA: |
| Net assets, end of year (in 000s) |
| RATIOS TO AVERAGE NET ASSETS |
| Operating expenses excluding reimbursement/waiver |
| Operating expenses including reimbursement/waiver |
| Net investment income including reimbursement/waiver |
| PORTFOLIO TURNOVER RATE |
See Notes to Financial Statements.
| 28 | www.sevencanyonsadvisors.com |
| Seven Canyons World Innovators Fund – Investor Class | Financial Highlights |
For a Share Outstanding Throughout the Years Presented
| For the Year Ended September 30, 2018(a) | For the Year Ended September 30, 2017 | For the Year Ended September 30, 2016 | For the Year Ended September 30, 2015 | For the Year Ended September 30, 2014 | ||||||||||||||
| $ | 22.75 | $ | 19.32 | $ | 20.17 | $ | 22.62 | $ | 23.15 | |||||||||
| (0.14 | )(b) | (0.13 | ) | (0.12 | ) | (0.21 | ) | (0.24 | ) | |||||||||
| 3.30 | 4.26 | 1.90 | 0.30 | 0.91 | ||||||||||||||
| 3.16 | 4.13 | 1.78 | 0.09 | 0.67 | ||||||||||||||
| (3.32 | ) | (0.70 | ) | (2.63 | ) | (2.54 | ) | (1.20 | ) | |||||||||
| (3.32 | ) | (0.70 | ) | (2.63 | ) | (2.54 | ) | (1.20 | ) | |||||||||
| 0.00 | (c) | – | – | – | – | |||||||||||||
| (0.16 | ) | 3.43 | (0.85 | ) | (2.45 | ) | (0.53 | ) | ||||||||||
| $ | 22.59 | $ | 22.75 | $ | 19.32 | $ | 20.17 | $ | 22.62 | |||||||||
| 14.77 | % | 22.23 | % | 8.97 | % | 0.32 | % | 2.69 | % | |||||||||
| $ | 153,187 | $ | 191,021 | $ | 193,826 | $ | 186,272 | $ | 253,311 | |||||||||
| 1.82 | % | 1.83 | % | 1.78 | % | 1.76 | % | 1.73 | % | |||||||||
| 1.81 | % | 1.83 | % | 1.78 | % | 1.76 | % | 1.73 | % | |||||||||
| (0.65 | %) | (0.57 | %) | (0.66 | %) | (0.76 | %) | (0.89 | %) | |||||||||
| 159 | % | 91 | % | 112 | % | 100 | % | 111 | % | |||||||||
| (a) | Effective September 10, 2018, the Seven Canyons World Innovators Fund merged into the ALPS Series Trust. The Fund was previously advised by Wasatch Advisors, Inc., and was recognized as the Wasatch World Innovators Fund. |
| (b) | Per share amounts are based upon average shares outstanding. |
| (c) | Less than $0.005 per share. |
| (d) | Assumes an initial investment on the business day before the first day of the fiscal period, with all dividends and distributions reinvested in additional shares on the reinvestment date, and redemption at the net asset value calculated on the last business day of the fiscal period. Total returns are for the period indicated and have not been annualized. Total returns would have been lower had certain expenses not been waived during the period. Returns shown do not reflect the deduction of taxes that a shareholder would pay on Fund distributions or the redemption of Fund shares. |
See Notes to Financial Statements.
| Annual Report | September 30, 2018 | 29 |
| Seven Canyons World Innovators Fund – Institutional Class | Financial Highlights |
For a Share Outstanding Throughout the Years Presented
| NET ASSET VALUE, BEGINNING OF PERIOD |
| INCOME/(LOSS) FROM OPERATIONS: |
| Net investment income/(loss) |
| Net realized and unrealized gain on investments |
| Total from investment operations |
| LESS DISTRIBUTIONS: |
| From net realized gains on investments |
| Total distributions |
| NET INCREASE/(DECREASE) IN NET ASSET VALUE |
| NET ASSET VALUE, END OF PERIOD |
| TOTAL RETURN(e) |
| SUPPLEMENTAL DATA: |
| Net assets, end of period (in 000s) |
| RATIOS TO AVERAGE NET ASSETS |
| Operating expenses excluding reimbursement/waiver |
| Operating expenses including reimbursement/waiver |
| Net investment income including reimbursement/waiver |
| PORTFOLIO TURNOVER RATE |
See Notes to Financial Statements.
| 30 | www.sevencanyonsadvisors.com |
| Seven Canyons World Innovators Fund – Institutional Class | Financial Highlights |
For a Share Outstanding Throughout the Years Presented
| For the Year Ended September 30, 2018(a) | For the Year Ended September 30, 2017 | For the Period Ended September 30, 2016(b) | |||||||||
| $ | 22.87 | $ | 19.36 | $ | 17.54 | ||||||
| (0.05 | )(c) | (0.09 | ) | 0.00 | (d) | ||||||
| 3.28 | 4.30 | 1.82 | |||||||||
| 3.23 | 4.21 | 1.82 | |||||||||
| (3.32 | ) | (0.70 | ) | – | |||||||
| (3.32 | ) | (0.70 | ) | – | |||||||
| (0.09 | ) | 3.51 | 1.82 | ||||||||
| $ | 22.78 | $ | 22.87 | $ | 19.36 | ||||||
| 15.03 | % | 22.55 | % | 10.38 | % | ||||||
| $ | 8,160 | $ | 3,836 | $ | 5,977 | ||||||
| 2.05 | % | 2.22 | % | 3.69 | %(f) | ||||||
| 1.55 | % | 1.55 | % | 1.55 | %(f) | ||||||
| (0.23 | %) | (0.29 | %) | 0.01 | %(f) | ||||||
| 159 | % | 91 | % | 112 | % | ||||||
| (a) | Effective September 10, 2018, the Seven Canyons World Innovators Fund merged into the ALPS Series Trust. The Fund was previously advised by Wasatch Advisors, Inc., and was recognized as the Wasatch World Innovators Fund. |
| (b) | Commenced operations on February 2, 2016. |
| (c) | Per share amounts are based upon average shares outstanding. |
| (d) | Less than $0.005 per share. |
| (e) | Assumes an initial investment on the business day before the first day of the fiscal period, with all dividends and distributions reinvested in additional shares on the reinvestment date, and redemption at the net asset value calculated on the last business day of the fiscal period. Total returns are for the period indicated and have not been annualized. Total returns would have been lower had certain expenses not been waived during the period. Returns shown do not reflect the deduction of taxes that a shareholder would pay on Fund distributions or the redemption of Fund shares. |
| (f) | Annualized. |
See Notes to Financial Statements.
| Annual Report | September 30, 2018 | 31 |
| Seven Canyons Advisors | Notes to Financial Statements |
September 30, 2018
1. ORGANIZATION
ALPS Series Trust (the “Trust”), a Delaware statutory trust, is an open-end management investment company registered under the Investment Company Act of 1940, as amended (the “1940 Act”). The Trust consists of multiple separate portfolios or series. This annual report describes the Seven Canyons Strategic Income Fund (previously Wasatch Strategic Income Fund) and Seven Canyons World Innovators Fund (previously Wasatch World Innovators Fund) (each individually the “Fund” or collectively the “Funds”). The Seven Canyons Strategic Income Fund’s primary investment objective is to capture current income and the Seven Canyons World Innovators Fund’s primary investment objective is long-term growth of capital. The Funds are each classified as diversified under the 1940 Act. The Seven Canyons Strategic Income Fund currently offers Investor Class shares and the Seven Canyons World Innovators Fund currently offers Investor Class and Institutional Class shares. Each share class has identical rights to earnings, assets and voting privileges, except for class specific expenses and exclusive rights to vote on matters affecting only individual classes. The Board of Trustees (the “Board”) may establish additional funds and classes of shares at any time in the future without shareholder approval.
The Seven Canyons Strategic Income Fund is the successor in interest to the Wasatch Strategic Income Fund (the “Predecessor Income Fund”), and was included as a series of another investment company, Wasatch Funds Trust (“Predecessor Trust”), and that was advised by Wasatch Advisors, Inc. On August 30, 2018, the shareholders of the Predecessor Income Fund approved the reorganization of the Investor Class Shares of the Predecessor Income Fund with and into the Investor Class Shares of the Seven Canyons Strategic Income Fund, and effective as of the close of business on September 7, 2018, the assets and liabilities of the Predecessor Income Fund were transferred to the Trust in exchange for shares in the Seven Canyons Strategic Income Fund. Costs incurred by the Seven Canyons Strategic Income Fund in connection with the reorganization were paid by Seven Canyons Advisors, LLC (the “Adviser”). The prior fiscal year end of the Predecessor Income Fund was September 30, 2017. Operations prior to September 10, 2018 were for the Predecessor Income Fund. The reorganization was accomplished by a tax-free exchange of 3,135,552 shares of the Predecessor Income Fund’s shares, valued at $39,522,919 for the exact same shares and value of the Seven Canyon Strategic Income Fund’s shares. For financial reporting purposes, assets received and shares issued by the Seven Canyon Strategic Income were recorded at fair value; however, the cost basis of the investments received from the Predecessor Income Fund was carried forward to align ongoing reporting of the Seven Canyon Strategic Income Fund’s’s realized and unrealized gains and losses with amounts distributable to shareholders for tax purposes. Immediately prior to the reorganization, the net assets of the Predecessor Income Fund were $39,522,919, including $6,277,490 of net unrealized appreciation, $104,284 of undistributed (accumulated) net investment income, and $1,242,774 of undistributed (accumulated) net realized loss.
The Seven Canyons World Innovators Fund is the successor in interest to the Wasatch World Innovators Fund (the “Predecessor Innovators Fund”), and was included as a series of another investment company, Wasatch Funds Trust (“Predecessor Trust”), and that was advised by Wasatch Advisors, Inc. On August 30, 2018, the shareholders of the Predecessor Innovators Fund approved the reorganization of the Investor Class Shares and Institutional Class Shares of the Predecessor Innovators Fund with and into the Investor Class Shares and Institutional Class Shares of the Seven Canyons World Innovators Fund, and effective as of the close of business on September 7, 2018, the assets and liabilities of the Predecessor Innovators Fund were transferred to the Trust in exchange for shares in the Seven Canyons World Innovators Fund. Costs incurred by the Seven Canyons World Innovators Fund in connection with the reorganization were paid by the Adviser. The prior fiscal year end of the Predecessor Innovators Fund was September 30, 2017. Operations prior to September 10, 2018 were for the Predecessor Innovators Fund. The reorganization was accomplished by a tax-free exchange of 7,210,951 shares of the Predecessor Innovators Fund’s shares, valued at $159,106,188 for the exact same shares and value of the Seven Canyons World Innovators Fund’s shares. For financial reporting purposes, assets received and shares issued by the Seven Canyons World Innovators Fund were recorded at fair value; however, the cost basis of the investments received from the Predecessor Innovators Fund was carried forward to align ongoing reporting of the Seven Canyons World Innovators Fund’s realized and unrealized gains and losses with amounts distributable to shareholders for tax purposes. Immediately prior to the reorganization, the net assets of the Predecessor Innovators Fund were $159,106,188, including $18,117,450 of net unrealized appreciation, $1,708,046 of undistributed (accumulated) net investment loss, and $28,540,462 of undistributed (accumulated) net realized gain.
32 | www.sevencanyonsadvisors.com |
Seven Canyons Advisors | Notes to Financial Statements |
September 30, 2018
The reorganizations did not result in any material changes to either of the existing Fund’s investment objectives or principal investment strategies or fundamental investment restrictions. However, upon completion of the reorganization, Seven Canyons Advisors, LLC, a registered investment advisor recently created by members of the Stewart family, will serve as the new Advisor to the Funds. Mr. Samuel Stewart, the founder of Wasatch Advisors, Inc. and the portfolio manager of the Wasatch Strategic Income Fund and co-portfolio manager of the Wasatch World Innovators Fund along with his son, Mr. Josh Stewart, co-portfolio manager of the Wasatch World Innovators Funds, have determined to join Seven Canyons Advisors, LLC.
The primary purpose of the reorganization was to move the existing Funds from their existing trust to another multi-series trust. The Funds will have the same investment objective(s) and substantially similar principal investment strategies, managed by the same portfolio manager(s) as the corresponding predecessor Fund; and the contractual expense cap of each Fund would be the same (and lower with respect to the Investor Class shares of the Seven Canyons World Innovators Fund) as the contractual expense limitations of the corresponding classes of the corresponding predecessor Funds.
2. SIGNIFICANT ACCOUNTING POLICIES
The accompanying financial statements were prepared in accordance with accounting principles generally accepted in the United States of America for investment companies (“U.S. GAAP”). Each Fund is considered an investment company under U.S. GAAP and follows the accounting and reporting guidance applicable to investment companies in the Financial Accounting Standards Board Accounting Standards Codification Topic 946. The preparation of financial statements in conformity with U.S. GAAP requires management to make certain estimates and assumptions that affect the reported amounts of assets and liabilities and disclosures of contingent assets and liabilities at the date of the financial statements and the reported amounts of revenue and expenses during the period. Actual results could differ from those estimates. The following is a summary of significant accounting policies consistently followed by each Fund in preparation of its financial statements.
Annual Report | September 30, 2018 | 33 |
Seven Canyons Advisors | Notes to Financial Statements |
September 30, 2018
Investment Valuation: Each Fund generally values its securities based on market prices determined at the close of regular trading on the New York Stock Exchange (“NYSE”), normally 4:00 p.m. Eastern Time, on each day the NYSE is open for trading.
For equity securities and mutual funds that are traded on an exchange, the market price is usually the closing sale or official closing price on that exchange. In the case of equity securities not traded on an exchange, or if such closing prices are not otherwise available, the securities are valued at the mean of the most recent bid and ask prices on such day.
Redeemable securities issued by open-end registered investment companies are valued at the investment company’s applicable net asset value, with the exception of exchange-traded open-end investment companies, which are priced as equity securities.
When such prices or quotations are not available, or when the Fair Value Committee appointed by the Board believes that they are unreliable, securities may be priced using fair value procedures approved by the Board.
Fair Value Measurements: The Funds disclose the classification of their fair value measurements following a three-tier hierarchy based on the inputs used to measure fair value. Inputs refer broadly to the assumptions that market participants would use in pricing the asset or liability, including assumptions about risk. Inputs may be observable or unobservable. Observable inputs reflect the assumptions market participants would use in pricing the asset or liability that are developed based on market data obtained from sources independent of the reporting entity. Unobservable inputs reflect the reporting entity’s own assumptions about the assumptions market participants would use in pricing the asset or liability that are developed based on the best information available.
Various inputs are used in determining the value of the Funds’ investments as of the end of the reporting period. When inputs used fall into different levels of the fair value hierarchy, the level in the hierarchy within which the fair value measurement falls is determined based on the lowest level input that is significant to the fair value measurement in its entirety. The designated input levels are not necessarily an indication of the risk or liquidity associated with these investments. These inputs are categorized in the following hierarchy under applicable financial accounting standards:
| Level 1 – | Unadjusted quoted prices in active markets for identical investments, unrestricted assets or liabilities that the Fund has the ability to access at the measurement date; |
| Level 2 – | Quoted prices which are not active, quoted prices for similar assets or liabilities in active markets or inputs other than quoted prices that are observable (either directly or indirectly); and |
| Level 3 – | Significant unobservable prices or inputs (including the Fund’s own assumptions in determining the fair value of investments) where there is little or no market activity for the asset or liability at the measurement date. |
34 | www.sevencanyonsadvisors.com |
Seven Canyons Advisors | Notes to Financial Statements |
September 30, 2018
The following is a summary of the inputs used to value the Funds’ investments as of September 30, 2018:
Seven Canyons Strategic Income Fund
| Investments in Securities at Value | Level 1 - Unadjusted Quoted Prices | Level 2 - Other Significant Observable Inputs | Level 3 - Significant Unobservable Inputs | Total | ||||||||||||
| Common Stocks(a) | ||||||||||||||||
| Diversified REITs | $ | 554,190 | $ | – | $ | 775,456 | $ | 1,329,646 | ||||||||
| Other | 36,099,201 | – | – | 36,099,201 | ||||||||||||
| Rights | – | – | 50,926 | 50,926 | ||||||||||||
| Short Term Investment | 2,147,766 | – | – | 2,147,766 | ||||||||||||
| Total | $ | 38,801,157 | $ | – | $ | 826,382 | $ | 39,627,539 | ||||||||
Seven Canyons World Innovators Fund
Investments in Securities at Value | Level 1 - Unadjusted Quoted Prices | Level 2 - Other Significant Observable Inputs | Level 3 - Significant Unobservable Inputs | Total | ||||||||||||
| Common Stocks(a) | $ | 147,847,024 | $ | – | $ | – | $ | 147,847,024 | ||||||||
| Limited Partnership Interest(b) | – | – | – | 183,043 | ||||||||||||
| Rights | – | – | 65,629 | 65,629 | ||||||||||||
| Short Term Investment | 12,190,491 | – | – | 12,190,491 | ||||||||||||
| Total | $ | 160,037,515 | $ | – | $ | 65,629 | $ | 160,286,187 | ||||||||
| (a) | For detailed descriptions of the underlying industries, see the accompanying Portfolios of Investments. |
| (b) | Certain investments measured at fair value using the net asset value per share (or its equivalent) practical expedient have not been classified in the fair value levels. The fair value amounts presented in the table are intended to permit reconciliation to the amounts presented in the Portfolios of Investments. |
Annual Report | September 30, 2018 | 35 |
Seven Canyons Advisors | Notes to Financial Statements |
September 30, 2018
Fund | Fair Value at 9/30/2018 | Unfunded Commitments | Redemption Frequency (if currently eligible) | Redemption Notice Period | ||||||||||||
Seven Canyons World Innovators Fund | ||||||||||||||||
| Limited Partnership Interest(a) | $ | 183,043 | $ | – | – | – | ||||||||||
| (a) | The fair value of this limited partnership interest has been estimated using the net asset value of the Fund’s Limited Partner Capital Account. This limited partnership interest can never be redeemed. Distributions from the limited partnership will be received as the underlying investments are liquidated. It is estimated that the underlying assets of the limited partnership will be liquidated over the next one to five years. The final purchase commitment was made on March 31, 2017 for Greenspring Global Partners II-B, L.P. |
The Funds recognize transfers between levels as of the end of the period. For the period ended September 30, 2018, the Funds did not have any transfers between Level 1 and Level 2 securities. The following is a reconciliation of assets in which Level 3 inputs were used in determining value:
Seven Canyons Strategic Income Fund | Common Stocks | Rights | Total | |||||||||
| Balance as of September 30, 2017 | $ | 885,728 | $ | – | $ | 885,728 | ||||||
| Change in Unrealized Appreciation/(Depreciation) | (110,272 | ) | 50,926 | (59,346 | ) | |||||||
| Purchases | – | – | – | |||||||||
| Transfer into Level 3 | – | – | * | – | ||||||||
| Transfer out of Level 3 | – | – | – | |||||||||
| Balance as of September 30, 2018 | $ | 775,456 | $ | 50,926 | $ | 826,382 | ||||||
| Net change in unrealized appreciation/(depreciation) included in the Statements of Operations attributable to Level 3 investments held at September 30, 2018 | $ | (110,272 | ) | $ | 50,926 | $ | (59,346 | ) | ||||
Seven Canyons World Innovators Fund | Rights | Total | ||||||
| Balance as of September 30, 2017 | $ | – | $ | – | ||||
| Change in Unrealized Appreciation/(Depreciation) | 65,629 | 65,629 | ||||||
| Purchases | – | – | ||||||
| Transfer into Level 3 | – | * | – | |||||
| Transfer out of Level 3 | – | – | ||||||
| Balance as of September 30, 2018 | $ | 65,629 | $ | 65,629 | ||||
| Net change in unrealized appreciation/(depreciation) included in the Statements of Operations attributable to Level 3 investments held at September 30, 2018 | $ | 65,629 | $ | 65,629 | ||||
| * | Security transferred in at a value of zero. |
36 | www.sevencanyonsadvisors.com |
Seven Canyons Advisors | Notes to Financial Statements |
September 30, 2018
Quantitative information about Level 3 measurements as of September 30, 2018:
Seven Canyons Strategic Income Fund
Asset Class | Market Value | Valuation Technique(s) | Unobservable Input(s)(a) | Value/Range | |||||||
| Common Stock | $ | 775,456 | Last Trade | Last Trade | 100% | ||||||
| Rights | $ | 50,926 | Probability of take out | Probability of take out | 8% | ||||||
| Premium of take out | Premium of take out | 20% | |||||||||
Seven Canyons World Innovators Fund
Asset Class | Market Value | Valuation Technique(s) | Unobservable Input(s)(a) | Value/Range | |||||||
| Rights | $ | 65,629 | Probability of take out | Probability of take out | 8% | ||||||
| Premium of take out | Premium of take out | 20% | |||||||||
| (a) | A change to the unobservable input may result in a significant change to the value of the investment as follows: A change to a multiple may affect the fair value of an investment. Generally, a decrease in this multiple will result in a decrease in the fair value of the investment. |
Cash & Cash Equivalents: The Funds consider their investment in a Federal Deposit Insurance Corporation (FDIC) insured interest bearing account to be cash and cash equivalents. Cash and cash equivalents are valued at cost plus any accrued interest. The FDIC limit is $250,000. At various times throughout the year or period, the amount on deposit may exceed the FDIC limit and subject the Funds to a credit risk. The Funds do not believe that such deposits are subject to any unusual risk associated with investment activities.
Trust Expenses: Some expenses of the Trust can be directly attributed to a Fund. Expenses that cannot be directly attributed to a Fund are apportioned among all funds in the Trust based on average net assets of each fund, including Trustees’ fees and expenses.
Fund Expenses: Some expenses can be directly attributed to a Fund and are apportioned among the classes based on average net assets of each class.
Class Expenses: Expenses that are specific to a class of shares are charged directly to that share class.
Federal Income Taxes: The Funds comply with the requirements under Subchapter M of the Internal Revenue Code of 1986, as amended, applicable to regulated investment companies and intend to distribute substantially all of their net taxable income and net capital gains, if any, each year so that it will not be subject to excise tax on undistributed income and gains. The Funds are not subject to income taxes to the extent such distributions are made.
As of and during the year ended September 30, 2018, the Funds did not have a liability for any unrecognized tax benefits in the accompanying financial statements. The Funds recognize interest and penalties, if any, related to tax liabilities as income tax expense in the Statements of Operations. The Funds file U.S. federal, state and local income tax returns as required. The Funds’ tax returns are subject to examination by the relevant tax authorities until expiration of the applicable statute of limitations, which is generally three years after the filing of the tax return for federal purposes and four years for most state returns. The Funds’ administrator has analyzed the Funds’ tax positions taken on federal and state income tax returns for all open tax years and has concluded that as of September 30, 2018, no provision for income tax is required in the Funds’ financial statements related to these tax positions.
Annual Report | September 30, 2018 | 37 |
Seven Canyons Advisors | Notes to Financial Statements |
September 30, 2018
Investment Transactions and Investment Income: Investment transactions are accounted for on the date the investments are purchased or sold (trade date basis for financial reporting purposes). Realized gains and losses from investment transactions are reported on an identified cost basis. Interest income, which includes accretion of discounts and amortization of premiums, is accrued and recorded as earned. Dividend income is recognized on the ex-dividend date, or for certain foreign securities, as soon as information is available to the Fund. Withholding taxes on foreign dividends are paid (a portion of which may be reclaimable) or provided for in accordance with the applicable country’s tax rules and rates and are disclosed in the Statements of Operations. All of the realized and unrealized gains and losses and net investment income are allocated daily to each class in proportion to its average daily net assets.
Foreign Securities: The Fund may directly purchase securities of foreign issuers. Investing in securities of foreign issuers involves special risks not typically associated with investing in securities of U.S. issuers. The risks include possible re-evaluation of currencies, the inability to repatriate foreign currency, less complete financial information about companies and possible future adverse political and economic developments. Moreover, securities of many foreign issuers and their markets may be less liquid and their prices more volatile than those of securities of comparable U.S. issuers.
Foreign Currency Translation: Values of investments denominated in foreign currencies are converted into U.S. dollars using the current exchange rates each business day (generally 4:00 p.m. Eastern Time). Purchases and sales of investments and dividend income are translated into U.S. dollars using the current prevailing exchange rate on the transaction date. The effect of changes in foreign exchange rates on realized and unrealized gains or losses on securities is reflected as a component of such gains or losses. Transactions in foreign denominated assets may involve greater risks than domestic transactions.
Foreign Exchange Transactions: The Funds may enter into foreign currency spot contracts to facilitate transactions in foreign securities or to convert foreign currency receipts into U.S. dollars. A foreign currency spot contract is an agreement between two parties to buy and sell currencies at the current market rate, for settlement generally within two business days. The U.S. dollar value of the contracts is determined using current currency exchange rates supplied by a pricing service. The contract is marked-to-market daily for settlements beyond one day and any change in market value is recorded as an unrealized gain or loss. When the contract is closed, the Fund records a realized gain or loss equal to the difference between the value on the open and close date. Losses may arise from changes in the value of the foreign currency, or if the counterparties do not perform under the contract’s terms. The maximum potential loss from such contracts is the aggregate face value in U.S. dollars at the time the contract was opened.
Distributions to Shareholders: The Funds normally pay dividends, if any, quarterly, and distribute capital gains, if any, on an annual basis. Income dividend distributions are derived from interest and other income a Fund receives from its investments, including short term capital gains. Long term capital gain distributions are derived from gains realized when a Fund sells a security it has owned for more than one year. The Funds may make additional distributions and dividends at other times if its investment advisor has determined that doing so may be necessary for the Fund to avoid or reduce taxes. Net investment income/(loss) and net realized gain/(loss) may differ for financial statement and tax purposes.
38 | www.sevencanyonsadvisors.com |
Seven Canyons Advisors | Notes to Financial Statements |
September 30, 2018
Restricted Securities: Restricted securities are securities that may only be resold upon registration under federal securities laws or in transactions exempt from such registration. In some cases, the issuer of restricted securities has agreed to register such securities for resale, at the issuer’s expense, either upon demand by a fund or in connection with another registered offering of the securities. Many restricted securities may be resold in the secondary market in transactions exempt from registration. Such restricted securities may be determined to be liquid. The Funds will not incur any registration costs upon such resale. The Funds’ restricted securities are valued at the price provided by pricing services or dealers in the secondary market or, if no market prices are available, at the fair value price as determined by the Fund’s Adviser or pursuant to the Fund’s fair value policy, subject to oversight by the Board. The Funds have acquired certain securities, the sale of which is restricted under applicable provisions of the Securities Act of 1933 (the “Securities Act”). It is possible that the fair value price may differ significantly from the amount that may ultimately be realized in the near term, and the difference could be material. Refer to Note 8 (Restricted Securities) for more information regarding Rule 144A of the Securities Act.
Repurchase Agreements: The Funds may engage in repurchase transactions. Under the terms of a typical repurchase agreement, a fund takes possession of an underlying debt obligation subject to an obligation of the seller to repurchase and the fund to resell the obligation at an agreed upon price and time. The market value of the collateral must be at least equal at all times to the total amount of the repurchase obligation, including interest. Generally, in the event of counterparty default, the fund has the right to use the collateral to offset losses incurred.
3. TAX BASIS INFORMATION
Tax Basis of Distributions to Shareholders: The character of distributions made during the period from net investment income or net realized gains may differ from its ultimate characterization for federal income tax purposes. Also, due to the timing of dividend distributions, the fiscal year in which amounts are distributed may differ from the fiscal year in which the income or realized gain were recorded by the Funds. The amounts and characteristics of tax basis distributions are estimated at the time of distribution and composition of distributable earnings/(accumulated losses) are finalized at fiscal year-end.
The tax character of distributions paid by the Funds for the fiscal year ended September 30, 2018 were as follows:
Ordinary Income | Long-Term | |||||||
Seven Canyons Strategic Income Fund | $ | 1,098,927 | $ | – | ||||
Seven Canyons World Innovators Fund | 2,887,529 | 25,533,795 | ||||||
| Annual Report | September 30, 2018 | 39 |
| Seven Canyons Advisors | Notes to Financial Statements |
| September 30, 2018 |
The tax character of distributions paid by the Funds for the fiscal year ended September 30, 2017 were as follows:
| Ordinary Income | Long-Term Capital Gains | |||||||
| Seven Canyons Strategic Income Fund | $ | 516,716 | $ | – | ||||
| Seven Canyons World Innovators Fund | – | 6,384,678 | ||||||
The tax character of distributions paid may differ from that shown in the Statements of Changes in Net Assets due to short-term gains being treated as ordinary income for tax purposes.
Reclassifications: As of September 30, 2018, permanent differences in book and tax accounting were reclassified. The following reclassifications, which had no impact on results of operations or net assets, were recorded to reflect tax character:
| Paid-in Capital | Total Distributable Earnings | |||||||
| Seven Canyons Strategic Income Fund | $ | (267 | ) | $ | 267 | |||
| Seven Canyons World Innovators Fund | 9,886 | (9,886 | ) |
To the extent these book and tax differences are permanent in nature, such amounts are reclassified at the end of the fiscal year among additional paid-in capital, undistributed net investment income (loss), and undistributed net realized gain (loss) on investments and foreign currency translations. The reclassifications generally relate to the tax treatment of net operating losses, investments in REITs and partnerships, Section 988 currency gains and losses and PFICs. These reclassifications have no impact on the net asset values of the Funds.
Unrealized Appreciation and Depreciation on Investments: As of September 30, 2018, the aggregate costs of investments, gross unrealized appreciation/(depreciation) and net unrealized appreciation for Federal tax purposes were as follows:
| Seven Canyons Strategic Income Fund | Seven Canyons World Innovators Fund | |||||||
| Gross unrealized appreciation (excess of value over tax cost) | $ | 7,306,170 | $ | 28,744,691 | ||||
| Gross unrealized depreciation (excess of tax cost over value) | (1,134,052 | ) | (8,856,418 | ) | ||||
| Net appreciation/(depreciation) on foreign currency and derivatives | 346 | (3,532 | ) | |||||
| Net unrealized appreciation | $ | 6,172,464 | $ | 19,884,741 | ||||
| Cost of investments for income tax purposes | $ | 33,455,421 | $ | 140,114,711 | ||||
These temporary differences are primarily attributed to wash sales, PFICs, and partnerships.
| 40 | www.sevencanyonsadvisors.com |
| Seven Canyons Advisors | Notes to Financial Statements |
| September 30, 2018 |
Components of Distributable Earnings: At September 30, 2018, components of distributable earnings were as follows:
| Seven Canyons Strategic Income Fund | Seven Canyons World Innovators Fund | |||||||
| Undistributed ordinary income | $ | 116,997 | $ | 5,036,798 | ||||
| Accumulated capital gains/(losses) | (518,809 | ) | 23,907,527 | |||||
| Net unrealized appreciation | 6,172,464 | 19,884,741 | ||||||
| Other cumulative effect of timing differences | (213,130 | ) | – | |||||
| Total | $ | 5,557,522 | $ | 48,829,066 | ||||
During the tax year ended September 30, 2018, the Funds used capital loss carryforwards in the following amounts:
| Fund | Amount | |||
| Seven Canyons Strategic Income Fund | $ | 4,359,963 | ||
Under current law, capital losses maintain their character as short-term or long-term and are carried forward to the next tax year without expiration. As of September 30, 2018, the following amounts are available as carry forwards to the next tax year:
| Short-Term Non-expiring | ||||
| Seven Canyons Strategic Income Fund | $ | 353,927 | ||
Capital losses arising in the post-October period of the current fiscal year may be deferred to the next fiscal year if the fund elects to defer the recognition of these losses. When this election is made any losses recognized during the period are treated as having occurred on the first day of the next fiscal year separate from and in addition to the application of normal capital loss carryovers as described above. The Funds have elected to defer losses as follows:
| Fund | Amount | |||
| Seven Canyons Strategic Income Fund | $ | 164,882 | ||
4. SECURITIES TRANSACTIONS
Purchases and sales of securities, excluding short-term securities, during the year ended September 30, 2018 were as follows:
| Purchases of Securities | Proceeds from Sales of Securities | |||||||
| Seven Canyons Strategic Income Fund | $ | 31,393,828 | $ | 35,920,826 | ||||
| Seven Canyons World Innovators Fund | 266,638,928 | 310,844,771 | ||||||
| Annual Report | September 30, 2018 | 41 |
| Seven Canyons Advisors | Notes to Financial Statements |
| September 30, 2018 |
5. BENEFICIAL SHARE TRANSACTIONS
The capitalization of the Trust consists of an unlimited number of shares of beneficial interest with no par value per share. Holders of the shares of the Funds have one vote for each share held and a proportionate fraction of a vote for each fractional share. All shares issued and outstanding are fully paid and are transferable and redeemable at the option of the shareholder. Shares have no pre-emptive rights. Neither the Funds nor any of their creditors have the right to require shareholders to pay any additional amounts solely because the shareholder owns the shares.
Shares redeemed within 60 days of purchase may incur a 2.00% redemption fee deducted from the redemption amount. For the period ended September 30, 2018, the redemption fees charged by the Fund, if any, are presented in the Statements of Changes in Net Assets.
Transactions in common shares were as follows:
| For the Year Ended September 30, 2018 | For the Year Ended September 30, 2017 | |||||||
| Seven Canyons Strategic Income Fund(a) | ||||||||
| Investor Class | ||||||||
| Shares sold | 1,342,592 | 289,909 | ||||||
| Shares issued in reinvestment of distributions to shareholders | 88,658 | 46,032 | ||||||
| Shares redeemed | (2,144,223 | ) | (1,699,886 | ) | ||||
| Net decrease in shares outstanding | (712,973 | ) | (1,363,945 | ) | ||||
| Seven Canyons World Innovators Fund(b) Investor Class | ||||||||
| Shares sold | 1,881,378 | 909,168 | ||||||
| Shares issued in reinvestment of distributions to shareholders | 1,271,497 | 326,414 | ||||||
| Shares redeemed | (4,766,873 | ) | (2,869,552 | ) | ||||
| Net decrease in shares outstanding | (1,613,998 | ) | (1,633,970 | ) | ||||
| Institutional Class | ||||||||
| Shares sold | 200,017 | 299,276 | ||||||
| Shares issued in reinvestment of distributions to shareholders | 29,016 | 6,903 | ||||||
| Shares redeemed | (38,497 | ) | (447,088 | ) | ||||
| Net increase/(decrease) in shares outstanding | 190,536 | (140,909 | ) | |||||
| (a) | Effective September 10, 2018, the Seven Canyons Strategic Income Fund merged into the ALPS Series Trust. The Fund was previously advised by Wasatch Advisors, Inc., and was recognized as the Wasatch Strategic Income Fund. |
| (b) | Effective September 10, 2018, the Seven Canyons World Innovators Fund merged into the ALPS Series Trust. The Fund was previously advised by Wasatch Advisors, Inc., and was recognized as the Wasatch World Innovators Fund. |
| 42 | www.sevencanyonsadvisors.com |
| Seven Canyons Advisors | Notes to Financial Statements |
September 30, 2018
6. MANAGEMENT AND RELATED PARTY TRANSACTIONS
Investment Advisory: Seven Canyons Advisors, LLC (the “Adviser”), subject to the authority of the Board, is responsible for the overall management and administration of the Funds’ business affairs. The Adviser manages the investments of the Funds in accordance with each Fund’s investment objective, policies and limitations and investment guidelines established jointly by the Adviser and the Board. Effective September 10, 2018, Seven Canyons became the Adviser to both Funds. Although the new Funds have different investment advisors, the portfolio manager(s) for the Funds and investment objectives are the same. The Funds also have substantially similar principal investment strategies and principal risks. Any shareholders that owned shares of the funds as of the close of business on June 29, 2018, voted to approve the new Seven Canyons Investment Advisory Agreements at the meeting. Under the new Agreements, the Advisor will provide advisory services to the Funds, subject to the oversight of the Board. The Funds’ Shareholder Meeting occurred on August 30, 2018 and all measures past.
Pursuant to the Investment Advisory Agreement (the “Advisory Agreement”) with the Adviser, the Seven Canyons Strategic Income Fund pays the Adviser an annual management fee of 0.70% based on the Fund’s average daily net assets, and the Seven Canyons World Innovators Fund pays the Adviser an annual management fee of 1.50% based on the Fund’s average daily net assets. The management fees are paid on a monthly basis. The Board may extend the Advisory Agreements for additional one-year term. The Board and shareholders of the Funds may terminate the Advisory Agreement upon 30 day written notice. The Adviser may terminate the Advisory Agreement upon 60 days’ written notice.
Pursuant to a fee waiver letter agreement (the “Fee Waiver Agreement”), the Adviser has contractually agreed to limit the amount of the Total Annual Fund Operating Expenses, exclusive of interest, dividend expense on short sales/interest expense, taxes, brokerage commissions, other investment related costs, acquired fund fees and expenses, and extraordinary expenses such as litigation and other expenses not incurred in the ordinary course of business, for the Seven Canyons Strategic Income Fund Investor Class shares and Seven Canyons World Innovators Fund Investor Class shares and Institutional Class shares, to 0.95%, 1.75% and 1.55%, respectively, of each Funds’ average daily net assets of each class of shares. The Fee Waiver Agreement is in effect through January 31, 2020. The Adviser will be permitted to recover, on a class-by-class basis, expenses it has borne through the Fee Waiver Agreement only to the extent that each Fund's expenses in later periods do not exceed the lesser of: (1) the contractual expense limit in effect at the time the Adviser waives or limits the expenses; or (2) the contractual expense limit in effect at the time the Adviser seeks to recover the expenses; provided, however, that the Fund will not be obligated to reimburse any such expenses borne by the Adviser more than three years after the date on which the fee or expense was waived or limited or assumed and paid by the Adviser, as calculated on a monthly basis. The Adviser may not discontinue this waiver without the approval by the Trust's Board. Fees waived or reimbursed for the year ended September 30, 2018 are disclosed in the Statements of Operations.
As of September 31, 2018, the balance of recoupable expenses was as follows:
| Expiring in 2021 | ||||
| Seven Canyons World Innovators Fund | $ | 24,966 | ||
| Seven Canyons Strategic Income Fund | 8,181 | |||
| Annual Report | September 30, 2018 | 43 |
| Seven Canyons Advisors | Notes to Financial Statements |
September 30, 2018
Prior to September 10, 2018, Wasatch Advisors, Inc. (“Wasatch”) served as the investment adviser to the Predecessor Funds pursuant to a prior investment advisory agreement between the Wasatch Funds Trust and Wasatch, under which Wasatch was entitled to receive an annual fee of 0.70% and 1.50% for Seven Canyons Strategic Income Fund and Seven Canyons World Innovators Fund, respectively, computed daily and paid monthly. Wasatch had contractually agreed to waive Its fees and/or reimburse certain Funds should a Fund’s operating expenses (exclusive of interest, dividend expense on short sales/interest expense, taxes, brokerage commissions, other investment related costs, acquired fund fees and expenses, and extraordinary expenses such as litigation and other expenses not incurred in the ordinary course of business), exceed an annual limitation of 0.95 % for Investor Class of the Seven Canyons Strategic Income Fund, and 1.95% and 1.55% for Investor Class and Institutional Class of the Seven Canyons World Innovators Fund, respectively. Wasatch was able to recover previously waived expenses through September 10, 2018.
Administrator: Effective September 10, 2018, ALPS Fund Services, Inc. (“ALPS”) (an affiliate of ALPS Distributors, Inc.) serves as administrator to each Fund. The Funds have agreed to pay expenses incurred in connection with its administrative activities. Pursuant to the Administration, Bookkeeping and Pricing Services Agreement with the Trust, ALPS will provide operational services to each Fund including, but not limited to, fund accounting and fund administration, and will generally assist in the Funds’ operations. The Funds’ administration fee is accrued on a daily basis and paid monthly. The officers and an Interested Trustee of the Trust are employees of ALPS. Administration fees paid by each Fund for the year ended September 30, 2018 are disclosed in the Statements of Operations. For the period from September 10, 2018 through September 30, 2018, the Seven Canyons Strategic Income Fund and Seven Canyons World Innovators Fund incurred Fund Administration and Accounting fees of $2,282 and $9,239, respectively, relating to services provided by ALPS. ALPS is reimbursed by the Funds for certain out of pocket expenses.
Prior to September 10, 2018, State Street Bank and Trust Company (“SSB”) provided certain administrative, custody and fund accounting services necessary for the Funds’ operations. The Funds were charged a fee for the services provided.
Transfer Agent: Effective September 10, 2018, ALPS serves as transfer agent for each Fund under a Transfer Agency Services Agreement with the Trust. Under this agreement, ALPS is paid an annual fee for services performed on behalf of the Funds plus fees for open accounts and is reimbursed for certain out-of-pocket expenses. For the period September 10, 2018 through September 30, 2018, the Seven Canyons Strategic Income Fund and Seven Canyons World Innovators Fund incurred Transfer Agent fees of $1,413 and $2,821, respectively, relating to services provided by ALPS.
Prior to September 10, 2018, UMB Fund Services, Inc. (“UMBFS”) served as the Funds’ transfer agent pursuant to a prior Transfer Agency and Services Agreement with the Predecessor Trust. In addition, ALPS Distributors, Inc. (the “Prior Distributor”) served as the Funds’ distributor pursuant to a prior Distribution Agreement with the Predecessor Trust.
| 44 | www.sevencanyonsadvisors.com |
| Seven Canyons Advisors | Notes to Financial Statements |
September 30, 2018
Compliance Services: Effective September 10, 2018, ALPS provides services as each Fund’s Chief Compliance Officer to monitor and test the policies and procedures of the Funds’ in conjunction with requirements under Rule 38a-1 of the 1940 Act pursuant to a Chief Compliance Officer Services Agreement with the Trust. Under this agreement, ALPS is paid an annual fee for services performed on behalf of the Funds and is reimbursed for certain out-of-pocket expenses. For the period from September 10, 2018 through September 30, 2018, the Seven Canyons Strategic Income Fund and Seven Canyons World Innovators Fund incurred Compliance Service fees of $347 and $1,937, respectively, relating to services provided by ALPS.
Distribution: Effective September 10, 2018, ALPS Distributors, Inc. (the “Distributor”) (an affiliate of ALPS) acts as the principal underwriter of the Funds’ shares pursuant to a Distribution Agreement with the Trust. Shares of the Funds are offered on a continuous basis through the Distributor, as agent of the Funds. The Distributor is not obligated to sell any particular amount of shares and is not entitled to any compensation for its services as the Funds’ principal underwriter pursuant to the Distribution Agreement.
7. TRUSTEES
As of September 30, 2018, there were four Trustees, three of whom are not “interested persons” (as defined in the 1940 Act) of the Trust (the “Independent Trustees”). Effective November 16, 2017, the Independent Trustees of the Trust receive a quarterly retainer of $6,000, plus $4,000 for each regular Board or Committee meeting attended and $2,000 for each special telephonic or in-person Board or Committee meeting attended. Additionally, the Audit Committee Chair receives a quarterly retainer of $1,250 and an Independent Chair receives a quarterly retainer of $2,500. The Independent Trustees are also reimbursed for all reasonable out-of-pocket expenses relating to attendance at meetings and for meeting-related expenses. Officers of the Trust and Trustees who are interested persons of the Trust receive no salary or fees from the Trust.
Prior to September 10, 2018, under the Wasatch Funds Trust , the method of compensating Trustees was to pay each Independent Trustee a retainer of $120,000 per year for services rendered and a fee of $24,000 for each Board of Trustees meeting attended in person or telephonically. In addition, each Independent Trustee received a fee of $24,000 for attendance at an executive session held with respect to the contract renewal process for the Funds. In addition, the Chairman of the Board received an additional fee of $30,000 a year as Chairman and $6,000 for attendance in person or telephonically at a Board meeting; the Chairman of the Audit Committee and the Chairman of the Nominating Committee each received an additional $18,000 per year as Chairman and $3,600 for attendance in person or telephonically at a Board meeting. Additionally, each Independent Trustee was entitled to reimbursement of expenses related to his or her duties as a Trustee of the Funds.
| Annual Report | September 30, 2018 | 45 |
| Seven Canyons Advisors | Notes to Financial Statements |
September 30, 2018
8. RESTRICTED SECURITIES
The Funds may own investments that were purchased through private placement transactions or under Rule 144A of the Securities Act of 1933 (the “Securities Act”) and cannot be sold without prior registration under the Securities Act or may be limited due to certain restrictions. These securities are generally deemed to be illiquid and are valued at fair value as determined by a designated Pricing Committee of the Advisor (“Pricing Committee”), comprised of personnel of the Adviser, with oversight by the Board and in accordance with Board-approved Pricing Policies and Procedures. If and when such securities are registered, the costs of registering such securities are paid by the issuer. At September 30, 2018, the Funds held the following restricted securities:
| Fund | Security Type | Acquisition Date | Cost | Fair Value | % of Net Assets | |||||||||||
| Strategic Income Fund | ||||||||||||||||
| Herbalife Nutrition, Ltd. | Right | 10/13/17 | – | $ | 50,926 | 0.13 | % | |||||||||
| Star Asia Capital Corp. | Common Stock | 2/22/07-5/11/15 | $ | 572,597 | 775,456 | 1.96 | % | |||||||||
| $ | 572,597 | $ | 826,382 | 2.09 | % | |||||||||||
| World Innovators Fund | ||||||||||||||||
| Greenspring Global Partners II LP | Limited Partnership | 10/10/13-3/31/17 | $ | 185,658 | $ | 183,043 | 0.12 | % | ||||||||
| Herbalife Nutrition, Ltd. | Right | 10/13/17 | – | 65,629 | 0.04 | % | ||||||||||
| $ | 185,658 | $ | 248,672 | 0.16 | % | |||||||||||
Restricted securities under Rule 144a, including the aggregate value and percentage of net assets of each Fund, have been identified in the Portfolios of Investments.
9. TRANSACTIONS WITH AFFILIATES
If a Fund’s holding represents ownership of 5% or more of the voting securities of a company, the company is deemed to be an affiliate as defined by the 1940 Act. The following Funds conducted transactions during the year ended September 30, 2018 with an “affiliated company” as so defined:
World Innovators Fund
| Security Name | Share Balance as of September 30, 2017 | Purchases | Sales | Share Balance as of September 30, 2018 | Value as of September 30, 2018 | Dividends | Change in Unrealized Gain (Loss) | Realized Gain/Loss | ||||||||||||||||||||||||
| GAME Digital PLC | – | 11,300,000 | – | 11,300,000 | $ | 4,528,993 | $ | – | $ | (639,100 | ) | $ | – | |||||||||||||||||||
| $ | 4,528,993 | $ | – | $ | (639,100 | ) | $ | – | ||||||||||||||||||||||||
10. LINE OF CREDIT
Effective May 19, 2017, the Funds in the Predecessor Trust renewed and amended agreements for two open lines of credit totaling $300,000,000, one of which is $100,000,000 committed, and the other of which is $200,000,000 uncommitted, with State Street Bank and Trust Company (together, the “Line”). The agreements were amended on May 18, 2018, and have no change in the committed, uncommitted and total amounts available on the Line, but extended the maturity to May 17, 2019. The Funds incur commitment fees of 0.25% on the undrawn portion of the committed part of the Line, and interest expense to the extent of amounts drawn (borrowed) under the entire Line. Interest is based on the higher of (a) the overnight federal-funds rate in effect on the date of borrowing, plus a 1.25% margin, or (b) the daily 1-Month London Interbank Offered Rate (LIBOR) in effect on the date of borrowing, plus a 1.25% margin. Commitment fees are pro-rated among the Funds based upon relative average net assets. Interest expense is charged directly to a Fund based upon actual amounts borrowed by that Fund.
| 46 | www.sevencanyonsadvisors.com |
| Seven Canyons Advisors | Notes to Financial Statements |
September 30, 2018
The agreement between the Funds and State Street Bank and Trust Company was terminated on September 7, 2018.
For the year ended September 30, 2018, the interest expense was $2,026 for Seven Canyons Strategic Income Fund. For the year ended September 30, 2018, there were no borrowings for the Seven Canyons World Innovators Fund, and there was no balance outstanding at the end of the year. There was no balance outstanding at September 30, 2018 for the Seven Canyons Strategic Income Fund. The average and maximum borrowing, respectively, for the year ended September 30, 2018 for the Seven Canyons Strategic Income Fund for the period from August 28, 2018 to August 30, 2018, the period the line was drawn, was $10,964,634 and 11,308,949, at an average borrowing rate of 3.325%.
11. INDEMNIFICATIONS
Under the Trust’s organizational documents, its officers and Trustees are indemnified against certain liabilities arising out of the performance of their duties to the Trust. Additionally, in the normal course of business, the Trust enters into contracts with service providers that may contain general indemnification clauses which may permit indemnification to the extent permissible under applicable law. The Trust’s maximum exposure under these arrangements is unknown, as such exposure would involve future claims that may be made against the Trust that have not yet occurred.
12. SUBSEQUENT EVENTS
Subsequent events after the date of the Statements of Assets and Liabilities have been evaluated through the date the financial statements were issued.
On October 4, 2018, the SEC amended Regulation S-X to require certain financial statement disclosure requirements to conform them to US Generally Accepted Accounting Principles for investment companies. Effective November 4, 2018, the Funds adopted disclosure requirement changes for Regulation S-X and these changes are reflected throughout this report. The Funds’ adoption of those amendments, effective with the financial statements prepared as of September 30, 2018, had no effect on the Funds’ net assets or results of operations.
| Annual Report | September 30, 2018 | 47 |
| Seven Canyons Advisors | Report of Independent Registered Public Accounting Firm |
To the Shareholders of Seven Canyons Strategic Income Fund and Seven Canyons World Innovators Fund and Board of Trustees of ALPS Series Trust
Opinion on the Financial Statements
We have audited the accompanying statements of assets and liabilities, including the portfolios of investments, of Seven Canyons Strategic Income Fund (formerly, Wasatch Strategic Income Fund) and Seven Canyons World Innovators Fund (formerly, Wasatch World Innovators Fund) (the “Funds”), each a series of ALPS Series Trust, as of September 30, 2018, and the related statements of operations and changes in net assets, including the related notes, and the financial highlights for the year then ended (collectively referred to as the “financial statements”). In our opinion, the financial statements present fairly, in all material respects, the financial position of each of the Funds as of September 30, 2018, the results of their operations, the changes in their net assets, and the financial highlights for the year then ended, in conformity with accounting principles generally accepted in the United States of America.
The Funds’ financial statements and financial highlights for the years or periods ended September 30, 2017, and prior, were audited by other auditors whose report dated November 22, 2017, expressed an unqualified opinion on those financial statements and financial highlights.
Basis for Opinion
These financial statements are the responsibility of the Funds’ management. Our responsibility is to express an opinion on the Funds’ financial statements based on our audit. We are a public accounting firm registered with the Public Company Accounting Oversight Board (United States) (“PCAOB”) and are required to be independent with respect to the Funds in accordance with the U.S. federal securities laws and the applicable rules and regulations of the Securities and Exchange Commission and the PCAOB.
We conducted our audit in accordance with the standards of the PCAOB. Those standards require that we plan and perform the audit to obtain reasonable assurance about whether the financial statements are free of material misstatement, whether due to error or fraud.
Our audit included performing procedures to assess the risks of material misstatement of the financial statements, whether due to error or fraud, and performing procedures that respond to those risks. Such procedures included examining, on a test basis, evidence regarding the amounts and disclosures in the financial statements. Our procedures included confirmation of securities owned as of September 30, 2018, by correspondence with the custodian and broker. Our audit also included evaluating the accounting principles used and significant estimates made by management, as well as evaluating the overall presentation of the financial statements. We believe that our audit provides a reasonable basis for our opinion.
We have served as the Funds’ auditor since 2018.
COHEN & COMPANY, LTD.
Cleveland, Ohio
November 29, 2018
| 48 | www.sevencanyonsadvisors.com |
| Seven Canyons Advisors | Additional Information |
September 30, 2018 (Unaudited)
1. PROXY VOTING POLICIES AND VOTING RECORD
A description of the policies and procedures that the Funds use to determine how to vote proxies relating to portfolio securities is available without charge, upon request, (i) by calling the Funds (toll-free) at 1-833-722-6966 or (ii) on the website of the Securities and Exchange Commission (the “SEC”) at http://www.sec.gov.
Information regarding how each Fund voted proxies relating to portfolio securities during the most recent 12-month period ended June 30 is available (i) without charge, upon request, by calling the Funds (toll-free) at 1-833-722-6966 or (ii) on the SEC’s website at http://www.sec.gov.
2. PORTFOLIO HOLDINGS
The Funds file their complete schedule of portfolio holdings with the SEC for the first and third quarters of each fiscal year on Form N-Q. The Funds’ Form N-Qs are available on the SEC website at http://www.sec.gov. The Funds’ Form N-Qs may be reviewed and copied at the SEC’s Public Reference Room in Washington, D.C., and information on the operation of the Public Reference Room may be obtained by calling 1-800-SEC-0330.
3. TAX DESIGNATIONS
Qualified Dividend Income
The percentage of ordinary income dividends distributed during the calendar year ended December 31, 2017 are designated as qualified dividend income (QDI) as defined in Section 1(h)(11) of the Internal Revenue Code in the following percentages:
| Amount | |
| Seven Canyons Strategic Income Fund | 50.02% |
| Seven Canyons World Innovators Fund | 88.33% |
Dividends Received Deduction
For corporate shareholders, the following ordinary dividends paid during the calendar year ended December 31, 2017 qualify for the corporate dividends received deduction:
| Amount | |
| Seven Canyons Strategic Income Fund | 41.58% |
| Seven Canyons World Innovators Fund | 26.38% |
Pursuant to Section 852(b)(3) of the Internal Revenue Code, the Seven Canyons World Innovators Fund designated $25,533,795 as long-term capital gain dividends.
| Annual Report | September 30, 2018 | 49 |
| Seven Canyons Advisors | Additional Information |
September 30, 2018 (Unaudited)
4. SHAREHOLDER PROXY RESULTS
At a Joint Special Meeting of Shareholders of the Wasatch Strategic Income Fund and Wasatch World Innovators Fund, held at the offices of Wasatch Trust at 505 Wakara Way, 3rd Floor, Salt Lake City, UT 84018 on August 30, 2018, shareholders of record as of the close of business on June 29, 2018 voted to approve the following proposals:
Proposal 1: To approve an Agreement and Plan of Reorganization which provides for the transfer of all the assets of the Wasatch Strategic Income Fund to the Seven Canyons Strategic Income Fund.
| Shares Voted In Favor | Shares Voted Against or Abstentions |
| 2,536,361 | 68,492 |
Proposal 2: To approve an Agreement and Plan of Reorganization which provides for the transfer of all the assets of the Wasatch World Innovators Fund to the Seven Canyons World Innovators Fund.
| Shares Voted In Favor | Shares Voted Against or Abstentions |
| 4,418,381 | 486,444 |
| 5. | DISCLOSURE REGARDING RENEWAL AND APPROVAL OF FUND ADVISORY AGREEMENT |
On March 27, 2018, the Board of Trustees (the “Board”) of ALPS Series Trust (the “Trust”) met in person to discuss, among other things, the approval of the Investment Advisory Agreement between the Trust and Seven Canyons Advisors, LLC (“Seven Canyons”) in accordance with Section 15(c) of the 1940 Act. The Independent Trustees met with independent legal counsel during executive session and discussed the Investment Advisory Agreement and other related materials.
In approving the Investment Advisory Agreement with Seven Canyons, the Trustees, including a majority of all the Independent Trustees, considered the following factors with respect to the Seven Canyons Strategic Income Fund and Seven Canyons World Innovators Fund (the “Funds”):
Investment Advisory Fee Rate: The Trustees reviewed and considered the contractual annual advisory fees to be paid by the Trust on behalf of Seven Canyons Strategic Income Fund to Seven Canyons of 0.70% of the Fund’s daily average net assets, and on behalf of Seven Canyons World Innovators Fund to Seven Canyons of 1.50% of the Fund’s daily average net assets, considering the nature, extent and quality of the advisory services to be provided by Seven Canyons to the Funds.
The Trustees considered the information they received comparing each Fund’s contractual annual advisory fees and overall expenses with those of funds in each expense group and universe of funds provided by the Data Provideran independent provider of investment company data (the “Data Provider”). The peer group for Seven Canyons Strategic Income fund consisted of Multi-Asset Income funds identified by the Data Provider, and the peer group for Seven Canyons World Innovators Fund consisted of World Small/Mid Stock funds identified by the Data Provider.
The Trustees noted that the Seven Canyons Strategic Income Fund’s contractual advisory fee of 0.70% was slightly above the Data Provider peer group median of 0.68% for the Investor Class, and that the Fund’s projected total net expenses (after fee waiver and expense reimbursement) of 0.95% for the Investor Class was slightly below the Data Provider peer group average of 1.08%.
| 50 | www.sevencanyonsadvisors.com |
| Seven Canyons Advisors | Additional Information |
September 30, 2018 (Unaudited)
The Trustees noted that the Seven Canyons World Innovators Fund’s contractual advisory fee of 1.50% was significantly above the Data Provider peer group median of 0.98% for the Institutional Class and 0.93% for the Investor Class, and that the Fund’s projected total net expenses (after fee waiver and expense reimbursement) of 1.55% for the Institutional Class and 1.75% for the Investor Class were above the Data Provider peer group average of 1.34% and 1.59%, respectively.
After further consideration and the recommendation of break points, the Trustees determined that the contractual annual advisory fees and total net expenses for each Fund, considering the contractual fee waiver, were fair to each Fund’s shareholders.
Nature, Extent and Quality of the Services under the Investment Advisory Agreement: The Trustees received and considered information regarding the nature, extent and quality of services provided to the Funds under the Investment Advisory Agreement with Seven Canyons. The Trustees reviewed certain background materials supplied by Seven Canyons in its presentation, including its Form ADV and ownership structure.
The Trustees reviewed and considered Seven Canyon’s investment advisory personnel and its short history as an asset manager. The Trustees also discussed the research and decision-making processes utilized by the Seven Canyons, including the methods adopted to seek to achieve compliance with the investment objectives, policies and restrictions of the Funds.
The Trustees considered the background and experience of Seven Canyons’ management relating to the Funds, including reviewing the qualifications, background and responsibilities of the portfolio managers primarily responsible for the day-to-day portfolio management of the Funds. The Trustees also reviewed, among other things, Seven Canyons’ Code of Ethics. The Trustees also considered Seven Canyons’ reputation generally and its investment techniques, strategies, risk management controls and decision-making processes.
Performance: The Board noted that each Fund would be new and did not have a current track record, although each Fund intended to incorporate the track record of its predecessor fund upon completion of the transaction. The Trustees also noted the strong historical performance of the World Innovators Fund, including its 5-star Morningstar rating and outperformance relative to its benchmark for the 1-year, 3-year, 5-year and 10-year periods, and its receipt of the Lipper Fund Award for 10-year performance.
Comparable Accounts: The Board discussed the comparable accounts managed by Seven Canyons and the fee structure and servicing requirements for these products;
The Adviser’s Profitability: The Trustees received and considered an estimated profitability analysis prepared by Seven Canyons based on the estimated fees to be paid under each Investment Advisory Agreement. The Trustees considered the profits, if any, anticipated to be realized by Seven Canyons relating to the operation of each Fund, noting that the Funds were not yet operational. The Trustees then reviewed and discussed Seven Canyons’ financial statements to analyze the financial condition and stability and profitability of Seven Canyons.
| Annual Report | September 30, 2018 | 51 |
| Seven Canyons Advisors | Additional Information |
September 30, 2018 (Unaudited)
Economies of Scale: The Trustees considered whether economies of scale in the provision of services to each Fund would be passed along to the shareholders under the Investment Advisory Agreement. However, economies of scale were not anticipated at projected asset levels in the near term for either Fund, and the Board recommended Seven Canyons to consider breakpoints in the future if conditions warrant such a discussion.
Other Benefits to the Adviser: The Trustees reviewed and considered any other incidental benefits derived or to be derived by Seven Canyons from its relationship with each Fund, including research and other support services.
The Board summarized its deliberations with respect to the Investment Advisory Agreement with Seven Canyons. In evaluating Seven Canyons and the fees to be charged under the Investment Advisory Agreement, the Trustees concluded that no single factor reviewed by the Trustees was identified by the Trustees to be determinative as the principal factor in whether to approve the Investment Advisory Agreement. Further, the Independent Trustees were advised by independent legal counsel throughout the process.
The Board indicated that the information presented and the discussion of the information were adequate for making a determination regarding the approval of the Advisory Agreement. During the review process, the Board noted certain instances where clarification or follow-up was appropriate and others where the Board determined that further clarification or follow-up was not necessary. In those instances where clarification or follow-up was requested, the Board determined that in each case either information responsive to its requests had been provided, or where any request was outstanding in whole or in part, given the totality of the information provided with respect to the Advisory Agreement, the Board had received sufficient information to renew and approve the Advisory Agreement
The Trustees, including all the Independent Trustees, concluded that:
| ● | Seven Canyons Strategic Income Fund’s contractual advisory fee of 0.70% of the Fund’s daily average net assets and projected total net expenses (after fee waiver and expense reimbursement) for each class of such Fund and Seven Canyons World Innovators Fund’s contractual advisory fee of 1.50% of the Fund’s daily average net assets and projected total net expenses (after fee waiver and expense reimbursement) for each class of such Fund was fair to the Seven Canyons’ shareholders; |
| ● | the terms of the fee waiver/expense reimbursement letter agreement between the Trust, (on behalf of each Fund) and Seven Canyons, were reasonable; |
| ● | the nature, extent and quality of services to be rendered by Seven Canyons under the Investment Advisory Agreement were adequate; |
| ● | both Funds were new, although each Fund intended to incorporate the track record of its predecessor fund upon completion of the transaction, and World Innovators Fund had especially strong historical performance; |
| 52 | www.sevencanyonsadvisors.com |
| Seven Canyons Advisors | Additional Information |
September 30, 2018 (Unaudited)
| ● | bearing in mind the limitations of comparing different types of accounts and the different levels of service typically associated with such accounts, the fee structures applicable to Seven Canyons’ other clients employing a comparable strategy to each Fund was not indicative of any unreasonableness with respect to the advisory fee payable by such Fund. |
| ● | the estimated profitability of Seven Canyons relating to the management of each Fund was not unreasonable; and |
| ● | there were no material economies of scale or other material incidental benefits expected to accrue to Seven Canyons because of its relationship with each Fund during the initial term of the Agreement. |
Based on the Trustees’ deliberations and their evaluation of the information described above, the Trustees, including a majority of the Independent Trustees, concluded that Seven Canyons’ compensation for investment advisory services is consistent with the best interests of each Fund and its shareholders.
| Annual Report | September 30, 2018 | 53 |
| Seven Canyons Advisors | Privacy Policy |
September 30, 2018 (Unaudited)
| FACTS | WHAT DO THE FUNDS DO WITH YOUR PERSONAL INFORMATION? | ||
| WHY? | Financial companies choose how they share your personal information. Federal law gives consumers the right to limit some but not all sharing. Federal law also requires us to tell you how we collect, share and protect your personal information. Please read this notice carefully to understand what we do. | ||
| WHAT? | The types of personal information we collect and share depend on the product or service you have with us. This information can include:
● Social Security number and account transactions ● Account balances and transaction history ● Wire transfer instructions | ||
| HOW? | All financial companies need to share customers’ personal information to run their everyday business. In the section below, we list the reasons financial companies can share their customers’ personal information, the reasons a Fund chooses to share, and whether you can limit this sharing. | ||
| REASONS WE CAN SHARE YOUR PERSONAL INFORMATION | DO THE FUNDS SHARE: | CAN YOU LIMIT THIS SHARING? | |
For our everyday business purposes – such as to process your transactions, maintain your account(s), respond to court orders and legal investigations, or report to credit bureaus | Yes | No | |
For our marketing purposes – to offer our products and services to you | No | We do not share. | |
| For joint marketing with other financial companies | No | We do not share. | |
For our affiliates’ everyday business purposes – information about your transactions and experiences | Yes | No | |
For our affiliates’ everyday business purposes – information about your creditworthiness | No | We do not share. | |
| For non-affiliates to market to you | No | We do not share. | |
| QUESTIONS? | Call 1-833-7-CANYON (833-722-6966) or go to www.sevencanyonsadvisors.com. | ||
| 54 | www.sevencanyonsadvisors.com |
| Seven Canyons Advisors | Privacy Policy |
September 30, 2018 (Unaudited)
| WHO WE ARE | ||
| Who is providing this notice? | Seven Canyons Strategic Income Fund and Seven Canyons World Innovators Fund (the “Funds”) | |
| WHAT WE DO | ||
| How do the Funds protect my personal information? | To protect your personal information from unauthorized access and use, we use security measures that comply with federal law. These measures include computer safeguards and secured files and buildings. | |
| How do the Funds collect my personal information? | We collect your personal information, for example, when you
● open an account ● provide account information or give us your contact information ● make a wire transfer or deposit money
| |
| Why can’t I limit all sharing? | Federal law gives you the right to limit only
● sharing for affiliates’ everyday business purposes-information about your creditworthiness ● affiliates from using your information to market to you ● sharing for non-affiliates to market to you ● State laws and individual companies may give you additional rights to limit sharing | |
| DEFINITIONS | ||
| Affiliates | Companies related by common ownership or control. They can be financial and nonfinancial companies. | |
| Non-affiliates | Companies not related by common ownership or control. They can be financial and nonfinancial companies.
● The Funds do not share with non-affiliates so they can market to you.
| |
| Joint marketing | A formal agreement between non-affiliated financial companies that together market financial products or services to you.
● The Funds do not jointly market. |
| Annual Report | September 30, 2018 | 55 |
| Seven Canyons Advisors | Privacy Policy |
September 30, 2018 (Unaudited)
| OTHER IMPORTANT INFORMATION | ||
| California Residents | If your account has a California home address, your personal information will not be disclosed to nonaffiliated third parties except as permitted by applicable California law, and we will limit sharing such personal information with our affiliates to comply with California privacy laws that apply to us. | |
| Vermont Residents | The State of Vermont requires financial institutions to obtain your consent prior to sharing personal information that they collect about you with affiliated companies and nonaffiliated third parties other than in certain limited circumstances. Except as permitted by law, we will not share personal information we collect about you with nonaffiliated third parties or other affiliated companies unless you provide us with your written consent to share such information. | |
| 56 | www.sevencanyonsadvisors.com |
| Seven Canyons Advisors | Trustees and Officers |
September 30, 2018 (Unaudited)
INTERESTED TRUSTEE
| Name, Birth Year & Address* | Position(s) Held with Fund | Term of Office and Length of Time Served** | Principal Occupation(s) During Past 5 Years*** | Number of Funds in Fund Complex Overseen by Trustee**** | Other Directorships Held by Trustee During Past 5 Years*** |
Ward D. Armstrong Birth year: 1954
| Trustee and Chairman | Mr. Armstrong was appointed to the Board on May 27, 2016. Mr. Armstrong was appointed Chairman of the Board at the August 24, 2017 meeting of the Board of Trustees. | Retired; Managing Partner, NorthRock Partners, LLC (October 2013 to July 2015); Managing Director, NorthRock Partners, a Private Wealth Advisory Practice of Ameriprise Financial (February 2010 to October 2013); Senior Vice President, Ameriprise Financial, Inc. (November 1984 to May 2007); President, American Express Asset Management (2002 to 2004); and Chairman, Ameriprise Trust Company (November 1996 to May 2007). | 12
| Mr. Armstrong is a Director of the Heartland Group, Inc. (5 funds).
|
| * | All communications to Trustees and Officers may be directed to ALPS Series Trust c/o 1290 Broadway, Suite 1100, Denver, CO 80203. |
| ** | This is the period for which the Trustee or Officer began serving the Trust. Each Trustee serves an indefinite term, until such Trustee’s successor is elected and appointed, or such Trustee resigns or is deceased. Officers are elected on an annual basis. |
| *** | Except as otherwise indicated, each individual has held the office shown or other offices in the same company for the last five years. |
| **** | The Fund Complex currently consists of 12 series of the Trust and any other investment companies for which Seven Canyons Advisors, LLC provides investment advisory services, currently none. |
| Annual Report | September 30, 2018 | 57 |
| Seven Canyons Advisors | Trustees and Officers |
September 30, 2018 (Unaudited)
| Name, Birth Year & Address* | Position(s) Held with Fund | Term of Office and Length of Time Served** | Principal Occupation(s) During Past 5 Years*** | Number of Funds in Fund Complex Overseen by Trustee**** | Other Directorships Held by Trustee During Past 5 Years*** |
J. Wayne Hutchens Birth year: 1944 | Trustee | Mr. Hutchens was elected to the Board on October 30, 2012. | Mr. Hutchens is currently retired. From April 2006 to December 2012, he served as President and CEO of the University of Colorado (CU) Foundation and from April 2009 to December 2012, he was Executive Director of the CU Real Estate Foundation. Mr. Hutchens is also Trustee of the Denver Museum of Nature and Science (2000 to present), Director of AMG National Trust Bank (June 2012 to present) and Trustee of Children’s Hospital Colorado (May 2012 to present). Prior to these positions, Mr. Hutchens spent 29 years in the banking industry, retiring as Chairman of Chase Bank Colorado. | 12 | Mr. Hutchens is a Director of RiverNorth Opportunities Fund, Inc. (2013 to present) |
Patrick Seese Birth year: 1971 | Trustee | Mr. Seese was elected to the Board on October 30, 2012. | Mr. Seese is an owner and a Managing Director of Integris Partners, a middle-market investment banking firm serving closely-held companies, financial sponsors and public companies (February 2008 to present). Prior to this, Mr. Seese was a Managing Director of Headwaters MB, a middle-market investing banking firm (December 2003 to February 2008). Prior to that, Mr. Seese worked in Credit Suisse First Boston’s Mergers and Acquisitions Group and served as Head of Corporation Development, Katy Industries, a publicly traded industrial and consumer products company and at Deloitte & Touche LLP, where he began his career in 1994. | 12 | Mr. Seese is a Director of The Mile High Five Foundation (2013 to present) and SJ Panthers Foundation (2016 to present) |
| * | All communications to Trustees and Officers may be directed to ALPS Series Trust c/o 1290 Broadway, Suite 1100, Denver, CO 80203. |
| ** | This is the period for which the Trustee or Officer began serving the Trust. Each Trustee serves an indefinite term, until such Trustee’s successor is elected and appointed, or such Trustee resigns or is deceased. Officers are elected on an annual basis. |
| *** | Except as otherwise indicated, each individual has held the office shown or other offices in the same company for the last five years. |
| **** | The Fund Complex currently consists of 12 series of the Trust and any other investment companies for which Seven Canyons Advisors, LLC provides investment advisory services, currently none. |
| 58 | www.sevencanyonsadvisors.com. |
| Seven Canyons Advisors | Trustees and Officers |
September 30, 2018 (Unaudited)
INTERESTED TRUSTEE
| Name, Birth Year & Address* | Position(s)Held with Fund | Term of Office and Length of Time Served** | Principal Occupation(s) During Past 5 Years*** | Number of Funds in Fund Complex Overseen by Trustee**** | Other Directorships Held by Trustee During Past 5 Years*** |
Jeremy O. May Birth year: 1970 | Trustee and President | Mr. May was elected Trustee and President on October 30, 2012. Mr. May was Chairman from October 30, 2012 to August 24, 2017. | Mr. May joined ALPS in 1995 and is currently President and Director of ALPS Fund Services, Inc., ALPS Distributors, Inc., and ALPS Portfolio Solutions Distributor, Inc., Executive Vice President and Director of ALPS Holdings, Inc. and ALPS Advisors, Inc. Because of his positions with these entities, Mr. May is deemed an affiliate of the Trust as defined under the 1940 Act. Mr. May is also on the Board of Directors of the University of Colorado Foundation and the AV Hunter Trust. | 12 | Mr. May is Trustee of the Reaves Utility Income Fund (1 fund)and Elevation ETF Trust (1 ETF) and President and Director of RiverNorth Opportunities Fund, Inc. |
| * | All communications to Trustees and Officers may be directed to ALPS Series Trust c/o 1290 Broadway, Suite 1100, Denver, CO 80203. |
| ** | This is the period for which the Trustee or Officer began serving the Trust. Each Trustee serves an indefinite term, until such Trustee’s successor is elected and appointed, or such Trustee resigns or is deceased. Officers are elected on an annual basis. |
| *** | Except as otherwise indicated, each individual has held the office shown or other offices in the same company for the last five years. |
| **** | The Fund Complex currently consists of 12 series of the Trust and any other investment companies for which Seven Canyons Advisors, LLC provides investment advisory services, currently none. |
| Annual Report | September 30, 2018 | 59 |
| Seven Canyons Advisors | Trustees and Officers |
September 30, 2018 (Unaudited)
OFFICERS
| Name, Birth Year & Address* | Position(s) Held with Fund | Office and Length of Time Served** | Principal Occupation(s) During Past 5 Years*** |
Kimberly R. Storms Birth year: 1972 | Treasurer | Ms. Storms was elected Treasurer of the Trust on October 30, 2012. | Ms. Storms is Senior Vice President and Director of Fund Administration of ALPS. Because of her position with ALPS, Ms. Storms is deemed an affiliate of the Trust as defined under the 1940 Act. Ms. Storms is also Treasurer of Financial Investors Trust, Liberty All-Star Equity Fund and Liberty All-Star Growth Fund, Inc. |
Richard C. Noyes Birth year: 1970 | Secretary | Mr. Noyes was elected Secretary of the Trust on November 14, 2016. | Mr. Noyes joined ALPS in 2015 and is Senior Vice President and General Counsel of ALPS. Prior to joining ALPS, Mr. Noyes served as Assistant Vice President and Senior Counsel of Janus Capital Management LLC. Mr. Noyes is deemed an affiliate of the Trust as defined under the 1940 Act. |
Anne M. Berg Birth year: 1973 | Assistant Secretary | Ms. Berg was elected Assistant Secretary of the Trust on August 23, 2018. | Ms. Berg joined ALPS as Senior Investment Company Act Paralegal in February 2017. Prior to joining ALPS, Anne was a Senior Legal Manager at Janus Capital Group Inc., a global investment manager in Denver, Colorado. Because of her position with ALPS, Ms. Berg is deemed an affiliate of the Trust as defined under the 1940 Act. |
Alan Gattis**** Birth year: 1980 | Assistant Treasurer | Mr. Gattis was elected Assistant Treasurer of the Trust on August 9, 2016. | Mr. Gattis joined ALPS in 2011 and is currently Vice President and Fund Controller of ALPS. Prior to joining ALPS, Mr. Gattis was an Auditor at Spicer Jeffries LLP (2009 through 2011) and an Auditor at PricewaterhouseCoopers LLP (2004 - 2009). Because of his position with ALPS, Mr. Gattis is deemed an affiliate of the Trust as defined under the 1940 Act. Mr. Gattis is also Assistant Treasurer of Elevation ETF Trust and Financial Investors Trust. |
| * | All communications to Trustees and Officers may be directed to ALPS Series Trust c/o 1290 Broadway, Suite 1100, Denver, CO 80203. |
| ** | This is the period for which the Trustee or Officer began serving the Trust. Each Trustee serves an indefinite term, until such Trustee’s successor is elected and appointed, or such Trustee resigns or is deceased. Officers are elected on an annual basis. |
| *** | Except as otherwise indicated, each individual has held the office shown or other offices in the same company for the last five years. |
| **** | Mr. Gattis resigned effective November 15, 2018. |
| 60 | www.sevencanyonsadvisors.com. |
| Seven Canyons Advisors | Trustees and Officers |
September 30, 2018 (Unaudited)
| Name, Birth Year & Address* | Position(s) Held with Fund | Term of Office and Length of Time Served** | Principal Occupation(s) During Past 5 Years*** |
Lucas D. Foss Birth year: 1977 | Chief Compliance Officer (“CCO”) | Mr. Foss was elected CCO of the Trust on January 22, 2018. | Mr. Foss joined ALPS in November 2017 as Vice President and Deputy Chief Compliance Officer. Prior to his current role, Mr. Foss served as the Director of Compliance at Transamerica Asset Management (July 2015- November 2017). Deputy Chief Compliance Officer at ALPS (September 2012 – June 2015) Compliance Manager at ALPS (January 2010 - August 2012) and a Senior Compliance Analyst at ALPS (November 2006 – December 2009). Before joining ALPS, Mr. Foss held positions at Bisys Hedge Fund Services and Deutsche Asset Management. Because of his position with ALPS, Mr. Foss is deemed an affiliate of the Trust as defined under the 1940 Act. Mr. Foss is also CCO of Harvest Volatility Edge Trust and Goehring & Rozencwajg Investment Funds. |
| * | All communications to Trustees and Officers may be directed to ALPS Series Trust c/o 1290 Broadway, Suite 1100, Denver, CO 80203. |
| ** | This is the period for which the Trustee or Officer began serving the Trust. Each Trustee serves an indefinite term, until such Trustee’s successor is elected and appointed, or such Trustee resigns or is deceased. Officers are elected on an annual basis. |
| *** | Except as otherwise indicated, each individual has held the office shown or other offices in the same company for the last five years. |
Additional information about members of the Board of Trustees and officers of the Trust is available in the Statement of Additional Information and is available, without charge, upon request, by calling the Fund (toll-free) at 1-833-722-6966.
| Annual Report | September 30, 2018 | 61 |

Must be accompanied or preceded by a prospectus.
ALPS Distributors, Inc. is the Distributor of the Funds.
Item 2. Code of Ethics.
| (a) | The registrant, as of the end of the period covered by this report, has adopted a code of ethics that applies to the registrant’s principal executive officer, principal financial officer, principal accounting officer or controller or any persons performing similar functions on behalf of the registrant. |
| (b) | Not applicable. |
| (c) | During the period covered by this report, no amendments to the provisions of the code of ethics adopted in Item 2(a) above were made. |
| (d) | During the period covered by this report, no implicit or explicit waivers to the provisions of the code of ethics adopted in Item 2(a) above were granted. |
| (e) | Not applicable. |
| (f) | The registrant’s Code of Ethics is attached as an Exhibit to this report. |
Item 3. Audit Committee Financial Expert.
The Board of Trustees of the registrant has determined that the registrant has at least one Audit Committee Financial Expert serving on its audit committee. The Board of Trustees of the registrant has designated J. Wayne Hutchens, as the registrant’s “Audit Committee Financial Experts.” Mr. Hutchens is “independent” as defined in paragraph (a)(2) of Item 3 to Form N-CSR.
Item 4. Principal Accountant Fees and Services.
| (a) | Audit Fees: For the registrant’s fiscal years ended September 30, 2018 and September 30, 2017, the aggregate fees billed for professional services rendered by the principal accountant for the audit of the registrant’s annual financial statements were $174,000 and 97,000, respectively. For the registrant’s fiscal years ended September 30, 2017 and 2018, Cohen & Company, Ltd. served as principal accountant. In 2018, the amount of $174,000 was paid to Cohen & Company, Ltd. and in 2017, the amount of $97,000 was paid to Cohen & Company, Ltd. |
| (b) | Audit-Related Fees: For the registrant’s fiscal years ended September 30, 2018 and September 30, 2017, the aggregate fees billed for assurance and related services by the principal accountant that were reasonably related to the performance of the audit of the registrant’s financial statements and are not reported under paragraph (a) of this Item were $0 and $0, respectively. |
| (c) | Tax Fees: For the registrant’s fiscal years ended September 30, 2018 and September 30, 2017, the aggregate fees billed for professional services rendered by the principal accountant for tax compliance, tax advice and tax planning were $38,000 and $23,000, respectively. The fiscal year 2018 and 2017 tax fees were for services for dividend calculation, excise tax preparation and tax return preparation. For the registrant’s fiscal years ended September 30, 2018 and September 30, 2017, Cohen & Company, Ltd. served as principal accountant. In 2018, the amount of $38,000 was paid to Cohen & Company, Ltd. and in 2017, the amount of $23,000 was paid to Cohen & Company, Ltd. |
| (d) | All Other Fees: For the registrant’s fiscal year ended September 30, 2018, $1,800 of other fees were billed to registrant by the principal accountant, Cohen & Company, Ltd. For the registrant’s fiscal year ended September 30, 2017, $6,500 of other fees were billed to registrant by the principal accountant for services other than the services reported in paragraphs (a) through (c) of this Item. |
| (e)(1) | Audit Committee Pre-Approval Policies and Procedures: All services to be performed by the registrant’s principal accountant must be pre-approved by the registrant’s audit committee. |
| (e)(2) | No services described in paragraphs (b) through (d) of this Item were approved by the registrant’s audit committee pursuant to paragraph (c)(7)(i)(C) of Rule 2-01 of Regulation S-X. |
| (f) | Not applicable. |
| (g) | The aggregate non-audit fees billed by the registrant’s accountant for services rendered to the registrant, and rendered to the registrant’s investment adviser (not including any sub-adviser whose role is primarily portfolio management and is subcontracted with or overseen by another investment adviser), and any entity controlling, controlled by, or under common control with the adviser that provides ongoing services to the registrant, were $38,000 in fiscal year ended September 30, 2018 and $23,000 in fiscal year ended September 30, 2017. These fees consisted of tax fees billed to the registrant as described in response to paragraph (c) of this Item. For the registrant’s fiscal years ended September 30, 2018 and September 30, 2017, Cohen & Company, Ltd. served as principal accountant. |
| (h) | The registrant’s audit committee has considered whether the provision of non-audit services that were rendered to the registrant’s investment adviser (not including any sub-adviser whose role is primarily portfolio management and is subcontracted with or overseen by another investment adviser), and any entity controlling, controlled by, or under common control with the investment adviser that provides ongoing services to the registrant that were not pre-approved pursuant to paragraph (c)(7)(ii) of Rule 2-01 of Regulation S-X, is compatible with maintaining the principal accountant’s independence and has determined that the provision of such non-audit services is compatible with maintaining the principal accountant’s independence. |
Item 5. Audit Committee of Listed Registrants.
Not applicable.
Item 6. Investments.
| (a) | Schedule of Investments is included as part of the Reports to Stockholders filed under Item 1 of this Form N-CSR. |
| (b) | Not applicable. |
Item 7. Disclosure of Proxy Voting Policies and Procedures for Closed-End Management Investment Companies.
Not applicable to the registrant.
Item 8. Portfolio Managers of Closed-End Management Investment Companies.
Not applicable to the registrant.
Item 9. Purchases of Equity Securities by Closed-End Management Investment Company and Affiliated Purchasers.
Not applicable to the registrant.
Item 10. Submission of Matters to Vote of Security Holders.
There have been no material changes to the procedures by which shareholders may recommend nominees to the registrant’s Board of Trustees, where those changes were implemented after the registrant last provided disclosure in response to the requirements of Item 407(c)(2)(iv) of Regulation S-K, or this Item.
Item 11. Controls and Procedures.
| (a) | The registrant’s principal executive officer and principal financial officer have evaluated the registrant’s disclosure controls and procedures (as defined in Rule 30a-3(c) under the Investment Company Act of 1940, as amended) within 90 days of this report and, except as discussed below, have concluded that the registrant’s disclosure controls and procedures were effective as of that date. A material weakness in internal controls relating to the reconciliation of valuation with respect to the swap contract held by the Insignia Macro Fund was identified. This weakness has since been corrected. |
| (b) | Except as discussed above, there was no change in the registrant’s internal control over financial reporting (as defined in Rule 30a-3(d) under the Investment Company Act of 1940, as amended) during the second fiscal quarter of the period covered by this report that has materially affected, or is reasonably likely to materially affect, the registrant’s internal control over financial reporting. |
Item 12. Disclosure of Securities Lending Activities for Closed-End Management Investment Companies.
Not applicable to the Registrant.
Item 13. Exhibits.
| (a)(1) | The registrant’s Code of Ethics for Principal Executive and Senior Financial Officers, which is the subject of the disclosure required by Item 2 of Form N-CSR is filed herewith as Exhibit 13(a)(1). |
| (a)(2) | The certifications required by Rule 30a-2(a) of the Investment Company Act of 1940, as amended, and Section 302 of the Sarbanes-Oxley Act of 2002 are attached hereto as Exhibit 99.Cert. |
| (a)(3) | None. |
| (a)(4) | Not applicable. |
| (b) | The certifications by the registrant’s principal executive officer and principal financial officer, as required by Rule 30a-2(b) of the Investment Company Act of 1940, as amended, and Section 906 of the Sarbanes-Oxley Act of 2002 are attached hereto as Exhibit 99.906Cert. |
SIGNATURES
Pursuant to the requirements of the Securities Exchange Act of 1934 and the Investment Company Act of 1940, the registrant has duly caused this report to be signed on its behalf by the undersigned, thereunto duly authorized.
| ALPS SERIES TRUST | ||
| By: | /s/ Jeremy O. May | |
| Jeremy O. May | ||
| President (Principal Executive Officer) | ||
| Date: | December 7, 2018 | |
Pursuant to the requirements of the Securities Exchange Act of 1934 and the Investment Company Act of 1940, this report has been signed below by the following persons on behalf of the registrant and in the capacities and on the dates indicated.
| By: | /s/ Jeremy O. May | |
| Jeremy O. May | ||
| President (Principal Executive Officer) | ||
| Date: | December 7, 2018 |
| By: | /s/ Kimberly R. Storms | |
| Kimberly R. Storms | ||
| Treasurer (Principal Financial Officer) | ||
| Date: | December 7, 2018 |