UNITED STATES
SECURITIES AND EXCHANGE COMMISSION
Washington, D.C. 20549
FORM N-CSR
CERTIFIED SHAREHOLDER REPORT OF REGISTERED
MANAGEMENT INVESTMENT COMPANIES
Investment Company Act file number: 811-22747
ALPS SERIES TRUST
(Exact name of registrant as specified in charter)
1290 Broadway, Suite 1000, Denver, Colorado 80203
(Address of principal executive offices) (Zip code)
(303) 623-2577
(Registrant’s telephone number, including area code)
Patrick Rogers, Secretary
ALPS Series Trust
1290 Broadway, Suite 1000
Denver, CO 80203
(Name and address of agent for service)
Date of fiscal year end: September 30
Date of reporting period: October 1, 2020 – September 30, 2021
Item 1. Reports to Stockholders.
| (a) |

Table of Contents
| Shareholder Letter | 2 |
| Portfolio Update | |
| Beacon Accelerated Return Strategy Fund | 5 |
| Beacon Planned Return Strategy Fund | 7 |
| Disclosure of Fund Expenses | 9 |
| Portfolios of Investments | |
| Beacon Accelerated Return Strategy Fund | 11 |
| Beacon Planned Return Strategy Fund | 14 |
| Statements of Assets and Liabilities | 17 |
| Statements of Operations | 18 |
| Statements of Changes in Net Assets | |
| Beacon Accelerated Return Strategy Fund | 19 |
| Beacon Planned Return Strategy Fund | 20 |
| Financial Highlights | 21 |
| Notes to Financial Statements | 25 |
| Report of Independent Registered Public Accounting Firm | 38 |
| Disclosure Regarding Renewal and Approval of Fund Advisory Agreement | 39 |
| Additional Information | 41 |
| Liquidity Risk Management Program | 42 |
| Privacy Policy | 43 |
| Trustees and Officers | 46 |
| Beacon Funds Trust | Shareholder Letter |
September 30, 2021 (Unaudited)
The S&P 500 squeaked out another positive return for the quarter ended September 30, 2021 rising 0.6%, although it ended on a down note by falling 4.7% in September. Over the course of the 12 months ended September 30, 2021, the S&P 500 was up 30.0%. The September loss was the first since January 2021 and has investors a bit unnerved as the market faces a number of short-term risks as it enters the earnings reporting season. Perhaps the most prominent of these risks is the looming extension of the federal government debt ceiling in December. The U.S. government has never defaulted on its U.S. Treasury bond obligations in its roughly 245 years of existence, but it has gone to the wire on several occasions resulting in investor angst. Treasury Secretary Janet Yellen said a default would be “catastrophic” and send the U.S. economy into another recession. We view a U.S. Treasury default as a low probability, but extremely high impact event, so are watching the situation closely.
Speaking of defaults, perhaps the biggest catalyst for the market’s September drawdown was the slow motion train wreck occurring with Evergrande Group, one of the largest property developers in China and the world. Real estate, and its related ecosystem, is at the heart of the Chinese economy, so the controlled restructuring of Evergrande poses the risk of a collapse and contagion beyond the Chinese real estate sector. Also adding to the September fireworks was the Federal Reserve’s announcement that a tapering of its longstanding bond buying program of $120 billion a month is at hand. We believe the taper is likely to begin in November 2021, but all bets are off if some dramatic events unfold in the interim. The taper talk has sent the yield on the benchmark 10 Year U.S. Treasury Note from roughly 1.25% to 1.65% in short order.
Adding to the risk bonfire is the ongoing supply chain bottlenecks experienced by many firms. These bottlenecks range from companies being unable to get their hands on production inputs, to COVID related lockdowns, to products sitting offshore on massive container ships with no one available to unload them. First, the shortages were confined to computer chips, but now shortages are springing up in areas as far flung as Nike’s sneaker factories in Vietnam. Fortunately, in most of these cases demand is delayed rather than destroyed completely, although the short-term effect is rising prices and dissatisfied customers.
Planned Return Strategy Fund — Performance and Benchmark Comparison
The Planned Return Strategy Fund (“PRS”) performed lower than its benchmark, the CBOE S&P 500 Buy/Write Index, over the past year, but continues to significantly outperform its benchmark over the more relevant 3 year and since inception periods.
PRS Fund Components of Performance
The returns sought to be generated by PRS Fund are derived from three distinct return elements, i.e., returns from Directional/Enhanced market movements, returns from Income (or option premium) and returns from the Hedge that seeks to create constant “downside protection”. Each return driver plays a crucial and sometimes complementary role in the overall performance of the strategy, as further described in greater detail below.
Directional/Enhanced
The Directional/Enhanced return component reflects that the performance of the S&P 500 is usually the main return driver of PRS Fund returns. Market exposure in the PRS Fund is generated by owning a deep-in-the-money call option. The return enhancement is created through the ownership of a long at-the-money call option. The Directional/Enhanced component added to returns over the past 12 months due to the strong increase in the S&P 500.
| 2 | www.beacontrust.com |
| Beacon Funds Trust | Shareholder Letter |
September 30, 2021 (Unaudited)
Income
The Income (or option premium) component represents cash flows received from selling out-of-the-money call and put options. This income generally serves two purposes by enhancing returns during periods of modest market movements and providing additional protection during declining markets. The income component detracted from performance over the past fiscal year since the out of the money call options declined in value, which offset the income gained from selling put options.
Hedge
The Hedge component is always present and provides the PRS Fund with its “downside protection” whenever it may be needed. This permanent “downside protection” is achieved by purchasing an at-the-money put option that rises in value as the market falls. The hedge detracted modestly from value over the year due to the rise in the S&P 500. In essence, it was insurance that was not needed in hindsight, but it reduced the portfolio risk and volatility.
Accelerated Return Strategy Fund — Performance and Benchmark Comparison
The Accelerated Return Strategy Fund (“ARS”) performed lower than its benchmark, the CBOE S&P 500 Buy/Write Index, over the past year, but continues to significantly outperform its benchmark over the more relevant 3 year and since inception periods.
ARS Fund Components of Performance
The returns sought to be generated by ARS Fund are derived from two distinct return elements, i.e. returns from Directional/Enhanced market movements and returns from Income (or option premium). Each return driver plays a crucial, and sometimes complementary role in the overall performance of the strategy.
Directional/Enhanced
The Directional/Enhanced return component reflects that the performance of the S&P 500 is the main return driver of ARS Fund. Market exposure in the ARS Fund is generated by owning a deep in the money call option. The return enhancement is created through the ownership of a long at-the-money call option. The directional component added to value over the past year due to the strong rise in the S&P 500.
Income
The Income (or option premium) component represents cash flows received from selling out-of-the-money call options. This Income component serves two purposes by enhancing returns during periods of modest market movements and providing additional protection during declining markets. The income component detracted from value over the past fiscal year since the premium received from selling the call options was smaller than the amount paid from the exercise of the options due to the strong rise in the S&P 500.
Market Outlook, Risks, and Conclusion
Assuming the federal debt ceiling is increased in December, as it always has in the past, we expect interest rates to gradually trend upward and the supply chain problems to slowly disappear, allowing for synchronized global growth to resume in earnest. In order for the economy to start to resemble what it looked like nearly two years ago, further progress on beating the COVID-19 pandemic must occur. There is good news to report on this front ranging from continued increase in global vaccinations, to a pill from Merck that limits the damage from the virus in most instances, to the impending launch of vaccinations for those at the age of 5 and above.
| Annual Report | September 30, 2021 | 3 |
| Beacon Funds Trust | Shareholder Letter |
September 30, 2021 (Unaudited)
To touch upon some additional risks not covered earlier in our note, we start with inflation, with recent readings of the Consumer Price Index (CPI) coming in at 5%+. The Fed’s longstanding trope of “transitory” inflation is experiencing increasing doubt. “Sticky” inflation may result in spiraling wage inflation creating a double whammy with the surge in most commodity prices this year. It raises the specter of the s word – stagflation – that is usually anathema to financial assets. At Beacon, we are not yet in the stagflation camp, but have it on our collective radar screens.
It seems like we have been saying this for months, but Congress continues to work on an infrastructure package. Our current thinking is that the traditional infrastructure package (e.g., bridges, roads, tunnels, sewers, broadband, etc.) will go through largely as planned, but that the “human services” infrastructure program may have to be slimmed down in order to receive congressional approval. An approved infrastructure package is likely to boost short-term GDP but also raises the possibility of higher taxes in order to pay for it. Geopolitical risk is ever present, with China-U.S. relations leading the list due to the enormous size of their respective economies. Beijing leaders have been cracking down on prominent Chinese firms, such as Alibaba and Tencent, in part to advance their “common prosperity” philosophy. It is not out of the question that Beijing will next target global firms doing business in China, negatively impacting profitability. China’s show of force with naval and air power over the South China Sea and Taiwan adds another dimension to geopolitical risk. Traditional hotspots in Russia, Iran, Afghanistan, and North Korea always have the potential to move from the back pages of the news to the front pages in a heartbeat.
The recent pullback in U.S. equities in September is normal, if not to be expected. We still favor equity-based strategies such as PRS and ARS with defined outcomes over fixed income for the long-term. Prior to the market decline at the end of the third quarter, the biggest drop for the S&P 500 in 2021 was a paltry 5%. This figure compares to an average intra-year decline of roughly 14% over the past 40 years and median decline of 11%. Yet, 75% of the time over this time frame, investors in the S&P 500 have finished the year in positive territory The lesson? During times of market distress, it usually makes sense to act like Rip Van Winkle. Relax, don’t focus on the stress of the short-term market turmoil, and wake up refreshed to discover potentially attractive long-term performance.
Beacon Funds Portfolio Management Team
| 4 | www.beacontrust.com |
| Beacon Accelerated Return Strategy Fund | Portfolio Update |
September 30, 2021 (Unaudited)
Performance of a Hypothetical $1,000,000 Initial Investment
(at Inception* through September 30, 2021)

The graph shown above represents historical performance of a hypothetical investment of $1,000,000 in the Institutional Class. Past performance does not guarantee future results. All returns reflect reinvested dividends, but do not reflect the deduction of taxes that a shareholder would pay on Fund distributions or the redemption of Fund shares.
Performance (as of September 30, 2021)
| 6 Month | 1 Year | 3 Year | Since Inception* | |
| Beacon Accelerated Return Strategy Fund – Institutional Class | 4.29% | 17.42% | 10.83% | 11.56% |
| CBOE S&P 500 BuyWrite Index | 6.50% | 21.10% | 4.15% | 5.51% |
The performance data quoted above represents past performance. Past performance is not a guarantee of future results. Investment return and value of the Fund shares will fluctuate so that an investor’s shares, when sold or redeemed, may be worth more or less than their original cost. Performance may be lower or higher than performance data quoted. Fund performance current to the most recent month end is available by calling (844) 894-9222 or by visiting www.beacontrust.com.
| * | Inception date of October 2, 2017 for Institutional Class. |
The Cboe S&P 500 BuyWrite Index (BXM) is a benchmark index designed to track the performance of a hypothetical buy-write strategy on the S&P 500 Index. The BXM is a passive total return index based on (1) buying an S&P 500 stock index portfolio, and (2) "writing" (or selling) the near-term S&P 500 Index (SPXSM) "covered" call option, generally on the third Friday of each month. The SPX call written will have about one month remaining to expiration, with an exercise price just above the prevailing index level (i.e., slightly out of the money). The SPX call is held until expiration and cash settled, at which time a new one-month, near-the-money call is written.
Returns of less than 1 year are cumulative.
| Annual Report | September 30, 2021 | 5 |
| Beacon Accelerated Return Strategy Fund | Portfolio Update |
September 30, 2021 (Unaudited)
Indices are not actively managed and do not reflect a deduction for fees, expenses or taxes. An investor cannot invest directly in an index.
The returns shown above do not reflect the deduction of taxes a shareholder would pay on Fund distributions or redemption of Fund shares.
The total annual operating expenses and total annual operating expenses after fee waivers and/or reimbursement for the Fund’s Institutional Class shares (as reported in the January 28, 2021 Prospectus), are 1.24% and 1.24%, respectively. The Fund’s investment adviser has contractually agreed to limit expenses through January 31, 2022.
Top Ten Holdings
| Option Contract | Expiration Date | Strike Price | % of Net Assets* |
| S&P 500® Mini Index | 6/14/22 | $0.01 | 11.62% |
| S&P 500® Mini Index | 11/12/21 | $0.01 | 8.99% |
| S&P 500® Mini Index | 12/14/21 | $0.01 | 8.44% |
| S&P 500® Mini Index | 1/14/22 | $0.01 | 8.44% |
| S&P 500® Mini Index | 2/14/22 | $0.01 | 8.43% |
| S&P 500® Mini Index | 3/14/22 | $0.01 | 8.24% |
| S&P 500® Mini Index | 8/12/22 | $0.01 | 8.03% |
| S&P 500® Mini Index | 7/14/22 | $0.01 | 7.86% |
| S&P 500® Mini Index | 10/14/21 | $0.01 | 7.74% |
| S&P 500® Mini Index | 5/13/22 | $0.01 | 7.16% |
| Top Ten Holdings | 84.95% |
| Asset Allocation | % of Net Assets* | ||
| Purchased Option Contracts | 104.62% | ||
| Written Option Contracts | -7.17% | ||
| Cash, Cash Equivalents, & Other Assets in Excess of Liabilities | 2.55% | ||
| Total | 100.00% |
| * | Holdings are subject to change, and may not reflect the current or future position of the portfolio. |
| 6 | www.beacontrust.com |
| Beacon Planned Return Strategy Fund | Portfolio Update |
September 30, 2021 (Unaudited)
Performance of a Hypothetical $1,000,000 Initial Investment
(at Inception* through September 30, 2021)
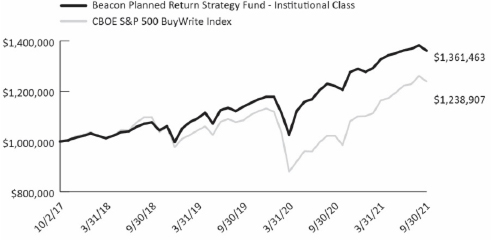
The graph shown above represents historical performance of a hypothetical investment of $1,000,000 in the Institutional Class. Past performance does not guarantee future results. All returns reflect reinvested dividends, but do not reflect the deduction of taxes that a shareholder would pay on Fund distributions or the redemption of Fund shares.
Performance (as of September 30, 2021)
| 6 Month | 1 Year | 3 Year | Since Inception* | |
| Beacon Planned Return Strategy Fund – Institutional Class | 2.58% | 11.53% | 8.14% | 8.03% |
| CBOE S&P 500 BuyWrite Index | 6.50% | 21.10% | 4.15% | 5.51% |
The performance data quoted above represents past performance. Past performance is not a guarantee of future results. Investment return and value of the Fund shares will fluctuate so that an investor’s shares, when sold or redeemed, may be worth more or less than their original cost. Performance may be lower or higher than performance data quoted. Fund performance current to the most recent month end is available by calling (844) 894-9222 or by visiting www.beacontrust.com.
| * | Inception date of October 2, 2017 for Institutional Class. |
The Cboe S&P 500 BuyWrite Index (BXM) is a benchmark index designed to track the performance of a hypothetical buy-write strategy on the S&P 500 Index. The BXM is a passive total return index based on (1) buying an S&P 500 stock index portfolio, and (2) "writing" (or selling) the near-term S&P 500 Index (SPXSM) "covered" call option, generally on the third Friday of each month. The SPX call written will have about one month remaining to expiration, with an exercise price just above the prevailing index level (i.e., slightly out of the money). The SPX call is held until expiration and cash settled, at which time a new one-month, near-the-money call is written.
Returns of less than 1 year are cumulative.
| Annual Report | September 30, 2021 | 7 |
| Beacon Planned Return Strategy Fund | Portfolio Update |
September 30, 2021 (Unaudited)
Indices are not actively managed and do not reflect a deduction for fees, expenses or taxes. An investor cannot invest directly in an index.
The returns shown above do not reflect the deduction of taxes a shareholder would pay on Fund distributions or redemption of Fund shares.
The total annual operating expenses and total annual operating expenses after fee waivers and/or reimbursement for the Fund’s Institutional Class shares (as reported in the January 28, 2021 Prospectus), 1.20% and 1.20%, respectively. The Fund’s investment adviser has contractually agreed to limit expenses through January 31, 2022.
Top Ten Holdings
| Option Contract | Expiration Date | Strike Price | % of Net Assets* |
| S&P 500® Mini Index | 10/14/21 | $45.30 | 9.56% |
| S&P 500® Mini Index | 1/14/22 | $49.25 | 8.71% |
| S&P 500® Mini Index | 2/14/22 | $51.35 | 8.50% |
| S&P 500® Mini Index | 3/14/22 | $51.25 | 8.38% |
| S&P 500® Mini Index | 11/12/21 | $47.30 | 8.24% |
| S&P 500® Mini Index | 7/14/22 | $56.80 | 8.18% |
| S&P 500® Mini Index | 9/14/22 | $58.40 | 8.13% |
| S&P 500® Mini Index | 6/14/22 | $55.39 | 7.96% |
| S&P 500® Mini Index | 8/12/22 | $58.00 | 7.84% |
| S&P 500® Mini Index | 5/13/22 | $54.25 | 7.84% |
| Top Ten Holdings | 83.34% |
| Asset Allocation | % of Net Assets* | ||
| Purchased Option Contracts | 117.00% | ||
| Written Option Contracts | -19.57% | ||
| Cash, Cash Equivalents, & Other Assets in Excess of Liabilities | 2.57% | ||
| Total | 100.00% |
| * | Holdings are subject to change, and may not reflect the current or future position of the portfolio. |
| 8 | www.beacontrust.com |
| Beacon Funds Trust | Disclosure of Fund Expenses |
September 30, 2021 (Unaudited)
Example. As a shareholder of the Beacon Accelerated Return Strategy Fund or Beacon Planned Return Strategy Fund (the “Funds”), you incur two types of costs: (1) transaction costs; and (2) ongoing costs, including management fees, shareholder service fees, and other Fund expenses. The following examples are intended to help you understand your ongoing costs (in dollars) of investing in a Fund and to compare these costs with the ongoing costs of investing in other mutual funds. The examples are based on an investment of $1,000 invested on April 1, 2021 and held through September 30, 2021.
Actual Expenses. The first line under each class in the following table provides information about actual account values and actual expenses. You may use the information in this line, together with the amount you invested, to estimate the expenses that you paid over the period. Simply divide your account value by $1,000 (for example, an $8,600 account value divided by $1,000 = 8.6), then multiply the result by the number in the first line under the heading “Expenses Paid During Period April 1, 2021 – September 30, 2021” to estimate the expenses you paid on your account during this period.
Hypothetical Example for Comparison Purposes. The second line under each class in the following table provides information about hypothetical account values and hypothetical expenses based on a Fund’s actual expense ratio and an assumed rate of return of 5% per year before expenses, which is not the Fund’s actual return. The hypothetical account values and expenses may not be used to estimate the actual ending account balance or expenses you paid for the period. You may use this information to compare the ongoing costs of investing in a Fund and other mutual funds. To do so, compare this 5% hypothetical example with the 5% hypothetical examples that appear in the shareholder reports of the other funds.
Please note that the expenses shown in the table are meant to highlight your ongoing Fund costs only and do not reflect any transactional costs. Therefore, the second line under each class in the table below is useful in comparing ongoing costs only and will not help you determine the relative total costs of owning different funds. In addition, if these transactional costs were included, your costs would have been higher.
| Annual Report | September 30, 2021 | 9 |
| Beacon Funds Trust | Disclosure of Fund Expenses |
September 30, 2021 (Unaudited)
| Beginning Account Value April 1, 2021 | Ending Account Value September 30, 2021 | Expense Ratio(a) | Expenses Paid During Period April 1, 2021 - September 30, 2021(b) | |
| Beacon Accelerated Return | ||||
| Strategy Fund | ||||
| Institutional Class | ||||
| Actual | $1,000.00 | $1,042.90 | 1.22% | $ 6.25 |
| Hypothetical (5% return before expenses) | $1,000.00 | $1,018.95 | 1.22% | $ 6.17 |
| Beacon Planned Return | ||||
| Strategy Fund | ||||
| Institutional Class | ||||
| Actual | $1,000.00 | $1,025.80 | 1.19% | $ 6.04 |
| Hypothetical (5% return before expenses) | $1,000.00 | $1,019.10 | 1.19% | $ 6.02 |
| (a) | Each Fund's expense ratios have been annualized based on the Fund's most recent fiscal half-year expenses after any applicable waivers and reimbursements. |
| (b) | Expenses are equal to the annualized expense ratio shown above for the applicable class, multiplied by the average account value over the period, multiplied by the number of days in the most recent fiscal half year (183), divided by 365. |
| 10 | www.beacontrust.com |
| Beacon Accelerated Return Strategy Fund | Portfolio of Investments |
September 30, 2021
| Counterparty | Expiration Date | Strike Price | Contracts | Notional Value | Value (Note 2) | |||||||||||||
| PURCHASED OPTION CONTRACTS - (104.62%) | ||||||||||||||||||
| Call Option Contracts (104.62%) | ||||||||||||||||||
| S&P 500® Mini Index: | ||||||||||||||||||
| Goldman Sachs | 10/14/2021 | $ | 0.01 | 215 | $ | 9,261,211 | $ | 9,262,578 | ||||||||||
| Goldman Sachs | 10/14/2021 | 361.68 | 215 | 9,261,211 | 1,491,314 | |||||||||||||
| Goldman Sachs | 11/12/2021 | 0.01 | 250 | 10,768,850 | 10,761,343 | |||||||||||||
| Goldman Sachs | 11/12/2021 | 377.80 | 250 | 10,768,850 | 1,371,659 | |||||||||||||
| Goldman Sachs | 12/14/2021 | 0.01 | 235 | 10,122,719 | 10,102,928 | |||||||||||||
| Goldman Sachs | 12/14/2021 | 393.35 | 235 | 10,122,719 | 1,012,188 | |||||||||||||
| Goldman Sachs | 01/14/2022 | 0.01 | 235 | 10,122,719 | 10,102,651 | |||||||||||||
| Goldman Sachs | 01/14/2022 | 393.09 | 185 | 7,968,949 | 844,909 | |||||||||||||
| Goldman Sachs | 01/14/2022 | 393.35 | 50 | 2,153,770 | 227,280 | |||||||||||||
| Goldman Sachs | 02/14/2022 | 0.01 | 235 | 10,122,719 | 10,093,948 | |||||||||||||
| Goldman Sachs | 02/14/2022 | 393.09 | 125 | 5,384,425 | 595,547 | |||||||||||||
| Goldman Sachs | 02/14/2022 | 416.40 | 110 | 4,738,294 | 327,589 | |||||||||||||
| Goldman Sachs | 03/14/2022 | 0.01 | 230 | 9,907,342 | 9,868,752 | |||||||||||||
| Goldman Sachs | 03/14/2022 | 414.64 | 70 | 3,015,278 | 232,272 | |||||||||||||
| Goldman Sachs | 03/14/2022 | 416.40 | 160 | 6,892,064 | 510,591 | |||||||||||||
| Goldman Sachs | 04/14/2022 | 0.01 | 190 | 8,184,326 | 8,148,278 | |||||||||||||
| Goldman Sachs | 04/14/2022 | 414.64 | 190 | 8,184,326 | 673,508 | |||||||||||||
| Goldman Sachs | 05/13/2022 | 0.01 | 200 | 8,615,080 | 8,568,897 | |||||||||||||
| Goldman Sachs | 05/13/2022 | 424.82 | 200 | 8,615,080 | 608,782 | |||||||||||||
| Goldman Sachs | 06/14/2022 | 0.01 | 325 | 13,999,505 | 13,910,024 | |||||||||||||
| Goldman Sachs | 06/14/2022 | 424.82 | 100 | 4,307,540 | 321,983 | |||||||||||||
| Goldman Sachs | 06/14/2022 | 436.60 | 225 | 9,691,965 | 556,569 | |||||||||||||
| Goldman Sachs | 07/14/2022 | 0.01 | 220 | 9,476,588 | 9,411,015 | |||||||||||||
| Goldman Sachs | 07/14/2022 | 436.60 | 50 | 2,153,770 | 132,687 | |||||||||||||
| Goldman Sachs | 07/14/2022 | 445.40 | 170 | 7,322,818 | 365,093 | |||||||||||||
| Goldman Sachs | 08/12/2022 | 0.01 | 225 | 9,691,965 | 9,616,414 | |||||||||||||
| Goldman Sachs | 08/12/2022 | 445.40 | 100 | 4,307,540 | 229,876 | |||||||||||||
| Goldman Sachs | 08/12/2022 | 447.90 | 125 | 5,384,425 | 270,110 | |||||||||||||
| Goldman Sachs | 09/14/2022 | 0.01 | 125 | 5,384,425 | 5,336,422 | |||||||||||||
| Goldman Sachs | 09/14/2022 | 447.90 | 125 | 5,384,425 | 290,113 | |||||||||||||
| 231,314,898 | 125,245,320 | |||||||||||||||||
| TOTAL PURCHASED OPTION CONTRACTS | ||||||||||||||||||
| (Cost $116,583,602) | $ | 231,314,898 | $ | 125,245,320 | ||||||||||||||
See Notes to Financial Statements.
| Annual Report | September 30, 2021 | 11 |
| Beacon Accelerated Return Strategy Fund | Portfolio of Investments |
September 30, 2021
| 7 Day Yield | Shares | Value (Note 2) | ||||||||||
| SHORT TERM INVESTMENTS (2.67%) | ||||||||||||
| Money Market Funds | ||||||||||||
| Goldman Sachs Financial Square Funds - Treasury Instruments Fund(a) | 0.000 | % | 1,844,318 | $ | 1,844,318 | |||||||
| Invesco Short-Term Investments Trust | ||||||||||||
| Government & Agency Portfolio - Institutional Class | 0.030 | % | 1,355,054 | 1,355,054 | ||||||||
| 3,199,372 | ||||||||||||
| TOTAL SHORT TERM INVESTMENTS | ||||||||||||
| (Cost $3,199,372) | 3,199,372 | |||||||||||
| TOTAL INVESTMENTS (107.29%) | ||||||||||||
| (Cost $119,782,974) | $ | 128,444,692 | ||||||||||
| LIABILITIES IN EXCESS OF OTHER ASSETS (-7.29%) | (8,730,859 | ) | ||||||||||
| NET ASSETS (100.00%) | $ | 119,713,833 | ||||||||||
| (a) | All or a portion is held as collateral at broker for written options. |
See Notes to Financial Statements.
| 12 | www.beacontrust.com |
| Beacon Accelerated Return Strategy Fund | Portfolio of Investments |
September 30, 2021
WRITTEN OPTION CONTRACTS (7.17%)
| Counterparty | Expiration Date | Strike Price | Contracts | Premiums Received | Notional Value | Value (Note 2) | ||||||||||||||||
| Call Option Contracts - (7.17%) | ||||||||||||||||||||||
| S&P 500® Mini Index | ||||||||||||||||||||||
| Goldman Sachs | 10/14/21 | $ | 394.23 | (430 | ) | $ | 435,125 | $ | (18,522,422 | ) | $ | (1,609,020 | ) | |||||||||
| Goldman Sachs | 11/12/21 | 408.97 | (500 | ) | 539,960 | (21,537,700 | ) | (1,377,262 | ) | |||||||||||||
| Goldman Sachs | 12/14/21 | 427.89 | (470 | ) | 575,712 | (20,245,438 | ) | (773,898 | ) | |||||||||||||
| Goldman Sachs | 01/14/22 | 427.05 | (370 | ) | 420,105 | (15,937,898 | ) | (737,519 | ) | |||||||||||||
| Goldman Sachs | 01/14/22 | 430.05 | (100 | ) | 129,392 | (4,307,540 | ) | (179,482 | ) | |||||||||||||
| Goldman Sachs | 02/14/22 | 429.25 | (250 | ) | 299,605 | (10,768,850 | ) | (523,581 | ) | |||||||||||||
| Goldman Sachs | 02/14/22 | 448.20 | (220 | ) | 225,042 | (9,476,588 | ) | (222,304 | ) | |||||||||||||
| Goldman Sachs | 03/14/22 | 445.86 | (140 | ) | 147,409 | (6,030,556 | ) | (187,901 | ) | |||||||||||||
| Goldman Sachs | 03/14/22 | 450.20 | (320 | ) | 340,135 | (13,784,128 | ) | (361,515 | ) | |||||||||||||
| Goldman Sachs | 04/14/22 | 447.89 | (380 | ) | 417,210 | (16,368,652 | ) | (555,060 | ) | |||||||||||||
| Goldman Sachs | 05/13/22 | 456.00 | (400 | ) | 404,778 | (17,230,160 | ) | (508,293 | ) | |||||||||||||
| Goldman Sachs | 06/14/22 | 458.21 | (200 | ) | 211,189 | (8,615,080 | ) | (267,116 | ) | |||||||||||||
| Goldman Sachs | 06/14/22 | 469.43 | (450 | ) | 489,125 | (19,383,930 | ) | (400,488 | ) | |||||||||||||
| Goldman Sachs | 07/14/22 | 471.62 | (100 | ) | 115,995 | (4,307,540 | ) | (95,382 | ) | |||||||||||||
| Goldman Sachs | 07/14/22 | 478.18 | (340 | ) | 376,022 | (14,645,636 | ) | (255,395 | ) | |||||||||||||
| Goldman Sachs | 08/12/22 | 0.01 | (250 | ) | 313,237 | (10,768,850 | ) | (177,091 | ) | |||||||||||||
| Goldman Sachs | 08/12/22 | 480.36 | (200 | ) | 228,989 | (8,615,080 | ) | (162,591 | ) | |||||||||||||
| Goldman Sachs | 08/12/22 | 481.85 | (250 | ) | 300,987 | (10,768,850 | ) | (193,012 | ) | |||||||||||||
| TOTAL WRITTEN OPTION CONTRACTS | $ | 5,970,017 | $ | (231,314,898 | ) | $ | (8,586,910 | ) | ||||||||||||||
See Notes to Financial Statements.
| Annual Report | September 30, 2021 | 13 |
| Beacon Planned Return Strategy Fund | Portfolio of Investments |
September 30, 2021
| Counterparty | Expiration Date | Strike Price | Contracts | Notional Value | Value (Note 2) | |||||||||||||
| PURCHASED OPTION CONTRACTS - (117.00%) | ||||||||||||||||||
| Call Option Contracts (111.96%) | ||||||||||||||||||
| S&P 500® Mini Index: | ||||||||||||||||||
| Goldman Sachs | 10/14/2021 | $ | 45.30 | 900 | $ | 38,767,860 | $ | 34,697,562 | ||||||||||
| Goldman Sachs | 10/14/2021 | 347.50 | 900 | 38,767,860 | 7,515,617 | |||||||||||||
| Goldman Sachs | 11/12/2021 | 47.30 | 780 | 33,598,812 | 29,887,011 | |||||||||||||
| Goldman Sachs | 11/12/2021 | 362.35 | 780 | 33,598,812 | 5,423,152 | |||||||||||||
| Goldman Sachs | 12/14/2021 | 47.85 | 315 | 13,568,751 | 12,035,434 | |||||||||||||
| Goldman Sachs | 12/14/2021 | 48.70 | 450 | 19,383,930 | 17,155,231 | |||||||||||||
| Goldman Sachs | 12/14/2021 | 368.55 | 315 | 13,568,751 | 2,047,879 | |||||||||||||
| Goldman Sachs | 12/14/2021 | 373.25 | 450 | 19,383,930 | 2,732,961 | |||||||||||||
| Goldman Sachs | 01/14/2022 | 49.25 | 830 | 35,752,582 | 31,595,435 | |||||||||||||
| Goldman Sachs | 01/14/2022 | 377.65 | 830 | 35,752,582 | 4,879,524 | |||||||||||||
| Goldman Sachs | 02/14/2022 | 51.35 | 815 | 35,106,451 | 30,823,320 | |||||||||||||
| Goldman Sachs | 02/14/2022 | 393.20 | 815 | 35,106,451 | 3,875,715 | |||||||||||||
| Goldman Sachs | 03/14/2022 | 51.25 | 805 | 34,675,697 | 30,416,833 | |||||||||||||
| Goldman Sachs | 03/14/2022 | 393.00 | 805 | 34,675,697 | 3,986,465 | |||||||||||||
| Goldman Sachs | 04/14/2022 | 54.25 | 680 | 29,291,272 | 25,475,034 | |||||||||||||
| Goldman Sachs | 04/14/2022 | 56.80 | 135 | 5,815,179 | 5,023,129 | |||||||||||||
| Goldman Sachs | 04/14/2022 | 416.85 | 680 | 29,291,272 | 2,300,860 | |||||||||||||
| Goldman Sachs | 04/14/2022 | 435.25 | 135 | 5,815,179 | 293,262 | |||||||||||||
| Goldman Sachs | 05/13/2022 | 54.25 | 760 | 32,737,304 | 28,445,009 | |||||||||||||
| Goldman Sachs | 05/13/2022 | 415.50 | 760 | 32,737,304 | 2,789,499 | |||||||||||||
| Goldman Sachs | 06/14/2022 | 55.39 | 775 | 33,383,435 | 28,879,879 | |||||||||||||
| Goldman Sachs | 06/14/2022 | 424.10 | 775 | 33,383,435 | 2,531,913 | |||||||||||||
| Goldman Sachs | 07/14/2022 | 56.80 | 800 | 34,460,320 | 29,680,829 | |||||||||||||
| Goldman Sachs | 07/14/2022 | 435.25 | 800 | 34,460,320 | 2,188,615 | |||||||||||||
| Goldman Sachs | 08/12/2022 | 58.00 | 770 | 33,168,058 | 28,446,779 | |||||||||||||
| Goldman Sachs | 08/12/2022 | 446.85 | 770 | 33,168,058 | 1,707,848 | |||||||||||||
| Goldman Sachs | 09/14/2022 | 58.40 | 800 | 34,460,320 | 29,485,019 | |||||||||||||
| Goldman Sachs | 09/14/2022 | 448.10 | 800 | 34,460,320 | 1,848,183 | |||||||||||||
| 828,339,942 | 406,167,997 | |||||||||||||||||
See Notes to Financial Statements.
| 14 | www.beacontrust.com |
| Beacon Planned Return Strategy Fund | Portfolio of Investments |
September 30, 2021
| Counterparty | Expiration Date | Strike Price | Contracts | Notional Value | Value (Note 2) | |||||||||||||
| PURCHASED OPTION CONTRACTS - (117.00%) (continued) | ||||||||||||||||||
| Put Option Contracts (5.04%) | ||||||||||||||||||
| S&P 500® Mini Index: | ||||||||||||||||||
| Goldman Sachs | 10/14/2021 | $ | 347.50 | 900 | $ | 38,767,860 | $ | 15,512 | ||||||||||
| Goldman Sachs | 11/12/2021 | 362.35 | 780 | 33,598,812 | �� | 108,443 | ||||||||||||
| Goldman Sachs | 12/14/2021 | 368.55 | 315 | 13,568,751 | 113,351 | |||||||||||||
| Goldman Sachs | 12/14/2021 | 373.25 | 450 | 19,383,930 | 180,824 | |||||||||||||
| Goldman Sachs | 01/14/2022 | 377.65 | 830 | 35,752,582 | 536,943 | |||||||||||||
| Goldman Sachs | 02/14/2022 | 393.20 | 815 | 35,106,451 | 907,451 | |||||||||||||
| Goldman Sachs | 03/14/2022 | 393.00 | 805 | 34,675,697 | 1,073,688 | |||||||||||||
| Goldman Sachs | 04/14/2022 | 416.85 | 680 | 29,291,272 | 1,475,286 | |||||||||||||
| Goldman Sachs | 04/14/2022 | 435.25 | 135 | 5,815,179 | 377,687 | |||||||||||||
| Goldman Sachs | 05/13/2022 | 415.50 | 760 | 32,737,304 | 1,789,887 | |||||||||||||
| Goldman Sachs | 06/14/2022 | 424.10 | 775 | 33,383,435 | 2,215,296 | |||||||||||||
| Goldman Sachs | 07/14/2022 | 435.25 | 800 | 34,460,320 | 2,769,450 | |||||||||||||
| Goldman Sachs | 08/12/2022 | 446.85 | 770 | 33,168,058 | 3,185,835 | |||||||||||||
| Goldman Sachs | 09/14/2022 | 448.10 | 800 | 34,460,320 | 3,518,576 | |||||||||||||
| 414,169,971 | 18,268,229 | |||||||||||||||||
| TOTAL PURCHASED OPTION CONTRACTS | ||||||||||||||||||
| (Cost $391,444,612) | $ | 1,242,509,913 | $ | 424,436,226 | ||||||||||||||
| 7 Day Yield | Shares | Value (Note 2) | ||||||||||
| SHORT TERM INVESTMENTS (2.70%) | ||||||||||||
| Money Market Funds | ||||||||||||
| Goldman Sachs Financial Square Funds - Treasury Instruments Fund(a) | 0.000 | % | 3,836,483 | $ | 3,836,483 | |||||||
| Invesco Short-Term Investments Trust | ||||||||||||
| Government & Agency Portfolio - Institutional Class | 0.030 | % | 5,975,927 | 5,975,928 | ||||||||
| 9,812,411 | ||||||||||||
| TOTAL SHORT TERM INVESTMENTS | ||||||||||||
| (Cost $9,812,411) | 9,812,411 | |||||||||||
| TOTAL INVESTMENTS (119.70%) | ||||||||||||
| (Cost $401,257,023) | $ | 434,248,637 | ||||||||||
| LIABILITIES IN EXCESS OF OTHER ASSETS (-19.70%) | (71,476,023 | ) | ||||||||||
| NET ASSETS (100.00%) | $ | 362,772,614 | ||||||||||
| (a) | All or a portion is held as collateral at broker for written options. |
See Notes to Financial Statements.
| Annual Report | September 30, 2021 | 15 |
| Beacon Planned Return Strategy Fund | Portfolio of Investments |
September 30, 2021
WRITTEN OPTION CONTRACTS (19.57%)
| Counterparty | Expiration Date | Strike Price | Contracts | Premiums Received | Notional Value | Value (Note 2) | ||||||||||||||||
| Put Option Contracts - (2.94%) | ||||||||||||||||||||||
| S&P 500® Mini Index | ||||||||||||||||||||||
| Goldman Sachs | 10/14/21 | $ | 312.75 | (900 | ) | $ | 1,883,627 | $ | (38,767,860 | ) | $ | (5,799 | ) | |||||||||
| Goldman Sachs | 11/12/21 | 326.12 | (780 | ) | 1,513,137 | (33,598,812 | ) | (49,463 | ) | |||||||||||||
| Goldman Sachs | 12/14/21 | 331.70 | (315 | ) | 654,230 | (13,568,751 | ) | (50,197 | ) | |||||||||||||
| Goldman Sachs | 12/14/21 | 335.93 | (450 | ) | 899,064 | (19,383,930 | ) | (78,443 | ) | |||||||||||||
| Goldman Sachs | 01/14/22 | 339.89 | (830 | ) | 1,799,403 | (35,752,582 | ) | (254,935 | ) | |||||||||||||
| Goldman Sachs | 02/14/22 | 353.88 | (815 | ) | 1,895,624 | (35,106,451 | ) | (458,303 | ) | |||||||||||||
| Goldman Sachs | 03/14/22 | 353.70 | (805 | ) | 1,777,375 | (34,675,697 | ) | (579,061 | ) | |||||||||||||
| Goldman Sachs | 04/14/22 | 375.17 | (680 | ) | 1,296,706 | (29,291,272 | ) | (818,553 | ) | |||||||||||||
| Goldman Sachs | 04/14/22 | 391.73 | (135 | ) | 215,453 | (5,815,179 | ) | (205,204 | ) | |||||||||||||
| Goldman Sachs | 05/13/22 | 373.95 | (760 | ) | 1,513,859 | (32,737,304 | ) | (1,028,750 | ) | |||||||||||||
| Goldman Sachs | 06/14/22 | 381.69 | (775 | ) | 1,474,008 | (33,383,435 | ) | (1,315,153 | ) | |||||||||||||
| Goldman Sachs | 07/14/22 | 391.73 | (800 | ) | 1,601,556 | (34,460,320 | ) | (1,670,517 | ) | |||||||||||||
| Goldman Sachs | 08/12/22 | 402.17 | (770 | ) | 1,568,449 | (33,168,058 | ) | (1,951,127 | ) | |||||||||||||
| Goldman Sachs | 09/14/22 | 403.29 | (800 | ) | 1,797,558 | (34,460,320 | ) | (2,204,310 | ) | |||||||||||||
| 19,890,049 | (414,169,971 | ) | (10,669,815 | ) | ||||||||||||||||||
| Call Option Contracts - (16.63%) | ||||||||||||||||||||||
| S&P 500® Mini Index | ||||||||||||||||||||||
| Goldman Sachs | 10/14/21 | 368.20 | (1,800 | ) | 3,268,681 | (77,535,720 | ) | (11,318,520 | ) | |||||||||||||
| Goldman Sachs | 11/12/21 | 381.55 | (1,560 | ) | 2,595,729 | (67,197,624 | ) | (8,021,868 | ) | |||||||||||||
| Goldman Sachs | 12/14/21 | 388.34 | (630 | ) | 1,079,769 | (27,137,502 | ) | (2,984,151 | ) | |||||||||||||
| Goldman Sachs | 12/14/21 | 392.30 | (900 | ) | 1,507,427 | (38,767,860 | ) | (3,956,932 | ) | |||||||||||||
| Goldman Sachs | 01/14/22 | 398.50 | (1,660 | ) | 3,034,366 | (71,505,164 | ) | (6,847,483 | ) | |||||||||||||
| Goldman Sachs | 02/14/22 | 415.89 | (1,630 | ) | 3,276,188 | (70,212,902 | ) | (4,914,955 | ) | |||||||||||||
| Goldman Sachs | 03/14/22 | 415.10 | (1,610 | ) | 3,042,788 | (69,351,394 | ) | (5,289,667 | ) | |||||||||||||
| Goldman Sachs | 04/14/22 | 436.11 | (1,360 | ) | 2,366,298 | (58,582,544 | ) | (2,883,247 | ) | |||||||||||||
| Goldman Sachs | 04/14/22 | 450.05 | (270 | ) | 440,085 | (11,630,358 | ) | (364,939 | ) | |||||||||||||
| Goldman Sachs | 05/13/22 | 434.90 | (1,520 | ) | 2,843,812 | (65,474,608 | ) | (3,627,325 | ) | |||||||||||||
| Goldman Sachs | 06/14/22 | 442.04 | (1,550 | ) | 2,653,515 | (66,766,870 | ) | (3,347,141 | ) | |||||||||||||
| Goldman Sachs | 07/14/22 | 454.75 | (1,600 | ) | 3,084,712 | (68,920,640 | ) | (2,648,701 | ) | |||||||||||||
| Goldman Sachs | 08/12/22 | 466.15 | (1,540 | ) | 2,842,758 | (66,336,116 | ) | (1,996,486 | ) | |||||||||||||
| Goldman Sachs | 09/14/22 | 469.03 | (1,600 | ) | 3,172,717 | (68,920,640 | ) | (2,134,067 | ) | |||||||||||||
| 35,208,845 | (828,339,942 | ) | (60,335,482 | ) | ||||||||||||||||||
| TOTAL WRITTEN OPTION CONTRACTS | $ | 55,098,894 | $ | (1,242,509,913 | ) | $ | (71,005,297 | ) | ||||||||||||||
See Notes to Financial Statements.
| 16 | www.beacontrust.com |
| Beacon Funds Trust | Statements of Assets and Liabilities |
September 30, 2021
| BEACON ACCELERATED RETURN STRATEGY FUND | BEACON PLANNED RETURN STRATEGY FUND | |||||||
| ASSETS: | ||||||||
| Investments, at value (Cost $119,782,974 and $401,257,023) | $ | 128,444,692 | $ | 434,248,637 | ||||
| Receivable for investments sold | 35 | 125 | ||||||
| Receivable for shares sold | 8,506 | 40,886 | ||||||
| Dividends and interest receivable | 1 | 5 | ||||||
| Other assets | 5,818 | 6,407 | ||||||
| Total Assets | 128,459,052 | 434,296,060 | ||||||
| LIABILITIES: | ||||||||
| Written options, at value (premiums received $5,970,017 and $55,098,894) | 8,586,910 | 71,005,297 | ||||||
| Payable for administration and transfer agent fees | 21,624 | 51,916 | ||||||
| Payable for shares redeemed | – | 100,000 | ||||||
| Payable to adviser | 100,221 | 300,547 | ||||||
| Payable for distribution and service fees | 2,984 | 12,518 | ||||||
| Payable for printing fees | 1,321 | 3,718 | ||||||
| Payable for professional fees | 24,479 | 32,111 | ||||||
| Payable for trustees' fees and expenses | 2,558 | 7,580 | ||||||
| Payable to Chief Compliance Officer fees | 679 | 2,013 | ||||||
| Accrued expenses and other liabilities | 4,443 | 7,746 | ||||||
| Total Liabilities | 8,745,219 | 71,523,446 | ||||||
| NET ASSETS | $ | 119,713,833 | $ | 362,772,614 | ||||
| NET ASSETS CONSIST OF: | ||||||||
| Paid-in capital (Note 6) | $ | 100,779,450 | $ | 326,257,435 | ||||
| Total distributable earnings | 18,934,383 | 36,515,179 | ||||||
| NET ASSETS | $ | 119,713,833 | $ | 362,772,614 | ||||
| PRICING OF SHARES | ||||||||
| Institutional Class : | ||||||||
| Net Asset Value, offering and redemption price per share | $ | 11.66 | $ | 11.13 | ||||
| Net Assets | $ | 119,713,833 | $ | 362,772,614 | ||||
| Shares of beneficial interest outstanding | 10,269,360 | 32,603,940 | ||||||
See Notes to Financial Statements.
| Annual Report | September 30, 2021 | 17 |
| Beacon Funds Trust | Statements of Operations |
For the Year Ended September 30, 2021
| BEACON ACCELERATED RETURN STRATEGY FUND | BEACON PLANNED RETURN STRATEGY FUND | |||||||
| INVESTMENT INCOME: | ||||||||
| Dividends | $ | 199 | $ | 2,043 | ||||
| Total Investment Income | 199 | 2,043 | ||||||
| EXPENSES: | ||||||||
| Investment advisory fees (Note 7) | 1,185,438 | 3,445,351 | ||||||
| Administration fees | 101,659 | 275,463 | ||||||
| Shareholder service fees | ||||||||
| Institutional Class | 37,435 | 137,435 | ||||||
| Custody fees | 6,182 | 5,915 | ||||||
| Legal fees | 10,453 | 29,970 | ||||||
| Audit and tax fees | 19,250 | 19,250 | ||||||
| Transfer agent fees | 29,152 | 65,394 | ||||||
| Trustees' fees and expenses | 10,897 | 31,492 | ||||||
| Registration and filing fees | 21,859 | 25,227 | ||||||
| Printing fees | 3,612 | 10,143 | ||||||
| Chief Compliance Officer fees | 8,183 | 23,774 | ||||||
| Insurance fees | 4,272 | 11,833 | ||||||
| Other expenses | 5,642 | 10,753 | ||||||
| Total Expenses | 1,444,034 | 4,092,000 | ||||||
| NET INVESTMENT LOSS | (1,443,835 | ) | (4,089,957 | ) | ||||
| REALIZED AND UNREALIZED GAIN/(LOSS) ON INVESTMENTS AND WRITTEN OPTIONS: | ||||||||
| Net realized gain/(loss) on: | ||||||||
| Investments | 60,570,955 | 147,281,843 | ||||||
| Written options | (37,981,708 | ) | (108,238,114 | ) | ||||
| Net realized gain | 22,589,247 | 39,043,729 | ||||||
| Change in unrealized appreciation/(depreciation) on: | ||||||||
| Investments | (7,733,233 | ) | (535,144 | ) | ||||
| Written options | 5,522,204 | 2,096,550 | ||||||
| Net change | (2,211,029 | ) | 1,561,406 | |||||
| NET REALIZED AND UNREALIZED GAIN ON INVESTMENTS AND WRITTEN OPTIONS | 20,378,218 | 40,605,135 | ||||||
| NET INCREASE IN NET ASSETS RESULTING FROM OPERATIONS | $ | 18,934,383 | $ | 36,515,178 | ||||
See Notes to Financial Statements.
| 18 | www.beacontrust.com |
| Beacon Accelerated Return Strategy Fund | Statements of Changes in Net Assets |
| For the Year Ended September 30, 2021 | For the Year Ended September 30, 2020 | |||||||
| OPERATIONS: | ||||||||
| Net investment loss | $ | (1,443,835 | ) | $ | (1,370,186 | ) | ||
| Net realized gain on investments and written options | 22,589,247 | 11,547,459 | ||||||
| Net change in unrealized appreciation/(depreciation) on investments and written options | (2,211,029 | ) | 1,267,721 | |||||
| Net increase in net assets resulting from operations | 18,934,383 | 11,444,994 | ||||||
| DISTRIBUTIONS TO SHAREHOLDERS | ||||||||
| Institutional Class | (9,098,504 | ) | (5,021,704 | ) | ||||
| Total distributions | (9,098,504 | ) | (5,021,704 | ) | ||||
| BENEFICIAL SHARE TRANSACTIONS (Note 6): | ||||||||
| Institutional Class | ||||||||
| Shares sold | 5,742,480 | 2,294,251 | ||||||
| Dividends reinvested | 8,904,999 | 4,912,463 | ||||||
| Shares redeemed | (20,810,707 | ) | (16,630,726 | ) | ||||
| Net decrease from beneficial share transactions | (6,163,228 | ) | (9,424,012 | ) | ||||
| Net increase/(decrease) in net assets | 3,672,651 | (3,000,722 | ) | |||||
| NET ASSETS: | ||||||||
| Beginning of year | 116,041,182 | 119,041,904 | ||||||
| End of year | $ | 119,713,833 | $ | 116,041,182 | ||||
See Notes to Financial Statements.
| Annual Report | September 30, 2021 | 19 |
| Beacon Planned Return Strategy Fund | Statements of Changes in Net Assets |
| For the Year Ended September 30, 2021 | For the Year Ended September 30, 2020 | |||||||
| OPERATIONS: | ||||||||
| Net investment loss | $ | (4,089,957 | ) | $ | (3,547,058 | ) | ||
| Net realized gain on investments and written options | 39,043,729 | 22,651,065 | ||||||
| Net change in unrealized appreciation on investments and written options | 1,561,406 | 1,302,816 | ||||||
| Net increase in net assets resulting from operations | 36,515,178 | 20,406,823 | ||||||
| DISTRIBUTIONS TO SHAREHOLDERS | ||||||||
| Institutional Class | (16,088,934 | ) | (19,513,463 | ) | ||||
| Total distributions | (16,088,934 | ) | (19,513,463 | ) | ||||
| BENEFICIAL SHARE TRANSACTIONS (Note 6): | ||||||||
| Institutional Class | ||||||||
| Shares sold | 38,458,035 | 27,902,211 | ||||||
| Dividends reinvested | 14,203,122 | 16,951,434 | ||||||
| Shares redeemed | (25,703,820 | ) | (36,881,950 | ) | ||||
| Net increase from beneficial share transactions | 26,957,337 | 7,971,695 | ||||||
| Net increase in net assets | 47,383,581 | 8,865,055 | ||||||
| NET ASSETS: | ||||||||
| Beginning of year | 315,389,033 | 306,523,978 | ||||||
| End of year | $ | 362,772,614 | $ | 315,389,033 | ||||
See Notes to Financial Statements.
| 20 | www.beacontrust.com |
| Beacon Accelerated | |
| Return Strategy Fund – Institutional Class | Financial Highlights |
For a Share Outstanding Throughout the Period Presented
| For the Year Ended September 30, 2021 | For the Year Ended September 30, 2020 | For the Year Ended September 30, 2019 | For the Period Ended September 30, 2018 (a) | |||||||||||||
| NET ASSET VALUE, BEGINNING OF PERIOD | $ | 10.74 | $ | 10.15 | $ | 11.30 | $ | 10.00 | ||||||||
| INCOME/(LOSS) FROM OPERATIONS: | ||||||||||||||||
| Net investment loss(b) | (0.14 | ) | (0.12 | ) | (0.11 | ) | (0.13 | ) | ||||||||
| Net realized and unrealized gain on investments | 1.93 | 1.15 | 0.37 | 1.49 | ||||||||||||
| Total from investment operations | 1.79 | 1.03 | 0.26 | 1.36 | ||||||||||||
| LESS DISTRIBUTIONS: | ||||||||||||||||
| From net realized gains on investments | (0.87 | ) | (0.44 | ) | (1.41 | ) | (0.06 | ) | ||||||||
| Total Distributions | (0.87 | ) | (0.44 | ) | (1.41 | ) | (0.06 | ) | ||||||||
| NET INCREASE/(DECREASE) IN NET ASSET VALUE | 0.92 | 0.59 | (1.15 | ) | 1.30 | |||||||||||
| NET ASSET VALUE, END OF PERIOD | $ | 11.66 | $ | 10.74 | $ | 10.15 | $ | 11.30 | ||||||||
| TOTAL RETURN(c) | 17.42 | % | 10.32 | % | 5.09 | % | 13.70 | % | ||||||||
| SUPPLEMENTAL DATA: | ||||||||||||||||
| Net assets, end of period (in 000s) | $ | 119,714 | $ | 116,041 | $ | 119,042 | $ | 154,518 | ||||||||
| RATIOS TO AVERAGE NET ASSETS | ||||||||||||||||
| Operating expenses (d) | 1.22 | % | 1.22 | % | 1.20 | % | 1.29 | %(e) | ||||||||
| Net investment loss | (1.22 | )% | (1.21) | % | (1.16 | )% | (1.25 | )%(e) | ||||||||
| PORTFOLIO TURNOVER RATE(f) | 0 | % | 0 | % | 0 | % | 0 | % | ||||||||
| (a) | Commenced operations on October 2, 2017. |
| (b) | Calculated using the average shares method. |
| (c) | Assumes an initial investment on the business day before the first day of the fiscal period, with all dividends and distributions reinvested in additional shares on the reinvestment date, and redemption at the net asset value calculated on the last business day of the fiscal period. Total returns are for the period indicated and have not been annualized. Returns shown do not reflect the deduction of taxes that a shareholder would pay on Fund distributions or the redemption of Fund shares. |
| (d) | According to the Fund's shareholder services plan with respect to the Fund's Institutional Class shares, any amount of fees accrued according to the plan but not paid during the Fund's fiscal year for such service activities shall be reimbursed to the Fund as soon as practical. Fees were reimbursed to the Fund during the period ended September 30, 2021, the period ended September 30, 2020, the period ended September 30, 2019, and the period ended September 30, 2018, respectively, in the amount of 0.00% (annualized), 0.00% (annualized), 0.14% (annualized), and 0.06% (annualized) of average net assets of Institutional Class shares. |
See Notes to Financial Statements.
| Annual Report | September 30, 2021 | 21 |
| Beacon Accelerated | |
| Return Strategy Fund – Institutional Class | Financial Highlights |
For a Share Outstanding Throughout the Period Presented
| (e) | Annualized. |
| (f) | All securities whose maturity or expiration date at time of acquisition were one year or less are excluded from the portfolio turnover calculation. |
See Notes to Financial Statements.
| 22 | www.beacontrust.com |
| Beacon Planned | |
| Return Strategy Fund – Institutional Class | Financial Highlights |
For a Share Outstanding Throughout the Period Presented
| For the Year Ended September 30, 2021 | For the Year Ended September 30, 2020 | For the Year Ended September 30, 2019 | For the Period Ended September 30, 2018 (a) | |||||||||||||
| NET ASSET VALUE, BEGINNING OF PERIOD | $ | 10.49 | $ | 10.44 | $ | 10.73 | $ | 10.00 | ||||||||
| INCOME/(LOSS) FROM OPERATIONS: | ||||||||||||||||
| Net investment loss(b) | (0.13 | ) | (0.12 | ) | (0.11 | ) | (0.13 | ) | ||||||||
| Net realized and unrealized gain on investments | 1.31 | 0.85 | 0.62 | 0.89 | ||||||||||||
| Total from investment operations | 1.18 | 0.73 | 0.51 | 0.76 | ||||||||||||
| LESS DISTRIBUTIONS: | ||||||||||||||||
| From net realized gains on investments | (0.54 | ) | (0.68 | ) | (0.80 | ) | (0.03 | ) | ||||||||
| Total Distributions | (0.54 | ) | (0.68 | ) | (0.80 | ) | (0.03 | ) | ||||||||
| NET INCREASE/(DECREASE) IN NET ASSET VALUE | 0.64 | 0.05 | (0.29 | ) | 0.73 | |||||||||||
| NET ASSET VALUE, END OF PERIOD | $ | 11.13 | $ | 10.49 | $ | 10.44 | $ | 10.73 | ||||||||
| TOTAL RETURN(c) | 11.53 | % | 7.21 | % | 5.77 | % | 7.64 | % | ||||||||
| SUPPLEMENTAL DATA: | ||||||||||||||||
| Net assets, end of period (in 000s) | $ | 362,773 | $ | 315,389 | $ | 306,524 | $ | 351,595 | ||||||||
| RATIOS TO AVERAGE NET ASSETS | ||||||||||||||||
| Operating expenses (d) | 1.19 | % | 1.20 | % | 1.17 | % | 1.25 | %(e) | ||||||||
| Net investment loss | (1.19 | )% | (1.19 | )% | (1.13 | )% | (1.23 | )%(e) | ||||||||
| PORTFOLIO TURNOVER RATE(f) | 0 | % | 0 | % | 0 | % | 0 | % | ||||||||
| (a) | Commenced operations on October 2, 2017. |
| (b) | Calculated using the average shares method. |
| (c) | Assumes an initial investment on the business day before the first day of the fiscal period, with all dividends and distributions reinvested in additional shares on the reinvestment date, and redemption at the net asset value calculated on the last business day of the fiscal period. Total returns are for the period indicated and have not been annualized. Returns shown do not reflect the deduction of taxes that a shareholder would pay on Fund distributions or the redemption of Fund shares. |
| (d) | According to the Fund's shareholder services plan with respect to the Fund's Institutional Class shares, any amount of fees accrued according to the plan but not paid during the Fund's fiscal year for such service activities shall be reimbursed to the Fund as soon as practical. Fees were reimbursed to the Fund during the period ended September 30, 2021, the period ended September 30, 2020, the period ended September 30, 2019, and the period ended September 30, 2018, respectively, in the amount of 0.00% (annualized), 0.00% (annualized), 0.14% (annualized), and 0.06% (annualized) of average net assets of Institutional Class shares. |
See Notes to Financial Statements.
| Annual Report | September 30, 2021 | 23 |
| Beacon Planned | |
| Return Strategy Fund – Institutional Class | Financial Highlights |
For a Share Outstanding Throughout the Period Presented
| (e) | Annualized. |
| (f) | All securities whose maturity or expiration date at time of acquisition were one year or less are excluded from the portfolio turnover calculation. |
See Notes to Financial Statements.
| 24 | www.beacontrust.com |
| Beacon Funds Trust | Notes to Financial Statements |
September 30, 2021
1. ORGANIZATION
ALPS Series Trust (the “Trust”), a Delaware statutory trust, is an open-end management investment company registered under the Investment Company Act of 1940, as amended (the “1940 Act”). The Trust consists of multiple separate portfolios or series. This annual report describes the Beacon Accelerated Return Strategy Fund and the Beacon Planned Return Strategy Fund (each, a “Fund” and collectively, the “Funds”). The Funds are non-diversified and the primary investment objectives are to deliver capital appreciation and generate positive alpha for the Beacon Accelerated Return Strategy Fund, and capital preservation and capital appreciation for the Beacon Planned Return Strategy Fund. The Funds currently offer Institutional Class shares. The Board of Trustees (the “Board”) may establish additional funds and classes of shares at any time in the future without shareholder approval.
2. SIGNIFICANT ACCOUNTING POLICIES
The accompanying financial statements were prepared in accordance with accounting principles generally accepted in the United States of America for investment companies (“U.S. GAAP”). The Funds are considered investment companies under U.S. GAAP and follow the accounting and reporting guidance applicable to investment companies in the Financial Accounting Standards Board (“FASB”) Accounting Standards Codification Topic 946. The preparation of financial statements in conformity with U.S. GAAP requires management to make certain estimates and assumptions that affect the reported amounts of assets and liabilities and disclosures of contingent assets and liabilities at the date of the financial statements and the reported amounts of increases and decreases in net assets from operations during the period. Actual results could differ from those estimates. The following is a summary of significant accounting policies consistently followed by the Funds in preparation of their financial statements.
Investment Valuation: The Funds generally value their securities based on market prices determined at the close of regular trading on the New York Stock Exchange (“NYSE”), normally 4:00 p.m. Eastern Time, on each day the NYSE is open for trading.
FLEX Options are customized option contracts available through the Chicago Board Options Exchange ("CBOE"). Flexible Exchange Options are valued based on prices supplied by an independent third-party pricing service, which utilizes pricing models that incorporate various inputs such as interest rates, credit spreads, currency exchange rates and volatility measurements for in-the-money, at-the-money, and out-of-money contracts on a given strike price.
Redeemable securities issued by open-end registered investment companies are valued at the investment company’s applicable net asset value (“NAV”). Money market funds, representing short-term investments, are valued at their NAV.
When such prices or quotations are not available, or when the Fair Value Committee appointed by the Board believes that they are unreliable, securities may be priced using fair value procedures approved by the Board.
| Annual Report | September 30, 2021 | 25 |
| Beacon Funds Trust | Notes to Financial Statements |
September 30, 2021
Fair Value Measurements: The Funds disclose the classification of their fair value measurements following a three-tier hierarchy based on the inputs used to measure fair value. Inputs refer broadly to the assumptions that market participants would use in pricing the asset or liability, including assumptions about risk. Inputs may be observable or unobservable. Observable inputs reflect the assumptions market participants would use in pricing the asset or liability that are developed based on market data obtained from sources independent of the reporting entity. Unobservable inputs reflect the reporting entity’s own assumptions about the assumptions market participants would use in pricing the asset or liability that are developed based on the best information available.
Various inputs are used in determining the value of the Funds’ investments as of the end of the reporting period. When inputs used fall into different levels of the fair value hierarchy, the level in the hierarchy within which the fair value measurement falls is determined based on the lowest level input that is significant to the fair value measurement in its entirety. The designated input levels are not necessarily an indication of the risk or liquidity associated with these investments. These inputs are categorized in the following hierarchy under applicable financial accounting standards:
| Level 1 – | Unadjusted quoted prices in active markets for identical investments, unrestricted assets or liabilities that the Fund has the ability to access at the measurement date; |
| Level 2 – | Quoted prices which are not active, quoted prices for similar assets or liabilities in active markets or inputs other than quoted prices that are observable (either directly or indirectly); and |
| Level 3 – | Significant unobservable prices or inputs (including the Fund’s own assumptions in determining the fair value of investments) where there is little or no market activity for the asset or liability at the measurement date. |
The following is a summary of the inputs used to value the Funds’ investments as of September 30, 2021:
BEACON ACCELERATED RETURN STRATEGY FUND
| Investments in Securities at Value | Level 1 - Unadjusted Quoted Prices | Level 2 - Other Significant Observable Inputs | Level 3 - Significant Unobservable Inputs | Total | ||||||||||||
| Purchased Option Contracts | $ | – | $ | 125,245,320 | $ | – | $ | 125,245,320 | ||||||||
| Short Term Investments | 3,199,372 | – | – | 3,199,372 | ||||||||||||
| Total | $ | 3,199,372 | $ | 125,245,320 | $ | – | $ | 128,444,692 | ||||||||
| Valuation Inputs | ||||||||||||||||
| Other Financial Instruments | Level 1 | Level 2 | Level 3 | Total | ||||||||||||
| Liabilities | ||||||||||||||||
| Written Option Contracts | $ | – | $ | (8,586,910 | ) | $ | – | $ | (8,586,910 | ) | ||||||
| Total | $ | – | $ | (8,586,910 | ) | $ | – | $ | (8,586,910 | ) | ||||||
| 26 | www.beacontrust.com |
| Beacon Funds Trust | Notes to Financial Statements |
September 30, 2021
BEACON PLANNED RETURN STRATEGY FUND
| Investments in Securities at Value | Level 1 - Unadjusted Quoted Prices | Level 2 - Other Significant Observable Inputs | Level 3 - Significant Unobservable Inputs | Total | ||||||||||||
| Purchased Option Contracts | $ | – | $ | 424,436,226 | $ | – | $ | 424,436,226 | ||||||||
| Short Term Investments | 9,812,411 | – | – | 9,812,411 | ||||||||||||
| Total | $ | 9,812,411 | $ | 424,436,226 | $ | – | $ | 434,248,637 | ||||||||
| Valuation Inputs | ||||||||||||||||
| Other Financial Instruments | Level 1 | Level 2 | Level 3 | Total | ||||||||||||
| Liabilities | ||||||||||||||||
| Written Option Contracts | $ | – | $ | (71,005,297 | ) | $ | – | $ | (71,005,297 | ) | ||||||
| Total | $ | – | $ | (71,005,297 | ) | $ | – | $ | (71,005,297 | ) | ||||||
There were no Level 3 securities held during the year ended September 30, 2021.
Cash & Cash Equivalents: The Funds consider their investment in a Federal Deposit Insurance Corporation ("FDIC") insured interest bearing account to be cash and cash equivalents. Cash and cash equivalents are valued at cost plus any accrued interest. The Funds maintain cash balances, which, at times may exceed federally insured limits. The Funds maintain these balances with a high quality financial institution.
Concentration of Credit Risk: The Funds place their cash with a banking institution, which is insured by FDIC. The FDIC limit is $250,000. At various times throughout the year, the amount on deposit may exceed the FDIC limit and subject the Funds to a credit risk. The Funds do not believe that such deposits are subject to any unusual risk associated with investment activities.
Trust Expenses: Some expenses of the Trust can be directly attributed to a fund. Expenses that cannot be directly attributed to a fund are apportioned among all funds in the Trust based on average net assets of each fund, including Trustees' fees and expenses.
Fund Expenses: Some expenses can be directly attributed to a fund and are apportioned among the classes based on average net assets of each class.
Federal Income Taxes: The Funds comply with the requirements under Subchapter M of the Internal Revenue Code of 1986, as amended, applicable to regulated investment companies and intend to distribute substantially all of their net taxable income and net capital gains, if any, each year so that they will not be subject to excise tax on undistributed income and gains. The Funds are not subject to income taxes to the extent such distributions are made.
As of and during the year ended September 30, 2021, the Funds did not have a liability for any unrecognized tax benefits in the accompanying financial statements. The Funds recognize interest and penalties, if any, related to tax liabilities as income tax expense in the Statements of Operations. The Funds file U.S. federal, state and local income tax returns as required. The Funds’ tax returns are subject to examination by the relevant tax authorities until expiration of the applicable statute of limitations, which is generally three years after the filing of the tax return for federal purposes and four years for most state returns. The Funds’ administrator has analyzed the Funds’ tax positions and has concluded that as of September 30, 2021, no provision for income tax is required in the Funds’ financial statements related to these tax positions.
| Annual Report | September 30, 2021 | 27 |
| Beacon Funds Trust | Notes to Financial Statements |
September 30, 2021
Investment Transactions and Investment Income: Investment transactions are accounted for on the date the investments are purchased or sold (trade date basis for financial reporting purposes). Realized gains and losses from investment transactions are reported on an identified cost basis. Interest income, which includes accretion of discounts and amortization of premiums, is accrued and recorded as earned. Dividend income is recognized on the ex-dividend date.
Distributions to Shareholders: The Funds normally pay dividends, if any, and distribute capital gains, if any, on an annual basis. Income dividend distributions are derived from interest, dividends and other income the Funds receive from their investments, including short-term capital gains. Long-term capital gain distributions are derived from gains realized when a Fund sells a security it has owned for more than one year. A Fund may make additional distributions and dividends at other times if its portfolio manager or managers believe doing so may be necessary for the Fund to avoid or reduce taxes. Net investment income/(loss) and net realized gain/(loss) may differ for financial statement and tax purposes.
COVID-19 Risk: An outbreak of respiratory disease caused by a novel coronavirus was first detected in December 2019 and has now spread internationally. This coronavirus has resulted in closing borders, enhanced health screenings, partial population vaccination, healthcare service preparation and delivery, quarantines, cancellations, disruptions to supply chains and customer activity, government sponsored fiscal stimulus programs, various moratoria on the applicability of certain laws and regulations, as well as general concern and uncertainty. The impact of this coronavirus, (and the variants of such virus) and other epidemics and pandemics that may arise in the future, could affect the economies of many nations, individual companies, their securities (including equity and debt), and the market in general in ways that cannot necessarily be foreseen at the present time. In addition, the impact of infectious diseases in developing or emerging market countries may be greater due to less established health care systems. Health crises caused by the recent coronavirus outbreak may exacerbate other pre-existing political, social, financial, and economic risks in certain countries. The impact of the outbreak may last for an extended period of time.
3. DERIVATIVE INSTRUMENTS
Each Fund's principal investment strategy permits it to enter into various types of derivatives contracts, including, but not limited to, futures contracts, forward foreign currency contracts, currency swaps and purchased and written options. In doing so, the Funds may employ strategies in differing combinations to permit it to increase, decrease, or change the level or types of exposure to market factors. Central to those strategies are features inherent in derivatives that make them more attractive for this purpose than equity or debt securities; they require little or no initial cash investment, they can focus exposure on only certain selected risk factors, and they may not require the ultimate receipt or delivery of the underlying security (or securities) to the contract. This may allow the Funds to pursue their objectives more quickly and efficiently than if they were to make direct purchases or sales of securities capable of affecting a similar response to market factors.
Risk of Investing in Derivatives: The Funds’ use of derivatives can result in losses due to unanticipated changes in the market risk factors and the overall market. In instances where the Funds are using derivatives to decrease, or hedge, exposures to market risk factors for securities held by the Funds, there are also risks that those derivatives may not perform as expected resulting in losses for the combined or hedged positions.
| 28 | www.beacontrust.com |
| Beacon Funds Trust | Notes to Financial Statements |
September 30, 2021
Derivatives may have little or no initial cash investment relative to their market value exposure and therefore can produce significant gains or losses in excess of their cost. This use of embedded leverage allows the Funds to increase their market value exposure relative to their net assets and can substantially increase the volatility of the Funds’ performance.
Additional associated risks from investing in derivatives also exist and potentially could have significant effects on the valuation of the derivative and the Funds. Typically, the associated risks are not the risks that the Funds are attempting to increase or decrease exposure to, per their investment objectives, but are the additional risks from investing in derivatives.
Examples of these associated risks are liquidity risk, which is the risk that the Funds will not be able to sell or close out the derivative in a timely manner, and counterparty credit risk, which is the risk that the counterparty will not fulfill its obligation to the Funds. In addition, use of derivatives may increase or decrease exposure to the following risk factors:
Equity Risk: Equity risk relates to the change in value of equity securities as they relate to increases or decreases in the general market. Associated risks can be different for each type of derivative.
Option Contracts: Each Fund may enter into options transactions for hedging purposes and for nonhedging purposes such as seeking to enhance return. Each Fund may write covered put and call options on any stocks or stock indices, currencies traded on domestic and foreign securities exchanges, or futures contracts on stock indices, interest rates and currencies traded on domestic and, to the extent permitted by the U.S. Commodity Futures Trading Commission, foreign exchanges. A call option on an asset written by a Fund obligates the Fund to sell the specified asset to the holder (purchaser) at a stated price (the exercise price) if the option is exercised before a specified date (the expiration date). A put option on an asset written by a Fund obligates the Fund to buy the specified asset from the purchaser at the exercise price if the option is exercised before the expiration date. Premiums received when writing options are recorded as liabilities and are subsequently adjusted to the current value of the options written. Premiums received from writing options that expire are treated as realized gains. Premiums received from writing options, which are either exercised or closed, are offset against the proceeds received or amount paid on the transaction to determine realized gains or losses.
The Funds use FLEX Options, which are customized equity or index option contracts that trade on an exchange, but that provide investors with the ability to customize key contract terms like exercise prices, styles and expiration dates. Like standardized exchange-traded options, FLEX Options are guaranteed for settlement by The Options Clearing Corporation (“OCC”), a market clearinghouse. The OCC guarantees performance by each of the counterparties to the FLEX Options, becoming the “buyer for every seller and the seller for every buyer,” protecting clearing members and options traders from counterparty risk. FLEX Options provide investors with the ability to customize key terms, while achieving price discovery in competitive, transparent auctions markets and avoiding the counterparty exposure of Over-the-Counter (“OTC”) options positions. The Funds bear the risk that the OCC will be unable or unwilling to perform its obligations under the FLEX Options contracts.
| Annual Report | September 30, 2021 | 29 |
| Beacon Funds Trust | Notes to Financial Statements |
September 30, 2021
Additionally, FLEX Options may be less liquid than certain other securities such as standardized options. In a less liquid market for the FLEX Options, the Funds may have difficulty closing out certain FLEX Options positions at desired times and prices.
Purchased Options: When the Funds purchase an option, an amount equal to the premium paid by the Funds are recorded as an investment and is subsequently adjusted to the current value of the option purchased. If an option expires on the stipulated expiration date or if the Funds enter into a closing sale transaction, a gain or loss is realized. If a call option is exercised, the cost of the security acquired is increased by the premium paid for the call. If a put option is exercised, a gain or loss is realized from the sale of the underlying security, and the proceeds from such sale are decreased by the premium originally paid. Purchased options are non-income producing securities.
Written Options: When the Funds write an option, an amount equal to the premium received by the Funds are recorded as a liability and is subsequently adjusted to the current value of the option written. Premiums received from writing options that expire unexercised are treated by the Funds on the expiration date as realized gain from written options. The difference between the premium and the amount paid on effecting a closing purchase transaction, including brokerage commissions, is also treated as a realized gain, or if the premium is less than the amount paid for the closing purchase transaction, as a realized loss. If a call option is exercised, the premium is added to the proceeds from the sale of the underlying security in determining whether the Funds have realized a gain or loss. If a put option is exercised, the premium reduces the cost basis of the securities purchased by the Funds. The Funds, as writers of an option, bear the market risk of an unfavorable change in the price of the security underlying the written option.
The average option contract notional amount during the year ended September 30, 2021, is noted below for each of the Funds.
| Derivative Type | Unit of Measurement | Monthly Average |
| Beacon Accelerated Return Strategy Fund | ||
| Purchased Option Contracts | Notional value of contracts outstanding | $234,547,027 |
| Written Option Contracts | Notional value of contracts outstanding | $234,547,027 |
| Derivative Type | Unit of Measurement | Monthly Average |
| Beacon Planned Return Strategy Fund | ||
| Purchased Option Contracts | Notional value of contracts outstanding | $1,240,449,192 |
| Written Option Contracts | Notional value of contracts outstanding | $1,240,449,192 |
| 30 | www.beacontrust.com |
| Beacon Funds Trust | Notes to Financial Statements |
September 30, 2021
Derivative Instruments: The following tables disclose the amounts related to the Funds’ use of derivative instruments.
The effect of derivative instruments on the Statements of Assets and Liabilities as of September 30, 2021:
| Risk Exposure | Statements of Assets and Liabilities Location | Fair Value of Asset Derivatives | Statements of Assets and Liabilities Location | Fair Value of Liability Derivatives | ||||||||
| Beacon Accelerated Return Strategy Fund | ||||||||||||
| Equity Contracts | ||||||||||||
| (Purchased Options/Written Options) | Investments, at value | $ | 125,245,320 | Written Options, at value | $ | 8,586,910 | ||||||
| $ | 125,245,320 | $ | 8,586,910 | |||||||||
| Beacon Planned Return Strategy Fund | ||||||||||||
| Equity Contracts | ||||||||||||
| (Purchased Options/Written Options) | Investments, at value | $ | 424,436,226 | Written Options, at value | $ | 71,005,297 | ||||||
| $ | 424,436,226 | $ | 71,005,297 | |||||||||
| Annual Report | September 30, 2021 | 31 |
| Beacon Funds Trust | Notes to Financial Statements |
September 30, 2021
The effect of derivative instruments on the Statements of Operations for the year ended September 30, 2021:
| Risk Exposure | Statements of Operations Location | Realized Gain (Loss) on Derivatives Recognized in Income | Change in Unrealized Gain (Loss) on Derivatives Recognized in Income | |||||||
| Beacon Accelerated Return Strategy Fund | ||||||||||
| Equity Contracts (Purchased Options) | Net realized gain/(loss) on investments/Net change in unrealized appreciation/ (depreciation) on investments | $ | 60,581,497 | $ | (7,733,233 | ) | ||||
| Equity Contracts (Written Options) | Net realized gain/(loss) on written option contracts/Net change in unrealized appreciation/ (depreciation) on written option contracts | (37,981,708 | ) | 5,522,204 | ||||||
| Total | $ | 22,599,789 | $ | (2,211,029 | ) | |||||
| Beacon Planned Return Strategy Fund | ||||||||||
| Equity Contracts (Purchased Options) | Net realized gain/(loss) on investments/Net change in unrealized appreciation/ (depreciation) on investments | $ | 147,306,141 | $ | (535,144 | ) | ||||
| Equity Contracts (Written Options) | Net realized gain/(loss) on written option contracts/Net change in unrealized appreciation/ (depreciation) on written option contracts | (108,238,114 | ) | 2,096,550 | ||||||
| Total | $ | 39,068,027 | $ | 1,561,406 | ||||||
4. TAX BASIS INFORMATION
Tax Basis of Distributions to Shareholders: The character of distributions made during the period from net investment income or net realized gains may differ from its ultimate characterization for federal income tax purposes. Also, due to the timing of dividend distributions, the fiscal year in which amounts are distributed may differ from the fiscal year in which the income or realized gain were recorded by the Funds. The amounts and characteristics of tax basis distributions and composition of distributable earnings/(accumulated losses) are finalized at fiscal year-end.
| 32 | www.beacontrust.com |
| Beacon Funds Trust | Notes to Financial Statements |
September 30, 2021
The tax character of distributions paid during the fiscal year ended September 30, 2021, were as follows:
| Ordinary Income | Long-Term Capital Gains | |||||||
| Beacon Accelerated Return Strategy Fund | $ | 2,817,768 | $ | 6,280,736 | ||||
| Beacon Planned Return Strategy Fund | 4,302,404 | 11,786,530 | ||||||
The tax character of distributions paid during the fiscal year ended September 30, 2020, were as follows:
| Ordinary Income | Long-Term Capital Gains | |||||||
| Beacon Accelerated Return Strategy Fund | $ | 1,155,236 | $ | 3,866,468 | ||||
| Beacon Planned Return Strategy Fund | 5,690,489 | 13,822,974 | ||||||
Reclassifications: As of September 30, 2021, permanent differences in book and tax accounting were reclassified. The following reclassifications, which had no impact on results of operations or net assets, were recorded to reflect tax character:
| Paid-in Capital | Distributable Earnings | |||||||
| Beacon Accelerated Return Strategy Fund | $ | 49 | $ | (49 | ) | |||
| Beacon Planned Return Strategy Fund | 199 | (199 | ) | |||||
Unrealized Appreciation and Depreciation on Investments and Derivative Instruments: As of September 30, 2021, the aggregate costs of investments, gross unrealized appreciation/ (depreciation) and net unrealized appreciation of instruments and derivative instruments for federal tax purposes were as follows:
| Beacon Accelerated Return Strategy Fund | Beacon Planned Return Strategy Fund | |||||||
| Gross unrealized appreciation (excess of value over tax cost)(a) | $ | – | $ | – | ||||
| Gross unrealized depreciation (excess of tax cost over value)(a) | – | – | ||||||
| Net unrealized appreciation | $ | – | $ | – | ||||
| Cost of investments for income tax purposes | $ | 128,444,692 | $ | 434,248,637 | ||||
| (a) | Includes appreciation/(depreciation) on written options. |
The primary reason for the temporary differences is due to mark to market adjustments.
| Annual Report | September 30, 2021 | 33 |
| Beacon Funds Trust | Notes to Financial Statements |
September 30, 2021
Components of Distributable Earnings: At September 30, 2021, components of distributable earnings were as follows:
| Beacon Accelerated Return Strategy Fund | Beacon Planned Return Strategy Fund | |||||||
| Undistributed ordinary income | $ | 6,701,128 | $ | 12,137,519 | ||||
| Accumulated capital gains | 12,233,255 | 24,377,660 | ||||||
| Total | $ | 18,934,383 | $ | 36,515,179 | ||||
5. SECURITIES TRANSACTIONS
Purchases and sales of securities, excluding short-term securities, during the year ended September 30, 2021 were as follows:
| Purchases of Securities | Proceeds from Sales of Securities | |||||||
| Beacon Accelerated Return Strategy Fund | $ | – | $ | – | ||||
| Beacon Planned Return Strategy Fund | – | – | ||||||
6. BENEFICIAL SHARE TRANSACTIONS
The capitalization of the Trust consists of an unlimited number of shares of beneficial interest with no par value per share. Holders of the shares of the Funds have one vote for each share held and a proportionate fraction of a vote for each fractional share. All shares issued and outstanding are fully paid and are transferable and redeemable at the option of the shareholder. Shares have no pre-emptive rights. Neither the Funds nor any of their creditors have the right to require shareholders to pay any additional amounts solely because the shareholder owns the shares.
Shares redeemed within 60 days of purchase may incur a 2.00% short-term redemption fee deducted from the redemption amount. For the year ended September 30, 2021, the redemption fees charged by the Funds, if any, are presented in the Statements of Changes in Net Assets.
| 34 | www.beacontrust.com |
| Beacon Funds Trust | Notes to Financial Statements |
September 30, 2021
Transactions in common shares were as follows:
| For the Year Ended September 30, 2021 | For the Year Ended September 30, 2020 | |||||||
| Beacon Accelerated Return Strategy Fund | ||||||||
| Institutional Class | ||||||||
| Shares sold | 515,974 | 225,873 | ||||||
| Shares issued in reinvestment of distributions to shareholders | 833,801 | 478,331 | ||||||
| Shares redeemed | (1,885,282 | ) | (1,624,133 | ) | ||||
| Net decrease in shares outstanding | (535,507 | ) | (919,929 | ) | ||||
| Beacon Planned Return Strategy Fund | ||||||||
| Institutional Class | ||||||||
| Shares sold | 3,587,643 | 2,760,515 | ||||||
| Shares issued in reinvestment of distributions to shareholders | 1,355,260 | 1,680,023 | ||||||
| Shares redeemed | (2,409,719 | ) | (3,738,778 | ) | ||||
| Net increase in shares outstanding | 2,533,184 | 701,760 | ||||||
Control is defined by the 1940 Act as the beneficial ownership, either directly or through one or more controlled companies, of more than 25% of the voting securities of a company. Approximately 98% of the outstanding shares of the Beacon Accelerated Return Strategy Fund are held by one omnibus account. Approximately 87% of the outstanding shares of the Beacon Planned Return Strategy Fund are owned by one omnibus account. Share transaction activities of these shareholders could have a material impact on the Funds.
7. MANAGEMENT AND RELATED PARTY TRANSACTIONS
Investment Advisory: Beacon Investment Advisory Services, Inc. (the “Adviser”), subject to the authority of the Board, is responsible for the management of the Funds’ portfolios. The Adviser manages the investments of the Funds in accordance with the Funds’ investment objectives, policies and limitations and investment guidelines established jointly by the Adviser and the Board.
Pursuant to the Investment Advisory Agreement (the “Advisory Agreement”) with the Adviser, each Fund pays the Adviser an annual management fee that is based on the Fund’s average daily net assets. The management fee is paid on a monthly basis. The contractual management fee rate is 1.00% based on average daily net assets for the Beacon Accelerated Return Strategy Fund and Beacon Planned Return Strategy Fund. The current term of the Advisory Agreement is one year. The Board may extend the Advisory Agreement for additional one-year terms. The Board and shareholders of a Fund may terminate the Advisory Agreement upon 30 days’ written notice. The Adviser may terminate the Advisory Agreement upon 60 days’ notice.
Pursuant to a fee waiver letter agreement (the “Fee Waiver Agreement”), the Adviser has contractually agreed to limit the amount of each Fund’s Total Annual Fund Operating Expenses, exclusive of 12b-1 fees, Acquired Fund Fees and Expenses, brokerage expenses, interest expenses, taxes and extraordinary expenses to an annual rate of 1.40% of the Beacon Accelerated Return Strategy Fund’s average daily net assets for the Institutional Class shares and 1.40% of the Beacon Planned Return Strategy Fund’s average daily net assets for the Institutional Class shares. The Fee Waiver Agreement is in effect through January 31, 2022, and will thereafter continue in effect for successive twelve-month periods provided that such continuance is specifically approved at least annually by the Board and the Adviser does not provide at least 30 days written notice of non-continuance prior to the end of the then effective term. The Adviser may not terminate the Fee Waiver Agreement without the approval of the Board. The Adviser will be permitted to recover, on a class-by-class basis, expenses it has borne through the Fee Waiver Agreement only to the extent that the Fund’s expenses in later periods do not exceed the lesser of: (1) the contractual expense limit in effect at the time the Adviser waives or limits the expenses; or (2) the contractual expense limit in effect at the time the Adviser seeks to recover the expenses; provided, however, that the Funds will not be obligated to reimburse any such expenses borne by the Adviser more than three years after the date on which the fee or expense was waived or limited or assumed and paid by the Adviser, as calculated on a monthly basis. There were no fees waived or reimbursed for the year ended September 30, 2021.
| Annual Report | September 30, 2021 | 35 |
| Beacon Funds Trust | Notes to Financial Statements |
September 30, 2021
Administrator: SS&C ALPS Fund Services, Inc. (“ALPS”) (an affiliate of ALPS Distributors, Inc.) serves as administrator to each Fund. The Funds have agreed to pay expenses incurred in connection with its administrative activities. Pursuant to the Administration, Bookkeeping and Pricing Services Agreement with the Trust, ALPS will provide operational services to the Funds including, but not limited to, fund accounting and fund administration and generally assist in each Fund’s operations. Each Fund’s administration fee is accrued on a daily basis and paid monthly. The officers of the Trust are employees of ALPS. Administration fees paid by the Funds for the year ended September 30, 2021, are disclosed in the Statements of Operations. ALPS is reimbursed by the Funds for certain out-of-pocket expenses.
Transfer Agent: ALPS serves as transfer agent for each Fund under a Transfer Agency and Services Agreement with the Trust. Under this agreement, ALPS is paid an annual fee for services performed on behalf of the Funds plus fees for open accounts and is reimbursed for certain out-of-pocket expenses.
Compliance Services: ALPS provides Chief Compliance Officer services to each Fund to monitor and test the policies and procedures of each Fund in conjunction with requirements under Rule 38a-1 of the 1940 Act pursuant to a Chief Compliance Officer Services Agreement with the Trust. Under this agreement, ALPS is paid an annual fee for services performed on behalf of the Funds and is reimbursed for certain out-of-pocket expenses.
Distribution: ALPS Distributors, Inc. (the “Distributor”) (an affiliate of ALPS) acts as the principal underwriter of each Fund’s shares pursuant to a Distribution Agreement with the Trust. Shares of each Fund are offered on a continuous basis through the Distributor, as agent of the Funds. The Distributor is not obligated to sell any particular amount of shares and is not entitled to any compensation for its services as the Funds’ principal underwriter pursuant to the Distribution Agreement.
Each Fund has adopted a shareholder services plan (“Shareholder Services Plan”) for its Institutional Class. Under the Shareholder Services Plan each Fund is authorized to pay banks and their affiliates and other institutions, including broker-dealers and Fund affiliates (“Participating Organizations”), an aggregate fee in an amount not to exceed on an annual basis 0.15% of the average daily net assets of each Fund’s Institutional Class shares, respectively, to Participating Organizations as compensation for providing shareholder service activities, which do not include distribution services, pursuant to an agreement with a Participating Organization. Shareholder Services Plan fees paid by the Funds are disclosed in the Statements of Operations.
| 36 | www.beacontrust.com |
| Beacon Funds Trust | Notes to Financial Statements |
September 30, 2021
8. TRUSTEES
As of September 30, 2021, there were four Trustees, three of whom are not “interested persons” (as defined in the 1940 Act) of the Trust (the “Independent Trustees”). The Independent Trustees of the Trust and Interested Trustees who are not currently employed by the Adviser, ALPS or other service providers receive a quarterly retainer of $13,500, plus $4,000 for each regular Board or Committee meeting attended and $2,000 for each special telephonic or in-person Board or Committee meeting attended. Additionally, the Audit Committee Chair receives a quarterly retainer of $1,250 and the Independent Chair receives a quarterly retainer of $3,250. The Independent Trustees and Interested Trustees who are not currently employed by the Adviser, ALPS or other service providers are also reimbursed for all reasonable out-of-pocket expenses relating to attendance at meetings. Officers of the Trust receive no salary or fees from the Trust. As discussed in Note 7, the Funds pay ALPS an annual fee for compliance services.
9. INDEMNIFICATIONS
Under the Trust’s organizational documents, its officers and Trustees are indemnified against certain liabilities arising out of the performance of their duties to the Trust. Additionally, in the normal course of business, the Trust enters into contracts with service providers that may contain general indemnification clauses which may permit indemnification to the extent permissible under applicable law. The Trust’s maximum exposure under these arrangements is unknown, as this would involve future claims that may be made against the Trust that have not yet occurred.
10. SUBSEQUENT EVENTS
Subsequent events after the date of the Statements of Assets and Liabilities have been evaluated through the date the financial statements were issued. Management has determined that there were no subsequent events to report through the issuance of these financial statements.
| Annual Report | September 30, 2021 | 37 |
| Report of Independent Registered | |
| Beacon Funds Trust | Public Accounting Firm |
To the Shareholders of Beacon Accelerated Return Strategy Fund and Beacon Planned Return Strategy Fund and Board of Trustees ALPS Series Trust
Opinion on the Financial Statements
We have audited the accompanying statements of assets and liabilities, including the portfolios of investments, of Beacon Accelerated Return Strategy Fund and Beacon Planned Return Strategy Fund (the “Funds”), each a series of ALPS Series Trust, as of September 30, 2021, the related statements of operations for the year then ended, the statements of changes in net assets for each of the two years in the period then ended, the related notes, and the financial highlights for each of the four periods in the period then ended (collectively referred to as the “financial statements”). In our opinion, the financial statements present fairly, in all material respects, the financial position of each of the Funds as of September 30, 2021, the results of their operations for the year then ended, the changes in net assets for each of the two years in the period then ended, and the financial highlights for each of the four periods in the period then ended, in conformity with accounting principles generally accepted in the United States of America.
Basis for Opinion
These financial statements are the responsibility of the Funds’ management. Our responsibility is to express an opinion on the Funds’ financial statements based on our audits. We are a public accounting firm registered with the Public Company Accounting Oversight Board (United States) (“PCAOB”) and are required to be independent with respect to the Funds in accordance with the U.S. federal securities laws and the applicable rules and regulations of the Securities and Exchange Commission and the PCAOB.
We conducted our audits in accordance with the standards of the PCAOB. Those standards require that we plan and perform the audit to obtain reasonable assurance about whether the financial statements are free of material misstatement whether due to error or fraud.
Our audits included performing procedures to assess the risks of material misstatement of the financial statements, whether due to error or fraud, and performing procedures that respond to those risks. Such procedures included examining, on a test basis, evidence regarding the amounts and disclosures in the financial statements. Our procedures included confirmation of securities owned as of September 30, 2021, by correspondence with the custodian and brokers. Our audits also included evaluating the accounting principles used and significant estimates made by management, as well as evaluating the overall presentation of the financial statements. We believe that our audits provide a reasonable basis for our opinion.
We have served as the Funds’ auditor since 2018.

COHEN & COMPANY, LTD.
Cleveland, Ohio
November 29, 2021
| 38 | www.beacontrust.com |
| Disclosure Regarding Renewal and | |
| Beacon Funds Trust | Approval of Fund Advisory Agreement |
September 30, 2021 (Unaudited)
On September 21, 2021, the Board of Trustees (the “Board”) of ALPS Series Trust (the “Trust”) met in person to discuss, among other things, the renewal and approval of the Investment Advisory Agreement between the Trust and Beacon Investment Advisory Services, Inc. (“Beacon”) in accordance with Section 15(c) of the 1940 Act. The Independent Trustees were advised by independent legal counsel and discussed the Investment Advisory Agreement and other related materials.
In evaluating Beacon and the fees charged under the Beacon Agreement, the Trustees concluded that no single factor reviewed by the Trustees was identified by the Trustees to be determinative as the principal factor in whether to renew the Beacon Agreement. Further, the Independent Trustees were advised by independent legal counsel throughout the process. The following summary does not identify all the matters considered by the Board, but provides a summary of the principal matters the Board considered with respect to the Beacon Planned Return Strategy Fund (“BPRS Fund”) and Beacon Accelerated Return Strategy Fund (“BARS”) (together the “Beacon Funds”):
Nature Extent and Quality of the Services: The Trustees received and considered information regarding the nature, extent and quality of services provided to the Beacon Funds under the Beacon Agreement. The Trustees reviewed certain background materials supplied by Beacon in its presentation, including its Form ADV and ownership structure as a subsidiary of a larger organization.
The Trustees reviewed and considered Beacon’s investment advisory personnel, its history as an asset manager and its performance. They commented favorably on Beacon’s disciplined, systematic approach to allocations while applying some level of downside protection. The Trustees also reviewed the research and decision-making processes utilized by the Beacon, including the methods adopted to seek to achieve compliance with the investment objectives, policies and restrictions of the Beacon Funds. They considered the Trust’s experience with Beacon over the last year, including the firm’s strong responsiveness to the officers of the Trust and excellent compliance record.
The Trustees considered the background and experience of Beacon’s team, including reviewing the qualifications, background and responsibilities of the portfolio manager primarily responsible for the day-to-day portfolio management of the Beacon Funds and the extent of the resources devoted to research and analysis of actual and potential investments, and execution of the strategy. The Trustees also reviewed, among other things, Beacon’s Code of Ethics. The Trustees also considered Beacon’s reputation generally and its risk management controls and decision-making processes. The Board agreed that the nature, extent and quality of services rendered by Beacon under the Beacon Agreement were satisfactory.
Investment Advisory Fee Rate: The Trustees reviewed and considered the contractual annual advisory fee paid by the Beacon Funds to Beacon of 1.00% of each Fund’s daily average net assets, considering the nature, extent and quality of the advisory services provided by Beacon to the Beacon Funds. The Board considered the information they received comparing each Beacon Fund’s contractual annual advisory fees and overall expenses with those of funds in the expense group and universe of funds provided by FUSE, an independent provider of investment company data.
The Trustees noted that the BARS Fund’s contractual advisory fee of 1.00% was slightly above the peer group median, but within the range of the peer group. The Board also noted that the BARS Fund’s net expense ratio was at the peer group median level. With respect to the BPRS Fund, its contractual advisory fee of 1.00% was slightly above the peer group median, but within the range of the peer group. The Board also noted that the BPRS Fund’s net expense ratio was also above the peer group median, but within the range of the peer group. The Board acknowledged Beacon’s representations regarding the differences in strategies of the peer funds compared to the Beacon Funds, noting that the Funds’ strategy may require more resources to execute than certain peer funds. After further consideration, the Trustees determined that the contractual annual advisory fees, taking into consideration the total net expenses for each Fund, were not unreasonable for the quality of services provided.
| Annual Report | September 30, 2021 | 39 |
| Disclosure Regarding Renewal and | |
| Beacon Funds Trust | Approval of Fund Advisory Agreement |
September 30, 2021 (Unaudited)
Performance: The Board reviewed performance information provided for the Funds for the quarter ended June 30, 2021 compared to each Fund’s benchmark index, and for the 3-month, one-year and since inception periods ended May 31, 2021 against a peer group selected by FUSE. The Trustees observed that the returns for each Fund’s second quarter 2021 significantly outperformed the benchmark index. In addition, for each of the 3-month, one year and since inception periods ended May 31, 2021, the Funds each significantly outperformed their respective peer group median performance, ranking among the top funds within the peer group. The Board noted their satisfaction with each Beacon Fund’s performance, giving credit to Beacon’s disciplined execution of its strategy.
Profitability: The Trustees received and considered a profitability analysis prepared by Beacon based on the fees paid under the Beacon Agreement. The Trustees noted that Beacon’s work with the Funds was profitable, but that the amount of profit was not unreasonable in absolute terms or as a percentage of income. They considered the benefit to Beacon of the soft dollar arrangements and reviewed and discussed the financial statements of Beacon’s parent company, recognizing that Beacon’s parent was well capitalized. Further, in consideration of the fact that Beacon’s work with the Funds was profitable, the Board did not have concerns regarding the firm’s continued viability.
Economies of Scale: The Trustees considered whether Beacon was benefiting from economies of scale in the provision of services to each Beacon Fund and whether such economies should be shared with the Funds’ shareholders under the Beacon Agreement. The Board noted Beacon’s belief that, because the firm was part of a large organization, it was able achieve certain internal economies through resource sharing with its parent company and thus was able to charge the Funds a lower advisory fee at current asset levels than it otherwise would be able to if Beacon was a smaller organization. The Board reviewed the size of the Beacon Funds and their prospects for growth and agreed that neither Fund had yet achieved meaningful economies that would necessitate the establishment of breakpoints, but agreed to continue to monitor and revisit the issue at the appropriate time.
Other Benefits to the Adviser: The Trustees reviewed and considered any other incidental benefits derived or to be derived by Beacon from its relationship with each Beacon Fund, including research and other support services, noting nothing of concern.
Having requested and reviewed such information from Beacon as the Board believed to be reasonably necessary to evaluate the terms of the Beacon Agreement, the Trustees, including all the Independent Trustees, concluded that renewal of the Beacon Agreement was in the best interests of each Beacon Fund and its respective shareholders.
| 40 | www.beacontrust.com |
| Beacon Funds Trust | Additional Information |
September 30, 2021 (Unaudited)
1. PROXY VOTING POLICIES AND VOTING RECORD
A description of the policies and procedures that the Funds use to determine how to vote proxies relating to portfolio securities is available without charge, upon request, (i) by calling the Funds (toll-free) at 1-844-894-9222 or (ii) on the website of the Securities and Exchange Commission (the “SEC”) at http://www.sec.gov.
Information regarding how each Fund voted proxies relating to portfolio securities during the most recent 12-month period ended June 30 is available (i) without charge, upon request, by calling the Funds (toll-free) at 1-844-894-9222 or (ii) on the SEC’s website at http://www.sec.gov.
2. PORTFOLIO HOLDINGS
The Funds’ portfolio holdings are made available semi-annually in shareholder reports within 60 days after the close of the period for which the report is being made, as required by federal securities laws. Each Fund files its complete schedule of portfolio holdings with the SEC for the first and third fiscal quarters of each fiscal year as an exhibit to its reports on Form N-PORT. The Funds’ Form N-PORT reports are available on the SEC’s website at www.sec.gov. The Funds’ portfolio holdings are also available upon request, without charge, by calling (toll-free) 1-866-377-8090 or by writing to Beacon Trust at 163 Madison Avenue, Suite 600, Morristown, New Jersey 07960.
3. SHAREHOLDER PROXY RESULTS
At a Special Meeting of Shareholders of the ALPS Series Trust, held on April 12, 2021, shareholders of record as of the close of business on March 1, 2021 voted to approve the following proposals:
Proposal 1: To elect Ward D. Armstrong to serve on the Board of Trustees until his resignation, retirement, death or removal or until his successor is duly elected and qualified.
| Shares Voted In Favor | Shares Voted Against or Abstentions |
| 162,259,659 | 244,729 |
Proposal 2: To elect Bradley J. Swenson to serve on the Board of Trustees until his resignation, retirement, death or removal or until his successor is duly elected and qualified.
| Shares Voted In Favor | Shares Voted Against or Abstentions |
| 162,281,980 | 222,408 |
4. TAX DESIGNATIONS
Pursuant to Section 852(b)(3) of the Internal Revenue Code the following Funds designate the amounts listed below as long-term capital gain dividends:
Beacon Accelerated Return Strategy Fund: $6,280,750
Beacon Planned Return Strategy Fund: $11,786,530
| Annual Report | September 30, 2021 | 41 |
| Beacon Funds Trust | Liquidity Risk Management Program |
September 30, 2021 (Unaudited)
The ALPS Series Trust (the “Trust”) has established a liquidity risk management program (the “Program”) to govern the Trust’s approach to managing liquidity risk for each fund in the series (each a “Fund”). The Program is overseen by the Liquidity Committee (the “Committee”), a committee comprised of representatives of the Trust and ALPS | SS&C. The Trust’s Board of Trustees (the “Board”) has approved the designation of the Committee to oversee the Program.
The Program’s principal objectives include supporting each Fund’s compliance with limits on investments in illiquid assets and mitigating the risk that a Fund will be unable to meet its redemption obligations in a timely manner. The Program also includes a number of elements that support the management and assessment of liquidity risk, including, among others, an annual assessment of factors that influence a Fund’s liquidity the periodic classification and re-classification of the Fund’s investments into groupings that reflect the Committee’s assessment of their relative liquidity under both current market conditions and reasonably foreseeable stressed conditions, as well as minimum levels of highly liquid investments.
At a meeting that occurred on May 20, 2021, the Board received a report from the Committee that addressed the operation of the Program and assessed its adequacy and effectiveness of implementation. The report revealed that, during the period covered by the report, there were no liquidity events that impacted the Funds or their ability to timely meet redemptions without dilution to existing shareholders. The report further discussed the liquidity classification methodology of each Fund, the effectiveness of the operation of certain Funds’ Highly Liquid Investment Minimum (“HLIM”) where applicable, and the liquidity classification of each Fund’s investments over the period. The report further noted that no material changes have been made to the Program since its implementation. The report provided to the Board included a conclusion that the Program appeared to be reasonably designed and operated effectively during the review period.
| 42 | www.beacontrust.com |
| Beacon Funds Trust | Privacy Policy |
September 30, 2021
| FACTS | WHAT DOES THE FUND DO WITH YOUR PERSONAL INFORMATION? |
| WHY? | Financial companies choose how they share your personal information. Federal law gives consumers the right to limit some but not all sharing. Federal law also requires us to tell you how we collect, share, and protect your personal information. Please read this notice carefully to understand what we do. |
| WHAT? | The types of personal information we collect and share depend on the product or service you have with us. This information can include: |
| • Social Security number and account transactions | |
| • Account balances and transaction history | |
| • Wire transfer instructions | |
| HOW? | All financial companies need to share customers’ personal information to run their everyday business. In the section below, we list the reasons financial companies can share their customers’ personal information, the reasons a Fund chooses to share, and whether you can limit this sharing. |
| REASONS WE CAN SHARE YOUR PERSONAL INFORMATION | DOES THE FUND SHARE: | CAN YOU LIMIT THIS SHARING? |
| For our everyday business purposes – | ||
| such as to process your transactions, maintain your account(s), respond to court orders and legal investigations, or report to credit bureaus | Yes | No |
| For our marketing purposes – | ||
| to offer our products and services to you | No | We do not share. |
| For joint marketing with other financial companies | No | We do not share. |
| For our affiliates’ everyday business purposes – | ||
| information about your transactions and experiences | Yes | No |
| For our affiliates’ everyday business purposes – | ||
| information about your creditworthiness | No | We do not share. |
| For non-affiliates to market to you | No | We do not share. |
| QUESTIONS? | Call 1-844-894-9222 or go to www.beacontrust.com. |
| Annual Report | September 30, 2021 | 43 |
| Beacon Funds Trust | Privacy Policy |
September 30, 2021
| WHO WE ARE | ||
| Who is providing this notice? | Beacon Accelerated Return Strategy fund and Beacon Planned Return Strategy fund (each, a “Fund”) | |
| WHAT WE DO | ||
| How does the Fund protect my personal information? | To protect your personal information from unauthorized access and use, we use security measures that comply with federal law. These measures include computer safeguards and secured files and buildings. | |
| How does the Fund collect my personal information? | We collect your personal information, for example, when you | |
| • | open an account | |
| • | provide account information or give us your | |
| contact information | ||
| • | make a wire transfer or deposit money | |
| Why can’t I limit all sharing? | Federal law gives you the right to limit only | |
| • | sharing for affiliates’ everyday business purposes- information about your creditworthiness | |
| • | affiliates from using your information to market to you | |
| • | sharing for non-affiliates to market to you | |
| • | State laws and individual companies may give you additional rights to limit sharing | |
| DEFINITIONS | ||
| Affiliates | Companies related by common ownership or control. They can be financial and nonfinancial companies. | |
| Non-affiliates | Companies not related by common ownership or control. They can be financial and nonfinancial companies. | |
| • | The Fund does not share with non-affiliates so they can market to you. | |
| Joint marketing | A formal agreement between non-affiliated financial companies that together market financial products or services to you. | |
| • | The Fund does not jointly market. | |
| 44 | www.beacontrust.com |
| Beacon Funds Trust | Privacy Policy |
September 30, 2021
| OTHER IMPORTANT INFORMATION | |
| California Residents | If your account has a California home address, your personal information will not be disclosed to nonaffiliated third parties except as permitted by applicable California law, and we will limit sharing such personal information with our affiliates to comply with California privacy laws that apply to us. |
| Vermont Residents | The State of Vermont requires financial institutions to obtain your consent prior to sharing personal information that they collect about you with affiliated companies and nonaffiliated third parties other than in certain limited circumstances. Except as permitted by law, we will not share personal information we collect about you with nonaffiliated third parties or other affiliated companies unless you provide us with your written consent to share such information. |
| Annual Report | September 30, 2021 | 45 |
| Beacon Funds Trust | Trustees and Officers |
September 30, 2021
INDEPENDENT TRUSTEES
| Name, Birth Year & Address* | Position(s) Held with Fund | Term of Office and Length of Time Served** | Principal Occupation(s) During Past 5 Years*** | Number of Funds in Fund Complex Overseen by Trustee**** | Other Directorships Held by Trustee During Past 5 Years*** |
| Ward D. Armstrong, Birth year: 1954 | Trustee and Chairman | Mr. Armstrong was appointed to the Board on May 27, 2016. Mr. Armstrong was appointed Chairman of the Board at the August 24, 2017 meeting of the Board of Trustees. | Mr. Armstrong is currently retired. From February 2010 to July 2015, he was Co- Founder and Managing Partner of NorthRock Partners, a private wealth advisory firm providing comprehensive wealth management and family office services to the high net-worth marketplace. Previously, he was Senior Vice President, Ameriprise Financial (1984 to 2007); Chairman of Ameriprise Trust Company (1996 to 2007) and President, American Express Institutional Asset Management (2002 to 2004). He has also served on several investment related Boards including Kenwood Capital Management, RiverSource Investments, American Express Asset Management International and was Chair of the Ordway Theatre Endowment Committee. | 11 | Mr. Armstrong is a Director of the Heartland Group, Inc. (3 funds). |
| * | All communications to Trustees and Officers may be directed to ALPS Series Trust c/o 1290 Broadway, Suite 1000, Denver, CO 80203. |
| ** | This is the period for which the Trustee or Officer began serving the Trust. Each Trustee serves an indefinite term, until such Trustee’s successor is elected and appointed, or such Trustee resigns or is deceased. Officers are elected on an annual basis. |
| *** | Except as otherwise indicated, each individual has held the office shown or other offices in the same company for the last five years. |
| **** | The Fund Complex currently consists of 11 series of the Trust. |
| 46 | www.beacontrust.com |
| Beacon Funds Trust | Trustees and Officers |
September 30, 2021
| Name, Birth Year & Address* | Position(s) Held with Fund | Term of Office and Length of Time Served** | Principal Occupation(s) During Past 5 Years*** | Number of Funds in Fund Complex Overseen by Trustee**** | Other Directorships Held by Trustee During Past 5 Years*** |
| J. Wayne Hutchens, Birth year: 1944 | Trustee | Mr. Hutchens was elected to the Board on October 30, 2012. | Mr. Hutchens is currently retired. From 2000 to January 2020, he served as Trustee of the Denver Museum of Nature and Science and from May 2012 to February 2020, he served as Trustee of Children’s Hospital Colorado. From April 2006 to December 2012, he served as President and CEO of the University of Colorado (CU) Foundation and from April 2009 to December 2012, he was Executive Director of the CU Real Estate Foundation. Mr. Hutchens is also Director of AMG National Trust Bank (June 2012 to present). Prior to these positions, Mr. Hutchens spent 29 years in the banking industry, retiring as Chairman of Chase Bank Colorado. | 11 | Mr. Hutchens is a Director of RiverNorth Opportunities Fund, Inc. (2013 to present), RiverNorth Opportunistic Municipal Income Fund, Inc. (2018 to present), RiverNorth/Doubleline Strategic Opportunity Fund, Inc. (2018 to present), RiverNorth Specialty Finance Corporation (2018 to present), RiverNorth Managed Duration Municipal Income Fund, Inc. (2019 to present), RiverNorth Flexible Municipal Income Fund, Inc. (2020 to present). He is an Advisory Board member of RiverNorth Funds (3 funds) (2020 to present). |
| * | All communications to Trustees and Officers may be directed to ALPS Series Trust c/o 1290 Broadway, Suite 1000, Denver, CO 80203. |
| ** | This is the period for which the Trustee or Officer began serving the Trust. Each Trustee serves an indefinite term, until such Trustee’s successor is elected and appointed, or such Trustee resigns or is deceased. Officers are elected on an annual basis. |
| *** | Except as otherwise indicated, each individual has held the office shown or other offices in the same company for the last five years. |
| **** | The Fund Complex currently consists of 11 series of the Trust. |
| Annual Report | September 30, 2021 | 47 |
| Beacon Funds Trust | Trustees and Officers |
September 30, 2021
| Name, Birth Year & Address* | Position(s) Held with Fund | Term of Office and Length of Time Served** | Principal Occupation(s) During Past 5 Years*** | Number of Funds in Fund Complex Overseen by Trustee**** | Other Directorships Held by Trustee During Past 5 Years*** |
| Patrick Seese, Birth year: 1971 | Trustee | Mr. Seese was elected to the Board on October 30, 2012. | Mr. Seese is an owner and a Managing Director of Integris Partners, a middle-market investment banking firm serving closely-held companies, financial sponsors and public companies (February 2008 to present). Prior to this, Mr. Seese was a Managing Director of Headwaters MB, a middle-market investing banking firm (December 2003 to February 2008). Prior to that, Mr. Seese worked in Credit Suisse First Boston’s Mergers and Acquisitions Group and served as Head of Corporation Development, Katy Industries, a publicly traded industrial and consumer products company and at Deloitte & Touche LLP, where he began his career in 1994. | 11 | Mr. Seese is a Director of The Mile High Five Foundation (2013 to present) and SJ Panthers Foundation (2016 to present). |
| * | All communications to Trustees and Officers may be directed to ALPS Series Trust c/o 1290 Broadway, Suite 1000, Denver, CO 80203. |
| ** | This is the period for which the Trustee or Officer began serving the Trust. Each Trustee serves an indefinite term, until such Trustee’s successor is elected and appointed, or such Trustee resigns or is deceased. Officers are elected on an annual basis. |
| *** | Except as otherwise indicated, each individual has held the office shown or other offices in the same company for the last five years. |
| **** | The Fund Complex currently consists of 11 series of the Trust. |
| 48 | www.beacontrust.com |
| Beacon Funds Trust | Trustees and Officers |
September 30, 2021
| Name, Birth Year & Address* | Position(s) Held with Fund | Term of Office and Length of Time Served** | Principal Occupation(s) During Past 5 Years*** | Number of Funds in Fund Complex Overseen by Trustee**** | Other Directorships Held by Trustee During Past 5 Years*** |
| Merrillyn J. Kosier, Birth year: 1959 | Trustee | Ms. Kosier was elected to the Board on November 17, 2021. | Ms. Kosier retired from Ariel Investments as Executive Vice President in 2019. During her tenure at Ariel Investments, she served as Chief Marketing Officer, Ariel Mutual Funds since 2007; Trustee for Ariel Investment Trust since 2003 and President of Ariel Distributors, LLC since 2002. From 2006 to present, she has served as Trustee at the Harris Theater For Music and Dance (not-for- profit organization) and is currently Executive Vice Chair. | 11 | Ms. Kosier is Board Director at the Arts Club of Chicago (2021 to present). |
| * | All communications to Trustees and Officers may be directed to ALPS Series Trust c/o 1290 Broadway, Suite 1000, Denver, CO 80203. |
| ** | This is the period for which the Trustee or Officer began serving the Trust. Each Trustee serves an indefinite term, until such Trustee’s successor is elected and appointed, or such Trustee resigns or is deceased. Officers are elected on an annual basis. |
| *** | Except as otherwise indicated, each individual has held the office shown or other offices in the same company for the last five years. |
| **** | The Fund Complex currently consists of 11 series of the Trust. |
| Annual Report | September 30, 2021 | 49 |
| Beacon Funds Trust | Trustees and Officers |
September 30, 2021
INTERESTED TRUSTEE
| Name, Birth Year & Address* | Position(s) Held with Fund | Term of Office and Length of Time Served** | Principal Occupation(s) During Past 5 Years*** | Number of Funds in Fund Complex Overseen by Trustee**** | Other Directorships Held by Trustee During Past 5 Years*** |
| Bradley J. Swenson, Birth year: 1972 | Trustee | Mr. Swenson was elected to the Board on April 12, 2021. | Mr. Swenson joined ALPS Fund Services, Inc. (“ALPS”) in 2004 and had served as its President since June 2019 until June 2021. In this role, he served as an officer to certain other closed-end and open-end investment companies. He previously served as the Chief Operating Officer of ALPS (2015-2019). Mr. Swenson also previously served as Chief Compliance Officer to ALPS, its affiliated entities, and to certain ETF, closed-end and open-end investment companies (2004-2015). | 11 | None |
| * | All communications to Trustees and Officers may be directed to ALPS Series Trust c/o 1290 Broadway, Suite 1000, Denver, CO 80203. |
| ** | This is the period for which the Trustee or Officer began serving the Trust. Each Trustee serves an indefinite term, until such Trustee’s successor is elected and appointed, or such Trustee resigns or is deceased. Officers are elected on an annual basis. |
| *** | Except as otherwise indicated, each individual has held the office shown or other offices in the same company for the last five years. |
| **** | The Fund Complex currently consists of 11 series of the Trust. |
| 50 | www.beacontrust.com |
| Beacon Funds Trust | Trustees and Officers |
September 30, 2021
OFFICERS
| Name, Birth Year & Address* | Position(s) Held with Fund | Term of Office and Length of Time Served** | Principal Occupation(s) During Past 5 Years*** |
Dawn Cotten Birth year: 1977 | President | Since June 2021 | Ms. Cotten joined ALPS in 2009 and is currently Senior Vice President of Fund Administration and Relationship Management of ALPS. She has served in that role since January 2020. Prior to that, Ms. Cotten served as Senior Vice President (2017-2020) and Vice President of ALPS Relationship Management (2013-2017). |
Erich Rettinger Birth year: 1985 | Treasurer | Since August 2020 | Mr. Rettinger joined ALPS in 2007 and is currently Vice President and Fund Controller of ALPS. He has served as Fund Controller of ALPS (since 2013) and Fund Accounting of ALPS (2013- 2017). He also served as Assistant Treasurer of the Trust (May 2019-August 2020). Mr. Rettinger is also Treasurer of the Clough Long/Short Equity Fund, Clough Global Opportunities Fund, Clough Global Dividend and Income Fund and Clough Global Equity Fund. Mr. Rettinger is also Assistant Treasurer of the Stone Harbor Investment Funds. |
Patrick Rogers+ Birth year: 1966 | Secretary | Since November 2021 | Mr. Rogers has served as Senior Legal Counsel of ALPS since September 2021 and previously served as Compliance Counsel for Mercer Advisors from 2018 to 2021 and Contract Attorney for CACI, Inc. from 2014 to 2018. |
Anne M. Berg Birth year: 1973 | Assistant Secretary | Since August 2018 | Ms. Berg joined ALPS as Senior Investment Company Act Paralegal in February 2017. Prior to joining ALPS, she was a Senior Legal Manager at Janus Capital Management LLC (2000-2017). |
Lucas D. Foss Birth year: 1977 | Chief Compliance Officer | Since January 2018 | Mr. Foss rejoined ALPS in November 2017 as Vice President and Deputy Chief Compliance Officer. Prior to his current role, Mr. Foss served as the Director of Compliance at Transamerica Asset Management (2015- 2017) and Deputy Chief Compliance Officer at ALPS (2012- 2015). Mr. Foss is also CCO of X-Square Balanced Fund, Goehring & Rozencwajg Investment Funds, Broadstone Real Estate Access Fund, Inc., Clough Global Funds; Clough Funds Trust; SPDR® S&P 500® ETF Trust, SPDR® Dow Jones® Industrial Average ETF Trust, SPDR® S&P MIDCAP 400® ETF Trust and 1WS Credit Income Fund. |
| Annual Report | September 30, 2021 | 51 |
| Beacon Funds Trust | Trustees and Officers |
September 30, 2021
| * | All communications to Trustees and Officers may be directed to ALPS Series Trust c/o 1290 Broadway, Suite 1000, Denver, CO 80203. |
| ** | This is the period for which the Trustee or Officer began serving the Trust. Each Trustee serves an indefinite term, until such Trustee’s successor is elected and appointed, or such Trustee resigns or is deceased. Officers are elected on an annual basis. |
| *** | Except as otherwise indicated, each individual has held the office shown or other offices in the same company for the last five years. |
| **** | The Fund Complex currently consists of 11 series of the Trust. |
| + | Appointed November 18, 2021 |
Additional information about members of the Board of Trustees and officers of the Trust is available in the Statement of Additional Information and is available, without charge, upon request, by calling the Fund (toll-free) at 1-844-680-6562.
| 52 | www.beacontrust.com |
Beacon Funds
This material must be preceded by a prospectus.
The Beacon Funds are distributed by ALPS Distributors, Inc.

Table of Contents
| Shareholder Letter | 1 |
| Portfolio Update | 3 |
| Disclosure of Fund Expenses | 5 |
| Portfolio of Investments | 6 |
| Statement of Assets and Liabilities | 12 |
| Statement of Operations | 13 |
| Statements of Changes in Net Assets | 14 |
| Financial Highlights | 15 |
| Notes to Financial Statements | 17 |
| Report of Independent Registered Public Accounting Firm | 23 |
| Disclosure Regarding Renewal and Approval of Fund Advisory Agreement | 24 |
| Additional Information | 25 |
| Liquidity Risk Management Program Disclosure | 26 |
| Privacy Policy | 27 |
| Trustees & Officers | 29 |
| Carret Kansas Tax-Exempt Bond Fund | Shareholder Letter |
| September 30, 2021 (Unaudited) |
As the 2021 fiscal year came to a close, the municipal bond market was functioning extremely well, even with the presence of inflation caused by accommodative federal monetary and fiscal policies, as well as supply and demand imbalances. Overall, municipal bond investors continued to experience relatively flat returns as interest rates drifted higher and prices moved slightly lower through the end of September.
The Fed historically controls short-term interest rates, and it continued its “accommodative stance” throughout fiscal 2021. However, long-term interest rates and the yield curve are more typically determined by economic sentiment. During the 1st calendar Quarter, the yield on the 10Yr US Treasury (UST) increased by 82 bps (from 0.92% to 1.74%) due to much-improved economic recovery metrics, as well as prevailing inflation implications. During that period, the 2Yr to 10Yr UST yield spread “steepened” from 81 bps to 158 bps. In the 2nd calendar Quarter, where positive economic news appeared more subdued and inflation concerns seemed to wane, the result was an opposite move in rates, where the yield on the 10Y UST dropped by 29 bps - from 1.74% to 1.45% from April through June. Finally, in the 3rd and final quarter of the fiscal year, with supply chain issues and higher prices more prevalent, interest rates slowly edged higher, though not quite to the levels during the spring. The yield on the 10Yr UST stood at 1.53% on September 30th.
As you may recall, Congress approved the long-awaited $900B stimulus package back in late December of 2020, with significant funds to aid individuals, households and small businesses. However, this plan was devoid of state, local, and/or tribal aid for which many economists and market professionals had been pressing Congress as part of an economic stimulus plan. Nevertheless, in mid-March of this year, Congress passed the 6th phase of Covid-19 fiscal stimulus, the American Rescue Plan, providing a “game-changing” $1.9T in funds which did finally include state, local, and tribal financial reinforcements. In addition to the almost completely unencumbered $350B of direct municipal fiscal support, there was another $300B in healthcare, mass transit, housing, and higher education funds included in the bill.
Ironically, up until that point, activity in the municipal market had been relatively immune to the lack of direct municipal aid throughout the pandemic, resulting in continued positive liquidity and overall functionality of municipal bond trading activity. Thus, the addition of these stimulus funds caused market economists and municipal credit analysts to upgrade their outlooks for many credit sectors, some even talking about a “golden age” for municipal credit. Because of this overall positive outlook, the municipal bond market was driven less by credit issues, and more by overall supply and demand dynamics.
To that point, YTD issuance was $355B, almost identical to the same period last year. Municipal bond demand, however, continued to outpace supply across the country. Kansas was a state where the primary new issue market (approximately $3.9B in new issuance through September) was very well-received, resulting in a secondary market that saw equally solid demand though with less inventory from which to choose. Case in point was the month of September, where investors saw the largest amount of bond maturities and calls for all of 2021, setting up even more demand for the final months of the year. Overall, three out of every four new bond issues were tax-exempt compared to taxable, and approx. 2/3 of new deals were “new money,” with about 1/3 being issued to refund outstanding debt.
On the economic front, the state experienced sizable Covid-driven challenges to employment, growth, and revenues, though as of November 2020, the state unemployment rate stood at 5.6%, versus a national average of 6.7%. Another positive note for that period was that state tax collections for both November and December 2020 exceeded estimates. Total tax collections were up $64.5M, or +9.1%, for December with $770.2M collected, a +1.8% increase from the same month of last fiscal year.
Additionally, the state benefited nicely from the positive trends in 2H21. Total Nonfarm Employment in May of this year was +5.25% higher YOY, and the Unemployment rate stood at just 3.5% in May, which was almost as low as pre-pandemic levels. Additionally, the state collected $8.9B in general tax revenue for the 2021 budget year (ending June 30), which was approximately $750M more than expected or a 9.3% surplus. Most of that tax revenue was due to investors realizing capital gains in investments. In August, Kansas’ total tax revenues were $629M or 22% more than estimated.
According to U.S. News & World Report, Kansas ranks 7th nationally in terms of Infrastructure (renewable energy participation, low commute times, and good roads). However, a report published by the Pew Charitable Trusts ranked Kansas 46th nationally in terms of personal income growth from 3Q19 to 3Q20. Obviously, personal income is crucial to states as a measurement of economic trends, helping to predict tax revenue and to plan overall spending. Even though personal income at the national level was higher over that time period (+2.7% for Kansas vs +5.9% state average), the low state ranking has led the state senate and Governor Laura Kelly to focus on these trends, and to pass and sign bi-partisan bills addressing the state’s overall economy, with the main goal of attracting new businesses and additional revenues to the state.
Along those lines, there were some positive reports announced in 2021. Of note was a $2.1B Federal Grant from the US Commerce Department for the Aerospace Research Facilities at Wichita State University, followed by a $7.3M award from the Federal Aviation Administration. Twenty-four expansion and modernization improvement projects, totaling more than $776M in investments, would be made to the state highway system while Kansas’ largest electric company, Evergy, with over 1M customers, expects to make its first big investments in solar energy over the next three years. While this “green initiative” will no doubt have its supporters and detractors across the state, we believe a solar power initiative, new wind energy sites, and the retirement of a number of coal power plants, will likely change the footprint of energy-generating capacity over the next several decades. Funding of these projects may involve both taxable and tax-exempt financing in the coming years.
| Annual Report | September 30, 2021 | 1 |
| Carret Kansas Tax-Exempt Bond Fund | Shareholder Letter |
| September 30, 2021 (Unaudited) |
Throughout the majority of 2021, Kansas municipal bonds remained fairly valued in the context of the overall municipal marketplace. For the Carret Kansas Tax-Exempt Bond Fund, assets fell slightly from $189M at the start of the year to $184M by the end of September. In August, the rating agencies (S&P and Moody’s) affirmed the credit rating for the state of Kansas, meaning that the state’s credit rating and debt outlook remain the same as it when it was last rated in 2020. The structure of the Fund stayed relatively constant throughout fiscal 2021. The Fund had an average Credit Rating of AA-, an Average Coupon of 4.07%, and a Yield to Maturity of 1.89%. The Fund remains 100% Kansas municipal bonds without any exposure to bonds subject to Alternative Minimum Tax (AMT).
The Carret Kansas Tax-Exempt Bond Fund focuses on preservation of capital while producing cash flows that are fully exempt from federal taxes and Kansas state tax. The Fund continues to seek premium coupon general obligation (GO) and essential service revenue bonds in the investment grade category. Representative bond issues in the Fund include Kansas Department of Transportation Revenue, Butler County KS School District, Seward County KS School District, Wichita KS Water & Sewer Authority, and Topeka Utility Revenue. The Fund’s largest sector allocations are to School Districts (42%), General Obligations (20%), Utility Revenues (13%), Transportation (10%), and General Revenue (9%).
The Fund’s average maturity is 9.6 years, which is in-line with its recent duration trend. The Fund holds 193 different bond issues with over 78% of those rated AA or better. The Institutional Share Class (I shares) returned +1.30% over the past 12 months ending September 30, 2021. Over this same period, the Bloomberg Barclays 7 Year U.S. Municipal Bond Index, the Fund’s primary benchmark, returned +1.40% while the Lipper Other State Intermediate Municipal Bond Index returned 1.08%. The Fund is Kansas-specific in nature, while the Indexes are non-state specific (General Market or Other State Focus). Over a 3-year time horizon, the Institutional shares returned an average of +4.06 % (annualized), compared to the Bloomberg Barclays Index at 4.65% (annualized) and the Lipper Index at 3.71% (annualized).
The Fund did not employ any derivative investments during the fiscal year ending September 30, 2021.
Carret Asset Management, LLC
Glossary of Terms
Coupon is the rate of interest, payable annually.
Yield to Maturity is calculated by assuming that interest payments will be made until the final maturity date, at which point the principal will be repaid by the issuer. Yield to maturity is essentially the discount rate at which the present value of future payments (investment income and return of principal) equals the price of the security.
Call features exists when/if a bond is subject to payment of the principal amount (and accrued interest) prior to the stated maturity date, with or without payment of a call premium. Bonds can be callable under several different circumstances, including at the option of the issuer, or on a mandatory or extraordinary basis.
Average Maturity is the weighted average of the effective maturity dates of the fixed-income securities in the Fund's holdings. A bond's effective maturity takes into account the possibility that it may be called by the issuer before its stated maturity date. In this case, the bond trades as though it had a shorter maturity than its stated maturity.
Duration is a measure of the responsiveness of a bond's price to interest rate changes for bonds with an embedded option.
SEC 30-day Yield represents the yield that must be earned on a fully taxable investment to equal the yield of the Fund on an after-tax basis at a specified tax rate. If the comparison were instead to investments that generate qualified dividend income, which is taxable at a rate lower than an individual's ordinary graduated tax rate, the Fund's Taxable-Equivalent yield would be lower. The Taxable-equivalent yield is computed under an SEC standardized formula and is based on the maximum offer price per share.
Taxable-Equivalent Yield is the pretax yield that a taxable bond needs for its yield to equal that of a tax-free municipal bond. The Taxable Equivalent Yield is calculated using a 46.50% Combined Federal, Kansas State, and Medicare Surcharge Tax Rate. Investors should consider their own tax rate when investing in municipal bonds.
Bond Rating Disclosure
Ratings shown are the highest rating given by one of the following national rating agencies: S&P, Moody's or Fitch. Additional information about ratings can be found, respectively, at www.standardandpoors.com, www.moodys.com and www.fitchratings.com. Credit ratings are subject to change. AAA, AA, A, and BBB are investment grade ratings categories used by S&P and Fitch; BB, B, CCC/CC/C and D are below investment grade ratings categories used by S&P and Fitch. Aaa, Aa, A and Baa are investment grade ratings categories used by Moody's; Ba, B, Caa/Ca and C are below investment grade ratings categories used by Moody's. Bonds backed by U.S. Government or agency securities are given an implied rating equal to the rating of such securities. Holdings designated Not Publicly Rated are not rated by these national rating agencies.
2 |
| Carret Kansas Tax-Exempt Bond Fund | Portfolio Update |
| September 30, 2021 (Unaudited) |
Average Annual Total Returns (as of September 30, 2021)
| 1 Year | 5 Year | 10 Year | Since Inception* | |
| Carret Kansas Tax-Exempt Bond Fund - Institutional Class | 1.30% | 2.51% | 3.01% | 4.46% |
| Carret Kansas Tax-Exempt Bond Fund – Class A (NAV) | 1.05% | 2.20% | 2.65% | 3.11% |
| Carret Kansas Tax-Exempt Bond Fund – Class A (MOP) | -3.29% | 1.31% | 2.21% | 2.88% |
| Bloomberg Barclays US Municipal Bond: 7 Year (6-8) Index(a) | 1.40% | 2.83% | 3.27% | 2.65% |
The performance data quoted above represents past performance. Past performance is not a guarantee of future results. Investment return and value of the Fund shares will fluctuate so that an investor’s shares, when sold or redeemed, may be worth more or less than their original cost. Performance may be lower or higher than performance data quoted. Fund performance current to the most recent month-end is available by calling (833) 287-7933.
| * | The Fund commenced operations on May 22, 2007. The Predecessor Fund, American Independence Kansas Tax-Exempt Bond Fund, managed by Manifold Fund Advisors, LLC, was reorganized into the American Independence Kansas Tax-Exempt Bond Fund on September 24, 2018. Manifold Partners, LLC was the Fund’s investment adviser from September 24, 2018 through September 13, 2019, with Carret Asset Management, LLC serving as sub-adviser. Effective September 13, 2019, Manifold Partners, LLC ceased providing investment advisory services to the Fund and Carret Asset Management, LLC became the Fund's investment adviser. Fund performance prior to September 24, 2018 is reflective of the past performance of the Predecessor Fund. The Institutional Class of the Predecessor Fund commenced operations on December 10, 1990. Class A of the Predecessor Fund commenced operations on August 6, 2002. |
| (a) | The Bloomberg Barclays 7-Year US Municipal Bond Index is a total return performance benchmark for the investment-grade, geographically unrestricted 7-year tax-exempt bond market, consisting of municipal bonds with maturities of 6 to 8 years. |
Indices are not actively managed and do not reflect deduction for fees, expenses or taxes. An investor cannot invest directly in an index.
The returns shown above do not reflect the deduction of taxes a shareholder would pay on Fund distributions or redemption of Fund shares.
Maximum Offering Price (MOP) for Class A shares includes the Fund’s maximum sales charge of 4.25%. Performance shown at NAV does not include these sales charges and would have been lower had it been taken into account.
The total annual operating expenses and total annual operating expenses after fee waivers and/or reimbursement for the Fund’s Institutional Class and Class A shares (as reported in the January 28, 2021 Prospectus) are 0.57% and 0.48% and 0.86% and 0.73%, respectively. The Fund’s investment adviser has contractually agreed to limit expenses through January 31, 2022.
| Annual Report | September 30, 2021 | 3 |
| Carret Kansas Tax-Exempt Bond Fund | Portfolio Update |
| September 30, 2021 (Unaudited) |
Performance of $3,000,000 Initial Investment (as of September 30, 2021)
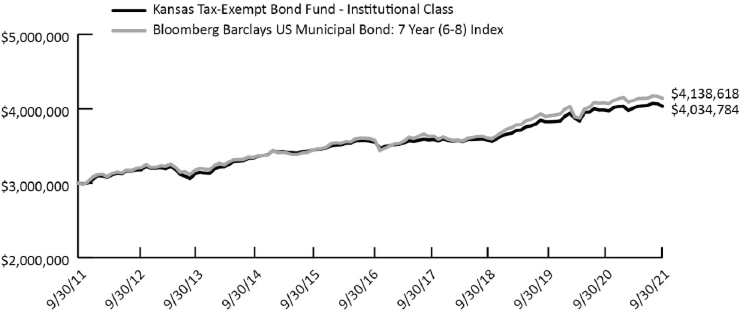
The graph shown above represents historical performance of a hypothetical investment of $3,000,000 in the Institutional Class. Due to differing expenses, performance of Class A will vary. Past performance does not guarantee future results. Returns do not reflect the deduction of fees, sales charges, or taxes that a shareholder would pay on Fund distributions or the redemption of Fund shares.
Portfolio Diversification (% of Net Assets as of September 30, 2021)

4 |
| Carret Kansas Tax-Exempt Bond Fund | Disclosure of Fund Expenses |
| September 30, 2021 (Unaudited) |
Examples. As a shareholder of the Carret Kansas Tax-Exempt Bond Fund, you incur two types of costs: (1) transaction costs, (2) ongoing costs, including management fees, distribution and service (12b-1) fees and other Fund expenses. The following examples are intended to help you understand your ongoing costs (in dollars) of investing in the Fund and to compare these costs with the ongoing costs of investing in other mutual funds. The examples are based on an investment of $1,000 invested on April 1, 2021 and held through September 30, 2021.
Actual Expenses. The first line under each class in the table below provides information about actual account values and actual expenses. You may use the information in this line, together with the amount you invested, to estimate the expenses that you paid over the period. Simply divide your account value by $1,000 (for example, an $8,600 account value divided by $1,000 = 8.6), then multiply the result by the number in the first line under the heading “Expenses Paid During Period April 1, 2021 – September 30, 2021.” to estimate the expenses you paid on your account during this period.
Hypothetical Example for Comparison Purposes. The second line under each class in the table below provides information about hypothetical account values and hypothetical expenses based on the Fund’s actual expense ratio and an assumed rate of return of 5% per year before expenses, which is not the Fund’s actual return. The hypothetical account values and expenses may not be used to estimate the actual ending account balance or expenses you paid for the period. You may use this information to compare the ongoing costs of investing in the Fund and other mutual funds. To do so, compare this 5% hypothetical example with the 5% hypothetical examples that appear in the shareholder reports of the other funds.
Please note that the expenses shown in the table are meant to highlight your ongoing Fund costs only and do not reflect any transactional costs, such as redemption fees. Therefore, the second line under each class in the table below is useful in comparing ongoing costs only and will not help you determine the relative total costs of owning different funds. In addition, if these transactional costs were included, your costs would have been higher.
| Beginning Account Value April 1, 2021 | Ending Account Value September 30, 2021 | Expense Ratio(a) | Expenses Paid During Period April 1, 2021 - September 30, 2021(b) | |
| Carret Kansas Tax-Exempt Bond Fund | ||||
| Institutional Class | ||||
| Actual | $ 1,000.00 | $ 1,006.40 | 0.48% | $ 2.41 |
| Hypothetical (5% return before expenses) | $ 1,000.00 | $ 1,022.66 | 0.48% | $ 2.43 |
| Class A | ||||
| Actual | $ 1,000.00 | $ 1,005.20 | 0.73% | $ 3.67 |
| Hypothetical (5% return before expenses) | $ 1,000.00 | $ 1,021.41 | 0.73% | $ 3.70 |
| (a) | The Fund's expense ratios have been annualized based on the Fund's most recent fiscal half-year expenses after any applicable waivers and reimbursements. |
| (b) | Expenses are equal to the annualized expense ratio shown above for the applicable class, multiplied by the average account value over the period, multiplied by the number of days in the most recent fiscal half year (183), divided by 365. |
| Annual Report | September 30, 2021 | 5 |
| Carret Kansas Tax-Exempt Bond Fund | Portfolio of Investments |
| September 30, 2021 |
| Principal Amount | Value (Note 2) | |||||||
| MUNICIPAL BONDS (98.76%) | ||||||||
| Education (46.48%)(a) | ||||||||
| Allen County Unified School District No. 257, General Obligation Unlimited Bonds | ||||||||
| 3.000%, 09/01/2043 | $ | 2,415,000 | $ | 2,549,884 | ||||
| Barton Community College, Certificate Participation Bonds | ||||||||
| 4.000%, 12/01/2032 | 555,000 | 619,421 | ||||||
| 4.000%, 12/01/2034 | 250,000 | 279,051 | ||||||
| Bourbon County Unified School District No. 234-Fort Scott, General Obligation Unlimited Bonds | ||||||||
| 5.000%, 09/01/2025 | 355,000 | 401,196 | ||||||
| Butler County Unified School District No. 206 Remington, General Obligation Unlimited Bonds | ||||||||
| 3.000%, 09/01/2034 | 1,000,000 | 1,041,102 | ||||||
| 3.000%, 09/01/2035 | 510,000 | 530,276 | ||||||
| Butler County Unified School District No. 375 Circle, General Obligation Unlimited Bonds | ||||||||
| 3.000%, 09/01/2035 | 750,000 | 843,762 | ||||||
| Butler County Unified School District No. 385 Andover, General Obligation Unlimited Bonds | ||||||||
| 4.000%, 09/01/2030 | 690,000 | 803,566 | ||||||
| 4.000%, 09/01/2031 | 500,000 | 578,419 | ||||||
| 5.000%, 09/01/2032 | 2,750,000 | 3,433,221 | ||||||
| 5.000%, 09/01/2034 | 2,000,000 | 2,496,888 | ||||||
| Butler County Unified School District No. 490 El Dorado, General Obligation Unlimited Bonds | ||||||||
| 4.000%, 09/01/2034 | 1,000,000 | 1,136,985 | ||||||
| 4.000%, 09/01/2036 | 500,000 | 565,554 | ||||||
| Douglas County Unified School District No. 497 Lawrence, General Obligation Unlimited Bonds | ||||||||
| 4.000%, 09/01/2031 | 1,500,000 | 1,735,256 | ||||||
| 4.000%, 09/01/2033 | 500,000 | 546,838 | ||||||
| Finney County Unified School District No. 457 Garden City, General Obligation Unlimited Bonds | ||||||||
| 4.000%, 09/01/2031 | 1,500,000 | 1,708,149 | ||||||
| 5.000%, 09/01/2027 | 800,000 | 966,552 | ||||||
| Ford County Unified School District No. 443 Dodge City, General Obligation Unlimited Bonds | ||||||||
| 4.000%, 03/01/2030 | 1,150,000 | 1,348,389 | ||||||
| 4.000%, 03/01/2034 | 1,000,000 | 1,172,512 | ||||||
| Franklin County Unified School District No. 289 Wellsville, General Obligation Unlimited Bonds | ||||||||
| 4.000%, 09/01/2030 | 645,000 | 788,608 | ||||||
| Franklin County Unified School District No. 290 Ottawa, General Obligation Unlimited Bonds | ||||||||
| 4.000%, 09/01/2040 | 250,000 | 284,136 | ||||||
| 5.000%, 09/01/2031 | 1,715,000 | 2,015,507 | ||||||
| 5.000%, 09/01/2032 | 150,000 | 176,283 | ||||||
| 5.000%, 09/01/2033 | 1,000,000 | 1,175,223 | ||||||
| Geary County Unified School District No. 475, General Obligation Unlimited Bonds | ||||||||
| 3.000%, 09/01/2033 | 1,000,000 | 1,134,842 | ||||||
| 4.000%, 09/01/2038 | 2,000,000 | 2,273,084 | ||||||
| 4.000%, 09/01/2043 | 1,000,000 | 1,136,542 | ||||||
| Johnson & Miami Counties Unified School District No. 230 Spring Hills, General Obligation Unlimited Bonds | ||||||||
| 4.000%, 09/01/2031 | 400,000 | 461,256 | ||||||
| 4.000%, 09/01/2033 | 1,000,000 | 1,135,205 | ||||||
| 4.000%, 09/01/2035 | 1,000,000 | 1,131,612 | ||||||
| 5.000%, 09/01/2030 | 1,970,000 | 2,393,948 | ||||||
| Johnson County Unified School District No. 229 Blue Valley, General Obligation Unlimited Bonds | ||||||||
| 3.000%, 10/01/2032 | 1,155,000 | 1,308,895 | ||||||
| Johnson County Unified School District No. 232 De Soto, General Obligation Unlimited Bonds | ||||||||
| 4.000%, 09/01/2031 | 1,165,000 | 1,380,734 | ||||||
| 4.000%, 09/01/2032 | 1,745,000 | 2,058,733 | ||||||
| Johnson County Unified School District No. 233 Olathe, General Obligation Unlimited Bonds | ||||||||
| 2.000%, 09/01/2030 | 750,000 | 784,893 | ||||||
| 4.000%, 09/01/2031 | 1,000,000 | 1,146,502 | ||||||
| 4.000%, 09/01/2033 | 905,000 | 1,024,988 | ||||||
| 4.000%, 09/01/2035 | 790,000 | 899,517 | ||||||
| See Notes to Financial Statements. |
| 6 |
| Carret Kansas Tax-Exempt Bond Fund | Portfolio of Investments |
| September 30, 2021 |
| Principal Amount | Value (Note 2) | |||||||
| Education (continued) | ||||||||
| 4.000%, 09/01/2036 | $ | 480,000 | $ | 546,542 | ||||
| Johnson County Unified School District No. 512 Shawnee Mission, General Obligation Unlimited Bonds | ||||||||
| 3.000%, 10/01/2039 | 2,000,000 | 2,218,465 | ||||||
| 4.000%, 10/01/2035 | 425,000 | 519,639 | ||||||
| 5.000%, 10/01/2032 | 1,000,000 | 1,181,105 | ||||||
| Kansas City Kansas Community College Auxiliary Enterprise System, Revenue Bonds | ||||||||
| 4.000%, 09/01/2032 | 140,000 | 164,451 | ||||||
| 4.000%, 09/01/2033 | 100,000 | 117,061 | ||||||
| Kansas Development Finance Authority, Revenue Bonds | ||||||||
| 2.000%, 05/01/2031 | 630,000 | 653,009 | ||||||
| 2.000%, 06/01/2032 | 1,000,000 | 1,001,709 | ||||||
| 2.000%, 05/01/2033 | 800,000 | 819,682 | ||||||
| 3.000%, 05/01/2030 | 450,000 | 464,464 | ||||||
| 4.000%, 03/01/2028 | 610,000 | 653,848 | ||||||
| Leavenworth County Unified School District No. 453, General Obligation Unlimited Bonds | ||||||||
| 4.000%, 09/01/2036 | 1,000,000 | 1,166,842 | ||||||
| Leavenworth County Unified School District No. 458, General Obligation Unlimited Bonds | ||||||||
| 5.000%, 09/01/2037 | 1,165,000 | 1,454,438 | ||||||
| 5.000%, 09/01/2038 | 1,000,000 | 1,248,444 | ||||||
| Leavenworth County Unified School District No. 464, General Obligation Unlimited Bonds | ||||||||
| 4.000%, 09/01/2034 | 675,000 | 769,102 | ||||||
| 4.000%, 09/01/2036 | 465,000 | 527,717 | ||||||
| Leavenworth County Unified School District No. 469, General Obligation Unlimited Bonds | ||||||||
| 4.000%, 09/01/2030 | 900,000 | 930,572 | ||||||
| Lyon County Unified School District No. 253 Emporia, General Obligation Unlimited Bonds | ||||||||
| 3.000%, 09/01/2044 | 1,000,000 | 1,056,794 | ||||||
| 4.000%, 09/01/2030 | 325,000 | 379,707 | ||||||
| Miami County Unified School District No. 416 Louisburg, General Obligation Unlimited Bonds | ||||||||
| 3.000%, 09/01/2035 | 500,000 | 543,606 | ||||||
| Montgomery County Unified School District No. 446 Independence, General Obligation Unlimited Bonds | ||||||||
| 5.000%, 09/01/2030 | 1,715,000 | 2,079,434 | ||||||
| Riley County Unified School District No. 378 Riley, General Obligation Unlimited Bonds | ||||||||
| 3.000%, 09/01/2039 | 925,000 | 969,147 | ||||||
| Riley County Unified School District No. 383 Manhattan-Ogden, General Obligation Unlimited Bonds | ||||||||
| 5.000%, 09/01/2028 | 1,220,000 | 1,469,814 | ||||||
| Saline County Unified School District No. 305 Salina, General Obligation Unlimited Bonds | ||||||||
| 4.000%, 09/01/2034 | 440,000 | 523,893 | ||||||
| Scott County Unified School District No. 466 Scott City, General Obligation Unlimited Bonds | ||||||||
| 4.000%, 09/01/2037 | 1,000,000 | 1,136,542 | ||||||
| Sedgwick County Unified School District No. 260 Derby, General Obligation Unlimited Bonds | ||||||||
| 3.500%, 10/01/2036 | 845,000 | 912,931 | ||||||
| 5.000%, 10/01/2029 | 340,000 | 356,439 | ||||||
| Sedgwick County Unified School District No. 262 Valley Center, General Obligation Unlimited Bonds | ||||||||
| 4.000%, 09/01/2030 | 500,000 | 552,914 | ||||||
| 5.000%, 09/01/2033 | 750,000 | 851,058 | ||||||
| Sedgwick County Unified School District No. 264 Clearwater, General Obligation Unlimited Bonds | ||||||||
| 4.000%, 09/01/2029 | 530,000 | 607,701 | ||||||
| Sedgwick County Unified School District No. 265 Goddard, General Obligation Unlimited Bonds | ||||||||
| 5.000%, 10/01/2024 | 370,000 | 421,040 | ||||||
| Sedgwick County Unified School District No. 266 Maize, General Obligation Unlimited Bonds | ||||||||
| 4.000%, 09/01/2032 | 750,000 | 871,147 | ||||||
| Sedgwick County Unified School District No. 267 Renwick, General Obligation Unlimited Bonds | ||||||||
| 4.000%, 11/01/2033 | 350,000 | 402,030 | ||||||
| 4.000%, 11/01/2034 | 425,000 | 487,557 | ||||||
| 4.000%, 11/01/2035 | 635,000 | 728,286 | ||||||
| Sedgwick County Unified School District No. 268 Cheney, General Obligation Unlimited Bonds | ||||||||
| 3.000%, 09/01/2029 | 615,000 | 645,126 | ||||||
| See Notes to Financial Statements. | |
| Annual Report | September 30, 2021 | 7 |
| Carret Kansas Tax-Exempt Bond Fund | Portfolio of Investments |
| September 30, 2021 |
| Principal Amount | Value (Note 2) | |||||||
| Education (continued) | ||||||||
| Seward County Unified School District No. 480 Liberal, General Obligation Unlimited Bonds | ||||||||
| 4.000%, 09/01/2028 | $ | 1,000,000 | $ | 1,162,726 | ||||
| 4.000%, 09/01/2032 | 500,000 | 570,632 | ||||||
| 5.000%, 09/01/2029 | 2,390,000 | 2,808,783 | ||||||
| Sumner County Unified School District No. 353 Wellington, General Obligation Unlimited Bonds | ||||||||
| 5.000%, 09/01/2026 | 230,000 | 250,832 | ||||||
| University of Kansas Hospital Authority, Revenue Bonds | ||||||||
| 5.000%, 09/01/2028 | 250,000 | 291,813 | ||||||
| 5.000%, 09/01/2030 | 350,000 | 407,507 | ||||||
| 5.000%, 09/01/2031 | 500,000 | 581,521 | ||||||
| Washburn University/Topeka, Revenue Bonds | ||||||||
| 4.000%, 07/01/2041 | 330,000 | 358,763 | ||||||
| 5.000%, 07/01/2035 | 500,000 | 569,018 | ||||||
| Wyandotte County Unified School District No. 202 Turner, General Obligation Unlimited Bonds | ||||||||
| 4.000%, 09/01/2038 | 1,225,000 | 1,365,117 | ||||||
| 4.000%, 09/01/2039 | 400,000 | 444,704 | ||||||
| Wyandotte County Unified School District No. 203 Piper, General Obligation Unlimited Bonds | ||||||||
| 5.000%, 09/01/2038 | 1,000,000 | 1,234,674 | ||||||
| Wyandotte County Unified School District No. 500 Kansas City, General Obligation Unlimited Bonds | ||||||||
| 5.000%, 09/01/2030 | 500,000 | 599,175 | ||||||
| Total Education | 85,545,050 | |||||||
| General Obligation (28.46%)(a) | ||||||||
| Abilene Public Building Commission, Revenue Bonds | ||||||||
| 4.000%, 12/01/2029 | 325,000 | 380,674 | ||||||
| 4.000%, 12/01/2031 | 445,000 | 513,289 | ||||||
| Ashland Public Building Commission, Revenue Bonds | ||||||||
| 5.000%, 09/01/2035 | 720,000 | 759,559 | ||||||
| City of Arkansas City, General Obligation Unlimited Bonds | ||||||||
| 2.000%, 08/01/2035 | 1,000,000 | 1,012,100 | ||||||
| City of Concordia, General Obligation Unlimited Bonds | ||||||||
| 2.000%, 11/01/2038 | 350,000 | 360,921 | ||||||
| 2.000%, 11/01/2039 | 355,000 | 364,108 | ||||||
| 2.000%, 11/01/2040 | 365,000 | 372,463 | ||||||
| City of Dodge City, Revenue Bonds | ||||||||
| 4.000%, 06/01/2024 | 230,000 | 251,544 | ||||||
| City of Garden City, General Obligation Unlimited Bonds | ||||||||
| 3.000%, 11/01/2028 | 950,000 | 1,059,964 | ||||||
| City of Haysville, Certificate Participation Bonds | ||||||||
| 4.125%, 11/01/2032 | 460,000 | 481,322 | ||||||
| City of Lawrence, General Obligation Unlimited Bonds | ||||||||
| 4.000%, 09/01/2030 | 470,000 | 539,710 | ||||||
| 4.000%, 09/01/2031 | 445,000 | 510,193 | ||||||
| City of Manhattan, General Obligation Unlimited Bonds | ||||||||
| 4.000%, 11/01/2031 | 400,000 | 483,983 | ||||||
| 5.000%, 11/01/2025 | 570,000 | 672,772 | ||||||
| 5.000%, 11/01/2029 | 800,000 | 1,037,212 | ||||||
| City of Merriam, General Obligation Unlimited Bonds | ||||||||
| 5.000%, 10/01/2027 | 1,670,000 | 2,086,008 | ||||||
| City of Olathe, General Obligation Unlimited Bonds | ||||||||
| 3.000%, 10/01/2033 | 1,000,000 | 1,117,206 | ||||||
| 4.000%, 10/01/2028 | 1,315,000 | 1,521,634 | ||||||
| City of Overland Park, General Obligation Unlimited Bonds | ||||||||
| 4.000%, 09/01/2030 | 2,230,000 | 2,767,386 | ||||||
| 4.000%, 09/01/2037 | 475,000 | 585,010 | ||||||
| 4.000%, 09/01/2038 | 475,000 | 582,917 | ||||||
| 4.000%, 09/01/2039 | 350,000 | 427,925 | ||||||
| See Notes to Financial Statements. |
| 8 |
| Carret Kansas Tax-Exempt Bond Fund | Portfolio of Investments |
| September 30, 2021 |
| Principal Amount | Value (Note 2) | |||||||
| General Obligation (continued) | ||||||||
| City of Park City, General Obligation Unlimited Bonds | ||||||||
| 5.375%, 12/01/2025 | $ | 5,000 | $ | 5,020 | ||||
| City of Salina, General Obligation Unlimited Bonds | ||||||||
| 3.000%, 10/01/2033 | 620,000 | 655,610 | ||||||
| 3.000%, 10/01/2036 | 680,000 | 714,850 | ||||||
| City of Shawnee, General Obligation Unlimited Bonds | ||||||||
| 4.000%, 12/01/2027 | 425,000 | 470,674 | ||||||
| City of Spring Hill, General Obligation Unlimited Bonds | ||||||||
| 4.000%, 09/01/2029 | 810,000 | 950,758 | ||||||
| City of Wichita, General Obligation Unlimited Bonds | ||||||||
| 2.000%, 06/01/2035 | 400,000 | 405,935 | ||||||
| 3.000%, 06/01/2029 | 515,000 | 575,941 | ||||||
| 3.000%, 10/01/2030 | 720,000 | 788,048 | ||||||
| 3.000%, 06/01/2032 | 1,000,000 | 1,114,851 | ||||||
| 4.000%, 12/01/2029 | 250,000 | 253,134 | ||||||
| 4.000%, 06/01/2030 | 820,000 | 952,682 | ||||||
| 5.000%, 12/01/2025 | 500,000 | 592,844 | ||||||
| County of Clay, General Obligation Unlimited Bonds | ||||||||
| 4.000%, 10/01/2036 | 750,000 | 831,399 | ||||||
| County of Geary, General Obligation Unlimited Bonds | ||||||||
| 4.000%, 09/01/2030 | 415,000 | 472,695 | ||||||
| County of Johnson, General Obligation Unlimited Bonds | ||||||||
| 3.000%, 09/01/2030 | 400,000 | 410,344 | ||||||
| 4.000%, 09/01/2028 | 1,125,000 | 1,272,358 | ||||||
| County of Linn, General Obligation Unlimited Bonds | ||||||||
| 4.000%, 07/01/2032 | 505,000 | 597,110 | ||||||
| County of Saline, General Obligation Unlimited Bonds | ||||||||
| 4.000%, 09/01/2029 | 765,000 | 934,088 | ||||||
| Johnson County Public Building Commission, Revenue Bonds | ||||||||
| 4.000%, 09/01/2029 | 650,000 | 745,294 | ||||||
| 4.000%, 09/01/2030 | 500,000 | 571,572 | ||||||
| 4.000%, 09/01/2031 | 1,500,000 | 1,711,234 | ||||||
| Kansas Development Finance Authority, Revenue Bonds | ||||||||
| 2.000%, 11/01/2033 | 950,000 | 966,004 | ||||||
| 2.000%, 11/01/2034 | 975,000 | 984,707 | ||||||
| 4.000%, 11/01/2030 | 800,000 | 933,529 | ||||||
| 4.000%, 11/01/2031 | 1,100,000 | 1,279,405 | ||||||
| 5.000%, 04/01/2026 | 1,485,000 | 1,588,562 | ||||||
| 5.000%, 09/01/2026 | 630,000 | 759,172 | ||||||
| 5.000%, 04/01/2030 | 655,000 | 698,958 | ||||||
| 5.000%, 04/01/2034 | 2,000,000 | 2,132,820 | ||||||
| Overland Park Transportation Development District, Revenue Bonds | ||||||||
| 5.900%, 04/01/2032 | 725,000 | 725,283 | ||||||
| Saline County Public Building Commission, Revenue Bonds | ||||||||
| 2.000%, 09/01/2033 | 200,000 | 202,871 | ||||||
| 2.000%, 09/01/2034 | 225,000 | 227,127 | ||||||
| 2.000%, 09/01/2035 | 220,000 | 220,585 | ||||||
| Unified Government of Greeley County, General Obligation Unlimited Bonds | ||||||||
| 4.000%, 12/01/2029 | 250,000 | 286,075 | ||||||
| 4.000%, 12/01/2032 | 100,000 | 114,430 | ||||||
| Wyandotte County-Kansas City Unified Government, General Obligation Unlimited Bonds | ||||||||
| 2.000%, 08/01/2033 | 1,000,000 | 1,017,015 | ||||||
| 4.000%, 08/01/2029 | 685,000 | 801,104 | ||||||
| 4.000%, 08/01/2030 | 2,105,000 | 2,484,760 | ||||||
| 4.000%, 08/01/2031 | 930,000 | 956,105 | ||||||
| 4.000%, 08/01/2032 | 1,000,000 | 1,192,915 | ||||||
| 5.000%, 08/01/2025 | 815,000 | 953,583 | ||||||
| See Notes to Financial Statements. | |
| Annual Report | September 30, 2021 | 9 |
| Carret Kansas Tax-Exempt Bond Fund | Portfolio of Investments |
| September 30, 2021 |
| Principal Amount | Value (Note 2) | |||||||
| General Obligation (continued) | ||||||||
| Wyandotte County-Kansas City Unified Government, Revenue Bonds | ||||||||
| 4.875%, 10/01/2028 | $ | 330,000 | $ | 330,067 | ||||
| 5.000%, 12/01/2023 | 570,000 | 618,839 | ||||||
| Total General Obligation | 52,388,257 | |||||||
| Health Care (3.37%) | ||||||||
| City of Manhattan, Revenue Bonds | ||||||||
| 5.000%, 11/15/2029 | 680,000 | 716,061 | ||||||
| City of Olathe, Revenue Bonds | ||||||||
| 4.000%, 09/01/2030 | 295,000 | 295,508 | ||||||
| City of Wichita, Revenue Bonds | ||||||||
| 5.000%, 11/15/2029 | 1,570,000 | 1,578,574 | ||||||
| Kansas Development Finance Authority, Revenue Bonds | ||||||||
| 5.000%, 11/15/2032 | 1,500,000 | 1,543,670 | ||||||
| 5.000%, 11/15/2034 | 350,000 | 360,079 | ||||||
| Lyon County Public Building Commission, Revenue Bonds | ||||||||
| 5.000%, 12/01/2035 | 1,335,000 | 1,561,963 | ||||||
| Pawnee County Public Building Commission, Revenue Bonds | ||||||||
| 4.000%, 02/15/2031 | 145,000 | 146,448 | ||||||
| Total Health Care | 6,202,303 | |||||||
| Public Services (1.02%) | ||||||||
| Johnson County Park & Recreation District, Certificate Participation Bonds | ||||||||
| 3.000%, 09/01/2028 | 1,165,000 | 1,289,610 | ||||||
| 3.000%, 09/01/2029 | 535,000 | 588,584 | ||||||
| Total Public Services | 1,878,194 | |||||||
| Transportation (10.01%) | ||||||||
| Kansas Turnpike Authority, Revenue Bonds | ||||||||
| 5.000%, 09/01/2031 | 630,000 | 813,461 | ||||||
| 5.000%, 09/01/2032 | 500,000 | 644,548 | ||||||
| 5.000%, 09/01/2036 | 1,000,000 | 1,277,341 | ||||||
| 5.000%, 09/01/2037 | 1,000,000 | 1,273,888 | ||||||
| 5.000%, 09/01/2038 | 1,150,000 | 1,461,726 | ||||||
| State of Kansas Department of Transportation, Revenue Bonds | ||||||||
| 5.000%, 09/01/2028 | 1,500,000 | 1,864,442 | ||||||
| 5.000%, 09/01/2029 | 1,000,000 | 1,167,310 | ||||||
| 5.000%, 09/01/2031 | 3,020,000 | 3,717,429 | ||||||
| 5.000%, 09/01/2032 | 500,000 | 614,043 | ||||||
| 5.000%, 09/01/2033 | 1,445,000 | 1,683,631 | ||||||
| 5.000%, 09/01/2034 | 3,260,000 | 3,908,943 | ||||||
| Total Transportation | 18,426,762 | |||||||
| Utilities (9.42%) | ||||||||
| City of Lawrence Water & Sewage System, Revenue Bonds | ||||||||
| 4.000%, 11/01/2038 | 1,000,000 | 1,110,969 | ||||||
| City of McPherson Water System, Revenue Bonds | ||||||||
| 2.000%, 10/01/2038 | 440,000 | 438,658 | ||||||
| City of Olathe Water & Sewer System, Revenue Bonds | ||||||||
| 2.000%, 07/01/2034 | 540,000 | 549,720 | ||||||
| 2.000%, 07/01/2035 | 550,000 | 557,135 | ||||||
| 3.000%, 07/01/2030 | 675,000 | 739,222 | ||||||
| 3.000%, 07/01/2031 | 555,000 | 604,186 | ||||||
| 3.000%, 07/01/2032 | 745,000 | 806,852 | ||||||
| 3.000%, 07/01/2033 | 755,000 | 815,745 | ||||||
| 4.000%, 07/01/2024 | 250,000 | 270,660 | ||||||
| See Notes to Financial Statements. |
| 10 |
| Carret Kansas Tax-Exempt Bond Fund | Portfolio of Investments |
| September 30, 2021 |
| Principal Amount | Value (Note 2) | |||||||
| Utilities (continued) | ||||||||
| City of Topeka Combined Utility, Revenue Bonds | ||||||||
| 2.000%, 08/01/2043 | $ | 1,070,000 | $ | 1,003,489 | ||||
| City of Wichita Water & Sewer Utility, Revenue Bonds | ||||||||
| 3.000%, 10/01/2029 | 1,180,000 | 1,292,451 | ||||||
| 3.375%, 10/01/2039 | 1,000,000 | 1,100,086 | ||||||
| 5.000%, 10/01/2025 | 1,000,000 | 1,000,000 | ||||||
| 5.000%, 10/01/2028 | 2,650,000 | 2,650,000 | ||||||
| Kansas Power Pool, Revenue Bonds | ||||||||
| 5.000%, 12/01/2023 | 200,000 | 211,125 | ||||||
| 5.000%, 12/01/2028 | 700,000 | 815,856 | ||||||
| Wyandotte County-Kansas City Unified Government Utility System, Revenue Bonds | ||||||||
| 3.000%, 09/01/2035 | 250,000 | 275,053 | ||||||
| 3.000%, 09/01/2040 | 250,000 | 270,201 | ||||||
| 5.000%, 09/01/2031 | 1,350,000 | 1,583,429 | ||||||
| 5.000%, 09/01/2032 | 1,090,000 | 1,137,762 | ||||||
| 5.000%, 09/01/2033 | 100,000 | 116,010 | ||||||
| Total Utilities | 17,348,609 | |||||||
| TOTAL MUNICIPAL BONDS | ||||||||
| (Cost $173,328,563) | 181,789,175 | |||||||
| Shares | Value (Note 2) | |||||||
| SHORT TERM INVESTMENTS (4.12%) | ||||||||
| Money Market Fund (4.12%) | ||||||||
| First American Treasury Obligations Fund (0.010%, 7-Day Yield) | 7,574,040 | $ | 7,574,040 | |||||
| Total Money Market Fund | 7,574,040 | |||||||
| TOTAL SHORT TERM INVESTMENTS | ||||||||
| (Cost $7,574,040) | 7,574,040 | |||||||
| TOTAL INVESTMENTS (102.88%) | ||||||||
| (Cost $180,902,603) | $ | 189,363,215 | ||||||
| LIABILITIES IN EXCESS OF OTHER ASSETS (-2.88%) | (5,297,452 | ) | ||||||
| NET ASSETS (100.00%) | $ | 184,065,763 | ||||||
| (a) | To the extent the Fund invests more heavily in particular sectors of the economy, its performance will be especially sensitive to developments that significantly affect those sectors. When sector categorization is broken down by industry, no industry exceeds the 25% maximum specified in the Statement of Additional Information. |
| See Notes to Financial Statements. | |
| Annual Report | September 30, 2021 | 11 |
| Carret Kansas Tax-Exempt Bond Fund | Statement of Assets and Liabilities |
| September 30, 2021 |
| ASSETS: | ||||
| Investments, at value (Cost $180,902,603) | $ | 189,363,215 | ||
| Receivable for investments sold | 1,240 | |||
| Receivable for shares sold | 92,205 | |||
| Dividends and interest receivable | 1,309,419 | |||
| Other assets | 21,011 | |||
| Total Assets | 190,787,090 | |||
| LIABILITIES: | ||||
| Distributions payable | 267,785 | |||
| Payable for administration and transfer agent fees | 49,313 | |||
| Payable for investments purchased | 6,325,902 | |||
| Payable for shares redeemed | 5,150 | |||
| Payable to adviser | 38,627 | |||
| Payable for distribution fees | 788 | |||
| Payable for printing fees | 3,158 | |||
| Payable for professional fees | 15,654 | |||
| Payable for trustees' fees and expenses | 3,843 | |||
| Payable to Chief Compliance Officer fees | 3,034 | |||
| Accrued expenses and other liabilities | 8,073 | |||
| Total Liabilities | 6,721,327 | |||
| NET ASSETS | $ | 184,065,763 | ||
| NET ASSETS CONSIST OF: | ||||
| Paid-in capital (Note 5) | $ | 175,378,139 | ||
| Total distributable earnings | 8,687,624 | |||
| NET ASSETS | $ | 184,065,763 | ||
| PRICING OF SHARES | ||||
| Institutional Class: | ||||
| Net Asset Value, offering and redemption price per share | $ | 11.10 | ||
| Net Assets | $ | 180,252,961 | ||
| Shares of beneficial interest outstanding | 16,236,780 | |||
| Class A : | ||||
| Net Asset Value, offering and redemption price per share | $ | 11.10 | ||
| Net Assets | $ | 3,812,802 | ||
| Shares of beneficial interest outstanding | 343,405 | |||
| Maximum offering price per share(a) | $ | 11.60 | ||
| (a) | Net Asset Value/100% minus maximum sales charge of net asset value, 4.25% for the Fund, adjusted to the nearest cent. |
| See Notes to Financial Statements. |
| 12 |
| Carret Kansas Tax-Exempt Bond Fund | Statement of Operations |
| For the Year Ended September 30, 2021 |
| INVESTMENT INCOME: | ||||
| Dividends | $ | 414 | ||
| Interest | 4,311,932 | |||
| Total Investment Income | 4,312,346 | |||
| EXPENSES: | ||||
| Investment advisory fees (Note 6) | 560,871 | |||
| Administration fees | 263,883 | |||
| Distribution fees | ||||
| Class A | 10,166 | |||
| Custody fees | 13,595 | |||
| Legal fees | 13,313 | |||
| Audit and tax fees | 17,744 | |||
| Transfer agent fees | 56,671 | |||
| Trustees' fees and expenses | 20,456 | |||
| Registration and filing fees | 36,711 | |||
| Printing fees | 7,839 | |||
| Chief Compliance Officer fees | 36,022 | |||
| Insurance fees | 7,046 | |||
| Other expenses | 10,846 | |||
| Total Expenses | 1,055,163 | |||
| Less fees waived/reimbursed by investment adviser (Note 6) | ||||
| Institutional Class | (141,747 | ) | ||
| Class A | (5,803 | ) | ||
| Total fees waived/reimbursed by investment adviser | (147,550 | ) | ||
| Net Expenses | 907,613 | |||
| NET INVESTMENT INCOME | 3,404,733 | |||
| REALIZED AND UNREALIZED GAIN/(LOSS) ON INVESTMENTS: | ||||
| Net realized gain/(loss) on: | ||||
| Investments | 145,848 | |||
| Net realized gain | 145,848 | |||
| Change in unrealized appreciation/(depreciation) on: | ||||
| Investments | (1,133,686 | ) | ||
| Net change | (1,133,686 | ) | ||
| NET REALIZED AND UNREALIZED LOSS ON INVESTMENTS | (987,838 | ) | ||
| NET INCREASE IN NET ASSETS RESULTING FROM OPERATIONS | $ | 2,416,895 | ||
| See Notes to Financial Statements. | |
| Annual Report | September 30, 2021 | 13 |
| Carret Kansas Tax-Exempt Bond Fund | Statements of Changes in Net Assets |
| For the Year Ended September 30, 2021 | For the Year Ended September 30, 2020 | |||||||
| OPERATIONS: | ||||||||
| Net investment income | $ | 3,404,733 | $ | 3,920,096 | ||||
| Net realized gain on investments | 145,848 | 14,257 | ||||||
| Net change in unrealized appreciation/(depreciation) on investments | (1,133,686 | ) | 3,225,657 | |||||
| Net increase in net assets resulting from operations | 2,416,895 | 7,160,010 | ||||||
| DISTRIBUTIONS TO SHAREHOLDERS | ||||||||
| Institutional Class | (3,345,813 | ) | (4,208,978 | ) | ||||
| Class A | (64,242 | ) | (91,196 | ) | ||||
| Total distributions | (3,410,055 | ) | (4,300,174 | ) | ||||
| BENEFICIAL SHARE TRANSACTIONS (Note 5): | ||||||||
| Institutional Class | ||||||||
| Shares sold | 26,301,217 | 28,276,279 | ||||||
| Dividends reinvested | 158,569 | 428,853 | ||||||
| Shares redeemed | (24,058,508 | ) | (32,071,924 | ) | ||||
| Net increase/(decrease) from beneficial share transactions | 2,401,278 | (3,366,792 | ) | |||||
| Class A | ||||||||
| Shares sold | 31,729 | 288,378 | ||||||
| Dividends reinvested | 50,632 | 72,657 | ||||||
| Shares redeemed | (504,900 | ) | (328,033 | ) | ||||
| Net increase/(decrease) from beneficial share transactions | (422,539 | ) | 33,002 | |||||
| Net increase/(decrease) in net assets | 985,579 | (473,954 | ) | |||||
| NET ASSETS: | ||||||||
| Beginning of year | 183,080,184 | 183,554,138 | ||||||
| End of year | $ | 184,065,763 | $ | 183,080,184 | ||||
| See Notes to Financial Statements. |
| 14 |
| Carret Kansas Tax-Exempt Bond Fund | Financial Highlights |
| Institutional Class | For a Share Outstanding Throughout the Periods Presented |
| For the Year Ended September 30, 2021 | For the Year Ended September 30, 2020 | For the Year Ended September 30, 2019 | For the Period Ended September 30, 2018(a) | For the Year Ended October 31, 2017 | For the Year Ended October 31, 2016 | |||||||||||||||||||
| NET ASSET VALUE, BEGINNING OF PERIOD | $ | 11.16 | $ | 10.97 | $ | 10.59 | $ | 10.88 | $ | 11.09 | $ | 11.11 | ||||||||||||
| INCOME/(LOSS) FROM OPERATIONS: | ||||||||||||||||||||||||
| Net investment income(b) | 0.20 | 0.24 | 0.28 | 0.27 | 0.32 | 0.33 | ||||||||||||||||||
| Net realized and unrealized gain/(loss) on investments | (0.06 | ) | 0.21 | 0.42 | (0.29 | ) | (0.21 | ) | (0.02 | ) | ||||||||||||||
| Total from investment operations | 0.14 | 0.45 | 0.70 | (0.02 | ) | 0.11 | 0.31 | |||||||||||||||||
| LESS DISTRIBUTIONS: | ||||||||||||||||||||||||
| From net investment income | (0.20 | ) | (0.24 | ) | (0.28 | ) | (0.27 | ) | (0.32 | ) | (0.33 | ) | ||||||||||||
| From net realized gains on investments | 0.00 | (c) | (0.02 | ) | (0.04 | ) | – | – | – | |||||||||||||||
| Total Distributions | (0.20 | ) | (0.26 | ) | (0.32 | ) | (0.27 | ) | (0.32 | ) | (0.33 | ) | ||||||||||||
| NET INCREASE/(DECREASE) IN NET ASSET VALUE | (0.06 | ) | 0.19 | 0.38 | (0.29 | ) | (0.21 | ) | (0.02 | ) | ||||||||||||||
| NET ASSET VALUE, END OF PERIOD | $ | 11.10 | $ | 11.16 | $ | 10.97 | $ | 10.59 | $ | 10.88 | $ | 11.09 | ||||||||||||
| TOTAL RETURN(d) | 1.30 | % | 4.17 | % | 6.77 | % | (0.15 | )% | 1.04 | % | 2.80 | % | ||||||||||||
| SUPPLEMENTAL DATA: | ||||||||||||||||||||||||
| Net assets, end of period (in 000s) | $ | 180,253 | $ | 178,827 | $ | 179,409 | $ | 133,235 | $ | 167,374 | $ | 190,780 | ||||||||||||
| RATIOS TO AVERAGE NET ASSETS | ||||||||||||||||||||||||
| Operating expenses excluding reimbursement/waiver | 0.56 | % | 0.57 | % | 0.55 | % | 0.75 | %(e) | 0.61 | % | 0.60 | % | ||||||||||||
| Operating expenses including reimbursement/waiver | 0.48 | % | 0.48 | % | 0.48 | % | 0.56 | %(e) | 0.48 | % | 0.48 | % | ||||||||||||
| Net investment income including reimbursement/waiver | 1.83 | % | 2.17 | % | 2.62 | % | 2.80 | %(e) | 2.95 | % | 2.94 | % | ||||||||||||
| PORTFOLIO TURNOVER RATE(f) | 8 | % | 16 | % | 12 | % | 14 | % | 9 | % | 10 | % | ||||||||||||
| (a) | Effective September 24, 2018, the Carret Kansas Tax-Exempt Bond Fund merged with and into a clone series of ALPS Series Trust. In connection with the merger, the fiscal year-end changed from October 31 to September 30. |
| (b) | Per share amounts are based upon average shares outstanding, unless otherwise noted. |
| (c) | Less than $0.005 per share. |
| (d) | Assumes an initial investment on the business day before the first day of the fiscal period, with all dividends and distributions reinvested in additional shares on the reinvestment date, and redemption at the net asset value calculated on the last business day of the fiscal period. Total returns are for the period indicated and have not been annualized. Total returns would have been lower had certain expenses not been waived during the period. Returns shown do not reflect the deduction of taxes that a shareholder would pay on Fund distributions or the redemption of Fund shares. |
| (e) | Annualized. |
| (f) | Portfolio turnover rate for periods less than one full year have not been annualized. |
| See Notes to Financial Statements. | |
| Annual Report | September 30, 2021 | 15 |
| Carret Kansas Tax-Exempt Bond Fund | Financial Highlights |
| Class A | For a Share Outstanding Throughout the Periods Presented |
| For the Year Ended September 30, 2021 | For the Year Ended September 30, 2020 | For the Year Ended September 30, 2019 | For the Period Ended September 30, 2018(a)(b) | For the Year Ended October 31, 2017 | For the Year Ended October 31, 2016 | |||||||||||||||||||
| NET ASSET VALUE, BEGINNING OF PERIOD | $ | 11.16 | $ | 10.97 | $ | 10.59 | $ | 10.88 | $ | 11.09 | $ | 11.11 | ||||||||||||
| INCOME/(LOSS) FROM OPERATIONS: | ||||||||||||||||||||||||
| Net investment income(c) | 0.18 | 0.21 | 0.26 | 0.24 | 0.28 | 0.29 | ||||||||||||||||||
| Net realized and unrealized gain/(loss) on investments | (0.06 | ) | 0.21 | 0.42 | (0.29 | ) | (0.21 | ) | (0.02 | ) | ||||||||||||||
| Total from investment operations | 0.12 | 0.42 | 0.68 | (0.05 | ) | 0.07 | 0.27 | |||||||||||||||||
| LESS DISTRIBUTIONS: | ||||||||||||||||||||||||
| From net investment income | (0.18 | ) | (0.21 | ) | (0.26 | ) | (0.24 | ) | (0.28 | ) | (0.29 | ) | ||||||||||||
| From net realized gains on investments | 0.00 | (d) | (0.02 | ) | (0.04 | ) | – | – | – | |||||||||||||||
| Total Distributions | (0.18 | ) | (0.23 | ) | (0.30 | ) | (0.24 | ) | (0.28 | ) | (0.29 | ) | ||||||||||||
| NET INCREASE/(DECREASE) IN NET ASSET VALUE | (0.06 | ) | 0.19 | 0.38 | (0.29 | ) | (0.21 | ) | (0.02 | ) | ||||||||||||||
| NET ASSET VALUE, END OF PERIOD | $ | 11.10 | $ | 11.16 | $ | 10.97 | $ | 10.59 | $ | 10.88 | $ | 11.09 | ||||||||||||
| TOTAL RETURN(e) | 1.05 | % | 3.91 | % | 6.50 | % | (0.51 | )% | 0.65 | % | 2.41 | % | ||||||||||||
| SUPPLEMENTAL DATA: | ||||||||||||||||||||||||
| Net assets, end of period (in 000s) | $ | 3,813 | $ | 4,253 | $ | 4,145 | $ | 4,748 | $ | 11,462 | $ | 11,509 | ||||||||||||
| RATIOS TO AVERAGE NET ASSETS | ||||||||||||||||||||||||
| Operating expenses excluding reimbursement/waiver | 0.87 | % | 0.86 | % | 0.88 | % | 1.25 | %(f) | 1.11 | % | 1.10 | % | ||||||||||||
| Operating expenses including reimbursement/waiver | 0.73 | % | 0.73 | % | 0.73 | % | 0.94 | %(f) | 0.87 | % | 0.87 | % | ||||||||||||
| Net investment income including reimbursement/waiver | 1.58 | % | 1.92 | % | 2.40 | % | 2.43 | %(f) | 2.56 | % | 2.55 | % | ||||||||||||
| PORTFOLIO TURNOVER RATE(g) | 8 | % | 16 | % | 12 | % | 14 | % | 9 | % | 10 | % | ||||||||||||
| (a) | Effective September 24, 2018, the Carret Kansas Tax-Exempt Bond Fund merged with and into a clone series of ALPS Series Trust. In connection with the merger, the fiscal year-end changed from October 31 to September 30. |
| (b) | Class C shares were merged into Class A on September 24, 2018. The amounts presented represent the results of the Class A shares for the periods prior to the merger and the results of the combined share class for the period subsequent to the merger. |
| (c) | Per share amounts are based upon average shares outstanding, unless otherwise noted. |
| (d) | Less than $0.005 per share. |
| (e) | Assumes an initial investment on the business day before the first day of the fiscal period, with all dividends and distributions reinvested in additional shares on the reinvestment date, and redemption at the net asset value calculated on the last business day of the fiscal period. Total returns are for the period indicated and have not been annualized. Total returns would have been lower had certain expenses not been waived during the period. Returns shown do not reflect the deduction of taxes that a shareholder would pay on Fund distributions or the redemption of Fund shares. |
| (f) | Annualized. |
| (g) | Portfolio turnover rate for periods less than one full year have not been annualized. |
| See Notes to Financial Statements. |
| 16 |
| Carret Kansas Tax-Exempt Bond Fund | Notes to Financial Statements |
| September 30, 2021 |
1. ORGANIZATION
ALPS Series Trust (the “Trust”), a Delaware statutory trust, is an open-end management investment company registered under the Investment Company Act of 1940, as amended (“1940 Act”). The Trust consists of multiple separate portfolios or series. This annual report describes the Carret Kansas Tax-Exempt Bond Fund (the “Fund” or “Kansas Tax-Exempt Bond Fund”) formally known as the American Independence Kansas Tax-Exempt Bond Fund. On September 13, 2019, Carret Asset Management, LLC (the “Adviser” or “Carret") became the adviser to the Kansas Tax-Exempt Bond Fund, changing the Fund’s name from American Independence to Carret. The Fund’s investment objective is to preserve capital while producing current income for the investor that is exempt from both federal and Kansas state income taxes. The Fund is considered non-diversified and may invest a greater portion of assets in securities of individual issuers than a diversified fund. As a result, changes in the market value of a single investment could cause greater fluctuations in share price than would occur in a diversified fund. The Fund currently offers Institutional Class Shares and Class A Shares. Each share class has identical rights to earnings, assets and voting privileges, except for class specific expenses and exclusive rights to vote on matters affecting only individual classes. The Board of Trustees (the “Board”) may establish additional funds and classes of shares at any time in the future without shareholder approval.
2. SIGNIFICANT ACCOUNTING POLICIES
The accompanying financial statements were prepared in accordance with accounting principles generally accepted in the United States of America for investment companies (“U.S. GAAP”). The Fund is considered an investment company under U.S. GAAP and follows the accounting and reporting guidance applicable to investment companies in the Financial Accounting Standards Board (“FASB”) Accounting Standards Codification Topic 946. The preparation of financial statements in conformity with U.S. GAAP requires management to make certain estimates and assumptions that affect the reported amounts of assets and liabilities and disclosures of contingent assets and liabilities at the date of the financial statements and the reported amounts of increases and decreases in net assets from operations during the period. Actual results could differ from those estimates. The following is a summary of significant accounting policies consistently followed by the Fund in preparation of its financial statements.
Investment Valuation: The Fund generally values its securities based on market prices determined at the close of regular trading on the New York Stock Exchange (“NYSE”), normally 4:00 p.m. Eastern Time, on each day the NYSE is open for trading.
The market price for debt obligations is generally the price supplied by an independent third-party pricing service approved by the Board, which may use a matrix, formula or other objective method that takes into consideration quotations from dealers, market transactions in comparable investments, market indices and yield curves. If vendors are unable to supply a price, or if the price supplied is deemed to be unreliable, the market price may be determined using quotations received from one or more broker-dealers that make a market in the security.
Redeemable securities issued by open-end registered investment companies are valued at the investment company’s applicable net asset value (“NAV”). Money market funds, representing short-term investments, are valued at their NAV.
When such prices or quotations are not available, or when the Fair Value Committee appointed by the Board believes that they are unreliable, securities may be priced using fair value procedures approved by the Board.
Fair Value Measurements: The Fund discloses the classification of its fair value measurements following a three-tier hierarchy based on the inputs used to measure fair value. Inputs refer broadly to the assumptions that market participants would use in pricing the asset or liability, including assumptions about risk. Inputs may be observable or unobservable. Observable inputs reflect the assumptions market participants would use in pricing the asset or liability that are developed based on market data obtained from sources independent of the reporting entity. Unobservable inputs reflect the reporting entity’s own assumptions about the assumptions market participants would use in pricing the asset or liability that are developed based on the best information available.
| Annual Report | September 30, 2021 | 17 |
| Carret Kansas Tax-Exempt Bond Fund | Notes to Financial Statements |
| September 30, 2021 |
Various inputs are used in determining the value of the Fund’s investments as of the end of the reporting period. When inputs used fall into different levels of the fair value hierarchy, the level in the hierarchy within which the fair value measurement falls is determined based on the lowest level input that is significant to the fair value measurement in its entirety. The designated input levels are not necessarily an indication of the risk or liquidity associated with these investments. These inputs are categorized in the following hierarchy under applicable financial accounting standards:
| Level 1 – | Unadjusted quoted prices in active markets for identical investments, unrestricted assets or liabilities that the Fund has the ability to access at the measurement date; |
| Level 2 – | Quoted prices which are not active, quoted prices for similar assets or liabilities in active markets or inputs other than quoted prices that are observable (either directly or indirectly); and |
| Level 3 – | Significant unobservable prices or inputs (including the Fund’s own assumptions in determining the fair value of investments) where there is little or no market activity for the asset or liability at the measurement date. |
The following is a summary of the inputs used to value the Fund’s investments as of September 30, 2021:
| Investments in Securities at Value* | Level 1 - Quoted and Unadjusted Prices | Level 2 - Other Significant Observable Inputs | Level 3 - Significant Unobservable Inputs | Total | ||||||||||||
| Municipal Bonds | $ | – | $ | 181,789,175 | $ | – | $ | 181,789,175 | ||||||||
| Short Term Investments | 7,574,040 | – | – | 7,574,040 | ||||||||||||
| Total | $ | 7,574,040 | $ | 181,789,175 | $ | – | $ | 189,363,215 | ||||||||
| * | For a detailed Sector breakdown, see the accompanying Portfolio of Investments. |
There were no Level 3 securities held in the Fund at September 30, 2021.
Securities Purchased on a When-Issued Basis: The Fund may purchase securities on a “when-issued” basis. When-issued securities are securities purchased for delivery beyond the normal settlement date at a stated price and/or yield, thereby involving the risk that the price and/or yield obtained may be more or less than those available in the market when delivery takes place. At the time the Fund makes the commitment to purchase a security on a when-issued basis, the Fund records the transaction and reflects the value of the security in determining net asset value. Normally, the settlement date occurs within one month of the purchase. No payment is made by the Fund and no interest accrues to the Fund during the period between purchase and settlement.
Cash & Cash Equivalents: The Fund considers its investment in a Federal Deposit Insurance Corporation ("FDIC") insured interest bearing account to be cash and cash equivalents. Cash and cash equivalents are valued at cost plus any accrued interest. The Fund maintains cash balances, which, at times may exceed federally insured limits. The Fund maintains these balances with a high-quality financial institution.
Concentration of Credit Risk: The Fund places its cash with a banking institution, which is insured by FDIC. The FDIC limit is $250,000. At various times throughout the year, the amount on deposit may exceed the FDIC limit and subject the Fund to a credit risk. The Fund does not believe that such deposits are subject to any unusual risk associated with investment activities.
The Fund invests primarily in debt obligations issued by the State of Kansas and its respective political subdivisions, agencies and public authorities. The Fund is more susceptible to economic and political factors adversely affecting issuers of Kansas specific municipal securities than are municipal bond funds that are not concentrated in these issuers to the same extent.
Trust Expenses: Some expenses of the Trust can be directly attributed to a fund. Expenses that cannot be directly attributed to a fund are apportioned among all funds in the Trust based on average net assets of each fund, including Trustees’ fees and expenses.
Fund Expenses: Some expenses can be directly attributed to the Fund and are apportioned among the classes based on average net assets of each class.
Class Expenses: Expenses that are specific to a class of shares are charged directly to that share class. Fees provided under the distribution (Rule 12b-1) and/or shareholder service plans for a particular class of each Fund are charged to the operations of such class.
| 18 |
| Carret Kansas Tax-Exempt Bond Fund | Notes to Financial Statements |
| September 30, 2021 |
Federal Income Taxes: The Fund complies with the requirements under Subchapter M of the Internal Revenue Code of 1986, as amended, applicable to regulated investment companies and intends to distribute substantially all of its net taxable income and net capital gains, if any, each year so that it will not be subject to excise tax on undistributed income and gains. The Fund is not subject to income taxes to the extent such distributions are made.
As of and during the year ended September 30, 2021, the Fund did not have a liability for any unrecognized tax benefits in the accompanying financial statements. The Fund recognizes interest and penalties, if any, related to tax liabilities as income tax expense in the Statement of Operations. The Fund files U.S. federal, state and local income tax returns as required. The Fund’s tax returns are subject to examination by the relevant tax authorities until expiration of the applicable statute of limitations, which is generally three years after the filing of the tax return for federal purposes and four years for most state returns. The Fund’s administrator has analyzed the Fund’s tax positions taken on federal and state income tax returns for all open tax years and has concluded that as of September 30, 2021, no provision for income tax is required in the Fund’s financial statements related to these tax positions.
Investment Transactions and Investment Income: Investment transactions are accounted for on the date the investments are purchased or sold (trade date basis for financial reporting purposes). Realized gains and losses from investment transactions are reported on an identified cost basis. Interest income, which includes accretion of discounts and amortization of premiums, is accrued and recorded as earned based on the effective yield method. Dividend income is recognized on the ex-dividend date. All of the realized and unrealized gains and losses and net investment income are allocated daily to each class in proportion to its average daily net assets.
Distributions to Shareholders: Distributions from net investment income for the Fund are declared daily and paid monthly. Distributions from net realized capital gains, if any, are distributed at least annually. Income dividend distributions are derived from interest and other income the Fund receives from its investments, including short-term capital gains. Long-term capital gain distributions are derived from gains realized when the Fund sells a security it has owned for more than one year. A Fund may make additional distributions and dividends at other times if its investment adviser has determined that so may be necessary for the Fund to avoid or reduce taxes. Net investment income/(loss) and net realized gain/(loss) may differ for financial statement and tax purposes.
COVID-19 Risk: An outbreak of respiratory disease caused by a novel coronavirus was first detected in December 2019 and has now spread internationally. This coronavirus has resulted in closing borders, enhanced health screenings, partial population vaccination, healthcare service preparation and delivery, quarantines, cancellations, disruptions to supply chains and customer activity, government sponsored fiscal stimulus programs, various moratoria on the applicability of certain laws and regulations, as well as general concern and uncertainty. The impact of this coronavirus, (and the variants of such virus) and other epidemics and pandemics that may arise in the future, could affect the economies of many nations, individual companies, their securities (including equity and debt), and the market in general in ways that cannot necessarily be foreseen at the present time. In addition, the impact of infectious diseases in developing or emerging market countries may be greater due to less established health care systems. Health crises caused by the recent coronavirus outbreak may exacerbate other pre-existing political, social, financial, and economic risks in certain countries. The impact of the outbreak may last for an extended period of time.
3. TAX BASIS INFORMATION
Tax Basis of Distributions to Shareholders: The character of distributions made during the period from net investment income or net realized gains may differ from its ultimate characterization for federal income tax purposes. Also, due to the timing of dividend distributions, the fiscal year in which amounts are distributed may differ from the fiscal year in which the income or realized gain were recorded by the Fund. The amounts and characteristics of tax basis distributions are estimated at the time of distribution and composition of distributable earnings/(accumulated losses) are finalized at fiscal year-end.
The tax character of distributions paid by the Fund for the fiscal years ended September 30, 2021 and September 30, 2020, respectively were as follows:
| Ordinary Income | Tax-Exempt Income | Long-Term Capital Gains | ||||||||||
| Kansas Tax-Exempt Bond Fund | $ | 7,205 | $ | 3,396,986 | $ | 5,864 | ||||||
| Ordinary Income | Tax-Exempt Income | Long-Term Capital Gains | ||||||||||
| Kansas Tax-Exempt Bond Fund | $ | 47,931 | $ | 3,871,299 | $ | 380,944 | ||||||
| Annual Report | September 30, 2021 | 19 |
| Carret Kansas Tax-Exempt Bond Fund | Notes to Financial Statements |
| September 30, 2021 |
Unrealized Appreciation and Depreciation on Investments: As of September 30, 2021, the aggregate cost of investments, gross unrealized appreciation/(depreciation) and net unrealized appreciation for Federal tax purposes were as follows:
| Kansas Tax-Exempt Bond Fund | ||||
| Gross unrealized appreciation (excess of value over tax cost) | $ | 8,781,219 | ||
| Gross unrealized depreciation (excess of tax cost over value) | (320,607 | ) | ||
| Net appreciation (depreciation) of foreign currency and derivatives | – | |||
| Net unrealized appreciation | $ | 8,460,612 | ||
| Cost of investments for income tax purposes | $ | 180,902,603 | ||
Reclassifications: As of September 30, 2021, permanent differences in book and tax accounting were reclassified. The following reclassifications, which had no impact on results of operations or net assets, were recorded to reflect tax character:
| Paid-in Capital | Total Distributable Earnings | |||||||
| Kansas Tax-Exempt Bond Fund | $ | (94 | ) | $ | 94 | |||
Components of Distributable Earnings: At September 30, 2021, components of distributable earnings were as follows:
| Kansas Tax-Exempt Bond Fund | ||||
| Undistributed ordinary income | $ | 1,554 | ||
| Tax-Exempt Undistributed Income | 347,463 | |||
| Accumulated capital gains | 145,779 | |||
| Net unrealized appreciation | 8,460,612 | |||
| Other cumulative effect of timing differences(a) | (267,785 | ) | ||
| Total | $ | 8,687,623 | ||
(a) Related to distributions payable at year end.
4. SECURITIES TRANSACTIONS
Purchases and sales of securities, excluding short-term securities, during the year ended September 30, 2021, were as follows:
| Purchases of Securities | Proceeds from Sales of Securities | |||||||
| Kansas Tax-Exempt Bond Fund | $ | 22,301,123 | $ | 14,556,311 | ||||
5. BENEFICIAL SHARE TRANSACTIONS
The capitalization of the Trust consists of an unlimited number of shares of beneficial interest with no par value per share. Holders of the shares of the Fund have one vote for each share held and a proportionate fraction of a vote for each fractional share. All shares issued and outstanding are fully paid and are transferable and redeemable at the option of the shareholder. Shares have no pre-emptive rights. Neither the Fund nor any of their creditors have the right to require shareholders to pay any additional amounts solely because the shareholder owns the shares.
| 20 |
| Carret Kansas Tax-Exempt Bond Fund | Notes to Financial Statements |
| September 30, 2021 |
Transactions in common shares were as follows:
| For the Year Ended September 30, 2021 | For the Year Ended September 30, 2020 | |||||||
| Carret Kansas Tax-Exempt Bond Fund | ||||||||
| Institutional Class | ||||||||
| Shares sold | 2,350,154 | 2,553,184 | ||||||
| Shares issued in reinvestment of distributions to shareholders | 14,189 | 39,093 | ||||||
| Shares redeemed | (2,155,561 | ) | (2,923,375 | ) | ||||
| Net increase/(decrease) in shares outstanding | 208,782 | (331,098 | ) | |||||
| Class A | ||||||||
| Shares sold | 2,833 | 26,220 | ||||||
| Shares issued in reinvestment of distributions to shareholders | 4,531 | 6,578 | ||||||
| Shares redeemed | (45,094 | ) | (29,595 | ) | ||||
| Net increase/(decrease) in shares outstanding | (37,730 | ) | 3,203 | |||||
Control is defined by the 1940 Act as the beneficial ownership, either directly or through one or more controlled companies, of more than 25% of the voting securities of a company. Approximately 93% of the shares outstanding of the Fund are owned by one omnibus account.
6. MANAGEMENT AND RELATED PARTY TRANSACTIONS
Investment Advisory: Carret Asset Management, LLC, serves as the investment adviser to the Fund. The Adviser, subject to the authority of the Board, is responsible for the overall management and administration of the Fund’s business affairs. The Adviser manages the investments of the Fund in accordance with the Fund’s investment objective, policies and limitations, and investment guidelines established jointly by the Adviser and the Board.
Pursuant to the Investment Advisory Agreement (“Advisory Agreement”) with the Adviser, the Fund pays the Adviser an annual management fee of 0.30% based on the Fund’s average daily net assets. The management fee is paid on a monthly basis. The current term of the Advisory Agreement is one year. And the Board may extend the Advisory Agreement for additional one-year terms by approval at an in-person meeting called for the purpose of considering such matters. The Board and shareholders of the Fund may terminate the Advisory Agreement upon 60 days’ prior written notice. The Adviser may terminate the Advisory Agreement upon 120 days’ prior written notice.
Pursuant to a fee waiver letter agreement (“Fee Waiver Agreement”), the Adviser has contractually agreed to limit the amount of the Total Annual Fund Operating Expenses, exclusive of interest, dividend expense on short sales/interest expense, taxes, brokerage commissions, other investment related costs, acquired fund fees and expenses, distribution service fees (i.e., Rule 12b-1 fees), shareholder service fees, and extraordinary expenses, such as litigation and other expenses not incurred in the ordinary course of business to 0.48% of the Fund’s average daily net assets for Institutional Class shares and Class A shares. The Fee Waiver Agreement is in effect through January 31, 2022. The Adviser will be permitted to recover, on a class-by-class basis, expenses it has borne through the Fee Waiver Agreement only to the extent that the Fund's expenses in later periods do not exceed the lesser of: (1) the contractual expense limit in effect at the time the Adviser waives or limits the expenses; or (2) the contractual expense limit in effect at the time the Adviser seeks to recover the expenses; provided, however, that the Fund will not be obligated to reimburse any such expenses borne by the Adviser more than three years after the date on which the fee or expense was waived or limited or assumed and paid by the Adviser, as calculated on a monthly basis. The Adviser may not discontinue this waiver without the approval by the Board.
As of September 30, 2021, the balances of recoupable expenses for the Fund were as follows:
| Kansas Tax-Exempt Bond Fund | Expiring in 2022 | Expiring in 2023 | Expiring in 2024 | Total | ||||||||||||
| Institutional Class | $ | 8,850 | $ | 162,771 | $ | 141,747 | $ | 313,368 | ||||||||
| Class A | 440 | 5,702 | 5,803 | 11,945 | ||||||||||||
Previously waived fees by Manifold Partners LLC (Advisor prior to September 13, 2019) amounting to $105,073 are not subject to recoupment by Carret.
Administrator: ALPS Fund Services, Inc. (“ALPS”) (an affiliate of ALPS Distributors, Inc.) serves as administrator to the Fund. The Fund has agreed to pay expenses incurred in connection with its administrative activities. Pursuant to the Administration, Bookkeeping and Pricing Services Agreement with the Trust, ALPS will provide operational services to the Fund including, but not limited to, fund accounting and fund administration, and will generally assist in the Fund’s operations. The Fund’s administration fee is accrued on a daily basis and paid monthly. The officers of the Trust are employees of ALPS. Administration fees paid by the Fund for the year ended September 30, 2021, are disclosed in the Statement of Operations. ALPS is reimbursed by the Fund for certain out of pocket expenses.
| Annual Report | September 30, 2021 | 21 |
| Carret Kansas Tax-Exempt Bond Fund | Notes to Financial Statements |
| September 30, 2021 |
Transfer Agent: ALPS serves as transfer agent for the Fund under a Transfer Agency and Services Agreement with the Trust. Under this agreement, ALPS is paid an annual fee for services performed on behalf of the Fund plus fees for open accounts and is reimbursed for certain out-of-pocket expenses.
Compliance Services: ALPS provides Chief Compliance Officer services to the Fund to monitor and test the policies and procedures of the Fund in conjunction with requirements under Rule 38a-1 of the 1940 Act pursuant to a Chief Compliance Officer Services Agreement with the Trust. Under this agreement, ALPS is paid an annual fee for services performed on behalf of the Fund and is reimbursed for certain out-of-pocket expenses.
Distribution: ALPS Distributors, Inc. (the “Distributor”) (an affiliate of ALPS) acts as the principal underwriter of the Fund’s shares pursuant to a Distribution Agreement with the Trust. Shares of the Fund are offered on a continuous basis through the Distributor, as agent of the Fund. The Distributor is not obligated to sell any particular amount of shares of the Fund and is not entitled to any compensation for its services as the Fund’s principal underwriter pursuant to the Distribution Agreement.
The Fund has adopted a shareholder services plan (“Shareholder Services Plan”) for its Class A Shares. Under the Shareholder Services Plan the Fund is authorized to pay banks and their affiliates and other institutions, including broker-dealers and Fund affiliates (“Participating Organizations”), an aggregate fee in an amount not to exceed on an annual basis 0.25% of the average daily net assets of the Fund’s Class A Shares to Participating Organizations as compensation for providing shareholder service activities, which do not include distribution services, pursuant to an agreement with a Participating Organization. Starting as of September 24, 2018, the Board authorized 0.00% to be paid on shareholder servicing fees.
The Fund has adopted a plan pursuant to Rule 12b-1 under the 1940 Act (the “Plan”) that allows its Class A shares to pay a distribution and service fee, as defined by the Financial Industry Regulatory Authority (“FINRA”), from its assets for selling and distributing its shares. The Fund was permitted to pay distribution and service fees at an annual rate of up to 0.25% of its Class A share assets. Distribution fees paid by the Fund for the year ended September 30, 2021, are disclosed in the Statement of Operations.
7. TRUSTEES
As of September 30, 2021, there were four Trustees, three of whom are not “interested persons” (as defined in the 1940 Act) of the Trust (the “Independent Trustees”). The Independent Trustees of the Trust and Interested Trustees who are not currently employed by the Adviser, ALPS or other service providers will receive a quarterly retainer of $13,500, plus $4,000 for each regular Board or Committee meeting attended and $2,000 for each special telephonic or in-person Board or Committee meeting attended. Additionally, the Audit Committee Chair receives a quarterly retainer of $1,250 and the Independent Chair receives a quarterly retainer of $3,250. The Independent Trustees and Interested Trustees who are not currently employed by the Adviser, ALPS or other service providers are also reimbursed for all reasonable out-of-pocket expenses relating to attendance at meetings. Officers of the Trust receive no salary or fees from the Trust. As discussed in Note 6, the Fund pays ALPS an annual fee for compliance services.
8. INDEMNIFICATIONS
Under the Trust’s organizational documents, its officers and Trustees are indemnified against certain liabilities arising out of the performance of their duties to the Trust. Additionally, in the normal course of business, the Trust enters into contracts with service providers that may contain general indemnification clauses which may permit indemnification to the extent permissible under applicable law. The Trust’s maximum exposure under these arrangements is unknown, as such exposure would involve future claims that may be made against the Trust that have not yet occurred.
9. SUBSEQUENT EVENTS
Subsequent events after the date of the Statement of Assets and Liabilities have been evaluated through the date the financial statements were issued. Management has determined that there were no subsequent events to report through the issuance of these financial statements.
| 22 |
| Report of Independent Registered | |
| Carret Kansas Tax-Exempt Bond Fund | Public Accounting Firm |
To the Shareholders of Carret Kansas Tax-Exempt Bond Fund and
Board of Trustees of ALPS Series Trust
Opinion on the Financial Statements
We have audited the accompanying statement of assets and liabilities, including the portfolio of investments, of Carret Kansas Tax-Exempt Bond Fund (the “Fund”), a series of ALPS Series Trust, as of September 30, 2021, the related statement of operations for the year then ended, the statements of changes in net assets for each of the two years in the period then ended, the related notes, and the financial highlights for each of the four periods in the period then ended (collectively referred to as the “financial statements”). In our opinion, the financial statements present fairly, in all material respects, the financial position of the Fund as of September 30, 2021, the results of its operations for the year then ended, the changes in net assets for each of the two years in the period then ended, and the financial highlights for each of the four periods in the period then ended, in conformity with accounting principles generally accepted in the United States of America.
The Fund’s financial highlights for the years ended October 31, 2017, and prior, were audited by other auditors whose report dated December 28, 2017, expressed an unqualified opinion on those financial highlights.
Basis for Opinion
These financial statements are the responsibility of the Fund’s management. Our responsibility is to express an opinion on the Fund’s financial statements based on our audits. We are a public accounting firm registered with the Public Company Accounting Oversight Board (United States) (“PCAOB”) and are required to be independent with respect to the Fund in accordance with the U.S. federal securities laws and the applicable rules and regulations of the Securities and Exchange Commission and the PCAOB.
We conducted our audits in accordance with the standards of the PCAOB. Those standards require that we plan and perform the audit to obtain reasonable assurance about whether the financial statements are free of material misstatement whether due to error or fraud.
Our audits included performing procedures to assess the risks of material misstatement of the financial statements, whether due to error or fraud, and performing procedures that respond to those risks. Such procedures included examining, on a test basis, evidence regarding the amounts and disclosures in the financial statements. Our procedures included confirmation of securities owned as of September 30, 2021, by correspondence with the custodian and brokers; when replies were not received from brokers, we performed other auditing procedures. Our audits also included evaluating the accounting principles used and significant estimates made by management, as well as evaluating the overall presentation of the financial statements. We believe that our audits provide a reasonable basis for our opinion.
We have served as the Fund’s auditor since 2018.

COHEN & COMPANY, LTD.
Cleveland, Ohio
November 29, 2021
| Annual Report | September 30, 2021 | 23 |
| Disclosure Regarding Renewal and | |
| Carret Kansas Tax-Exempt Bond Fund | Approval of Fund Advisory Agreement |
| September 30, 2021 (Unaudited) |
On August 19, 2021, the Board of Trustees (the “Board”) of ALPS Series Trust (the “Trust”) met in person to discuss, among other things, the renewal and approval of the Investment Advisory Agreement between the Trust and Carret Asset Management, LLC (“Carret”) in accordance with Section 15(c) of the 1940 Act. The independent legal counsel advised the independent Trustees with respect to their responsibilities pertaining to the approval of advisory contracts.
In evaluating Carret and the fees charged under the Carret Agreement, the Trustees concluded that no single factor reviewed by the Trustees was identified by the Trustees to be determinative as the principal factor in whether to renew the Carret Agreement. Further, the Independent Trustees were advised by independent legal counsel throughout the process. The following summary does not identify all the matters considered by the Board but provides a summary of the principal matters the Board considered with respect to the Carret Kansas Tax-Exempt Bond Fund (the “Fund”):
Nature, Extent and Quality of the Services: The Trustees received and considered information regarding the nature, extent and quality of services provided to the Fund pursuant to the Investment Advisory Agreement. The Trustees reviewed certain background materials supplied by Carret, including Carret’s Form ADV.
The Trustees evaluated Carret’s history as an asset manager. They considered the quality of services provided by Carret to the Fund as the current adviser and previously as its sub-adviser. The Trustees discussed the research and decision-making processes utilized by Carret, including the methods adopted to seek to achieve compliance with the investment objective, policies, and restrictions of the Fund.
The Trustees considered the background and experience of Carret’s management team, including the qualifications, background, and responsibilities of the portfolio managers primarily responsible for the day-to-day portfolio management of the Fund. The Trustees reviewed the backgrounds of key investment personnel responsible for servicing the Fund and noted their education and diverse financial industry experience. The Trustees also considered the reputation of Carret and its ability to deliver all services required of an adviser. The Trustees considered the Adviser’s commitment to providing high quality service to the Fund, as observed by the Trustees in their interaction with Adviser personnel and confirmed by the officers of the Fund.
Performance: The Trustees discussed the Fund’s performance as compared to its benchmark and a third-party provided peer group. They noted that the Fund achieved positive returns in each of the periods presented with returns similar to that of the peer funds. They discussed that the Fund trailed the benchmark index over the 1-, 3-, and 5-year periods but outperformed since the Fund’s inception. The Trustees acknowledged Carret’s dedication to providing a portfolio limited primarily to Kansas municipal bonds, consistent with the mandate of the Fund’s strategy.
The Adviser’s Profitability: The Trustees received and considered information related to Carret’s profitability with respect to its relationship with the Fund. They noted that the Adviser reported a profit in each of the two previous years. The Trustees considered the level of profit earn by the Adviser and determined it was not excessive either in terms of a total dollar amount or as a percentage of gross revenue earned. The Trustees considered the impact of the expense limitation agreement with respect to the Adviser’s profits earned. The Trustees then reviewed and discussed Carret’s financial statements to analyze Carret’s financial condition and stability.
Economies of Scale: The Trustees considered whether economies of scale had been reached with respect to the Adviser’s management of the Fund. They recognized the benefits received by shareholders from the expense limitation agreement in place. They also considered that Fund shareholders benefit from the current scale of Carret’s advisory business, which affords opportunities in terms of execution, access to markets, and similar benefits of institutional investing, but that the Fund’s assets under management would likely not result in material additional economies of scale for Carret.
Other Benefits to the Adviser: The Trustees reviewed and considered any other incidental benefits derived by Carret from its relationship with the Fund, including research and other support services.
Having requested and reviewed such information from Carret as the Board believed to be reasonably necessary to evaluate the terms of the Carret Agreement, the Trustees, including all the Independent Trustees, concluded that the compensation of Carret was appropriate under the Carret Agreement and the renewal of the Carret Agreement was in the best interests of the Carret Fund and its shareholders.
| 24 |
| Carret Kansas Tax-Exempt Bond Fund | Additional Information |
| September 30, 2021 (Unaudited) |
1. PROXY VOTING POLICIES AND VOTING RECORD
A description of the policies and procedures that the Fund uses to determine how to vote proxies relating to portfolio securities is available without charge, upon request, (i) by calling the Fund (toll-free) at 1-833-287-7933 or (ii) on the website of the Securities and Exchange Commission (“SEC”) at http://www.sec.gov.
Information regarding how the Fund voted proxies relating to portfolio securities during the most recent 12-month period ended June 30 is available (i) without charge, upon request, by calling the Fund (toll-free) at 1-833-287-7933 or (ii) on the SEC’s website at http://www.sec.gov.
2. PORTFOLIO HOLDINGS
The Fund’s portfolio holdings are made available semi-annually in shareholder reports within 60 days after the close of the period for which the report is being made, as required by federal securities laws. The Fund files its complete schedule of portfolio holdings with the SEC for the first and third fiscal quarters of each fiscal year as an exhibit to its reports on Form N-PORT. The Fund’s Form N-PORT reports are available on the SEC’s website at www.sec.gov. The Fund’s portfolio holdings are also available upon request, without charge, by calling (toll-free) 1-833-287-7933 or by writing to Carret Asset Management at 320 Park Avenue, 18th Floor, New York, New York 10022.
3. SHAREHOLDER PROXY RESULTS
At a Special Meeting of Shareholders of the ALPS Series Trust, held on April 12, 2021, shareholders of record as of the close of business on March 1, 2021 voted to approve the following proposals:
Proposal 1: To elect Ward D. Armstrong to serve on the Board of Trustees until his resignation, retirement, death or removal or until his successor is duly elected and qualified.
| Shares Voted In Favor | Shares Voted Against or Abstentions | |||||||
| 162,259,659 | 244,729 | |||||||
Proposal 2: To elect Bradley J. Swenson to serve on the Board of Trustees until his resignation, retirement, death or removal or until his successor is duly elected and qualified.
| Shares Voted In Favor | Shares Voted Against or Abstentions | |||||||
| 162,281,980 | 222,408 | |||||||
4. TAX DESIGNATIONS
For the year ended September 30, 2021, pursuant to Section 852(b)(3) of the Internal Revenue Code, American Independence Kansas Tax Exempt Bond Fund did designate $5,864 as long-term capital gain dividends.
For the year ended September 30, 2021, 99.79% of the distributions from net investment income for American Independence Kansas Tax Exempt Bond Fund are exempt from federal income tax.
| Annual Report | September 30, 2021 | 25 |
| Liquidity Risk Management | |
| Carret Kansas Tax-Exempt Bond Fund | Program Disclosure |
| September 30, 2021 (Unaudited) |
The ALPS Series Trust (the “Trust”) has established a liquidity risk management program (the “Program”) to govern the Trust’s approach to managing liquidity risk for each fund in the series (each a “Fund”). The Program is overseen by the Liquidity Committee (the “Committee”), a committee comprised of representatives of the Trust and ALPS | SS&C. The Trust’s Board of Trustees (the “Board”) has approved the designation of the Committee to oversee the Program.
The Program’s principal objectives include supporting each Fund’s compliance with limits on investments in illiquid assets and mitigating the risk that a Fund will be unable to meet its redemption obligations in a timely manner. The Program also includes a number of elements that support the management and assessment of liquidity risk, including, among others, an annual assessment of factors that influence a Fund’s liquidity the periodic classification and re-classification of the Fund’s investments into groupings that reflect the Committee’s assessment of their relative liquidity under both current market conditions and reasonably foreseeable stressed conditions, as well as minimum levels of highly liquid investments.
At a meeting that occurred on May 20, 2021, the Board received a report from the Committee that addressed the operation of the Program and assessed its adequacy and effectiveness of implementation. The report revealed that, during the period covered by the report, there were no liquidity events that impacted the Funds or their ability to timely meet redemptions without dilution to existing shareholders. The report further discussed the liquidity classification methodology of each Fund, the effectiveness of the operation of certain Funds’ Highly Liquid Investment Minimum (“HLIM”) where applicable, and the liquidity classification of each Fund’s investments over the period. The report further noted that no material changes have been made to the Program since its implementation. The report provided to the Board included a conclusion that the Program appeared to be reasonably designed and operated effectively during the review period.
| 26 |
| Carret Kansas Tax-Exempt Bond Fund | Privacy Policy |
| September 30, 2021 (Unaudited) |
| FACTS | WHAT DOES THE FUND DO WITH YOUR PERSONAL INFORMATION? |
| WHY? | Financial companies choose how they share your personal information. Federal law gives consumers the right to limit some but not all sharing. Federal law also requires us to tell you how we collect, share and protect your personal information. Please read this notice carefully to understand what we do. |
| WHAT? | The types of personal information we collect and share depend on the product or service you have with us. This information can include: |
| · Social Security number and account transactions | |
| · Account balances and transaction history | |
| · Wire transfer instructions | |
| HOW? | All financial companies need to share customers’ personal information to run their everyday business. In the section below, we list the reasons financial companies can share their customers’ personal information, the reasons a Fund chooses to share, and whether you can limit this sharing. |
| REASONS WE CAN SHARE YOUR PERSONAL INFORMATION | DO THE FUNDS SHARE? | CAN YOU LIMIT THIS SHARING? | |
For our everyday business purposes – such as to process your transactions, maintain your account(s), respond to court orders and legal investigations, or report to credit bureaus | Yes | No | |
For our marketing purposes – to offer our products and services to you | No | We do not share. | |
| For joint marketing with other financial companies | No | We do not share. | |
For our affiliates’ everyday business purposes – information about your transactions and experiences | Yes | No | |
For our affiliates’ everyday business purposes – information about your creditworthiness | No | We do not share. | |
| For non-affiliates to market to you | No | We do not share. | |
| QUESTIONS? | Call 1-833-287-7933. | ||
| Annual Report | September 30, 2021 | 27 |
| Carret Kansas Tax-Exempt Bond Fund | Privacy Policy |
| September 30, 2021 (Unaudited) |
| WHO WE ARE | |
| Who is providing this notice? | Carret Kansas Tax-Exempt Bond Fund (the “Fund”) |
| WHAT WE DO | |
| How does the Fund protect my personal information? | To protect your personal information from unauthorized access and use, we use security measures that comply with federal law. These measures include computer safeguards and secured files and buildings. |
| How does the Fund collect my personal information? | We collect your personal information, for example, when you · open an account · provide account information or give us your contact information · make a wire transfer or deposit money |
| Why can’t I limit all sharing? | Federal law gives you the right to limit only · sharing for affiliates’ everyday business purposes-information about your creditworthiness · affiliates from using your information to market to you · sharing for non-affiliates to market to you
State laws and individual companies may give you additional rights to limit sharing. |
| DEFINITIONS | |
| Affiliates | Companies related by common ownership or control. They can be financial and nonfinancial companies. |
| Non-affiliates | Companies not related by common ownership or control. They can be financial and nonfinancial companies. · The Fund does not share with non-affiliates so they can market to you. |
| Joint marketing | A formal agreement between non-affiliated financial companies that together market financial products or services to you. · The Fund does not jointly market. |
| OTHER IMPORTANT INFORMATION | |
| California Residents | If your account has a California home address, your personal information will not be disclosed to nonaffiliated third parties except as permitted by applicable California law, and we will limit sharing such personal information with our affiliates to comply with California privacy laws that apply to us. |
| 28 |
| Carret Kansas Tax-Exempt Bond Fund | Trustees & Officers |
| September 30, 2021 (Unaudited) |
INDEPENDENT TRUSTEES
| Name, Birth Year & Address* | Position(s) Held with Fund | Term of Office and Length of Time Served** | Principal Occupation(s) During Past 5 Years*** | Number of Funds in Fund Complex Overseen by Trustee**** | Other Directorships Held by Trustee During Past 5 Years*** |
Ward D. Armstrong, Birth year: 1954 | Trustee and Chairman | Mr. Armstrong was appointed to the Board on May 27, 2016. Mr. Armstrong was appointed Chairman of the Board at the August 24, 2017 meeting of the Board of Trustees. | Mr. Armstrong is currently retired. From February 2010 to July 2015, he was Co-Founder and Managing Partner of NorthRock Partners, a private wealth advisory firm providing comprehensive wealth management and family office services to the high net-worth marketplace. Previously, he was Senior Vice President, Ameriprise Financial (1984 to 2007); Chairman of Ameriprise Trust Company (1996 to 2007) and President, American Express Institutional Asset Management (2002 to 2004). He has also served on several investment related Boards including Kenwood Capital Management, RiverSource Investments, American Express Asset Management International and was Chair of the Ordway Theatre Endowment Committee. | 11 | Mr. Armstrong is a Director of the Heartland Group, Inc. (3 funds). |
J. Wayne Hutchens, Birth year: 1944 | Trustee | Mr. Hutchens was elected to the Board on October 30, 2012. | Mr. Hutchens is currently retired. From 2000 to January 2020, he served as Trustee of the Denver Museum of Nature and Science and from May 2012 to February 2020, he served as Trustee of Children’s Hospital Colorado. From April 2006 to December 2012, he served as President and CEO of the University of Colorado (CU) Foundation and from April 2009 to December 2012, he was Executive Director of the CU Real Estate Foundation. Mr. Hutchens is also Director of AMG National Trust Bank (June 2012 to present). Prior to these positions, Mr. Hutchens spent 29 years in the banking industry, retiring as Chairman of Chase Bank Colorado. | 11 | Mr. Hutchens is a Director of RiverNorth Opportunities Fund, Inc. (2013 to present), RiverNorth Opportunistic Municipal Income Fund, Inc. (2018 to present), RiverNorth/Doubleline Strategic Opportunity Fund, Inc. (2018 to present), RiverNorth Specialty Finance Corporation (2018 to present), RiverNorth Managed Duration Municipal Income Fund, Inc. (2019 to present), RiverNorth Flexible Municipal Income Fund, Inc. (2020 to present). He is an Advisory Board member of RiverNorth Funds (3 funds) (2020 to present). |
| * | All communications to Trustees and Officers may be directed to ALPS Series Trust c/o 1290 Broadway, Suite 1000, Denver, CO 80203. |
| ** | This is the period for which the Trustee or Officer began serving the Trust. Each Trustee serves an indefinite term, until such Trustee’s successor is elected and appointed, or such Trustee resigns or is deceased. Officers are elected on an annual basis. |
| *** | Except as otherwise indicated, each individual has held the office shown or other offices in the same company for the last five years. |
| **** | The Fund Complex currently consists of 11 series of the Trust. |
| Annual Report | September 30, 2021 | 29 |
| Carret Kansas Tax-Exempt Bond Fund | Trustees & Officers |
| September 30, 2021 (Unaudited) |
INDEPENDENT TRUSTEES
| Name, Birth Year & Address* | Position(s) Held with Fund | Term of Office and Length of Time Served** | Principal Occupation(s) During Past 5 Years*** | Number of Funds in Fund Complex Overseen by Trustee**** | Other Directorships Held by Trustee During Past 5 Years*** |
| Patrick Seese, Birth year: 1971 | Trustee | Mr. Seese was elected to the Board on October 30, 2012. | Mr. Seese is an owner and a Managing Director of Integris Partners, a middle-market investment banking firm serving closely-held companies, financial sponsors and public companies (February 2008 to present). Prior to this, Mr. Seese was a Managing Director of Headwaters MB, a middle-market investing banking firm (December 2003 to February 2008). Prior to that, Mr. Seese worked in Credit Suisse First Boston’s Mergers and Acquisitions Group and served as Head of Corporation Development, Katy Industries, a publicly traded industrial and consumer products company and at Deloitte & Touche LLP, where he began his career in 1994. | 11 | Mr. Seese is a Director of The Mile High Five Foundation (2013 to present) and SJ Panthers Foundation (2016 to present). |
| Merrillyn J. Kosier, Birth year: 1959 | Trustee | Ms. Kosier was elected to the Board on November 17, 2021. | Ms. Kosier retired from Ariel Investments as Executive Vice President in 2019. During her tenure at Ariel Investments, she served as Chief Marketing Officer, Ariel Mutual Funds since 2007; Trustee for Ariel Investment Trust since 2003 and President of Ariel Distributors, LLC since 2002. From 2006 to present, she has served as Trustee at the Harris Theater For Music and Dance (not-for-profit organization) and is currently Executive Vice Chair. | 11 | Ms. Kosier is Board Director at the Arts Club of Chicago (2021 to present). |
INTERESTED TRUSTEE
| Name, Birth Year & Address* | Position(s) Held with Fund | Term of Office and Length of Time Served** | Principal Occupation(s) During Past 5 Years*** | Number of Funds in Fund Complex Overseen by Trustee**** | Other Directorships Held by Trustee During Past 5 Years*** |
| Bradley J. Swenson, Birth year: 1972 | Trustee | Mr. Swenson was elected to the Board on April 12, 2021. | Mr. Swenson joined ALPS Fund Services, Inc. (“ALPS”) in 2004 and had served as its President since June 2019 until June 2021. In this role, he served as an officer to certain other closed-end and open-end investment companies. He previously served as the Chief Operating Officer of ALPS (2015-2019). Mr. Swenson also previously served as Chief Compliance Officer to ALPS, its affiliated entities, and to certain ETF, closed-end and open-end investment companies (2004-2015). | 11 | None |
| * | All communications to Trustees and Officers may be directed to ALPS Series Trust c/o 1290 Broadway, Suite 1000, Denver, CO 80203. |
| ** | This is the period for which the Trustee or Officer began serving the Trust. Each Trustee serves an indefinite term, until such Trustee’s successor is elected and appointed, or such Trustee resigns or is deceased. Officers are elected on an annual basis. |
| *** | Except as otherwise indicated, each individual has held the office shown or other offices in the same company for the last five years. |
| **** | The Fund Complex currently consists of 11 series of the Trust. |
| 30 |
| Carret Kansas Tax-Exempt Bond Fund | Trustees & Officers |
| September 30, 2021 (Unaudited) |
OFFICERS
| Name, Birth Year & Address* | Position(s) Held with Fund | Term of Office and Length of Time Served** | Principal Occupation(s) During Past 5 Years*** |
Dawn Cotten Birth year: 1977 | President | Since June 2021 | Ms. Cotten joined ALPS in 2009 and is currently Senior Vice President of Fund Administration and Relationship Management of ALPS. She has served in that role since January 2020. Prior to that, Ms. Cotten served as Senior Vice President (2017-2020) and Vice President of ALPS Relationship Management (2013-2017). |
Erich Rettinger Birth year: 1985 | Treasurer | Since August 2020 | Mr. Rettinger joined ALPS in 2007 and is currently Vice President and Fund Controller of ALPS. He has served as Fund Controller of ALPS (since 2013) and Fund Accounting of ALPS (2013-2017). He also served as Assistant Treasurer of the Trust (May 2019-August 2020). Mr. Rettinger is also Treasurer of the Clough Long/Short Equity Fund, Clough Global Opportunities Fund, Clough Global Dividend and Income Fund and Clough Global Equity Fund. Mr. Rettinger is also Assistant Treasurer of the Stone Harbor Investment Funds. |
Patrick Rogers+ Birth year: 1966 | Secretary | Since November 2021 | Mr. Rogers has served as Senior Legal Counsel of ALPS since September 2021 and previously served as Compliance Counsel for Mercer Advisors from 2018 to 2021 and Contract Attorney for CACI, Inc. from 2014 to 2018. |
Anne M. Berg Birth year: 1973 | Assistant Secretary | Since August 2018 | Ms. Berg joined ALPS as Senior Investment Company Act Paralegal in February 2017. Prior to joining ALPS, she was a Senior Legal Manager at Janus Capital Management LLC (2000-2017). |
Lucas D. Foss Birth year: 1977 | Chief Compliance Officer | Since January 2018 | Mr. Foss rejoined ALPS in November 2017 as Vice President and Deputy Chief Compliance Officer. Prior to his current role, Mr. Foss served as the Director of Compliance at Transamerica Asset Management (2015- 2017) and Deputy Chief Compliance Officer at ALPS (2012- 2015). Mr. Foss is also CCO of X-Square Balanced Fund, Goehring & Rozencwajg Investment Funds, Broadstone Real Estate Access Fund, Inc., Clough Global Funds; Clough Funds Trust; SPDR® S&P 500® ETF Trust, SPDR® Dow Jones® Industrial Average ETF Trust, SPDR® S&P MIDCAP 400® ETF Trust and 1WS Credit Income Fund. |
| * | All communications to Trustees and Officers may be directed to ALPS Series Trust c/o 1290 Broadway, Suite 1000, Denver, CO 80203. |
| ** | This is the period for which the Trustee or Officer began serving the Trust. Each Trustee serves an indefinite term, until such Trustee’s successor is elected and appointed, or such Trustee resigns or is deceased. Officers are elected on an annual basis. |
| *** | Except as otherwise indicated, each individual has held the office shown or other offices in the same company for the last five years. |
| **** | The Fund Complex currently consists of 11 series of the Trust. |
| + | Appointed November 18, 2021 |
Additional information about members of the Board of Trustees and officers of the Trust is available in the Statement of Additional Information and is available, without charge, upon request, by calling the Fund (toll-free) at 1-833-287-7933.
| Annual Report | September 30, 2021 | 31 |
This material must be preceded or accompanied by a prospectus.
The Carret Kansas Tax-Exempt Bond Fund is distributed by ALPS Distributors, Inc
Table of Contents
| Shareholder Letter | 2 |
| Portfolio Update | |
| Clarkston Partners Fund | 10 |
| Clarkston Fund | 16 |
| Clarkston Founders Fund | 22 |
| Disclosure of Fund Expenses | 28 |
| Portfolios of Investments | |
| Clarkston Partners Fund | 30 |
| Clarkston Fund | 32 |
| Clarkston Founders Fund | 34 |
| Statements of Assets and Liabilities | 36 |
| Statements of Operations | 37 |
| Statements of Changes in Net Assets | |
| Clarkston Partners Fund | 38 |
| Clarkston Fund | 39 |
| Clarkston Founders Fund | 40 |
| Financial Highlights | 42 |
| Notes to Financial Statements | 53 |
| Report of Independent Registered Public Accounting Firm | 64 |
| Additional Information | 65 |
| Liquidity Risk Management Program | 67 |
| Privacy Policy | 68 |
| Trustees and Officers | 71 |
| Clarkston Funds | Shareholder Letter |
| September 30, 2021 (Unaudited) |
Dear Shareholder:
The hallmark of wisdom is the ability to recognize what one can control, and what one cannot. We cannot control what other investors believe, how their emotions influence their behavior, and how they ultimately engage with the market. The tides of the market are ceaseless and capricious, tumultuously battering stock prices, and therefore short-term performance. We cannot command the waves, but we can choose which ship to set sail upon and which course to charter. If the businesses we purchase are the ships in our travels, we seek high quality in an attempt to identify endurance and excellence. Equally important and controllable is the navigation, or price paid, for even the best ship is doomed without a valuable compass and map. While the novice traveler may cling to a quality vessel or a treasured map, the wise captain understands the disciplined adherence to both transcends all environments. Our observations lead us to believe many investors have abandoned this approach in fear of missing passage on the next trendy liner. As stewards of the Clarkston Funds shareholders’ capital, we seek to purchase quality businesses at values we consider well-positioned to potentially deliver strong absolute returns. And while the seas may have been rough more recently, we believe these short-term conditions will have a smaller impact on our long-term journey. We are eternally grateful for the Clarkston Funds shareholders’ persistent support and philosophical alignment. With modest pride, the Institutional Class of the Clarkston Partners Fund, Clarkston Founders Fund and Clarkston Fund have generated annualized since-inception1 returns of 10.77%, 10.85% and 11.13%, respectively, through September 30, 2021.
This year has showcased the manic short-term waves of market swings. For example, from January 1 through May 13, 2021, the Partners Fund – Institutional Class gained 19.35%, outperforming the Russell 2500TM Index, the Partners Fund’s benchmark, by 8.13%. From January 1 through September 30, 2021, the Partners Fund – Institutional Class was up only 5.11% versus 13.83% for the Russell 2500TM Index, meaning that, from May 13 through September 30, 2021, the Partners Fund – Institutional Class was down -11.94% at the same time the Russell 2500TM Index was up 2.35%. For additional details regarding the Funds’ performance, please see the individual Fund discussions that follow. While these details present a relative picture over the short-term, our focus remains on the long-term destination. The average market participant has a holding period of about five and a half months.2 For the Partners Fund, the average holding period is over six years.3 This differential leads to very different areas of focus. On the short end, quarterly earnings, headlines, macro events and sentiment drive price returns. On the end of the spectrum that Clarkston Capital focuses on, we believe underlying fundamentals, competitive positioning, and capital allocation are the primary drivers of returns over long periods. We believe these long-term drivers simply do not oscillate on short term price movements. As such, we do not consider transient price-to-value dislocations to be an injury, but an opportunity and at times, a necessary discomfort for further investment.
Although tides of the market are high right now, we are pleased with the Funds’ fleet of investments. We believe each name held in the Clarkston Funds is a high-quality business exhibiting strong fundamentals and trading at an attractive valuation, positioning the Funds to potentially deliver strong absolute returns going forward. Outside the Clarkston Funds’ portfolios, but within our opportunity set, we believe quality exists, though low free cash flow (“FCF”) yields4 indicate substantial growth must continue in order to deliver attractive returns. Worth mentioning is the continued multiple expansion5 within the growth and technology sectors. While many of these businesses fall outside of our core competencies, in our view base rates and historical precedents indicate potential difficulties of fundamentals catching prices in the coming years.
| 2 | www.clarkstonfunds.com |
| Clarkston Funds | Shareholder Letter |
| September 30, 2021 (Unaudited) |
As a reminder, we value businesses via a “cash-on-cash” returns model with two components. The first component of our investment philosophy is based on the assumption that the estimated internal rate of return (“IRR”) an owner of a business can expect to earn over a long-term holding period is equal to the sum of the FCF yield and the growth rate of FCF. Important to note is the purposely omitted multiple expansion (or contraction), a source (or use) of returns we view as unsustainable. Each investment we make in the Clarkston Funds is subject to an absolute hurdle rate6 plus an appropriate “cushion” or “margin of safety”7 based on the individual risk of each investment. In other words, we typically will not initiate a new investment until the established IRR is “comfortably” greater than our hurdle rate.
To further illustrate and using the Clarkston Partners Fund as an example, as of September 30, 2021, the FCF yield of the Clarkston Partners Fund portfolio was 7.70% versus 3.70% for the Clarkston Bench8 and 2.70% for the average business in the Russell 2500 technology sector, a proxy for the high growth segment of the overall market. Therefore, the average businesses on the Clarkston Bench and in the Russell 2500 technology sector would have to have an estimated FCF growth rate greater than that of the holdings in the Clarkston Partners Fund portfolio to qualify, under Clarkston Capital’s valuation process, as an equally attractive investment. While not impossible, we generally see these FCF growth rates as difficult to achieve and may lead to subpar results.
Avoiding “pricey” growth investments has made for the Funds’ relative underperformance in the short-term: a mark for which we are unremorseful, as we believe absolute returns and forward-looking expectations remain strong. Another pillar of our confidence is built on our guiding principles. We believe fundamentals drive business value over the long-term and the price paid drives shareholder returns. A concept we see being stretched excessively by so many investors today by conflating the value of a business with the price of its shares. In fact, when we find our IRR hurdle rate to be prudently unavailable, we have made the resolute decision to hold cash.
Share price is a function of the price at which marginal buyers and sellers agree to transact. This price, therefore, may or may not reflect the underlying value of the business because factors such as emotion or sentiment can drive the investment decisions made by these marginal players. Common sense tells us these superfluous factors have no bearing on a business’s ability to generate and grow FCF. Said another way, share price is not always reflective of the value of a business. Value is a function of the future cash flows a business will generate during its “life”. These cash flows are driven by the fundamentals of a business. Qualitatively, we spend much of our analysis focused on these drivers and how we expect them to materialize over the “life” of our investment horizon. This is paramount as we believe the price of a business will eventually converge to the value. Therefore, in our view the true challenge we face is not in temporary price-to-value discrepancies – though we do appreciate how incentive structures, social proof, and short feedback loops can influence myopic behavior – but instead, incorrectly appraising the intrinsic value of the businesses held in the Clarkston Funds.
At Clarkston, our ability to manage capital according to our Quality Value philosophy is multifaceted. It begins with a temperament inherently backed by courage and patience. Deep knowledge of a concentrated portfolio of businesses gives us confidence in our capabilities. And a long time horizon allows for our theses to successfully converge.
| Annual Report | September 30, 2021 | 3 |
| Clarkston Funds | Shareholder Letter |
| September 30, 2021 (Unaudited) |
Fundamentals
The prior preponderance of this letter illustrates Clarkston Capital’s framework for investment selection. What is hopefully evident is the long-term focus on fundamentals necessary to seek to provide independent paths of sustainable shareholder returns. The remaining content uses topical portfolio holdings as examples of potentially improving fundamental drivers. We look at the competitive positioning of food distributors, the underappreciated growth of LPL Financial Holdings, Inc. (LPL), execution and refocusing with Nielsen Holdings Plc (NLSN) and Stericycle, Inc. (SRCL), leveraged capital allocation of Hillenbrand, Inc. (HI), and updates on the accelerated value recognition of Change Healthcare, Inc. (CHNG). While examining these businesses, we highlight perceived challenges and how we believe that gives Clarkston Capital an opportunity, albeit necessarily unpopular and time agnostic, for attractive absolute returns.
Sysco Corporation (SYY) and US Foods Holding Corp. (USFD)
Sysco and US Foods are the two largest food distributors in the United States. Together, they control around 26% of the nearly $300 billion U.S. food distribution market. The remaining market share is divided among one other national distributor, a handful of regional distributors, and around 15,000 local distributors. The past 18 months have been the most difficult in the industry’s history. Restaurant customers were forced to close or operate at less than 100% capacity for extended periods of time, travel, hospitality, healthcare, and education customers experienced significant reductions in foot traffic, and labor constraints and food cost inflation pressured supply chains. In many regions, these are ongoing challenges. We believe the short-term headwinds have and will continue to have a positive effect on Sysco’s and US Foods’ competitive positions relative to peers. Our confidence in their long-term prospects stems from two sources: our belief that their technological capabilities are superior to those of industry peers and that they are well positioned to invest ahead of the recovery.
In our opinion, Sysco and US Foods have been at the forefront of technological investment in their industry. What is cutting edge technology in food distribution may seem rudimentary compared to other industries. Mobile ordering, real time pricing, inventory management, and personalized order suggestions are just some of the technology tools the large distributors offer. The benefits of these tools have driven new business wins, increased wallet share with existing customers, and lowered customer churn.
During the initial months of the pandemic, when most jurisdictions mandated a closure of indoor dining, industry volumes fell precipitously. We, like many, predicted that distributors without the balance sheet to endure the environment would struggle. There was some carnage, most notably a bankruptcy of one of the largest regional distributors, but smaller distributors fared better than expected. The snap-back in demand may prove more arduous, however. When revenues are declining, inventories and accounts receivables are depleted, providing a boon to cash flow. As revenues increase, the opposite occurs, creating the need for significant working capital investment. Furthermore, staff levels were reduced during 2020 to rationalize the cost structure to a level appropriate with the reduction in volumes. This must also reverse to accommodate the recovering environment. Both Sysco and US Foods proactively invested in these areas, well ahead of the recovery. The data suggests these were wise investments, as Sysco and US Foods took market share over the nine months ended September 30, 2021.
| 4 | www.clarkstonfunds.com |
| Clarkston Funds | Shareholder Letter |
| September 30, 2021 (Unaudited) |
LPL Financial Holdings, Inc. (LPLA)
In our opinion, LPL has been a successful investment from both a performance and process perspective. This brief case study highlights the underappreciated growth component of our thesis playing out over a multiyear holding period using the Clarkston Partners Fund as an example.
The Clarkston Partners Fund first initiated a position in LPL in December of 2015. Shortly after, a myriad of largely external factors drove the share price lower leading to subsequent purchases. Underpinning our underwriting case was a high but conservative FCF growth rate estimate. Our view started with volume growth of assets on LPL’s platform. We believe secular organic flows are critical from a qualitative proof point and experienced a noticeable and sustainable step-up from much needed technology investments and cultural realignment. In our opinion, the volume growth from structural capital market appreciation is highly attractive given the lack of parallel expenses. While LPL was not immune to typical industry pricing headwinds, the negative effects were less pronounced due to a favorable business mix shifting from brokerage to advisory assets and a brief pocket of elevated interest rates. Combined and enhanced with operating leverage, these factors produced a low double digit growth rate in free cash flow. These results, in conjunction with attractive mergers and acquisitions (“M&A”) activity, surpassed our estimates, resulting in subsequent and positive updates to our valuation. We estimate the growth in normalized organic FCF since the position was initiated in the Partners Fund through September 30, 2021, was approximately 20% annualized.
We believe our long-term commitment to fundamentals allowed for the growth drivers of LPL to materialize. The Company’s continued execution, acceleration, and distancing from competitors has only increased our conviction. The market’s lack of acknowledgement (in the form of a lower FCF yield) of structural and secular growth drivers lead us to believe the Fund held a high-quality business at an attractive valuation through the reporting period.
Nielsen Holdings Plc (NLSN)
The past six months have been riddled with news articles detailing media networks’ dissatisfaction with Nielsen’s ratings. The criticism surrounds Nielsen’s measurement adjustments during the COVID pandemic. At the beginning of the pandemic, the Company made the decision to not enter panelists’ homes to protect the health and safety of the panelists and Nielsen employees. This decision limited new panel recruitment as well as existing panelist maintenance. The results of these actions were found to have potentially affected ratings in the range of 2%-6%, and ultimately led to the Media Ratings Council (“MRC”) – an organization that manages accreditation for media measurement – to suspend Nielsen’s accreditation.
Nielsen began to work hard to address the issues raised and to re-gain accreditation status from the MRC. It has since re-entered panelists’ homes to fix technical issues as well as recruit new panelists. It acknowledged a need to be more transparent regarding future changes to measurement. Despite the turmoil, media publishers and advertisers continued to transact using Nielsen in the most recent upfronts, where large portions of annual advertising inventory are bought and sold. This is a testament to the importance of Nielsen’s role in media transactions, as well as the trust it has accrued from industry constituents over decades of measurement integrity.
Much has been accomplished over the last 12 months. Nielsen completed the sale of Global Connect to Advent International, creating a streamlined organization focused on media. The proceeds from the sale were used to strengthen the balance sheet, reducing leverage (debt divided by earnings before interest, taxes, depreciation and amortization (“EBITDA”)) from 4.1x to 3.6x. The EBITDA margin profile improved from the low 30% range to north of 40%. Recurring revenue increased from 70% to 80%. Nielsen introduced a new cross-media measurement currency: Nielsen ONE. The rollout of Nielsen ONE has gone as planned and Nielsen has secured important partnerships and client endorsements around the new currency. Meaningful investments have been made to upgrade the technology infrastructure. And the organic growth of the business has accelerated each quarter, a byproduct of a more focused business. We believe that Nielsen must continue to execute and shepherd the adoption of Nielsen ONE and work hard to restore any trust and credibility that may have been lost over the last six months.
| Annual Report | September 30, 2021 | 5 |
| Clarkston Funds | Shareholder Letter |
| September 30, 2021 (Unaudited) |
Stericycle, Inc. (SRCL)
Stericycle, in our opinion, is a high-quality business that is facing temporary challenges. Prior to the Clarkston Funds initiating a position in Stericycle, Stericycle’s management began acquiring businesses outside of its core competency. As a result, the business became more operationally complex and exposed to more cyclicality in its end markets. In addition, a portion of the core regulated medical waste business has faced pricing headwinds from certain customer segments. These new acquisitions, along with past practices gone unnoticed, led to operational challenges, increasing debt levels, and deteriorating economics. To counter these issues, management laid out a Business Transformation plan to streamline the business operations, implement a new enterprise resource planning (“ERP”) system, and divest non-core assets. We believe that the transformation plan spend, pricing issues, and end-market cyclicality are temporarily suppressing cash earnings, which obscures the quality of the core businesses.
It is our opinion that Regulated Medical Waste and Document Destruction are both competitively advantaged. Stericycle enjoys an approximate 30% market share in the ~$2.5B U.S. medical waste industry which is supported by 10 incinerators that are difficult to replicate due to the onerous permitting process. It also enjoys an approximate 50% market share in the ~$1.5B U.S. domestic document destruction industry where most of the competition is still highly fragmented. Because these addressable markets are small and offer only moderate growth, they do not attract much competition. Those that choose to compete are met with highly competitive barriers and have trouble garnering enough share or route density to compete with Stericycle, let alone generate a profit.
Led by a new management team, including CEO, CFO, and eight other executives, Stericycle has simplified the business. Since 2016, the company made 14 divestitures (11 since 2018), raising over $650M, and de-levered approximately two turns of net debt to EBITDA.
Hillenbrand, Inc. (HI)
Several recent purchases in the Clarkston Funds have been directed towards companies with elevated debt levels. On the surface, it may seem that we are growing comfortable with businesses that take on excessive debt, but this is not the case. Our decision to invest in these businesses was more thoughtful and deliberate. We are only comfortable investing in companies with higher debt when:
| 1. | the debt proceeds are allocated in a way that we believe increases the value of the business, |
| 6 | www.clarkstonfunds.com |
| Clarkston Funds | Shareholder Letter |
| September 30, 2021 (Unaudited) |
| 2. | the business, in all economic environments, generates ample cash flow to service the debt, and |
| 3. | the business has proven it has the capacity and intentions of reducing debt to reasonable levels. |
Hillenbrand is an example of a business that met all three of these requirements. In its first fiscal quarter of 2020, Hillenbrand closed on its largest acquisition ever, Milacron Holdings Corp. The Company funded the acquisition with debt, which drove leverage up from approximately 0.7x to 3.8x. We supported the value additive deal because it significantly expanded Hillenbrand’s presence in the attractive plastics processing value chain and further diversified the Company away from the slow growing Batesville casket business.
Hillenbrand’s diverse business mix mitigated the impact of COVID-19 and highlighted the resilience of its earning power. The Company quickly and aggressively reduced net leverage by more than two times EBITDA by the end of its fiscal third quarter 2021. In our view, Hillenbrand’s success in rapidly de-levering its balance sheet was due to a combination of factors including the following:
| · | A spike in COVID-19 related deaths bolstered the casket business and drove high incremental margins resulting in a windfall of cash. |
| · | The realization of Milacron synergies combined with tight expense and working capital management protected Hillenbrand’s profitability and cash flow. |
| · | The sale of non-core businesses (Cimcool, Red Valve, Abel Pump). |
Hillenbrand’s rapid debt paydown provided the Company with increased financial flexibility.
Change Healthcare, Inc. (CHNG)
On January 6, 2021, UnitedHealth Group Incorporated agreed to acquire Change Healthcare for $25.75 per share for a total consideration of about $8 billion. Based on internal analysis and early conversations with management, we initially expected the deal to close in the second half of 2021. However, rumors that the Department of Justice (“DOJ”) was considering a lawsuit to block the transaction began surfacing mid-summer.
On August 7, 2021, Change and UnitedHealth reached a timing agreement with the DOJ not to consummate the merger before 120 days have passed after certifying compliance with the agency’s request for additional information related to the merger. They also agreed to not certify compliance before September 15, 2021. This pushes the closing of the deal, if it is consummated, to no sooner than January 13, 2022. Still, we believe there is a high probability, albeit lower than we estimated in early 2021, the transaction closes in 2022. Our confidence hinges on the requirement that UnitedHealth can only call off the deal if the government mandated asset sales exceed $650M, or ~20% of Change's revenue.
As of September 30, 2021, Change’s shares traded near a 20% discount to the $25.75 per share takeout price, reflecting this uncertainty around the regulatory approval process. If the deal closes, the investment will realize an attractive return to investors in an environment where attractive values are difficult to find. Even If the deal is blocked by the DOJ, in our estimation Change remains a high-quality technology business positioned to capitalize on its critical role in the healthcare ecosystem trading at an attractive valuation. Additionally, as we have waited for a resolution on the deal, Change has continued to grow and improve its business fundamentals. It has restored revenue and EBTIDA to pre-COVID-19 levels, net debt has been reduced by approximately $45M, and the Company continues to win new contracts even as it awaits resolution of the deal. We believe the continued execution of the business and increasingly attractive economics are not being reflected in the share price as we continue to wait for a determination that should benefit shareholders regardless of the decision.
| Annual Report | September 30, 2021 | 7 |
| Clarkston Funds | Shareholder Letter |
| September 30, 2021 (Unaudited) |
We thank you for your continued confidence in the Clarkston Funds and we hope you stay safe and well.
Thank you,
| Jeffrey A. Hakala, CFA, CPA | Jerry W. Hakala, CFA |
 |  |
| 1 | The inception dates of the Institutional Classes of the Clarkston Partners Fund, the Clarkston Founders Fund, and the Clarkston Fund are 9/15/15, 1/31/17, and 4/1/16, respectively. |
| 2 | Average holding period as calculated by Reuters based on New York Stock Exchange data in June of 2020. Source: Reuters article dated August 3, 2020, “Buy, sell, repeat! No room for ‘hold’ in whipsawing markets”. |
| 3 | Based on the average annual portfolio turnover rate of the Clarkston Partners Fund since inception. |
| 4 | Free Cash Flow Yield is a company’s free cash flow divided by its market value, which is intended to capture Clarkston Capital's estimate of a company’s “normalized” free cash flow generation. |
| 5 | Multiple Expansion refers to a period when investors' perceptions improve, and as a result, they are willing to pay more for a dollar's worth of earnings. |
| 6 | Hurdle Rate is Clarkston Capital's internal return target for a company's minimum estimated IRR in order for that company to be considered for inclusion in a Fund's portfolio. |
| 7 | We believe a margin of safety exists when there is a significant discount to our estimate of intrinsic value at the time of purchase. |
| 8 | Clarkston Bench companies are the businesses that we have determined meet our quality standards and are eligible for portfolio inclusion when the price of the stock meets our valuation standards. |
| 8 | www.clarkstonfunds.com |
| Clarkston Funds | Shareholder Letter |
| September 30, 2021 (Unaudited) |
Past performance does not guarantee future results. The views and information discussed in this letter are as of the date of publication, are subject to change, and may not reflect the writer’s current views. The views expressed are those of Clarkston Capital Partners, LLC, the investment adviser to the Clarkston Funds, and represent an assessment of market conditions at a specific point in time, are opinions only and should not be relied upon as investment advice regarding a particular investment or markets in general. The information provided does not constitute a recommendation to buy or sell specific securities or investment vehicles. It should not be assumed that any investment will be profitable or will equal the performance of any securities or any sectors mentioned in this letter. The subject matter contained in this letter has been derived from several sources believed to be reliable and accurate at the time of compilation. Neither the Clarkston Funds nor Clarkston Capital Partners, LLC accepts any liability for losses, either direct or consequential, caused by the use of this information.
DISCLOSURES:
The Clarkston Funds invest in companies Clarkston Capital believes to be of high quality and believes to be undervalued relative to their expected long-term free cash flows. Clarkston Capital refers to this investment philosophy as “Quality Value”. Clarkston Capital defines high-quality companies as those that meet certain financial, business and management criteria, which may vary over time. These criteria include favorable profitability metrics, sustainable competitive advantages and capable management teams.
All references to portfolio holdings are as of September 30, 2021.
| Annual Report | September 30, 2021 | 9 |
| Clarkston Partners Fund | Portfolio Update |
| September 30, 2021 (Unaudited) |
Introduction
Investors have had a lot of concerns on their plate for the past twelve months. Fears over inflation and whether it is transitory or structural, COVID and its Delta variant, Chinese governmental interference and regulations, and the eternal struggle between growth and value all vie for attention, tugging market sentiment this way and that. Which is to say, it’s business as usual.
Market Commentary and Performance
Despite the chaos of the past year, the Russell 3000® Index finished the 12 months ended September 30, 2021 with an extraordinary increase of 31.88%. The Russell 3000® Growth Index gained 27.57%, well below the Russell 3000® Value Index, which rose by 36.64%.1
During the fiscal year ended September 30, 2021, the Clarkston Partners Fund – Institutional Class climbed by 29.33% versus its benchmark, the Russell 2500® Index’s staggering increase of 45.03%. The market at large was bolstered by the unprecedented environment of the pandemic, and its full effects are yet to be seen. As always, we look to the future; we believe the companies in the Fund’s portfolio have spent the past year reinvesting in their businesses and improving fundamentals, with an eye on long-term performance gains.
Below is a discussion of the top contributors to Fund performance and bottom contributors to or detractors from Fund performance during the fiscal year ended September 30, 2021:
Top Contributors
Top contributors to the Fund’s performance this past fiscal year included LPL Financial Holdings, Inc. (LPLA). Platform assets for LPL grew substantially over the last 12 months. A combination of strong organic flows, key client wins, an acquisition of Waddell & Reed advisors, and continued recovery in capital markets left LPL with AUM approaching $1.2 trillion. The shares likely benefitted from a rebound in capital markets and as interest rates increased materially from their lows. Additionally, the net interest revenue produced has high contribution margins that bolstered earning power. LPL introduced new product and platform offerings increasing the opportunity set for various types of advisors and monetization. These included different Business Solutions which show promising adoption and new platform capabilities expanding the pool for future advisor recruitment.
Affiliated Manager’s Group, Inc. (AMG) reached an important inflection point as flows turned positive for all affiliates, except AQR. This was driven by the company’s strategic repositioning, new affiliate investments, and existing affiliate business momentum. AMG made 5 new investments during the year, increasing its exposure to areas with strong client demand trends, including Environmental, Social, and Corporate Governance ("ESG")2, private credit, and real estate. Management continued to return excess free cash flow to shareholders through repurchases and is on pace to retire greater than 10% of the shares outstanding for the year.
Shares of Change Healthcare, Inc. (CHNG) benefited from the January 2021 merger agreement announcement with UnitedHealth Group Incorporated (UNH). UnitedHealth agreed to acquire Change for $25.75 per share, a total consideration of about $8B. Based on internal analysis and early conversations with management, we initially expected the deal to close in the second half of 2021. However, rumors that the Department of Justice (“DOJ”) was considering a lawsuit to block the transaction began surfacing mid-summer. In August, Change and UnitedHealth reached a timing agreement with the DOJ that likely pushes the closing of the deal, if it is consummated, to no sooner than mid-January 2022. At the end of September, Change was trading at a 19% discount to the $25.75 per share takeout price, reflecting uncertainty around the regulatory approval process and ultimate closure of the deal. We feel that the transaction could close given the structure of the deal, particularly the requirement that United Health can only call off the deal if the government mandated asset sales exceed ~20% of Change's revenue. If the deal does not close, however, we are still excited to own Change and believe it can compound intrinsic value for a long time.
| 10 | www.clarkstonfunds.com |
| Clarkston Partners Fund | Portfolio Update |
| September 30, 2021 (Unaudited) |
Nielsen Holdings Plc (NLSN), another top contributor, completed the sale of Global Connect to Advent International in March, completing its transformation to a singularly focused media organization. Nielsen received ~$2.4B in net proceeds from the transaction, which allowed them to pay down debt and better position the balance sheet for future growth investments. The roll out of Nielsen ONE - a cross media measurement currency - remains on track and Nielsen secured important partnerships and client endorsements over the past 12 months.
The final top contributor, Molson Coors Beverage Company Class B (TAP) continued to benefit from the execution of their revitalization plan. As such, their above premium portfolio reached its highest percentage of the company’s total revenue since the MillerCoors joint venture in 2008 and the seltzer portfolio is now the No. 4 player in the space. During the first half of the year, many restaurants and on-premise locations were still closed or at limited capacity due to restrictions and mandates. Molson has continued to see a recovery in volumes in this space as many restrictions have been lifted. Despite the difficulties of the pandemic throughout the year, Molson Coors remained disciplined with their capital allocation priorities reducing debt by ~988M from Q2 2020 through Q2 2021. Additionally, management reinstated the dividend in Q2 2021 as business conditions continued to improve.
Bottom Contributors/Detractors
The bottom five performing holdings this fiscal year included Altice USA, Inc. Class A (ATUS). Altice nearly doubled its net subscriber growth in 2020 as Manhattan area residents flocked to the tri-state suburbs where Altice has a large presence. Unfortunately, however, the same dynamics that led to strong growth in 2020 began to reverse in 2021, resulting in flat net subscriber growth. In our view Altice remains attractively valued, however, with a free cash flow yield (free cash flow divided by the company’s market value) well into the double digits.
Global supply chain disruptions and a tight freight market increased freight costs faster than C.H. Robinson Worldwide, Inc.’s (CHRW) contracted customer rates, thus pressuring gross profit margins. To combat rising costs, management implemented shorter contract cycles, pricing negotiations, and a mix shift towards the spot market. Due to the cyclical nature of the industry, these headwinds typically reverse and serve as a tailwind in a loose freight market as CHRW's costs fall faster than their contracted rates. Global Forwarding has been a bright spot throughout the year and continues to benefit from increased volumes in constrained Ocean and Airfreight markets. However, positive performance in this segment has not managed to completely offset margin pressure in the North American Surface Transportation segment. We strongly feel that C.H. Robinson remains integral to the transportation network as they connect a fragmented base of shippers with a fragmented base of carriers.
Another bottom performer was US Ecology, Inc. (ECOL). Industrial activity and hazardous waste volumes have been slow to recover from the pandemic. The company is experiencing input cost and wage inflation, impacting the short-term economics of the business. These headwinds are not structural in nature and US Ecology will continue to utilize pricing initiatives to combat inflationary headwinds. We remain confident in our view that US Ecology is a high-quality, micro-niche business as they operate five of the 20 permitted hazardous waste landfills in North America. Hazardous waste disposal is a highly regulated, mission critical process that will continue to recover as industrial activity, manufacturing, and other related activities return.
As the pandemic forced a step-up in digital adoption for remittance transactions, fears increased regarding Western Union Company’s (WU) ability to compete effectively against largely digital-only players. Many of these concerns became more mainstream with a handful of successful public market debuts by these competitors. Still, Western Union accomplished much during the last twelve months. They continued to expand on their partnerships and announced two large agreements, including Walmart, who historically had an exclusive relationship with a major traditional competitor. Western Union also acquired a minority stake in STC Pay, a digital wallet offered by Saudi Telecom where they will play a processor role.
| Annual Report | September 30, 2021 | 11 |
| Clarkston Partners Fund | Portfolio Update |
| September 30, 2021 (Unaudited) |
Rounding out the bottom five was Landstar System, Inc. (LSTR)., a position which the Fund exited due to valuation. Landstar continued to benefit from a tight freight environment as spot rates continued to rise. This environment provided optimal conditions for LSTR to exceed their normalized earning power. Clarkston did not believe this increase in earnings provided a permanent step-up, especially if freight markets normalize over time. Therefore, we sold the shares due to valuation. In our view, Landstar remains a high quality, understandable business that Clarkston would happily own again but at a lower price.
Initiations and Eliminations
During the fiscal year ended September 30, 2021, we initiated a position in Altice USA, Inc. Class A (ATUS).
As referenced above, we eliminated the Fund’s small position in Landstar System, Inc. (LSTR) as the share price climbed to a level far above our estimate of intrinsic value. We also eliminated the Fund’s position in Sabre Corp. (SABR) as the share price reached our assessment of fair value.
The Fund’s Portfolio
We continue to believe that most businesses are fully to generously overvalued, especially those companies we consider to be of high quality. However, there have been isolated instances where the share price of a business has been unfairly punished, in our opinion. This has resulted in limited but attractive opportunities for the Fund. Overall, we judiciously deployed roughly five percentage points of cash during the 12 months ended September 30, 2021.
While the short-term performance may not reflect it, we believe the businesses in the Fund have also proven their ability to navigate challenging environments. In our estimation, these companies have capitalized on trying times by exploiting weaker competitors, strengthening their balance sheets and leaning-out operations where necessary. Many of them have sold non-core assets, paid down debt, and reallocated capital to their core segments.
Conclusion
Although we may be in a more traditional investing environment once again, our core values have not changed, nor will they. We ever endeavor to be the most knowledgeable investors we can and upturn every stone to find unseen value. We thank you for your continued confidence and support. Be safe and well.
| 1 | The Russell 3000® Index measures the performance of the largest 3,000 U.S. companies representing approximately 98% of the investable U.S. equity market. The Russell 3000® Value Index measures the performance of the broad value segment of the US equity value universe. It includes those Russell 3000 companies with relatively lower valuation measures. The Russell 3000® Growth Index includes companies that display signs of above-average growth and is used to provide a gauge of the performance of growth stocks in the United States. |
| 2 | ESG is a set of standards for a company’s operations that socially conscious investors use to screen potential investments. |
| 12 | www.clarkstonfunds.com |
| Clarkston Partners Fund | Portfolio Update |
| September 30, 2021 (Unaudited) |
| Top Ten Holdings (as a % of Net Assets)* | |
| Change Healthcare, Inc. | 8.18% |
| Nielsen Holdings PLC | 7.60% |
| LPL Financial Holdings, Inc. | 7.45% |
| Stericycle, Inc. | 5.92% |
| Affiliated Managers Group, Inc. | 5.88% |
| Altice USA, Inc., Class A | 5.77% |
| Hillenbrand, Inc. | 5.63% |
| CDK Global, Inc. | 4.94% |
| Willis Towers Watson PLC | 4.91% |
| Molson Coors Beverage Co. | 4.50% |
| Top Ten Holdings | 60.78% |
| Sector Allocation (as a % of Net Assets)* | |
| Financials | 28.78% |
| Consumer Staples | 13.28% |
| Technology | 13.12% |
| Industrials | 12.58% |
| Consumer Discretionary | 11.36% |
| Utilities | 7.85% |
| Telecommunications | 5.77% |
| Cash, Cash Equivalents, & Other Net Assets | 7.26% |
| Total | 100.00% |
| * | Holdings are subject to change, and may not reflect the current or future position of the portfolio. |
| Annual Report | September 30, 2021 | 13 |
| Clarkston Partners Fund | Portfolio Update |
| September 30, 2021 (Unaudited) |
Performance of a Hypothetical $25,000 Initial Investment (at Inception* through September 30, 2021)

The graph shown above represents historical performance of a hypothetical investment of $25,000 in the Institutional Class. Due to differing expenses, performance of the Founders Class will vary. Past performance does not guarantee future results. All returns reflect reinvested dividends, but do not reflect the deduction of taxes that a shareholder would pay on Fund distributions or the redemption of Fund shares.
Average Annual Total Returns (as of September 30, 2021)
| 1 Year | 3 Year | 5 Year | Since Inception* | |
| Clarkston Partners Fund – Founders Class | 29.47% | 11.04% | 10.93% | 10.91% |
| Clarkston Partners Fund – Institutional Class | 29.33% | 10.94% | 10.81% | 10.77% |
| Russell 2500TM Index TR | 45.03% | 12.47% | 14.25% | 13.21% |
The performance data quoted above represents past performance. Past performance is not a guarantee of future results. Recent market volatility may have meaningfully impacted performance. There is no guarantee that any positive impact will be repeated. Investment return and value of the Fund shares will fluctuate so that an investor’s shares, when sold or redeemed, may be worth more or less than their original cost. Performance may be lower or higher than performance data quoted. Fund performance current to the most recent month end is available by calling (844) 680-6562 or by visiting www.clarkstonfunds.com.
| * | Fund’s inception date is September 15, 2015. |
The Russell 2500TM Index TR measures the performance of the small- to mid-cap segment of the U.S. equity universe, commonly referred to as “smid” cap. The Russell 2500TM Index TR is a subset of the Russell 3000® Index. It includes approximately 2,500 of the smallest securities based on a combination of their market cap and current index membership. The Russell 2500TM Index TR is constructed to provide a comprehensive and unbiased barometer for the small- to mid-cap segment. The Russell 3000® Index measures the performance of the largest 3,000 U.S. companies representing approximately 98% of the investable U.S. equity market.
| 14 | www.clarkstonfunds.com |
| Clarkston Partners Fund | Portfolio Update |
| September 30, 2021 (Unaudited) |
Frank Russell Company (“Russell”) is the source and owner of the trademarks, service marks and copyrights related to the Russell Indexes. Russell® is a trademark of Frank Russell Company. Neither Russell nor its licensors accept any liability for any errors or omissions in the Russell Indexes or underlying data and no party may rely on any Russell Indexes and/or underlying data contained in this communication. No further distribution of Russell Data is permitted without Russell’s express written consent. Russell does not promote, sponsor or endorse the content of this communication.
Returns of less than 1 year are cumulative.
Indices are not actively managed and do not reflect a deduction for fees, expenses or taxes. An investor cannot invest directly in an index.
The returns shown above do not reflect the deduction of taxes a shareholder would pay on Fund distributions or redemption of Fund shares.
The total annual operating expenses and total annual operating expenses after fee waivers and/or reimbursement for the Fund’s Founders Class and Institutional Class shares (as reported in the January 28, 2021 Prospectus), are 0.91% and 0.85% and 1.06% and 1.00%, respectively. The Fund’s investment adviser has contractually agreed to limit expenses through January 31, 2022.
All references to portfolio holdings are as of September 30, 2021.
| Annual Report | September 30, 2021 | 15 |
| Clarkston Fund | Portfolio Update |
| September 30, 2021 (Unaudited) |
Introduction
Investors have had a lot of concerns on their plate for the past twelve months. Fears over inflation and whether it is transitory or structural, COVID and its Delta variant, Chinese governmental interference and regulations, and the eternal struggle between growth and value all vie for attention, tugging market sentiment this way and that. Which is to say, it’s business as usual.
Market Commentary and Performance
Despite the chaos of the past year, the Russell 3000® Index finished the 12 months ended September 30, 2021 with an extraordinary increase of 31.88%. The Russell 3000® Growth Index gained 27.57%, well below the Russell 3000® Value Index, which rose by 36.64%.1
During the fiscal year ended September 30, 2021, the Clarkston Fund climbed by 30.08% versus its benchmark, the Russell 1000® Index’s increase of 30.96%. The market at large was bolstered by the unprecedented environment of the pandemic, and its full effects are yet to be seen. As always, we look to the future; we believe the companies in the Fund’s portfolio have spent the past year reinvesting in their businesses and improving fundamentals, with an eye on long-term performance gains.
Below is a discussion of the top contributors to Fund performance and bottom contributors to or detractors from Fund performance during the fiscal year ended September 30, 2021:
Top Contributors
Top contributors to the Fund’s performance this past fiscal year included General Electric Company (GE). CEO Larry Culp’s transformation plan into a lean, focused industrial company is well underway as evidenced by operational execution and asset sales. Organic growth and margin expansion in the Healthcare and Power segments combined with improving Industrial free cash flow highlighted the strength of GE’s underlying fundamentals. The company significantly strengthened its balance sheet reducing debt by ~$53B since the end of FY2018 via asset sales, pension de-risking, and by discontinuing its receivables factoring program.
As the COVID-19 pandemic began to subside, clarity around macro trends and the effects on Capital One Financial Corporation (COF) became more apparent. Net charge-offs decreased to historical lows and large provisions for anticipated credit losses began to reverse, leading to strong earnings. During the pandemic, Capital One operated with a substantially over capitalized balance sheet. An easing of restrictions around capital allocation from the Federal Reserve enabled the company to return a portion of this capital to shareholders in the form of larger dividend payments, special dividends, and share repurchases. A rebound in interest rates theoretically facilitates Capital One’s ability to increase rates on various loan products as well, which will lead to potentially higher earning power.
Another top contributor was Affiliated Manager’s Group, Inc. (AMG). AMG reached an important inflection point as flows turned positive for all affiliates, except AQR. This was driven by the company’s strategic repositioning, new affiliate investments, and existing affiliate business momentum. AMG made 5 new investments during the year, increasing its exposure to areas with strong client demand trends, including ESG, private credit, and real estate. Management continued to return excess free cash flow to shareholders through repurchases and is on pace to retire greater than 10% of the shares outstanding for the year.
| 16 | www.clarkstonfunds.com |
| Clarkston Fund | Portfolio Update |
| September 30, 2021 (Unaudited) |
Charles Schwab Corporation (SCHW) closed on the acquisition of TD Ameritrade in Q4 2020. This transformational deal further cemented the business as a preeminent destination for retail investors and their advisors. We believe that scale benefits should accrue over time with AUM ending the year at $7.6 trillion. With interest rates rebounding throughout the year, Schwab's ability to generate high margin net interest revenue increased substantially. We estimate a 0.25% increase in net interest margin adds approximately $1.5 billion in earning power.
The final top contributor for the year was American Express Company (AXP). The economic recovery from the pandemic provided clarity and strong gains in consumer spending. Overall spending recovered completely and the company expects it to eclipse 2019 levels this year. Net charge-off rates continued to trend lower during the last 12 months. The net charge-off rate peaked at 2.8% in Q2 2020 and ended at 1.0% in Q2 2021, well below historical averages. Sequential card growth and increases in interest rates throughout the year added to earning power.
Bottom Contributors/Detractors
The bottom five performing holdings this fiscal year included Altice USA, Inc. Class A (ATUS). Altice nearly doubled its net subscriber growth in 2020 as Manhattan area residents flocked to the tri-state suburbs where Altice has a large presence. Unfortunately, however, the same dynamics that led to strong growth in 2020 began to reverse in 2021, resulting in flat net subscriber growth. In our view Altice remains attractively valued, however, with a free cash flow yield (free cash flow divided by the company’s market value) well into the double digits.
Global supply chain disruptions and a tight freight market increased freight costs faster than C.H. Robinson Worldwide, Inc.’s (CHRW) contracted customer rates, thus pressuring gross profit margins. To combat rising costs, management implemented shorter contract cycles, pricing negotiations, and a mix shift towards the spot market. Due to the cyclical nature of the industry, these headwinds typically reverse and serve as a tailwind in a loose freight market as CHRW's costs fall faster than their contracted rates. Global Forwarding has been a bright spot throughout the year and continues to benefit from increased volumes in constrained Ocean and Airfreight markets. However, positive performance in this segment has not managed to completely offset margin pressure in the North American Surface Transportation segment. We strongly feel that C.H. Robinson remains integral to the transportation network as they connect a fragmented base of shippers with a fragmented base of carriers.
We eliminated three bottom performers from the Fund’s portfolio during the fiscal year, not because they underperformed the average holding in the Fund’s portfolio, but because the share prices of all three had already ascended above and beyond our estimation of intrinsic value. These businesses included Nestle S.A. Sponsored ADR (NSRGY), Procter & Gamble Company (PG), and PepsiCo, Inc. (PEP). All three possess a collection of high-quality brands with strong fundamentals, but we chose to exit the Fund from the businesses and allocate capital to more attractively valued opportunities.
Initiations and Eliminations
During the fiscal year ended September 30, 2021, we initiated positions in Altice USA, Inc. Class A (ATUS), Brown & Brown, Inc. (BRO), LPL Financial Holdings Inc. (LPLA), Post Holdings, Inc. (POST), and US Foods Holding Corp. (USFD). We eliminated the Fund’s positions in Diageo plc Sponsored ADR (DEO), Nestle S.A. Sponsored ADR (NSRGY), PepsiCo, Inc. (PEP), Procter & Gamble Company (PG), U.S. Bancorp (USB), and United Parcel Service, Inc. Class B (UPS). These positions were eliminated largely due to over-valuation; proceeds from these sales were allocated into newly initiated holdings. We also initiated and later eliminated the Fund’s position in Fox Corporation (FOXA) as the share price climbed to a level far above our estimate of intrinsic value.
| Annual Report | September 30, 2021 | 17 |
| Clarkston Fund | Portfolio Update |
| September 30, 2021 (Unaudited) |
The Fund’s Portfolio
We continue to believe that most businesses are fully to generously overvalued, especially those companies we consider to be of high quality. However, there have been isolated instances where the share price of a business has been unfairly punished, in our opinion. This has resulted in limited but attractive opportunities for the Fund. Overall, the Fund accumulated roughly six percentage points of cash during the 12 months ended September 30, 2021.
While the short-term performance may not reflect it, we believe the businesses in the Fund have also proven their ability to navigate challenging environments. In our estimation, these companies have capitalized on trying times by exploiting weaker competitors, strengthening their balance sheets and leaning-out operations where necessary. Many of them have sold non-core assets, paid down debt, and reallocated capital to their core segments.
Conclusion
Although we may be in a more traditional investing environment once again, our core values have not changed, nor will they. We ever endeavor to be the most knowledgeable investors we can and upturn every stone to find unseen value. We thank you for your continued confidence and support. Be safe and well.
| 1 | The Russell 3000® Index measures the performance of the largest 3,000 U.S. companies representing approximately 98% of the investable U.S. equity market. The Russell 3000® Value Index measures the performance of the broad value segment of the US equity value universe. It includes those Russell 3000 companies with relatively lower valuation measures. The Russell 3000® Growth Index includes companies that display signs of above-average growth and is used to provide a gauge of the performance of growth stocks in the United States. |
| 18 | www.clarkstonfunds.com |
| Clarkston Fund | Portfolio Update |
| September 30, 2021 (Unaudited) |
Top Ten Holdings (as a % of Net Assets)*
| Nielsen Holdings PLC | 9.01% |
| Altice USA, Inc., Class A | 6.14% |
| Anheuser-Busch InBev SA/NV | 5.99% |
| General Electric Co. | 5.79% |
| Molson Coors Beverage Co. | 5.68% |
| Willis Towers Watson PLC | 4.75% |
| American Express Co. | 4.65% |
| FedEx Corp. | 4.37% |
| Capital One Financial Corp. | 4.30% |
| Affiliated Managers Group, Inc. | 4.01% |
| Top Ten Holdings | 54.69% |
Sector Allocation (as a % of Net Assets)*
| Industrials | 26.29% |
| Financials | 21.88% |
| Consumer Staples | 20.40% |
| Consumer Discretionary | 9.79% |
| Telecommunications | 6.14% |
| Technology | 2.30% |
| Cash, Cash Equivalents, & Other Net Assets | 13.20% |
| Total | 100.00% |
| * | Holdings are subject to change, and may not reflect the current or future position of the portfolio. |
| Annual Report | September 30, 2021 | 19 |
| Clarkston Fund | Portfolio Update |
| September 30, 2021 (Unaudited) |
Performance of a Hypothetical $10,000 Initial Investment (at Inception* through September 30, 2021)

The graph shown above represents historical performance of a hypothetical investment of $10,000 in the Institutional Class. Past performance does not guarantee future results. All returns reflect reinvested dividends, but do not reflect the deduction of taxes that a shareholder would pay on Fund distributions or the redemption of Fund shares.
Average Annual Total Returns (as of September 30, 2021)
| 1 Year | 3 Year | 5 Year | Since Inception* | |
| Clarkston Fund – Institutional Class | 30.08% | 13.30% | 11.17% | 11.13% |
| Russell 1000® Index TR | 30.96% | 16.43% | 17.11% | 16.68% |
The performance data quoted above represents past performance. Past performance is not a guarantee of future results. Recent market volatility may have meaningfully impacted performance. Investment return and value of the Fund shares will fluctuate so that an investor’s shares, when sold or redeemed, may be worth more or less than their original cost. Performance may be lower or higher than performance data quoted. Fund performance current to the most recent month-end is available by calling (844) 680-6562 or by visiting www.clarkstonfunds.com.
| * | Fund’s inception date is April 1, 2016. |
The Russell 1000® Index TR measures the performance of the large-cap segment of the U.S. equity universe. It is a subset of the Russell 3000® Index and includes approximately 1,000 of the largest securities based on a combination of their market cap and current index membership. The Russell 1000® Index TR represents approximately 92% of the U.S. market. The Russell 1000® Index TR is constructed to provide a comprehensive and unbiased barometer for the large-cap segment and is completely reconstituted annually to ensure new and growing equities are reflected.
Frank Russell Company (“Russell”) is the source and owner of the trademarks, service marks and copyrights related to the Russell Indexes. Russell® is a trademark of Frank Russell Company. Neither Russell nor its licensors accept any liability for any errors or omissions in the Russell Indexes or underlying data and no party may rely on any Russell Indexes and/or underlying data contained in this communication. No further distribution of Russell Data is permitted without Russell’s express written consent. Russell does not promote, sponsor or endorse the content of this communication.
| 20 | www.clarkstonfunds.com |
| Clarkston Fund | Portfolio Update |
| September 30, 2021 (Unaudited) |
Returns of less than 1 year are cumulative.
Indices are not actively managed and do not reflect a deduction for fees, expenses or taxes. An investor cannot invest directly in an index.
The returns shown above do not reflect the deduction of taxes a shareholder would pay on Fund distributions or redemption of Fund shares.
The total annual operating expenses and total annual operating expenses after fee waivers and/or reimbursement for the Fund’s Institutional Class shares (as reported in the January 28, 2021 Prospectus), are 0.92% and 0.70%, respectively. The Fund’s investment adviser has contractually agreed to limit expenses through January 31, 2022.
All references to portfolio holdings are as of September 30, 2021.
| Annual Report | September 30, 2021 | 21 |
| Clarkston Founders Fund | Portfolio Update |
| September 30, 2021 (Unaudited) |
Introduction
Investors have had a lot of concerns on their plate for the past twelve months. Fears over inflation and whether it is transitory or structural, COVID and its Delta variant, Chinese governmental interference and regulations, and the eternal struggle between growth and value all vie for attention, tugging market sentiment this way and that. Which is to say, it’s business as usual.
Market Commentary and Performance
Despite the chaos of the past year, the Russell 3000® Index finished the 12 months ended September 30, 2021 with an extraordinary increase of 31.88%. The Russell 3000® Growth Index gained 27.57%, well below the Russell 3000® Value Index, which rose by 36.64%.1
During the year ended September 30, 2021, the Clarkston Founders Fund – Institutional Class climbed by 23.31% versus its benchmark, the Russell Midcap® Index’s staggering increase of 38.11%. The market at large was bolstered by the unprecedented environment of the pandemic, and its full effects are yet to be seen. As always, we look to the future; we believe the companies in the Fund’s portfolio have spent the past year reinvesting in their businesses and improving fundamentals, with an eye on long-term performance gains.
Below is a discussion of the top contributors to Fund performance and bottom contributors to or detractors from Fund performance during the fiscal year ended September 30, 2021:
Top Contributors
Top contributors to the Fund’s performance this past fiscal year included Affiliated Manager’s Group, Inc. (AMG). AMG reached an important inflection point as flows turned positive for all affiliates, except AQR. This was driven by the company’s strategic repositioning, new affiliate investments, and existing affiliate business momentum. AMG made 5 new investments during the year, increasing its exposure to areas with strong client demand trends, including ESG, private credit, and real estate. Management continued to return excess free cash flow to shareholders through repurchases and is on pace to retire greater than 10% of the shares outstanding for the year.
Shares of Change Healthcare, Inc. (CHNG) benefited from the January 2021 merger agreement announcement with UnitedHealth Group Incorporated (UNH). UnitedHealth agreed to acquire Change for $25.75 per share, a total consideration of about $8B. Based on internal analysis and early conversations with management, we initially expected the deal to close in the second half of 2021. However, rumors that the Department of Justice (“DOJ”) was considering a lawsuit to block the transaction began surfacing mid-summer. In August, Change and UnitedHealth reached a timing agreement with the DOJ that likely pushes the closing of the deal, if it is consummated, to no sooner than mid-January 2022. At the end of September, Change was trading at a 19% discount to the $25.75 per share takeout price, reflecting uncertainty around the regulatory approval process and ultimate closure of the deal. We feel that the transaction could close given the structure of the deal, particularly the requirement that United Health can only call off the deal if the government mandated asset sales exceed ~20% of Change's revenue. If the deal does not close, however, we are still excited to own Change and believe it can compound intrinsic value for a long time.
Nielsen Holdings Plc (NLSN), another top contributor, completed the sale of Global Connect to Advent International in March, completing its transformation to a singularly focused media organization. Nielsen received ~$2.4B in net proceeds from the transaction, which allowed them to pay down debt and better position the balance sheet for future growth investments. The roll out of Nielsen ONE - a cross media measurement currency - remains on track and Nielsen secured important partnerships and client endorsements over the past 12 months.
| 22 | www.clarkstonfunds.com |
| Clarkston Founders Fund | Portfolio Update |
| September 30, 2021 (Unaudited) |
Platform assets for LPL Financial Holdings, Inc. (LPLA) grew substantially over the last 12 months. A combination of strong organic flows, key client wins, an acquisition of Waddell & Reed advisors, and continued recovery in capital markets left LPL with AUM approaching $1.2 trillion. The shares likely benefitted from a rebound in capital markets and as interest rates increased materially from their lows. Additionally, the net interest revenue produced has high contribution margins that bolstered earning power. LPL introduced new product and platform offerings increasing the opportunity set for various types of advisors and monetization. These included different Business Solutions which show promising adoption and new platform capabilities expanding the pool for future advisor recruitment.
The final top contributor, Molson Coors Beverage Company Class B (TAP) continued to benefit from the execution of their revitalization plan. As such, their above premium portfolio reached its highest percentage of the company’s total revenue since the MillerCoors joint venture in 2008 and the seltzer portfolio is now the No. 4 player in the space. During the first half of the year, many restaurants and on-premise locations were still closed or at limited capacity due to restrictions and mandates. Molson has continued to see a recovery in volumes in this space as many restrictions have been lifted. Despite the difficulties of the pandemic throughout the year, Molson Coors remained disciplined with their capital allocation priorities reducing debt by ~988M from Q2 2020 through Q2 2021. Additionally, management reinstated the dividend in Q2 2021 as business conditions continued to improve.
Bottom Contributors/Detractors
The bottom five performing holdings this fiscal year included Altice USA, Inc. Class A (ATUS). Altice nearly doubled its net subscriber growth in 2020 as Manhattan area residents flocked to the tri-state suburbs where Altice has a large presence. Unfortunately, however, the same dynamics that led to strong growth in 2020 began to reverse in 2021, resulting in flat net subscriber growth. In our view Altice remains attractively valued, however, with a free cash flow yield (free cash flow divided by the company’s market value) well into the double digits.
Global supply chain disruptions and a tight freight market increased freight costs faster than C.H. Robinson Worldwide, Inc.’s (CHRW) contracted customer rates, thus pressuring gross profit margins. To combat rising costs, management implemented shorter contract cycles, pricing negotiations, and a mix shift towards the spot market. Due to the cyclical nature of the industry, these headwinds typically reverse and serve as a tailwind in a loose freight market as CHRW's costs fall faster than their contracted rates. Global Forwarding has been a bright spot throughout the year and continues to benefit from increased volumes in constrained Ocean and Airfreight markets. However, positive performance in this segment has not managed to completely offset margin pressure in the North American Surface Transportation segment. We strongly feel that C.H. Robinson remains integral to the transportation network as they connect a fragmented base of shippers with a fragmented base of carriers.
The Fund held a small position in Sabre Corp. (SABR) entering 2020 and acquired a larger position in late February and early March of 2020 as the share price dropped. Initially, we believed COVID-19’s effects would be severe, but the spread would be fairly contained. What we failed to understand, like many experts, is that COVID-19 and its level of infectiousness was unlike anything we have seen and would have longer-term ramifications on business travel, where Sabre generated much of its revenue. While we believe Sabre can prosper even in a depressed travel environment, it is impossible to estimate profitability given the many unknowns. The Company also raised capital to navigate the difficult environment, which reduced materially our appraisal of fair value. Positive vaccine news during the fourth quarter of 2020 rapidly drove Sabre’s share price upward. Consequently, we capitalized on the opportunity to sell the Fund’s shares.
| Annual Report | September 30, 2021 | 23 |
| Clarkston Founders Fund | Portfolio Update |
| September 30, 2021 (Unaudited) |
As the pandemic forced a step-up in digital adoption for remittance transactions, fears increased regarding Western Union Company’s (WU) ability to compete effectively against largely digital-only players. Many of these concerns became more mainstream with a handful of successful public market debuts by these competitors. Still, Western Union accomplished much during the last twelve months. They continued to expand on their partnerships and announced two large agreements, including Walmart, who historically had an exclusive relationship with a major traditional competitor. Western Union also acquired a minority stake in STC Pay, a digital wallet offered by Saudi Telecom where they will play a processor role.
Rounding out the bottom performers was FedEx Corporation (FDX). The growth of ecommerce volumes and a capacity-constrained environment boded well for FedEx as they reached record revenues and net income during FY2021. However, labor shortages and inflationary costs mitigated some of the efficiencies of their global network as packages were rerouted due to limited labor availability. These headwinds are expected to subside as FedEx continued initiatives such as targeted pay premiums and national hiring days. Despite increased costs, we believe that FedEx remains well positioned to benefit from continued growth of volumes while achieving network efficiencies.
Initiations and Eliminations
During the fiscal year ended September 30, 2021, we initiated a position in Altice USA, Inc. Class A (ATUS).
We eliminated the Fund’s position in Fox Corporation (FOXA) as the share price climbed to a level far above our estimate of intrinsic value. We also eliminated the Fund’s position in Sabre Corp. (SABR) as referenced above.
The Fund’s Portfolio
We continue to believe that most businesses are fully to generously overvalued, especially those companies we consider to be of high quality. However, there have been isolated instances where the share price of a business has been unfairly punished, in our opinion. This has resulted in limited but attractive opportunities for the Fund. Overall, we judiciously deployed roughly two percentage points of cash during the 12 months ended September 30, 2021.
While the short-term performance may not reflect it, we believe the businesses in the Fund have also proven their ability to navigate challenging environments. In our estimation, these companies have capitalized on trying times by exploiting weaker competitors, strengthening their balance sheets and leaning-out operations where necessary. Many of them have sold non-core assets, paid down debt, and reallocated capital to their core segments.
Conclusion
Although we may be in a more traditional investing environment once again, our core values have not changed, nor will they. We ever endeavor to be the most knowledgeable investors we can and upturn every stone to find unseen value. We thank you for your continued confidence and support. Be safe and well.
| 1 | The Russell 3000® Index measures the performance of the largest 3,000 U.S. companies representing approximately 98% of the investable U.S. equity market. The Russell 3000® Value Index measures the performance of the broad value segment of the US equity value universe. It includes those Russell 3000 companies with relatively lower valuation measures. The Russell 3000® Growth Index includes companies that display signs of above-average growth and is used to provide a gauge of the performance of growth stocks in the United States. |
| 24 | www.clarkstonfunds.com |
| Clarkston Founders Fund | Portfolio Update |
| September 30, 2021 (Unaudited) |
Top Ten Holdings (as a % of Net Assets)*
| Nielsen Holdings PLC | 8.59% |
| Change Healthcare, Inc. | 6.67% |
| Molson Coors Beverage Co. | 5.88% |
| Stericycle, Inc. | 5.77% |
| Altice USA, Inc., Class A | 5.58% |
| Anheuser-Busch InBev SA/NV | 5.42% |
| CDK Global, Inc. | 5.40% |
| Brown & Brown, Inc. | 5.18% |
| Willis Towers Watson PLC | 4.73% |
| LPL Financial Holdings, Inc. | 4.50% |
| Top Ten Holdings | 57.72% |
Sector Allocation (as a % of Net Assets)*
| Financials | 24.44% |
| Consumer Staples | 20.08% |
| Technology | 12.06% |
| Industrials | 8.93% |
| Consumer Discretionary | 8.59% |
| Utilities | 5.77% |
| Telecommunications | 5.58% |
| Cash, Cash Equivalents, & Other Net Assets | 14.55% |
| Total | 100.00% |
| * | Holdings are subject to change, and may not reflect the current or future position of the portfolio. |
| Annual Report | September 30, 2021 | 25 |
| Clarkston Founders Fund | Portfolio Update |
| September 30, 2021 (Unaudited) |
Performance of a Hypothetical $10,000 Initial Investment (at Inception* through September 30, 2021)

The graph shown above represents historical performance of a hypothetical investment of $10,000 in the Institutional Class. Due to differing expenses, performance of the Founders Class will vary. Past performance does not guarantee future results. All returns reflect reinvested dividends, but do not reflect the deduction of taxes that a shareholder would pay on Fund distributions or the redemption of Fund shares.
Average Annual Total Returns (as of September 30, 2021)
| 1 Year | 3 Year | Since Inception* | |
| Clarkston Founders Fund – Founders Class | – | – | -2.90% |
| Russell Midcap® Index TR | – | – | 6.50% |
| Clarkston Founders Fund – Institutional Class | 23.31% | 12.39% | 10.85% |
| Russell Midcap® Index TR | 38.11% | 14.22% | 14.14% |
The performance data quoted above represents past performance. Past performance is not a guarantee of future results. Recent market volatility may have meaningfully impacted performance. There is no guarantee that any positive impact will be repeated. Investment return and value of the Fund shares will fluctuate so that an investor’s shares, when sold or redeemed, may be worth more or less than their original cost. Performance may be lower or higher than performance data quoted. Fund performance current to the most recent month end is available by calling (844) 680-6562 or by visiting www.clarkstonfunds.com.
| * | Founders Class inception date is February 16, 2021 and Institutional Class inception date is January 31, 2017. |
The Russell Midcap® Index is a market capitalization weighted index that measures the performance of the mid-capitalization sector of the U.S. equity market and includes approximately 800 of the smallest issuers in the Russell 1000® Index. The Russell 1000® Index includes the 1,000 largest stocks in the Russell 3000® Index, which consists of the 3,000 largest U.S. public companies.
Frank Russell Company (“Russell”) is the source and owner of the trademarks, service marks and copyrights related to the Russell Indexes. Russell® is a trademark of Frank Russell Company.
| 26 | www.clarkstonfunds.com |
| Clarkston Founders Fund | Portfolio Update |
| September 30, 2021 (Unaudited) |
Neither Russell nor its licensors accept any liability for any errors or omissions in the Russell Indexes or underlying data and no party may rely on any Russell Indexes and/or underlying data contained in this communication. No further distribution of Russell Data is permitted without Russell’s express written consent. Russell does not promote, sponsor or endorse the content of this communication.
Returns of less than 1 year are cumulative.
Indices are not actively managed and do not reflect a deduction for fees, expenses or taxes. An investor cannot invest directly in an index.
The returns shown above do not reflect the deduction of taxes a shareholder would pay on Fund distributions or redemption of Fund shares.
The total annual operating expenses and total annual operating expenses after fee waivers and/or reimbursement for the Fund’s Institutional Class and Founders Class shares (as reported in the January 28, 2021 and February 12, 2021 Prospectus, respectively), are 1.15% and 0.95% and 1.00% and 0.80%, respectively. The Fund's investment advisor has contractually agreed to limit expenses of the Institutional Class and Founders Class through January 31, 2022 and February 28, 2022, respectively.
All references to portfolio holdings are as of September 30, 2021.
| Annual Report | September 30, 2021 | 27 |
| Clarkston Funds | Disclosure of Fund Expenses |
| September 30, 2021 (Unaudited) |
Example. As a shareholder of the Clarkston Partners Fund, Clarkston Fund, or Clarkston Founders Fund (the “Funds”), you incur one type of cost, ongoing costs, including management fees and other Fund expenses. The following examples are intended to help you understand your ongoing costs (in dollars) of investing in a Fund and to compare these costs with the ongoing costs of investing in other mutual funds. The examples are based on an investment of $1,000 invested on April 1, 2020 and held through September 30, 2021.
Actual Expenses. The first line under each class in the following table provides information about actual account values and actual expenses. You may use the information in this line, together with the amount you invested, to estimate the expenses that you paid over the period. Simply divide your account value by $1,000 (for example, an $8,600 account value divided by $1,000 = 8.6), then multiply the result by the number in the first line under the heading “Expenses Paid During Period April 1, 2020 – September 30, 2021” to estimate the expenses you paid on your account during this period.
Hypothetical Example for Comparison Purposes. The second line under each class in the following table provides information about hypothetical account values and hypothetical expenses based on a Fund’s actual expense ratio and an assumed rate of return of 5% per year before expenses, which is not the Fund’s actual return. The hypothetical account values and expenses may not be used to estimate the actual ending account balance or expenses you paid for the period. You may use this information to compare the ongoing costs of investing in a Fund and other mutual funds. To do so, compare this 5% hypothetical example with the 5% hypothetical examples that appear in the shareholder reports of the other funds.
Please note that the expenses shown in the table are meant to highlight your ongoing Fund costs only and do not reflect any transactional costs. Therefore, the second line under each class in the table below is useful in comparing ongoing costs only and will not help you determine the relative total costs of owning different funds. In addition, if these transactional costs were included, your costs would have been higher.
| 28 | www.clarkstonfunds.com |
| Clarkston Funds | Disclosure of Fund Expenses |
| September 30, 2021 (Unaudited) |
| Beginning Account Value April 1, 2021 | Ending Account Value September 30, 2021 | Expense Ratio(a) | Expenses Paid During Period April 1, 2021 - September 30, 2021(b) | |||||||||||||
| Clarkston Partners Fund | ||||||||||||||||
| Founders Class | ||||||||||||||||
| Actual | $ | 1,000.00 | $ | 928.60 | 0.85 | % | $ | 4.11 | ||||||||
| Hypothetical (5% return before expenses) | $ | 1,000.00 | $ | 1,020.81 | 0.85 | % | $ | 4.31 | ||||||||
| Institutional Class | ||||||||||||||||
| Actual | $ | 1,000.00 | $ | 928.20 | 0.95 | % | $ | 4.59 | ||||||||
| Hypothetical (5% return before expenses) | $ | 1,000.00 | $ | 1,020.31 | 0.95 | % | $ | 4.81 | ||||||||
| Clarkston Fund | ||||||||||||||||
| Institutional Class | ||||||||||||||||
| Actual | $ | 1,000.00 | $ | 971.10 | 0.66 | % | $ | 3.26 | ||||||||
| Hypothetical (5% return before expenses) | $ | 1,000.00 | $ | 1,021.76 | 0.66 | % | $ | 3.35 | ||||||||
| Clarkston Founders Fund | ||||||||||||||||
| Founders Class | ||||||||||||||||
| Actual | $ | 1,000.00 | $ | 936.70 | 0.80 | % | $ | 3.88 | ||||||||
| Hypothetical (5% return before expenses) | $ | 1,000.00 | $ | 1,021.06 | 0.80 | % | $ | 4.05 | ||||||||
| Institutional Class | ||||||||||||||||
| Actual | $ | 1,000.00 | $ | 936.70 | 0.86 | % | $ | 4.18 | ||||||||
| Hypothetical (5% return before expenses) | $ | 1,000.00 | $ | 1,020.76 | 0.86 | % | $ | 4.36 | ||||||||
| (a) | Each Fund's expense ratios have been annualized based on the Fund's most recent fiscal half-year expenses after any applicable waivers and reimbursements. |
| (b) | Expenses are equal to the annualized expense ratio shown above for the applicable class, multiplied by the average account value over the period, multiplied by the number of days in the most recent fiscal half year (183), divided by 365. |
| Annual Report | September 30, 2021 | 29 |
| Clarkston Partners Fund | Portfolio of Investments |
| September 30, 2021 |
| Shares | Value (Note 2) | |||||||
| COMMON STOCK (92.74%) | ||||||||
| Consumer Discretionary (11.36%) | ||||||||
| John Wiley & Sons, Inc., Class A | 1,090,000 | $ | 56,908,900 | |||||
| Nielsen Holdings PLC | 6,000,000 | 115,140,000 | ||||||
| Total Consumer Discretionary | 172,048,900 | |||||||
| Consumer Staples (13.28%) | ||||||||
| Molson Coors Beverage Co., Class B | 1,470,000 | 68,178,600 | ||||||
| Post Holdings, Inc.(a) | 375,000 | 41,310,000 | ||||||
| Sysco Corp. | 594,933 | 46,702,240 | ||||||
| US Foods Holding Corp.(a) | 1,300,000 | 45,058,000 | ||||||
| Total Consumer Staples | 201,248,840 | |||||||
| Financials (28.78%)(b) | ||||||||
| Affiliated Managers Group, Inc. | 589,585 | 89,080,398 | ||||||
| Artisan Partners Asset Management, Inc., Class A | 860,000 | 42,071,200 | ||||||
| Brown & Brown, Inc. | 1,100,000 | 60,995,000 | ||||||
| Franklin Resources, Inc. | 1,907,587 | 56,693,485 | ||||||
| LPL Financial Holdings, Inc. | 720,000 | 112,867,200 | ||||||
| Willis Towers Watson PLC | 320,000 | 74,387,200 | ||||||
| Total Financials | 436,094,483 | |||||||
| Industrials (12.58%) | ||||||||
| CH Robinson Worldwide, Inc. | 289,616 | 25,196,592 | ||||||
| Enerpac Tool Group Corp., Class A | 1,719,903 | 35,653,589 | ||||||
| Hillenbrand, Inc. | 2,000,000 | 85,300,000 | ||||||
| The Western Union Co. | 2,200,000 | 44,484,000 | ||||||
| Total Industrials | 190,634,181 | |||||||
| Technology (13.12%) | ||||||||
| CDK Global, Inc. | 1,760,000 | 74,888,000 | ||||||
| Change Healthcare, Inc.(a) | 5,920,000 | 123,964,800 | ||||||
| Total Technology | 198,852,800 | |||||||
| Telecommunications (5.77%) | ||||||||
| Altice USA, Inc., Class A(a) | 4,220,000 | 87,438,400 | ||||||
| Utilities (7.85%) | ||||||||
| Stericycle, Inc.(a) | 1,319,450 | 89,683,017 | ||||||
| See Notes to Financial Statements. | |
| 30 | www.clarkstonfunds.com |
| Clarkston Partners Fund | Portfolio of Investments |
| September 30, 2021 |
| Shares | Value (Note 2) | |||||||
| Utilities (continued) | ||||||||
| US Ecology, Inc.(a) | 903,000 | $ | 29,212,050 | |||||
| Total Utilities | 118,895,067 | |||||||
| TOTAL COMMON STOCK | ||||||||
| (Cost $997,405,169) | 1,405,212,671 | |||||||
| TOTAL INVESTMENTS (92.74%) | ||||||||
| (Cost $997,405,169) | $ | 1,405,212,671 | ||||||
| OTHER ASSETS IN EXCESS OF LIABILITIES (7.26%) | 109,956,548 | |||||||
| NET ASSETS (100.00%) | $ | 1,515,169,219 | ||||||
| (a) | Non-income producing security. |
| (b) | To the extent the Fund invests more heavily in particular sectors of the economy, its performance will be especially sensitive to developments that significantly affect those sectors. When sector categorization is broken down by industry, no industry exceeds the 25% maximum specified in the Statement of Additional Information. |
For Fund compliance purposes, the Fund's industry classifications refer to any one or more of the industry sub-classifications used by one or more widely recognized market indices or ratings group indices and/or as defined by Fund management. This definition may not apply for purposes of this report, which may use a different classification system or may combine industry sub-classifications for reporting ease. Industries are shown as a percent of the Fund's net assets. (Unaudited)
| See Notes to Financial Statements. | |
| Annual Report | September 30, 2021 | 31 |
| Clarkston Fund | Portfolio of Investments |
| September 30, 2021 |
| Shares | Value (Note 2) | |||||||
| COMMON STOCK (86.80%) | ||||||||
| Consumer Discretionary (9.79%) | ||||||||
| Nielsen Holdings PLC | 460,000 | $ | 8,827,400 | |||||
| The Walt Disney Co.(a) | 4,500 | 761,265 | ||||||
| Total Consumer Discretionary | 9,588,665 | |||||||
| Consumer Staples (20.40%) | ||||||||
| Anheuser-Busch InBev SA/NV, Sponsored ADR | 104,000 | 5,863,520 | ||||||
| Molson Coors Beverage Co., Class B | 120,000 | 5,565,600 | ||||||
| Post Holdings, Inc.(a) | 30,000 | 3,304,800 | ||||||
| Sysco Corp. | 47,000 | 3,689,500 | ||||||
| US Foods Holding Corp.(a) | 45,000 | 1,559,700 | ||||||
| Total Consumer Staples | 19,983,120 | |||||||
| Financials (21.88%) | ||||||||
| Affiliated Managers Group, Inc. | 26,000 | 3,928,340 | ||||||
| Brown & Brown, Inc. | 62,000 | 3,437,900 | ||||||
| Franklin Resources, Inc. | 117,000 | 3,477,240 | ||||||
| LPL Financial Holdings, Inc. | 16,000 | 2,508,160 | ||||||
| The Charles Schwab Corp. | 47,000 | 3,423,480 | ||||||
| Willis Towers Watson PLC | 20,000 | 4,649,200 | ||||||
| Total Financials | 21,424,320 | |||||||
| Industrials (26.29%)(b) | ||||||||
| American Express Co. | 27,200 | 4,556,816 | ||||||
| Capital One Financial Corp. | 26,000 | 4,211,220 | ||||||
| CH Robinson Worldwide, Inc. | 21,000 | 1,827,000 | ||||||
| FedEx Corp. | 19,500 | 4,276,155 | ||||||
| General Electric Co. | 55,000 | 5,666,650 | ||||||
| Mastercard, Inc., Class A | 3,500 | 1,216,880 | ||||||
| Paychex, Inc. | 8,500 | 955,825 | ||||||
| The Western Union Co. | 150,000 | 3,033,000 | ||||||
| Total Industrials | 25,743,546 | |||||||
| Technology (2.30%) | ||||||||
| Microsoft Corp. | 8,000 | 2,255,360 | ||||||
| See Notes to Financial Statements. | |
| 32 | www.clarkstonfunds.com |
| Clarkston Fund | Portfolio of Investments |
| September 30, 2021 |
| Shares | Value (Note 2) | |||||||
| Telecommunications (6.14%) | ||||||||
| Altice USA, Inc., Class A(a) | 290,000 | $ | 6,008,800 | |||||
| TOTAL COMMON STOCK | ||||||||
| (Cost $72,696,800) | 85,003,811 | |||||||
| TOTAL INVESTMENTS (86.80%) | ||||||||
| (Cost $72,696,800) | $ | 85,003,811 | ||||||
| OTHER ASSETS IN EXCESS OF LIABILITIES (13.20%) | 12,931,892 | |||||||
| NET ASSETS (100.00%) | $ | 97,935,703 | ||||||
| (a) | Non-income producing security. |
| (b) | To the extent the Fund invests more heavily in particular sectors of the economy, its performance will be especially sensitive to developments that significantly affect those sectors. When sector categorization is broken down by industry, no industry exceeds the 25% maximum specified in the Statement of Additional Information. |
For Fund compliance purposes, the Fund's industry classifications refer to any one or more of the industry sub-classifications used by one or more widely recognized market indices or ratings group indices and/or as defined by Fund management. This definition may not apply for purposes of this report, which may use a different classification system or may combine industry sub-classifications for reporting ease. Industries are shown as a percent of the Fund's net assets. (Unaudited)
| See Notes to Financial Statements. | |
| Annual Report | September 30, 2021 | 33 |
| Clarkston Founders Fund | Portfolio of Investments |
| September 30, 2021 |
| Shares | Value (Note 2) | |||||||
| COMMON STOCK (85.45%) | ||||||||
| Consumer Discretionary (8.59%) | ||||||||
| Nielsen Holdings PLC | 1,870,000 | $ | 35,885,300 | |||||
| Consumer Staples (20.08%) | ||||||||
| Anheuser-Busch InBev SA/NV, Sponsored ADR | 402,000 | 22,664,760 | ||||||
| Molson Coors Beverage Co., Class B | 530,000 | 24,581,400 | ||||||
| Post Holdings, Inc.(a) | 130,000 | 14,320,800 | ||||||
| Sysco Corp. | 110,000 | 8,635,000 | ||||||
| US Foods Holding Corp.(a) | 395,000 | 13,690,700 | ||||||
| Total Consumer Staples | 83,892,660 | |||||||
| Financials (24.44%) | ||||||||
| Affiliated Managers Group, Inc. | 110,000 | 16,619,900 | ||||||
| Brown & Brown, Inc. | 390,000 | 21,625,500 | ||||||
| Franklin Resources, Inc. | 508,690 | 15,118,267 | ||||||
| LPL Financial Holdings, Inc. | 120,000 | 18,811,200 | ||||||
| The Charles Schwab Corp. | 140,000 | 10,197,600 | ||||||
| Willis Towers Watson PLC | 85,000 | 19,759,100 | ||||||
| Total Financials | 102,131,567 | |||||||
| Industrials (8.93%) | ||||||||
| CH Robinson Worldwide, Inc. | 75,000 | 6,525,000 | ||||||
| FedEx Corp. | 63,000 | 13,815,270 | ||||||
| Paychex, Inc. | 25,000 | 2,811,250 | ||||||
| The Western Union Co. | 700,000 | 14,154,000 | ||||||
| Total Industrials | 37,305,520 | |||||||
| Technology (12.06%) | ||||||||
| CDK Global, Inc. | 530,000 | 22,551,500 | ||||||
| Change Healthcare, Inc.(a) | 1,330,000 | 27,850,200 | ||||||
| Total Technology | 50,401,700 | |||||||
| Telecommunications (5.58%) | ||||||||
| Altice USA, Inc., Class A(a) | 1,125,000 | 23,310,000 | ||||||
| Utilities (5.77%) | ||||||||
| Stericycle, Inc.(a) | 355,000 | 24,129,350 | ||||||
| TOTAL COMMON STOCK | ||||||||
| (Cost $330,169,449) | 357,056,097 | |||||||
| See Notes to Financial Statements. | |
| 34 | www.clarkstonfunds.com |
| Clarkston Founders Fund | Portfolio of Investments |
| September 30, 2021 |
| TOTAL INVESTMENTS (85.45%) | ||||
| (Cost $330,169,449) | $ | 357,056,097 | ||
| OTHER ASSETS IN EXCESS OF LIABILITIES (14.55%) | 60,780,955 | |||
| NET ASSETS (100.00%) | $ | 417,837,052 |
| (a) | Non-income producing security. |
For Fund compliance purposes, the Fund's industry classifications refer to any one or more of the industry sub-classifications used by one or more widely recognized market indices or ratings group indices and/or as defined by Fund management. This definition may not apply for purposes of this report, which may use a different classification system or may combine industry sub-classifications for reporting ease. Industries are shown as a percent of the Fund's net assets. (Unaudited)
| See Notes to Financial Statements. | |
| Annual Report | September 30, 2021 | 35 |
| Clarkston Funds | Statements of Assets and Liabilities |
| September 30, 2021 |
| Clarkston Partners Fund | Clarkston Fund | Clarkston Founders Fund | ||||||||||
| ASSETS: | ||||||||||||
| Investments, at value (Cost $997,405,169, $72,696,800 and $330,169,449) | $ | 1,405,212,671 | $ | 85,003,811 | $ | 357,056,097 | ||||||
| Cash and Cash Equivalents | 104,774,704 | 12,448,973 | 59,129,506 | |||||||||
| Receivable for investments sold | 5,005,106 | – | – | |||||||||
| Receivable for shares sold | 805,540 | 578,308 | 1,625,795 | |||||||||
| Dividends and interest receivable | 1,292,461 | 146,825 | 379,871 | |||||||||
| Other assets | 38,178 | 6,773 | 8,557 | |||||||||
| Total Assets | 1,517,128,660 | 98,184,690 | 418,199,826 | |||||||||
| LIABILITIES: | ||||||||||||
| Payable for administration and transfer agent fees | �� | 119,024 | 15,514 | 36,479 | ||||||||
| Payable for shares redeemed | 515,896 | 157,399 | 24,560 | |||||||||
| Payable to adviser | 952,204 | 27,340 | 219,529 | |||||||||
| Payable for shareholder service fees | 215,467 | 20,991 | – | |||||||||
| Payable for printing fees | 28,560 | 1,415 | 4,670 | |||||||||
| Payable for professional fees | 41,047 | 17,553 | 23,585 | |||||||||
| Payable for trustees' fees and expenses | 31,261 | 2,253 | 8,998 | |||||||||
| Payable to Chief Compliance Officer fees | 5,568 | 356 | 1,499 | |||||||||
| Accrued expenses and other liabilities | 50,414 | 6,166 | 43,454 | |||||||||
| Total Liabilities | 1,959,441 | 248,987 | 362,774 | |||||||||
| NET ASSETS | $ | 1,515,169,219 | $ | 97,935,703 | $ | 417,837,052 | ||||||
| NET ASSETS CONSIST OF: | ||||||||||||
| Paid-in capital (Note 5) | $ | 1,095,767,672 | $ | 82,468,398 | $ | 388,826,904 | ||||||
| Total distributable earnings | 419,401,547 | 15,467,305 | 29,010,148 | |||||||||
| NET ASSETS | $ | 1,515,169,219 | $ | 97,935,703 | $ | 417,837,052 | ||||||
| PRICING OF SHARES | ||||||||||||
| Founders Class: | ||||||||||||
| Net Asset Value, offering and redemption price per share | $ | 15.73 | N/A | $ | 15.09 | |||||||
| Net Assets | $ | 669,345,127 | N/A | $ | 278,748,892 | |||||||
| Shares of beneficial interest outstanding | 42,560,093 | N/A | 18,469,182 | |||||||||
| Institutional Class: | ||||||||||||
| Net Asset Value, offering and redemption price per share | $ | 15.64 | $ | 14.80 | $ | 15.09 | ||||||
| Net Assets | $ | 845,824,092 | $ | 97,935,703 | $ | 139,088,160 | ||||||
| Shares of beneficial interest outstanding | 54,086,910 | 6,616,460 | 9,219,679 | |||||||||
| See Notes to Financial Statements. | |
| 36 | www.clarkstonfunds.com |
| Clarkston Funds | Statements of Operations |
| For the Year Ended September 30, 2021 |
| Clarkston Partners Fund | Clarkston Fund | Clarkston Founders Fund | ||||||||||
| INVESTMENT INCOME: | ||||||||||||
| Dividends | $ | 18,643,817 | $ | 891,564 | $ | 3,070,004 | ||||||
| Foreign taxes withheld | – | (12,661 | ) | (52,822 | ) | |||||||
| Total Investment Income | 18,643,817 | 878,903 | 3,017,182 | |||||||||
| EXPENSES: | ||||||||||||
| Investment advisory fees (Note 6) | 11,933,649 | 392,078 | 2,424,804 | |||||||||
| Administration fees | 631,022 | 45,435 | 143,795 | |||||||||
| Shareholder service fees Institutional Class | 780,214 | 85,180 | 101,923 | |||||||||
| Custody fees | 120,406 | 8,535 | 37,775 | |||||||||
| Legal fees | 71,853 | 4,429 | 15,078 | |||||||||
| Audit and tax fees | 16,591 | 15,604 | 15,591 | |||||||||
| Transfer agent fees | 58,076 | 28,084 | 24,600 | |||||||||
| Trustees fees and expenses | 126,813 | 7,341 | 25,959 | |||||||||
| Registration and filing fees | 59,269 | 29,482 | 63,708 | |||||||||
| Printing fees | 61,400 | 3,097 | 11,884 | |||||||||
| Chief Compliance Officer fees | 35,116 | 1,810 | 7,254 | |||||||||
| Insurance fees | 41,502 | 2,001 | 5,225 | |||||||||
| Other expenses | 22,047 | 3,195 | 4,471 | |||||||||
| Total Expenses | 13,957,958 | 626,271 | 2,882,067 | |||||||||
| Less fees waived by investment adviser (Note 6) | ||||||||||||
| Founders Class | (230,019 | ) | N/A | (98,870 | ) | |||||||
| Institutional Class | (257,630 | ) | (108,840 | ) | (86,951 | ) | ||||||
| Total fees waived by investment adviser (Note 6) | (487,649 | ) | (108,840 | ) | (185,821 | ) | ||||||
| Net Expenses | 13,470,309 | 517,431 | 2,696,246 | |||||||||
| NET INVESTMENT INCOME | 5,173,508 | 361,472 | 320,936 | |||||||||
| REALIZED AND UNREALIZED GAIN/(LOSS) ON INVESTMENTS: | ||||||||||||
| Net realized gain/(loss) on: | ||||||||||||
| Investments | 7,492,502 | 2,872,306 | 1,897,401 | |||||||||
| Net realized gain | 7,492,502 | 2,872,306 | 1,897,401 | |||||||||
| Change in unrealized appreciation/(depreciation) on: | ||||||||||||
| Investments | 312,272,217 | 10,078,749 | 20,560,759 | |||||||||
| Net change | 312,272,217 | 10,078,749 | 20,560,759 | |||||||||
| NET REALIZED AND UNREALIZED GAIN ON INVESTMENTS | 319,764,719 | 12,951,055 | 22,458,160 | |||||||||
| NET INCREASE IN NET ASSETS RESULTING FROM OPERATIONS | $ | 324,938,227 | $ | 13,312,527 | $ | 22,779,096 | ||||||
| See Notes to Financial Statements. | |
| Annual Report | September 30, 2021 | 37 |
| Clarkston Partners Fund | Statements of Changes in Net Assets |
| For the Year Ended September 30, 2021 | For the Year Ended September 30, 2020 | |||||||
| OPERATIONS: | ||||||||
| Net investment income | $ | 5,173,508 | $ | 7,295,475 | ||||
| Net realized gain on investments | 7,492,502 | 49,059,100 | ||||||
| Net change in unrealized appreciation/(depreciation) on investments | 312,272,217 | (20,848,049 | ) | |||||
| Net increase in net assets resulting from operations | 324,938,227 | 35,506,526 | ||||||
| DISTRIBUTIONS TO SHAREHOLDERS | ||||||||
| Founders Class | (24,894,074 | ) | (18,042,443 | ) | ||||
| Institutional Class | (24,895,825 | ) | (19,314,644 | ) | ||||
| Total distributions | (49,789,899 | ) | (37,357,087 | ) | ||||
| BENEFICIAL SHARE TRANSACTIONS (Note 5): | ||||||||
| Founders Class | ||||||||
| Shares sold | 12,245,916 | 140,007,090 | ||||||
| Dividends reinvested | 743,721 | 560,589 | ||||||
| Shares redeemed | (37,748,713 | ) | (40,386,657 | ) | ||||
| Net increase/(decrease) from beneficial share transactions | (24,759,076 | ) | 100,181,022 | |||||
| Institutional Class | ||||||||
| Shares sold | 244,242,554 | 179,388,104 | ||||||
| Dividends reinvested | 24,780,467 | 18,965,301 | ||||||
| Shares redeemed | (132,710,776 | ) | (101,219,238 | ) | ||||
| Net increase from beneficial share transactions | 136,312,245 | 97,134,167 | ||||||
| Net increase in net assets | 386,701,497 | 195,464,628 | ||||||
| NET ASSETS: | ||||||||
| Beginning of year | 1,128,467,722 | 933,003,094 | ||||||
| End of year | $ | 1,515,169,219 | $ | 1,128,467,722 | ||||
| See Notes to Financial Statements. | |
| 38 | www.clarkstonfunds.com |
| Clarkston Fund | Statements of Changes in Net Assets |
| For the Year Ended September 30, 2021 | For the Year Ended September 30, 2020 | |||||||
| OPERATIONS: | ||||||||
| Net investment income | $ | 361,472 | $ | 761,275 | ||||
| Net realized gain on investments | 2,872,306 | 2,625,815 | ||||||
| Net change in unrealized appreciation/(depreciation) on investments | 10,078,749 | (3,577,427 | ) | |||||
| Net increase/(decrease) in net assets resulting from operations | 13,312,527 | (190,337 | ) | |||||
| DISTRIBUTIONS TO SHAREHOLDERS | ||||||||
| Institutional Class | (3,280,402 | ) | (2,522,147 | ) | ||||
| Total distributions | (3,280,402 | ) | (2,522,147 | ) | ||||
| BENEFICIAL SHARE TRANSACTIONS (Note 5): | ||||||||
| Institutional Class | ||||||||
| Shares sold | 43,745,785 | 8,028,416 | ||||||
| Dividends reinvested | 3,267,291 | 2,514,242 | ||||||
| Shares redeemed | (7,588,219 | ) | (13,995,698 | ) | ||||
| Net increase/(decrease) from beneficial share transactions | 39,424,857 | (3,453,040 | ) | |||||
| Net increase/(decrease) in net assets | 49,456,982 | (6,165,524 | ) | |||||
| NET ASSETS: | ||||||||
| Beginning of year | 48,478,721 | 54,644,245 | ||||||
| End of year | $ | 97,935,703 | $ | 48,478,721 | ||||
| See Notes to Financial Statements. | |
| Annual Report | September 30, 2021 | 39 |
| Clarkston Founders Fund | Statements of Changes in Net Assets |
| For the Year Ended September 30, 2021 | For the Year Ended September 30, 2020 | |||||||
| OPERATIONS: | ||||||||
| Net investment income | $ | 320,936 | $ | 401,591 | ||||
| Net realized gain on investments | 1,897,401 | 1,754,833 | ||||||
| Net change in unrealized appreciation on investments | 20,560,759 | 3,398,109 | ||||||
| Net increase in net assets resulting from operations | 22,779,096 | 5,554,533 | ||||||
| DISTRIBUTIONS TO SHAREHOLDERS | ||||||||
| Institutional Class | (2,151,069 | ) | (1,647,285 | ) | ||||
| Total distributions | (2,151,069 | ) | (1,647,285 | ) | ||||
| BENEFICIAL SHARE TRANSACTIONS (Note 5): | ||||||||
| Founders Class(a) | ||||||||
| Shares sold | 314,236,098 | – | ||||||
| Shares redeemed | (24,156,962 | ) | – | |||||
| Net increase from beneficial share transactions | 290,079,136 | – | ||||||
| Institutional Class | ||||||||
| Shares sold | 243,218,337 | 34,571,388 | ||||||
| Dividends reinvested | 918,880 | 1,647,285 | ||||||
| Shares redeemed | (213,118,346 | ) | (8,425,457 | ) | ||||
| Net increase from beneficial share transactions | 31,018,871 | 27,793,216 | ||||||
| Net increase in net assets | 341,726,034 | 31,700,464 | ||||||
| NET ASSETS: | ||||||||
| Beginning of year | 76,111,018 | 44,410,554 | ||||||
| End of year | $ | 417,837,052 | $ | 76,111,018 | ||||
| (a) | The Founders Class commenced operations on February 17, 2021. |
| See Notes to Financial Statements. | |
| 40 | www.clarkstonfunds.com |
Page Intentionally Left Blank
| Clarkston Partners Fund – Founders Class | Financial Highlights |
| For a Share Outstanding Throughout the Periods Presented | |
| NET ASSET VALUE, BEGINNING OF PERIOD |
| INCOME/(LOSS) FROM OPERATIONS: |
| Net investment income(a) |
| Net realized and unrealized gain on investments |
| Total from investment operations |
| LESS DISTRIBUTIONS: |
| From net investment income |
| From net realized gains on investments |
| Total Distributions |
| NET INCREASE/(DECREASE) IN NET ASSET VALUE |
| NET ASSET VALUE, END OF PERIOD |
| TOTAL RETURN(b) |
| SUPPLEMENTAL DATA: |
| Net assets, end of period (in 000s) |
| RATIOS TO AVERAGE NET ASSETS |
| Operating expenses excluding reimbursement/waiver |
| Operating expenses including reimbursement/waiver |
| Net investment income including reimbursement/waiver |
| PORTFOLIO TURNOVER RATE |
| See Notes to Financial Statements. | |
| 42 | www.clarkstonfunds.com |
| Clarkston Partners Fund – Founders Class | Financial Highlights |
| For a Share Outstanding Throughout the Periods Presented | |
| For the Year Ended September 30, 2021 | For the Year Ended September 30, 2020 | For the Year Ended September 30, 2019 | For the Year Ended September 30, 2018 | For the Year Ended September 30, 2017 | ||||||||||||||
| $ | 12.61 | $ | 12.81 | $ | 13.29 | $ | 12.39 | $ | 11.11 | |||||||||
| 0.06 | 0.10 | 0.14 | 0.08 | 0.05 | ||||||||||||||
| 3.62 | 0.21 | 0.17 | 0.99 | 1.37 | ||||||||||||||
| 3.68 | 0.31 | 0.31 | 1.07 | 1.42 | ||||||||||||||
| (0.06 | ) | (0.13 | ) | (0.09 | ) | (0.04 | ) | (0.06 | ) | |||||||||
| (0.50 | ) | (0.38 | ) | (0.70 | ) | (0.13 | ) | (0.08 | ) | |||||||||
| (0.56 | ) | (0.51 | ) | (0.79 | ) | (0.17 | ) | (0.14 | ) | |||||||||
| 3.12 | (0.20 | ) | (0.48 | ) | 0.90 | 1.28 | ||||||||||||
| $ | 15.73 | $ | 12.61 | $ | 12.81 | $ | 13.29 | $ | 12.39 | |||||||||
| 29.47 | % | 2.18 | % | 3.49 | % | 8.70 | % | 12.86 | % | |||||||||
| $ | 669,345 | $ | 553,691 | $ | 451,294 | $ | 445,516 | $ | 397,474 | |||||||||
| 0.88 | % | 0.91 | % | 0.92 | % | 0.94 | % | 0.96 | % | |||||||||
| 0.85 | % | 0.85 | % | 0.85 | % | 0.85 | % | 0.85 | % | |||||||||
| 0.40 | % | 0.77 | % | 1.16 | % | 0.60 | % | 0.40 | % | |||||||||
| 9 | % | 25 | % | 10 | % | 23 | % | 13 | % | |||||||||
| (a) | Calculated using the average shares method. |
| (b) | Assumes an initial investment on the business day before the first day of the fiscal period, with all dividends and distributions reinvested in additional shares on the reinvestment date, and redemption at the net asset value calculated on the last business day of the fiscal period. Total returns are for the period indicated and have not been annualized. Total returns would have been lower had certain expenses not been waived during the period. Returns shown do not reflect the deduction of taxes that a shareholder would pay on Fund distributions or the redemption of Fund shares. |
| See Notes to Financial Statements. | |
| Annual Report | September 30, 2021 | 43 |
| Clarkston Partners Fund – Institutional Class | Financial Highlights |
| For a Share Outstanding Throughout the Periods Presented | |
| NET ASSET VALUE, BEGINNING OF PERIOD |
| INCOME/(LOSS) FROM OPERATIONS: |
| Net investment income(a) |
| Net realized and unrealized gain on investments |
| Total from investment operations |
| LESS DISTRIBUTIONS: |
| From net investment income |
| From net realized gains on investments |
| Total Distributions |
| NET INCREASE/(DECREASE) IN NET ASSET VALUE |
| NET ASSET VALUE, END OF PERIOD |
| TOTAL RETURN(b) |
| SUPPLEMENTAL DATA: |
| Net assets, end of period (in 000s) |
| RATIOS TO AVERAGE NET ASSETS |
| Operating expenses excluding reimbursement/waiver |
| Operating expenses including reimbursement/waiver |
| Net investment income/(loss) including reimbursement/waiver |
| PORTFOLIO TURNOVER RATE |
| See Notes to Financial Statements. | |
| 44 | www.clarkstonfunds.com |
| Clarkston Partners Fund – Institutional Class | Financial Highlights |
| For a Share Outstanding Throughout the Periods Presented | |
| For the Year Ended September 30, 2021 | For the Year Ended September 30, 2020 | For the Year Ended September 30, 2019 | For the Year Ended September 30, 2018 | For the Year Ended September 30, 2017 | ||||||||||||||
| $ | 12.55 | $ | 12.76 | $ | 13.24 | $ | 12.36 | $ | 11.09 | |||||||||
| 0.05 | 0.08 | 0.13 | 0.06 | 0.03 | ||||||||||||||
| 3.59 | 0.21 | 0.18 | 0.99 | 1.37 | ||||||||||||||
| 3.64 | 0.29 | 0.31 | 1.05 | 1.40 | ||||||||||||||
| (0.05 | ) | (0.12 | ) | (0.09 | ) | (0.04 | ) | (0.05 | ) | |||||||||
| (0.50 | ) | (0.38 | ) | (0.70 | ) | (0.13 | ) | (0.08 | ) | |||||||||
| (0.55 | ) | (0.50 | ) | (0.79 | ) | (0.17 | ) | (0.13 | ) | |||||||||
| 3.09 | (0.21 | ) | (0.48 | ) | 0.88 | 1.27 | ||||||||||||
| $ | 15.64 | $ | 12.55 | $ | 12.76 | $ | 13.24 | $ | 12.36 | |||||||||
| 29.33 | % | 2.07 | % | 3.45 | % | 8.52 | % | 12.75 | % | |||||||||
| $ | 845,824 | $ | 574,777 | $ | 481,709 | $ | 429,622 | $ | 367,393 | |||||||||
| 0.98 | % | 1.01 | % | 1.03 | % | 1.08 | % | 1.09 | % | |||||||||
| 0.95 | %(c) | 0.95 | %(c) | 0.96 | %(c) | 0.98 | %(c) | 0.98 | %(c) | |||||||||
| 0.30 | % | 0.68 | % | 1.04 | % | 0.47 | % | 0.27 | % | |||||||||
| 9 | % | 25 | % | 10 | % | 23 | % | 13 | % | |||||||||
| (a) | Calculated using the average shares method. |
| (b) | Assumes an initial investment on the business day before the first day of the fiscal period, with all dividends and distributions reinvested in additional shares on the reinvestment date, and redemption at the net asset value calculated on the last business day of the fiscal period. Total returns are for the period indicated and have not been annualized. Total returns would have been lower had certain expenses not been waived during the period. Returns shown do not reflect the deduction of taxes that a shareholder would pay on Fund distributions or the redemption of Fund shares. |
| (c) | According to the Fund's shareholder services plan with respect to the Fund's Institutional shares, any amount of fees accrued according to the plan but not paid during the Fund's fiscal year for such service activities shall be reimbursed to the Fund as soon as practical. Fees were reimbursed to the Fund for the years ended September 30, 2021, September 30, 2020, September 30, 2019, September 30, 2018 and September 30, 2017, respectively, in the amount of 0.05%, 0.05%, 0.04%, 0.02% and 0.02% of average net assets of Institutional shares. |
| See Notes to Financial Statements. | |
| Annual Report | September 30, 2021 | 45 |
| Clarkston Fund – Institutional Class | Financial Highlights |
| For a Share Outstanding Throughout the Periods Presented | |
| NET ASSET VALUE, BEGINNING OF PERIOD |
| INCOME/(LOSS) FROM OPERATIONS: |
| Net investment income(a) |
| Net realized and unrealized gain/(loss) on investments |
| Total from investment operations |
| LESS DISTRIBUTIONS: |
| From net investment income |
| From net realized gains on investments |
| Total Distributions |
| NET INCREASE/(DECREASE) IN NET ASSET VALUE |
| NET ASSET VALUE, END OF PERIOD |
| TOTAL RETURN(c) |
| SUPPLEMENTAL DATA: |
| Net assets, end of period (in 000s) |
| RATIOS TO AVERAGE NET ASSETS |
| Operating expenses excluding reimbursement/waiver |
| Operating expenses including reimbursement/waiver |
| Net investment income including reimbursement/waiver |
| PORTFOLIO TURNOVER RATE |
| See Notes to Financial Statements. | |
| 46 | www.clarkstonfunds.com |
| Clarkston Fund – Institutional Class | Financial Highlights |
| For a Share Outstanding Throughout the Periods Presented | |
| For the Year Ended September 30, 2021 | For the Year Ended September 30, 2020 | For the Year Ended September 30, 2019 | For the Year Ended September 30, 2018 | For the Year Ended September 30, 2017 | ||||||||||||||
| $ | 12.05 | $ | 12.50 | $ | 11.99 | $ | 11.46 | $ | 10.52 | |||||||||
| 0.07 | 0.17 | 0.22 | 0.19 | 0.16 | ||||||||||||||
| 3.49 | (0.05 | ) | 0.94 | 0.49 | 0.90 | |||||||||||||
| 3.56 | 0.12 | 1.16 | 0.68 | 1.06 | ||||||||||||||
| (0.16 | ) | (0.14 | ) | (0.26 | ) | (0.15 | ) | (0.10 | ) | |||||||||
| (0.65 | ) | (0.43 | ) | (0.39 | ) | (0.00 | )(b) | (0.02 | ) | |||||||||
| (0.81 | ) | (0.57 | ) | (0.65 | ) | (0.15 | ) | (0.12 | ) | |||||||||
| 2.75 | (0.45 | ) | 0.51 | 0.53 | 0.94 | |||||||||||||
| $ | 14.80 | $ | 12.05 | $ | 12.50 | $ | 11.99 | $ | 11.46 | |||||||||
| 30.08 | % | 0.81 | % | 10.92 | % | 5.99 | % | 10.13 | % | |||||||||
| $ | 97,936 | $ | 48,479 | $ | 54,644 | $ | 31,673 | $ | 29,407 | |||||||||
| 0.80 | % | 0.86 | % | 0.93 | % | 0.93 | % | 1.04 | % | |||||||||
| 0.66 | % | 0.64 | %(d) | 0.67 | %(d) | 0.65 | %(d) | 0.65 | %(d) | |||||||||
| 0.46 | % | 1.47 | % | 1.86 | % | 1.60 | % | 1.41 | % | |||||||||
| 18 | % | 31 | % | 17 | % | 11 | % | 5 | % | |||||||||
| (a) | Calculated using the average shares method. |
| (b) | Less than $0.005 per share. |
| (c) | Assumes an initial investment on the business day before the first day of the fiscal period, with all dividends and distributions reinvested in additional shares on the reinvestment date, and redemption at the net asset value calculated on the last business day of the fiscal period. Total returns are for the period indicated and have not been annualized. Total returns would have been lower had certain expenses not been waived during the period. Returns shown do not reflect the deduction of taxes that a shareholder would pay on Fund distributions or the redemption of Fund shares. |
| (d) | According to the Fund's shareholder services plan with respect to the Fund's Institutional shares, any amount of fees accrued according to the plan but not paid during the Fund's fiscal year for such service activities shall be reimbursed to the Fund as soon as practical. Fees were reimbursed to the Fund for the years ended September 30, 2021, September 30, 2020, September 30, 2019, September 30, 2018 and September 30, 2017, respectively, in the amount of 0.04%, 0.06%, 0.03%, 0.05% and 0.05% of average net assets of Institutional shares. |
| See Notes to Financial Statements. | |
| Annual Report | September 30, 2021 | 47 |
| Clarkston Founders Fund – Founders Class | Financial Highlights |
| For a Share Outstanding Throughout the Periods Presented | |
| For the Period Ended September 30, 2021(a) | ||||
| NET ASSET VALUE, BEGINNING OF PERIOD | $ | 15.54 | ||
| INCOME/(LOSS) FROM OPERATIONS: | ||||
| Net investment income(b) | 0.02 | |||
| Net realized and unrealized loss on investments | (0.47 | )(c) | ||
| Total from investment operations | (0.45 | ) | ||
| NET DECREASE IN NET ASSET VALUE | (0.45 | ) | ||
| NET ASSET VALUE, END OF PERIOD | $ | 15.09 | ||
| TOTAL RETURN(d) | (2.90 | %) | ||
| SUPPLEMENTAL DATA: | ||||
| Net assets, end of period (in 000s) | $ | 278,749 | ||
| RATIOS TO AVERAGE NET ASSETS | ||||
| Operating expenses excluding reimbursement/waiver | 0.86 | %(e) | ||
| Operating expenses including reimbursement/waiver | 0.80 | %(e) | ||
| Net investment income including reimbursement/waiver | 0.20 | %(e) | ||
| PORTFOLIO TURNOVER RATE(f) | 5 | % | ||
| (a) | Commenced operations on February 17, 2021. |
| (b) | Calculated using the average shares method. |
| (c) | The amount shown for a share outstanding throughout the period may not correlate with the Statement of Operations for the period due to the timing of sales and redemptions of Fund shares in relation to income earned and/or fluctuating market value of the investments of the Fund. |
| (d) | Assumes an initial investment on the business day before the first day of the fiscal period, with all dividends and distributions reinvested in additional shares on the reinvestment date, and redemption at the net asset value calculated on the last business day of the fiscal period. Total returns are for the period indicated and have not been annualized. Total returns would have been lower had certain expenses not been waived during the period. Returns shown do not reflect the deduction of taxes that a shareholder would pay on Fund distributions or the redemption of Fund shares. |
| (e) | Annualized. |
| (f) | Portfolio turnover rate for periods less than one full year have not been annualized. |
| See Notes to Financial Statements. | |
| 48 | www.clarkstonfunds.com |
Page Intentionally Left Blank
Clarkston Founders Fund – Institutional Class | Financial Highlights |
| For a Share Outstanding Throughout the Periods Presented | |
| NET ASSET VALUE, BEGINNING OF PERIOD |
| INCOME/(LOSS) FROM OPERATIONS: |
| Net investment income/(loss)(b) |
| Net realized and unrealized gain on investments |
| Total from investment operations |
| LESS DISTRIBUTIONS: |
| From net investment income |
| From net realized gains on investments |
| Total Distributions |
| NET INCREASE IN NET ASSET VALUE |
| NET ASSET VALUE, END OF PERIOD |
| TOTAL RETURN(d) |
| SUPPLEMENTAL DATA: |
| Net assets, end of period (in 000s) |
| RATIOS TO AVERAGE NET ASSETS |
| Operating expenses excluding reimbursement/waiver |
| Operating expenses including reimbursement/waiver |
| Net investment income including reimbursement/waiver |
| PORTFOLIO TURNOVER RATE(h) |
See Notes to Financial Statements.
| 50 | www.clarkstonfunds.com |
| Clarkston Founders Fund – Institutional Class | Financial Highlights |
| For a Share Outstanding Throughout the Periods Presented | |
| For the Year Ended September 30, 2021 | For the Year Ended September 30, 2020 | For the Year Ended September 30, 2019 | For the Year Ended September 30, 2018 | For the Period Ended September 30, 2017(a) | ||||||||||||||
| $ | 12.35 | $ | 11.67 | $ | 11.34 | $ | 10.64 | $ | 10.00 | |||||||||
| (0.00 | )(c) | 0.08 | 0.12 | 0.07 | 0.02 | |||||||||||||
| 2.87 | 1.00 | 0.44 | 0.67 | 0.62 | ||||||||||||||
| 2.87 | 1.08 | 0.56 | 0.74 | 0.64 | ||||||||||||||
| (0.02 | ) | (0.10 | ) | (0.08 | ) | (0.04 | ) | – | ||||||||||
| (0.11 | ) | (0.30 | ) | (0.15 | ) | – | – | |||||||||||
| (0.13 | ) | (0.40 | ) | (0.23 | ) | (0.04 | ) | – | ||||||||||
| 2.74 | 0.68 | 0.33 | 0.70 | 0.64 | ||||||||||||||
| $ | 15.09 | $ | 12.35 | $ | 11.67 | $ | 11.34 | $ | 10.64 | |||||||||
| 23.31 | % | 9.34 | % | 5.31 | % | 7.01 | % | 6.40 | % | |||||||||
| $ | 139,088 | $ | 76,111 | $ | 44,411 | $ | 34,201 | $ | 24,147 | |||||||||
| 0.92 | % | 1.11 | % | 1.15 | % | 1.22 | % | 1.46 | %(e) | |||||||||
| 0.86 | %(f) | 0.91 | %(f) | 0.91 | %(f) | 0.91 | %(f) | 0.92 | %(e)(f) | |||||||||
| (0.00 | %)(g) | 0.73 | % | 1.06 | % | 0.59 | % | 0.29 | %(e) | |||||||||
| 5 | % | 22 | % | 15 | % | 9 | % | 4 | % | |||||||||
| (a) | Commenced operations on February 1, 2017. |
| (b) | Calculated using the average shares method. |
| (c) | Less than $0.005 per share. |
| (d) | Assumes an initial investment on the business day before the first day of the fiscal period, with all dividends and distributions reinvested in additional shares on the reinvestment date, and redemption at the net asset value calculated on the last business day of the fiscal period. Total returns are for the period indicated and have not been annualized. Total returns would have been lower had certain expenses not been waived during the period. Returns shown do not reflect the deduction of taxes that a shareholder would pay on Fund distributions or the redemption of Fund shares. |
| (e) | Annualized. |
| See Notes to Financial Statements. | |
| Annual Report | September 30, 2021 | 51 |
| Clarkston Founders Fund – Institutional Class | Financial Highlights |
| For a Share Outstanding Throughout the Periods Presented | |
| (f) | According to the Fund's shareholder services plan with respect to the Fund's Institutional shares, any amount of fees accrued according to the plan but not paid during the Fund's fiscal year for such service activities shall be reimbursed to the Fund as soon as practical. Fees were reimbursed to the Fund for the years ended September 30, 2021, September 30, 2020, September 30, 2019, September 30, 2018, and September 30, 2017, respectively, in the amount of 0.09%, 0.04%, 0.04%, 0.04% and 0.03% of average net assets of Institutional shares. |
| (g) | Less than 0.005%. |
| (h) | Portfolio turnover rate for periods less than one full year have not been annualized. |
See Notes to Financial Statements.
| 52 | www.clarkstonfunds.com |
| Clarkston Funds | Notes to Financial Statements |
| September 30, 2021 |
1. ORGANIZATION
ALPS Series Trust (the “Trust”), a Delaware statutory trust, is an open-end management investment company registered under the Investment Company Act of 1940, as amended (the “1940 Act”). The Trust consists of multiple separate portfolios or series. This annual report describes the Clarkston Partners Fund, the Clarkston Fund and the Clarkston Founders Fund (each, a “Fund” and collectively, the “Funds”). The Funds are non-diversified and each Fund's investment objective is to achieve long- term capital appreciation. The Clarkston Partners Fund and Clarkston Founders Fund currently offer Founders Class shares and Institutional Class shares, and the Clarkston Fund currently offers Institutional Class shares. Each share class of the Clarkston Partners Fund and Clarkston Founders Fund have identical rights to earnings, assets and voting privileges, except for class-specific expenses and exclusive rights to vote on matters affecting only individual classes. The Board of Trustees (the “Board”) may establish additional funds and classes of shares at any time in the future without shareholder approval.
2. SIGNIFICANT ACCOUNTING POLICIES
The accompanying financial statements were prepared in accordance with accounting principles generally accepted in the United States of America for investment companies (“U.S. GAAP”). The Funds are considered investment companies under U.S. GAAP and follow the accounting and reporting guidance applicable to investment companies in the Financial Accounting Standards Board (“FASB”) Accounting Standards Codification Topic 946. The preparation of financial statements in conformity with U.S. GAAP requires management to make certain estimates and assumptions that affect the reported amounts of assets and liabilities and disclosures of contingent assets and liabilities at the date of the financial statements and the reported amounts of increases and decreases in net assets from operations during the period. Actual results could differ from those estimates. The following is a summary of significant accounting policies consistently followed by the Funds in preparation of their financial statements.
Investment Valuation: The Funds generally value their securities based on market prices determined at the close of regular trading on the New York Stock Exchange (“NYSE”), normally 4:00 p.m. Eastern Time, on each day the NYSE is open for trading.
Securities traded on a registered U.S. securities exchange (including exchange-traded derivatives other than futures and futures options) are valued based on the last sale price of the security reported on the principal exchange on which it is traded, prior to the time when the Funds’ assets are valued. In the case of equity securities not traded on an exchange, or if such closing prices are not otherwise available, the securities are valued at the mean of the most recent bid and ask prices on such day.
Redeemable securities issued by open-end registered investment companies are valued at the investment company’s applicable net asset value (“NAV”), with the exception of exchange-traded open-end investment companies, which are priced as equity securities. Money market funds, representing short-term investments, are valued at their NAV.
| Annual Report | September 30, 2021 | 53 |
| Clarkston Funds | Notes to Financial Statements |
| September 30, 2021 |
When such prices or quotations are not available, or when the Fair Value Committee appointed by the Board believes that they are unreliable, securities may be priced using fair value procedures approved by the Board.
Fair Value Measurements: The Funds disclose the classification of their fair value measurements following a three-tier hierarchy based on the inputs used to measure fair value. Inputs refer broadly to the assumptions that market participants would use in pricing the asset or liability, including assumptions about risk. Inputs may be observable or unobservable. Observable inputs reflect the assumptions market participants would use in pricing the asset or liability that are developed based on market data obtained from sources independent of the reporting entity. Unobservable inputs reflect the reporting entity’s own assumptions about the assumptions market participants would use in pricing the asset or liability that are developed based on the best information available.
Various inputs are used in determining the value of the Funds’ investments as of the end of the reporting period. When inputs used fall into different levels of the fair value hierarchy, the level in the hierarchy within which the fair value measurement falls is determined based on the lowest level input that is significant to the fair value measurement in its entirety. The designated input levels are not necessarily an indication of the risk or liquidity associated with these investments. These inputs are categorized in the following hierarchy under applicable financial accounting standards:
| Level 1 – | Unadjusted quoted prices in active markets for identical investments, unrestricted assets or liabilities that the Fund has the ability to access at the measurement date; |
| Level 2 – | Quoted prices which are not active, quoted prices for similar assets or liabilities in active markets or inputs other than quoted prices that are observable (either directly or indirectly); and |
| Level 3 – | Significant unobservable prices or inputs (including the Fund’s own assumptions in determining the fair value of investments) where there is little or no market activity for the asset or liability at the measurement date. |
| 54 | www.clarkstonfunds.com |
| Clarkston Funds | Notes to Financial Statements |
| September 30, 2021 |
The following is a summary of the inputs used to value the Funds’ investments as of September 30, 2021:
CLARKSTON PARTNERS FUND
| Investments in Securities at Value | Level 1 - Unadjusted Quoted Prices | Level 2 - Other Significant Observable Inputs | Level 3 - Significant Unobservable Inputs | Total | ||||||||||||
| Common Stock | ||||||||||||||||
| Consumer Discretionary | $ | 172,048,900 | $ | – | $ | – | $ | 172,048,900 | ||||||||
| Consumer Staples | 201,248,840 | – | – | 201,248,840 | ||||||||||||
| Financials | 436,094,483 | – | – | 436,094,483 | ||||||||||||
| Industrials | 190,634,181 | – | – | 190,634,181 | ||||||||||||
| Technology | 198,852,800 | – | – | 198,852,800 | ||||||||||||
| Telecommunications | 87,438,400 | – | – | 87,438,400 | ||||||||||||
| Utilities | 118,895,067 | – | – | 118,895,067 | ||||||||||||
| Total | $ | 1,405,212,671 | $ | – | $ | – | $ | 1,405,212,671 | ||||||||
CLARKSTON FUND
| Investments in Securities at Value | Level 1 - Unadjusted Quoted Prices | Level 2 - Other Significant Observable Inputs | Level 3 - Significant Unobservable Inputs | Total | ||||||||||||
| Common Stock | ||||||||||||||||
| Consumer Discretionary | $ | 9,588,665 | $ | – | $ | – | $ | 9,588,665 | ||||||||
| Consumer Staples | 19,983,120 | – | – | 19,983,120 | ||||||||||||
| Financials | 21,424,320 | – | – | 21,424,320 | ||||||||||||
| Industrials | 25,743,546 | – | – | 25,743,546 | ||||||||||||
| Technology | 2,255,360 | – | – | 2,255,360 | ||||||||||||
| Telecommunications | 6,008,800 | – | – | 6,008,800 | ||||||||||||
| Total | $ | 85,003,811 | $ | – | $ | – | $ | 85,003,811 | ||||||||
CLARKSTON FOUNDERS FUND
| Investments in Securities at Value | Level 1 - Unadjusted Quoted Prices | Level 2 - Other Significant Observable Inputs | Level 3 - Significant Unobservable Inputs | Total | ||||||||||||
| Common Stock | ||||||||||||||||
| Consumer Discretionary | $ | 35,885,300 | $ | – | $ | – | $ | 35,885,300 | ||||||||
| Consumer Staples | 83,892,660 | – | – | 83,892,660 | ||||||||||||
| Financials | 102,131,567 | – | – | 102,131,567 | ||||||||||||
| Industrials | 37,305,520 | – | – | 37,305,520 | ||||||||||||
| Technology | 50,401,700 | – | – | 50,401,700 | ||||||||||||
| Telecommunications | 23,310,000 | – | – | 23,310,000 | ||||||||||||
| Utilities | 24,129,350 | – | – | 24,129,350 | ||||||||||||
| Total | $ | 357,056,097 | $ | – | $ | – | $ | 357,056,097 | ||||||||
There were no Level 3 securities held during the year.
| Annual Report | September 30, 2021 | 55 |
| Clarkston Funds | Notes to Financial Statements |
| September 30, 2021 |
Cash & Cash Equivalents: The Funds consider their investment in a Federal Deposit Insurance Corporation (“FDIC”) insured interest bearing account to be cash and cash equivalents. Cash and cash equivalents are valued at cost plus any accrued interest. The Funds maintain cash balances, which, at times may exceed federally insured limits. The Funds maintain these balances with a high quality financial institution.
Concentration of Credit Risk: Each Fund places its cash with a banking institution, which is insured by FDIC. The FDIC limit is $250,000. At various times throughout the period, the amount on deposit may exceed the FDIC limit and subject a Fund to a credit risk. The Funds do not believe that such deposits are subject to any unusual risk associated with investment activities.
Trust Expenses: Some expenses of the Trust can be directly attributed to a fund. Expenses that cannot be directly attributed to a fund are apportioned among all funds in the Trust based on average net assets of each fund, including Trustees' fees and expenses.
Fund Expenses: Some expenses can be directly attributed to a Fund and are apportioned among the classes based on average net assets of each class.
Class Expenses: Expenses that are specific to a class of shares are charged directly to that share class. Fees provided under the shareholder service plan for a particular class of a Fund are charged to the operations of such class.
Federal Income Taxes: The Funds comply with the requirements under Subchapter M of the Internal Revenue Code of 1986, as amended, applicable to regulated investment companies and intend to distribute substantially all of their net taxable income and net capital gains, if any, each year so that they will not be subject to federal income or excise tax on undistributed income and gains. The Funds are not subject to income taxes to the extent such distributions are made.
As of and during the fiscal year ended September 30, 2021, the Funds did not have a liability for any unrecognized tax benefits in the accompanying financial statements. The Funds recognize interest and penalties, if any, related to tax liabilities as income tax expense in the Statements of Operations. The Funds file U.S. federal, state and local income tax returns as required. The Funds’ tax returns are subject to examination by the relevant tax authorities until expiration of the applicable statute of limitations, which is generally three years after the filing of the tax return for federal purposes and four years for most state returns. The Funds’ administrator has analyzed the Funds’ tax positions taken on federal and state income tax returns for all open tax years and has concluded that as of September 30, 2021, no provision for income tax is required in the Funds’ financial statements related to these tax positions.
Investment Transactions and Investment Income: Investment transactions are accounted for on the date the investments are purchased or sold (trade date basis for financial reporting purposes). Realized gains and losses from investment transactions are reported on an identified cost basis. Interest income, which includes accretion of discounts and amortization of premiums, is accrued and recorded as earned using the effective yield method. Dividend income is recognized on the ex-dividend date, or for certain foreign securities, as soon as information is available to a Fund. Withholding taxes on foreign dividends are paid (a portion of which may be reclaimable) or provided for in accordance with the applicable country’s tax rules and rates and are disclosed in the Statements of Operations. All of the realized and unrealized gains and losses of a Fund and net investment income of a Fund are allocated daily to each class of the Fund in proportion to its average daily net assets.
| 56 | www.clarkstonfunds.com |
| Clarkston Funds | Notes to Financial Statements |
| September 30, 2021 |
Distributions to Shareholders: The Funds normally pay dividends, if any, and distribute capital gains, if any, on an annual basis. Income dividend distributions are derived from interest, dividends and other income the Funds receive from their investments, including short-term capital gains. Long-term capital gain distributions are derived from gains realized when a Fund sells a security it has owned for more than one year. A Fund may make additional distributions and dividends at other times if its portfolio manager or managers believe doing so may be necessary for the Fund to avoid or reduce taxes. Net investment income/(loss) and net realized gain/(loss) may differ for financial statement and tax purposes.
COVID-19 Risk: An outbreak of respiratory disease caused by a novel coronavirus was first detected in December 2019 and has now spread internationally. This coronavirus has resulted in closing borders, enhanced health screenings, partial population vaccination, healthcare service preparation and delivery, quarantines, cancellations, disruptions to supply chains and customer activity, government sponsored fiscal stimulus programs, various moratoria on the applicability of certain laws and regulations, as well as general concern and uncertainty. The impact of this coronavirus, (and the variants of such virus) and other epidemics and pandemics that may arise in the future, could affect the economies of many nations, individual companies, their securities (including equity and debt), and the market in general in ways that cannot necessarily be foreseen at the present time. In addition, the impact of infectious diseases in developing or emerging market countries may be greater due to less established health care systems. Health crises caused by the recent coronavirus outbreak may exacerbate other pre-existing political, social, financial, and economic risks in certain countries. The impact of the outbreak may last for an extended period of time.
3. TAX BASIS INFORMATION
Tax Basis of Distributions to Shareholders: The character of distributions made during the period from net investment income or net realized gains may differ from its ultimate characterization for federal income tax purposes. Also, due to the timing of dividend distributions, the fiscal year in which amounts are distributed may differ from the fiscal year in which the income or realized gain were recorded by the Funds. The amounts and characteristics of tax basis distributions and composition of distributable earnings/(accumulated losses) are finalized at fiscal year-end.
The tax character of distributions paid during the fiscal year ended September 30, 2021, were as follows:
| Ordinary Income | Long-Term Capital Gains | |||||||
| Clarkston Partners Fund | $ | 5,143,628 | $ | 44,646,271 | ||||
| Clarkston Fund | 1,140,328 | 2,140,074 | ||||||
| Clarkston Founders Fund | 604,606 | 1,546,463 | ||||||
| Annual Report | September 30, 2021 | 57 |
| Clarkston Funds | Notes to Financial Statements |
| September 30, 2021 |
The tax character of distributions paid during the fiscal year ended September 30, 2020, were as follows:
| Ordinary Income | Long-Term Capital Gains | |||||||
| Clarkston Partners Fund | $ | 10,647,842 | $ | 26,709,245 | ||||
| Clarkston Fund | 633,816 | 1,888,331 | ||||||
| Clarkston Founders Fund | 397,565 | 1,249,720 | ||||||
Reclassifications: As of September 30, 2021, permanent differences in book and tax accounting were reclassified. The following reclassifications, which had no impact on results of operations or net assets, were recorded to reflect tax character:
| Paid-in Capital | Total Distributable Earnings | |||||||
| Clarkston Partners Fund | $ | 146,531 | $ | (146,531 | ) | |||
These differences are primarily attributable to deemed distributions for tax purposes.
Unrealized Appreciation and Depreciation on Investments: As of September 30, 2021, the aggregate costs of investments, gross unrealized appreciation/(depreciation) and net unrealized appreciation for Federal tax purposes were as follows:
| Clarkston Partners Fund | Clarkston Fund | Clarkston Founders Fund | ||||||||||
| Gross unrealized appreciation (excess of value over tax cost) | $ | 468,204,225 | $ | 20,164,484 | $ | 51,851,628 | ||||||
| Gross unrealized depreciation (excess of tax cost over value) | (60,643,051 | ) | (7,857,473 | ) | (24,964,983 | ) | ||||||
| Net appreciation (depreciation) of foreign currency and derivatives | – | – | – | |||||||||
| Net unrealized appreciation | $ | 407,561,174 | $ | 12,307,011 | $ | 26,886,645 | ||||||
| Cost of investments for income tax purposes | $ | 997,651,497 | $ | 72,696,800 | $ | 330,169,452 | ||||||
These differences are primarily attributable to wash sales.
| 58 | www.clarkstonfunds.com |
| Clarkston Funds | Notes to Financial Statements |
| September 30, 2021 |
Components of Distributable Earnings: As of September 30, 2021, components of distributable earnings were as follows:
| Clarkston Partners Fund | Clarkston Fund | Clarkston Founders Fund | ||||||||||
| Undistributed ordinary income | $ | 4,482,151 | $ | 1,048,052 | $ | 1,558,497 | ||||||
| Accumulated capital gains | 7,358,222 | 2,112,242 | 565,006 | |||||||||
| Net unrealized appreciation | 407,561,174 | 12,307,011 | 26,886,645 | |||||||||
| Total | $ | 419,401,547 | $ | 15,467,305 | $ | 29,010,148 | ||||||
4. SECURITIES TRANSACTIONS
Purchases and sales of securities, excluding short-term securities, during the fiscal year ended September 30, 2021, were as follows:
| Purchases of Securities | Proceeds from Sales of Securities | |||||||
| Clarkston Partners Fund | $ | 217,139,973 | $ | 122,535,310 | ||||
| Clarkston Fund | 38,338,369 | 11,625,779 | ||||||
| Clarkston Founders Fund | 282,600,074 | 13,386,274 | ||||||
5. BENEFICIAL SHARE TRANSACTIONS
The capitalization of the Trust consists of an unlimited number of shares of beneficial interest with no par value per share. Holders of the shares of the Funds have one vote for each share held and a proportionate fraction of a vote for each fractional share. All shares issued and outstanding are fully paid and are transferable and redeemable at the option of the shareholder. Shares have no pre-emptive rights. Neither the Funds nor any of their creditors have the right to require shareholders to pay any additional amounts solely because the shareholder owns the shares.
| Annual Report | September 30, 2021 | 59 |
| Clarkston Funds | Notes to Financial Statements |
| September 30, 2021 |
Transactions in common shares were as follows:
| For the Year Ended September 30, 2021 | For the Year Ended September 30, 2020 | |||||||
| Clarkston Partners Fund | ||||||||
| Founders Class | ||||||||
| Shares sold | 919,329 | 12,044,655 | ||||||
| Shares issued in reinvestment of distributions to shareholders | 50,354 | 42,309 | ||||||
| Shares redeemed | (2,325,386 | ) | (3,392,583 | ) | ||||
| Net increase/(decrease) in shares outstanding | (1,355,703 | ) | 8,694,381 | |||||
| Institutional Class | ||||||||
| Shares sold | 15,108,538 | 15,338,237 | ||||||
| Shares issued in reinvestment of distributions to shareholders | 1,685,746 | 1,436,765 | ||||||
| Shares redeemed | (8,516,424 | ) | (8,714,703 | ) | ||||
| Net increase in shares outstanding | 8,277,860 | 8,060,299 | ||||||
| Clarkston Fund | ||||||||
| Institutional Class | ||||||||
| Shares sold | 2,869,881 | 703,998 | ||||||
| Shares issued in reinvestment of distributions to shareholders | 239,537 | 201,623 | ||||||
| Shares redeemed | (514,932 | ) | (1,256,132 | ) | ||||
| Net increase/(decrease) in shares outstanding | 2,594,486 | (350,511 | ) | |||||
| Clarkston Founders Fund | ||||||||
| Founders Class(a) | ||||||||
| Shares sold | 19,965,249 | – | ||||||
| Shares issued in reinvestment of distributions to shareholders | – | – | ||||||
| Shares redeemed | (1,496,067 | ) | – | |||||
| Net increase in shares outstanding | 18,469,182 | – | ||||||
| Institutional Class | ||||||||
| Shares sold | 16,726,461 | 2,956,388 | ||||||
| Shares issued in reinvestment of distributions to shareholders | 63,240 | 137,503 | ||||||
| Shares redeemed | (13,734,914 | ) | (734,413 | ) | ||||
| Net increase in shares outstanding | 3,054,787 | 2,359,478 | ||||||
| (a) | The Founders Class commenced operations on February 17, 2021. |
| 60 | www.clarkstonfunds.com |
| Clarkston Funds | Notes to Financial Statements |
| September 30, 2021 |
Control is defined by the 1940 Act as the beneficial ownership, either directly or through one or more controlled companies, of more than 25% of the voting securities of a company. Approximately 43% of the outstanding shares of the Clarkston Partners Fund are held by one shareholder that owns shares on behalf of its underlying beneficial owners. Approximately 79% of the outstanding shares of the Clarkston Fund are owned by one omnibus account. Approximately 64% of the outstanding shares of the Clarkston Founders Fund are held by one shareholder that owns shares on behalf of its underlying beneficial owners. Share transaction activities of these shareholders could have a material impact on the Funds.
6. MANAGEMENT AND RELATED PARTY TRANSACTIONS
Investment Advisory: Clarkston Capital Partners, LLC (“Clarkston” or the “Adviser”), subject to the authority of the Board, is responsible for the management of the Funds’ portfolios. The Adviser manages the investments of the Funds in accordance with the Funds’ investment objectives, policies and limitations and investment guidelines established jointly by the Adviser and the Board.
Pursuant to the Investment Advisory Agreement (the “Advisory Agreement”) with the Adviser, each Fund pays the Adviser an annual management fee that is based on each Fund’s average daily net assets. The management fee is paid on a monthly basis. The contractual management fee rates are 0.80%, 0.50% and 0.75% for the Clarkston Partners Fund, the Clarkston Fund and the Clarkston Founders Fund, respectively. The Board may extend the Advisory Agreement for additional one-year terms. The Board and shareholders of a Fund may terminate the Advisory Agreement upon 30 days’ written notice. The Adviser may terminate the Advisory Agreement upon 60 days’ notice.
Pursuant to a fee waiver letter agreement (the “Fee Waiver Agreement”), the Adviser has contractually agreed to limit the amount of each Fund’s Total Annual Fund Operating Expenses, exclusive of shareholder servicing fees, brokerage expenses, interest expenses, taxes, acquired fund fees and expenses and extraordinary expenses to an annual rate of 0.85% of the Clarkston Partners Fund’s average daily net assets for each of the Founders Class shares and the Institutional Class shares, 0.55% of the Clarkston Fund’s average daily net assets for the Institutional Class shares and 0.80% of the Clarkston Founders Fund’s average daily net assets for the Institutional Class shares. The Fee Waiver Agreement is in effect through January 31, 2022, for the Clarkston Partners Fund, Clarkston Fund and Institutional Class shares of the Founders Fund and through February 28, 2022 for the Founders Class shares of the Founders Fund and will thereafter continue in effect for successive twelve-month periods provided that such continuance is specifically approved at least annually by the Board and the Adviser does not provide at least 30 days written notice of noncontinuance prior to the end of the then effective term. The Adviser may not terminate the Fee Waiver Agreement without the approval of the Trust’s Board. The Adviser will be permitted to recover, on a class-by-class basis, expenses it has borne through the Fee Waiver Agreement only to the extent that the Fund’s expenses in later periods do not exceed the lesser of: (1) the contractual expense limit in effect at the time the Adviser waives or limits the expenses; or (2) the contractual expense limit in effect at the time the Adviser seeks to recover the expenses; provided, however, that the Funds will not be obligated to reimburse any such expenses borne by the Adviser more than three years after the date on which the fee or expense was waived or limited or assumed and paid by the Adviser, as calculated on a monthly basis.
| Annual Report | September 30, 2021 | 61 |
| Clarkston Funds | Notes to Financial Statements |
| September 30, 2021 |
For the fiscal year ended September 30, 2021, the fee waivers and/or reimbursements were $230,019, $257,630, $108,840, $98,870, and $86,951 for the Clarkston Partners Fund Founders Class, Clarkston Partners Fund Institutional Class, Clarkston Fund Institutional Class, Clarkston Founders Fund Founders Class and Clarkston Founders Fund Institutional Class, respectively.
As of September 30, 2021, the balances of recoupable expenses for each Fund and class were as follows:
| Expiring in 2022 | Expiring in 2023 | Expiring in 2024 | ||||||||||
| Clarkston Partners Fund | ||||||||||||
| Founders | $ | 303,538 | $ | 312,179 | $ | 230,019 | ||||||
| Institutional | 312,594 | 333,794 | 257,630 | |||||||||
| Clarkston Fund | ||||||||||||
| Institutional | 108,159 | 110,696 | 108,840 | |||||||||
| Clarkston Founders Fund | ||||||||||||
| Founders | – | – | 98,870 | |||||||||
| Institutional | 90,772 | 110,059 | 86,951 | |||||||||
Administrator: SS&C ALPS Fund Services, Inc. (“ALPS”) (an affiliate of ALPS Distributors, Inc.) serves as administrator to each Fund. The Funds have agreed to pay expenses incurred in connection with their administrative activities. Pursuant to the Administration, Bookkeeping and Pricing Services Agreement with the Trust, ALPS provides operational services to the Funds including, but not limited to, fund accounting and fund administration and generally assists in each Fund’s operations. Each Fund’s administration fee is accrued on a daily basis and paid monthly. The officers of the Trust are employees of ALPS. Administration fees paid by the Funds for the fiscal year ended September 30, 2021 are disclosed in the Statements of Operations. ALPS is reimbursed by the Funds for certain out-of-pocket expenses.
Transfer Agent: ALPS serves as transfer agent for each Fund under a Transfer Agency and Services Agreement with the Trust. Under this agreement, ALPS is paid an annual fee for services performed on behalf of the Funds plus fees for open accounts and is reimbursed for certain out-of-pocket expenses.
Compliance Services: ALPS provides Chief Compliance Officer services to each Fund to monitor and test the policies and procedures of each Fund in conjunction with requirements under Rule 38a-1 of the 1940 Act pursuant to a Chief Compliance Officer Services Agreement with the Trust. Under this agreement, ALPS is paid an annual fee for services performed on behalf of the Funds and is reimbursed for certain out-of-pocket expenses.
Distribution: ALPS Distributors, Inc. (the “Distributor”) (an affiliate of ALPS) acts as the principal underwriter of each Fund’s shares pursuant to a Distribution Agreement with the Trust. Shares of each Fund are offered on a continuous basis through the Distributor, as agent of the Funds. The Distributor is not obligated to sell any particular amount of shares and is not entitled to any compensation for its services as the Funds’ principal underwriter pursuant to the Distribution Agreement.
| 62 | www.clarkstonfunds.com |
| Clarkston Funds | Notes to Financial Statements |
| September 30, 2021 |
Each Fund has adopted a shareholder services plan (“Shareholder Services Plan”) for its Institutional Class. Under the Shareholder Services Plan each Fund is authorized to pay banks and their affiliates and other institutions, including broker-dealers and Fund affiliates (“Participating Organizations”), an aggregate fee in an amount not to exceed on an annual basis 0.15% of the average daily net asset value of each Fund’s Institutional Class shares to Participating Organizations as compensation for providing shareholder service activities, which do not include distribution services, pursuant to an agreement with a Participating Organization.
7. TRUSTEES
As of September 30, 2021, there were four Trustees, three of whom are not “interested persons” (as defined in the 1940 Act) of the Trust (the “Independent Trustees”). The Independent Trustees of the Trust and Interested Trustees who are not currently employed by the Adviser, ALPS or other service providers receive a quarterly retainer of $13,500, plus $4,000 for each regular Board or Committee meeting attended and $2,000 for each special telephonic or in-person Board or Committee meeting attended. Additionally, the Audit Committee Chair receives a quarterly retainer of $1,250 and the Independent Chair receives a quarterly retainer of $3,250. The Independent Trustees and Interested Trustees who are not currently employed by the Adviser, ALPS or other service providers are also reimbursed for all reasonable out-of-pocket expenses relating to attendance at meetings. Officers of the Trust receive no salary or fees from the Trust. As discussed in Note 6, the Funds pay ALPS an annual fee for compliance services.
8. INDEMNIFICATIONS
Under the Trust’s organizational documents, its officers and Trustees are indemnified against certain liabilities arising out of the performance of their duties to the Trust. Additionally, in the normal course of business, the Trust enters into contracts with service providers that may contain general indemnification clauses which may permit indemnification to the extent permissible under applicable law. The Trust’s maximum exposure under these arrangements is unknown, as this would involve future claims that may be made against the Trust that have not yet occurred.
9. SUBSEQUENT EVENTS
Subsequent events after the date of the Statements of Assets and Liabilities have been evaluated through the date the financial statements were issued. Management has determined that there were no subsequent events to report through the issuance of these financial statements.
| Annual Report | September 30, 2021 | 63 |
| Report of Independent Registered | |
| Clarkston Funds | Public Accounting Firm |
To the Shareholders of Clarkston Partners Fund, Clarkston Fund and Clarkston Founders Fund and Board of Trustees of ALPS Series Trust
Opinion on the Financial Statements
We have audited the accompanying statements of assets and liabilities, including the portfolios of investments, of Clarkston Partners Fund, Clarkston Fund and Clarkston Founders Fund (the “Funds”), each a series of ALPS Series Trust, as of September 30, 2021, the related statements of operations for the year then ended, the statements of changes in net assets for each of the two years in the period then ended, the related notes, and the financial highlights for each of the five years in the period then ended for Clarkston Partners Fund and Clarkston Fund, and the related statement of operations for the year then ended, the statements of changes in net assets for each of the two years in the period then ended, the related notes, and the financial highlights for each of the five periods in the period then ended for Clarkston Founders Fund (collectively referred to as the “financial statements”). In our opinion, the financial statements present fairly, in all material respects, the financial position of each of the Funds as of September 30, 2021, the results of their operations, the changes in net assets, and the financial highlights for the periods indicated above, in conformity with accounting principles generally accepted in the United States of America.
Basis for Opinion
These financial statements are the responsibility of the Funds’ management. Our responsibility is to express an opinion on the Funds’ financial statements based on our audits. We are a public accounting firm registered with the Public Company Accounting Oversight Board (United States) (“PCAOB”) and are required to be independent with respect to the Funds in accordance with the U.S. federal securities laws and the applicable rules and regulations of the Securities and Exchange Commission and the PCAOB.
We conducted our audits in accordance with the standards of the PCAOB. Those standards require that we plan and perform the audit to obtain reasonable assurance about whether the financial statements are free of material misstatement whether due to error or fraud.
Our audits included performing procedures to assess the risks of material misstatement of the financial statements, whether due to error or fraud, and performing procedures that respond to those risks. Such procedures included examining, on a test basis, evidence regarding the amounts and disclosures in the financial statements. Our procedures included confirmation of securities owned as of September 30, 2021, by correspondence with the custodian and brokers. Our audits also included evaluating the accounting principles used and significant estimates made by management, as well as evaluating the overall presentation of the financial statements. We believe that our audits provide a reasonable basis for our opinion.
We have served as the Funds’ auditor since 2017.

COHEN & COMPANY, LTD.
Cleveland, Ohio
November 29, 2021
| 64 | www.clarkstonfunds.com |
| Clarkston Funds | Additional Information |
| September 30, 2021 (Unaudited) |
1. PROXY VOTING POLICIES AND VOTING RECORD
A description of the policies and procedures that the Funds use to determine how to vote proxies relating to portfolio securities is available without charge, upon request, (i) by calling the Funds (toll-free) at 1-844-680-6562 or (ii) on the website of the Securities and Exchange Commission (the “SEC”) at http://www.sec.gov.
Information regarding how each Fund voted proxies relating to portfolio securities during the most recent 12-month period ended June 30 is available (i) without charge, upon request, by calling the Funds (toll-free) at 1-844-680-6562 or (ii) on the SEC’s website at http://www.sec.gov.
2. PORTFOLIO HOLDINGS
The Funds’ portfolio holdings are made available semi-annually in shareholder reports within 60 days after the close of the period for which the report is being made, as required by federal securities laws. Each Fund files its complete schedule of portfolio holdings with the SEC for the first and third fiscal quarters of each fiscal year as an exhibit to its reports on Form N-PORT. The Funds’ Form N-PORT reports are available on the SEC’s website at www.sec.gov. The Funds’ portfolio holdings are also available at www.clarkstonfunds.com, or upon request, without charge, by calling (toll-free) 1-844-680-6562 or by writing to SS&C ALPS, c/o Clarkston Funds at 1290 Broadway, Suite 1000, Denver, Colorado 80203.
3. SHAREHOLDER PROXY RESULTS
At a Special Meeting of Shareholders of the ALPS Series Trust, held on April 12, 2021, shareholders of record as of the close of business on March 1, 2021 voted to approve the following proposals:
Proposal 1: To elect Ward D. Armstrong to serve on the Board of Trustees until his resignation, retirement, death or removal or until his successor is duly elected and qualified.
| Shares Voted In Favor | Shares Voted Against or Abstentions |
| 162,259,659 | 244,729 |
Proposal 2: To elect Bradley J. Swenson to serve on the Board of Trustees until his resignation, retirement, death or removal or until his successor is duly elected and qualified.
| Shares Voted In Favor | Shares Voted Against or Abstentions |
| 162,281,980 | 222,408 |
| Annual Report | September 30, 2021 | 65 |
| Clarkston Funds | Additional Information |
| September 30, 2021 (Unaudited) |
4. TAX DESIGNATIONS
Qualified Dividend Income
The percentage of ordinary income dividends distributed during the calendar year ended December 31, 2020 are designated as qualified dividend income (QDI) as defined in Section 1(h)(11) of the Internal Revenue Code in the following percentages:
| Amount | |
| Clarkston Partners Fund | 100.00% |
| Clarkston Fund | 84.20% |
| Clarkston Founders Fund | 100.00% |
Dividends Received Deduction
For corporate shareholders, the following ordinary dividends paid during the calendar year ended December 31, 2020 qualify for the corporate dividends received deduction:
| Amount | |
| Clarkston Partners Fund | 100.00% |
| Clarkston Fund | 65.14% |
| Clarkston Founders Fund | 100.00% |
Pursuant to Section 852(b)(3) of the Internal Revenue Code the following Funds designate the amounts listed below as long-term capital gain dividends:
| Amount | |
| Clarkston Partners Fund | $44,646,271 |
| Clarkston Fund | $2,140,074 |
| Clarkston Founders Fund | $1,546,438 |
The amount above includes $4,904,517 of earnings and profits distributed to shareholders on redemptions for the Clarkston Partners Fund.
| 66 | www.clarkstonfunds.com |
| Clarkston Funds | Liquidity Risk Management Program |
| September 30, 2021 (Unaudited) |
The ALPS Series Trust (the “Trust”) has established a liquidity risk management program (the “Program”) to govern the Trust’s approach to managing liquidity risk for each fund in the series (each a “Fund”). The Program is overseen by the Liquidity Committee (the “Committee”), a committee comprised of representatives of the Trust and ALPS | SS&C. The Trust’s Board of Trustees (the “Board”) has approved the designation of the Committee to oversee the Program.
The Program’s principal objectives include supporting each Fund’s compliance with limits on investments in illiquid assets and mitigating the risk that a Fund will be unable to meet its redemption obligations in a timely manner. The Program also includes a number of elements that support the management and assessment of liquidity risk, including, among others, an annual assessment of factors that influence a Fund’s liquidity, the periodic classification and re-classification of the Fund’s investments into groupings that reflect the Committee’s assessment of their relative liquidity under both current market conditions and reasonably foreseeable stressed conditions, as well as minimum levels of highly liquid investments.
At a meeting that occurred on May 20, 2021, the Board received a report from the Committee that addressed the operation of the Program and assessed its adequacy and effectiveness of implementation. The report revealed that, during the period covered by the report, there were no liquidity events that impacted the Funds or their ability to timely meet redemptions without dilution to existing shareholders. The report further discussed the liquidity classification methodology of each Fund, the effectiveness of the operation of certain Funds’ Highly Liquid Investment Minimum (“HLIM”) where applicable, and the liquidity classification of each Fund’s investments over the period. The report further noted that no material changes have been made to the Program since its implementation. The report provided to the Board included a conclusion that the Program appeared to be reasonably designed and operated effectively during the review period.
| Annual Report | September 30, 2021 | 67 |
| Clarkston Funds | Privacy Policy |
| September 30, 2021 (Unaudited) |
| FACTS | WHAT DO THE FUNDS DO WITH YOUR PERSONAL INFORMATION? |
| WHY? | Financial companies choose how they share your personal information. Federal law gives consumers the right to limit some but not all sharing. Federal law also requires us to tell you how we collect, share and protect your personal information. Please read this notice carefully to understand what we do. |
| WHAT? | The types of personal information we collect and share depend on the product or service you have with us. This information can include: · Social Security number and account transactions · Account balances and transaction history · Wire transfer instructions |
| HOW? | All financial companies need to share customers’ personal information to run their everyday business. In the section below, we list the reasons financial companies can share their customers’ personal information, the reasons a Fund chooses to share, and whether you can limit this sharing. |
| REASONS WE CAN SHARE YOUR PERSONAL INFORMATION | DO THE FUNDS SHARE? | CAN YOU LIMIT THIS SHARING? |
| For our everyday business purposes – such as to process your transactions, maintain your account(s), respond to court orders and legal investigations, or report to credit bureaus | Yes | No |
For our marketing purposes – to offer our products and services to you | No | We do not share. |
| For joint marketing with other financial companies | No | We do not share. |
| For our affiliates’ everyday business purposes – information about your transactions and experiences | Yes | No |
For our affiliates’ everyday business purposes – information about your creditworthiness | No | We do not share. |
| For non-affiliates to market to you | No | We do not share. |
| QUESTIONS? | Call 1-844-680-6562 or go to www.clarkstonfunds.com |
| 68 | www.clarkstonfunds.com |
| Clarkston Funds | Privacy Policy |
| September 30, 2021 (Unaudited) |
| WHO WE ARE | |
| Who is providing this notice? | Clarkston Partners Fund, Clarkston Fund, and Clarkston Founders Fund (the “Funds”) |
| WHAT WE DO | |
| How do the Funds protect my personal information? | To protect your personal information from unauthorized access and use, we use security measures that comply with federal law. These measures include computer safeguards and secured files and buildings. |
| How do the Funds collect my personal information? | We collect your personal information, for example, when you
· open an account · provide account information or give us your contact information · make a wire transfer or deposit money |
| Why can’t I limit all sharing? | Federal law gives you the right to limit only
· sharing for affiliates’ everyday business purposes- information about your creditworthiness · affiliates from using your information to market to you · sharing for non-affiliates to market to you
State laws and individual companies may give you additional rights to limit sharing. |
| DEFINITIONS | |
| Affiliates | Companies related by common ownership or control. They can be financial and nonfinancial companies. |
| Non-affiliates | Companies not related by common ownership or control. They can be financial and nonfinancial companies.
• The Funds do not share with non-affiliates so they can market to you. |
| Joint marketing | A formal agreement between non-affiliated financial companies that together market financial products or services to you.
• The Funds do not jointly market. |
| Annual Report | September 30, 2021 | 69 |
| Clarkston Funds | Privacy Policy |
| September 30, 2021 (Unaudited) |
| OTHER IMPORTANT INFORMATION | |
| California Residents | If your account has a California home address, your personal information will not be disclosed to nonaffiliated third parties except as permitted by applicable California law, and we will limit sharing such personal information with our affiliates to comply with California privacy laws that apply to us. |
| Vermont Residents | The State of Vermont requires financial institutions to obtain your consent prior to sharing personal information that they collect about you with affiliated companies and nonaffiliated third parties other than in certain limited circumstances. Except as permitted by law, we will not share personal information we collect about you with nonaffiliated third parties or other affiliated companies unless you provide us with your written consent to share such information. |
| 70 | www.clarkstonfunds.com |
| Clarkston Funds | Trustees and Officers |
| September 30, 2021 (Unaudited) |
| INDEPENDENT TRUSTEES | |||||
| Name, Birth Year & Address* | Position(s) Held with Fund | Term of Office and Length of Time Served** | Principal Occupation(s) During Past 5 Years*** | Number of Funds in Fund Complex Overseen by Trustee**** | Other Directorships Held by Trustee During Past 5 Years*** |
| Ward D. Armstrong, Birth year: 1954 | Trustee and Chairman | Mr. Armstrong was appointed to the Board on May 27, 2016. Mr. Armstrong was appointed Chairman of the Board at the August 24, 2017 meeting of the Board of Trustees. | Mr. Armstrong is currently retired. From February 2010 to July 2015, he was Co- Founder and Managing Partner of NorthRock Partners, a private wealth advisory firm providing comprehensive wealth management and family office services to the high net-worth marketplace. Previously, he was Senior Vice President, Ameriprise Financial (1984 to 2007); Chairman of Ameriprise Trust Company (1996 to 2007) and President, American Express Institutional Asset Management (2002 to 2004). He has also served on several investment related Boards including Kenwood Capital Management, RiverSource Investments, American Express Asset Management International and was Chair of the Ordway Theatre Endowment Committee. | 11 | Mr. Armstrong is a Director of the Heartland Group, Inc. (3 funds). |
| * | All communications to Trustees and Officers may be directed to ALPS Series Trust c/o 1290 Broadway, Suite 1000, Denver, CO 80203. |
| ** | This is the period for which the Trustee or Officer began serving the Trust. Each Trustee serves an indefinite term, until such Trustee’s successor is elected and appointed, or such Trustee resigns or is deceased. Officers are elected on an annual basis. |
| *** | Except as otherwise indicated, each individual has held the office shown or other offices in the same company for the last five years. |
| **** | The Fund Complex currently consists of 11 series of the Trust. |
| Annual Report | September 30, 2021 | 71 |
| Clarkston Funds | Trustees and Officers |
| September 30, 2021 (Unaudited) |
| Name, Birth Year & Address* | Position(s) Held with Fund | Term of Office and Length of Time Served** | Principal Occupation(s) During Past 5 Years*** | Number of Funds in Fund Complex Overseen by Trustee**** | Other Directorships Held by Trustee During Past 5 Years*** |
| J. Wayne Hutchens, Birth year: 1944 | Trustee | Mr. Hutchens was elected to the Board on October 30, 2012. | Mr. Hutchens is currently retired. From 2000 to January 2020, he served as Trustee of the Denver Museum of Nature and Science and from May 2012 to February 2020, he served as Trustee of Children’s Hospital Colorado. From April 2006 to December 2012, he served as President and CEO of the University of Colorado (CU) Foundation and from April 2009 to December 2012, he was Executive Director of the CU Real Estate Foundation. Mr. Hutchens is also Director of AMG National Trust Bank (June 2012 to present). Prior to these positions, Mr. Hutchens spent 29 years in the banking industry, retiring as Chairman of Chase Bank Colorado. | 11 | Mr. Hutchens is a Director of RiverNorth Opportunities Fund, Inc. (2013 to present), RiverNorth Opportunistic Municipal Income Fund, Inc. (2018 to present), RiverNorth/Doubleline Strategic Opportunity Fund, Inc. (2018 to present), RiverNorth Specialty Finance Corporation (2018 to present), RiverNorth Managed Duration Municipal Income Fund, Inc. (2019 to present), RiverNorth Flexible Municipal Income Fund, Inc. (2020 to present). He is an Advisory Board member of RiverNorth Funds (3 funds) (2020 to present). |
| * | All communications to Trustees and Officers may be directed to ALPS Series Trust c/o 1290 Broadway, Suite 1000, Denver, CO 80203. |
| ** | This is the period for which the Trustee or Officer began serving the Trust. Each Trustee serves an indefinite term, until such Trustee’s successor is elected and appointed, or such Trustee resigns or is deceased. Officers are elected on an annual basis. |
| *** | Except as otherwise indicated, each individual has held the office shown or other offices in the same company for the last five years. |
| **** | The Fund Complex currently consists of 11 series of the Trust. |
| 72 | www.clarkstonfunds.com |
| Clarkston Funds | Trustees and Officers |
| September 30, 2021 (Unaudited) |
| Name, Birth Year & Address* | Position(s) Held with Fund | Term of Office and Length of Time Served** | Principal Occupation(s) During Past 5 Years*** | Number of Funds in Fund Complex Overseen by Trustee**** | Other Directorships Held by Trustee During Past 5 Years*** |
| Patrick Seese, Birth year: 1971 | Trustee | Mr. Seese was elected to the Board on October 30, 2012. | Mr. Seese is an owner and a Managing Director of Integris Partners, a middle-market investment banking firm serving closely-held companies, financial sponsors and public companies (February 2008 to present). Prior to this, Mr. Seese was a Managing Director of Headwaters MB, a middle-market investing banking firm (December 2003 to February 2008). Prior to that, Mr. Seese worked in Credit Suisse First Boston’s Mergers and Acquisitions Group and served as Head of Corporation Development, Katy Industries, a publicly traded industrial and consumer products company and at Deloitte & Touche LLP, where he began his career in 1994. | 11 | Mr. Seese is a Director of The Mile High Five Foundation (2013 to present) and SJ Panthers Foundation (2016 to present). |
| Merrillyn J. Kosier, Birth year: 1959 | Trustee | Ms. Kosier was elected to the Board on November 17, 2021. | Ms. Kosier retired from Ariel Investments as Executive Vice President in 2019. During her tenure at Ariel Investments, she served as Chief Marketing Officer, Ariel Mutual Funds since 2007; Trustee for Ariel Investment Trust since 2003 and President of Ariel Distributors, LLC since 2002. From 2006 to present, she has served as Trustee at the Harris Theater For Music and Dance (not-for-profit organization) and is currently Executive Vice Chair. | 11 | Ms. Kosier is Board Director at the Arts Club of Chicago (2021 to present). |
| * | All communications to Trustees and Officers may be directed to ALPS Series Trust c/o 1290 Broadway, Suite 1000, Denver, CO 80203. |
| ** | This is the period for which the Trustee or Officer began serving the Trust. Each Trustee serves an indefinite term, until such Trustee’s successor is elected and appointed, or such Trustee resigns or is deceased. Officers are elected on an annual basis. |
| *** | Except as otherwise indicated, each individual has held the office shown or other offices in the same company for the last five years. |
| **** | The Fund Complex currently consists of 11 series of the Trust. |
| Annual Report | September 30, 2021 | 73 |
| Clarkston Funds | Trustees and Officers |
| September 30, 2021 (Unaudited) |
INTERESTED TRUSTEE
| Name, Birth Year & Address* | Position(s) Held with Fund | Term of Office and Length of Time Served** | Principal Occupation(s) During Past 5 Years*** | Number of Funds in Fund Complex Overseen by Trustee**** | Other Directorships Held by Trustee During Past 5 Years*** |
| Bradley J. Swenson, Birth year: 1972 | Trustee | Mr. Swenson was elected to the Board on April 12, 2021. | Mr. Swenson joined ALPS Fund Services, Inc. (“ALPS”) in 2004 and had served as its President since June 2019 until June 2021. In this role, he served as an officer to certain other closed- end and open-end investment companies. He previously served as the Chief Operating Officer of ALPS (2015-2019). Mr. Swenson also previously served as Chief Compliance Officer to ALPS, its affiliated entities, and to certain ETF, closed-end and open-end investment companies (2004-2015). | 11 | None |
| * | All communications to Trustees and Officers may be directed to ALPS Series Trust c/o 1290 Broadway, Suite 1000, Denver, CO 80203. |
| ** | This is the period for which the Trustee or Officer began serving the Trust. Each Trustee serves an indefinite term, until such Trustee’s successor is elected and appointed, or such Trustee resigns or is deceased. Officers are elected on an annual basis. |
| *** | Except as otherwise indicated, each individual has held the office shown or other offices in the same company for the last five years. |
| **** | The Fund Complex currently consists of 11 series of the Trust. |
| 74 | www.clarkstonfunds.com |
| Clarkston Funds | Trustees and Officers |
| September 30, 2021 (Unaudited) |
| OFFICERS | |||
| Name, Birth Year & Address* | Position(s) Held with Fund | Term of Office and Length of Time Served** | Principal Occupation(s) During Past 5 Years*** |
| Dawn Cotten Birth year: 1977 | President | Since June 2021 | Ms. Cotten joined ALPS in 2009 and is currently Senior Vice President of Fund Administration and Relationship Management of ALPS. She has served in that role since January 2020. Prior to that, Ms. Cotten served as Senior Vice President (2017-2020) and Vice President of ALPS Relationship Management (2013-2017). |
| Erich Rettinger Birth year: 1985 | Treasurer | Since August 2020 | Mr. Rettinger joined ALPS in 2007 and is currently Vice President and Fund Controller of ALPS. He has served as Fund Controller of ALPS (since 2013) and Fund Accounting of ALPS (2013- 2017). He also served as Assistant Treasurer of the Trust (May 2019-August 2020). Mr. Rettinger is also Treasurer of the Clough Long/Short Equity Fund, Clough Global Opportunities Fund, Clough Global Dividend and Income Fund and Clough Global Equity Fund. Mr. Rettinger is also Assistant Treasurer of the Stone Harbor Investment Funds. |
| Patrick Rogers+ Birth year: 1966 | Secretary | Since November 2021 | Mr. Rogers has served as Senior Legal Counsel of ALPS since September 2021 and previously served as Compliance Counsel for Mercer Advisors from 2018 to 2021 and Contract Attorney for CACI, Inc. from 2014 to 2018. |
| Anne M. Berg Birth year: 1973 | Assistant Secretary | Since August 2018 | Ms. Berg joined ALPS as Senior Investment Company Act Paralegal in February 2017. Prior to joining ALPS, she was a Senior Legal Manager at Janus Capital Management LLC (2000-2017). |
| Lucas D. Foss Birth year: 1977 | Chief Compliance Officer | Since January 2018 | Mr. Foss rejoined ALPS in November 2017 as Vice President and Deputy Chief Compliance Officer. Prior to his current role, Mr. Foss served as the Director of Compliance at Transamerica Asset Management (2015- 2017) and Deputy Chief Compliance Officer at ALPS (2012- 2015). Mr. Foss is also CCO of X-Square Balanced Fund, Goehring & Rozencwajg Investment Funds, Broadstone Real Estate Access Fund, Inc., Clough Global Funds; Clough Funds Trust; SPDR® S&P 500® ETF Trust, SPDR® Dow Jones® Industrial Average ETF Trust, SPDR® S&P MIDCAP 400® ETF Trust and 1WS Credit Income Fund. |
| Annual Report | September 30, 2021 | 75 |
| Clarkston Funds | Trustees and Officers |
| September 30, 2021 (Unaudited) |
| * | All communications to Trustees and Officers may be directed to ALPS Series Trust c/o 1290 Broadway, Suite 1000, Denver, CO 80203. |
| ** | This is the period for which the Trustee or Officer began serving the Trust. Each Trustee serves an indefinite term, until such Trustee’s successor is elected and appointed, or such Trustee resigns or is deceased. Officers are elected on an annual basis. |
| *** | Except as otherwise indicated, each individual has held the office shown or other offices in the same company for the last five years. |
| **** | The Fund Complex currently consists of 11 series of the Trust. |
| + | Appointed November 18, 2021 |
Additional information about members of the Board of Trustees and officers of the Trust is available in the Statement of Additional Information and is available, without charge, upon request, by calling the Fund (toll-free) at 1-844-680-6562.
| 76 | www.clarkstonfunds.com |


Table of Contents
| Shareholder Letter | 1 |
| Portfolio Update | 4 |
| Disclosure of Fund Expenses | 6 |
| Portfolio of Investments | 7 |
| Statement of Assets and Liabilities | 13 |
| Statement of Operations | 14 |
| Statements of Changes in Net Assets | 15 |
| Financial Highlights | 16 |
| Notes to Financial Statements | 19 |
| Report of Independent Registered Public Accounting Firm | 28 |
| Disclosure Regarding Renewal and Approval of Fund Advisory Agreement | 29 |
| Additional Information | 31 |
| Liquidity Risk Management Program | 32 |
| Privacy Policy | 33 |
| Trustees & Officers | 35 |
| DDJ Opportunistic High Yield Fund | Shareholder Letter |
| September 30, 2021 (Unaudited) |
Message from the DDJ President: Covering September 30, 2020 – September 30, 2021
The high yield bond market began the fourth quarter of 2020 with somewhat of a cautious tone, particularly over the second half of October as political uncertainty increased ahead of the U.S. election. However, once election day had passed, the market appeared relieved that such a contentious election was finally over. This reduced political uncertainty coupled with the announcements in November of the development of two effective vaccines for COVID-19 set the stage for a significant rally. The positive vaccine news in particular increased optimism that the economy could “reopen” sooner than initially anticipated, resulting in positive performance by the high yield market that continued largely unabated through September 30th, 2021.
After a relatively slow start at the end of 2020, the pace of COVID-19 vaccinations steadily increased during the first quarter of 2021 and into the second quarter. While the rate of vaccinations slowed towards the end of the second and during the third quarter of 2021, progress continued nonetheless, and by the end of the third quarter, approximately 56% of the U.S. population had been fully vaccinated against COVID-19. In all likelihood, when the U.S. was hit by this summer’s Delta variant COVID wave, the surge in cases, hospitalizations and deaths would likely have been far worse had only a fraction of the population been vaccinated. In addition to the obvious public health benefits of an increasingly vaccinated population, the successful vaccine rollout resulted in most COVID-19 related restrictions being lifted during the second quarter, accelerating the reopening of the economy. Furthermore, significant government stimulus continued to support the economy, with President Biden signing into law an additional $1.9 trillion COVID-19 stimulus bill in March 2021, and the U.S. Federal Reserve (“the Fed”) maintaining an accommodative monetary policy. As a result, economic activity has been robust recently, with Q1 and Q2 GDP in the U.S. increasing at an annualized rate of 6.3% and 6.7%, respectively, while most forecasts call for calendar year 2021 GDP growth above 5.5% on an annualized basis. That being said, there is evidence that the pace of economic growth is slowing, particularly given the likelihood that the COVID-19 Delta variant will adversely impact the economy in the third quarter and beyond.
Against this backdrop, the fundamental profile of many issuers in the high yield market saw meaningful improvements in the first quarter of 2021, with such improvements accelerating in the second quarter (the most recent quarterly data available). In aggregate, high yield market issuers experienced growing revenues as well as EBITDA in the second quarter of 2021, and according to JP Morgan estimates, aggregate EBITDA and revenues in the second quarter for the high yield market as a whole are now above levels generated during the first quarter of 2019 (pre-pandemic). However, leverage continues to remain above pre-pandemic levels, though it did decrease meaningfully in the second quarter and, In our view, should continue to improve in coming quarters as trailing twelve-month EBITDA levels normalize. In fact, as a result of projected EBITA growth, some investment bank forecasts call for leverage to return to pre-pandemic levels as soon as the end of this year.
From a technical perspective, over the trailing twelve months ending September 30, 2021, high yield bond mutual funds experienced three consecutive quarters of net outflows before reporting modest inflows in the third quarter of 2021, resulting in sizable outflows over the period. Conversely, leveraged loan mutual funds have experienced consecutive monthly inflows beginning in December 2020, following over two years of net outflows. Furthermore, high yield bond primary market activity remained robust over the entire period. Record calendar year issuance in 2020 was followed by the largest, third largest, and seventh largest quarterly issuance totals during the first, second, and third quarters of 2021, respectively. Notably, over the twelve-month period ending September 30, 2021, the primary use of such new issuances has been to refinance existing debt. In addition, after two quarters of subdued issuance, primary market activity for loans rebounded in the fourth quarter of 2020 and has remained strong over the first three quarters of 2021. Be that as it may, refinancing and repricing activity was the dominant use of proceeds over the entire period; however, M&A-related activity led the way in terms of use of proceeds over the past two quarters. In addition, improving fundamentals and wide open primary markets have resulted in a steady decline in default activity over the past twelve months, with the par-weighted default rate for high yield bonds dipping below 1%, well under the 25-year average of 3.0%. At this point, most high yield companies have refinanced their debt, locking in lower interest rates and extending their maturity profile. As a result, issuers have experienced an improvement in their overall liquidity, which when coupled with improved business fundamentals, supports the outlook for a muted default environment and the relatively tight spreads observed in the high yield market at the time of this writing.
The primary risk investors have been grappling with over the past twelve months, and in particular over the first three quarters of 2021, is the trajectory of inflation in the U.S. Several factors have contributed to heightened concerns over rising inflation, including an improving outlook for economic growth, sharply higher oil and gas prices, the enactment of a $1.9 trillion COVID-19 stimulus bill in March, and supply chain/freight issues that have resulted in higher import prices as well as shortages of some products. These concerns are the primary reason for the meaningful increase in intermediate-to-longer maturity Treasury yields in the first quarter of 2021, with the 10-year Treasury yield, for example, increasing over 80 basis points to close the quarter at 1.74%, higher than where it stood on January 31, 2020, just prior to the beginning of the pandemic-induced market volatility. Treasury rates remained volatile over the subsequent two quarters, declining during the second quarter before increasing modestly in the third quarter. After its September 2021 meeting, the Fed indicated that a shift to tighter monetary policy is on the horizon, beginning with a decision to taper its asset purchases likely to commence in the fourth quarter of 2021, followed by rate hikes as soon as next year. I expect interest rate volatility to continue in the coming quarters, with a bias toward higher rates, as the Fed transitions from its current accommodative stance to gradually tighter monetary policy.
| Annual Report | September 30, 2021 | 1 |
| DDJ Opportunistic High Yield Fund | Shareholder Letter |
| September 30, 2021 (Unaudited) |
In this environment, during the trailing twelve months ending September 30, 2021, leveraged credit markets produced impressive gains, with the high yield bond market performance exceeded the return of the leveraged loan market. This performance was driven by CCC-rated bonds, which significantly outperformed both BB-rated and B-rated bonds, as the fundamental prospects of such issuers benefited disproportionately from the improving economic outlook while higher Treasury yields during the period negatively impacted the performance of longer duration, higher-rated issues. From a sector perspective, the top performers were the sectors initially hardest hit by the COVID-19 pandemic and associated mitigation efforts (i.e., Energy, Transportation, and Leisure sectors). Conversely, the Utility and Telecommunications sectors lagged the broader market over the period.
Turning our attention to the Fund’s performance, during the twelve-months ending September 30, 2021, the Fund outperformed its benchmark, the ICE BofA U.S. High Yield Index. The Fund’s structurally shorter duration relative to the benchmark, due in large part to the Fund’s strategic allocation to bank loans, was a significant contributor to relative performance, given the increase in U.S. Treasury yields during the period. In addition, the Fund’s income advantage relative to the benchmark, a characteristic that the Fund typically exhibits as a result of its higher-than-average coupon, also meaningfully contributed to relative performance. Furthermore, the large outperformance by CCC-rated bonds and loans relative to higher rated bonds and loans (i.e., BB and B-rated) that occurred in the leveraged credit market during the period, as described above, served as a significant tailwind to the Fund’s relative performance over the period. Specifically, the investment strategy pursued by DDJ on behalf of the Fund seeks to exploit inefficiencies in the lower tier (i.e., B/CCC-rated) segment of the leveraged credit market, and as a result, the Fund typically has a significant underweight to the BB-rated segment of the market and overweight to the CCC-rated segment. As mentioned above, lower quality high yield bonds and loans significantly outperformed their higher-quality peers during the trailing twelve-month period, positively impacting the Fund’s relative performance.
Looking forward, DDJ continues to maintain a constructive outlook for the U.S. economy. While it may be true that the economic recovery has slowed, DDJ believes that such recovery will continue, supported by fiscal stimulus and, even if waning, monetary stimulus. In addition, the economy should benefit from continued vaccinations both domestically as well as abroad and an eventual return to normalcy; however, the global economy remains susceptible to virus-induced disruptions, albeit to a much lesser degree than those experienced during the earlier part of the pandemic. Furthermore, I believe persistent inflationary pressures as well as the potential for a monetary policy mistake by the Fed remain the primary risks in the current market environment, which DDJ will continue to closely monitor. While a policy mistake by the Fed has the potential to induce angst and volatility in markets, I believe that the Fed will tread carefully, both in its messaging and its actions, with regards to its taper of asset purchases and eventual interest rate hikes.
Furthermore, despite the strong rebound in the performance of the high yield market since the pandemic-induced selloff in early 2020, DDJ believes that the market still offers reasonable valuations and an attractive yield relative to other fixed income markets. In particular, as compared to the upper tier segment, DDJ believes that the lower tier of the high yield market remains more insulated from a rise in interest rates, as well as from associated interest rate volatility. Lower-rated bonds typically have shorter durations and higher coupons with more room, relative to higher quality bonds, for incremental spread compression at this point in the credit cycle. In addition, bank loans, which are a meaningful component of the Fund's investments, could benefit from a rising rate environment given the floating rate nature of their coupon. Accordingly, for the balance of 2021, DDJ remains cautiously optimistic about the performance of the high yield market broadly, as well as the relative returns of the Fund. DDJ believes that a continued economic recovery should disproportionately benefit the fundamental profile of issuers in the lower tier segment, enabling such issuers to reduce their overall leverage, potentially further limiting the likelihood of significant default losses in such segment.
Sincerely,

David J. Breazzano
President, Chief Investment Officer and Co-Portfolio Manager
DDJ Capital Management, LLC
The ICE BofA Merrill Lynch U.S. High Yield Index is maintained by ICE BofA Merrill Lynch and comprises U.S. dollar denominated below investment grade corporate debt publicly issued in the U.S. domestic market. One cannot invest directly into an index.
BPS: Stands for basis points. A basis point is one one-hundredth of one percent (0.0001).
Coupon: The stated interest rate paid on a bond. Coupon payments for high yield bonds are typically made semi-annually.
Yield: The yield is the income return on an investment, such as interest or dividends received from holding a particular security.
| 2 | www.ddjcap.com |
| DDJ Opportunistic High Yield Fund | Shareholder Letter |
| September 30, 2021 (Unaudited) |
Yield Premium: As referenced in this letter, refers to the yield of individual investments in the Fund, or the yield of the Fund in aggregate, being higher than the yield of the Fund’s benchmark.
The views and information discussed in this commentary are as of the date of publication, are subject to change, and may not reflect the writer’s current views. The views expressed are those of the Adviser only and represent an assessment of market conditions at a specific point in time, are opinions only and should not be relied upon as investment advice regarding a particular investment or markets in general. Such information does not constitute a recommendation to buy or sell specific securities or investment vehicles. It should not be assumed that any investment will be profitable or will equal the performance of the fund(s) or any securities or any sectors mentioned in this letter. The subject matter contained in this letter has been derived from several sources believed to be reliable and accurate at the time of compilation. Neither the Fund nor the Adviser accepts any liability for losses either direct or consequential caused by the use of this information.
Credit ratings are measured on a scale that generally ranges from AAA (highest) to D (lowest). All Fund securities except for those labeled “Not Rated” and “Other” have been rated by Moody’s, S&P or Fitch, which are each a Nationally Recognized Statistical Rating Organization (“NRSRO”). All Index securities except for those labeled “Not Rated” have been rated by Moody’s or S&P. Credit ratings are subject to change.
Not FDIC Insured – No Bank Guarantee – May Lose Value
Past performance does not guarantee future results.
ALPS Distributors, Inc. is not affiliated with DDJ Capital Management, LLC, the investment adviser to the Fund.
Please consider the DDJ Opportunistic High Yield Fund’s investment objectives, risks, and charges and expenses carefully before investing. This and other important information is contained in the Fund’s prospectus, which can be obtained by calling 844-363-4898. Please read before investing.
| Annual Report | September 30, 2021 | 3 |
| DDJ Opportunistic High Yield Fund | Portfolio Update |
| September 30, 2021 (Unaudited) |
Average Annual Total Returns (as of September 30, 2021)
| 1 Year | 3 Year | 5 Year | Since Inception* | |
| DDJ Opportunistic High Yield Fund – Institutional Class | 12.74%** | 4.11% | 5.81% | 5.72% |
| DDJ Opportunistic High Yield Fund – Class I | 12.62%** | 4.10% | 5.84% | 5.73% |
| DDJ Opportunistic High Yield Fund – Class II | 12.33%** | 3.75% | 5.47% | 5.38% |
| ICE BofA Merrill Lynch U.S. High Yield Index(a) | 11.46% | 6.62% | 6.35% | 6.25% |
The performance data quoted above represents past performance. Past performance is not a guarantee of future results. Investment return and value of the Fund shares will fluctuate so that an investor’s shares, when sold or redeemed, may be worth more or less than their original cost. Performance may be lower or higher than performance data quoted. Fund performance current to the most recent month-end is available by calling (844) 363-4898 or by visiting www.ddjfunds.com.
| * | Fund’s inception date is July 16, 2015. |
| ** | Excludes adjustments in accordance with accounting principles generally accepted in the United States of America and as such, the net asset value and total return for shareholder transactions reported to the market may differ from the net asset value for financial reporting purposes. |
| (a) | The benchmark of the Fund is the ICE BofAML US High Yield Index, maintained by ICE BofA Merrill Lynch and comprised of U.S. dollar denominated below investment grade corporate debt publicly issued in the U.S. domestic market. |
Returns of less than 1 year are cumulative.
Indices are not actively managed and do not reflect deduction for fees, expenses or taxes. An investor cannot invest directly in an index.
The returns shown above do not reflect the deduction of taxes a shareholder would pay on Fund distributions or redemption of Fund shares.
The total annual operating expenses and total annual operating expenses after fee waivers and/or reimbursement for the Fund’s Institutional Class, Class I and Class II shares (as reported in the January 28, 2021 Prospectus) are 1.24% and 0.79%, 1.42% and 0.89% and 1.71% and 1.14% respectively. The Fund’s investment adviser has contractually agreed to limit expenses through January 31, 2022.
Performance of $5,000,000 Initial Investment (as of September 30, 2021)

The graph shown above represents historical performance of a hypothetical investment of $5,000,000 in the Fund since inception. Past performance does not guarantee future results. All returns reflect reinvested dividends, but do not reflect the deduction of taxes that a shareholder would pay on Fund distributions or the redemption of Fund shares.
| 4 | www.ddjcap.com |
| DDJ Opportunistic High Yield Fund | Portfolio Update |
| September 30, 2021 (Unaudited) |
| Top Ten Holdings (as a % of Net Assets)* | |
| NFP Corp. | 3.73% |
| Century Aluminum Co. | 3.65% |
| Baffinland Iron Mines Corp. / Baffinland Iron Mines LP | 3.51% |
| Tenet Healthcare Corp. | 2.47% |
| Ford Motor Co. | 2.39% |
| CNT Holdings I Corp | 2.29% |
| Deliver Buyer, Inc. | 2.14% |
| Engineered Machinery Holdings, Inc. | 2.07% |
| Brand Energy & Infrastructure Services, Inc. | 2.02% |
| HUB International, Ltd. | 1.89% |
| Top Ten Holdings | 26.16% |
| * | Holdings are subject to change, and may not reflect the current or future position of the portfolio. Tables present indicative values only. |
Portfolio Composition (as a % of Net Assets)*

| Annual Report | September 30, 2021 | 5 |
| DDJ Opportunistic High Yield Fund | Disclosure of Fund Expenses |
| September 30, 2021 (Unaudited) |
Examples. As a shareholder of the DDJ Opportunistic High Yield Fund (the “Fund”), you incur two types of costs: (1) transaction costs, including applicable redemption fees; and (2) ongoing costs, including management fees, distribution and service (12b-1) fees and other Fund expenses. The following examples are intended to help you understand your ongoing costs (in dollars) of investing in the Fund and to compare these costs with the ongoing costs of investing in other mutual funds. The examples are based on an investment of $1,000 invested on April 1, 2021 and held through September 30, 2021.
Actual Expenses. The first line under each class in the table below provides information about actual account values and actual expenses. You may use the information in this line, together with the amount you invested, to estimate the expenses that you paid over the period. Simply divide your account value by $1,000 (for example, an $8,600 account value divided by $1,000 = 8.6), then multiply the result by the number in the first line under the heading “Expenses Paid During Period April 1, 2021 - September 30, 2021” to estimate the expenses you paid on your account during this period.
Hypothetical Example for Comparison Purposes. The second line under each class in the table below provides information about hypothetical account values and hypothetical expenses based on the Fund’s actual expense ratio and an assumed rate of return of 5% per year before expenses, which is not the Fund’s actual return. The hypothetical account values and expenses may not be used to estimate the actual ending account balance or expenses you paid for the period. You may use this information to compare the ongoing costs of investing in the Fund and other mutual funds. To do so, compare this 5% hypothetical example with the 5% hypothetical examples that appear in the shareholder reports of the other funds.
Please note that the expenses shown in the table are meant to highlight your ongoing Fund costs only and do not reflect any transactional costs, such as redemption fees. Therefore, the second line under each class in the table below is useful in comparing ongoing costs only and will not help you determine the relative total costs of owning different funds. In addition, if these transactional costs were included, your costs would have been higher.
| Beginning Account Value April 1, 2021 | Ending Account Value September 30, 2021 | Expense Ratio(a) | Expense Paid During Period April 1, 2021 - September 30, 2021(b) | |||||||||||||
| DDJ Opportunistic High Yield Fund | ||||||||||||||||
| Institutional Class | ||||||||||||||||
| Actual | $ | 1,000.00 | $ | 1,037.90 | 0.79 | % | $ | 4.04 | ||||||||
| Hypothetical (5% return before expenses) | $ | 1,000.00 | $ | 1,021.11 | 0.79 | % | $ | 4.00 | ||||||||
| Class I | ||||||||||||||||
| Actual | $ | 1,000.00 | $ | 1,036.80 | 0.79 | % | $ | 4.03 | ||||||||
| Hypothetical (5% return before expenses) | $ | 1,000.00 | $ | 1,021.11 | 0.79 | % | $ | 4.00 | ||||||||
| Class II | ||||||||||||||||
| Actual | $ | 1,000.00 | $ | 1,034.80 | 1.14 | % | $ | 5.82 | ||||||||
| Hypothetical (5% return before expenses) | $ | 1,000.00 | $ | 1,019.35 | 1.14 | % | $ | 5.77 | ||||||||
| (a) | The Fund's expense ratios have been annualized based on the Fund's most recent fiscal half-year expenses after any applicable waivers and reimbursements. |
| (b) | Expenses are equal to the annualized expense ratio shown above for the applicable class, multiplied by the average account value over the period, multiplied by the number of days in the most recent fiscal half year (183), divided by 365. |
| 6 | www.ddjcap.com |
| DDJ Opportunistic High Yield Fund | Portfolio of Investments |
| September 30, 2021 |
| Shares | Value (Note 2) | |||||||
| COMMON STOCKS (0.67%) | ||||||||
| Consumer, Non-Cyclical (0.10%) | ||||||||
| American Tire Distributors, Inc.(a)(b)(c)(d)(e) | 2,940 | $ | 245,549 | |||||
| Materials (0.12%) | ||||||||
| Real Alloy Holding, Inc.(a)(b)(c)(d)(e) | 3 | 120,709 | ||||||
| Specialty Steel Holdco, Inc.(a)(b)(c)(d)(e) | 1 | 184,052 | ||||||
| Total Materials | 304,761 | |||||||
| Mineral and Precious Stone Mining (0.03%) | ||||||||
| Arctic Canadian Diamond Co LTD.(a)(b)(d)(e) | 541 | 82,773 | ||||||
| Oil & Gas (0.26%) | ||||||||
| Utex Industries, Inc.(a)(b)(c)(d)(e) | 7,506 | 638,385 | ||||||
| Technology (0.16%) | ||||||||
| Skillsoft Corp.(b)(c)(d) | 32,763 | 382,994 | ||||||
| TOTAL COMMON STOCKS | ||||||||
| (Cost $974,461) | 1,654,462 | |||||||
| Rate | Maturity Date | Principal Amount | Value (Note 2) | |||||||||
| BANK LOANS (34.85%) | ||||||||||||
| Basic Materials (1.04%) | ||||||||||||
| Aruba Investments, Inc., Series Initial(f) | 3M US L + 7.75%, 0.75% Floor | 11/24/2028 | $ | 2,540,000 | $ | 2,567,521 | ||||||
| Communications (3.73%) | ||||||||||||
| Auction.com LLC fka Ten-X LLC(b)(c)(f) | 1M US L + 4.00%, 1.00% Floor | 9/27/2024 | 4,108,773 | 3,970,102 | ||||||||
| Getty Images, Inc., Series Initial Dollar(f) | 1M US L + 4.50% | 2/19/2026 | 809,481 | 810,663 | ||||||||
| Intrado Corp., Series Initial B(f) | 3M US L + 4.00%, 1.00% Floor | 10/10/2024 | 4,490,869 | 4,431,882 | ||||||||
| Total Communications | 9,212,647 | |||||||||||
| Consumer Discretionary (2.77%) | ||||||||||||
| 18 Fremont Street Acquisition LLC(f) | 3M US L + 9.50%, 1.50% Floor | 8/9/2025 | 1,107,214 | 1,131,667 | ||||||||
| American Tire Distributors, Inc., Series Initial(b)(c)(f)(g) | Cash L + 7.50 + PIK 1.50%, 1.00% Floor | 9/2/2024 | 16,667 | 16,687 | ||||||||
| American Tire Distributors, Inc., Series Initial (DIP)(b)(c)(f)(g) | Cash L + 6.00 + PIK 1.00%, 1.00% Floor | 9/1/2023 | 25,705 | 25,720 | ||||||||
| CNT Holdings I Corp, Series Initial(f)(h) | 3M US L + 6.75%, 0.75% Floor | 11/6/2028 | 5,554,188 | 5,665,272 | ||||||||
| Total Consumer Discretionary | 6,839,346 | |||||||||||
| Consumer, Cyclical (0.77%) | ||||||||||||
| Autokiniton US Holdings, Inc., Series Closing Date B(f) | 3M US L + 4.50%, 0.50% Floor | 4/6/2028 | 997,500 | 998,747 | ||||||||
| DexKo Global, Inc., Series B(a)(e)(f) | 3M US L + 8.25% | 7/24/2025 | 238,910 | 238,910 | ||||||||
| Wheel Pros, Inc., Series Initial(f) | 1M US L + 4.50%, 0.75% Floor | 5/11/2028 | 660,000 | 660,548 | ||||||||
| Total Consumer, Cyclical | 1,898,205 | |||||||||||
| See Notes to Financial Statements. | |
| Annual Report | September 30, 2021 | 7 |
| DDJ Opportunistic High Yield Fund | Portfolio of Investments |
| September 30, 2021 |
| Rate | Maturity Date | Principal Amount | Value (Note 2) | |||||||||
| Consumer, Non-Cyclical (16.97%) | ||||||||||||
| Ankura Consulting Group LLC, Series Closing Date(a)(f) | 1M US L + 8.00%, 0.75% Floor | 3/19/2029 | $ | 650,000 | $ | 662,188 | ||||||
| Asurion LLC, Series New B-4(f) | 1M US L + 5.25% | 1/20/2029 | 2,390,000 | 2,381,934 | ||||||||
| ATI Holdings Acquisition, Inc., Series Initial(f) | 3M US L + 3.50%, 1.00% Floor | 5/10/2023 | 1,710,365 | 1,674,379 | ||||||||
| Cano Health LLC, Series Initial(f) | 3M US L + 4.75%, 0.75% Floor | 11/23/2027 | 1,400,124 | 1,403,043 | ||||||||
| Cloudera, Inc.(a)(f)(h) | 0.50% Floor | 8/10/2029 | 860,000 | 860,000 | ||||||||
| CP Iris Holdco I, Inc.(a)(b)(f)(h) | 0.50% Floor | 9/15/2029 | 1,720,000 | 1,720,000 | ||||||||
| Envision Healthcare Corp., Series Initial(f)(h) | 1M US L + 3.75% | 10/10/2025 | 2,527,008 | 2,256,365 | ||||||||
| Infinite Bidco LLC, Series Initial(f) | 1M US L + 7.00%, 0.50% Floor | 3/2/2029 | 4,245,740 | 4,288,198 | ||||||||
| IRI Holdings, Inc., Series Initial(f) | 1M US L + 4.25% | 12/1/2025 | 597,357 | 597,730 | ||||||||
| KKR Apple Bidco LLC, Series Initial(f)(h) | 6M US L + 5.75%, 0.50% Floor | 9/21/2029 | 1,500,000 | 1,527,195 | ||||||||
| KUEHG Corp, Series B-3(f) | 3M US L + 3.75%, 1.00% Floor | 2/21/2025 | 4,556,169 | 4,521,679 | ||||||||
| KUEHG Corp, Series Tranche B(f) | 3M US L + 8.25%, 1.00% Floor | 8/22/2025 | 780,000 | 782,925 | ||||||||
| LaserShip, Inc., Series Initial(a)(f) | 3M US L + 7.50%, 0.75% Floor | 5/7/2029 | 1,450,000 | 1,457,250 | ||||||||
| Learning Care Group No. 2, Inc., Series Initial(f) | 3M US L + 7.50%, 1.00% Floor | 3/13/2026 | 1,970,000 | 1,964,257 | ||||||||
| Learning Care Group No. 2, Inc., Series Initial(f) | 3M US L + 3.25%, 1.00% Floor | 3/13/2025 | 3,637,060 | 3,590,087 | ||||||||
| Medical Solutions LLC(f)(h) | 0.50% Floor | 9/24/2028 | 1,770,000 | 1,752,300 | ||||||||
| MH Sub I LLC, Series 2021 Replacement(f) | 1M US L + 6.25% | 2/23/2029 | 4,340,000 | 4,416,623 | ||||||||
| Option Care Health, Inc., Series B(f) | 1M US L + 3.75% | 8/6/2026 | 922,955 | 923,762 | ||||||||
| RLG Holdings LLC, Series Delayed Draw(f)(h) | 0.75% Floor | 7/7/2028 | 167,089 | 167,585 | ||||||||
| RLG Holdings LLC, Series Closing Date Initial(f)(i) | 3M US L + 4.25%, 0.75% Floor | 7/7/2028 | 660,000 | 661,960 | ||||||||
| SM Wellness Holdings, Inc., Series Initial(a)(f) | 3M US L + 8.75%, 0.75% Floor | 4/16/2029 | 1,030,000 | 1,037,725 | ||||||||
| VC GB Holdings I Corp, Series Initial(f) | 3M US L + 6.75%, 0.50% Floor | 7/23/2029 | 1,330,000 | 1,339,556 | ||||||||
| Xplornet Communications Inc. TL(f)(h) | 0.50% Floor | 9/30/2029 | 1,930,000 | 1,920,350 | ||||||||
| Total Consumer, Non-Cyclical | 41,907,091 | |||||||||||
| eCommerce (1.21%) | ||||||||||||
| CommerceHub, Inc., Series Initial(f)(h) | 3M US L + 7.00%, 0.75% Floor | 12/29/2028 | 2,910,000 | 2,979,113 | ||||||||
| Financials (1.29%) | ||||||||||||
| Arctic Canadian Diamond Corp, 1L TL(a)(b)(e)(f) | 3M US L + 5.00%, 1.00% Floor | 12/31/2027 | 37,950 | 37,950 | ||||||||
| Arctic Canadian Diamond Corp, 2L TL(a)(b)(e)(g) | Cash 5.00% + PIK 12.50% | 12/31/2027 | 483,762 | 483,762 | ||||||||
| Masergy Holdings, Inc., Series Initial(f) | 3M US L + 7.50%, 1.00% Floor | 12/16/2024 | 2,584,107 | 2,578,732 | ||||||||
| Zest Acquisition Corp., Series Initial(a)(f) | 3M US L + 7.50%, 1.00% Floor | 3/13/2026 | 90,000 | 90,112 | ||||||||
| Total Financials | 3,190,556 | |||||||||||
| Industrials (7.05%) | ||||||||||||
| Brand Energy & Infrastructure Services, Inc., Series Initial(f) | 3M US L + 4.25%, 1.00% Floor | 6/21/2024 | 5,008,543 | 4,975,461 | ||||||||
| Deliver Buyer, Inc., Series Senior Secured(a)(f) | 3M US L + 5.00%, 1.00% Floor | 5/1/2024 | 4,188,023 | 4,206,345 | ||||||||
| Deliver Buyer, Inc., Series Amendment No. 5(f) | 3M US L + 6.25%, 1.00% Floor | 5/1/2024 | 1,061,955 | 1,066,936 | ||||||||
| Engineered Machinery Holdings, Inc., Series Incremental | ||||||||||||
| Amendment No. 2(f) | 3M US L + 6.50%, 0.75% Floor | 5/21/2029 | 2,760,000 | 2,791,050 | ||||||||
| Engineered Machinery Holdings, Inc., Series Incremental | ||||||||||||
| Amendment No. 3(a)(f) | 3M US L + 6.00%, 0.75% Floor | 5/21/2029 | 2,295,812 | 2,324,510 | ||||||||
| GI Consilio Parent LLC(a)(e)(f) | 1M US L + 7.50%, 0.50% Floor | 5/14/2029 | 2,050,000 | 2,050,000 | ||||||||
| Total Industrials | 17,414,302 | |||||||||||
| Oil & Gas (0.02%) | ||||||||||||
| Utex Industries, Inc., Series Second Out(b)(f)(g) | 1M US L + 3.75% + PIK 5.75%, 1.50% Floor | 12/3/2025 | 46,776 | 46,074 | ||||||||
| TOTAL BANK LOANS | ||||||||||||
| (Cost $84,754,560) | 86,054,855 | |||||||||||
| See Notes to Financial Statements. | |
| 8 | www.ddjcap.com |
| DDJ Opportunistic High Yield Fund | Portfolio of Investments |
| September 30, 2021 |
| Rate | Maturity Date | Principal Amount | Value (Note 2) | |||||||||
| HIGH YIELD BONDS AND NOTES (62.13%) | ||||||||||||
| Basic Materials (10.51%) | ||||||||||||
| Allegheny Technologies, Inc. | 7.875% | 8/15/2023 | $ | 2,400,000 | $ | 2,703,000 | ||||||
| Allegheny Technologies, Inc. | 5.875% | 12/1/2027 | 460,000 | 487,025 | ||||||||
| Baffinland Iron Mines Corp. / Baffinland Iron Mines LP(j) | 8.750% | 7/15/2026 | 8,190,000 | 8,678,370 | ||||||||
| Big River Steel LLC / BRS Finance Corp.(j) | 6.625% | 1/31/2029 | 2,336,000 | 2,530,098 | ||||||||
| Century Aluminum Co.(j) | 7.500% | 4/1/2028 | 8,495,000 | 9,023,984 | ||||||||
| Joseph T Ryerson & Son, Inc.(j) | 8.500% | 8/1/2028 | 2,281,000 | 2,532,913 | ||||||||
| Northwest Acquisitions ULC / Dominion Finco, Inc.(b)(c)(d)(j)(k) | 7.125% | 11/1/2022 | 1,650,000 | 2,145 | ||||||||
| Total Basic Materials | 25,957,535 | |||||||||||
| Communications (5.36%) | ||||||||||||
| Clear Channel Outdoor Holdings, Inc.(j) | 7.750% | 4/17/2028 | 2,170,000 | 2,286,833 | ||||||||
| Clear Channel Outdoor Holdings, Inc.(j) | 7.500% | 6/1/2029 | 440,000 | 458,150 | ||||||||
| Connect Finco SARL / Connect US Finco LLC(j) | 6.750% | 10/1/2026 | 3,560,000 | 3,729,314 | ||||||||
| GTT Communications, Inc.(b)(c)(d)(j)(k) | 7.875% | 12/31/2024 | 1,970,000 | 216,700 | ||||||||
| Nexstar Media, Inc.(j) | 5.625% | 7/15/2027 | 340,000 | 360,136 | ||||||||
| Scripps Escrow II, Inc.(j) | 5.375% | 1/15/2031 | 1,820,000 | 1,792,018 | ||||||||
| Scripps Escrow, Inc.(j) | 5.875% | 7/15/2027 | 1,460,000 | 1,500,420 | ||||||||
| Viasat, Inc.(j) | 5.625% | 9/15/2025 | 1,450,000 | 1,471,289 | ||||||||
| Viasat, Inc.(j) | 6.500% | 7/15/2028 | 1,340,000 | 1,412,990 | ||||||||
| Total Communications | 13,227,850 | |||||||||||
| Consumer, Cyclical (11.87%) | ||||||||||||
| Boyd Gaming Corp.(j) | 4.750% | 6/15/2031 | 1,070,000 | 1,104,775 | ||||||||
| Carlson Travel, Inc.(b)(j) | 10.500% | 3/31/2025 | 705,741 | 744,758 | ||||||||
| Carlson Travel, Inc.(b)(d)(j)(k) | 6.750% | 12/15/2025 | 2,480,000 | 2,219,699 | ||||||||
| Carlson Travel, Inc.(b)(d)(g)(j)(k) | Cash 9.50% + PIK 2.00% | 12/15/2026 | 644,594 | 216,058 | ||||||||
| Dornoch Debt Merger Sub, Inc.(c)(j) | 6.625% | 10/15/2029 | 2,120,000 | 2,122,650 | ||||||||
| Ford Motor Co. | 7.450% | 7/16/2031 | 1,820,000 | 2,377,102 | ||||||||
| Ford Motor Co. | 9.625% | 4/22/2030 | 4,160,000 | 5,893,576 | ||||||||
| Lions Gate Capital Holdings LLC(j) | 5.500% | 4/15/2029 | 3,040,000 | 3,146,461 | ||||||||
| Real Hero Merger Sub 2, Inc.(j) | 6.250% | 2/1/2029 | 2,000,000 | 2,077,670 | ||||||||
| Specialty Building Products Holdings LLC / SBP Finance Corp.(j) | 6.375% | 9/30/2026 | 1,620,000 | 1,703,025 | ||||||||
| Sportsnet(a)(b)(c)(e) | 10.250% | 1/15/2025 | 100,000 | 101,625 | ||||||||
| SRS Distribution, Inc.(j) | 4.625% | 7/1/2028 | 1,100,000 | 1,123,595 | ||||||||
| Wheel Pros, Inc.(j) | 6.500% | 5/15/2029 | 3,800,000 | 3,681,269 | ||||||||
| White Cap Buyer LLC(j) | 6.875% | 10/15/2028 | 2,654,000 | 2,803,500 | ||||||||
| Total Consumer, Cyclical | 29,315,763 | |||||||||||
| See Notes to Financial Statements. | |
| Annual Report | September 30, 2021 | 9 |
| DDJ Opportunistic High Yield Fund | Portfolio of Investments |
| September 30, 2021 |
| Rate | Maturity Date | Principal Amount | Value (Note 2) | |||||||||
| Consumer, Non-Cyclical (12.03%) | ||||||||||||
| Bausch Health Cos., Inc.(j) | 5.250% | 1/30/2030 | $ | 3,140,000 | $ | 2,932,823 | ||||||
| Carriage Services, Inc.(j) | 4.250% | 5/15/2029 | 740,000 | 741,739 | ||||||||
| Cimpress PLC(j) | 7.000% | 6/15/2026 | 1,860,000 | 1,942,212 | ||||||||
| Envision Healthcare Corp.(j) | 8.750% | 10/15/2026 | 5,180,000 | 4,215,225 | ||||||||
| High Ridge Brands Escrow(a)(b)(e) | 3/15/2025 | 125,000 | 1,550 | |||||||||
| MPH Acquisition Holdings LLC(j) | 5.500% | 9/1/2028 | 3,010,000 | 3,005,861 | ||||||||
| Simmons Foods, Inc./Simmons Prepared Foods Inc/Simmons Pet Food Inc/Simmons Feed(j) | 4.625% | 3/1/2029 | 630,000 | 635,541 | ||||||||
| Specialty Steel(a)(b)(c)(e)(f)(g) | 11.9222% or PIK L+11.00%, 1.00% Floor | 11/15/2026 | 210,000 | 210,000 | ||||||||
| Surgery Center Holdings, Inc.(j) | 6.750% | 7/1/2025 | 2,045,000 | 2,083,344 | ||||||||
| Surgery Center Holdings, Inc.(j) | 10.000% | 4/15/2027 | 3,530,000 | 3,816,812 | ||||||||
| Team Health Holdings, Inc.(j) | 6.375% | 2/1/2025 | 4,135,000 | 4,003,466 | ||||||||
| Tenet Healthcare Corp.(j) | 5.125% | 11/1/2027 | 5,850,000 | 6,105,937 | ||||||||
| Total Consumer, Non-Cyclical | 29,694,510 | |||||||||||
| Energy (3.97%) | ||||||||||||
| Harvest Midstream I LP(j) | 7.500% | 9/1/2028 | 2,975,000 | 3,173,224 | ||||||||
| Occidental Petroleum Corp. | 6.450% | 9/15/2036 | 2,410,000 | 3,035,094 | ||||||||
| Occidental Petroleum Corp. | 8.875% | 7/15/2030 | 1,630,000 | 2,216,279 | ||||||||
| Teine Energy, Ltd.(j) | 6.875% | 4/15/2029 | 1,360,000 | 1,386,207 | ||||||||
| Total Energy | 9,810,804 | |||||||||||
| Financials (7.32%) | ||||||||||||
| AssuredPartners, Inc.(j) | 7.000% | 8/15/2025 | 2,540,000 | 2,583,688 | ||||||||
| GTCR AP Finance, Inc.(j) | 8.000% | 5/15/2027 | 1,530,000 | 1,616,544 | ||||||||
| HUB International, Ltd.(j) | 7.000% | 5/1/2026 | 4,510,000 | 4,667,850 | ||||||||
| NFP Corp.(j) | 6.875% | 8/15/2028 | 6,460,000 | 6,604,769 | ||||||||
| NFP Corp.(j) | 4.875% | 8/15/2028 | 2,550,000 | 2,596,538 | ||||||||
| Total Financials | 18,069,389 | |||||||||||
| Industrials (9.93%) | ||||||||||||
| IEA Energy Services LLC(j) | 6.625% | 8/15/2029 | 1,630,000 | 1,616,927 | ||||||||
| Intelligent Packaging, Ltd. Finco, Inc. / Intelligent Packaging Ltd | ||||||||||||
| Co.-Issuer LLC(j) | 6.000% | 9/15/2028 | 2,050,000 | 2,151,475 | ||||||||
| JPW Industries Holding Corp.(j) | 9.000% | 10/1/2024 | 780,000 | 819,761 | ||||||||
| Material Sciences Corp.(a)(b)(c)(e)(f)(g) | L + 8.25 or PIK 2.00% | 1/9/2024 | 90,225 | 90,225 | ||||||||
| New Enterprise Stone & Lime Co., Inc.(j) | 5.250% | 7/15/2028 | 620,000 | 628,525 | ||||||||
| Plastipak Holdings, Inc.(j) | 6.250% | 10/15/2025 | 4,230,000 | 4,311,956 | ||||||||
| Titan Acquisition, Ltd. / Titan Co.-Borrower LLC(j) | 7.750% | 4/15/2026 | 4,401,000 | 4,503,323 | ||||||||
| TransDigm, Inc. | 6.375% | 6/15/2026 | 2,230,000 | 2,303,389 | ||||||||
| TransDigm, Inc., Series WI | 4.875% | 5/1/2029 | 1,170,000 | 1,174,177 | ||||||||
| Trident TPI Holdings, Inc.(j) | 6.625% | 11/1/2025 | 3,510,000 | 3,571,846 | ||||||||
| Trident TPI Holdings, Inc.(j) | 9.250% | 8/1/2024 | 3,180,000 | 3,345,710 | ||||||||
| Total Industrials | 24,517,314 | |||||||||||
| Materials (0.05%) | ||||||||||||
| L + 10.00% or PIK L+12.00%, | ||||||||||||
| Real Alloy Holding, Inc.(a)(b)(c)(e)(f)(g) | 1.00% Floor | 11/28/2023 | 114,596 | 114,596 | ||||||||
| See Notes to Financial Statements. | |
| 10 | www.ddjcap.com |
| DDJ Opportunistic High Yield Fund | Portfolio of Investments |
| September 30, 2021 |
| Rate | Maturity Date | Principal Amount | Value (Note 2) | |||||||||
| Technology (1.09%) | ||||||||||||
| Playtika Holding Corp.(j) | 4.250% | 3/15/2029 | $ | 1,040,000 | $ | 1,044,617 | ||||||
| Presidio Holdings, Inc.(j) | 8.250% | 2/1/2028 | 1,540,000 | 1,659,843 | ||||||||
| Total Technology | 2,704,460 | |||||||||||
| TOTAL HIGH YIELD BONDS AND NOTES | ||||||||||||
| (Cost $150,613,080) | 153,412,221 | |||||||||||
| WARRANTS (0.00%) | ||||||||||||
| Oil & Gas (0.00%) | ||||||||||||
| Utex Industries Holdings, LLC(a)(b)(c)(d)(e) | 1,150 | – | ||||||||||
| TOTAL WARRANTS | ||||||||||||
| (Cost $–) | – | |||||||||||
| 7-Day Yield | Shares | Value (Note 2) | ||||||||
| SHORT TERM INVESTMENTS (7.49%) | ||||||||||
| MSILF Treasury Securities Port | 0.01% | 18,489,077 | $ | 18,489,077 | ||||||
| TOTAL SHORT TERM INVESTMENTS | ||||||||||
| (Cost $18,489,077) | 18,489,077 | |||||||||
| TOTAL INVESTMENTS (105.14%) | ||||||||||
| (Cost $254,831,178) | $ | 259,610,615 | ||||||||
| LIABILITIES IN EXCESS OF OTHER ASSETS (-5.14%) | (12,690,068 | ) | ||||||||
| NET ASSETS (100.00%) | $ | 246,920,547 | ||||||||
| (a) | As a result of the use of significant unobservable inputs to determine fair value, these investments have been classified as Level 3 assets. Additional information on Level 3 assets can be found in Note 2. Significant Accounting Policies in the Notes to Financial Statements section. |
| (b) | Security deemed to be illiquid under the procedures approved by the Fund’s Board of Trustees. As of September 30, 2021, the fair value of illiquid securities in the aggregate was $11,872,113, representing 4.80% of the Fund’s net assets. |
| (c) | Security deemed to be restricted as of September 30, 2021. As of September 30, 2021, the fair value of restricted securities in the aggregate was $8,442,139, representing 3.42% of the Fund’s net assets. Additional information on restricted securities can be found in Note 2. Significant Accounting Policies in the Notes to Financial Statements section. |
| (d) | Non-income producing security. |
| (e) | Fair valued security under the procedures approved by the Fund’s Board of Trustees. |
| (f) | Floating or variable rate security. The reference rate is described below. The rate in effect as of September 30, 2021 is based on the reference rate plus the displayed spread as of the securities last reset date. |
| (g) | Payment in-kind. |
| (h) | All or a portion of this position has not settled as of September 30, 2021. The interest rate shown represents the stated spread over the London Interbank Offered Rate ("LIBOR" or "L") or the applicable LIBOR floor; the Fund will not accrue interest until the settlement date, at which point LIBOR will be established. |
| (i) | At September 30, 2021, all or a portion of this investment was unfunded. |
| (j) | Securities exempt from registration under Rule 144A of the Securities Act of 1933. These securities may be resold in transactions exempt from registration, normally to qualified institutional buyers. As of September 30, 2021 the fair value of securities restricted under Rule 144A in the aggregate was $132,704,581, representing 53.74% of net assets. These securities have been determined to be liquid pursuant to procedures adopted by the Board unless indicated as illiquid as denoted in footnote (b). |
| (k) | Security is currently in default. |
| See Notes to Financial Statements. | |
| Annual Report | September 30, 2021 | 11 |
| DDJ Opportunistic High Yield Fund | Portfolio of Investments |
| September 30, 2021 |
Investment Abbreviations:
LIBOR - London Interbank Offered Rate
PIK - Payment in-kind
Reference Rates:
1M US L - 1 Month LIBOR as of September 30, 2021 was 0.08%
3M US L - 3 Month LIBOR as of September 30, 2021 was 0.13%
6M US L - 6 Month LIBOR as of September 30, 2021 was 0.16%
For Fund compliance purposes, the Fund's industry classifications refer to any one or more of the industry sub-classifications used by one or more widely recognized market indices or ratings group indices, and/or as defined by Fund's management. This definition may not apply for purposes of this report, which may combine industry sub-classifications for reporting ease. Industries are shown as a percentage of the Fund's net assets. (Unaudited)
| See Notes to Financial Statements. | |
| 12 | www.ddjcap.com |
| DDJ Opportunistic High Yield Fund | Statement of Assets and Liabilities |
| September 30, 2021 |
| ASSETS: | ||||
| Investments, at value (Cost $254,831,178) | $ | 259,610,615 | ||
| Cash and cash equivalents | 12,556 | |||
| Due from custodian | 253,449 | |||
| Receivable for investments sold | 149,332 | |||
| Receivable for shares sold | 444 | |||
| Dividends and interest receivable | 3,546,598 | |||
| Prepaid expenses | 1,648 | |||
| Total Assets | 263,574,642 | |||
| LIABILITIES: | ||||
| Payable for administration and transfer agent fees | 49,425 | |||
| Payable for investments purchased | 16,465,559 | |||
| Payable to adviser | 58,004 | |||
| Payable for distribution fees | ||||
| Class II | 544 | |||
| Payable for printing fees | 1,962 | |||
| Payable for professional fees | 33,083 | |||
| Payable for trustees' fees and expenses | 4,711 | |||
| Payable to Chief Compliance Officer fees | 2,809 | |||
| Accrued expenses and other liabilities | 37,998 | |||
| Total Liabilities | 16,654,095 | |||
| NET ASSETS | $ | 246,920,547 | ||
| NET ASSETS CONSIST OF: | ||||
| Paid-in capital (Note 5) | $ | 242,357,783 | ||
| Total distributable earnings/(deficit) | 4,562,764 | |||
| NET ASSETS | $ | 246,920,547 | ||
| PRICING OF SHARES | ||||
| Institutional Class : | ||||
| Net Asset Value, offering and redemption price per share | $ | 8.59 | ||
| Net Assets | $ | 243,732,272 | ||
| Shares of beneficial interest outstanding | 28,367,297 | |||
| Class I : | ||||
| Net Asset Value, offering and redemption price per share | $ | 8.58 | ||
| Net Assets | $ | 708,006 | ||
| Shares of beneficial interest outstanding | 82,481 | |||
| Class II : | ||||
| Net Asset Value, offering and redemption price per share | $ | 8.61 | ||
| Net Assets | $ | 2,480,269 | ||
| Shares of beneficial interest outstanding | 287,912 | |||
| Commitments and Contingencies (Note 8) | ||||
| See Notes to Financial Statements. | |
| Annual Report | September 30, 2021 | 13 |
| DDJ Opportunistic High Yield Fund | Statement of Operations |
| For the Year Ended September 30, 2021 |
| INVESTMENT INCOME: | ||||
| Interest | $ | 13,714,034 | ||
| Total Investment Income | 13,714,034 | |||
| EXPENSES: | ||||
| Investment advisory fees (Note 6) | 1,396,787 | |||
| Administration fees | 241,954 | |||
| Shareholder service fees | ||||
| Class II | 2,609 | |||
| Distribution fees | ||||
| Class II | 6,572 | |||
| Custody fees | 54,518 | |||
| Legal fees | 32,303 | |||
| Audit and tax fees | 22,100 | |||
| Transfer agent fees | 54,262 | |||
| Trustees' fees and expenses | 14,896 | |||
| Registration and filing fees | 94,371 | |||
| Printing fees | 6,811 | |||
| Chief Compliance Officer fees | 33,584 | |||
| Insurance fees | 4,537 | |||
| Other expenses | 12,631 | |||
| Total Expenses | 1,977,935 | |||
| Less fees waived/reimbursed by investment adviser (Note 6) | ||||
| Institutional Class | (383,598 | ) | ||
| Class I | (1,339 | ) | ||
| Class II | (5,019 | ) | ||
| Net Expenses | 1,587,979 | |||
| NET INVESTMENT INCOME | 12,126,055 | |||
| REALIZED AND UNREALIZED GAIN/(LOSS) ON INVESTMENTS: | ||||
| Net realized gain/(loss) on: | ||||
| Investments | 3,183,924 | |||
| Net realized gain | 3,183,924 | |||
| Change in unrealized appreciation/(depreciation) on: | ||||
| Investments | 6,551,940 | |||
| Net change | 6,551,940 | |||
| NET REALIZED AND UNREALIZED GAIN ON INVESTMENTS | 9,735,864 | |||
| NET INCREASE IN NET ASSETS RESULTING FROM OPERATIONS | $ | 21,861,919 | ||
| See Notes to Financial Statements. | |
| 14 | www.ddjcap.com |
| DDJ Opportunistic High Yield Fund | Statements of Changes in Net Assets |
| For the Year Ended September 30, 2021 | For the Year Ended September 30, 2020 | |||||||
| OPERATIONS: | ||||||||
| Net investment income | $ | 12,126,055 | $ | 5,438,160 | ||||
| Net realized gain/(loss) on investments | 3,183,924 | (2,684,880 | ) | |||||
| Net change in unrealized appreciation/(depreciation) on investments | 6,551,940 | (596,920 | ) | |||||
| Net increase in net assets resulting from operations | 21,861,919 | 2,156,360 | ||||||
| DISTRIBUTIONS TO SHAREHOLDERS | ||||||||
| Institutional Class | (11,780,574 | ) | (5,217,396 | ) | ||||
| Class I | (42,105 | ) | (49,269 | ) | ||||
| Class II | (148,341 | ) | (293,725 | ) | ||||
| Total distributions | (11,971,020 | ) | (5,560,390 | ) | ||||
| BENEFICIAL SHARE TRANSACTIONS (Note 5): | ||||||||
| Institutional Class | ||||||||
| Shares sold | 89,692,093 | 116,461,794 | ||||||
| Dividends reinvested | 11,476,862 | 4,782,105 | ||||||
| Shares redeemed | (2,939,778 | ) | (2,933,446 | ) | ||||
| Net increase from beneficial share transactions | 98,229,177 | 118,310,453 | ||||||
| Class I | ||||||||
| Shares sold | – | – | ||||||
| Dividends reinvested | – | – | ||||||
| Shares redeemed | – | – | ||||||
| Class II | ||||||||
| Shares sold | 609,249 | 2,613,469 | ||||||
| Dividends reinvested | 113,152 | 209,621 | ||||||
| Shares redeemed | (969,795 | ) | (6,235,789 | ) | ||||
| Redemption fees | 3 | 1,202 | ||||||
| Net decrease from beneficial share transactions | (247,391 | ) | (3,411,497 | ) | ||||
| Net increase in net assets | 107,872,685 | 111,494,926 | ||||||
| NET ASSETS: | ||||||||
| Beginning of year | 139,047,862 | 27,552,936 | ||||||
| End of year | $ | 246,920,547 | $ | 139,047,862 | ||||
| See Notes to Financial Statements. | |
| Annual Report | September 30, 2021 | 15 |
| DDJ Opportunistic High Yield Fund | Financial Highlights |
| Institutional Class | For a Share Outstanding Throughout the Periods Presented |
| For the Year Ended September 30, 2021 | For the Year Ended September 30, 2020 | For the Year Ended September 30, 2019 | For the Year Ended September 30, 2018 | For the Year Ended September 30, 2017 | ||||||||||||||||
| NET ASSET VALUE, BEGINNING OF PERIOD | $ | 8.10 | $ | 8.72 | $ | 9.53 | $ | 10.04 | $ | 9.84 | ||||||||||
| INCOME/(LOSS) FROM OPERATIONS: | ||||||||||||||||||||
| Net investment income(a) | 0.52 | 0.60 | (b) | 0.83 | 0.84 | 0.87 | ||||||||||||||
| Net realized and unrealized gain/(loss) on investments | 0.48 | (0.63 | ) | (0.82 | ) | (0.43 | ) | 0.33 | ||||||||||||
| Total from investment operations | 1.00 | (0.03 | ) | 0.01 | 0.41 | 1.20 | ||||||||||||||
| LESS DISTRIBUTIONS: | ||||||||||||||||||||
| From net investment income | (0.51 | ) | (0.59 | ) | (0.82 | ) | (0.82 | ) | (0.89 | ) | ||||||||||
| From net realized gains on investments | – | – | – | (0.10 | ) | (0.11 | ) | |||||||||||||
| Total Distributions | (0.51 | ) | (0.59 | ) | (0.82 | ) | (0.92 | ) | (1.00 | ) | ||||||||||
| NET INCREASE/(DECREASE) IN NET ASSET VALUE | 0.49 | (0.62 | ) | (0.81 | ) | (0.51 | ) | 0.20 | ||||||||||||
| NET ASSET VALUE, END OF PERIOD | $ | 8.59 | $ | 8.10 | $ | 8.72 | $ | 9.53 | $ | 10.04 | ||||||||||
| TOTAL RETURN(c) | 12.61 | % | (0.03 | %) | 0.12 | % | 4.26 | % | 12.73 | % | ||||||||||
| SUPPLEMENTAL DATA: | ||||||||||||||||||||
| Net assets, end of period (in 000s) | $ | 243,732 | $ | 135,801 | $ | 20,367 | $ | 8,801 | $ | 7,101 | ||||||||||
| RATIOS TO AVERAGE NET ASSETS | ||||||||||||||||||||
| Operating expenses excluding reimbursement/waiver | 0.99 | % | 1.24 | % | 3.01 | % | 3.81 | % | 4.61 | % | ||||||||||
| Operating expenses including reimbursement/waiver | 0.79 | % | 0.79 | % | 0.79 | % | 0.79 | % | 0.79 | % | ||||||||||
| Net investment income including reimbursement/waiver | 6.07 | % | 7.36 | % | 9.14 | % | 8.56 | % | 8.67 | % | ||||||||||
| PORTFOLIO TURNOVER RATE | 74 | % | 66 | % | 43 | % | 147 | % | 86 | % | ||||||||||
| (a) | Calculated using the average shares method. |
| (b) | The amount shown for a share outstanding throughout the period may not correlate with the Statement of Operations for the period due to the timing of sales and redemptions of Fund shares in relation to income earned and/or fluctuating market value of the investments of the Fund. |
| (c) | Assumes an initial investment on the business day before the first day of the fiscal period, with all dividends and distributions reinvested in additional shares on the reinvestment date, and redemption at the net asset value calculated on the last business day of the fiscal period. Total returns are for the period indicated and have not been annualized. Total returns would have been lower had certain expenses not been waived during the period. Returns shown do not reflect the deduction of taxes that a shareholder would pay on Fund distributions or the redemption of Fund shares. |
| See Notes to Financial Statements. | |
| 16 | www.ddjcap.com |
| DDJ Opportunistic High Yield Fund | Financial Highlights |
| Class I | For a Share Outstanding Throughout the Periods Presented |
| For the Year Ended September 30, 2021 | For the Year Ended September 30, 2020 | For the Year Ended September 30, 2019 | For the Year Ended September 30, 2018 | For the Year Ended September 30, 2017 | ||||||||||||||||
| NET ASSET VALUE, BEGINNING OF PERIOD | $ | 8.09 | $ | 8.72 | $ | 9.54 | $ | 10.04 | $ | 9.84 | ||||||||||
| INCOME/(LOSS) FROM OPERATIONS: | ||||||||||||||||||||
| Net investment income(a) | 0.52 | 0.61 | (b) | 0.84 | 0.81 | 0.86 | ||||||||||||||
| Net realized and unrealized gain/(loss) on investments | 0.48 | (0.64 | ) | (0.83 | ) | (0.39 | ) | 0.33 | ||||||||||||
| Total from investment operations | 1.00 | (0.03 | ) | 0.01 | 0.42 | 1.19 | ||||||||||||||
| LESS DISTRIBUTIONS: | ||||||||||||||||||||
| From net investment income | (0.51 | ) | (0.60 | ) | (0.83 | ) | (0.82 | ) | (0.88 | ) | ||||||||||
| From net realized gains on investments | – | – | – | (0.10 | ) | (0.11 | ) | |||||||||||||
| Total Distributions | (0.51 | ) | (0.60 | ) | (0.83 | ) | (0.92 | ) | (0.99 | ) | ||||||||||
| REDEMPTION FEES ADDED TO PAID-IN-CAPITAL (Note 5) | – | – | – | 0.00 | (c) | – | ||||||||||||||
| NET INCREASE/(DECREASE) IN NET ASSET VALUE | 0.49 | (0.63 | ) | (0.82 | ) | (0.50 | ) | 0.20 | ||||||||||||
| NET ASSET VALUE, END OF PERIOD | $ | 8.58 | $ | 8.09 | $ | 8.72 | $ | 9.54 | $ | 10.04 | ||||||||||
| TOTAL RETURN(d) | 12.63 | % | (0.11 | %) | 0.16 | % | 4.42 | % | 12.63 | % | ||||||||||
| SUPPLEMENTAL DATA: | ||||||||||||||||||||
| Net assets, end of period (in 000s) | $ | 708 | $ | 668 | $ | 719 | $ | 723 | $ | 732 | ||||||||||
| RATIOS TO AVERAGE NET ASSETS | ||||||||||||||||||||
| Operating expenses excluding reimbursement/waiver | 0.98 | % | 1.32 | % | 2.98 | % | 3.04 | % | 4.63 | % | ||||||||||
| Operating expenses including reimbursement/waiver | 0.79 | %(e) | 0.79 | %(e) | 0.79 | %(e) | 0.79 | %(e) | 0.80 | %(e) | ||||||||||
| Net investment income including reimbursement/waiver | 6.11 | % | 7.44 | % | 9.20 | % | 8.29 | % | 8.66 | % | ||||||||||
| PORTFOLIO TURNOVER RATE | 74 | % | 66 | % | 43 | % | 147 | % | 86 | % | ||||||||||
| (a) | Calculated using the average shares method. |
| (b) | The amount shown for a share outstanding throughout the period may not correlate with the Statement of Operations for the period due to the timing of sales and redemptions of Fund shares in relation to income earned and/or fluctuating market value of the investments of the Fund. |
| (c) | Less than $0.005 per share. |
| (d) | Assumes an initial investment on the business day before the first day of the fiscal period, with all dividends and distributions reinvested in additional shares on the reinvestment date, and redemption at the net asset value calculated on the last business day of the fiscal period. Total returns are for the period indicated and have not been annualized. Total returns would have been lower had certain expenses not been waived during the period. Returns shown do not reflect the deduction of taxes that a shareholder would pay on Fund distributions or the redemption of Fund shares. |
| (e) | According to the Fund's shareholder services plan with respect to the Fund's Class I shares, any amount of such payment not paid during the Fund's fiscal year for such services activities shall be reimbursed to the Fund as soon as practical after the end of the fiscal year. Fees were reimbursed to the Fund during the years ended, September 30, 2019, September 30, 2018 and September 30, 2017, in the amounts of 0.10%, 0.10% and 0.09% of average net assets of Class I shares. For the years ended September 30, 2021 and September 30, 2020, no fees were accrued and thus no fees were reimbursed. |
| See Notes to Financial Statements. | |
| Annual Report | September 30, 2021 | 17 |
| DDJ Opportunistic High Yield Fund | Financial Highlights |
| Class II | For a Share Outstanding Throughout the Periods Presented |
| For the Year Ended September 30, 2021 | For the Year Ended September 30, 2020 | For the Year Ended September 30, 2019 | For the Year Ended September 30, 2018 | For the Year Ended September 30, 2017 | ||||||||||||||||
| NET ASSET VALUE, BEGINNING OF PERIOD | $ | 8.12 | $ | 8.75 | $ | 9.55 | $ | 10.04 | $ | 9.83 | ||||||||||
| INCOME/(LOSS) FROM OPERATIONS: | ||||||||||||||||||||
| Net investment income(a) | 0.49 | 0.59 | (b) | 0.80 | 0.79 | 0.84 | ||||||||||||||
| Net realized and unrealized gain/(loss) on investments | 0.48 | (0.65 | ) | (0.82 | ) | (0.41 | ) | 0.32 | ||||||||||||
| Total from investment operations | 0.97 | (0.06 | ) | (0.02 | ) | 0.38 | 1.16 | |||||||||||||
| LESS DISTRIBUTIONS: | ||||||||||||||||||||
| From net investment income | (0.48 | ) | (0.57 | ) | (0.79 | ) | (0.77 | ) | (0.84 | ) | ||||||||||
| From net realized gains on investments | – | – | – | (0.10 | ) | (0.11 | ) | |||||||||||||
| Total Distributions | (0.48 | ) | (0.57 | ) | (0.79 | ) | (0.87 | ) | (0.95 | ) | ||||||||||
| REDEMPTION FEES ADDED TO PAID-IN-CAPITAL (Note 5) | 0.00 | (c) | 0.00 | (c) | 0.01 | 0.00 | (c) | – | ||||||||||||
| NET INCREASE/(DECREASE) IN NET ASSET VALUE | 0.49 | (0.63 | ) | (0.80 | ) | (0.49 | ) | 0.21 | ||||||||||||
| NET ASSET VALUE, END OF PERIOD | $ | 8.61 | $ | 8.12 | $ | 8.75 | $ | 9.55 | $ | 10.04 | ||||||||||
| TOTAL RETURN(d) | 12.20 | % | (0.46 | %) | (0.12 | %) | 3.97 | % | 12.38 | % | ||||||||||
| SUPPLEMENTAL DATA: | ||||||||||||||||||||
| Net assets, end of period (in 000s) | $ | 2,480 | $ | 2,579 | $ | 6,467 | $ | 1,292 | $ | 201 | ||||||||||
| RATIOS TO AVERAGE NET ASSETS | ||||||||||||||||||||
| Operating expenses excluding reimbursement/waiver | 1.33 | % | 1.71 | % | 3.20 | % | 3.83 | % | 4.86 | % | ||||||||||
| Operating expenses including reimbursement/waiver | 1.14 | %(e) | 1.14 | %(e) | 1.14 | %(e) | 1.08 | %(e) | 1.05 | %(e) | ||||||||||
| Net investment income including reimbursement/waiver | 5.75 | % | 6.98 | % | 8.74 | % | 8.16 | % | 8.41 | % | ||||||||||
| PORTFOLIO TURNOVER RATE | 74 | % | 66 | % | 43 | % | 147 | % | 86 | % | ||||||||||
| (a) | Calculated using the average shares method. |
| (b) | The amount shown for a share outstanding throughout the period may not correlate with the Statement of Operations for the period due to the timing of sales and redemptions of Fund shares in relation to income earned and/or fluctuating market value of the investments of the Fund. |
| (c) | Less than $0.005 per share. |
| (d) | Assumes an initial investment on the business day before the first day of the fiscal period, with all dividends and distributions reinvested in additional shares on the reinvestment date, and redemption at the net asset value calculated on the last business day of the fiscal period. Total returns are for the period indicated and have not been annualized. Total returns would have been lower had certain expenses not been waived during the period. Returns shown do not reflect the deduction of taxes that a shareholder would pay on Fund distributions or the redemption of Fund shares. |
| (e) | According to the Fund's shareholder services plan with respect to the Fund's Class II shares, any amount of such payment not paid during the Fund's fiscal year for such services activities shall be reimbursed to the Fund as soon as practical after the end of the fiscal year. Fees were reimbursed to the Fund during the years ended September 30, 2021, September 30, 2020, September 30, 2019, September 30, 2018 and September 30, 2017, in the amounts of 0.00% 0.00%, 0.00%, 0.06% and 0.09% of average net assets of Class II shares. |
| See Notes to Financial Statements. | |
| 18 | www.ddjcap.com |
| DDJ Opportunistic High Yield Fund | Notes to Financial Statements |
| September 30, 2021 |
1. ORGANIZATION
ALPS Series Trust (the “Trust”), a Delaware statutory trust, is an open-end management investment company registered under the Investment Company Act of 1940, as amended (the “1940 Act”). The Trust consists of multiple separate portfolios or series. This annual report describes the DDJ Opportunistic High Yield Fund (the “Fund”). The Fund is diversified, and its primary investment objective is overall total return consisting of a high level of current income together with long-term capital appreciation. The Fund currently offers Class I shares, Class II shares and Institutional Class shares. Each share class has identical rights to earnings, assets and voting privileges, except for class specific expenses and exclusive rights to vote on matters affecting only individual classes. The Board of Trustees (the “Board”) may establish additional funds and classes of shares at any time in the future without shareholder approval.
2. SIGNIFICANT ACCOUNTING POLICIES
The accompanying financial statements were prepared in accordance with accounting principles generally accepted in the United States of America for investment companies (“U.S. GAAP”). The Fund is considered an investment company under U.S. GAAP and follows the accounting and reporting guidance applicable to investment companies in the Financial Accounting Standards Board (“FASB”) Accounting Standards Codification Topic 946. The preparation of financial statements in conformity with U.S. GAAP requires management to make certain estimates and assumptions that affect the reported amounts of assets and liabilities and disclosures of contingent assets and liabilities at the date of the financial statements and the reported amounts of increases and decreases in net assets from operations during the period. Actual results could differ from those estimates. The following is a summary of significant accounting policies consistently followed by the Fund in preparation of its financial statements.
Investment Valuation: The market price for debt obligations is generally the price supplied by an independent third-party pricing service approved by the Board, which may use a matrix, formula or other objective method that takes into consideration quotations from dealers, market transactions in comparable investments, market indices and yield curves. If vendors are unable to supply a price, or if the price supplied is deemed to be unreliable or otherwise not representative of market conditions at the time of the valuation determination, the market price may be determined using quotations received from one or more brokers–dealers that make a market in the security. High yield bonds and notes are valued using market models that consider trade data, quotations from dealers and active market makers, relevant yield curve and spread data, creditworthiness, trade data or market information on comparable securities, and other relevant security specific information.
Loans are primarily valued by using a composite loan price from a nationally recognized loan pricing service. The methodology used by the Fund’s nationally recognized loan pricing provider for composite loan prices is to value loans at the mean of the bid and ask prices from one or more third party pricing services or dealers.
For equity securities and mutual funds that are traded on an exchange, the market price is usually the closing sale or official closing price on that exchange. In the case of equity securities not traded on an exchange, or if such closing prices are not otherwise available, the securities are valued at the mean of the most recent bid and ask prices on such day.
Money market funds, representing short-term investments, are valued at their NAV.
When such prices or quotations are not available, or when the Fair Value Committee appointed by the Board believes that they are unreliable, securities may be priced using fair value procedures approved by the Board.
Fair Value Measurements: The Fund discloses the classification of its fair value measurements following a three-tier hierarchy based on the inputs used to measure fair value. Inputs refer broadly to the assumptions that market participants would use in pricing the asset or liability, including assumptions about risk. Inputs may be observable or unobservable. Observable inputs reflect the assumptions market participants would use in pricing the asset or liability that are developed based on market data obtained from sources independent of the reporting entity. Unobservable inputs reflect the reporting entity’s own assumptions about the assumptions market participants would use in pricing the asset or liability that are developed based on the best information available.
| Annual Report | September 30, 2021 | 19 |
| DDJ Opportunistic High Yield Fund | Notes to Financial Statements |
| September 30, 2021 |
Various inputs are used in determining the value of the Fund’s investments as of the end of the reporting period. When inputs used fall into different levels of the fair value hierarchy, the level in the hierarchy within which the fair value measurement falls is determined based on the lowest level input that is significant to the fair value measurement in its entirety. The designated input levels are not necessarily an indication of the risk or liquidity associated with these investments. These inputs are categorized in the following hierarchy under applicable financial accounting standards:
| Level 1 – | Unadjusted quoted prices in active markets for identical investments, unrestricted assets or liabilities that the Fund has the ability to access at the measurement date; |
| Level 2 – | Quoted prices which are not active, quoted prices for similar assets or liabilities in active markets or inputs other than quoted prices that are observable (either directly or indirectly); and |
| Level 3 – | Significant unobservable prices or inputs (including the Fund’s own assumptions in determining the fair value of investments) where there is little or no market activity for the asset or liability at the measurement date. |
The following is a summary of the inputs used to value the Fund’s investments as of September 30, 2021:
DDJ Opportunistic High Yield Fund
| Investments in Securities at Value* | Level 1 - Quoted and Unadjusted Prices | Level 2 - Other Significant Observable Inputs | Level 3 - Significant Unobservable Inputs | Total | ||||||||||||
| Common Stocks | ||||||||||||||||
| Consumer, Non-Cyclical | $ | – | $ | – | $ | 245,549 | $ | 245,549 | ||||||||
| Materials | – | – | 304,761 | 304,761 | ||||||||||||
| Mineral and Precious Stone Mining | – | – | 82,773 | 82,773 | ||||||||||||
| Oil & Gas | – | – | 638,385 | 638,385 | ||||||||||||
| Technology | 382,994 | – | – | 382,994 | ||||||||||||
| Bank Loans | ||||||||||||||||
| Basic Materials | – | 2,567,521 | – | 2,567,521 | ||||||||||||
| Communications | – | 9,212,647 | – | 9,212,647 | ||||||||||||
| Consumer Discretionary | – | 6,839,346 | – | 6,839,346 | ||||||||||||
| Consumer, Cyclical | – | 1,659,295 | 238,910 | 1,898,205 | ||||||||||||
| Consumer, Non-Cyclical | – | 36,169,928 | 5,737,163 | 41,907,091 | ||||||||||||
| eCommerce | – | 2,979,113 | – | 2,979,113 | ||||||||||||
| Financials | – | 2,578,732 | 611,824 | 3,190,556 | ||||||||||||
| Industrials | – | 8,833,447 | 8,580,855 | 17,414,302 | ||||||||||||
| Oil & Gas | – | 46,074 | – | 46,074 | ||||||||||||
| High Yield Bonds and Notes | ||||||||||||||||
| Basic Materials | – | 25,957,535 | – | 25,957,535 | ||||||||||||
| Communications | – | 13,227,850 | – | 13,227,850 | ||||||||||||
| Consumer, Cyclical | – | 29,214,138 | 101,625 | 29,315,763 | ||||||||||||
| Consumer, Non-Cyclical | – | 29,482,960 | 211,550 | 29,694,510 | ||||||||||||
| Energy | – | 9,810,804 | – | 9,810,804 | ||||||||||||
| Financials | – | 18,069,389 | – | 18,069,389 | ||||||||||||
| Industrials | – | 24,427,089 | 90,225 | 24,517,314 | ||||||||||||
| Materials | – | – | 114,596 | 114,596 | ||||||||||||
| Technology | – | 2,704,460 | – | 2,704,460 | ||||||||||||
| Short Term Investments | 18,489,077 | – | – | 18,489,077 | ||||||||||||
| Warrants | – | – | 0 | 0 | ||||||||||||
| Total | $ | 18,872,071 | $ | 223,780,328 | $ | 16,958,216 | $ | 259,610,615 | ||||||||
| 20 | www.ddjcap.com |
| DDJ Opportunistic High Yield Fund | Notes to Financial Statements |
| September 30, 2021 |
The following is a reconciliation of assets in which Level 3 inputs were used in determining value:
| Asset Type | Common Stocks | Bank Loans | High Yield Bonds And Notes | Warrants | Total | |||||||||||||||
| Balance as of September 30, 2020 | $ | 1,032,401 | $ | 1,337,662 | $ | 550,503 | $ | – | $ | 2,920,566 | ||||||||||
| Accrued Discount/premium | – | (13,654 | ) | (2,090 | ) | – | (15,744 | ) | ||||||||||||
| Realized Gain/(Loss) | 331,117 | (387,063 | ) | (107,850 | ) | – | (163,796 | ) | ||||||||||||
| Change in Unrealized Appreciation/Depreciation | 562,563 | 567,890 | 111,187 | – | 1,241,640 | |||||||||||||||
| Purchases | 368,395 | 10,540,053 | 210,000 | – | 11,118,448 | |||||||||||||||
| Sales Proceeds | (1,023,008 | ) | (1,082,481 | ) | (243,754 | ) | – | (2,349,243 | ) | |||||||||||
| Transfer into Level 3(a) | – | 4,206,345 | – | – | 4,206,345 | |||||||||||||||
| Transfer Out of Level 3 | – | – | – | – | – | |||||||||||||||
| Balance as of September 30, 2021 | $ | 1,271,468 | $ | 15,168,752 | $ | 517,996 | $ | – | $ | 16,958,216 | ||||||||||
| Net change in unrealized appreciation/(depreciation)included in the Statement of Operations attributable to Level 3 investments held at September 30, 2021 | $ | 617,448 | $ | 178,964 | $ | 3,269 | $ | – | $ | 799,681 | ||||||||||
| (a) | Transferred from Level 2 to Level 3 because of a lack of observable market data, resulting from a decrease in market activity for the securities. |
Information about Level 3 measurements as of September 30, 2021:
| Asset Class | Value | Valuation Technique | Unobservable Input(s)(a) | Value/Range | Weighted Average | |||||||
| Common Stocks | $ | 1,188,695 | Discounted Cash Flow Analysis Market Analysis | Discount Rate EBITDA Multiple | 9.60% - 12.70% 3.75x - 9.00x | 10.25% 7.36x | ||||||
| Common Stocks | $ | 82,773 | Discounted Cash Flow Analysis | Discount rate | 18.30% | |||||||
| Price per share | $153.00 | |||||||||||
| Bank Loans | $ | 12,597,041 | Third-Party Vendor Pricing Service | Vendor Quotes | N/A | |||||||
| Bank Loans | $ | 2,050,000 | Yield Analysis | Yield to Worst | 8.00% | |||||||
| Bank Loans | $ | 521,711 | Discounted Cash Flow Analysis | Discount Rate | 18.40% | |||||||
| Percentage of par value | 100.00% | |||||||||||
| High Yield Bonds and Notes | $ | 516,446 | Yield Analysis | Yield to Worst | 8.3% - 11.0% | 10.21% | ||||||
| High Yield Bonds and Notes | $ | 1,550 | Litigation Trust Settlement Proceeds | Discount rate | 7.10% | |||||||
| Expected recovery probability rate | $1.24 per $100 principal amount of now cancelled Unsecured Notes | |||||||||||
| Warrants | $ | – | Intrinsic value | Strike price per share | $114.76 | |||||||
| Per share value | $0.00 | |||||||||||
| (fully diluted) | ||||||||||||
| $ | 16,958,216 | |||||||||||
| (a) | A change to the unobservable input may result in a significant change to the value of the investment as follows: |
| Unobservable Input | Impact to Value if Input Increases | Impact to Value if Input Decreases |
| Yield to Worst | Increase | Decrease |
| Vendor Quotes | Increase | Decrease |
| Discount Rate | Decrease | Increase |
| EBITDA Multiple | Increase | Decrease |
| Expected Recovery Rate | Increase | Decrease |
Cash & Cash Equivalents: The Fund considers its investment in a Federal Deposit Insurance Corporation ("FDIC") insured interest bearing account to be cash and cash equivalents. Cash and cash equivalents are valued at cost plus any accrued interest. The Fund maintains cash balances, which, at times may exceed federally insured limits. The Fund maintains these balances with a high quality financial institution.
| Annual Report | September 30, 2021 | 21 |
| DDJ Opportunistic High Yield Fund | Notes to Financial Statements |
| September 30, 2021 |
Concentration of Credit Risk: The Fund places its cash with a banking institution, which is insured by FDIC. The FDIC limit is $250,000. At various times throughout the year, the amount on deposit may exceed the FDIC limit and subject the Fund to a credit risk. The Fund does not believe that such deposits are subject to any unusual risk associated with investment activities.
Trust Expenses: Some expenses of the Trust can be directly attributed to a fund in the Trust. Expenses that cannot be directly attributed to a fund are apportioned among all funds in the Trust based on average net assets of each fund, including Trustees’ fees and expenses.
Fund Expenses: Some expenses can be directly attributed to the Fund and are apportioned among the classes based on average net assets of each class.
Class Expenses: Expenses that are specific to a class of shares are charged directly to that share class. Fees provided under the distribution (Rule 12b-1) and/or shareholder service plans for a particular class of the Fund are charged to the operations of such class.
Federal Income Taxes: The Fund complies with the requirements under Subchapter M of the Internal Revenue Code of 1986, as amended, applicable to regulated investment companies and intends to distribute substantially all of its net taxable income and net capital gains, if any, each year so that it will not be subject to excise tax on undistributed income and gains. The Fund is not subject to income taxes to the extent such distributions are made.
As of and during the year ended September 30, 2021, the Fund did not have a liability for any unrecognized tax benefits in the accompanying financial statements. The Fund recognizes interest and penalties, if any, related to tax liabilities as income tax expense in the Statement of Operations. The Fund files U.S. federal, state and local income tax returns as required. The Fund’s tax returns are subject to examination by the relevant tax authorities until expiration of the applicable statute of limitations, which is generally three years after the filing of the tax return for federal purposes and four years for most state returns. The Fund’s administrator has analyzed the Fund’s tax positions taken on federal and state income tax returns for all open tax years and has concluded that as of September 30, 2021, no provision for income tax is required in the Fund’s financial statements related to these tax positions.
Investment Transactions and Investment Income: Investment transactions are accounted for on the date the investments are purchased or sold (trade date basis for financial reporting purposes). Realized gains and losses from investment transactions are reported on an identified cost basis. Interest income, which includes accretion of discounts and amortization of premiums, is accrued and recorded as earned using the effective yield method. Dividend income is recognized on the ex-dividend date. All of the realized and unrealized gains and losses and net investment income are allocated daily to each class in proportion to its average daily net assets. Paydown gains and losses on mortgage-related and other asset-backed securities, if any, are recorded as components of interest income in the Statement of Operations.
Distributions to Shareholders: The Fund normally pays dividends, if any, monthly, and distributes capital gains, if any, on an annual basis. Income dividend distributions are derived from interest and other income the Fund receives from its investments, including short term capital gains. Long term capital gain distributions are derived from gains realized when the Fund sells a security it has owned for more than one year. The Fund may make additional distributions and dividends at other times if its investment advisor has determined that doing so may be necessary for the Fund to avoid or reduce taxes. Net investment income/(loss) and net realized gain/(loss) may differ for financial statement and tax purposes.
Loan Assignments: The Fund acquires loans via loan assignments. The Fund considers loans acquired via assignment to be investments in debt instruments. When the Fund purchases loans from lenders via assignment, the Fund will acquire direct rights against the borrower on the loan except that under certain circumstances such rights may be more limited than those held by the assigning lender.
Loans and debt instruments are subject to credit risk. Credit risk relates to the ability of the borrower under such fixed income instruments to make interest and principal payments as they become due.
As of September 30, 2021, the Fund held $86,054,855 or 34.85% of the Fund’s net assets, in loans acquired via assignment.
Liquidity Risk: Liquidity risk exists when particular investments are difficult to sell. The Fund may not be able to sell these investments at the best prices or at the value the Fund places on them. In such a market, the value of such investments, and as a result the Fund’s share price, may fall dramatically, even during periods of declining interest rates. Investments that are illiquid or that trade in lower volumes may be more difficult to value. The market for high yield securities in particular may be less liquid than higher quality fixed income securities, and therefore these securities may be harder to value or sell at an acceptable price, especially during times of market volatility or decline.
LIBOR Transition: Certain of the Fund's investments, payment obligations and financing terms may be based on floating rates, such as LIBOR, Euro Interbank Offered Rate and other similar types of reference rates (each, a “Reference Rate”). In July of 2017, the head of the UK Financial Conduct Authority (“FCA”) announced a desire to phase out the use of LIBOR by the end of 2021. The FCA and ICE Benchmark Administrator have since announced that most LIBOR settings will no longer be published after December 31, 2021 and a majority of U.S. dollar LIBOR settings will cease publication after June 30, 2023. It is possible that a subset of LIBOR settings will be published after these dates on a “synthetic” basis, but any such publications would be considered non-representative of the underlying market. The U.S. Federal Reserve, based on the recommendations of the New York Federal Reserve’s Alternative Reference Rate Committee (comprised of major derivative market participants and their regulators), has begun publishing Secured Overnight Financial Rate Data (“SOFR”) that is intended to replace U.S. dollar LIBOR. Proposals for alternative reference rates for other currencies have also been announced or have already begun publication. Markets are slowly developing in response to these new reference rates. Uncertainty related to the liquidity impact of the change in rates, and how to appropriately adjust these rates at the time of transition, poses risks for the Underlying Funds and Funds. The effect of any changes to, or discontinuation of, LIBOR on the Underlying Funds and Funds will depend on, among other things, (1) existing fallback or termination provisions in individual contracts, and (2) whether, how, and when industry participants develop and adopt new reference rates and fallbacks for both legacy and new instruments and contracts. The expected discontinuation of LIBOR could have a significant impact on the financial markets in general and may also present heightened risk to market participants, including public companies, investment advisers, investment companies, and broker-dealers. The risks associated with this discontinuation and transition will be exacerbated if the work necessary to effect an orderly transition to an alternative reference rate is not completed in a timely manner. For example, current information technology systems may be unable to accommodate new instruments and rates with features that differ from LIBOR. Accordingly, it is difficult to predict the full impact of the transition away from LIBOR on the Underlying Funds and Funds until new reference rates and fallbacks for both legacy and new instruments and contracts are commercially accepted and market practices become settled.
| 22 | www.ddjcap.com |
| DDJ Opportunistic High Yield Fund | Notes to Financial Statements |
| September 30, 2021 |
COVID-19 Risk: An outbreak of respiratory disease caused by a novel coronavirus was first detected in December 2019 and has now spread internationally. This coronavirus has resulted in closing borders, enhanced health screenings, partial population vaccination, healthcare service preparation and delivery, quarantines, cancellations, disruptions to supply chains and customer activity, government sponsored fiscal stimulus programs, various moratoria on the applicability of certain laws and regulations, as well as general concern and uncertainty. The impact of this coronavirus, (and the variants of such virus) and other epidemics and pandemics that may arise in the future, could affect the economies of many nations, individual companies, their securities (including equity and debt), and the market in general in ways that cannot necessarily be foreseen at the present time. In addition, the impact of infectious diseases in developing or emerging market countries may be greater due to less established health care systems. Health crises caused by the recent coronavirus outbreak may exacerbate other pre-existing political, social, financial, and economic risks in certain countries. The impact of the outbreak may last for an extended period of time.
Restricted Securities: Restricted securities are securities that may only be resold upon registration under federal securities laws or in transactions exempt from such registration. In some cases, the issuer of restricted securities has agreed to register such securities for resale, at the issuer’s expense, either upon demand by a fund or in connection with another registered offering of the securities. Many restricted securities may be resold in the secondary market in transactions exempt from registration. Such restricted securities may be determined to be liquid. The Fund will not incur any registration costs upon such resale. The Fund’s restricted securities are valued at the price provided by pricing services or dealers in the secondary market or, if no market prices are available, at the fair value price as determined by the Fund’s adviser or pursuant to the Fund’s fair value policy, subject to oversight by the Board. The Fund has acquired certain securities, the sale of which is restricted under applicable provisions of the Securities Act of 1933. It is possible that the fair value price may differ significantly from the amount that may ultimately be realized in the near term, and the difference could be material.
The below securities are restricted from resale as of September 30, 2021:
| Security Type | Acquisition Date | Amortized Cost | Fair Value | ||||||||||
| American Tire Distributors, Inc. | Common Stocks | 12/21/2018 | $ | 62,534 | $ | 245,549 | |||||||
| American Tire Distributors, Inc., Series Initial | Bank Loans | 12/21/2018 | 14,906 | 16,687 | |||||||||
| American Tire Distributors, Inc., Series Initial (DIP) | Bank Loans | 12/21/2018 | 25,705 | 25,721 | |||||||||
| Auction.com, LLC. | Bank Loans | 12/12/2019 | 3,964,174 | 3,970,102 | |||||||||
| Dornoch Debt Merger Sub, Inc. | High Yield Bonds and Notes | 9/23/2021 | 2,120,000 | 2,122,650 | |||||||||
| GTT Communications, Inc. | High Yield Bonds and Notes | 4/6/2018 | 1,703,824 | 216,700 | |||||||||
| Material Sciences Corp. | High Yield Bonds and Notes | 7/9/2018-6/30/2020 | 90,225 | 90,225 | |||||||||
| Northwest Acquisition ULC | High Yield Bonds and Notes | 10/25/2018 | 1,343,974 | 2,145 | |||||||||
| Real Alloy Holding, Inc. | Common Stocks | 5/31/2018 | 103,329 | 120,708 | |||||||||
| Real Alloy Holding, Inc. | High Yield Bonds and Notes | 5/31/2018-7/7/2020 | 114,596 | 114,596 | |||||||||
| Skillsoft | Common Stocks | 7/23/2021 | 306,329 | 382,994 | |||||||||
| Specialty Steel Holdco Inc. | Common Stocks | 11/15/2017 | 133,875 | 184,052 | |||||||||
| Specialty Steel Holdco, Inc. | High Yield Bonds and Notes | 11/15/2017 | 210,000 | 210,000 | |||||||||
| Sportsnet | High Yield Bonds and Notes | 12/27/2017 | 99,164 | 101,625 | |||||||||
| Utex Industries, Inc. | Common Stocks | 12/3/2020 | 368,394 | 638,385 | |||||||||
| Utex Industries, Inc. Warrant | Warrant | 12/3/2020 | – | – | |||||||||
| $ | 8,442,139 | ||||||||||||
| Annual Report | September 30, 2021 | 23 |
| DDJ Opportunistic High Yield Fund | Notes to Financial Statements |
| September 30, 2021 |
Restricted securities under Rule 144A, including the aggregate value and percentage of net assets of the Fund, have been identified in the Portfolio of Investments.
3. TAX BASIS INFORMATION
Tax Basis of Distributions to Shareholders: The character of distributions made during the period from net investment income or net realized gains may differ from its ultimate characterization for federal income tax purposes. Also, due to the timing of dividend distributions, the fiscal year in which amounts are distributed may differ from the fiscal year in which the income or realized gain were recorded by the Fund. The amounts and characteristics of tax basis distributions are estimated at the time of distribution and composition of distributable earnings/(accumulated losses) are finalized at fiscal year-end.
The tax character of distributions paid by the Fund for the fiscal years ended September 30 were as follows:
| Distributions Paid From: | 2021 | 2020 | ||||||
| Ordinary Income | $ | 11,971,020 | $ | 5,560,390 | ||||
| Total | $ | 11,971,020 | $ | 5,560,390 | ||||
Reclassifications: As of September 30, 2021, there were no permanent reclassifications.
Unrealized Appreciation and Depreciation on Investments: As of September 30, 2021, the aggregate cost of investments, gross unrealized appreciation/(depreciation) and net unrealized depreciation for Federal tax purposes were as follows:
| Gross unrealized appreciation (excess of value over tax cost) | $ | 7,655,962 | ||
| Gross unrealized depreciation (excess of tax cost over value) | (3,431,883 | ) | ||
| Net unrealized appreciation | 4,224,079 | |||
| Cost of investments for income tax purposes | $ | 255,386,536 |
Temporary differences are attributed to wash sales, difference in premium amortization, and defaulted interest on debt securities.
Components of Distributable Earnings: As of September 30, 2021, components of distributable earnings were as follows:
| Undistributed ordinary income | $ | 568,095 | ||
| Accumulated capital losses | (229,410 | ) | ||
| Net unrealized appreciation on investments | 4,224,079 | |||
| Total | $ | 4,562,764 |
Capital Losses: Capital loss carryovers used during the year ended September 30, 2021 were $688,256.
Under current law, capital losses maintain their character as short-term or long-term and are carried forward to the next tax year without expiration.
As of the current fiscal year end, the following amounts are available as carry forwards to the next tax year:
| Short-Term | Long-Term | |||||||
| $ | – | $ | 55,320 | |||||
The Fund has elected to defer to the twelve month period ending September 30, 2022, capital losses recognized during the period November 1, 2020 to September 30, 2021, in the amount of $174,090. Capital losses arising in the post-October period of the current fiscal year may be deferred to the next fiscal year if the Fund elects to defer the recognition of these losses. When this election is made, any losses recognized during the period are treated as having occurred on the first day of the next fiscal year separate from and in addition to the application of normal capital loss carryovers as described above.
| 24 | www.ddjcap.com |
| DDJ Opportunistic High Yield Fund | Notes to Financial Statements |
| September 30, 2021 |
4. SECURITIES TRANSACTIONS
Purchases and sales of securities, excluding short-term securities, during the year ended September 30, 2021, were as follows:
| Purchases of Securities | Proceeds from Sales of Securities | |||||||
| $ | 235,263,253 | $ | 143,438,763 | |||||
5. BENEFICIAL SHARE TRANSACTIONS
The capitalization of the Trust consists of an unlimited number of shares of beneficial interest with no par value per share. Holders of the shares of the Fund have one vote for each share held and a proportionate fraction of a vote for each fractional share. All shares issued and outstanding are fully paid and are transferable and redeemable at the option of the shareholder. Shares have no pre-emptive rights. Neither the Fund nor any of its creditors has the right to require shareholders to pay any additional amounts solely because the shareholder owns the shares.
Shares redeemed within 60 days of purchase may incur a 1.00% short-term redemption fee deducted from the redemption amount. For the year ended September 30, 2021, the redemption fees charged by the Fund, if any, are presented in the Statements of Changes in Net Assets.
Transactions in common shares were as follows:
| For the Year Ended September 30, 2021 | For the Year Ended September 30, 2020 | |||||||
| Institutional Class | ||||||||
| Shares sold | 10,602,415 | 14,176,243 | ||||||
| Dividends reinvested | 1,351,464 | 597,979 | ||||||
| Shares redeemed | (347,640 | ) | (347,623 | ) | ||||
| Net increase in shares outstanding | 11,606,239 | 14,426,599 | ||||||
| Class I | ||||||||
| Shares sold | – | – | ||||||
| Dividends reinvested | – | – | ||||||
| Shares redeemed | – | – | ||||||
| Net increase in shares outstanding | – | – | ||||||
| Class II | ||||||||
| Shares sold | 71,528 | 309,218 | ||||||
| Dividends reinvested | 13,309 | 25,409 | ||||||
| Shares redeemed | (114,402 | ) | (756,482 | ) | ||||
| Net decrease in shares outstanding | (29,565 | ) | (421,855 | ) | ||||
Control is defined by the 1940 Act as the beneficial ownership, either directly or through one or more controlled companies, of more than 25% of the voting securities of a company. As of September 30, 2021, the Fund did not have any shareholder or account that exceeded the 25% ownership threshold for disclosure.
6. MANAGEMENT AND RELATED PARTY TRANSACTIONS
Investment Advisory: The Adviser, subject to the authority of the Board, is responsible for the overall management and administration of the Fund’s business affairs. The Adviser manages the investments of the Fund in accordance with the Fund’s investment objective, policies and limitations and investment guidelines established jointly by the Adviser and the Board.
Pursuant to the Investment Advisory Agreement (the “Advisory Agreement”) with the Adviser, the Fund pays the Adviser an annual management fee of 0.70% based on the Fund’s average daily net assets. The management fee is paid on a monthly basis. The Board may extend the Advisory Agreement for additional one-year terms. The Board and the shareholders of the Fund may terminate the Advisory Agreement upon 30 days’ written notice. The Adviser may terminate the Advisory Agreement upon 60 days’ written notice.
| Annual Report | September 30, 2021 | 25 |
| DDJ Opportunistic High Yield Fund | Notes to Financial Statements |
| September 30, 2021 |
Pursuant to a fee waiver letter agreement (the “Fee Waiver Agreement”), the Adviser has contractually agreed to limit the amount of the Fund’s Total Annual Fund Operating Expenses, exclusive of Distribution and Service (12b-1) Fees, Shareholder Servicing expenses, acquired fund fees and expenses, brokerage expenses, interest expenses, taxes and extraordinary expenses, to 0.79% of the Fund’s average daily net assets of each of the Institutional Class, Class I and Class II shares. The Fee Waiver Agreement is in effect through January 31, 2022, and will thereafter continue in effect for successive twelve-month periods provided that such continuance is specifically approved at least annually by the Board and the Adviser does not provide at least 30 days written notice of non-continuance prior to the end of the then effective term. The Adviser will be permitted to recover, on a class-by-class basis, expenses it has borne through the Fee Waiver Agreement only to the extent that the Fund's expenses in later periods do not exceed the lesser of: (1) the contractual expense limit in effect at the time the Adviser waives or limits the expenses; or (2) the contractual expense limit in effect at the time the Adviser seeks to recover the expenses; provided, however, that the Fund will not be obligated to reimburse any such expenses borne by the Adviser more than three years after the date on which the fee or expense was waived or limited or assumed and paid by the Adviser, as calculated on a monthly basis. The Adviser may not discontinue this waiver without the approval by the Trust's Board. Fees waived or reimbursed for the year ended September 30, 2021, are disclosed in the Statement of Operations.
As of September 30, 2021, the balance of recoupable expenses was as follows:
| Expiring in 2022 | Expiring in 2023 | Expiring in 2024 | ||||||||||
| Institutional Class | $ | 221,366 | $ | 312,139 | $ | 383,598 | ||||||
| Class I | 17,790 | 3,572 | 1,339 | |||||||||
| Class II | 109,325 | 25,503 | 5,019 | |||||||||
Administrator: ALPS Fund Services, Inc. (“ALPS”) (an affiliate of ALPS Distributors, Inc.) serves as administrator to the Fund. The Fund has agreed to pay expenses incurred in connection with its administrative activities. Pursuant to the Administration, Bookkeeping and Pricing Services Agreement with the Trust, ALPS will provide operational services to the Fund including, but not limited to, fund accounting and fund administration, and will generally assist in the Fund’s operations. The Fund’s administration fee is accrued on a daily basis and paid monthly. The officers of the Trust are employees of ALPS. Administration fees paid by the Fund for the year ended September 30, 2021, are disclosed in the Statement of Operations. ALPS is reimbursed by the Fund for certain out of pocket expenses.
Transfer Agent: ALPS serves as transfer agent for the Fund under a Transfer Agency and Services Agreement with the Trust. Under this agreement, ALPS is paid an annual fee for services performed on behalf of the Fund plus fees for open accounts and is reimbursed for certain out-of-pocket expenses.
Compliance Services: ALPS provides services as the Fund’s Chief Compliance Officer to monitor and test the policies and procedures of the Fund in conjunction with requirements under Rule 38a-1 of the 1940 Act pursuant to a Chief Compliance Officer Services Agreement with the Trust. Under this agreement, ALPS is paid an annual fee for services performed on behalf of the Fund and is reimbursed for certain out-of-pocket expenses.
Distribution: ALPS Distributors, Inc. (the “Distributor”) (an affiliate of ALPS) acts as the principal underwriter of the Fund’s shares pursuant to a Distribution Agreement with the Trust. Shares of the Fund are offered on a continuous basis through the Distributor, as agent of the Fund. The Distributor is not obligated to sell any particular amount of shares and is not entitled to any compensation for its services as the Fund’s principal underwriter pursuant to the Distribution Agreement.
The Fund has adopted a Distribution and Services Plan (the “Plan”) pursuant to Rule 12b-1 of the 1940 Act for its Class II shares. The Plan allows the Fund to use Class II assets to pay fees in connection with the distribution and marketing of Class II shares and/or the provision of shareholder services to Class II shareholders. The Plan permits payment for services in connection with the administration of plans or programs that use Class II shares of the Fund, if any, as their funding medium and for related expenses. The Plan permits the Fund to make total payments at an annual rate of up to 0.25% of the Fund’s average daily net assets attributable to its Class II shares. Because these fees are paid out of the Fund’s Class II assets, if any, on an ongoing basis, over time they will increase the cost of an investment in the Class II shares, if any, and Class II Plan fees may cost an investor more than other types of sales charges. Plan fees are shown as distribution fees on the Statement of Operations.
The Fund has adopted a shareholder services plan (“Shareholder Services Plan”) with respect to the Fund’s Class I and Class II shares. Under the Shareholder Services Plan, the Fund is authorized to pay banks and their affiliates and other institutions, including broker-dealers and Fund affiliates (“Participating Organizations”), an aggregate fee in an amount not to exceed on an annual basis 0.15% of the average daily net assets of the Class I shares and Class II shares, respectively, attributable to or held in the name of a Participating Organization for its clients as compensation for providing shareholder service activities, which do not include distribution services, pursuant to an agreement with a Participating Organization. Shareholder Services Plan fees are included with shareholder service fees on the Statement of Operations. The Fund's Class I and Class II Shareholder Services Plan fees are currently accruing at 0.00% and 0.10% of the average daily net asset value of each share class, respectively, on an annual basis.
| 26 | www.ddjcap.com |
| DDJ Opportunistic High Yield Fund | Notes to Financial Statements |
| September 30, 2021 |
7. TRUSTEES
As of September 30, 2021, there were four Trustees, three of whom are not “interested persons” (as defined in the 1940 Act) of the Trust (the “Independent Trustees”). The Independent Trustees of the Trust and Interested Trustees who are not currently employed by the Adviser, ALPS or other service providers will receive a quarterly retainer of $13,500, plus $4,000 for each regular Board or Committee meeting attended and $2,000 for each special telephonic or in-person Board or Committee meeting attended. Additionally, the Audit Committee Chair receives a quarterly retainer of $1,250 and the Independent Chair receives a quarterly retainer of $3,250. The Independent Trustees and Interested Trustees who are not currently employed by the Adviser, ALPS or other service providers are also reimbursed for all reasonable out-of-pocket expenses relating to attendance at meetings. Officers of the Trust receive no salary or fees from the Trust. As discussed in Note 6, the Fund pays ALPS an annual fee for compliance services.
8. COMMITMENTS AND CONTINGENCIES
The Fund may make commitments pursuant to bridge loan facilities. Such commitments typically remain off balance sheet as it is more likely than not, based on the good faith judgement of the Adviser, that such bridge facilities will not ever fund. As of September 30, 2021, the Fund had $7,987,542 outstanding bridge facility commitments.
9. INDEMNIFICATIONS
Under the Trust’s organizational documents, its officers and Trustees are indemnified against certain liabilities arising out of the performance of their duties to the Trust. Additionally, in the normal course of business, the Trust enters into contracts with service providers that may contain general indemnification clauses which may permit indemnification to the extent permissible under applicable law. The Trust’s maximum exposure under these arrangements is unknown, as such exposure would involve future claims that may be made against the Trust that have not yet occurred.
10. RECENT ACCOUNTING PRONOUNCEMENT
In March 2020, the Financial Accounting Standards Board (“FASB”) issued Accounting Standards Update (“ASU”) No. 2020-04, Reference Rate Reform (Topic 848): Facilitation of the Effects of Reference Rate Reform on Financial Reporting. The amendments provide optional expedients and exceptions for applying U.S. GAAP to contracts, hedging relationships, and other transactions affected by reference rate reform if certain criteria are met. The standard is effective upon issuance and can be applied through December 31, 2022. Management is currently evaluating the impact of the optional guidance on the Fund’s financial statements and disclosures.
11. SUBSEQUENT EVENTS
Subsequent events after the date of the Statement of Assets and Liabilities have been evaluated through the date the financial statements were issued. Management has determined that there were no subsequent events to report through the issuance of these financial statements.
| Annual Report | September 30, 2021 | 27 |
| Report of Independent Registered | |
| DDJ Opportunistic High Yield Fund | Public Accounting Firm |
To the Shareholders of DDJ Opportunistic High Yield Fund and
Board of Trustees of ALPS Series Trust
Opinion on the Financial Statements
We have audited the accompanying statement of assets and liabilities, including the portfolio of investments, of DDJ Opportunistic High Yield Fund (the “Fund”), a series of ALPS Series Trust, as of September 30, 2021, the related statement of operations for the year then ended, the statements of changes in net assets for each of the two years in the period then ended, the related notes, and the financial highlights for each of the five years in the period then ended (collectively referred to as the “financial statements”). In our opinion, the financial statements present fairly, in all material respects, the financial position of the Fund as of September 30, 2021, the results of its operations for the year then ended, the changes in net assets for each of the two years in the period then ended, and the financial highlights for each of the five years in the period then ended, in conformity with accounting principles generally accepted in the United States of America.
Basis for Opinion
These financial statements are the responsibility of the Fund’s management. Our responsibility is to express an opinion on the Fund’s financial statements based on our audits. We are a public accounting firm registered with the Public Company Accounting Oversight Board (United States) (“PCAOB”) and are required to be independent with respect to the Fund in accordance with the U.S. federal securities laws and the applicable rules and regulations of the Securities and Exchange Commission and the PCAOB.
We conducted our audits in accordance with the standards of the PCAOB. Those standards require that we plan and perform the audit to obtain reasonable assurance about whether the financial statements are free of material misstatement whether due to error or fraud.
Our audits included performing procedures to assess the risks of material misstatement of the financial statements, whether due to error or fraud, and performing procedures that respond to those risks. Such procedures included examining, on a test basis, evidence regarding the amounts and disclosures in the financial statements. Our procedures included confirmation of securities owned as of September 30, 2021, by correspondence with the custodian, agent banks, issuers, and brokers; when replies were not received from brokers, agent banks or issuers, we performed other auditing procedures. Our audits also included evaluating the accounting principles used and significant estimates made by management, as well as evaluating the overall presentation of the financial statements. We believe that our audits provide a reasonable basis for our opinion.
We have served as the Fund’s auditor since 2017.

COHEN & COMPANY, LTD.
Cleveland, Ohio
November 29, 2021
| 28 | www.ddjcap.com |
| Disclosure Regarding Renewal and |
| DDJ Opportunistic High Yield Fund | Approval of Fund Advisory Agreement |
| September 30, 2021 (Unaudited) |
On May 20, 2021, the Board of Trustees (the “Board”) of ALPS Series Trust (the “Trust”) met via electronic means (videoconference) to discuss, among other things, the renewal and approval of the Investment Advisory Agreement between the Trust and DDJ Capital Management, LLC (“DDJ”) in accordance with Section 15(c) of the 1940 Act. The Independent Trustees met with independent legal counsel during executive session and discussed the Investment Advisory Agreement and other related materials.
In approving the renewal of the Investment Advisory Agreement with DDJ Capital, the Trustees, including all the Independent Trustees, considered the following factors with respect to the DDJ Fund (the “DDJ Fund”):
Investment Advisory Fee Rate: In evaluating DDJ and the fees charged under the DDJ Agreement, the Trustees concluded that no single factor reviewed by the Trustees was identified by the Trustees to be determinative as the principal factor in whether to renew the DDJ Agreement.
The Trustees reviewed and considered the contractual annual advisory fee paid by the DDJ Fund to DDJ of 0.70% of the Fund’s daily average net assets, in light of the nature, extent and quality of the advisory services provided by DDJ to the DDJ Fund. The Trustees considered the information comparing the DDJ Fund’s contractual annual advisory fee and overall Fund expenses with those of funds in the peer group provided by FUSE, an independent provider of investment company data. The Trustees noted that for analysis of the Institutional Class and Class I of the DDJ Fund, the FUSE peer group consisted of the DDJ Fund and 15 other high yield bond funds identified by FUSE; while Class II of the DDJ Fund’s peer group consisted of the DDJ Fund and 13 other high yield bond funds identified by FUSE.
The Trustees noted that DDJ’s contractual advisory fee of 0.70% was slightly above the FUSE peer group median of 0.64% for the Institutional Class and Class I peers, while the Fund’s contractual advisory fee of 0.70% was above the Class II peer group median of 0.62%. The Trustees also noted that the DDJ Fund’s Institutional Class and Class I total net expense of 0.79% (after fee waiver and expense reimbursement) was below the FUSE peer group median of 0.80%, while the DDJ Fund’s Class II total net expense of 1.14% was above the peer group median of 1.01%. They discussed the extensive research efforts of DDJ to source investment opportunities for the DDJ Fund, focusing on bottom-up, fundamental analysis, with internal analysts assigned to specific sectors, and its ongoing efforts to monitor investments in the portfolio, and concluded that the advisory fee was not unreasonable.
Comparable Accounts: The Trustees considered the advisory fees charged by DDJ to DDJ’s client accounts that employ a comparable strategy to the DDJ Fund, noting they were generally lower than the advisory fee charged to the Fund, and considered DDJ’s rationale for the differences.
Nature, Extent and Quality of the Services: The Trustees received and considered information regarding the nature, extent and quality of services provided to the DDJ Fund under the DDJ Agreement. The Trustees reviewed information supplied by DDJ including its Form ADV. The Trustees reviewed and considered DDJ’s history as an asset manager, and its experience managing high yield assets. The Trustees also reviewed the research and decision-making processes utilized by DDJ, including the methods adopted to seek to achieve the Fund’s investment objective in a manner consistent with the Fund’s policies and restrictions. The Trustees considered the background and experience of DDJ’s personnel, including the qualifications, background and responsibilities of the portfolio managers primarily responsible for the day-to-day portfolio management of the DDJ Fund. They discussed the extent of the resources devoted to research and analysis of actual and potential investments, as well as the firm’s internal legal team that evaluates the structural aspects of the DDJ Fund’s investments. They considered the Trust’s experience with DDJ, including DDJ’s responsiveness to the officers of the DDJ Fund. The Trustees also considered DDJ’s focus on compliance both at the firm level and with respect to the DDJ Fund. The Trustees concluded that DDJ had provided quality advisory services to the DDJ Fund, and that the nature and extent of those services were consistent with the DDJ Agreement.
Performance: The Trustees reviewed performance information for the DDJ Fund’s Class I, Class II and Institutional Class shares for the one-year, three-year and three-month periods ended March 31, 2021, as well as the since-inception performance (July 16, 2015) through March 31, 2021. The review included a comparison of the DDJ Fund’s performance to the performance of a peer group of comparable funds, as identified by a third-party data provider. The Trustees noted in particular that for the since inception and five-year periods ended March 31, 2021, the performance of the DDJ Fund’s Class I ranked fifth in its peer group, the performance of the DDJ Fund’s Class II ranked fourth in its peer group, and the performance of the DDJ Fund’s Institutional Class ranked seventh in its peer group. The Trustees noted DDJ’s observation that recent performance had produced favorable returns. They considered the concentrated nature of the portfolio and the impact on performance relative to the peers. The Trustees concluded that the DDJ Fund’s performance was acceptable.
The Adviser’s Profitability: The Trustees received and considered a profitability analysis prepared by DDJ based on the fees paid (and to be paid) under the DDJ Agreement. The Trustees noted that, based on the information provided, DDJ had earned a profit (before distribution related expenses) from managing the DDJ Fund in 2020. The Trustees then reviewed and discussed DDJ’s financial statements in order to consider the financial condition and stability of DDJ. The Trustees concluded that the profits realized were not excessive.
| Annual Report | September 30, 2021 | 29 |
| Disclosure Regarding Renewal and |
| DDJ Opportunistic High Yield Fund | Approval of Fund Advisory Agreement |
| September 30, 2021 (Unaudited) |
Economies of Scale: The Trustees considered whether economies of scale in the provision of services to the DDJ Fund would be passed along to the shareholders under the DDJ Agreement. The Board agreed that material economies of scale were not anticipated to be achieved at projected DDJ Fund asset levels in the near term, and the Trustees would consider the issue at the next renewal period.
Other Benefits to the Adviser: The Trustees reviewed and considered any incidental benefits derived or to be derived by DDJ from its relationship with the DDJ Fund. They noted that, because the DDJ Fund was pursuing an investment strategy that is primarily fixed income, rather than equity, soft dollars were not a material consideration.
Having requested, reviewed, and deliberated such information from DDJ as the Board believed to be reasonably necessary to evaluate the terms of the DDJ Agreement, the Trustees, including a majority of the Independent Trustees, concluded that renewal of the DDJ Agreement was in the best interests of the DDJ Fund and its shareholders.
| 30 | www.ddjcap.com |
| DDJ Opportunistic High Yield Fund | Additional Information |
| September 30, 2021 (Unaudited) |
1. PROXY VOTING POLICIES AND VOTING RECORD
A description of the policies and procedures that the Fund uses to determine how to vote proxies relating to portfolio securities is available without charge, upon request, (i) by calling the Fund (toll-free) at 1-844-363-4898 or (ii) on the website of the Securities and Exchange Commission (the “SEC”) at http://www.sec.gov.
Information regarding how the Fund voted proxies relating to portfolio securities during the most recent 12-month period ended June 30 is available (i) without charge, upon request, by calling the Fund (toll-free) at 1-844-363-4898 or (ii) on the SEC’s website at http://www.sec.gov.
2. PORTFOLIO HOLDINGS
The Fund’s portfolio holdings are made available semi-annually in shareholder reports within 60 days after the close of the period for which the report is being made, as required by federal securities laws. The Fund files its complete schedule of portfolio holdings with the SEC for the first and third fiscal quarters of each fiscal year as an exhibit to its reports on Form N-PORT. The Fund’s Form N-PORT reports are available on the SEC’s website at www.sec.gov. The Fund’s portfolio holdings are also available upon request, without charge, by calling (toll-free) 1-781-283-8500 or by writing to DDJ Capital Management, LLC at 1075 Main Street, Suite 320, Waltham, MA 02451.
3. SHAREHOLDER PROXY RESULTS
At a Special Meeting of Shareholders of the ALPS Series Trust, held on April 12, 2021, shareholders of record as of the close of business on March 1, 2021 voted to approve the following proposals:
Proposal 1: To elect Ward D. Armstrong to serve on the Board of Trustees until his resignation, retirement, death or removal or until his successor is duly elected and qualified.
| Shares Voted In Favor | Shares Voted Against or Abstentions | |
| 162,259,659 | 244,729 |
Proposal 2: To elect Bradley J. Swenson to serve on the Board of Trustees until his resignation, retirement, death or removal or until his successor is duly elected and qualified.
| Shares Voted In Favor | Shares Voted Against or Abstentions | |
| 162,281,980 | 222,408 |
| Annual Report | September 30, 2021 | 31 |
| DDJ Opportunistic High Yield Fund | Liquidity Risk Management Program |
| September 30, 2021 (Unaudited) |
The ALPS Series Trust (the “Trust”) has established a liquidity risk management program (the “Program”) to govern the Trust’s approach to managing liquidity risk for each fund in the series (each a “Fund”). The Program is overseen by the Liquidity Committee (the “Committee”), a committee comprised of representatives of the Trust and ALPS | SS&C. The Trust’s Board of Trustees (the “Board”) has approved the designation of the Committee to oversee the Program.
The Program’s principal objectives include supporting each Fund’s compliance with limits on investments in illiquid assets and mitigating the risk that a Fund will be unable to meet its redemption obligations in a timely manner. The Program also includes a number of elements that support the management and assessment of liquidity risk, including, among others, an annual assessment of factors that influence a Fund’s liquidity the periodic classification and re-classification of the Fund’s investments into groupings that reflect the Committee’s assessment of their relative liquidity under both current market conditions and reasonably foreseeable stressed conditions, as well as minimum levels of highly liquid investments.
At a meeting that occurred on May 20, 2021, the Board received a report from the Committee that addressed the operation of the Program and assessed its adequacy and effectiveness of implementation. The report revealed that, during the period covered by the report, there were no liquidity events that impacted the Funds or their ability to timely meet redemptions without dilution to existing shareholders. The report further discussed the liquidity classification methodology of each Fund, the effectiveness of the operation of certain Funds’ Highly Liquid Investment Minimum (“HLIM”) where applicable, and the liquidity classification of each Fund’s investments over the period. The report further noted that no material changes have been made to the Program since its implementation. The report provided to the Board included a conclusion that the Program appeared to be reasonably designed and operated effectively during the review period.
| 32 | www.ddjcap.com |
| DDJ Opportunistic High Yield Fund | Privacy Policy |
| September 30, 2021 (Unaudited) |
| FACTS | WHAT DOES THE FUND DO WITH YOUR PERSONAL INFORMATION? |
| WHY? | Financial companies choose how they share your personal information. Federal law gives consumers the right to limit some but not all sharing. Federal law also requires us to tell you how we collect, share and protect your personal information. Please read this notice carefully to understand what we do. |
| WHAT? | The types of personal information we collect and share depend on the product or service you have with us. This information can include: |
| · Social Security number and account transactions | |
| · Account balances and transaction history | |
| · Wire transfer instructions | |
| HOW? | All financial companies need to share customers’ personal information to run their everyday business. In the section below, we list the reasons financial companies can share their customers’ personal information, the reasons a Fund chooses to share, and whether you can limit this sharing. |
REASONS WE CAN SHARE YOUR PERSONAL INFORMATION | DOES THE FUND SHARE? | CAN YOU LIMIT THIS SHARING? |
For our everyday business purposes – such as to process your transactions, maintain your account(s), respond to court orders and legal investigations, or report to credit bureaus | Yes | No |
For our marketing purposes – to offer our products and services to you | No | We do not share. |
| For joint marketing with other financial companies | No | We do not share. |
For our affiliates’ everyday business purposes – information about your transactions and experiences | Yes | No |
For our affiliates’ everyday business purposes – information about your creditworthiness | No | We do not share. |
| For non-affiliates to market to you | No | We do not share. |
| QUESTIONS? Call 1-844-363-4898 or go to www.ddjfunds.com. | ||
| Annual Report | September 30, 2021 | 33 |
| DDJ Opportunistic High Yield Fund | Privacy Policy |
| September 30, 2021 (Unaudited) |
| WHO WE ARE | |
| Who is providing this notice? | DDJ Opportunistic High Yield Fund (the “Fund”) |
| WHAT WE DO | |
| How does the Fund protect my personal information? | To protect your personal information from unauthorized access and use, we use security measures that comply with federal law. These measures include computer safeguards and secured files and buildings. |
| How does the Fund collect my personal information? | We collect your personal information, for example, when you · open an account · provide account information or give us your contact information · make a wire transfer or deposit money |
| Why can’t I limit all sharing? | Federal law gives you the right to limit only · sharing for affiliates’ everyday business purposes-information about your creditworthiness · affiliates from using your information to market to you · sharing for non-affiliates to market to you State laws and individual companies may give you additional rights to limit sharing. |
| DEFINITIONS | |
| Affiliates | Companies related by common ownership or control. They can be financial and nonfinancial companies. |
| Non-affiliates | Companies not related by common ownership or control. They can be financial and nonfinancial companies. · The Fund does not share with non-affiliates so they can market to you. |
| Joint marketing | A formal agreement between non-affiliated financial companies that together market financial products or services to you. · The Fund does not jointly market. |
| OTHER IMPORTANT INFORMATION | |
| California Residents | If your account has a California home address, your personal information will not be disclosed to nonaffiliated third parties except as permitted by applicable California law, and we will limit sharing such personal information with our affiliates to comply with California privacy laws that apply to us. |
| Vermont Residents | The State of Vermont requires financial institutions to obtain your consent prior to sharing personal information that they collect about you with affiliated companies and nonaffiliated third parties other than in certain limited circumstances. Except as permitted by law, we will not share personal information we collect about you with nonaffiliated third parties or other affiliated companies unless you provide us with your written consent to share such information. |
| 34 | www.ddjcap.com |
| DDJ Opportunistic High Yield Fund | Trustees & Officers |
| September 30, 2021 (Unaudited) |
| INDEPENDENT TRUSTEES | |||||
| Name, Birth Year & Address* | Position(s) Held with Fund | Term of Office and Length of Time Served** | Principal Occupation(s) During Past 5 Years*** | Number of Funds in Fund Complex Overseen by Trustee**** | Other Directorships Held by Trustee During Past 5 Years*** |
| Ward D. Armstrong, Birth year: 1954 | Trustee and Chairman | Mr. Armstrong was appointed to the Board on May 27, 2016. Mr. Armstrong was appointed Chairman of the Board at the August 24, 2017 meeting of the Board of Trustees. | Mr. Armstrong is currently retired. From February 2010 to July 2015, he was Co-Founder and Managing Partner of NorthRock Partners, a private wealth advisory firm providing comprehensive wealth management and family office services to the high net-worth marketplace. Previously, he was Senior Vice President, Ameriprise Financial (1984 to 2007); Chairman of Ameriprise Trust Company (1996 to 2007) and President, American Express Institutional Asset Management (2002 to 2004). He has also served on several investment related Boards including Kenwood Capital Management, RiverSource Investments, American Express Asset Management International and was Chair of the Ordway Theatre Endowment Committee. | 11 | Mr. Armstrong is a Director of the Heartland Group, Inc. (3 funds). |
| J. Wayne Hutchens, Birth year: 1944 | Trustee | Mr. Hutchens was elected to the Board on October 30, 2012. | Mr. Hutchens is currently retired. From 2000 to January 2020, he served as Trustee of the Denver Museum of Nature and Science and from May 2012 to February 2020, he served as Trustee of Children’s Hospital Colorado. From April 2006 to December 2012, he served as President and CEO of the University of Colorado (CU) Foundation and from April 2009 to December 2012, he was Executive Director of the CU Real Estate Foundation. Mr. Hutchens is also Director of AMG National Trust Bank (June 2012 to present). Prior to these positions, Mr. Hutchens spent 29 years in the banking industry, retiring as Chairman of Chase Bank Colorado. | 11 | Mr. Hutchens is a Director of RiverNorth Opportunities Fund, Inc. (2013 to present), RiverNorth Opportunistic Municipal Income Fund, Inc. (2018 to present), RiverNorth/Doubleline Strategic Opportunity Fund, Inc. (2018 to present), RiverNorth Specialty Finance Corporation (2018 to present), RiverNorth Managed Duration Municipal Income Fund, Inc. (2019 to present), RiverNorth Flexible Municipal Income Fund, Inc. (2020 to present). He is an Advisory Board member of RiverNorth Funds (3 funds) (2020 to present). |
| * | All communications to Trustees and Officers may be directed to ALPS Series Trust c/o 1290 Broadway, Suite 1000, Denver, CO 80203. |
| ** | This is the period for which the Trustee or Officer began serving the Trust. Each Trustee serves an indefinite term, until such Trustee’s successor is elected and appointed, or such Trustee resigns or is deceased. Officers are elected on an annual basis. |
| *** | Except as otherwise indicated, each individual has held the office shown or other offices in the same company for the last five years. |
| **** | The Fund Complex currently consists of 11 series of the Trust. |
| Annual Report | September 30, 2021 | 35 |
| DDJ Opportunistic High Yield Fund | Trustees & Officers |
| September 30, 2021 (Unaudited) |
| INDEPENDENT TRUSTEES | |||||
| Name, Birth Year & Address* | Position(s) Held with Fund | Term of Office and Length of Time Served** | Principal Occupation(s) During Past 5 Years*** | Number of Funds in Fund Complex Overseen by Trustee**** | Other Directorships Held by Trustee During Past 5 Years*** |
| Patrick Seese, Birth year: 1971 | Trustee | Mr. Seese was elected to the Board on October 30, 2012. | Mr. Seese is an owner and a Managing Director of Integris Partners, a middle-market investment banking firm serving closely-held companies, financial sponsors and public companies (February 2008 to present). Prior to this, Mr. Seese was a Managing Director of Headwaters MB, a middle- market investing banking firm (December 2003 to February 2008). Prior to that, Mr. Seese worked in Credit Suisse First Boston’s Mergers and Acquisitions Group and served as Head of Corporation Development, Katy Industries, a publicly traded industrial and consumer products company and at Deloitte & Touche LLP, where he began his career in 1994. | 11 | Mr. Seese is a Director of The Mile High Five Foundation (2013 to present) and SJ Panthers Foundation (2016 to present). |
| Merrillyn J. Kosier, Birth year: 1959 | Trustee | Ms. Kosier was elected to the Board on November 17, 2021. | Ms. Kosier retired from Ariel Investments as Executive Vice President in 2019. During her tenure at Ariel Investments, she served as Chief Marketing Officer, Ariel Mutual Funds since 2007; Trustee for Ariel Investment Trust since 2003 and President of Ariel Distributors, LLC since 2002. From 2006 to present, she has served as Trustee at the Harris Theater For Music and Dance (not-for-profit organization) and is currently Executive Vice Chair. | 11 | Ms. Kosier is Board Director at the Arts Club of Chicago (2021 to present). |
| * | All communications to Trustees and Officers may be directed to ALPS Series Trust c/o 1290 Broadway, Suite 1000, Denver, CO 80203. |
| ** | This is the period for which the Trustee or Officer began serving the Trust. Each Trustee serves an indefinite term, until such Trustee’s successor is elected and appointed, or such Trustee resigns or is deceased. Officers are elected on an annual basis. |
| *** | Except as otherwise indicated, each individual has held the office shown or other offices in the same company for the last five years. |
| **** | The Fund Complex currently consists of 11 series of the Trust. |
| 36 | www.ddjcap.com |
| DDJ Opportunistic High Yield Fund | Trustees & Officers |
| September 30, 2021 (Unaudited) |
| INTERESTED TRUSTEE | |||||
| Name, Birth Year & Address* | Position(s) Held with Fund | Term of Office and Length of Time Served** | Principal Occupation(s) During Past 5 Years*** | Number of Funds in Fund Complex Overseen by Trustee**** | Other Directorships Held by Trustee During Past 5 Years*** |
| Bradley J. Swenson, Birth year: 1972 | Trustee | Mr. Swenson was elected to the Board on April 12, 2021 | Mr. Swenson joined ALPS Fund Services, Inc. (“ALPS”) in 2004 and had served as its President since June 2019 until June 2021. In this role, he served as an officer to certain other closed-end and open-end investment companies. He previously served as the Chief Operating Officer of ALPS (2015-2019). Mr. Swenson also previously served as Chief Compliance Officer to ALPS, its affiliated entities, and to certain ETF, closed-end and open-end investment companies (2004-2015). | 11 | None |
| * | All communications to Trustees and Officers may be directed to ALPS Series Trust c/o 1290 Broadway, Suite 1000, Denver, CO 80203. |
| ** | This is the period for which the Trustee or Officer began serving the Trust. Each Trustee serves an indefinite term, until such Trustee’s successor is elected and appointed, or such Trustee resigns or is deceased. Officers are elected on an annual basis. |
| *** | Except as otherwise indicated, each individual has held the office shown or other offices in the same company for the last five years. |
| **** | The Fund Complex currently consists of 11 series of the Trust. |
| Annual Report | September 30, 2021 | 37 |
| DDJ Opportunistic High Yield Fund | Trustees & Officers |
| September 30, 2021 (Unaudited) |
| OFFICERS | |||
| Name, Birth Year & Address* | Position(s) Held with Fund | Term of Office and Length of Time Served** | Principal Occupation(s) During Past 5 Years*** |
| Dawn Cotten Birth year: 1977 | President | Since June 2021 | Ms. Cotten joined ALPS in 2009 and is currently Senior Vice President of Fund Administration and Relationship Management of ALPS. She has served in that role since January 2020. Prior to that, Ms. Cotten served as Senior Vice President (2017-2020) and Vice President of ALPS Relationship Management (2013-2017). |
| Erich Rettinger Birth year: 1985 | Treasurer | Since August 2020 | Mr. Rettinger joined ALPS in 2007 and is currently Vice President and Fund Controller of ALPS. He has served as Fund Controller of ALPS (since 2013) and Fund Accounting of ALPS (2013-2017). He also served as Assistant Treasurer of the Trust (May 2019-August 2020). Mr. Rettinger is also Treasurer of the Clough Long/Short Equity Fund, Clough Global Opportunities Fund, Clough Global Dividend and Income Fund and Clough Global Equity Fund. Mr. Rettinger is also Assistant Treasurer of the Stone Harbor Investment Funds. |
| Patrick Rogers+ Birth year: 1966 | Secretary | Since November 2021 | Mr. Rogers has served as Senior Legal Counsel of ALPS since September 2021 and previously served as Compliance Counsel for Mercer Advisors from 2018 to 2021 and Contract Attorney for CACI, Inc. from 2014 to 2018. |
| Anne M. Berg Birth year: 1973 | Assistant Secretary | Since August 2018 | Ms. Berg joined ALPS as Senior Investment Company Act Paralegal in February 2017. Prior to joining ALPS, she was a Senior Legal Manager at Janus Capital Management LLC (2000-2017). |
| Lucas D. Foss Birth year: 1977 | Chief Compliance Officer | Since January 2018 | Mr. Foss rejoined ALPS in November 2017 as Vice President and Deputy Chief Compliance Officer. Prior to his current role, Mr. Foss served as the Director of Compliance at Transamerica Asset Management (2015- 2017) and Deputy Chief Compliance Officer at ALPS (2012- 2015). Mr. Foss is also CCO of X-Square Balanced Fund, Goehring & Rozencwajg Investment Funds, Broadstone Real Estate Access Fund, Inc., Clough Global Funds; Clough Funds Trust; SPDR® S&P 500® ETF Trust, SPDR® Dow Jones® Industrial Average ETF Trust, SPDR® S&P MIDCAP 400® ETF Trust and 1WS Credit Income Fund. |
| * | All communications to Trustees and Officers may be directed to ALPS Series Trust c/o 1290 Broadway, Suite 1000, Denver, CO 80203. |
| ** | This is the period for which the Trustee or Officer began serving the Trust. Each Trustee serves an indefinite term, until such Trustee’s successor is elected and appointed, or such Trustee resigns or is deceased. Officers are elected on an annual basis. |
| *** | Except as otherwise indicated, each individual has held the office shown or other offices in the same company for the last five years. |
| **** | The Fund Complex currently consists of 11 series of the Trust. |
| + | Appointed November 18, 2021 |
Additional information about members of the Board of Trustees and officers of the Trust is available in the Statement of Additional Information and is available, without charge, upon request, by calling the Fund (toll-free) at 1-844-680-6562.
| 38 | www.ddjcap.com |
Intentionally Left Blank

Annual Report 2021
As of September 30, 2021
Hillman Value Fund
No Load Shares

This report and the financial statements contained herein are submitted for the general information of the shareholders of the Hillman Value Fund (“Fund”). The Fund’s shares are not deposits or obligations of, or guaranteed by, any depository institution. The Fund’s shares are not insured by the FDIC, Federal Reserve Board or any other agency, and are subject to investment risks, including possible loss of principal amount invested. Neither the Fund nor the Fund’s distributor is a bank.
TABLE OF CONTENTS
| Shareholder Letter | 1 |
| Portfolio Update | 3 |
| Disclosure of Fund Expenses | 6 |
| Portolio of Investments | 7 |
| Statement of Assets and Liabilities | 11 |
| Statement of Operations | 12 |
| Statements of Changes in Net Assets | 13 |
| Financial Highlights | 14 |
| Notes to Financial Statements | 17 |
| Report of Independent Registered Accounting Firm | 29 |
| Additional Information | 30 |
| Liquidity Risk Management Program | 31 |
| Privacy Policy | 32 |
| Trustees & Officers | 35 |
| Hillman Value Fund | Shareholder Letter |
September 30, 2021 (Unaudited)

Dear Hillman Value Fund Shareholder,
We are pleased to provide the annual report for the Hillman Value Fund for the fiscal year ended September 30, 2021.
We have enclosed the attached performance summary to remind our shareholders of Hillman Capital Management’s approach and to share some perspective on current economic conditions.
On behalf of the team at Hillman Capital Management, I thank you for your ongoing confidence. It is our hope that we may continue to serve you throughout the years to come.
Sincerely,

Mark A. Hillman
CEO and Chief Investment Officer
Hillman Capital Management, Inc.
Performance Summary
For the year ended September 30, 2021, the Hillman Value Fund returned 43.04% versus a return of 35.01% for its benchmark, the Russell 1000 Value Total Return Index. It is our view that investment in enterprises which we believe possess sustainable competitive advantages, coupled with strict adherence to our fundamentally sound valuation discipline, helped to support performance in a volatile market.
The Fund benefitted from strong performance in the Financials, Industrials, Energy, Consumer Discretionary, and Health Care Sectors. The Communication Services, Materials, and Consumer Staples Sectors contributed the least to performance, despite posting gains. The premiums generated from option writing nominally benefitted performance.
The top 5 performers for the fiscal year were Nordstrom Inc. (Ticker: JWN), Wells Fargo & Company (Ticker: WFC), Simon Property Group, Inc. (Ticker: SPG), Exxon Mobil Corporation (Ticker: XOM), and Plains All American Pipeline, L.P. (Ticker: PAA).
The bottom 5 performers for the fiscal year were Discovery, Inc. (Ticker: DISCA), Verizon Communications Inc. (Ticker: VZ), Merck & Co., Inc. (Ticker: MRK), Bristol-Myers Squibb Company (Ticker: BMY), and Nike, Inc. (Ticker: NKE).
| Annual Report | September 30, 2021 | 1 |
| Hillman Value Fund | Shareholder Letter |
September 30, 2021 (Unaudited)
During the period, U.S. equity investors took heart from the rollout of COVID-19 vaccinations, congressional passage of a $1.9 trillion emergency spending package and anticipation of the creation of a large public sector infrastructure spending program. With forward looking economic optimism pervading, investors took more seriously the possibility of inflation returning to more historically normal levels, driving the yield on the benchmark Ten Year US Treasury Note 83 basis points higher, ending the period at 1.52%.
Our equity strategies are driven by our core belief that competitively advantaged companies will outperform their peers through economic cycles and market cycles. Our goal is to invest in great enterprises at attractive prices. We will continue to invest according to this precept for the long-term interest of our clients. We feel that the Fund is well positioned with investments in companies with sustainable competitive advantages, at prices that we believe to be reasonable.
Disclosure:
Statements in this Annual Report reflect projections or expectations of future financial or economic performance of the Fund and of the market in general and statements of the Fund’s plans and objectives for future operations are forward-looking statements. No assurance can be given that actual results or events will not differ materially from those projected, estimated, assumed, or anticipated in any such forward-looking statements. Important factors that could result in such differences, in addition to the other factors noted with such forward-looking statements, include general economic conditions such as inflation, recession and interest rates.
ALPS Distributors, Inc. is the distributor of the Hillman Capital Value Fund, 1290 Broadway, Suite 1000, Denver, CO 80203.
ALPS Distributors, Inc. is not affiliated with Hillman Capital Management, Inc.
© 2021 Hillman Capital Management. All rights reserved.
| 2 | www.hcmfunds.com |
| Hillman Value Fund | Portfolio Update |
September 30, 2021 (Unaudited)
Average Annual Total Returns (as of September 30, 2021)*
| 1 Year | 3 Year | 5 Year | 10 Year | Since Inception** | |
| Hillman Value Fund - NAV | 43.04% | 15.16% | 15.50% | 15.00% | 8.09% |
| Russell 1000® Value Total Return Index(a) | 35.01% | 10.07% | 10.94% | 13.51% | 7.33% |
The performance data quoted above represents past performance. Past performance is not a guarantee of future results. Investment return and value of the Fund shares will fluctuate so that an investor’s shares, when sold or redeemed, may be worth more or less than their original cost. Performance may be lower or higher than performance data quoted. Fund performance current to the most recent month-end is available by calling (855) 400-5944 or by visiting www.hcmfunds.com.
| * | The Hillman Value Fund (the “Predecessor Fund”) reorganized into the Fund on March 15, 2021. The Predecessor Fund was a series of the Hillman Capital Management Investment Trust (the “Hillman Trust”) and also was advised by Hillman Capital Management, Inc. For periods prior to the reorganization, performance results above for the Fund reflect the performance of the Predecessor Fund. The Predecessor Fund’s past performance does not necessarily indicate how the Fund will perform in the future. |
| ** | Fund inception December 29, 2000. |
| (a) | The Russell 1000 Value Total Return Index is an index of approximately 1,000 of the largest companies in the U.S. equity market and is a widely recognized, unmanaged index of large-cap equities. It is not possible to invest in this index. |
Returns of less than 1 year are cumulative.
Indices are not actively managed and do not reflect deduction for fees, expenses or taxes. An investor cannot invest directly in an index.
The returns shown above do not reflect the deduction of taxes a shareholder would pay on Fund distributions or redemption of Fund shares.
The total annual operating expenses and total annual operating expenses after fee waivers and/or reimbursement for the Fund (as reported in the March 15, 2021 Prospectus) are 1.15% and 0.95%, respectively. The Fund’s investment adviser has contractually agreed to limit expenses through March 15, 2022.
| Annual Report | September 30, 2021 | 3 |
| Hillman Value Fund | Portfolio Update |
September 30, 2021 (Unaudited)
Performance of $10,000 Initial Investment (as of September 30, 2021)

The graph shown above represents historical performance of a hypothetical investment of $10,000 in the Fund since inception. Past performance does not guarantee future results. All returns reflect reinvested dividends, but do not reflect the deduction of taxes that a shareholder would pay on Fund distributions or the redemption of Fund shares.
Top Ten Holdings (as a % of Net Assets)*
| Alphabet, Inc. | 3.46% |
| Raytheon Technologies Corp. | 3.43% |
| Boeing Co. | 3.36% |
| Kraft Heinz Co. | 3.36% |
| Wells Fargo & Co. | 3.33% |
| Kellogg Co. | 3.25% |
| Amazon.com, Inc. | 3.19% |
| Bank of New York Mellon Corp. | 3.19% |
| Pfizer, Inc. | 3.16% |
| Merck & Co., Inc. | 3.13% |
| Top Ten Holdings | 32.86% |
| 4 | www.hcmfunds.com |
| Hillman Value Fund | Portfolio Update |
September 30, 2021 (Unaudited)
Sector Allocation (as a % of Net Assets)*
| Health Care | 19.80% |
| Communication Services | 15.06% |
| Industrials | 12.47% |
| Consumer Staples | 9.37% |
| Limited Partnership | 8.90% |
| Financials | 6.52% |
| Consumer Discretionary | 6.13% |
| Materials | 5.87% |
| Information Technology | 5.56% |
| Real Estate Investment Trust | 3.01% |
| Energy | 2.94% |
| Cash, Cash Equivalents, & Other Net Assets | 4.37% |
| Total | 100.00% |
| * | Holdings are subject to change, and may not reflect the current or future position of the portfolio. Tables present indicative values only. |
| Annual Report | September 30, 2021 | 5 |
| Hillman Value Fund | Disclosure of Fund Expenses |
September 30, 2021 (Unaudited)
Examples. As a shareholder of the Hillman Value Fund (the “Fund”), you incur two types of costs: (1) transaction costs, including applicable redemption fees; and (2) ongoing costs, including management fees and other Fund expenses. The following examples are intended to help you understand your ongoing costs (in dollars) of investing in the Fund and to compare these costs with the ongoing costs of investing in other mutual funds. The examples are based on an investment of $1,000 invested on April 1, 2021 and held through September 30, 2021.
Actual Expenses. The first line under each class in the table below provides information about actual account values and actual expenses. You may use the information in this line, together with the amount you invested, to estimate the expenses that you paid over the period. Simply divide your account value by $1,000 (for example, an $8,600 account value divided by $1,000 = 8.6), then multiply the result by the number in the first line under the heading “Expenses Paid During Period April 1, 2021 - September 30, 2021” to estimate the expenses you paid on your account during this period.
Hypothetical Example for Comparison Purposes. The second line under each class in the table below provides information about hypothetical account values and hypothetical expenses based on the Fund’s actual expense ratio and an assumed rate of return of 5% per year before expenses, which is not the Fund’s actual return. The hypothetical account values and expenses may not be used to estimate the actual ending account balance or expenses you paid for the period. You may use this information to compare the ongoing costs of investing in the Fund and other mutual funds. To do so, compare this 5% hypothetical example with the 5% hypothetical examples that appear in the shareholder reports of the other funds.
Please note that the expenses shown in the table are meant to highlight your ongoing Fund costs only and do not reflect any transactional costs, such as redemption fees. Therefore, the second line under each class in the table below is useful in comparing ongoing costs only and will not help you determine the relative total costs of owning different funds. In addition, if these transactional costs were included, your costs would have been higher.
| Beginning Account Value April 1, 2021 | Ending Account Value September 30, 2021 | Expense Ratio(a) | Expenses Paid During Period April 1, 2021 - September 30, 2021(b) | |
| Hillman Value Fund | ||||
| Actual | $1,000.00 | $1,054.20 | 0.95% | $ 4.89 |
| Hypothetical (5% return before expenses) | $1,000.00 | $1,020.31 | 0.95% | $ 4.81 |
| (a) | Annualized based on the Fund’s most recent half-year expenses. |
| (b) | Expenses are equal to the Fund’s annualized expense ratio multiplied by the average account value over the period, multiplied by the number of days in the most recent fiscal half year (183), divided by 365. |
| 6 | www.hcmfunds.com |
| Hillman Value Fund | Portfolio of Investments |
September 30, 2021
| Shares | Value (Note 2) | |||||||
| COMMON STOCK (83.72%) | ||||||||
| Communication Services (15.06%) | ||||||||
| Alphabet, Inc., Class A(a) | 2,800 | $ | 7,485,856 | |||||
| AT&T, Inc. | 230,000 | 6,212,300 | ||||||
| Discovery, Inc., Class A(a) | 223,000 | 5,659,740 | ||||||
| Facebook, Inc., Class A(a) | 19,000 | 6,448,410 | ||||||
| Verizon Communications, Inc. | 125,000 | 6,751,250 | ||||||
| Total Communication Services | 32,557,556 | |||||||
| Consumer Discretionary (6.13%) | ||||||||
| Amazon.com, Inc.(a) | 2,100 | 6,898,584 | ||||||
| Nordstrom, Inc.(a) | 240,000 | 6,348,000 | ||||||
| Total Consumer Discretionary | 13,246,584 | |||||||
| Consumer Staples (9.37%) | ||||||||
| Anheuser-Busch InBev NV, Sponsored ADR(b) | 106,000 | 5,976,280 | ||||||
| Kellogg Co. | 110,000 | 7,031,200 | ||||||
| Kraft Heinz Co.(b) | 197,000 | 7,253,540 | ||||||
| Total Consumer Staples | 20,261,020 | |||||||
| Energy (2.94%) | ||||||||
| Exxon Mobil Corp.(b) | 108,000 | 6,352,560 | ||||||
| Financials (6.52%) | ||||||||
| Bank of New York Mellon Corp. | 133,000 | 6,894,720 | ||||||
| Wells Fargo & Co.(b) | 155,000 | 7,193,550 | ||||||
| Total Financials | 14,088,270 | |||||||
| Health Care (19.80%) | ||||||||
| Becton Dickinson and Co. | 24,000 | 5,899,680 | ||||||
| Biogen, Inc.(a) | 18,200 | 5,150,418 | ||||||
| Bristol-Myers Squibb Co. | 93,000 | 5,502,810 | ||||||
| CVS Health Corp. | 77,000 | 6,534,220 | ||||||
| GlaxoSmithKline PLC, Sponsored ADR | 160,000 | 6,113,600 | ||||||
| Merck & Co., Inc. | 90,000 | 6,759,900 | ||||||
See Notes to Financial Statements.
| Annual Report | September 30, 2021 | 7 |
| Hillman Value Fund | Portfolio of Investments |
September 30, 2021
| Shares | Value (Note 2) | |||||||
| Health Care (continued) | ||||||||
| Pfizer, Inc. | 159,000 | $ | 6,838,590 | |||||
| Total Health Care | 42,799,218 | |||||||
| Industrials (12.47%) | ||||||||
| Boeing Co.(a) | 33,000 | 7,258,020 | ||||||
| Emerson Electric Co. | 66,000 | 6,217,200 | ||||||
| General Dynamics Corp. | 31,000 | 6,076,930 | ||||||
| Raytheon Technologies Corp. | 86,187 | 7,408,635 | ||||||
| Total Industrials | 26,960,785 | |||||||
| Information Technology (5.56%) | ||||||||
| Intel Corp.(b) | 122,200 | 6,510,816 | ||||||
| Microsoft Corp. | 19,500 | 5,497,440 | ||||||
| Total Information Technology | 12,008,256 | |||||||
| Materials (5.87%) | ||||||||
| Compass Minerals International, Inc. | 104,000 | 6,697,600 | ||||||
| DuPont de Nemours, Inc. | 88,000 | 5,983,120 | ||||||
| Total Materials | 12,680,720 | |||||||
| TOTAL COMMON STOCK | ||||||||
| (Cost $162,918,226) | 180,954,969 | |||||||
| LIMITED PARTNERSHIP (8.90%) | ||||||||
| Energy (8.90%) | ||||||||
| Enterprise Products Partners LP | 305,500 | 6,611,020 | ||||||
| Magellan Midstream Partners LP | 141,000 | 6,426,780 | ||||||
| Plains All American Pipeline LP | 610,000 | 6,203,700 | ||||||
| Total Energy | 19,241,500 | |||||||
| TOTAL LIMITED PARTNERSHIP | ||||||||
| (Cost $18,577,100) | 19,241,500 | |||||||
See Notes to Financial Statements.
| 8 | www.hcmfunds.com |
| Hillman Value Fund | Portfolio of Investments |
September 30, 2021
| Shares | Value (Note 2) | |||||||
| REAL ESTATE INVESTMENT TRUST (3.01%) | ||||||||
| Real Estate (3.01%) | ||||||||
| Simon Property Group, Inc. | 50,000 | $ | 6,498,500 | |||||
| TOTAL REAL ESTATE INVESTMENT TRUST | ||||||||
| (Cost $5,329,820) | 6,498,500 | |||||||
| TOTAL INVESTMENTS (95.63%) | ||||||||
| (Cost $186,825,146) | $ | 206,694,969 | ||||||
| OTHER ASSETS IN EXCESS OF LIABILITIES (4.37%)(c) | 9,435,273 | |||||||
| NET ASSETS (100.00%) | $ | 216,130,242 | ||||||
| (a) | Non-income producing security. |
| (b) | All or a portion is held as collateral at custodian for written options. |
| (c) | Includes cash which is being held as collateral for written options. |
See Notes to Financial Statements.
| Annual Report | September 30, 2021 | 9 |
| Hillman Value Fund | Portfolio of Investments |
September 30, 2021
WRITTEN OPTION CONTRACTS (0.17%)
| Counterparty | Expiration Date | Strike Price | Contracts | Premiums Received | Notional Value | Value (Note 2) | |||||||||||||||
| Option Contracts - (0.17%) | |||||||||||||||||||||
| StoneX | 11/19/21 | $ | 25.00 | 350 | $ | 47,015 | $ | (888,300 | ) | $ | (50,750 | ) | |||||||||
| StoneX | 10/15/21 | 33.00 | 2,120 | 217,610 | (7,180,440 | ) | (95,400 | ) | |||||||||||||
| StoneX | 11/19/21 | 20.00 | 3,250 | 207,894 | (6,571,500 | ) | (217,750 | ) | |||||||||||||
| TOTAL WRITTEN OPTION CONTRACTS | $ | 472,519 | $ | (14,640,240 | ) | $ | (363,900 | ) | |||||||||||||
See Notes to Financial Statements.
| 10 | www.hcmfunds.com |
| Hillman Value Fund | Statement of Assets and Liabilities |
September 30, 2021
| ASSETS: | ||||
| Investments, at value (Cost $186,825,146) | $ | 206,694,969 | ||
| Cash and cash equivalents | 9,357,237 | |||
| Deposit with broker for written options | 46,990 | |||
| Receivable for shares sold | 481,316 | |||
| Dividends and interest receivable | 201,418 | |||
| Other assets | 7,684 | |||
| Total Assets | 216,789,614 | |||
| LIABILITIES: | ||||
| Written options, at value (premiums received $472,519) | 363,900 | |||
| Payable for administration and transfer agent fees | 39,740 | |||
| Payable for investments purchased | 61 | |||
| Payable for shares redeemed | 117,980 | |||
| Payable to adviser | 75,852 | |||
| Payable for printing fees | 6,525 | |||
| Payable for professional fees | 25,413 | |||
| Payable for trustees’ fees and expenses | 3,469 | |||
| Payable to Chief Compliance Officer fees | 500 | |||
| Accrued expenses and other liabilities | 25,932 | |||
| Total Liabilities | 659,372 | |||
| NET ASSETS | $ | 216,130,242 | ||
| NET ASSETS CONSIST OF: | ||||
| Paid-in capital (Note 6) | $ | 175,550,445 | ||
| Total distributable earnings | 40,579,797 | |||
| NET ASSETS | $ | 216,130,242 | ||
| PRICING OF SHARES | ||||
| Net Asset Value, offering and redemption price per share | $ | 33.82 | ||
| Net Assets | $ | 216,130,242 | ||
| Shares of beneficial interest outstanding | 6,391,078 | |||
See Notes to Financial Statements.
| Annual Report | September 30, 2021 | 11 |
| Hillman Value Fund | Statement of Operations |
For the Year Ended September 30, 2021(a)
| INVESTMENT INCOME: | ||||
| Dividends | $ | 4,930,848 | ||
| Foreign taxes withheld | (9,341 | ) | ||
| Total Investment Income | 4,921,507 | |||
| EXPENSES: | ||||
| Investment advisory fees (Note 7) | 1,446,090 | |||
| Administration fees (Note 7) | 152,850 | |||
| Custody fees | 36,448 | |||
| Legal fees | 38,195 | |||
| Audit and tax fees | 17,454 | |||
| Transfer agent fees (Note 7) | 145,481 | |||
| Trustees fees and expenses (Note 8) | 14,095 | |||
| Registration and filing fees | 56,688 | |||
| Printing fees | 17,789 | |||
| Chief Compliance Officer fees (Note 7) | 14,758 | |||
| Insurance fees | 1,897 | |||
| Other expenses | 16,913 | |||
| Total Expenses | 1,958,658 | |||
| Less fees waived by investment adviser (Note 7) | (339,444 | ) | ||
| Net Expenses | 1,619,214 | |||
| NET INVESTMENT INCOME | 3,302,293 | |||
| REALIZED AND UNREALIZED GAIN/(LOSS) ON INVESTMENTS AND WRITTEN OPTIONS: | ||||
| Net realized gain/(loss) on: | ||||
| Investments | 16,385,241 | |||
| Written options | 1,736,223 | |||
| Net realized gain | 18,121,464 | |||
| Change in unrealized appreciation/(depreciation) on: | ||||
| Investments | 27,473,059 | |||
| Written options | 145,397 | |||
| Net change | 27,618,456 | |||
| NET REALIZED AND UNREALIZED GAIN ON INVESTMENTS AND WRITTEN OPTIONS | 45,739,920 | |||
| NET INCREASE IN NET ASSETS RESULTING FROM OPERATIONS | $ | 49,042,213 | ||
| (a) | Effective March 15th, 2021, the Hillman Value Fund merged into the ALPS Series Trust. The Fund was previously advised by Hillman Capital Management, and was recognized as the Hillman Value Fund, a series of Hillman Capital Management Investment Trust. |
See Notes to Financial Statements.
| 12 | www.hcmfunds.com |
| Hillman Value Fund | Statements of Changes in Net Assets |
For the Year Ended September 30, 2021 (a) | For the Year Ended September 30, 2020 | |||||||
| OPERATIONS: | ||||||||
| Net investment income | $ | 3,302,293 | $ | 1,371,951 | ||||
| Net realized gain on investments and written options | 18,121,464 | 8,598,433 | ||||||
| Net change in unrealized appreciation/(depreciation) on investments and written options | 27,618,456 | (12,528,231 | ) | |||||
| Net increase/(decrease) in net assets resulting from operations | 49,042,213 | (2,557,847 | ) | |||||
| DISTRIBUTIONS TO SHAREHOLDERS | ||||||||
| From distributable earnings | (10,792,129 | ) | (3,025,998 | ) | ||||
| Total distributions | (10,792,129 | ) | (3,025,998 | ) | ||||
| BENEFICIAL SHARE TRANSACTIONS (Note 6): | ||||||||
| Shares sold | 106,317,500 | 77,081,289 | ||||||
| Dividends reinvested | 10,376,937 | 2,959,930 | ||||||
| Shares redeemed | (43,209,382 | ) | (32,956,201 | ) | ||||
| Net increase from beneficial share transactions | 73,485,055 | 47,085,018 | ||||||
| Net increase in net assets | 111,735,139 | 41,501,173 | ||||||
| NET ASSETS: | ||||||||
| Beginning of year | 104,395,103 | 62,893,930 | ||||||
| End of year | $ | 216,130,242 | $ | 104,395,103 | ||||
| (a) | Effective March 15th, 2021, the Hillman Value Fund merged into the ALPS Series Trust. The Fund was previously advised by Hillman Capital Management, and was recognized as the Hillman Value Fund, a series of Hillman Capital Management Investment Trust. |
See Notes to Financial Statements.
| Annual Report | September 30, 2021 | 13 |
| Hillman Value Fund | Financial Highlights |
For a Share Outstanding Throughout the Periods Presented
| NET ASSET VALUE, BEGINNING OF PERIOD | ||||||||
| INCOME/(LOSS) FROM OPERATIONS: | ||||||||
| Net investment income(b) | ||||||||
| Net realized and unrealized gain/(loss) on investments | ||||||||
| Total from investment operations | ||||||||
| LESS DISTRIBUTIONS: | ||||||||
| From net investment income | ||||||||
| From net realized gains on investments | ||||||||
| Total Distributions | ||||||||
| NET INCREASE/(DECREASE) IN NET ASSET VALUE | ||||||||
| NET ASSET VALUE, END OF PERIOD | ||||||||
| TOTAL RETURN(d) | ||||||||
| SUPPLEMENTAL DATA: | ||||||||
| Net assets, end of period (in 000s) | ||||||||
| RATIOS TO AVERAGE NET ASSETS | ||||||||
| Operating expenses excluding reimbursement/waiver | ||||||||
| Operating expenses including reimbursement/waiver | ||||||||
| Net investment income including reimbursement/waiver | ||||||||
| PORTFOLIO TURNOVER RATE | ||||||||
See Notes to Financial Statements.
| 14 | www.hcmfunds.com |
| Hillman Value Fund | Financial Highlights |
For a Share Outstanding Throughout the Periods Presented
| For the Year Ended September 30, 2021 (a) | For the Year Ended September 30, 2020 | For the Year Ended September 30, 2019 | For the Year Ended September 30, 2018 | For the Year Ended September 30, 2017 | ||||||||||||||
| $ | 25.68 | $ | 27.74 | $ | 25.10 | $ | 22.20 | $ | 18.86 | |||||||||
| 0.62 | 0.29 | 0.17 | 0.18 | 0.11 | ||||||||||||||
| 9.97 | (1.32 | ) | 2.64 | 2.84 | 3.35 | |||||||||||||
| 10.59 | (1.03 | ) | 2.81 | 3.02 | 3.46 | |||||||||||||
| (0.27 | ) | (0.12 | ) | (0.17 | ) | (0.12 | ) | (0.12 | ) | |||||||||
| (2.18 | ) | (0.91 | ) | – | – | – | ||||||||||||
| (2.45 | ) | (1.03 | ) | (0.17 | ) | (0.12 | ) | (0.12 | ) | |||||||||
| 8.14 | (2.06 | ) | 2.64 | 2.90 | 3.34 | |||||||||||||
| $ | 33.82 | $ | 25.68 | (c) | $ | 27.74 | (c) | $ | 25.10 | $ | 22.20 | |||||||
| 43.04 | % | (4.10 | %) | 11.37 | % | 13.65 | % | 18.41 | % | |||||||||
| $ | 216,130 | $ | 104,395 | $ | 62,894 | $ | 35,038 | $ | 36,802 | |||||||||
| 1.15 | % | 1.31 | % | 1.65 | % | 1.63 | % | 1.60 | % | |||||||||
| 0.95 | % | 0.99 | % | 1.50 | % | 1.50 | % | 1.50 | % | |||||||||
| 1.94 | % | 1.54 | % | 0.91 | % | 0.68 | % | 0.51 | % | |||||||||
| 27 | % | 30 | % | 48 | % | 51 | % | 90 | % | |||||||||
See Notes to Financial Statements.
| Annual Report | September 30, 2021 | 15 |
| Hillman Value Fund | Financial Highlights |
For a Share Outstanding Throughout the Periods Presented
| (a) | Effective March 15th, 2021, the Hillman Value Fund merged into the ALPS Series Trust. The Fund was previously advised by Hillman Capital Management, and was recognized as the Hillman Value Fund, a series of Hillman Capital Management Investment Trust. |
| (b) | Calculated using the average shares method. |
| (c) | Includes adjustments in accordance with the accounting principles generally accepted in the United States of America, and, consequently, the net asset values for financial reporting purposes and the total returns based upon those net asset values may differ from the net asset values and totals returns for shareholder transactions. |
| (d) | Assumes an initial investment on the business day before the first day of the fiscal period, with all dividends and distributions reinvested in additional shares on the reinvestment date, and redemption at the net asset value calculated on the last business day of the fiscal period. Total returns are for the period indicated and have not been annualized. Total returns would have been lower had certain expenses not been waived during the period. Returns shown do not reflect the deduction of taxes that a shareholder would pay on Fund distributions or the redemption of Fund shares. |
See Notes to Financial Statements.
| 16 | www.hcmfunds.com |
| Hillman Value Fund | Notes to Financial Statements |
September 30, 2021
1. ORGANIZATION
ALPS Series Trust (the “Trust”), a Delaware statutory trust, is an open-end management investment company registered under the Investment Company Act of 1940, as amended (the “1940 Act”). The Trust consists of multiple separate portfolios or series. This annual report describes the Hillman Value Fund (the “Fund”). The Hillman Value Fund (the “Predecessor Fund”) reorganized into the Trust on March 15, 2021. The Predecessor Fund was a series of the Hillman Capital Management Investment Trust (the “Hillman Trust”) and also was advised by Hillman Capital Management, Inc. (the "Adviser”). The Fund is diversified, and its primary investment objective is to provide long-term total return from a combination of income and capital gains. The Fund currently offers one share class. The Board of Trustees (the “Board”) may establish additional funds and classes of shares at any time in the future without shareholder approval.
On February 23, 2021, the shareholders of the Predecessor Fund approved the reorganization of the shares of the Predecessor Fund with and into the shares of the Hillman Value Fund, and effective as of the close of business on March 12, 2021, the assets and liabilities of the Predecessor Fund were transferred to the Trust in exchange for shares in the Hillman Value Fund. Costs incurred by the Hillman Value Fund in connection with the reorganization were paid by the Adviser. The fiscal year ends of the Predecessor Fund and the Fund are identical, and as a result no changes were made to the Fund’s fiscal year end following the reorganization. Operations prior to March 15, 2021 were for the Predecessor Fund. The reorganization was accomplished by a tax-free exchange of 5,302,980 shares of the Predecessor Fund’s shares, valued at $168,935,617 for the exact same shares and value of the Hillman Value Fund’s shares. For financial reporting purposes, assets received and shares issued by the Hillman Value Fund were recorded at fair value; however, the cost basis of the investments received from the Predecessor Fund was carried forward to align ongoing reporting of the Hillman Value Fund’s realized and unrealized gains and losses with amounts distributable to shareholders for tax purposes. Immediately prior to the reorganization, the net assets of the Predecessor Fund were $168,935,617, including $20,066,955 of net unrealized appreciation, $1,349,744 of net investment income, and $10,192,610 of net realized gain.
2. SIGNIFICANT ACCOUNTING POLICIES
The accompanying financial statements were prepared in accordance with accounting principles generally accepted in the United States of America for investment companies (“U.S. GAAP”). The Fund is considered an investment company under U.S. GAAP and follows the accounting and reporting guidance applicable to investment companies in the Financial Accounting Standards Board (“FASB”) Accounting Standards Codification Topic 946. The preparation of financial statements in conformity with U.S. GAAP requires management to make certain estimates and assumptions that affect the reported amounts of assets and liabilities and disclosures of contingent assets and liabilities at the date of the financial statements and the reported amounts of increases and decreases in net assets from operations during the period. Actual results could differ from those estimates. The following is a summary of significant accounting policies consistently followed by the Fund in preparation of its financial statements.
Investment Valuation: The Fund generally values its securities based on market prices determined at the close of regular trading on the New York Stock Exchange (“NYSE”), normally 4:00 p.m. Eastern Time, on each day the NYSE is open for trading.
| Annual Report | September 30, 2021 | 17 |
| Hillman Value Fund | Notes to Financial Statements |
September 30, 2021
For equity securities and mutual funds that are traded on an exchange, the market price is usually the closing sale or official closing price on that exchange. In the case of equity securities not traded on an exchange, or if such closing prices are not otherwise available, the securities are valued at the mean of the most recent bid and ask prices on such day.
Options are valued at the National Best Bid and Offer (“NBBO”) last trade as of the valuation time. Options will be valued on the basis of prices provided by pricing services when such prices are reasonably believed to reflect the market value of such options and may include the use of composite or NBBO pricing information provided by the pricing services. Prior to March 15, 2021 the Fund valued options at the mean of the last quoted bid and ask prices as of the valuation time.
Redeemable securities issued by open-end registered investment companies are valued at the investment company’s applicable net asset value (“NAV”). Money market funds, representing short- term investments, are valued at their NAV.
When such prices or quotations are not available, or when the Fair Value Committee appointed by the Board believes that they are unreliable, securities may be priced using fair value procedures approved by the Board.
Fair Value Measurements: The Fund discloses the classification of its fair value measurements following a three-tier hierarchy based on the inputs used to measure fair value. Inputs refer broadly to the assumptions that market participants would use in pricing the asset or liability, including assumptions about risk. Inputs may be observable or unobservable. Observable inputs reflect the assumptions market participants would use in pricing the asset or liability that are developed based on market data obtained from sources independent of the reporting entity. Unobservable inputs reflect the reporting entity’s own assumptions about the assumptions market participants would use in pricing the asset or liability that are developed based on the best information available.
Various inputs are used in determining the value of the Fund’s investments as of the end of the reporting period. When inputs used fall into different levels of the fair value hierarchy, the level in the hierarchy within which the fair value measurement falls is determined based on the lowest level input that is significant to the fair value measurement in its entirety. The designated input levels are not necessarily an indication of the risk or liquidity associated with these investments. These inputs are categorized in the following hierarchy under applicable financial accounting standards:
| Level 1 – | Unadjusted quoted prices in active markets for identical investments, unrestricted assets or liabilities that the Fund has the ability to access at the measurement date; |
| Level 2 – | Quoted prices which are not active, quoted prices for similar assets or liabilities in active markets or inputs other than quoted prices that are observable (either directly or indirectly); and |
| Level 3 – | Significant unobservable prices or inputs (including the Fund’s own assumptions in determining the fair value of investments) where there is little or no market activity for the asset or liability at the measurement date. |
| 18 | www.hcmfunds.com |
| Hillman Value Fund | Notes to Financial Statements |
September 30, 2021
The following is a summary of the inputs used to value the Fund’s investments as of September 30, 2021:
HILLMAN VALUE FUND
| Investments in Securities at Value* | Level 1 - Unadjusted Quoted Prices | Level 2 - Other Significant Observable Inputs | Level 3 - Significant Unobservable Inputs | Total | ||||||||||||
| Common Stock | ||||||||||||||||
| Communication Services | $ | 32,557,556 | $ | – | $ | – | $ | 32,557,556 | ||||||||
| Consumer Discretionary | 13,246,584 | – | – | 13,246,584 | ||||||||||||
| Consumer Staples | 20,261,020 | – | – | 20,261,020 | ||||||||||||
| Energy | 6,352,560 | – | – | 6,352,560 | ||||||||||||
| Financials | 14,088,270 | – | – | 14,088,270 | ||||||||||||
| Health Care | 42,799,218 | – | – | 42,799,218 | ||||||||||||
| Industrials | 26,960,785 | – | – | 26,960,785 | ||||||||||||
| Information Technology | 12,008,256 | – | – | 12,008,256 | ||||||||||||
| Materials | 12,680,720 | – | – | 12,680,720 | ||||||||||||
| Limited Partnership Energy | 19,241,500 | – | – | 19,241,500 | ||||||||||||
| Real Estate Investment Trust Real Estate | 6,498,500 | – | – | 6,498,500 | ||||||||||||
| Total | $ | 206,694,969 | $ | – | $ | – | $ | 206,694,969 | ||||||||
| Valuation Inputs | ||||||||||||||||
| Other Financial Instruments | Level 1 | Level 2 | Level 3 | Total | ||||||||||||
| Liabilities | ||||||||||||||||
| Written Option Contracts | $ | (363,900 | ) | $ | – | $ | – | $ | (363,900 | ) | ||||||
| Total | $ | (363,900 | ) | $ | – | $ | – | $ | (363,900 | ) | ||||||
| * | For a detailed breakout by sector, please refer to the Portfolio of Investments. |
The Fund did not hold any level 3 securities during the year.
Cash & Cash Equivalents: The Fund considers its investment in a Federal Deposit Insurance Corporation (“FDIC”) insured interest bearing account to be cash and cash equivalents. Cash and cash equivalents are valued at cost plus any accrued interest. The Fund maintains cash balances, which, at times may exceed federally insured limits. The Fund maintains these balances with a high-quality financial institution.
Concentration of Credit Risk: The Fund places its cash with a banking institution, which is insured by FDIC. The FDIC limit is $250,000. At various times throughout the year, the amount on deposit may exceed the FDIC limit and subject the Fund to a credit risk. The Fund does not believe that such deposits are subject to any unusual risk associated with investment activities.
| Annual Report | September 30, 2021 | 19 |
| Hillman Value Fund | Notes to Financial Statements |
September 30, 2021
Trust Expenses: Some expenses of the Trust can be directly attributed to a fund. Expenses that cannot be directly attributed to a fund are apportioned among all funds in the Trust based on average net assets of each fund, including Trustees’ fees and expenses.
Federal Income Taxes: The Fund complies with the requirements under Subchapter M of the Internal Revenue Code of 1986, as amended, applicable to regulated investment companies and intends to distribute substantially all of its net taxable income and net capital gains, if any, each year so that it will not be subject to excise tax on undistributed income and gains. The Fund is not subject to income taxes to the extent such distributions are made.
As of and during the year ended September 30, 2021, the Fund did not have a liability for any unrecognized tax benefits in the accompanying financial statements. The Fund recognizes interest and penalties, if any, related to tax liabilities as income tax expense in the Statement of Operations. The Fund files U.S. federal, state and local income tax returns as required. The Fund’s tax returns are subject to examination by the relevant tax authorities until expiration of the applicable statute of limitations, which is generally three years after the filing of the tax return for federal purposes and four years for most state returns. The Fund’s administrator has analyzed the Fund’s tax positions taken on federal and state income tax returns for all open tax years and has concluded that as of September 30, 2021, no provision for income tax is required in the Fund’s financial statements related to these tax positions.
Investment Transactions and Investment Income: Investment transactions are accounted for on the date the investments are purchased or sold (trade date basis for financial reporting purposes). Realized gains and losses from investment transactions are reported on a first in first out basis. Interest income, which includes accretion of discounts and amortization of premiums, is accrued and recorded as earned using the effective yield method. Dividend income is recognized on the ex-dividend date, or for certain foreign securities, as soon as information is available to the Fund. Withholding taxes on foreign dividends are paid (a portion of which may be reclaimable) or provided for in accordance with the applicable country’s tax rules and rates and are disclosed in the Statement of Operations.
Distributions to Shareholders: The Fund normally pay dividends, if any, and distribute capital gains, if any, on an annual basis. Income dividend distributions are derived from interest, dividends and other income the Fund receives from their investments, including short-term capital gains. Long-term capital gain distributions are derived from gains realized when the Fund sells a security it has owned for more than one year. The Fund may make additional distributions and dividends at other times if its portfolio manager or managers believe doing so may be necessary for the Fund to avoid or reduce taxes. Net investment income/(loss) and net realized gain/(loss) may differ for financial statement and tax purposes.
COVID-19 Risk: An outbreak of respiratory disease caused by a novel coronavirus was first detected in December 2019 and has now spread internationally. This coronavirus has resulted in closing borders, enhanced health screenings, partial population vaccination, healthcare service preparation and delivery, quarantines, cancellations, disruptions to supply chains and customer activity, government sponsored fiscal stimulus programs, various moratoria on the applicability of certain laws and regulations, as well as general concern and uncertainty. The impact of this coronavirus, (and the variants of such virus) and other epidemics and pandemics that may arise in the future, could affect the economies of many nations, individual companies, their securities (including equity and debt), and the market in general in ways that cannot necessarily be foreseen at the present time. In addition, the impact of infectious diseases in developing or emerging market countries may be greater due to less established health care systems. Health crises caused by the recent coronavirus outbreak may exacerbate other pre-existing political, social, financial, and economic risks in certain countries. The impact of the outbreak may last for an extended period of time.
| 20 | www.hcmfunds.com |
| Hillman Value Fund | Notes to Financial Statements |
September 30, 2021
3. DERIVATIVE INSTRUMENTS
The Fund may invest in derivative financial instruments (derivatives) in order to manage risk or gain exposure to various other investments or markets. Derivatives may contain various risks including the potential inability of the counterparty to fulfill their obligations under the terms of the contract, the potential for an illiquid secondary market, and the potential for market movements which may expose the Fund to gains or losses in excess of the amounts shown on the Statement of Assets and Liabilities.
Risk of Investing in Derivatives: The Fund’s use of derivatives can result in losses due to unanticipated changes in the market risk factors and the overall market. In instances where the Fund is using derivatives to decrease, or hedge, exposures to market risk factors for securities held by the Fund, there are also risks that those derivatives may not perform as expected resulting in losses for the combined or hedged positions.
Derivatives may have little or no initial cash investment relative to their market value exposure and therefore can produce significant gains or losses in excess of their cost. This use of embedded leverage allows the Fund to increase its market value exposure relative to its net assets and can substantially increase the volatility of the Fund’s performance.
Additional associated risks from investing in derivatives also exist and potentially could have significant effects on the valuation of the derivative and the Fund. Typically, the associated risks are not the risks that the Fund are attempting to increase or decrease exposure to, per its investment objectives, but are the additional risks from investing in derivatives.
Examples of these associated risks are liquidity risk, which is the risk that the Fund will not be able to sell or close out the derivative in a timely manner, and counterparty credit risk, which is the risk that the counterparty will not fulfill its obligation to the Fund. In addition, use of derivatives may increase or decrease exposure to the following risk factors:
Equity Risk: Equity risk relates to the change in value of equity securities as they relate to increases or decreases in the general market. Associated risks can be different for each type of derivative.
Option Contracts: The Fund may enter into options transactions for hedging purposes and for nonhedging purposes such as seeking to enhance return. The Fund may write covered put and call options on any stocks or stock indices, currencies traded on domestic and foreign securities exchanges, or futures contracts on stock indices, interest rates and currencies traded on domestic and, to the extent permitted by the U.S. Commodity Futures Trading Commission, foreign exchanges. A call option on an asset written by a Fund obligates the Fund to sell the specified asset to the holder (purchaser) at a stated price (the exercise price) if the option is exercised before a specified date (the expiration date). A put option on an asset written by a Fund obligates the Fund to buy the specified asset from the purchaser at the exercise price if the option is exercised before the expiration date. Premiums received when writing options are recorded as liabilities and are subsequently adjusted to the current value of the options written. Premiums received from writing options that expire are treated as realized gains. Premiums received from writing options, which are either exercised or closed, are offset against the proceeds received or amount paid on the transaction to determine realized gains or losses.
| Annual Report | September 30, 2021 | 21 |
| Hillman Value Fund | Notes to Financial Statements |
September 30, 2021
Purchased Options: When the Fund purchases an option, an amount equal to the premium paid by the Fund is recorded as an investment and is subsequently adjusted to the current value of the option purchased. If an option expires on the stipulated expiration date or if the Fund enters into a closing sale transaction, a gain or loss is realized. If a call option is exercised, the cost of the security acquired is increased by the premium paid for the call. If a put option is exercised, a gain or loss is realized from the sale of the underlying security, and the proceeds from such sale are decreased by the premium originally paid. Purchased options are non-income producing securities.
Written Options: When the Fund writes an option, an amount equal to the premium received by the Fund is recorded as a liability and is subsequently adjusted to the current value of the option written. Premiums received from writing options that expire unexercised are treated by the Fund on the expiration date as realized gain from written options. The difference between the premium and the amount paid on effecting a closing purchase transaction, including brokerage commissions, is also treated as a realized gain, or if the premium is less than the amount paid for the closing purchase transaction, as a realized loss. If a call option is exercised, the premium is added to the proceeds from the sale of the underlying security in determining whether the Fund has realized a gain or loss. If a put option is exercised, the premium reduces the cost basis of the securities purchased by the Fund. The Fund, as a writer of an option, bears the market risk of an unfavorable change in the price of the security underlying the written option.
The average notional amount of the written options held for the year ended September 30, 2021 was $8,854,604.
Derivative Instruments: The following table disclose the amounts related to the Fund’s use of derivative instruments.
| 22 | www.hcmfunds.com |
| Hillman Value Fund | Notes to Financial Statements |
September 30, 2021
The effect of derivative instruments on the Statement of Assets and Liabilities as of September 30, 2021:
| Risk Exposure | Statement of Assets and Liabilities Location | Fair Value of Asset Derivatives | Statement of Assets and Liabilities Location | Fair Value of Liability Derivatives | ||||||||
| Hillman Value Fund | ||||||||||||
| Equity Contracts (Written Options) | Investments, at value | $ | – | Options written, at value | $ | 363,900 | ||||||
| $ | – | $ | 363,900 | |||||||||
The effect of derivative instruments on the Statement of Operations for the year ended September 30, 2021:
| Risk Exposure | Statement of Operations Location | Realized Gain/(Loss) on Derivatives Recognized in Income | Change in Unrealized Gain/(Loss) on Derivatives Recognized in Income | |||||||
| Hillman Value Fund | ||||||||||
| Equity Contracts (Written Options) | Net realized gain/(loss) on written option contracts/Net change in unrealized depreciation on written option contracts | $ | 1,736,223 | $ | 145,397 | |||||
| Total | – | $ | 1,736,223 | $ | 145,397 | |||||
4. TAX BASIS INFORMATION
Tax Basis of Distributions to Shareholders: The character of distributions made during the period from net investment income or net realized gains may differ from its ultimate characterization for federal income tax purposes. Also, due to the timing of dividend distributions, the fiscal year in which amounts are distributed may differ from the fiscal year in which the income or realized gain were recorded by the Fund. The amounts and characteristics of tax basis distributions are estimated at the time of distribution and composition of distributable earnings/(accumulated losses) are finalized at fiscal year-end.
| Annual Report | September 30, 2021 | 23 |
| Hillman Value Fund | Notes to Financial Statements |
September 30, 2021
The tax character of distributions paid by the Fund for the fiscal year ended September 30, 2021 was as follows:
| Ordinary Income | Long-Term Capital Gains | |||||||
| Hillman Value Fund | $ | 5,752,130 | $ | 5,039,999 | ||||
The tax character of distributions paid by the Predecessor Fund for the fiscal year ended September 30, 2020, were as follows:
| Ordinary Income | Long-Term Capital Gains | |||||||
| Hillman Value Fund | $ | 1,505,998 | $ | 1,520,000 | ||||
Unrealized Appreciation and Depreciation on Investments: As of September 30, 2021, the aggregate costs of investments, gross unrealized appreciation/(depreciation) and net unrealized appreciation for Federal tax purposes were as follows:
| Hillman Value Fund | ||||
| Gross unrealized appreciation (excess of value over tax cost) | $ | 30,462,309 | ||
| Gross unrealized depreciation (excess of tax cost over value) | (9,236,971 | ) | ||
| Net unrealized appreciation | $ | 21,225,338 | ||
| Cost of investments for income tax purposes | $ | 185,578,249 | ||
These temporary differences are primarily attributed to partnerships.
Reclassifications: For the fiscal year ended September 30, 2021, the Fund did not have any reclassifications.
| 24 | www.hcmfunds.com |
| Hillman Value Fund | Notes to Financial Statements |
September 30, 2021
Components of Distributable Earnings: At September 31, 2021, components of distributable earnings were as follows:
| Undistributed ordinary income | $ | 13,140,859 | ||
| Accumulated capital gains | 6,213,600 | |||
| Net unrealized appreciation | 21,225,338 | |||
| Total | $ | 40,579,797 |
5. SECURITIES TRANSACTIONS
Purchases and sales of securities, excluding short-term securities, during the year ended September 30, 2021 were as follows:
| Purchases of Securities | Proceeds from Sales of Securities | |||||||
| Hillman Value Fund | $ | 107,014,811 | $ | 43,252,623 | ||||
6. BENEFICIAL SHARE TRANSACTIONS
The capitalization of the Trust consists of an unlimited number of shares of beneficial interest with no par value per share. Holders of the shares of the Fund have one vote for each share held and a proportionate fraction of a vote for each fractional share. All shares issued and outstanding are fully paid and are transferable and redeemable at the option of the shareholder. Shares have no pre-emptive rights. Neither the Fund nor any of its creditors has the right to require shareholders to pay any additional amounts solely because the shareholder owns the shares.
Transactions in common shares were as follows:
| For the Year Ended September 30, 2021 | For the Year Ended September 30, 2020 | |||||||
| Hillman Value Fund | ||||||||
| Shares sold | 3,333,444 | 2,998,324 | ||||||
| Shares issued in reinvestment of distributions to shareholders | 362,184 | 102,466 | ||||||
| Shares redeemed | (1,369,874 | ) | (1,302,740 | ) | ||||
| Net increase in shares outstanding | 2,325,754 | 1,798,050 | ||||||
Control is defined by the 1940 Act as the beneficial ownership, either directly or through one or more controlled companies, of more than 25% of the voting securities of a company. Approximately 74% of the outstanding shares of the Fund are owned by two omnibus accounts.
| Annual Report | September 30, 2021 | 25 |
| Hillman Value Fund | Notes to Financial Statements |
September 30, 2021
7. MANAGEMENT AND RELATED PARTY TRANSACTIONS
Investment Advisory: Hillman Capital Management, Inc. (the “Adviser”), subject to the authority of the Board, is responsible for the overall management and administration of the Fund’s business affairs. The Adviser manages the investments of the Fund in accordance with the Fund’s investment objective, policies and limitations, and investment guidelines established jointly by the Adviser and the Board.
Pursuant to the Investment Advisory Agreement (the “Advisory Agreement”) with the Adviser, the Fund pays the Adviser an annual management fee of 0.85% based on the Fund’s average daily net assets. The management fees are paid on a monthly basis. The Board may extend the Advisory Agreements for successive one year terms. The Board and shareholders of the Fund may terminate the Advisory Agreement upon 60 days’ written notice. The Adviser may terminate the Advisory Agreement upon 120 days’ written notice.
Pursuant to a fee waiver letter agreement (the “Fee Waiver Agreement”), the Adviser has contractually agreed to limit the amount of the Total Annual Fund Operating Expenses, to waive or limit its fees and to assume other expenses so that the total annual operating expenses of the Fund (exclusive of (i) any front-end or contingent deferred loads; (ii) brokerage fees and commissions, (iii) acquired fund fees and expenses; (iv) fees and expenses associated with investments in other collective investment vehicles or derivative instruments (including for example option and swap fees and expenses); (v) borrowing costs (such as interest and dividend expense on securities sold short); (vi) taxes; and (vii) extraordinary expenses, such as litigation expenses (which may include indemnification of Fund officers and Trustees and contractual indemnification of Fund service providers (other than the Advisor))), and other expenses not incurred in the ordinary course of business, to 0.95% of the Fund’s average daily net assets. The Fee Waiver Agreement is in effect through March 15, 2022, and will thereafter continue in effect for successive twelve-month periods provided that such continuance is specifically approved at least annually by the Board and the Adviser does not provide at least 30 days written notice of non-continuance prior to the end of the then effective term. The Adviser may not discontinue this waiver without the approval by the Trust’s Board. Fees waived or reimbursed for the year ended September 30, 2021, are disclosed in the Statement of Operations. Previously waived fees are not subject to recoupment by the Adviser.
Prior to March 15, 2021, Hillman Capital Management, Inc. served as the investment adviser to the Predecessor Fund pursuant to a prior investment advisory agreement between the Hillman Capital Management Investment Trust and Hillman Capital Management, Inc. under which Hillman Capital Management, Inc. was entitled to receive an annual fee of 0.85%, computed daily and paid monthly. Hillman Capital Management, Inc. had contractually agreed to waive Its fees and/or reimburse certain funds should the Fund’s operating expenses (to waive or limit its fees and to assume other expenses so that the total annual operating expenses of the Fund (exclusive of (i) any front-end or contingent deferred loads; (ii) brokerage fees and commissions, (iii) acquired fund fees and expenses; (iv) fees and expenses associated with investments in other collective investment vehicles or derivative instruments (including for example option and swap fees and expenses); (v) borrowing costs (such as interest and dividend expense on securities sold short); (vi) taxes; and (vii) extraordinary expenses, such as litigation expenses (which may include indemnification of Fund officers and Trustees and contractual indemnification of Fund service providers (other than the Advisor))), and other expenses not incurred in the ordinary course of business), exceed an annual limitation of 0.95% of the Fund’s average daily net assets.
| 26 | www.hcmfunds.com |
| Hillman Value Fund | Notes to Financial Statements |
September 30, 2021
Administrator: Effective March 15, 2021, ALPS Fund Services, Inc. (“ALPS”) (an affiliate of ALPS Distributors, Inc.) serves as administrator to the Fund. The Fund has agreed to pay expenses incurred in connection with its administrative activities. Pursuant to the Services Agreement with the Trust, ALPS will provide operational services to the Fund including, but not limited to, fund accounting and fund administration, and will generally assist in the Fund’s operations. The Fund’s administration fee is accrued on a daily basis and paid monthly. The officers of the Trust are employees of ALPS. Administration fees paid by the Fund for the year ended September 30, 2021, are disclosed in the Statement of Operations. ALPS is reimbursed by the Fund for certain out of pocket expenses. For the period March 15, 2021 through September 30, 2021, the Fund incurred Fund Administration and Accounting fees of $71,166, relating to services provided by ALPS.
Prior to March 15, 2021, The Nottingham Company provided certain administrative and fund accounting services necessary for the Fund’s operations. The Fund was charged a fee for the services provided. For the period October 1, 2020 through March 12, 2021, the Predecessor Fund incurred Fund Administration and Accounting fees of $81,684, relating to services provided by The Nottingham Company. Prior to March 15, 2021, Officers of the Predecessor Fund were employees of The Nottingham Company.
Transfer Agent: Effective March 15, 2021, ALPS serves as transfer agent for the Fund under a Services Agreement with the Trust. Under this agreement, ALPS is paid an annual fee for services performed on behalf of the Fund plus fees for open accounts and is reimbursed for certain out-of-pocket expenses. For the period March 15, 2021 through September 30, 2021, the Fund incurred Transfer Agent fees of $129,868, relating to services provided by ALPS.
Prior to March 15, 2021, NC Shareholder Services, LLC served as the Fund’s transfer agent pursuant to a prior Transfer Agency and Services Agreement with the Predecessor Fund. For the period October 1, 2020 through March 12, 2021, the Predecessor Fund incurred Transfer Agent fees of $15,613, relating to services provided by NC Shareholder Services, LLC.
Compliance Services: Effective March 15, 2021, ALPS provides Chief Compliance Officer services to the Fund to monitor and test the policies and procedures of each Fund in conjunction with requirements under Rule 38a-1 of the 1940 Act pursuant to a Services Agreement with the Trust. Under this agreement, ALPS is paid an annual fee for services performed on behalf of the Fund and is reimbursed for certain out-of-pocket expenses. For the period March 15, 2021 through September 30, 2021, the Fund incurred Chief Compliance Officer fees of $8,983, relating to services provided by ALPS.
Prior to March 15, 2021, The Nottingham Company provided certain compliance services including services as the Predecessor Fund’s Chief Compliance Officer. For the period October 1, 2020 through March 14, 2021, the Predecessor Fund incurred Fund Compliance fees of $5,775, relating to services provided by The Nottingham Company.
Distribution: Effective March 15, 2021, ALPS Distributors, Inc. (the “Distributor”) (an affiliate of ALPS) acts as the principal underwriter of the Fund’s shares pursuant to a Distribution Agreement with the Trust. Shares of the Fund are offered on a continuous basis through the Distributor, as agent of the Fund. The Distributor is not obligated to sell any particular amount of shares and is not entitled to any compensation for its services as the Fund’s principal underwriter pursuant to the Distribution Agreement.
| Annual Report | September 30, 2021 | 27 |
| Hillman Value Fund | Notes to Financial Statements |
September 30, 2021
Prior to March 15, 2021, pursuant to a prior agreement with the Predecessor Fund, Capital Investment Group, Inc. served as the Fund’s principal underwriter distributor pursuant to a prior Distributor Agreement with the Predecessor Trust.
8. TRUSTEES
As of September 30, 2021, there were four Trustees, three of whom are not “interested persons” (as defined in the 1940 Act) of the Trust (the “Independent Trustees”). The Independent Trustees of the Trust and Interested Trustees who are not currently employed by the Adviser, ALPS or other service providers will receive a quarterly retainer of $13,500, plus $4,000 for each regular Board or Committee meeting attended and $2,000 for each special telephonic or in-person Board or Committee meeting attended. Additionally, the Audit Committee Chair receives a quarterly retainer of $1,250 and the Independent Chair receives a quarterly retainer of $3,250. The Independent Trustees and Interested Trustees who are not currently employed by the Adviser, ALPS or other service providers are also reimbursed for all reasonable out-of-pocket expenses relating to attendance at meetings. Officers of the Trust receive no salary or fees from the Trust. As discussed in Note 7, the Fund pays ALPS an annual fee for compliance services.
9. INDEMNIFICATIONS
Under the Trust’s organizational documents, its officers and Trustees are indemnified against certain liabilities arising out of the performance of their duties to the Trust. Additionally, in the normal course of business, the Trust enters into contracts with service providers that may contain general indemnification clauses which may permit indemnification to the extent permissible under applicable law. The Trust’s maximum exposure under these arrangements is unknown; as such exposure would involve future claims that may be made against the Trust that have not yet occurred.
10. SUBSEQUENT EVENTS
Subsequent events after the date of the Statement of Assets and Liabilities have been evaluated through the date the financial statements were issued. Management has determined that there were no subsequent events to report through the issuance of these financial statements.
| 28 | www.hcmfunds.com |
| Hillman Value Fund | Report of Independent Registered Accounting Firm |
To the Shareholders of Hillman Value Fund and
Board of Trustees of ALPS series Trust
Opinion on the Financial Statements
We have audited the accompanying statement of assets and liabilities, including the portfolio of investments, of Hillman Value Fund (the “Fund”), a series of ALPS Series Trust, as of September 30, 2021, and the related statements of operations and changes in net assets, the related notes, and the financial highlights for the year then ended (collectively referred to as the “financial statements”). In our opinion, the financial statements present fairly, in all material respects, the financial position of the Fund as of September 30, 2021, the results of its operations, the changes in its net assets, and the financial highlights for the year then ended, in conformity with accounting principles generally accepted in the United States of America.
The Fund’s financial statements and financial highlights for the years ended September 30, 2020, and prior, were audited by other auditors whose report dated November 23, 2020, expressed an unqualified opinion on those financial statements and financial highlights.
Basis for Opinion
These financial statements are the responsibility of the Fund’s management. Our responsibility is to express an opinion on the Fund’s financial statements based on our audit. We are a public accounting firm registered with the Public Company Accounting Oversight Board (United States) (“PCAOB”) and are required to be independent with respect to the Fund in accordance with the U.S. federal securities laws and the applicable rules and regulations of the Securities and Exchange Commission and the PCAOB.
We conducted our audit in accordance with the standards of the PCAOB. Those standards require that we plan and perform the audit to obtain reasonable assurance about whether the financial statements are free of material misstatement whether due to error or fraud.
Our audit included performing procedures to assess the risks of material misstatement of the financial statements, whether due to error or fraud, and performing procedures that respond to those risks. Such procedures included examining, on a test basis, evidence regarding the amounts and disclosures in the financial statements. Our procedures included confirmation of securities owned as of September 30, 2021, by correspondence with the custodian and brokers. Our audit also included evaluating the accounting principles used and significant estimates made by management, as well as evaluating the overall presentation of the financial statements. We believe that our audit provides a reasonable basis for our opinion.
We have served as the Fund’s auditor since 2021.

COHEN & COMPANY, LTD.
Cleveland, Ohio
November 29, 2021
| Annual Report | September 30, 2021 | 29 |
| Hillman Value Fund | Additional Information |
September 30, 2021 (Unaudited)
1. PROXY VOTING POLICIES AND VOTING RECORD
A description of the policies and procedures that the Fund uses to determine how to vote proxies relating to portfolio securities is available without charge, upon request, (i) by calling the Fund (toll-free) at 1-855-400-5944 or (ii) on the website of the Securities and Exchange Commission (the “SEC”) at http://www.sec.gov.
Information regarding how the Fund voted proxies relating to portfolio securities during the most recent 12-month period ended June 30 is available (i) without charge, upon request, by calling the Funds (toll-free) at 1-855-400-5944 or (ii) on the SEC’s website at http://www.sec.gov.
2. PORTFOLIO HOLDINGS
The Fund’s portfolio holdings are made available semi-annually in shareholder reports within 60 days after the close of the period for which the report is being made, as required by federal securities laws. The Fund files its complete schedule of portfolio holdings with the SEC for the first and third fiscal quarters of each fiscal year as an exhibit to its reports on Form N-PORT. The Fund’s Form N-PORT reports are available on the SEC’s website at www.sec.gov. The Fund’s portfolio holdings are also available upon request, without charge, by calling (toll-free) 1-855-400-5944 or by writing to the Fund at Hillman Value Fund, P.O. Box 1920, Denver, CO 80201.
3. SHAREHOLDER PROXY RESULTS
At a Special Meeting of Shareholders of the ALPS Series Trust, held on April 12, 2021, shareholders of record as of the close of business on March 1, 2021 voted to approve the following proposals: Proposal 1: To elect Ward D. Armstrong to serve on the Board of Trustees until his resignation, retirement, death or removal or until his successor is duly elected and qualified.
| Shares Voted In Favor | Shares Voted Against or Abstentions |
| 162,259,659 | 244,729 |
Proposal 2: To elect Bradley J. Swenson to serve on the Board of Trustees until his resignation, retirement, death or removal or until his successor is duly elected and qualified.
| Shares Voted In Favor | Shares Voted Against or Abstentions |
| 162,281,980 | 222,408 |
4. TAX DESIGNATIONS
For the year ended September 30, 2021, pursuant to Section 852(b)(3) of the Internal Revenue Code, Hillman Value Fund did designate $5,039,999 as long-term capital gain dividends.
| 30 | www.hcmfunds.com |
| Hillman Value Fund | Liquidity Risk Management Program |
September 30, 2021 (Unaudited)
The ALPS Series Trust (the “Trust”) has established a liquidity risk management program (the “Program”) to govern the Trust’s approach to managing liquidity risk for each fund in the series (each a “Fund”). The Program is overseen by the Liquidity Committee (the “Committee”), a committee comprised of representatives of the Trust and ALPS | SS&C. The Trust’s Board of Trustees (the “Board”) has approved the designation of the Committee to oversee the Program.
The Program’s principal objectives include supporting each Fund’s compliance with limits on investments in illiquid assets and mitigating the risk that a Fund will be unable to meet its redemption obligations in a timely manner. The Program also includes a number of elements that support the management and assessment of liquidity risk, including, among others, an annual assessment of factors that influence a Fund’s liquidity the periodic classification and re-classification of the Fund’s investments into groupings that reflect the Committee’s assessment of their relative liquidity under both current market conditions and reasonably foreseeable stressed conditions, as well as minimum levels of highly liquid investments.
At a meeting that occurred on May 20, 2021, the Board received a report from the Committee that addressed the operation of the Program and assessed its adequacy and effectiveness of implementation. The report revealed that, during the period covered by the report, there were no liquidity events that impacted the Funds or their ability to timely meet redemptions without dilution to existing shareholders. The report further discussed the liquidity classification methodology of each Fund, the effectiveness of the operation of certain Funds’ Highly Liquid Investment Minimum (“HLIM”) where applicable, and the liquidity classification of each Fund’s investments over the period. The report further noted that no material changes have been made to the Program since its implementation. The report provided to the Board included a conclusion that the Program appeared to be reasonably designed and operated effectively during the review period.
| Annual Report | September 30, 2021 | 31 |
| Hillman Value Fund | Privacy Policy |
September 30, 2021 (Unaudited)
| FACTS | WHAT DOES THE FUND DO WITH YOUR PERSONAL INFORMATION? |
| WHY? | Financial companies choose how they share your personal information. Federal law gives consumers the right to limit some but not all sharing. Federal law also requires us to tell you how we collect, share and protect your personal information. Please read this notice carefully to understand what we do. |
| WHAT? | The types of personal information we collect and share depend on the product or service you have with us. This information can include: · Social Security number and account transactions · Account balances and transaction history · Wire transfer instructions |
| HOW? | All financial companies need to share customers’ personal information to run their everyday business. In the section below, we list the reasons financial companies can share their customers’ personal information, the reasons a Fund chooses to share, and whether you can limit this sharing. |
| REASONS WE CAN SHARE YOUR PERSONAL INFORMATION | DO THE FUNDS SHARE? | CAN YOU LIMIT THIS SHARING? |
For our everyday business purposes – such as to process your transactions, maintain your account(s), respond to court orders and legal investigations, or report to credit bureaus | Yes | No |
For our marketing purposes – to offer our products and services to you | No | We do not share. |
| For joint marketing with other financial companies | No | We do not share. |
For our affiliates’ everyday business purposes – information about your transactions and experiences | Yes | No |
For our affiliates’ everyday business purposes – information about your creditworthiness | No | We do not share. |
| For non-affiliates to market to you | No | We do not share. |
| QUESTIONS? | Call 1-855-400-5944. |
| 32 | www.hcmfunds.com |
| Hillman Value Fund | Privacy Policy |
September 30, 2021 (Unaudited)
| WHO WE ARE | |
| Who is providing this notice? | Hillman Value Fund (the “Fund”) |
| WHAT WE DO | |
| How does the Fund protect my personal information? | To protect your personal information from unauthorized access and use, we use security measures that comply with federal law. These measures include computer safeguards and secured files and buildings. |
| How does the Fund collect my personal information? | We collect your personal information, for example, when you · open an account · provide account information or give us your contact information · make a wire transfer or deposit money |
| Why can’t I limit all sharing? | Federal law gives you the right to limit only · sharing for affiliates’ everyday business purposes-information about your creditworthiness · affiliates from using your information to market to you · sharing for non-affiliates to market to you
State laws and individual companies may give you additional rights to limit sharing. |
| DEFINITIONS | |
| Affiliates | Companies related by common ownership or control. They can be financial and nonfinancial companies. |
| Non-affiliates | Companies not related by common ownership or control. They can be financial and nonfinancial companies. |
| · The Fund does not share with non-affiliates so they can market to you. | |
| Joint marketing | A formal agreement between non-affiliated financial companies that together market financial products or services to you. |
| · The Fund does not jointly market. |
| Annual Report | September 30, 2021 | 33 |
| Hillman Value Fund | Privacy Policy |
September 30, 2021 (Unaudited)
| OTHER IMPORTANT INFORMATION | |
| California Residents | If your account has a California home address, your personal information will not be disclosed to nonaffiliated third parties except as permitted by applicable California law, and we will limit sharing such personal information with our affiliates to comply with California privacy laws that apply to us. |
| 34 | www.hcmfunds.com |
| Hillman Value Fund | Trustees & Officers |
September 30, 2021 (Unaudited)
INDEPENDENT TRUSTEES
| Name, Birth Year & Address* | Position(s) Held with Fund | Term of Office and Length of Time Served** | Principal Occupation(s) During Past 5 Years*** | Number of Funds in Fund Complex Overseen by Trustee**** | Other Directorships Held by Trustee During Past 5 Years*** |
Ward D. Armstrong, Birth year: 1954 | Trustee and Chairman | Mr. Armstrong was appointed to the Board on May 27, 2016. Mr. Armstrong was appointed Chairman of the Board at the August 24, 2017 meeting of the Board of Trustees. | Mr. Armstrong is currently retired. From February 2010 to July 2015, he was Co- Founder and Managing Partner of NorthRock Partners, a private wealth advisory firm providing comprehensive wealth management and family office services to the high net-worth marketplace. Previously, he was Senior Vice President, Ameriprise Financial (1984 to 2007); Chairman of Ameriprise Trust Company (1996 to 2007) and President, American Express Institutional Asset Management (2002 to 2004). He has also served on several investment related Boards including Kenwood Capital Management, RiverSource Investments, American Express Asset Management International and was Chair of the Ordway Theatre Endowment Committee. | 11 | Mr. Armstrong is a Director of the Heartland Group, Inc. (3 funds). |
| * | All communications to Trustees and Officers may be directed to ALPS Series Trust c/o 1290 Broadway, Suite 1000, Denver, CO 80203. |
| ** | This is the period for which the Trustee or Officer began serving the Trust. Each Trustee serves an indefinite term, until such Trustee’s successor is elected and appointed, or such Trustee resigns or is deceased. Officers are elected on an annual basis. |
| *** | Except as otherwise indicated, each individual has held the office shown or other offices in the same company for the last five years. |
| **** | The Fund Complex currently consists of 11 series of the Trust. |
| Annual Report | September 30, 2021 | 35 |
| Hillman Value Fund | Trustees & Officers |
September 30, 2021 (Unaudited)
| Name, Birth Year & Address* | Position(s) Held with Fund | Term of Office and Length of Time Served** | Principal Occupation(s) During Past 5 Years*** | Number of Funds in Fund Complex Overseen by Trustee**** | Other Directorships Held by Trustee During Past 5 Years*** |
J. Wayne Hutchens, Birth year: 1944 | Trustee | Mr. Hutchens was elected to the Board on October 30, 2012. | Mr. Hutchens is currently retired. From 2000 to January 2020, he served as Trustee of the Denver Museum of Nature and Science and from May 2012 to February 2020, he served as Trustee of Children’s Hospital Colorado. From April 2006 to December 2012, he served as President and CEO of the University of Colorado (CU) Foundation and from April 2009 to December 2012, he was Executive Director of the CU Real Estate Foundation. Mr. Hutchens is also Director of AMG National Trust Bank (June 2012 to present). Prior to these positions, Mr. Hutchens spent 29 years in the banking industry, retiring as Chairman of Chase Bank Colorado. | 11 | Mr. Hutchens is a Director of RiverNorth Opportunities Fund, Inc. (2013 to present), RiverNorth Opportunistic Municipal Income Fund, Inc. (2018 to present), RiverNorth/Doubleline Strategic Opportunity Fund, Inc. (2018 to present), RiverNorth Specialty Finance Corporation (2018 to present), RiverNorth Managed Duration Municipal Income Fund, Inc. (2019 to present), RiverNorth Flexible Municipal Income Fund, Inc. (2020 to present). He is an Advisory Board member of RiverNorth Funds (3 funds) (2020 to present). |
| * | All communications to Trustees and Officers may be directed to ALPS Series Trust c/o 1290 Broadway, Suite 1000, Denver, CO 80203. |
| ** | This is the period for which the Trustee or Officer began serving the Trust. Each Trustee serves an indefinite term, until such Trustee’s successor is elected and appointed, or such Trustee resigns or is deceased. Officers are elected on an annual basis. |
| *** | Except as otherwise indicated, each individual has held the office shown or other offices in the same company for the last five years. |
| **** | The Fund Complex currently consists of 11 series of the Trust. |
| 36 | www.hcmfunds.com |
| Hillman Value Fund | Trustees & Officers |
September 30, 2021 (Unaudited)
| Name, Birth Year & Address* | Position(s) Held with Fund | Term of Office and Length of Time Served** | Principal Occupation(s) During Past 5 Years*** | Number of Funds in Fund Complex Overseen by Trustee**** | Other Directorships Held by Trustee During Past 5 Years*** |
Patrick Seese, Birth year: 1971 | Trustee | Mr. Seese was elected to the Board on October 30, 2012. | Mr. Seese is an owner and a Managing Director of Integris Partners, a middle-market investment banking firm serving closely-held companies, financial sponsors and public companies (February 2008 to present). Prior to this, Mr. Seese was a Managing Director of Headwaters MB, a middle-market investing banking firm (December 2003 to February 2008). Prior to that, Mr. Seese worked in Credit Suisse First Boston’s Mergers and Acquisitions Group and served as Head of Corporation Development, Katy Industries, a publicly traded industrial and consumer products company and at Deloitte & Touche LLP, where he began his career in 1994. | 11 | Mr. Seese is a Director of The Mile High Five Foundation (2013 to present) and SJ Panthers Foundation (2016 to present). |
Merrillyn J. Kosier, Birth year: 1959 | Trustee | Ms. Kosier was elected to the Board on November 17, 2021. | Ms. Kosier retired from Ariel Investments as Executive Vice President in 2019. During her tenure at Ariel Investments, she served as Chief Marketing Officer, Ariel Mutual Funds since 2007; Trustee for Ariel Investment Trust since 2003 and President of Ariel Distributors, LLC since 2002. From 2006 to present, she has served as Trustee at the Harris Theater For Music and Dance (not-for-profit organization) and is currently Executive Vice Chair. | 11 | Ms. Kosier is Board Director at the Arts Club of Chicago (2021 to present). |
| * | All communications to Trustees and Officers may be directed to ALPS Series Trust c/o 1290 Broadway, Suite 1000, Denver, CO 80203. |
| ** | This is the period for which the Trustee or Officer began serving the Trust. Each Trustee serves an indefinite term, until such Trustee’s successor is elected and appointed, or such Trustee resigns or is deceased. Officers are elected on an annual basis. |
| *** | Except as otherwise indicated, each individual has held the office shown or other offices in the same company for the last five years. |
| **** | The Fund Complex currently consists of 11 series of the Trust. |
| Annual Report| September 30, 2021 | 37 |
| Hillman Value Fund | Trustees & Officers |
September 30, 2021 (Unaudited)
INTERESTED TRUSTEE
| Name, Birth Year & Address* | Position(s) Held with Fund | Term of Office and Length of Time Served** | Principal Occupation(s) During Past 5 Years*** | Number of Funds in Fund Complex Overseen by Trustee**** | Other Directorships Held by Trustee During Past 5 Years*** |
Bradley J. Swenson, Birth year: 1972 | Trustee | Mr. Swenson was elected to the Board on April 12, 2021. | Mr. Swenson joined ALPS Fund Services, Inc. (“ALPS”) in 2004 and had served as its President since June 2019 until June 2021. In this role, he served as an officer to certain other closed- end and open-end investment companies. He previously served as the Chief Operating Officer of ALPS (2015-2019). Mr. Swenson also previously served as Chief Compliance Officer to ALPS, its affiliated entities, and to certain ETF, closed-end and open-end investment companies (2004-2015). | 11 | None |
| * | All communications to Trustees and Officers may be directed to ALPS Series Trust c/o 1290 Broadway, Suite 1000, Denver, CO 80203. |
| ** | This is the period for which the Trustee or Officer began serving the Trust. Each Trustee serves an indefinite term, until such Trustee’s successor is elected and appointed, or such Trustee resigns or is deceased. Officers are elected on an annual basis. |
| *** | Except as otherwise indicated, each individual has held the office shown or other offices in the same company for the last five years. |
| **** | The Fund Complex currently consists of 11 series of the Trust. |
| 38 | www.hcmfunds.com |
| Hillman Value Fund | Trustees & Officers |
September 30, 2021 (Unaudited)
OFFICERS
| Name, Birth Year & Address* | Position(s) Held with Fund | Term of Office and Length of Time Served** | Principal Occupation(s) During Past 5 Years*** |
Dawn Cotten Birth year: 1977 | President | Since June 2021 | Ms. Cotten joined ALPS in 2009 and is currently Senior Vice President of Fund Administration and Relationship Management of ALPS. She has served in that role since January 2020. Prior to that, Ms. Cotten served as Senior Vice President (2017-2020) and Vice President of ALPS Relationship Management (2013-2017). |
Erich Rettinger Birth year: 1985 | Treasurer | Since August 2020 | Mr. Rettinger joined ALPS in 2007 and is currently Vice President and Fund Controller of ALPS. He has served as Fund Controller of ALPS (since 2013) and Fund Accounting of ALPS (2013- 2017). He also served as Assistant Treasurer of the Trust (May 2019-August 2020). Mr. Rettinger is also Treasurer of the Clough Long/Short Equity Fund, Clough Global Opportunities Fund, Clough Global Dividend and Income Fund and Clough Global Equity Fund. Mr. Rettinger is also Assistant Treasurer of the Stone Harbor Investment Funds. |
Patrick Rogers+ Birth year: 1966 | Secretary | Since November 2021 | Mr. Rogers has served as Senior Legal Counsel of ALPS since September 2021 and previously served as Compliance Counsel for Mercer Advisors from 2018 to 2021 and Contract Attorney for CACI, Inc. from 2014 to 2018. |
Anne M. Berg Birth year: 1973 | Assistant Secretary | Since August 2018 | Ms. Berg joined ALPS as Senior Investment Company Act Paralegal in February 2017. Prior to joining ALPS, she was a Senior Legal Manager at Janus Capital Management LLC (2000-2017). |
Lucas D. Foss Birth year: 1977 | Chief Compliance Officer | Since January 2018 | Mr. Foss rejoined ALPS in November 2017 as Vice President and Deputy Chief Compliance Officer. Prior to his current role, Mr. Foss served as the Director of Compliance at Transamerica Asset Management (2015- 2017) and Deputy Chief Compliance Officer at ALPS (2012- 2015). Mr. Foss is also CCO of X-Square Balanced Fund, Goehring & Rozencwajg Investment Funds, Broadstone Real Estate Access Fund, Inc., Clough Global Funds; Clough Funds Trust; SPDR® S&P 500® ETF Trust, SPDR® Dow Jones® Industrial Average ETF Trust, SPDR® S&P MIDCAP 400® ETF Trust and 1WS Credit Income Fund. |
| Annual Report | September 30, 2021 | 39 |
| Hillman Value Fund | Trustees & Officers |
September 30, 2021 (Unaudited)
| * | All communications to Trustees and Officers may be directed to ALPS Series Trust c/o 1290 Broadway, Suite 1000, Denver, CO 80203. |
| ** | This is the period for which the Trustee or Officer began serving the Trust. Each Trustee serves an indefinite term, until such Trustee’s successor is elected and appointed, or such Trustee resigns or is deceased. Officers are elected on an annual basis. |
| *** | Except as otherwise indicated, each individual has held the office shown or other offices in the same company for the last five years. |
| **** | The Fund Complex currently consists of 11 series of the Trust. |
| + | Appointed November 18, 2021 |
Additional information about members of the Board of Trustees and officers of the Trust is available in the Statement of Additional Information and is available, without charge, upon request, by calling the Fund (toll-free) at 1-855-400-5944.
| 40 | www.hcmfunds.com |
Hillman Value Fund
is a series of the
ALPS Series Trust
For Shareholder Service Inquiries:
Hillman Value Fund
c/o ALPS Funds
P.O. Box 1920
Denver, CO 80201
Telephone
1-855-400-5944

Hillman Value Fund distributed by ALPS Distributors, Inc.
Must be accompanied or preceded by a prospectus.

Table of Contents
| Shareholder Letter | 1 |
| Portfolio Update | |
| Seven Canyons Strategic Income Fund | 6 |
| Seven Canyons World Innovators Fund | 8 |
| Disclosure of Fund Expenses | 10 |
| Portfolios of Investments | |
| Seven Canyons Strategic Income Fund | 12 |
| Seven Canyons World Innovators Fund | 17 |
| Statements of Assets and Liabilities | 22 |
| Statements of Operations | 24 |
| Statements of Changes in Net Assets | |
| Seven Canyons Strategic Income Fund | 26 |
| Seven Canyons World Innovators Fund | 27 |
| Financial Highlights | 28 |
| Notes to Financial Statements | 34 |
| Report of Independent Registered Public Accounting Firm | 47 |
| Additional Information | 48 |
| Liquidity Risk Management Program Disclosure | 50 |
| Privacy Policy | 51 |
| Trustees and Officers | 54 |
| Seven Canyons Advisors | Shareholder Letter |
| September 30, 2021 (Unaudited) |
Dear Fellow Shareholders:
Last December, as we wrapped up a year that will forever be associated with COVID, there was hope on the horizon that 2021 would bring vaccinations, economic reopening, and a resurgence of global travel and daily individual comforts. This past year, we saw many of these hopes come to fruition, yet many uncertainties remain: Given the COVID variants, should we get a booster shot? Will we need to lock down again? How resilient are global supply chains? Is inflation going to become more widespread, and if so, will it prove transient? And why haven’t any of these negatives hurt the stock market? At the onset of COVID, if anyone had outlined the woes ahead and been asked to make a market prediction, the forecast surely would have been for weak markets. Yet not only have markets not been weak, they have been exceptionally strong. The market is up more than 30% since the eve of COVID last year.
Why?
My best interpretation of the market’s strange behavior is that it acknowledges COVID, lockdowns, supply chain disruption, and inflation, yet concludes “this too shall pass.” In other words, the market is looking down the road and seeing our current problems resolved and bright prospects ahead. The market believes these issues are merely the headlines du jour with little impact on a better future.
This calls to mind Fed Chair Greenspan’s “conundrum” comment regarding the failure of long bond rates to rise in the early 2000s. In spite of soaring short rates, long rates remained stubbornly flat. Now, despite the hit to our economy from COVID lockdowns, supply chain issues, and inflation, how is it that the stock market continues to rise? It’s a conundrum.
Is the market wrong?
Many felt the market was expensive even before COVID. After the impact of the ’08-’09 Global Financial Crisis (GFC) had been fully reflected in ’10 stock prices, they settled in at a multiple of 15x their earnings. From that point, the earnings multiple continued a steady rise to 25x by January 2020, just as news of COVID started to emerge.
Why did the market multiple rise so much during the decade prior to COVID? The standard answer would be that economic prospects faced a sunny future. However, that is a dubious assertion about the economy post the GFC. The hallmark of the broader economic recovery is that it was the slowest on record with stubbornly high unemployment.
Since the onset of COVID, the price to earnings multiple has continued rising from 25x to 35x. This seems nearly impossible. Again, the standard answer of “economic prospects continued to brighten” seems foolish. Prospects brightened during COVID? Actual GDP fell 10% during 2020 and is just now recovering to its level prior to COVID. GDP growth has returned to the tepid 2-3% growth we’ve experienced over the past decade. This does not seem to foretell a rosy future.
Yet there have been many studies demonstrating that the market correctly prices stocks. This suggests that stock prices relative to their earnings are generally appropriate. But the pricing of stocks over the last decade does not seem rational. Instead, and especially since COVID, stock prices seem crazy. Given the problems outlined at the outset, how could economic prospects be rosy? I am sure that most of us would be happy with just a return to normal. Even though it seems to be good news, the fact that the “new normal” market is at twice the multiple it was at a decade ago just doesn’t add up.
| Annual Report | September 30, 2021 | 1 |
| Seven Canyons Advisors | Shareholder Letter |
| September 30, 2021 (Unaudited) |
Is the market a bubble ready to pop?
The bubble argument is straightforward. Stock prices have risen far beyond the earnings underlying them. When this has happened in the past, the market has always corrected to bring prices back to their traditional relationship with earnings. Yet our current market seems to be puncture resistant—instead of “popping” and returning to normal, stock prices continue to rise and rise.
A possible explanation for our soaring market is that its underlying structure has changed. There are a couple of reasons why this might be so. Post the GFC, our government embarked on a strange new path of trying to support a weak economy by increasing the money supply, instead of using the more standard economic booster of increasing government spending. Relying on monetary policy instead of fiscal policy took us into uncharted waters. Money printing was being asked to do the job normally assigned to fiscal disbursement. Instead of stimulating the economy, money printing led to vast amounts of liquidity looking for a home. Stocks and bonds proved a ready receptacle, precipitating soaring stock and bond prices. Stimulus to offset COVID has been via the traditional go-to of government spending. This fiscal boost has been accompanied by plenty of stock-price-stimulating money printing.
Another possible change in market structure may be due to the growth of index funds, ETFs, and algorithmic trading. None of these investing strategies are reliant on any measure of valuation. Instead, they are based on price momentum. Take index funds for example. Any new money flowing into an index fund is immediately invested, regardless of stock prices. This tends to increase prices which, in turn, attracts more money, which sparks further price increases, and so on. Valuation has no place in the “decision” making of index funds, ETFs, and algorithmic trading. At a minimum, all of these instruments generate trend behavior. This may have led us into a strange new world where stock prices are not set on any rational basis.
Which brings us back to our conundrum.
As investors, we can choose to interpret this market behavior as normal. That is, the market is in bubble territory and ready to pop. Given that the potential pop lies in the future, we may even believe in its resilience for a bit longer. As Chuck Prince, CEO of Citicorp, famously said, “I’ll keep dancing as long as the music is playing.”
Or we could interpret the market as functioning by different rules due to the change in market structure. If prices are not set by considering valuation, there seems no reason to expect an imminent collapse.
My take is a bit like the quintessential economist who says “on the one hand” offset by the subsequent “on the other.” The future will have price reversals to take account of stretched valuation. But any reversal might be delayed for a long time due to the impact of all the money sloshing around and the rise of value-insensitive investing. Whether the market corrects sooner or later, I believe that careful strategies are needed to identify market winners.
| 2 | www.sevencanyonsadvisors.com |
| Seven Canyons Advisors | Shareholder Letter |
| September 30, 2021 (Unaudited) |
FUNDS SUMMARY
World Innovators Fund
Market conditions have been unkind to the World Innovators Fund in the first three quarters of 2021, creating sector and style headwinds that have weighed on the share prices of our investments. Value stocks have outperformed growth stocks. Commodity sectors have outperformed. And numerous COVID winners, many of which the fund owned, have had flat or down share prices this year, as even the strongest results often haven’t been enough to meet lofty expectations and support valuation multiples.
For the most part, these trends continued into the third quarter. Most COVID winners sold off, despite reporting strong business results. The two strongest sectors were Energy and Financials, which are mostly composed of companies we avoid because they sell commoditized products and services. The World Innovators Fund was overweight the two weakest sectors, Healthcare and Consumer Discretionary. The World Innovators Fund is structurally overweight these sectors because they produce an abundance of companies with unique products and business models. On the balance, the fund faced some headwinds from market conditions during the quarter, but they were relatively mild.
Frustratingly, this means it was our stock selection that created the majority of the World Innovator’s Fund third quarter underperformance relative to the benchmark. An unusual number of companies held by the World Innovators Fund lowered earnings guidance for 2021 for a variety of reasons—mostly due to external events they couldn’t control. The one commonality is that several companies reported COVID-related supply chain issues that went from bad early in the year, to worse in the third quarter. For example, AO World, a UK company, mentioned a truck driver shortage and associated wage increases due to Eastern European drivers returning home to sort out Brexit-related visa issues, then getting stuck there as a result of COVID. Asetek had production temporarily shut down due to localized COVID lockdowns in China, closing production facilities. Maisons du Monde had a similar issue in Vietnam. We believe that although Avon Rubber had big orders to fill, they had a hard time hiring because of the UK government’s temporary unemployment benefit boosts.
We do not think there is a systemic problem with the companies the World Innovators Fund owns. Even great companies occasionally face some bumps in the road, but those bumps tend to look insignificant when a company consistently grows sales by double-digits for over a decade. Honestly, we think most of the quarter’s underperformance is a normal side effect of high-quality active management. We aim to generate significant long-term outperformance for our shareholders, and a critical part of any strategy aiming for significant outperformance is to run a high conviction, highly concentrated portfolio. Of the 4000+ companies in the World Innovators Fund’s benchmark, the fund owns a total of 57. The fund’s top 10 holdings account for ~40% of the portfolio. It is this highly concentrated structure that enabled the fund to outperform its benchmark by 53% in calendar year 2020 and to outperform its benchmark over the last 3, 5, and 10 years. But this structure also means short term periods of underperformance are normal—all it takes is for a few owned companies to simultaneously hit bumps in the road.
After making what seemed like all the right calls to adapt to COVID’s impact on stock markets in 2020, some of the fund’s investments have struggled with the new set of problems the virus has presented for companies in 2021. Even so, we believe that the World Innovators Fund owns great companies which will emerge much stronger than their competition from this ongoing crisis. We also remain confident in our high-conviction, high-concentration investment strategy and its ability to beat the benchmark in the long term.
| Annual Report | September 30, 2021 | 3 |
| Seven Canyons Advisors | Shareholder Letter |
| September 30, 2021 (Unaudited) |
Strategic Income Fund
The past 12 months have seen returns for the fund of 51.66% versus 27.44% for the MSCI ACWI Index, the fund’s primary benchmark, and -0.90% for the Bloomberg US Aggregate Bond Index, the fund’s secondary benchmark. Despite the third quarter of the calendar year seeing only modest gains, the previous three quarters helped to make the past year one of the best performing periods in the fund’s 15 year history.
The fund’s position as a more global, smaller-cap portfolio has so far produced favorable results, as reflected in our performance over the last year. But the long term effects of this position may take several years to play out. In addition, stocks have done well this past year, echoing the recovery in the US economy. This strong performance also reflects expected future strength in the global economy.
During the past several months, one of the Strategic Income Fund’s primary portfolio themes was an increase in cash due to the paucity of opportunities to buy good companies at reasonable prices. The strong market rally off the COVID bottom has produced a near doubling of stock prices. Good companies are costly these days. Buying expensive stocks yields only meager returns, even if the companies continue to do well. And if they don't, there is a long way to fall. We tried to improve the focus of the fund by shrinking our name count, taking profits in several companies in which we had lower confidence.
Geographically, the Strategic Income Fund is overweight India both due to the size of the country and its growth prospects. India will soon overtake China as the most populous country in the world, and is more than 4x the size of the US. Some analysts believe that Indian companies have the opportunity to grow at 20% for 20 years. The Fund generally is underweight the US, as stocks are generally more expensive and have fewer growth prospects, especially compared to companies in emerging markets.
The fund’s largest sector underweight is technology. Given tech’s current growth prospects, we would really like the fund to have more weight. However, the prices of tech stocks often more than reflect their growth, making them too expensive to own. A continuing theme in the Strategic Income Fund has been outsized holdings of financial stocks. The fund is overweight due to the fact that the development of banks is critical to the growth of emerging economies. Nearly 10% of the fund is invested in emerging banks.
Looking forward, we expect the market will continue to be choppy, as it was during the third quarter. We believe the best way to navigate turbulent markets is by being highly selective in the companies owned by the funds. Good companies usually do well, regardless of market conditions.
Sincerely,

Sam Stewart
Partner
| 4 | www.sevencanyonsadvisors.com |
| Seven Canyons Advisors | Shareholder Letter |
| September 30, 2021 (Unaudited) |
This letter is for informational purposes only and does not constitute investment advice or a recommendation of any particular security, strategy, or investment product. The expressed views and opinions presented are for informational purposes only, are based on current market conditions, and are subject to change without notice. Although information and statistics contained herein have been obtained from sources believed to be reliable and are accurate to the best of our knowledge, Seven Canyons Advisors cannot and does not guarantee the accuracy, validity, timeliness, or completeness of such information and statistics made available to you for any particular purpose. Past performance is not indicative of future results.
All investing involves risks. Investments in securities of foreign companies involve additional risks, including less liquidity, currency-rate fluctuations, political and economic instability, and differences in financial reporting standards and securities market regulation. Investing in small and micro-cap funds will be more volatile and loss of principal could be greater than investing in large cap or more diversified funds.
An investor should consider investment objectives, risks, charges, and expenses carefully before investing. To obtain a Prospectus, which contains this and other information, visit our website at www.sevencanyonsadvisors.com or call us at 1-801-349-2718. Read the prospectus carefully before investing.
© 2021 Seven Canyons. All rights reserved. Seven Canyons Funds are distributed by ALPS Distributors, Inc. (ADI).
| Annual Report | September 30, 2021 | 5 |
| Seven Canyons Strategic Income Fund | Portfolio Update |
| September 30, 2021 (Unaudited) |
Performance of a Hypothetical $10,000 Initial Investment
(September 30, 2011 through September 30, 2021)

The graph shown above represents historical performance of a hypothetical investment of $10,000 in the Investor Class. Past performance does not guarantee future results. All returns reflect reinvested dividends, but do not reflect the deduction of fees or taxes that a shareholder would pay on Fund distributions or the redemption of Fund shares.
Average Annual Total Returns (as of September 30, 2021)
| 1 Year | 5 Year | 10 Year | Since Inception* | |
| Seven Canyons Strategic Income Fund - Investor | 51.66% | 12.64% | 12.46% | 8.33% |
| MSCI All Country World Index - NR(a) | 27.44% | 13.20% | 11.90% | 7.27% |
| Bloomberg US Aggregate Bond Index(b) | -0.90% | 2.94% | 3.01% | 4.20% |
The performance data quoted above represents past performance. Past performance is not a guarantee of future results. Investment return and value of the Fund shares will fluctuate so that an investor’s shares, when sold or redeemed, may be worth more or less than their original cost. Performance may be lower or higher than performance data quoted. Fund performance current to the most recent month-end is available by calling (833) 722-6966 or by visiting www.sevencanyonsadvisors.com.
| * | The Fund commenced operations on February 1, 2006. The Predecessor Fund, Wasatch Strategic Income Fund, managed by Wasatch Advisors, Inc., was reorganized into the Seven Canyons Strategic Income Fund on September 10, 2018. Seven Canyons Advisors, LLC has been the Fund’s investment adviser since September 10, 2018. Fund performance prior to September 10, 2018 is reflective of the past performance of the Predecessor Fund. |
| (a) | The MSCI ACWI is a market capitalization weighted index designed to provide a broad measure of equity-market performance throughout the world. The MSCI ACWI is maintained by Morgan Stanley Capital International (MSCI) and is comprised of stocks from 23 developed countries and 24 emerging markets. |
| 6 | www.sevencanyonsadvisors.com |
| Seven Canyons Strategic Income Fund | Portfolio Update |
| September 30, 2021 (Unaudited) |
| (b) | Then Bloomberg U.S. Aggregate Bond Index is a broad-based benchmark that measures the investment grade, U.S. dollar-denominated, fixed-rate taxable bond market, including Treasuries, government-related and corporate securities, MBS (agency fixed-rate and hybrid ARM pass-throughs), ABS, and CMBS (agency and non-agency). The index is not actively managed and does not reflect any deductions for fees, expenses or taxes. |
Returns of less than 1 year are cumulative.
Indices are not actively managed and do not reflect deduction for fees, expenses or taxes. An investor cannot invest directly in an index.
The returns shown above do not reflect the deduction of taxes a shareholder would pay on Fund distributions or redemption of Fund shares.
The total annual operating expenses and total annual operating expenses after fee waivers and/or reimbursement for the Fund’s Investor Class (as reported in the January 28, 2021 Prospectus) are 2.05% and 1.54%, respectively. The Fund’s investment adviser has contractually agreed to limit expenses through January 31, 2022.
| Top Ten Equity Holdings (as a % of Net Assets)* | ||||
| Future PLC | 8.73 | % | ||
| Burford Capital, Ltd. | 8.34 | % | ||
| Gamma Communications PLC | 3.94 | % | ||
| GTPL Hathway, Ltd. | 3.91 | % | ||
| Bank of Georgia Group PLC | 2.95 | % | ||
| Mo-BRUK SA | 2.81 | % | ||
| NAC Kazatomprom JSC | 2.57 | % | ||
| Radico Khaitan, Ltd. | 2.53 | % | ||
| Arman Financial Services, Ltd. | 2.50 | % | ||
| Inter Cars SA | 2.47 | % | ||
| Top Ten Holdings | 40.75 | % | ||
| Sector Allocation (as a % of Net Assets)* | ||||
| Financials | 22.33 | % | ||
| Communication Services | 19.99 | % | ||
| Consumer Discretionary | 8.08 | % | ||
| Information Technology | 8.05 | % | ||
| Industrials | 5.81 | % | ||
| Health Care | 5.20 | % | ||
| Consumer Staples | 3.59 | % | ||
| Energy | 2.57 | % | ||
| Materials | 0.28 | % | ||
| Cash, Cash Equivalents, & Other Net Assets | 24.10 | % | ||
| Total | 100.00 | % | ||
| * | Holdings are subject to change, and may not reflect the current or future position of the portfolio. |
| Annual Report | September 30, 2021 | 7 |
| Seven Canyons World Innovators Fund | Portfolio Update |
| September 30, 2021 (Unaudited) |
Performance of a Hypothetical $10,000 Initial Investment
(September 30, 2011 through September 30, 2021)

The graph shown above represents historical performance of a hypothetical investment of $10,000 in the Investor Class. Due to differing expenses, performance of the Institutional Class will vary. Past performance does not guarantee future results. Returns do not reflect the deduction of fees, sales charges, or taxes that a shareholder would pay on Fund distributions or the redemption of Fund shares.
Average Annual Total Returns (as of September 30, 2021)
| 1 Year | 5 Year | 10 Year | Since Inception* | |
| Seven Canyons World Innovators Fund - Investor | 13.92% | 17.84% | 14.91% | 9.83% |
| Seven Canyons World Innovators Fund - Institutional | 14.17% | 18.11% | 15.07% | 9.90% |
| MSCI All Country World Index ex USA Small Cap - NR(a) | 33.06% | 10.28% | 9.44% | 8.87% |
The performance data quoted above represents past performance. Past performance is not a guarantee of future results. Investment return and value of the Fund shares will fluctuate so that an investor’s shares, when sold or redeemed, may be worth more or less than their original cost. Performance may be lower or higher than performance data quoted. Fund performance current to the most recent month-end is available by calling (833) 722-6966 or by visiting www.sevencanyonsadvisors.com.
| * | Seven Canyons World Innovators Fund – Investor Class has an inception date of December 19, 2000. Seven Canyons World Innovators Fund – Institutional Class has an inception date of February 1, 2016. Performance for the Institutional Class prior to 2/1/2016 is based on the performance of the Investor Class. Performance of the Fund’s Institutional Class prior to 2/1/2016 uses the actual expenses of the Fund’s Investor Class without any adjustments. For any such period of time, the performance of the Fund’s Institutional Class would have been substantially similar to, yet higher than, the performance of the Fund’s Investor Class, because the shares of both classes are invested in the same portfolio of securities, but the classes bear different expenses. The Predecessor Fund, Wasatch World Innovators Fund, managed by Wasatch Advisors, Inc., was reorganized into the Seven Canyons World Innovators Fund on September 10, 2018. Seven Canyons Advisors, LLC has been the Fund’s investment adviser since September 10, 2018. Fund performance prior to September 10, 2018 is reflective of the past performance of the Predecessor Fund. |
| 8 | www.sevencanyonsadvisors.com |
| Seven Canyons World Innovators Fund | Portfolio Update |
| September 30, 2021 (Unaudited) |
| (a) | The MSCI ACWI ex USA Small Cap Index captures small cap representation across 22 of 23 Developed Markets (DM) countries (excluding the US) and 26 Emerging Markets (EM) countries. |
Returns of less than 1 year are cumulative.
Indices are not actively managed and do not reflect deduction for fees, expenses or taxes. An investor cannot invest directly in an index.
The returns shown above do not reflect the deduction of taxes a shareholder would pay on Fund distributions or redemption of Fund shares.
The total annual operating expenses and total annual operating expenses after fee waivers and/or reimbursement for the Fund’s Investor Class and Institutional Class shares (as reported in the January 28, 2021 Prospectus) are 2.03% and 1.76% and 1.98% and 1.56%, respectively. The Fund’s investment adviser has contractually agreed to limit expenses through January 31, 2022.
| Top Ten Equity Holdings (as a % of Net Assets)* | ||||
| Nordic Entertainment Group AB | 6.80 | % | ||
| Fevertree Drinks PLC | 5.79 | % | ||
| va-Q-tec AG | 5.62 | % | ||
| Fenix Outdoor International AG | 4.68 | % | ||
| Maisons du Monde SA | 4.16 | % | ||
| Gamma Communications PLC | 4.12 | % | ||
| Advanced Medical Solutions Group PLC | 3.47 | % | ||
| GK Software SE | 3.38 | % | ||
| MNF Group, Ltd. | 3.22 | % | ||
| AO World PLC | 2.95 | % | ||
| Top Ten Holdings | 44.19 | % | ||
| Sector Allocation (as a % of Net Assets)* | ||||
| Consumer Discretionary | 21.25 | % | ||
| Communication Services | 17.63 | % | ||
| Information Technology | 17.55 | % | ||
| Industrials | 16.04 | % | ||
| Health Care | 10.25 | % | ||
| Consumer Staples | 7.56 | % | ||
| Financials | 2.16 | % | ||
| Real Estate | 0.49 | % | ||
| Cash, Cash Equivalents, & Other Net Assets | 7.07 | % | ||
| Total | 100.00 | % | ||
| * | Holdings are subject to change, and may not reflect the current or future position of the portfolio. |
| Annual Report | September 30, 2021 | 9 |
| Seven Canyons Advisors | Disclosure of Fund Expenses |
| September 30, 2021 (Unaudited) |
Example. As a shareholder of the Seven Canyons Strategic Income Fund or Seven Canyons World Innovators Fund (the “Funds”), you incur two types of costs: (1) transaction costs; and (2) ongoing costs, including management fees and other Fund expenses. The following examples are intended to help you understand your ongoing costs (in dollars) of investing in a Fund and to compare these costs with the ongoing costs of investing in other mutual funds. The examples are based on an investment of $1,000 invested on April 1, 2021 and held through September 30, 2021.
Actual Expenses. The first line under each class in the following table provides information about actual account values and actual expenses. You may use the information in this line, together with the amount you invested, to estimate the expenses that you paid over the period. Simply divide your account value by $1,000 (for example, an $8,600 account value divided by $1,000 = 8.6), then multiply the result by the number in the first line under the heading “Expenses Paid During Period April 1, 2021 – September 30, 2021” to estimate the expenses you paid on your account during this period.
Hypothetical Example for Comparison Purposes. The second line under each class in the following table provides information about hypothetical account values and hypothetical expenses based on a Fund’s actual expense ratio and an assumed rate of return of 5% per year before expenses, which is not the Fund’s actual return. The hypothetical account values and expenses may not be used to estimate the actual ending account balance or expenses you paid for the period. You may use this information to compare the ongoing costs of investing in a Fund and other mutual funds. To do so, compare this 5% hypothetical example with the 5% hypothetical examples that appear in the shareholder reports of the other funds.
Please note that the expenses shown in the table are meant to highlight your ongoing Fund costs only and do not reflect any transactional costs. Therefore, the second line under each class in the table below is useful in comparing ongoing costs only and will not help you determine the relative total costs of owning different funds. In addition, if these transactional costs were included, your costs would have been higher.
| 10 | www.sevencanyonsadvisors.com |
| Seven Canyons Advisors | Disclosure of Fund Expenses |
| September 30, 2021 (Unaudited) |
| Beginning Account Value April 1, 2021 | Ending Account Value September 30, 2021 | Expense Ratio(a) | Expenses Paid During Period April 1, 2021 - September 30, 2021(b) | |
| Seven Canyons Strategic | ||||
| Income Fund | ||||
| Investor Class | ||||
| Actual | $1,000.00 | $1,179.10 | 0.95% | $ 5.19 |
| Hypothetical (5% return before expenses) | $1,000.00 | $1,020.31 | 0.95% | $ 4.81 |
| Seven Canyons World | ||||
| Innovators Fund | ||||
| Investor Class | ||||
| Actual | $1,000.00 | $ 970.30 | 1.75% | $ 8.64 |
| Hypothetical (5% return before expenses) | $1,000.00 | $1,016.29 | 1.75% | $ 8.85 |
| Institutional Class | ||||
| Actual | $1,000.00 | $ 971.20 | 1.55% | $ 7.66 |
| Hypothetical (5% return before expenses) | $1,000.00 | $1,017.30 | 1.55% | $ 7.84 |
| (a) | Each Fund's expense ratios have been annualized based on the Fund's most recent fiscal halfyear expenses after any applicable waivers and reimbursements. |
| (b) | Expenses are equal to the annualized expense ratio shown above for the applicable class, multiplied by the average account value over the period, multiplied by the number of days in the most recent fiscal half year (183), divided by 365. |
| Annual Report | September 30, 2021 | 11 |
| Seven Canyons Strategic Income Fund | Portfolio of Investments |
| September 30, 2021 |
| Shares | Value (Note 2) | |||||||
| COMMON STOCKS (75.90%) | ||||||||
| Airlines (1.11%) | ||||||||
| Controladora Vuela Cia de Aviacion SAB de CV, ADR(a) | 25,854 | $ | 563,876 | |||||
| Alternative Carriers (5.00%) | ||||||||
| Gamma Communications PLC | 81,793 | 2,005,870 | ||||||
| MNF Group, Ltd. | 112,828 | 541,670 | ||||||
| Total Alternative Carriers | 2,547,540 | |||||||
| Application Software (1.87%) | ||||||||
| Hyundai Ezwel Co., Ltd. | 111,000 | 951,050 | ||||||
| Cable & Satellite (3.91%) | ||||||||
| GTPL Hathway, Ltd.(b)(c) | 582,000 | 1,990,951 | ||||||
| Coal & Consumable Fuels (2.57%) | ||||||||
| NAC Kazatomprom JSC, GDR(c) | 37,000 | 1,311,650 | ||||||
| Consumer Finance (3.33%) | ||||||||
| Arman Financial Services, Ltd.(a) | 112,501 | 1,271,912 | ||||||
| Kaspi.KZ JSC, GDR | 4,000 | 424,800 | ||||||
| Total Consumer Finance | 1,696,712 | |||||||
| Data Processing & Outsourced Services (3.33%) | ||||||||
| Boku, Inc.(a)(b)(c) | 203,000 | 534,208 | ||||||
| iEnergizer, Ltd. | 310,818 | 1,164,253 | ||||||
| Total Data Processing & Outsourced Services | 1,698,461 | |||||||
| Distillers & Vintners (2.53%) | ||||||||
| Radico Khaitan, Ltd. | 109,000 | 1,291,422 | ||||||
| Distributors (3.59%) | ||||||||
| Inter Cars SA | 11,084 | 1,256,021 | ||||||
| Sirca Paints India, Ltd.(b)(c) | 120,000 | 573,842 | ||||||
| Total Distributors | 1,829,863 | |||||||
| Diversified Banks (4.04%) | ||||||||
| Bank of Georgia Group PLC | 72,000 | 1,505,353 | ||||||
| TCS Group Holding PLC, GDR(c) | 6,000 | 550,800 | ||||||
| Total Diversified Banks | 2,056,153 | |||||||
| See Notes to Financial Statements. | |
| 12 | www.sevencanyonsadvisors.com |
| Seven Canyons Strategic Income Fund | Portfolio of Investments |
| September 30, 2021 |
| Shares | Value (Note 2) | |||||||
| Diversified REITs (0.94%) | ||||||||
| Star Asia Capital Corp.(b)(d)(e)(f)(g) | 355,714 | $ | 477,759 | |||||
| Electronic Components (1.09%) | ||||||||
| M3 Technology, Inc. | 71,000 | 557,547 | ||||||
| Electronic Equipment & Instruments (1.75%) | ||||||||
| Basler AG | 2,000 | 334,219 | ||||||
| Vigo System SA(a) | 3,000 | 560,229 | ||||||
| Total Electronic Equipment & Instruments | 894,448 | |||||||
| Environmental & Facilities Services (3.78%) | ||||||||
| Antony Waste Handling Cell, Ltd.(a)(b)(c) | 102,000 | 490,578 | ||||||
| Mo-BRUK SA | 15,696 | 1,433,915 | ||||||
| Total Environmental & Facilities Services | 1,924,493 | |||||||
| Fertilizers & Agricultural Chemicals (0.28%) | ||||||||
| Kilpest India, Ltd. | 22,718 | 141,384 | ||||||
| Financial Exchanges & Data (1.35%) | ||||||||
| OTC Markets Group, Inc., Class A | 14,000 | 686,000 | ||||||
| Health Care Equipment (1.88%) | ||||||||
| GeneReach Biotechnology Corp.(a) | 95,200 | 349,066 | ||||||
| Revenio Group Oyj | 9,605 | 609,126 | ||||||
| Total Health Care Equipment | 958,192 | |||||||
| Health Care Services (0.82%) | ||||||||
| Metropolis Healthcare, Ltd.(b)(c) | 11,500 | 417,131 | ||||||
| Health Care Supplies (0.69%) | ||||||||
| Tristel PLC | 43,000 | 351,459 | ||||||
| Human Resource & Employment Services (0.93%) | ||||||||
| Veteranpoolen AB | 122,000 | 473,819 | ||||||
| Interactive Media & Services (2.35%) | ||||||||
| Wirtualna Polska Holding SA(c) | 35,286 | 1,197,715 | ||||||
| Internet & Direct Marketing Retail (3.14%) | ||||||||
| Koukandekirukun, Inc.(a) | 13,500 | 590,669 | ||||||
| momo.com, Inc. | 17,400 | 1,008,443 | ||||||
| Total Internet & Direct Marketing Retail | 1,599,112 | |||||||
| See Notes to Financial Statements. | |
| Annual Report | September 30, 2021 | 13 |
| Seven Canyons Strategic Income Fund | Portfolio of Investments |
| September 30, 2021 |
| Shares | Value (Note 2) | |||||||
| Investment Banking & Brokerage (2.41%) | ||||||||
| flatexDEGIRO AG(a) | 58,000 | $ | 1,227,472 | |||||
| Packaged Foods & Meats (1.05%) | ||||||||
| Manorama Industries, Ltd.(a) | 27,000 | 537,721 | ||||||
| Pharmaceuticals (1.81%) | ||||||||
| Granules India, Ltd. | 81,861 | 351,150 | ||||||
| Hypera SA | 97,000 | 569,808 | ||||||
| Total Pharmaceuticals | 920,958 | |||||||
| Publishing (8.73%) | ||||||||
| Future PLC | 89,500 | 4,449,857 | ||||||
| Specialized Consumer Services (1.35%) | ||||||||
| Perfect Medical Health Management, Ltd. | 904,000 | 686,490 | ||||||
| Specialized Finance (8.34%) | ||||||||
| Burford Capital, Ltd. | 389,200 | 4,247,706 | ||||||
| Thrifts & Mortgage Finance (1.93%) | ||||||||
| Aavas Financiers, Ltd.(a) | 28,712 | 982,346 | ||||||
| TOTAL COMMON STOCKS | ||||||||
| (Cost $29,779,281) | 38,669,287 | |||||||
| 7 Day Yield | Shares | Value (Note 2) | ||||||||||
| SHORT TERM INVESTMENT (24.04%) | ||||||||||||
| State Street Institutional US Government Money Market Fund | 0.010 | % | 12,247,993 | 12,247,993 | ||||||||
| 12,247,993 | ||||||||||||
| TOTAL SHORT TERM INVESTMENT | ||||||||||||
| (Cost $12,247,993) | 12,247,993 | |||||||||||
| TOTAL INVESTMENTS (99.94%) | ||||||||||||
| (Cost $42,027,274) | $ | 50,917,280 | ||||||||||
| OTHER ASSETS IN EXCESS OF LIABILITIES (0.06%) | 28,565 | |||||||||||
| NET ASSETS (100.00%) | $ | 50,945,845 | ||||||||||
| See Notes to Financial Statements. | |
| 14 | www.sevencanyonsadvisors.com |
| Seven Canyons Strategic Income Fund | Portfolio of Investments |
| September 30, 2021 |
| (a) | Non-income producing security. |
| (b) | Securities exempt from registration under Rule 144A of the Securities Act of 1933. These securities may be resold in transactions exempt from registration, normally to qualified institutional buyers. As of September 30, 2021 the fair value of securities restricted under Rule 144A in the aggregate was $4,484,469, representing 8.80% of net assets. |
| (c) | Securities were purchased pursuant to Regulation S under the Securities Act of 1933, which exempts securities offered and sold outside of the United States from registration. Such securities cannot be sold in the United States without either an effective registration statement filed pursuant to the Securities Act of 1933, or pursuant to an exemption from registration. As of September 30, 2021, the fair value of those securities was $7,066,875 representing 13.87% of net assets. |
| (d) | As a result of the use of significant unobservable inputs to determine fair value, these investments have been classified as Level 3 assets. Additional information on Level 3 assets can be found in Note 2. Significant Accounting Policies in the Notes to Financial Statements section. |
| (e) | Security deemed to be restricted as of September 30, 2021. As of September 30, 2021, the fair value of restricted securities in the aggregate was $477,759, representing 0.94% of the Fund’s net assets. Additional information on restricted securities can be found in Note 8. (f) Fair valued security under the procedures approved by the Fund’s Board of Trustees. |
| (g) | Security deemed to be illiquid under the procedures approved by the Fund’s Board of Trustees. As of September 30, 2021, the fair value of illiquid securities in the aggregate was $477,759, representing 0.94% of the Fund’s net assets. |
| See Notes to Financial Statements. | |
| Annual Report | September 30, 2021 | 15 |
| Seven Canyons Strategic Income Fund | Portfolio of Investments |
| September 30, 2021 |
At September 30, 2021, Seven Canyons Strategic Income Fund's investments, excluding short-term investments, were in the following countries:
| Country | % of Total Market Value | |||
| Australia | 1.4 | |||
| Brazil | 1.5 | |||
| Cyprus | 1.4 | |||
| Finland | 1.6 | |||
| Georgia | 3.9 | |||
| Germany | 4.0 | |||
| Great Britain | 17.6 | |||
| Guernsey | 3.0 | |||
| Hong Kong | 1.8 | |||
| India | 20.7 | |||
| Japan | 1.5 | |||
| Kazakhstan | 4.5 | |||
| Mexico | 1.5 | |||
| Poland | 11.5 | |||
| South Korea | 2.5 | |||
| Sweden | 1.2 | |||
| Taiwan | 5.0 | |||
| United States | 15.4 | |||
| 100.0 | ||||
| See Notes to Financial Statements. | |
| 16 | www.sevencanyonsadvisors.com |
| Seven Canyons World Innovators Fund | Portfolio of Investments |
| September 30, 2021 |
| Shares | Value (Note 2) | |||||||
| COMMON STOCKS (92.93%) | ||||||||
| Aerospace & Defense (1.61%) | ||||||||
| Avon Protection PLC | 65,000 | $ | 1,700,823 | |||||
| Electro Optic Systems Holdings, Ltd.(a) | 350,000 | 858,448 | ||||||
| Mynaric AG(a)(b) | 30,000 | 2,239,476 | ||||||
| Total Aerospace & Defense | 4,798,747 | |||||||
| Agricultural Products (0.83%) | ||||||||
| Winfarm SAS(a) | 60,831 | 2,476,786 | ||||||
| Airlines (2.38%) | ||||||||
| Controladora Vuela Cia de Aviacion SAB de CV, ADR(a) | 325,000 | 7,088,250 | ||||||
| Alternative Carriers (8.28%) | ||||||||
| Gamma Communications PLC | 500,000 | 12,261,869 | ||||||
| MNF Group, Ltd. | 2,000,000 | 9,601,689 | ||||||
| V-Cube, Inc. | 200,000 | 2,809,054 | ||||||
| Total Alternative Carriers | 24,672,612 | |||||||
| Application Software (11.26%) | ||||||||
| 24SevenOffice Group AB(a) | 500,000 | 1,016,632 | ||||||
| Elmo Software, Ltd.(a) | 600,000 | 1,917,105 | ||||||
| GK Software SE(a) | 55,000 | 10,068,762 | ||||||
| Kaonavi, Inc.(a) | 121,300 | 2,537,714 | ||||||
| Lectra | 200,000 | 7,837,459 | ||||||
| Lime Technologies AB | 132,629 | 5,161,384 | ||||||
| Napster Group PLC(a) | 23,903,583 | 418,700 | ||||||
| Skitude Holding AS(a) | 1,806,919 | 607,698 | ||||||
| Skyfii, Ltd.(a) | 13,939,393 | 986,597 | ||||||
| Smaregi, Inc.(a) | 100,000 | 3,003,067 | ||||||
| Total Application Software | 33,555,118 | |||||||
| Auto Parts & Equipment (0.91%) | ||||||||
| hGears AG(a)(c) | 100,000 | 2,722,113 | ||||||
| Biotechnology (1.02%) | ||||||||
| Abcam PLC(a) | 150,000 | 3,027,608 | ||||||
| Broadcasting (6.80%) | ||||||||
| Nordic Entertainment Group AB(a) | 375,000 | 20,248,814 | ||||||
| See Notes to Financial Statements. | |
| Annual Report | September 30, 2021 | 17 |
| Seven Canyons World Innovators Fund | Portfolio of Investments |
| September 30, 2021 |
| Shares | Value (Note 2) | |||||||
| Building Products (1.69%) | ||||||||
| Grupo Rotoplas SAB de CV | 4,005,801 | $ | 5,026,294 | |||||
| Diversified Support Services (2.03%) | ||||||||
| Arena Events Group PLC(a)(b) | 10,000,000 | 2,002,789 | ||||||
| Johnson Service Group PLC(a) | 2,000,000 | 4,052,980 | ||||||
| Total Diversified Support Services | 6,055,769 | |||||||
| Electrical Components & Equipment (0.28%) | ||||||||
| Arcure SA(a)(c) | 176,785 | 819,113 | ||||||
| Electronic Equipment & Instruments (3.43%) | ||||||||
| ACSL, Ltd.(a) | 50,000 | 1,029,898 | ||||||
| Basler AG | 10,000 | 1,671,094 | ||||||
| Catapult Group International, Ltd.(a) | 1,700,000 | 2,359,321 | ||||||
| Eroad, Ltd.(a) | 1,300,000 | 5,148,303 | ||||||
| Total Electronic Equipment & Instruments | 10,208,616 | |||||||
| Electronic Manufacturing Services (2.41%) | ||||||||
| Audinate Group, Ltd.(a) | 1,000,000 | 7,174,847 | ||||||
| Food Retail (0.94%) | ||||||||
| Naked Wines PLC(a) | 300,000 | 2,801,245 | ||||||
| Health Care Equipment (3.63%) | ||||||||
| Atomo Diagnostics, Ltd.(a) | 10,652,698 | 2,691,793 | ||||||
| Revenio Group Oyj | 50,000 | 3,170,880 | ||||||
| Surgical Science Sweden AB(a) | 180,000 | 4,944,942 | ||||||
| Total Health Care Equipment | 10,807,615 | |||||||
| Health Care Supplies (4.02%) | ||||||||
| Advanced Medical Solutions Group PLC | 2,500,000 | 10,340,323 | ||||||
| Ypsomed Holding AG | 10,000 | 1,646,011 | ||||||
| Total Health Care Supplies | 11,986,334 | |||||||
| Health Care Technology (1.13%) | ||||||||
| Mentice AB(a) | 180,000 | 3,372,019 | ||||||
| Homefurnishing Retail (4.16%) | ||||||||
| Maisons du Monde SA(b)(d) | 614,611 | 12,390,827 | ||||||
| See Notes to Financial Statements. | |
| 18 | www.sevencanyonsadvisors.com |
| Seven Canyons World Innovators Fund | Portfolio of Investments |
| September 30, 2021 |
| Shares | Value (Note 2) | |||||||
| Hotel & Resort REITs (0.49%) | ||||||||
| Concentradora Fibra Hotelera Mexicana SA de CV(a)(b)(d) | 5,000,000 | $ | 1,463,072 | |||||
| Hotels, Resorts & Cruise Lines (2.19%) | ||||||||
| eDreams ODIGEO SA(a) | 400,000 | 3,490,977 | ||||||
| Grupo Hotelero Santa Fe SAB de CV(a) | 5,000,000 | 1,140,906 | ||||||
| Trainline PLC(a)(b)(d) | 400,000 | 1,886,935 | ||||||
| Total Hotels, Resorts & Cruise Lines | 6,518,818 | |||||||
| Industrial Machinery (6.14%) | ||||||||
| Balyo SA(a) | 1,000,000 | 1,563,985 | ||||||
| va-Q-tec AG(a)(b) | 500,000 | 16,742,066 | ||||||
| Total Industrial Machinery | 18,306,051 | |||||||
| Internet & Direct Marketing Retail (7.79%) | ||||||||
| AO World PLC(a) | 3,000,000 | 8,787,744 | ||||||
| Bike24 Holding AG(a)(c) | 200,000 | 5,346,925 | ||||||
| Creema, Ltd.(a) | 100,000 | 2,284,028 | ||||||
| Marley Spoon AG(a) | 2,208,269 | 2,366,412 | ||||||
| Oisix ra daichi, Inc.(a) | 100,000 | 4,432,739 | ||||||
| Total Internet & Direct Marketing Retail | 23,217,848 | |||||||
| Investment Banking & Brokerage (2.16%) | ||||||||
| JDC Group AG(a) | 227,158 | 6,446,625 | ||||||
| Life Sciences Tools & Services (0.46%) | ||||||||
| Genetic Signatures, Ltd.(a) | 1,300,000 | 1,363,377 | ||||||
| Movies & Entertainment (2.54%) | ||||||||
| Thunderbird Entertainment Group, Inc.(a) | 2,000,000 | 7,579,346 | ||||||
| Security & Alarm Services (1.91%) | ||||||||
| Blackline Safety Corp.(a) | 1,000,000 | 5,692,405 | ||||||
| Soft Drinks (5.79%) | �� | |||||||
| Fevertree Drinks PLC | 550,000 | 17,259,523 | ||||||
| Specialty Stores (6.19%) | ||||||||
| Fenix Outdoor International AG | 83,816 | 13,948,058 | ||||||
| Mister Spex SE(a) | 200,000 | 4,496,699 | ||||||
| Total Specialty Stores | 18,444,757 | |||||||
| See Notes to Financial Statements. | |
| Annual Report | September 30, 2021 | 19 |
| Seven Canyons World Innovators Fund | Portfolio of Investments |
| September 30, 2021 |
| Shares | Value (Note 2) | |||||||
| Technology Hardware, Storage & Peripherals (0.46%) | ||||||||
| Asetek A/S(a) | 377,923 | $ | 1,370,453 | |||||
| TOTAL COMMON STOCKS | ||||||||
| (Cost $245,991,407) | 276,895,002 | |||||||
| 7 Day Yield | Shares | Value (Note 2) | ||||||||||
| SHORT TERM INVESTMENT (5.84%) | ||||||||||||
| State Street Institutional US Government Money Market Fund | 0.010 | % | 17,405,495 | 17,405,495 | ||||||||
| 17,405,495 | ||||||||||||
| TOTAL SHORT TERM INVESTMENT | ||||||||||||
| (Cost $17,405,495) | 17,405,495 | |||||||||||
| TOTAL INVESTMENTS (98.77%) | ||||||||||||
| (Cost $263,396,902) | $ | 294,300,497 | ||||||||||
| OTHER ASSETS IN EXCESS OF LIABILITIES (1.23%) | 3,672,731 | |||||||||||
| NET ASSETS (100.00%) | $ | 297,973,228 | ||||||||||
| (a) | Non-income producing security. |
| (b) | Securities were purchased pursuant to Regulation S under the Securities Act of 1933, which exempts securities offered and sold outside of the United States from registration. Such securities cannot be sold in the United States without either an effective registration statement filed pursuant to the Securities Act of 1933, or pursuant to an exemption from registration. As of September 30, 2021, the fair value of those securities was $36,725,165 representing 12.32% of net assets. |
| (c) | Security deemed to be illiquid under the procedures approved by the Fund’s Board of Trustees. As of September 30, 2021, the fair value of illiquid securities in the aggregate was $8,888,151, representing 2.98% of the Fund’s net assets. |
| (d) | Securities exempt from registration under Rule 144A of the Securities Act of 1933. These securities may be resold in transactions exempt from registration, normally to qualified institutional buyers. As of September 30, 2021 the fair value of securities restricted under Rule 144A in the aggregate was $15,740,834, representing 5.28% of net assets. |
| See Notes to Financial Statements. | |
| 20 | www.sevencanyonsadvisors.com |
| Seven Canyons World Innovators Fund | Portfolio of Investments |
| September 30, 2021 |
At September 30, 2021, Seven Canyons World Innovators Fund's investments, excluding short-term investments, were in the following countries:
| Country | % of Total Market Value | |||
| Australia | 9.7 | |||
| Canada | 4.8 | |||
| Denmark | 0.5 | |||
| Finland | 1.1 | |||
| France | 9.1 | |||
| Germany | 18.8 | |||
| Great Britain | 23.3 | |||
| Japan | 5.8 | |||
| Mexico | 5.3 | |||
| New Zealand | 1.9 | |||
| Norway | 0.6 | |||
| Spain | 1.3 | |||
| Sweden | 12.2 | |||
| Switzerland | 5.6 | |||
| 100.0 | ||||
| See Notes to Financial Statements. | |
| Annual Report | September 30, 2021 | 21 |
| Seven Canyons Advisors | Statements of Assets and Liabilities |
| September 30, 2021 |
| SEVEN CANYONS STRATEGIC INCOME FUND | SEVEN CANYONS WORLD INNOVATORS FUND | |||||||
| ASSETS: | ||||||||
| Investments, at value (Cost $42,027,274 and $263,396,902) | $ | 50,917,280 | $ | 294,300,497 | ||||
| Cash and cash equivalents | 52 | 101 | ||||||
| Foreign currency, at value (Cost $474,130 and $58,032, respectively) | 466,851 | 58,032 | ||||||
| Receivable for investments sold | – | 4,583,421 | ||||||
| Receivable for shares sold | 51,425 | 228,052 | ||||||
| Dividends and interest receivable | 52,688 | 125,020 | ||||||
| Other assets | 18,005 | 28,400 | ||||||
| Total Assets | 51,506,301 | 299,323,523 | ||||||
| LIABILITIES: | ||||||||
| Deferred Foreign Capital Gains Tax | 362,943 | – | ||||||
| Payable for administration and transfer agent fees | 15,150 | 96,836 | ||||||
| Payable for investments purchased | – | 354,332 | ||||||
| Payable for shares redeemed | 99,238 | 488,286 | ||||||
| Payable to adviser | 10,141 | 272,736 | ||||||
| Payable for distribution | 16,321 | 0 | ||||||
| Payable for printing fees | 921 | 6,908 | ||||||
| Payable for professional fees | 21,846 | 28,576 | ||||||
| Payable for trustees' fees and expenses | 940 | 6,768 | ||||||
| Payable to Chief Compliance Officer fees | 423 | 3,045 | ||||||
| Accrued expenses and other liabilities | 32,533 | 92,808 | ||||||
| Total Liabilities | 560,456 | 1,350,295 | ||||||
| NET ASSETS | $ | 50,945,845 | $ | 297,973,228 | ||||
| NET ASSETS CONSIST OF: | ||||||||
| Paid-in capital (Note 6) | $ | 36,905,547 | $ | 231,274,213 | ||||
| Total distributable earnings | 14,040,298 | 66,699,015 | ||||||
| NET ASSETS | $ | 50,945,845 | $ | 297,973,228 | ||||
| See Notes to Financial Statements. | |
| 22 | www.sevencanyonsadvisors.com |
| Seven Canyons Advisors | Statements of Assets and Liabilities |
| September 30, 2021 |
| SEVEN CANYONS STRATEGIC INCOME FUND | SEVEN CANYONS WORLD INNOVATORS FUND | |||||||
| PRICING OF SHARES | ||||||||
| Investor Class: | ||||||||
| Net Asset Value, offering and redemption price per share | $ | 17.15 | $ | 25.50 | ||||
| Net Assets | $ | 50,945,845 | $ | 204,661,541 | ||||
| Shares of beneficial interest outstanding | 2,970,623 | 8,025,339 | ||||||
| Institutional Class: | ||||||||
| Net Asset Value, offering and redemption price per share | N/A | $ | 25.98 | |||||
| Net Assets | N/A | $ | 93,311,687 | |||||
| Shares of beneficial interest outstanding | N/A | 3,591,469 | ||||||
| See Notes to Financial Statements. | |
| Annual Report | September 30, 2021 | 23 |
| Seven Canyons Advisors | Statements of Operations |
| For the Year Ended September 30, 2021 |
| SEVEN CANYONS STRATEGIC INCOME FUND | SEVEN CANYONS WORLD INNOVATORS FUND | |||||||
| INVESTMENT INCOME: | ||||||||
| Dividends from unaffiliated issuers | $ | 755,644 | $ | 1,106,706 | ||||
| Foreign taxes withheld | (30,945 | ) | (57,908 | ) | ||||
| Total Investment Income | 724,699 | 1,048,798 | ||||||
| EXPENSES: | ||||||||
| Investment advisory fees (Note 6) | 245,315 | 4,284,994 | ||||||
| Administration fees | 44,502 | 293,852 | ||||||
| Custody fees | 35,856 | 137,185 | ||||||
| Legal fees | 3,734 | 19,274 | ||||||
| Audit and tax fees | 20,750 | 20,750 | ||||||
| Transfer agent fees | 50,180 | 439,696 | ||||||
| Trustees' fees and expenses | 3,282 | 20,665 | ||||||
| Registration and filing fees | 23,741 | 63,906 | ||||||
| Printing fees | 3,687 | 33,899 | ||||||
| Chief Compliance Officer fees | 4,447 | 36,721 | ||||||
| Insurance fees | 1,106 | 7,179 | ||||||
| Other expenses | 17,348 | 26,921 | ||||||
| Total Expenses | 453,948 | 5,385,042 | ||||||
| Less fees waived/reimbursed by investment adviser (Note 6) | ||||||||
| Investor Class | (120,396 | ) | (282,006 | ) | ||||
| Institutional Class | – | (247,564 | ) | |||||
| Total fees waived/reimbursed by investment adviser (Note 6) | (120,396 | ) | (529,570 | ) | ||||
| Net Expenses | 333,552 | 4,855,472 | ||||||
| NET INVESTMENT INCOME/(LOSS) | 391,147 | (3,806,674 | ) | |||||
| See Notes to Financial Statements. | |
| 24 | www.sevencanyonsadvisors.com |
| Seven Canyons Advisors | Statements of Operations |
| For the Year Ended September 30, 2021 |
| SEVEN CANYONS STRATEGIC INCOME FUND | SEVEN CANYONS WORLD INNOVATORS FUND | |||||||
| REALIZED AND UNREALIZED GAIN/(LOSS) ON INVESTMENTS AND FOREIGN CURRENCY: | ||||||||
| Net realized gain/(loss) on: | ||||||||
| Unaffiliated Investments | 8,167,008 | 50,605,818 | ||||||
| Foreign capital gains tax | (118,625 | ) | (332,066 | ) | ||||
| Foreign currency transactions | (15,895 | ) | (826,693 | ) | ||||
| Net realized gain | 8,032,488 | 49,447,059 | ||||||
| Change in unrealized appreciation/(depreciation) on: | ||||||||
| Unaffiliated Investments (net of change in foreign capital gains tax of $(302,677) and $0) | 4,776,542 | (21,279,096 | ) | |||||
| Translation of asset and liabilities denominated in foreign currency | (11,082 | ) | 13,253 | |||||
| Net change | 4,765,460 | (21,265,843 | ) | |||||
| NET REALIZED AND UNREALIZED GAIN ON INVESTMENTS AND FOREIGN CURRENCY | 12,797,948 | 28,181,216 | ||||||
| NET INCREASE IN NET ASSETS RESULTING FROM OPERATIONS | $ | 13,189,095 | $ | 24,374,542 | ||||
| See Notes to Financial Statements. | |
| Annual Report | September 30, 2021 | 25 |
| Seven Canyons | |
| Strategic Income Fund | Statements of Changes in Net Assets |
| For the Year Ended September 30, 2021 | For the Year Ended September 30, 2020 | |||||||
| OPERATIONS: | ||||||||
| Net investment income | $ | 391,147 | $ | 615,773 | ||||
| Net realized gain/(loss) on investments | 8,032,488 | (1,381,938 | ) | |||||
| Net change in unrealized appreciation/(depreciation) on investments | 4,765,460 | (179,479 | ) | |||||
| Net increase/(decrease) in net assets resulting from operations | 13,189,095 | (945,644 | ) | |||||
| DISTRIBUTIONS TO SHAREHOLDERS | ||||||||
| Investor Class | (459,102 | ) | (1,101,362 | ) | ||||
| From return of capital | ||||||||
| Investor Class | – | (51,250 | ) | |||||
| Total distributions | (459,102 | ) | (1,152,612 | ) | ||||
| BENEFICIAL SHARE TRANSACTIONS (Note 5): | ||||||||
| Investor Class | ||||||||
| Shares sold | 16,391,027 | 1,350,601 | ||||||
| Dividends reinvested | 435,821 | 1,137,069 | ||||||
| Shares redeemed | (5,830,368 | ) | (7,619,723 | ) | ||||
| Redemption fees | 2,578 | 433 | ||||||
| Net increase/(decrease) from beneficial share transactions | 10,999,058 | (5,131,620 | ) | |||||
| Net increase/(decrease) in net assets | 23,729,051 | (7,229,876 | ) | |||||
| NET ASSETS: | ||||||||
| Beginning of year | 27,216,794 | 34,446,670 | ||||||
| End of year | $ | 50,945,845 | $ | 27,216,794 | ||||
| See Notes to Financial Statements. | |
| 26 | www.sevencanyonsadvisors.com |
| Seven Canyons | |
| World Innovators Fund | Statements of Changes in Net Assets |
| For the Year Ended September 30, 2021 | For the Year Ended September 30, 2020 | |||||||
| OPERATIONS: | ||||||||
| Net investment loss | $ | (3,806,674 | ) | $ | (1,427,046 | ) | ||
| Net realized gain on investments | 49,447,059 | 15,006,708 | ||||||
| Net change in unrealized appreciation/(depreciation) on investments | (21,265,843 | ) | 45,589,158 | |||||
| Net increase in net assets resulting from operations | 24,374,542 | 59,168,820 | ||||||
| DISTRIBUTIONS TO SHAREHOLDERS | ||||||||
| Investor Class | (16,322,460 | ) | (634,788 | ) | ||||
| Institutional Class | (5,384,380 | ) | (37,652 | ) | ||||
| Total distributions | (21,706,840 | ) | (672,440 | ) | ||||
| BENEFICIAL SHARE TRANSACTIONS (Note 5): | ||||||||
| Investor Class | ||||||||
| Shares sold | 88,874,602 | 31,276,758 | ||||||
| Dividends reinvested | 15,796,640 | 614,289 | ||||||
| Shares redeemed | (53,298,312 | ) | (45,701,421 | ) | ||||
| Redemption fees | 52,900 | 11,752 | ||||||
| Net increase/(decrease) from beneficial share transactions | 51,425,830 | (13,798,622 | ) | |||||
| Institutional Class | ||||||||
| Shares sold | 127,209,449 | 26,543,435 | ||||||
| Dividends reinvested | 5,337,156 | 35,769 | ||||||
| Shares redeemed | (75,233,580 | ) | (2,727,851 | ) | ||||
| Redemption fees | 14,696 | 963 | ||||||
| Net increase from beneficial share transactions | 57,327,721 | 23,852,316 | ||||||
| Net increase in net assets | 111,421,253 | 68,550,074 | ||||||
| NET ASSETS: | ||||||||
| Beginning of year | 186,551,975 | 118,001,901 | ||||||
| End of year | $ | 297,973,228 | $ | 186,551,975 | ||||
| See Notes to Financial Statements. | |
| Annual Report | September 30, 2021 | 27 |
| Seven Canyons | |
| Strategic Income Fund – Investor Class | Financial Highlights |
| For a Share Outstanding Throughout the Years Presented |
| NET ASSET VALUE, BEGINNING OF PERIOD |
| INCOME/(LOSS) FROM OPERATIONS: |
| Net investment income(b) |
| Net realized and unrealized gain/(loss) on investments |
| Total from investment operations |
| LESS DISTRIBUTIONS: |
| From net investment income |
| From net realized gains on investments |
| Tax return of capital |
| Total Distributions |
| REDEMPTION FEES |
| NET INCREASE/(DECREASE) IN NET ASSET VALUE |
| NET ASSET VALUE, END OF PERIOD |
| TOTAL RETURN(d) |
| SUPPLEMENTAL DATA: |
| Net assets, end of period (in 000s) |
| RATIOS TO AVERAGE NET ASSETS |
| Operating expenses excluding reimbursement/waiver |
| Operating expenses including reimbursement/waiver |
| Net investment income including reimbursement/waiver |
| PORTFOLIO TURNOVER RATE |
| See Notes to Financial Statements. | |
| 28 | www.sevencanyonsadvisors.com |
| Seven Canyons | |
| Strategic Income Fund – Investor Class | Financial Highlights |
| For a Share Outstanding Throughout the Years Presented |
| For the Year Ended September 30, 2021 | For the Year Ended September 30, 2020 | For the Year Ended September 30, 2019 | For the Year Ended September 30, 2018(a) | For the Year Ended September 30, 2017 | ||||||||||||||
| $ | 11.45 | $ | 12.05 | $ | 12.74 | $ | 11.78 | $ | 10.62 | |||||||||
| 0.17 | 0.23 | 0.34 | 0.21 | 0.16 | ||||||||||||||
| 5.73 | (0.41 | ) | (0.62 | ) | 1.04 | 1.12 | ||||||||||||
| 5.90 | (0.18 | ) | (0.28 | ) | 1.25 | 1.28 | ||||||||||||
| (0.20 | ) | (0.17 | ) | (0.41 | ) | (0.29 | ) | (0.12 | ) | |||||||||
| – | (0.23 | ) | – | – | – | |||||||||||||
| – | (0.02 | ) | – | – | – | |||||||||||||
| (0.20 | ) | (0.42 | ) | (0.41 | ) | (0.29 | ) | (0.12 | ) | |||||||||
| 0.00 | (c) | 0.00 | (c) | 0.00 | (c) | 0.00 | (c) | – | ||||||||||
| 5.70 | (0.60 | ) | (0.69 | ) | 0.96 | 1.16 | ||||||||||||
| $ | 17.15 | $ | 11.45 | $ | 12.05 | $ | 12.74 | $ | 11.78 | |||||||||
| 51.66 | % | (1.60 | %) | (2.09 | %) | 10.71 | % | 12.09 | % | |||||||||
| $ | 50,946 | $ | 27,217 | $ | 34,447 | $ | 39,618 | $ | 45,045 | |||||||||
| 1.29 | % | 1.46 | % | 1.31 | % | 1.08 | % | 1.10 | % | |||||||||
| 0.95 | % | 0.95 | % | 0.95 | % | 0.95 | % | 0.95 | % | |||||||||
| 1.11 | % | 2.09 | % | 2.85 | % | 1.71 | % | 1.12 | % | |||||||||
| 90 | % | 128 | % | 50 | % | 72 | % | 34 | % | |||||||||
| (a) | Effective September 10, 2018, the Seven Canyons Strategic Income Fund merged into the ALPS Series Trust. The Fund was previously advised by Wasatch Advisors, Inc., and was recognized as the Wasatch Strategic Income Fund. |
| (b) | Calculated using the average shares method. |
| (c) | Less than $0.005 per share. |
| (d) | Assumes an initial investment on the business day before the first day of the fiscal period, with all dividends and distributions reinvested in additional shares on the reinvestment date, and redemption at the net asset value calculated on the last business day of the fiscal period. Total returns are for the period indicated and have not been annualized. Total returns would have been lower had certain expenses not been waived during the period. Returns shown do not reflect the deduction of taxes that a shareholder would pay on Fund distributions or the redemption of Fund shares. |
| See Notes to Financial Statements. | |
| Annual Report | September 30, 2021 | 29 |
| Seven Canyons | |
| World Innovators Fund – Investor Class | Financial Highlights |
| For a Share Outstanding Throughout the Years Presented |
| NET ASSET VALUE, BEGINNING OF PERIOD |
| INCOME/(LOSS) FROM OPERATIONS: |
| Net investment loss(b) |
| Net realized and unrealized gain/(loss) on investments |
| Total from investment operations |
| LESS DISTRIBUTIONS: |
| From net realized gains on investments |
| Total Distributions |
| REDEMPTION FEES |
| NET INCREASE/(DECREASE) IN NET ASSET VALUE |
| NET ASSET VALUE, END OF PERIOD |
| TOTAL RETURN(d) |
| SUPPLEMENTAL DATA: |
| Net assets, end of period (in 000s) |
| RATIOS TO AVERAGE NET ASSETS |
| Operating expenses excluding reimbursement/waiver |
| Operating expenses including reimbursement/waiver |
| Net investment (loss) including reimbursement/waiver |
| PORTFOLIO TURNOVER RATE |
| See Notes to Financial Statements. | |
| 30 | www.sevencanyonsadvisors.com |
| Seven Canyons | |
| World Innovators Fund – Investor Class | Financial Highlights |
| For a Share Outstanding Throughout the Years Presented |
| For the Year Ended September 30, 2021 | For the Year Ended September 30, 2020 | For the Year Ended September 30, 2019 | For the Year Ended September 30, 2018(a) | For the Year Ended September 30, 2017 | ||||||||||||||
| $ | 24.32 | $ | 15.97 | $ | 22.59 | $ | 22.75 | $ | 19.32 | |||||||||
| (0.38 | ) | (0.20 | ) | (0.05 | ) | (0.14 | ) | (0.13 | ) | |||||||||
| 3.88 | 8.65 | (2.04 | ) | 3.30 | 4.26 | |||||||||||||
| 3.50 | 8.45 | (2.09 | ) | 3.16 | 4.13 | |||||||||||||
| (2.33 | ) | (0.10 | ) | (4.53 | ) | (3.32 | ) | (0.70 | ) | |||||||||
| (2.33 | ) | (0.10 | ) | (4.53 | ) | (3.32 | ) | (0.70 | ) | |||||||||
| 0.01 | 0.00 | (c) | 0.00 | (c) | 0.00 | (c) | – | |||||||||||
| 1.18 | 8.35 | (6.62 | ) | (0.16 | ) | 3.43 | ||||||||||||
| $ | 25.50 | $ | 24.32 | $ | 15.97 | $ | 22.59 | $ | 22.75 | |||||||||
| 13.92 | % | 53.12 | % | (7.13 | %) | 14.77 | % | 22.23 | % | |||||||||
| $ | 204,662 | $ | 149,179 | $ | 111,449 | $ | 153,187 | $ | 191,021 | |||||||||
| 1.88 | % | 2.02 | % | 1.94 | % | 1.82 | % | 1.83 | % | |||||||||
| 1.75 | % | 1.75 | % | 1.75 | % | 1.81 | % | 1.83 | % | |||||||||
| (1.39 | %) | (1.12 | %) | (0.30 | %) | (0.65 | %) | (0.57 | %) | |||||||||
| 101 | % | 176 | % | 136 | % | 159 | % | 91 | % | |||||||||
| (a) | Effective September 10, 2018, the Seven Canyons World Innovators Fund merged into the ALPS Series Trust. The Fund was previously advised by Wasatch Advisors, Inc., and was recognized as the Wasatch Strategic Income Fund. |
| (b) | Calculated using the average shares method. |
| (c) | Less than $0.005 per share. |
| (d) | Assumes an initial investment on the business day before the first day of the fiscal period, with all dividends and distributions reinvested in additional shares on the reinvestment date, and redemption at the net asset value calculated on the last business day of the fiscal period. Total returns are for the period indicated and have not been annualized. Total returns would have been lower had certain expenses not been waived during the period. Returns shown do not reflect the deduction of taxes that a shareholder would pay on Fund distributions or the redemption of Fund shares. |
| See Notes to Financial Statements. | |
| Annual Report | September 30, 2021 | 31 |
| Seven Canyons | |
| World Innovators Fund – Institutional Class | Financial Highlights |
| For a Share Outstanding Throughout the Years Presented |
| NET ASSET VALUE, BEGINNING OF PERIOD |
| INCOME/(LOSS) FROM OPERATIONS: |
| Net investment loss(b) |
| Net realized and unrealized gain/(loss) on investments |
| Total from investment operations |
| LESS DISTRIBUTIONS: |
| From net realized gains on investments |
| Total Distributions |
| REDEMPTION FEES |
| NET INCREASE/(DECREASE) IN NET ASSET VALUE |
| NET ASSET VALUE, END OF PERIOD |
| TOTAL RETURN(d) SUPPLEMENTAL DATA: |
| Net assets, end of period (in 000s) |
| RATIOS TO AVERAGE NET ASSETS |
| Operating expenses excluding reimbursement/waiver |
| Operating expenses including reimbursement/waiver |
| Net investment (loss) including reimbursement/waiver |
PORTFOLIO TURNOVER RATE
| See Notes to Financial Statements. | |
| 32 | www.sevencanyonsadvisors.com |
| Seven Canyons | |
| World Innovators Fund – Institutional Class | Financial Highlights |
| For a Share Outstanding Throughout the Years Presented |
| For the Year Ended September 30, 2021 | For the Year Ended September 30, 2020 | For the Year Ended September 30, 2019 | For the Year Ended September 30, 2018(a) | For the Year Ended September 30, 2017 | ||||||||||||||
| $ | 24.69 | $ | 16.18 | $ | 22.78 | $ | 22.87 | $ | 19.36 | |||||||||
| (0.32 | ) | (0.20 | ) | (0.02 | ) | (0.05 | ) | (0.09 | ) | |||||||||
| 3.93 | 8.81 | (2.05 | ) | 3.28 | 4.30 | |||||||||||||
| 3.61 | 8.61 | (2.07 | ) | 3.23 | 4.21 | |||||||||||||
| (2.33 | ) | (0.10 | ) | (4.53 | ) | (3.32 | ) | (0.70 | ) | |||||||||
| (2.33 | ) | (0.10 | ) | (4.53 | ) | (3.32 | ) | (0.70 | ) | |||||||||
| 0.01 | 0.00 | (c) | 0.00 | (c) | – | – | ||||||||||||
| 1.29 | 8.51 | (6.60 | ) | (0.09 | ) | 3.51 | ||||||||||||
| $ | 25.98 | $ | 24.69 | $ | 16.18 | $ | 22.78 | $ | 22.87 | |||||||||
| 14.17 | % | 53.42 | % | (6.96 | %) | 15.03 | % | 22.55 | % | |||||||||
| $ | 93,312 | $ | 37,373 | $ | 6,553 | $ | 8,160 | $ | 3,836 | |||||||||
| 1.88 | % | 1.97 | % | 1.94 | % | 2.05 | % | 2.22 | % | |||||||||
| 1.55 | % | 1.55 | % | 1.55 | % | 1.55 | % | 1.55 | % | |||||||||
| (1.17 | %) | (1.01 | %) | (0.10 | %) | (0.23 | %) | (0.29 | %) | |||||||||
| 101 | % | 176 | % | 136 | % | 159 | % | 91 | % | |||||||||
| (a) | Effective September 10, 2018, the Seven Canyons World Innovators Fund merged into the ALPS Series Trust. The Fund was previously advised by Wasatch Advisors, Inc., and was recognized as the Wasatch Strategic Income Fund. |
| (b) | Calculated using the average shares method. |
| (c) | Less than $0.005 per share. |
| (d) | Assumes an initial investment on the business day before the first day of the fiscal period, with all dividends and distributions reinvested in additional shares on the reinvestment date, and redemption at the net asset value calculated on the last business day of the fiscal period. Total returns are for the period indicated and have not been annualized. Total returns would have been lower had certain expenses not been waived during the period. Returns shown do not reflect the deduction of taxes that a shareholder would pay on Fund distributions or the redemption of Fund shares. |
| See Notes to Financial Statements. | |
| Annual Report | September 30, 2021 | 33 |
| Seven Canyons Advisors | Notes to Financial Statements |
| September 30, 2021 |
| 1. | ORGANIZATION |
ALPS Series Trust (the “Trust”), a Delaware statutory trust, is an open-end management investment company registered under the Investment Company Act of 1940, as amended (the “1940 Act”). The Trust consists of multiple separate portfolios or series. This annual report describes the Seven Canyons Strategic Income Fund (the “Strategic Income Fund”) and Seven Canyons World Innovators Fund (the “World Innovators Fund”)(each individually a “Fund” or collectively “Funds”). The Strategic Income Fund’s primary investment objective is to capture current income with a secondary objective of long-term growth of capital and World Innovators Fund’s primary investment objective is long-term growth of capital. The Funds are each classified as diversified under the 1940 Act. The Strategic Income Fund currently offers Investor Class shares and the World Innovators Fund currently offers Investor Class and Institutional Class shares. Each share class has identical rights to earnings, assets and voting privileges, except for class specific expenses and exclusive rights to vote on matters affecting only individual classes. The Board of Trustees (the “Board”) may establish additional funds and classes of shares at any time in the future without shareholder approval.
| 2. | SIGNIFICANT ACCOUNTING POLICIES |
The accompanying financial statements were prepared in accordance with accounting principles generally accepted in the United States of America for investment companies (“U.S. GAAP”). Each Fund is considered an investment company under U.S. GAAP and follows the accounting and reporting guidance applicable to investment companies in the Financial Accounting Standards Board (“FASB”) Accounting Standards Codification Topic 946. The preparation of financial statements in conformity with U.S. GAAP requires management to make certain estimates and assumptions that affect the reported amounts of assets and liabilities and disclosures of contingent assets and liabilities at the date of the financial statements and the reported amounts of increases and decreases in net assets from operations during the period. Actual results could differ from those estimates. The following is a summary of significant accounting policies consistently followed by each Fund in preparation of its financial statements.
Investment Valuation: Each Fund generally values its securities based on market prices determined at the close of regular trading on the New York Stock Exchange (“NYSE”), normally 4:00 p.m. Eastern Time, on each day the NYSE is open for trading.
For equity securities and mutual funds that are traded on an exchange, the market price is usually the closing sale or official closing price on that exchange. In the case of equity securities not traded on an exchange, or if such closing prices are not otherwise available, the securities are valued at the mean of the most recent bid and ask prices on such day.
Equity securities that are primarily traded on foreign securities exchanges are valued at the last sale price or closing values of such securities on their respective foreign exchanges, except when an event occurs subsequent to the close of the foreign exchange and the close of the NYSE that was likely to have changed such value. In such an event, the fair value of those securities are determined in good faith through consideration of other factors in accordance with procedures established by and under the general supervision of the Board. The Funds will use a fair valuation model provided by an independent pricing service, which is intended to reflect fair value when a security’s value or a meaningful portion of a Fund’s portfolio is believed to have been materially affected by a valuation event that has occurred between the close of the exchange or market on which the security is traded and the close of the regular trading day on the NYSE. The Funds’ valuation procedures set forth certain triggers which instruct when to use the fair valuation model. Foreign securities, currencies, and other assets and liabilities denominated in foreign currencies are translated into U.S. Dollars at the exchange rate of said currencies against the U.S. Dollar, as of valuation time, as provided by an independent pricing service approved by the Board.
| 34 | www.sevencanyonsadvisors.com |
| Seven Canyons Advisors | Notes to Financial Statements |
| September 30, 2021 |
Redeemable securities issued by open-end registered investment companies are valued at the investment company’s applicable net asset value (“NAV”), with the exception of exchange-traded open-end investment companies, which are priced as equity securities.
When such prices or quotations are not available, or when the Fair Value Committee appointed by the Board believes that they are unreliable, securities may be priced using fair value procedures approved by the Board.
Fair Value Measurements: The Funds disclose the classification of their fair value measurements following a three-tier hierarchy based on the inputs used to measure fair value. Inputs refer broadly to the assumptions that market participants would use in pricing the asset or liability, including assumptions about risk. Inputs may be observable or unobservable. Observable inputs reflect the assumptions market participants would use in pricing the asset or liability that are developed based on market data obtained from sources independent of the reporting entity. Unobservable inputs reflect the reporting entity’s own assumptions about the assumptions market participants would use in pricing the asset or liability that are developed based on the best information available.
Various inputs are used in determining the value of the Funds’ investments as of the end of the reporting period. When inputs used fall into different levels of the fair value hierarchy, the level in the hierarchy within which the fair value measurement falls is determined based on the lowest level input that is significant to the fair value measurement in its entirety. The designated input levels are not necessarily an indication of the risk or liquidity associated with these investments. These inputs are categorized in the following hierarchy under applicable financial accounting standards:
| Level 1 – | Unadjusted quoted prices in active markets for identical investments, unrestricted assets or liabilities that the Fund has the ability to access at the measurement date; |
| Level 2 – | Quoted prices which are not active, quoted prices for similar assets or liabilities in active markets or inputs other than quoted prices that are observable (either directly or indirectly); and |
| Level 3 – | Significant unobservable prices or inputs (including the Fund’s own assumptions in determining the fair value of investments) where there is little or no market activity for the asset or liability at the measurement date. |
| Annual Report | September 30, 2021 | 35 |
| Seven Canyons Advisors | Notes to Financial Statements |
| September 30, 2021 |
The following is a summary of the inputs used to value the Funds’ investments as of September 30, 2021:
SEVEN CANYONS STRATEGIC INCOME FUND
| Investments in Securities at Value* | Level 1 - Unadjusted Quoted Prices | Level 2 - Other Significant Observable Inputs | Level 3 - Significant Unobservable Inputs | Total | ||||||||||||
| Common Stocks | ||||||||||||||||
| Diversified REITs | $ | – | $ | – | $ | 477,759 | $ | 477,759 | ||||||||
| Other | 17,053,580 | 21,137,948 | – | 38,191,528 | ||||||||||||
| Short Term Investment | 12,247,993 | – | – | 12,247,993 | ||||||||||||
| Total | $ | 29,301,573 | $ | 21,137,948 | $ | 477,759 | $ | 50,917,280 | ||||||||
SEVEN CANYONS WORLD INNOVATORS FUND
| Investments in Securities at Value* | Level 1 - Unadjusted Quoted Prices | Level 2 - Other Significant Observable Inputs | Level 3 - Significant Unobservable Inputs | Total | ||||||||||||
| Common Stocks | $ | 101,304,912 | $ | 175,590,090 | $ | – | $ | 276,895,002 | ||||||||
| Short Term Investment | 17,405,495 | – | – | 17,405,495 | ||||||||||||
| Total | $ | 118,710,407 | $ | 175,590,090 | $ | – | $ | 294,300,497 | ||||||||
| * | For a detailed Industry breakdown, see the accompanying Portfolio of Investments. |
| 36 | www.sevencanyonsadvisors.com |
| Seven Canyons Advisors | Notes to Financial Statements |
| September 30, 2021 |
The following is a reconciliation of assets in which Level 3 inputs were used in determining value:
| Seven Canyons Strategic Income Fund | Common Stock | Total | ||||||
| Balance as of September 30, 2020 | $ | 531,437 | $ | 531,437 | ||||
| Accrued discount/ premium | – | – | ||||||
| Realized Gain/(Loss) | – | – | ||||||
| Change in Unrealized Appreciation/(Depreciation) | (53,678 | ) | (53,678 | ) | ||||
| Purchases | – | – | ||||||
| Sales Proceeds | – | – | ||||||
| Transfer into Level 3 | – | – | ||||||
| Transfer out of Level 3 | – | – | ||||||
| Balance as of September 30, 2021 | $ | 477,759 | $ | 477,759 | ||||
| Net change in unrealized appreciation/(depreciation) included in the Statements of Operations attributable to Level 3 investments held at September 30, 2021 | $ | (53,678 | ) | $ | (53,678 | ) | ||
Quantitative information about Level 3 measurements as of September 30, 2021:
Seven Canyons Strategic Income Fund
| Asset Class | Fair Value | Valuation Technique(s) | Unobservable Input(s)(a) | Value/Range | ||||||||
| Common Stock | $ | 477,759 | Net Asset Value less Liquidity Discount Recent Transaction | Estimated Liquidity Discount Recent Transaction | 30% $1.00 | |||||||
| (a) | A change to the unobservable input may result in a significant change to the value of the investment as follows: A change to a multiple may affect the fair value of an investment. Generally, a decrease in this multiple will result in a decrease in the fair value of the investment. For Liquidity Discount, a decrease in the multiple will result in an increase in fair value of the investment. |
Cash & Cash Equivalents: The Funds consider their investment in a Federal Deposit Insurance Corporation (“FDIC”) insured interest bearing account to be cash and cash equivalents. Cash and cash equivalents are valued at cost plus any accrued interest. The Funds maintain cash balances, which, at times may exceed federally insured limits. The Funds maintain these balances with a high quality financial institution.
Concentration of Credit Risk: Each Fund places its cash with a banking institution, which is insured by the FDIC. The FDIC limit is $250,000. At various times throughout the year, the amount on deposit may exceed the FDIC limit and subject the Fund to a credit risk. The Funds do not believe that such deposits are subject to any unusual risk associated with investment activities.
Trust Expenses: Some expenses of the Trust can be directly attributed to a fund. Expenses that cannot be directly attributed to a fund are apportioned among all funds in the Trust based on average net assets of each fund, including Trustees’ fees and expenses.
Fund Expenses: Some expenses can be directly attributed to a Fund and are apportioned among the classes based on average net assets of each class.
| Annual Report | September 30, 2021 | 37 |
| Seven Canyons Advisors | Notes to Financial Statements |
| September 30, 2021 |
Class Expenses: Expenses that are specific to a class of shares are charged directly to that share class.
Federal Income Taxes: The Funds comply with the requirements under Subchapter M of the Internal Revenue Code of 1986, as amended, applicable to regulated investment companies and intend to distribute substantially all of their net taxable income and net capital gains, if any, each year so that it will not be subject to excise tax on undistributed income and gains. The Funds are not subject to income taxes to the extent such distributions are made.
As of and during the year ended September 30, 2021, the Funds did not have a liability for any unrecognized tax benefits in the accompanying financial statements. The Funds recognize interest and penalties, if any, related to tax liabilities as income tax expense in the Statements of Operations. The Funds file U.S. federal, state and local income tax returns as required. The Funds’ tax returns are subject to examination by the relevant tax authorities until expiration of the applicable statute of limitations, which is generally three years after the filing of the tax return for federal purposes and four years for most state returns. The Funds’ administrator has analyzed the Funds’ tax positions taken on federal and state income tax returns for all open tax years and has concluded that as of September 30, 2021, no provision for income tax is required in the Funds’ financial statements related to these tax positions.
In addition to the requirements of the Code, the Funds may also be subject to capital gains tax in India and potentially other foreign jurisdictions, on gains realized upon the sale of securities, payable upon repatriation of sales proceeds. Any realized losses in excess of gains in India may be carried forward to offset future gains. Funds with exposure to Indian securities and potentially other foreign jurisdictions accrue a deferred liability for unrealized gains in excess of available loss carryforwards based on existing tax rates and holding periods of the securities. As of September 30, 2021, Seven Canyons Strategic Income Fund, recorded a deferred liability for potential future India capital gains taxes of $362,943.
Investment Transactions and Investment Income: Investment transactions are accounted for on the date the investments are purchased or sold (trade date basis for financial reporting purposes). Realized gains and losses from investment transactions are reported on an identified cost basis. Interest income, which includes accretion of discounts and amortization of premiums, is accrued and recorded as earned using the effective interest method. Dividend income is recognized on the ex-dividend date, or for certain foreign securities, as soon as information is available to the Funds. Withholding taxes on foreign dividends are paid (a portion of which may be reclaimable) or provided for in accordance with the applicable country’s tax rules and rates and are disclosed in the Statements of Operations. All of the realized and unrealized gains and losses and net investment income are allocated daily to each class in proportion to its average daily net assets.
Foreign Securities: The Funds may directly purchase securities of foreign issuers. Investing in securities of foreign issuers involves special risks not typically associated with investing in securities of U.S. issuers. The risks include possible re-evaluation of currencies, the inability to repatriate foreign currency, less complete financial information about companies and possible future adverse political and economic developments. Moreover, securities of many foreign issuers and their markets may be less liquid and their prices more volatile than those of securities of comparable U.S. issuers.
| 38 | www.sevencanyonsadvisors.com |
| Seven Canyons Advisors | Notes to Financial Statements |
September 30, 2021
Foreign Currency Translation: Values of investments denominated in foreign currencies are converted into U.S. dollars using the current exchange rates each business day (generally 4:00 p.m. Eastern Time). Investment securities and other assets and liabilities denominated in foreign currencies are translated into U.S. dollar amounts at the date of valuation. Purchases and sales of investment securities and income and expense items denominated in foreign currencies are translated into U.S. dollar amounts on the respective dates of such transactions. The Funds do not isolate that portion of the results of operations resulting from changes in foreign exchange rates on investments from the fluctuations arising from changes in market prices of securities held. Such fluctuations are included with the net realized and unrealized gain or loss from investments. Reported net realized foreign exchange gains or losses arise from sales of foreign currencies, currency gains or losses realized between the trade and settlement dates on securities transactions, and the difference between the amounts of dividends, interest, and foreign withholding taxes recorded on the Funds' books and the U.S. dollar equivalent of the amounts actually received or paid. Net unrealized foreign exchange gains and losses arise from changes in the fair values of assets and liabilities, other than investments in securities at fiscal period-end, resulting from changes in exchange rates.
Foreign Exchange Transactions: The Funds may enter into foreign currency spot contracts to facilitate transactions in foreign securities or to convert foreign currency receipts into U.S. dollars. A foreign currency spot contract is an agreement between two parties to buy and sell currencies at the current market rate, for settlement generally within two business days. The U.S. dollar value of the contracts is determined using current currency exchange rates supplied by a pricing service. The contract is marked-to-market daily for settlements beyond one day and any change in market value is recorded as an unrealized gain or loss. When the contract is closed, a Fund records a realized gain or loss equal to the difference between the value on the open and close date. Losses may arise from changes in the value of the foreign currency, or if the counterparties do not perform under the contract’s terms. The maximum potential loss from such contracts is the aggregate face value in U.S. dollars at the time the contract was opened.
Distributions to Shareholders: The Funds normally pay dividends, if any, quarterly, and distribute capital gains, if any, on an annual basis. Income dividend distributions are derived from interest and other income a Fund receives from its investments, including short term capital gains. Long term capital gain distributions are derived from gains realized when a Fund sells a security it has owned for more than one year. The Funds may make additional distributions and dividends at other times if its investment advisor has determined that doing so may be necessary for the Fund to avoid or reduce taxes. Net investment income/(loss) and net realized gain/(loss) may differ for financial statement and tax purposes.
COVID-19 Risk: An outbreak of respiratory disease caused by a novel coronavirus was first detected in December 2019 and has now spread internationally. This coronavirus has resulted in closing borders, enhanced health screenings, partial population vaccination, healthcare service preparation and delivery, quarantines, cancellations, disruptions to supply chains and customer activity, government sponsored fiscal stimulus programs, various moratoria on the applicability of certain laws and regulations, as well as general concern and uncertainty. The impact of this coronavirus, (and the variants of such virus) and other epidemics and pandemics that may arise in the future, could affect the economies of many nations, individual companies, their securities (including equity and debt), and the market in general in ways that cannot necessarily be foreseen at the present time. In addition, the impact of infectious diseases in developing or emerging market countries may be greater due to less established health care systems. Health crises caused by the recent coronavirus outbreak may exacerbate other pre-existing political, social, financial, and economic risks in certain countries. The impact of the outbreak may last for an extended period of time.
| Annual Report | September 30, 2021 | 39 |
| Seven Canyons Advisors | Notes to Financial Statements |
September 30, 2021
| 3. | TAX BASIS INFORMATION |
Tax Basis of Distributions to Shareholders: The character of distributions made during the period from net investment income or net realized gains may differ from its ultimate characterization for federal income tax purposes. Also, due to the timing of dividend distributions, the fiscal year in which amounts are distributed may differ from the fiscal year in which the income or realized gain were recorded by the Funds. The amounts and characteristics of tax basis distributions are estimated at the time of distribution and composition of distributable earnings/(accumulated losses) are finalized at fiscal year-end.
The tax character of distributions paid by the Funds for the fiscal year ended September 30, 2021, were as follows:
| Ordinary Income | Long-Term Capital Gains | |||||||
| Seven Canyons Strategic Income Fund | $ | 459,102 | $ | – | ||||
| Seven Canyons World Innovators Fund | 15,229,773 | 6,477,067 | ||||||
The tax character of distributions paid by the Funds for the fiscal year ended September 30, 2020, were as follows:
| Ordinary Income | Long-Term Capital Gains | Return of Capital | ||||||||||
| Seven Canyons Strategic Income Fund | $ | 455,553 | $ | 645,809 | $ | 51,250 | ||||||
| Seven Canyons World Innovators Fund | – | 672,440 | – | |||||||||
Reclassifications: As of September 30, 2021, permanent differences in book and tax accounting were reclassified. The following reclassifications, which had no impact on results of operations or net assets, were recorded to reflect tax character:
| Paid-in Capital | Total Distributable Earnings | |||||||
| Seven Canyons Strategic Income Fund | $ | 51,162 | $ | (51,162 | ) | |||
| Seven Canyons World Innovators Fund | 308,729 | (308,729 | ) | |||||
To the extent these book and tax differences are permanent in nature, such amounts are reclassified at the end of the fiscal year among additional paid-in capital and distributable earnings on investments and foreign currency translations. The reclassifications generally relate to the tax treatment of partnerships. These reclassifications have no impact on the net asset values of the Funds.
| 40 | www.sevencanyonsadvisors.com |
| Seven Canyons Advisors | Notes to Financial Statements |
September 30, 2021
Unrealized Appreciation and Depreciation on Investments: As of September 30, 2021, the aggregate costs of investments, gross unrealized appreciation/(depreciation) and net unrealized appreciation for Federal tax purposes were as follows:
| Seven Canyons Strategic Income Fund | Seven Canyons World Innovators Fund | |||||||
| Gross unrealized appreciation (excess of value over tax cost) | $ | 10,273,705 | $ | 53,682,694 | ||||
| Gross unrealized depreciation (excess of tax cost over value) | (1,909,092 | ) | (23,228,596 | ) | ||||
| Net appreciation (depreciation) of foreign currency and derivatives | (370,818 | ) | 4,740 | |||||
| Net unrealized appreciation | $ | 7,993,795 | $ | 30,458,838 | ||||
| Cost of investments for income tax purposes | $ | 42,552,667 | $ | 263,846,399 | ||||
These temporary differences are primarily attributed to wash sales, passive foreign investment companies, and organizational expenses.
Components of Distributable Earnings: At September 30, 2021, components of distributable earnings were as follows:
| Seven Canyons Strategic Income Fund | Seven Canyons World Innovators Fund | |||||||
| Undistributed ordinary income | $ | 4,070,208 | $ | 14,030,581 | ||||
| Accumulated capital gains | 1,976,295 | 22,209,596 | ||||||
| Net unrealized appreciation | 7,993,795 | 30,458,838 | ||||||
| Total | $ | 14,040,298 | $ | 66,699,015 | ||||
| Annual Report | September 30, 2021 | 41 |
| Seven Canyons Advisors | Notes to Financial Statements |
September 30, 2021
| 4. | SECURITIES TRANSACTIONS |
Purchases and sales of securities, excluding short-term securities, during the year ended September 30, 2021, were as follows:
| Proceeds from Sales of | Purchases of Securities Securities | |||||||
| Seven Canyons Strategic Income Fund | $ | 29,741,152 | $ | 27,375,508 | ||||
| Seven Canyons World Innovators Fund | 338,676,257 | 265,667,095 | ||||||
| 5. | BENEFICIAL SHARE TRANSACTIONS |
The capitalization of the Trust consists of an unlimited number of shares of beneficial interest with no par value per share. Holders of the shares of the Funds have one vote for each share held and a proportionate fraction of a vote for each fractional share. All shares issued and outstanding are fully paid and are transferable and redeemable at the option of the shareholder. Shares have no pre-emptive rights. Neither the Funds nor any of their creditors have the right to require shareholders to pay any additional amounts solely because the shareholder owns the shares.
Shares redeemed within 60 days of purchase may incur a 2.00% redemption fee deducted from the redemption amount. For the year ended September 30, 2021, the redemption fees charged by a Fund, if any, are presented in the Statements of Changes in Net Assets.
| 42 | www.sevencanyonsadvisors.com |
| Seven Canyons Advisors | Notes to Financial Statements |
September 30, 2021
Transactions in common shares were as follows:
| For the Year Ended September 30, 2021 | For the Year Ended September 30, 2020 | |||||||
| Seven Canyons Strategic Income Fund | ||||||||
| Investor Class | ||||||||
| Shares sold | 964,533 | 124,311 | ||||||
| Shares issued in reinvestment of distributions to shareholders | 27,397 | 95,524 | ||||||
| Shares redeemed | (397,983 | ) | (702,215 | ) | ||||
| Net increase/(decrease) in shares outstanding | 593,947 | (482,380 | ) | |||||
| Seven Canyons World Innovators Fund | ||||||||
| Investor Class | ||||||||
| Shares sold | 3,267,871 | 1,486,894 | ||||||
| Shares issued in reinvestment of distributions to shareholders | 587,017 | 35,426 | ||||||
| Shares redeemed | (1,964,533 | ) | (2,364,863 | ) | ||||
| Net increase/(decrease) in shares outstanding | 1,890,355 | (842,543 | ) | |||||
| Institutional Class | ||||||||
| Shares sold | 4,618,438 | 1,265,969 | ||||||
| Shares issued in reinvestment of distributions to shareholders | 194,929 | 2,036 | ||||||
| Shares redeemed | (2,735,671 | ) | (159,189 | ) | ||||
| Net increase in shares outstanding | 2,077,696 | 1,108,816 | ||||||
Control is defined by the 1940 Act as the beneficial ownership, either directly or through one or more controlled companies, of more than 25% of the voting securities of a company. As of September 30, 2021, approximately 33% of the outstanding shares of the World Innovators Fund are held by one record shareholder that owns shares on behalf of its underlying beneficial owners. Share transaction activities of these shareholders could have a material impact on the Fund. As of September 30, 2021, the Strategic Income Fund did not have any shareholder or accounts that exceeded the 25% ownership threshold for disclosure.
| 6. | MANAGEMENT AND RELATED PARTY TRANSACTIONS |
Investment Advisory: Seven Canyons Advisors, LLC (the “Adviser”), subject to the authority of the Board, is responsible for the overall management and administration of the Funds’ business affairs. The Adviser manages the investments of the Funds in accordance with each Fund’s investment objective, policies and limitations, and investment guidelines established jointly by the Adviser and the Board.
| Annual Report | September 30, 2021 | 43 |
| Seven Canyons Advisors | Notes to Financial Statements |
September 30, 2021
Pursuant to the Investment Advisory Agreement (the “Advisory Agreement”) with the Adviser, the Strategic Income Fund pays the Adviser an annual management fee of 0.70% based on the Fund’s average daily net assets, and the World Innovators Fund pays the Adviser an annual management fee of 1.50% based on the Fund’s average daily net assets. The management fees are paid on a monthly basis. The Board may extend the Advisory Agreements for an additional one-year term. The Board and shareholders of the Funds may terminate the Advisory Agreement upon 30 days’ written notice. The Adviser may terminate the Advisory Agreement upon 60 days’ written notice.
Pursuant to a fee waiver letter agreement (the “Fee Waiver Agreement”), the Adviser has contractually agreed to limit the amount of the Total Annual Fund Operating Expenses, exclusive of interest, dividend expense on short sales/interest expense, taxes, brokerage commissions, other investment related costs, acquired fund fees and expenses, and extraordinary expenses such as litigation and other expenses not incurred in the ordinary course of business, for the Strategic Income Fund Investor Class shares and World Innovators Fund Investor Class shares and Institutional Class shares, to 0.95%, 1.75% and 1.55%, respectively, of each Fund’s average daily net assets of each class of shares. The Fee Waiver Agreement is in effect through January 31, 2022, and will thereafter continue in effect for successive twelve-month periods provided that such continuance is specifically approved at least annually by the Board and the Adviser does not provide at least 30 days written notice of non-continuance prior to the end of the then effective term. The Adviser will be permitted to recover, on a class-by-class basis, expenses it has borne through the Fee Waiver Agreement only to the extent that each Fund's expenses in later periods do not exceed the lesser of: (1) the contractual expense limit in effect at the time the Adviser waives or limits the expenses; or (2) the contractual expense limit in effect at the time the Adviser seeks to recover the expenses; provided, however, that the Fund will not be obligated to reimburse any such expenses borne by the Adviser more than three years after the date on which the fee or expense was waived or limited or assumed and paid by the Adviser, as calculated on a monthly basis. The Adviser may not discontinue this waiver without the approval by the Trust's Board. Fees waived or reimbursed for the year ended September 30, 2021 are disclosed in the Statements of Operations.
As of September 30, 2021, the balance of recoupable expenses was as follows:
| Expiring in 2022 | Expiring in 2023 | Expiring in 2024 | ||||||||||
| Seven Canyons Strategic Income Fund | ||||||||||||
| Investor | $ | 129,098 | $ | 149,027 | $ | 120,396 | ||||||
| Seven Canyons World Innovators Fund | ||||||||||||
| Institutional | 25,386 | 53,988 | 247,564 | |||||||||
| Investor | 239,226 | 312,479 | 282,006 | |||||||||
Administrator: ALPS Fund Services, Inc. (“ALPS”) (an affiliate of ALPS Distributors, Inc.) serves as administrator to each Fund. The Funds have agreed to pay expenses incurred in connection with its administrative activities. Pursuant to the Administration, Bookkeeping and Pricing Services Agreement with the Trust, ALPS will provide operational services to each Fund including, but not limited to, fund accounting and fund administration, and will generally assist in the Funds’ operations. The Funds’ administration fee is accrued on a daily basis and paid monthly. The officers of the Trust are employees of ALPS. Administration fees paid by each Fund for the fiscal period ended September 30, 2021, are disclosed in the Statements of Operations. ALPS is reimbursed by the Funds for certain out-of-pocket expenses.
| 44 | www.sevencanyonsadvisors.com |
| Seven Canyons Advisors | Notes to Financial Statements |
September 30, 2021
Transfer Agent: ALPS serves as transfer agent for each Fund under a Transfer Agency and Services Agreement with the Trust. Under this agreement, ALPS is paid an annual fee for services performed on behalf of the Funds plus fees for open accounts and is reimbursed for certain out-of-pocket expenses.
Compliance Services: ALPS provides Chief Compliance Officer services to each fund to monitor and test the policies and procedures of each Fund in conjunction with requirements under Rule 38a-1 of the 1940 Act pursuant to a Chief Compliance Officer Services Agreement with the Trust. Under this agreement, ALPS is paid an annual fee for services performed on behalf of each Fund and is reimbursed for certain out-of-pocket expenses.
Distribution: ALPS Distributors, Inc. (the “Distributor”) (an affiliate of ALPS) acts as the principal underwriter of the Funds’ shares pursuant to a Distribution Agreement with the Trust. Shares of the Funds are offered on a continuous basis through the Distributor, as agent of the Funds. The Distributor is not obligated to sell any particular amount of shares and is not entitled to any compensation for its services as the Funds’ principal underwriter pursuant to the Distribution Agreement.
| 7. | TRUSTEES |
As of September 30, 2021, there were three Trustees, all of whom are not “interested persons” (as defined in the 1940 Act) of the Trust (the “Independent Trustees”). The Independent Trustees of the Trust and Interested Trustees who are not currently employed by the Adviser, ALPS or other service providers receive a quarterly retainer of $13,500, plus $4,000 for each regular Board or Committee meeting attended and $2,000 for each special telephonic or in-person Board or Committee meeting attended. Additionally, the Audit Committee Chair receives a quarterly retainer of $1,250 and the Independent Chair receives a quarterly retainer of $3,250. The Independent Trustees and Interested Trustees who are not currently employed by the Adviser, ALPS or other service providers are also reimbursed for all reasonable out-of-pocket expenses relating to attendance at meetings. Officers of the Trust receive no salary or fees from the Trust. As discussed in Note 6, the Funds pay ALPS an annual fee for compliance services.
| 8. | RESTRICTED SECURITIES |
Restricted securities are securities that may only be resold upon registration under federal securities laws or in transactions exempt from such registration. In some cases, the issuer of restricted securities has agreed to register such securities for resale, at the issuer’s expense, either upon demand by a fund or in connection with another registered offering of the securities. Many restricted securities may be resold in the secondary market in transactions exempt from registration. Such restricted securities may be determined to be liquid. The Funds will not incur any registration costs upon such resale. The Funds’ restricted securities are valued at the price provided by pricing services or dealers in the secondary market or, if no market prices are available, at the fair value price as determined by the Fund Adviser or pursuant to the Fund’s fair value policy, subject to oversight by the Board. The Funds have acquired certain securities, the sale of which is restricted under applicable provisions of the Securities Act of 1933. It is possible that the fair value price may differ significantly from the amount that may ultimately be realized in the near term, and the difference could be material. At September 30, 2021, the Funds held the following restricted securities:
| Annual Report | September 30, 2021 | 45 |
| Seven Canyons Advisors | Notes to Financial Statements |
September 30, 2021
| Fund | Security Type | Acquisition Date | Amortized Cost | Fair Value | % of Net Assets | |||||||||||
| Seven Canyons Strategic Income Fund | ||||||||||||||||
| Star Asia Capital Corp. | Common Stocks | 2/22/07- | ||||||||||||||
| 5/11/15 | $ | 572,597 | $ | 477,759 | 0.94 | % | ||||||||||
Restricted securities under Rule 144a, including the aggregate value and percentage of net assets of each Fund, have been identified in the Portfolios of Investments.
| 9. | INDEMNIFICATIONS |
Under the Trust’s organizational documents, its officers and Trustees are indemnified against certain liabilities arising out of the performance of their duties to the Trust. Additionally, in the normal course of business, the Trust enters into contracts with service providers that may contain general indemnification clauses which may permit indemnification to the extent permissible under applicable law. The Trust’s maximum exposure under these arrangements is unknown; as such exposure would involve future claims that may be made against the Trust that have not yet occurred.
| 10. | SUBSEQUENT EVENTS |
Subsequent events after the date of the Statements of Assets and Liabilities have been evaluated through the date the financial statements were issued. Management has determined that there were no subsequent events to report through the issuance of these financial statements.
| 46 | www.sevencanyonsadvisors.com |
| Report of Independent Registered |
| Seven Canyons Advisors | Public Accounting Firm |
To the Shareholders of Seven Canyons Strategic Income Fund and Seven Canyons World Innovators Fund and Board of Trustees of ALPS Series Trust
Opinion on the Financial Statements
We have audited the accompanying statements of assets and liabilities, including the portfolios of investments, of Seven Canyons Strategic Income Fund and Seven Canyons World Innovators Fund (the “Funds”), each a series of ALPS Series Trust, as of September 30, 2021, the related statements of operations for the year then ended, the statements of changes in net assets for each of the two years in the period then ended, the related notes, and the financial highlights for each of the four years in the period then ended (collectively referred to as the “financial statements”). In our opinion, the financial statements present fairly, in all material respects, the financial position of each of the Funds as of September 30, 2021, the results of their operations for the year then ended, the changes in net assets for each of the two years in the period then ended, and the financial highlights for each of the four years in the period then ended, in conformity with accounting principles generally accepted in the United States of America.
The Funds’ financial highlights for the year ended September 30, 2017, were audited by other auditors whose report dated November 22, 2017, expressed an unqualified opinion on those financial highlights.
Basis for Opinion
These financial statements are the responsibility of the Funds’ management. Our responsibility is to express an opinion on the Funds’ financial statements based on our audits. We are a public accounting firm registered with the Public Company Accounting Oversight Board (United States) (“PCAOB”) and are required to be independent with respect to the Funds in accordance with the U.S. federal securities laws and the applicable rules and regulations of the Securities and Exchange Commission and the PCAOB.
We conducted our audits in accordance with the standards of the PCAOB. Those standards require that we plan and perform the audit to obtain reasonable assurance about whether the financial statements are free of material misstatement whether due to error or fraud.
Our audits included performing procedures to assess the risks of material misstatement of the financial statements, whether due to error or fraud, and performing procedures that respond to those risks. Such procedures included examining, on a test basis, evidence regarding the amounts and disclosures in the financial statements. Our procedures included confirmation of securities owned as of September 30, 2021, by correspondence with the custodians, issuers, and brokers. Our audits also included evaluating the accounting principles used and significant estimates made by management, as well as evaluating the overall presentation of the financial statements. We believe that our audits provide a reasonable basis for our opinion.
We have served as the Funds’ auditor since 2018.

COHEN & COMPANY, LTD.
Cleveland, Ohio
November 29, 2021
| Annual Report | September 30, 2021 | 47 |
| Seven Canyons Advisors | Additional Information |
September 30, 2021 (Unaudited)
| 1. | PROXY VOTING POLICIES AND VOTING RECORD |
A description of the policies and procedures that the Funds use to determine how to vote proxies relating to portfolio securities is available without charge, upon request, (i) by calling the Funds (toll-free) at 1-833-722-6966 or (ii) on the website of the Securities and Exchange Commission (the “SEC”) at http://www.sec.gov.
Information regarding how each Fund voted proxies relating to portfolio securities during the most recent 12-month period ended June 30 is available (i) without charge, upon request, by calling the Funds (toll-free) at 1-833-722-6966 or (ii) on the SEC’s website at http://www.sec.gov.
| 2. | PORTFOLIO HOLDINGS |
The Funds’ portfolio holdings are made available semi-annually in shareholder reports within 60 days after the close of the period for which the report is being made, as required by federal securities laws. Each Fund files its complete schedule of portfolio holdings with the SEC for the first and third fiscal quarters of each fiscal year as an exhibit to its reports on Form N-PORT. The Funds’ Form N-PORT reports are available on the SEC’s website at www.sec.gov. The Funds’ portfolio holdings are also available upon request, without charge, by calling (toll-free) 1-833-722-6966 or by writing to Seven Canyons Advisors at 22 East 100 South, Third Floor, Salt Lake City, Utah 84111.
| 3. | SHAREHOLDER PROXY RESULTS |
At a Special Meeting of Shareholders of the ALPS Series Trust, held on April 12, 2021, shareholders of record as of the close of business on March 1, 2021 voted to approve the following proposals:
Proposal 1: To elect Ward D. Armstrong to serve on the Board of Trustees until his resignation, retirement, death or removal or until his successor is duly elected and qualified.
| Shares Voted In Favor | Shares Voted Against or Abstentions |
| 162,259,659 | 244,729 |
Proposal 2: To elect Bradley J. Swenson to serve on the Board of Trustees until his resignation, retirement, death or removal or until his successor is duly elected and qualified.
| Shares Voted In Favor | Shares Voted Against or Abstentions |
| 162,281,980 | 222,408 |
| 48 | www.sevencanyonsadvisors.com |
| Seven Canyons Advisors | Additional Information |
September 30, 2021 (Unaudited)
4. TAX DESIGNATIONS
Qualified Dividend Income
The percentage of ordinary income dividends distributed during the calendar year ended December 31, 2020 are designated as qualified dividend income (QDI) as defined in Section 1(h)(11) of the Internal Revenue Code in the following percentages:
| Amount | |
| Seven Canyons Strategic Income Fund | 100.00% |
| Seven Canyons World Innovators Fund | 2.96%* |
Dividends Received Deduction
For corporate shareholders, the following ordinary dividends paid during the calendar year ended December 31, 2020 qualify for the corporate dividends received deduction:
| Amount | |
| Seven Canyons Strategic Income Fund | 100.00% |
| Seven Canyons World Innovators Fund | 0.00%* |
Pursuant to Section 852(b)(3) of the Internal Revenue Code, the Seven Canyons World Innovators Fund and Seven Canyons Strategic Income Fund designated $6,477,067 and $0 respectively as long-term capital gain dividends.
| * | Fund did not pay ordinary distribution in 2020 |
| Annual Report | September 30, 2021 | 49 |
| Seven Canyons Advisors | Liquidity Risk Management Program Disclosure |
| September 30, 2021 (Unaudited) |
The ALPS Series Trust (the “Trust”) has established a liquidity risk management program (the “Program”) to govern the Trust’s approach to managing liquidity risk for each fund in the series (each a “Fund”). The Program is overseen by the Liquidity Committee (the “Committee”), a committee comprised of representatives of the Trust and ALPS | SS&C. The Trust’s Board of Trustees (the “Board”) has approved the designation of the Committee to oversee the Program.
The Program’s principal objectives include supporting each Fund’s compliance with limits on investments in illiquid assets and mitigating the risk that a Fund will be unable to meet its redemption obligations in a timely manner. The Program also includes a number of elements that support the management and assessment of liquidity risk, including, among others, an annual assessment of factors that influence a Fund’s liquidity the periodic classification and re-classification of the Fund’s investments into groupings that reflect the Committee’s assessment of their relative liquidity under both current market conditions and reasonably foreseeable stressed conditions, as well as minimum levels of highly liquid investments.
At a meeting that occurred on May 20, 2021, the Board received a report from the Committee that addressed the operation of the Program and assessed its adequacy and effectiveness of implementation. The report revealed that, during the period covered by the report, there were no liquidity events that impacted the Funds or their ability to timely meet redemptions without dilution to existing shareholders. The report further discussed the liquidity classification methodology of each Fund, the effectiveness of the operation of certain Funds’ Highly Liquid Investment Minimum (“HLIM”) where applicable, and the liquidity classification of each Fund’s investments over the period. The report further noted that no material changes have been made to the Program since its implementation. The report provided to the Board included a conclusion that the Program appeared to be reasonably designed and operated effectively during the review period.
| 50 | www.sevencanyonsadvisors.com |
| Seven Canyons Advisors | Privacy Policy |
| September 30, 2021 (Unaudited) |
| FACTS | WHAT DO THE FUNDS DO WITH YOUR PERSONAL INFORMATION? |
| WHY? | Financial companies choose how they share your personal information. Federal law gives consumers the right to limit some but not all sharing. Federal law also requires us to tell you how we collect, share and protect your personal information. Please read this notice carefully to understand what we do. |
| WHAT? | The types of personal information we collect and share depend on the product or service you have with us. This information can include: |
| · Social Security number and account transactions | |
| · Account balances and transaction history | |
| · Wire transfer instructions | |
| HOW? | All financial companies need to share customers’ personal information to run their everyday business. In the section below, we list the reasons financial companies can share their customers’ personal information, the reasons a Fund chooses to share, and whether you can limit this sharing. |
REASONS WE CAN SHARE YOUR PERSONAL INFORMATION | DO THE FUNDS SHARE: | CAN YOU LIMIT THIS SHARING? | |
For our everyday business purposes – such as to process your transactions, maintain your account(s), respond to court orders and legal investigations, or report to credit bureaus | Yes | No | |
For our marketing purposes – to offer our products and services to you | No | We do not share. | |
| For joint marketing with other financial companies | No | We do not share. | |
For our affiliates’ everyday business purposes – information about your transactions and experiences | Yes | No | |
For our affiliates’ everyday business purposes – information about your creditworthiness | No | We do not share. | |
| For non-affiliates to market to you | No | We do not share. | |
| QUESTIONS? | Call 1-833-7-CANYON (833-722-6966) or go to www.sevencanyonsadvisors.com. | ||
| Annual Report | September 30, 2021 | 51 |
| Seven Canyons Advisors | Privacy Policy |
| September 30, 2021 (Unaudited) |
| WHO WE ARE | |
| Who is providing this notice? | Seven Canyons Strategic Income Fund and Seven Canyons World Innovators Fund (the “Funds”) |
| WHAT WE DO | |
| How do the Funds protect my personal information? | To protect your personal information from unauthorized access and use, we use security measures that comply with federal law. These measures include computer safeguards and secured files and buildings. |
| How do the Funds collect my personal information? | We collect your personal information, for example, when you · open an account · provide account information or give us your contact information · make a wire transfer or deposit money |
| Why can’t I limit all sharing? | Federal law gives you the right to limit only · sharing for affiliates’ everyday business purposes-information about your creditworthiness · affiliates from using your information to market to you · sharing for non-affiliates to market to you · State laws and individual companies may give you additional rights to limit sharing |
| DEFINITIONS | |
| Affiliates | Companies related by common ownership or control. They can be financial and nonfinancial companies. |
| Non-affiliates | Companies not related by common ownership or control. They can be financial and nonfinancial companies. · The Funds do not share with non-affiliates so they can market to you. |
| Joint marketing | A formal agreement between non-affiliated financial companies that together market financial products or services to you. · The Funds do not jointly market. |
| 52 | www.sevencanyonsadvisors.com |
| Seven Canyons Advisors | Privacy Policy |
| September 30, 2021 (Unaudited) |
| OTHER IMPORTANT INFORMATION | |
| California Residents | If your account has a California home address, your personal information will not be disclosed to nonaffiliated third parties except as permitted by applicable California law, and we will limit sharing such personal information with our affiliates to comply with California privacy laws that apply to us. |
| Vermont Residents | The State of Vermont requires financial institutions to obtain your consent prior to sharing personal information that they collect about you with affiliated companies and nonaffiliated third parties other than in certain limited circumstances. Except as permitted by law, we will not share personal information we collect about you with nonaffiliated third parties or other affiliated companies unless you provide us with your written consent to share such information. |
| Annual Report | September 30, 2021 | 53 |
| Seven Canyons Advisors | Trustees and Officers |
| September 30, 2021 (Unaudited) |
| INDEPENDENT TRUSTEES | |||||
| Name, Birth Year & Address* | Position(s) Held with Fund | Term of Office and Length of Time Served** | Principal Occupation(s) During Past 5 Years*** | Number of Funds in Fund Complex Overseen by Trustee**** | Other Directorships Held by Trustee During Past 5 Years*** |
| Ward D. Armstrong, Birth year: 1954 | Trustee and Chairman | Mr. Armstrong was appointed to the Board on May 27, 2016. Mr. Armstrong was appointed Chairman of the Board at the August 24, 2017 meeting of the Board of Trustees. | Mr. Armstrong is currently retired. From February 2010 to July 2015, he was Co- Founder and Managing Partner of NorthRock Partners, a private wealth advisory firm providing comprehensive wealth management and family office services to the high net-worth marketplace. Previously, he was Senior Vice President, Ameriprise Financial (1984 to 2007); Chairman of Ameriprise Trust Company (1996 to 2007) and President, American Express Institutional Asset Management (2002 to 2004). He has also served on several investment related Boards including Kenwood Capital Management, RiverSource Investments, American Express Asset Management International and was Chair of the Ordway Theatre Endowment Committee. | 11 | Mr. Armstrong is a Director of the Heartland Group, Inc. (3 funds). |
| * | All communications to Trustees and Officers may be directed to ALPS Series Trust c/o 1290 Broadway, Suite 1000, Denver, CO 80203. |
| ** | This is the period for which the Trustee or Officer began serving the Trust. Each Trustee serves an indefinite term, until such Trustee’s successor is elected and appointed, or such Trustee resigns or is deceased. Officers are elected on an annual basis. |
| *** | Except as otherwise indicated, each individual has held the office shown or other offices in the same company for the last five years. |
| **** | The Fund Complex currently consists of 11 series of the Trust. |
| 54 | www.sevencanyonsadvisors.com |
| Seven Canyons Advisors | Trustees and Officers |
| September 30, 2021 (Unaudited) |
| Name, Birth Year & Address* | Position(s) Held with Fund | Term of Office and Length of Time Served** | Principal Occupation(s) During Past 5 Years*** | Number of Funds in Fund Complex Overseen by Trustee**** | Other Directorships Held by Trustee During Past 5 Years*** |
| J. Wayne Hutchens, Birth year: 1944 | Trustee | Mr. Hutchens was elected to the Board on October 30, 2012. | Mr. Hutchens is currently retired. From 2000 to January 2020, he served as Trustee of the Denver Museum of Nature and Science and from May 2012 to February 2020, he served as Trustee of Children’s Hospital Colorado. From April 2006 to December 2012, he served as President and CEO of the University of Colorado (CU) Foundation and from April 2009 to December 2012, he was Executive Director of the CU Real Estate Foundation. Mr. Hutchens is also Director of AMG National Trust Bank (June 2012 to present). Prior to these positions, Mr. Hutchens spent 29 years in the banking industry, retiring as Chairman of Chase Bank Colorado. | 11 | Mr. Hutchens is a Director of RiverNorth Opportunities Fund, Inc. (2013 to present), RiverNorth Opportunistic Municipal Income Fund, Inc. (2018 to present), RiverNorth/Doubleline Strategic Opportunity Fund, Inc. (2018 to present), RiverNorth Specialty Finance Corporation (2018 to present), RiverNorth Managed Duration Municipal Income Fund, Inc. (2019 to present), RiverNorth Flexible Municipal Income Fund, Inc. (2020 to present). He is an Advisory Board member of RiverNorth Funds (3 funds) (2020 to present). |
| * | All communications to Trustees and Officers may be directed to ALPS Series Trust c/o 1290 Broadway, Suite 1000, Denver, CO 80203. |
| ** | This is the period for which the Trustee or Officer began serving the Trust. Each Trustee serves an indefinite term, until such Trustee’s successor is elected and appointed, or such Trustee resigns or is deceased. Officers are elected on an annual basis. |
| *** | Except as otherwise indicated, each individual has held the office shown or other offices in the same company for the last five years. |
| **** | The Fund Complex currently consists of 11 series of the Trust. |
| Annual Report | September 30, 2021 | 55 |
| Seven Canyons Advisors | Trustees and Officers |
| September 30, 2021 (Unaudited) |
| Name, Birth Year & Address* | Position(s) Held with Fund | Term of Office and Length of Time Served** | Principal Occupation(s) During Past 5 Years*** | Number of Funds in Fund Complex Overseen by Trustee**** | Other Directorships Held by Trustee During Past 5 Years*** |
Patrick Seese, Birth year: 1971 | Trustee | Mr. Seese was elected to the Board on October 30, 2012. | Mr. Seese is an owner and a Managing Director of Integris Partners, a middle-market investment banking firm serving closely-held companies, financial sponsors and public companies (February 2008 to present). Prior to this, Mr. Seese was a Managing Director of Headwaters MB, a middle-market investing banking firm (December 2003 to February 2008). Prior to that, Mr. Seese worked in Credit Suisse First Boston’s Mergers and Acquisitions Group and served as Head of Corporation Development, Katy Industries, a publicly traded industrial and consumer products company and at Deloitte & Touche LLP, where he began his career in 1994. | 11 | Mr. Seese is a Director of The Mile High Five Foundation (2013 to present) and SJ Panthers Foundation (2016 to present). |
| * | All communications to Trustees and Officers may be directed to ALPS Series Trust c/o 1290 Broadway, Suite 1000, Denver, CO 80203. |
| ** | This is the period for which the Trustee or Officer began serving the Trust. Each Trustee serves an indefinite term, until such Trustee’s successor is elected and appointed, or such Trustee resigns or is deceased. Officers are elected on an annual basis. |
| *** | Except as otherwise indicated, each individual has held the office shown or other offices in the same company for the last five years. |
| **** | The Fund Complex currently consists of 11 series of the Trust. |
| 56 | www.sevencanyonsadvisors.com |
| Seven Canyons Advisors | Trustees and Officers |
| September 30, 2021 (Unaudited) |
| Name, Birth Year & Address* | Position(s) Held with Fund | Term of Office and Length of Time Served** | Principal Occupation(s) During Past 5 Years*** | Number of Funds in Fund Complex Overseen by Trustee**** | Other Directorships Held by Trustee During Past 5 Years*** |
Merrillyn J. Kosier, Birth year: 1959 | Trustee | Ms. Kosier was elected to the Board on November 17, 2021. | Ms. Kosier retired from Ariel Investments as Executive Vice President in 2019. During her tenure at Ariel Investments, she served as Chief Marketing Officer, Ariel Mutual Funds since 2007; Trustee for Ariel Investment Trust since 2003 and President of Ariel Distributors, LLC since 2002. From 2006 to present, she has served as Trustee at the Harris Theater For Music and Dance (not-for-profit organization) and is currently Executive Vice Chair. | 11 | Ms. Kosier is Board Director at the Arts Club of Chicago (2021 to present). |
| * | All communications to Trustees and Officers may be directed to ALPS Series Trust c/o 1290 Broadway, Suite 1000, Denver, CO 80203. |
| ** | This is the period for which the Trustee or Officer began serving the Trust. Each Trustee serves an indefinite term, until such Trustee’s successor is elected and appointed, or such Trustee resigns or is deceased. Officers are elected on an annual basis. |
| *** | Except as otherwise indicated, each individual has held the office shown or other offices in the same company for the last five years. |
| **** | The Fund Complex currently consists of 11 series of the Trust. |
| Annual Report | September 30, 2021 | 57 |
| Seven Canyons Advisors | Trustees and Officers |
| September 30, 2021 (Unaudited) |
| INTERESTED TRUSTEE | |||||
| Name, Birth Year & Address* | Position(s) Held with Fund | Term of Office and Length of Time Served** | Principal Occupation(s) During Past 5 Years*** | Number of Funds in Fund Complex Overseen by Trustee**** | Other Directorships Held by Trustee During Past 5 Years*** |
Bradley J. Swenson, Birth year: 1972 | Trustee | Mr. Swenson was elected to the Board on April 12, 2021. | Mr. Swenson joined ALPS Fund Services, Inc. (“ALPS”) in 2004 and had served as its President since June 2019 until June 2021. In this role, he served as an officer to certain other closed-end and open-end investment companies. He previously served as the Chief Operating Officer of ALPS (2015-2019). Mr. Swenson also previously served as Chief Compliance Officer to ALPS, its affiliated entities, and to certain ETF, closed-end and open-end investment companies (2004-2015). | 11 | None |
| * | All communications to Trustees and Officers may be directed to ALPS Series Trust c/o 1290 Broadway, Suite 1000, Denver, CO 80203. |
| ** | This is the period for which the Trustee or Officer began serving the Trust. Each Trustee serves an indefinite term, until such Trustee’s successor is elected and appointed, or such Trustee resigns or is deceased. Officers are elected on an annual basis. |
| *** | Except as otherwise indicated, each individual has held the office shown or other offices in the same company for the last five years. |
| **** | The Fund Complex currently consists of 11 series of the Trust. |
| 58 | www.sevencanyonsadvisors.com |
| Seven Canyons Advisors | Trustees and Officers |
| September 30, 2021 (Unaudited) |
| OFFICERS | |||
Name, Birth Year & Address* | Position(s) Held with Fund | Term of Office and Length of Time Served** | Principal Occupation(s) During Past 5 Years*** |
Dawn Cotten Birth year: 1977 | President | Since June 2021 | Ms. Cotten joined ALPS in 2009 and is currently Senior Vice President of Fund Administration and Relationship Management of ALPS. She has served in that role since January 2020. Prior to that, Ms. Cotten served as Senior Vice President (2017-2020) and Vice President of ALPS Relationship Management (2013-2017). |
Erich Rettinger Birth year: 1985 | Treasurer | Since August 2020 | Mr. Rettinger joined ALPS in 2007 and is currently Vice President and Fund Controller of ALPS. He has served as Fund Controller of ALPS (since 2013) and Fund Accounting of ALPS (2013- 2017). He also served as Assistant Treasurer of the Trust (May 2019-August 2020). Mr. Rettinger is also Treasurer of the Clough Long/Short Equity Fund, Clough Global Opportunities Fund, Clough Global Dividend and Income Fund and Clough Global Equity Fund. Mr. Rettinger is also Assistant Treasurer of the Stone Harbor Investment Funds. |
Patrick Rogers+ Birth year: 1966 | Secretary | Since November 2021 | Mr. Rogers has served as Senior Legal Counsel of ALPS since September 2021 and previously served as Compliance Counsel for Mercer Advisors from 2018 to 2021 and Contract Attorney for CACI, Inc. from 2014 to 2018. |
Anne M. Berg Birth year: 1973 | Assistant Secretary | Since August 2018 | Ms. Berg joined ALPS as Senior Investment Company Act Paralegal in February 2017. Prior to joining ALPS, she was a Senior Legal Manager at Janus Capital Management LLC (2000-2017). |
Lucas D. Foss Birth year: 1977 | Chief Compliance Officer | Since January 2018 | Mr. Foss rejoined ALPS in November 2017 as Vice President and Deputy Chief Compliance Officer. Prior to his current role, Mr. Foss served as the Director of Compliance at Transamerica Asset Management (2015- 2017) and Deputy Chief Compliance Officer at ALPS (2012- 2015). Mr. Foss is also CCO of X-Square Balanced Fund, Goehring & Rozencwajg Investment Funds, Broadstone Real Estate Access Fund, Inc., Clough Global Funds; Clough Funds Trust; SPDR® S&P 500® ETF Trust, SPDR® Dow Jones® Industrial Average ETF Trust, SPDR® S&P MIDCAP 400® ETF Trust and 1WS Credit Income Fund. |
| Annual Report | September 30, 2021 | 59 |
| Seven Canyons Advisors | Trustees and Officers |
| September 30, 2021 (Unaudited) |
| * | All communications to Trustees and Officers may be directed to ALPS Series Trust c/o 1290 Broadway, Suite 1000, Denver, CO 80203. |
| ** | This is the period for which the Trustee or Officer began serving the Trust. Each Trustee serves an indefinite term, until such Trustee’s successor is elected and appointed, or such Trustee resigns or is deceased. Officers are elected on an annual basis. |
| *** | Except as otherwise indicated, each individual has held the office shown or other offices in the same company for the last five years. |
| **** | The Fund Complex currently consists of 11 series of the Trust. |
| + | Appointed November 18, 2021 |
Additional information about members of the Board of Trustees and officers of the Trust is available in the Statement of Additional Information and is available, without charge, upon request, by calling the Funds (toll-free) at 1-833-722-6966.
| 60 | www.sevencanyonsadvisors.com |

Must be accompanied or preceded by a prospectus.
ALPS Distributors, Inc. is the Distributor of the Funds.
| (b) | Not applicable. |
Item 2. Code of Ethics.
| (a) | The registrant, as of the end of the period covered by this report, has adopted a code of ethics that applies to the registrant’s principal executive officer, principal financial officer, principal accounting officer or controller or any persons performing similar functions on behalf of the registrant. |
(b) Not applicable.
| (c) | During the period covered by this report, no amendments to the provisions of the code of ethics adopted in Item 2(a) above were made. |
| (d) | During the period covered by this report, no implicit or explicit waivers to the provisions of the code of ethics adopted in Item 2(a) above were granted. |
| (e) | Not applicable. |
| (f) | The registrant’s Code of Ethics is attached as an Exhibit to this report. |
Item 3. Audit Committee Financial Expert.
The Board of Trustees of the registrant has determined that the registrant has at least one Audit Committee Financial Expert serving on its audit committee. The Board of Trustees of the registrant has designated Patrick Seese, as the registrant’s “Audit Committee Financial Experts.” Mr. Seese is “independent” as defined in paragraph (a)(2) of Item 3 to Form N-CSR.
Item 4. Principal Accountant Fees and Services.
| (a) | Audit Fees: For the registrant’s fiscal years ended September 30, 2021 and September 30, 2020, the aggregate fees billed for professional services rendered by the principal accountant for the audit of the registrant’s annual financial statements were $153,300 and $135,950, respectively. For the registrant’s fiscal years ended September 30, 2020 and 2021, Cohen & Company, Ltd. served as principal accountant. In 2021, the amount of $153,300 was paid to Cohen & Company, Ltd. and in 2020, the amount of $135,950 was paid to Cohen & Company, Ltd. |
| (b) | Audit-Related Fees: For the registrant’s fiscal years ended September 30, 2021 and September 30, 2020, the aggregate fees billed for assurance and related services by the principal accountant that were reasonably related to the performance of the audit of the registrant’s financial statements and are not reported under paragraph (a) of this Item were $0 and $0, respectively. |
| (c) | Tax Fees: For the registrant’s fiscal years ended September 30, 2021 and September 30, 2020, the aggregate fees billed for professional services rendered by the principal accountant for tax compliance, tax advice and tax planning were $31,000 and $27,900, respectively. The fiscal year 2021 and 2020 tax fees were for services for dividend calculation, excise tax preparation and tax return preparation. For the registrant’s fiscal years ended September 30, 2021 and September 30, 2020, Cohen & Company, Ltd. served as principal accountant. In 2021, the amount of $31,000 was paid to Cohen & Company, Ltd. and in 2020, the amount of $27,900 was paid to Cohen & Company, Ltd. |
| (d) | All Other Fees: For the registrant’s fiscal year ended September 30, 2021, $1,000 of other fees were billed to registrant by the principal accountant, Cohen & Company, Ltd. For the registrant’s fiscal year ended September 30, 2020, $1,000 of other fees were billed to registrant by the principal accountant for services other than the services reported in paragraphs (a) through (c) of this Item. |
| (e)(1) | Audit Committee Pre-Approval Policies and Procedures: All services to be performed by the registrant’s principal accountant must be pre-approved by the registrant’s audit committee. |
| (e)(2) | No services described in paragraphs (b) through (d) of this Item were approved by the registrant’s audit committee pursuant to paragraph (c)(7)(i)(C) of Rule 2-01 of Regulation S-X. |
| (f) | Not applicable. |
| (g) | The aggregate non-audit fees billed by the registrant’s accountant for services rendered to the registrant, and rendered to the registrant’s investment adviser (not including any sub-adviser whose role is primarily portfolio management and is subcontracted with or overseen by another investment adviser), and any entity controlling, controlled by, or under common control with the adviser that provides ongoing services to the registrant, were $32,000 in fiscal year ended September 30, 2021 and $28,900 in fiscal year ended September 30, 2020. These fees consisted of tax fees billed to the registrant as described in response to paragraph (c) of this Item. For the registrant’s fiscal years ended September 30, 2021 and September 30, 2020, Cohen & Company, Ltd. served as principal accountant. |
| (h) | The registrant’s audit committee has considered whether the provision of non-audit services that were rendered to the registrant’s investment adviser (not including any sub-adviser whose role is primarily portfolio management and is subcontracted with or overseen by another investment adviser), and any entity controlling, controlled by, or under common control with the investment adviser that provides ongoing services to the registrant that were not pre-approved pursuant to paragraph (c)(7)(ii) of Rule 2-01 of Regulation S-X, is compatible with maintaining the principal accountant’s independence and has determined that the provision of such non-audit services is compatible with maintaining the principal accountant’s independence. |
Item 5. Audit Committee of Listed Registrants.
Not applicable.
Item 6. Investments.
| (a) | Schedule of Investments is included as part of the Reports to Stockholders filed under Item 1 of this Form N-CSR. |
| (b) | Not applicable. |
Item 7. Disclosure of Proxy Voting Policies and Procedures for Closed-End Management Investment Companies.
Not applicable to the registrant.
Item 8. Portfolio Managers of Closed-End Management Investment Companies.
Not applicable to the registrant.
Item 9. Purchases of Equity Securities by Closed-End Management Investment Company and Affiliated Purchasers.
Not applicable to the registrant.
Item 10. Submission of Matters to Vote of Security Holders.
There have been no material changes to the procedures by which shareholders may recommend nominees to the registrant’s Board of Trustees, where those changes were implemented after the registrant last provided disclosure in response to the requirements of Item 407(c)(2)(iv) of Regulation S-K, or this Item.
Item 11. Controls and Procedures.
| (a) | The registrant’s principal executive officer and principal financial officer have evaluated the registrant’s disclosure controls and procedures (as defined in Rule 30a-3(c) under the Investment Company Act of 1940, as amended) within 90 days of this report and have concluded that the registrant’s disclosure controls and procedures were effective as of that date. |
| (b) | There was no change in the registrant’s internal control over financial reporting (as defined in Rule 30a-3(d) under the Investment Company Act of 1940, as amended) during the period covered by this report that has materially affected, or is reasonably likely to materially affect, the registrant’s internal control over financial reporting. |
Item 12. Disclosure of Securities Lending Activities for Closed-End Management Investment Companies.
Not applicable to the registrant.
Item 13. Exhibits.
| (a)(2) | The certifications required by Rule 30a-2(a) of the Investment Company Act of 1940, as amended, and Section 302 of the Sarbanes-Oxley Act of 2002 are attached hereto as Exhibit 99.Cert. |
| (a)(3) | None. |
| (a)(4) | Not applicable. |
SIGNATURES
Pursuant to the requirements of the Securities Exchange Act of 1934 and the Investment Company Act of 1940, the registrant has duly caused this report to be signed on its behalf by the undersigned, thereunto duly authorized.
ALPS SERIES TRUST
| By: | /s/ Dawn Cotten | |
| Dawn Cotten | ||
| President (Principal Executive Officer) | ||
| Date: | December 6, 2021 |
Pursuant to the requirements of the Securities Exchange Act of 1934 and the Investment Company Act of 1940, this report has been signed below by the following persons on behalf of the registrant and in the capacities and on the dates indicated.
| By: | /s/ Dawn Cotten | |
| Dawn Cotten | ||
| President (Principal Executive Officer) | ||
| Date: | December 6, 2021 | |
| By: | /s/ Erich Rettinger | |
| Erich Rettinger | ||
| Treasurer (Principal Financial Officer) | ||
| Date: | December 6, 2021 |