UNITED STATES
SECURITIES AND EXCHANGE COMMISSION
Washington, D.C. 20549
Form N-CSR
CERTIFIED SHAREHOLDER REPORT OF REGISTERED
MANAGEMENT INVESTMENT COMPANIES
Investment Company Act File Number: 811-22777
Eaton Vance Municipal Income 2028 Term Trust
(Exact Name of Registrant as Specified in Charter)
One Post Office Square, Boston, Massachusetts 02109
(Address of Principal Executive Offices)
Deidre E. Walsh
One Post Office Square, Boston, Massachusetts 02109
(Name and Address of Agent for Services)
(617) 482-8260
(Registrant’s Telephone Number)
January 31
Date of Fiscal Year End
January 31, 2024
Date of Reporting Period
Item 1. Reports to Stockholders


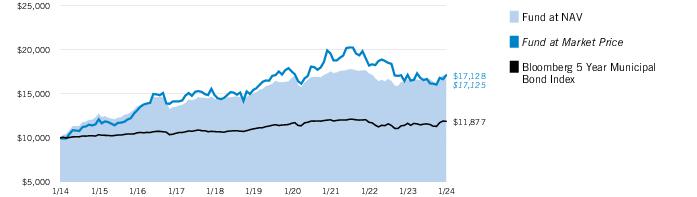
| % Average Annual Total Returns1,2 | Inception Date | One Year | Five Years | Since Inception |
| Fund at NAV | 03/28/2013 | 2.80% | 2.60% | 4.33% |
| Fund at Market Price | — | (0.18) | 2.10 | 3.69 |
| Bloomberg 5 Year Municipal Bond Index | — | 1.92% | 1.50% | 1.69% |
| % Premium/Discount to NAV3 | |
| As of period end | (6.49)% |
| Distributions 4 | |
| Total Distributions per share for the period | $0.737 |
| Distribution Rate at NAV | 4.95% |
| Taxable-Equivalent Distribution Rate at NAV | 8.36 |
| Distribution Rate at Market Price | 5.29 |
| Taxable-Equivalent Distribution Rate at Market Price | 8.94 |
| % Total Leverage5 | |
| Residual Interest Bond (RIB) Financing | 15.48% |
| Credit Quality (% of total investments)1,2 |
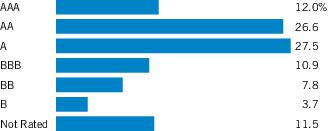
| 1 | For purposes of the Fund’s rating restrictions, ratings are based on Moody’s Investors Service, Inc. (“Moody’s”), S&P Global Ratings (“S&P”) or Fitch Ratings (“Fitch”), as applicable. If securities are rated differently by the ratings agencies, the highest rating is applied. Ratings, which are subject to change, apply to the creditworthiness of the issuers of the underlying securities and not to the Fund or its shares. Credit ratings measure the quality of a bond based on the issuer’s creditworthiness, with ratings ranging from AAA, being the highest, to D, being the lowest based on S&P’s measures. Ratings of BBB or higher by S&P or Fitch (Baa or higher by Moody’s) are considered to be investment-grade quality. Credit ratings are based largely on the ratings agency’s analysis at the time of rating. The rating assigned to any particular security is not necessarily a reflection of the issuer’s current financial condition and does not necessarily reflect its assessment of the volatility of a security’s market value or of the liquidity of an investment in the security. Holdings designated as “Not Rated” (if any) are not rated by the national ratings agencies stated above. |
| 2 | The chart includes the municipal bonds held by a trust that issues residual interest bonds, consistent with the Portfolio of Investments. |
| † | The views expressed in this report are those of the portfolio manager(s) and are current only through the date stated at the top of this page. These views are subject to change at any time based upon market or other conditions, and Eaton Vance and the Fund(s) disclaim any responsibility to update such views. These views may not be relied upon as investment advice and, because investment decisions are based on many factors, may not be relied upon as an indication of trading intent on behalf of any Eaton Vance fund. This commentary may contain statements that are not historical facts, referred to as “forward-looking statements.” The Fund’s actual future results may differ significantly from those stated in any forward-looking statement, depending on factors such as changes in securities or financial markets or general economic conditions, the volume of sales and purchases of Fund shares, the continuation of investment advisory, administrative and service contracts, and other risks discussed from time to time in the Fund’s filings with the Securities and Exchange Commission. |
| ‡ | The information contained herein is provided for informational purposes only and does not constitute a solicitation of an offer to buy or sell Fund shares. Common shares of the Fund are available for purchase and sale only at current market prices in secondary market trading. |
| 1 | Bloomberg 5 Year Municipal Bond Index is an unmanaged index of municipal bonds traded in the U.S. with maturities ranging from 4-6 years. Unless otherwise stated, index returns do not reflect the effect of any applicable sales charges, commissions, expenses, taxes or leverage, as applicable. It is not possible to invest directly in an index. |
| 2 | Performance results reflect the effects of leverage. Performance since inception for an index, if presented, is the performance since the Fund’s or oldest share class’ inception, as applicable. |
| 3 | The shares of the Fund often trade at a discount or premium to their net asset value. The discount or premium may vary over time and may be higher or lower than what is quoted in this report. For up-to-date premium/discount information, please refer to https://funds.eatonvance.com/closed-end-fund-prices.php. |
| 4 | The Distribution Rate is based on the Fund’s last regular distribution per share in the period (annualized) divided by the Fund’s NAV or market price at the end of the period. The Fund’s distributions may be comprised of amounts characterized for federal income tax purposes as tax-exempt income, qualified and non-qualified ordinary dividends, capital gains and nondividend distributions, also known as return of capital. For additional information about nondividend distributions, please refer to Eaton Vance Closed-End Fund Distribution Notices (19a) posted on our website, eatonvance.com. The Fund will determine the federal income tax character of distributions paid to a shareholder after the end of the calendar year. This is reported on the IRS form 1099-DIV and provided to the shareholder shortly after each year-end. For information about the tax character of distributions made in prior calendar years, please refer to Performance-Tax Character of Distributions on the Fund’s webpage available at eatonvance.com. The Fund’s distributions are determined by the investment adviser based on its current assessment of the Fund’s long-term return potential. Fund distributions may be affected by numerous factors including changes in Fund performance, the cost of |
| financing for leverage, portfolio holdings, realized and projected returns, and other factors. As portfolio and market conditions change, the rate of distributions paid by the Fund could change. Taxable- equivalent performance is based on the highest combined federal and state income tax rates, where applicable. Lower tax rates would result in lower tax-equivalent performance. Actual tax rates will vary depending on your income, exemptions and deductions. Rates do not include local taxes. | |
| 5 | Fund employs RIB financing. The leverage created by RIB investments provides an opportunity for increased income but, at the same time, creates special risks (including the likelihood of greater price volatility). The cost of leverage rises and falls with changes in short-term interest rates. See “Floating Rate Notes Issued in Conjunction with Securities Held” in the notes to the financial statements for more information about RIB financing. RIB leverage represents the amount of Floating Rate Notes outstanding at period end as a percentage of Fund net assets plus Floating Rate Notes. |
| Fund profile subject to change due to active management. | |
| Additional Information | |
| Bloomberg Municipal Bond Index is an unmanaged index of municipal bonds traded in the U.S. | |
| Yield curve is a graphical representation of the yields offered by bonds of various maturities. The yield curve flattens when long-term interest rates fall and/or short-term interest rates increase, and the yield curve steepens when long-term interest rates increase and/or short-term interest rates fall. | |
| Important Notice to Shareholders | |
| On January 26, 2023, the Fund’s Board of Trustees voted to exempt, on a going forward basis, all prior and, until further notice, new acquisitions of Fund hares that otherwise might be deemed “Control Share Acquisitions” under the Fund’s By-Laws from the Control Share Provisions of the Fund’s By-Laws. |
| Corporate Bonds — 1.2% |
| Security | Principal Amount (000's omitted) | Value | |
| Education — 1.2% | |||
| Grand Canyon University, 4.125%, 10/1/24 | $ | 2,500 | $ 2,418,750 |
| Total Corporate Bonds (identified cost $2,888,943) | $ 2,418,750 | ||
| Tax-Exempt Municipal Obligations — 105.8% |
| Security | Principal Amount (000's omitted) | Value | |
| Bond Bank — 0.6% | |||
| Rickenbacker Port Authority, OH, (OASBO Expanded Asset Pooled Financing Program), 5.375%, 1/1/32 | $ | 1,085 | $ 1,242,542 |
| $ 1,242,542 | |||
| Education — 2.1% | |||
| Capital Trust Agency, FL, (Florida Charter Educational Foundation, Inc.), 4.50%, 6/15/28(1) | $ | 440 | $ 430,927 |
| Colorado State University, 4.375% to 3/1/29 (Put Date), 3/1/48 | 1,000 | 1,059,070 | |
| Florida Higher Educational Facilities Financing Authority, (Jacksonville University), 4.50%, 6/1/33(1) | 265 | 259,255 | |
| Philadelphia School District, PA, 5.00%, 6/28/24 | 2,090 | 2,101,850 | |
| Pinellas County Educational Facilities Authority, FL, (Pinellas Academy of Math and Science), 4.125%, 12/15/28(1) | 380 | 380,346 | |
| $ 4,231,448 | |||
| Electric Utilities — 1.9% | |||
| Michigan Strategic Fund, (DTE Electric Co. Exempt Facilities), (AMT), 3.875% to 6/3/30 (Put Date), 6/1/53 | $ | 2,000 | $ 1,982,300 |
| West Virginia Economic Development Authority, (Appalachian Power Co.), 3.75% to 6/1/25 (Put Date), 12/1/42 | 2,000 | 1,997,060 | |
| $ 3,979,360 | |||
| Escrowed/Prerefunded — 10.9% | |||
| Clovis Unified School District, CA, (Election of 2012): | |||
| Prerefunded to 8/1/24, 0.00%, 8/1/28 | $ | 1,000 | $ 837,610 |
| Prerefunded to 8/1/24, 0.00%, 8/1/29 | 2,395 | 1,914,060 | |
| Prerefunded to 8/1/24, 0.00%, 8/1/30 | 2,575 | 1,959,704 | |
| Fresno Unified School District, CA, (Election of 2010): | |||
| Prerefunded to 8/1/24, 0.00%, 8/1/30 | 800 | 598,064 | |
| Security | Principal Amount (000's omitted) | Value | |
| Escrowed/Prerefunded (continued) | |||
| Fresno Unified School District, CA, (Election of 2010): (continued) | |||
| Prerefunded to 8/1/24, 0.00%, 8/1/31 | $ | 955 | $ 679,072 |
| Illinois Finance Authority, (Plymouth Place, Inc.), Prerefunded to 5/15/25, 5.00%, 5/15/30 | 2,750 | 2,816,412 | |
| Multnomah County Hospital Facilities Authority, OR, (Mirabella at South Waterfront), Prerefunded to 10/1/24, 5.125%, 10/1/34 | 1,500 | 1,516,965 | |
| Riverside County Community College District, CA, (Election of 2004): | |||
| Prerefunded to 2/1/25, 0.00%, 8/1/29 | 1,500 | 1,195,455 | |
| Prerefunded to 2/1/25, 0.00%, 8/1/30 | 1,250 | 946,763 | |
| Scottsdale Municipal Property Corp., AZ, Excise Tax Revenue: | |||
| Prerefunded to 7/1/25, 4.00%, 7/1/30(2) | 2,000 | 2,032,000 | |
| Prerefunded to 7/1/25, 4.00%, 7/1/31(2) | 5,680 | 5,770,880 | |
| Prerefunded to 7/1/25, 4.00%, 7/1/32(2) | 2,120 | 2,153,920 | |
| $ 22,420,905 | |||
| General Obligations — 14.0% | |||
| Chicago Board of Education, IL: | |||
| 5.00%, 12/1/26 | $ | 3,000 | $ 3,089,280 |
| 5.00%, 12/1/27 | 500 | 519,905 | |
| 5.00%, 12/1/30 | 1,250 | 1,329,613 | |
| Clackamas Community College District, OR: | |||
| 0.00%, 6/15/28 | 1,830 | 1,547,960 | |
| 0.00%, 6/15/29 | 1,000 | 808,820 | |
| Illinois: | |||
| 5.00%, 11/1/29 | 1,500 | 1,602,060 | |
| 5.00%, 5/1/33 | 3,200 | 3,208,576 | |
| 5.00%, 5/1/39 | 1,165 | 1,166,771 | |
| Leander Independent School District, TX, (PSF Guaranteed), 0.00%, 8/15/31 | 5,000 | 3,598,500 | |
| Puerto Rico, 5.625%, 7/1/27 | 2,000 | 2,113,780 | |
| Texas, (Texas Transportation Commission), 4.00%, 10/1/31(2) | 10,000 | 10,004,200 | |
| $ 28,989,465 | |||
| Hospital — 9.0% | |||
| California Health Facilities Financing Authority, (Providence Health & Services), 4.00%, 10/1/28(2) | $ | 10,000 | $ 10,041,300 |
| Colorado Health Facilities Authority, (AdventHealth Obligated Group), 5.00% to 11/19/26 (Put Date), 11/15/49 | 905 | 951,073 | |
| Harris County Cultural Education Facilities Finance Corp., TX, (Texas Children's Hospital), (LOC: TD Bank, N.A.), 3.75%, 10/1/45(3) | 2,300 | 2,300,000 | |
| Security | Principal Amount (000's omitted) | Value | |
| Hospital (continued) | |||
| Illinois Finance Authority, (Presence Health Network), 5.00%, 2/15/29 | $ | 2,635 | $ 2,774,023 |
| Southeastern Ohio Port Authority, (Memorial Health System Obligated Group), 5.50%, 12/1/29 | 985 | 985,246 | |
| Yavapai County Industrial Development Authority, AZ, (Yavapai Regional Medical Center), 5.00%, 8/1/28 | 1,500 | 1,500,735 | |
| $ 18,552,377 | |||
| Housing — 3.0% | |||
| Connecticut Housing Finance Authority, 1.05%, 5/15/29 | $ | 2,000 | $ 1,695,820 |
| New York City Housing Development Corp., NY: | |||
| 3.70% to 12/30/27 (Put Date), 5/1/63 | 1,500 | 1,507,305 | |
| Sustainable Development Bonds, 4.30% to 11/1/28 (Put Date), 11/1/63 | 1,000 | 1,019,740 | |
| Virginia Housing Development Authority, 4.10%, 10/1/27 | 2,000 | 2,011,600 | |
| $ 6,234,465 | |||
| Industrial Development Revenue — 18.0% | |||
| Boone County, KY, (Duke Energy Kentucky, Inc.), 3.70%, 8/1/27 | $ | 750 | $ 743,580 |
| Burke County Development Authority, GA, (Georgia Power Co.), 3.80% to 5/21/26 (Put Date), 10/1/32 | 1,000 | 1,001,360 | |
| Chandler Industrial Development Authority, AZ, (Intel Corp.), (AMT), 5.00% to 9/1/27 (Put Date), 9/1/52 | 2,250 | 2,328,975 | |
| Iowa Finance Authority, (Iowa Fertilizer Co.), 4.00% to 12/1/32 (Put Date), 12/1/50 | 1,000 | 1,035,350 | |
| Louisiana Offshore Terminal Authority, (Loop LLC), 4.15%, 9/1/27 | 1,000 | 1,016,640 | |
| Louisiana Public Facilities Authority, (Cleco Power LLC), 4.25%, 12/1/38 | 2,395 | 2,372,798 | |
| Matagorda County Navigation District No. 1, TX, (AEP Texas Central Co.): | |||
| Series 2008-1, 4.00%, 6/1/30 | 3,130 | 3,127,684 | |
| Series 2008-2, 4.00%, 6/1/30 | 3,000 | 2,997,780 | |
| Michigan Strategic Fund, (Graphic Packaging International LLC), Green Bonds, (AMT), 4.00% to 10/1/26 (Put Date), 10/1/61 | 2,500 | 2,475,600 | |
| Montgomery County Industrial Development Authority, PA, (Constellation Energy Generation LLC), 4.10% to 4/3/28 (Put Date), 4/1/53 | 1,000 | 1,022,270 | |
| National Finance Authority, NH, (Covanta), (AMT), 4.00%, 11/1/27(1) | 4,500 | 4,385,115 | |
| New Jersey Economic Development Authority, (Continental Airlines), (AMT), 5.625%, 11/15/30 | 1,355 | 1,369,268 | |
| New York State Environmental Facilities Corp., (Casella Waste Systems, Inc.), (AMT), 5.125% to 9/3/30 (Put Date), 9/1/50(1) | 500 | 509,575 | |
| Security | Principal Amount (000's omitted) | Value | |
| Industrial Development Revenue (continued) | |||
| New York Transportation Development Corp., (Delta Air Lines, Inc. - LaGuardia Airport Terminals C&D Redevelopment): | |||
| (AMT), 4.00%, 10/1/30 | $ | 3,000 | $ 2,999,910 |
| (AMT), 5.00%, 1/1/31 | 1,125 | 1,160,584 | |
| Ohio Air Quality Development Authority, (Duke Energy Corp.), 4.00% to 6/1/27 (Put Date), 9/1/30 | 1,000 | 1,007,250 | |
| Ohio Air Quality Development Authority, (Pratt Paper LLC), (AMT), 3.75%, 1/15/28(1) | 630 | 625,647 | |
| Public Finance Authority, WI, (Celanese Corp.), 4.05%, 11/1/30 | 3,000 | 2,899,950 | |
| Vermont Economic Development Authority, (Casella Waste Systems, Inc.): | |||
| (AMT), 4.625% to 4/3/28 (Put Date), 4/1/36(1) | 105 | 104,502 | |
| (AMT), 5.00% to 6/1/27 (Put Date), 6/1/52(1) | 1,500 | 1,508,865 | |
| Whiting, IN, (BP Products North America, Inc.), (AMT), 5.00% to 6/5/26 (Put Date), 12/1/44 | 2,500 | 2,549,600 | |
| $ 37,242,303 | |||
| Insured - Electric Utilities — 2.6% | |||
| Puerto Rico Electric Power Authority: | |||
| (NPFG), 5.25%, 7/1/29 | $ | 500 | $ 494,435 |
| (NPFG), 5.25%, 7/1/30 | 5,000 | 4,940,900 | |
| $ 5,435,335 | |||
| Insured - General Obligations — 2.5% | |||
| Grossmont Union High School District, CA, (Election of 2008), (AGM), 0.00%, 8/1/29 | $ | 4,000 | $ 3,162,240 |
| Luzerne County, PA, (AGM), 5.00%, 11/15/29 | 2,000 | 2,050,120 | |
| $ 5,212,360 | |||
| Insured - Hospital — 1.0% | |||
| Westchester County Local Development Corp., NY, (Westchester Medical Center Obligated Group), (AGM), 5.25%, 11/1/31 | $ | 1,750 | $ 2,005,290 |
| $ 2,005,290 | |||
| Insured - Lease Revenue/Certificates of Participation — 3.8% | |||
| New Jersey Transportation Trust Fund Authority, (Transportation System), (AMBAC), 0.00%, 12/15/28 | $ | 9,095 | $ 7,754,579 |
| $ 7,754,579 | |||
| Insured - Transportation — 1.1% | |||
| Foothill/Eastern Transportation Corridor Agency, CA, (AGM), 5.625%, (0.00% until 1/15/24), 1/15/32 | $ | 795 | $ 940,000 |
| Security | Principal Amount (000's omitted) | Value | |
| Insured - Transportation (continued) | |||
| New Jersey Economic Development Authority, (The Goethals Bridge Replacement), (AGM), (AMT), 5.00%, 1/1/31 | $ | 1,340 | $ 1,340,804 |
| $ 2,280,804 | |||
| Lease Revenue/Certificates of Participation — 1.6% | |||
| Michigan Strategic Fund, (Facility for Rare Isotope Beams), 4.00%, 3/1/31 | $ | 1,000 | $ 1,000,610 |
| New Jersey Economic Development Authority, (Portal North Bridge Project), 5.00%, 11/1/32 | 675 | 791,809 | |
| Pennsylvania Economic Development Financing Authority, (Pennsylvania Rapid Bridge Replacement), 5.00%, 12/31/29 | 1,375 | 1,410,585 | |
| $ 3,203,004 | |||
| Other Revenue — 8.5% | |||
| Black Belt Energy Gas District, AL, 4.00% to 12/1/26 (Put Date), 10/1/52 | $ | 1,250 | $ 1,252,263 |
| Buckeye Tobacco Settlement Financing Authority, OH, 5.00%, 6/1/32 | 2,000 | 2,190,840 | |
| California Community Choice Financing Authority, Clean Energy Project Revenue, Green Bonds, 5.00% to 8/1/29 (Put Date), 12/1/53 | 1,000 | 1,056,740 | |
| Kalispel Tribe of Indians, WA, Series A, 5.00%, 1/1/32(1) | 695 | 719,151 | |
| Main Street Natural Gas, Inc., GA, Gas Supply Revenue: | |||
| 5.00% to 12/1/30 (Put Date), 5/1/54 | 1,370 | 1,451,118 | |
| 5.00% to 3/1/30 (Put Date), 7/1/53 | 2,500 | 2,652,000 | |
| 5.00% to 9/1/31 (Put Date), 5/1/54 | 2,000 | 2,141,520 | |
| Patriots Energy Group Financing Agency, SC, Gas Supply Revenue, 5.25% to 8/1/31 (Put Date), 10/1/54 | 3,680 | 3,967,003 | |
| Texas Municipal Gas Acquisition and Supply Corp IV, Gas Supply Revenue, 5.50% to 1/1/30 (Put Date), 1/1/54 | 2,000 | 2,151,060 | |
| $ 17,581,695 | |||
| Senior Living/Life Care — 6.7% | |||
| Buffalo and Erie County Industrial Land Development Corp., NY, (Orchard Park CCRC, Inc.), 5.00%, 11/15/28 | $ | 1,360 | $ 1,379,611 |
| Colorado Health Facilities Authority, (Frasier Meadows Retirement Community), 5.25%, 5/15/28 | 250 | 256,110 | |
| Franklin County Industrial Development Authority, PA, (Menno-Haven, Inc.): | |||
| 5.00%, 12/1/27 | 250 | 244,118 | |
| 5.00%, 12/1/28 | 250 | 242,680 | |
| Harris County Cultural Education Facilities Finance Corp., TX, (Brazos Presbyterian Homes, Inc.), 5.75%, 1/1/28 | 135 | 135,101 | |
| Lancaster County Hospital Authority, PA, (Brethren Village), 5.00%, 7/1/30 | 1,025 | 999,713 | |
| Security | Principal Amount (000's omitted) | Value | |
| Senior Living/Life Care (continued) | |||
| Massachusetts Development Finance Agency, (Linden Ponds, Inc.), 5.00%, 11/15/28(1) | $ | 300 | $ 315,327 |
| Montgomery County Industrial Development Authority, PA, (Whitemarsh Continuing Care Retirement Community), 4.25%, 1/1/28 | 1,880 | 1,806,473 | |
| New Hope Cultural Education Facilities Finance Corp., TX, (Longhorn Village), 5.00%, 1/1/28 | 1,145 | 1,137,329 | |
| North Carolina Medical Care Commission, (Galloway Ridge), 5.00%, 1/1/29 | 560 | 555,649 | |
| Public Finance Authority, WI, (Church Home of Hartford, Inc.), 5.00%, 9/1/25(1) | 510 | 508,904 | |
| Rockville, MD, (Ingleside at King Farm), 5.00%, 11/1/29 | 1,100 | 1,069,948 | |
| St. Louis County Industrial Development Authority, MO, (Friendship Village St. Louis Obligated Group), 5.00%, 9/1/28 | 635 | 640,918 | |
| Tarrant County Cultural Education Facilities Finance Corp., TX, (MRC Stevenson Oaks), 6.25%, 11/15/31 | 540 | 524,734 | |
| Tarrant County Cultural Education Facilities Finance Corp., TX, (Trinity Terrace), 5.00%, 10/1/29 | 1,045 | 1,045,752 | |
| Tempe Industrial Development Authority, AZ, (Mirabella at ASU), 5.50%, 10/1/27(1) | 900 | 781,119 | |
| Vermont Economic Development Authority, (Wake Robin Corp.): | |||
| 5.00%, 5/1/27 | 500 | 510,770 | |
| 5.00%, 5/1/28 | 750 | 765,015 | |
| Washington Housing Finance Commission, (Bayview Manor Homes), 5.00%, 7/1/31(1) | 1,000 | 941,370 | |
| $ 13,860,641 | |||
| Special Tax Revenue — 2.6% | |||
| Bullhead City, AZ, Excise Taxes Revenue, 1.30%, 7/1/28 | $ | 485 | $ 441,612 |
| Lakewood Ranch Stewardship District, FL, (Villages of Lakewood Ranch), 4.25%, 5/1/26 | 680 | 678,517 | |
| Metropolitan Development and Housing Agency, TN, (Fifth + Broadway Development), 4.50%, 6/1/28(1) | 595 | 598,588 | |
| Michigan Finance Authority, Detroit Financial Recovery Income Tax Revenue, 4.50%, 10/1/29 | 895 | 898,634 | |
| Puerto Rico Sales Tax Financing Corp., 5.00%, 7/1/58 | 2,000 | 2,006,459 | |
| Sparks, NV, (Legends at Sparks Marina), 2.75%, 6/15/28(1) | 790 | 752,436 | |
| $ 5,376,246 | |||
| Student Loan — 1.7% | |||
| Massachusetts Educational Financing Authority, (AMT), 5.00%, 1/1/27 | $ | 3,000 | $ 3,036,060 |
| New Jersey Higher Education Student Assistance Authority, Series 2015-1A, (AMT), 4.00%, 12/1/28 | 425 | 424,150 | |
| $ 3,460,210 | |||
| Security | Principal Amount (000's omitted) | Value | |
| Transportation — 11.8% | |||
| Atlanta, GA, Airport Revenue, Green Bonds, (AMT), 5.00%, 7/1/24 | $ | 1,375 | $ 1,382,906 |
| Foothill/Eastern Transportation Corridor Agency, CA, 5.90%, 1/15/27 | 2,000 | 2,173,180 | |
| Grand Parkway Transportation Corp., TX: | |||
| 4.95%, 10/1/29 | 800 | 876,608 | |
| 5.05%, 10/1/30 | 1,500 | 1,656,060 | |
| 5.20%, 10/1/31 | 2,000 | 2,218,140 | |
| Houston, TX, (United Airlines, Inc.), (AMT), 5.00%, 7/1/29 | 1,470 | 1,470,397 | |
| Metropolitan Transportation Authority, NY, 5.00% to 5/15/30 (Put Date), 11/15/45 | 2,250 | 2,431,957 | |
| New York Transportation Development Corp., (Terminal 4 John F. Kennedy International Airport), (AMT), 5.00%, 12/1/29 | 2,000 | 2,160,360 | |
| Port Authority of New York and New Jersey, (AMT), 4.00%, 7/15/36(2) | 10,000 | 10,000,900 | |
| $ 24,370,508 | |||
| Water and Sewer — 2.4% | |||
| Michigan Finance Authority, (Detroit Water and Sewerage Department), 5.00%, 7/1/30 | $ | 5,000 | $ 5,032,900 |
| $ 5,032,900 | |||
| Total Tax-Exempt Municipal Obligations (identified cost $214,059,096) | $218,466,437 | ||
| Taxable Municipal Obligations — 5.7% |
| Security | Principal Amount (000's omitted) | Value | |
| General Obligations — 2.5% | |||
| Atlantic City, NJ, 7.00%, 3/1/28 | $ | 2,105 | $ 2,191,221 |
| Chicago, IL: | |||
| 7.375%, 1/1/33 | 944 | 1,017,481 | |
| 7.781%, 1/1/35 | 1,675 | 1,855,213 | |
| $ 5,063,915 | |||
| Hospital — 1.2% | |||
| California Statewide Communities Development Authority, (Loma Linda University Medical Center), 6.00%, 12/1/24 | $ | 2,500 | $ 2,491,900 |
| $ 2,491,900 | |||
| Security | Principal Amount (000's omitted) | Value | |
| Insured - Transportation — 2.0% | |||
| Alameda Corridor Transportation Authority, CA, (AMBAC), 0.00%, 10/1/31 | $ | 5,805 | $ 4,131,419 |
| $ 4,131,419 | |||
| Total Taxable Municipal Obligations (identified cost $10,655,936) | $ 11,687,234 | ||
| Total Investments — 112.7% (identified cost $227,603,975) | $232,572,421 | ||
| Other Assets, Less Liabilities — (12.7)% | $ (26,182,910) | ||
| Net Assets — 100.0% | $206,389,511 | ||
| The percentage shown for each investment category in the Portfolio of Investments is based on net assets. | |
| (1) | Security exempt from registration under Rule 144A of the Securities Act of 1933, as amended. These securities may be sold in certain transactions in reliance on an exemption from registration (normally to qualified institutional buyers). At January 31, 2024, the aggregate value of these securities is $12,821,127 or 6.2% of the Trust's net assets. |
| (2) | Security represents the municipal bond held by a trust that issues residual interest bonds (see Note 1G). |
| (3) | Variable rate demand obligation that may be tendered at par on any day for payment the lesser of 5 business days or 7 calendar days. The stated interest rate, which generally resets weekly, is determined by the remarketing agent and represents the rate in effect at January 31, 2024. |
| At January 31, 2024, the concentration of the Trust’s investments in the various states and territories, determined as a percentage of total investments, is as follows: | |
| Texas | 14.3% |
| California | 13.8% |
| New York | 10.8% |
| Others, representing less than 10% individually | 60.1% |
| The Trust invests primarily in debt securities issued by municipalities. The ability of the issuers of the debt securities to meet their obligations may be affected by economic developments in a specific industry or municipality. At January 31, 2024, 11.5% of total investments are backed by bond insurance of various financial institutions and financial guaranty assurance agencies. The aggregate percentage insured by an individual financial institution or financial guaranty assurance agency ranged from 2.3% to 5.1% of total investments. |
| Abbreviations: | |
| AGM | – Assured Guaranty Municipal Corp. |
| AMBAC | – AMBAC Financial Group, Inc. |
| AMT | – Interest earned from these securities may be considered a tax preference item for purposes of the Federal Alternative Minimum Tax. |
| LOC | – Letter of Credit |
| NPFG | – National Public Finance Guarantee Corp. |
| PSF | – Permanent School Fund |
| January 31, 2024 | |
| Assets | |
| Investments, at value (identified cost $227,603,975) | $ 232,572,421 |
| Cash | 4,776,871 |
| Interest receivable | 1,874,320 |
| Trustees' deferred compensation plan | 32,844 |
| Total assets | $239,256,456 |
| Liabilities | |
| Payable for floating rate notes issued | $ 30,020,128 |
| Payable for investments purchased | 2,305,314 |
| Payable to affiliates: | |
| Investment adviser and administration fee | 120,395 |
| Trustees' deferred compensation plan | 32,844 |
| Interest expense and fees payable | 255,035 |
| Accrued expenses | 133,229 |
| Total liabilities | $ 32,866,945 |
| Net Assets | $206,389,511 |
| Sources of Net Assets | |
| Common shares, $0.01 par value, unlimited number of shares authorized | $ 108,850 |
| Additional paid-in capital | 206,874,765 |
| Accumulated loss | (594,104) |
| Net Assets | $206,389,511 |
| Common Shares Issued and Outstanding | 10,884,956 |
| Net Asset Value Per Common Share | |
| Net assets ÷ common shares issued and outstanding | $ 18.96 |
| Year Ended | |
| January 31, 2024 | |
| Investment Income | |
| Interest income | $ 11,351,731 |
| Total investment income | $11,351,731 |
| Expenses | |
| Investment adviser and administration fee | $ 1,626,711 |
| Trustees’ fees and expenses | 16,968 |
| Custodian fee | 51,349 |
| Transfer and dividend disbursing agent fees | 18,895 |
| Legal and accounting services | 65,933 |
| Printing and postage | 50,948 |
| Interest expense and fees | 2,498,073 |
| Miscellaneous | 55,611 |
| Total expenses | $ 4,384,488 |
| Net investment income | $ 6,967,243 |
| Realized and Unrealized Gain (Loss) | |
| Net realized gain (loss): | |
| Investment transactions | $ (615,259) |
| Net realized loss | $ (615,259) |
| Change in unrealized appreciation (depreciation): | |
| Investments | $ (1,288,026) |
| Net change in unrealized appreciation (depreciation) | $ (1,288,026) |
| Net realized and unrealized loss | $ (1,903,285) |
| Net increase in net assets from operations | $ 5,063,958 |
| Year Ended January 31, | ||
| 2024 | 2023 | |
| Increase (Decrease) in Net Assets | ||
| From operations: | ||
| Net investment income | $ 6,967,243 | $ 8,026,340 |
| Net realized loss | (615,259) | (1,462,236) |
| Net change in unrealized appreciation (depreciation) | (1,288,026) | (14,951,568) |
| Net increase (decrease) in net assets from operations | $ 5,063,958 | $ (8,387,464) |
| Distributions to shareholders | $ (7,053,976) | $ (8,854,966) |
| Tax return of capital to shareholders | $ (962,794) | $ — |
| Capital share transactions: | ||
| Reinvestment of distributions | $ — | $ 297,741 |
| Net increase in net assets from capital share transactions | $ — | $ 297,741 |
| Net decrease in net assets | $ (2,952,812) | $ (16,944,689) |
| Net Assets | ||
| At beginning of year | $ 209,342,323 | $ 226,287,012 |
| At end of year | $206,389,511 | $209,342,323 |
| Year Ended | |
| January 31, 2024 | |
| Cash Flows From Operating Activities | |
| Net increase in net assets from operations | $ 5,063,958 |
| Adjustments to reconcile net increase in net assets from operations to net cash provided by operating activities: | |
| Investments purchased | (71,822,244) |
| Investments sold | 150,546,077 |
| Net amortization/accretion of premium (discount) | (1,190,263) |
| Decrease in interest receivable | 633,056 |
| Increase in Trustees’ deferred compensation plan | (32,844) |
| Decrease in payable to affiliate for investment adviser and administration fee | (37,441) |
| Decrease in interest expense and fees payable | (510,647) |
| Increase in payable to affiliate for Trustees' deferred compensation plan | 32,844 |
| Decrease in accrued expenses | (2,711) |
| Net change in unrealized (appreciation) depreciation from investments | 1,288,026 |
| Net realized loss from investments | 615,259 |
| Net cash provided by operating activities | $ 84,583,070 |
| Cash Flows From Financing Activities | |
| Cash distributions paid | $ (8,016,770) |
| Repayment of secured borrowings | (71,415,000) |
| Decrease in due to custodian | (374,429) |
| Net cash used in financing activities | $ (79,806,199) |
| Net increase in cash | $ 4,776,871 |
| Cash at beginning of year | $ — |
| Cash at end of year | $ 4,776,871 |
| Supplemental disclosure of cash flow information: | |
| Cash paid for interest and fees on borrowings | $ 3,008,720 |
| Year Ended January 31, | |||||
| 2024 | 2023 | 2022 | 2021 | 2020 | |
| Net asset value — Beginning of year | $ 19.23 | $ 20.82 | $ 21.96 | $ 21.88 | $ 20.44 |
| Income (Loss) From Operations | |||||
| Net investment income(1) | $ 0.64 | $ 0.74 | $ 0.87 | $ 0.88 | $ 0.76 |
| Net realized and unrealized gain (loss) | (0.17) | (1.52) | (1.16) | 0.04 | 1.53 |
| Total income (loss) from operations | $ 0.47 | $ (0.78) | $ (0.29) | $ 0.92 | $ 2.29 |
| Less Distributions | |||||
| From net investment income | $ (0.65) | $ (0.81) | $ (0.85) | $ (0.84) | $ (0.85) |
| Tax return of capital | (0.09) | — | — | — | — |
| Total distributions | $ (0.74) | $ (0.81) | $ (0.85) | $ (0.84) | $ (0.85) |
| Net asset value — End of year | $ 18.96 | $ 19.23 | $ 20.82 | $ 21.96 | $ 21.88 |
| Market value — End of year | $ 17.73 | $ 18.52 | $ 20.51 | $ 22.95 | $ 21.37 |
| Total Investment Return on Net Asset Value(2) | 2.80% | (3.66)% | (1.39)% | 4.45% | 11.46% |
| Total Investment Return on Market Value(2) | (0.18)% | (5.82)% | (7.03)% | 11.74% | 13.58% |
| Ratios/Supplemental Data | |||||
| Net assets, end of year (000’s omitted) | $206,390 | $209,342 | $226,287 | $238,364 | $237,212 |
| Ratios (as a percentage of average daily net assets):(3) | |||||
| Expenses excluding interest and fees | 0.92% | 1.04% | 1.03% | 1.04% | 1.04% |
| Interest and fee expense(4) | 1.22% | 1.06% | 0.33% | 0.63% | 1.16% |
| Total expenses | 2.14% | 2.10% | 1.36% | 1.67% | 2.20% |
| Net expenses | 2.14% | 2.10% | 1.36% | 1.67% | 2.20% |
| Net investment income | 3.40% | 3.79% | 4.02% | 4.10% | 3.58% |
| Portfolio Turnover | 26% | 16% | 2% | 3% | 1% |
| (1) | Computed using average shares outstanding. |
| (2) | Returns are historical and are calculated by determining the percentage change in net asset value or market value with all distributions reinvested. Distributions are assumed to be reinvested at prices obtained under the Trust’s dividend reinvestment plan. |
| (3) | Total expenses do not reflect amounts reimbursed and/or waived by the adviser and certain of its affiliates, if applicable. Net expenses are net of all reductions and represent the net expenses paid by the Fund. |
| (4) | Interest and fee expense relates to the liability for floating rate notes issued in conjunction with residual interest bond transactions (see Note 1G). |
vote.
| Year Ended January 31, | ||
| 2024 | 2023 | |
| Tax-exempt income | $6,358,921 | $8,390,455 |
| Ordinary income | $ 695,055 | $ 464,511 |
| Tax return of capital | $ 962,794 | $ — |
| Deferred capital losses | $(5,967,871) |
| Net unrealized appreciation | 5,373,767 |
| Accumulated loss | $ (594,104) |
| Aggregate cost | $197,178,526 |
| Gross unrealized appreciation | $ 6,282,109 |
| Gross unrealized depreciation | (908,342) |
| Net unrealized appreciation | $ 5,373,767 |
| • | Level 1 – quoted prices in active markets for identical investments |
| • | Level 2 – other significant observable inputs (including quoted prices for similar investments, interest rates, prepayment speeds, credit risk, etc.) |
| • | Level 3 – significant unobservable inputs (including a fund's own assumptions in determining the fair value of investments) |
| Asset Description | Level 1 | Level 2 | Level 3 | Total |
| Corporate Bonds | $ — | $ 2,418,750 | $ — | $ 2,418,750 |
| Tax-Exempt Municipal Obligations | — | 218,466,437 | — | 218,466,437 |
| Taxable Municipal Obligations | — | 11,687,234 | — | 11,687,234 |
| Total Investments | $ — | $232,572,421 | $ — | $232,572,421 |
Boston, Massachusetts
March 20, 2024
| Number of Shares | ||||
| Nominees for Trustee | For | Withheld | ||
| Alan C. Bowser | 8,961,458 | 197,555 | ||
| George J. Gorman | 9,013,999 | 145,014 | ||
| Marcus L. Smith | 9,002,788 | 156,225 | ||
| Susan J. Sutherland | 8,980,814 | 178,199 | ||
the Plan agent (Agent). Distributions subject to income tax (if any) are taxable whether or not Shares are reinvested.
| Please print exact name on account | |
| Shareholder signature | Date |
| Shareholder signature | Date |
| Please sign exactly as your common shares are registered. All persons whose names appear on the share certificate must sign. | |
c/o Equiniti Trust Company, LLC ("EQ")
P.O. Box 10027
Newark, NJ 07101
| Name and Year of Birth | Fund Position(s) | Length of Service | Principal Occupation(s) and Other Directorships During Past Five Years and Other Relevant Experience |
| Interested Trustee | |||
| Anchal Pachnanda(1) 1980 | Class III Trustee | Until 2024. 3 years. Since 2023. | Co-Head of Strategy of MSIM (since 2019). Formerly, Head of Strategy of MSIM (2017-2019). Ms. Pachnanda is an interested person because of her position with MSIM, which is an affiliate of the Fund. Other Directorships. None. |
| Noninterested Trustees | |||
| Alan C. Bowser 1962 | Class II Trustee | Until 2026. 3 years. Since 2023. | Private investor. Formerly, Chief Diversity Officer, Partner and a member of the Operating Committee, and formerly served as Senior Advisor on Diversity and Inclusion for the firm's chief executive officer, Co-Head of the Americas Region, and Senior Client Advisor of Bridgewater Associates, an asset management firm (2011- 2023). Other Directorships. Independent Director of Stout Risius Ross (a middle market professional services advisory firm) (since 2021). |
| Mark R. Fetting 1954 | Class III Trustee | Until 2024. 3 years. Since 2016. | Private investor. Formerly held various positions at Legg Mason, Inc. (investment management firm) (2000-2012), including President, Chief Executive Officer, Director and Chairman (2008-2012), Senior Executive Vice President (2004-2008) and Executive Vice President (2001-2004). Formerly, President of Legg Mason family of funds (2001-2008). Formerly, Division President and Senior Officer of Prudential Financial Group, Inc. and related companies (investment management firm) (1991-2000). Other Directorships. None. |
| Cynthia E. Frost 1961 | Class I Trustee | Until 2025. 3 years. Since 2014. | Private investor. Formerly, Chief Investment Officer of Brown University (university endowment) (2000-2012). Formerly, Portfolio Strategist for Duke Management Company (university endowment manager) (1995-2000). Formerly, Managing Director, Cambridge Associates (investment consulting company) (1989-1995). Formerly, Consultant, Bain and Company (management consulting firm) (1987-1989). Formerly, Senior Equity Analyst, BA Investment Management Company (1983-1985). Other Directorships. None. |
| George J. Gorman 1952 | Chairperson of the Board and Class II Trustee | Until 2026. 3 years. Chairperson of the Board since 2021 and Trustee since 2014. | Principal at George J. Gorman LLC (consulting firm). Formerly, Senior Partner at Ernst & Young LLP (a registered public accounting firm) (1974-2009). Other Directorships. None. |
| Name and Year of Birth | Fund Position(s) | Length of Service | Principal Occupation(s) and Other Directorships During Past Five Years and Other Relevant Experience |
| Noninterested Trustees (continued) | |||
| Valerie A. Mosley 1960 | Class III Trustee | Until 2024. 3 years. Since 2014. | Chairwoman and Chief Executive Officer of Valmo Ventures (a consulting and investment firm). Founder of Upward Wealth, Inc., dba BrightUP, a fintech platform. Formerly, Partner and Senior Vice President, Portfolio Manager and Investment Strategist at Wellington Management Company, LLP (investment management firm) (1992-2012). Formerly, Chief Investment Officer, PG Corbin Asset Management (1990-1992). Formerly worked in institutional corporate bond sales at Kidder Peabody (1986-1990). Other Directorships. Director of DraftKings, Inc. (digital sports entertainment and gaming company) (since September 2020). Director of Envestnet, Inc. (provider of intelligent systems for wealth management and financial wellness) (since 2018). Formerly, Director of Dynex Capital, Inc. (mortgage REIT) (2013-2020) and Director of Groupon, Inc. (e-commerce provider) (2020-2022). |
| Keith Quinton 1958 | Class III Trustee | Until 2024. 3 years. Since 2018. | Private investor, researcher and lecturer. Formerly, Independent Investment Committee Member at New Hampshire Retirement System (2017-2021). Formerly, Portfolio Manager and Senior Quantitative Analyst at Fidelity Investments (investment management firm) (2001-2014). Other Directorships. Formerly, Director (2016-2021) and Chairman (2019-2021) of New Hampshire Municipal Bond Bank. |
| Marcus L. Smith 1966 | Class II Trustee | Until 2026. 3 years. Since 2018. | Private investor and independent corporate director. Formerly, Chief Investment Officer, Canada (2012-2017), Chief Investment Officer, Asia (2010-2012), Director of Asian Research (2004-2010) and portfolio manager (2001-2017) at MFS Investment Management (investment management firm). Other Directorships. Director of First Industrial Realty Trust, Inc. (an industrial REIT) (since 2021). Director of MSCI Inc. (global provider of investment decision support tools) (since 2017). Formerly, Director of DCT Industrial Trust Inc. (logistics real estate company) (2017-2018). |
| Susan J. Sutherland 1957 | Class II Trustee | Until 2026. 3 years. Since 2015. | Private investor. Director of Ascot Group Limited and certain of its subsidiaries (insurance and reinsurance) (since 2017). Formerly, Director of Hagerty Holding Corp. (insurance) (2015-2018) and Montpelier Re Holdings Ltd. (insurance and reinsurance) (2013-2015). Formerly, Associate, Counsel and Partner at Skadden, Arps, Slate, Meagher & Flom LLP (law firm) (1982-2013). Other Directorships. Formerly, Director of Kairos Acquisition Corp. (insurance/InsurTech acquisition company) (2021-2023). |
| Scott E. Wennerholm 1959 | Class I Trustee | Until 2025. 3 years. Since 2016. | Private investor. Formerly, Trustee at Wheelock College (postsecondary institution) (2012-2018). Formerly, Consultant at GF Parish Group (executive recruiting firm) (2016-2017). Formerly, Chief Operating Officer and Executive Vice President at BNY Mellon Asset Management (investment management firm) (2005-2011). Formerly, Chief Operating Officer and Chief Financial Officer at Natixis Global Asset Management (investment management firm) (1997-2004). Formerly, Vice President at Fidelity Investments Institutional Services (investment management firm) (1994-1997). Other Directorships. None. |
| Nancy A. Wiser 1967 | Class I Trustee | Until 2025. 3 years. Since 2022. | Formerly, Executive Vice President and the Global Head of Operations at Wells Fargo Asset Management (2011-2021). Other Directorships. None. |
| Name and Year of Birth | Fund Position(s) | Length of Service | Principal Occupation(s) During Past Five Years |
| Principal Officers who are not Trustees | |||
| Kenneth A. Topping 1966 | President | Since 2023 | Vice President and Chief Administrative Officer of EVM and BMR and Chief Operating Officer for Public Markets at MSIM. Also Vice President of Calvert Research and Management (“CRM”) since 2021. Formerly, Chief Operating Officer for Goldman Sachs Asset Management 'Classic’ (2009-2020). |
| Deidre E. Walsh 1971 | Vice President and Chief Legal Officer | Since 2009 | Vice President of EVM and BMR. Also Vice President of CRM. |
| James F. Kirchner 1967 | Treasurer | Since 2007 | Vice President of EVM and BMR. Also Vice President of CRM. |
| Name and Year of Birth | Fund Position(s) | Length of Service | Principal Occupation(s) During Past Five Years |
| Principal Officers who are not Trustees (continued) | |||
| Nicholas S. Di Lorenzo 1987 | Secretary | Since 2022 | Formerly, associate (2012-2021) and counsel (2022) at Dechert LLP. |
| Laura T. Donovan 1976 | Chief Compliance Officer | Since 2024 | Vice President of EVM and BMR. |
| Privacy Notice | April 2021 |
| FACTS | WHAT DOES EATON VANCE DO WITH YOUR PERSONAL INFORMATION? |
| Why? | Financial companies choose how they share your personal information. Federal law gives consumers the right to limit some but not all sharing. Federal law also requires us to tell you how we collect, share, and protect your personal information. Please read this notice carefully to understand what we do. |
| What? | The types of personal information we collect and share depend on the product or service you have with us. This information can include:■ Social Security number and income ■ investment experience and risk tolerance ■ checking account number and wire transfer instructions |
| How? | All financial companies need to share customers’ personal information to run their everyday business. In the section below, we list the reasons financial companies can share their customers’ personal information; the reasons Eaton Vance chooses to share; and whether you can limit this sharing. |
| Reasons we can share your personal information | Does Eaton Vance share? | Can you limit this sharing? |
| For our everyday business purposes — such as to process your transactions, maintain your account(s), respond to court orders and legal investigations, or report to credit bureaus | Yes | No |
| For our marketing purposes — to offer our products and services to you | Yes | No |
| For joint marketing with other financial companies | No | We don’t share |
| For our investment management affiliates’ everyday business purposes — information about your transactions, experiences, and creditworthiness | Yes | Yes |
| For our affiliates’ everyday business purposes — information about your transactions and experiences | Yes | No |
| For our affiliates’ everyday business purposes — information about your creditworthiness | No | We don’t share |
| For our investment management affiliates to market to you | Yes | Yes |
| For our affiliates to market to you | No | We don’t share |
| For nonaffiliates to market to you | No | We don’t share |
| To limit our sharing | Call toll-free 1-800-262-1122 or email: EVPrivacy@eatonvance.comPlease note:If you are a new customer, we can begin sharing your information 30 days from the date we sent this notice. When you are no longer our customer, we continue to share your information as described in this notice. However, you can contact us at any time to limit our sharing. |
| Questions? | Call toll-free 1-800-262-1122 or email: EVPrivacy@eatonvance.com |
| Privacy Notice — continued | April 2021 |
| Who we are | |
| Who is providing this notice? | Eaton Vance Management, Eaton Vance Distributors, Inc., Eaton Vance Trust Company, Eaton Vance Management (International) Limited, Eaton Vance Advisers International Ltd., Eaton Vance Global Advisors Limited, Eaton Vance Management’s Real Estate Investment Group, Boston Management and Research, Calvert Research and Management, Eaton Vance and Calvert Fund Families and our investment advisory affiliates (“Eaton Vance”) (see Investment Management Affiliates definition below) |
| What we do | |
| How does Eaton Vance protect my personal information? | To protect your personal information from unauthorized access and use, we use security measures that comply with federal law. These measures include computer safeguards and secured files and buildings. We have policies governing the proper handling of customer information by personnel and requiring third parties that provide support to adhere to appropriate security standards with respect to such information. |
| How does Eaton Vance collect my personal information? | We collect your personal information, for example, when you■ open an account or make deposits or withdrawals from your account ■ buy securities from us or make a wire transfer ■ give us your contact informationWe also collect your personal information from others, such as credit bureaus, affiliates, or other companies. |
| Why can’t I limit all sharing? | Federal law gives you the right to limit only■ sharing for affiliates’ everyday business purposes — information about your creditworthiness ■ affiliates from using your information to market to you ■ sharing for nonaffiliates to market to youState laws and individual companies may give you additional rights to limit sharing. See below for more on your rights under state law. |
| Definitions | |
| Investment Management Affiliates | Eaton Vance Investment Management Affiliates include registered investment advisers, registered broker- dealers, and registered and unregistered funds. Investment Management Affiliates does not include entities associated with Morgan Stanley Wealth Management, such as Morgan Stanley Smith Barney LLC and Morgan Stanley & Co. |
| Affiliates | Companies related by common ownership or control. They can be financial and nonfinancial companies.■ Our affiliates include companies with a Morgan Stanley name and financial companies such as Morgan Stanley Smith Barney LLC and Morgan Stanley & Co. |
| Nonaffiliates | Companies not related by common ownership or control. They can be financial and nonfinancial companies.■ Eaton Vance does not share with nonaffiliates so they can market to you. |
| Joint marketing | A formal agreement between nonaffiliated financial companies that together market financial products or services to you.■ Eaton Vance doesn’t jointly market. |
| Other important information | |
| Vermont: Except as permitted by law, we will not share personal information we collect about Vermont residents with Nonaffiliates unless you provide us with your written consent to share such information.California: Except as permitted by law, we will not share personal information we collect about California residents with Nonaffiliates and we will limit sharing such personal information with our Affiliates to comply with California privacy laws that apply to us. | |
One Post Office Square
Boston, MA 02109
One Congress Street, Suite 1
Boston, MA 02114-2016
P.O. Box 500
Newark, NJ 07101
200 Berkeley Street
Boston, MA 02116-5022
Boston, MA 02109
Item 2. Code of Ethics
The registrant (sometimes referred to as the “Fund”) has adopted a code of ethics applicable to its Principal Executive Officer, Principal Financial Officer and Principal Accounting Officer. The registrant undertakes to provide a copy of such code of ethics to any person upon request, without charge, by calling 1-800-262-1122. The registrant has not amended the code of ethics as described in Form N-CSR during the period covered by this report. The registrant has not granted any waiver, including an implicit waiver, from a provision of the code of ethics as described in Form N-CSR during the period covered by this report.
Item 3. Audit Committee Financial Expert
The registrant’s Board of Trustees (the “Board”) has designated George J. Gorman and Scott E. Wennerholm, each an independent trustee, as audit committee financial experts. Mr. Gorman is a certified public accountant who is the Principal at George J. Gorman LLC (a consulting firm). Previously, Mr. Gorman served in various capacities at Ernst & Young LLP (a registered public accounting firm), including as Senior Partner. Mr. Gorman also has experience serving as an independent trustee and audit committee financial expert of other mutual fund complexes. Mr. Wennerholm is a private investor. Previously, Mr. Wennerholm served as a
Trustee at Wheelock College (postsecondary institution), as a Consultant at GF Parish Group (executive recruiting firm), Chief Operating Officer and Executive Vice President at BNY Mellon Asset Management (investment management firm), Chief Operating Officer and Chief Financial Officer at Natixis Global Asset Management (investment management firm), and Vice President at Fidelity Investments Institutional Services (investment management firm).
Item 4. Principal Accountant Fees and Services
(a)-(d)
The following table presents the aggregate fees billed to the registrant for the registrant’s fiscal years ended January 31, 2023 and January 31, 2024 by the registrant’s principal accountant, Deloitte & Touche LLP (“D&T”), for professional services rendered for the audit of the registrant’s annual financial statements and fees billed for other services rendered by D&T during such period.
Fiscal Years Ended | 1/31/23 | 1/31/24 | ||||||
Audit Fees | $ | 57,600 | $ | 57,600 | ||||
Audit-Related Fees(1) | $ | 0 | $ | 0 | ||||
Tax Fees(2) | $ | 350 | $ | 0 | ||||
All Other Fees(3) | $ | 0 | $ | 0 | ||||
|
|
|
| |||||
Total | $ | 57,950 | $ | 57,600 | ||||
|
|
|
| |||||
| (1) | Audit-related fees consist of the aggregate fees billed for assurance and related services that are reasonably related to the performance of the audit of financial statements and are not reported under the category of audit fees. |
| (2) | Tax fees consist of the aggregate fees billed for professional services rendered by the principal accountant relating to tax compliance, tax advice, and tax planning and specifically include fees for tax return preparation and other related tax compliance/planning matters. |
| (3) | All other fees consist of the aggregate fees billed for products and services provided by the principal accountant other than audit, audit-related, and tax services. |
(e)(1) The registrant’s audit committee has adopted policies and procedures relating to the pre-approval of services provided by the registrant’s principal accountant (the “Pre-Approval Policies”). The Pre-Approval Policies establish a framework intended to assist the audit committee in the proper discharge of its pre-approval responsibilities. As a general matter, the Pre-Approval Policies (i) specify certain types of audit, audit-related, tax, and other services determined to be pre-approved by the audit committee; and (ii) delineate specific procedures governing the mechanics of the pre-approval process, including the approval and monitoring of audit and non-audit service fees. Unless a service is specifically pre-approved under the Pre-Approval Policies, it must be separately pre-approved by the audit committee.
The Pre-Approval Policies and the types of audit and non-audit services pre-approved therein must be reviewed and ratified by the registrant’s audit committee at least annually. The registrant’s audit committee maintains full responsibility for the appointment, compensation, and oversight of the work of the registrant’s principal accountant.
(e)(2) No services described in paragraphs (b)-(d) above were approved by the registrant’s audit committee pursuant to the “de minimis exception” set forth in Rule 2-01(c)(7)(i)(C) of Regulation S-X.
(f) Not applicable.
(g) The following table presents (i) the aggregate non-audit fees (i.e., fees for audit-related, tax, and other services) billed to the registrant by D&T for the registrant’s fiscal years ended January 31, 2023 and January 31, 2024; and (ii) the aggregate non-audit fees (i.e., fees for audit-related, tax, and other services) billed to the Eaton Vance organization by D&T for the same time periods.
Fiscal Years Ended | 1/31/23 | 1/31/24 | ||||||
Registrant | $ | 350 | $ | 0 | ||||
Eaton Vance(1) | $ | 52,836 | $ | 52,836 | ||||
| (1) | Eaton Vance Management, a subsidiary of Morgan Stanley, acts as the registrant’s investment adviser and administrator. |
(h) The registrant’s audit committee has considered whether the provision by the registrant’s principal accountant of non-audit services to the registrant’s investment adviser and any entity controlling, controlled by, or under common control with the adviser that provides ongoing services to the registrant that were not pre-approved pursuant to Rule 2-01(c)(7)(ii) of Regulation S-X is compatible with maintaining the principal accountant’s independence.
(i) Not applicable.
(j) Not applicable.
Item 5. Audit Committee of Listed Registrants
The registrant has a separately-designated standing audit committee established in accordance with Section 3(a)(58)(A) of the Securities and Exchange Act of 1934, as amended. George J. Gorman, Keith Quinton, Scott E. Wennerholm (Chair), and Nancy A. Wiser are the members of the registrant’s audit committee.
Item 6. Schedule of Investments
Please see schedule of investments contained in the Report to Stockholders included under Item 1 of this Form N-CSR.
Item 7. Disclosure of Proxy Voting Policies and Procedures for Closed-End Management Investment Companies
The Board of the Fund has adopted a proxy voting policy and procedure (the “Fund Policy”), pursuant to which the trustees have delegated proxy voting responsibility to the Fund’s investment adviser and adopted the investment adviser’s proxy voting policies and procedures (the “Policies”) which are described below. The trustees will review the Policies annually. In the event that a conflict of interest arises between the Fund’s shareholders and the investment adviser, the administrator, or any of their affiliates or any affiliate of the Fund, the investment adviser will generally refrain from voting the proxies related to the companies giving rise to such conflict until it consults with the Board, or any committee, sub-committee or group of independent trustees identified by the Board, which will instruct the investment adviser on the appropriate course of action. If the Board Members are unable to meet and the failure to vote a proxy would have a material adverse impact on the Fund, the investment adviser may vote such proxy, provided that it discloses the existence of the material conflict to the Chairperson of the Fund’s Board as soon as practicable and to the Board at its next meeting.
The Policies are designed to promote accountability of a company’s management to its shareholders and to align the interests of management with those shareholders. An independent proxy voting service (“Agent”), currently Institutional Shareholder Services, Inc., has been retained to assist in the voting of proxies through the provision of vote analysis, implementation and recordkeeping and disclosure services. The investment adviser will generally vote proxies through the Agent. The Agent is required to vote all proxies in accordance with customized proxy voting guidelines (the “Guidelines”) and/or refer them back to the investment adviser pursuant to the Policies.
The Agent is required to establish and maintain adequate internal controls and policies in connection with the provision of proxy voting services, including methods to reasonably ensure that its analysis and recommendations are not influenced by a conflict of interest. The Guidelines include voting guidelines for matters relating to, among other things, the election of directors, approval of independent auditors, executive compensation, corporate structure and anti-takeover defenses. The investment adviser may cause the Fund to abstain from voting from time to time where it determines that the costs associated with voting a proxy outweigh the benefits derived from exercising the right to vote or it is unable to access or access timely ballots or other proxy information, among other stated reasons. The Agent will refer Fund proxies to the investment adviser for instructions under circumstances where, among others: (1) the application of the Guidelines is unclear; (2) a particular proxy question is not covered by the Guidelines; or (3) the Guidelines require input from the investment adviser. When a proxy voting issue has been referred to the investment adviser, the analyst (or portfolio manager if applicable) covering the company subject to the proxy proposal determines the final vote (or decision not to vote) and the investment adviser’s Proxy Administrator (described below) instructs the Agent to vote accordingly for securities held by the Fund. Where more than one analyst covers a particular company and the recommendations of such analysts voting a proposal conflict, the investment adviser’s Global Proxy Group (described below) will review such recommendations and any other available information related to the proposal and determine the manner in which it should be voted, which may result in different recommendations for the Fund that may differ from other clients of the investment adviser.
The investment adviser has appointed a Proxy Administrator to assist in the coordination of the voting of client proxies (including the Fund’s) in accordance with the Guidelines and the Policies. The investment adviser and its affiliates have also established a Global Proxy Group. The Global Proxy Group develops the investment adviser’s positions on all major corporate issues, creates the Guidelines and oversees the proxy voting process. The Proxy Administrator maintains a record of all proxy questions that have been referred by the Agent, all applicable recommendations, analysis and research received and any resolution of the matter. Before instructing the Agent to vote contrary to the Guidelines or the recommendation of the Agent, the Proxy Administrator will provide the Global Proxy Group with the Agent’s recommendation for the proposal along with any other relevant materials, including the basis for the analyst’s recommendation. The Proxy Administrator will then instruct the Agent to vote the proxy in the manner determined by the Global Proxy Group. A similar process will be followed if the Agent has a conflict of interest with respect to a proxy. The investment adviser will report to the Fund’s Board any votes cast contrary to the Guidelines or Agent recommendations, as applicable, no less than annually.
The investment adviser’s Global Proxy Group is responsible for monitoring and resolving possible material conflicts with respect to proxy voting. Because the Guidelines are predetermined and designed to be in the best interests of shareholders, application of the Guidelines to vote client proxies should, in most cases, adequately address any possible conflict of interest. The investment adviser will monitor situations that may result in a conflict of interest between any of its clients and the investment adviser or any of its affiliates by maintaining a list of significant existing and prospective corporate clients. The Proxy Administrator will compare such list with the names of companies of which he or she has been referred a proxy statement (the “Proxy Companies”). If a company on the list is also a Proxy Company, the Proxy Administrator will report that fact to the Global Proxy Group. If the Proxy Administrator intends to instruct the Agent to vote in a manner inconsistent with the Guidelines, the Global Proxy Group will first determine, in consultation with legal counsel if necessary, whether a material conflict exists. If it is determined that a material conflict exists, the investment adviser will seek instruction on how the proxy should be voted from the Fund’s Board, or any committee or subcommittee identified by the Board. If a matter is referred to the Global Proxy Group, the decision made and basis for the decision will be documented by the Proxy Administrator and/or Global Proxy Group.
Information on how the Fund voted proxies relating to portfolio securities during the most recent 12 month period ended June 30 is available (1) without charge, upon request, by calling 1-800-262-1122, and (2) on the Securities and Exchange Commission’s website at http://www.sec.gov.
Item 8. Portfolio Managers of Closed-End Management Investment Companies
Eaton Vance Management (“EVM” or “Eaton Vance”) is the investment adviser of the Fund. Craig R. Brandon and Julie P. Callahan are responsible for the overall and day-to-day management of the Fund’s investments. Mr. Brandon is a Vice President of EVM, has been a portfolio manager of the Fund since July 2015, is Co-Director of the Municipal Investments Group, and has managed other Eaton Vance portfolios for more than five years. Ms. Callahan has been a Vice President of EVM since September 2021, has been a Managing Director at Morgan Stanley Investment Management Inc. (“MSIM”), an affiliate of EVM, since 2020, and has been a portfolio manager of the Fund since October 2021. Prior to joining MSIM, she was a senior member of the municipal bond portfolio management team at PIMCO from 2011 to 2020. This information is provided as of the date of filing this report.
The following table shows, as of the Fund’s most recent fiscal year end, the number of accounts the portfolio manager managed in each of the listed categories and the total assets (in millions of dollars) in the accounts managed within each category. The table also shows the number of accounts with respect to which the advisory fee is based on the performance of the account, if any, and the total assets (in millions of dollars) in those accounts.
| Number of All Accounts | Total Assets of All Accounts | Number of Accounts Paying a Performance Fee | Total Assets of Accounts Paying a Performance Fee | |||||||||||||
Craig R. Brandon, CFA | ||||||||||||||||
Registered Investment Companies | 9 | $ | 7,692.7 | 0 | $ | 0 | ||||||||||
Other Pooled Investment Vehicles | 0 | $ | 0 | 0 | $ | 0 | ||||||||||
Other Accounts | 8 | $ | 805.7 | 0 | $ | 0 | ||||||||||
Julie P. Callahan, CFA | ||||||||||||||||
Registered Investment Companies | 11 | $ | 2,731.3 | 0 | $ | 0 | ||||||||||
Other Pooled Investment Vehicles | 0 | $ | 0 | 0 | $ | 0 | ||||||||||
Other Accounts | 0 | $ | 0 | 0 | $ | 0 | ||||||||||
The following table shows the dollar range of Fund shares beneficially owned by the portfolio manager as of the Fund’s most recent fiscal year end.
Portfolio Manager | Dollar Range of Equity Securities Beneficially Owned in the Fund | |
Craig R. Brandon, CFA | $100,001 - $500,000 | |
Julie P. Callahan, CFA | None |
Potential for Conflicts of Interest. It is possible that conflicts of interest may arise in connection with a portfolio manager’s management of the Fund’s investments on the one hand and the investments of other accounts for which a portfolio manager is responsible on the other. For example, a portfolio manager may have conflicts of interest in allocating management time, resources and investment opportunities among the Fund and other accounts he advises. In addition, due to differences in the investment strategies or restrictions between the
Fund and the other accounts, the portfolio manager may take action with respect to another account that differs from the action taken with respect to the Fund. In some cases, another account managed by a portfolio manager may compensate the investment adviser based on the performance of the securities held by that account. The existence of such a performance based fee may create additional conflicts of interest for the portfolio manager in the allocation of management time, resources and investment opportunities. Whenever conflicts of interest arise, the portfolio manager will endeavor to exercise his discretion in a manner that he believes is equitable to all interested persons. EVM has adopted several policies and procedures designed to address these potential conflicts including a code of ethics and policies that govern the investment adviser’s trading practices, including among other things the aggregation and allocation of trades among clients, brokerage allocations, cross trades and best execution.
Compensation Structure for EVM
The compensation structure of Eaton Vance and its affiliates that are investment advisers (for purposes of this section “Eaton Vance”) is based on a total reward system of base salary and incentive compensation, which is paid either in the form of cash bonus, or for employees meeting the specified deferred compensation eligibility threshold, partially as a cash bonus and partially as mandatory deferred compensation. Deferred compensation granted to Eaton Vance employees is generally granted as a mix of deferred cash awards under the Investment Management Alignment Plan (IMAP) and equity-based awards in the form of stock units. The portion of incentive compensation granted in the form of a deferred compensation award and the terms of such awards are determined annually by the Compensation, Management Development and Succession Committee of the Board of Directors of Eaton Vance’s parent company, Morgan Stanley.
Base salary compensation. Generally, portfolio managers and research analysts receive base salary compensation based on the level of their position with the Adviser.
Incentive compensation. In addition to base compensation, portfolio managers and research analysts may receive discretionary year-end compensation. Incentive compensation may include:
| • | Cash bonus |
| • | Deferred compensation: |
| • | A mandatory program that defers a portion of incentive compensation into restricted stock units or other awards based on Morgan Stanley common stock or other plans that are subject to vesting and other conditions. |
| • | IMAP is a cash-based deferred compensation plan designed to increase the alignment of participants’ interests with the interests of clients. For eligible employees, a portion of their deferred compensation is mandatorily deferred into IMAP on an annual basis. Awards granted under IMAP are notionally invested in referenced funds available pursuant to the plan, which are funds advised by MSIM and its affiliates including Eaton Vance. Portfolio managers are required to notionally invest a minimum of 40% of their account balance in the designated funds that they manage and are included in the IMAP notional investment fund menu. |
| • | Deferred compensation awards are typically subject to vesting over a multi-year period and are subject to cancellation through the payment date for competition, cause (i.e., any act or omission that constitutes a breach of obligation to the Funds, including failure to comply with internal compliance, ethics or risk management standards, and failure or refusal to perform duties satisfactorily, including supervisory and management duties), disclosure of proprietary information, and solicitation of employees or clients. Awards are also subject to clawback through the payment date if an employee’s act or omission (including with respect to direct supervisory responsibilities) causes a restatement of the firm’s consolidated financial results, constitutes a violation of the firm’s global risk management principles, policies and standards, or causes a loss of revenue associated with a position on which the employee was paid and the employee operated outside of internal control policies. |
Eaton Vance compensates employees based on principles of pay-for-performance, market competitiveness and risk management. Eligibility for, and the amount of any, discretionary compensation is subject to a multi-dimensional process. Specifically, consideration is given to one or more of the following factors, which can vary by portfolio management team and circumstances:
| • | Revenue and profitability of the business and/or each fund/account managed by the portfolio manager |
| • | Revenue and profitability of the firm |
| • | Return on equity and risk factors of both the business units and Morgan Stanley |
| • | Assets managed by the portfolio manager |
| • | External market conditions |
| • | New business development and business sustainability |
| • | Contribution to client objectives |
| • | Team, product and/or Eaton Vance performance |
| • | The pre-tax investment performance of the funds/accounts managed by the portfolio manager(1) (which may, in certain cases, be measured against the applicable benchmark(s) and/or peer group(s) over one, three and five-year periods),(2) provided that for funds that are tax-managed or otherwise have an objective of after-tax returns, performance net of taxes will be considered |
| • | Individual contribution and performance |
Further, the firm’s Global Incentive Compensation Discretion Policy requires compensation managers to consider only legitimate, business related factors when exercising discretion in determining variable incentive compensation, including adherence to Morgan Stanley’s core values, conduct, disciplinary actions in the current performance year, risk management and risk outcomes.
| (1) | Generally, this is total return performance, provided that consideration may also be given to relative risk-adjusted performance. |
| (2) | When a fund’s peer group as determined by Lipper or Morningstar is deemed by the relevant Eaton Vance Chief Investment Officer, or in the case of the sub-advised Funds, the Director of Product Development and Sub-Advised Funds, not to provide a fair comparison, performance may instead be evaluated primarily against a custom peer group or market index. |
Item 9. Purchases of Equity Securities by Closed-End Management Investment Company and Affiliated Purchasers
No such purchases this period.
Item 10. Submission of Matters to a Vote of Security Holders
No material changes.
Item 11. Controls and Procedures
(a) It is the conclusion of the registrant’s principal executive officer and principal financial officer that the effectiveness of the registrant’s current disclosure controls and procedures (such disclosure controls and procedures having been evaluated within 90 days of the date of this filing) provide reasonable assurance that the information required to be disclosed by the registrant has been recorded, processed, summarized and reported within the time period specified in the Commission’s rules and forms and that the information required to be disclosed by the registrant has been accumulated and communicated to the registrant’s principal executive officer and principal financial officer in order to allow timely decisions regarding required disclosure.
(b) There have been no changes in the registrant’s internal controls over financial reporting during the period covered by this report that has materially affected, or is reasonably likely to materially affect, the registrant’s internal control over financial reporting.
Item 12. Disclosure of Securities Lending Activities for Closed-End Management Investment Companies
No activity to report for the registrant’s most recent fiscal year end.
Item 13. Exhibits
| (a)(1) | Registrant’s Code of Ethics – Not applicable (please see Item 2). | |
| (a)(2)(i) | Treasurer’s Section 302 certification. | |
| (a)(2)(ii) | President’s Section 302 certification. | |
| (b) | Combined Section 906 certification. | |
Signatures
Pursuant to the requirements of the Securities Exchange Act of 1934 and the Investment Company Act of 1940, the registrant has duly caused this report to be signed on its behalf by the undersigned, thereunto duly authorized.
Eaton Vance Municipal Income 2028 Term Trust
| By: | /s/ Kenneth A. Topping | |
| Kenneth A. Topping | ||
| President |
Date: March 25, 2024
Pursuant to the requirements of the Securities Exchange Act of 1934 and the Investment Company Act of 1940, this report has been signed below by the following persons on behalf of the registrant and in the capacities and on the dates indicated.
| By: | /s/ James F. Kirchner | |
| James F. Kirchner | ||
| Treasurer |
Date: March 25, 2024
| By: | /s/ Kenneth A. Topping | |
| Kenneth A. Topping | ||
| President |
Date: March 25, 2024