|
Exhibit 99.1 
|
Transforming Healthcare from the Inside
J.P. Morgan Healthcare Conference
January 12, 2016
|
|
Forward-looking statements—Certain statements included in this presentation, including, but not limited to, those related to our financial and business outlook, strategy and growth drivers, member retention and renewal rates and revenue visibility, cross and upsell opportunities, leverage and financial flexibility, acquisition activities and pipeline, revenue available under contract, long-term financial goals, and 2016 financial guidance and related assumptions, are “forward-looking statements” within the meaning of the federal securities laws. Forward-looking statements may involve known and unknown risks, uncertainties and other factors that may cause the actual results of Premier to be materially different from historical results or from any future results or projections expressed or implied by such forward-looking statements. Accordingly, readers should not place undue reliance on any forward looking statements. Readers are urged to consider statements in the conditional or future tenses or that include terms such as “believes,” “belief,” “expects,” “estimates,” “intends,” “anticipates” or “plans” to be uncertain and forward-looking. Forward-looking statements may include comments as to Premier’s beliefs and expectations as to future events and trends affecting its business and are necessarily subject to uncertainties, many of which are outside Premier’s control. More information on potential risks and other factors that could affect Premier’s financial results is included, and updated, from time to time, in Premier’s periodic and current filings with the SEC, including Premier’s most recent Form 10-K for the year ended June 30, 2015. Forward looking statements speak only as of the date they are made. Premier undertakes no obligation to publicly update or revise any forward-looking statements.
Non-GAAP financial measures—This presentation includes certain “non-GAAP financial measures” as defined in Regulation G under the Securities Exchange Act of 1934. Schedules are attached that reconcile the non-GAAP financial measures included in this presentation to the most directly comparable financial measures calculated and presented in accordance with Generally Accepted Accounting Principles in the United States. Our Form 10-Q for the fiscal first quarter ended September 30, 2015, filed with the SEC, provides further explanation and disclosure regarding our use of non-GAAP financial measures and should be read in conjunction with this presentation.
Susan Devore
President & CEO
Premier Inc.
PREMIER IS…
WHY HOW WHAT
Able and committed to Improving quality, reducing Unique depth and breadth
transform healthcare costs and paving the way of data, technology and
together with member for a population health services to provide a
systems. world. holistic and integrated set
of solutions.
GOVERNMENT
INSURERS SUPPLIERS
Relationships that matter:
Delivering high quality affordable care
1,100+ Suppliers
Pharma
Insurance Companies
HOW
Premier has an inside-out, outside-in approach.
Majority owned by healthcare systems
Embedded employees Test, fast-track and prove solutions together
HEALTH SYSTEM CHALLENGES
Population health MACRA Healthcare Cost reduction/ Evolving payment
information drug pricing models
technology
Pull from multiple sources
Create actionable insights
Use intelligence to improve care and lower cost
Reduce Improve Manage
Costs Quality and Safety Populations
Combines People, Process, and Technology
PREMIERCONNECT
SUPPLY CHAIN
ANY
DATA
P U R C H A S I N G B I L L I N G F I N A N C I A L C L I N I C A L C L A I M S
HEALTH SYSTEM Premier
Challenges SOLUTIONS
CHALLENGE CHALLENGE CHALLENGE CHALLENGE CHALLENGE
Population health MACRA Healthcare information Cost reduction/ Evolving payment
technology drug pricing models
SOLUTION SOLUTION SOLUTION SOLUTION SOLUTION
#1 KLAS-rated Analytics Integrated Integrated cost and Collaboratives,
population health Physician enterprise data platform pharmacy solutions technology &
D.C. presence
services optimization
Integrate solutions
Tackle challenges holistically
Attack and succeed in a reform environment
Strong performance
Minimal debt
Significant flexibility
INOVATM
First Health
OF THE CAROLINAS
PREMIER +
DRIVING
PERFORMANCE
Craig McKasson
CFO
Premier Inc.
DIVERSIFIED FINANCIAL MODEL
AND POWERFUL
Multiple growth Core “chassis” Recurring and Cross and up-sell Financial
drivers built visible revenue opportunities flexibility
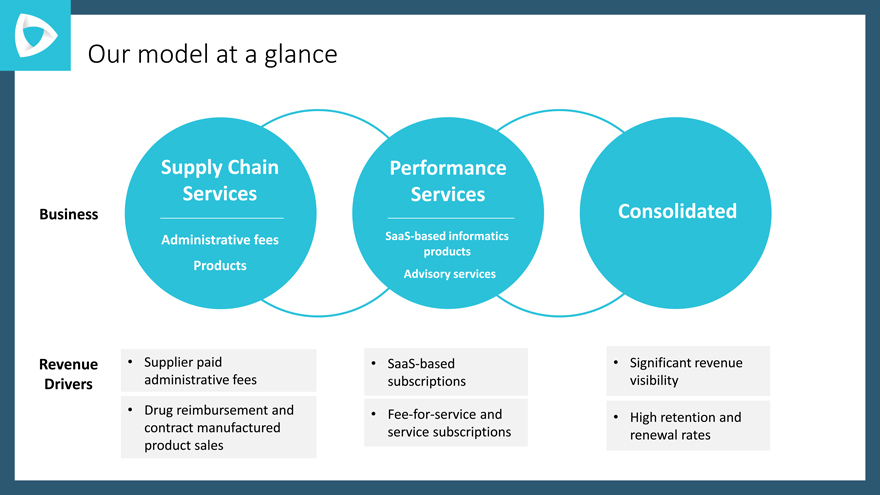
Our model at a glance
Supply Chain Performance
Services Services
Business Consolidated
Administrative fees SaaS-based informatics
products
Products
Advisory services
Revenue Supplier paid SaaS-based Significant revenue
Drivers administrative fees subscriptions visibility
Drug reimbursement and Fee-for-service and High retention and
contract manufactured service subscriptions renewal rates
product sales
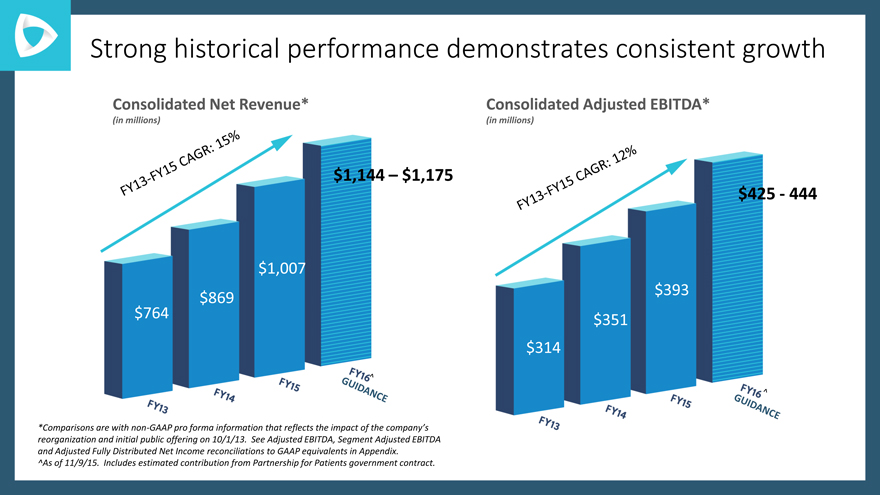
Strong historical performance demonstrates consistent growth
Consolidated Net Revenue*
(in millions)
$1,144 – $1,175
$1,007
$869
$764
Consolidated Adjusted EBITDA*
(in millions)
$425—444
$393
$351
$314
*Comparisons are with non-GAAP pro forma information that reflects the impact of the company’s reorganization and initial public offering on 10/1/13. See Adjusted EBITDA, Segment Adjusted EBITDA and Adjusted Fully Distributed Net Income reconciliations to GAAP equivalents in Appendix.
^As of 11/9/15. Includes estimated contribution from Partnership for Patients government contract.
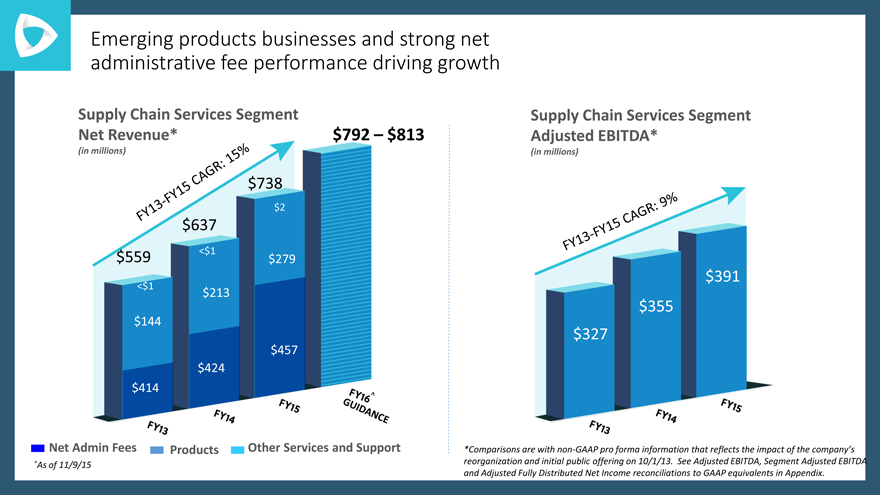
Emerging products businesses and strong net administrative fee performance driving growth
Supply Chain Services Segment
Net Revenue* $792 – $813
(in millions)
$738
$2
$637
$559 <$1 $279
<$1 $213
$144
$457
$424
$414
Net Admin Fees Products Other Services and Support
^As of 11/9/15
Supply Chain Services Segment
Adjusted EBITDA*
(in millions)
$391
$355
$327
*Comparisons are with non-GAAP pro forma information that reflects the impact of the company’s reorganization and initial public offering on 10/1/13. See Adjusted EBITDA, Segment Adjusted EBITDA and Adjusted Fully Distributed Net Income reconciliations to GAAP equivalents in Appendix.
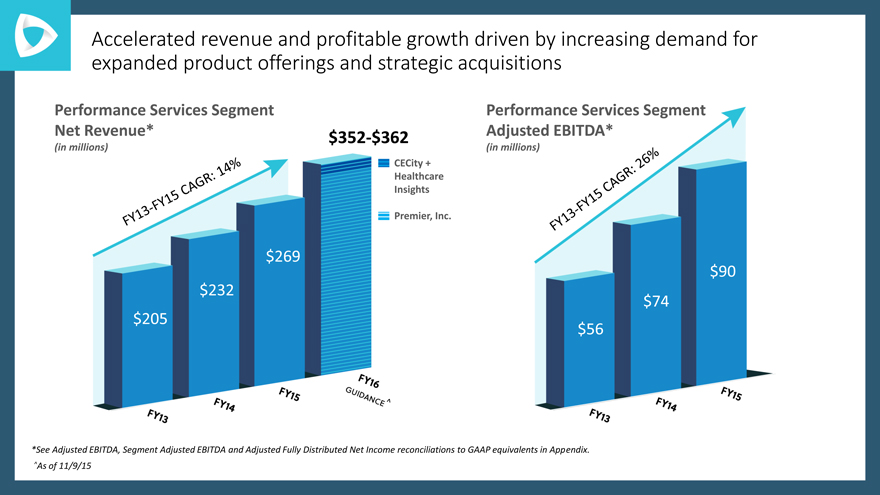
Accelerated revenue and profitable growth driven by increasing demand for expanded product offerings and strategic acquisitions
Performance Services Segment
Net Revenue* $352-$362
(in millions)
CECity +
Healthcare
Insights
Premier, Inc.
$269
$232
$205
Performance Services Segment
Adjusted EBITDA*
(in millions)
$90
$74
$56
*See Adjusted EBITDA, Segment Adjusted EBITDA and Adjusted Fully Distributed Net Income reconciliations to GAAP equivalents in Appendix. ^As of 11/9/15
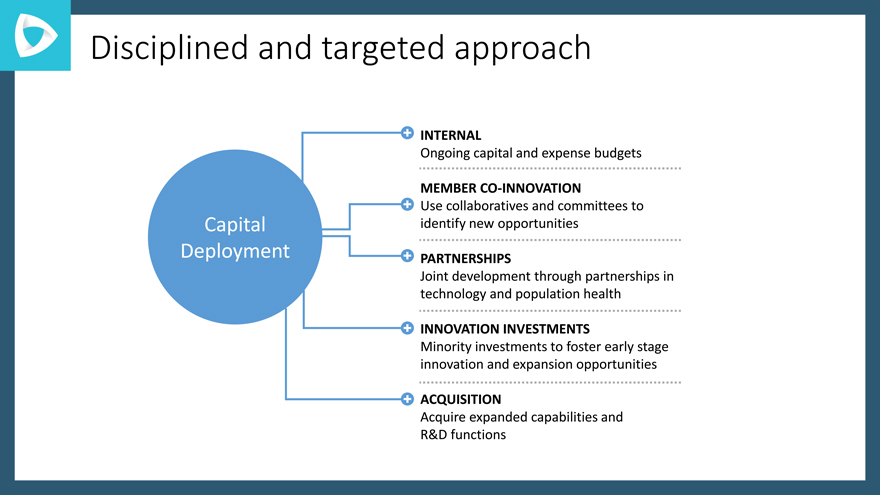
Capital Deployment Strategy
Disciplined and targeted approach
INTERNAL
Ongoing capital and expense budgets
MEMBER CO-INNOVATION
Use collaboratives and committees to
Capital identify new opportunities
Deployment PARTNERSHIPS
Joint development through partnerships in
technology and population health
INNOVATION INVESTMENTS
Minority investments to foster early stage
innovation and expansion opportunities
ACQUISITION
Acquire expanded capabilities and
R&D functions
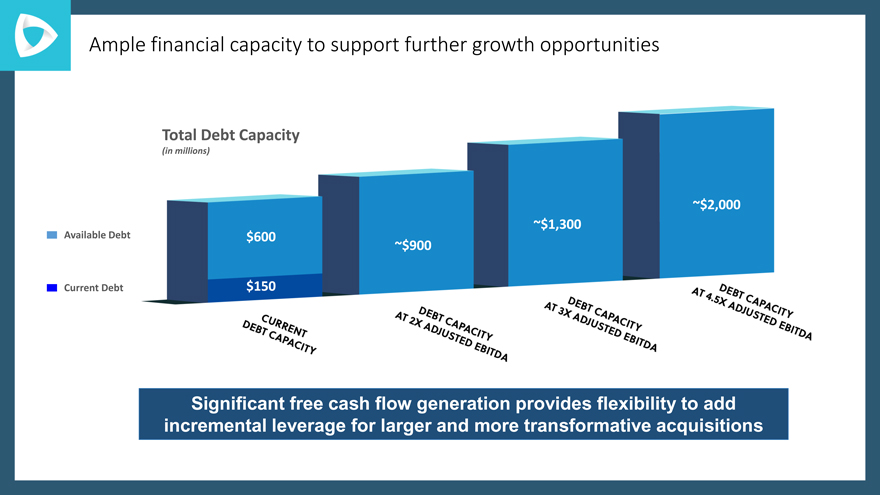
Ample financial capacity to support further growth opportunities
Total Debt Capacity
(in millions)
~$2,000
~$1,300
Available Debt $ 600
~$900
Current Debt $ 150
Significant free cash flow generation provides flexibility to add incremental leverage for larger and more transformative acquisitions
Well-positioned for
CONTINUED
LONG-TERM GROWTH
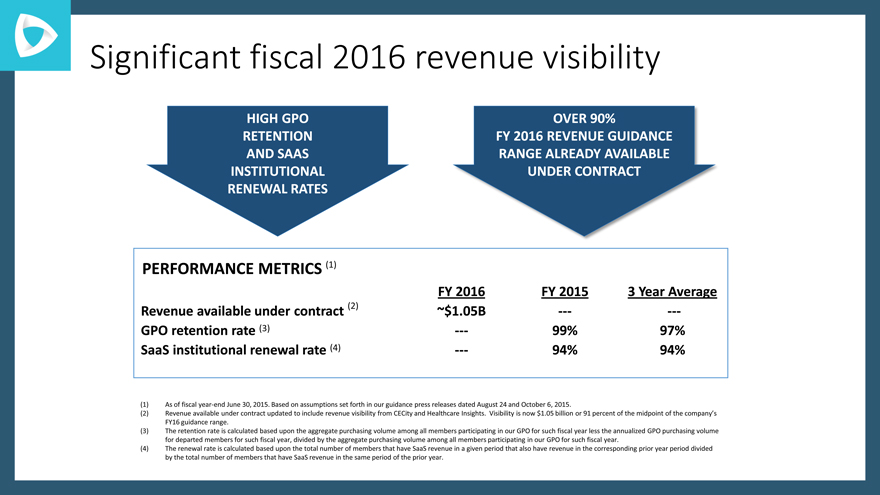
Significant fiscal 2016 revenue visibility
HIGH GPO OVER 90%
RETENTION FY 2016 REVENUE GUIDANCE
AND SAAS RANGE ALREADY AVAILABLE
INSTITUTIONAL UNDER CONTRACT
RENEWAL RATES
PERFORMANCE METRICS (1)
FY 2016 FY 2015 3 Year Average
Revenue available under contract (2) ~$1.05B —- —-
GPO retention rate (3) —- 99% 97%
SaaS institutional renewal rate (4) —- 94% 94%
As of fiscal year-end June 30, 2015. Based on assumptions set forth in our guidance press releases dated August 24 and October 6, 2015.
Revenue available under contract updated to include revenue visibility from CECity and Healthcare Insights. Visibility is now $1.05 billion or 91 percent of the midpoint of the company’s FY16 guidance range.
The retention rate is calculated based upon the aggregate purchasing volume among all members participating in our GPO for such fiscal year less the annualized GPO purchasing volume for departed members for such fiscal year, divided by the aggregate purchasing volume among all members participating in our GPO for such fiscal year.
The renewal rate is calculated based upon the total number of members that have SaaS revenue in a given period that also have revenue in the corresponding prior year period divided by the total number of members that have SaaS revenue in the same period of the prior year.
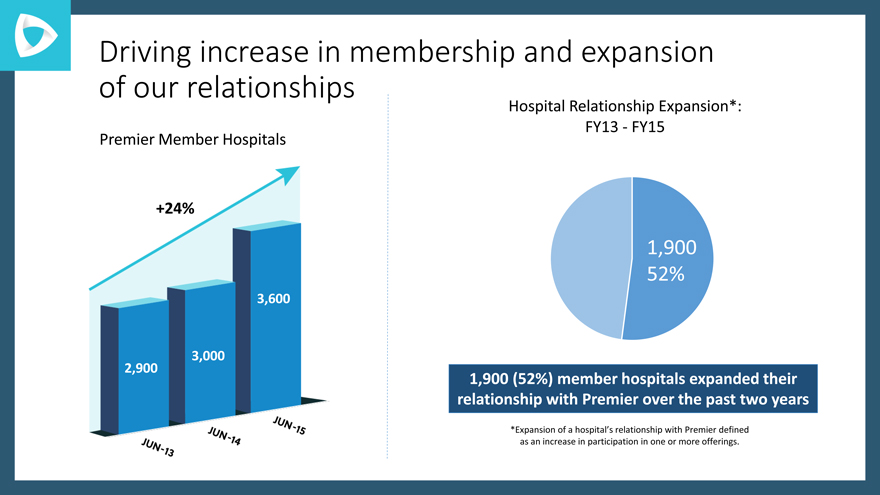
Driving increase in membership and expansion of our relationships
Premier Member Hospitals
+24%
3,600
3,000
2,900
Hospital Relationship Expansion*:
FY13—FY15
1,900
52%
1,900 (52%) member hospitals expanded their relationship with Premier over the past two years
*Expansion of a hospital’s relationship with Premier defined as an increase in participation in one or more offerings.
Member engagement across core capabilities demonstrates recognition of integrated value
Improve
Reduce
Population
Quality
Costs
Health
and Safety
Category June 2013 June 2015
Cost and Quality/Safety 24% 27%
Any Two Categories 25% 34%
All Three Categories 2% 10%
Tracking and measuring a static cohort of member hospitals over a three-year period to understand the change in participation yields a significant up-sell opportunity*
*Hospitals are counted in a category (reduce cost, improve quality & safety, population health) if they participate in at least one offering in that category (numerator). The hospital cohort is based on those hospitals that were Premier members at both 6/30/13 and 6/30/15 (denominator).
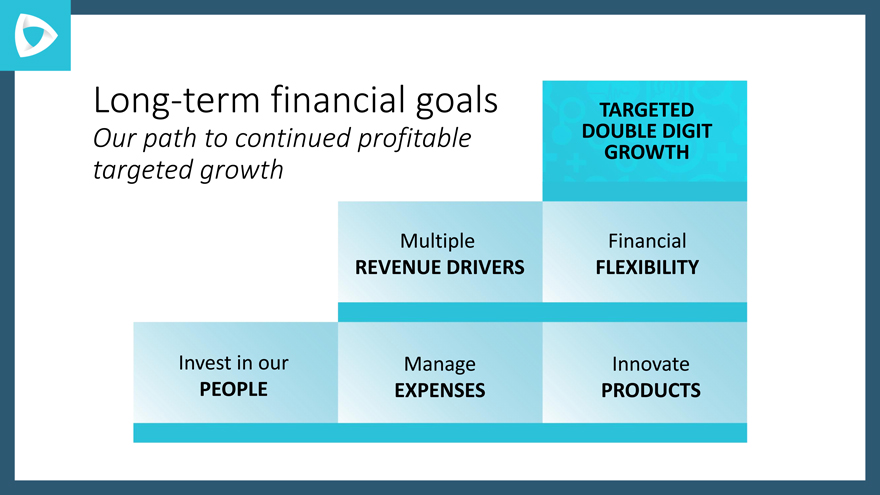
Long-term financial goals TARGETED
Our path to continued profitable DOUBLE DIGIT
GROWTH
targeted growth
Multiple Financial
REVENUE DRIVERS FLEXIBILITY
Invest in our Manage Innovate
PEOPLE EXPENSES PRODUCTS
Transforming Healthcare from the Inside
J.P. Morgan Healthcare Conference
January 12, 2016
Appendix
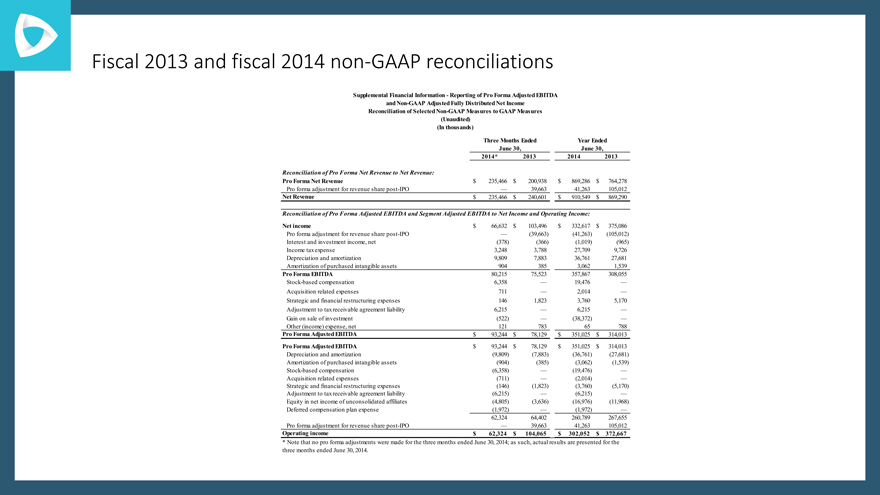
Fiscal 2013 and fiscal 2014 non-GAAP reconciliations
Supplemental Financial Information—Reporting of Pro Forma Adjusted EBITDA and Non-GAAP Adjusted Fully Distributed Net Income Reconciliation of Selected Non-GAAP Measures to GAAP Measures (Unaudited) (In thousands)
Three Months Ended Year Ended
June 30, June 30,
2014* 2013 2014 2013
Reconciliation of Pro Forma Net Revenue to Net Revenue:
Pro Forma Net Revenue $ 235,466 $ 200,938 $ 869,286 $ 764,278
Pro forma adjustment for revenue share post-IPO — 39,663 41,263 105,012
Net Revenue $ 235,466 $ 240,601 $ 910,549 $ 869,290
Reconciliation of Pro Forma Adjusted EBITDA and Segment Adjusted EBITDA to Net Income and Operating Income:
Net income $ 66,632 $ 103,496 $ 332,617 $ 375,086
Pro forma adjustment for revenue share post-IPO —(39,663)(41,263)(105,012)
Interest and investment income, net(378)(366)(1,019)(965)
Income tax expense 3,248 3,788 27,709 9,726
Depreciation and amortization 9,809 7,883 36,761 27,681
Amortization of purchased intangible assets 904 385 3,062 1,539
Pro Forma EBITDA 80,215 75,523 357,867 308,055
Stock-based compensation 6,358 — 19,476 —
Acquisition related expenses 711 — 2,014 —
Strategic and financial restructuring expenses 146 1,823 3,760 5,170
Adjustment to tax receivable agreement liability 6,215 — 6,215 —
Gain on sale of investment(522) —(38,372) —
Other (income) expense, net 121 783 65 788
Pro Forma Adjusted EBITDA $ 93,244 $ 78,129 $ 351,025 $ 314,013
Pro Forma Adjusted EBITDA $ 93,244 $ 78,129 $ 351,025 $ 314,013
Depreciation and amortization(9,809)(7,883)(36,761)(27,681)
Amortization of purchased intangible assets(904)(385)(3,062)(1,539)
Stock-based compensation(6,358) —(19,476) —
Acquisition related expenses(711) —(2,014) —
Strategic and financial restructuring expenses(146)(1,823)(3,760)(5,170)
Adjustment to tax receivable agreement liability(6,215) —(6,215) —
Equity in net income of unconsolidated affiliates(4,805)(3,636)(16,976)(11,968)
Deferred compensation plan expense(1,972) —(1,972) —
62,324 64,402 260,789 267,655
Pro forma adjustment for revenue share post-IPO — 39,663 41,263 105,012
Operating income $ 62,324 $ 104,065 $ 302,052 $ 372,667
* Note that no pro forma adjustments were made for the three months ended June 30, 2014; as such, actual results are presented for the three months ended June 30, 2014.
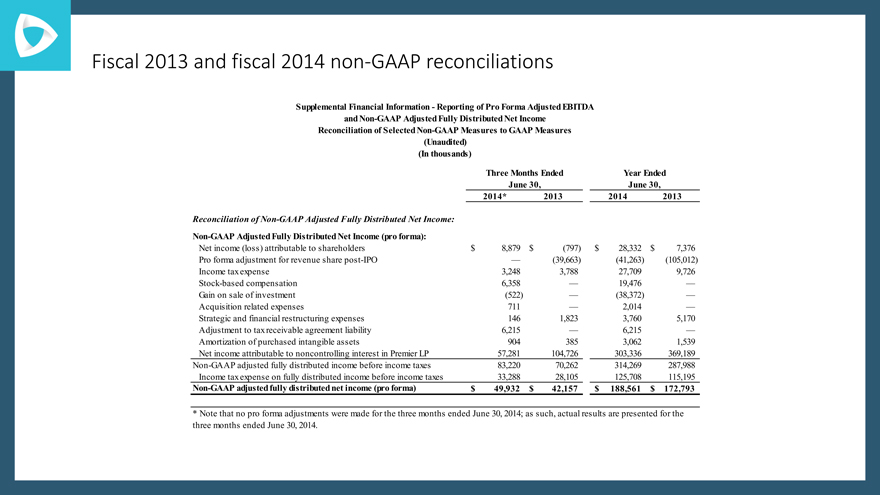
Fiscal 2013 and fiscal 2014 non-GAAP reconciliations
Supplemental Financial Information—Reporting of Pro Forma Adjusted EBITDA and Non-GAAP Adjusted Fully Distributed Net Income Reconciliation of Selected Non-GAAP Measures to GAAP Measures (Unaudited) (In thousands)
Three Months Ended Year Ended
June 30, June 30,
2014* 2013 2014 2013
Reconciliation of Non-GAAP Adjusted Fully Distributed Net Income:
Non-GAAP Adjusted Fully Distributed Net Income (pro forma):
Net income (loss) attributable to shareholders $ 8,879 $(797) $ 28,332 $ 7,376
Pro forma adjustment for revenue share post-IPO —(39,663)(41,263)(105,012)
Income tax expense 3,248 3,788 27,709 9,726
Stock-based compensation 6,358 — 19,476 —
Gain on sale of investment(522) —(38,372) —
Acquisition related expenses 711 — 2,014 —
Strategic and financial restructuring expenses 146 1,823 3,760 5,170
Adjustment to tax receivable agreement liability 6,215 — 6,215 —
Amortization of purchased intangible assets 904 385 3,062 1,539
Net income attributable to noncontrolling interest in Premier LP 57,281 104,726 303,336 369,189
Non-GAAP adjusted fully distributed income before income taxes 83,220 70,262 314,269 287,988
Income tax expense on fully distributed income before income taxes 33,288 28,105 125,708 115,195
Non-GAAP adjusted fully distributed net income (pro forma) $ 49,932 $ 42,157 $ 188,561 $ 172,793
* Note that no pro forma adjustments were made for the three months ended June 30, 2014; as such, actual results are presented for the three months ended June 30, 2014.
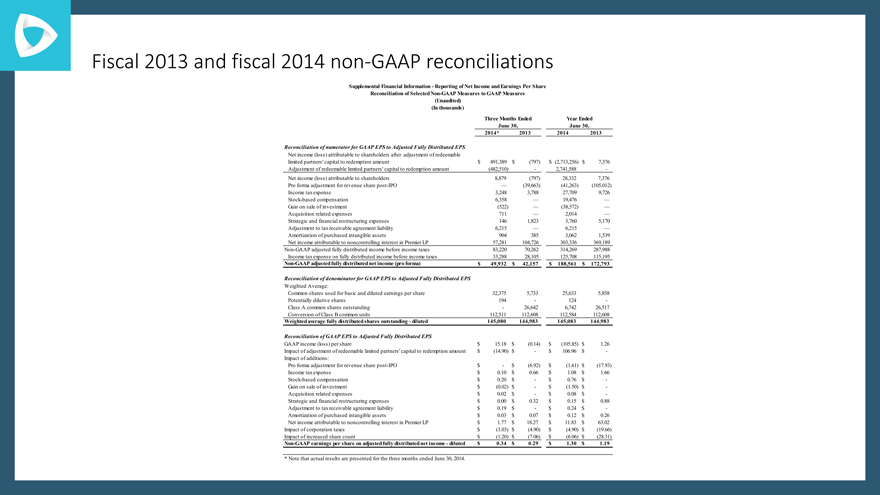
Fiscal 2013 and fiscal 2014 non-GAAP reconciliations
Supplemental Financial Information—Reporting of Net Income and Earnings Per Share Reconciliation of Selected Non-GAAP Measures to GAAP Measures (Unaudited) (In thousands)
Three Months Ended Year Ended
June 30, June 30,
2014* 2013 2014 2013
Reconciliation of numerator for GAAP EPS to Adjusted Fully Distributed EPS
Net income (loss) attributable to shareholders after adjustment of redeemable
limited partners’ capital to redemption amount $ 491,389 $(797) $ (2,713,256) $ 7,376
Adjustment of redeemable limited partners’ capital to redemption amount(482,510)—2,741,588 -
Net income (loss) attributable to shareholders 8,879(797) 28,332 7,376
Pro forma adjustment for revenue share post-IPO —(39,663)(41,263)(105,012)
Income tax expense 3,248 3,788 27,709 9,726
Stock-based compensation 6,358 — 19,476 —
Gain on sale of investment(522) —(38,372) —
Acquisition related expenses 711 — 2,014 —
Strategic and financial restructuring expenses 146 1,823 3,760 5,170
Adjustment to tax receivable agreement liability 6,215 — 6,215 —
Amortization of purchased intangible assets 904 385 3,062 1,539
Net income attributable to noncontrolling interest in Premier LP 57,281 104,726 303,336 369,189
Non-GAAP adjusted fully distributed income before income taxes 83,220 70,262 314,269 287,988
Income tax expense on fully distributed income before income taxes 33,288 28,105 125,708 115,195
Non-GAAP adjusted fully distributed net income (pro forma) $ 49,932 $ 42,157 $ 188,561 $ 172,793
Reconciliation of denominator for GAAP EPS to Adjusted Fully Distributed EPS
Weighted Average:
Common shares used for basic and diluted earnings per share 32,375 5,733 25,633 5,858
Potentially dilutive shares 194—124 -
Class A common shares outstanding—26,642 6,742 26,517
Conversion of Class B common units 112,511 112,608 112,584 112,608
Weighted average fully distributed shares outstanding—diluted 145,080 144,983 145,083 144,983
Reconciliation of GAAP EPS to Adjusted Fully Distributed EPS
GAAP income (loss) per share $ 15.18 $(0.14) $ (105.85) $ 1.26
Impact of adjustment of redeemable limited partners’ capital to redemption amount $ (14.90) $—$ 106.96 $ -
Impact of additions:
Pro forma adjustment for revenue share post-IPO $—$(6.92) $ (1.61) $(17.93)
Income tax expense $ 0.10 $ 0.66 $ 1.08 $ 1.66
Stock-based compensation $ 0.20 $—$ 0.76 $ -
Gain on sale of investment $ (0.02) $—$ (1.50) $ -
Acquisition related expenses $ 0.02 $—$ 0.08 $ -
Strategic and financial restructuring expenses $ 0.00 $ 0.32 $ 0.15 $ 0.88
Adjustment to tax receivable agreement liability $ 0.19 $—$ 0.24 $ -
Amortization of purchased intangible assets $ 0.03 $ 0.07 $ 0.12 $ 0.26
Net income attributable to noncontrolling interest in Premier LP $ 1.77 $ 18.27 $ 11.83 $ 63.02
Impact of corporation taxes $ (1.03) $(4.90) $ (4.90) $(19.66)
Impact of increased share count $ (1.20) $(7.06) $ (6.06) $(28.31)
Non-GAAP earnings per share on adjusted fully distributed net income—diluted $ 0.34 $ 0.29 $ 1.30 $ 1.19
* Note that actual results are presented for the three months ended June 30, 2014.
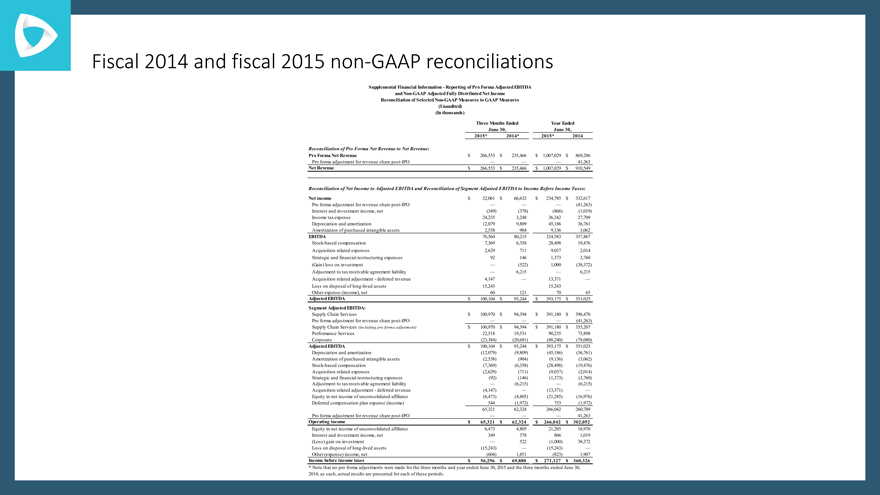
Fiscal 2014 and fiscal 2015 non-GAAP reconciliations
Supplemental Financial Information—Reporting of Pro Forma Adjusted EBITDA and Non-GAAP Adjusted Fully Distributed Net Income Reconciliation of Selected Non-GAAP Measures to GAAP Measures (Unaudited) (In thousands)
Three Months Ended Year Ended
June 30, June 30,
2015* 2014* 2015* 2014
Reconciliation of Pro Forma Net Revenue to Net Revenue:
Pro Forma Net Revenue $ 266,553 $ 235,466 $ 1,007,029 $ 869,286
Pro forma adjustment for revenue share post-IPO — — — 41,263
Net Revenue $ 266,553 $ 235,466 $ 1,007,029 $ 910,549
Reconciliation of Net Income to Adjusted EBITDA and Reconciliation of Segment Adjusted EBITDA to Income Before Income Taxes:
Net income $ 32,061 $ 66,632 $ 234,785 $ 332,617
Pro forma adjustment for revenue share post-IPO — — —(41,263)
Interest and investment income, net(349)(378)(866)(1,019)
Income tax expense 24,235 3,248 36,342 27,709
Depreciation and amortization 12,079 9,809 45,186 36,761
Amortization of purchased intangible assets 2,538 904 9,136 3,062
EBITDA 70,564 80,215 324,583 357,867
Stock-based compensation 7,369 6,358 28,498 19,476
Acquisition related expenses 2,629 711 9,037 2,014
Strategic and financial restructuring expenses 92 146 1,373 3,760
(Gain) loss on investment —(522) 1,000(38,372)
Adjustment to tax receivable agreement liability — 6,215 — 6,215
Acquisition related adjustment—deferred revenue 4,147 — 13,371 —
Loss on disposal of long-lived assets 15,243 15,243
Other expense (income), net 60 121 70 65
Adjusted EBITDA $ 100,104 $ 93,244 $ 393,175 $ 351,025
Segment Adjusted EBITDA:
Supply Chain Services $ 100,970 $ 94,394 $ 391,180 $ 396,470
Pro forma adjustment for revenue share post-IPO — — —(41,263)
Supply Chain Services (including pro forma adjustment) $ 100,970 $ 94,394 $ 391,180 $ 355,207
Performance Services 22,518 19,531 90,235 73,898
Corporate(23,384)(20,681)(88,240)(78,080)
Adjusted EBITDA $ 100,104 $ 93,244 $ 393,175 $ 351,025
Depreciation and amortization(12,079)(9,809)(45,186)(36,761)
Amortization of purchased intangible assets(2,538)(904)(9,136)(3,062)
Stock-based compensation(7,369)(6,358)(28,498)(19,476)
Acquisition related expenses(2,629)(711)(9,037)(2,014)
Strategic and financial restructuring expenses(92)(146)(1,373)(3,760)
Adjustment to tax receivable agreement liability —(6,215) —(6,215)
Acquisition related adjustment—deferred revenue(4,147) —(13,371) —
Equity in net income of unconsolidated affiliates(6,473)(4,805)(21,285)(16,976)
Deferred compensation plan expense (income) 544(1,972) 753(1,972)
65,321 62,324 266,042 260,789
Pro forma adjustment for revenue share post-IPO — — — 41,263
Operating income $ 65,321 $ 62,324 $ 266,042 $ 302,052
Equity in net income of unconsolidated affiliates 6,473 4,805 21,285 16,976
Interest and investment income, net 349 378 866 1,019
(Loss) gain on investment — 522(1,000) 38,372
Loss on disposal of long-lived assets(15,243) —(15,243) —
Other (expense) income, net(604) 1,851(823) 1,907
Income before income taxes $ 56,296 $ 69,880 $ 271,127 $ 360,326
* Note that no pro forma adjustments were made for the three months and year ended June 30, 2015 and the three months ended June 30,
2014; as such, actual results are presented for each of these periods.
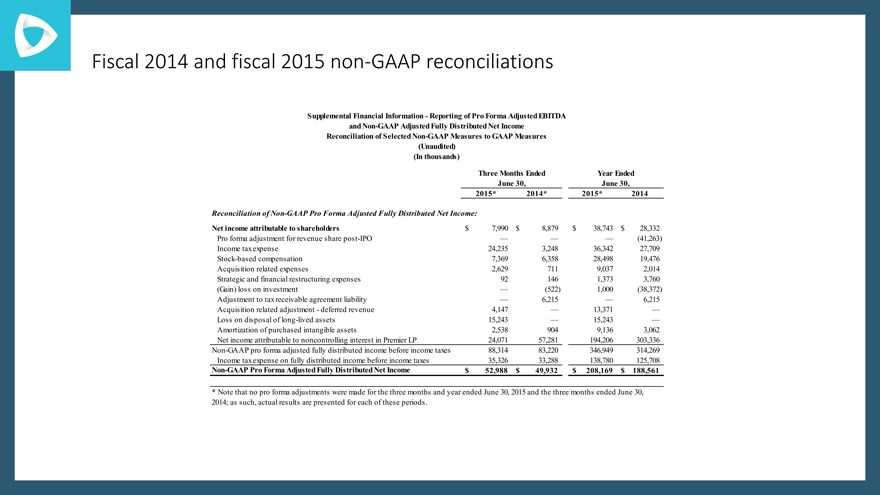
Fiscal 2014 and fiscal 2015 non-GAAP reconciliations
Supplemental Financial Information—Reporting of Pro Forma Adjusted EBITDA and Non-GAAP Adjusted Fully Distributed Net Income Reconciliation of Selected Non-GAAP Measures to GAAP Measures (Unaudited) (In thousands)
Three Months Ended Year Ended
June 30, June 30,
2015* 2014* 2015* 2014
Reconciliation of Non-GAAP Pro Forma Adjusted Fully Distributed Net Income:
Net income attributable to shareholders $ 7,990 $ 8,879 $ 38,743 $ 28,332
Pro forma adjustment for revenue share post-IPO — — —(41,263)
Income tax expense 24,235 3,248 36,342 27,709
Stock-based compensation 7,369 6,358 28,498 19,476
Acquisition related expenses 2,629 711 9,037 2,014
Strategic and financial restructuring expenses 92 146 1,373 3,760
(Gain) loss on investment —(522) 1,000(38,372)
Adjustment to tax receivable agreement liability — 6,215 — 6,215
Acquisition related adjustment—deferred revenue 4,147 — 13,371 —
Loss on disposal of long-lived assets 15,243 — 15,243 —
Amortization of purchased intangible assets 2,538 904 9,136 3,062
Net income attributable to noncontrolling interest in Premier LP 24,071 57,281 194,206 303,336
Non-GAAP pro forma adjusted fully distributed income before income taxes 88,314 83,220 346,949 314,269
Income tax expense on fully distributed income before income taxes 35,326 33,288 138,780 125,708
Non-GAAP Pro Forma Adjusted Fully Distributed Net Income $ 52,988 $ 49,932 $ 208,169 $ 188,561
* Note that no pro forma adjustments were made for the three months and year ended June 30, 2015 and the three months ended June 30, 2014; as such, actual results are presented for each of these periods.
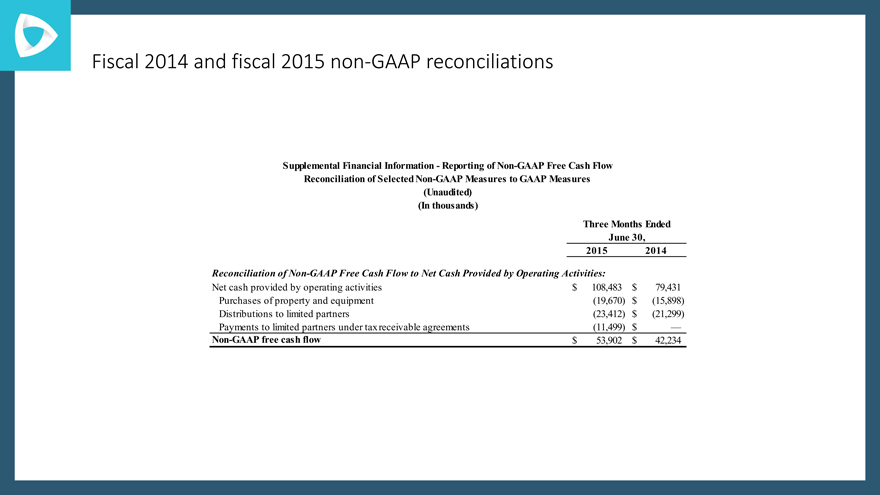
Fiscal 2014 and fiscal 2015 non-GAAP reconciliations
Supplemental Financial Information—Reporting of Non-GAAP Free Cash Flow Reconciliation of Selected Non-GAAP Measures to GAAP Measures (Unaudited) (In thousands)
Three Months Ended
June 30,
2015 2014
Reconciliation of Non-GAAP Free Cash Flow to Net Cash Provided by Operating Activities:
Net cash provided by operating activities $ 108,483 $ 79,431
Purchases of property and equipment(19,670) $(15,898)
Distributions to limited partners(23,412) $(21,299)
Payments to limited partners under tax receivable agreements(11,499) $ —
Non-GAAP free cash flow $ 53,902 $ 42,234
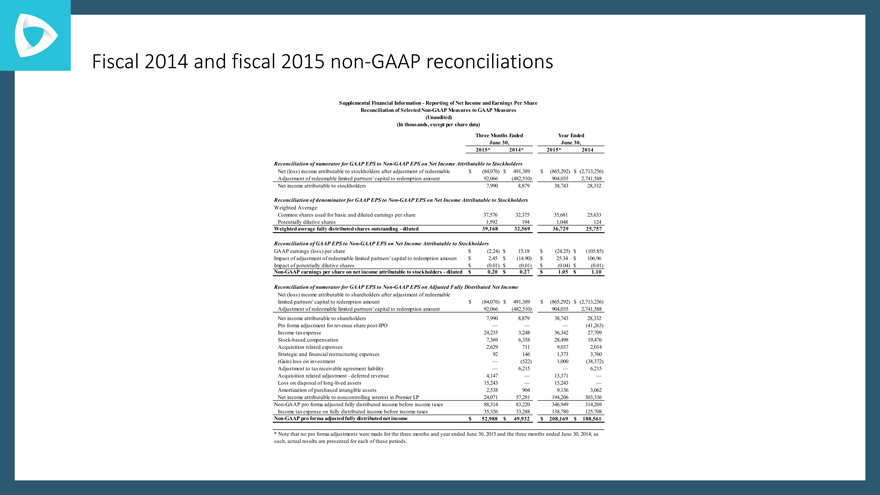
Fiscal 2014 and fiscal 2015 non-GAAP reconciliations
Supplemental Financial Information—Reporting of Net Income and Earnings Per Share Reconciliation of Selected Non-GAAP Measures to GAAP Measures (Unaudited) (In thousands, except per share data)
Three Months Ended Year Ended
June 30, June 30,
2015* 2014* 2015* 2014
Reconciliation of numerator for GAAP EPS to Non-GAAP EPS on Net Income Attributable to Stockholders
Net (loss) income attributable to stockholders after adjustment of redeemable $ (84,076) $ 491,389 $ (865,292) $(2,713,256)
Adjustment of redeemable limited partners’ capital to redemption amount 92,066(482,510) 904,035 2,741,588
Net income attributable to stockholders 7,990 8,879 38,743 28,332
Reconciliation of denominator for GAAP EPS to Non-GAAP EPS on Net Income Attributable to Stockholders
Weighted Average:
Common shares used for basic and diluted earnings per share 37,576 32,375 35,681 25,633
Potentially dilutive shares 1,592 194 1,048 124
Weighted average fully distributed shares outstanding—diluted 39,168 32,569 36,729 25,757
Reconciliation of GAAP EPS to Non-GAAP EPS on Net Income Attributable to Stockholders
GAAP earnings (loss) per share $(2.24) $ 15.18 $ (24.25) $(105.85)
Impact of adjustment of redeemable limited partners’ capital to redemption amount $ 2.45 $(14.90) $ 25.34 $ 106.96
Impact of potentially dilutive shares $(0.01) $(0.01) $ (0.04) $(0.01)
Non-GAAP earnings per share on net income attributable to stockholders—diluted $ 0.20 $ 0.27 $ 1.05 $ 1.10
Reconciliation of numerator for GAAP EPS to Non-GAAP EPS on Adjusted Fully Distributed Net Income
Net (loss) income attributable to shareholders after adjustment of redeemable
limited partners’ capital to redemption amount $ (84,076) $ 491,389 $ (865,292) $(2,713,256)
Adjustment of redeemable limited partners’ capital to redemption amount 92,066(482,510) 904,035 2,741,588
Net income attributable to shareholders 7,990 8,879 38,743 28,332
Pro forma adjustment for revenue share post-IPO — — —(41,263)
Income tax expense 24,235 3,248 36,342 27,709
Stock-based compensation 7,369 6,358 28,498 19,476
Acquisition related expenses 2,629 711 9,037 2,014
Strategic and financial restructuring expenses 92 146 1,373 3,760
(Gain) loss on investment —(522) 1,000(38,372)
Adjustment to tax receivable agreement liability — 6,215 — 6,215
Acquisition related adjustment—deferred revenue 4,147 — 13,371 —
Loss on disposal of long-lived assets 15,243 — 15,243 —
Amortization of purchased intangible assets 2,538 904 9,136 3,062
Net income attributable to noncontrolling interest in Premier LP 24,071 57,281 194,206 303,336
Non-GAAP pro forma adjusted fully distributed income before income taxes 88,314 83,220 346,949 314,269
Income tax expense on fully distributed income before income taxes 35,326 33,288 138,780 125,708
Non-GAAP pro forma adjusted fully distributed net income $ 52,988 $ 49,932 $ 208,169 $ 188,561
* Note that no pro forma adjustments were made for the three months and year ended June 30, 2015 and the three months ended June 30, 2014; as such, actual results are presented for each of these periods.
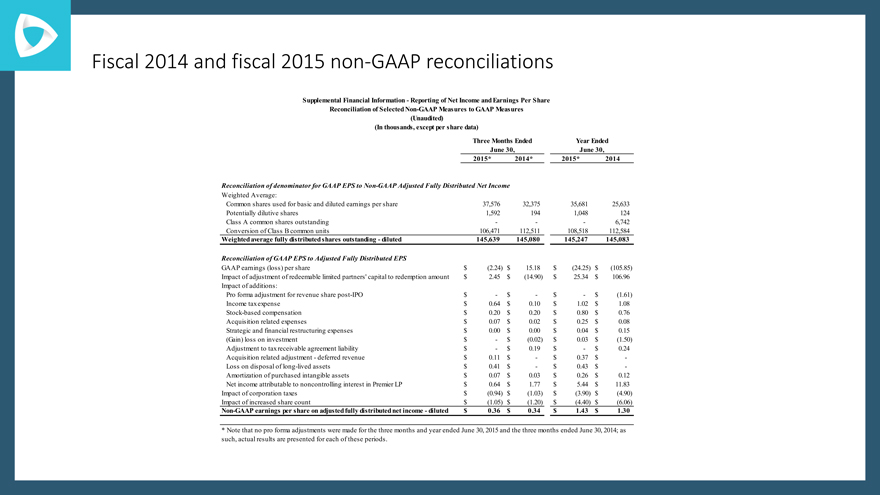
Fiscal 2014 and fiscal 2015 non-GAAP reconciliations
Supplemental Financial Information—Reporting of Net Income and Earnings Per Share Reconciliation of Selected Non-GAAP Measures to GAAP Measures (Unaudited) (In thousands, except per share data)
Three Months Ended Year Ended
June 30, June 30,
2015* 2014* 2015* 2014
Reconciliation of denominator for GAAP EPS to Non-GAAP Adjusted Fully Distributed Net Income
Weighted Average:
Common shares used for basic and diluted earnings per share 37,576 32,375 35,681 25,633
Potentially dilutive shares 1,592 194 1,048 124
Class A common shares outstanding ——6,742
Conversion of Class B common units 106,471 112,511 108,518 112,584
Weighted average fully distributed shares outstanding—diluted 145,639 145,080 145,247 145,083
Reconciliation of GAAP EPS to Adjusted Fully Distributed EPS
GAAP earnings (loss) per share $(2.24) $ 15.18 $(24.25) $(105.85)
Impact of adjustment of redeemable limited partners’ capital to redemption amount $ 2.45 $(14.90) $ 25.34 $ 106.96
Impact of additions:
Pro forma adjustment for revenue share post-IPO $—$—$—$(1.61)
Income tax expense $ 0.64 $ 0.10 $ 1.02 $ 1.08
Stock-based compensation $ 0.20 $ 0.20 $ 0.80 $ 0.76
Acquisition related expenses $ 0.07 $ 0.02 $ 0.25 $ 0.08
Strategic and financial restructuring expenses $ 0.00 $ 0.00 $ 0.04 $ 0.15
(Gain) loss on investment $—$(0.02) $ 0.03 $(1.50)
Adjustment to tax receivable agreement liability $—$ 0.19 $—$ 0.24
Acquisition related adjustment—deferred revenue $ 0.11 $—$ 0.37 $ -
Loss on disposal of long-lived assets $ 0.41 $—$ 0.43 $ -
Amortization of purchased intangible assets $ 0.07 $ 0.03 $ 0.26 $ 0.12
Net income attributable to noncontrolling interest in Premier LP $ 0.64 $ 1.77 $ 5.44 $ 11.83
Impact of corporation taxes $(0.94) $(1.03) $(3.90) $(4.90)
Impact of increased share count $(1.05) $(1.20) $(4.40) $(6.06)
Non-GAAP earnings per share on adjusted fully distributed net income—diluted $ 0.36 $ 0.34 $ 1.43 $ 1.30
* Note that no pro forma adjustments were made for the three months and year ended June 30, 2015 and the three months ended June 30, 2014; as such, actual results are presented for each of these periods.