UNITED STATES
SECURITIES AND EXCHANGE COMMISSION
Washington, D.C. 20549
FORM N-CSR
CERTIFIED SHAREHOLDER REPORT OF REGISTERED MANAGEMENT INVESTMENT COMPANIES
Investment Company Act file number 811-22865
Forethought Variable Insurance Trust
(Exact name of registrant as specified in charter)
10 West Market Street, Suite 2300
Indianapolis, Indiana 46204
(Address of principal executive offices) (Zip code)
The Corporation Trust Company
1209 Orange Street Wilmington, DE 19801
(Name and address of agent for service)
Registrant's telephone number, including area code: 877-355-1820
Date of fiscal year end: December 31
Date of reporting period: December 31, 2021
Form N-CSR is to be used by management investment companies to file reports with the Commission not later than 10 days after the transmission to stockholders of any report that is required to be transmitted to stockholders under Rule 30e-1 under the Investment Company Act of 1940 (17 CFR 270.30e-1). The Commission may use the information provided on Form N-CSR in its regulatory, disclosure review, inspection, and policymaking roles.
A registrant is required to disclose the information specified by Form N-CSR, and the Commission will make this information public. A registrant is not required to respond to the collection of information contained in Form N-CSR unless the Form displays a currently valid Office of Management and Budget (“OMB”) control number. Please direct comments concerning the accuracy of the information collection burden estimate and any suggestions for reducing the burden to Secretary, Securities and Exchange Commission, 450 Fifth Street, NW, Washington, DC 20549-0609. The OMB has reviewed this collection of information under the clearance requirements of 44 U.S.C. § 3507.
Item 1. Reports to Stockholders.
| (a) | Include a copy of the report transmitted to stockholders pursuant to Rule 30e-1 under the Act (17 CFR 270.30e-1). |

Annual Report
December 31, 2021
Global Atlantic Portfolios
Global Atlantic BlackRock Allocation Portfolio
Global Atlantic BlackRock Disciplined Core Portfolio
Global Atlantic BlackRock Disciplined Growth Portfolio
Global Atlantic BlackRock Disciplined International Core Portfolio
Global Atlantic BlackRock Disciplined Mid Cap Growth Portfolio
Global Atlantic BlackRock Disciplined Value Portfolio
Global Atlantic BlackRock High Yield Portfolio
Global Atlantic Goldman Sachs Core Fixed Income Portfolio
Class I and Class II shares
Each a separate series of the Forethought Variable Insurance Trust
Distributed by Global Atlantic Distributors, LLC
Member FINRA
Dear Shareholders/Contract Owners:
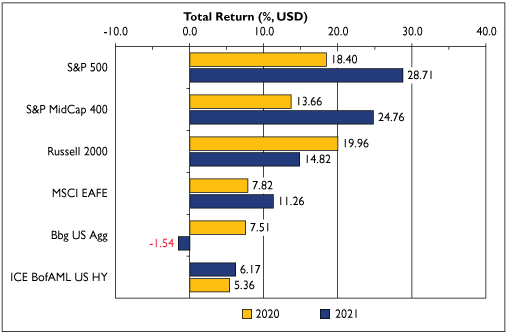
We think it goes without saying that the past two years have been truly historic. While the COVID-19 pandemic (the "Pandemic") has deservedly been front and center, and is a topic we will touch on shortly, buried beneath all the hardships and loss have been two strong years of U.S. equity returns. The S&P 500 and S&P MidCap 400 led major global equity indices, rising 28.71% and 24.76% respectively in 2021, which were meaningful improvements over 2020's strong returns that were recorded despite a historic selloff in March of that year. The Russell 2000 also performed well in 2021, up 14.82%, yet somewhat below its leading return of 19.96% in 2020. International developed large capitalization stocks, as represented by the MSCI EAFE, rose 11.26%, and while that was an improvement over its return of 7.82% in 2020, it meaningfully lagged U.S. equities. Similarly lagging were investment grade fixed income markets. Domestically, U.S. Treasury yields rose sharply while corporate spreads remained flat, resulting in a -1.54% return on the Bbg US Agg. Domestic high yield fixed income (as represented by the ICE BofAML US HY index), fared better given the strength in equity markets and meaningful spread tightening, returning 5.36%. Given these differing returns, a portfolio's exposure to equity versus fixed income, domestic versus international equity, and/or investment grade versus high yield fixed income were key determinants of performance over the past two years.
While the financial markets did not experience the historic decline and recovery of 2020 during 2021, it was a volatile year nonetheless given the continued impact of the Pandemic. Despite the development and availability of vaccines, vaccination rates remain low in many parts of the world. Together with the emergence of new variants, COVID-19 continues to negatively impact many areas of the economy, causing inconsistent and regionally disparate economic data, as well as overall financial market volatility. Since the historic bear market and recovery of 2020, financial markets have experienced spikes in volatility about every 4-6 weeks over the past 18 months, typically lasting several days before subsiding. As a result, while the performance figures shown in the graph illustrate generally strong annual returns, the intra-period path to get to these numbers was somewhat turbulent. As a result, for asset allocation funds, not only was the degree of exposure to certain asset classes an important driver of performance, but also important was the timing of those exposures.
As the U.S. economy continues to struggle with the impact of the Pandemic, we expect economic data to be directionally positive but potentially inconsistent given the emergence of new COVID-19 variants and differing vaccination rates throughout the country. Furthermore, heightened concern regarding inflation has led the U.S. Federal Reserve (the Fed) to state it will likely quicken the reduction (tapering) of its balance sheet (bond holdings) and increase interest rates in 2022. Globally, we believe the outlook is similar given the rapid spread of the Omicron variant and differing approaches by country with respect to how to best contain the virus. Consequently, there are concerns that economic growth globally could slow until these issues improve.
Given the hardships endured over the past two years, we hope this shareholder letter finds you healthy and wish you all the best for 2022 and beyond.
Thank you for investing in the Global Atlantic Portfolios.
Sincerely, | |||||||
|
| ||||||
Eric D. Todd, CFA | Cameron Jeffreys, CFA | ||||||
President | Senior Vice President | ||||||
Global Atlantic Investment Advisors, LLC | Global Atlantic Investment Advisors, LLC | ||||||


1
Portfolio | Benchmark | ||||||
Global Atlantic BlackRock Allocation Portfolio | S&P Target Risk® Growth Index | ||||||
Global Atlantic BlackRock Disciplined Core Portfolio | S&P 500® Index | ||||||
Global Atlantic BlackRock Disciplined Growth Portfolio | Russell 1000® Growth Index | ||||||
Global Atlantic BlackRock Disciplined International Core Portfolio | MSCI ACWI ex-USA Index | ||||||
Global Atlantic BlackRock Disciplined Mid Cap Growth Portfolio | Russell Midcap® Growth Index | ||||||
Global Atlantic BlackRock Disciplined Value Portfolio | Russell 1000® Value Index | ||||||
Global Atlantic BlackRock High Yield Portfolio | ICE BofAML BB-B U.S. High Yield Constrained Index | ||||||
Global Atlantic Goldman Sachs Core Fixed Income Portfolio | Bloomberg U.S. Aggregate Bond Index | ||||||
The indices shown are for informational purposes only and are not reflective of any investment. As it is not possible to invest directly in the indices, the data shown does not reflect or compare features of an actual investment, such as its objectives, costs and expenses, liquidity, safety, guarantees or insurance, fluctuation of principal or return, or tax features. Past performance is no guarantee of future results.
This report contains the current opinions of Global Atlantic Investment Advisors, LLC and/or sub-advisers at the time of its publication and should not be considered investment advice or a recommendation of any particular security, strategy or investment product. Such opinions are subject to change without notice and securities described herein may no longer be included in, or may at any time be removed from, a Portfolio's portfolio. This report is distributed for informational purposes only. Information contained herein has been obtained from sources believed to be reliable, but not guaranteed.
Index Definitions:
Bloomberg U.S. Aggregate Bond Index ("Bbg US Agg").1 An index weighted according to market capitalization and includes, among other categories, Treasury securities, mortgage-backed securities, government agency bonds and corporate bonds. To be included in the index, bonds must be rated investment grade by Moody's and Standard & Poor's.
ICE BofAML BB-B U.S. High Yield Constrained Index. An index that contains all securities in the ICE BofAML U.S. High Yield Index rated BB1 through B3, based on an average of Moody's, S&P, and Fitch, but caps issuer exposure at 2%. Index constituents are capitalization-weighted, based on their current amount outstanding, provided the total allocation to an individual issuer does not exceed 2%.
ICE BofAML High Yield Cash Pay MV USI Index ("ICE BofAML US HY"). An index that tracks the performance of US dollar denominated, below investment grade corporate debt, currently in a coupon paying period, which is publicly issued in the US domestic market.
MSCI ACWI ex-USA Index. A free float-adjusted market capitalization index designed to measure the combined equity market performance of developed and emerging market countries, excluding the United States.
MSCI EAFE Total Return Index ("MSCI EAFE"). An index created by Morgan Stanley Capital International (MSCI) that serves as a benchmark of the performance in major developed international equity markets as represented by 21 major MSCI indexes from Europe, Australasia and the Far East.
Russell 1000® Growth Index. An unmanaged index of common stock prices that measures the performance of those Russell 1000® Index companies with higher price-to-book ratios and higher forecasted growth values.
Russell 1000® Value Index. An index that measures the performance of large- and mid-capitalization value sectors of the U.S. equity market. It is a subset of the Russell 1000® Index, which measures the performance of the large-capitalization sector of the U.S. equity market.
1 Formerly known as the Bloomberg Barclays U.S. Aggregate Bond Index.
2
Russell 2000® Index ("Russell 2000"). An index measuring the performance of approximately 2,000 small-cap companies in the Russell 3000 Index, which is made up of 3,000 of the biggest U.S. stocks. The Russell 2000 serves as a benchmark for small-cap stocks in the United States.
Russell Midcap® Growth Index. An unmanaged index that consists of the bottom 800 securities of the Russell 1000® Index with greater-than-average growth orientation as ranked by total market capitalization. Securities in this index generally have higher price-to-book and price-to-earnings ratios, lower dividend yields and higher forecasted growth values.
S&P MidCap 400 Total Return Index ("S&P MidCap 400"). A capitalization-weighted index which measures the performance of the mid-range sector of the U.S. stock market.
S&P Target Risk® Growth Index. An index that increases exposure to equities, while also providing limited fixed income exposure to diversify risk.
S&P 500 Index ("S&P 500"). A market capitalization weighted price index composed of 500 widely held U.S. common stocks. Frequently used as a measure of U.S. stock market performance.
3
Table of Contents
Page | |||||||||||
• | Global Atlantic Portfolio Review and Portfolio of Investments | ||||||||||
Global Atlantic BlackRock Allocation Portfolio | 5 – 7 | ||||||||||
Global Atlantic BlackRock Disciplined Core Portfolio | 8 – 13 | ||||||||||
Global Atlantic BlackRock Disciplined Growth Portfolio | 14 – 20 | ||||||||||
Global Atlantic BlackRock Disciplined International Core Portfolio | 21 – 35 | ||||||||||
Global Atlantic BlackRock Disciplined Mid Cap Growth Portfolio | 36 – 43 | ||||||||||
Global Atlantic BlackRock Disciplined Value Portfolio | 44 – 51 | ||||||||||
Global Atlantic BlackRock High Yield Portfolio | 52 – 65 | ||||||||||
Global Atlantic Goldman Sachs Core Fixed Income Portfolio | 66 – 79 | ||||||||||
• | Financial Statements: | ||||||||||
Statements of Assets and Liabilities | 80 – 81 | ||||||||||
Statements of Operations | 82 – 83 | ||||||||||
Statements of Changes in Net Assets | 84 – 87 | ||||||||||
Financial Highlights | 88 – 102 | ||||||||||
• | Notes to Financial Statements | 103 – 128 | |||||||||
• | Report of Independent Registered Accounting Firm | 129 | |||||||||
• | Expense Examples | 130 – 131 | |||||||||
• | Supplemental Information | 132 | |||||||||
• | Trustee and Officer Table | 133 – 136 | |||||||||
• | Privacy Notice | 137 – 138 | |||||||||
• | Proxy Voting Policy | Back Cover | |||||||||
• | Portfolio Holdings | Back Cover | |||||||||
4
Global Atlantic BlackRock Allocation Portfolio
Portfolio Review
December 31, 2021 (Unaudited)
Investment Objective
The Portfolio seeks to provide total return.
Management Review
The Portfolio is sub-advised by BlackRock Investment Management, LLC ("BlackRock").
How did the Portfolio perform during the period?
During 2021, the Class I shares of Global Atlantic BlackRock Allocation Portfolio slightly underperformed its reference benchmark, the S&P Target Risk® Growth Index. The Portfolio posted a return of 11.33% compared to a benchmark return of 11.37%, a difference of -4 basis points. The following discussion of relative performance pertains to this benchmark.
What factors and allocation decisions influenced the Portfolio's performance?
The multi-asset Portfolio's overweight to equities was the largest driver of its returns, as stocks outperformed bonds overall and domestic stocks broadly outperformed their international counterparts. Within equities, the Portfolio's strategic allocation to, and rotation among, factors – along with its strategic overweight to financial stocks – were largely detractors to performance, as were international stocks.
On the fixed income side, longer-duration U.S. Treasuries sold off and the curve bear steepened to start the year, then rallied considerably as COVID-19's Delta variant reversed trends, only for inflation to force the U.S. Federal Reserve's (the "Fed") hand by the end of the year. While returns were negative across all fixed income asset classes, shifts in duration and the spread tightening in lower-quality credit bonds were sources of outperformance for the Portfolio.
How was the Portfolio positioned at period end?
At year-end, the Portfolio was 4% overweight equities relative to fixed income, as BlackRock's investment team believed the risk-reward in fixed income was diminished and challenged given interest rates at currently low levels and the persistent threat of inflation. The portfolio investment team believes that despite the concerns over the Omicron variant and the Fed's tapering-then-hike plans, expectations surrounding growth and earnings remain strong, which should lead to more equity outperformance in 2022. BlackRock believes that the case for cyclical assets like equities and commodities remains intact for 2022, with key drivers being continued supply constraints, higher wages, and the cautiously slow removal of some policy and fiscal support by non-US central banks. As the holidays led to COVID-19 case surges, some caution has returned in the U.S. and with international markets continuing to lag from slower global demand, BlackRock's investment view is to position the Portfolio for the ongoing post-COVID-19 "restart" and the maturing cycle as interest rate hikes begin amidst strong economic growth.
Within fixed income, the portfolio investment team favors a shorter duration bias, particularly within investment grade and high yield credit. This was partially offset with longer duration holdings in treasury inflation-protected securities ("TIPS") at the end of the period, which was present to not only balance inflation risks, but to also benefit sector positions should inflation run above expectations.
5
Global Atlantic BlackRock Allocation Portfolio
Portfolio Review (Continued)
December 31, 2021 (Unaudited)
The Portfolio's performance figures for the periods ended December 31, 2021 as compared to its benchmark:
Annualized | Operating Expense** | ||||||||||||||||||||||
| Inception Date* | One Year | Since Inception | Gross Ratio | Net Ratio | |||||||||||||||||||
Global Atlantic BlackRock Allocation Portfolio | |||||||||||||||||||||||
Class I | November 1, 2017 | 11.33 | % | 10.08 | % | 0.47 | % | 0.47 | % | ||||||||||||||
Class II | November 1, 2017 | 11.04 | % | 9.79 | % | 0.72 | % | 0.72 | % | ||||||||||||||
S&P Target Risk® Growth Index^ | 11.37 | % | 8.96 | % | |||||||||||||||||||
The performance data quoted is historical. Past performance is no guarantee of future results. Current performance may be higher or lower than the performance data quoted. The principal value and investment return of an investment will fluctuate so that your shares, when redeemed, may be worth more or less than their original cost. Total returns would have been lower absent fee waivers by the Adviser. Performance figures for periods greater than one year are annualized. The returns shown do not reflect the deduction of taxes that a shareholder may pay on Portfolio distributions or on the redemption of Portfolio shares, as well as other charges and expenses of the insurance contract or separate account.
* Commencement of operations is November 6, 2017.
** The estimated operating expense ratios for Class I and Class II shares, as disclosed in the most recent prospectus dated May 1, 2021. Ratios include Acquired Fund Fees and Expenses indirectly incurred by the Portfolio. Gross operating expense ratio reflects the ratio of expenses absent waivers and/or reimbursements by the Adviser. The operating expense ratios presented here may differ from the expense ratios disclosed in the Financial Highlights table in this report.
^ The S&P Target Risk® Growth Index (Total Return) provides increased exposure to equities, while also using some fixed income exposure to dampen risk. It is not possible to invest directly in an index.
Comparison of the Change in Value of a $10,000 Investment

Holdings by Asset Class | % of Net Assets | ||||||
Exchange Traded Funds | 99.5 | % | |||||
Short-Term Investments | 1.0 | % | |||||
Other Assets Less Liabilities - Net | (0.5 | )% | |||||
100.0 | % | ||||||
Please refer to the Portfolio of Investments in this annual report for more information regarding the Portfolio's holdings as of December 31, 2021.
6
Global Atlantic BlackRock Allocation Portfolio
Portfolio of Investments
December 31, 2021
| Shares/ Principal | Fair Value | ||||||||||
EXCHANGE TRADED FUNDS - 99.5% | |||||||||||
DEBT FUNDS - 34.7% | |||||||||||
| iShares 1-5 Year Investment Grade Corporate Bond ETF | 37,545 | $ | 2,022,925 | ||||||||
iShares Core Total USD Bond Market ETF | 188,768 | 9,991,490 | |||||||||
iShares Fallen Angels USD Bond ETF | 126,130 | 3,780,116 | |||||||||
iShares TIPS Bond ETF | 32,656 | 4,219,155 | |||||||||
iShares U.S. Treasury Bond ETF | 261,158 | 6,967,695 | |||||||||
TOTAL DEBT FUNDS | 26,981,381 | ||||||||||
EQUITY FUNDS - 64.8% | |||||||||||
iShares Core S&P 500 ETF | 20,920 | 9,978,631 | |||||||||
iShares Core S&P Small-Cap ETF | 24,594 | 2,816,259 | |||||||||
iShares ESG Aware MSCI USA ETF | 117,302 | 12,656,886 | |||||||||
iShares Global Financials ETF | 19,620 | 1,570,777 | |||||||||
iShares Global Tech ETF | 33,322 | 2,145,604 | |||||||||
iShares MSCI EAFE Growth ETF | 51,350 | 5,663,391 | |||||||||
iShares MSCI EAFE Value ETF | 121,338 | 6,114,222 | |||||||||
iShares MSCI USA Min Vol Factor ETF | 15,020 | 1,215,118 | |||||||||
iShares MSCI USA Value Factor ETF | 22,920 | 2,509,052 | |||||||||
iShares U.S. Energy ETF | 124,652 | 3,752,025 | |||||||||
| Shares/ Principal | Fair Value | ||||||||||
EQUITY FUNDS - 64.8% (Continued) | |||||||||||
| iShares, Inc., iShares ESG Aware MSCI EM ETF | 46,842 | $ | 1,861,970 | ||||||||
TOTAL EQUITY FUNDS | 50,283,935 | ||||||||||
| TOTAL EXCHANGE TRADED FUNDS (Cost - $63,381,806) | 77,265,316 | ||||||||||
SHORT-TERM INVESTMENTS - 1.0% | |||||||||||
MONEY MARKET FUNDS - 1.0% | |||||||||||
| Fidelity Investments Money Market Fund - Government Portfolio, Institutional Class, 0.01% (a) (Cost - $744,104) | 744,104 | 744,104 | |||||||||
| TOTAL INVESTMENTS - 100.5% (Cost - $64,125,910) | $ | 78,009,420 | |||||||||
| OTHER ASSETS LESS LIABILITIES - NET (0.5)% | (357,211) | ||||||||||
TOTAL NET ASSETS - 100.0% | $ | 77,652,209 | |||||||||
(a) The rate shown is the annualized seven-day yield at period end.
TIPS - Treasury Inflation Protected Security
See accompanying notes to financial statements.
7
Global Atlantic BlackRock Disciplined Core Portfolio
Portfolio Review
December 31, 2021 (Unaudited)
Investment Objective
The Portfolio seeks to provide long-term capital appreciation.
Management Review
The Portfolio is sub-advised by BlackRock Investment Management, LLC ("BlackRock").
How did the Portfolio perform during the period?
During 2021, the Class I shares of Global Atlantic BlackRock Disciplined Core Portfolio slightly underperformed its reference benchmark, the S&P 500® Index. The Portfolio posted a return of 28.67% compared to a benchmark return of 28.71%, a difference of -4 basis points. The following discussion of relative performance pertains to this benchmark.
What factors and allocation decisions influenced the Portfolio's performance?
BlackRock's Scientific Active Equity ("SAE") process systematically tracks and ranks the characteristics of companies in order to seek to construct a portfolio that has the best trade-off between returns, risk and costs. The SAE investment model groups the universe of securities based on an analysis of a wide range of factors, such as relative value ("Value"), earnings quality ("Quality"), market sentiment ("Sentiment"), and thematic insights. Value insights seek to incorporate, where appropriate, asset value, sales, earnings and cash flow forecasts over short and long periods. Quality measures aim to assess the sustainability of earnings and the quality of corporate management by investigating company financials as well as other company statements. Sentiment criteria seek to infer information about a company's value from changes in analysts' forecasts, linkages between companies, management decisions and the behavior of other market participants in equities and other securities markets. And lastly, thematic insights seek to identify and exploit commonalities among groups of stocks that are believed to drive prices but that currently appear to be less obvious to the market.
Portfolio outperformance was driven by strength in the second and fourth quarters of the year, primarily driven by Sentiment and fundamental measures. Within Sentiment insights, trend-based measures drove gains as these were able to correctly position the Portfolio around the volatile market backdrop that included several market style preference shifts and rising rates. Capturing Sentiment from market participants, such as identifying bond investor views as well as text analyses across executive commentaries was additive. Faster moving alternative data measures, such as insights designed to track search trends also benefitted performance. The real time nature of these types of measures were helpful in evaluating the quickly evolving marketplace. Macro thematic insights evaluating business to business invoicing, hiring activity, and sensitivity to the economic cycle were also additive through an overweight position to industrials.
Nontraditional measures of Quality, such as environmental, social, and governance ("ESG") related insights, were mixed in the period. Insights designed to capture investor flows into preferred ESG positions were top contributors, benefitting from the broader sustainability market trend. However, other insights that track company controversies and tax levels struggled. This measure penalizes companies that pay lower levels of taxes versus peers, typically growth-oriented technology companies, and favors those with higher relative tax levels. The signal struggled to keep up amid the preference shift to growth styles. Elsewhere, more traditional quality signals, such as a preference for lower-risk securities, performed well against rising market volatility.
The positive performance of fundamental Value insights in the first part of the year faded in the second half, detracting in aggregate for the year. Traditional measures, such as insights designed to track sales across valuations and research expenditures across price, detracted from performance, particularly in oil companies where the Portfolio was underweight.
How was the Portfolio positioned at period end?
At year-end, from a sector positioning perspective, the Portfolio remained largely sector neutral. The Portfolio had slight overweight positions in the information technology and financial sectors and slight underweight positions in the communication services and materials sectors at the end of the year. The SAE team seeks to maintain a style neutral approach, so the Portfolio did not have any outsized active exposures to any particular style or factor.
8
Global Atlantic BlackRock Disciplined Core Portfolio
Portfolio Review (Continued)
December 31, 2021 (Unaudited)
The Portfolio's performance figures for the periods ended December 31, 2021 as compared to its benchmark:
Annualized | Operating Expense** | ||||||||||||||||||||||
| Inception Date* | One Year | Since Inception | Gross Ratio | Net Ratio | |||||||||||||||||||
Global Atlantic BlackRock Disciplined Core Portfolio | |||||||||||||||||||||||
Class I | November 1, 2017 | 28.67 | % | 17.64 | % | 0.50 | % | 0.50 | % | ||||||||||||||
Class II | November 1, 2017 | 28.35 | % | 17.33 | % | 0.75 | % | 0.75 | % | ||||||||||||||
S&P 500® Index^ | 28.71 | % | 18.02 | % | |||||||||||||||||||
The performance data quoted is historical. Past performance is no guarantee of future results. Current performance may be higher or lower than the performance data quoted. The principal value and investment return of an investment will fluctuate so that your shares, when redeemed, may be worth more or less than their original cost. Total returns would have been lower absent fee waivers by the Adviser. Performance figures for periods greater than one year are annualized. The returns shown do not reflect the deduction of taxes that a shareholder may pay on Portfolio distributions or on the redemption of Portfolio shares, as well as other charges and expenses of the insurance contract or separate account.
* Commencement of operations is November 6, 2017.
** The estimated operating expense ratios for Class I and Class II shares, as disclosed in the most recent prospectus dated May 1, 2021. Ratios include Acquired Fund Fees and Expenses indirectly incurred by the Portfolio. The operating expense ratios presented here may differ from the expense ratios disclosed in the Financial Highlights table in this report.
^ The S&P 500® Index (Total Return) is a widely accepted, unmanaged index of U.S. stock market performance which does not take into account charges, fees, and other expenses. Investors cannot invest directly in an index.
Comparison of the Change in Value of a $10,000 Investment

Holdings by Asset Class | % of Net Assets | ||||||
Common Stocks | 98.6 | % | |||||
Short-Term Investments | 1.4 | % | |||||
Other Assets less Liabilities - Net | 0.0 | %^ | |||||
100.0 | % | ||||||
Please refer to the Portfolio of Investments in this annual report for more information regarding the Portfolio's holdings as of December 31, 2021.
Derivative exposure is included in "Other Assets Les Liabilities - Net"
^ Represents less than 0.05%.
9
Global Atlantic BlackRock Disciplined Core Portfolio
Portfolio of Investments
December 31, 2021
| Shares/ Principal | Fair Value | ||||||||||
COMMON STOCKS - 98.6% | |||||||||||
AEROSPACE & DEFENSE - 0.9% | |||||||||||
Axon Enterprise, Inc.* | 1,339 | $ | 210,223 | ||||||||
Lockheed Martin Corp. | 12,564 | 4,465,371 | |||||||||
Northrop Grumman Corp. | 3,567 | 1,380,679 | |||||||||
6,056,273 | |||||||||||
AIR FREIGHT & LOGISTICS - 1.2% | |||||||||||
C.H. Robinson Worldwide, Inc. | 36,560 | 3,934,953 | |||||||||
Expeditors International of Washington, Inc. | 14,467 | 1,942,774 | |||||||||
United Parcel Service, Inc., Class B | 14,139 | 3,030,553 | |||||||||
8,908,280 | |||||||||||
AIRLINES - 0.1% | |||||||||||
Alaska Air Group, Inc.* | 13,398 | 698,036 | |||||||||
AUTO COMPONENTS - 0.6% | |||||||||||
BorgWarner, Inc. | 101,394 | 4,569,828 | |||||||||
AUTOMOBILES - 2.0% | |||||||||||
Rivian Automotive, Inc., Class A* | 9,921 | 1,028,708 | |||||||||
Tesla, Inc.* | 12,793 | 13,519,387 | |||||||||
14,548,095 | |||||||||||
BANKS - 3.5% | |||||||||||
Bank of America Corp. | 96,968 | 4,314,106 | |||||||||
Bank of Montreal | 8,121 | 874,794 | |||||||||
Bank of Nova Scotia (The) | 7,360 | 527,638 | |||||||||
Citigroup, Inc. | 67,646 | 4,085,142 | |||||||||
First Republic Bank | 29,791 | 6,152,140 | |||||||||
Huntington Bancshares, Inc. | 10,851 | 167,323 | |||||||||
JPMorgan Chase & Co. | 35,741 | 5,659,587 | |||||||||
Pinnacle Financial Partners, Inc. | 3,952 | 377,416 | |||||||||
PNC Financial Services Group, Inc. (The) | 5,440 | 1,090,829 | |||||||||
Regions Financial Corp. | 60,609 | 1,321,276 | |||||||||
Wells Fargo & Co. | 4,244 | 203,627 | |||||||||
Western Alliance Bancorp | 5,256 | 565,808 | |||||||||
25,339,686 | |||||||||||
BEVERAGES - 1.0% | |||||||||||
Coca-Cola Europacific Partners PLC | 4,589 | 256,663 | |||||||||
Diageo PLC, ADR | 10,635 | 2,341,189 | |||||||||
Keurig Dr Pepper, Inc. | 26,617 | 981,102 | |||||||||
Molson Coors Beverage Co., Class B | 32,988 | 1,528,994 | |||||||||
PepsiCo, Inc. | 10,890 | 1,891,702 | |||||||||
6,999,650 | |||||||||||
BIOTECHNOLOGY - 1.4% | |||||||||||
AbbVie, Inc. | 29,512 | 3,995,925 | |||||||||
Amgen, Inc. | 21,183 | 4,765,539 | |||||||||
Biogen, Inc.* | 1,197 | 287,184 | |||||||||
Moderna, Inc.* | 1,952 | 495,769 | |||||||||
Regeneron Pharmaceuticals, Inc.* | 1,086 | 685,831 | |||||||||
10,230,248 | |||||||||||
| Shares/ Principal | Fair Value | ||||||||||
BUILDING PRODUCTS - 0.8% | |||||||||||
Builders FirstSource, Inc.* | 6,560 | $ | 562,258 | ||||||||
Masco Corp. | 14,946 | �� | 1,049,508 | ||||||||
Owens Corning | 5,896 | 533,588 | |||||||||
Trane Technologies PLC | 18,494 | 3,736,343 | |||||||||
5,881,697 | |||||||||||
CAPITAL MARKETS - 1.9% | |||||||||||
FactSet Research Systems, Inc. | 2,906 | 1,412,345 | |||||||||
Goldman Sachs Group, Inc. (The) | 4,205 | 1,608,623 | |||||||||
Intercontinental Exchange, Inc. | 5,696 | 779,042 | |||||||||
Moody's Corp. | 1,878 | 733,509 | |||||||||
Morgan Stanley | 18,880 | 1,853,261 | |||||||||
S&P Global, Inc. | 12,264 | 5,787,749 | |||||||||
Stifel Financial Corp. | 22,904 | 1,612,900 | |||||||||
13,787,429 | |||||||||||
CHEMICALS - 1.0% | |||||||||||
Corteva, Inc. | 11,157 | 527,503 | |||||||||
Ecolab, Inc. | 16,197 | 3,799,654 | |||||||||
Mosaic Co. (The) | 11,668 | 458,436 | |||||||||
Sherwin-Williams Co. (The) | 6,564 | 2,311,578 | |||||||||
Valvoline, Inc. | 2,412 | 89,944 | |||||||||
7,187,115 | |||||||||||
COMMERCIAL SERVICES & SUPPLIES - 0.2% | |||||||||||
Republic Services, Inc. | 943 | 131,501 | |||||||||
Waste Connections, Inc. | 9,352 | 1,274,397 | |||||||||
1,405,898 | |||||||||||
COMMUNICATIONS EQUIPMENT - 0.2% | |||||||||||
Juniper Networks, Inc. | 45,441 | 1,622,698 | |||||||||
CONSTRUCTION MATERIALS - 0.5% | |||||||||||
Vulcan Materials Co. | 15,945 | 3,309,863 | |||||||||
CONSUMER FINANCE - 1.2% | |||||||||||
Ally Financial, Inc. | 84,804 | 4,037,518 | |||||||||
American Express Co. | 19,260 | 3,150,936 | |||||||||
Capital One Financial Corp. | 11,919 | 1,729,328 | |||||||||
8,917,782 | |||||||||||
CONTAINERS & PACKAGING - 0.3% | |||||||||||
Avery Dennison Corp. | 2,843 | 615,708 | |||||||||
Westrock Co. | 31,833 | 1,412,112 | |||||||||
2,027,820 | |||||||||||
DIVERSIFIED CONSUMER SERVICES - 0.4% | |||||||||||
H&R Block, Inc. | 71,078 | 1,674,597 | |||||||||
Service Corp. International | 20,520 | 1,456,715 | |||||||||
3,131,312 | |||||||||||
See accompanying notes to financial statements.
10
Global Atlantic BlackRock Disciplined Core Portfolio
Portfolio of Investments (Continued)
December 31, 2021
| Shares/ Principal | Fair Value | ||||||||||
DIVERSIFIED FINANCIAL SERVICES - 1.3% | |||||||||||
Apollo Global Management, Inc. | 8,995 | $ | 651,508 | ||||||||
Berkshire Hathaway, Inc., Class B* | 5,901 | 1,764,399 | |||||||||
Voya Financial, Inc. | 99,071 | 6,569,398 | |||||||||
8,985,305 | |||||||||||
DIVERSIFIED TELECOMMUNICATION - 0.4% | |||||||||||
BCE, Inc. | 33,004 | 1,717,528 | |||||||||
TELUS Corp. | 16,417 | 386,949 | |||||||||
Verizon Communications, Inc. | 18,517 | 962,143 | |||||||||
3,066,620 | |||||||||||
ELECTRIC UTILITIES - 1.0% | |||||||||||
NextEra Energy, Inc. | 26,729 | 2,495,419 | |||||||||
OGE Energy Corp. | 88,244 | 3,386,805 | |||||||||
Pinnacle West Capital Corp. | 3,276 | 231,253 | |||||||||
Southern Co. (The) | 19,057 | 1,306,929 | |||||||||
7,420,406 | |||||||||||
ELECTRICAL EQUIPMENT - 0.1% | |||||||||||
AMETEK, Inc. | 6,744 | 991,638 | |||||||||
ELECTRONIC EQUIPMENT, INSTRUMENTS & COMPONENTS - 0.3% | |||||||||||
Keysight Technologies, Inc.* | 8,612 | 1,778,464 | |||||||||
ENERGY EQUIPMENT & SERVICES - 0.9% | |||||||||||
Halliburton Co. | 29,393 | 672,218 | |||||||||
Schlumberger NV | 179,506 | 5,376,205 | |||||||||
6,048,423 | |||||||||||
ENTERTAINMENT - 0.8% | |||||||||||
Roku, Inc.* | 2,136 | 487,435 | |||||||||
Sea Ltd., ADR* | 377 | 84,339 | |||||||||
Walt Disney Co. (The)* | 31,589 | 4,892,820 | |||||||||
5,464,594 | |||||||||||
EQUITY REAL ESTATE INVESTMENT - 2.0% | |||||||||||
American Homes 4 Rent, Class A | 6,214 | 270,992 | |||||||||
CubeSmart | 39,679 | 2,258,132 | |||||||||
Extra Space Storage, Inc. | 2,230 | 505,608 | |||||||||
Life Storage, Inc. | 12,668 | 1,940,484 | |||||||||
Prologis, Inc. | 56,355 | 9,487,928 | |||||||||
14,463,144 | |||||||||||
FOOD & STAPLES RETAILING - 2.1% | |||||||||||
Costco Wholesale Corp. | 15,001 | 8,516,068 | |||||||||
Walmart, Inc. | 45,177 | 6,536,660 | |||||||||
15,052,728 | |||||||||||
FOOD PRODUCTS - 0.0%† | |||||||||||
McCormick & Co., Inc. | 393 | 37,968 | |||||||||
HEALTH CARE EQUIPMENT & SUPPLIES - 1.7% | |||||||||||
Abbott Laboratories | 18,683 | 2,629,445 | |||||||||
Align Technology, Inc.* | 1,016 | 667,695 | |||||||||
| Shares/ Principal | Fair Value | ||||||||||
HEALTH CARE EQUIPMENT & SUPPLIES - 1.7% (Continued) | |||||||||||
Boston Scientific Corp.* | 3,660 | $ | 155,477 | ||||||||
Dexcom, Inc.* | 1,120 | 601,384 | |||||||||
Hologic, Inc.* | 5,156 | 394,743 | |||||||||
IDEXX Laboratories, Inc.* | 11,172 | 7,356,315 | |||||||||
Medtronic PLC | 6,590 | 681,736 | |||||||||
12,486,795 | |||||||||||
HEALTH CARE PROVIDERS & SERVICES - 2.5% | |||||||||||
Anthem, Inc. | 11,297 | 5,236,611 | |||||||||
Cigna Corp. | 7,555 | 1,734,855 | |||||||||
CVS Health Corp. | 14,977 | 1,545,027 | |||||||||
McKesson Corp. | 17,073 | 4,243,836 | |||||||||
UnitedHealth Group, Inc. | 9,887 | 4,964,658 | |||||||||
17,724,987 | |||||||||||
HOTELS, RESTAURANTS & LEISURE - 1.4% | |||||||||||
Booking Holdings, Inc.* | 1,568 | 3,761,993 | |||||||||
Choice Hotels International, Inc. | 1 | 156 | |||||||||
McDonald's Corp. | 19,535 | 5,236,747 | |||||||||
Travel + Leisure Co. | 18,648 | 1,030,675 | |||||||||
10,029,571 | |||||||||||
HOUSEHOLD DURABLES - 0.9% | |||||||||||
DR Horton, Inc. | 28,215 | 3,059,917 | |||||||||
PulteGroup, Inc. | 1,539 | 87,969 | |||||||||
Whirlpool Corp. | 13,478 | 3,162,747 | |||||||||
6,310,633 | |||||||||||
HOUSEHOLD PRODUCTS - 2.0% | |||||||||||
Colgate-Palmolive Co. | 96,496 | 8,234,969 | |||||||||
Procter & Gamble Co. (The) | 36,986 | 6,050,170 | |||||||||
14,285,139 | |||||||||||
INDEPENDENT POWER AND RENEWABLE ELECTRICITY PRODUCERS - 0.0%† | |||||||||||
Sunnova Energy International, Inc.* | 2,907 | 81,163 | |||||||||
INDUSTRIAL CONGLOMERATES - 0.7% | |||||||||||
General Electric Co. | 4,057 | 383,265 | |||||||||
Honeywell International, Inc. | 17,597 | 3,669,150 | |||||||||
Roper Technologies, Inc. | 1,332 | 655,158 | |||||||||
4,707,573 | |||||||||||
INSURANCE - 3.4% | |||||||||||
Allstate Corp. (The) | 5,054 | 594,603 | |||||||||
Aon PLC, Class A | 1,175 | 353,158 | |||||||||
Brighthouse Financial, Inc.* | 2,778 | 143,900 | |||||||||
Manulife Financial Corp. | 4,118 | 78,530 | |||||||||
Marsh & McLennan Cos., Inc. | 52,528 | 9,130,417 | |||||||||
MetLife, Inc. | 128,134 | 8,007,094 | |||||||||
Reinsurance Group of America, Inc. | 2,008 | 219,856 | |||||||||
Travelers Cos., Inc. (The) | 25,668 | 4,015,245 | |||||||||
Willis Towers Watson PLC | 8,324 | 1,976,867 | |||||||||
24,519,670 | |||||||||||
See accompanying notes to financial statements.
11
Global Atlantic BlackRock Disciplined Core Portfolio
Portfolio of Investments (Continued)
December 31, 2021
| Shares/ Principal | Fair Value | ||||||||||
INTERACTIVE MEDIA & SERVICES - 6.6% | |||||||||||
Alphabet, Inc., Class A* | 7,699 | $ | 22,304,311 | ||||||||
Alphabet, Inc., Class C* | 4,898 | 14,172,804 | |||||||||
Meta Platforms, Inc., Class A* | 32,119 | 10,803,226 | |||||||||
Twitter, Inc.* | 5,152 | 222,669 | |||||||||
47,503,010 | |||||||||||
INTERNET & DIRECT MARKETING RETAIL - 3.9% | |||||||||||
Amazon.com, Inc.* | 8,308 | 27,701,697 | |||||||||
Qurate Retail, Inc., Series A | 14,260 | 108,376 | |||||||||
Vipshop Holdings Ltd., ADR* | 22,485 | 188,874 | |||||||||
27,998,947 | |||||||||||
IT SERVICES - 4.7% | |||||||||||
Accenture PLC, Class A | 6,707 | 2,780,387 | |||||||||
Automatic Data Processing, Inc. | 18,047 | 4,450,029 | |||||||||
EPAM Systems, Inc.* | 297 | 198,530 | |||||||||
Fidelity National Information Services, Inc. | 30,747 | 3,356,035 | |||||||||
Global Payments, Inc. | 1,296 | 175,193 | |||||||||
Mastercard, Inc., Class A | 14,731 | 5,293,143 | |||||||||
Okta, Inc.* | 530 | 118,810 | |||||||||
PayPal Holdings, Inc.* | 16,069 | 3,030,292 | |||||||||
Visa, Inc., Class A | 65,125 | 14,113,239 | |||||||||
33,515,658 | |||||||||||
LIFE SCIENCES TOOLS & SERVICES - 2.1% | |||||||||||
Agilent Technologies, Inc. | 31,113 | 4,967,190 | |||||||||
Bruker Corp. | 2,903 | 243,591 | |||||||||
Danaher Corp. | 19,815 | 6,519,333 | |||||||||
Illumina, Inc.* | 1,281 | 487,344 | |||||||||
Thermo Fisher Scientific, Inc. | 4,208 | 2,807,746 | |||||||||
15,025,204 | |||||||||||
MACHINERY - 2.4% | |||||||||||
Caterpillar, Inc. | 10,418 | 2,153,817 | |||||||||
Deere & Co. | 879 | 301,400 | |||||||||
Fortive Corp. | 14,893 | 1,136,187 | |||||||||
Illinois Tool Works, Inc. | 36,781 | 9,077,551 | |||||||||
Otis Worldwide Corp. | 55,349 | 4,819,238 | |||||||||
17,488,193 | |||||||||||
MEDIA - 1.1% | |||||||||||
Altice USA, Inc., Class A* | 8,672 | 140,313 | |||||||||
Comcast Corp., Class A | 83,190 | 4,186,953 | |||||||||
Discovery, Inc., Class C* | 6,329 | 144,934 | |||||||||
Fox Corp., Class A | 41,134 | 1,517,845 | |||||||||
Fox Corp., Class B | 2,791 | 95,647 | |||||||||
Nexstar Media Group, Inc., Class A | 470 | 70,961 | |||||||||
Sirius XM Holdings, Inc. | 289,214 | 1,836,509 | |||||||||
TEGNA, Inc. | 4,076 | 75,650 | |||||||||
8,068,812 | |||||||||||
| Shares/ Principal | Fair Value | ||||||||||
MULTILINE RETAIL - 1.3% | |||||||||||
Kohl's Corp. | 3,853 | $ | 190,300 | ||||||||
Nordstrom, Inc.* | 38,676 | 874,851 | |||||||||
Target Corp. | 34,468 | 7,977,274 | |||||||||
9,042,425 | |||||||||||
MULTI-UTILITIES - 1.7% | |||||||||||
CMS Energy Corp. | 12,474 | 811,434 | |||||||||
Consolidated Edison, Inc. | 56,123 | 4,788,414 | |||||||||
DTE Energy Co. | 38,733 | 4,630,143 | |||||||||
NiSource, Inc. | 73,602 | 2,032,151 | |||||||||
12,262,142 | |||||||||||
OIL, GAS & CONSUMABLE FUELS - 1.7% | |||||||||||
| BP PLC, ADR | 43,274 | 1,152,386 | |||||||||
Chevron Corp. | 1,060 | 124,391 | |||||||||
Devon Energy Corp. | 14,253 | 627,845 | |||||||||
EOG Resources, Inc. | 90,878 | 8,072,693 | |||||||||
Equinor ASA, ADR | 12,645 | 332,943 | |||||||||
Kinder Morgan, Inc. | 26,193 | 415,421 | |||||||||
Phillips 66 | 4,267 | 309,187 | |||||||||
Royal Dutch Shell PLC, Class A, ADR | 6,727 | 291,952 | |||||||||
Williams Cos., Inc. (The) | 44,163 | 1,150,004 | |||||||||
12,476,822 | |||||||||||
PERSONAL PRODUCTS - 0.6% | |||||||||||
Estee Lauder Cos, Inc. (The), Class A | 12,091 | 4,476,088 | |||||||||
PHARMACEUTICALS - 5.2% | |||||||||||
Bristol-Myers Squibb Co. | 41,963 | 2,616,393 | |||||||||
Eli Lilly & Co. | 16,638 | 4,595,748 | |||||||||
Johnson & Johnson | 90,879 | 15,546,671 | |||||||||
Merck & Co., Inc. | 40,554 | 3,108,059 | |||||||||
Pfizer, Inc. | 64,169 | 3,789,179 | |||||||||
Zoetis, Inc. | 29,777 | 7,266,481 | |||||||||
36,922,531 | |||||||||||
PROFESSIONAL SERVICES - 0.7% | |||||||||||
Equifax, Inc. | 13,126 | 3,843,161 | |||||||||
IHS Markit Ltd. | 6,843 | 909,572 | |||||||||
4,752,733 | |||||||||||
REAL ESTATE MANAGEMENT & DEVELOPMENT - 0.2% | |||||||||||
CBRE Group, Inc., Class A* | 13,187 | 1,430,921 | |||||||||
ROAD & RAIL - 1.1% | |||||||||||
Landstar System, Inc. | 17,124 | 3,065,539 | |||||||||
Old Dominion Freight Line, Inc. | 3,622 | 1,298,052 | |||||||||
Ryder System, Inc. | 32,708 | 2,696,120 | |||||||||
Schneider National, Inc., Class B | 27,535 | 740,967 | |||||||||
7,800,678 | |||||||||||
See accompanying notes to financial statements.
12
Global Atlantic BlackRock Disciplined Core Portfolio
Portfolio of Investments (Continued)
December 31, 2021
| Shares/ Principal | Fair Value | ||||||||||
SEMICONDUCTORS & SEMICONDUCTOR EQUIPMENT - 5.7% | |||||||||||
Advanced Micro Devices, Inc.* | 32,536 | $ | 4,681,930 | ||||||||
Analog Devices, Inc. | 6,003 | 1,055,147 | |||||||||
Applied Materials, Inc. | 21,202 | 3,336,347 | |||||||||
Cirrus Logic, Inc.* | 13,754 | 1,265,643 | |||||||||
CMC Materials, Inc. | 1 | 192 | |||||||||
Intel Corp. | 138,312 | 7,123,068 | |||||||||
KLA Corp. | 1,705 | 733,338 | |||||||||
Lam Research Corp. | 4,451 | 3,200,937 | |||||||||
NVIDIA Corp. | 42,325 | 12,448,206 | |||||||||
QUALCOMM, Inc. | 18,081 | 3,306,472 | |||||||||
Silicon Laboratories, Inc.* | 2,483 | 512,541 | |||||||||
Texas Instruments, Inc. | 11,575 | 2,181,540 | |||||||||
Xilinx, Inc. | 4,343 | 920,846 | |||||||||
40,766,207 | |||||||||||
SOFTWARE - 10.0% | |||||||||||
Adobe, Inc.* | 17,041 | 9,663,270 | |||||||||
Cadence Design Systems, Inc.* | 3,246 | 604,892 | |||||||||
HashiCorp, Inc., Class A* | 7,697 | 700,735 | |||||||||
Intuit, Inc. | 12,568 | 8,083,989 | |||||||||
Microsoft Corp. | 115,775 | 38,937,448 | |||||||||
salesforce.com, Inc.* | 12,466 | 3,167,985 | |||||||||
ServiceNow, Inc.* | 11,584 | 7,519,290 | |||||||||
Workday, Inc., Class A* | 11,924 | 3,257,398 | |||||||||
71,935,007 | |||||||||||
SPECIALTY RETAIL - 1.5% | |||||||||||
Advance Auto Parts, Inc. | 1,306 | 313,283 | |||||||||
American Eagle Outfitters, Inc. | 23,819 | 603,097 | |||||||||
Dick's Sporting Goods, Inc. | 1,904 | 218,941 | |||||||||
Foot Locker, Inc. | 7,948 | 346,771 | |||||||||
Home Depot, Inc. (The) | 10,869 | 4,510,744 | |||||||||
Lithia Motors, Inc. | 962 | 285,666 | |||||||||
Lowe's Cos., Inc. | 6,083 | 1,572,334 | |||||||||
Penske Automotive Group, Inc. | 8,379 | 898,397 | |||||||||
Tractor Supply Co. | 5,453 | 1,301,086 | |||||||||
Ulta Beauty, Inc.* | 1,607 | 662,630 | |||||||||
10,712,949 | |||||||||||
| Shares/ Principal | Fair Value | ||||||||||
TECHNOLOGY HARDWARE, STORAGE & PERIPHERALS - 8.9% | |||||||||||
Apple, Inc. | 277,317 | $ | 49,243,180 | ||||||||
Dell Technologies, Inc., Class C* | 118,626 | 6,663,222 | |||||||||
Hewlett Packard Enterprise Co. | 276,393 | 4,358,718 | |||||||||
NetApp, Inc. | 19,447 | 1,788,929 | |||||||||
Pure Storage, Inc., Class A* | 6,205 | 201,973 | |||||||||
Western Digital Corp.* | 19,796 | 1,290,897 | |||||||||
63,546,919 | |||||||||||
TEXTILES, APPAREL & LUXURY GOODS - 0.2% | |||||||||||
Levi Strauss & Co., Class A | 11,186 | 279,985 | |||||||||
Ralph Lauren Corp. | 6,966 | 827,979 | |||||||||
Under Armour, Inc., Class C* | 146 | 2,634 | |||||||||
1,110,598 | |||||||||||
TRADING COMPANIES & DISTRIBUTORS - 0.2% | |||||||||||
SiteOne Landscape Supply, Inc.* | 5,733 | 1,388,991 | |||||||||
WIRELESS TELECOMMUNICATION SERVICES - 0.1% | |||||||||||
United States Cellular Corp.* | 19,885 | 626,775 | |||||||||
Vodafone Group PLC, ADR | 5,484 | 81,876 | |||||||||
708,651 | |||||||||||
| TOTAL COMMON STOCKS (Cost - $498,316,341) | 707,010,017 | ||||||||||
SHORT-TERM INVESTMENTS - 1.4% | |||||||||||
MONEY MARKET FUNDS - 1.4% | |||||||||||
| Fidelity Investments Money Market Fund - Government Portfolio, Institutional Class, 0.01% (a) (Cost - $10,339,947) | 10,339,947 | 10,339,947 | |||||||||
| TOTAL INVESTMENTS - 100.0% (Cost - $508,656,288) | $ | 717,349,964 | |||||||||
| OTHER ASSETS LESS LIABILITIES - NET 0.0%† | 181,174 | ||||||||||
TOTAL NET ASSETS - 100.0% | $ | 717,531,138 | |||||||||
* Non-income producing security.
† Represents less than 0.05%.
(a) The rate shown is the annualized seven-day yield at period end.
ADR - American Depositary Receipt
PLC - Public Limited Company
FUTURES CONTRACTS | |||||||||||||||||||||||
LONG FUTURES CONTRACTS | Counterparty | Number of Contracts | Expiration Date | Notional Value | Fair Value/ Unrealized Appreciation (Depreciation) | ||||||||||||||||||
S&P 500 E-Mini Future | Goldman Sachs & Co. | 47 | 3/18/2022 | $ | 11,182,475 | $ | 127,608 | ||||||||||||||||
See accompanying notes to financial statements.
13
Global Atlantic BlackRock Disciplined Growth Portfolio
Portfolio Review
December 31, 2021 (Unaudited)
Investment Objective
The Portfolio seeks to provide long-term capital appreciation.
Management Review
The Portfolio is sub-advised by BlackRock Investment Management, LLC ("BlackRock").
How did the Portfolio perform during the period?
During 2021, the Class II shares of Global Atlantic BlackRock Disciplined Growth Portfolio underperformed its reference benchmark, the Russell 1000® Growth Index. The Portfolio posted a return of 27.29% compared to a benchmark return of 27.60%, a difference of -31 basis points. The following discussion of relative performance pertains to this benchmark.
What factors and allocation decisions influenced the Portfolio's performance?
BlackRock's Scientific Active Equity ("SAE") process systematically tracks and ranks the characteristics of companies in order to seek to construct a portfolio that has the best trade-off between returns, risk and costs. The SAE investment model groups the universe of securities based on an analysis of a wide range of factors, such as relative value ("Value"), earnings quality ("Quality"), market sentiment ("Sentiment"), and thematic insights. Value insights seek to incorporate, where appropriate, asset value, sales, earnings and cash flow forecasts over short and long periods. Quality measures aim to assess the sustainability of earnings and the quality of corporate management by investigating company financials as well as other company statements. Sentiment criteria seek to infer information about a company's value from changes in analysts' forecasts, linkages between companies, management decisions and the behavior of other market participants in equities and other securities markets. And lastly, thematic insights seek to identify and exploit commonalities among groups of stocks that are believed to drive prices but that currently appear to be less obvious to the market.
The Portfolio performed well amid the changeable market backdrop, with outperformance primarily driven by the Portfolio's Sentiment and fundamental measures. Within Sentiment insights, trend-based measures drove gains as these were able to correctly position the Portfolio around the volatile market backdrop that included several market style preference shifts and rising rates. Capturing Sentiment from market participants, such as identifying bond investor views as well as text analyses across executive commentaries was additive. Faster moving alternative data measures, such as insights designed to track search trends also benefitted performance. The real time nature of these types of measures were helpful in evaluating the quickly evolving marketplace.
Nontraditional measures of Quality, such as environmental, social, and governance ("ESG") related insights, were mixed in the period. Insights designed to capture investor flows into preferred ESG positions were top contributors, benefitting from the broader sustainability market trend. However, other risk mitigation related ESG insights that track company tax levels struggled. This measure penalizes companies that pay lower levels of taxes versus peers, typically growth-oriented technology companies, and favors those with higher relative tax levels. The signal struggled to keep up amid the preference shift to growth styles. Elsewhere, more traditional quality signals, such as a preference for lower-risk securities, performed well later in the year against rising market volatility.
A more dynamic macro thematic insight designed to evaluate macro views, the economic environment, and technical conditions proved wrong footed and was a top detractor in the period. This motivated an underweight to capital markets stocks, detracting from performance amid rate volatility.
How was the Portfolio positioned at period end?
From a sector positioning perspective, the Portfolio remained largely sector neutral at the end of the period. The Portfolio had slight overweight positions in information technology and financials companies and maintains slight underweights in communication services and consumer discretionary stocks. The SAE Team seeks to maintain a style neutral approach, so the Portfolio did not have any outsized active exposures to any particular style or factor.
14
Global Atlantic BlackRock Disciplined Growth Portfolio
Portfolio Review (Continued)
December 31, 2021 (Unaudited)
The Portfolio's performance figures for the periods ended December 31, 2021 as compared to its benchmark:
Annualized | Operating Expense** | ||||||||||||||||||||||
| Inception Date* | One Year | Since Inception | Gross Ratio | Net Ratio | |||||||||||||||||||
Global Atlantic BlackRock Disciplined Growth Portfolio | |||||||||||||||||||||||
Class I | August 20, 2021 | - | 9.12 | % | 0.63 | % | 0.57 | % | |||||||||||||||
Class II | November 1, 2017 | 27.29 | % | 22.01 | % | 0.88 | % | 0.82 | % | ||||||||||||||
Russell 1000® Growth Index^ | 27.60 | % | 24.20 | % | |||||||||||||||||||
The performance data quoted is historical. Past performance is no guarantee of future results. Current performance may be higher or lower than the performance data quoted. The principal value and investment return of an investment will fluctuate so that your shares, when redeemed, may be worth more or less than their original cost. Total returns would have been lower absent fee waivers by the Adviser. Performance figures for periods greater than one year are annualized. The returns shown do not reflect the deduction of taxes that a shareholder may pay on Portfolio distributions or on the redemption of Portfolio shares, as well as other charges and expenses of the insurance contract or separate account.
* Class II commencement of operations is November 6, 2017. Class I commenced operations on August 20, 2021 as a result of the reorganization. See Note 13 in the Notes to the Financial Statements.
** The estimated operating expense ratios for Class II shares, as disclosed in the most recent prospectus dated May 1, 2021. Ratios include Acquired Fund Fees and Expenses indirectly incurred by the Portfolio. The operating expense ratios presented here may differ from the expense ratios disclosed in the Financial Highlights table in this report.
^ The Russell 1000® Growth Index (Total Return) is an unmanaged index of common stock prices that measures the performance of those Russell 1000® Index companies with higher price-to-book ratios and higher forecasted growth values. It is not possible to invest directly in an index.
Comparison of the Change in Value of a $10,000 Investment*

* Since the inception date for Class I Shares is August 20, 2021, the performance comparison of the change in value of a $10,000 investment is not shown.
15
Global Atlantic BlackRock Disciplined Growth Portfolio
Portfolio Review (Continued)
December 31, 2021 (Unaudited)
Holdings by Asset Class | % of Net Assets | ||||||
Common Stocks | 99.2 | % | |||||
Short-Term Investments | 0.9 | % | |||||
Other Assets less Liabilities - Net | (0.1 | )% | |||||
100.0 | % | ||||||
Please refer to the Portfolio of Investments in this annual report for more information regarding the Portfolio's holdings as of December 31, 2021.
Derivative exposure is included in "Other Assets Less Liabilities - Net".
16
Global Atlantic BlackRock Disciplined Growth Portfolio
Portfolio of Investments
December 31, 2021
| Shares/ Principal | Fair Value | ||||||||||
COMMON STOCKS - 99.2% | |||||||||||
AEROSPACE & DEFENSE - 0.1% | |||||||||||
Axon Enterprise, Inc.* | 608 | $ | 95,456 | ||||||||
AIR FREIGHT & LOGISTICS - 1.4% | |||||||||||
C.H. Robinson Worldwide, Inc. | 4,006 | 431,166 | |||||||||
Expeditors International of Washington, Inc. | 2,335 | 313,567 | |||||||||
United Parcel Service, Inc., Class B | 4,827 | 1,034,619 | |||||||||
1,779,352 | |||||||||||
AUTO COMPONENTS - 0.2% | |||||||||||
BorgWarner, Inc. | 5,518 | 248,696 | |||||||||
AUTOMOBILES - 3.6% | |||||||||||
Rivian Automotive, Inc., Class A* | 2,207 | 228,844 | |||||||||
Tesla, Inc.* | 4,041 | 4,270,448 | |||||||||
4,499,292 | |||||||||||
BEVERAGES - 0.8% | |||||||||||
Brown-Forman Corp., Class B | 3,494 | 254,573 | |||||||||
Coca-Cola Co. (The) | 333 | 19,717 | |||||||||
Coca-Cola Europacific Partners PLC | 6,771 | 378,702 | |||||||||
Keurig Dr Pepper, Inc. | 6,449 | 237,710 | |||||||||
PepsiCo, Inc. | 738 | 128,198 | |||||||||
1,018,900 | |||||||||||
BIOTECHNOLOGY - 1.2% | |||||||||||
AbbVie, Inc. | 6,318 | 855,457 | |||||||||
Amgen, Inc. | 1,720 | 386,948 | |||||||||
Moderna, Inc.* | 910 | 231,122 | |||||||||
1,473,527 | |||||||||||
BUILDING PRODUCTS - 0.5% | |||||||||||
Builders FirstSource, Inc.* | 252 | 21,599 | |||||||||
Masco Corp. | 1,286 | 90,303 | |||||||||
Trane Technologies PLC | 2,403 | 485,478 | |||||||||
597,380 | |||||||||||
CAPITAL MARKETS - 1.7% | |||||||||||
FactSet Research Systems, Inc. | 340 | 165,243 | |||||||||
Moody's Corp. | 146 | 57,025 | |||||||||
MSCI, Inc. | 65 | 39,825 | |||||||||
S&P Global, Inc. | 3,671 | 1,732,455 | |||||||||
Stifel Financial Corp. | 1,543 | 108,658 | |||||||||
2,103,206 | |||||||||||
CHEMICALS - 0.5% | |||||||||||
Ecolab, Inc. | 2,693 | 631,751 | |||||||||
COMMERCIAL SERVICES & SUPPLIES - 0.1% | |||||||||||
Waste Connections, Inc. | 1,067 | 145,400 | |||||||||
COMMUNICATIONS EQUIPMENT - 0.0%† | |||||||||||
Juniper Networks, Inc. | 1,027 | 36,674 | |||||||||
| Shares/ Principal | Fair Value | ||||||||||
CONSTRUCTION MATERIALS - 0.0%† | |||||||||||
Vulcan Materials Co. | 72 | $ | 14,946 | ||||||||
CONSUMER FINANCE - 0.4% | |||||||||||
American Express Co. | 2,871 | 469,696 | |||||||||
DIVERSIFIED CONSUMER SERVICES - 0.5% | |||||||||||
H&R Block, Inc. | 14,429 | 339,947 | |||||||||
Service Corp. International | 3,527 | 250,382 | |||||||||
590,329 | |||||||||||
DIVERSIFIED FINANCIAL SERVICES - 0.5% | |||||||||||
Apollo Global Management, Inc. | 1,164 | 84,308 | |||||||||
Voya Financial, Inc. | 8,541 | 566,354 | |||||||||
650,662 | |||||||||||
ELECTRONIC EQUIPMENT, INSTRUMENTS & COMPONENTS - 0.8% | |||||||||||
Keysight Technologies, Inc.* | 2,813 | 580,913 | |||||||||
National Instruments Corp. | 553 | 24,150 | |||||||||
Zebra Technologies Corp., Class A* | 587 | 349,382 | |||||||||
954,445 | |||||||||||
ENERGY EQUIPMENT & SERVICES - 0.1% | |||||||||||
Schlumberger NV | 5,868 | 175,747 | |||||||||
ENTERTAINMENT - 1.0% | |||||||||||
Roku, Inc.* | 1,656 | 377,899 | |||||||||
Spotify Technology SA* | 1,672 | 391,298 | |||||||||
Walt Disney Co. (The)* | 2,751 | 426,102 | |||||||||
Zynga, Inc., Class A* | 15,209 | 97,338 | |||||||||
1,292,637 | |||||||||||
EQUITY REAL ESTATE INVESTMENT - 1.6% | |||||||||||
American Homes 4 Rent, Class A | 6,413 | 279,671 | |||||||||
CubeSmart | 10,192 | 580,027 | |||||||||
Equinix, Inc. | 76 | 64,284 | |||||||||
Extra Space Storage, Inc. | 624 | 141,479 | |||||||||
Invitation Homes, Inc. | 1,454 | 65,924 | |||||||||
Life Storage, Inc. | 481 | 73,680 | |||||||||
Prologis, Inc. | 4,329 | 728,830 | |||||||||
1,933,895 | |||||||||||
FOOD & STAPLES RETAILING - 1.3% | |||||||||||
Costco Wholesale Corp. | 2,882 | 1,636,111 | |||||||||
HEALTH CARE EQUIPMENT & SUPPLIES - 2.3% | |||||||||||
Abbott Laboratories | 433 | 60,940 | |||||||||
Align Technology, Inc.* | 596 | 391,679 | |||||||||
Dexcom, Inc.* | 646 | 346,870 | |||||||||
Edwards Lifesciences Corp.* | 3,167 | 410,285 | |||||||||
IDEXX Laboratories, Inc.* | 2,447 | 1,611,252 | |||||||||
Insulet Corp.* | 315 | 83,812 | |||||||||
2,904,838 | |||||||||||
See accompanying notes to financial statements.
17
Global Atlantic BlackRock Disciplined Growth Portfolio
Portfolio of Investments (Continued)
December 31, 2021
| Shares/ Principal | Fair Value | ||||||||||
HEALTH CARE PROVIDERS & SERVICES - 0.5% | |||||||||||
McKesson Corp. | 2,649 | $ | 658,462 | ||||||||
HEALTH CARE TECHNOLOGY - 0.0%† | |||||||||||
Teladoc Health, Inc.* | 527 | 48,389 | |||||||||
HOTELS, RESTAURANTS & LEISURE - 1.6% | |||||||||||
Booking Holdings, Inc.* | 239 | 573,416 | |||||||||
Darden Restaurants, Inc. | 261 | 39,317 | |||||||||
Domino's Pizza, Inc. | 126 | 71,106 | |||||||||
McDonald's Corp. | 2,893 | 775,526 | |||||||||
Starbucks Corp. | 308 | 36,027 | |||||||||
Travel + Leisure Co. | 7,965 | 440,225 | |||||||||
1,935,617 | |||||||||||
HOUSEHOLD DURABLES - 0.6% | |||||||||||
DR Horton, Inc. | 2,866 | 310,818 | |||||||||
Whirlpool Corp. | 2,072 | 486,215 | |||||||||
797,033 | |||||||||||
HOUSEHOLD PRODUCTS - 0.7% | |||||||||||
Colgate-Palmolive Co. | 10,250 | 874,735 | |||||||||
INDEPENDENT POWER AND RENEWABLE ELECTRICITY PRODUCERS - 0.1% | |||||||||||
Sunnova Energy International, Inc.* | 2,621 | 73,178 | |||||||||
INDUSTRIAL CONGLOMERATES - 0.1% | |||||||||||
Honeywell International, Inc. | 184 | 38,366 | |||||||||
Roper Technologies, Inc. | 53 | 26,069 | |||||||||
64,435 | |||||||||||
INSURANCE - 0.5% | |||||||||||
Aon PLC, Class A | 137 | 41,177 | |||||||||
Marsh & McLennan Cos., Inc. | 1,949 | 338,775 | |||||||||
MetLife, Inc. | 4,374 | 273,331 | |||||||||
Willis Towers Watson PLC | 67 | 15,912 | |||||||||
669,195 | |||||||||||
INTERACTIVE MEDIA & SERVICES - 8.5% | |||||||||||
Alphabet, Inc., Class A* | 855 | 2,476,969 | |||||||||
Alphabet, Inc., Class C* | 1,265 | 3,660,391 | |||||||||
Meta Platforms, Inc., Class A* | 11,971 | 4,026,446 | |||||||||
Pinterest, Inc., Class A* | 285 | 10,360 | |||||||||
Snap, Inc., Class A* | 1,365 | 64,196 | |||||||||
Twitter, Inc.* | 4,852 | 209,704 | |||||||||
ZoomInfo Technologies, Inc.* | 2,435 | 156,327 | |||||||||
10,604,393 | |||||||||||
INTERNET & DIRECT MARKETING RETAIL - 5.9% | |||||||||||
Amazon.com, Inc.* | 2,156 | 7,188,837 | |||||||||
DoorDash, Inc., Class A* | 258 | 38,416 | |||||||||
Etsy, Inc.* | 755 | 165,300 | |||||||||
Overstock.com, Inc.* | 224 | 13,218 | |||||||||
7,405,771 | |||||||||||
| Shares/ Principal | Fair Value | ||||||||||
IT SERVICES - 8.0% | |||||||||||
Accenture PLC, Class A | 838 | $ | 347,393 | ||||||||
Automatic Data Processing, Inc. | 3,692 | 910,373 | |||||||||
Block, Inc.* | 482 | 77,848 | |||||||||
Broadridge Financial Solutions, Inc. | 1,101 | 201,285 | |||||||||
Cloudflare, Inc., Class A* | 1,461 | 192,121 | |||||||||
EPAM Systems, Inc.* | 1,095 | 731,953 | |||||||||
Fidelity National Information Services, Inc. | 3,853 | 420,555 | |||||||||
Gartner, Inc.* | 924 | 308,912 | |||||||||
Global Payments, Inc. | 340 | 45,961 | |||||||||
Marqeta, Inc., Class A* | 710 | 12,191 | |||||||||
Mastercard, Inc., Class A | 3,875 | 1,392,365 | |||||||||
MongoDB, Inc.* | 256 | 135,514 | |||||||||
Okta, Inc.* | 1,756 | 393,643 | |||||||||
PayPal Holdings, Inc.* | 6,749 | 1,272,726 | |||||||||
Snowflake, Inc., Class A* | 710 | 240,512 | |||||||||
Visa, Inc., Class A | 15,223 | 3,298,976 | |||||||||
9,982,328 | |||||||||||
LEISURE PRODUCTS - 0.0%† | |||||||||||
Peloton Interactive, Inc., Class A* | 1,346 | 48,133 | |||||||||
LIFE SCIENCES TOOLS & SERVICES - 2.7% | |||||||||||
Agilent Technologies, Inc. | 8,886 | 1,418,650 | |||||||||
Bruker Corp. | 1,715 | 143,906 | |||||||||
Danaher Corp. | 1,353 | 445,150 | |||||||||
Illumina, Inc.* | 459 | 174,622 | |||||||||
Mettler-Toledo International, Inc.* | 649 | 1,101,489 | |||||||||
West Pharmaceutical Services, Inc. | 187 | 87,705 | |||||||||
3,371,522 | |||||||||||
MACHINERY - 1.7% | |||||||||||
Caterpillar, Inc. | 1,692 | 349,804 | |||||||||
Fortive Corp. | 582 | 44,401 | |||||||||
Illinois Tool Works, Inc. | 5,472 | 1,350,490 | |||||||||
Otis Worldwide Corp. | 3,719 | 323,813 | |||||||||
2,068,508 | |||||||||||
MEDIA - 1.0% | |||||||||||
Altice USA, Inc., Class A* | 9,518 | 154,001 | |||||||||
Charter Communications, Inc., Class A* | 447 | 291,430 | |||||||||
Comcast Corp., Class A | 8,090 | 407,170 | |||||||||
Fox Corp., Class A | 5,956 | 219,776 | |||||||||
Interpublic Group of Cos., Inc. (The) | 997 | 37,338 | |||||||||
Nexstar Media Group, Inc., Class A | 851 | 128,484 | |||||||||
Sirius XM Holdings, Inc. | 3,159 | 20,060 | |||||||||
1,258,259 | |||||||||||
MULTILINE RETAIL - 1.2% | |||||||||||
Nordstrom, Inc.* | 10,615 | 240,111 | |||||||||
Target Corp. | 5,495 | 1,271,763 | |||||||||
1,511,874 | |||||||||||
See accompanying notes to financial statements.
18
Global Atlantic BlackRock Disciplined Growth Portfolio
Portfolio of Investments (Continued)
December 31, 2021
| Shares/ Principal | Fair Value | ||||||||||
MULTI-UTILITIES - 0.2% | |||||||||||
DTE Energy Co. | 2,461 | $ | 294,188 | ||||||||
OIL, GAS & CONSUMABLE FUELS - 0.2% | |||||||||||
EOG Resources, Inc. | 3,094 | 274,840 | |||||||||
PERSONAL PRODUCTS - 1.0% | |||||||||||
Estee Lauder Cos, Inc. (The), Class A | 3,416 | 1,264,603 | |||||||||
PHARMACEUTICALS - 2.2% | |||||||||||
Eli Lilly and Co. | 3,553 | 981,410 | |||||||||
Johnson & Johnson | 1,345 | 230,089 | |||||||||
Zoetis, Inc. | 6,537 | 1,595,224 | |||||||||
2,806,723 | |||||||||||
PROFESSIONAL SERVICES - 0.7% | |||||||||||
Equifax, Inc. | 2,353 | 688,935 | |||||||||
Robert Half International, Inc. | 1,328 | 148,099 | |||||||||
TransUnion | 266 | 31,542 | |||||||||
868,576 | |||||||||||
REAL ESTATE MANAGEMENT & DEVELOPMENT - 0.0%† | |||||||||||
Zillow Group, Inc., Class A* | 200 | 12,444 | |||||||||
ROAD & RAIL - 1.3% | |||||||||||
Landstar System, Inc. | 3,402 | 609,026 | |||||||||
Lyft, Inc., Class A* | 1,496 | 63,924 | |||||||||
Old Dominion Freight Line, Inc. | 2,596 | 930,354 | |||||||||
Ryder System, Inc. | 660 | 54,404 | |||||||||
1,657,708 | |||||||||||
SEMICONDUCTORS & SEMICONDUCTOR EQUIPMENT - 8.0% | |||||||||||
Advanced Micro Devices, Inc.* | 10,435 | 1,501,597 | |||||||||
Analog Devices, Inc. | 421 | 73,999 | |||||||||
Applied Materials, Inc. | 7,592 | 1,194,677 | |||||||||
Cirrus Logic, Inc.* | 1,667 | 153,397 | |||||||||
Intel Corp. | 10,906 | 561,659 | |||||||||
KLA Corp. | 1,683 | 723,875 | |||||||||
Lam Research Corp. | 699 | 502,686 | |||||||||
NVIDIA Corp. | 13,212 | 3,885,781 | |||||||||
QUALCOMM, Inc. | 5,560 | 1,016,757 | |||||||||
Silicon Laboratories, Inc.* | 149 | 30,757 | |||||||||
Texas Instruments, Inc. | 1,435 | 270,455 | |||||||||
Xilinx, Inc. | 468 | 99,230 | |||||||||
10,014,870 | |||||||||||
SOFTWARE - 18.1% | |||||||||||
Adobe, Inc.* | 3,899 | 2,210,967 | |||||||||
Atlassian Corp. PLC, Class A* | 915 | 348,880 | |||||||||
Autodesk, Inc.* | 444 | 124,848 | |||||||||
Bill.com Holdings, Inc.* | 162 | 40,362 | |||||||||
Cadence Design Systems, Inc.* | 4,198 | 782,297 | |||||||||
Crowdstrike Holdings, Inc., Class A* | 1,539 | 315,110 | |||||||||
| Shares/ Principal | Fair Value | ||||||||||
SOFTWARE - 18.1% (Continued) | |||||||||||
Datadog, Inc., Class A* | 502 | $ | 89,411 | ||||||||
Dynatrace, Inc.* | 350 | 21,123 | |||||||||
Fortinet, Inc.* | 858 | 308,365 | |||||||||
HashiCorp, Inc., Class A* | 1,697 | 154,495 | |||||||||
HubSpot, Inc.* | 631 | 415,924 | |||||||||
Intuit, Inc. | 3,346 | 2,152,214 | |||||||||
Manhattan Associates, Inc.* | 1,600 | 248,784 | |||||||||
Microsoft Corp. | 33,759 | 11,353,827 | |||||||||
Nutanix, Inc., Class A* | 483 | 15,388 | |||||||||
Palantir Technologies, Inc., Class A* | 2,169 | 39,498 | |||||||||
Paycom Software, Inc.* | 437 | 181,438 | |||||||||
Paylocity Holding Corp.* | 22 | 5,196 | |||||||||
Rapid7, Inc.* | 1,015 | 119,455 | |||||||||
RingCentral, Inc., Class A* | 67 | 12,552 | |||||||||
salesforce.com, Inc.* | 1,501 | 381,449 | |||||||||
ServiceNow, Inc.* | 2,550 | 1,655,231 | |||||||||
Synopsys, Inc.* | 297 | 109,445 | |||||||||
VMware, Inc., Class A | 1,134 | 131,408 | |||||||||
Workday, Inc., Class A* | 5,415 | 1,479,270 | |||||||||
Zoom Video Communications, Inc., Class A* | 205 | 37,702 | |||||||||
22,734,639 | |||||||||||
SPECIALTY RETAIL - 3.1% | |||||||||||
American Eagle Outfitters, Inc. | 790 | 20,003 | |||||||||
Dick's Sporting Goods, Inc. | 737 | 84,748 | |||||||||
Foot Locker, Inc. | 2,067 | 90,183 | |||||||||
Home Depot, Inc. (The) | 5,074 | 2,105,761 | |||||||||
Lithia Motors, Inc. | 106 | 31,477 | |||||||||
Lowe's Cos., Inc. | 3,824 | 988,427 | |||||||||
Penske Automotive Group, Inc. | 283 | 30,343 | |||||||||
Ulta Beauty, Inc.* | 1,068 | 440,379 | |||||||||
Victoria's Secret & Co.* | 790 | 43,877 | |||||||||
Williams-Sonoma, Inc. | 81 | 13,699 | |||||||||
3,848,897 | |||||||||||
TECHNOLOGY HARDWARE, STORAGE & PERIPHERALS - 11.7% | |||||||||||
Apple, Inc. | 69,785 | 12,391,722 | |||||||||
Dell Technologies, Inc., Class C* | 25,148 | 1,412,563 | |||||||||
Hewlett Packard Enterprise Co. | 1,224 | 19,303 | |||||||||
HP, Inc. | 1,894 | 71,347 | |||||||||
NetApp, Inc. | 4,713 | 433,549 | |||||||||
Pure Storage, Inc., Class A* | 7,282 | 237,029 | |||||||||
Western Digital Corp.* | 1,295 | 84,447 | |||||||||
14,649,960 | |||||||||||
TEXTILES, APPAREL & LUXURY GOODS - 0.6% | |||||||||||
Lululemon Athletica, Inc.* | 441 | 172,630 | |||||||||
NIKE, Inc., Class B | 1,523 | 253,838 | |||||||||
Ralph Lauren Corp. | 2,676 | 318,069 | |||||||||
744,537 | |||||||||||
See accompanying notes to financial statements.
19
Global Atlantic BlackRock Disciplined Growth Portfolio
Portfolio of Investments (Continued)
December 31, 2021
| Shares/ Principal | Fair Value | ||||||||||
TRADING COMPANIES & DISTRIBUTORS - 0.4% | |||||||||||
SiteOne Landscape Supply, Inc.* | 2,036 | $ | 493,282 | ||||||||
| TOTAL COMMON STOCKS (Cost - $81,693,302) | 124,290,039 | ||||||||||
SHORT-TERM INVESTMENTS - 0.9% | |||||||||||
MONEY MARKET FUNDS - 0.9% | |||||||||||
| Fidelity Investments Money Market Fund - Government Portfolio, Institutional Class, 0.01% (a) (Cost - $1,135,976) | 1,135,976 | 1,135,976 | |||||||||
| TOTAL INVESTMENTS - 100.1% (Cost - $82,829,278) | $ | 125,426,015 | |||||||||
| OTHER ASSETS LESS LIABILITIES - NET (0.1)% | (76,593) | ||||||||||
TOTAL NET ASSETS - 100.0% | $ | 125,349,422 | |||||||||
* Non-income producing security.
† Represents less than 0.05%.
(a) The rate shown is the annualized seven-day yield at period end.
PLC - Public Limited Company
FUTURES CONTRACTS | |||||||||||||||||||||||
LONG FUTURES CONTRACTS | Counterparty | Number of Contracts | Expiration Date | Notional Value | Fair Value/ Unrealized Appreciation (Depreciation) | ||||||||||||||||||
NASDAQ 100 E-Mini Future | Goldman Sachs & Co. | 3 | 3/18/2022 | $ | 979,245 | $ | 12,424 | ||||||||||||||||
See accompanying notes to financial statements.
20
Global Atlantic BlackRock Disciplined International Core Portfolio
Portfolio Review
December 31, 2021 (Unaudited)
Investment Objective
The Portfolio seeks to provide long-term capital appreciation.
Management Review
The Portfolio is sub-advised by BlackRock Investment Management, LLC ("BlackRock").
How did the Portfolio perform during the period?
During 2021, the Class I shares of Global Atlantic BlackRock Disciplined International Core Portfolio outperformed its reference benchmark, the MSCI ACWI ex USA Index. The Portfolio posted a return of 8.67% compared to a benchmark return of 7.82%, a difference of 85 basis points. The following discussion of relative performance pertains to this benchmark.
What factors and allocation decisions influenced the Portfolio's performance?
BlackRock's Scientific Active Equity ("SAE") process systematically tracks and ranks the characteristics of companies in order to seek to construct a portfolio that has the best trade-off between returns, risk and costs. The SAE investment model groups the universe of securities based on an analysis of a wide range of factors, such as relative value ("Value"), earnings quality ("Quality"), market sentiment ("Sentiment"), and thematic insights. Value insights seek to incorporate, where appropriate, asset value, sales, earnings and cash flow forecasts over short and long periods. Quality measures aim to assess the sustainability of earnings and the quality of corporate management by investigating company financials as well as other company statements. Sentiment criteria seek to infer information about a company's value from changes in analysts' forecasts, linkages between companies, management decisions and the behavior of other market participants in equities and other securities markets. And lastly, thematic insights seek to identify and exploit commonalities among groups of stocks that are believed to drive prices but that currently appear to be less obvious to the market.
Benefiting from the continued equity rally in the first half of 2021, and quickly recovering from a challenging third quarter during the fourth quarter, the Portfolio posted positive excess returns and outperformed its benchmark in 2021. Portfolio outperformance was primarily driven by the Portfolio's fundamental and Sentiment measures, with some contribution from Macro thematic insights as well.
Within fundamental insights, traditional Value and Quality measures such as insights tracking companies with cheaper multiples and cashflow efficiency contributed to performance. Fundamental environmental, social and governance ("ESG") related measures were mixed overall, with signals favoring firms that track tax levels and high green patent issuance relative to assets amongst the top contributors, particularly in the first quarter. Sentiment based insights, particularly those that measure the news' effects on stock prices changes, mobile app usage, and balance sheet trends all performed strongly throughout the year. Other insights that contributed to performance included broker Sentiment, as well as faster moving alternative data measures, such as those that track search trends. Within macro thematic insights, an overweight to information technology, consumer staples and industrials also help the Portfolio's performance in 2021.
Although there was broad-based positive performance across all signal buckets, select measures struggled during the year. Several ESG fundamental insights struggled as the increase in volatility correlated negatively with ESG signals (i.e. flow buying) in a theme that played out during the year. Within thematic signals, the Portfolio's exposure to companies most exposed to economic stagnation detracted from performance.
How was the Portfolio positioned at period end?
From a sector positioning perspective, the Portfolio remained largely sector neutral at the end of the period. There was a limited overweight exposure to information technology and industrials, and the Portfolio was moderately underweight health care and utilities. The Portfolio also targeted a generally country neutral approach. As of year-end, the portfolio was underweight Saudi Arabia, Russia, and Switzerland, and had small overweight positions in French and Canadian equities.
21
Global Atlantic BlackRock Disciplined International Core Portfolio
Portfolio Review (Continued)
December 31, 2021 (Unaudited)
The Portfolio's performance figures for the periods ended December 31, 2021 as compared to its benchmark:
Annualized | Operating Expense** | ||||||||||||||||||||||
| Inception Date* | One Year | Since Inception | Gross Ratio | Net Ratio | |||||||||||||||||||
Global Atlantic BlackRock Disciplined International Core Portfolio | |||||||||||||||||||||||
Class I | November 1, 2017 | 8.67 | % | 5.64 | % | 0.88 | % | 0.78 | % | ||||||||||||||
Class II | November 1, 2017 | 8.47 | % | 5.38 | % | 1.13 | % | 1.03 | % | ||||||||||||||
MSCI ACWI ex-USA Index^ | 7.82 | % | 6.03 | % | |||||||||||||||||||
The performance data quoted is historical. Past performance is no guarantee of future results. Current performance may be higher or lower than the performance data quoted. The principal value and investment return of an investment will fluctuate so that your shares, when redeemed, may be worth more or less than their original cost. Total returns would have been lower absent fee waivers by the Adviser. Performance figures for periods greater than one year are annualized. The returns shown do not reflect the deduction of taxes that a shareholder may pay on Portfolio distributions or on the redemption of Portfolio shares, as well as other charges and expenses of the insurance contract or separate account.
* Commencement of operations is November 6, 2017.
** The estimated operating expense ratios for Class I and Class II shares, as disclosed in the most recent prospectus dated May 1, 2021. Ratios include Acquired Fund Fees and Expenses indirectly incurred by the Portfolio. The operating expense ratios presented here may differ from the expense ratios disclosed in the Financial Highlights table in this report.
^ The MSCI ACWI ex-USA Index is a free float-adjusted market capitalization index designed to measure the combined equity market performance of developed and emerging market countries, excluding the United States. It is not possible to invest directly in an index.
Comparison of the Change in Value of a $10,000 Investment

22
Global Atlantic BlackRock Disciplined International Core Portfolio
Portfolio Review (Continued)
December 31, 2021 (Unaudited)
Holdings by Asset Class | % of Net Assets | ||||||
Common Stocks | 88.9 | % | |||||
Exchange Traded Funds | 7.9 | % | |||||
Short-Term Investments | 1.7 | % | |||||
Preferred Stocks | 0.8 | % | |||||
Rights | 0.0 | %^ | |||||
Other Assets less Liabilities - Net | 0.7 | % | |||||
100.0 | % | ||||||
Please refer to the Portfolio of Investments in this annual report for more information regarding the Portfolio's holdings as of December 31, 2021.
Derivative exposure is included in "Other Assets Less Liabilities - Net".
^ Represents less than 0.05%.
23
Global Atlantic BlackRock Disciplined International Core Portfolio
Portfolio of Investments
December 31, 2021
| Shares/ Principal | Fair Value | ||||||||||
COMMON STOCKS - 88.9% | |||||||||||
AEROSPACE & DEFENSE - 0.4% | |||||||||||
Airbus SE* | 721 | $ | 92,126 | ||||||||
BAE Systems PLC | 5,478 | 40,793 | |||||||||
Embraer SA* | 9,191 | 40,955 | |||||||||
MTU Aero Engines AG | 668 | 136,281 | |||||||||
Rolls-Royce Holdings PLC* | 39,816 | 66,268 | |||||||||
Saab AB, Class B | 8,321 | 211,659 | |||||||||
Safran SA | 533 | 65,256 | |||||||||
653,338 | |||||||||||
AIR FREIGHT & LOGISTICS - 1.0% | |||||||||||
Deutsche Post AG | 19,517 | 1,254,890 | |||||||||
DSV A/S | 651 | 152,044 | |||||||||
JD Logistics, Inc.*,(a) | 4,000 | 13,571 | |||||||||
Mainfreight Ltd. | 267 | 17,165 | |||||||||
PostNL NV | 27,163 | 118,215 | |||||||||
Royal Mail PLC | 8,974 | 61,503 | |||||||||
SG Holdings Co. Ltd. | 1,000 | 23,386 | |||||||||
ZTO Express Cayman, Inc., ADR | 4,120 | 116,266 | |||||||||
1,757,040 | |||||||||||
AIRLINES - 0.1% | |||||||||||
Air China Ltd., Class H* | 20,000 | 13,955 | |||||||||
AirAsia Group Bhd* | 89,900 | 17,048 | |||||||||
China Eastern Airlines Corp. Ltd., Class A* | 18,600 | 15,059 | |||||||||
China Eastern Airlines Corp. Ltd., Class H* | 128,000 | 48,433 | |||||||||
| International Consolidated Airlines Group SA* | 36,066 | 69,601 | |||||||||
Jin Air Co. Ltd.* | 1,154 | 16,212 | |||||||||
Korean Air Lines Co. Ltd.* | 2,447 | 60,416 | |||||||||
240,724 | |||||||||||
AUTO COMPONENTS - 0.7% | |||||||||||
Bridgestone Corp. | 12,300 | 528,615 | |||||||||
Hyundai Mobis Co. Ltd. | 743 | 159,069 | |||||||||
JTEKT Corp. | 600 | 5,236 | |||||||||
Koito Manufacturing Co. Ltd. | 1,000 | 52,885 | |||||||||
Mando Corp.* | 497 | 26,507 | |||||||||
NGK Spark Plug Co. Ltd. | 3,800 | 66,097 | |||||||||
NOK Corp. | 1,500 | 16,309 | |||||||||
Pirelli & C SpA (a) | 26,219 | 182,118 | |||||||||
Tokai Rika Co. Ltd. | 7,300 | 98,132 | |||||||||
Toyoda Gosei Co. Ltd. | 700 | 15,209 | |||||||||
Valeo | 1,969 | 59,517 | |||||||||
1,209,694 | |||||||||||
AUTOMOBILES - 1.9% | |||||||||||
BAIC Motor Corp. Ltd., Class H (a) | 40,500 | 17,403 | |||||||||
Bayerische Motoren Werke AG | 5,486 | 552,061 | |||||||||
BYD Co. Ltd., Class A | 6,200 | 260,827 | |||||||||
BYD Co. Ltd., Class H | 6,500 | 222,272 | |||||||||
Daimler AG | 1,259 | 96,771 | |||||||||
| Shares/ Principal | Fair Value | ||||||||||
AUTOMOBILES - 1.9% (Continued) | |||||||||||
Geely Automobile Holdings Ltd. | 20,000 | $ | 54,641 | ||||||||
Great Wall Motor Co. Ltd., Class H | 17,000 | 58,438 | |||||||||
Honda Motor Co. Ltd. | 13,800 | 387,078 | |||||||||
Hyundai Motor Co. | 228 | 40,086 | |||||||||
Isuzu Motors Ltd. | 6,600 | 82,016 | |||||||||
Kia Corp.* | 907 | 62,718 | |||||||||
Li Auto, Inc., ADR* | 3,564 | 114,404 | |||||||||
Mazda Motor Corp.* | 2,600 | 19,982 | |||||||||
Mitsubishi Motors Corp.* | 8,300 | 23,137 | |||||||||
NIO, Inc., ADR* | 8,225 | 260,568 | |||||||||
Nissan Motor Co. Ltd.* | 8,200 | 39,578 | |||||||||
Renault SA* | 2,222 | 77,183 | |||||||||
Stellantis NV | 5,613 | 106,508 | |||||||||
Subaru Corp. | 12,700 | 226,859 | |||||||||
Toyota Motor Corp. | 15,700 | 287,060 | |||||||||
XPeng, Inc., ADR* | 2,771 | 139,464 | |||||||||
XPeng, Inc., Class A* | 1,200 | 28,675 | |||||||||
Yamaha Motor Co. Ltd. | 8,000 | 191,672 | |||||||||
3,349,401 | |||||||||||
BANKS - 9.9% | |||||||||||
ABN AMRO Bank NV, CVA (a) | 7,759 | 113,965 | |||||||||
Absa Group Ltd. | 8,658 | 82,756 | |||||||||
Agricultural Bank of China Ltd., Class A | 106,200 | 48,990 | |||||||||
Agricultural Bank of China Ltd., Class H | 47,000 | 16,156 | |||||||||
Banco Bilbao Vizcaya Argentaria SA | 57,043 | 340,564 | |||||||||
Banco Bradesco SA | 13,576 | 39,461 | |||||||||
Banco de Sabadell SA* | 87,690 | 59,015 | |||||||||
Banco do Brasil SA | 14,852 | 76,926 | |||||||||
Banco Santander Brasil SA | 9,764 | 52,554 | |||||||||
Banco Santander SA | 83,564 | 279,433 | |||||||||
Bangkok Bank PCL, NVDR | 9,900 | 36,008 | |||||||||
Bank Central Asia TBK PT | 656,000 | 335,997 | |||||||||
Bank Hapoalim BM | 34,745 | 358,345 | |||||||||
Bank Leumi Le-Israel BM | 1,702 | 18,292 | |||||||||
Bank Mandiri Persero TBK PT | 115,300 | 56,831 | |||||||||
Bank Negara Indonesia Persero Tbk PT | 43,900 | 20,791 | |||||||||
Bank of China Ltd., Class H | 229,000 | 82,538 | |||||||||
Bank of Communications Co. Ltd., Class A | 102,500 | 74,141 | |||||||||
Bank of Montreal | 8,057 | 868,688 | |||||||||
Bank of Ningbo Co. Ltd., Class A | 3,850 | 23,124 | |||||||||
Bank of Nova Scotia (The) | 5,530 | 392,045 | |||||||||
Bank Rakyat Indonesia Persero TBK PT | 438,800 | 126,537 | |||||||||
Bankinter SA | 9,199 | 47,169 | |||||||||
Banque Cantonale Vaudoise | 534 | 41,494 | |||||||||
Barclays PLC | 12,426 | 31,473 | |||||||||
BAWAG Group AG*,(a) | 2,059 | 126,909 | |||||||||
Bendigo & Adelaide Bank Ltd. | 3,891 | 25,743 | |||||||||
BNP Paribas SA | 8,511 | 588,175 | |||||||||
BOC Hong Kong Holdings Ltd. | 86,500 | 283,477 | |||||||||
| BPER Banca | 47,344 | 98,150 | |||||||||
See accompanying notes to financial statements.
24
Global Atlantic BlackRock Disciplined International Core Portfolio
Portfolio of Investments (Continued)
December 31, 2021
| Shares/ Principal | Fair Value | ||||||||||
BANKS - 9.9% (Continued) | |||||||||||
Canadian Imperial Bank of Commerce | 2,724 | $ | 317,978 | ||||||||
Capitec Bank Holdings Ltd. | 450 | 57,513 | |||||||||
China CITIC Bank Corp. Ltd., Class H | 179,000 | 77,603 | |||||||||
China Construction Bank Corp., Class H | 581,000 | 402,422 | |||||||||
China Everbright Bank Co. Ltd., Class A | 10,200 | 5,313 | |||||||||
China Merchants Bank Co. Ltd., Class A | 14,400 | 110,056 | |||||||||
China Merchants Bank Co. Ltd., Class H | 32,500 | 252,411 | |||||||||
CIMB Group Holdings BHD | 53,200 | 69,597 | |||||||||
Commonwealth Bank of Australia | 7,074 | 519,458 | |||||||||
Credit Agricole SA | 17,278 | 246,589 | |||||||||
DBS Group Holdings Ltd. | 2,400 | 58,142 | |||||||||
DNB Bank ASA | 5,937 | 135,998 | |||||||||
Erste Group Bank AG | 9,170 | 431,203 | |||||||||
FinecoBank Banca Fineco SpA | 1,273 | 22,345 | |||||||||
| Grupo Financiero Banorte SAB de CV, Class O | 33,407 | 217,386 | |||||||||
Hana Financial Group, Inc. | 697 | 24,655 | |||||||||
Hong Leong Bank BHD | 4,200 | 18,772 | |||||||||
HSBC Holdings PLC | 91,539 | 556,259 | |||||||||
| Industrial & Commercial Bank of China Ltd., Class H | 355,000 | 200,351 | |||||||||
Industrial Bank Co. Ltd., Class A | 36,800 | 109,938 | |||||||||
Intesa Sanpaolo SpA | 130,711 | 338,018 | |||||||||
Israel Discount Bank Ltd., Class A | 25,457 | 171,273 | |||||||||
KB Financial Group, Inc. | 616 | 28,501 | |||||||||
Lloyds Banking Group PLC | 547,300 | 354,337 | |||||||||
Malayan Banking BHD | 169,600 | 337,897 | |||||||||
| Mediobanca Banca di Credito Finanziario SpA | 23,211 | 266,859 | |||||||||
Mizrahi Tefahot Bank Ltd. | 2,427 | 93,574 | |||||||||
National Bank of Canada | 3,521 | 268,824 | |||||||||
Nedbank Group Ltd. | 2,444 | 26,801 | |||||||||
Nordea Bank Abp | 57,363 | 700,101 | |||||||||
OTP Bank Nyrt* | 4,889 | 250,410 | |||||||||
Oversea-Chinese Banking Corp. Ltd. | 21,200 | 179,268 | |||||||||
Ping An Bank Co. Ltd., Class A | 19,300 | 49,905 | |||||||||
| Postal Savings Bank of China Co. Ltd., Class H (a) | 40,000 | 28,065 | |||||||||
Public Bank BHD | 211,900 | 211,595 | |||||||||
Raiffeisen Bank International AG | 11,939 | 351,374 | |||||||||
RHB Bank BHD | 99,400 | 128,127 | |||||||||
Royal Bank of Canada | 16,336 | 1,736,221 | |||||||||
Shinhan Financial Group Co. Ltd. | 2,179 | 67,455 | |||||||||
Societe Generale SA | 11,058 | 379,833 | |||||||||
Standard Bank Group Ltd. | 19,329 | 169,565 | |||||||||
Standard Chartered PLC | 17,258 | 104,814 | |||||||||
Sumitomo Mitsui Financial Group, Inc. | 27,700 | 948,470 | |||||||||
Svenska Handelsbanken AB, Class A | 4,650 | 50,260 | |||||||||
Swedbank AB, Class A | 1,249 | 25,121 | |||||||||
TMBThanachart Bank PCL, NVDR | 488,400 | 21,492 | |||||||||
Toronto-Dominion Bank (The) | 14,224 | 1,092,066 | |||||||||
| Shares/ Principal | Fair Value | ||||||||||
BANKS - 9.9% (Continued) | |||||||||||
UniCredit SpA | 7,762 | $ | 119,552 | ||||||||
United Overseas Bank Ltd. | 7,500 | 149,650 | |||||||||
17,229,164 | |||||||||||
BEVERAGES - 1.8% | |||||||||||
Ambev SA | 65,559 | 181,494 | |||||||||
Arca Continental SAB de CV | 20,605 | 130,909 | |||||||||
Budweiser Brewing Co. APAC Ltd. (a) | 5,700 | 14,951 | |||||||||
Carlsberg A/S, Class B | 1,043 | 180,126 | |||||||||
China Resources Beer Holdings Co. Ltd. | 4,000 | 32,759 | |||||||||
Coca-Cola Femsa SAB de CV | 6,091 | 33,486 | |||||||||
Davide Campari-Milano NV | 4,817 | 70,418 | |||||||||
Diageo PLC | 23,113 | 1,263,486 | |||||||||
Fomento Economico Mexicano SAB de CV | 18,619 | 145,104 | |||||||||
Fraser & Neave Holdings BHD | 1,700 | 10,095 | |||||||||
| Jiangsu Yanghe Brewery Joint-Stock Co., Ltd., Class A | 1,000 | 25,847 | |||||||||
JiuGui Liquor Co. Ltd., Class A | 600 | 20,005 | |||||||||
Kirin Holdings Co. Ltd. | 1,700 | 27,267 | |||||||||
Kweichow Moutai Co. Ltd., Class A | 300 | 96,496 | |||||||||
Luzhou Laojiao Co., Ltd, Class A | 900 | 35,850 | |||||||||
Pernod Ricard SA | 1,466 | 352,599 | |||||||||
Remy Cointreau SA | 546 | 132,875 | |||||||||
| Shanxi Xinghuacun Fen Wine Factory Co. Ltd., Class A | 1,390 | 68,870 | |||||||||
Suntory Beverage & Food Ltd. | 4,200 | 151,726 | |||||||||
Treasury Wine Estates Ltd. | 15,923 | 143,321 | |||||||||
Wuliangye Yibin Co. Ltd., Class A | 2,400 | 83,847 | |||||||||
3,201,531 | |||||||||||
BIOTECHNOLOGY - 0.8% | |||||||||||
3SBio, Inc.*,(a) | 7,500 | 6,253 | |||||||||
BeiGene Ltd., ADR* | 449 | 121,648 | |||||||||
Celltrion, Inc. | 729 | 121,473 | |||||||||
CSL Ltd. | 3,057 | 646,152 | |||||||||
Galapagos NV* | 1,572 | 87,989 | |||||||||
Genmab A/S* | 616 | 247,709 | |||||||||
Grifols SA | 770 | 14,776 | |||||||||
Innovent Biologics, Inc.*,(a) | 7,000 | 43,322 | |||||||||
SK Bioscience Co. Ltd.* | 79 | 14,953 | |||||||||
Swedish Orphan Biovitrum AB* | 891 | 18,216 | |||||||||
Zai Lab Ltd., ADR* | 403 | 25,329 | |||||||||
1,347,820 | |||||||||||
BUILDING PRODUCTS - 0.5% | |||||||||||
Assa Abloy AB, Class B | 3,902 | 119,036 | |||||||||
Cie de Saint-Gobain | 1,331 | 93,647 | |||||||||
Daikin Industries Ltd. | 2,100 | 475,785 | |||||||||
Kingspan Group PLC | 1,598 | 190,811 | |||||||||
Sanwa Holdings Corp. | 1,300 | 13,852 | |||||||||
Zhuzhou Kibing Group Co. Ltd., Class A | 7,400 | 19,854 | |||||||||
912,985 | |||||||||||
See accompanying notes to financial statements.
25
Global Atlantic BlackRock Disciplined International Core Portfolio
Portfolio of Investments (Continued)
December 31, 2021
| Shares/ Principal | Fair Value | ||||||||||
CAPITAL MARKETS - 1.5% | |||||||||||
| 3i Group PLC | 6,584 | $ | 129,217 | ||||||||
Amundi SA (a) | 1,875 | 154,695 | |||||||||
Avanza Bank Holding AB | 675 | 24,767 | |||||||||
B3 SA - Brasil Bolsa Balcao | 88,416 | 176,832 | |||||||||
Banca Generali SpA | 546 | 24,060 | |||||||||
| China International Capital Corp. Ltd., Class H (a) | 20,000 | 55,154 | |||||||||
CI Financial Corp. | 500 | 10,466 | |||||||||
CITIC Securities Co., Ltd., Class A | 43,400 | 179,842 | |||||||||
Deutsche Boerse AG | 1,622 | 271,332 | |||||||||
DWS Group GmbH & Co. KGaA (a) | 1,550 | 62,539 | |||||||||
East Money Information Co. Ltd., Class A | 20,448 | 119,062 | |||||||||
Euronext NV (a) | 410 | 42,546 | |||||||||
Guotai Junan Securities Co. Ltd., Class A | 24,900 | 69,894 | |||||||||
| Hithink RoyalFlush Information Network Co. Ltd., Class A | 2,800 | 63,518 | |||||||||
Hong Kong Exchanges & Clearing Ltd. | 3,400 | 198,602 | |||||||||
Huatai Securities Co. Ltd., Class A | 22,000 | 61,305 | |||||||||
IG Group Holdings PLC | 5,468 | 60,212 | |||||||||
Insignia Financial Ltd. | 19,449 | 51,188 | |||||||||
Macquarie Group Ltd. | 2,238 | 334,214 | |||||||||
Partners Group Holding AG | 168 | 278,878 | |||||||||
Perpetual Ltd. | 1,866 | 48,800 | |||||||||
Reinet Investments SCA | 690 | 12,366 | |||||||||
TMX Group Ltd. | 1,032 | 104,781 | |||||||||
UBS Group AG | 8,163 | 147,107 | |||||||||
2,681,377 | |||||||||||
CHEMICALS - 3.2% | |||||||||||
Air Liquide SA | 2,890 | 503,887 | |||||||||
Air Water, Inc. | 1,100 | 16,965 | |||||||||
Arkema SA | 139 | 19,577 | |||||||||
Asahi Kasei Corp. | 13,300 | 124,852 | |||||||||
Covestro AG (a) | 2,525 | 155,631 | |||||||||
Croda International PLC | 1,561 | 213,967 | |||||||||
DIC Corp. | 1,900 | 47,782 | |||||||||
Dongyue Group Ltd. | 6,000 | 9,358 | |||||||||
Evonik Industries AG | 14,820 | 479,814 | |||||||||
Givaudan SA | 200 | 1,051,857 | |||||||||
Hyosung Advanced Materials Corp.* | 30 | 15,041 | |||||||||
Johnson Matthey PLC | 1,862 | 51,600 | |||||||||
K+S AG* | 1,230 | 21,240 | |||||||||
Kaneka Corp. | 300 | 9,835 | |||||||||
Kansai Paint Co. Ltd. | 2,900 | 62,959 | |||||||||
Kuraray Co. Ltd. | 2,200 | 19,086 | |||||||||
LG Chem Ltd.* | 341 | 176,416 | |||||||||
Mitsubishi Chemical Holdings Corp. | 2,600 | 19,237 | |||||||||
Nippon Paint Holdings Co. Ltd. | 1,600 | 17,423 | |||||||||
Nippon Shokubai Co. Ltd. | 1,100 | 50,818 | |||||||||
Nitto Denko Corp. | 800 | 61,760 | |||||||||
Novozymes A/S, Class B | 1,597 | 131,174 | |||||||||
| Shares/ Principal | Fair Value | ||||||||||
CHEMICALS - 3.2% (Continued) | |||||||||||
Nutrien Ltd. | 77 | $ | 5,796 | ||||||||
OCI NV* | 795 | 20,812 | |||||||||
PhosAgro PJSC, GDR | 740 | 15,969 | |||||||||
Shin-Etsu Chemical Co. Ltd. | 2,400 | 415,162 | |||||||||
Sika AG | 1,393 | 581,264 | |||||||||
Solvay SA | 2,179 | 253,247 | |||||||||
Sumitomo Chemical Co. Ltd. | 141,300 | 665,057 | |||||||||
Symrise AG | 1,425 | 211,152 | |||||||||
Teijin Ltd. | 2,400 | 29,491 | |||||||||
Toray Industries, Inc. | 6,700 | 39,669 | |||||||||
Tosoh Corp. | 1,600 | 23,704 | |||||||||
Wacker Chemie AG | 491 | 73,481 | |||||||||
Wanhua Chemical Group Co. Ltd., Class A | 2,700 | 42,788 | |||||||||
5,637,871 | |||||||||||
COMMERCIAL SERVICES & SUPPLIES - 0.3% | |||||||||||
Brambles Ltd. | 20,320 | 157,044 | |||||||||
HomeServe PLC | 10,413 | 123,339 | |||||||||
Rentokil Initial PLC | 9,497 | 75,121 | |||||||||
Secom Co. Ltd. | 1,500 | 104,025 | |||||||||
459,529 | |||||||||||
COMMUNICATIONS EQUIPMENT - 0.4% | |||||||||||
Nokia Oyj* | 70,013 | 443,795 | |||||||||
Telefonaktiebolaget LM Ericsson, Class B | 22,138 | 244,001 | |||||||||
ZTE Corp., Class A | 8,200 | 43,102 | |||||||||
730,898 | |||||||||||
CONSTRUCTION & ENGINEERING - 0.1% | |||||||||||
COMSYS Holdings Corp. | 600 | 13,344 | |||||||||
HOCHTIEF AG | 504 | 40,694 | |||||||||
Kandenko Co. Ltd. | 3,900 | 29,024 | |||||||||
Metallurgical Corp. of China Ltd., Class H | 72,000 | 18,378 | |||||||||
101,440 | |||||||||||
CONSTRUCTION MATERIALS - 0.5% | |||||||||||
Cemex SAB de CV* | 113,453 | 77,557 | |||||||||
CRH PLC | 1,866 | 98,569 | |||||||||
Imerys SA | 650 | 27,009 | |||||||||
James Hardie Industries PLC | 11,668 | 469,122 | |||||||||
Siam Cement PCL (The), NVDR | 8,700 | 100,530 | |||||||||
Taiheiyo Cement Corp. | 600 | 11,843 | |||||||||
Wienerberger AG | 364 | 13,387 | |||||||||
798,017 | |||||||||||
CONSUMER FINANCE - 0.0%† | |||||||||||
Muangthai Capital PCL, NVDR | 8,800 | 15,477 | |||||||||
CONTAINERS & PACKAGING - 0.1% | |||||||||||
Klabin SA | 10,840 | 49,938 | |||||||||
Orora Ltd. | 7,034 | 17,899 | |||||||||
Smurfit Kappa Group PLC | 767 | 42,251 | |||||||||
See accompanying notes to financial statements.
26
Global Atlantic BlackRock Disciplined International Core Portfolio
Portfolio of Investments (Continued)
December 31, 2021
| Shares/ Principal | Fair Value | ||||||||||
CONTAINERS & PACKAGING - 0.1% (Continued) | |||||||||||
| Yunnan Energy New Material Co. Ltd., Class A | 500 | $ | 19,644 | ||||||||
129,732 | |||||||||||
DISTRIBUTORS - 0.0%† | |||||||||||
D'ieteren Group | 108 | 21,076 | |||||||||
DIVERSIFIED CONSUMER SERVICES - 0.1% | |||||||||||
Benesse Holdings, Inc. | 2,500 | 49,043 | |||||||||
Cogna Educacao* | 29,080 | 12,843 | |||||||||
IDP Education Ltd. | 771 | 19,423 | |||||||||
81,309 | |||||||||||
DIVERSIFIED FINANCIAL SERVICES - 0.8% | |||||||||||
Banca Mediolanum SpA | 12,195 | 120,376 | |||||||||
Challenger Ltd. | 8,543 | 40,559 | |||||||||
EXOR NV | 1,057 | 94,911 | |||||||||
FirstRand Ltd. | 37,438 | 142,621 | |||||||||
Groupe Bruxelles Lambert SA | 2,182 | 243,571 | |||||||||
Industrivarden AB, Class A | 976 | 31,089 | |||||||||
Investor AB, Class A | 5,132 | 135,246 | |||||||||
Investor AB, Class B | 14,161 | 356,221 | |||||||||
L E Lundbergforetagen AB, Class B | 1,692 | 94,936 | |||||||||
M&G PLC | 7,398 | 19,990 | |||||||||
Mitsubishi HC Capital, Inc. | 28,100 | 138,847 | |||||||||
1,418,367 | |||||||||||
DIVERSIFIED TELECOMMUNICATION - 1.4% | |||||||||||
BT Group PLC | 74,731 | 171,617 | |||||||||
China Tower Corp. Ltd., Class H (a) | 112,000 | 12,355 | |||||||||
Deutsche Telekom AG | 14,304 | 265,144 | |||||||||
Koninklijke KPN NV | 103,786 | 322,209 | |||||||||
KT Corp. | 7,588 | 195,325 | |||||||||
Nippon Telegraph & Telephone Corp. | 8,100 | 221,571 | |||||||||
Orange SA | 12,637 | 135,272 | |||||||||
PCCW Ltd. | 129,000 | 65,358 | |||||||||
Singapore Telecommunications Ltd. | 432,100 | 743,591 | |||||||||
Spark New Zealand Ltd. | 11,045 | 34,180 | |||||||||
Telecom Italia SpA/Milano | 138,804 | 67,114 | |||||||||
Telefonica Deutschland Holding AG | 20,573 | 57,109 | |||||||||
Telekom Malaysia BHD | 38,800 | 51,224 | |||||||||
Telstra Corp. Ltd. | 35,752 | 108,653 | |||||||||
United Internet AG | 331 | 13,152 | |||||||||
2,463,874 | |||||||||||
ELECTRIC UTILITIES - 1.0% | |||||||||||
Acciona SA | 741 | 141,652 | |||||||||
Chugoku Electric Power Co., Inc. (The) | 3,900 | 31,531 | |||||||||
| CPFL Energia SA | 16,341 | 78,713 | |||||||||
EDP - Energias de Portugal SA | 2,535 | 13,930 | |||||||||
Electricite de France SA | 28,688 | 337,006 | |||||||||
Emera, Inc. | 5,787 | 289,636 | |||||||||
| Shares/ Principal | Fair Value | ||||||||||
ELECTRIC UTILITIES - 1.0% (Continued) | |||||||||||
Enel SpA | 26,452 | $ | 211,952 | ||||||||
Energisa SA | 4,781 | 38,085 | |||||||||
Equatorial Energia SA | 4,300 | 17,455 | |||||||||
Iberdrola SA | 11,799 | 139,679 | |||||||||
Light SA | 4,100 | 8,649 | |||||||||
Origin Energy Ltd. | 4,961 | 18,900 | |||||||||
Orsted AS (a) | 283 | 36,139 | |||||||||
Shikoku Electric Power Co., Inc. | 9,000 | 63,306 | |||||||||
Tenaga Nasional BHD | 101,000 | 226,438 | |||||||||
Verbund AG | 237 | 26,655 | |||||||||
1,679,726 | |||||||||||
ELECTRICAL EQUIPMENT - 1.8% | |||||||||||
ABB Ltd. | 20,109 | 770,240 | |||||||||
| Contemporary Amperex Technology Co. Ltd., Class A | 2,624 | 242,088 | |||||||||
Legrand SA | 4,397 | 514,528 | |||||||||
Mitsubishi Electric Corp. | 3,400 | 43,063 | |||||||||
Schneider Electric SE | 7,493 | 1,469,538 | |||||||||
WEG SA | 15,148 | 89,691 | |||||||||
| Xinjiang Goldwind Science & Technology Co. Ltd., Class H | 6,200 | 12,104 | |||||||||
3,141,252 | |||||||||||
ELECTRONIC EQUIPMENT, INSTRUMENTS & COMPONENTS - 1.7% | |||||||||||
AAC Technologies Holdings, Inc. | 3,500 | 13,827 | |||||||||
Alps Alpine Co. Ltd. | 3,800 | 35,804 | |||||||||
BOE Technology Group Co. Ltd., Class A | 67,700 | 53,643 | |||||||||
Canon Marketing Japan, Inc. | 700 | 13,926 | |||||||||
GoerTek, Inc., Class A | 2,900 | 24,616 | |||||||||
Halma PLC | 4,153 | 180,001 | |||||||||
Hana Microelectronics PCL, NVDR | 8,400 | 22,254 | |||||||||
Hexagon AB, Class B | 23,017 | 365,192 | |||||||||
Inari Amertron BHD | 82,400 | 79,117 | |||||||||
KCE Electronics PCL, NVDR | 13,900 | 36,617 | |||||||||
Keyence Corp. | 1,500 | 941,514 | |||||||||
LG Innotek Co. Ltd.* | 177 | 54,198 | |||||||||
Murata Manufacturing Co. Ltd. | 3,500 | 278,316 | |||||||||
Omron Corp. | 2,700 | 268,699 | |||||||||
Samsung Electro-Mechanics Co. Ltd.* | 893 | 148,364 | |||||||||
Samsung SDI Co. Ltd. | 378 | 208,278 | |||||||||
Shimadzu Corp. | 1,800 | 75,889 | |||||||||
Sunny Optical Technology Group Co. Ltd. | 3,600 | 113,869 | |||||||||
TDK Corp. | 1,200 | 46,789 | |||||||||
| Wuxi Lead Intelligent Equipment Co. Ltd., Class A | 4,160 | 48,543 | |||||||||
3,009,456 | |||||||||||
See accompanying notes to financial statements.
27
Global Atlantic BlackRock Disciplined International Core Portfolio
Portfolio of Investments (Continued)
December 31, 2021
| Shares/ Principal | Fair Value | ||||||||||
ENERGY EQUIPMENT & SERVICES - 0.0%† | |||||||||||
Dialog Group BHD | 15,700 | $ | 9,874 | ||||||||
SBM Offshore NV | 1,282 | 19,091 | |||||||||
Worley Ltd. | 5,399 | 41,726 | |||||||||
70,691 | |||||||||||
ENTERTAINMENT - 0.5% | |||||||||||
Bilibili, Inc., ADR* | 296 | 13,734 | |||||||||
Krafton, Inc.* | 54 | 20,896 | |||||||||
NCSoft Corp.* | 161 | 87,086 | |||||||||
NetEase, Inc. | 23,560 | 475,956 | |||||||||
Netmarble Corp.*,(a) | 287 | 30,179 | |||||||||
Nexon Co. Ltd. | 2,500 | 48,283 | |||||||||
Sea Ltd., ADR* | 514 | 114,987 | |||||||||
Tencent Music Entertainment Group, ADR* | 3,441 | 23,571 | |||||||||
814,692 | |||||||||||
EQUITY REAL ESTATE INVESTMENT - 0.8% | |||||||||||
British Land Co. PLC (The) | 2,752 | 19,793 | |||||||||
Canadian Apartment Properties REIT | 6,647 | 315,524 | |||||||||
Champion REIT | 23,000 | 11,771 | |||||||||
Charter Hall Group | 1,883 | 28,175 | |||||||||
First Capital Real Estate Investment Trust | 1,897 | 28,324 | |||||||||
Goodman Group | 12,347 | 237,887 | |||||||||
GPT Group (The) | 14,419 | 56,820 | |||||||||
Klepierre SA* | 3,875 | 91,879 | |||||||||
Link REIT | 13,300 | 117,113 | |||||||||
Mirvac Group | 46,459 | 98,294 | |||||||||
RioCan Real Estate Investment Trust | 991 | 17,997 | |||||||||
Scentre Group | 132,655 | 304,772 | |||||||||
Stockland | 7,275 | 22,426 | |||||||||
Unibail-Rodamco-Westfield* | 706 | 49,472 | |||||||||
1,400,247 | |||||||||||
FOOD & STAPLES RETAILING - 1.6% | |||||||||||
Alimentation Couche-Tard, Inc. | 9,534 | 400,033 | |||||||||
Berli Jucker PCL, NVDR | 86,400 | 80,180 | |||||||||
Carrefour SA | 1,753 | 32,105 | |||||||||
Clicks Group Ltd. | 2,219 | 43,870 | |||||||||
Coles Group Ltd. | 7,233 | 94,342 | |||||||||
HelloFresh SE* | 962 | 73,888 | |||||||||
J Sainsbury PLC | 9,947 | 37,158 | |||||||||
Jeronimo Martins SGPS SA | 8,321 | 190,199 | |||||||||
Kesko Oyj, Class B | 6,526 | 217,743 | |||||||||
Koninklijke Ahold Delhaize NV | 27,918 | 956,737 | |||||||||
Lawson, Inc. | 1,000 | 47,328 | |||||||||
Magnit PJSC, GDR | 2,720 | 40,800 | |||||||||
Metcash Ltd. | 9,316 | 30,479 | |||||||||
Sundrug Co. Ltd. | 1,200 | 31,314 | |||||||||
Tesco PLC | 101,630 | 399,055 | |||||||||
Tsuruha Holdings, Inc. | 200 | 19,174 | |||||||||
Wal-Mart de Mexico SAB de CV | 21,019 | 78,283 | |||||||||
2,772,688 | |||||||||||
| Shares/ Principal | Fair Value | ||||||||||
FOOD PRODUCTS - 1.9% | |||||||||||
Ajinomoto Co., Inc. | 1,000 | $ | 30,368 | ||||||||
Associated British Foods PLC | 1,957 | 53,225 | |||||||||
AVI Ltd. | 2,983 | 13,812 | |||||||||
Calbee, Inc. | 13,600 | 315,213 | |||||||||
Dali Foods Group Co. Ltd. (a) | 66,000 | 34,540 | |||||||||
| Foshan Haitian Flavouring & Food Co. Ltd., Class A | 1,300 | 21,440 | |||||||||
Fuji Oil Holdings, Inc. | 4,200 | 84,616 | |||||||||
Grupo Bimbo SAB de CV, Series A | 23,733 | 73,165 | |||||||||
Itoham Yonekyu Holdings, Inc. | 2,300 | 13,142 | |||||||||
JBS SA | 2,441 | 16,631 | |||||||||
JDE Peet's NV | 3,927 | 121,023 | |||||||||
Kerry Group PLC, Class A | 559 | 71,993 | |||||||||
Kuala Lumpur Kepong BHD | 6,300 | 32,937 | |||||||||
Marfrig Global Foods SA | 19,624 | 77,756 | |||||||||
Minerva SA/Brazil | 8,446 | 16,073 | |||||||||
Morinaga & Co. Ltd./Japan | 2,700 | 88,159 | |||||||||
Nestle SA | 14,372 | 2,010,171 | |||||||||
NH Foods Ltd. | 1,800 | 64,713 | |||||||||
Nisshin Seifun Group, Inc. | 2,400 | 34,555 | |||||||||
Nissin Foods Holdings Co. Ltd. | 600 | 43,715 | |||||||||
QL Resources BHD | 10,350 | 11,354 | |||||||||
Strauss Group Ltd. | 750 | 23,374 | |||||||||
Toyo Suisan Kaisha Ltd. | 800 | 33,867 | |||||||||
Uni-President China Holdings Ltd. | 21,000 | 20,364 | |||||||||
Yamazaki Baking Co. Ltd. | 6,500 | 86,249 | |||||||||
3,392,455 | |||||||||||
GAS UTILITIES - 0.5% | |||||||||||
AltaGas Ltd. | 1,871 | 40,452 | |||||||||
Beijing Enterprises Holdings Ltd. | 10,000 | 34,503 | |||||||||
China Resources Gas Group Ltd. | 4,000 | 22,600 | |||||||||
ENN Energy Holdings Ltd. | 6,200 | 116,743 | |||||||||
Italgas SpA | 20,418 | 140,523 | |||||||||
Korea Gas Corp.* | 1,943 | 63,909 | |||||||||
Kunlun Energy Co. Ltd. | 22,000 | 20,628 | |||||||||
Perusahaan Gas Negara TBK PT* | 194,400 | 18,755 | |||||||||
Rubis SCA | 8,136 | 242,964 | |||||||||
Tokyo Gas Co. Ltd. | 13,000 | 232,782 | |||||||||
Towngas China Co. Ltd.* | 14,000 | 12,175 | |||||||||
946,034 | |||||||||||
HEALTH CARE EQUIPMENT & SUPPLIES - 1.6% | |||||||||||
Coloplast A/S, Class B | 2,167 | 381,364 | |||||||||
Demant A/S* | 353 | 18,087 | |||||||||
Elekta AB, Class B | 17,222 | 217,894 | |||||||||
Fisher & Paykel Healthcare Corp. Ltd. | 8,648 | 193,967 | |||||||||
Getinge AB, Class B | 443 | 19,332 | |||||||||
Hartalega Holdings BHD | 31,600 | 43,463 | |||||||||
Hoya Corp. | 3,900 | 579,471 | |||||||||
Kossan Rubber Industries BHD | 31,500 | 14,518 | |||||||||
See accompanying notes to financial statements.
28
Global Atlantic BlackRock Disciplined International Core Portfolio
Portfolio of Investments (Continued)
December 31, 2021
| Shares/ Principal | Fair Value | ||||||||||
HEALTH CARE EQUIPMENT & SUPPLIES - 1.6% (Continued) | |||||||||||
Nihon Kohden Corp. | 600 | $ | 16,439 | ||||||||
Olympus Corp. | 18,100 | 416,447 | |||||||||
Osstem Implant Co. Ltd.* | 129 | 15,485 | |||||||||
| Shenzhen Mindray Bio-Medical Electronics Co. Ltd., Class A | 2,500 | 149,372 | |||||||||
Sonova Holding AG | 299 | 117,414 | |||||||||
Straumann Holding AG | 45 | 95,665 | |||||||||
Supermax Corp. BHD | 17,112 | 6,038 | |||||||||
Sysmex Corp. | 700 | 94,525 | |||||||||
Terumo Corp. | 10,300 | 434,701 | |||||||||
2,814,182 | |||||||||||
HEALTH CARE PROVIDERS & SERVICES - 0.3% | |||||||||||
Aier Eye Hospital Group Co., Ltd., Class A | 2,300 | 15,258 | |||||||||
Amplifon SpA | 3,217 | 173,590 | |||||||||
Celltrion Healthcare Co. Ltd. | 400 | 26,975 | |||||||||
Fleury SA | 4,972 | 16,059 | |||||||||
Fresenius SE & Co. KGAA | 984 | 39,613 | |||||||||
IHH Healthcare BHD | 81,600 | 143,770 | |||||||||
Sonic Healthcare Ltd. | 1,481 | 50,209 | |||||||||
465,474 | |||||||||||
HEALTH CARE TECHNOLOGY - 0.1% | |||||||||||
M3, Inc. | 2,400 | 120,735 | |||||||||
HOTELS, RESTAURANTS & LEISURE - 0.8% | |||||||||||
Aristocrat Leisure Ltd. | 14,105 | 446,812 | |||||||||
Compass Group PLC* | 9,819 | 219,572 | |||||||||
Entain PLC* | 1,432 | 32,643 | |||||||||
Evolution AB (a) | 806 | 114,501 | |||||||||
Flight Centre Travel Group Ltd.* | 1,212 | 15,526 | |||||||||
Flutter Entertainment PLC* | 619 | 97,846 | |||||||||
Greggs PLC | 2,961 | 133,831 | |||||||||
Jiumaojiu International Holdings Ltd. (a) | 10,000 | 17,572 | |||||||||
Sodexo SA | 1,651 | 144,682 | |||||||||
Trip.com Group Ltd., ADR* | 1,195 | 29,421 | |||||||||
Whitbread PLC* | 4,865 | 197,353 | |||||||||
1,449,759 | |||||||||||
HOUSEHOLD DURABLES - 0.6% | |||||||||||
Barratt Developments PLC | 1,752 | 17,750 | |||||||||
Bellway PLC | 1,378 | 62,264 | |||||||||
Casio Computer Co. Ltd. | 11,400 | 146,417 | |||||||||
LG Electronics, Inc. | 378 | 43,881 | |||||||||
Nikon Corp. | 6,900 | 74,300 | |||||||||
Persimmon PLC | 981 | 37,948 | |||||||||
Rinnai Corp. | 500 | 45,070 | |||||||||
Sekisui House Ltd. | 20,200 | 433,101 | |||||||||
Sony Group Corp. | 500 | 62,850 | |||||||||
Sumitomo Forestry Co. Ltd. | 1,300 | 25,130 | |||||||||
Taylor Wimpey PLC | 26,811 | 63,731 | |||||||||
1,012,442 | |||||||||||
| Shares/ Principal | Fair Value | ||||||||||
HOUSEHOLD PRODUCTS - 0.3% | |||||||||||
Lion Corp. | 4,300 | $ | 57,393 | ||||||||
Pigeon Corp. | 2,200 | 41,992 | |||||||||
Unicharm Corp. | 8,100 | 351,630 | |||||||||
451,015 | |||||||||||
| INDEPENDENT POWER AND RENEWABLE ELECTRICITY PRODUCERS - 0.1% | |||||||||||
B Grimm Power PCL | 10,800 | 13,094 | |||||||||
| China Longyuan Power Group Corp. Ltd., Class H | 28,000 | 65,364 | |||||||||
China Yangtze Power Co. Ltd., Class A | 7,300 | 26,001 | |||||||||
Energy Absolute PCL, NVDR | 8,200 | 23,565 | |||||||||
Gulf Energy Development PCL | 13,500 | 18,489 | |||||||||
Gunkul Engineering PCL, NVDR | 174,600 | 29,270 | |||||||||
175,783 | |||||||||||
INDUSTRIAL CONGLOMERATES - 1.6% | |||||||||||
Alfa SAB de CV, Class A | 18,300 | 13,440 | |||||||||
CK Hutchison Holdings Ltd. | 39,000 | 251,619 | |||||||||
Investment AB Latour, Class B | 719 | 29,280 | |||||||||
Jardine Cycle & Carriage Ltd. | 25,400 | 388,117 | |||||||||
NWS Holdings Ltd. | 9,000 | 8,439 | |||||||||
Samsung C&T Corp.* | 646 | 64,668 | |||||||||
Siemens AG | 9,620 | 1,670,298 | |||||||||
SM Investments Corp. | 920 | 17,014 | |||||||||
Smiths Group PLC | 10,696 | 228,825 | |||||||||
Toshiba Corp. | 2,400 | 98,580 | |||||||||
2,770,280 | |||||||||||
INSURANCE - 4.4% | |||||||||||
AIA Group Ltd. | 118,400 | 1,193,674 | |||||||||
Allianz SE | 2,360 | 557,289 | |||||||||
| ASR Nederland NV | 8,396 | 386,691 | |||||||||
Aviva PLC | 7,238 | 40,234 | |||||||||
AXA SA | 14,804 | 440,827 | |||||||||
Baloise Holding AG | 525 | 85,911 | |||||||||
China Life Insurance Co. Ltd., Class H | 64,000 | 106,061 | |||||||||
Dai-ichi Life Holdings, Inc. | 3,800 | 76,739 | |||||||||
Direct Line Insurance Group PLC | 4,188 | 15,826 | |||||||||
Fairfax Financial Holdings Ltd. | 695 | 342,364 | |||||||||
Great-West Lifeco, Inc. | 18,660 | 560,768 | |||||||||
iA Financial Corp., Inc. | 276 | 15,815 | |||||||||
Intact Financial Corp. | 1,638 | 213,213 | |||||||||
Japan Post Holdings Co. Ltd.* | 39,400 | 306,838 | |||||||||
Legal & General Group PLC | 15,393 | 62,026 | |||||||||
Manulife Financial Corp. | 36,075 | 688,571 | |||||||||
Medibank Pvt Ltd. | 158,500 | 386,045 | |||||||||
MS&AD Insurance Group Holdings, Inc. | 8,600 | 265,046 | |||||||||
| Muenchener Rueckversicherungs-Gesellschaft AG in Muenchen | 433 | 128,272 | |||||||||
NN Group NV | 374 | 20,249 | |||||||||
Old Mutual Ltd. | 29,187 | 23,957 | |||||||||
See accompanying notes to financial statements.
29
Global Atlantic BlackRock Disciplined International Core Portfolio
Portfolio of Investments (Continued)
December 31, 2021
| Shares/ Principal | Fair Value | ||||||||||
INSURANCE - 4.4% (Continued) | |||||||||||
Phoenix Group Holdings PLC | 3,233 | $ | 28,603 | ||||||||
PICC Property & Casualty Co. Ltd., Class H | 8,000 | 6,536 | |||||||||
| Ping An Insurance Group Co. of China Ltd., Class H | 62,000 | 446,532 | |||||||||
Porto Seguro SA | 3,608 | 13,551 | |||||||||
Prudential PLC | 11,996 | 207,080 | |||||||||
QBE Insurance Group Ltd. | 10,851 | 89,543 | |||||||||
Sampo Oyj, Class A | 1,202 | 60,226 | |||||||||
Samsung Fire & Marine Insurance Co. Ltd.* | 77 | 13,084 | |||||||||
Samsung Life Insurance Co. Ltd.* | 645 | 34,780 | |||||||||
Sanlam Ltd. | 25,363 | 94,333 | |||||||||
T&D Holdings, Inc. | 6,500 | 83,088 | |||||||||
Tokio Marine Holdings, Inc. | 7,800 | 432,961 | |||||||||
Unipol Gruppo SpA | 24,721 | 134,351 | |||||||||
Zurich Insurance Group AG | 379 | 166,550 | |||||||||
7,727,634 | |||||||||||
INTERACTIVE MEDIA & SERVICES - 2.8% | |||||||||||
Auto Trader Group PLC (a) | 2,300 | 23,053 | |||||||||
Autohome, Inc., ADR | 944 | 27,829 | |||||||||
Baidu, Inc., ADR* | 2,398 | 356,798 | |||||||||
Baidu, Inc., Class A* | 3,250 | 60,279 | |||||||||
Kakao Corp. | 2,067 | 195,615 | |||||||||
Kuaishou Technology*,(a) | 3,600 | 33,270 | |||||||||
NAVER Corp.* | 1,204 | 383,356 | |||||||||
REA Group Ltd. | 2,703 | 329,449 | |||||||||
Rightmove PLC | 19,927 | 214,571 | |||||||||
Scout24 SE (a) | 11,325 | 791,015 | |||||||||
Tencent Holdings Ltd. | 41,100 | 2,408,127 | |||||||||
4,823,362 | |||||||||||
INTERNET & DIRECT MARKETING RETAIL - 1.8% | |||||||||||
Alibaba Group Holding Ltd.* | 96,400 | 1,470,179 | |||||||||
JD.com, Inc., Class A* | 8,750 | 307,518 | |||||||||
Meituan, Class B*,(a) | 23,900 | 690,977 | |||||||||
Naspers Ltd., Class N | 3,138 | 486,036 | |||||||||
Pinduoduo, Inc., ADR* | 1,753 | 102,200 | |||||||||
Vipshop Holdings Ltd., ADR* | 4,960 | 41,664 | |||||||||
ZOZO, Inc. | 600 | 18,705 | |||||||||
3,117,279 | |||||||||||
IT SERVICES - 1.7% | |||||||||||
Adyen NV*,(a) | 122 | 320,694 | |||||||||
Atos SE | 246 | 10,460 | |||||||||
Capgemini SE | 2,098 | 514,150 | |||||||||
CGI, Inc.* | 6,374 | 564,408 | |||||||||
Cielo SA | 53,228 | 21,788 | |||||||||
GDS Holdings Ltd., Class A* | 3,100 | 18,012 | |||||||||
NEC Corp. | 5,700 | 262,837 | |||||||||
NET One Systems Co. Ltd. | 1,800 | 48,456 | |||||||||
Nomura Research Institute Ltd. | 1,400 | 59,997 | |||||||||
Obic Co. Ltd. | 900 | 168,816 | |||||||||
| Shares/ Principal | Fair Value | ||||||||||
IT SERVICES - 1.7% (Continued) | |||||||||||
Reply SpA | 100 | $ | 20,322 | ||||||||
Samsung SDS Co. Ltd.* | 746 | 98,212 | |||||||||
Shopify, Inc., Class A* | 631 | 870,052 | |||||||||
2,978,204 | |||||||||||
LEISURE PRODUCTS - 0.0%† | |||||||||||
BRP, Inc. | 298 | 26,140 | |||||||||
Games Workshop Group PLC | 21 | 2,836 | |||||||||
28,976 | |||||||||||
LIFE SCIENCES TOOLS & SERVICES - 0.9% | |||||||||||
Eurofins Scientific SE | 1,534 | 189,798 | |||||||||
Gerresheimer AG | 1,677 | 161,530 | |||||||||
Lonza Group AG | 102 | 85,258 | |||||||||
Pharmaron Beijing Co. Ltd., Class A | 600 | 13,299 | |||||||||
Pharmaron Beijing Co. Ltd., Class H (a) | 3,800 | 58,636 | |||||||||
Samsung Biologics Co. Ltd.*,(a) | 93 | 70,645 | |||||||||
Sartorius Stedim Biotech | 281 | 154,152 | |||||||||
Tecan Group AG | 219 | 133,518 | |||||||||
WuXi AppTec Co. Ltd., Class A | 3,720 | 69,213 | |||||||||
WuXi AppTec Co. Ltd., Class H (a) | 11,400 | 197,401 | |||||||||
Wuxi Biologics Cayman, Inc.*,(a) | 29,000 | 344,260 | |||||||||
1,477,710 | |||||||||||
MACHINERY - 2.1% | |||||||||||
Amada Co. Ltd. | 22,400 | 221,559 | |||||||||
ANDRITZ AG | 1,787 | 92,220 | |||||||||
Atlas Copco AB, Class A | 8,769 | 606,111 | |||||||||
Atlas Copco AB, Class B | 4,007 | 235,538 | |||||||||
Daifuku Co. Ltd. | 700 | 57,140 | |||||||||
Daimler Truck Holding AG* | 630 | 23,115 | |||||||||
DMG Mori Co. Ltd. | 3,100 | 53,221 | |||||||||
Ebara Corp. | 1,200 | 66,589 | |||||||||
FANUC Corp. | 1,300 | 275,229 | |||||||||
Fluidra SA | 1,375 | 55,040 | |||||||||
GEA Group AG | 606 | 33,141 | |||||||||
Husqvarna AB, Class B | 5,842 | 93,465 | |||||||||
IMI PLC | 3,274 | 76,982 | |||||||||
Indutrade AB | 1,477 | 45,221 | |||||||||
Komatsu Ltd. | 3,400 | 79,527 | |||||||||
Kone Oyj, Class B | 9,535 | 683,555 | |||||||||
Mitsubishi Heavy Industries Ltd. | 2,900 | 66,963 | |||||||||
| Shenzhen Inovance Technology Co. Ltd., Class A | 5,300 | 57,047 | |||||||||
SMC Corp. | 100 | 67,379 | |||||||||
Spirax-Sarco Engineering PLC | 382 | 83,043 | |||||||||
Sumitomo Heavy Industries Ltd. | 1,100 | 26,642 | |||||||||
Techtronic Industries Co. Ltd. | 25,500 | 507,625 | |||||||||
Trelleborg AB, Class B | 2,663 | 69,944 | |||||||||
Valmet OYJ | 547 | 23,464 | |||||||||
VAT Group AG (a) | 169 | 84,282 | |||||||||
See accompanying notes to financial statements.
30
Global Atlantic BlackRock Disciplined International Core Portfolio
Portfolio of Investments (Continued)
December 31, 2021
| Shares/ Principal | Fair Value | ||||||||||
MACHINERY - 2.1% (Continued) | |||||||||||
| Zoomlion Heavy Industry Science and Technology Co. Ltd., Class A | 41,299 | $ | 46,461 | ||||||||
| Zoomlion Heavy Industry Science and Technology Co. Ltd., Class H | 15,200 | 9,573 | |||||||||
3,740,076 | |||||||||||
MARINE - 0.5% | |||||||||||
AP Moller - Maersk A/S, Class A | 12 | 39,962 | |||||||||
AP Moller - Maersk A/S, Class B | 77 | 276,083 | |||||||||
| COSCO SHIPPING Holdings Co Ltd., Class A* | 15,000 | 43,988 | |||||||||
| COSCO SHIPPING Holdings Co. Ltd., Class H* | 58,550 | 113,551 | |||||||||
HMM Co Ltd.* | 1,822 | 41,230 | |||||||||
Kuehne + Nagel International AG | 447 | 144,429 | |||||||||
Mitsui OSK Lines Ltd. | 500 | 37,080 | |||||||||
Nippon Yusen KK | 1,100 | 83,678 | |||||||||
Precious Shipping PCL, NVDR | 37,300 | 18,536 | |||||||||
SITC International Holdings Co. Ltd. | 4,000 | 14,468 | |||||||||
813,005 | |||||||||||
MEDIA - 0.5% | |||||||||||
Future PLC | 720 | 37,350 | |||||||||
ITV PLC* | 119,510 | 178,948 | |||||||||
Megacable Holdings SAB de CV | 3,800 | 12,996 | |||||||||
MultiChoice Group | 1,493 | 11,415 | |||||||||
Nine Entertainment Co. Holdings Ltd. | 12,710 | 26,891 | |||||||||
Nippon Television Holdings, Inc. | 3,900 | 39,557 | |||||||||
ProSiebenSat.1 Media SE | 343 | 5,465 | |||||||||
Publicis Groupe SA | 2,247 | 151,273 | |||||||||
RTL Group SA | 3,000 | 159,049 | |||||||||
Telenet Group Holding NV | 2,227 | 81,193 | |||||||||
WPP PLC | 13,713 | 207,931 | |||||||||
912,068 | |||||||||||
METALS & MINING - 3.0% | |||||||||||
Agnico Eagle Mines Ltd. | 816 | 43,405 | |||||||||
Alumina Ltd. | 39,332 | 53,332 | |||||||||
Aluminum Corp. of China Ltd., Class A* | 144,200 | 137,789 | |||||||||
Aluminum Corp. of China Ltd., Class H* | 146,000 | 80,713 | |||||||||
Angang Steel Co. Ltd., Class H | 22,000 | 9,792 | |||||||||
Anglo American Platinum Ltd. | 982 | 111,784 | |||||||||
Anglo American PLC | 13,476 | 550,497 | |||||||||
Anglo American PLC | 6,705 | 273,796 | |||||||||
AngloGold Ashanti Ltd. | 5,485 | 112,965 | |||||||||
BHP Group Ltd. | 22,901 | 690,982 | |||||||||
BHP Group PLC | 2,965 | 88,331 | |||||||||
BlueScope Steel Ltd. | 9,275 | 140,937 | |||||||||
China Molybdenum Co. Ltd., Class H | 51,000 | 26,886 | |||||||||
Dongkuk Steel Mill Co. Ltd.* | 1,506 | 20,143 | |||||||||
Franco-Nevada Corp. | 1,687 | 233,641 | |||||||||
Ganfeng Lithium Co. Ltd., Class A | 3,700 | 82,930 | |||||||||
| Shares/ Principal | Fair Value | ||||||||||
METALS & MINING - 3.0% (Continued) | |||||||||||
Ganfeng Lithium Co. Ltd., Class H (a) | 4,000 | $ | 62,953 | ||||||||
Glencore PLC* | 41,644 | 211,489 | |||||||||
Gold Fields Ltd. | 8,302 | 90,583 | |||||||||
Grupo Mexico SAB de CV, Series B | 25,451 | 111,007 | |||||||||
Impala Platinum Holdings Ltd. | 6,903 | 97,317 | |||||||||
Korea Zinc Co. Ltd.* | 96 | 41,267 | |||||||||
Mineral Resources Ltd. | 1,881 | 76,585 | |||||||||
Mitsubishi Materials Corp. | 2,000 | 34,302 | |||||||||
Mitsui Mining & Smelting Co. Ltd. | 900 | 24,502 | |||||||||
MMG Ltd.* | 40,000 | 12,827 | |||||||||
Nippon Steel Corp. | 700 | 11,419 | |||||||||
Norsk Hydro ASA | 4,922 | 38,803 | |||||||||
Outokumpu Oyj* | 4,758 | 29,759 | |||||||||
POSCO | 655 | 151,249 | |||||||||
Press Metal Aluminium Holdings BHD | 102,200 | 141,794 | |||||||||
| Shandong Nanshan Aluminum Co. Ltd., Class A | 29,400 | 21,727 | |||||||||
Sibanye Stillwater Ltd. | 10,987 | 33,801 | |||||||||
Sims Ltd. | 5,303 | 61,920 | |||||||||
South32 Ltd. | 77,727 | 226,611 | |||||||||
SSAB AB, Class A* | 9,757 | 56,513 | |||||||||
Vale SA | 1,316 | 18,419 | |||||||||
Wheaton Precious Metals Corp. | 14,572 | 626,187 | |||||||||
Yunnan Aluminium Co. Ltd., Class A* | 21,500 | 37,681 | |||||||||
Zhaojin Mining Industry Co. Ltd., Class H | 15,000 | 12,814 | |||||||||
Zhejiang Huayou Cobalt Co. Ltd., Class A | 4,600 | 79,617 | |||||||||
Zijin Mining Group Co. Ltd., Class A | 60,100 | 91,470 | |||||||||
Zijin Mining Group Co. Ltd., Class H | 88,000 | 104,747 | |||||||||
5,165,286 | |||||||||||
MULTILINE RETAIL - 0.2% | |||||||||||
Harvey Norman Holdings Ltd. | 8,547 | 30,698 | |||||||||
Lifestyle International Holdings Ltd.* | 22,500 | 12,381 | |||||||||
Next PLC | 1,132 | 124,959 | |||||||||
Wesfarmers Ltd. | 3,554 | 153,227 | |||||||||
Woolworths Holdings Ltd./South Africa | 22,801 | 74,089 | |||||||||
395,354 | |||||||||||
MULTI-UTILITIES - 0.8% | |||||||||||
AGL Energy Ltd. | 15,060 | 67,229 | |||||||||
Atco Ltd./Canada, Class I | 14,018 | 473,870 | |||||||||
Canadian Utilities Ltd., Class A | 4,089 | 118,771 | |||||||||
Centrica PLC* | 25,587 | 24,779 | |||||||||
E.ON SE | 9,102 | 126,197 | |||||||||
Engie SA | 36,581 | 541,381 | |||||||||
Hera SpA | 3,875 | 16,133 | |||||||||
National Grid PLC | 2,472 | 35,484 | |||||||||
Veolia Environnement SA | 595 | 21,828 | |||||||||
1,425,672 | |||||||||||
See accompanying notes to financial statements.
31
Global Atlantic BlackRock Disciplined International Core Portfolio
Portfolio of Investments (Continued)
December 31, 2021
| Shares/ Principal | Fair Value | ||||||||||
OIL, GAS & CONSUMABLE FUELS - 4.7% | |||||||||||
Ampol Ltd. | 4,656 | $ | 100,403 | ||||||||
| BP PLC | 195,212 | 873,858 | |||||||||
Canadian Natural Resources Ltd. | 13,321 | 563,676 | |||||||||
Cenovus Energy, Inc. | 4,733 | 58,116 | |||||||||
China Petroleum & Chemical Corp., Class A | 66,500 | 44,136 | |||||||||
China Petroleum & Chemical Corp., Class H | 144,000 | 67,047 | |||||||||
| China Suntien Green Energy Corp. Ltd., Class H | 31,000 | 24,176 | |||||||||
Crescent Point Energy Corp. | 18,352 | 98,069 | |||||||||
Ecopetrol SA | 174,971 | 115,644 | |||||||||
Enbridge, Inc. | 19,247 | 752,875 | |||||||||
Eni SpA | 9,892 | 137,465 | |||||||||
Equinor ASA | 32,908 | 880,328 | |||||||||
Galp Energia SGPS SA | 14,212 | 137,699 | |||||||||
GS Holdings Corp.* | 764 | 25,129 | |||||||||
Imperial Oil Ltd. | 2,531 | 91,410 | |||||||||
Inpex Corp. | 18,000 | 156,624 | |||||||||
Koninklijke Vopak NV | 687 | 24,063 | |||||||||
Lundin Energy AB | 3,523 | 126,268 | |||||||||
Neste Oyj | 6,478 | 319,424 | |||||||||
Novatek PJSC, GDR | 585 | 137,007 | |||||||||
Parex Resources, Inc. | 1,344 | 22,993 | |||||||||
Parkland Corp./Canada | 4,192 | 115,391 | |||||||||
Pembina Pipeline Corp. | 7,850 | 238,455 | |||||||||
PetroChina Co. Ltd., Class A | 155,100 | 119,488 | |||||||||
PetroChina Co. Ltd., Class H | 362,000 | 161,120 | |||||||||
Petroleo Brasileiro SA | 22,563 | 124,360 | |||||||||
Petronas Dagangan BHD | 14,500 | 71,699 | |||||||||
PTT Exploration & Production PCL, NVDR | 18,400 | 64,996 | |||||||||
PTT PCL, NVDR | 146,900 | 167,107 | |||||||||
Repsol SA | 26,926 | 319,553 | |||||||||
Royal Dutch Shell PLC, Class A | 25,276 | 555,224 | |||||||||
Royal Dutch Shell PLC, Class B | 18,764 | 412,331 | |||||||||
SK Innovation Co. Ltd.* | 610 | 122,385 | |||||||||
S-Oil Corp. | 753 | 54,286 | |||||||||
Star Petroleum Refining PCL, NVDR* | 47,400 | 13,906 | |||||||||
Suncor Energy, Inc. | 1,540 | 38,587 | |||||||||
TotalEnergies SE | 9,762 | 495,453 | |||||||||
Tourmaline Oil Corp. | 8,355 | 270,133 | |||||||||
Ultrapar Participacoes SA | 30,797 | 80,393 | |||||||||
Woodside Petroleum Ltd. | 4,415 | 70,394 | |||||||||
8,251,671 | |||||||||||
PERSONAL PRODUCTS - 1.7% | |||||||||||
Kao Corp. | 2,600 | 135,899 | |||||||||
LG Household & Health Care Ltd.* | 67 | 61,829 | |||||||||
L'Oreal SA | 3,931 | 1,863,905 | |||||||||
Unilever PLC | 9,500 | 508,354 | |||||||||
Unilever PLC | 7,661 | 409,402 | |||||||||
2,979,389 | |||||||||||
| Shares/ Principal | Fair Value | ||||||||||
PHARMACEUTICALS - 4.7% | |||||||||||
Aspen Pharmacare Holdings Ltd. | 3,918 | $ | 55,097 | ||||||||
Astellas Pharma, Inc. | 9,600 | 155,936 | |||||||||
AstraZeneca PLC | 7,944 | 933,731 | |||||||||
| Asymchem Laboratories Tianjin Co. Ltd., Class A | 276 | 18,838 | |||||||||
Bayer AG | 6,543 | 349,713 | |||||||||
CanSino Biologics, Inc., Class H*,(a) | 400 | 9,245 | |||||||||
| Changchun High & New Technology Industry Group, Inc., Class A | 600 | 25,550 | |||||||||
Chugai Pharmaceutical Co. Ltd. | 5,300 | 171,903 | |||||||||
CSPC Pharmaceutical Group Ltd. | 153,040 | 166,265 | |||||||||
Daiichi Sankyo Co. Ltd. | 10,100 | 256,545 | |||||||||
Eisai Co. Ltd. | 2,400 | 136,116 | |||||||||
GlaxoSmithKline PLC | 16,304 | 354,785 | |||||||||
Hansoh Pharmaceutical Group Co. Ltd. (a) | 4,000 | 9,748 | |||||||||
Hisamitsu Pharmaceutical Co., Inc. | 500 | 17,259 | |||||||||
Merck KGaA | 421 | 108,679 | |||||||||
Novartis AG | 19,548 | 1,722,344 | |||||||||
Novo Nordisk A/S, Class B | 13,687 | 1,538,159 | |||||||||
Roche Holding AG | 3,143 | 1,309,624 | |||||||||
Sanofi | 4,034 | 406,358 | |||||||||
Sawai Group Holdings Co. Ltd. | 400 | 15,266 | |||||||||
Sino Biopharmaceutical Ltd. | 84,000 | 58,828 | |||||||||
Takeda Pharmaceutical Co. Ltd. | 5,300 | 144,380 | |||||||||
Teva Pharmaceutical Industries Ltd.* | 14,367 | 124,403 | |||||||||
Teva Pharmaceutical Industries Ltd., ADR* | 6,768 | 54,212 | |||||||||
| Zhangzhou Pientzehuang Pharmaceutical Co. Ltd., Class A | 300 | 20,577 | |||||||||
8,163,561 | |||||||||||
PROFESSIONAL SERVICES - 2.0% | |||||||||||
Adecco Group AG | 2,485 | 127,093 | |||||||||
Experian PLC | 9,417 | 463,256 | |||||||||
Intertek Group PLC | 776 | 59,174 | |||||||||
Nihon M&A Center Holdings, Inc. | 3,200 | 78,392 | |||||||||
Randstad NV | 5,425 | 370,405 | |||||||||
Recruit Holdings Co. Ltd. | 10,600 | 641,772 | |||||||||
RELX PLC | 20,949 | 681,553 | |||||||||
SGS SA | 6 | 20,065 | |||||||||
Stantec, Inc. | 622 | 34,996 | |||||||||
Teleperformance | 483 | 215,313 | |||||||||
Wolters Kluwer NV | 7,206 | 848,967 | |||||||||
3,540,986 | |||||||||||
REAL ESTATE MANAGEMENT & DEVELOPMENT - 1.0% | |||||||||||
Castellum AB | 801 | 21,569 | |||||||||
China Overseas Land & Investment Ltd. | 25,000 | 59,195 | |||||||||
China Resources Land Ltd. | 12,000 | 50,485 | |||||||||
CK Asset Holdings Ltd. | 17,000 | 107,173 | |||||||||
Country Garden Services Holdings Co. Ltd. | 11,000 | 65,890 | |||||||||
Daito Trust Construction Co. Ltd. | 1,700 | 194,425 | |||||||||
FirstService Corp. | 1,473 | 289,900 | |||||||||
See accompanying notes to financial statements.
32
Global Atlantic BlackRock Disciplined International Core Portfolio
Portfolio of Investments (Continued)
December 31, 2021
| Shares/ Principal | Fair Value | ||||||||||
REAL ESTATE MANAGEMENT & DEVELOPMENT - 1.0% (Continued) | |||||||||||
Hulic Co. Ltd. | 2,800 | $ | 26,552 | ||||||||
Hysan Development Co. Ltd. | 9,000 | 27,821 | |||||||||
IWG PLC* | 9,543 | 37,613 | |||||||||
KE Holdings, Inc., ADR* | 4,688 | 94,323 | |||||||||
Kerry Properties Ltd. | 56,000 | 145,813 | |||||||||
KWG Group Holdings Ltd. | 15,500 | 10,139 | |||||||||
Logan Group Co. Ltd. | 26,000 | 19,876 | |||||||||
Longfor Group Holdings Ltd. (a) | 2,500 | 11,768 | |||||||||
Mitsubishi Estate Co. Ltd. | 1,400 | 19,385 | |||||||||
New World Development Co. Ltd. | 5,000 | 19,785 | |||||||||
Poly Property Services Co. Ltd., Class H | 3,000 | 23,588 | |||||||||
PSP Swiss Property AG | 174 | 21,713 | |||||||||
Relo Group, Inc. | 1,500 | 27,081 | |||||||||
Sagax AB, Class B | 426 | 14,351 | |||||||||
Samhallsbyggnadsbolaget i Norden AB | 3,441 | 25,244 | |||||||||
Seazen Group Ltd.* | 20,000 | 13,519 | |||||||||
Sino Land Co. Ltd. | 14,000 | 17,436 | |||||||||
SM Prime Holdings, Inc. | 21,800 | 14,493 | |||||||||
Sun Hung Kai Properties Ltd. | 4,500 | 54,603 | |||||||||
Sunac China Holdings Ltd. | 35,000 | 52,884 | |||||||||
Swire Pacific Ltd., Class A | 3,500 | 19,910 | |||||||||
Swire Properties Ltd. | 102,200 | 256,146 | |||||||||
Wharf Holdings Ltd. (The) | 5,000 | 15,360 | |||||||||
Wharf Real Estate Investment Co. Ltd. | 12,000 | 60,952 | |||||||||
1,818,992 | |||||||||||
ROAD & RAIL - 0.6% | |||||||||||
ALD SA (a) | 967 | 14,230 | |||||||||
Aurizon Holdings Ltd. | 79,116 | 200,749 | |||||||||
Canadian National Railway Co. | 1,323 | 162,742 | |||||||||
Canadian Pacific Railway Ltd. | 2,575 | 185,468 | |||||||||
CJ Logistics Corp.* | 69 | 7,313 | |||||||||
Localiza Rent a Car SA | 8,415 | 80,071 | |||||||||
MTR Corp. Ltd. | 27,000 | 144,934 | |||||||||
TFI International, Inc. | 2,088 | 234,513 | |||||||||
1,030,020 | |||||||||||
| SEMICONDUCTORS & SEMICONDUCTOR EQUIPMENT - 3.1% | |||||||||||
Advantest Corp. | 3,500 | 331,293 | |||||||||
ASM Pacific Technology Ltd. | 2,600 | 28,097 | |||||||||
| ASML Holding NV | 3,212 | 2,581,353 | |||||||||
Daqo New Energy Corp., ADR* | 586 | 23,627 | |||||||||
Disco Corp. | 800 | 244,193 | |||||||||
JCET Group Co., Ltd., Class A | 5,656 | 27,528 | |||||||||
Lasertec Corp. | 100 | 30,646 | |||||||||
Nordic Semiconductor ASA* | 778 | 26,256 | |||||||||
SCREEN Holdings Co. Ltd. | 500 | 53,710 | |||||||||
SG Micro Corp., Class A | 500 | 24,242 | |||||||||
SK Hynix, Inc. | 4,081 | 449,725 | |||||||||
| Shares/ Principal | Fair Value | ||||||||||
| SEMICONDUCTORS & SEMICONDUCTOR EQUIPMENT - 3.1% (Continued) | |||||||||||
SK Square Co. Ltd.* | 1,321 | $ | 73,800 | ||||||||
Tokyo Electron Ltd. | 2,200 | 1,266,258 | |||||||||
Tokyo Seimitsu Co. Ltd. | 2,000 | 88,576 | |||||||||
Tower Semiconductor Ltd.* | 1,206 | 47,854 | |||||||||
| Unigroup Guoxin Microelectronics Co. Ltd., Class A | 800 | 28,243 | |||||||||
Xinyi Solar Holdings Ltd. | 12,000 | 20,348 | |||||||||
5,345,749 | |||||||||||
SOFTWARE - 2.4% | |||||||||||
Constellation Software, Inc. | 72 | 133,776 | |||||||||
Dassault Systemes SE | 9,057 | 538,773 | |||||||||
Descartes Systems Group, Inc. (The)* | 319 | 26,421 | |||||||||
| Kingdee International Software Group Co. Ltd.* | 25,000 | 76,960 | |||||||||
Micro Focus International PLC | 15 | 85 | |||||||||
Nemetschek SE | 1,233 | 158,165 | |||||||||
Nice Ltd.* | 1,048 | 320,454 | |||||||||
Open Text Corp. | 2,669 | 126,863 | |||||||||
Oracle Corp. Japan | 600 | 45,539 | |||||||||
Rakus Co. Ltd. | 1,600 | 43,072 | |||||||||
Sangfor Technologies, Inc., Class A | 500 | 14,984 | |||||||||
SAP SE | 14,724 | 2,091,342 | |||||||||
SimCorp. A/S | 498 | 54,428 | |||||||||
Temenos AG | 816 | 112,887 | |||||||||
TOTVS SA | 4,800 | 24,681 | |||||||||
Trend Micro, Inc./Japan | 3,400 | 188,667 | |||||||||
WiseTech Global Ltd. | 2,065 | 87,950 | |||||||||
Xero Ltd.* | 1,726 | 177,491 | |||||||||
4,222,538 | |||||||||||
SPECIALTY RETAIL - 0.8% | |||||||||||
Fast Retailing Co. Ltd. | 300 | 170,145 | |||||||||
Fielmann AG | 796 | 53,543 | |||||||||
Foschini Group Ltd. (The)* | 1,691 | 13,127 | |||||||||
Hikari Tsushin, Inc. | 700 | 107,655 | |||||||||
Industria de Diseno Textil SA | 17,085 | 554,311 | |||||||||
JB Hi-Fi Ltd. | 5,079 | 178,431 | |||||||||
JD Sports Fashion PLC | 51,490 | 151,895 | |||||||||
Pepkor Holdings Ltd.*,(a) | 15,484 | 21,237 | |||||||||
Shimamura Co. Ltd. | 200 | 16,777 | |||||||||
WH Smith PLC* | 1,880 | 37,686 | |||||||||
Yamada Holdings Co. Ltd. | 46,400 | 158,354 | |||||||||
1,463,161 | |||||||||||
| TECHNOLOGY HARDWARE, STORAGE & PERIPHERALS - 1.8% | |||||||||||
Canon, Inc. | 11,200 | 272,426 | |||||||||
FUJIFILM Holdings Corp. | 2,500 | 185,098 | |||||||||
Konica Minolta, Inc. | 10,100 | 45,959 | |||||||||
Lenovo Group Ltd. | 120,000 | 137,911 | |||||||||
See accompanying notes to financial statements.
33
Global Atlantic BlackRock Disciplined International Core Portfolio
Portfolio of Investments (Continued)
December 31, 2021
| Shares/ Principal | Fair Value | ||||||||||
| TECHNOLOGY HARDWARE, STORAGE & PERIPHERALS - 1.8% (Continued) | |||||||||||
Ricoh Co. Ltd. | 5,200 | $ | 48,363 | ||||||||
Samsung Electronics Co. Ltd. | 33,658 | 2,216,969 | |||||||||
Seiko Epson Corp. | 900 | 16,186 | |||||||||
Xiaomi Corp., Class B*,(a) | 88,400 | 214,302 | |||||||||
3,137,214 | |||||||||||
TEXTILES, APPAREL & LUXURY GOODS - 2.3% | |||||||||||
ANTA Sports Products Ltd. | 9,800 | 146,944 | |||||||||
Burberry Group PLC | 6,828 | 168,086 | |||||||||
Cie Financiere Richemont SA, Class A | 5,093 | 765,501 | |||||||||
Gildan Activewear, Inc. | 900 | 38,212 | |||||||||
Hermes International | 437 | 763,325 | |||||||||
HUGO BOSS AG | 473 | 28,778 | |||||||||
Kering SA | 1,012 | 813,533 | |||||||||
Li Ning Co. Ltd. | 17,500 | 191,581 | |||||||||
LVMH Moet Hennessy Louis Vuitton SE | 1,096 | 906,112 | |||||||||
Moncler SpA | 650 | 47,322 | |||||||||
PRADA SpA | 2,200 | 14,081 | |||||||||
Shenzhou International Group Holdings Ltd. | 1,300 | 24,995 | |||||||||
Swatch Group AG (The) | 329 | 100,742 | |||||||||
Xtep International Holdings Ltd. | 22,000 | 36,684 | |||||||||
4,045,896 | |||||||||||
TOBACCO - 1.7% | |||||||||||
British American Tobacco PLC | 30,312 | 1,122,268 | |||||||||
Gudang Garam TBK PT | 6,500 | 13,956 | |||||||||
Imperial Brands PLC | 8,606 | 188,426 | |||||||||
Japan Tobacco, Inc. | 50,000 | 1,008,423 | |||||||||
Swedish Match AB | 82,163 | 653,576 | |||||||||
2,986,649 | |||||||||||
TRADING COMPANIES & DISTRIBUTORS - 1.7% | |||||||||||
Ashtead Group PLC | 10,651 | 857,208 | |||||||||
Ferguson PLC | 1,561 | 277,078 | |||||||||
Finning International, Inc. | 809 | 20,418 | |||||||||
IMCD NV | 1,373 | 304,000 | |||||||||
ITOCHU Corp. | 14,200 | 433,812 | |||||||||
Marubeni Corp. | 24,000 | 233,320 | |||||||||
Mitsubishi Corp. | 4,400 | 139,541 | |||||||||
Mitsui & Co. Ltd. | 500 | 11,825 | |||||||||
MonotaRO Co. Ltd. | 1,500 | 27,003 | |||||||||
Rexel SA* | 4,470 | 90,635 | |||||||||
Sojitz Corp. | 2,920 | 43,817 | |||||||||
Sumitomo Corp. | 31,100 | 459,255 | |||||||||
2,897,912 | |||||||||||
TRANSPORTATION INFRASTRUCTURE - 0.1% | |||||||||||
Atlas Arteria Ltd. | 4,123 | 20,743 | |||||||||
| Fraport AG Frankfurt Airport Services Worldwide* | 1,458 | 98,123 | |||||||||
| Shares/ Principal | Fair Value | ||||||||||
TRANSPORTATION INFRASTRUCTURE - 0.1% (Continued) | |||||||||||
| Grupo Aeroportuario del Centro Norte SAB de CV | 1,800 | $ | 12,103 | ||||||||
| Grupo Aeroportuario del Pacifico SAB de CV, Class B* | 2,161 | 29,860 | |||||||||
Kamigumi Co. Ltd. | 1,100 | 20,805 | |||||||||
181,634 | |||||||||||
WATER UTILITIES - 0.0%† | |||||||||||
| Cia de Saneamento de Minas Gerais-COPASA | 6,708 | 15,307 | |||||||||
WIRELESS TELECOMMUNICATION SERVICES - 0.9% | |||||||||||
| 1&1 AG | 503 | 13,740 | |||||||||
America Movil SAB de CV, Series L | 21,974 | 23,279 | |||||||||
Freenet AG | 4,551 | 120,431 | |||||||||
KDDI Corp. | 12,800 | 373,702 | |||||||||
Mobile TeleSystems PJSC, ADR | 3,291 | 26,163 | |||||||||
MTN Group Ltd.* | 10,247 | 109,603 | |||||||||
SK Telecom Co. Ltd. | 2,043 | 99,508 | |||||||||
SoftBank Corp. | 18,400 | 232,407 | |||||||||
SoftBank Group Corp. | 7,700 | 363,352 | |||||||||
Tele2 AB, Class B | 9,023 | 128,660 | |||||||||
Vodacom Group Ltd. | 2,599 | 21,922 | |||||||||
Vodafone Group PLC | 30,951 | 47,061 | |||||||||
1,559,828 | |||||||||||
| TOTAL COMMON STOCKS (Cost - $137,074,819) | 155,172,708 | ||||||||||
EXCHANGE TRADED FUNDS - 7.9% | |||||||||||
EQUITY FUNDS - 7.9% | |||||||||||
iShares MSCI India ETF | 131,304 | 6,018,975 | |||||||||
iShares MSCI Taiwan ETF | 112,725 | 7,508,612 | |||||||||
iShares MSCI Turkey ETF | 10,255 | 190,538 | |||||||||
| TOTAL EXCHANGE TRADED FUNDS (Cost - $9,385,423) | 13,718,125 | ||||||||||
PREFERRED STOCKS - 0.8% | |||||||||||
AIRLINES - 0.1% | |||||||||||
Azul SA* | 15,995 | 69,953 | |||||||||
Gol Linhas Aereas Inteligentes SA* | 9,948 | 30,415 | |||||||||
100,368 | |||||||||||
AUTOMOBILES - 0.1% | |||||||||||
Bayerische Motoren Werke AG | 161 | 13,421 | |||||||||
Volkswagen AG | 818 | 165,097 | |||||||||
178,518 | |||||||||||
BANKS - 0.3% | |||||||||||
Banco Bradesco SA | 81,415 | 280,787 | |||||||||
Bancolombia SA | 1,950 | 15,332 | |||||||||
Itau Unibanco Holding SA | 44,495 | 167,355 | |||||||||
463,474 | |||||||||||
See accompanying notes to financial statements.
34
Global Atlantic BlackRock Disciplined International Core Portfolio
Portfolio of Investments (Continued)
December 31, 2021
| Shares/ Principal | Fair Value | ||||||||||
HEALTH CARE EQUIPMENT & SUPPLIES - 0.2% | |||||||||||
Sartorius AG | 439 | $ | 297,142 | ||||||||
HOUSEHOLD PRODUCTS - 0.0%† | |||||||||||
Henkel AG & Co. KGaA | 431 | 34,868 | |||||||||
INTERNET & DIRECT MARKETING RETAIL - 0.0%† | |||||||||||
Lojas Americanas SA | 25,527 | 26,993 | |||||||||
METALS & MINING - 0.0%† | |||||||||||
Gerdau SA | 3,563 | 17,438 | |||||||||
OIL, GAS & CONSUMABLE FUELS - 0.0%† | |||||||||||
Petroleo Brasileiro SA | 19,157 | 97,849 | |||||||||
| TECHNOLOGY HARDWARE, STORAGE & PERIPHERALS - 0.1% | |||||||||||
Samsung Electronics Co. Ltd. | 3,956 | 236,944 | |||||||||
| TOTAL PREFERRED STOCKS (Cost - $1,594,989) | 1,453,594 | ||||||||||
RIGHTS - 0.0%† | |||||||||||
| Seazen Group Ltd., expires 1/19/22* (Cost - $0) | 952 | 0 | |||||||||
| Shares/ Principal | Fair Value | ||||||||||
SHORT-TERM INVESTMENTS - 1.7% | |||||||||||
MONEY MARKET FUNDS - 1.7% | |||||||||||
| Fidelity Investments Money Market Fund - Government Portfolio, Institutional Class, 0.01% (b) (Cost - $2,915,273) | 2,915,273 | $ | 2,915,273 | ||||||||
| TOTAL INVESTMENTS - 99.3% (Cost - $150,970,504) | $ | 173,259,700 | |||||||||
| OTHER ASSETS LESS LIABILITIES - NET 0.7% | 1,225,209 | ||||||||||
TOTAL NET ASSETS - 100.0% | $ | 174,484,909 | |||||||||
* Non-income producing security.
† Represents less than 0.05%.
(a) 144A - Security was purchased pursuant to Rule 144a under the Securities Act of 1933 and may not be resold subject to that rule, except to qualified institutional buyers. As of December 31, 2021, these securities amounted to $4,220,124 or 2.4% of net assets.
(b) The rate shown is the annualized seven-day yield at period end.
ADR - American Depositary Receipt
CVA - Certificate Van Aandelen (Bearer)
GDR - Global Depositary Receipt
NVDR - Non-Voting Depositary Receipt
PLC - Public Limited Company
REIT - Real Estate Investment Trust
FUTURES CONTRACTS | |||||||||||||||||||||||
LONG FUTURES CONTRACTS | Counterparty | Number of Contracts | Expiration Date | Notional Value | Fair Value/ Unrealized Appreciation (Depreciation) | ||||||||||||||||||
MSCI EAFE Future | Goldman Sachs & Co. | 19 | 3/18/2022 | $ | 2,205,710 | $ | 45,552 | ||||||||||||||||
MSCI Emerging Market Index Future | Goldman Sachs & Co. | 15 | 3/18/2022 | 919,725 | 5,741 | ||||||||||||||||||
S&P/TSX 60 Index Future | Goldman Sachs & Co. | 1 | 3/17/2022 | 202,810 | 3,466 | ||||||||||||||||||
TOTAL NET UNREALIZED APPRECIATION ON FUTURES CONTRACTS | $ | 54,759 | |||||||||||||||||||||
See accompanying notes to financial statements.
35
Global Atlantic BlackRock Disciplined Mid Cap Growth Portfolio
Portfolio Review
December 31, 2021 (Unaudited)
Investment Objective
The Portfolio seeks to provide long-term capital appreciation.
Management Review
The Portfolio is sub-advised by BlackRock Investment Management, LLC ("BlackRock").
How did the Portfolio perform during the period?
During 2021, the Class I shares of Global Atlantic BlackRock Disciplined Mid Cap Growth Portfolio outperformed its reference benchmark, the Russell Midcap® Growth Index. The Portfolio posted a return of 14.29% compared to a benchmark return of 12.73%, a difference of 156 basis points. The following discussion of relative performance pertains to this benchmark.
What factors and allocation decisions influenced the Portfolio's performance?
BlackRock's Scientific Active Equity ("SAE") process systematically tracks and ranks the characteristics of companies in order to seek to construct a portfolio that has the best trade-off between returns, risk and costs. The SAE investment model groups the universe of securities based on an analysis of a wide range of factors, such as relative value ("Value"), earnings quality ("Quality"), market sentiment ("Sentiment"), and thematic insights. Value insights seek to incorporate, where appropriate, asset value, sales, earnings and cash flow forecasts over short and long periods. Quality measures aim to assess the sustainability of earnings and the quality of corporate management by investigating company financials as well as other company statements. Sentiment criteria seek to infer information about a company's value from changes in analysts' forecasts, linkages between companies, management decisions and the behavior of other market participants in equities and other securities markets. And lastly, thematic insights seek to identify and exploit commonalities among groups of stocks that are believed to drive prices but that currently appear to be less obvious to the market.
The Portfolio performed well amid the changeable market backdrop, with outperformance primarily driven by the Portfolio's Sentiment and fundamental measures. Within Sentiment insights, trend-based measures drove gains as these were able to correctly position the portfolio around the volatile market backdrop that included several market style preference shifts and rising rates. Capturing Sentiment from market participants, such as identifying bond investor views as well as text analyses across executive commentaries was additive.
Nontraditional measures of quality, such as environmental, social, and governance ("ESG") related insights, were mixed in the period. Insights designed to capture investor flows into preferred ESG positions were top contributors, benefitting from the broader sustainability market trend. However, other risk mitigation related ESG insights that track company controversies and tax levels struggled. This measure penalizes companies that pay lower levels of taxes versus peers, typically growth-oriented technology companies, and favors those with higher relative tax levels. The signal struggled to keep up amid the preference shift to growth styles. Macro thematic related measures that look toward vaccine utilization and job hiring trends motivated an overweight to life sciences companies, which contributed to performance.
How was the Portfolio positioned at period end?
From a sector positioning perspective, the Portfolio remained largely sector neutral at the end of the period. The Portfolio had slight overweight positions in the information technology and industrials sectors and slight underweight positions in the consumer discretionary and materials sectors at the end of the year. The SAE team seeks to maintain a style neutral approach, so the Portfolio did not have any outsized active exposures to any particular style or factor.
36
Global Atlantic BlackRock Disciplined Mid Cap Growth Portfolio
Portfolio Review (Continued)
December 31, 2021 (Unaudited)
The Portfolio's performance figures for the periods ended December 31, 2021 as compared to its benchmark:
Annualized | Operating Expense** | ||||||||||||||||||||||
| Inception Date* | One Year | Since Inception | Gross Ratio | Net Ratio | |||||||||||||||||||
Global Atlantic BlackRock Disciplined Mid Cap Growth Portfolio | |||||||||||||||||||||||
Class I | November 1, 2017 | 14.29 | % | 19.18 | % | 0.67 | % | 0.65 | % | ||||||||||||||
Class II | November 1, 2017 | 13.96 | % | 18.89 | % | 0.92 | % | 0.90 | % | ||||||||||||||
Russell Midcap® Growth Index^ | 12.73 | % | 18.89 | % | |||||||||||||||||||
The performance data quoted is historical. Past performance is no guarantee of future results. Current performance may be higher or lower than the performance data quoted. The principal value and investment return of an investment will fluctuate so that your shares, when redeemed, may be worth more or less than their original cost. Total returns would have been lower absent fee waivers by the Adviser. Performance figures for periods greater than one year are annualized. The returns shown do not reflect the deduction of taxes that a shareholder may pay on Portfolio distributions or on the redemption of Portfolio shares, as well as other charges and expenses of the insurance contract or separate account.
* Commencement of operations is November 6, 2017.
** The estimated operating expense ratios for Class I and Class II shares, as disclosed in the most recent prospectus dated May 1, 2021. Ratios include Acquired Fund Fees and Expenses indirectly incurred by the Portfolio. The operating expense ratios presented here may differ from the expense ratios disclosed in the Financial Highlights table in this report.
^ The Russell Midcap® Growth Index (Total Return) is an unmanaged index that consists of the bottom 800 securities of the Russell 1000® Index with greater-than-average growth orientation as ranked by total market capitalization. It is not possible to invest directly in an index.
Comparison of the Change in Value of a $10,000 Investment

37
Global Atlantic BlackRock Disciplined Mid Cap Growth Portfolio
Portfolio Review (Continued)
December 31, 2021 (Unaudited)
Holdings by Asset Class | % of Net Assets | ||||||
Common Stocks | 98.5 | % | |||||
Short-Term Investments | 1.5 | % | |||||
Rights | 0.0 | %^ | |||||
Warrants | 0.0 | %^ | |||||
Other Assets less Liabilities - Net | (0.0 | )%^ | |||||
100.0 | % | ||||||
Please refer to the Portfolio of Investments in this annual report for more information regarding the Portfolio's holdings as of December 31, 2021.
Derivative exposure is included in "Other Assets Less Liabilities - Net".
^ Represents less than 0.05%.
38
Global Atlantic BlackRock Disciplined Mid Cap Growth Portfolio
Portfolio of Investments
December 31, 2021
| Shares/ Principal | Fair Value | ||||||||||
COMMON STOCKS - 98.5% | |||||||||||
AEROSPACE & DEFENSE - 0.8% | |||||||||||
Axon Enterprise, Inc.* | 9,501 | $ | 1,491,657 | ||||||||
BWX Technologies, Inc. | 9,699 | 464,388 | |||||||||
HEICO Corp., Class A | 7,084 | 910,436 | |||||||||
Virgin Galactic Holdings, Inc.* | 4,833 | 64,665 | |||||||||
2,931,146 | |||||||||||
AIR FREIGHT & LOGISTICS - 1.4% | |||||||||||
C.H. Robinson Worldwide, Inc. | 23,926 | 2,575,155 | |||||||||
Expeditors International of Washington, Inc. | 19,561 | 2,626,847 | |||||||||
5,202,002 | |||||||||||
AIRLINES - 0.4% | |||||||||||
Alaska Air Group, Inc.* | 3,376 | 175,890 | |||||||||
Delta Air Lines, Inc.* | 30,607 | 1,196,121 | |||||||||
1,372,011 | |||||||||||
AUTO COMPONENTS - 0.5% | |||||||||||
BorgWarner, Inc. | 36,140 | 1,628,830 | |||||||||
QuantumScape Corp.* | 10,360 | 229,888 | |||||||||
1,858,718 | |||||||||||
AUTOMOBILES - 0.1% | |||||||||||
Rivian Automotive, Inc., Class A* | 5,332 | 552,875 | |||||||||
BANKS - 0.4% | |||||||||||
First Republic Bank | 1,405 | 290,146 | |||||||||
Mid Penn Bancorp., Inc. | 5 | 159 | |||||||||
Western Alliance Bancorp | 10,426 | 1,122,359 | |||||||||
1,412,664 | |||||||||||
BEVERAGES - 0.0%† | |||||||||||
Brown-Forman Corp., Class B | 2,457 | 179,017 | |||||||||
BIOTECHNOLOGY - 2.0% | |||||||||||
Alnylam Pharmaceuticals, Inc.* | 7,803 | 1,323,233 | |||||||||
Exact Sciences Corp.* | 9,208 | 716,659 | |||||||||
Exelixis, Inc.* | 36,922 | 674,934 | |||||||||
Incyte Corp.* | 22,790 | 1,672,786 | |||||||||
Ionis Pharmaceuticals, Inc.* | 7,309 | 222,413 | |||||||||
Natera, Inc.* | 3,480 | 324,997 | |||||||||
Novavax, Inc.* | 5,078 | 726,509 | |||||||||
Sarepta Therapeutics, Inc.* | 3,951 | 355,788 | |||||||||
Seagen, Inc.* | 6,873 | 1,062,566 | |||||||||
Ultragenyx Pharmaceutical, Inc.* | 2,345 | 197,191 | |||||||||
Verve Therapeutics, Inc.* | 568 | 20,942 | |||||||||
7,298,018 | |||||||||||
BUILDING PRODUCTS - 2.3% | |||||||||||
Allegion PLC | 15,363 | 2,034,676 | |||||||||
Builders FirstSource, Inc.* | 1,508 | 129,251 | |||||||||
Fortune Brands Home & Security, Inc. | 12,218 | 1,306,104 | |||||||||
Lennox International, Inc. | 593 | 192,345 | |||||||||
Masco Corp. | 626 | 43,958 | |||||||||
| Shares/ Principal | Fair Value | ||||||||||
BUILDING PRODUCTS - 2.3% (Continued) | |||||||||||
Owens Corning | 582 | $ | 52,671 | ||||||||
Trane Technologies PLC | 18,470 | 3,731,494 | |||||||||
Trex Co., Inc.* | 5,376 | 725,921 | |||||||||
8,216,420 | |||||||||||
CAPITAL MARKETS - 2.6% | |||||||||||
Ameriprise Financial, Inc. | 1,039 | 313,425 | |||||||||
Ares Management Corp., Class A | 1,241 | 100,856 | |||||||||
FactSet Research Systems, Inc. | 5,555 | 2,699,786 | |||||||||
MarketAxess Holdings, Inc. | 1,339 | 550,691 | |||||||||
Morningstar, Inc. | 1,062 | 363,193 | |||||||||
MSCI, Inc. | 4,183 | 2,562,882 | |||||||||
Raymond James Financial, Inc. | 862 | 86,545 | |||||||||
S&P Global, Inc. | 281 | 132,612 | |||||||||
Stifel Financial Corp. | 9,057 | 637,794 | |||||||||
T Rowe Price Group, Inc. | 8,988 | 1,767,400 | |||||||||
9,215,184 | |||||||||||
CHEMICALS - 0.2% | |||||||||||
Amyris, Inc.* | 11,279 | 61,019 | |||||||||
Ecolab, Inc. | 2,392 | 561,139 | |||||||||
PPG Industries, Inc. | 1,690 | 291,424 | |||||||||
913,582 | |||||||||||
COMMERCIAL SERVICES & SUPPLIES - 1.1% | |||||||||||
Cintas Corp. | 4,131 | 1,830,735 | |||||||||
Copart, Inc.* | 1,741 | 263,971 | |||||||||
IAA, Inc.* | 31,976 | 1,618,625 | |||||||||
Rollins, Inc. | 4,887 | 167,184 | |||||||||
3,880,515 | |||||||||||
COMMUNICATIONS EQUIPMENT - 0.5% | |||||||||||
Arista Networks, Inc.* | 7,975 | 1,146,406 | |||||||||
CommScope Holding Co., Inc.* | 7,727 | 85,306 | |||||||||
Juniper Networks, Inc. | 11,592 | 413,951 | |||||||||
1,645,663 | |||||||||||
CONSUMER FINANCE - 0.4% | |||||||||||
Ally Financial, Inc. | 20,990 | 999,334 | |||||||||
Upstart Holdings, Inc.* | 4,124 | 623,961 | |||||||||
1,623,295 | |||||||||||
CONTAINERS & PACKAGING - 0.6% | |||||||||||
Avery Dennison Corp. | 9,854 | 2,134,081 | |||||||||
Sealed Air Corp. | 748 | 50,467 | |||||||||
2,184,548 | |||||||||||
DISTRIBUTORS - 0.5% | |||||||||||
Pool Corp. | 3,470 | 1,964,020 | |||||||||
DIVERSIFIED CONSUMER SERVICES - 0.9% | |||||||||||
2U, Inc.* | 2,255 | 45,258 | |||||||||
Bright Horizons Family Solutions, Inc.* | 6,079 | 765,225 | |||||||||
Chegg, Inc.* | 20,016 | 614,491 | |||||||||
See accompanying notes to financial statements.
39
Global Atlantic BlackRock Disciplined Mid Cap Growth Portfolio
Portfolio of Investments (Continued)
December 31, 2021
| Shares/ Principal | Fair Value | ||||||||||
DIVERSIFIED CONSUMER SERVICES - 0.9% (Continued) | |||||||||||
H&R Block, Inc. | 66,106 | $ | 1,557,457 | ||||||||
Service Corp. International | 3,543 | 251,518 | |||||||||
3,233,949 | |||||||||||
DIVERSIFIED FINANCIAL SERVICES - 1.0% | |||||||||||
Apollo Global Management, Inc., Class A | 28,546 | 2,067,587 | |||||||||
Voya Financial, Inc. | 23,936 | 1,587,196 | |||||||||
3,654,783 | |||||||||||
ELECTRIC UTILITIES - 0.0%† | |||||||||||
OGE Energy Corp. | 2,623 | 100,671 | |||||||||
ELECTRICAL EQUIPMENT - 1.6% | |||||||||||
Generac Holdings, Inc.* | 4,931 | 1,735,317 | |||||||||
Plug Power, Inc.* | 33,098 | 934,357 | |||||||||
Regal Rexnord Corp. | 2,605 | 443,319 | |||||||||
Rockwell Automation, Inc. | 7,401 | 2,581,839 | |||||||||
5,694,832 | |||||||||||
ELECTRONIC EQUIPMENT, INSTRUMENTS & COMPONENTS - 3.1% | |||||||||||
CDW Corp. | 1,725 | 353,246 | |||||||||
Cognex Corp. | 14,418 | 1,121,144 | |||||||||
Jabil, Inc. | 5,744 | 404,090 | |||||||||
Keysight Technologies, Inc.* | 23,732 | 4,900,895 | |||||||||
National Instruments Corp. | 886 | 38,692 | |||||||||
Vontier Corp. | 7,585 | 233,087 | |||||||||
Zebra Technologies Corp., Class A* | 6,772 | 4,030,694 | |||||||||
11,081,848 | |||||||||||
ENERGY EQUIPMENT & SERVICES - 0.1% | |||||||||||
Basic Energy Services, Inc.* | 394 | 0 | |||||||||
Halliburton Co. | 4,128 | 94,408 | |||||||||
Parker Drilling Co.* | 2 | 9 | |||||||||
Schlumberger NV | 9,377 | 280,841 | |||||||||
Valaris PLC* | 2,253 | 0 | |||||||||
375,258 | |||||||||||
ENTERTAINMENT - 2.0% | |||||||||||
Roku, Inc.* | 12,921 | 2,948,572 | |||||||||
Skillz, Inc.* | 22,976 | 170,942 | |||||||||
Spotify Technology SA* | 14,043 | 3,286,483 | |||||||||
Zynga, Inc., Class A* | 126,523 | 809,747 | |||||||||
7,215,744 | |||||||||||
EQUITY REAL ESTATE INVESTMENT - 1.7% | |||||||||||
American Homes 4 Rent, Class A | 3,590 | 156,560 | |||||||||
CubeSmart | 8,141 | 463,304 | |||||||||
Equity LifeStyle Properties, Inc. | 9,274 | 812,959 | |||||||||
Extra Space Storage, Inc. | 8,856 | 2,007,921 | |||||||||
Simon Property Group, Inc. | 16,469 | 2,631,252 | |||||||||
6,071,996 | |||||||||||
| Shares/ Principal | Fair Value | ||||||||||
FOOD PRODUCTS - 0.3% | |||||||||||
Beyond Meat, Inc.* | 1,950 | $ | 127,062 | ||||||||
Hershey Co. (The) | 5,242 | 1,014,170 | |||||||||
1,141,232 | |||||||||||
HEALTH CARE EQUIPMENT & SUPPLIES - 5.2% | |||||||||||
Align Technology, Inc.* | 280 | 184,010 | |||||||||
Dexcom, Inc.* | 10,895 | 5,850,070 | |||||||||
IDEXX Laboratories, Inc.* | 13,231 | 8,712,084 | |||||||||
Insulet Corp.* | 8,288 | 2,205,188 | |||||||||
Novocure Ltd.* | 4,584 | 344,167 | |||||||||
Penumbra, Inc.* | 3,411 | 980,049 | |||||||||
ResMed, Inc. | 617 | 160,716 | |||||||||
Tandem Diabetes Care, Inc.* | 2,888 | 434,702 | |||||||||
18,870,986 | |||||||||||
HEALTH CARE PROVIDERS & SERVICES - 0.8% | |||||||||||
Cardinal Health, Inc. | 10,334 | 532,098 | |||||||||
McKesson Corp. | 9,089 | 2,259,253 | |||||||||
Molina Healthcare, Inc.* | 758 | 241,104 | |||||||||
3,032,455 | |||||||||||
HEALTH CARE TECHNOLOGY - 1.0% | |||||||||||
Teladoc Health, Inc.* | 6,458 | 592,974 | |||||||||
Veeva Systems, Inc., Class A* | 12,300 | 3,142,404 | |||||||||
3,735,378 | |||||||||||
HOTELS, RESTAURANTS & LEISURE - 4.4% | |||||||||||
Boyd Gaming Corp.* | 5,828 | 382,142 | |||||||||
Caesars Entertainment, Inc.* | 4,834 | 452,124 | |||||||||
Chipotle Mexican Grill, Inc.* | 1,487 | 2,599,648 | |||||||||
Choice Hotels International, Inc. | 986 | 153,806 | |||||||||
Darden Restaurants, Inc. | 9,598 | 1,445,843 | |||||||||
Domino's Pizza, Inc. | 2,620 | 1,478,545 | |||||||||
DraftKings, Inc., Class A* | 32,820 | 901,565 | |||||||||
Expedia Group, Inc.* | 13,848 | 2,502,611 | |||||||||
International Game Technology PLC | 3,042 | 87,944 | |||||||||
Penn National Gaming, Inc.* | 5,961 | 309,078 | |||||||||
Sweetgreen, Inc., Class A* | 2,489 | 79,648 | |||||||||
Travel + Leisure Co. | 47,352 | 2,617,145 | |||||||||
Wendy's Co. (The) | 26,537 | 632,907 | |||||||||
Wyndham Hotels & Resorts, Inc. | 7,234 | 648,528 | |||||||||
Wynn Resorts Ltd.* | 17,346 | 1,475,104 | |||||||||
15,766,638 | |||||||||||
HOUSEHOLD DURABLES - 1.1% | |||||||||||
DR Horton, Inc. | 31,919 | 3,461,616 | |||||||||
PulteGroup, Inc. | 8,008 | 457,737 | |||||||||
Sonos, Inc.* | 1,424 | 42,435 | |||||||||
Toll Brothers, Inc. | 2,264 | 163,891 | |||||||||
4,125,679 | |||||||||||
See accompanying notes to financial statements.
40
Global Atlantic BlackRock Disciplined Mid Cap Growth Portfolio
Portfolio of Investments (Continued)
December 31, 2021
| Shares/ Principal | Fair Value | ||||||||||
HOUSEHOLD PRODUCTS - 0.6% | |||||||||||
Clorox Co. (The) | 1,516 | $ | 264,330 | ||||||||
Colgate-Palmolive Co. | 20,915 | 1,784,886 | |||||||||
2,049,216 | |||||||||||
INDEPENDENT POWER AND RENEWABLE ELECTRICITY PRODUCERS - 0.2% | |||||||||||
Brookfield Renewable Corp., Class A | 5,788 | 213,172 | |||||||||
Sunnova Energy International, Inc.* | 12,784 | 356,929 | |||||||||
570,101 | |||||||||||
INSURANCE - 0.4% | |||||||||||
Everest Re Group Ltd. | 452 | 123,812 | |||||||||
MetLife, Inc. | 19,936 | 1,245,800 | |||||||||
1,369,612 | |||||||||||
INTERACTIVE MEDIA & SERVICES - 1.1% | |||||||||||
Match Group, Inc.* | 16,374 | 2,165,462 | |||||||||
Pinterest, Inc., Class A* | 36,923 | 1,342,151 | |||||||||
Twitter, Inc.* | 11,205 | 484,280 | |||||||||
3,991,893 | |||||||||||
INTERNET & DIRECT MARKETING RETAIL - 1.4% | |||||||||||
DoorDash, Inc., Class A* | 10,900 | 1,623,010 | |||||||||
Etsy, Inc.* | 11,458 | 2,508,614 | |||||||||
Stitch Fix, Inc., Class A* | 3,968 | 75,075 | |||||||||
Wayfair, Inc., Class A* | 3,803 | 722,456 | |||||||||
4,929,155 | |||||||||||
IT SERVICES - 7.2% | |||||||||||
Broadridge Financial Solutions, Inc. | 11,304 | �� | 2,066,597 | ||||||||
Cloudflare, Inc., Class A* | 21,484 | 2,825,146 | |||||||||
EPAM Systems, Inc.* | 5,174 | 3,458,560 | |||||||||
Euronet Worldwide, Inc.* | 2,577 | 307,101 | |||||||||
Fidelity National Information Services, Inc. | 8,549 | 933,123 | |||||||||
Gartner, Inc.* | 7,185 | 2,402,089 | |||||||||
Genpact Ltd. | 12,847 | 681,919 | |||||||||
Global Payments, Inc. | 1,369 | 185,062 | |||||||||
Globant SA* | 2,591 | 813,807 | |||||||||
GoDaddy, Inc., Class A* | 4,471 | 379,409 | |||||||||
Marqeta, Inc., Class A* | 1,742 | 29,910 | |||||||||
MongoDB, Inc.* | 5,012 | 2,653,102 | |||||||||
Okta, Inc.* | 16,314 | 3,657,109 | |||||||||
Paychex, Inc. | 15,986 | 2,182,089 | |||||||||
Shift4 Payments, Inc., Class A* | 1,660 | 96,164 | |||||||||
StoneCo Ltd., Class A* | 27,601 | 465,353 | |||||||||
Visa, Inc., Class A | 8,223 | 1,782,006 | |||||||||
Western Union Co. (The) | 16,422 | 292,969 | |||||||||
Wix.com Ltd.* | 4,221 | 666,032 | |||||||||
25,877,547 | |||||||||||
| Shares/ Principal | Fair Value | ||||||||||
LEISURE PRODUCTS - 0.4% | |||||||||||
Peloton Interactive, Inc., Class A* | 27,335 | $ | 977,500 | ||||||||
YETI Holdings, Inc.* | 7,183 | 594,968 | |||||||||
1,572,468 | |||||||||||
LIFE SCIENCES TOOLS & SERVICES - 7.3% | |||||||||||
10X Genomics, Inc., Class A* | 2,557 | 380,891 | |||||||||
Adaptive Biotechnologies Corp.* | 4,516 | 126,719 | |||||||||
Agilent Technologies, Inc. | 47,774 | 7,627,119 | |||||||||
Avantor, Inc.* | 70,729 | 2,980,520 | |||||||||
Bio-Techne Corp. | 979 | 506,476 | |||||||||
Bruker Corp. | 24,879 | 2,087,597 | |||||||||
| Charles River Laboratories International, Inc.* | 282 | 106,252 | |||||||||
Maravai LifeSciences Holdings, Inc., Class A* | 7,074 | 296,401 | |||||||||
Mettler-Toledo International, Inc.* | 2,607 | 4,424,626 | |||||||||
Repligen Corp.* | 5,462 | 1,446,556 | |||||||||
Sotera Health Co.* | 6,160 | 145,068 | |||||||||
Syneos Health, Inc.* | 5,961 | 612,075 | |||||||||
Waters Corp.* | 4,746 | 1,768,360 | |||||||||
West Pharmaceutical Services, Inc. | 7,938 | 3,723,001 | |||||||||
26,231,661 | |||||||||||
MACHINERY - 0.9% | |||||||||||
AGCO Corp. | 1,937 | 224,731 | |||||||||
Allison Transmission Holdings, Inc. | 1,054 | 38,313 | |||||||||
Briggs & Stratton Corp.* | 1,081 | 0 | |||||||||
Fortive Corp. | 1,377 | 105,051 | |||||||||
Graco, Inc. | 7,936 | 639,800 | |||||||||
Illinois Tool Works, Inc. | 4,415 | 1,089,622 | |||||||||
Otis Worldwide Corp. | 12,464 | 1,085,241 | |||||||||
Snap-on, Inc. | 609 | 131,166 | |||||||||
3,313,924 | |||||||||||
MEDIA - 0.4% | |||||||||||
Altice USA, Inc., Class A* | 30,482 | 493,199 | |||||||||
Nexstar Media Group, Inc., Class A | 6,726 | 1,015,491 | |||||||||
1,508,690 | |||||||||||
METALS & MINING - 0.0%† | |||||||||||
Steel Dynamics, Inc. | 1,754 | 108,871 | |||||||||
MULTILINE RETAIL - 0.3% | |||||||||||
Nordstrom, Inc.* | 42,759 | 967,209 | |||||||||
OIL, GAS & CONSUMABLE FUELS - 1.6% | |||||||||||
Cheniere Energy, Inc. | 20,710 | 2,100,408 | |||||||||
Continental Resources, Inc. | 3,276 | 146,634 | |||||||||
Diamondback Energy, Inc. | 10,507 | 1,133,180 | |||||||||
EOG Resources, Inc. | 10,087 | 896,028 | |||||||||
Pioneer Natural Resources Co. | 3,693 | 671,683 | |||||||||
Texas Pacific Land Corp. | 550 | 686,878 | |||||||||
5,634,811 | |||||||||||
See accompanying notes to financial statements.
41
Global Atlantic BlackRock Disciplined Mid Cap Growth Portfolio
Portfolio of Investments (Continued)
December 31, 2021
| Shares/ Principal | Fair Value | ||||||||||
PAPER & FOREST PRODUCTS - 0.1% | |||||||||||
Louisiana-Pacific Corp. | 2,811 | $ | 220,242 | ||||||||
PERSONAL PRODUCTS - 0.5% | |||||||||||
Estee Lauder Cos, Inc. (The), Class A | 4,565 | 1,689,963 | |||||||||
PHARMACEUTICALS - 0.3% | |||||||||||
Zoetis, Inc. | 4,456 | 1,087,398 | |||||||||
PROFESSIONAL SERVICES - 3.1% | |||||||||||
Booz Allen Hamilton Holding Corp. | 4,133 | 350,437 | |||||||||
CoStar Group, Inc.* | 16,062 | 1,269,380 | |||||||||
Equifax, Inc. | 12,883 | 3,772,014 | |||||||||
Robert Half International, Inc. | 17,005 | 1,896,398 | |||||||||
TransUnion | 25,190 | 2,987,030 | |||||||||
Verisk Analytics, Inc. | 3,677 | 841,040 | |||||||||
11,116,299 | |||||||||||
REAL ESTATE MANAGEMENT & DEVELOPMENT - 0.8% | |||||||||||
CBRE Group, Inc., Class A* | 16,914 | 1,835,338 | |||||||||
Zillow Group, Inc., Class A* | 5,050 | 314,211 | |||||||||
Zillow Group, Inc., Class C* | 9,913 | 632,945 | |||||||||
2,782,494 | |||||||||||
ROAD & RAIL - 2.6% | |||||||||||
Landstar System, Inc. | 24,406 | 4,369,162 | |||||||||
Lyft, Inc., Class A* | 32,974 | 1,408,979 | |||||||||
Old Dominion Freight Line, Inc. | 8,033 | 2,878,866 | |||||||||
Ryder System, Inc. | 4,099 | 337,881 | |||||||||
XPO Logistics, Inc.* | 4,720 | 365,470 | |||||||||
9,360,358 | |||||||||||
SEMICONDUCTORS & SEMICONDUCTOR EQUIPMENT - 4.9% | |||||||||||
Advanced Micro Devices, Inc.* | 3,189 | 458,897 | |||||||||
Azenta, Inc. | 4,522 | 466,264 | |||||||||
Cirrus Logic, Inc.* | 7,253 | 667,421 | |||||||||
Enphase Energy, Inc.* | 10,160 | 1,858,670 | |||||||||
Entegris, Inc. | 8,447 | 1,170,585 | |||||||||
Intel Corp. | 12,961 | 667,492 | |||||||||
KLA Corp. | 288 | 123,872 | |||||||||
Microchip Technology, Inc. | 16,999 | 1,479,933 | |||||||||
MKS Instruments, Inc. | 6,725 | 1,171,293 | |||||||||
Monolithic Power Systems, Inc. | 5,736 | 2,829,741 | |||||||||
Silicon Laboratories, Inc.* | 1,860 | 383,941 | |||||||||
Teradyne, Inc. | 12,275 | 2,007,331 | |||||||||
Xilinx, Inc. | 21,076 | 4,468,744 | |||||||||
17,754,184 | |||||||||||
SOFTWARE - 18.1% | |||||||||||
Alteryx, Inc., Class A* | 5,812 | 351,626 | |||||||||
Anaplan, Inc.* | 21,537 | 987,471 | |||||||||
ANSYS, Inc.* | 1,405 | 563,574 | |||||||||
Bill.com Holdings, Inc.* | 7,841 | 1,953,585 | |||||||||
| Shares/ Principal | Fair Value | ||||||||||
SOFTWARE - 18.1% (Continued) | |||||||||||
Braze, Inc., Class A* | 92 | $ | 7,099 | ||||||||
C3.ai, Inc., Class A* | 12,094 | 377,937 | |||||||||
Cadence Design Systems, Inc.* | 34,281 | 6,388,264 | |||||||||
Coupa Software, Inc.* | 8,933 | 1,411,861 | |||||||||
Crowdstrike Holdings, Inc., Class A* | 18,099 | 3,705,770 | |||||||||
Datadog, Inc., Class A* | 17,669 | 3,147,026 | |||||||||
DocuSign, Inc.* | 17,154 | 2,612,726 | |||||||||
Dynatrace, Inc.* | 21,519 | 1,298,672 | |||||||||
Elastic NV* | 6,747 | 830,488 | |||||||||
Everbridge, Inc.* | 1,396 | 93,993 | |||||||||
Expensify, Inc., Class A* | 4,910 | 216,040 | |||||||||
Five9, Inc.* | 3,722 | 511,105 | |||||||||
Fortinet, Inc.* | 9,380 | 3,371,172 | |||||||||
Gitlab, Inc., Class A* | 1,422 | 123,714 | |||||||||
HashiCorp, Inc., Class A* | 3,937 | 358,424 | |||||||||
HubSpot, Inc.* | 5,143 | 3,390,008 | |||||||||
Intuit, Inc. | 2,760 | 1,775,287 | |||||||||
Manhattan Associates, Inc.* | 13,261 | 2,061,953 | |||||||||
Nuance Communications, Inc.* | 6,940 | 383,921 | |||||||||
Nutanix, Inc., Class A* | 39,463 | 1,257,291 | |||||||||
PagerDuty, Inc.* | 12,639 | 439,205 | |||||||||
Palantir Technologies, Inc., Class A* | 147,151 | 2,679,620 | |||||||||
Palo Alto Networks, Inc.* | 4,059 | 2,259,889 | |||||||||
Paycom Software, Inc.* | 5,537 | 2,298,907 | |||||||||
Paylocity Holding Corp.* | 6,510 | 1,537,402 | |||||||||
PTC, Inc.* | 7,204 | 872,765 | |||||||||
RingCentral, Inc., Class A* | 9,624 | 1,803,056 | |||||||||
ServiceNow, Inc.* | 3,726 | 2,418,584 | |||||||||
Smartsheet, Inc., Class A* | 17,395 | 1,347,243 | |||||||||
Splunk, Inc.* | 14,548 | 1,683,495 | |||||||||
Synopsys, Inc.* | 8,310 | 3,062,235 | |||||||||
Teradata Corp.* | 2,996 | 127,240 | |||||||||
Trade Desk, Inc. (The), Class A* | 25,888 | 2,372,376 | |||||||||
Unity Software, Inc.* | 8,979 | 1,283,907 | |||||||||
Workday, Inc., Class A* | 4,691 | 1,281,487 | |||||||||
Zendesk, Inc.* | 11,730 | 1,223,322 | |||||||||
Zscaler, Inc.* | 3,915 | 1,258,007 | |||||||||
65,127,747 | |||||||||||
SPECIALTY RETAIL - 3.8% | |||||||||||
American Eagle Outfitters, Inc. | 18,723 | 474,066 | |||||||||
AutoZone, Inc.* | 110 | 230,603 | |||||||||
Best Buy Co., Inc. | 3,341 | 339,446 | |||||||||
Carvana Co.* | 2,763 | 640,436 | |||||||||
Dick's Sporting Goods, Inc. | 368 | 42,316 | |||||||||
Five Below, Inc.* | 5,071 | 1,049,139 | |||||||||
Floor & Decor Holdings, Inc., Class A* | 3,068 | 398,871 | |||||||||
Foot Locker, Inc. | 3,270 | 142,670 | |||||||||
GameStop Corp., Class A* | 4,761 | 706,485 | |||||||||
Leslie's, Inc.* | 11,243 | 266,009 | |||||||||
Lithia Motors, Inc. | 3,849 | 1,142,960 | |||||||||
See accompanying notes to financial statements.
42
Global Atlantic BlackRock Disciplined Mid Cap Growth Portfolio
Portfolio of Investments (Continued)
December 31, 2021
| Shares/ Principal | Fair Value | ||||||||||
SPECIALTY RETAIL - 3.8% (Continued) | |||||||||||
O'Reilly Automotive, Inc.* | 400 | $ | 282,492 | ||||||||
Penske Automotive Group, Inc. | 2,148 | 230,309 | |||||||||
Petco Health & Wellness Co., Inc.* | 20,409 | 403,894 | |||||||||
RH* | 621 | 332,819 | |||||||||
Tractor Supply Co. | 13,926 | 3,322,744 | |||||||||
Ulta Beauty, Inc.* | 5,474 | 2,257,149 | |||||||||
Victoria's Secret & Co.* | 7,491 | 416,050 | |||||||||
Williams-Sonoma, Inc. | 5,988 | 1,012,750 | |||||||||
13,691,208 | |||||||||||
TECHNOLOGY HARDWARE, STORAGE & PERIPHERALS - 2.4% | |||||||||||
Dell Technologies, Inc., Class C* | 36,513 | 2,050,935 | |||||||||
Hewlett Packard Enterprise Co. | 34,154 | 538,608 | |||||||||
HP, Inc. | 38,940 | 1,466,870 | |||||||||
NetApp, Inc. | 32,174 | 2,959,686 | |||||||||
Pure Storage, Inc., Class A* | 46,272 | 1,506,154 | |||||||||
Western Digital Corp.* | 2,919 | 190,348 | |||||||||
8,712,601 | |||||||||||
TEXTILES, APPAREL & LUXURY GOODS - 1.4% | |||||||||||
Lululemon Athletica, Inc.* | 9,558 | 3,741,479 | |||||||||
Ralph Lauren Corp. | 2,209 | 262,562 | |||||||||
Skechers U.S.A., Inc., Class A* | 5,554 | 241,043 | |||||||||
Tapestry, Inc. | 19,950 | 809,970 | |||||||||
5,055,054 | |||||||||||
TRADING COMPANIES & DISTRIBUTORS - 1.7% | |||||||||||
SiteOne Landscape Supply, Inc.* | 13,213 | 3,201,246 | |||||||||
United Rentals, Inc.* | 2,303 | 765,264 | |||||||||
WW Grainger, Inc. | 4,136 | 2,143,440 | |||||||||
6,109,950 | |||||||||||
| TOTAL COMMON STOCKS (Cost - $302,862,959) | 355,383,783 | ||||||||||
| Shares/ Principal | Fair Value | ||||||||||
RIGHTS - 0.0%† | |||||||||||
Achillion Pharmaceuticals, Inc., CVR* | 1,183 | $ | 544 | ||||||||
Alder BioPharmaceuticals, CVR* | 638 | 561 | |||||||||
Prevail Therapeutics, CVR* | 107 | 54 | |||||||||
| TOTAL RIGHTS (Cost - $561) | 1,159 | ||||||||||
WARRANTS - 0.0%† | |||||||||||
Oasis Petroleum, Inc., expires 12/31/25* | 24 | 1,009 | |||||||||
Parker Drilling Co., expires 9/16/24* | 20 | 0 | |||||||||
Valaris Ltd., expires 12/31/28* | 61 | 199 | |||||||||
| TOTAL WARRANTS (Cost - $744) | 1,208 | ||||||||||
SHORT-TERM INVESTMENTS - 1.5% | |||||||||||
MONEY MARKET FUNDS - 1.5% | |||||||||||
| Fidelity Investments Money Market Fund - Government Portfolio, Institutional Class, 0.01% (a) (Cost - $5,327,075) | 5,327,075 | 5,327,075 | |||||||||
| TOTAL INVESTMENTS - 100.0% (Cost - $308,191,339) | $ | 360,713,225 | |||||||||
| OTHER ASSETS LESS LIABILITIES - NET (0.0)%† | (91,350 | ) | |||||||||
TOTAL NET ASSETS - 100.0% | $ | 360,621,875 | |||||||||
* Non-income producing security.
† Represents less than 0.05%.
(a) The rate shown is the annualized seven-day yield at period end.
CVR - Contingent Value Rights
PLC - Public Limited Company
FUTURES CONTRACTS | |||||||||||||||||||||||
LONG FUTURES CONTRACTS | Counterparty | Number of Contracts | Expiration Date | Notional Value | Fair Value/ Unrealized Appreciation (Depreciation) | ||||||||||||||||||
S&P 500 E-Mini Future | Goldman Sachs & Co. | 23 | 3/18/2022 | $ | 5,472,275 | $ | 61,506 | ||||||||||||||||
See accompanying notes to financial statements.
43
Global Atlantic BlackRock Disciplined Value Portfolio
Portfolio Review
December 31, 2021 (Unaudited)
Investment Objective
The Portfolio seeks to provide long-term capital appreciation.
Management Review
The Portfolio is sub-advised by BlackRock Investment Management, LLC ("BlackRock").
How did the Portfolio perform during the period?
During 2021, the Class I shares of Global Atlantic BlackRock Disciplined Value Portfolio outperformed its reference benchmark, the Russell 1000® Value Index. The Portfolio posted a return of 26.58% compared to a benchmark return of 25.16%, a difference of 142 basis points. The following discussion of relative performance pertains to this benchmark.
What factors and allocation decisions influenced the Portfolio's performance?
BlackRock's Scientific Active Equity ("SAE") process systematically tracks and ranks the characteristics of companies in order to seek to construct a portfolio that has the best trade-off between returns, risk and costs. The SAE investment model groups the universe of securities based on an analysis of a wide range of factors, such as relative value ("Value"), earnings quality ("Quality"), market sentiment ("Sentiment"), and thematic insights. Value insights seek to incorporate, where appropriate, asset value, sales, earnings and cash flow forecasts over short and long periods. Quality measures aim to assess the sustainability of earnings and the quality of corporate management by investigating company financials as well as other company statements. Sentiment criteria seek to infer information about a company's value from changes in analysts' forecasts, linkages between companies, management decisions and the behavior of other market participants in equities and other securities markets. And lastly, thematic insights seek to identify and exploit commonalities among groups of stocks that are believed to drive prices but that currently appear to be less obvious to the market.
The Portfolio struggled in the first quarter amid the strong value equity rally, but performed well the remainder of the year, with outperformance primarily driven by the portfolio's Sentiment and fundamental measures. Within Sentiment insights, trend-based measures drove gains as these were able to correctly position the Portfolio around the volatile market backdrop that included several market style preference shifts and rising rates. Capturing Sentiment from market participants, such as identifying bond investor views as well as text analyses across executive commentaries was additive. Faster moving alternative data measures, such as insights designed to track search trends also benefitted performance. The real time nature of these types of measures were helpful in evaluating the quickly evolving marketplace. Macro thematic insights evaluating hiring activity were additive through an overweight to information technology names, while more traditional quality signals, such as a preference for lower risk securities, performed well later in the year against rising market volatility.
Nontraditional measures of quality, such as environmental, social, and governance ("ESG") related insights, were mixed in the period. Insights designed to capture investor flows into preferred ESG positions were top contributors, benefitting from the broader sustainability market trend. However, other insights that track company controversies and tax levels struggled. This measure penalizes companies that pay lower levels of taxes versus peers, typically growth-oriented technology companies, and favors those with higher relative tax levels. The signal struggled to keep up amid the preference shift to growth styles. The positive performance of fundamental value insights in the first part of the year faded in the second half, detracting in aggregate for the year. Traditional measures, such as insights designed to research expenditures across price, struggled.
How was the Portfolio positioned at period end?
From a sector positioning perspective, the Portfolio remained largely sector neutral at the end of the period. The Portfolio had slight overweight positions in the information technology and utilities sectors and slight underweight positions in the communication services and materials sectors at the end of the year. The SAE team seeks to maintain a style neutral approach, so the Portfolio did not have any outsized active exposures to any particular style or factor.
44
Global Atlantic BlackRock Disciplined Value Portfolio
Portfolio Review (Continued)
December 31, 2021 (Unaudited)
The Portfolio's performance figures for the periods ended December 31, 2021 as compared to its benchmark:
Annualized | Operating Expense** | ||||||||||||||||||||||
| Inception Date* | One Year | Since Inception | Gross Ratio | Net Ratio | |||||||||||||||||||
Global Atlantic BlackRock Disciplined Value Portfolio | |||||||||||||||||||||||
Class I | November 1, 2017 | 26.58 | % | 11.72 | % | 0.57 | % | 0.56 | % | ||||||||||||||
Class II | November 1, 2017 | 26.23 | % | 11.49 | % | 0.82 | % | 0.81 | % | ||||||||||||||
Russell 1000® Value Index^ | 25.16 | % | 11.22 | % | |||||||||||||||||||
The performance data quoted is historical. Past performance is no guarantee of future results. Current performance may be higher or lower than the performance data quoted. The principal value and investment return of an investment will fluctuate so that your shares, when redeemed, may be worth more or less than their original cost. Total returns would have been lower absent fee waivers by the Adviser. Performance figures for periods greater than one year are annualized. The returns shown do not reflect the deduction of taxes that a shareholder may pay on Portfolio distributions or on the redemption of Portfolio shares, as well as other charges and expenses of the insurance contract or separate account.
* Commencement of operations is November 6, 2017.
** The estimated operating expense ratios for Class I and Class II shares, as disclosed in the most recent prospectus dated May 1, 2021. Ratios include Acquired Fund Fees and Expenses indirectly incurred by the Portfolio. The operating expense ratios presented here may differ from the expense ratios disclosed in the Financial Highlights table in this report.
^ The Russell 1000® Value Index (Total Return) measures the performance of large- and mid-capitalization value sectors of the U.S. equity market. It is not possible to invest directly in an index.
Comparison of the Change in Value of a $10,000 Investment
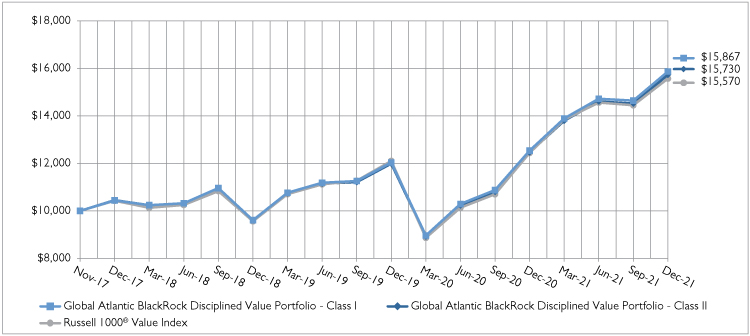
45
Global Atlantic BlackRock Disciplined Value Portfolio
Portfolio Review (Continued)
December 31, 2021 (Unaudited)
Holdings by Asset Class | % of Net Assets | ||||||
Common Stocks | 98.5 | % | |||||
Short-Term Investments | 1.5 | % | |||||
Other Assets Less Liabilities - Net | (0.0 | )%^ | |||||
100.0 | % | ||||||
Please refer to the Portfolio of Investments in this annual report for more information regarding the Portfolio's holdings as of December 31, 2021.
Derivative exposure is included in "Other Assets Less Liabilities - Net".
^ Represents less than 0.05%.
46
Global Atlantic BlackRock Disciplined Value Portfolio
Portfolio of Investments
December 31, 2021
| Shares/ Principal | Fair Value | ||||||||||
COMMON STOCKS - 98.5% | |||||||||||
AEROSPACE & DEFENSE - 1.4% | |||||||||||
Axon Enterprise, Inc.* | 1,180 | $ | 185,260 | ||||||||
General Dynamics Corp. | 1,255 | 261,630 | |||||||||
Lockheed Martin Corp. | 7,442 | 2,644,961 | |||||||||
Mercury Systems, Inc.* | 1,899 | 104,559 | |||||||||
Northrop Grumman Corp. | 2,218 | 858,521 | |||||||||
4,054,931 | |||||||||||
AIR FREIGHT & LOGISTICS - 1.1% | |||||||||||
C.H. Robinson Worldwide, Inc. | 16,438 | 1,769,222 | |||||||||
Expeditors International of Washington, Inc. | 8,066 | 1,083,183 | |||||||||
United Parcel Service, Inc., Class B | 1,122 | 240,490 | |||||||||
3,092,895 | |||||||||||
AIRLINES - 0.3% | |||||||||||
Alaska Air Group, Inc.* | 16,626 | 866,215 | |||||||||
AUTO COMPONENTS - 0.8% | |||||||||||
BorgWarner, Inc. | 47,227 | 2,128,521 | |||||||||
AUTOMOBILES - 0.2% | |||||||||||
Ford Motor Co. | 3,041 | 63,161 | |||||||||
Rivian Automotive, Inc., Class A* | 3,868 | 401,073 | |||||||||
464,234 | |||||||||||
BANKS - 7.5% | |||||||||||
Bank of America Corp. | 69,436 | 3,089,208 | |||||||||
Bank of Hawaii Corp. | 5,538 | 463,863 | |||||||||
Citigroup, Inc. | 52,433 | 3,166,429 | |||||||||
Commerce Bancshares, Inc. | 776 | 53,342 | |||||||||
First Republic Bank | 13,548 | 2,797,797 | |||||||||
Huntington Bancshares, Inc. | 38,933 | 600,347 | |||||||||
JPMorgan Chase & Co. | 35,715 | 5,655,470 | |||||||||
Pinnacle Financial Partners, Inc. | 6,485 | 619,317 | |||||||||
PNC Financial Services Group, Inc. (The) | 4,846 | 971,720 | |||||||||
Regions Financial Corp. | 36,646 | 798,883 | |||||||||
Signature Bank | 598 | 193,435 | |||||||||
Truist Financial Corp. | 14,553 | 852,078 | |||||||||
US Bancorp | 2,162 | 121,440 | |||||||||
Wells Fargo & Co. | 30,751 | 1,475,433 | |||||||||
Western Alliance Bancorp | 2,438 | 262,451 | |||||||||
21,121,213 | |||||||||||
BEVERAGES - 1.2% | |||||||||||
Coca-Cola Europacific Partners PLC | 10,055 | 562,376 | |||||||||
Keurig Dr Pepper, Inc. | 34,765 | 1,281,438 | |||||||||
Molson Coors Beverage Co., Class B | 30,226 | 1,400,975 | |||||||||
3,244,789 | |||||||||||
BIOTECHNOLOGY - 1.2% | |||||||||||
Amgen, Inc. | 7,520 | 1,691,774 | |||||||||
Biogen, Inc.* | 2,725 | 653,782 | |||||||||
Gilead Sciences, Inc. | 8,273 | 600,703 | |||||||||
Regeneron Pharmaceuticals, Inc.* | 555 | 350,494 | |||||||||
3,296,753 | |||||||||||
| Shares/ Principal | Fair Value | ||||||||||
BUILDING PRODUCTS - 1.3% | |||||||||||
Allegion PLC | 1,332 | $ | 176,410 | ||||||||
Builders FirstSource, Inc.* | 3,856 | 330,498 | |||||||||
Lennox International, Inc. | 986 | 319,819 | |||||||||
Masco Corp. | 9,409 | 660,700 | |||||||||
Owens Corning | 7,852 | 710,606 | |||||||||
Trane Technologies PLC | 7,607 | 1,536,842 | |||||||||
3,734,875 | |||||||||||
CAPITAL MARKETS - 3.6% | |||||||||||
Bank of New York Mellon Corp. (The) | 2,356 | 136,836 | |||||||||
Charles Schwab Corp. (The) | 4,295 | 361,209 | |||||||||
CME Group, Inc. | 3,939 | 899,904 | |||||||||
FactSet Research Systems, Inc. | 1,230 | 597,792 | |||||||||
Goldman Sachs Group, Inc. (The) | 3,146 | 1,203,502 | |||||||||
Intercontinental Exchange, Inc. | 5,001 | 683,987 | |||||||||
KKR & Co., Inc. | 942 | 70,179 | |||||||||
Moody's Corp. | 196 | 76,554 | |||||||||
Morgan Stanley | 19,191 | 1,883,789 | |||||||||
S&P Global, Inc. | 5,787 | 2,731,059 | |||||||||
Stifel Financial Corp. | 19,206 | 1,352,487 | |||||||||
9,997,298 | |||||||||||
CHEMICALS - 1.5% | |||||||||||
Corteva, Inc. | 23,407 | 1,106,683 | |||||||||
Ecolab, Inc. | 9,600 | 2,252,064 | |||||||||
Mosaic Co. (The) | 17,668 | 694,176 | |||||||||
Sherwin-Williams Co. (The) | 499 | 175,728 | |||||||||
4,228,651 | |||||||||||
COMMERCIAL SERVICES & SUPPLIES - 0.1% | |||||||||||
Waste Connections, Inc. | 3,109 | 423,663 | |||||||||
COMMUNICATIONS EQUIPMENT - 1.1% | |||||||||||
Cisco Systems, Inc. | 16,198 | 1,026,468 | |||||||||
Juniper Networks, Inc. | 48,934 | 1,747,433 | |||||||||
Motorola Solutions, Inc. | 1,476 | 401,029 | |||||||||
3,174,930 | |||||||||||
CONSTRUCTION MATERIALS - 0.5% | |||||||||||
Martin Marietta Materials, Inc. | 349 | 153,741 | |||||||||
Vulcan Materials Co. | 5,663 | 1,175,526 | |||||||||
1,329,267 | |||||||||||
CONSUMER FINANCE - 1.7% | |||||||||||
Ally Financial, Inc. | 53,573 | 2,550,610 | |||||||||
American Express Co. | 7,053 | 1,153,871 | |||||||||
Capital One Financial Corp. | 7,708 | 1,118,354 | |||||||||
4,822,835 | |||||||||||
CONTAINERS & PACKAGING - 0.6% | |||||||||||
Amcor PLC | 58,302 | 700,207 | |||||||||
Avery Dennison Corp. | 939 | 203,359 | |||||||||
Westrock Co. | 20,256 | 898,556 | |||||||||
1,802,122 | |||||||||||
See accompanying notes to financial statements.
47
Global Atlantic BlackRock Disciplined Value Portfolio
Portfolio of Investments (Continued)
December 31, 2021
| Shares/ Principal | Fair Value | ||||||||||
DIVERSIFIED CONSUMER SERVICES - 0.6% | |||||||||||
H&R Block, Inc. | 32,553 | $ | 766,949 | ||||||||
Service Corp. International | 11,298 | 802,045 | |||||||||
1,568,994 | |||||||||||
DIVERSIFIED FINANCIAL SERVICES - 2.7% | |||||||||||
Apollo Global Management, Inc. | 6,093 | 441,316 | |||||||||
Berkshire Hathaway, Inc., Class B* | 15,655 | 4,680,845 | |||||||||
Voya Financial, Inc. | 37,691 | 2,499,290 | |||||||||
7,621,451 | |||||||||||
DIVERSIFIED TELECOMMUNICATION - 1.1% | |||||||||||
AT&T, Inc. | 76,539 | 1,882,859 | |||||||||
Verizon Communications, Inc. | 21,954 | 1,140,730 | |||||||||
3,023,589 | |||||||||||
ELECTRIC UTILITIES - 2.3% | |||||||||||
Entergy Corp. | 5,804 | 653,821 | |||||||||
NextEra Energy, Inc. | 21,159 | 1,975,404 | |||||||||
OGE Energy Corp. | 67,138 | 2,576,756 | |||||||||
Pinnacle West Capital Corp. | 7,729 | 545,590 | |||||||||
Portland General Electric Co. | 2,505 | 132,565 | |||||||||
Southern Co. (The) | 6,661 | 456,811 | |||||||||
6,340,947 | |||||||||||
ELECTRICAL EQUIPMENT - 0.5% | |||||||||||
AMETEK, Inc. | 10,047 | 1,477,311 | |||||||||
ELECTRONIC EQUIPMENT, INSTRUMENTS & COMPONENTS - 0.3% | |||||||||||
Avnet, Inc. | 2,120 | 87,408 | |||||||||
Flex Ltd.* | 19,932 | 365,353 | |||||||||
Keysight Technologies, Inc.* | 1,829 | 377,707 | |||||||||
830,468 | |||||||||||
ENERGY EQUIPMENT & SERVICES - 1.1% | |||||||||||
Baker Hughes Co. | 2,291 | 55,122 | |||||||||
Halliburton Co. | 16,435 | 375,868 | |||||||||
Schlumberger NV | 90,303 | 2,704,575 | |||||||||
3,135,565 | |||||||||||
ENTERTAINMENT - 1.2% | |||||||||||
Roku, Inc.* | 1,323 | 301,909 | |||||||||
Spotify Technology SA* | 347 | 81,208 | |||||||||
Walt Disney Co. (The)* | 18,692 | 2,895,204 | |||||||||
Zynga, Inc., Class A* | 18,751 | 120,006 | |||||||||
3,398,327 | |||||||||||
EQUITY REAL ESTATE INVESTMENT - 4.0% | |||||||||||
American Homes 4 Rent, Class A | 29,558 | 1,289,024 | |||||||||
Brixmor Property Group, Inc. | 30,477 | 774,421 | |||||||||
CubeSmart | 33,065 | 1,881,729 | |||||||||
Equity Residential | 6,297 | 569,879 | |||||||||
Extra Space Storage, Inc. | 3,015 | 683,591 | |||||||||
Kimco Realty Corp. | 4 | 99 | |||||||||
| Shares/ Principal | Fair Value | ||||||||||
EQUITY REAL ESTATE INVESTMENT - 4.0% (Continued) | |||||||||||
Life Storage, Inc. | 12,557 | $ | 1,923,481 | ||||||||
Prologis, Inc. | 24,378 | 4,104,280 | |||||||||
Sun Communities, Inc. | 187 | 39,264 | |||||||||
11,265,768 | |||||||||||
FOOD & STAPLES RETAILING - 1.7% | |||||||||||
Costco Wholesale Corp. | 3,277 | 1,860,353 | |||||||||
Walmart, Inc. | 19,276 | 2,789,044 | |||||||||
4,649,397 | |||||||||||
FOOD PRODUCTS - 0.7% | |||||||||||
Conagra Brands, Inc. | 7,251 | 247,622 | |||||||||
Kellogg Co. | 11,229 | 723,372 | |||||||||
McCormick & Co., Inc. | 11,609 | 1,121,545 | |||||||||
2,092,539 | |||||||||||
GAS UTILITIES - 0.4% | |||||||||||
Atmos Energy Corp. | 4,300 | 450,511 | |||||||||
UGI Corp. | 13,456 | 617,765 | |||||||||
1,068,276 | |||||||||||
HEALTH CARE EQUIPMENT & SUPPLIES - 2.0% | |||||||||||
Abbott Laboratories | 3,866 | 544,101 | |||||||||
Boston Scientific Corp.* | 2,483 | 105,478 | |||||||||
Dexcom, Inc.* | 350 | 187,932 | |||||||||
Hologic, Inc.* | 6,638 | 508,205 | |||||||||
IDEXX Laboratories, Inc.* | 3,741 | 2,463,299 | |||||||||
Medtronic PLC | 10,982 | 1,136,088 | |||||||||
Stryker Corp. | 1,984 | 530,561 | |||||||||
5,475,664 | |||||||||||
HEALTH CARE PROVIDERS & SERVICES - 4.8% | |||||||||||
AmerisourceBergen Corp. | 5,372 | 713,885 | |||||||||
Anthem, Inc. | 7,634 | 3,538,664 | |||||||||
Cigna Corp. | 7,021 | 1,612,232 | |||||||||
CVS Health Corp. | 17,553 | 1,810,768 | |||||||||
McKesson Corp. | 7,355 | 1,828,232 | |||||||||
Molina Healthcare, Inc.* | 425 | 135,184 | |||||||||
UnitedHealth Group, Inc. | 7,314 | 3,672,652 | |||||||||
13,311,617 | |||||||||||
HEALTH CARE TECHNOLOGY - 0.3% | |||||||||||
Cerner Corp. | 3,856 | 358,107 | |||||||||
Teladoc Health, Inc.* | 6,964 | 639,434 | |||||||||
997,541 | |||||||||||
HOTELS, RESTAURANTS & LEISURE - 1.1% | |||||||||||
Booking Holdings, Inc.* | 289 | 693,377 | |||||||||
Hyatt Hotels Corp., Class A* | 841 | 80,652 | |||||||||
McDonald's Corp. | 5,485 | 1,470,364 | |||||||||
Sweetgreen, Inc., Class A* | 1,799 | 57,568 | |||||||||
Travel + Leisure Co. | 15,410 | 851,711 | |||||||||
3,153,672 | |||||||||||
See accompanying notes to financial statements.
48
Global Atlantic BlackRock Disciplined Value Portfolio
Portfolio of Investments (Continued)
December 31, 2021
| Shares/ Principal | Fair Value | ||||||||||
HOUSEHOLD DURABLES - 0.8% | |||||||||||
DR Horton, Inc. | 4,439 | $ | 481,410 | ||||||||
PulteGroup, Inc. | 1,899 | 108,547 | |||||||||
Whirlpool Corp. | 7,008 | 1,644,497 | |||||||||
2,234,454 | |||||||||||
HOUSEHOLD PRODUCTS - 2.7% | |||||||||||
Colgate-Palmolive Co. | 34,660 | 2,957,884 | |||||||||
Procter & Gamble Co. (The) | 28,987 | 4,741,694 | |||||||||
7,699,578 | |||||||||||
| INDEPENDENT POWER AND RENEWABLE ELECTRICITY PRODUCERS - 0.1% | |||||||||||
Brookfield Renewable Corp., Class A | 1,999 | 73,623 | |||||||||
Sunnova Energy International, Inc.* | 4,133 | 115,394 | |||||||||
189,017 | |||||||||||
INDUSTRIAL CONGLOMERATES - 1.4% | |||||||||||
General Electric Co. | 8,604 | 812,820 | |||||||||
Honeywell International, Inc. | 11,097 | 2,313,836 | |||||||||
Roper Technologies, Inc. | 1,784 | 877,478 | |||||||||
4,004,134 | |||||||||||
INSURANCE - 4.8% | |||||||||||
Allstate Corp. (The) | 5,784 | 680,488 | |||||||||
American International Group, Inc. | 11,175 | 635,410 | |||||||||
Athene Holding Ltd., Class A* | 1,505 | 125,412 | |||||||||
Brighthouse Financial, Inc.* | 1,090 | 56,462 | |||||||||
Hanover Insurance Group, Inc. (The) | 2,902 | 380,336 | |||||||||
Hartford Financial Services Group, Inc. (The) | 980 | 67,659 | |||||||||
Lincoln National Corp. | 3,899 | 266,146 | |||||||||
Marsh & McLennan Cos., Inc. | 20,020 | 3,479,876 | |||||||||
MetLife, Inc. | 49,620 | 3,100,754 | |||||||||
Reinsurance Group of America, Inc. | 7,216 | 790,080 | |||||||||
Travelers Cos., Inc. (The) | 18,364 | 2,872,680 | |||||||||
Willis Towers Watson PLC | 4,224 | 1,003,158 | |||||||||
13,458,461 | |||||||||||
INTERACTIVE MEDIA & SERVICES - 2.0% | |||||||||||
Alphabet, Inc., Class A* | 1,359 | 3,937,077 | |||||||||
Alphabet, Inc., Class C* | 516 | 1,493,092 | |||||||||
Twitter, Inc.* | 4,603 | 198,942 | |||||||||
5,629,111 | |||||||||||
INTERNET & DIRECT MARKETING RETAIL - 0.1% | |||||||||||
Amazon.com, Inc.* | 48 | 160,048 | |||||||||
Qurate Retail, Inc., Series A | 5,100 | 38,760 | |||||||||
198,808 | |||||||||||
IT SERVICES - 2.5% | |||||||||||
Automatic Data Processing, Inc. | 5,528 | 1,363,094 | |||||||||
Fidelity National Information Services, Inc. | 21,237 | 2,318,019 | |||||||||
Global Payments, Inc. | 4,338 | 586,411 | |||||||||
Okta, Inc.* | 1,342 | 300,836 | |||||||||
Visa, Inc., Class A | 11,355 | 2,460,742 | |||||||||
7,029,102 | |||||||||||
| Shares/ Principal | Fair Value | ||||||||||
LIFE SCIENCES TOOLS & SERVICES - 2.7% | |||||||||||
Agilent Technologies, Inc. | 11,056 | $ | 1,765,090 | ||||||||
Bruker Corp. | 638 | 53,535 | |||||||||
Danaher Corp. | 12,173 | 4,005,039 | |||||||||
Thermo Fisher Scientific, Inc. | 2,544 | 1,697,458 | |||||||||
7,521,122 | |||||||||||
MACHINERY - 3.0% | |||||||||||
Caterpillar, Inc. | 4,550 | 940,667 | |||||||||
Fortive Corp. | 15,534 | 1,185,089 | |||||||||
Illinois Tool Works, Inc. | 10,633 | 2,624,225 | |||||||||
Otis Worldwide Corp. | 31,600 | 2,751,412 | |||||||||
Snap-on, Inc. | 814 | 175,319 | |||||||||
Stanley Black & Decker, Inc. | 3,944 | 743,917 | |||||||||
8,420,629 | |||||||||||
MEDIA - 1.7% | |||||||||||
Altice USA, Inc., Class A* | 9,620 | 155,652 | |||||||||
Comcast Corp., Class A | 53,148 | 2,674,939 | |||||||||
Discovery, Inc., Class C* | 4,394 | 100,623 | |||||||||
Fox Corp., Class A | 16,150 | 595,935 | |||||||||
Fox Corp., Class B | 1,828 | 62,645 | |||||||||
Liberty Media Corp.-Liberty SiriusXM, Class A* | 1,007 | 51,206 | |||||||||
Nexstar Media Group, Inc., Class A | 332 | 50,125 | |||||||||
Sirius XM Holdings, Inc. | 125,060 | 794,131 | |||||||||
TEGNA, Inc. | 7,793 | 144,638 | |||||||||
ViacomCBS, Inc., Class B | 3,229 | 97,451 | |||||||||
4,727,345 | |||||||||||
METALS & MINING - 0.4% | |||||||||||
Reliance Steel & Aluminum Co. | 7,159 | 1,161,333 | |||||||||
MULTILINE RETAIL - 1.3% | |||||||||||
Kohl's Corp. | 5,904 | 291,598 | |||||||||
Nordstrom, Inc.* | 19,524 | 441,633 | |||||||||
Target Corp. | 12,159 | 2,814,079 | |||||||||
3,547,310 | |||||||||||
MULTI-UTILITIES - 3.0% | |||||||||||
Ameren Corp. | 10,017 | 891,613 | |||||||||
CMS Energy Corp. | 15,259 | 992,598 | |||||||||
Consolidated Edison, Inc. | 32,960 | 2,812,147 | |||||||||
DTE Energy Co. | 17,855 | 2,134,387 | |||||||||
NiSource, Inc. | 57,977 | 1,600,745 | |||||||||
8,431,490 | |||||||||||
OIL, GAS & CONSUMABLE FUELS - 4.0% | |||||||||||
Antero Resources Corp.* | 1,398 | 24,465 | |||||||||
Chesapeake Energy Corp. | 2,148 | 138,589 | |||||||||
Chevron Corp. | 19,666 | 2,307,805 | |||||||||
Continental Resources, Inc. | 8,759 | 392,053 | |||||||||
Devon Energy Corp. | 18,008 | 793,252 | |||||||||
EOG Resources, Inc. | 33,996 | 3,019,865 | |||||||||
EQT Corp.* | 3,702 | 80,741 | |||||||||
See accompanying notes to financial statements.
49
Global Atlantic BlackRock Disciplined Value Portfolio
Portfolio of Investments (Continued)
December 31, 2021
| Shares/ Principal | Fair Value | ||||||||||
OIL, GAS & CONSUMABLE FUELS - 4.0% (Continued) | |||||||||||
Exxon Mobil Corp. | 26,070 | $ | 1,595,223 | ||||||||
Kinder Morgan, Inc. | 59,234 | 939,451 | |||||||||
Phillips 66 | 15,412 | 1,116,753 | |||||||||
Pioneer Natural Resources Co. | 1,485 | 270,092 | |||||||||
Targa Resources Corp. | 1,756 | 91,733 | |||||||||
Valero Energy Corp. | 2,745 | 206,177 | |||||||||
Williams Cos., Inc. (The) | 8,765 | 228,241 | |||||||||
11,204,440 | |||||||||||
PERSONAL PRODUCTS - 0.6% | |||||||||||
Estee Lauder Cos, Inc. (The), Class A | 4,459 | 1,650,722 | |||||||||
PHARMACEUTICALS - 7.0% | |||||||||||
Bristol-Myers Squibb Co. | 34,675 | 2,161,986 | |||||||||
Eli Lilly and Co. | 2,523 | 696,903 | |||||||||
Johnson & Johnson | 48,640 | 8,320,845 | |||||||||
Merck & Co., Inc. | 31,304 | 2,399,139 | |||||||||
Pfizer, Inc. | 59,850 | 3,534,142 | |||||||||
Zoetis, Inc. | 10,362 | 2,528,639 | |||||||||
19,641,654 | |||||||||||
PROFESSIONAL SERVICES - 1.1% | |||||||||||
Equifax, Inc. | 7,503 | 2,196,803 | |||||||||
IHS Markit Ltd. | 4,870 | 647,321 | |||||||||
Robert Half International, Inc. | 964 | 107,505 | |||||||||
TransUnion | 320 | 37,946 | |||||||||
2,989,575 | |||||||||||
REAL ESTATE MANAGEMENT & DEVELOPMENT - 0.5% | |||||||||||
CBRE Group, Inc., Class A* | 12,326 | 1,337,494 | |||||||||
ROAD & RAIL - 1.3% | |||||||||||
Landstar System, Inc. | 9,052 | 1,620,489 | |||||||||
Ryder System, Inc. | 17,479 | 1,440,794 | |||||||||
Schneider National, Inc., Class B | 18,811 | 506,204 | |||||||||
3,567,487 | |||||||||||
SEMICONDUCTORS & SEMICONDUCTOR EQUIPMENT - 2.4% | |||||||||||
Advanced Micro Devices, Inc.* | 1,919 | 276,144 | |||||||||
Analog Devices, Inc. | 3,222 | 566,331 | |||||||||
Applied Materials, Inc. | 691 | 108,736 | |||||||||
Cirrus Logic, Inc.* | 10,268 | 944,861 | |||||||||
Intel Corp. | 78,967 | 4,066,800 | |||||||||
KLA Corp. | 216 | 92,904 | |||||||||
Lam Research Corp. | 154 | 110,749 | |||||||||
Silicon Laboratories, Inc.* | 999 | 206,214 | |||||||||
Texas Instruments, Inc. | 1,697 | 319,834 | |||||||||
6,692,573 | |||||||||||
| Shares/ Principal | Fair Value | ||||||||||
SOFTWARE - 2.4% | |||||||||||
Adobe, Inc.* | 669 | $ | 379,363 | ||||||||
Braze, Inc., Class A* | 67 | 5,170 | |||||||||
Cadence Design Systems, Inc.* | 451 | 84,044 | |||||||||
Expensify, Inc., Class A* | 3,558 | 156,552 | |||||||||
Gitlab, Inc., Class A* | 1,066 | 92,742 | |||||||||
HashiCorp, Inc., Class A* | 2,953 | 268,841 | |||||||||
Intuit, Inc. | 2,237 | 1,438,883 | |||||||||
salesforce.com, Inc.* | 7,242 | 1,840,409 | |||||||||
ServiceNow, Inc.* | 1,889 | 1,226,169 | |||||||||
VMware, Inc., Class A | 479 | 55,507 | |||||||||
Workday, Inc., Class A* | 3,878 | 1,059,392 | |||||||||
6,607,072 | |||||||||||
SPECIALTY RETAIL - 0.5% | |||||||||||
Advance Auto Parts, Inc. | 943 | 226,207 | |||||||||
American Eagle Outfitters, Inc. | 9,747 | 246,794 | |||||||||
Dick's Sporting Goods, Inc. | 214 | 24,608 | |||||||||
Foot Locker, Inc. | 1,140 | 49,738 | |||||||||
Lithia Motors, Inc. | 561 | 166,589 | |||||||||
Penske Automotive Group, Inc. | 4,271 | 457,937 | |||||||||
Tractor Supply Co. | 692 | 165,111 | |||||||||
1,336,984 | |||||||||||
TECHNOLOGY HARDWARE, STORAGE & PERIPHERALS - 2.3% | |||||||||||
Dell Technologies, Inc., Class C* | 45,323 | 2,545,793 | |||||||||
Hewlett Packard Enterprise Co. | 142,864 | 2,252,965 | |||||||||
NetApp, Inc. | 9,665 | 889,083 | |||||||||
Pure Storage, Inc., Class A* | 2,243 | 73,010 | |||||||||
Western Digital Corp.* | 11,380 | 742,090 | |||||||||
6,502,941 | |||||||||||
TEXTILES, APPAREL & LUXURY GOODS - 0.2% | |||||||||||
Levi Strauss & Co., Class A | 3,792 | 94,914 | |||||||||
Ralph Lauren Corp. | 4,043 | 480,551 | |||||||||
Under Armour, Inc., Class C* | 2,584 | 46,615 | |||||||||
622,080 | |||||||||||
THRIFTS & MORTGAGE FINANCE - 0.2% | |||||||||||
New York Community Bancorp, Inc. | 34,822 | 425,177 | |||||||||
Radian Group, Inc. | 11,030 | 233,064 | |||||||||
658,241 | |||||||||||
TRADING COMPANIES & DISTRIBUTORS - 0.3% | |||||||||||
SiteOne Landscape Supply, Inc.* | 3,194 | 773,842 | |||||||||
WIRELESS TELECOMMUNICATION SERVICES - 0.3% | |||||||||||
United States Cellular Corp.* | 23,286 | 733,975 | |||||||||
| TOTAL COMMON STOCKS (Cost - $232,416,540) | 275,765,292 | ||||||||||
See accompanying notes to financial statements.
50
Global Atlantic BlackRock Disciplined Value Portfolio
Portfolio of Investments (Continued)
December 31, 2021
| Shares/ Principal | Fair Value | ||||||||||
SHORT-TERM INVESTMENTS - 1.5% | |||||||||||
MONEY MARKET FUNDS - 1.5% | |||||||||||
| Fidelity Investments Money Market Fund - Government Portfolio, Institutional Class, 0.01% (a) (Cost - $4,077,510) | 4,077,510 | $ | 4,077,510 | ||||||||
| TOTAL INVESTMENTS - 100.0% (Cost - $236,494,050) | $ | 279,842,802 | |||||||||
| OTHER ASSETS LESS LIABILITIES - NET (0.0)%† | (63,416) | ||||||||||
TOTAL NET ASSETS - 100.0% | $ | 279,779,386 | |||||||||
* Non-income producing security.
† Represents less than 0.05%.
(a) The rate shown is the annualized seven-day yield at period end.
PLC - Public Limited Company
FUTURES CONTRACTS | |||||||||||||||||||||||
LONG FUTURES CONTRACTS | Counterparty | Number of Contracts | Expiration Date | Notional Value | Fair Value/ Unrealized Appreciation (Depreciation) | ||||||||||||||||||
S&P 500 E-Mini Future | Goldman Sachs & Co. | 18 | 3/18/2022 | $ | 4,282,650 | $ | 46,353 | ||||||||||||||||
See accompanying notes to financial statements.
51
Global Atlantic BlackRock High Yield Portfolio
Portfolio Review
December 31, 2021 (Unaudited)
Investment Objective
The Portfolio seeks to provide total return.
Management Review
The Portfolio is sub-advised by BlackRock Investment Management, LLC ("BlackRock").
How did the Portfolio perform during the period?
During 2021, the Class I shares of Global Atlantic BlackRock High Yield Portfolio underperformed its reference benchmark, the ICE BofAML BB-B U.S. High Yield Constrained Index. The Portfolio posted a return of 4.00% compared to a benchmark return of 4.60%, a difference of -60 basis points. The following discussion of relative performance pertains to this benchmark.
What factors and allocation decisions influenced the Portfolio's performance?
While the year began with High Yield bond prices rising modestly on optimism for additional fiscal stimulus from the Democratic party sweep in Congress, this was quickly offset by an increase in equity volatility. February saw a continuation of these modest gains after a strong first half of the month was capped off with a widening of credit spreads spurred on by an increase in volatility in the treasury market, and ultimately, a rise in rates. High Yield bond prices increased sharply in the second quarter, as first quarter rate volatility eased and commodity prices climbed. While the hawkish surprise from the U.S. Federal Reserve (the "Fed") in the middle of June served as an obstacle, the subsequent rate volatility was short-lived and high yield credit remained resilient throughout.
The third quarter saw High Yield bond prices increase with higher quality credit outperforming. What was expected to be a relatively quiet period saw spreads decompress between BBs and CCCs, with CCCs lagging BBs, thus breaking the year-to-date-trend of low-quality outperformance. A meaningful drop in commodity prices, particularly oil, and a rise in Delta variant COVID-19 concerns, caused brief selloffs, however these quickly subsided. The fourth quarter was highlighted by increased rate volatility, as represented by the ICE BofA U.S. Bond Market Option Volatility Estimate ("MOVE") Index1, which broke above 80, a level not seen since March 2020. With this higher rate volatility, together with concerns around inflation, a potentially faster rate hiking cycle, and ultimately, the Omicron variant, spreads widened meaningfully in November, only to retrace their steps in early December.
High Yield new issuance rose 9% to $470 billion in 2021, while the default rate of 0.29% (down from 6.76% in 2020) is the lowest since 2007.
The primary contributor to Portfolio performance during the period was an overweight to basic industry, particularly the chemicals sub-sector. Within financial services, overweight positions within lease financing was beneficial, as were overweight positions to the energy and exploration sub-sector. The primary detractor during the period was an overweight to telecommunications, particularly within the satellite sub-sector. Underweights within leisure, particularly the recreation & travel and gaming sub-sectors, as well as security selection within consumer goods, specifically in the wholesale food sub-sector, detracted from performance.
How was the Portfolio positioned at period end?
At period end, the Portfolio was overweight basic industry, energy, and financial services. The largest sector underweights were leisure, healthcare, and media at the end of the period. The Portfolio moved from underweight to overweight the energy sector during the period, primarily driven by increasing the overweight in exploration & production. Within healthcare, the Portfolio increased its underweight during the period, mainly driven by increasing the underweight in the managed care subsector. Over the period, the Portfolio also increased its underweight to leisure, particularly in recreation & travel.
1 The MOVE Index is a yield curve weighted index that measures U.S. bond market yield volatility by tracking a basket of over the counter options on U.S. Treasury notes and bonds.
52
Global Atlantic BlackRock High Yield Portfolio
Portfolio Review (Continued)
December 31, 2021 (Unaudited)
The Portfolio's performance figures for the periods ended December 31, 2021 as compared to its benchmark:
Annualized | Operating Expense** | ||||||||||||||||||||||
| Inception Date* | One Year | Since Inception | Gross Ratio | Net Ratio | |||||||||||||||||||
Global Atlantic BlackRock High Yield Portfolio | |||||||||||||||||||||||
Class I | November 1, 2017 | 4.00 | % | 4.51 | % | 0.62 | % | 0.61 | % | ||||||||||||||
Class II | November 1, 2017 | 3.74 | % | 4.25 | % | 0.87 | % | 0.86 | % | ||||||||||||||
ICE BofAML BB-B U.S. High Yield Constrained Index^ | 4.60 | % | 5.54 | % | |||||||||||||||||||
The performance data quoted is historical. Past performance is no guarantee of future results. Current performance may be higher or lower than the performance data quoted. The principal value and investment return of an investment will fluctuate so that your shares, when redeemed, may be worth more or less than their original cost. Total returns would have been lower absent fee waivers by the Adviser. Performance figures for periods greater than one year are annualized. The returns shown do not reflect the deduction of taxes that a shareholder may pay on Portfolio distributions or on the redemption of Portfolio shares, as well as other charges and expenses of the insurance contract or separate account.
* Commencement of operations is November 6, 2017.
** The estimated operating expense ratios for Class I and Class II shares, as disclosed in the most recent prospectus dated May 1, 2021. Ratios include Acquired Fund Fees and Expenses indirectly incurred by the Portfolio. The operating expense ratios presented here may differ from the expense ratios disclosed in the Financial Highlights table in this report.
^ The ICE BofAML BB-B U.S. High Yield Constrained Index contains all securities in the ICE BofAML U.S. High Yield Index rated BB1 through B3, based on an average of Moody's, S&P, and Fitch, but caps issuer exposure at 2%. Index constituents are capitalization-weighted, based on their current amount outstanding, provided the total allocation to an individual issuer does not exceed 2%. It is not possible to invest directly in an index.
Comparison of the Change in Value of a $10,000 Investment

53
Global Atlantic BlackRock High Yield Portfolio
Portfolio Review (Continued)
December 31, 2021 (Unaudited)
Holdings by Asset Class | % of Net Assets | ||||||
Corporate Bonds and Notes | 96.7 | % | |||||
Short-Term Investments | 2.1 | % | |||||
Other Assets Less Liabilities - Net | 1.2 | % | |||||
100.0 | % | ||||||
Please refer to the Portfolio of Investments in this annual report for more information regarding the Portfolio's holdings as of December 31, 2021.
Derivative exposure is included in "Other Assets Less Liabilities - Net".
54
Global Atlantic BlackRock High Yield Portfolio
Portfolio of Investments
December 31, 2021
| Shares/ Principal | Fair Value | ||||||||||
CORPORATE BONDS AND NOTES - 96.7% | |||||||||||
ADVERTISING - 0.2% | |||||||||||
Midas OpCo Holdings LLC, 5.63%, 8/15/29 (a) | $ | 85,000 | $ | 87,019 | |||||||
| Outfront Media Capital LLC / Outfront Media Capital Corp., 5.00%, 8/15/27 (a) | 45,000 | 46,047 | |||||||||
133,066 | |||||||||||
AEROSPACE & DEFENSE - 1.7% | |||||||||||
BWX Technologies, Inc., 4.13%, 6/30/28 (a) | 115,000 | 116,725 | |||||||||
Howmet Aerospace, Inc., 5.90%, 2/1/27 | 150,000 | 171,375 | |||||||||
| Kratos Defense & Security Solutions, Inc., 6.50%, 11/30/25 (a) | 40,000 | 41,100 | |||||||||
Spirit AeroSystems, Inc., 5.50%, 1/15/25 (a) | 25,000 | 25,906 | |||||||||
SSL Robotics LLC, 9.75%, 12/31/23 (a) | 58,000 | 62,495 | |||||||||
TransDigm, Inc. | |||||||||||
6.25%, 3/15/26 (a) | 300,000 | 311,813 | |||||||||
6.38%, 6/15/26 | 50,000 | 51,366 | |||||||||
7.50%, 3/15/27 | 250,000 | 261,250 | |||||||||
Triumph Group, Inc., 8.88%, 6/1/24 (a) | 82,000 | 89,380 | |||||||||
1,131,410 | |||||||||||
AGRICULTURE - 0.9% | |||||||||||
Turning Point Brands, Inc., 5.63%, 2/15/26 (a) | 110,000 | 110,275 | |||||||||
Vector Group Ltd., 5.75%, 2/1/29 (a) | 520,000 | 505,991 | |||||||||
616,266 | |||||||||||
AIRLINES - 1.3% | |||||||||||
American Airlines, Inc., 11.75%, 7/15/25 (a) | 125,000 | 154,219 | |||||||||
| American Airlines, Inc./AAdvantage Loyalty IP Ltd. | |||||||||||
5.50%, 4/20/26 (a) | 55,000 | 57,193 | |||||||||
5.75%, 4/20/29 (a) | 275,000 | 293,587 | |||||||||
Delta Air Lines, Inc., 7.38%, 1/15/26 | 150,000 | 176,574 | |||||||||
| Spirit Loyalty Cayman Ltd. / Spirit IP Cayman Ltd., 8.00%, 9/20/25 (a) | 60,000 | 66,118 | |||||||||
United Airlines Holdings, Inc., 4.88%, 1/15/25 | 25,000 | 25,719 | |||||||||
United Airlines, Inc. | |||||||||||
4.38%, 4/15/26 (a) | 40,000 | 41,710 | |||||||||
4.63%, 4/15/29 (a) | 45,000 | 46,406 | |||||||||
861,526 | |||||||||||
APPAREL - 0.6% | |||||||||||
Crocs, Inc., 4.13%, 8/15/31 (a) | 340,000 | 332,350 | |||||||||
Kontoor Brands, Inc., 4.13%, 11/15/29 (a) | 55,000 | 55,000 | |||||||||
387,350 | |||||||||||
AUTO MANUFACTURERS - 3.0% | |||||||||||
Ford Motor Co. | |||||||||||
4.35%, 12/8/26 | 200,000 | 218,150 | |||||||||
9.63%, 4/22/30 | 140,000 | 204,925 | |||||||||
4.75%, 1/15/43 | 150,000 | 165,562 | |||||||||
5.29%, 12/8/46 | 100,000 | 117,525 | |||||||||
Ford Motor Credit Co. LLC | |||||||||||
3.09%, 1/9/23 | 200,000 | 203,381 | |||||||||
4.06%, 11/1/24 | 200,000 | 210,434 | |||||||||
5.11%, 5/3/29 | 200,000 | 227,250 | |||||||||
| Shares/ Principal | Fair Value | ||||||||||
AUTO MANUFACTURERS - 3.0% (Continued) | |||||||||||
Jaguar Land Rover Automotive PLC | |||||||||||
5.63%, 2/1/23 (a) | $ | 150,000 | $ | 150,277 | |||||||
5.50%, 7/15/29 (a) | 250,000 | 250,269 | |||||||||
JB Poindexter & Co., Inc., 7.13%, 4/15/26 (a) | 80,000 | 83,706 | |||||||||
Wabash National Corp., 4.50%, 10/15/28 (a) | 90,000 | 90,900 | |||||||||
1,922,379 | |||||||||||
AUTO PARTS & EQUIPMENT - 1.1% | |||||||||||
Adient US LLC, 9.00%, 4/15/25 (a) | 15,000 | 15,937 | |||||||||
| Clarios Global LP / Clarios US Finance Co., 6.25%, 5/15/26 (a) | 41,000 | 42,896 | |||||||||
| Cooper-Standard Automotive, Inc., 13.00%, 6/1/24 (a) | 190,000 | 205,200 | |||||||||
| Goodyear Tire & Rubber Co. (The), 5.00%, 7/15/29 (a) | 75,000 | 80,565 | |||||||||
| IHO Verwaltungs GmbH, 4.75% Cash, 9/15/26 (a),(b) | 200,000 | 204,000 | |||||||||
Meritor, Inc., 6.25%, 6/1/25 (a) | 40,000 | 41,700 | |||||||||
Tenneco, Inc. | |||||||||||
7.88%, 1/15/29 (a) | 45,000 | 48,600 | |||||||||
5.13%, 4/15/29 (a) | 77,000 | 75,268 | |||||||||
714,166 | |||||||||||
BANKS - 0.7% | |||||||||||
| Deutsche Bank AG, 4.30%, (USD 5 Year Swap + 2.25%), 5/24/28 (c) | 100,000 | 102,757 | |||||||||
Freedom Mortgage Corp. | |||||||||||
8.25%, 4/15/25 (a) | 75,000 | 76,781 | |||||||||
7.63%, 5/1/26 (a) | 45,000 | 45,957 | |||||||||
6.63%, 1/15/27 (a) | 35,000 | 34,212 | |||||||||
| UniCredit SpA, 5.46%, (US 5 Year CMT T-Note + 4.75%), 6/30/35 (a),(c) | 200,000 | 218,110 | |||||||||
477,817 | |||||||||||
BUILDING MATERIALS - 1.8% | |||||||||||
Boise Cascade Co., 4.88%, 7/1/30 (a) | 50,000 | 52,750 | |||||||||
Builders FirstSource, Inc. | |||||||||||
6.75%, 6/1/27 (a) | 114,000 | 120,270 | |||||||||
5.00%, 3/1/30 (a) | 125,000 | 134,062 | |||||||||
4.25%, 2/1/32 (a) | 150,000 | 156,000 | |||||||||
| Forterra Finance LLC / FRTA Finance Corp., 6.50%, 7/15/25 (a) | 100,000 | 106,130 | |||||||||
Griffon Corp., 5.75%, 3/1/28 | 25,000 | 25,954 | |||||||||
| James Hardie International Finance DAC, 5.00%, 1/15/28 (a) | 200,000 | 208,000 | |||||||||
Louisiana-Pacific Corp., 3.63%, 3/15/29 (a) | 125,000 | 127,491 | |||||||||
Masonite International Corp., 5.38%, 2/1/28 (a) | 100,000 | 104,875 | |||||||||
| New Enterprise Stone & Lime Co., Inc., 5.25%, 7/15/28 (a) | 25,000 | 25,350 | |||||||||
SRM Escrow Issuer LLC, 6.00%, 11/1/28 (a) | 85,000 | 90,838 | |||||||||
| Summit Materials LLC / Summit Materials Finance Corp., 6.50%, 3/15/27 (a) | 30,000 | 31,125 | |||||||||
1,182,845 | |||||||||||
See accompanying notes to financial statements.
55
Global Atlantic BlackRock High Yield Portfolio
Portfolio of Investments (Continued)
December 31, 2021
| Shares/ Principal | Fair Value | ||||||||||
CHEMICALS - 3.4% | |||||||||||
Ashland LLC, 3.38%, 9/1/31 (a) | $ | 15,000 | $ | 14,887 | |||||||
Chemours Co. (The) | |||||||||||
5.38%, 5/15/27 | 125,000 | 133,750 | |||||||||
5.75%, 11/15/28 (a) | 93,000 | 97,185 | |||||||||
4.63%, 11/15/29 (a) | 50,000 | 49,612 | |||||||||
| CVR Partners LP / CVR Nitrogen Finance Corp. | |||||||||||
9.25%, 6/15/23 (a) | 5,000 | 5,010 | |||||||||
6.13%, 6/15/28 (a) | 355,000 | 374,525 | |||||||||
Element Solutions, Inc., 3.88%, 9/1/28 (a) | 40,000 | 40,200 | |||||||||
HB Fuller Co., 4.25%, 10/15/28 | 70,000 | 72,100 | |||||||||
Ingevity Corp., 3.88%, 11/1/28 (a) | 50,000 | 48,687 | |||||||||
| Kraton Polymers LLC / Kraton Polymers Capital Corp., 4.25%, 12/15/25 (a) | 50,000 | 51,756 | |||||||||
Methanex Corp. | |||||||||||
5.13%, 10/15/27 | 35,000 | 36,750 | |||||||||
5.65%, 12/1/44 | 15,000 | 15,008 | |||||||||
Minerals Technologies, Inc., 5.00%, 7/1/28 (a) | 25,000 | 25,914 | |||||||||
NOVA Chemicals Corp., 4.88%, 6/1/24 (a) | 350,000 | 361,375 | |||||||||
| Nufarm Australia Ltd. / Nufarm Americas, Inc., 5.75%, 4/30/26 (a) | 90,000 | 92,045 | |||||||||
| Rain CII Carbon LLC / CII Carbon Corp., 7.25%, 4/1/25 (a) | 30,000 | 30,670 | |||||||||
Rayonier AM Products, Inc., 7.63%, 1/15/26 (a) | 142,000 | 150,520 | |||||||||
SCIH Salt Holdings, Inc., 4.88%, 5/1/28 (a) | 50,000 | 48,000 | |||||||||
SPCM SA, 3.13%, 3/15/27 (a) | 25,000 | 24,705 | |||||||||
| Trinseo Materials Operating SCA / Trinseo Materials Finance, Inc., 5.38%, 9/1/25 (a) | 62,000 | 63,132 | |||||||||
Tronox, Inc. | |||||||||||
6.50%, 5/1/25 (a) | 25,000 | 26,422 | |||||||||
4.63%, 3/15/29 (a) | 70,000 | 69,913 | |||||||||
| Unifrax Escrow Issuer Corp., 5.25%, 9/30/28 (a) | 105,000 | 106,129 | |||||||||
Valvoline, Inc. | |||||||||||
4.25%, 2/15/30 (a) | 75,000 | 76,516 | |||||||||
3.63%, 6/15/31 (a) | 75,000 | 72,623 | |||||||||
WR Grace Holdings LLC, 4.88%, 6/15/27 (a) | 150,000 | 154,070 | |||||||||
2,241,504 | |||||||||||
COAL - 0.1% | |||||||||||
| Natural Resource Partners LP / NRP Finance Corp., 9.13%, 6/30/25 (a) | 25,000 | 25,375 | |||||||||
SunCoke Energy, Inc., 4.88%, 6/30/29 (a) | 20,000 | 19,900 | |||||||||
Warrior Met Coal, Inc., 7.88%, 12/1/28 (a) | 45,000 | 46,125 | |||||||||
91,400 | |||||||||||
COMMERCIAL SERVICES - 3.6% | |||||||||||
| Adtalem Global Education, Inc., 5.50%, 3/1/28 (a) | 20,000 | 19,550 | |||||||||
| Albion Financing 1 SARL / Aggreko Holdings, Inc., 6.13%, 10/15/26 (a) | 35,000 | 35,350 | |||||||||
| Allied Universal Holdco LLC / Allied Universal Finance Corp., 6.63%, 7/15/26 (a) | 30,000 | 31,449 | |||||||||
| Shares/ Principal | Fair Value | ||||||||||
COMMERCIAL SERVICES - 3.6% (Continued) | |||||||||||
| Alta Equipment Group, Inc., 5.63%, 4/15/26 (a) | $ | 128,000 | $ | 131,649 | |||||||
AMN Healthcare, Inc., 4.63%, 10/1/27 (a) | 15,000 | 15,547 | |||||||||
APi Escrow Corp., 4.75%, 10/15/29 (a) | 35,000 | 35,700 | |||||||||
ASGN, Inc., 4.63%, 5/15/28 (a) | 142,000 | 147,013 | |||||||||
| Avis Budget Car Rental LLC / Avis Budget Finance, Inc., 5.38%, 3/1/29 (a) | 120,000 | 126,578 | |||||||||
Carriage Services, Inc., 4.25%, 5/15/29 (a) | 25,000 | 24,875 | |||||||||
CPI CG, Inc., 8.63%, 3/15/26 (a) | 240,000 | 253,817 | |||||||||
Deluxe Corp., 8.00%, 6/1/29 (a) | 373,000 | 389,785 | |||||||||
Gartner, Inc. | |||||||||||
4.50%, 7/1/28 (a) | 175,000 | 182,767 | |||||||||
3.63%, 6/15/29 (a) | 50,000 | 50,553 | |||||||||
3.75%, 10/1/30 (a) | 80,000 | 81,792 | |||||||||
Graham Holdings Co., 5.75%, 6/1/26 (a) | 125,000 | 129,844 | |||||||||
Korn Ferry, 4.63%, 12/15/27 (a) | 200,000 | 206,000 | |||||||||
| Legends Hospitality Holding Co. LLC / Legends Hospitality Co.-Issuer, Inc., 5.00%, 2/1/26 (a) | 15,000 | 15,075 | |||||||||
NESCO Holdings II, Inc., 5.50%, 4/15/29 (a) | 40,000 | 41,300 | |||||||||
| Prime Security Services Borrower LLC / Prime Finance, Inc., 5.75%, 4/15/26 (a) | 125,000 | 134,209 | |||||||||
| Ritchie Bros Auctioneers, Inc., 5.38%, 1/15/25 (a) | 50,000 | 50,506 | |||||||||
RR Donnelley & Sons Co., 6.13%, 11/1/26 (a) | 35,000 | 38,325 | |||||||||
Service Corp. International | |||||||||||
5.13%, 6/1/29 | 20,000 | 21,450 | |||||||||
3.38%, 8/15/30 | 25,000 | 24,566 | |||||||||
United Rentals North America, Inc. | |||||||||||
5.25%, 1/15/30 | 70,000 | 75,775 | |||||||||
3.88%, 2/15/31 | 15,000 | 15,225 | |||||||||
3.75%, 1/15/32 | 45,000 | 45,315 | |||||||||
| WASH Multifamily Acquisition, Inc., 5.75%, 4/15/26 (a) | 10,000 | 10,510 | |||||||||
2,334,525 | |||||||||||
COMPUTERS - 0.7% | |||||||||||
Booz Allen Hamilton, Inc. | |||||||||||
3.88%, 9/1/28 (a) | 30,000 | 30,525 | |||||||||
4.00%, 7/1/29 (a) | 20,000 | 20,650 | |||||||||
Crowdstrike Holdings, Inc., 3.00%, 2/15/29 | 70,000 | 69,125 | |||||||||
KBR, Inc., 4.75%, 9/30/28 (a) | 75,000 | 76,500 | |||||||||
Presidio Holdings, Inc., 4.88%, 2/1/27 (a) | 35,000 | 36,050 | |||||||||
Unisys Corp., 6.88%, 11/1/27 (a) | 198,000 | 214,335 | |||||||||
447,185 | |||||||||||
COSMETICS & PERSONAL CARE - 0.3% | |||||||||||
Coty, Inc., 5.00%, 4/15/26 (a) | 177,000 | 182,315 | |||||||||
DISTRIBUTION & WHOLESALE - 0.3% | |||||||||||
American Builders & Contractors Supply Co., Inc. | |||||||||||
4.00%, 1/15/28 (a) | 15,000 | 15,348 | |||||||||
3.88%, 11/15/29 (a) | 25,000 | 24,938 | |||||||||
See accompanying notes to financial statements.
56
Global Atlantic BlackRock High Yield Portfolio
Portfolio of Investments (Continued)
December 31, 2021
| Shares/ Principal | Fair Value | ||||||||||
DISTRIBUTION & WHOLESALE - 0.3% (Continued) | |||||||||||
G-III Apparel Group Ltd., 7.88%, 8/15/25 (a) | $ | 100,000 | $ | 106,399 | |||||||
Ritchie Bros Holdings, Inc., 4.75%, 12/15/31 (a) | 50,000 | 52,188 | |||||||||
198,873 | |||||||||||
DIVERSIFIED FINANCIAL SERVICES - 4.9% | |||||||||||
AG Issuer LLC, 6.25%, 3/1/28 (a) | 35,000 | 36,312 | |||||||||
| Brightsphere Investment Group, Inc., 4.80%, 7/27/26 | 17,000 | 17,758 | |||||||||
Cobra AcquisitionCo. LLC, 6.38%, 11/1/29 (a) | 15,000 | 14,812 | |||||||||
Coinbase Global, Inc. | |||||||||||
3.38%, 10/1/28 (a) | 30,000 | 28,012 | |||||||||
3.63%, 10/1/31 (a) | 55,000 | 50,600 | |||||||||
Credit Acceptance Corp., 6.63%, 3/15/26 | 45,000 | 46,838 | |||||||||
Curo Group Holdings Corp., 7.50%, 8/1/28 (a) | 185,000 | 186,054 | |||||||||
Enova International, Inc., 8.50%, 9/15/25 (a) | 395,000 | 407,348 | |||||||||
| Global Aircraft Leasing Co. Ltd., 6.50% Cash or 7.25% PIK, 9/15/24 (a),(b) | 75,000 | 72,375 | |||||||||
goeasy Ltd., 5.38%, 12/1/24 (a) | 110,000 | 113,025 | |||||||||
| Jefferson Capital Holdings LLC, 6.00%, 8/15/26 (a) | 24,000 | 24,300 | |||||||||
LPL Holdings, Inc. | |||||||||||
4.63%, 11/15/27 (a) | 104,000 | 107,640 | |||||||||
4.00%, 3/15/29 (a) | 30,000 | 30,712 | |||||||||
4.38%, 5/15/31 (a) | 125,000 | 127,813 | |||||||||
Nationstar Mortgage Holdings, Inc. | |||||||||||
6.00%, 1/15/27 (a) | 65,000 | 67,711 | |||||||||
5.50%, 8/15/28 (a) | 140,000 | 142,800 | |||||||||
5.75%, 11/15/31 (a) | 250,000 | 248,750 | |||||||||
Navient Corp. | |||||||||||
6.75%, 6/15/26 | 100,000 | 110,535 | |||||||||
5.00%, 3/15/27 | 35,000 | 35,673 | |||||||||
4.88%, 3/15/28 | 25,000 | 24,937 | |||||||||
5.50%, 3/15/29 | 50,000 | 49,875 | |||||||||
5.63%, 8/1/33 | 25,000 | 23,813 | |||||||||
NFP Corp., 4.88%, 8/15/28 (a) | 20,000 | 20,200 | |||||||||
OneMain Finance Corp. | |||||||||||
5.63%, 3/15/23 | 100,000 | 104,455 | |||||||||
6.13%, 3/15/24 | 120,000 | 127,228 | |||||||||
7.13%, 3/15/26 | 100,000 | 114,000 | |||||||||
6.63%, 1/15/28 | 95,000 | 106,400 | |||||||||
| PennyMac Financial Services, Inc., 5.75%, 9/15/31 (a) | 25,000 | 25,250 | |||||||||
PHH Mortgage Corp., 7.88%, 3/15/26 (a) | 128,000 | 132,340 | |||||||||
PRA Group, Inc., 5.00%, 10/1/29 (a) | 65,000 | 65,163 | |||||||||
| Provident Funding Associates LP / PFG Finance Corp., 6.38%, 6/15/25 (a) | 150,000 | 152,625 | |||||||||
SLM Corp., 4.20%, 10/29/25 | 25,000 | 26,125 | |||||||||
| United Wholesale Mortgage LLC, 5.75%, 6/15/27 (a) | 135,000 | 135,338 | |||||||||
World Acceptance Corp., 7.00%, 11/1/26 (a) | 234,000 | 234,585 | |||||||||
3,211,402 | |||||||||||
| Shares/ Principal | Fair Value | ||||||||||
ELECTRIC - 1.4% | |||||||||||
Calpine Corp. | |||||||||||
5.25%, 6/1/26 (a) | $ | 59,000 | $ | 60,534 | |||||||
4.50%, 2/15/28 (a) | 100,000 | 103,500 | |||||||||
5.13%, 3/15/28 (a) | 70,000 | 71,061 | |||||||||
4.63%, 2/1/29 (a) | 25,000 | 24,656 | |||||||||
3.75%, 3/1/31 (a) | 25,000 | 24,250 | |||||||||
| Clearway Energy Operating LLC, 3.75%, 1/15/32 (a) | 130,000 | 129,025 | |||||||||
Drax Finco PLC, 6.63%, 11/1/25 (a) | 200,000 | 206,500 | |||||||||
FirstEnergy Corp., 5.35%, 7/15/47 | 55,000 | 65,469 | |||||||||
| Leeward Renewable Energy Operations LLC, 4.25%, 7/1/29 (a) | 30,000 | 30,300 | |||||||||
| NextEra Energy Operating Partners LP, 4.25%, 7/15/24 (a) | 50,000 | 51,937 | |||||||||
| Pattern Energy Operations LP / Pattern Energy Operations, Inc., 4.50%, 8/15/28 (a) | 40,000 | 41,500 | |||||||||
PG&E Corp., 5.25%, 7/1/30 | 55,000 | 57,678 | |||||||||
Talen Energy Supply LLC, 6.63%, 1/15/28 (a) | 25,000 | 21,938 | |||||||||
Vistra Operations Co. LLC, 5.00%, 7/31/27 (a) | 40,000 | 41,513 | |||||||||
929,861 | |||||||||||
ELECTRICAL COMPONENTS & EQUIPMENT - 0.2% | |||||||||||
WESCO Distribution, Inc. | |||||||||||
7.13%, 6/15/25 (a) | 90,000 | 95,400 | |||||||||
7.25%, 6/15/28 (a) | 45,000 | 49,331 | |||||||||
144,731 | |||||||||||
ELECTRONICS - 0.8% | |||||||||||
Atkore, Inc., 4.25%, 6/1/31 (a) | 374,000 | 383,350 | |||||||||
II-VI, Inc., 5.00%, 12/15/29 (a) | 80,000 | 81,667 | |||||||||
Imola Merger Corp., 4.75%, 5/15/29 (a) | 50,000 | 51,231 | |||||||||
516,248 | |||||||||||
ENERGY-ALTERNATE SOURCES - 0.2% | |||||||||||
| TerraForm Power Operating LLC, 5.00%, 1/31/28 (a) | 100,000 | 105,920 | |||||||||
ENGINEERING & CONSTRUCTION - 1.3% | |||||||||||
AECOM, 5.13%, 3/15/27 | 190,000 | 206,976 | |||||||||
Artera Services LLC, 9.03%, 12/4/25 (a) | 60,000 | 63,476 | |||||||||
| Brundage-Bone Concrete Pumping Holdings, Inc., 6.00%, 2/1/26 (a) | 150,000 | 156,000 | |||||||||
MasTec, Inc., 4.50%, 8/15/28 (a) | 90,000 | 93,487 | |||||||||
TopBuild Corp. | |||||||||||
3.63%, 3/15/29 (a) | 50,000 | 50,375 | |||||||||
4.13%, 2/15/32 (a) | 55,000 | 56,444 | |||||||||
Tutor Perini Corp., 6.88%, 5/1/25 (a) | 190,000 | 191,478 | |||||||||
| Weekley Homes LLC / Weekley Finance Corp., 4.88%, 9/15/28 (a) | 15,000 | 15,450 | |||||||||
833,686 | |||||||||||
ENTERTAINMENT - 0.9% | |||||||||||
Affinity Gaming, 6.88%, 12/15/27 (a) | 15,000 | 15,600 | |||||||||
Boyne USA, Inc., 4.75%, 5/15/29 (a) | 62,000 | 63,860 | |||||||||
See accompanying notes to financial statements.
57
Global Atlantic BlackRock High Yield Portfolio
Portfolio of Investments (Continued)
December 31, 2021
| Shares/ Principal | Fair Value | ||||||||||
ENTERTAINMENT - 0.9% (Continued) | |||||||||||
| Cedar Fair LP / Canada's Wonderland Co. / Magnum Management Corp. / Millennium Op, 5.50%, 5/1/25 (a) | $ | 80,000 | $ | 82,800 | |||||||
Everi Holdings, Inc., 5.00%, 7/15/29 (a) | 20,000 | 20,200 | |||||||||
| International Game Technology PLC, 6.50%, 2/15/25 (a) | 100,000 | 108,500 | |||||||||
Jacobs Entertainment, Inc., 7.88%, 2/1/24 (a) | 5,000 | 5,100 | |||||||||
| Live Nation Entertainment, Inc., 4.88%, 11/1/24 (a) | 200,000 | 202,000 | |||||||||
| Midwest Gaming Borrower LLC / Midwest Gaming Finance Corp., 4.88%, 5/1/29 (a) | 40,000 | 40,200 | |||||||||
| Raptor Acquisition Corp. / Raptor Co-Issuer LLC, 4.88%, 11/1/26 (a) | 20,000 | 20,200 | |||||||||
Six Flags Theme Parks, Inc., 7.00%, 7/1/25 (a) | 15,000 | 16,019 | |||||||||
| Wynn Resorts Finance LLC / Wynn Resorts Capital Corp., 7.75%, 4/15/25 (a) | 30,000 | 31,463 | |||||||||
605,942 | |||||||||||
ENVIRONMENTAL CONTROL - 1.6% | |||||||||||
Covanta Holding Corp. | |||||||||||
4.88%, 12/1/29 (a) | 270,000 | 274,050 | |||||||||
5.00%, 9/1/30 | 418,000 | 426,360 | |||||||||
GFL Environmental, Inc. | |||||||||||
3.75%, 8/1/25 (a) | 30,000 | 30,300 | |||||||||
5.13%, 12/15/26 (a) | 35,000 | 36,400 | |||||||||
4.00%, 8/1/28 (a) | 50,000 | 49,000 | |||||||||
4.75%, 6/15/29 (a) | 100,000 | 100,875 | |||||||||
Madison IAQ LLC, 4.13%, 6/30/28 (a) | 40,000 | 40,100 | |||||||||
Stericycle, Inc., 3.88%, 1/15/29 (a) | 35,000 | 34,475 | |||||||||
Tervita Corp., 11.00%, 12/1/25 (a) | 50,000 | 57,562 | |||||||||
1,049,122 | |||||||||||
FOOD - 2.7% | |||||||||||
| Albertsons Cos., Inc. / Safeway, Inc. / New Albertsons LP / Albertsons LLC | |||||||||||
4.63%, 1/15/27 (a) | 50,000 | 52,472 | |||||||||
5.88%, 2/15/28 (a) | 30,000 | 31,800 | |||||||||
Del Monte Foods, Inc., 11.88%, 5/15/25 (a) | 93,000 | 103,642 | |||||||||
Ingles Markets, Inc., 4.00%, 6/15/31 (a) | 38,000 | 38,285 | |||||||||
Kraft Heinz Foods Co. | |||||||||||
3.75%, 4/1/30 | 200,000 | 216,091 | |||||||||
6.88%, 1/26/39 | 200,000 | 293,858 | |||||||||
5.00%, 6/4/42 | 250,000 | 310,876 | |||||||||
4.38%, 6/1/46 | 150,000 | 175,897 | |||||||||
| Lamb Weston Holdings, Inc., 4.38%, 1/31/32 (a) | 75,000 | 77,345 | |||||||||
Pilgrim's Pride Corp., 5.88%, 9/30/27 (a) | 50,000 | 52,797 | |||||||||
Post Holdings, Inc., 5.75%, 3/1/27 (a) | 300,000 | 309,750 | |||||||||
| SEG Holding LLC / SEG Finance Corp., 5.63%, 10/15/28 (a) | 20,000 | 20,950 | |||||||||
| Simmons Foods, Inc./Simmons Prepared Foods, Inc./Simmons Pet Food, Inc./Simmons Feed, 4.63%, 3/1/29 (a) | 75,000 | 73,875 | |||||||||
1,757,638 | |||||||||||
| Shares/ Principal | Fair Value | ||||||||||
FOREST PRODUCTS & PAPER - 1.0% | |||||||||||
Clearwater Paper Corp., 4.75%, 8/15/28 (a) | $ | 15,000 | $ | 15,262 | |||||||
Domtar Corp., 6.75%, 10/1/28 (a) | 365,000 | 375,111 | |||||||||
Glatfelter Corp., 4.75%, 11/15/29 (a) | 25,000 | 25,781 | |||||||||
| Resolute Forest Products, Inc., 4.88%, 3/1/26 (a) | 160,000 | 162,400 | |||||||||
| Schweitzer-Mauduit International, Inc., 6.88%, 10/1/26 (a) | 50,000 | 52,313 | |||||||||
630,867 | |||||||||||
GAS - 0.3% | |||||||||||
| AmeriGas Partners LP / AmeriGas Finance Corp., 5.63%, 5/20/24 | 150,000 | 162,175 | |||||||||
HEALTHCARE-PRODUCTS - 0.3% | |||||||||||
Hologic, Inc., 3.25%, 2/15/29 (a) | 75,000 | 75,000 | |||||||||
Mozart Debt Merger Sub, Inc. | |||||||||||
3.88%, 4/1/29 (a) | 105,000 | 104,629 | |||||||||
5.25%, 10/1/29 (a) | 25,000 | 25,341 | |||||||||
Varex Imaging Corp., 7.88%, 10/15/27 (a) | 16,000 | 17,778 | |||||||||
222,748 | |||||||||||
HEALTHCARE-SERVICES - 5.3% | |||||||||||
Acadia Healthcare Co., Inc. | |||||||||||
5.50%, 7/1/28 (a) | 100,000 | 105,107 | |||||||||
5.00%, 4/15/29 (a) | 25,000 | 25,687 | |||||||||
Catalent Pharma Solutions, Inc. | |||||||||||
5.00%, 7/15/27 (a) | 40,000 | 41,560 | |||||||||
3.13%, 2/15/29 (a) | 45,000 | 44,388 | |||||||||
Centene Corp., 4.25%, 12/15/27 | 30,000 | 31,275 | |||||||||
Charles River Laboratories International, Inc. | |||||||||||
4.25%, 5/1/28 (a) | 25,000 | 26,000 | |||||||||
4.00%, 3/15/31 (a) | 37,000 | 37,911 | |||||||||
CHS/Community Health Systems, Inc. | |||||||||||
8.00%, 3/15/26 (a) | 175,000 | 183,968 | |||||||||
5.63%, 3/15/27 (a) | 45,000 | 47,625 | |||||||||
8.00%, 12/15/27 (a) | 50,000 | 54,000 | |||||||||
6.00%, 1/15/29 (a) | 15,000 | 15,994 | |||||||||
DaVita, Inc., 4.63%, 6/1/30 (a) | 90,000 | 92,137 | |||||||||
Encompass Health Corp., 4.50%, 2/1/28 | 45,000 | 46,294 | |||||||||
HCA, Inc. | |||||||||||
5.88%, 2/15/26 | 450,000 | 507,945 | |||||||||
5.63%, 9/1/28 | 115,000 | 134,376 | |||||||||
5.88%, 2/1/29 | 20,000 | 23,831 | |||||||||
3.50%, 9/1/30 | 100,000 | 105,688 | |||||||||
IQVIA, Inc. | |||||||||||
5.00%, 10/15/26 (a) | 200,000 | 205,250 | |||||||||
5.00%, 5/15/27 (a) | 200,000 | 207,060 | |||||||||
| Legacy LifePoint Health LLC, 4.38%, 2/15/27 (a) | 35,000 | 35,263 | |||||||||
MEDNAX, Inc., 6.25%, 1/15/27 (a) | 25,000 | 26,156 | |||||||||
ModivCare, Inc., 5.88%, 11/15/25 (a) | 290,000 | 304,500 | |||||||||
Molina Healthcare, Inc., 4.38%, 6/15/28 (a) | 90,000 | 92,700 | |||||||||
| Prime Healthcare Services, Inc., 7.25%, 11/1/25 (a) | 45,000 | 47,700 | |||||||||
See accompanying notes to financial statements.
58
Global Atlantic BlackRock High Yield Portfolio
Portfolio of Investments (Continued)
December 31, 2021
| Shares/ Principal | Fair Value | ||||||||||
HEALTHCARE-SERVICES - 5.3% (Continued) | |||||||||||
RP Escrow Issuer LLC, 5.25%, 12/15/25 (a) | $ | 45,000 | $ | 45,394 | |||||||
Select Medical Corp., 6.25%, 8/15/26 (a) | 215,000 | 227,655 | |||||||||
Tenet Healthcare Corp. | |||||||||||
6.75%, 6/15/23 | 90,000 | 96,187 | |||||||||
4.63%, 7/15/24 | 40,000 | 40,500 | |||||||||
7.50%, 4/1/25 (a) | 30,000 | 31,574 | |||||||||
5.13%, 11/1/27 (a) | 255,000 | 265,519 | |||||||||
6.13%, 10/1/28 (a) | 210,000 | 221,804 | |||||||||
| US Acute Care Solutions LLC, 6.38%, 3/1/26 (a) | 40,000 | 41,900 | |||||||||
3,412,948 | |||||||||||
HOME BUILDERS - 1.8% | |||||||||||
| Ashton Woods USA LLC / Ashton Woods Finance Co., 4.63%, 8/1/29 (a) | 35,000 | 34,562 | |||||||||
| Brookfield Residential Properties, Inc. / Brookfield Residential US Corp., 4.88%, 2/15/30 (a) | 130,000 | 132,965 | |||||||||
Century Communities, Inc. | |||||||||||
6.75%, 6/1/27 | 25,000 | 26,375 | |||||||||
3.88%, 8/15/29 (a) | 25,000 | 25,188 | |||||||||
| Empire Communities Corp., 7.00%, 12/15/25 (a) | 35,000 | 36,225 | |||||||||
Forestar Group, Inc., 3.85%, 5/15/26 (a) | 60,000 | 60,150 | |||||||||
| Installed Building Products, Inc., 5.75%, 2/1/28 (a) | 45,000 | 46,800 | |||||||||
LGI Homes, Inc., 4.00%, 7/15/29 (a) | 372,000 | 370,605 | |||||||||
Mattamy Group Corp. | |||||||||||
5.25%, 12/15/27 (a) | 60,000 | 63,105 | |||||||||
4.63%, 3/1/30 (a) | 15,000 | 15,277 | |||||||||
Picasso Finance Sub, Inc., 6.13%, 6/15/25 (a) | 42,000 | 43,890 | |||||||||
Shea Homes LP / Shea Homes Funding Corp. | |||||||||||
4.75%, 2/15/28 (a) | 50,000 | 51,125 | |||||||||
4.75%, 4/1/29 (a) | 25,000 | 25,475 | |||||||||
| Taylor Morrison Communities, Inc., 5.75%, 1/15/28 (a) | 25,000 | 27,938 | |||||||||
Tri Pointe Homes, Inc. | |||||||||||
5.25%, 6/1/27 | 75,000 | 80,531 | |||||||||
5.70%, 6/15/28 | 15,000 | 16,500 | |||||||||
| Williams Scotsman International, Inc., 4.63%, 8/15/28 (a) | 45,000 | 46,463 | |||||||||
Winnebago Industries, Inc., 6.25%, 7/15/28 (a) | 45,000 | 48,183 | |||||||||
1,151,357 | |||||||||||
HOUSEHOLD PRODUCTS & WARES - 0.3% | |||||||||||
| Kronos Acquisition Holdings, Inc. / KIK Custom Products, Inc., 5.00%, 12/31/26 (a) | 55,000 | 54,331 | |||||||||
Spectrum Brands, Inc. | |||||||||||
5.50%, 7/15/30 (a) | 100,000 | 107,250 | |||||||||
3.88%, 3/15/31 (a) | 15,000 | 14,812 | |||||||||
176,393 | |||||||||||
HOUSEWARES - 0.3% | |||||||||||
CD&R Smokey Buyer, Inc., 6.75%, 7/15/25 (a) | 25,000 | 26,250 | |||||||||
| Shares/ Principal | Fair Value | ||||||||||
HOUSEWARES - 0.3% (Continued) | |||||||||||
Newell Brands, Inc. | |||||||||||
4.70%, 4/1/26 | $ | 100,000 | $ | 109,025 | |||||||
5.88%, 4/1/36 | 25,000 | 30,812 | |||||||||
6.00%, 4/1/46 | 25,000 | 32,076 | |||||||||
198,163 | |||||||||||
INSURANCE - 0.3% | |||||||||||
| Alliant Holdings Intermediate LLC / Alliant Holdings Co.-Issuer, 4.25%, 10/15/27 (a) | 45,000 | 45,000 | |||||||||
AmWINS Group, Inc., 4.88%, 6/30/29 (a) | 25,000 | 25,250 | |||||||||
MGIC Investment Corp., 5.25%, 8/15/28 | 8,000 | 8,400 | |||||||||
Radian Group, Inc. | |||||||||||
6.63%, 3/15/25 | 50,000 | 55,250 | |||||||||
4.88%, 3/15/27 | 40,000 | 42,922 | |||||||||
176,822 | |||||||||||
INTERNET - 1.1% | |||||||||||
Arches Buyer, Inc., 4.25%, 6/1/28 (a) | 55,000 | 54,950 | |||||||||
Match Group Holdings II LLC | |||||||||||
5.00%, 12/15/27 (a) | 150,000 | 156,000 | |||||||||
4.63%, 6/1/28 (a) | 30,000 | 31,212 | |||||||||
5.63%, 2/15/29 (a) | 155,000 | 165,850 | |||||||||
4.13%, 8/1/30 (a) | 85,000 | 85,850 | |||||||||
3.63%, 10/1/31 (a) | 110,000 | 106,838 | |||||||||
Millennium Escrow Corp., 6.63%, 8/1/26 (a) | 40,000 | 40,100 | |||||||||
NortonLifeLock, Inc., 5.00%, 4/15/25 (a) | 55,000 | 55,419 | |||||||||
696,219 | |||||||||||
INVESTMENT COMPANIES - 1.7% | |||||||||||
Compass Group Diversified Holdings LLC | |||||||||||
5.25%, 4/15/29 (a) | 75,000 | 78,562 | |||||||||
5.00%, 1/15/32 (a) | 95,000 | 97,375 | |||||||||
| Icahn Enterprises LP / Icahn Enterprises Finance Corp. | |||||||||||
4.75%, 9/15/24 | 250,000 | 259,375 | |||||||||
6.38%, 12/15/25 | 200,000 | 203,500 | |||||||||
6.25%, 5/15/26 | 190,000 | 197,838 | |||||||||
5.25%, 5/15/27 | 200,000 | 205,500 | |||||||||
4.38%, 2/1/29 | 60,000 | 58,500 | |||||||||
1,100,650 | |||||||||||
IRON & STEEL - 0.4% | |||||||||||
| Big River Steel LLC / BRS Finance Corp., 6.63%, 1/31/29 (a) | 48,000 | 51,900 | |||||||||
Cleveland-Cliffs, Inc., 4.63%, 3/1/29 (a) | 25,000 | 25,500 | |||||||||
Commercial Metals Co., 5.38%, 7/15/27 | 100,000 | 104,000 | |||||||||
Mineral Resources Ltd., 8.13%, 5/1/27 (a) | 75,000 | 80,863 | |||||||||
262,263 | |||||||||||
LEISURE TIME - 0.7% | |||||||||||
Carnival Corp., 9.88%, 8/1/27 (a) | 60,000 | 68,563 | |||||||||
Life Time, Inc., 5.75%, 1/15/26 (a) | 10,000 | 10,350 | |||||||||
See accompanying notes to financial statements.
59
Global Atlantic BlackRock High Yield Portfolio
Portfolio of Investments (Continued)
December 31, 2021
| Shares/ Principal | Fair Value | ||||||||||
LEISURE TIME - 0.7% (Continued) | |||||||||||
Royal Caribbean Cruises Ltd. | |||||||||||
10.88%, 6/1/23 (a) | $ | 35,000 | $ | 38,237 | |||||||
9.13%, 6/15/23 (a) | 10,000 | 10,575 | |||||||||
11.50%, 6/1/25 (a) | 148,000 | 165,760 | |||||||||
Vista Outdoor, Inc., 4.50%, 3/15/29 (a) | 182,000 | 183,138 | |||||||||
476,623 | |||||||||||
LODGING - 1.0% | |||||||||||
Hilton Domestic Operating Co., Inc. | |||||||||||
5.38%, 5/1/25 (a) | 20,000 | 20,812 | |||||||||
4.88%, 1/15/30 | 45,000 | 48,094 | |||||||||
Hilton Grand Vacations Borrower Escrow LLC | |||||||||||
5.00%, 6/1/29 (a) | 45,000 | 46,125 | |||||||||
4.88%, 7/1/31 (a) | 34,000 | 34,000 | |||||||||
| Hilton Worldwide Finance LLC / Hilton Worldwide Finance Corp., 4.88%, 4/1/27 | 200,000 | 206,000 | |||||||||
| Marriott Ownership Resorts, Inc., 6.13%, 9/15/25 (a) | 36,000 | 37,530 | |||||||||
Travel + Leisure Co. | |||||||||||
6.00%, 4/1/27 | 75,000 | 81,508 | |||||||||
4.63%, 3/1/30 (a) | 14,000 | 14,070 | |||||||||
| Wyndham Hotels & Resorts, Inc., 4.38%, 8/15/28 (a) | 41,000 | 42,230 | |||||||||
| Wynn Las Vegas LLC / Wynn Las Vegas Capital Corp., 5.50%, 3/1/25 (a) | 100,000 | 103,000 | |||||||||
633,369 | |||||||||||
MACHINERY-CONSTRUCTION & MINING - 0.3% | |||||||||||
Terex Corp., 5.00%, 5/15/29 (a) | 160,000 | 164,400 | |||||||||
MACHINERY-DIVERSIFIED - 0.5% | |||||||||||
| ATS Automation Tooling Systems, Inc., 4.13%, 12/15/28 (a) | 60,000 | 60,450 | |||||||||
Colfax Corp., 6.38%, 2/15/26 (a) | 19,000 | 19,641 | |||||||||
GrafTech Finance, Inc., 4.63%, 12/15/28 (a) | 209,000 | 212,135 | |||||||||
Stevens Holding Co., Inc., 6.13%, 10/1/26 (a) | 20,000 | 21,325 | |||||||||
313,551 | |||||||||||
MEDIA - 6.5% | |||||||||||
Altice Financing SA, 5.75%, 8/15/29 (a) | 75,000 | 74,250 | |||||||||
Audacy Capital Corp., 6.75%, 3/31/29 (a) | 20,000 | 19,539 | |||||||||
Block Communications, Inc., 4.88%, 3/1/28 (a) | 25,000 | 25,000 | |||||||||
| CCO Holdings LLC / CCO Holdings Capital Corp. | |||||||||||
5.00%, 2/1/28 (a) | 100,000 | 104,000 | |||||||||
5.38%, 6/1/29 (a) | 250,000 | 269,784 | |||||||||
4.75%, 3/1/30 (a) | 115,000 | 119,600 | |||||||||
4.50%, 8/15/30 (a) | 100,000 | 102,319 | |||||||||
4.25%, 1/15/34 (a) | 220,000 | 216,442 | |||||||||
CSC Holdings LLC | |||||||||||
5.38%, 2/1/28 (a) | 200,000 | 207,074 | |||||||||
6.50%, 2/1/29 (a) | 200,000 | 214,000 | |||||||||
| Cumulus Media New Holdings, Inc., 6.75%, 7/1/26 (a) | 100,000 | 103,750 | |||||||||
| Shares/ Principal | Fair Value | ||||||||||
MEDIA - 6.5% (Continued) | |||||||||||
| Directv Holdings LLC / Directv Financing Co., Inc., 5.88%, 8/15/27 (a) | $ | 245,000 | $ | 250,716 | |||||||
DISH DBS Corp. | |||||||||||
5.88%, 11/15/24 | 235,000 | 241,190 | |||||||||
7.75%, 7/1/26 | 125,000 | 131,875 | |||||||||
5.13%, 6/1/29 | 100,000 | 91,000 | |||||||||
GCI LLC, 4.75%, 10/15/28 (a) | 195,000 | 200,119 | |||||||||
Gray Escrow II, Inc., 5.38%, 11/15/31 (a) | 60,000 | 61,725 | |||||||||
Gray Television, Inc., 5.88%, 7/15/26 (a) | 121,000 | 125,009 | |||||||||
| Houghton Mifflin Harcourt Publishers, Inc., 9.00%, 2/15/25 (a) | 12,000 | 12,540 | |||||||||
iHeartCommunications, Inc. | |||||||||||
5.25%, 8/15/27 (a) | 29,000 | 30,163 | |||||||||
4.75%, 1/15/28 (a) | 20,000 | 20,282 | |||||||||
McGraw-Hill Education, Inc., 5.75%, 8/1/28 (a) | 25,000 | 24,750 | |||||||||
Nexstar Media, Inc., 5.63%, 7/15/27 (a) | 100,000 | 104,500 | |||||||||
| Radiate Holdco LLC / Radiate Finance, Inc., 4.50%, 9/15/26 (a) | 50,000 | 50,500 | |||||||||
Sirius XM Radio, Inc. | |||||||||||
3.13%, 9/1/26 (a) | 25,000 | 25,008 | |||||||||
4.00%, 7/15/28 (a) | 95,000 | 95,531 | |||||||||
5.50%, 7/1/29 (a) | 50,000 | 53,875 | |||||||||
3.88%, 9/1/31 (a) | 65,000 | 63,729 | |||||||||
| Spanish Broadcasting System, Inc., 9.75%, 3/1/26 (a) | 29,000 | 29,834 | |||||||||
TEGNA, Inc. | |||||||||||
4.75%, 3/15/26 (a) | 80,000 | 83,200 | |||||||||
5.00%, 9/15/29 | 145,000 | 148,262 | |||||||||
Townsquare Media, Inc., 6.88%, 2/1/26 (a) | 270,000 | 286,537 | |||||||||
Virgin Media Finance PLC, 5.00%, 7/15/30 (a) | 300,000 | 298,500 | |||||||||
| Virgin Media Secured Finance PLC, 5.50%, 5/15/29 (a) | 200,000 | 210,500 | |||||||||
Ziggo BV, 5.50%, 1/15/27 (a) | 150,000 | 154,125 | |||||||||
4,249,228 | |||||||||||
METAL FABRICATE & HARDWARE - 0.3% | |||||||||||
| Advanced Drainage Systems, Inc., 5.00%, 9/30/27 (a) | 145,000 | 149,894 | |||||||||
| Roller Bearing Co. of America, Inc., 4.38%, 10/15/29 (a) | 26,000 | 26,520 | |||||||||
176,414 | |||||||||||
MINING - 2.4% | |||||||||||
Arconic Corp., 6.13%, 2/15/28 (a) | 76,000 | 80,879 | |||||||||
Eldorado Gold Corp., 6.25%, 9/1/29 (a) | 55,000 | 55,928 | |||||||||
| FMG Resources August 2006 Pty Ltd., 4.50%, 9/15/27 (a) | 85,000 | 90,525 | |||||||||
Freeport-McMoRan, Inc. | |||||||||||
4.38%, 8/1/28 | 155,000 | 162,556 | |||||||||
5.45%, 3/15/43 | 110,000 | 138,280 | |||||||||
IAMGOLD Corp., 5.75%, 10/15/28 (a) | 85,000 | 83,513 | |||||||||
Joseph T Ryerson & Son, Inc., 8.50%, 8/1/28 (a) | 389,000 | 423,038 | |||||||||
See accompanying notes to financial statements.
60
Global Atlantic BlackRock High Yield Portfolio
Portfolio of Investments (Continued)
December 31, 2021
| Shares/ Principal | Fair Value | ||||||||||
MINING - 2.4% (Continued) | |||||||||||
Novelis Corp. | |||||||||||
3.25%, 11/15/26 (a) | $ | 25,000 | $ | 25,219 | |||||||
4.75%, 1/30/30 (a) | 65,000 | 68,331 | |||||||||
3.88%, 8/15/31 (a) | 20,000 | 19,875 | |||||||||
Taseko Mines Ltd., 7.00%, 2/15/26 (a) | 398,000 | 413,920 | |||||||||
1,562,064 | |||||||||||
MISCELLANEOUS MANUFACTURING - 0.1% | |||||||||||
LSB Industries, Inc., 6.25%, 10/15/28 (a) | 70,000 | 72,800 | |||||||||
OIL & GAS - 10.5% | |||||||||||
| Aethon United BR LP / Aethon United Finance Corp., 8.25%, 2/15/26 (a) | 20,000 | 21,484 | |||||||||
Antero Resources Corp. | |||||||||||
5.00%, 3/1/25 | 25,000 | 25,401 | |||||||||
8.38%, 7/15/26 (a) | 17,000 | 19,356 | |||||||||
7.63%, 2/1/29 (a) | 92,000 | 102,120 | |||||||||
5.38%, 3/1/30 (a) | 35,000 | 37,415 | |||||||||
Apache Corp. | |||||||||||
4.63%, 11/15/25 | 45,000 | 48,319 | |||||||||
4.88%, 11/15/27 | 25,000 | 27,250 | |||||||||
4.25%, 1/15/30 | 15,000 | 16,278 | |||||||||
6.00%, 1/15/37 | 50,000 | 61,000 | |||||||||
5.10%, 9/1/40 | 147,000 | 166,110 | |||||||||
| Ascent Resources Utica Holdings LLC / ARU Finance Corp. | |||||||||||
8.25%, 12/31/28 (a) | 20,000 | 20,850 | |||||||||
5.88%, 6/30/29 (a) | 50,000 | 48,109 | |||||||||
Berry Petroleum Co. LLC, 7.00%, 2/15/26 (a) | 80,000 | 79,200 | |||||||||
California Resources Corp., 7.13%, 2/1/26 (a) | 85,000 | 88,305 | |||||||||
Callon Petroleum Co. | |||||||||||
6.13%, 10/1/24 | 100,000 | 98,500 | |||||||||
9.00%, 4/1/25 (a) | 100,000 | 108,000 | |||||||||
| Calumet Specialty Products Partners LP / Calumet Finance Corp., 9.25%, 7/15/24 (a) | 40,000 | 43,200 | |||||||||
Centennial Resource Production LLC | |||||||||||
5.38%, 1/15/26 (a) | 191,000 | 187,180 | |||||||||
6.88%, 4/1/27 (a) | 75,000 | 76,500 | |||||||||
Chesapeake Energy Corp., 5.50%, 2/1/26 (a) | 10,000 | 10,525 | |||||||||
Civitas Resources, Inc., 5.00%, 10/15/26 (a) | 57,000 | 57,559 | |||||||||
CNX Resources Corp., 7.25%, 3/14/27 (a) | 75,000 | 79,555 | |||||||||
| Colgate Energy Partners III LLC, 5.88%, 7/1/29 (a) | 45,000 | 46,350 | |||||||||
Comstock Resources, Inc., 7.50%, 5/15/25 (a) | 26,000 | 26,812 | |||||||||
| CrownRock LP / CrownRock Finance, Inc., 5.00%, 5/1/29 (a) | 20,000 | 20,750 | |||||||||
| Encino Acquisition Partners Holdings LLC, 8.50%, 5/1/28 (a) | 35,000 | 36,356 | |||||||||
| Endeavor Energy Resources LP / EER Finance, Inc., 6.63%, 7/15/25 (a) | 75,000 | 79,352 | |||||||||
EQT Corp. | |||||||||||
6.63%, 2/1/25 | 60,000 | 67,650 | |||||||||
3.90%, 10/1/27 | 75,000 | 80,532 | |||||||||
5.00%, 1/15/29 | 10,000 | 11,075 | |||||||||
| Shares/ Principal | Fair Value | ||||||||||
OIL & GAS - 10.5% (Continued) | |||||||||||
Harbour Energy PLC, 5.50%, 10/15/26 (a) | $ | 200,000 | $ | 198,500 | |||||||
Hilcorp Energy I LP / Hilcorp Finance Co. | |||||||||||
6.25%, 11/1/28 (a) | 80,000 | 84,100 | |||||||||
6.00%, 2/1/31 (a) | 80,000 | 82,400 | |||||||||
| Independence Energy Finance LLC, 7.25%, 5/1/26 (a) | 20,000 | 20,775 | |||||||||
Laredo Petroleum, Inc. | |||||||||||
9.50%, 1/15/25 | 100,000 | 102,000 | |||||||||
10.13%, 1/15/28 | 50,000 | 52,428 | |||||||||
7.75%, 7/31/29 (a) | 150,000 | 146,250 | |||||||||
| Magnolia Oil & Gas Operating LLC / Magnolia Oil & Gas Finance Corp., 6.00%, 8/1/26 (a) | 50,000 | 51,250 | |||||||||
Matador Resources Co., 5.88%, 9/15/26 | 115,000 | 118,450 | |||||||||
MEG Energy Corp., 5.88%, 2/1/29 (a) | 85,000 | 89,110 | |||||||||
Murphy Oil Corp. | |||||||||||
5.75%, 8/15/25 | 65,000 | 66,788 | |||||||||
5.88%, 12/1/27 | 73,000 | 75,281 | |||||||||
Nabors Industries, Inc., 7.38%, 5/15/27 (a) | 35,000 | 36,218 | |||||||||
Northern Oil and Gas, Inc., 8.13%, 3/1/28 (a) | 285,000 | 300,675 | |||||||||
Oasis Petroleum, Inc., 6.38%, 6/1/26 (a) | 355,000 | 371,862 | |||||||||
Occidental Petroleum Corp. | |||||||||||
2.90%, 8/15/24 | 425,000 | 433,818 | |||||||||
5.50%, 12/1/25 | 45,000 | 49,894 | |||||||||
6.38%, 9/1/28 | 70,000 | 83,114 | |||||||||
3.50%, 8/15/29 | 250,000 | 256,487 | |||||||||
6.63%, 9/1/30 | 35,000 | 43,312 | |||||||||
6.13%, 1/1/31 | 25,000 | 30,465 | |||||||||
6.45%, 9/15/36 | 145,000 | 184,875 | |||||||||
4.30%, 8/15/39 | 25,000 | 24,932 | |||||||||
4.40%, 4/15/46 | 125,000 | 128,125 | |||||||||
4.20%, 3/15/48 | 59,000 | 59,000 | |||||||||
4.40%, 8/15/49 | 150,000 | 151,875 | |||||||||
Parkland Corp., 5.88%, 7/15/27 (a) | 40,000 | 42,200 | |||||||||
PBF Holding Co. LLC / PBF Finance Corp. | |||||||||||
9.25%, 5/15/25 (a) | 50,000 | 47,563 | |||||||||
7.25%, 6/15/25 | 30,000 | 21,261 | |||||||||
6.00%, 2/15/28 | 45,000 | 28,912 | |||||||||
PDC Energy, Inc., 5.75%, 5/15/26 | 130,000 | 134,225 | |||||||||
Penn Virginia Holdings LLC, 9.25%, 8/15/26 (a) | 80,000 | 83,000 | |||||||||
Precision Drilling Corp., 7.13%, 1/15/26 (a) | 50,000 | 50,875 | |||||||||
Range Resources Corp. | |||||||||||
5.00%, 3/15/23 | 100,000 | 102,250 | |||||||||
9.25%, 2/1/26 | 125,000 | 134,724 | |||||||||
Rockcliff Energy II LLC, 5.50%, 10/15/29 (a) | 55,000 | 56,650 | |||||||||
SM Energy Co. | |||||||||||
10.00%, 1/15/25 (a) | 204,000 | 224,400 | |||||||||
6.50%, 7/15/28 | 200,000 | 207,000 | |||||||||
Southwestern Energy Co. | |||||||||||
6.45%, 1/23/25 | 26,000 | 28,574 | |||||||||
8.38%, 9/15/28 | 25,000 | 27,906 | |||||||||
5.38%, 2/1/29 | 25,000 | 26,438 | |||||||||
See accompanying notes to financial statements.
61
Global Atlantic BlackRock High Yield Portfolio
Portfolio of Investments (Continued)
December 31, 2021
| Shares/ Principal | Fair Value | ||||||||||
OIL & GAS - 10.5% (Continued) | |||||||||||
Sunoco LP / Sunoco Finance Corp. | |||||||||||
6.00%, 4/15/27 | $ | 220,000 | $ | 229,438 | |||||||
5.88%, 3/15/28 | 50,000 | 52,875 | |||||||||
4.50%, 5/15/29 | 75,000 | 76,165 | |||||||||
4.50%, 4/30/30 (a) | 80,000 | 81,993 | |||||||||
Talos Production, Inc., 12.00%, 1/15/26 | 50,000 | 52,375 | |||||||||
Tap Rock Resources LLC, 7.00%, 10/1/26 (a) | 5,000 | 5,200 | |||||||||
Viper Energy Partners LP, 5.38%, 11/1/27 (a) | 75,000 | 77,438 | |||||||||
6,824,539 | |||||||||||
OIL & GAS SERVICES - 0.6% | |||||||||||
Bristow Group, Inc., 6.88%, 3/1/28 (a) | 45,000 | 46,810 | |||||||||
| Oceaneering International, Inc., 4.65%, 11/15/24 | 37,000 | 37,185 | |||||||||
| USA Compression Partners LP / USA Compression Finance Corp. | |||||||||||
6.88%, 4/1/26 | 135,000 | 140,400 | |||||||||
6.88%, 9/1/27 | 25,000 | 26,406 | |||||||||
| Weatherford International Ltd., 6.50%, 9/15/28 (a) | 140,000 | 148,133 | |||||||||
398,934 | |||||||||||
PACKAGING & CONTAINERS - 1.2% | |||||||||||
| Ardagh Packaging Finance PLC / Ardagh Holdings USA, Inc., 5.25%, 8/15/27 (a) | 200,000 | 201,250 | |||||||||
Ball Corp. | |||||||||||
5.25%, 7/1/25 | 100,000 | 110,250 | |||||||||
2.88%, 8/15/30 | 60,000 | 58,200 | |||||||||
Berry Global, Inc., 5.63%, 7/15/27 (a) | 50,000 | 52,312 | |||||||||
Greif, Inc., 6.50%, 3/1/27 (a) | 55,000 | 57,062 | |||||||||
| Intelligent Packaging Ltd. Finco, Inc. / Intelligent Packaging Ltd. Co.-Issuer LLC, 6.00%, 9/15/28 (a) | 25,000 | 25,688 | |||||||||
| Intertape Polymer Group, Inc., 4.38%, 6/15/29 (a) | 50,000 | 50,000 | |||||||||
LABL, Inc., 5.88%, 11/1/28 (a) | 25,000 | 25,766 | |||||||||
| Mauser Packaging Solutions Holding Co., 5.50%, 4/15/24 (a) | 100,000 | 100,917 | |||||||||
Sealed Air Corp., 6.88%, 7/15/33 (a) | 70,000 | 88,988 | |||||||||
770,433 | |||||||||||
PHARMACEUTICALS - 2.3% | |||||||||||
AdaptHealth LLC, 6.13%, 8/1/28 (a) | 35,000 | 37,100 | |||||||||
| Bausch Health Americas, Inc., 8.50%, 1/31/27 (a) | 110,000 | 115,500 | |||||||||
Bausch Health Cos., Inc. | |||||||||||
5.50%, 11/1/25 (a) | 60,000 | 60,975 | |||||||||
7.00%, 1/15/28 (a) | 55,000 | 54,725 | |||||||||
5.00%, 1/30/28 (a) | 155,000 | 142,600 | |||||||||
7.25%, 5/30/29 (a) | 100,000 | 99,000 | |||||||||
| Endo Luxembourg Finance Co. I Sarl / Endo US, Inc., 6.13%, 4/1/29 (a) | 175,000 | 171,500 | |||||||||
| Herbalife Nutrition Ltd. / HLF Financing, Inc., 7.88%, 9/1/25 (a) | 75,000 | 79,687 | |||||||||
| Shares/ Principal | Fair Value | ||||||||||
PHARMACEUTICALS - 2.3% (Continued) | |||||||||||
| Horizon Therapeutics USA, Inc., 5.50%, 8/1/27 (a) | $ | 250,000 | $ | 262,687 | |||||||
Option Care Health, Inc., 4.38%, 10/31/29 (a) | 65,000 | 65,163 | |||||||||
Owens & Minor, Inc., 4.50%, 3/31/29 (a) | 60,000 | 61,500 | |||||||||
| P&L Development LLC / PLD Finance Corp., 7.75%, 11/15/25 (a) | 40,000 | 40,050 | |||||||||
Par Pharmaceutical, Inc., 7.50%, 4/1/27 (a) | 175,000 | 178,838 | |||||||||
PRA Health Sciences, Inc., 2.88%, 7/15/26 (a) | 100,000 | 100,125 | |||||||||
Vizient, Inc., 6.25%, 5/15/27 (a) | 20,000 | 20,875 | |||||||||
1,490,325 | |||||||||||
PIPELINES - 6.3% | |||||||||||
| Antero Midstream Partners LP / Antero Midstream Finance Corp. | |||||||||||
5.75%, 3/1/27 (a) | 20,000 | 20,725 | |||||||||
5.75%, 1/15/28 (a) | 65,000 | 68,161 | |||||||||
5.38%, 6/15/29 (a) | 110,000 | 114,950 | |||||||||
Buckeye Partners LP | |||||||||||
4.13%, 3/1/25 (a) | 25,000 | 25,813 | |||||||||
5.85%, 11/15/43 | 50,000 | 49,062 | |||||||||
| Cheniere Energy Partners LP, 3.25%, 1/31/32 (a) | 50,000 | 50,500 | |||||||||
Cheniere Energy, Inc., 4.63%, 10/15/28 | 40,000 | 42,300 | |||||||||
| CNX Midstream Partners LP, 4.75%, 4/15/30 (a) | 20,000 | 19,925 | |||||||||
| Crestwood Midstream Partners LP / Crestwood Midstream Finance Corp. | |||||||||||
5.75%, 4/1/25 | 100,000 | 102,250 | |||||||||
5.63%, 5/1/27 (a) | 150,000 | 152,813 | |||||||||
6.00%, 2/1/29 (a) | 105,000 | 109,068 | |||||||||
DCP Midstream Operating LP | |||||||||||
5.38%, 7/15/25 | 105,000 | 114,712 | |||||||||
5.60%, 4/1/44 | 70,000 | 87,080 | |||||||||
| Delek Logistics Partners LP / Delek Logistics Finance Corp., 7.13%, 6/1/28 (a) | 224,000 | 232,960 | |||||||||
DT Midstream, Inc. | |||||||||||
4.13%, 6/15/29 (a) | 35,000 | 35,831 | |||||||||
4.38%, 6/15/31 (a) | 35,000 | 36,400 | |||||||||
EnLink Midstream LLC | |||||||||||
5.63%, 1/15/28 (a) | 65,000 | 67,600 | |||||||||
5.38%, 6/1/29 | 100,000 | 102,250 | |||||||||
EnLink Midstream Partners LP | |||||||||||
4.15%, 6/1/25 | 75,000 | 77,813 | |||||||||
5.05%, 4/1/45 | 40,000 | 38,600 | |||||||||
5.45%, 6/1/47 | 75,000 | 75,667 | |||||||||
EQM Midstream Partners LP | |||||||||||
6.50%, 7/1/27 (a) | 160,000 | 179,200 | |||||||||
5.50%, 7/15/28 | 22,000 | 24,035 | |||||||||
6.50%, 7/15/48 | 28,000 | 34,020 | |||||||||
| Genesis Energy LP / Genesis Energy Finance Corp. | |||||||||||
6.50%, 10/1/25 | 120,000 | 118,500 | |||||||||
8.00%, 1/15/27 | 40,000 | 41,222 | |||||||||
See accompanying notes to financial statements.
62
Global Atlantic BlackRock High Yield Portfolio
Portfolio of Investments (Continued)
December 31, 2021
| Shares/ Principal | Fair Value | ||||||||||
PIPELINES - 6.3% (Continued) | |||||||||||
Global Partners LP / GLP Finance Corp. | |||||||||||
7.00%, 8/1/27 | $ | 50,000 | $ | 51,875 | |||||||
6.88%, 1/15/29 | 135,000 | 141,365 | |||||||||
Harvest Midstream I LP, 7.50%, 9/1/28 (a) | 25,000 | 26,750 | |||||||||
Hess Midstream Operations LP | |||||||||||
5.63%, 2/15/26 (a) | 95,000 | 97,850 | |||||||||
5.13%, 6/15/28 (a) | 50,000 | 52,062 | |||||||||
4.25%, 2/15/30 (a) | 160,000 | 158,800 | |||||||||
| Holly Energy Partners LP / Holly Energy Finance Corp., 5.00%, 2/1/28 (a) | 175,000 | 174,344 | |||||||||
| Howard Midstream Energy Partners LLC, 6.75%, 1/15/27 (a) | 85,000 | 87,100 | |||||||||
ITT Holdings LLC, 6.50%, 8/1/29 (a) | 65,000 | 64,350 | |||||||||
New Fortress Energy, Inc., 6.75%, 9/15/25 (a) | 65,000 | 65,650 | |||||||||
| Summit Midstream Holdings LLC / Summit Midstream Finance Corp., 8.50%, 10/15/26 (a) | 85,000 | 88,564 | |||||||||
| Tallgrass Energy Partners LP / Tallgrass Energy Finance Corp. | |||||||||||
5.50%, 1/15/28 (a) | 200,000 | 198,250 | |||||||||
6.00%, 12/31/30 (a) | 55,000 | 55,114 | |||||||||
| Targa Resources Partners LP / Targa Resources Partners Finance Corp. | |||||||||||
5.88%, 4/15/26 | 70,000 | 73,043 | |||||||||
5.00%, 1/15/28 | 100,000 | 105,370 | |||||||||
6.88%, 1/15/29 | 50,000 | 55,939 | |||||||||
5.50%, 3/1/30 | 25,000 | 27,312 | |||||||||
4.88%, 2/1/31 | 25,000 | 27,149 | |||||||||
4.00%, 1/15/32 (a) | 50,000 | 52,250 | |||||||||
| Venture Global Calcasieu Pass LLC, 4.13%, 8/15/31 (a) | 60,000 | 63,600 | |||||||||
Western Midstream Operating LP | |||||||||||
5.30%, 2/1/30 | 165,000 | 181,668 | |||||||||
5.30%, 3/1/48 | 120,000 | 144,600 | |||||||||
6.50%, 2/1/50 | 65,000 | 76,863 | |||||||||
4,091,325 | |||||||||||
REAL ESTATE - 0.5% | |||||||||||
| Five Point Operating Co. LP / Five Point Capital Corp., 7.88%, 11/15/25 (a) | 50,000 | 52,155 | |||||||||
| Greystar Real Estate Partners LLC, 5.75%, 12/1/25 (a) | 35,000 | 35,620 | |||||||||
| Howard Hughes Corp. (The), 4.38%, 2/1/31 (a) | 40,000 | 40,400 | |||||||||
Hunt Cos., Inc., 5.25%, 4/15/29 (a) | 30,000 | 29,550 | |||||||||
Kennedy-Wilson, Inc. | |||||||||||
4.75%, 2/1/30 | 100,000 | 101,371 | |||||||||
5.00%, 3/1/31 | 35,000 | 36,050 | |||||||||
295,146 | |||||||||||
REITS - 4.5% | |||||||||||
| Brookfield Property REIT, Inc. / BPR Cumulus LLC / BPR Nimbus LLC / GGSI Sellco LL, 4.50%, 4/1/27 (a) | 75,000 | 73,580 | |||||||||
| Shares/ Principal | Fair Value | ||||||||||
REITS - 4.5% (Continued) | |||||||||||
| Brookfield Property REIT, Inc. / BPR Cumulus LLC / BPR Nimbus LLC / GGSI Sellco LLC, 5.75%, 5/15/26 (a) | $ | 80,000 | $ | 82,800 | |||||||
| Iron Mountain Information Management Services, Inc., 5.00%, 7/15/32 (a) | 45,000 | 46,056 | |||||||||
Iron Mountain, Inc. | |||||||||||
4.88%, 9/15/27 (a) | 50,000 | 51,849 | |||||||||
5.25%, 7/15/30 (a) | 270,000 | 284,532 | |||||||||
4.50%, 2/15/31 (a) | 130,000 | 131,390 | |||||||||
5.63%, 7/15/32 (a) | 225,000 | 240,791 | |||||||||
iStar, Inc., 4.25%, 8/1/25 | 100,000 | 102,250 | |||||||||
| Ladder Capital Finance Holdings LLP / Ladder Capital Finance Corp. | |||||||||||
5.25%, 10/1/25 (a) | 50,000 | 50,500 | |||||||||
4.25%, 2/1/27 (a) | 25,000 | 25,163 | |||||||||
4.75%, 6/15/29 (a) | 55,000 | 56,375 | |||||||||
| MGM Growth Properties Operating Partnership LP / MGP Finance Co.-Issuer, Inc. | |||||||||||
5.63%, 5/1/24 | 500,000 | 534,360 | |||||||||
4.63%, 6/15/25 (a) | 40,000 | 42,600 | |||||||||
| MPT Operating Partnership LP / MPT Finance Corp., 5.00%, 10/15/27 | 150,000 | 156,937 | |||||||||
| New Residential Investment Corp., 6.25%, 10/15/25 (a) | 25,000 | 25,111 | |||||||||
| Park Intermediate Holdings LLC / PK Domestic Property LLC / PK Finance Co.-Issuer, 5.88%, 10/1/28 (a) | 185,000 | 192,400 | |||||||||
| RHP Hotel Properties LP / RHP Finance Corp., 4.50%, 2/15/29 (a) | 30,000 | 30,000 | |||||||||
Service Properties Trust, 4.65%, 3/15/24 | 50,000 | 49,375 | |||||||||
Starwood Property Trust, Inc. | |||||||||||
4.75%, 3/15/25 | 145,000 | 150,800 | |||||||||
3.63%, 7/15/26 (a) | 25,000 | 24,875 | |||||||||
| Uniti Group LP / Uniti Fiber Holdings, Inc. / CSL Capital LLC, 7.88%, 2/15/25 (a) | 150,000 | 156,563 | |||||||||
| Uniti Group LP / Uniti Group Finance, Inc. / CSL Capital LLC, 4.75%, 4/15/28 (a) | 100,000 | 99,173 | |||||||||
VICI Properties LP / VICI Note Co., Inc. | |||||||||||
4.25%, 12/1/26 (a) | 25,000 | 26,037 | |||||||||
3.75%, 2/15/27 (a) | 50,000 | 51,642 | |||||||||
4.63%, 12/1/29 (a) | 48,000 | 51,083 | |||||||||
4.13%, 8/15/30 (a) | 70,000 | 74,025 | |||||||||
XHR LP | |||||||||||
6.38%, 8/15/25 (a) | 55,000 | 58,175 | |||||||||
4.88%, 6/1/29 (a) | 25,000 | 25,438 | |||||||||
2,893,880 | |||||||||||
RETAIL - 4.5% | |||||||||||
1011778 BC ULC / New Red Finance, Inc. | |||||||||||
5.75%, 4/15/25 (a) | 40,000 | 41,500 | |||||||||
3.88%, 1/15/28 (a) | 50,000 | 50,638 | |||||||||
4.38%, 1/15/28 (a) | 40,000 | 40,800 | |||||||||
4.00%, 10/15/30 (a) | 123,000 | 120,848 | |||||||||
See accompanying notes to financial statements.
63
Global Atlantic BlackRock High Yield Portfolio
Portfolio of Investments (Continued)
December 31, 2021
| Shares/ Principal | Fair Value | ||||||||||
RETAIL - 4.5% (Continued) | |||||||||||
| Abercrombie & Fitch Management Co., 8.75%, 7/15/25 (a) | $ | 125,000 | $ | 134,594 | |||||||
Academy Ltd., 6.00%, 11/15/27 (a) | 75,000 | 79,969 | |||||||||
Asbury Automotive Group, Inc. | |||||||||||
4.75%, 3/1/30 | 70,000 | 71,137 | |||||||||
5.00%, 2/15/32 (a) | 40,000 | 41,508 | |||||||||
At Home Group, Inc., 4.88%, 7/15/28 (a) | 20,000 | 19,700 | |||||||||
Bath & Body Works, Inc. | |||||||||||
9.38%, 7/1/25 (a) | 9,000 | 10,980 | |||||||||
6.69%, 1/15/27 | 50,000 | 57,500 | |||||||||
5.25%, 2/1/28 | 25,000 | 27,625 | |||||||||
7.50%, 6/15/29 | 100,000 | 113,834 | |||||||||
6.63%, 10/1/30 (a) | 55,000 | 62,288 | |||||||||
6.88%, 11/1/35 | 325,000 | 403,812 | |||||||||
Beacon Roofing Supply, Inc., 4.13%, 5/15/29 (a) | 60,000 | 59,968 | |||||||||
BlueLinx Holdings, Inc., 6.00%, 11/15/29 (a) | 265,000 | 263,675 | |||||||||
Group 1 Automotive, Inc., 4.00%, 8/15/28 (a) | 130,000 | 129,512 | |||||||||
GYP Holdings III Corp., 4.63%, 5/1/29 (a) | 25,000 | 25,062 | |||||||||
IRB Holding Corp., 7.00%, 6/15/25 (a) | 60,000 | 63,478 | |||||||||
| KFC Holding Co./Pizza Hut Holdings LLC/ Taco Bell of America LLC, 4.75%, 6/1/27 (a) | 50,000 | 51,688 | |||||||||
| LCM Investments Holdings II LLC, 4.88%, 5/1/29 (a) | 20,000 | 20,554 | |||||||||
Macy's Retail Holdings LLC | |||||||||||
5.88%, 4/1/29 (a) | 60,000 | 63,975 | |||||||||
5.13%, 1/15/42 | 15,000 | 14,325 | |||||||||
4.30%, 2/15/43 | 30,000 | 26,325 | |||||||||
Michaels Cos., Inc. (The), 5.25%, 5/1/28 (a) | 50,000 | 49,938 | |||||||||
Murphy Oil USA, Inc., 4.75%, 9/15/29 | 100,000 | 105,250 | |||||||||
Nordstrom, Inc., 5.00%, 1/15/44 | 100,000 | 93,250 | |||||||||
| Sally Holdings LLC / Sally Capital, Inc., 5.63%, 12/1/25 | 100,000 | 102,250 | |||||||||
Sonic Automotive, Inc., 4.88%, 11/15/31 (a) | 32,000 | 32,310 | |||||||||
| Specialty Building Products Holdings LLC / SBP Finance Corp., 6.38%, 9/30/26 (a) | 45,000 | 47,163 | |||||||||
Staples, Inc., 7.50%, 4/15/26 (a) | 100,000 | 102,750 | |||||||||
| Superior Plus LP / Superior General Partner, Inc., 4.50%, 3/15/29 (a) | 20,000 | 20,557 | |||||||||
Victoria's Secret & Co., 4.63%, 7/15/29 (a) | 75,000 | 76,688 | |||||||||
Yum! Brands, Inc. | |||||||||||
7.75%, 4/1/25 (a) | 5,000 | 5,269 | |||||||||
4.75%, 1/15/30 (a) | 125,000 | 135,312 | |||||||||
3.63%, 3/15/31 | 100,000 | 99,625 | |||||||||
6.88%, 11/15/37 | 25,000 | 31,625 | |||||||||
5.35%, 11/1/43 | 50,000 | 55,125 | |||||||||
2,952,407 | |||||||||||
SEMICONDUCTORS - 0.6% | |||||||||||
Amkor Technology, Inc., 6.63%, 9/15/27 (a) | 100,000 | 105,692 | |||||||||
Entegris, Inc. | |||||||||||
4.38%, 4/15/28 (a) | 50,000 | 51,375 | |||||||||
3.63%, 5/1/29 (a) | 115,000 | 115,287 | |||||||||
Synaptics, Inc., 4.00%, 6/15/29 (a) | 110,000 | 111,650 | |||||||||
384,004 | |||||||||||
| Shares/ Principal | Fair Value | ||||||||||
SOFTWARE - 2.9% | |||||||||||
ACI Worldwide, Inc., 5.75%, 8/15/26 (a) | $ | 25,000 | $ | 26,062 | |||||||
Boxer Parent Co., Inc., 7.13%, 10/2/25 (a) | 15,000 | 15,731 | |||||||||
| Clarivate Science Holdings Corp., 3.88%, 7/1/28 (a) | 45,000 | 45,225 | |||||||||
Consensus Cloud Solutions, Inc. | |||||||||||
6.00%, 10/15/26 (a) | 70,000 | 72,807 | |||||||||
6.50%, 10/15/28 (a) | 95,000 | 99,275 | |||||||||
| Dun & Bradstreet Corp. (The), 6.88%, 8/15/26 (a) | 30,000 | 31,200 | |||||||||
Elastic NV, 4.13%, 7/15/29 (a) | 105,000 | 103,885 | |||||||||
Fair Isaac Corp., 4.00%, 6/15/28 (a) | 55,000 | 56,515 | |||||||||
MicroStrategy, Inc., 6.13%, 6/15/28 (a) | 20,000 | 20,050 | |||||||||
MSCI, Inc. | |||||||||||
4.00%, 11/15/29 (a) | 110,000 | 114,950 | |||||||||
3.63%, 9/1/30 (a) | 105,000 | 107,363 | |||||||||
3.88%, 2/15/31 (a) | 95,000 | 98,919 | |||||||||
3.25%, 8/15/33 (a) | 45,000 | 45,506 | |||||||||
| Nuance Communications, Inc., 5.63%, 12/15/26 | 100,000 | 103,166 | |||||||||
PTC, Inc. | |||||||||||
3.63%, 2/15/25 (a) | 75,000 | 76,031 | |||||||||
4.00%, 2/15/28 (a) | 45,000 | 45,788 | |||||||||
SS&C Technologies, Inc., 5.50%, 9/30/27 (a) | 200,000 | 209,000 | |||||||||
| Veritas US, Inc. / Veritas Bermuda Ltd., 7.50%, 9/1/25 (a) | 150,000 | 155,250 | |||||||||
Ziff Davis, Inc., 4.63%, 10/15/30 (a) | 270,000 | 276,923 | |||||||||
| ZoomInfo Technologies LLC/ZoomInfo Finance Corp., 3.88%, 2/1/29 (a) | 195,000 | 193,323 | |||||||||
1,896,969 | |||||||||||
TELECOMMUNICATIONS - 3.4% | |||||||||||
Altice France SA, 5.50%, 1/15/28 (a) | 200,000 | 198,254 | |||||||||
Avaya, Inc., 6.13%, 9/15/28 (a) | 125,000 | 132,500 | |||||||||
CommScope, Inc., 6.00%, 3/1/26 (a) | 65,000 | 66,950 | |||||||||
Embarq Corp., 8.00%, 6/1/36 | 25,000 | 28,000 | |||||||||
Frontier Communications Corp. | |||||||||||
5.88%, 10/15/27 (a) | 15,000 | 15,863 | |||||||||
5.00%, 5/1/28 (a) | 40,000 | 41,200 | |||||||||
Hughes Satellite Systems Corp., 5.25%, 8/1/26 | 35,000 | 38,281 | |||||||||
LogMeIn, Inc., 5.50%, 9/1/27 (a) | 55,000 | 55,660 | |||||||||
Lumen Technologies, Inc. | |||||||||||
6.88%, 1/15/28 | 34,000 | 37,825 | |||||||||
5.38%, 6/15/29 (a) | 31,000 | 31,000 | |||||||||
7.60%, 9/15/39 | 50,000 | 53,625 | |||||||||
7.65%, 3/15/42 | 140,000 | 150,653 | |||||||||
Nokia Oyj, 4.38%, 6/12/27 | 100,000 | 108,000 | |||||||||
Sable International Finance Ltd., 5.75%, 9/7/27 (a) | 25,000 | 25,594 | |||||||||
Sprint Capital Corp. | |||||||||||
6.88%, 11/15/28 | 100,000 | 126,500 | |||||||||
8.75%, 3/15/32 | 60,000 | 90,000 | |||||||||
Sprint Corp., 7.63%, 3/1/26 | 50,000 | 60,030 | |||||||||
Telecom Italia Capital SA | |||||||||||
6.38%, 11/15/33 | 75,000 | 80,760 | |||||||||
6.00%, 9/30/34 | 50,000 | 52,883 | |||||||||
See accompanying notes to financial statements.
64
Global Atlantic BlackRock High Yield Portfolio
Portfolio of Investments (Continued)
December 31, 2021
| Shares/ Principal | Fair Value | ||||||||||
TELECOMMUNICATIONS - 3.4% (Continued) | |||||||||||
Telesat Canada / Telesat LLC | |||||||||||
5.63%, 12/6/26 (a) | $ | 20,000 | $ | 18,782 | |||||||
4.88%, 6/1/27 (a) | 75,000 | 66,375 | |||||||||
6.50%, 10/15/27 (a) | 305,000 | 236,680 | |||||||||
T-Mobile USA, Inc. | |||||||||||
4.75%, 2/1/28 | 150,000 | 157,875 | |||||||||
2.88%, 2/15/31 | 45,000 | 44,442 | |||||||||
Viasat, Inc., 5.63%, 4/15/27 (a) | 150,000 | 154,500 | |||||||||
| Windstream Escrow LLC / Windstream Escrow Finance Corp., 7.75%, 8/15/28 (a) | 80,000 | 84,837 | |||||||||
Zayo Group Holdings, Inc., 4.00%, 3/1/27 (a) | 80,000 | 78,800 | |||||||||
2,235,869 | |||||||||||
TRANSPORTATION - 0.3% | |||||||||||
Danaos Corp., 8.50%, 3/1/28 (a) | 133,000 | 145,635 | |||||||||
| First Student Bidco, Inc. / First Transit Parent, Inc., 4.00%, 7/31/29 (a) | 15,000 | 14,580 | |||||||||
XPO Logistics, Inc., 6.25%, 5/1/25 (a) | 35,000 | 36,619 | |||||||||
196,834 | |||||||||||
TRUCKING & LEASING - 0.8% | |||||||||||
| Fortress Transportation and Infrastructure Investors LLC | |||||||||||
6.50%, 10/1/25 (a) | 165,000 | 170,569 | |||||||||
9.75%, 8/1/27 (a) | 315,000 | 352,800 | |||||||||
523,369 | |||||||||||
| Shares/ Principal | Fair Value | ||||||||||
WATER - 0.0%† | |||||||||||
| Solaris Midstream Holdings LLC, 7.63%, 4/1/26 (a) | $ | 20,000 | $ | 21,000 | |||||||
| TOTAL CORPORATE BONDS AND NOTES (Cost - $60,735,840) | 62,891,265 | ||||||||||
SHORT-TERM INVESTMENTS - 2.1% | |||||||||||
MONEY MARKET FUNDS - 2.1% | |||||||||||
| Fidelity Investments Money Market Fund - Government Portfolio, Institutional Class, 0.01% (d) (Cost - $1,358,562) | 1,358,562 | 1,358,562 | |||||||||
| TOTAL INVESTMENTS - 98.8% (Cost - $62,094,402) | $ | 64,249,827 | |||||||||
| OTHER ASSETS LESS LIABILITIES - NET 1.2% | 761,426 | ||||||||||
TOTAL NET ASSETS - 100.0% | $ | 65,011,253 | |||||||||
† Represents less than 0.05%.
(a) 144A - Security was purchased pursuant to Rule 144a under the Securities Act of 1933 and may not be resold subject to that rule, except to qualified institutional buyers. As of December 31, 2021, these securities amounted to $44,636,393 or 68.7% of net assets.
(b) PIK - Pay-in-kind security.
(c) Variable rate security. The rate shown is the rate in effect at period end.
(d) The rate shown is the annualized seven-day yield at period end.
CMT - Treasury Constant Maturity Rate
PLC - Public Limited Company
REIT - Real Estate Investment Trust
FUTURES CONTRACTS | |||||||||||||||||||||||
LONG FUTURES CONTRACTS | Counterparty | Number of Contracts | Expiration Date | Notional Value | Fair Value/ Unrealized Appreciation (Depreciation) | ||||||||||||||||||
U.S. 10 Year Note Future | Goldman Sachs & Co | 4 | 3/22/2022 | $ | 521,875 | $ | 3,104 | ||||||||||||||||
U.S. 10 Year Ultra Future | Goldman Sachs & Co | 4 | 3/22/2022 | 585,750 | 7,736 | ||||||||||||||||||
U.S. 2 Year Note Future | Goldman Sachs & Co | 2 | 3/31/2022 | 436,344 | (391 | ) | |||||||||||||||||
U.S. 5 Year Note Future | Goldman Sachs & Co | 9 | 3/31/2022 | 1,088,789 | 878 | ||||||||||||||||||
TOTAL NET UNREALIZED APPRECIATION ON FUTURES CONTRACTS | $ | 11,327 | |||||||||||||||||||||
See accompanying notes to financial statements.
65
Global Atlantic Goldman Sachs Core Fixed Income Portfolio
Portfolio Review
December 31, 2021 (Unaudited)
Investment Objective
The Portfolio seeks to provide total return consisting of capital appreciation and income.
Management Review
The Portfolio is sub-advised by Goldman Sachs Asset Management, L.P. ("GSAM").
How did the Portfolio perform during the period?
During 2021, the Class I shares of Global Atlantic Goldman Sachs Core Fixed Income Portfolio underperformed its reference benchmark, the Bloomberg U.S. Aggregate Bond Index. The Portfolio posted a return of -1.98% compared to a benchmark return of -1.54%, a difference of -44 basis points. The following discussion of relative performance pertains to this benchmark.
What factors and allocation decisions influenced the Portfolio's performance?
During 2021, key detractors to performance were the Portfolio's duration, country, and currency positioning, which more than offset contributions from sector and security selection. The Portfolio's duration and yield curve positioning detracted from performance, due to its overweight to Canadian and Australian interest rates and its underweight U.K. interest rates positioning. The Portfolio's overweight to Canadian and Australian interest rates detracted in February 2021, due to a global sell-off in real interest rates and, again, in October 2021, due to rising front-end interest rates. The Portfolio's country strategy also detracted from performance due to an overweight to Australian and Canadian versus other developed market interest rates. Underperformance was caused by global rates selling off in February and October of 2021. The currency strategy did not materially impact performance over the period.
Cross-sector positioning added to returns due to the Portfolio's overweight to investment-grade corporates and collateralized loan obligations, and an underweight to agency mortgage-backed securities. The Portfolio's credit hedge, which combines overweight interest rates and currency with overweight corporate credit, detracted from performance due to a global interest rate sell off in the beginning of 2021.
The Portfolio's security selection contributed to performance, most notably with respect to its government/swaps strategy, the selection of Metropolitan Transit Authority and the State of Illinois bonds. Corporate selection slightly contributed to returns, due to the Portfolio's overweight to intermediate-term corporate bonds and down-in-quality bias, where the Portfolio is overweight lower quality investment-grade bonds. Additionally, the Portfolio's preference for short- and intermediate-maturity versus long-maturity bonds added to performance. However, the securitized selection strategy detracted from performance, as the bias for Ginnie Mae versus Freddie Mac and Fannie Mae mortgage-backed securities was the main detractor from performance within the strategy.
How was the Portfolio positioned at period end?
At the period end, the Portfolio was overweight to front-end Canadian and Australian rates. Across sectors, the Portfolio was underweight U.S. Treasuries and government securities, overweight asset-backed securities (notably high-quality collateralized loan obligations), underweight agency mortgage-backed securities, overweight to corporate credit, and slightly overweight emerging market debt at the end of the period. The Portfolio was underweight U.S. rates (overweight in the strategy due to systematic rates strategies) and underweight to U.K. rates at the end of the period. The Portfolio held an overweight position to corporate credit, with a preference for lower-quality investment-grade corporate bonds and shorter-dated corporate securities at the end of the period. The Portfolio retains this down-in-quality bias, with a preference for BBB-rated bonds.
The Portfolio also increased its underweight exposure to agency mortgage-backed securities over the period and overweight exposure to asset-backed securities. GSAM expects continued underperformance in mortgage-backed securities in the near term. GSAM believes mortgage-backed securities valuations are expensive due to continued purchases under the U.S. Federal
66
Global Atlantic Goldman Sachs Core Fixed Income Portfolio
Portfolio Review (Continued)
December 31, 2021 (Unaudited)
Reserve's (the "Fed") quantitative easing program. GSAM expects that the Fed's tapering of mortgage-backed securities purchases will end balance sheet expansion by March 2022, and there is potential for an accelerated rundown of its balance sheet ("quantitative tightening") as early as the third quarter of 2022. GSAM believes that mortgage-backed securities supply will remain elevated given the buoyant housing market, at a time when the Fed is pulling away.
The Portfolio's performance figures for the periods ended December 31, 2021 as compared to its benchmark:
Annualized | Operating Expense** | ||||||||||||||||||||||
| Inception Date* | One Year | Since Inception | Gross Ratio | Net Ratio | |||||||||||||||||||
Global Atlantic Goldman Sachs Core Fixed Income Portfolio | |||||||||||||||||||||||
Class I | November 1, 2017 | -1.98 | % | 3.76 | % | 0.51 | % | 0.49 | % | ||||||||||||||
Bloomberg U.S. Aggregate Bond Index^ | -1.54 | % | 3.52 | % | |||||||||||||||||||
The performance data quoted is historical. Past performance is no guarantee of future results. Current performance may be higher or lower than the performance data quoted. The principal value and investment return of an investment will fluctuate so that your shares, when redeemed, may be worth more or less than their original cost. Total returns would have been lower absent fee waivers by the Adviser. Performance figures for periods greater than one year are annualized. The returns shown do not reflect the deduction of taxes that a shareholder may pay on Portfolio distributions or on the redemption of Portfolio shares, as well as other charges and expenses of the insurance contract or separate account.
* Commencement of operations is November 6, 2017.
** The estimated operating expense ratios for Class I shares, as disclosed in the most recent prospectus dated May 1, 2021. Ratios include Acquired Fund Fees and Expenses indirectly incurred by the Portfolio. The operating expense ratios presented here may differ from the expense ratios disclosed in the Financial Highlights table in this report.
^ The Bloomberg U.S. Aggregate Bond Index represents an unmanaged diversified portfolio of fixed income securities, including U.S. Treasuries, investment-grade corporate bonds, and mortgage-backed and asset-backed securities. It is not possible to invest directly in an index.
Comparison of the Change in Value of a $10,000 Investment

67
Global Atlantic Goldman Sachs Core Fixed Income Portfolio
Portfolio Review (Continued)
December 31, 2021 (Unaudited)
Holdings by Asset Class | % of Net Assets | ||||||
Corporate Bonds and Notes | 44.1 | % | |||||
U.S. Treasury Securities and Agency Bonds | 15.6 | % | |||||
Agency Mortgage Backed Securities | 19.6 | % | |||||
Short-Term Investments | 14.9 | % | |||||
Asset Backed and Commercial Backed Securities | 8.8 | % | |||||
Municipal Bonds | 1.4 | % | |||||
Sovereign Debts | 1.7 | % | |||||
Other Assets less Liabilities - Net | (6.1 | )% | |||||
100.0 | % | ||||||
Please refer to the Portfolio of Investments in this annual report for more information regarding the Portfolio's holdings as of December 31, 2021.
Derivative exposure is included in "Other Assets Less Liabilities - Net".
68
Global Atlantic Goldman Sachs Core Fixed Income Portfolio
Portfolio of Investments
December 31, 2021
| Shares/ Principal | Fair Value | ||||||||||
CORPORATE BONDS AND NOTES - 44.1% | |||||||||||
AEROSPACE & DEFENSE - 1.2% | |||||||||||
Boeing Co. (The) | |||||||||||
2.60%, 10/30/25 | $ | 150,000 | $ | 154,169 | |||||||
3.45%, 11/1/28 | 100,000 | 104,653 | |||||||||
Northrop Grumman Corp. | |||||||||||
3.25%, 1/15/28 | 300,000 | 321,308 | |||||||||
4.75%, 6/1/43 | 50,000 | 63,072 | |||||||||
Raytheon Technologies Corp. | |||||||||||
3.95%, 8/16/25 | 275,000 | 298,279 | |||||||||
4.05%, 5/4/47 | 50,000 | 58,053 | |||||||||
999,534 | |||||||||||
AGRICULTURE - 0.2% | |||||||||||
BAT Capital Corp. | |||||||||||
2.26%, 3/25/28 | 150,000 | 146,285 | |||||||||
4.76%, 9/6/49 | 25,000 | 26,930 | |||||||||
173,215 | |||||||||||
AUTO MANUFACTURERS - 0.5% | |||||||||||
General Motors Co., 4.00%, 4/1/25 | 50,000 | 53,499 | |||||||||
General Motors Financial Co., Inc. | |||||||||||
4.30%, 7/13/25 | 75,000 | 80,877 | |||||||||
1.50%, 6/10/26 | 125,000 | 123,051 | |||||||||
5.65%, 1/17/29 | 25,000 | 29,670 | |||||||||
2.35%, 1/8/31 | 125,000 | 121,802 | |||||||||
408,899 | |||||||||||
BANKS - 12.1% | |||||||||||
Banco Santander SA | |||||||||||
2.75%, 5/28/25 | 200,000 | 206,806 | |||||||||
4.25%, 4/11/27 | 200,000 | 220,022 | |||||||||
Bank of America Corp. | |||||||||||
| 3.86%, (3 Month US Libor + 0.94%), 7/23/24 (a) | 50,000 | 52,098 | |||||||||
4.20%, 8/26/24 | 165,000 | 176,899 | |||||||||
4.18%, 11/25/27 | 25,000 | 27,370 | |||||||||
| 3.42%, (3 Month US Libor + 1.04%), 12/20/28 (a) | 108,000 | 115,390 | |||||||||
| 4.27%, (3 Month US Libor + 1.31%), 7/23/29 (a) | 125,000 | 139,478 | |||||||||
| 2.88%, (3 Month US Libor + 1.19%), 10/22/30 (a) | 100,000 | 103,354 | |||||||||
| 2.50%, (3 Month US Libor + 0.99%), 2/13/31 (a) | 25,000 | 25,089 | |||||||||
2.59%, (SOFR + 2.15%), 4/29/31 (a) | 375,000 | 379,204 | |||||||||
1.90%, (SOFR + 1.53%), 7/23/31 (a) | 100,000 | 95,811 | |||||||||
| 2.48%, (US 5 Year CMT T-Note + 1.20%), 9/21/36 (a) | 75,000 | 72,736 | |||||||||
6.11%, 1/29/37 | 100,000 | 134,787 | |||||||||
Barclays PLC | |||||||||||
| 4.61%, (3 Month US Libor + 1.40%), 2/15/23 (a) | 225,000 | 225,964 | |||||||||
2.85%, (SOFR + 2.71%), 5/7/26 (a) | 200,000 | 206,358 | |||||||||
| Shares/ Principal | Fair Value | ||||||||||
BANKS - 12.1% (Continued) | |||||||||||
BNP Paribas SA | |||||||||||
3.38%, 1/9/25 (b) | $ | 252,000 | $ | 264,699 | |||||||
1.32%, (SOFR + 1.00%), 1/13/27 (a),(b) | 225,000 | 219,051 | |||||||||
| BPCE SA | |||||||||||
4.00%, 9/12/23(b) | 250,000 | 261,793 | |||||||||
3.12%, (SOFR + 1.73%), 10/19/32 (a),(b) | 250,000 | 251,089 | |||||||||
Citigroup, Inc. | |||||||||||
| 4.04%, (3 Month US Libor + 1.02%), 6/1/24 (a) | 105,000 | 109,440 | |||||||||
4.60%, 3/9/26 | 75,000 | 82,748 | |||||||||
3.40%, 5/1/26 | 200,000 | 214,566 | |||||||||
4.45%, 9/29/27 | 125,000 | 139,461 | |||||||||
| 3.67%, (3 Month US Libor + 1.39%), 7/24/28 (a) | 50,000 | 53,963 | |||||||||
4.13%, 7/25/28 | 100,000 | 109,820 | |||||||||
2.98%, (SOFR + 1.42%), 11/5/30 (a) | 100,000 | 103,945 | |||||||||
Comerica Bank, 2.50%, 7/23/24 | 300,000 | 309,796 | |||||||||
Credit Suisse Group AG, 4.55%, 4/17/26 | 255,000 | 281,089 | |||||||||
Deutsche Bank AG | |||||||||||
2.22%, (SOFR + 2.16%), 9/18/24 (a) | 150,000 | 151,945 | |||||||||
2.13%, (SOFR + 1.87%), 11/24/26 (a) | 225,000 | 224,741 | |||||||||
Fifth Third Bancorp, 2.38%, 1/28/25 | 85,000 | 87,292 | |||||||||
| HSBC Holdings PLC, 1.65%, (SOFR + 1.54%), 4/18/26 (a) | 225,000 | 223,229 | |||||||||
| Huntington Bancshares, Inc., 4.00%, 5/15/25 | 150,000 | 161,398 | |||||||||
ING Groep NV, 4.63%, 1/6/26 (b) | 225,000 | 250,135 | |||||||||
JPMorgan Chase & Co. | |||||||||||
| 3.56%, (3 Month US Libor + 0.73%), 4/23/24 (a) | 40,000 | 41,339 | |||||||||
| 3.80%, (3 Month US Libor + 0.89%), 7/23/24 (a) | 50,000 | 52,114 | |||||||||
| 4.02%, (3 Month US Libor + 1.00%), 12/5/24 (a) | 125,000 | 131,811 | |||||||||
2.30%, (SOFR + 1.16%), 10/15/25 (a) | 150,000 | 153,440 | |||||||||
3.30%, 4/1/26 | 225,000 | 239,944 | |||||||||
| 3.96%, (3 Month US Libor + 1.25%), 1/29/27 (a) | 175,000 | 189,179 | |||||||||
| 3.51%, (3 Month US Libor + 0.95%), 1/23/29 (a) | 125,000 | 134,006 | |||||||||
2.96%, (SOFR + 2.52%), 5/13/31 (a) | 50,000 | 51,821 | |||||||||
| Macquarie Group Ltd., 1.34%, (SOFR + 1.07%), 1/12/27 (a),(b) | 75,000 | 73,008 | |||||||||
| Mitsubishi UFJ Financial Group, Inc., 3.75%, 7/18/39 | 225,000 | 255,735 | |||||||||
Morgan Stanley | |||||||||||
| 3.74%, (3 Month US Libor + 0.85%), 4/24/24 (a) | 50,000 | 51,731 | |||||||||
3.70%, 10/23/24 | 275,000 | 292,924 | |||||||||
2.72%, (SOFR + 1.15%), 7/22/25 (a) | 75,000 | 77,303 | |||||||||
3.63%, 1/20/27 | 400,000 | 433,928 | |||||||||
3.95%, 4/23/27 | 75,000 | 82,517 | |||||||||
See accompanying notes to financial statements.
69
Global Atlantic Goldman Sachs Core Fixed Income Portfolio
Portfolio of Investments (Continued)
December 31, 2021
| Shares/ Principal | Fair Value | ||||||||||
BANKS - 12.1% (Continued) | |||||||||||
| 4.43%, (3 Month US Libor + 1.63%), 1/23/30 (a) | $ | 50,000 | $ | 57,026 | |||||||
1.79%, (SOFR + 1.03%), 2/13/32 (a) | 125,000 | 118,454 | |||||||||
2.48%, (SOFR + 1.36%), 9/16/36 (a) | 125,000 | 120,357 | |||||||||
| NatWest Group PLC, 4.52%, (3 Month US Libor + 1.55%), 6/25/24 (a) | 300,000 | 313,891 | |||||||||
| Standard Chartered PLC, 4.25%, (3 Month US Libor + 1.15%), 1/20/23 (a),(b) | 375,000 | 375,538 | |||||||||
Wells Fargo & Co. | |||||||||||
3.75%, 1/24/24 | 55,000 | 57,795 | |||||||||
3.55%, 9/29/25 | 125,000 | 133,258 | |||||||||
3.00%, 10/23/26 | 325,000 | 341,644 | |||||||||
4.30%, 7/22/27 | 100,000 | 111,480 | |||||||||
4.15%, 1/24/29 | 25,000 | 28,008 | |||||||||
| Westpac Banking Corp., 4.11%, (US 5 Year CMT T-Note + 2.00%), 7/24/34 (a) | 75,000 | 81,012 | |||||||||
9,680,829 | |||||||||||
BEVERAGES - 1.4% | |||||||||||
| Anheuser-Busch Cos., LLC / Anheuser-Busch InBev Worldwide, Inc. | |||||||||||
4.70%, 2/1/36 | 200,000 | 241,708 | |||||||||
4.90%, 2/1/46 | 300,000 | 380,356 | |||||||||
Constellation Brands, Inc. | |||||||||||
4.40%, 11/15/25 | 200,000 | 219,321 | |||||||||
3.60%, 2/15/28 | 100,000 | 108,051 | |||||||||
3.15%, 8/1/29 | 125,000 | 131,957 | |||||||||
Keurig Dr Pepper, Inc. | |||||||||||
5.09%, 5/25/48 | 25,000 | 32,727 | |||||||||
3.80%, 5/1/50 | 25,000 | 27,701 | |||||||||
1,141,821 | |||||||||||
BIOTECHNOLOGY - 0.4% | |||||||||||
Amgen, Inc., 3.13%, 5/1/25 | 175,000 | 184,532 | |||||||||
Royalty Pharma PLC, 1.20%, 9/2/25 | 100,000 | 97,936 | |||||||||
282,468 | |||||||||||
BUILDING MATERIALS - 0.4% | |||||||||||
Carrier Global Corp. | |||||||||||
2.49%, 2/15/27 | 225,000 | 231,290 | |||||||||
2.72%, 2/15/30 | 75,000 | 76,667 | |||||||||
Masco Corp., 1.50%, 2/15/28 | 50,000 | 48,436 | |||||||||
356,393 | |||||||||||
CHEMICALS - 0.4% | |||||||||||
| DuPont de Nemours, Inc., 4.21%, 11/15/23 | 175,000 | 185,078 | |||||||||
| International Flavors & Fragrances, Inc., 1.83%, 10/15/27 (b) | 100,000 | 98,245 | |||||||||
283,323 | |||||||||||
| Shares/ Principal | Fair Value | ||||||||||
COMMERCIAL SERVICES - 0.7% | |||||||||||
Emory University, 2.14%, 9/1/30 | $ | 160,000 | $ | 162,386 | |||||||
Global Payments, Inc., 2.65%, 2/15/25 | 75,000 | 77,105 | |||||||||
PayPal Holdings, Inc., 1.65%, 6/1/25 | 225,000 | 227,847 | |||||||||
S&P Global, Inc., 2.95%, 1/22/27 | 50,000 | 52,822 | |||||||||
520,160 | |||||||||||
COMPUTERS - 1.2% | |||||||||||
Amdocs Ltd., 2.54%, 6/15/30 | 75,000 | 74,406 | |||||||||
Apple, Inc., 3.25%, 2/23/26 | 175,000 | 187,157 | |||||||||
Dell International LLC / EMC Corp. | |||||||||||
5.45%, 6/15/23 | 54,000 | 56,969 | |||||||||
5.85%, 7/15/25 | 25,000 | 28,348 | |||||||||
6.02%, 6/15/26 | 200,000 | 231,285 | |||||||||
Hewlett Packard Enterprise Co. | |||||||||||
4.45%, 10/2/23 | 225,000 | 237,443 | |||||||||
4.90%, 10/15/25 | 50,000 | 55,480 | |||||||||
6.35%, 10/15/45 | 60,000 | 80,588 | |||||||||
951,676 | |||||||||||
DIVERSIFIED FINANCIAL SERVICES - 2.4% | |||||||||||
| AerCap Ireland Capital DAC / AerCap Global Aviation Trust | |||||||||||
4.88%, 1/16/24 | 175,000 | 186,129 | |||||||||
2.45%, 10/29/26 | 225,000 | 226,994 | |||||||||
Air Lease Corp. | |||||||||||
2.30%, 2/1/25 | 175,000 | 177,465 | |||||||||
3.38%, 7/1/25 | 100,000 | 104,386 | |||||||||
2.88%, 1/15/26 | 75,000 | 77,397 | |||||||||
3.75%, 6/1/26 | 175,000 | 185,620 | |||||||||
Ally Financial, Inc., 2.20%, 11/2/28 | 100,000 | 99,422 | |||||||||
American Express Co. | |||||||||||
2.50%, 7/30/24 | 35,000 | 36,167 | |||||||||
3.63%, 12/5/24 | 175,000 | 187,022 | |||||||||
| Aviation Capital Group LLC, 1.95%, 1/30/26 (b) | 75,000 | 73,191 | |||||||||
Avolon Holdings Funding Ltd. | |||||||||||
3.95%, 7/1/24 (b) | 75,000 | 78,604 | |||||||||
2.88%, 2/15/25 (b) | 150,000 | 153,285 | |||||||||
4.25%, 4/15/26 (b) | 25,000 | 26,506 | |||||||||
Capital One Financial Corp. | |||||||||||
3.50%, 6/15/23 | 75,000 | 77,724 | |||||||||
3.30%, 10/30/24 | 65,000 | 68,425 | |||||||||
| Intercontinental Exchange, Inc., 3.00%, 6/15/50 | 50,000 | 50,660 | |||||||||
Nasdaq, Inc., 3.25%, 4/28/50 | 25,000 | 25,514 | |||||||||
Visa, Inc., 3.15%, 12/14/25 | 100,000 | 106,631 | |||||||||
1,941,142 | |||||||||||
See accompanying notes to financial statements.
70
Global Atlantic Goldman Sachs Core Fixed Income Portfolio
Portfolio of Investments (Continued)
December 31, 2021
| Shares/ Principal | Fair Value | ||||||||||
ELECTRIC - 3.1% | |||||||||||
| Alliant Energy Finance LLC, 3.75%, 6/15/23 (b) | $ | 50,000 | $ | 51,795 | |||||||
Ameren Corp., 3.50%, 1/15/31 | 25,000 | 26,998 | |||||||||
| American Electric Power Co., Inc., 2.30%, 3/1/30 | 50,000 | 48,796 | |||||||||
Avangrid, Inc., 3.20%, 4/15/25 | 50,000 | 52,566 | |||||||||
| Berkshire Hathaway Energy Co., 6.13%, 4/1/36 | 74,000 | 100,861 | |||||||||
Dominion Energy, Inc. | |||||||||||
3.07%, 8/15/24 (c) | 175,000 | 181,179 | |||||||||
3.38%, 4/1/30 | 50,000 | 53,110 | |||||||||
| Duke Energy Carolinas LLC, 3.95%, 3/15/48 | 25,000 | 28,898 | |||||||||
Duke Energy Corp., 3.15%, 8/15/27 | 200,000 | 210,502 | |||||||||
| Duquesne Light Holdings, Inc., 2.53%, 10/1/30 (b) | 100,000 | 97,858 | |||||||||
| Enel Finance International NV, 1.88%, 7/12/28 (b) | 200,000 | 195,163 | |||||||||
Entergy Corp., 2.95%, 9/1/26 | 175,000 | 182,585 | |||||||||
Exelon Corp., 4.05%, 4/15/30 | 50,000 | 55,606 | |||||||||
FirstEnergy Corp. | |||||||||||
2.65%, 3/1/30 | 150,000 | 148,125 | |||||||||
2.25%, 9/1/30 | 50,000 | 48,187 | |||||||||
| NextEra Energy Capital Holdings, Inc., 1.90%, 6/15/28 | 80,000 | 79,225 | |||||||||
NRG Energy, Inc., 3.75%, 6/15/24 (b) | 150,000 | 156,537 | |||||||||
Pacific Gas and Electric Co. | |||||||||||
2.10%, 8/1/27 | 25,000 | 24,153 | |||||||||
2.50%, 2/1/31 | 50,000 | 47,653 | |||||||||
3.30%, 8/1/40 | 25,000 | 23,239 | |||||||||
3.50%, 8/1/50 | 50,000 | 46,477 | |||||||||
Sempra Energy, 3.40%, 2/1/28 | 125,000 | 133,162 | |||||||||
| Southern California Edison Co., 4.20%, 3/1/29 | 100,000 | 111,573 | |||||||||
Southern Co. (The), 3.25%, 7/1/26 | 350,000 | 370,435 | |||||||||
2,474,683 | |||||||||||
ENGINEERING & CONSTRUCTION - 0.3% | |||||||||||
| Mexico City Airport Trust, 3.88%, 4/30/28 (b) | 200,000 | 207,200 | |||||||||
ENVIRONMENTAL CONTROL - 0.2% | |||||||||||
Republic Services, Inc., 2.50%, 8/15/24 | 150,000 | 154,390 | |||||||||
FOOD - 0.3% | |||||||||||
Mars, Inc., 2.70%, 4/1/25 (b) | 50,000 | 52,014 | |||||||||
Sysco Corp. | |||||||||||
4.45%, 3/15/48 | 25,000 | 29,514 | |||||||||
6.60%, 4/1/50 | 25,000 | 38,961 | |||||||||
Tyson Foods, Inc., 3.90%, 9/28/23 | 125,000 | 130,838 | |||||||||
251,327 | |||||||||||
| Shares/ Principal | Fair Value | ||||||||||
GAS - 0.6% | |||||||||||
| East Ohio Gas Co. (The), 1.30%, 6/15/25 (b) | $ | 50,000 | $ | 49,335 | |||||||
NiSource, Inc. | |||||||||||
3.49%, 5/15/27 | 400,000 | 429,641 | |||||||||
3.60%, 5/1/30 | 25,000 | 26,972 | |||||||||
505,948 | |||||||||||
HEALTHCARE-PRODUCTS - 0.8% | |||||||||||
Baxter International, Inc. | |||||||||||
2.27%, 12/1/28 (b) | 75,000 | 75,610 | |||||||||
2.54%, 2/1/32 (b) | 75,000 | 75,857 | |||||||||
DENTSPLY SIRONA, Inc., 3.25%, 6/1/30 | 50,000 | 52,866 | |||||||||
| DH Europe Finance II SARL, 2.20%, 11/15/24 | 125,000 | 127,762 | |||||||||
| STERIS Irish FinCo UnLtd Co., 2.70%, 3/15/31 | 75,000 | 75,726 | |||||||||
Thermo Fisher Scientific, Inc. | |||||||||||
3.65%, 12/15/25 | 200,000 | 214,814 | |||||||||
1.75%, 10/15/28 | 25,000 | 24,859 | |||||||||
647,494 | |||||||||||
HEALTHCARE-SERVICES - 0.9% | |||||||||||
Adventist Health System, 2.95%, 3/1/29 | 25,000 | 26,154 | |||||||||
Banner Health, 2.34%, 1/1/30 | 145,000 | 146,913 | |||||||||
| Baylor Scott & White Holdings, 1.78%, 11/15/30 | 50,000 | 48,308 | |||||||||
CommonSpirit Health, 3.91%, 10/1/50 | 110,000 | 122,823 | |||||||||
Rush Obligated Group, 3.92%, 11/15/29 | 60,000 | 67,075 | |||||||||
Stanford Health Care, 3.31%, 8/15/30 | 35,000 | 37,644 | |||||||||
Sutter Health | |||||||||||
2.29%, 8/15/30 | 25,000 | 24,990 | |||||||||
4.09%, 8/15/48 | 225,000 | 265,338 | |||||||||
739,245 | |||||||||||
INSURANCE - 0.9% | |||||||||||
AIA Group Ltd., 3.20%, 3/11/25 (b) | 200,000 | 208,394 | |||||||||
| American International Group, Inc., 3.90%, 4/1/26 | 175,000 | 189,759 | |||||||||
| New York Life Insurance Co., 3.75%, 5/15/50 (b) | 50,000 | 57,114 | |||||||||
Principal Financial Group, Inc. | |||||||||||
3.10%, 11/15/26 | 75,000 | 78,868 | |||||||||
2.13%, 6/15/30 | 100,000 | 98,969 | |||||||||
Willis North America, Inc., 2.95%, 9/15/29 | 50,000 | 51,232 | |||||||||
XLIT Ltd., 4.45%, 3/31/25 | 50,000 | 54,220 | |||||||||
738,556 | |||||||||||
INTERNET - 0.1% | |||||||||||
Expedia Group, Inc., 2.95%, 3/15/31 | 50,000 | 49,984 | |||||||||
IRON & STEEL - 0.0%† | |||||||||||
Steel Dynamics, Inc., 2.40%, 6/15/25 | 30,000 | 30,706 | |||||||||
See accompanying notes to financial statements.
71
Global Atlantic Goldman Sachs Core Fixed Income Portfolio
Portfolio of Investments (Continued)
December 31, 2021
| Shares/ Principal | Fair Value | ||||||||||
MEDIA - 0.9% | |||||||||||
Comcast Corp. | |||||||||||
3.70%, 4/15/24 | $ | 150,000 | $ | 159,389 | |||||||
3.95%, 10/15/25 | 125,000 | 136,527 | |||||||||
3.30%, 4/1/27 | 125,000 | 134,436 | |||||||||
3.75%, 4/1/40 | 25,000 | 28,062 | |||||||||
Fox Corp., 4.03%, 1/25/24 | 75,000 | 79,219 | |||||||||
Walt Disney Co. (The), 3.70%, 9/15/24 | 200,000 | 212,569 | |||||||||
750,202 | |||||||||||
MINING - 0.6% | |||||||||||
Glencore Funding LLC | |||||||||||
4.63%, 4/29/24 (b) | 250,000 | 267,033 | |||||||||
1.63%, 4/27/26 (b) | 75,000 | 73,623 | |||||||||
| Newcrest Finance Pty Ltd., 3.25%, 5/13/30 (b) | 25,000 | 26,209 | |||||||||
Newmont Corp., 2.25%, 10/1/30 | 150,000 | 148,048 | |||||||||
514,913 | |||||||||||
OIL & GAS - 1.8% | |||||||||||
| BP Capital Markets America, Inc., 3.41%, 2/11/26 | 50,000 | 53,358 | |||||||||
| Gazprom PJSC Via Gaz Capital SA, 4.95%, 3/23/27 | 400,000 | 432,480 | |||||||||
Lukoil Securities BV, 3.88%, 5/6/30 | 200,000 | 203,660 | |||||||||
Marathon Petroleum Corp. | |||||||||||
3.63%, 9/15/24 | 50,000 | 52,578 | |||||||||
3.80%, 4/1/28 | 25,000 | 26,813 | |||||||||
| Occidental Petroleum Corp., 2.90%, 8/15/24 | 150,000 | 153,112 | |||||||||
Phillips 66 | |||||||||||
3.70%, 4/6/23 | 75,000 | 77,538 | |||||||||
3.85%, 4/9/25 | 25,000 | 26,665 | |||||||||
1.30%, 2/15/26 | 25,000 | 24,469 | |||||||||
3.90%, 3/15/28 | 150,000 | 162,687 | |||||||||
Suncor Energy, Inc. | |||||||||||
2.80%, 5/15/23 | 50,000 | 51,156 | |||||||||
3.10%, 5/15/25 | 75,000 | 78,382 | |||||||||
Valero Energy Corp., 2.85%, 4/15/25 | 75,000 | 77,691 | |||||||||
1,420,589 | |||||||||||
PHARMACEUTICALS - 0.7% | |||||||||||
AbbVie, Inc. | |||||||||||
4.05%, 11/21/39 | 125,000 | 144,089 | |||||||||
4.88%, 11/14/48 | 25,000 | 32,280 | |||||||||
Cigna Corp., 3.40%, 3/15/50 | 200,000 | 209,057 | |||||||||
CVS Health Corp. | |||||||||||
2.63%, 8/15/24 | 30,000 | 31,069 | |||||||||
3.88%, 7/20/25 | 25,000 | 26,878 | |||||||||
4.78%, 3/25/38 | 75,000 | 91,664 | |||||||||
5.13%, 7/20/45 | 25,000 | 32,595 | |||||||||
567,632 | |||||||||||
| Shares/ Principal | Fair Value | ||||||||||
PIPELINES - 2.5% | |||||||||||
Energy Transfer LP | |||||||||||
4.20%, 9/15/23 | $ | 175,000 | $ | 182,768 | |||||||
2.90%, 5/15/25 | 100,000 | 103,224 | |||||||||
5.25%, 4/15/29 | 100,000 | 114,634 | |||||||||
5.30%, 4/15/47 | 25,000 | 29,057 | |||||||||
5.40%, 10/1/47 | 50,000 | 58,853 | |||||||||
| Enterprise Products Operating LLC, 3.70%, 2/15/26 | 300,000 | 321,938 | |||||||||
| Galaxy Pipeline Assets Bidco Ltd., 2.94%, 9/30/40 | 200,000 | 199,043 | |||||||||
| MPLX LP | |||||||||||
4.80%, 2/15/29 | 50,000 | 57,142 | |||||||||
2.65%, 8/15/30 | 125,000 | 124,560 | |||||||||
4.50%, 4/15/38 | 75,000 | 84,181 | |||||||||
Sabine Pass Liquefaction LLC | |||||||||||
5.63%, 4/15/23 | 100,000 | 104,597 | |||||||||
5.63%, 3/1/25 | 275,000 | 305,420 | |||||||||
5.00%, 3/15/27 | 100,000 | 112,380 | |||||||||
Williams Cos., Inc. (The), 4.00%, 9/15/25 | 175,000 | 189,127 | |||||||||
1,986,924 | |||||||||||
REITS - 3.0% | |||||||||||
| Alexandria Real Estate Equities, Inc., 3.80%, 4/15/26 | 75,000 | 81,196 | |||||||||
American Homes 4 Rent LP | |||||||||||
4.90%, 2/15/29 | 50,000 | 57,800 | |||||||||
2.38%, 7/15/31 | 30,000 | 29,435 | |||||||||
American Tower Corp. | |||||||||||
3.38%, 5/15/24 | 200,000 | 208,889 | |||||||||
2.40%, 3/15/25 | 125,000 | 128,398 | |||||||||
Camden Property Trust, 2.80%, 5/15/30 | 75,000 | 78,074 | |||||||||
Crown Castle International Corp. | |||||||||||
3.15%, 7/15/23 | 100,000 | 103,026 | |||||||||
3.65%, 9/1/27 | 75,000 | 80,622 | |||||||||
CubeSmart LP, 2.50%, 2/15/32 | 100,000 | 99,679 | |||||||||
Essex Portfolio LP, 3.00%, 1/15/30 | 75,000 | 78,676 | |||||||||
| Federal Realty Investment Trust, 3.25%, 7/15/27 | 150,000 | 159,200 | |||||||||
| Host Hotels & Resorts LP, 2.90%, 12/15/31 | 75,000 | 72,442 | |||||||||
Invitation Homes Operating Partnership LP | |||||||||||
2.30%, 11/15/28 | 50,000 | 49,500 | |||||||||
2.00%, 8/15/31 | 185,000 | 174,230 | |||||||||
Kilroy Realty LP, 4.75%, 12/15/28 | 100,000 | 114,329 | |||||||||
| National Retail Properties, Inc., 3.90%, 6/15/24 | 45,000 | 47,523 | |||||||||
Realty Income Corp. | |||||||||||
4.63%, 11/1/25 | 200,000 | 221,774 | |||||||||
4.88%, 6/1/26 | 75,000 | 84,422 | |||||||||
3.40%, 1/15/28 | 25,000 | 26,982 | |||||||||
2.85%, 12/15/32 | 75,000 | 77,926 | |||||||||
See accompanying notes to financial statements.
72
Global Atlantic Goldman Sachs Core Fixed Income Portfolio
Portfolio of Investments (Continued)
December 31, 2021
| Shares/ Principal | Fair Value | ||||||||||
REITS - 3.0% (Continued) | |||||||||||
Regency Centers LP, 2.95%, 9/15/29 | $ | 125,000 | $ | 129,820 | |||||||
Spirit Realty LP, 3.40%, 1/15/30 | 100,000 | 105,266 | |||||||||
UDR, Inc., 2.10%, 8/1/32 | 25,000 | 23,794 | |||||||||
WP Carey, Inc. | |||||||||||
4.60%, 4/1/24 | 25,000 | 26,545 | |||||||||
4.00%, 2/1/25 | 30,000 | 31,924 | |||||||||
3.85%, 7/15/29 | 75,000 | 82,649 | |||||||||
2.40%, 2/1/31 | 25,000 | 24,593 | |||||||||
2,398,714 | |||||||||||
RETAIL - 0.8% | |||||||||||
7-Eleven, Inc., 1.30%, 2/10/28 (b) | 100,000 | 95,319 | |||||||||
| Alimentation Couche-Tard, Inc., 3.55%, 7/26/27 (b) | 50,000 | 53,600 | |||||||||
AutoNation, Inc., 1.95%, 8/1/28 | 25,000 | 24,467 | |||||||||
Dollar Tree, Inc. | |||||||||||
4.00%, 5/15/25 | 75,000 | 80,602 | |||||||||
4.20%, 5/15/28 | 125,000 | 139,418 | |||||||||
Lowe's Cos., Inc., 1.70%, 9/15/28 | 75,000 | 73,556 | |||||||||
McDonald's Corp., 4.45%, 9/1/48 | 25,000 | 30,886 | |||||||||
Starbucks Corp., 3.80%, 8/15/25 | 150,000 | 161,896 | |||||||||
659,744 | |||||||||||
SAVINGS & LOANS - 0.3% | |||||||||||
| Nationwide Building Society, 3.96%, (3 Month US Libor + 1.86%), 7/18/30 (a),(b) | 200,000 | 219,927 | |||||||||
SEMICONDUCTORS - 0.8% | |||||||||||
Broadcom, Inc. | |||||||||||
3.42%, 4/15/33 (b) | 150,000 | 157,429 | |||||||||
3.47%, 4/15/34 (b) | 165,000 | 172,815 | |||||||||
3.50%, 2/15/41 (b) | 25,000 | 25,618 | |||||||||
Intel Corp., 3.05%, 8/12/51 | 75,000 | 77,022 | |||||||||
Micron Technology, Inc., 2.70%, 4/15/32 | 50,000 | 50,057 | |||||||||
| NXP BV / NXP Funding LLC / NXP USA, Inc. | |||||||||||
3.40%, 5/1/30 (b) | 50,000 | 53,337 | |||||||||
2.50%, 5/11/31 (b) | 125,000 | 125,932 | |||||||||
662,210 | |||||||||||
SOFTWARE - 1.0% | |||||||||||
Fiserv, Inc. | |||||||||||
2.75%, 7/1/24 | 150,000 | 155,178 | |||||||||
3.20%, 7/1/26 | 150,000 | 158,683 | |||||||||
4.20%, 10/1/28 | 100,000 | 112,191 | |||||||||
Oracle Corp. | |||||||||||
2.88%, 3/25/31 | 125,000 | 125,934 | |||||||||
3.60%, 4/1/40 | 75,000 | 75,511 | |||||||||
3.60%, 4/1/50 | 75,000 | 73,700 | |||||||||
| Shares/ Principal | Fair Value | ||||||||||
SOFTWARE - 1.0% (Continued) | |||||||||||
VMware, Inc. | |||||||||||
1.80%, 8/15/28 | $ | 25,000 | $ | 24,350 | |||||||
2.20%, 8/15/31 | 75,000 | 73,637 | |||||||||
799,184 | |||||||||||
TELECOMMUNICATIONS - 3.4% | |||||||||||
AT&T, Inc. | |||||||||||
2.30%, 6/1/27 | 125,000 | 127,252 | |||||||||
2.55%, 12/1/33 | 175,000 | 171,397 | |||||||||
5.25%, 3/1/37 | 125,000 | 154,943 | |||||||||
4.90%, 8/15/37 | 50,000 | 60,593 | |||||||||
4.85%, 3/1/39 | 85,000 | 101,838 | |||||||||
3.50%, 6/1/41 | 100,000 | 103,056 | |||||||||
5.15%, 11/15/46 | 25,000 | 31,796 | |||||||||
5.15%, 2/15/50 | 25,000 | 32,003 | |||||||||
3.65%, 6/1/51 | 50,000 | 51,974 | |||||||||
3.50%, 9/15/53 | 25,000 | 25,321 | |||||||||
T-Mobile USA, Inc. | |||||||||||
3.50%, 4/15/25 | 125,000 | 132,487 | |||||||||
1.50%, 2/15/26 | 50,000 | 49,416 | |||||||||
3.75%, 4/15/27 | 200,000 | 216,714 | |||||||||
2.05%, 2/15/28 | 200,000 | 198,683 | |||||||||
3.88%, 4/15/30 | 200,000 | 219,025 | |||||||||
3.00%, 2/15/41 | 50,000 | 48,955 | |||||||||
Verizon Communications, Inc. | |||||||||||
2.10%, 3/22/28 | 225,000 | 225,611 | |||||||||
4.33%, 9/21/28 | 313,000 | 355,843 | |||||||||
4.02%, 12/3/29 | 25,000 | 28,053 | |||||||||
3.15%, 3/22/30 | 100,000 | 105,915 | |||||||||
2.55%, 3/21/31 | 150,000 | 151,503 | |||||||||
5.25%, 3/16/37 | 100,000 | 130,200 | |||||||||
2,722,578 | |||||||||||
TRANSPORTATION - 0.2% | |||||||||||
| Burlington Northern Santa Fe LLC, 3.25%, 6/15/27 | 75,000 | 80,760 | |||||||||
| Canadian Pacific Railway Co., 2.45%, 12/2/31 | 50,000 | 50,958 | |||||||||
FedEx Corp., 3.40%, 2/15/28 | 25,000 | 27,000 | |||||||||
158,718 | |||||||||||
| TOTAL CORPORATE BONDS AND NOTES (Cost - $33,680,880) | 35,400,328 | ||||||||||
AGENCY MORTGAGE BACKED SECURITIES - 19.6% | |||||||||||
FEDERAL HOME LOAN MORTGAGE CORPORATION - 2.8% | |||||||||||
Freddie Mac Pool | |||||||||||
4.00%, 1/1/49 | 368,090 | 399,996 | |||||||||
3.00%, 12/1/50 | 794,768 | 836,638 | |||||||||
2.50%, 9/1/51 | 980,538 | 1,008,452 | |||||||||
2,245,086 | |||||||||||
See accompanying notes to financial statements.
73
Global Atlantic Goldman Sachs Core Fixed Income Portfolio
Portfolio of Investments (Continued)
December 31, 2021
| Shares/ Principal | Fair Value | ||||||||||
FEDERAL NATIONAL MORTGAGE ASSOCIATION - 4.2% | |||||||||||
Fannie Mae Pool | |||||||||||
4.50%, 6/1/31 | $ | 367,276 | $ | 404,473 | |||||||
4.50%, 7/1/48 | 506,601 | 543,909 | |||||||||
5.00%, 11/1/48 | 359,597 | 403,341 | |||||||||
Federal National Mortgage Association | |||||||||||
2.00%, 1/1/52 (d) | 1,000,000 | 997,500 | |||||||||
2.50%, 1/1/52 (d) | 1,000,000 | 1,020,938 | |||||||||
3,370,161 | |||||||||||
GOVERNMENT NATIONAL MORTGAGE ASSOCIATION - 12.6% | |||||||||||
Ginnie Mae | |||||||||||
2.50%, 1/20/52 (d) | 1,000,000 | 1,024,687 | |||||||||
3.00%, 1/20/52 (d) | 2,000,000 | 2,070,625 | |||||||||
Ginnie Mae II Pool | |||||||||||
3.50%, 4/20/47 | 259,156 | 272,942 | |||||||||
3.50%, 12/20/47 | 328,222 | 345,683 | |||||||||
4.50%, 2/20/48 | 188,594 | 201,794 | |||||||||
4.50%, 5/20/48 | 187,357 | 198,577 | |||||||||
4.50%, 8/20/48 | 234,755 | 248,814 | |||||||||
5.00%, 8/20/48 | 52,863 | 56,310 | |||||||||
4.50%, 9/20/48 | 829,046 | 878,486 | |||||||||
5.00%, 10/20/48 | 297,232 | 318,727 | |||||||||
5.00%, 11/20/48 | 190,527 | 204,306 | |||||||||
5.00%, 12/20/48 | 98,630 | 105,763 | |||||||||
5.00%, 1/20/49 | 290,526 | 311,537 | |||||||||
4.00%, 2/20/49 | 239,634 | 253,389 | |||||||||
4.50%, 3/20/49 | 8,301 | 8,798 | |||||||||
5.00%, 3/20/49 | 132,667 | 142,261 | |||||||||
4.00%, 5/20/49 | 217,259 | 229,311 | |||||||||
4.50%, 10/20/49 | 200,074 | 212,056 | |||||||||
Government National Mortgage Association | |||||||||||
3.00%, 9/20/49 | 949,825 | 984,155 | |||||||||
3.00%, 11/20/51 | 995,389 | 1,034,008 | |||||||||
3.00%, 2/20/52 (d) | 1,000,000 | 1,033,555 | |||||||||
10,135,784 | |||||||||||
| TOTAL AGENCY MORTGAGE BACKED SECURITIES (Cost - $15,678,979) | 15,751,031 | ||||||||||
U.S. TREASURY SECURITIES AND AGENCY BONDS - 15.6% | |||||||||||
U.S. Treasury Note | |||||||||||
0.75%, 3/31/26 | 580,000 | 569,284 | |||||||||
1.25%, 12/31/26 | 860,000 | 859,664 | |||||||||
1.13%, 2/29/28 | 1,150,000 | 1,134,232 | |||||||||
1.25%, 3/31/28 | 1,130,000 | 1,120,863 | |||||||||
1.25%, 6/30/28 | 3,160,000 | 3,130,252 | |||||||||
1.38%, 12/31/28 | 860,000 | 856,909 | |||||||||
U.S. Treasury Bond | |||||||||||
4.25%, 5/15/39 | 440,000 | 604,742 | |||||||||
| Shares/ Principal | Fair Value | ||||||||||
U.S. TREASURY SECURITIES AND AGENCY BONDS - 15.6% (Continued) | |||||||||||
2.38%, 11/15/49 | $ | 3,390,000 | $ | 3,739,991 | |||||||
| Federal Farm Credit Banks Funding Corp., 1.70%, 4/23/35 | 540,000 | 525,596 | |||||||||
| TOTAL U.S. TREASURY SECURITIES AND AGENCY BONDS (Cost - $12,623,534) | 12,541,533 | ||||||||||
ASSET BACKED AND COMMERCIAL BACKED SECURITIES - 8.8% | |||||||||||
| 3650R 2021-PF1 Commercial Mortgage Trust, 2.78%, 11/15/54 | 150,000 | 152,692 | |||||||||
| ASSURANT CLO LTD., 1.17%, (3 Month US Libor + 1.04%), 4/20/31 (a),(b) | 1,500,000 | 1,500,114 | |||||||||
| Benchmark 2018-B1 Mortgage Trust, 2.75%, 1/15/51 (b) | 100,000 | 86,823 | |||||||||
| BX Trust 2021-ARIA, 1.76%, (1 Month US Libor + 1.65%), 10/15/36 (a),(b) | 150,000 | 149,416 | |||||||||
| Cathedral Lake VI Ltd., 2.07%, (3 Month US Libor + 1.95%), 4/25/34 (a),(b) | 350,000 | 349,272 | |||||||||
| Cathedral Lake VIII Ltd., 2.72%, (3 Month US Libor + 2.62%), 1/20/35 (a),(b) | 150,000 | 148,526 | |||||||||
| CBAM 2018-5 Ltd., 1.14%, (3 Month US Libor + 1.02%), 4/17/31 (a),(b) | 350,000 | 350,005 | |||||||||
| Citigroup Commercial Mortgage Trust 2015-GC29, 3.11%, 4/10/48 (b) | 100,000 | 96,801 | |||||||||
| COMM 2017-COR2 Mortgage Trust, 3.00%, 9/10/50 (b) | 100,000 | 93,976 | |||||||||
| Connecticut Avenue Securities Trust 2021-R03, 1.70%, (SOFR + 1.65%), 12/25/41 (a),(b) | 34,000 | 34,059 | |||||||||
| DOLP Trust 2021-NYC, 2.96%, 5/10/41 (b) | 200,000 | 208,080 | |||||||||
| Elmwood CLO IV Ltd., 1.36%, (3 Month US Libor + 1.24%), 4/15/33 (a),(b) | 600,000 | 600,330 | |||||||||
| Freddie Mac STACR REMIC Trust 2021-DNA5, 1.70%, (SOFR + 1.65%), 1/25/34 (a),(b) | 30,000 | 30,127 | |||||||||
| Harben Finance 2017-1 PLC, 0.91%, (3 Month GBP Libor + 0.80%), 8/20/56 (a) | 77,971 | 105,662 | |||||||||
| JP Morgan Mortgage Trust 2021-6, 2.50%, 10/25/51 (b),(e) | 114,121 | 114,175 | |||||||||
| London Wall Mortgage Capital PLC, 0.95%, (3 Month GBP Libor + 0.85%), 11/15/49 (a) | 55,106 | 74,638 | |||||||||
| Morgan Stanley Capital I Trust 2020-HR8, 2.04%, 7/15/53 | 250,000 | 246,545 | |||||||||
| Morgan Stanley Capital I Trust 2020-L4, 2.70%, 2/15/53 | 500,000 | 517,525 | |||||||||
| PHEAA Student Loan Trust 2012-1, 0.65%, (1 Month US Libor + 0.55%), 5/25/57 (a),(b) | 208,805 | 205,847 | |||||||||
| TICP CLO X Ltd., 1.13%, (3 Month US Libor + 1.00%), 4/20/31 (a),(b) | 1,550,000 | 1,549,126 | |||||||||
See accompanying notes to financial statements.
74
Global Atlantic Goldman Sachs Core Fixed Income Portfolio
Portfolio of Investments (Continued)
December 31, 2021
| Shares/ Principal | Fair Value | ||||||||||
ASSET BACKED AND COMMERCIAL BACKED SECURITIES - 8.8% (Continued) | |||||||||||
| Wellfleet CLO X LTD., 1.30%, (3 Month US Libor + 1.17%), 7/20/32 (a),(b) | $ | 375,000 | $ | 374,999 | |||||||
| Wells Fargo Commercial Mortgage Trust 2017-C42, 2.80%, 12/15/50 (b),(e) | 100,000 | 89,601 | |||||||||
| Wells Fargo Mortgage Backed Securities Trust 2019-3, 3.50%, 7/25/49 (b),(e) | 11,501 | 11,587 | |||||||||
| TOTAL ASSET BACKED AND COMMERCIAL BACKED SECURITIES (Cost - $7,121,983) | 7,089,926 | ||||||||||
MUNICIPAL BONDS - 1.4% | |||||||||||
Bay Area Toll Authority, 1.63%, 4/1/28 | 10,000 | 9,865 | |||||||||
| California Statewide Communities Development Authority, 1.88%, 2/1/31 | 30,000 | 29,417 | |||||||||
City of Tucson | |||||||||||
1.46%, 7/1/28 | 5,000 | 4,856 | |||||||||
1.93%, 7/1/31 | 30,000 | 29,468 | |||||||||
Metropolitan Transportation Authority | |||||||||||
5.99%, 11/15/30 (f) | 25,000 | 31,079 | |||||||||
5.18%, 11/15/49 | 160,000 | 219,028 | |||||||||
Municipal Improvement Corp. of Los Angeles | |||||||||||
1.65%, 11/1/28 | 35,000 | 34,337 | |||||||||
2.07%, 11/1/30 | 95,000 | 94,195 | |||||||||
New Jersey Turnpike Authority | |||||||||||
1.48%, 1/1/28 | 5,000 | 4,843 | |||||||||
7.10%, 1/1/41 | 25,000 | 39,223 | |||||||||
| San Francisco Municipal Transportation Agency, 1.30%, 3/1/28 | 25,000 | 24,368 | |||||||||
State of California, 7.60%, 11/1/40 | 175,000 | 301,667 | |||||||||
State of Illinois, 5.10%, 6/1/33 (f) | 265,000 | 306,309 | |||||||||
| TOTAL MUNICIPAL BONDS (Cost - $977,633) | 1,128,655 | ||||||||||
SOVEREIGN DEBTS - 1.7% | |||||||||||
Mexico Government International Bond | |||||||||||
3.25%, 4/16/30 | 290,000 | 297,259 | |||||||||
3.77%, 5/24/61 | 200,000 | 184,024 | |||||||||
| Perusahaah Penerbit SBSN Indonesia III, 4.55%, 3/29/26 | 520,000 | 582,634 | |||||||||
| Peruvian Government International Bond, 3.23%, 7/28/21 | 20,000 | 17,160 | |||||||||
Romanian Government International Bond | |||||||||||
2.12%, 7/16/31 | EUR | 30,000 | 32,512 | ||||||||
2.00%, 1/28/32 (b) | EUR | 70,000 | 73,832 | ||||||||
| Saudi Government International Bond, 3.63%, 3/4/28 | 210,000 | 228,627 | |||||||||
| TOTAL SOVEREIGN DEBTS (Cost - $1,382,653) | 1,416,048 | ||||||||||
| Shares/ Principal | Fair Value | ||||||||||
SHORT-TERM INVESTMENTS - 14.9% | |||||||||||
MONEY MARKET FUNDS - 9.8% | |||||||||||
| Fidelity Investments Money Market Fund - Government Portfolio, Institutional Class, 0.01% (g) (Cost - $7,841,918) | 7,841,918 | $ | 7,841,918 | ||||||||
U.S. TREASURY SECURITIES - 5.1% | |||||||||||
| U.S. Treasury Bill, 0.09%, 3/31/22 (Cost - $4,107,522) | $ | 4,108,000 | 4,107,477 | ||||||||
| TOTAL SHORT-TERM INVESTMENTS (Cost - $11,949,440) | 11,949,395 | ||||||||||
| TOTAL INVESTMENTS - 106.1% (Cost - $83,415,102) | $ | 85,276,916 | |||||||||
| OTHER ASSETS LESS LIABILITIES - NET (6.1)% | (4,915,694) | ||||||||||
TOTAL NET ASSETS - 100.0% | $ | 80,361,222 | |||||||||
† Represents less than 0.05%.
(a) Variable rate security. The rate shown is the rate in effect at period end.
(b) 144A - Security was purchased pursuant to Rule 144a under the Securities Act of 1933 and may not be resold subject to that rule, except to qualified institutional buyers. As of December 31, 2021, these securities amounted to $10,689,559 or 13.3% of net assets.
(c) Step coupon.
(d) When-issued, or delayed delivery, all or a portion may be subject to dollar-roll transactions.
(e) Adjustable rate security with an interest rate that is not based on a published reference index and spread. The rate is based on the structure of the agreement and current market conditions. The coupon rate shown represents the rate at period end.
(f) Sinking bond security.
(g) The rate shown is the annualized seven-day yield at period end.
CLO - Collateralized Loan Obligation
CMT - Treasury Constant Maturity Rate
EUR - EURO
Libor - London Interbank Offer Rate
PLC - Public Limited Company
REMIC - Real Estate Mortgage Investment Conduit
SOFR - Secured Overnight Financing Rate
See accompanying notes to financial statements.
75
Global Atlantic Goldman Sachs Core Fixed Income Portfolio
Portfolio of Investments (Continued)
December 31, 2021
FUTURES CONTRACTS | |||||||||||||||||||||||
LONG FUTURES CONTRACTS | Counterparty | Number of Contracts | Expiration Date | Notional Value | Fair Value/ Unrealized Appreciation (Depreciation) | ||||||||||||||||||
U.S. 10 Year Note Future | Morgan Stanley | 54 | 3/22/2022 | $ | 7,045,313 | $ | 44,901 | ||||||||||||||||
U.S. 2 Year Note Future | Morgan Stanley | 39 | 3/31/2022 | 8,508,703 | (5,008 | ) | |||||||||||||||||
U.S. Long Bond Future | Morgan Stanley | 20 | 3/22/2022 | 3,208,750 | 13,150 | ||||||||||||||||||
U.S. Ultra Bond Future | Morgan Stanley | 19 | 3/22/2022 | 3,745,375 | 59,667 | ||||||||||||||||||
112,710 | |||||||||||||||||||||||
SHORT FUTURES CONTRACTS | |||||||||||||||||||||||
U.S. 10 Year Ultra Future | Morgan Stanley | 20 | 3/22/2022 | 2,928,750 | (43,323 | ) | |||||||||||||||||
U.S. 5 Year Note Future | Morgan Stanley | 53 | 3/31/2022 | 6,411,758 | (16,390 | ) | |||||||||||||||||
(59,713 | ) | ||||||||||||||||||||||
TOTAL NET UNREALIZED APPRECIATION ON FUTURES CONTRACTS | $ | 52,997 | |||||||||||||||||||||
INTEREST RATE SWAPTIONS PURCHASED | |||||||||||||||||||||||||||||||||||
Counterparty | Description* | Floating Rate Index | Exercise Rate | Expiration Date | Notional Amount | Fair Value | Premiums Paid | Unrealized Appreciation (Depreciation) | |||||||||||||||||||||||||||
JP Morgan Chase Bank | Call - IRS SWAPTION | Pay GBP SONIO | Receives 0.30% | 09/08/23 | 1,360,000 | GBP | $ | 287 | $ | 2,643 | $ | (2,356 | ) | ||||||||||||||||||||||
JP Morgan Chase Bank | Call - IRS SWAPTION | Pay GBP SONIO | Receives 0.28% | 09/08/23 | 1,040,000 | GBP | 206 | 1,984 | (1,778 | ) | |||||||||||||||||||||||||
| TOTAL FAIR VALUE, PREMIUMS PAID AND NET UNREALIZED DEPRECIATION ON INTEREST RATE SWAPTIONS PURCHASED | $ | 493 | $ | 4,627 | $ | (4,134 | ) | ||||||||||||||||||||||||||||
* The Fund may receive or pay a variable rate.
INTEREST RATE SWAPTIONS WRITTEN | |||||||||||||||||||||||||||||||||||
Counterparty | Description* | Floating Rate Index | Exercise Rate | Expiration Date | Notional Amount | Fair Value | Premiums Received | Unrealized Appreciation (Depreciation) | |||||||||||||||||||||||||||
JP Morgan Chase Bank | Call - IRS SWAPTION | Pay GBP SONIO | Receives 0.40% | 09/08/23 | 140,000 | GBP | $ | (1,266 | ) | $ | (2,636 | ) | $ | 1,370 | |||||||||||||||||||||
JP Morgan Chase Bank | Call - IRS SWAPTION | Pay GBP SONIO | Receives 0.36% | 09/08/23 | 110,000 | GBP | (897 | ) | (2,033 | ) | 1,136 | ||||||||||||||||||||||||
| TOTAL FAIR VALUE, PREMIUMS RECEIVED AND NET UNREALIZED APPRECIATION ON INTEREST RATE SWAPTIONS WRITTEN | $ | (2,163 | ) | $ | (4,669 | ) | $ | 2,506 | |||||||||||||||||||||||||||
* The Fund may receive or pay a variable rate.
See accompanying notes to financial statements.
76
Global Atlantic Goldman Sachs Core Fixed Income Portfolio
Portfolio of Investments (Continued)
December 31, 2021
INTEREST RATE SWAPS | |||||||||||||||||||||||||||||||||||
Counterparty | Payment Frequency | Fund Receives | Fund Pays | Expiration Date | Notional Amount† | Fair Value | Premiums Paid (Received) | Unrealized Appreciation (Depreciation) | |||||||||||||||||||||||||||
| Morgan Stanley | Semi-Annually | 2.25% | 3 Month Canadian Dollar Offered Rate | 12/15/51 | 220,000 | CAD | $ | 6,504 | $ | 1,964 | $ | 4,540 | |||||||||||||||||||||||
| Morgan Stanley | Quarterly | 1.25% | 3 Month New Zealand Dollar Bank Bill Rate | 12/15/22 | 540,000 | NZD | (1,382 | ) | (461 | ) | (921 | ) | |||||||||||||||||||||||
Morgan Stanley | Quarterly | 0.19% | 3 Month Australian Bill | 03/16/32 | 5,870,000 | AUD | (13,844 | ) | (1,553 | ) | (12,291 | ) | |||||||||||||||||||||||
| Morgan Stanley | Annually | 0.25% | Swiss Average Rate Overnight | 03/16/32 | 300,000 | CHF | 4,392 | 4,309 | 83 | ||||||||||||||||||||||||||
Morgan Stanley | Quarterly | 3 Month New Zealand Dollar Bank Bill Rate | 2.75% | 03/16/32 | 330,000 | NZD | (1,381 | ) | (2,564 | ) | 1,183 | ||||||||||||||||||||||||
Morgan Stanley | Quarterly | 3 Month US Libor | 1 Month US Libor | 07/25/24 | 3,160,000 | USD | 837 | 735 | 102 | ||||||||||||||||||||||||||
Morgan Stanley | Quarterly | 0.50% | 3 Month Stibor | 03/18/24 | 8,180,000 | SEK | 2,182 | 1,876 | 306 | ||||||||||||||||||||||||||
Morgan Stanley | Annually | Secured Overnight Financing Rate | 0.25% | 03/18/24 | 580,000 | USD | 7,107 | 5,610 | 1,497 | ||||||||||||||||||||||||||
Morgan Stanley | Annually | Secured Overnight Financing Rate | 1.00% | 03/16/27 | 1,250,000 | USD | 16,122 | 8,514 | 7,608 | ||||||||||||||||||||||||||
Morgan Stanley | Semi-Annually | 3 Month Canadian Dollar Offered Rate | 1.75% | 03/16/27 | 830,000 | CAD | 3,488 | 5,809 | (2,321 | ) | |||||||||||||||||||||||||
Morgan Stanley | Quarterly | 1.00% | 3 Month Stockholm Interbank Offered Rate | 03/16/32 | 4,230,000 | SEK | 400 | 7,392 | (6,992 | ) | |||||||||||||||||||||||||
Morgan Stanley | Quarterly | 0.75% | 3 Month Stockholm Interbank Offered Rate | 03/16/27 | 1,980,000 | SEK | – | 1,346 | (1,346 | ) | |||||||||||||||||||||||||
Morgan Stanley | Semi-Annually | 0.25% | 6 Month Euribor | 03/16/32 | 140,000 | EUR | (1,234 | ) | 255 | (1,489 | ) | ||||||||||||||||||||||||
Morgan Stanley | Annually | Sterling Overnight Interbank Average Rate | 0.75% | 03/16/32 | 730,000 | GBP | 19,896 | (313 | ) | 20,209 | |||||||||||||||||||||||||
Morgan Stanley | Semi-Annually | 3 Month Canadian Dollar Offered Rate | 1.68% | 08/22/28 | 620,000 | CAD | 7,821 | (334 | ) | 8,155 | |||||||||||||||||||||||||
Morgan Stanley | Semi-Annually | 1.56% | 3 Month Canadian Dollar Offered Rate | 08/22/25 | 780,000 | CAD | (6,488 | ) | 174 | (6,662 | ) | ||||||||||||||||||||||||
Morgan Stanley | Semi-Annually | 6 Month Norway Ibor | 2.13% | 05/12/31 | 4,620,000 | NOK | (4,203 | ) | (3,864 | ) | (339 | ) | |||||||||||||||||||||||
Morgan Stanley | Semi-Annually | 2.50% | 3 Month Canadian Dollar Offered Rate | 10/14/31 | 460,000 | CAD | 6,267 | 2,090 | 4,177 | ||||||||||||||||||||||||||
Morgan Stanley | Semi-Annually | 2.00% | 6 Month Norway Ibor | 03/16/32 | 840,000 | NOK | 753 | 2,454 | (1,701 | ) | |||||||||||||||||||||||||
Morgan Stanley | Annually | 1.50% | Secured Overnight Financing Rate | 03/16/32 | 410,000 | USD | 5,946 | 7,967 | (2,021 | ) | |||||||||||||||||||||||||
Morgan Stanley | Semi-Annually | 1.25% | 6 Month Australian Bill | 03/16/27 | 2,870,000 | AUD | (50,342 | ) | (48,606 | ) | (1,736 | ) | |||||||||||||||||||||||
Morgan Stanley | Annually | Tokyo Overnight Weighted Average Rate | 0.00% | 03/16/32 | 25,840,000 | JPY | 1,888 | 1,011 | 877 | ||||||||||||||||||||||||||
Morgan Stanley | Semi-Annually | 2.00% | 6 Month Australian Bill | 03/16/32 | 530,000 | AUD | (970 | ) | 383 | (1,353 | ) | ||||||||||||||||||||||||
See accompanying notes to financial statements.
77
Global Atlantic Goldman Sachs Core Fixed Income Portfolio
Portfolio of Investments (Continued)
December 31, 2021
Counterparty | Payment Frequency | Fund Receives | Fund Pays | Expiration Date | Notional Amount† | Fair Value | Premiums Paid (Received) | Unrealized Appreciation (Depreciation) | |||||||||||||||||||||||||||
Morgan Stanley | Semi-Annually | 3 Month Canadian Dollar Offered Rate | 2.00% | 03/16/32 | 570,000 | CAD | $ | 216 | $ | 843 | $ | (627 | ) | ||||||||||||||||||||||
Morgan Stanley | Annually | Sterling Overnight Interbank Average Rate | 0.50% | 03/16/27 | 420,000 | GBP | 15,739 | 10,786 | 4,953 | ||||||||||||||||||||||||||
Morgan Stanley | Semi-Annually | 6 Month Norway Ibor | 2.00% | 03/16/27 | 3,590,000 | NOK | (1,828 | ) | (1,371 | ) | (457 | ) | |||||||||||||||||||||||
Morgan Stanley | Semi-Annually | 2.10% | 3 Month Canadian Dollar Offered Rate | 12/19/33 | 200,000 | CAD | (648 | ) | 998 | (1,646 | ) | ||||||||||||||||||||||||
Morgan Stanley | Annually | Secured Overnight Financing Rate | 1.75% | 03/18/52 | 140,000 | USD | (9,731 | ) | (11,871 | ) | 2,140 | ||||||||||||||||||||||||
| TOTAL FAIR VALUE, PREMIUMS PAID (RECEIVED) AND NET UNREALIZED APPRECIATION ON INTEREST RATE SWAPS | $ | 7,507 | $ | (6,421 | ) | $ | 13,928 | ||||||||||||||||||||||||||||
† Unless otherwise indicated, notional amount is shown in USD.
CREDIT DEFAULT SWAPS | |||||||||||||||||||||||||||||||||||||||||||||||
Counterparty | Reference Obligation/ Index | Payment Frequency | Buy/Sell Protection | Fixed Rate Received | Fixed Rate Paid | Credit Rating* | Expiration Date | Notional Amount | Fair Value | Premiums Paid (Received) | Unrealized Appreciation (Depreciation) | ||||||||||||||||||||||||||||||||||||
| Morgan Stanley | CD CDX.IG.28 | Quarterly | Buy | 1.00 | % | - | BBB | 06/20/22 | $ | 2,225,000 | $ | 9,057 | $ | 7,151 | $ | 1,906 | |||||||||||||||||||||||||||||||
| Morgan Stanley | CD The Boeing Company | Quarterly | Buy | 1.00 | % | - | BBB- | 06/20/24 | 100,000 | 696 | 1,182 | (486 | ) | ||||||||||||||||||||||||||||||||||
| Morgan Stanley | CD Prudential Financial, Inc. | Quarterly | Buy | 1.00 | % | - | A- | 06/20/24 | 175,000 | 3,215 | 1,555 | 1,660 | |||||||||||||||||||||||||||||||||||
| Morgan Stanley | CD Republic of Indonesia | Quarterly | Buy | 1.00 | % | - | BBB | 06/20/24 | 550,000 | 9,163 | 1,755 | 7,408 | |||||||||||||||||||||||||||||||||||
| Morgan Stanley | CD CD.NA.IG.34 | Quarterly | Buy | 1.00 | % | - | BBB | 06/20/25 | 625,000 | 12,078 | 6,185 | 5,893 | |||||||||||||||||||||||||||||||||||
| Morgan Stanley | CD General Electric Company | Quarterly | Buy | 1.00 | % | - | BBB+ | 06/20/26 | 325,000 | 5,657 | 3,945 | 1,712 | |||||||||||||||||||||||||||||||||||
| Morgan Stanley | CD Russian Federation | Quarterly | Buy | 1.00 | % | - | BBB- | 12/20/26 | 10,000 | (115 | ) | 65 | (180 | ) | |||||||||||||||||||||||||||||||||
| TOTAL FAIR VALUE PREMIUM PAID (RECEIVED) AND NET UNREALIZED APPRECIATION ON CREDIT DEFAULT SWAPS | $ | 39,751 | $ | 21,838 | $ | 17,913 | |||||||||||||||||||||||||||||||||||||||||
* Using S&P's rating of the issuer or the underlying securities of the index.
FORWARD FOREIGN CURRENCY CONTRACTS | |||||||||||||||||||
Settlement Date | Counterparty | Currency Units to Receive | In Exchange For | Unrealized Appreciation (Depreciation) | |||||||||||||||
01/21/22 | Morgan Stanley | 39,515 | GBP | 54,415 | USD | $ | (896 | ) | |||||||||||
01/21/22 | Morgan Stanley | 3,619 | USD | 2,679 | GBP | (9 | ) | ||||||||||||
01/21/22 | Morgan Stanley | 238,143 | USD | 172,934 | GBP | 3,923 | |||||||||||||
03/16/22 | Morgan Stanley | 26,863 | EUR | 30,624 | USD | (29 | ) | ||||||||||||
03/16/22 | Morgan Stanley | 41,141 | USD | 60,312 | NZD | (101 | ) | ||||||||||||
TOTAL NET UNREALIZED APPRECIATION ON FORWARD FOREIGN CURRENCY CONTRACTS | $ | 2,888 | |||||||||||||||||
See accompanying notes to financial statements.
78
Global Atlantic Goldman Sachs Core Fixed Income Portfolio
Portfolio of Investments (Continued)
December 31, 2021
AUD - Australian Dollar
CAD - Canadian Dollar
CHF - Swiss Franc
EUR - Euro
GBP - Pound Sterling
JPY - Japanese Yen
NOK - Norwegian Krone
NZD - New Zealand Dollar
SEK - Swedish Krona
USD - United States Dollar
See accompanying notes to financial statements.
79
Global Atlantic Portfolios
Statements of Assets and Liabilities
December 31, 2021
Assets: | Global Atlantic BlackRock Allocation Portfolio | Global Atlantic BlackRock Disciplined Core Portfolio | Global Atlantic BlackRock Disciplined Growth Portfolio | Global Atlantic BlackRock Disciplined International Core Portfolio | |||||||||||||||
Investments in securities, at cost | $ | 64,125,910 | $ | 508,656,288 | $ | 82,829,278 | $ | 150,970,504 | |||||||||||
Investments in securities, at fair value | $ | 78,009,420 | $ | 717,349,964 | $ | 125,426,015 | $ | 173,259,700 | |||||||||||
Foreign cash (cost $-, $-, $- and $399,464, respectively) | - | - | - | 407,506 | |||||||||||||||
Deposit with broker | - | 453,652 | 55,129 | 137,243 | |||||||||||||||
Unrealized appreciation on futures contracts | - | 127,608 | 12,424 | 54,759 | |||||||||||||||
Receivable for securities sold | - | 271 | - | 2,264,902 | |||||||||||||||
Receivable for portfolio shares sold | - | - | 14,972 | - | |||||||||||||||
Interest and dividends receivable | 20,195 | 370,846 | 27,536 | 629,250 | |||||||||||||||
Prepaid expenses | 2,897 | 26,351 | 4,754 | 6,497 | |||||||||||||||
Total Assets | 78,032,512 | 718,328,692 | 125,540,830 | 176,759,857 | |||||||||||||||
Liabilities: | |||||||||||||||||||
Payable for securities purchased | 1,241 | - | - | 2,122,100 | |||||||||||||||
Payable for portfolio shares redeemed | 351,929 | 468,738 | 127,544 | 41,271 | |||||||||||||||
Accrued distribution (12b-1) fees | 3,320 | 8,898 | 5,813 | 11,315 | |||||||||||||||
Accrued investment advisory fees | 14,457 | 234,055 | 39,372 | 91,254 | |||||||||||||||
Administrative service fees payable | 1,979 | 18,169 | 3,274 | 4,397 | |||||||||||||||
Accrued expenses and other liabilities | 7,377 | 67,694 | 15,405 | 4,611 | |||||||||||||||
Total Liabilities | 380,303 | 797,554 | 191,408 | 2,274,948 | |||||||||||||||
Net Assets | $ | 77,652,209 | $ | 717,531,138 | $ | 125,349,422 | $ | 174,484,909 | |||||||||||
Composition of Net Assets: | |||||||||||||||||||
Paid-in capital | $ | 55,647,430 | $ | 406,173,447 | $ | 104,517,319 | $ | 155,867,354 | |||||||||||
Total distributable earnings | 22,004,779 | 311,357,691 | 20,832,103 | 18,617,555 | |||||||||||||||
Net Assets | $ | 77,652,209 | $ | 717,531,138 | $ | 125,349,422 | $ | 174,484,909 | |||||||||||
Class I Shares: | |||||||||||||||||||
Net Assets | $ | 61,825,949 | $ | 674,859,014 | $ | 97,770,471 | $ | 120,257,964 | |||||||||||
| Total shares outstanding at end of period ($0 par value, unlimited shares authorized) | 4,694,098 | 39,472,325 | 4,838,481 | 10,411,698 | |||||||||||||||
| Net asset value, offering and redemption price per share (Net assets ÷ Total shares of beneficial interest outstanding) | $ | 13.17 | $ | 17.10 | $ | 20.21 | $ | 11.55 | |||||||||||
Class II Shares: | |||||||||||||||||||
Net Assets | $ | 15,826,260 | $ | 42,672,124 | $ | 27,578,951 | $ | 54,226,945 | |||||||||||
| Total shares outstanding at end of period ($0 par value, unlimited shares authorized) | 1,204,911 | 2,500,156 | 1,365,998 | 4,703,098 | |||||||||||||||
| Net asset value, offering and redemption price per share (Net assets ÷ Total shares of beneficial interest outstanding) | $ | 13.13 | $ | 17.07 | $ | 20.19 | $ | 11.53 | |||||||||||
See accompanying notes to financial statements.
80
Global Atlantic Portfolios
Statements of Assets and Liabilities (Continued)
December 31, 2021
Assets: | Global Atlantic BlackRock Disciplined Mid Cap Growth Portfolio | Global Atlantic BlackRock Disciplined Value Portfolio | Global Atlantic BlackRock High Yield Portfolio | Global Atlantic Goldman Sachs Core Fixed Income Portfolio | |||||||||||||||
Investments in securities, at cost | $ | 308,191,339 | $ | 236,494,050 | $ | 62,094,402 | $ | 83,415,102 | |||||||||||
Investments in securities, at fair value | $ | 360,713,225 | $ | 279,842,802 | $ | 64,249,827 | $ | 85,276,916 | |||||||||||
| Swaptions purchased, at fair value (premiums paid $-, $-, $- and $4,627, respectively) | - | - | - | 493 | |||||||||||||||
Premiums paid on open swap contracts, net | - | - | - | 15,418 | |||||||||||||||
Cash | 1,041 | 455 | 4 | 45 | |||||||||||||||
Foreign cash (cost $-, $-, $- and $88,930, respectively) | - | - | - | 90,207 | |||||||||||||||
Deposit with broker | 229,254 | 171,287 | 19,712 | 818,909 | |||||||||||||||
| Unrealized appreciation on forward foreign currency contracts | - | - | - | 3,923 | |||||||||||||||
Unrealized appreciation on futures contracts | 61,506 | 46,353 | 11,327 | 52,997 | |||||||||||||||
Unrealized appreciation on swap contracts | - | - | - | 31,841 | |||||||||||||||
Receivable for securities sold | - | - | - | 3,061,677 | |||||||||||||||
Interest and dividends receivable | 83,531 | 191,528 | 962,578 | 407,237 | |||||||||||||||
Prepaid expenses | 14,123 | 10,266 | 2,415 | 2,973 | |||||||||||||||
Total Assets | 361,102,680 | 280,262,691 | 65,245,863 | 89,762,636 | |||||||||||||||
Liabilities: | |||||||||||||||||||
| Swaptions written, at fair value (premiums received $-, $-, $- and $4,669, respectively) | - | - | - | 2,163 | |||||||||||||||
| Unrealized depreciation on forward foreign currency contracts | - | - | - | 1,035 | |||||||||||||||
Payable for securities purchased | - | - | - | 9,200,277 | |||||||||||||||
Payable for portfolio shares redeemed | 243,506 | 339,289 | 198,704 | 166,892 | |||||||||||||||
Accrued distribution (12b-1) fees | 31,158 | 1,655 | 170 | - | |||||||||||||||
Accrued investment advisory fees | 162,661 | 104,680 | 27,042 | 23,980 | |||||||||||||||
Administrative service fees payable | 9,185 | 7,035 | 1,627 | 2,044 | |||||||||||||||
Accrued expenses and other liabilities | 34,295 | 30,646 | 7,067 | 5,023 | |||||||||||||||
Total Liabilities | 480,805 | 483,305 | 234,610 | 9,401,414 | |||||||||||||||
Net Assets | $ | 360,621,875 | $ | 279,779,386 | $ | 65,011,253 | $ | 80,361,222 | |||||||||||
Composition of Net Assets: | |||||||||||||||||||
Paid-in capital | $ | 259,962,054 | $ | 189,431,251 | $ | 64,083,712 | $ | 77,090,347 | |||||||||||
Total distributable earnings | 100,659,821 | 90,348,135 | 927,541 | 3,270,875 | |||||||||||||||
Net Assets | $ | 360,621,875 | $ | 279,779,386 | $ | 65,011,253 | $ | 80,361,222 | |||||||||||
Class I Shares: | |||||||||||||||||||
Net Assets | $ | 212,083,373 | $ | 271,801,155 | $ | 64,218,742 | $ | 80,361,222 | |||||||||||
| Total shares outstanding at end of period ($0 par value, unlimited shares authorized) | 11,996,313 | 19,438,143 | 6,385,784 | 7,976,600 | |||||||||||||||
| Net asset value, offering and redemption price per share (Net assets ÷ Total shares of beneficial interest outstanding) | $ | 17.68 | $ | 13.98 | $ | 10.06 | $ | 10.07 | |||||||||||
Class II Shares: | |||||||||||||||||||
Net Assets | $ | 148,538,502 | $ | 7,978,231 | $ | 792,511 | $ | - | |||||||||||
| Total shares outstanding at end of period ($0 par value, unlimited shares authorized) | 8,428,037 | 570,043 | 78,805 | - | |||||||||||||||
| Net asset value, offering and redemption price per share (Net assets ÷ Total shares of beneficial interest outstanding) | $ | 17.62 | $ | 14.00 | $ | 10.06 | $ | - | |||||||||||
See accompanying notes to financial statements.
81
Global Atlantic Portfolios
Statements of Operations
For the Year Ended December 31, 2021
| Global Atlantic BlackRock Allocation Portfolio | Global Atlantic BlackRock Disciplined Core Portfolio | Global Atlantic BlackRock Disciplined Growth Portfolio | Global Atlantic BlackRock Disciplined International Core Portfolio | ||||||||||||||||
Investment Income: | |||||||||||||||||||
Dividend income* | $ | 1,446,617 | $ | 8,499,799 | $ | 473,269 | $ | 4,182,778 | |||||||||||
Interest income | 32 | - | - | - | |||||||||||||||
Total Investment Income | 1,446,649 | 8,499,799 | 473,269 | 4,182,778 | |||||||||||||||
Expenses: | |||||||||||||||||||
Investment advisory fee | 173,723 | 2,589,469 | 226,248 | 967,100 | |||||||||||||||
Distribution fees (12b-1) - Class II Shares | 39,488 | 96,736 | 56,518 | 118,273 | |||||||||||||||
Administrative service fees | 24,956 | 209,817 | 18,423 | 50,929 | |||||||||||||||
Legal fees | 16,832 | 141,220 | 12,298 | 34,384 | |||||||||||||||
Trustees fees | 6,810 | 55,079 | 3,960 | 13,558 | |||||||||||||||
Custody fees | 2,808 | 26,462 | 10,089 | 164,556 | |||||||||||||||
Miscellaneous expenses | 27,128 | 228,661 | 24,579 | 94,443 | |||||||||||||||
Total Expenses | 291,745 | 3,347,444 | 352,115 | 1,443,243 | |||||||||||||||
Expenses waived/reimbursed | (3,906 | ) | (26,103 | ) | (6,330 | ) | (162,171 | ) | |||||||||||
Net Expenses | 287,839 | 3,321,341 | 345,785 | 1,281,072 | |||||||||||||||
Net Investment Income | 1,158,810 | 5,178,458 | 127,484 | 2,901,706 | |||||||||||||||
Net Realized and Change in Unrealized Gain (Loss) | |||||||||||||||||||
Net realized gain (loss) on: | |||||||||||||||||||
Investments | 7,447,427 | 107,721,364 | 14,917,171 | 17,507,567 | |||||||||||||||
Futures contracts | - | 4,008,492 | 159,036 | 353,569 | |||||||||||||||
Foreign currency translations | - | (100 | ) | - | (31,162 | ) | |||||||||||||
Capital gain distributions from underlying funds | - | - | - | 36,614 | |||||||||||||||
7,447,427 | 111,729,756 | 15,076,207 | 17,866,588 | ||||||||||||||||
Net change in unrealized appreciation/(depreciation) on: | |||||||||||||||||||
Investments | (189,980 | ) | 49,648,526 | (1,216,557 | ) | (7,556,894 | ) | ||||||||||||
Futures contracts | - | (344,903 | ) | (4,635 | ) | 1,365 | |||||||||||||
Foreign currency translations | - | 253 | - | (22,990 | ) | ||||||||||||||
(189,980 | ) | 49,303,876 | (1,221,192 | ) | (7,578,519 | ) | |||||||||||||
Net Realized and Change in Unrealized Gain | 7,257,447 | 161,033,632 | 13,855,015 | 10,288,069 | |||||||||||||||
| Net Increase in Net Assets Resulting from Operations | $ | 8,416,257 | $ | 166,212,090 | $ | 13,982,499 | $ | 13,189,775 | |||||||||||
| * Foreign taxes withheld | $ | - | $ | 16,526 | $ | 61 | $ | 481,577 | |||||||||||
See accompanying notes to financial statements.
82
Global Atlantic Portfolios
Statements of Operations (Continued)
For the Year Ended December 31, 2021
| Global Atlantic BlackRock Disciplined Mid Cap Growth Portfolio | Global Atlantic BlackRock Disciplined Value Portfolio | Global Atlantic BlackRock High Yield Portfolio | Global Atlantic Goldman Sachs Core Fixed Income Portfolio | ||||||||||||||||
Investment Income: | |||||||||||||||||||
Dividend income* | $ | 1,481,602 | $ | 4,974,986 | $ | 20 | $ | 56 | |||||||||||
Interest income | - | - | 3,361,435 | 1,918,368 | |||||||||||||||
Total Investment Income | 1,481,602 | 4,974,986 | 3,361,455 | 1,918,424 | |||||||||||||||
Expenses: | |||||||||||||||||||
Investment advisory fee | 1,518,203 | 1,228,976 | 329,241 | 287,399 | |||||||||||||||
Distribution fees (12b-1) - Class II Shares | 237,234 | 19,396 | 2,007 | - | |||||||||||||||
Administrative service fees | 88,224 | 86,308 | 20,810 | 26,715 | |||||||||||||||
Legal fees | 59,230 | 58,197 | 14,037 | 18,029 | |||||||||||||||
Trustees fees | 22,496 | 22,798 | 5,680 | 7,447 | |||||||||||||||
Custody fees | 24,501 | 21,994 | 6,107 | 12,993 | |||||||||||||||
Miscellaneous expenses | 94,285 | 93,741 | 22,817 | 29,346 | |||||||||||||||
Total Expenses | 2,044,173 | 1,531,410 | 400,699 | 381,929 | |||||||||||||||
Expenses waived/reimbursed | (22,900 | ) | (13,916 | ) | (4,298 | ) | (8,039 | ) | |||||||||||
Net Expenses | 2,021,273 | 1,517,494 | 396,401 | 373,890 | |||||||||||||||
Net Investment Income (Loss) | (539,671 | ) | 3,457,492 | 2,965,054 | 1,544,534 | ||||||||||||||
Net Realized and Change in Unrealized Gain (Loss) | |||||||||||||||||||
Net realized gain (loss) on: | |||||||||||||||||||
Investments | 64,895,882 | 50,490,811 | 1,444,343 | 284,536 | |||||||||||||||
Short sales | - | - | - | 91 | |||||||||||||||
Futures contracts | 1,428,241 | 1,700,255 | (5,154 | ) | (315,193 | ) | |||||||||||||
Swap contracts | - | - | - | (184,942 | ) | ||||||||||||||
Swaptions | - | - | - | 31,814 | |||||||||||||||
Forward foreign currency contracts | - | - | - | (86,707 | ) | ||||||||||||||
Foreign currency translations | - | - | - | (10,898 | ) | ||||||||||||||
66,324,123 | 52,191,066 | 1,439,189 | (281,299 | ) | |||||||||||||||
Net change in unrealized appreciation/(depreciation) on: | |||||||||||||||||||
Investments | (33,097,481 | ) | 7,991,023 | (1,862,372 | ) | (3,166,654 | ) | ||||||||||||
Short Sales | - | - | - | (469 | ) | ||||||||||||||
Futures contracts | (122,269 | ) | (162,590 | ) | 13,311 | 123,139 | |||||||||||||
Swap contracts | - | - | - | 8,308 | |||||||||||||||
Swaptions | - | - | - | (2,510 | ) | ||||||||||||||
Forward foreign currency contracts | - | - | - | 52,377 | |||||||||||||||
Foreign currency translations | - | - | - | (332 | ) | ||||||||||||||
(33,219,750 | ) | 7,828,433 | (1,849,061 | ) | (2,986,141 | ) | |||||||||||||
Net Realized and Change in Unrealized Gain/ (Loss) | 33,104,373 | 60,019,499 | (409,872 | ) | (3,267,440 | ) | |||||||||||||
| Net Increase (Decrease) in Net Assets Resulting from Operations | $ | 32,564,702 | $ | 63,476,991 | $ | 2,555,182 | $ | (1,722,906 | ) | ||||||||||
| * Foreign taxes withheld | $ | 1,058 | $ | 1,190 | $ | - | $ | - | |||||||||||
See accompanying notes to financial statements.
83
Global Atlantic Portfolios
Statements of Changes in Net Assets
| Global Atlantic BlackRock Allocation Portfolio | Global Atlantic BlackRock Disciplined Core Portfolio | ||||||||||||||||||
| For the Year Ended December 31, 2021 | For the Year Ended December 31, 2020 | For the Year Ended December 31, 2021 | For the Year Ended December 31, 2020 | ||||||||||||||||
Increase/(Decrease) in Net Assets: | |||||||||||||||||||
From Operations: | |||||||||||||||||||
Net investment income | $ | 1,158,810 | $ | 1,264,798 | $ | 5,178,458 | $ | 6,713,949 | |||||||||||
Net realized gain | 7,447,427 | 2,321,018 | 111,729,756 | 28,008,337 | |||||||||||||||
Net change in unrealized appreciation (depreciation) | (189,980 | ) | 6,710,514 | 49,303,876 | 66,845,901 | ||||||||||||||
Net increase in net assets resulting from operations | 8,416,257 | 10,296,330 | 166,212,090 | 101,568,187 | |||||||||||||||
From Distributions to Shareholders: | |||||||||||||||||||
Total distributions paid | (3,880,297 | ) | (3,581,012 | ) | (34,691,795 | ) | (31,381,879 | ) | |||||||||||
From Shares of Beneficial Interest: | |||||||||||||||||||
Proceeds from shares sold | |||||||||||||||||||
Class I | 1,841,622 | 2,145,998 | 23,825,395 | * | 293,287 | ||||||||||||||
Class II | 1,120,778 | 1,535,338 | 5,169,859 | * | 292,426 | ||||||||||||||
Reinvestment of distributions | |||||||||||||||||||
Class I | 3,136,835 | 2,884,959 | 32,715,715 | 29,546,445 | |||||||||||||||
Class II | 743,463 | 696,053 | 1,976,080 | 1,835,434 | |||||||||||||||
Cost of shares redeemed | |||||||||||||||||||
Class I | (11,584,403 | ) | (12,033,397 | ) | (80,674,613 | ) | (68,367,445 | ) | |||||||||||
Class II | (3,138,099 | ) | (2,926,596 | ) | (8,827,419 | ) | (4,800,829 | ) | |||||||||||
| Net decrease in net assets from share transactions of beneficial interest | (7,879,804 | ) | (7,697,645 | ) | (25,814,983 | ) | (41,200,682 | ) | |||||||||||
Total increase (decrease) in net assets | (3,343,844 | ) | (982,327 | ) | 105,705,312 | 28,985,626 | |||||||||||||
Net Assets: | |||||||||||||||||||
Beginning of year | 80,996,053 | 81,978,380 | 611,825,826 | 582,840,200 | |||||||||||||||
End of year | $ | 77,652,209 | $ | 80,996,053 | $ | 717,531,138 | $ | 611,825,826 | |||||||||||
Share Activity: | |||||||||||||||||||
Class I | |||||||||||||||||||
Shares sold | 140,020 | 186,381 | 1,430,902 | ** | 23,630 | ||||||||||||||
Shares reinvested | 240,740 | 255,080 | 1,998,517 | 2,409,987 | |||||||||||||||
Shares redeemed | (889,588 | ) | (1,052,132 | ) | (5,101,518 | ) | (5,503,376 | ) | |||||||||||
| Net decrease in shares of beneficial interest outstanding | (508,828 | ) | (610,671 | ) | (1,672,099 | ) | (3,069,759 | ) | |||||||||||
Share Activity: | |||||||||||||||||||
Class II | |||||||||||||||||||
Shares sold | 85,829 | 132,908 | 312,152 | ** | 22,222 | ||||||||||||||
Shares reinvested | 57,190 | 61,707 | 120,861 | 149,831 | |||||||||||||||
Shares redeemed | (243,437 | ) | (256,098 | ) | (564,297 | ) | (378,988 | ) | |||||||||||
| Net decrease in shares of beneficial interest outstanding | (100,418 | ) | (61,483 | ) | (131,284 | ) | (206,935 | ) | |||||||||||
* Includes the value received from shares issued in connection with the reorganization. See Note 13 in the Notes to Financial Statements.
** Includes shares issued in connection with reorganization. See Note 13 in the Notes to Financial Statements.
See accompanying notes to financial statements.
84
Global Atlantic Portfolios
Statements of Changes in Net Assets (Continued)
| Global Atlantic BlackRock Disciplined Growth Portfolio | Global Atlantic BlackRock Disciplined International Core Portfolio | ||||||||||||||||||
| For the Year Ended December 31, 2021 | For the Year Ended December 31, 2020 | For the Year Ended December 31, 2021 | For the Year Ended December 31, 2020 | ||||||||||||||||
Increase/(Decrease) in Net Assets: | |||||||||||||||||||
From Operations: | |||||||||||||||||||
Net investment income | $ | 127,484 | $ | 38,336 | $ | 2,901,706 | $ | 1,942,977 | |||||||||||
Net realized gain (loss) | 15,076,207 | 1,869,667 | 17,866,588 | (4,558,850 | ) | ||||||||||||||
Net change in unrealized appreciation (depreciation) | (1,221,192 | ) | 3,555,040 | (7,754,649 | ) | 15,738,052 | |||||||||||||
Net increase in net assets resulting from operations | 13,982,499 | 5,463,043 | 13,189,775 | 13,122,179 | |||||||||||||||
From Distributions to Shareholders: | |||||||||||||||||||
Total distributions paid | (1,872,995 | ) | (1,026,608 | ) | (2,551,441 | ) | (2,589,599 | ) | |||||||||||
From Shares of Beneficial Interest: | |||||||||||||||||||
Proceeds from shares sold | |||||||||||||||||||
Class I | 97,856,259 | * | - | 16,738,187 | * | 1,103,114 | |||||||||||||
Class II | 7,299,576 | * | 795,624 | 13,978,820 | * | 694,580 | |||||||||||||
Reinvestment of distributions | |||||||||||||||||||
Class I | 1,467,358 | - | 1,833,625 | 1,917,814 | |||||||||||||||
Class II | 405,637 | 1,026,607 | 717,816 | 671,785 | |||||||||||||||
Cost of shares redeemed | |||||||||||||||||||
Class I | (8,649,029 | ) | - | (12,100,080 | ) | (10,239,925 | ) | ||||||||||||
Class II | (5,314,796 | ) | (4,161,048 | ) | (5,878,741 | ) | (4,712,910 | ) | |||||||||||
| Net increase (decrease) in net assets from share transactions of beneficial interest | 93,065,005 | (2,338,817 | ) | 15,289,627 | (10,565,542 | ) | |||||||||||||
Total increase (decrease) in net assets | 105,174,509 | 2,097,618 | 25,927,961 | (32,962 | ) | ||||||||||||||
Net Assets: | |||||||||||||||||||
Beginning of year | 20,174,913 | 18,077,295 | 148,556,948 | 148,589,910 | |||||||||||||||
End of year | $ | 125,349,422 | $ | 20,174,913 | $ | 174,484,909 | $ | 148,556,948 | |||||||||||
Share Activity: | |||||||||||||||||||
Class I | |||||||||||||||||||
Shares sold | 5,204,444 | ** | - | 1,458,438 | ** | 131,746 | |||||||||||||
Shares reinvested | 75,481 | - | 158,072 | 210,517 | |||||||||||||||
Shares redeemed | (441,444 | ) | - | (1,053,285 | ) | (1,099,777 | ) | ||||||||||||
| Net increase (decrease) in shares of beneficial interest outstanding | 4,838,481 | - | 563,225 | (757,514 | ) | ||||||||||||||
Share Activity: | |||||||||||||||||||
Class II | |||||||||||||||||||
Shares sold | 389,649 | ** | 60,808 | 1,221,987 | ** | 84,611 | |||||||||||||
Shares reinvested | 20,877 | 71,441 | 61,987 | 73,823 | |||||||||||||||
Shares redeemed | (297,713 | ) | (307,056 | ) | (511,655 | ) | (512,023 | ) | |||||||||||
| Net increase (decrease) in shares of beneficial interest outstanding | 112,813 | (174,807 | ) | 772,319 | (353,589 | ) | |||||||||||||
* Includes the value received from shares issued in connection with the reorganization. See Note 13 in the Notes to Financial Statements.
** Includes shares issued in connection with reorganization. See Note 13 in the Notes to Financial Statements.
See accompanying notes to financial statements.
85
Global Atlantic Portfolios
Statements of Changes in Net Assets (Continued)
| Global Atlantic BlackRock Disciplined Mid Cap Growth Portfolio | Global Atlantic BlackRock Disciplined Value Portfolio | ||||||||||||||||||
| For the Year Ended December 31, 2021 | For the Year Ended December 31, 2020 | For the Year Ended December 31, 2021 | For the Year Ended December 31, 2020 | ||||||||||||||||
Increase/(Decrease) in Net Assets: | |||||||||||||||||||
From Operations: | |||||||||||||||||||
Net investment income (loss) | $ | (539,671 | ) | $ | 68,192 | $ | 3,457,492 | $ | 4,342,335 | ||||||||||
Net realized gain (loss) | 66,324,123 | 23,700,338 | 52,191,066 | (4,910,551 | ) | ||||||||||||||
Net change in unrealized appreciation (depreciation) | (33,219,750 | ) | 37,642,627 | 7,828,433 | 8,025,829 | ||||||||||||||
Net increase in net assets resulting from operations | 32,564,702 | 61,411,157 | 63,476,991 | 7,457,613 | |||||||||||||||
From Distributions to Shareholders: | |||||||||||||||||||
Total distributions paid | (23,682,050 | ) | (14,730,628 | ) | (3,594,121 | ) | (14,604,649 | ) | |||||||||||
From Shares of Beneficial Interest: | |||||||||||||||||||
Proceeds from shares sold | |||||||||||||||||||
Class I | 55,813,006 | * | 614,595 | 614,623 | 614,076 | ||||||||||||||
Class II | 90,838,795 | * | 125,537 | 188,856 | 254,546 | ||||||||||||||
Reinvestment of distributions | |||||||||||||||||||
Class I | 13,977,471 | 10,866,505 | 3,509,478 | 14,211,082 | |||||||||||||||
Class II | 9,704,578 | 3,864,123 | 84,643 | 393,567 | |||||||||||||||
Cost of shares redeemed | |||||||||||||||||||
Class I | (29,299,309 | ) | (24,429,910 | ) | (35,365,378 | ) | (29,391,970 | ) | |||||||||||
Class II | (11,805,579 | ) | (6,945,832 | ) | (1,094,831 | ) | (744,114 | ) | |||||||||||
| Net increase (decrease) in net assets from share transactions of beneficial interest | 129,228,962 | (15,904,982 | ) | (32,062,609 | ) | (14,662,813 | ) | ||||||||||||
Total increase (decrease) in net assets | 138,111,614 | 30,775,547 | 27,820,261 | (21,809,849 | ) | ||||||||||||||
Net Assets: | |||||||||||||||||||
Beginning of year | 222,510,261 | 191,734,714 | 251,959,125 | 273,768,974 | |||||||||||||||
End of year | $ | 360,621,875 | $ | 222,510,261 | $ | 279,779,386 | $ | 251,959,125 | |||||||||||
Share Activity: | |||||||||||||||||||
Class I | |||||||||||||||||||
Shares sold | 3,012,584 | ** | 46,992 | 46,837 | 65,058 | ||||||||||||||
Shares reinvested | 765,469 | 763,634 | 259,194 | 1,491,194 | |||||||||||||||
Shares redeemed | (1,640,482 | ) | (1,767,666 | ) | (2,741,658 | ) | (2,826,318 | ) | |||||||||||
| Net increase (decrease) in shares of beneficial interest outstanding | 2,137,571 | (957,040 | ) | (2,435,627 | ) | (1,270,066 | ) | ||||||||||||
Share Activity: | |||||||||||||||||||
Class II | |||||||||||||||||||
Shares sold | 4,915,247 | ** | 9,404 | 15,149 | 23,718 | ||||||||||||||
Shares reinvested | 532,633 | 271,548 | 6,242 | 41,211 | |||||||||||||||
Shares redeemed | (656,427 | ) | (507,907 | ) | (85,508 | ) | (70,617 | ) | |||||||||||
| Net increase (decrease) in shares of beneficial interest outstanding | 4,791,453 | (226,955 | ) | (64,117 | ) | (5,688 | ) | ||||||||||||
* Includes the value received from shares issued in connection with the reorganization. See Note 13 in the Notes to Financial Statements.
** Includes shares issued in connection with reorganization. See Note 13 in the Notes to Financial Statements.
See accompanying notes to financial statements.
86
Global Atlantic Portfolios
Statements of Changes in Net Assets (Continued)
| Global Atlantic BlackRock High Yield Portfolio | Global Atlantic Goldman Sachs Core Fixed Income Portfolio | ||||||||||||||||||
| For the Year Ended December 31, 2021 | For the Year Ended December 31, 2020 | For the Year Ended December 31, 2021 | For the Year Ended December 31, 2020 | ||||||||||||||||
Increase/(Decrease) in Net Assets: | |||||||||||||||||||
From Operations: | |||||||||||||||||||
Net investment income | $ | 2,965,054 | $ | 3,218,036 | $ | 1,544,534 | $ | 1,983,068 | |||||||||||
Net realized gain (loss) | 1,439,189 | (1,622,955 | ) | (281,299 | ) | 3,680,116 | |||||||||||||
Net change in unrealized appreciation (depreciation) | (1,849,061 | ) | 1,741,661 | (2,986,141 | ) | 2,553,404 | |||||||||||||
| Net increase (decrease) in net assets resulting from operations | 2,555,182 | 3,336,742 | (1,722,906 | ) | 8,216,588 | ||||||||||||||
From Distributions to Shareholders: | |||||||||||||||||||
Total distributions paid | (3,219,040 | ) | (3,704,548 | ) | (5,827,630 | ) | (4,212,919 | ) | |||||||||||
From Shares of Beneficial Interest: | |||||||||||||||||||
Proceeds from shares sold | |||||||||||||||||||
Class I | 6,056,458 | 8,495,258 | 3,742,962 | 8,702,714 | |||||||||||||||
Class II | 38,887 | 29,833 | - | - | |||||||||||||||
Reinvestment of distributions | |||||||||||||||||||
Class I | 3,182,155 | 3,661,770 | 5,827,630 | 4,212,919 | |||||||||||||||
Class II | 36,885 | 42,778 | - | - | |||||||||||||||
Cost of shares redeemed | |||||||||||||||||||
Class I | (10,554,711 | ) | (16,330,289 | ) | (13,200,885 | ) | (15,883,140 | ) | |||||||||||
Class II | (75,165 | ) | (168,251 | ) | - | - | |||||||||||||
| Net decrease in net assets from share transactions of beneficial interest | (1,315,491 | ) | (4,268,901 | ) | (3,630,293 | ) | (2,967,507 | ) | |||||||||||
Total increase (decrease) in net assets | (1,979,349 | ) | (4,636,707 | ) | (11,180,829 | ) | 1,036,162 | ||||||||||||
Net Assets: | |||||||||||||||||||
Beginning of year | 66,990,602 | 71,627,309 | 91,542,051 | 90,505,889 | |||||||||||||||
End of year | $ | 65,011,253 | $ | 66,990,602 | $ | 80,361,222 | $ | 91,542,051 | |||||||||||
Share Activity: | |||||||||||||||||||
Class I | |||||||||||||||||||
Shares sold | 591,243 | 857,690 | 353,421 | 778,521 | |||||||||||||||
Shares reinvested | 318,854 | 377,892 | 579,287 | 386,506 | |||||||||||||||
Shares redeemed | (1,035,993 | ) | (1,652,722 | ) | (1,226,960 | ) | (1,435,874 | ) | |||||||||||
| Net decrease in shares of beneficial interest outstanding | (125,896 | ) | (417,140 | ) | (294,252 | ) | (270,847 | ) | |||||||||||
Share Activity: | |||||||||||||||||||
Class II | |||||||||||||||||||
Shares sold | 3,773 | 2,999 | - | - | |||||||||||||||
Shares reinvested | 3,696 | 4,414 | - | - | |||||||||||||||
Shares redeemed | (7,361 | ) | (17,075 | ) | - | - | |||||||||||||
| Net increase (decrease) in shares of beneficial interest outstanding | 108 | (9,662 | ) | - | - | ||||||||||||||
See accompanying notes to financial statements.
87
Global Atlantic Portfolios
Financial Highlights
Global Atlantic BlackRock Allocation Portfolio
Selected data for a Class I share outstanding throughout each period indicated
| For the Year Ended December 31, 2021 | For the Year Ended December 31, 2020 | For the Year Ended December 31, 2019 | For the Year Ended December 31, 2018 | For the Period Ended December 31, 2017 (a) | |||||||||||||||||||
| Net asset value, beginning of period | $ | 12.45 | $ | 11.42 | $ | 9.62 | $ | 10.19 | $ | 10.00 | |||||||||||||
| Income from investment operations: | |||||||||||||||||||||||
| Net investment income (b,c) | 0.20 | 0.19 | 0.23 | 0.21 | 0.06 | ||||||||||||||||||
| Net realized and unrealized gain (loss) (d) | 1.20 | 1.40 | 1.79 | (0.73 | ) | 0.13 | |||||||||||||||||
| Total income (loss) from investment operations | 1.40 | 1.59 | 2.02 | (0.52 | ) | 0.19 | |||||||||||||||||
Less distributions from: | |||||||||||||||||||||||
Net investment income | (0.23 | ) | (0.27 | ) | (0.22 | ) | (0.05 | ) | - | ||||||||||||||
Net realized gains | (0.45 | ) | (0.29 | ) | - | 0.00 | (e) | - | |||||||||||||||
| Total distributions from net investment income and net realized gains | (0.68 | ) | (0.56 | ) | (0.22 | ) | (0.05 | ) | - | ||||||||||||||
| Net asset value, end of period | $ | 13.17 | $ | 12.45 | $ | 11.42 | $ | 9.62 | $ | 10.19 | |||||||||||||
Total return (f) | 11.33 | % | 14.46 | % | 21.09 | % | (5.14 | )% (g) | 1.90 | % (g) | |||||||||||||
| Ratios and Supplemental Data: | |||||||||||||||||||||||
| Net assets, end of period (in 000's) | $ | 61,826 | $ | 64,791 | $ | 66,410 | $ | 63,462 | $ | 75,191 | |||||||||||||
| Ratio of net expenses to average net assets (h) | 0.31 | % | 0.31 | % | 0.31 | % | 0.31 | % | 0.31 | % (i) | |||||||||||||
| Ratio of gross expenses to average net assets (h,j) | 0.32 | % | 0.33 | % | 0.34 | % | 0.32 | % | 0.32 | % (i) | |||||||||||||
| Ratio of net investment income to average net assets (c,h) | 1.52 | % | 1.69 | % | 2.15 | % | 2.06 | % | 4.15 | % (i) | |||||||||||||
Portfolio turnover rate | 73 | % | 85 | % | 61 | % | 54 | % | 2 | % (k) | |||||||||||||
(a) Global Atlantic BlackRock Allocation Portfolio inception date is November 1, 2017. The Fund commenced operations on November 6, 2017.
(b) Net investment income has been calculated using the average shares method, which more appropriately presents the per share data for the period.
(c) Recognition of net investment income by the Portfolio is affected by the timing of the declaration of dividends by the underlying investment companies in which the Portfolio invests.
(d) Realized and unrealized gain (loss) per share are balancing amounts necessary to reconcile the change in net asset value per share for the period, and may not reconcile with aggregate gains and losses in the statement of operations due to timing of share transactions.
(e) Less than $0.005 per share.
(f) Total returns are historical and assume changes in share price and reinvestment of dividends and capital gains distributions. Total return does not reflect the deduction of taxes that a shareholder may pay on Portfolio distributions or on the redemption of Portfolio shares, as well as other charges and expenses of the insurance contract or separate account. Total returns would have been lower absent fee waivers by the Adviser.
(g) For the period ended December 31, 2017 and the year ended December 31, 2018, the Portfolio received reimbursements from a related party. The reimbursements had no impact on the Portfolio's total return.
(h) Does not include the expenses of the investment companies in which the Portfolio invests.
(i) Annualized.
(j) Represents the ratio of expenses to average net assets absent fee waivers and/or expense reimbursements by the Adviser.
(k) Not annualized.
See accompanying notes to financial statements.
88
Global Atlantic Portfolios
Financial Highlights
Global Atlantic BlackRock Allocation Portfolio
Selected data for a Class II share outstanding throughout each period indicated
| For the Year Ended December 31, 2021 | For the Year Ended December 31, 2020 | For the Year Ended December 31, 2019 | For the Year Ended December 31, 2018 | For the Period Ended December 31, 2017 (a) | |||||||||||||||||||
| Net asset value, beginning of period | $ | 12.41 | $ | 11.39 | $ | 9.61 | $ | 10.18 | $ | 10.00 | |||||||||||||
| Income from investment operations: | |||||||||||||||||||||||
| Net investment income (b,c) | 0.17 | 0.17 | 0.21 | 0.20 | 0.14 | ||||||||||||||||||
| Net realized and unrealized gain (loss) (d) | 1.19 | 1.38 | 1.78 | (0.74 | ) | 0.04 | |||||||||||||||||
| Total income (loss) from investment operations | 1.36 | 1.55 | 1.99 | (0.54 | ) | 0.18 | |||||||||||||||||
Less distributions from: | |||||||||||||||||||||||
Net investment income | (0.19 | ) | (0.24 | ) | (0.21 | ) | (0.03 | ) | - | ||||||||||||||
Net realized gains | (0.45 | ) | (0.29 | ) | - | 0.00 | (e) | - | |||||||||||||||
| Total distributions from net investment income and net realized gains | (0.64 | ) | (0.53 | ) | (0.21 | ) | (0.03 | ) | - | ||||||||||||||
| Net asset value, end of period | $ | 13.13 | $ | 12.41 | $ | 11.39 | $ | 9.61 | $ | 10.18 | |||||||||||||
Total return (f) | 11.04 | % | 14.13 | % | 20.82 | % | (5.33 | )% (g) | 1.80 | % (g) | |||||||||||||
| Ratios and Supplemental Data: | |||||||||||||||||||||||
| Net assets, end of period (in 000's) | $ | 15,826 | $ | 16,205 | $ | 15,568 | $ | 13,806 | $ | 9,034 | |||||||||||||
| Ratio of net expenses to average net assets (h) | 0.56 | % | 0.56 | % | 0.56 | % | 0.56 | % | 0.56 | % (i) | |||||||||||||
| Ratio of gross expenses to average net assets (h,j) | 0.57 | % | 0.58 | % | 0.59 | % | 0.57 | % | 0.56 | % (i) | |||||||||||||
| Ratio of net investment income to average net assets (c,h) | 1.28 | % | 1.45 | % | 1.91 | % | 1.99 | % | 9.11 | % (i) | |||||||||||||
Portfolio turnover rate | 73 | % | 85 | % | 61 | % | 54 | % | 2 | % (k) | |||||||||||||
(a) Global Atlantic BlackRock Allocation Portfolio inception date is November 1, 2017. The Fund commenced operations on November 6, 2017.
(b) Net investment income has been calculated using the average shares method, which more appropriately presents the per share data for the period.
(c) Recognition of net investment income by the Portfolio is affected by the timing of the declaration of dividends by the underlying investment companies in which the Portfolio invests.
(d) Realized and unrealized gain (loss) per share are balancing amounts necessary to reconcile the change in net asset value per share for the period, and may not reconcile with aggregate gains and losses in the statement of operations due to timing of share transactions.
(e) Less than $0.005 per share.
(f) Total returns are historical and assume changes in share price and reinvestment of dividends and capital gains distributions. Total return does not reflect the deduction of taxes that a shareholder may pay on Portfolio distributions or on the redemption of Portfolio shares, as well as other charges and expenses of the insurance contract or separate account. Total returns would have been lower absent fee waivers by the Adviser.
(g) For the period ended December 31, 2017 and the year ended December 31, 2018, the Portfolio received reimbursements from a related party. The reimbursements had no impact on the Portfolio's total return.
(h) Does not include the expenses of the investment companies in which the Portfolio invests.
(i) Annualized.
(j) Represents the ratio of expenses to average net assets absent fee waivers and/or expense reimbursements by the Adviser.
(k) Not annualized.
See accompanying notes to financial statements.
89
Global Atlantic Portfolios
Financial Highlights
Global Atlantic BlackRock Disciplined Core Portfolio
Selected data for a Class I share outstanding throughout each period indicated
| For the Year Ended December 31, 2021 | For the Year Ended December 31, 2020 | For the Year Ended December 31, 2019 | For the Year Ended December 31, 2018 | For the Period Ended December 31, 2017 (a) | |||||||||||||||||||
| Net asset value, beginning of period | $ | 13.98 | $ | 12.39 | $ | 9.74 | $ | 10.38 | $ | 10.00 | |||||||||||||
| Income from investment operations: | |||||||||||||||||||||||
| Net investment income (b) | 0.13 | 0.15 | 0.17 | 0.16 | 0.03 | ||||||||||||||||||
| Net realized and unrealized gain (loss) (c) | 3.84 | 2.19 | 2.66 | (0.64 | ) | 0.35 | |||||||||||||||||
| Total income (loss) from investment operations | 3.97 | 2.34 | 2.83 | (0.48 | ) | 0.38 | |||||||||||||||||
Less distributions from: | |||||||||||||||||||||||
Net investment income | (0.15 | ) | (0.20 | ) | (0.18 | ) | (0.12 | ) | - | ||||||||||||||
Net realized gains | (0.70 | ) | (0.55 | ) | - | (0.04 | ) | - | |||||||||||||||
| Total distributions from net investment income and net realized gains | (0.85 | ) | (0.75 | ) | (0.18 | ) | (0.16 | ) | - | ||||||||||||||
| Net asset value, end of period | $ | 17.10 | $ | 13.98 | $ | 12.39 | $ | 9.74 | $ | 10.38 | |||||||||||||
Total return (d) | 28.67 | % | 19.69 | % | 29.21 | % | (4.75 | )% (e) | 3.80 | % (e) | |||||||||||||
| Ratios and Supplemental Data: | |||||||||||||||||||||||
| Net assets, end of period (in 000's) | $ | 674,859 | $ | 575,095 | $ | 547,724 | $ | 486,491 | $ | 315,936 | |||||||||||||
| Ratio of net expenses to average net assets | 0.49 | % | 0.48 | % | 0.48 | % | 0.48 | % | 0.48 | % (f) | |||||||||||||
| Ratio of gross expenses to average net assets (g) | 0.49 | % | 0.50 | % | 0.50 | % | 0.49 | % | 0.48 | % (f) | |||||||||||||
| Ratio of net investment income to average net assets | 0.79 | % | 1.23 | % | 1.53 | % | 1.51 | % | 1.67 | % (f) | |||||||||||||
Portfolio turnover rate | 109 | % (h) | 122 | % | 130 | % | 156 | % | 18 | % (i) | |||||||||||||
(a) Global Atlantic BlackRock Disciplined Core Portfolio inception date is November 1, 2017. The Fund commenced operations on November 6, 2017.
(b) Net investment income has been calculated using the average shares method, which more appropriately presents the per share data for the period.
(c) Realized and unrealized gain (loss) per share are balancing amounts necessary to reconcile the change in net asset value per share for the period, and may not reconcile with aggregate gains and losses in the statement of operations due to timing of share transactions.
(d) Total returns are historical and assume changes in share price and reinvestment of dividends and capital gains distributions. Total return does not reflect the deduction of taxes that a shareholder may pay on Portfolio distributions or on the redemption of Portfolio shares, as well as other charges and expenses of the insurance contract or separate account. Total returns would have been lower absent fee waivers by the Adviser.
(e) For the period ended December 31, 2017 and the year ended December 31, 2018, the Portfolio received reimbursements from a related party. The reimbursements had no impact on the Portfolio's total return.
(f) Annualized.
(g) Represents the ratio of expenses to average net assets absent fee waivers and/or expense reimbursements by the Adviser.
(h) During the year ended December 31, 2021, the Portfolio engaged in security transactions associated with the transition of assets from Global Atlantic BlackRock Disciplined U.S. Core Portfolio, which merged into the Portfolio on August 20, 2021. Certain security transactions were excluded from the portfolio turnover rate calculation. If these transactions were included, portfolio turnover would have been higher.
(i) Not annualized.
See accompanying notes to financial statements.
90
Global Atlantic Portfolios
Financial Highlights
Global Atlantic BlackRock Disciplined Core Portfolio
Selected data for a Class II share outstanding throughout each period indicated
| For the Year Ended December 31, 2021 | For the Year Ended December 31, 2020 | For the Year Ended December 31, 2019 | For the Year Ended December 31, 2018 | For the Period Ended December 31, 2017 (a) | |||||||||||||||||||
| Net asset value, beginning of period | $ | 13.96 | $ | 12.37 | $ | 9.72 | $ | 10.37 | $ | 10.00 | |||||||||||||
| Income from investment operations: | |||||||||||||||||||||||
| Net investment income (b) | 0.09 | 0.12 | 0.14 | 0.13 | 0.02 | ||||||||||||||||||
| Net realized and unrealized gain (loss) (c) | 3.83 | 2.18 | 2.66 | (0.65 | ) | 0.35 | |||||||||||||||||
| Total income (loss) from investment operations | 3.92 | 2.30 | 2.80 | (0.52 | ) | 0.37 | |||||||||||||||||
Less distributions from: | |||||||||||||||||||||||
Net investment income | (0.11 | ) | (0.16 | ) | (0.15 | ) | (0.09 | ) | - | ||||||||||||||
Net realized gains | (0.70 | ) | (0.55 | ) | - | (0.04 | ) | - | |||||||||||||||
| Total distributions from net investment income and net realized gains | (0.81 | ) | (0.71 | ) | (0.15 | ) | (0.13 | ) | - | ||||||||||||||
| Net asset value, end of period | $ | 17.07 | $ | 13.96 | $ | 12.37 | $ | 9.72 | $ | 10.37 | |||||||||||||
Total return (d) | 28.35 | % | 19.42 | % | 28.94 | % | (5.06 | )% (e) | 3.70 | % (e) | |||||||||||||
| Ratios and Supplemental Data: | |||||||||||||||||||||||
| Net assets, end of period (in 000's) | $ | 42,672 | $ | 36,731 | $ | 35,116 | $ | 32,442 | $ | 36,674 | |||||||||||||
| Ratio of net expenses to average net assets | 0.74 | % | 0.73 | % | 0.73 | % | 0.73 | % | 0.72 | % (f) | |||||||||||||
| Ratio of gross expenses to average net assets (g) | 0.74 | % | 0.75 | % | 0.75 | % | 0.74 | % | 0.72 | % (f) | |||||||||||||
| Ratio of net investment income to average net assets | 0.54 | % | 0.98 | % | 1.28 | % | 1.24 | % | 1.00 | % (f) | |||||||||||||
Portfolio turnover rate | 109 | % (h) | 122 | % | 130 | % | 156 | % | 18 | % (i) | |||||||||||||
(a) Global Atlantic BlackRock Disciplined Core Portfolio inception date is November 1, 2017. The Fund commenced operations on November 6, 2017.
(b) Net investment income has been calculated using the average shares method, which more appropriately presents the per share data for the period.
(c) Realized and unrealized gain (loss) per share are balancing amounts necessary to reconcile the change in net asset value per share for the period, and may not reconcile with aggregate gains and losses in the statement of operations due to timing of share transactions.
(d) Total returns are historical and assume changes in share price and reinvestment of dividends and capital gains distributions. Total return does not reflect the deduction of taxes that a shareholder may pay on Portfolio distributions or on the redemption of Portfolio shares, as well as other charges and expenses of the insurance contract or separate account. Total returns would have been lower absent fee waivers by the Adviser.
(e) For the period ended December 31, 2017 and the year ended December 31, 2018, the Portfolio received reimbursements from a related party. The reimbursements had no impact on the Portfolio's total return.
(f) Annualized.
(g) Represents the ratio of expenses to average net assets absent fee waivers and/or expense reimbursements by the Adviser.
(h) During the year ended December 31, 2021, the Portfolio engaged in security transactions associated with the transition of assets from Global Atlantic BlackRock Disciplined U.S. Core Portfolio, which merged into the Portfolio on August 20, 2021. Certain security transactions were excluded from the portfolio turnover rate calculation. If these transactions were included, portfolio turnover would have been higher.
(i) Not annualized.
See accompanying notes to financial statements.
91
Global Atlantic Portfolios
Financial Highlights
Global Atlantic BlackRock Disciplined Growth Portfolio
Selected data for a Class I share outstanding throughout the period indicated
| For the Period Ended December 31, 2021 (a) | |||||||
Net asset value, beginning of period | $ | 18.80 | |||||
Income from investment operations: | |||||||
Net investment income (b) | 0.03 | ||||||
Net realized and unrealized gain (loss) (c) | 1.67 | ||||||
Total income from investment operations | 1.70 | ||||||
Less distributions from: | |||||||
Net investment income | - | ||||||
Net realized gains | (0.29 | ) | |||||
Total distributions from net investment income and net realized gains | (0.29 | ) | |||||
Net asset value, end of period | $ | 20.21 | |||||
Total return (d) | 9.12 | % | |||||
Ratios and Supplemental Data: | |||||||
Net assets, end of period (in 000's) | $ | 97,770 | |||||
Ratio of net expenses to average net assets | 0.48 | % (e) | |||||
Ratio of gross expenses to average net assets | 0.48 | % (e) | |||||
Ratio of net investment income to average net assets | 0.36 | % (e) | |||||
Portfolio turnover rate | 130 | % (f,g) | |||||
(a) Global Atlantic BlackRock Disciplined Growth Portfolio inception date is November 1, 2017. The Fund commenced operations on November 6, 2017. Class I commenced operations on August 20, 2021 as a result of a reorganization (see Note 13 in the Notes to Financial Statements).
(b) Net investment income has been calculated using the average shares method, which more appropriately presents the per share data for the period.
(c) Realized and unrealized gain (loss) per share are balancing amounts necessary to reconcile the change in net asset value per share for the period, and may not reconcile with aggregate gains and losses in the statement of operations due to timing of share transactions.
(d) Total returns are historical and assume changes in share price and reinvestment of dividends and capital gains distributions. Total return does not reflect the deduction of taxes that a shareholder may pay on Portfolio distributions or on the redemption of Portfolio shares, as well as other charges and expenses of the insurance contract or separate account. Total returns for periods less than one year are not annualized. Total returns would have been lower absent fee waivers by the Adviser.
(e) Annualized.
(f) Not annualized.
(g) During the year ended December 31, 2021, the Portfolio engaged in security transactions associated with the transition of assets from Global Atlantic Goldman Sachs Large Cap Growth Insights Portfolio, which merged into the Portfolio on August 20, 2021. Certain security transactions were excluded from the portfolio turnover rate calculation. If these transactions were included, portfolio turnover would have been higher.
See accompanying notes to financial statements.
92
Global Atlantic Portfolios
Financial Highlights
Global Atlantic BlackRock Disciplined Growth Portfolio
Selected data for a Class II share outstanding throughout each period indicated
| For the Year Ended December 31, 2021 | For the Year Ended December 31, 2020 | For the Year Ended December 31, 2019 | For the Year Ended December 31, 2018 | For the Period Ended December 31, 2017 (a) | |||||||||||||||||||
| Net asset value, beginning of period | $ | 16.10 | $ | 12.66 | $ | 9.85 | $ | 10.32 | $ | 10.00 | |||||||||||||
| Income from investment operations: | |||||||||||||||||||||||
| Net investment income (loss) (b) | (0.00 | ) (c) | 0.03 | 0.07 | 0.08 | 0.02 | |||||||||||||||||
| Net realized and unrealized gain (loss) (d) | 4.38 | 4.26 | 3.18 | (0.38 | ) | 0.30 | |||||||||||||||||
| Total income (loss) from investment operations | 4.38 | 4.29 | 3.25 | (0.30 | ) | 0.32 | |||||||||||||||||
Less distributions from: | |||||||||||||||||||||||
Net investment income | - | (0.06 | ) | (0.06 | ) | (0.08 | ) | - | |||||||||||||||
Net realized gains | (0.29 | ) | (0.79 | ) | (0.38 | ) | (0.09 | ) | - | ||||||||||||||
| Total distributions from net investment income and net realized gains | (0.29 | ) | (0.85 | ) | (0.44 | ) | (0.17 | ) | - | ||||||||||||||
| Net asset value, end of period | $ | 20.19 | $ | 16.10 | $ | 12.66 | $ | 9.85 | $ | 10.32 | |||||||||||||
Total return (e) | 27.29 | % | 34.68 | % | 33.38 | % | (2.98 | )% | 3.20 | % (f) | |||||||||||||
| Ratios and Supplemental Data: | |||||||||||||||||||||||
| Net assets, end of period (in 000's) | $ | 27,579 | $ | 20,175 | $ | 18,077 | $ | 15,807 | $ | 20,534 | |||||||||||||
| Ratio of net expenses to average net assets | 0.77 | % | 0.79 | % | 0.79 | % | 0.79 | % | 0.79 | % (g) | |||||||||||||
| Ratio of gross expenses to average net assets (h) | 0.80 | % | 0.87 | % | 0.85 | % | 0.81 | % | 0.80 | % (g) | |||||||||||||
| Ratio of net investment income to average net assets | (0.00 | )% (c) | 0.21 | % | 0.58 | % | 0.75 | % | 1.14 | % (g) | |||||||||||||
Portfolio turnover rate | 130 | % (i) | 133 | % | 144 | % | 156 | % | 23 | % (j) | |||||||||||||
(a) Global Atlantic BlackRock Disciplined Growth Portfolio inception date is November 1, 2017. The Fund commenced operations on November 6, 2017.
(b) Net investment income has been calculated using the average shares method, which more appropriately presents the per share data for the period.
(c) Less than $0.005 or 0.005% per share.
(d) Realized and unrealized gain (loss) per share are balancing amounts necessary to reconcile the change in net asset value per share for the period, and may not reconcile with aggregate gains and losses in the statement of operations due to timing of share transactions.
(e) Total returns are historical and assume changes in share price and reinvestment of dividends and capital gains distributions. Total return does not reflect the deduction of taxes that a shareholder may pay on Portfolio distributions or on the redemption of Portfolio shares, as well as other charges and expenses of the insurance contract or separate account. Total returns would have been lower absent fee waivers by the Adviser.
(f) For the period ended December 31, 2017, the Portfolio received reimbursements from a related party. The reimbursements had no impact on the Portfolio's total return.
(g) Annualized.
(h) Represents the ratio of expenses to average net assets absent fee waivers and/or expense reimbursements by the Adviser.
(i) During the year ended December 31, 2021, the Portfolio engaged in security transactions associated with the transition of assets from Global Atlantic Goldman Sachs Large Cap Growth Insights Portfolio, which merged into the Portfolio on August 20, 2021. Certain security transactions were excluded from the portfolio turnover rate calculation. If these transactions were included, portfolio turnover would have been higher.
(j) Not annualized.
See accompanying notes to financial statements.
93
Global Atlantic Portfolios
Financial Highlights
Global Atlantic BlackRock Disciplined International Core Portfolio
Selected data for a Class I share outstanding throughout each period indicated
| For the Year Ended December 31, 2021 | For the Year Ended December 31, 2020 | For the Year Ended December 31, 2019 | For the Year Ended December 31, 2018 | For the Period Ended December 31, 2017 (a) | |||||||||||||||||||
| Net asset value, beginning of period | $ | 10.78 | $ | 9.98 | $ | 8.50 | $ | 10.20 | $ | 10.00 | |||||||||||||
| Income from investment operations: | |||||||||||||||||||||||
| Net investment income (b,c) | 0.22 | 0.14 | 0.25 | 0.23 | 0.03 | ||||||||||||||||||
| Net realized and unrealized gain (loss) (d) | 0.73 | 0.85 | 1.48 | (1.74 | ) | 0.17 | |||||||||||||||||
| Total income (loss) from investment operations | 0.95 | 0.99 | 1.73 | (1.51 | ) | 0.20 | |||||||||||||||||
Less distributions from: | |||||||||||||||||||||||
Net investment income | (0.18 | ) | (0.19 | ) | (0.25 | ) | (0.19 | ) | - | ||||||||||||||
Net realized gains | - | - | - | 0.00 | (e) | - | |||||||||||||||||
| Total distributions from net investment income and net realized gains | (0.18 | ) | (0.19 | ) | (0.25 | ) | (0.19 | ) | - | ||||||||||||||
| Net asset value, end of period | $ | 11.55 | $ | 10.78 | $ | 9.98 | $ | 8.50 | $ | 10.20 | |||||||||||||
Total return (f) | 8.77 | % | 10.32 | % | 20.50 | % | (14.80 | )% (g) | 2.00 | % (h) | |||||||||||||
| Ratios and Supplemental Data: | |||||||||||||||||||||||
| Net assets, end of period (in 000's) | $ | 120,258 | $ | 106,216 | $ | 105,876 | $ | 98,694 | $ | 67,071 | |||||||||||||
| Ratio of net expenses to average net assets (i) | 0.72 | % | 0.69 | % | 0.69 | % | 0.69 | % | 0.69 | % (j) | |||||||||||||
| Ratio of gross expenses to average net assets (i,k) | 0.82 | % | 0.84 | % | 0.72 | % | 0.70 | % | 0.69 | % (j) | |||||||||||||
| Ratio of net investment income to average net assets (c,i) | 1.87 | % | 1.55 | % | 2.61 | % | 2.30 | % | 1.99 | % (j) | |||||||||||||
Portfolio turnover rate | 117 | % (l) | 161 | % | 86 | % | 67 | % | 4 | % (m) | |||||||||||||
(a) Global Atlantic BlackRock Disciplined International Core Portfolio inception date is November 1, 2017. The Fund commenced operations on November 6, 2017.
(b) Net investment income has been calculated using the average shares method, which more appropriately presents the per share data for the period.
(c) Recognition of net investment income by the Portfolio is affected by the timing of the declaration of dividends by the underlying investment companies in which the Portfolio invests.
(d) Realized and unrealized gain (loss) per share are balancing amounts necessary to reconcile the change in net asset value per share for the period, and may not reconcile with aggregate gains and losses in the statement of operations due to timing of share transactions.
(e) Less than $0.005 per share.
(f) Total returns are historical and assume changes in share price and reinvestment of dividends and capital gains distributions. Total return does not reflect the deduction of taxes that a shareholder may pay on Portfolio distributions or on the redemption of Portfolio shares, as well as other charges and expenses of the insurance contract or separate account. Total returns would have been lower absent fee waivers by the Adviser.
(g) For the year ended December 31, 2018, 0.10% of the Portfolio's total return consisted of a reimbursement from an affiliate. Excluding this item, the total return would have been (14.90)%.
(h) For the period ended December 31, 2017, 0.13% of the Portfolio's total return consisted of a reimbursement from an affiliate. Excluding this item, the total return would have been 1.87%.
(i) Does not include the expenses of the investment companies in which the Portfolio invests.
(j) Annualized.
(k) Represents the ratio of expenses to average net assets absent fee waivers and/or expense reimbursements by the Adviser.
(l) During the year ended December 31, 2021, the Portfolio engaged in security transactions associated with the transition of assets from Global Atlantic Goldman Sachs Global Equity Insights Portfolio, which merged into the Portfolio on August 20, 2021. Certain security transactions were excluded from the portfolio turnover rate calculation. If these transactions were included, portfolio turnover would have been higher.
(m) Not annualized.
See accompanying notes to financial statements.
94
Global Atlantic Portfolios
Financial Highlights
Global Atlantic BlackRock Disciplined International Core Portfolio
Selected data for a Class II share outstanding throughout each period indicated
| For the Year Ended December 31, 2021 | For the Year Ended December 31, 2020 | For the Year Ended December 31, 2019 | For the Year Ended December 31, 2018 | For the Period Ended December 31, 2017 (a) | |||||||||||||||||||
| Net asset value, beginning of period | $ | 10.77 | $ | 9.97 | $ | 8.49 | $ | 10.19 | $ | 10.00 | |||||||||||||
| Income from investment operations: | |||||||||||||||||||||||
| Net investment income (b,c) | 0.19 | 0.12 | 0.22 | 0.22 | 0.05 | ||||||||||||||||||
| Net realized and unrealized gain (loss) (d) | 0.72 | 0.85 | 1.48 | (1.74 | ) | 0.14 | |||||||||||||||||
| Total income (loss) from investment operations | 0.91 | 0.97 | 1.70 | (1.52 | ) | 0.19 | |||||||||||||||||
Less distributions from: | |||||||||||||||||||||||
Net investment income | (0.15 | ) | (0.17 | ) | (0.22 | ) | (0.18 | ) | - | ||||||||||||||
Net realized gains | - | - | - | 0.00 | (e) | - | |||||||||||||||||
| Total distributions from net investment income and net realized gains | (0.15 | ) | (0.17 | ) | (0.22 | ) | (0.18 | ) | - | ||||||||||||||
| Net asset value, end of period | $ | 11.53 | $ | 10.77 | $ | 9.97 | $ | 8.49 | $ | 10.19 | |||||||||||||
Total return (f) | 8.47 | % | 10.05 | % | 20.22 | % | (14.95 | )% (g) | 1.90 | % (h) | |||||||||||||
| Ratios and Supplemental Data: | |||||||||||||||||||||||
| Net assets, end of period (in 000's) | $ | 54,227 | $ | 42,341 | $ | 42,714 | $ | 41,052 | $ | 5,097 | |||||||||||||
| Ratio of net expenses to average net assets (i) | 0.97 | % | 0.94 | % | 0.94 | % | 0.94 | % | 0.93 | % (j) | |||||||||||||
| Ratio of gross expenses to average net assets (i) | 1.07 | % | 1.09 | % | 0.97 | % | 0.95 | % | 0.93 | % (j) | |||||||||||||
| Ratio of net investment income to average net assets (c,i) | 1.63 | % | 1.30 | % | 2.36 | % | 2.23 | % | 3.34 | % (j) | |||||||||||||
Portfolio turnover rate | 117 | % (k) | 161 | % | 86 | % | 67 | % | 4 | % (l) | |||||||||||||
(a) Global Atlantic BlackRock Disciplined International Core Portfolio inception date is November 1, 2017. The Fund commenced operations on November 6, 2017.
(b) Net investment income has been calculated using the average shares method, which more appropriately presents the per share data for the period.
(c) Recognition of net investment income by the Portfolio is affected by the timing of the declaration of dividends by the underlying investment companies in which the Portfolio invests.
(d) Realized and unrealized gain (loss) per share are balancing amounts necessary to reconcile the change in net asset value per share for the period, and may not reconcile with aggregate gains and losses in the statement of operations due to timing of share transactions.
(e) Less than $0.005 per share.
(f) Total returns are historical and assume changes in share price and reinvestment of dividends and capital gains distributions. Total return does not reflect the deduction of taxes that a shareholder may pay on Portfolio distributions or on the redemption of Portfolio shares, as well as other charges and expenses of the insurance contract or separate account. Total returns would have been lower absent fee waivers by the Adviser.
(g) For the year ended December 31, 2018, 0.10% of the Portfolio's total return consisted of a reimbursement from an affiliate. Excluding this item, the total return would have been (15.05)%.
(h) For the period ended December 31, 2017, the Portfolio received a reimbursement from an affiliate. This reimbursement had no impact on the Portfolio's total return.
(i) Does not include the expenses of the investment companies in which the Portfolio invests.
(j) Annualized.
(k) During the year ended December 31, 2021, the Portfolio engaged in security transactions associated with the transition of assets from Global Atlantic Goldman Sachs Global Equity Insights Portfolio, which merged into the Portfolio on August 20, 2021. Certain security transactions were excluded from the portfolio turnover rate calculation. If these transactions were included, portfolio turnover would have been higher.
(l) Not annualized.
See accompanying notes to financial statements.
95
Global Atlantic Portfolios
Financial Highlights
Global Atlantic BlackRock Disciplined Mid Cap Growth Portfolio
Selected data for a Class I share outstanding throughout each period indicated
| For the Year Ended December 31, 2021 | For the Year Ended December 31, 2020 | For the Year Ended December 31, 2019 | For the Year Ended December 31, 2018 | For the Period Ended December 31, 2017 (a) | |||||||||||||||||||
| Net asset value, beginning of period | $ | 16.49 | $ | 13.06 | $ | 9.91 | $ | 10.35 | $ | 10.00 | |||||||||||||
| Income from investment operations: | |||||||||||||||||||||||
| Net investment income (loss) (b) | (0.02 | ) | 0.01 | 0.05 | 0.11 | 0.01 | |||||||||||||||||
| Net realized and unrealized gain (loss) (c) | 2.41 | 4.58 | 3.18 | (0.43 | ) | 0.34 | |||||||||||||||||
| Total income (loss) from investment operations | 2.39 | 4.59 | 3.23 | (0.32 | ) | 0.35 | |||||||||||||||||
Less distributions from: | |||||||||||||||||||||||
Net investment income | (0.00 | ) (d) | (0.04 | ) | (0.03 | ) | (0.09 | ) | - | ||||||||||||||
Net realized gains | (1.20 | ) | (1.12 | ) | (0.05 | ) | (0.03 | ) | - | ||||||||||||||
| Total distributions from net investment income and net realized gains | (1.20 | ) | (1.16 | ) | (0.08 | ) | (0.12 | ) | - | ||||||||||||||
| Net asset value, end of period | $ | 17.68 | $ | 16.49 | $ | 13.06 | $ | 9.91 | $ | 10.35 | |||||||||||||
Total return (e) | 14.29 | % | 36.52 | % | 32.68 | % | (3.07 | )% (f) | 3.50 | % (f) | |||||||||||||
| Ratios and Supplemental Data: | |||||||||||||||||||||||
| Net assets, end of period (in 000's) | $ | 212,083 | $ | 162,580 | $ | 141,289 | $ | 126,149 | $ | 93,457 | |||||||||||||
| Ratio of net expenses to average net assets | 0.64 | % | 0.63 | % | 0.63 | % | 0.63 | % | 0.63 | % (g) | |||||||||||||
| Ratio of gross expenses to average net assets (h) | 0.65 | % | 0.67 | % | 0.66 | % | 0.65 | % | 0.64 | % (g) | |||||||||||||
| Ratio of net investment income (loss) to average net assets | (0.11 | )% | 0.09 | % | 0.44 | % | 0.99 | % | 0.79 | % (g) | |||||||||||||
Portfolio turnover rate | 179 | % (i) | 139 | % | 148 | % | 168 | % | 26 | % (j) | |||||||||||||
(a) Global Atlantic BlackRock Disciplined Mid Cap Growth Portfolio inception date is November 1, 2017. The Fund commenced operations on November 6, 2017.
(b) Net investment income has been calculated using the average shares method, which more appropriately presents the per share data for the period.
(c) Realized and unrealized gain (loss) per share are balancing amounts necessary to reconcile the change in net asset value per share for the period, and may not reconcile with aggregate gains and losses in the statement of operations due to timing of share transactions.
(d) Less than $0.005 per share.
(e) Total returns are historical and assume changes in share price and reinvestment of dividends and capital gains distributions. Total return does not reflect the deduction of taxes that a shareholder may pay on Portfolio distributions or on the redemption of Portfolio shares, as well as other charges and expenses of the insurance contract or separate account. Total returns would have been lower absent fee waivers by the Adviser.
(f) For the period ended December 31, 2017 and the year ended December 31, 2018, the Portfolio received reimbursements from a related party. The reimbursements had no impact on the Portfolio's total return.
(g) Annualized.
(h) Represents the ratio of expenses to average net assets absent fee waivers and/or expense reimbursements by the Adviser.
(i) During the year ended December 31, 2021, the Portfolio engaged in security transactions associated with the transition of assets from Global Atlantic BlackRock Disciplined Small Cap Portfolio and Global Atlantic Goldman Sachs Mid Cap Value Insights Portfolio, which merged into the Portfolio on August 20, 2021. Certain security transactions were excluded from the portfolio turnover rate calculation. If these transactions were included, portfolio turnover would have been higher.
(j) Not annualized.
See accompanying notes to financial statements.
96
Global Atlantic Portfolios
Financial Highlights
Global Atlantic BlackRock Disciplined Mid Cap Growth Portfolio
Selected data for a Class II share outstanding throughout each period indicated
| For the Year Ended December 31, 2021 | For the Year Ended December 31, 2020 | For the Year Ended December 31, 2019 | For the Year Ended December 31, 2018 | For the Period Ended December 31, 2017 (a) | |||||||||||||||||||
| Net asset value, beginning of period | $ | 16.48 | $ | 13.06 | $ | 9.90 | $ | 10.35 | $ | 10.00 | |||||||||||||
| Income from investment operations: | |||||||||||||||||||||||
| Net investment income (loss) (b) | (0.06 | ) | (0.02 | ) | 0.02 | 0.08 | 0.01 | ||||||||||||||||
| Net realized and unrealized gain (loss) (c) | 2.40 | 4.56 | 3.19 | (0.43 | ) | 0.34 | |||||||||||||||||
| Total income (loss) from investment operations | 2.34 | 4.54 | 3.21 | (0.35 | ) | 0.35 | |||||||||||||||||
Less distributions from: | |||||||||||||||||||||||
Net investment income | - | (0.00 | ) (d) | (0.00 | ) (d) | (0.07 | ) | - | |||||||||||||||
Net realized gains | (1.20 | ) | (1.12 | ) | (0.05 | ) | (0.03 | ) | - | ||||||||||||||
| Total distributions from net investment income and net realized gains | (1.20 | ) | (1.12 | ) | (0.05 | ) | (0.10 | ) | - | ||||||||||||||
| Net asset value, end of period | $ | 17.62 | $ | 16.48 | $ | 13.06 | $ | 9.90 | $ | 10.35 | |||||||||||||
Total return (e) | 13.96 | % | 36.13 | % | 32.48 | % | (3.35 | )% (f) | 3.50 | % (f) | |||||||||||||
| Ratios and Supplemental Data: | |||||||||||||||||||||||
| Net assets, end of period (in 000's) | $ | 148,539 | $ | 59,930 | $ | 50,446 | $ | 43,290 | $ | 17,801 | |||||||||||||
| Ratio of net expenses to average net assets | 0.89 | % | 0.88 | % | 0.88 | % | 0.88 | % | 0.88 | % (g) | |||||||||||||
| Ratio of gross expenses to average net assets (h) | 0.90 | % | 0.92 | % | 0.91 | % | 0.90 | % | 0.89 | % (g) | |||||||||||||
| Ratio of net investment income (loss) to average net assets | (0.35 | )% | (0.12 | )% | 0.19 | % | 0.77 | % | 0.41 | % (g) | |||||||||||||
Portfolio turnover rate | 179 | % (i) | 139 | % | 148 | % | 168 | % | 26 | % (j) | |||||||||||||
(a) Global Atlantic BlackRock Disciplined Mid Cap Growth Portfolio inception date is November 1, 2017. The Fund commenced operations on November 6, 2017.
(b) Net investment income has been calculated using the average shares method, which more appropriately presents the per share data for the period.
(c) Realized and unrealized gain (loss) per share are balancing amounts necessary to reconcile the change in net asset value per share for the period, and may not reconcile with aggregate gains and losses in the statement of operations due to timing of share transactions.
(d) Less than $0.005 per share.
(e) Total returns are historical and assume changes in share price and reinvestment of dividends and capital gains distributions. Total return does not reflect the deduction of taxes that a shareholder may pay on Portfolio distributions or on the redemption of Portfolio shares, as well as other charges and expenses of the insurance contract or separate account. Total returns would have been lower absent fee waivers by the Adviser.
(f) For the period ended December 31, 2017 and the year ended December 31, 2018, the Portfolio received reimbursements from a related party. The reimbursements had no impact on the Portfolio's total return.
(g) Annualized.
(h) Represents the ratio of expenses to average net assets absent fee waivers and/or expense reimbursements by the Adviser.
(i) During the year ended December 31, 2021, the Portfolio engaged in security transactions associated with the transition of assets from Global Atlantic BlackRock Disciplined Small Cap Portfolio and Global Atlantic Goldman Sachs Mid Cap Value Insights Portfolio, which merged into the Portfolio on August 20, 2021. Certain security transactions were excluded from the portfolio turnover rate calculation. If these transactions were included, portfolio turnover would have been higher.
(j) Not annualized.
See accompanying notes to financial statements.
97
Global Atlantic Portfolios
Financial Highlights
Global Atlantic BlackRock Disciplined Value Portfolio
Selected data for a Class I share outstanding throughout each period indicated
| For the Year Ended December 31, 2021 | For the Year Ended December 31, 2020 | For the Year Ended December 31, 2019 | For the Year Ended December 31, 2018 | For the Period Ended December 31, 2017 (a) | |||||||||||||||||||
| Net asset value, beginning of period | $ | 11.19 | $ | 11.51 | $ | 9.39 | $ | 10.44 | $ | 10.00 | |||||||||||||
| Income from investment operations: | |||||||||||||||||||||||
| Net investment income (b) | 0.16 | 0.19 | 0.23 | 0.20 | 0.03 | ||||||||||||||||||
| Net realized and unrealized gain (loss) (c) | 2.81 | 0.17 | 2.13 | (1.02 | ) | 0.41 | |||||||||||||||||
| Total income (loss) from investment operations | 2.97 | 0.36 | 2.36 | (0.82 | ) | 0.44 | |||||||||||||||||
Less distributions from: | |||||||||||||||||||||||
Net investment income | (0.18 | ) | (0.24 | ) | (0.24 | ) | (0.16 | ) | - | ||||||||||||||
Net realized gains | - | (0.44 | ) | - | (0.07 | ) | - | ||||||||||||||||
| Total distributions from net investment income and net realized gains | (0.18 | ) | (0.68 | ) | (0.24 | ) | (0.23 | ) | - | ||||||||||||||
| Net asset value, end of period | $ | 13.98 | $ | 11.19 | $ | 11.51 | $ | 9.39 | $ | 10.44 | |||||||||||||
Total return (d) | 26.58 | % | 4.14 | % | 25.28 | % | (7.97 | )% (e) | 4.40 | % (e) | |||||||||||||
| Ratios and Supplemental Data: | |||||||||||||||||||||||
| Net assets, end of period (in 000's) | $ | 271,801 | $ | 244,853 | $ | 266,399 | $ | 248,141 | $ | 309,640 | |||||||||||||
| Ratio of net expenses to average net assets | 0.55 | % | 0.54 | % | 0.54 | % | 0.54 | % | 0.54 | % (f) | |||||||||||||
| Ratio of gross expenses to average net assets (g) | 0.55 | % | 0.57 | % | 0.56 | % | 0.55 | % | 0.54 | % (f) | |||||||||||||
| Ratio of net investment income to average net assets | 1.27 | % | 1.87 | % | 2.11 | % | 1.93 | % | 1.99 | % (f) | |||||||||||||
Portfolio turnover rate | 120 | % | 125 | % | 132 | % | 140 | % | 17 | % (h) | |||||||||||||
(a) Global Atlantic BlackRock Disciplined Value Portfolio inception date is November 1, 2017. The Fund commenced operations on November 6, 2017.
(b) Net investment income has been calculated using the average shares method, which more appropriately presents the per share data for the period.
(c) Realized and unrealized gain (loss) per share are balancing amounts necessary to reconcile the change in net asset value per share for the period, and may not reconcile with aggregate gains and losses in the statement of operations due to timing of share transactions.
(d) Total returns are historical and assume changes in share price and reinvestment of dividends and capital gains distributions. Total return does not reflect the deduction of taxes that a shareholder may pay on Portfolio distributions or on the redemption of Portfolio shares, as well as other charges and expenses of the insurance contract or separate account. Total returns would have been lower absent fee waivers by the Adviser.
(e) For the period ended December 31, 2017 and the year ended December 31, 2018, the Portfolio received reimbursements from a related party. The reimbursements had no impact on the Portfolio's total return.
(f) Annualized.
(g) Represents the ratio of expenses to average net assets absent fee waivers and/or expense reimbursements by the Adviser.
(h) Not annualized.
See accompanying notes to financial statements.
98
Global Atlantic Portfolios
Financial Highlights
Global Atlantic BlackRock Disciplined Value Portfolio
Selected data for a Class II share outstanding throughout each period indicated
| For the Year Ended December 31, 2021 | For the Year Ended December 31, 2020 | For the Year Ended December 31, 2019 | For the Year Ended December 31, 2018 | For the Period Ended December 31, 2017 (a) | |||||||||||||||||||
| Net asset value, beginning of period | $ | 11.21 | $ | 11.52 | $ | 9.40 | $ | 10.45 | $ | 10.00 | |||||||||||||
| Income from investment operations: | |||||||||||||||||||||||
| Net investment income (b) | 0.13 | 0.17 | 0.20 | 0.18 | 0.02 | ||||||||||||||||||
| Net realized and unrealized gain (loss) (c) | 2.81 | 0.18 | 2.13 | (1.02 | ) | 0.43 | |||||||||||||||||
| Total income (loss) from investment operations | 2.94 | 0.35 | 2.33 | (0.84 | ) | 0.45 | |||||||||||||||||
Less distributions from: | |||||||||||||||||||||||
Net investment income | (0.15 | ) | (0.22 | ) | (0.21 | ) | (0.14 | ) | - | ||||||||||||||
Net realized gains | - | (0.44 | ) | - | (0.07 | ) | - | ||||||||||||||||
| Total distributions from net investment income and net realized gains | (0.15 | ) | (0.66 | ) | (0.21 | ) | (0.21 | ) | - | ||||||||||||||
| Net asset value, end of period | $ | 14.00 | $ | 11.21 | $ | 11.52 | $ | 9.40 | $ | 10.45 | |||||||||||||
Total return (d) | 26.23 | % | 3.94 | % | 24.92 | % | (8.16 | )% (e) | 4.50 | % (e) | |||||||||||||
| Ratios and Supplemental Data: | |||||||||||||||||||||||
| Net assets, end of period (in 000's) | $ | 7,978 | $ | 7,106 | $ | 7,370 | $ | 7,160 | $ | 9,545 | |||||||||||||
| Ratio of net expenses to average net assets | 0.80 | % | 0.79 | % | 0.79 | % | 0.79 | % | 0.78 | % (f) | |||||||||||||
| Ratio of gross expenses to average net assets (g) | 0.80 | % | 0.82 | % | 0.81 | % | 0.80 | % | 0.78 | % (f) | |||||||||||||
| Ratio of net investment income to average net assets | 1.02 | % | 1.62 | % | 1.86 | % | 1.68 | % | 1.34 | % (f) | |||||||||||||
Portfolio turnover rate | 120 | % | 125 | % | 132 | % | 140 | % | 17 | % (h) | |||||||||||||
(a) Global Atlantic BlackRock Disciplined Value Portfolio inception date is November 1, 2017. The Fund commenced operations on November 6, 2017.
(b) Net investment income has been calculated using the average shares method, which more appropriately presents the per share data for the period.
(c) Realized and unrealized gain (loss) per share are balancing amounts necessary to reconcile the change in net asset value per share for the period, and may not reconcile with aggregate gains and losses in the statement of operations due to timing of share transactions.
(d) Total returns are historical and assume changes in share price and reinvestment of dividends and capital gains distributions. Total return does not reflect the deduction of taxes that a shareholder may pay on Portfolio distributions or on the redemption of Portfolio shares, as well as other charges and expenses of the insurance contract or separate account. Total returns would have been lower absent fee waivers by the Adviser.
(e) For the period ended December 31, 2017 and the year ended December 31, 2018, the Portfolio received reimbursements from a related party. The reimbursements had no impact on the Portfolio's total return.
(f) Annualized.
(g) Represents the ratio of expenses to average net assets absent fee waivers and/or expense reimbursements by the Adviser.
(h) Not annualized.
See accompanying notes to financial statements.
99
Global Atlantic Portfolios
Financial Highlights
Global Atlantic BlackRock High Yield Portfolio
Selected data for a Class I share outstanding throughout each period indicated
| For the Year Ended December 31, 2021 | For the Year Ended December 31, 2020 | For the Year Ended December 31, 2019 | For the Year Ended December 31, 2018 | For the Period Ended December 31, 2017 (a) | |||||||||||||||||||
| Net asset value, beginning of period | $ | 10.17 | $ | 10.21 | $ | 9.43 | $ | 9.92 | $ | 10.00 | |||||||||||||
| Income from investment operations: | |||||||||||||||||||||||
| Net investment income (b) | 0.46 | 0.49 | 0.52 | 0.52 | 0.07 | ||||||||||||||||||
| Net realized and unrealized gain (loss) (c) | (0.06 | ) | 0.07 | 0.89 | (0.95 | ) | (0.15 | ) | |||||||||||||||
| Total income (loss) from investment operations | 0.40 | 0.56 | 1.41 | (0.43 | ) | (0.08 | ) | ||||||||||||||||
Less distributions from: | |||||||||||||||||||||||
Net investment income | (0.51 | ) | (0.60 | ) | (0.63 | ) | (0.06 | ) | - | ||||||||||||||
| Total distributions from net investment income and net realized gains | (0.51 | ) | (0.60 | ) | (0.63 | ) | (0.06 | ) | - | ||||||||||||||
| Net asset value, end of period | $ | 10.06 | $ | 10.17 | $ | 10.21 | $ | 9.43 | $ | 9.92 | |||||||||||||
Total return (d) | 4.00 | % | 5.79 | % | 15.06 | % | (4.32 | )% | (0.80 | )% (e) | |||||||||||||
| Ratios and Supplemental Data: | |||||||||||||||||||||||
| Net assets, end of period (in 000's) | $ | 64,219 | $ | 66,191 | $ | 70,727 | $ | 69,255 | $ | 83,070 | |||||||||||||
| Ratio of net expenses to average net assets | 0.60 | % | 0.59 | % | 0.59 | % | 0.59 | % | 0.59 | % (f) | |||||||||||||
| Ratio of gross expenses to average net assets (g) | 0.61 | % | 0.62 | % | 0.62 | % | 0.60 | % | 0.59 | % (f) | |||||||||||||
| Ratio of net investment income to average net assets | 4.51 | % | 4.93 | % | 5.11 | % | 5.24 | % | 4.54 | % (f) | |||||||||||||
Portfolio turnover rate | 62 | % | 52 | % | 45 | % | 36 | % | 3 | % (h) | |||||||||||||
(a) Global Atlantic BlackRock High Yield Portfolio inception date is November 1, 2017. The Fund commenced operations on November 6, 2017.
(b) Net investment income has been calculated using the average shares method, which more appropriately presents the per share data for the period.
(c) Realized and unrealized gain (loss) per share are balancing amounts necessary to reconcile the change in net asset value per share for the period, and may not reconcile with aggregate gains and losses in the statement of operations due to timing of share transactions.
(d) Total returns are historical and assume changes in share price and reinvestment of dividends and capital gains distributions. Total return does not reflect the deduction of taxes that a shareholder may pay on Portfolio distributions or on the redemption of Portfolio shares, as well as other charges and expenses of the insurance contract or separate account. Total returns would have been lower absent fee waivers by the Adviser.
(e) For the period ended December 31, 2017, the Portfolio received reimbursements from a related party. The reimbursements had no impact on the Portfolio's total return.
(f) Annualized.
(g) Represents the ratio of expenses to average net assets absent fee waivers and/or expense reimbursements by the Adviser.
(h) Not annualized.
See accompanying notes to financial statements.
100
Global Atlantic Portfolios
Financial Highlights
Global Atlantic BlackRock High Yield Portfolio
Selected data for a Class II share outstanding throughout each period indicated
| For the Year Ended December 31, 2021 | For the Year Ended December 31, 2020 | For the Year Ended December 31, 2019 | For the Year Ended December 31, 2018 | For the Period Ended December 31, 2017 (a) | |||||||||||||||||||
| Net asset value, beginning of period | $ | 10.16 | $ | 10.19 | $ | 9.41 | $ | 9.92 | $ | 10.00 | |||||||||||||
| Income from investment operations: | |||||||||||||||||||||||
| Net investment income (b) | 0.44 | 0.46 | 0.50 | 0.49 | 0.07 | ||||||||||||||||||
| Net realized and unrealized gain (loss) (c) | (0.06 | ) | 0.08 | 0.87 | (0.94 | ) | (0.15 | ) | |||||||||||||||
| Total income (loss) from investment operations | 0.38 | 0.54 | 1.37 | (0.45 | ) | (0.08 | ) | ||||||||||||||||
Less distributions from: | |||||||||||||||||||||||
Net investment income | (0.48 | ) | (0.57 | ) | (0.59 | ) | (0.06 | ) | - | ||||||||||||||
| Total distributions from net investment income and net realized gains | (0.48 | ) | (0.57 | ) | (0.59 | ) | (0.06 | ) | - | ||||||||||||||
| Net asset value, end of period | $ | 10.06 | $ | 10.16 | $ | 10.19 | $ | 9.41 | $ | 9.92 | |||||||||||||
Total return (d) | 3.74 | % | 5.57 | % | 14.70 | % | (4.56 | )% | (0.80 | )% (e) | |||||||||||||
| Ratios and Supplemental Data: | |||||||||||||||||||||||
| Net assets, end of period (in 000's) | $ | 793 | $ | 799 | $ | 900 | $ | 1,071 | $ | 1,405 | |||||||||||||
| Ratio of net expenses to average net assets | 0.85 | % | 0.84 | % | 0.84 | % | 0.84 | % | 0.83 | % (f) | |||||||||||||
| Ratio of gross expenses to average net assets (g) | 0.86 | % | 0.87 | % | 0.87 | % | 0.85 | % | 0.83 | % (f) | |||||||||||||
| Ratio of net investment income to average net assets | 4.26 | % | 4.68 | % | 4.86 | % | 4.99 | % | 4.31 | % (f) | |||||||||||||
Portfolio turnover rate | 62 | % | 52 | % | 45 | % | 36 | % | 3 | % (h) | |||||||||||||
(a) Global Atlantic BlackRock High Yield Portfolio inception date is November 1, 2017. The Fund commenced operations on November 6, 2017.
(b) Net investment income has been calculated using the average shares method, which more appropriately presents the per share data for the period.
(c) Realized and unrealized gain (loss) per share are balancing amounts necessary to reconcile the change in net asset value per share for the period, and may not reconcile with aggregate gains and losses in the statement of operations due to timing of share transactions.
(d) Total returns are historical and assume changes in share price and reinvestment of dividends and capital gains distributions. Total return does not reflect the deduction of taxes that a shareholder may pay on Portfolio distributions or on the redemption of Portfolio shares, as well as other charges and expenses of the insurance contract or separate account. Total returns would have been lower absent fee waivers by the Adviser.
(e) For the period ended December 31, 2017, the Portfolio received reimbursements from a related party. The reimbursements had no impact on the Portfolio's total return.
(f) Annualized.
(g) Represents the ratio of expenses to average net assets absent fee waivers and/or expense reimbursements by the Adviser.
(h) Not annualized.
See accompanying notes to financial statements.
101
Global Atlantic Portfolios
Financial Highlights
Global Atlantic Goldman Sachs Core Fixed Income Portfolio
Selected data for a Class I share outstanding throughout each period indicated
| For the Year Ended December 31, 2021 | For the Year Ended December 31, 2020 | For the Year Ended December 31, 2019 | For the Year Ended December 31, 2018 | For the Period Ended December 31, 2017 (a) | |||||||||||||||||||
| Net asset value, beginning of period | $ | 11.07 | $ | 10.60 | $ | 9.92 | $ | 9.98 | $ | 10.00 | |||||||||||||
| Income from investment operations: | |||||||||||||||||||||||
| Net investment income (b,c) | 0.20 | 0.24 | 0.27 | 0.25 | 0.03 | ||||||||||||||||||
| Net realized and unrealized gain (loss) (d) | (0.42 | ) | 0.76 | 0.67 | (0.31 | ) | (0.05 | ) | |||||||||||||||
| Total income (loss) from investment operations | (0.22 | ) | 1.00 | 0.94 | (0.06 | ) | (0.02 | ) | |||||||||||||||
Less distributions from: | |||||||||||||||||||||||
Net investment income | (0.28 | ) | (0.27 | ) | (0.26 | ) | 0.00 | (e) | - | ||||||||||||||
Net realized gains | (0.50 | ) | (0.26 | ) | - | - | - | ||||||||||||||||
| Total distributions from net investment income and net realized gains | (0.78 | ) | (0.53 | ) | (0.26 | ) | 0.00 | (e) | - | ||||||||||||||
| Net asset value, end of period | $ | 10.07 | $ | 11.07 | $ | 10.60 | $ | 9.92 | $ | 9.98 | |||||||||||||
Total return (f) | (1.98 | )% | 9.49 | % | 9.49 | % | (0.55 | )% (g) | (0.20 | )% (g) | |||||||||||||
| Ratios and Supplemental Data: | |||||||||||||||||||||||
| Net assets, end of period (in 000's) | $ | 80,361 | $ | 91,542 | $ | 90,506 | $ | 92,760 | $ | 35,260 | |||||||||||||
| Ratio of net expenses to average net assets (h) | 0.43 | % | 0.43 | % | 0.43 | % | 0.43 | % | 0.43 | % (i) | |||||||||||||
| Ratio of gross expenses to average net assets (h,j) | 0.45 | % | 0.47 | % | 0.46 | % | 0.44 | % | 0.44 | % (i) | |||||||||||||
| Ratio of net investment income to average net assets (c,h) | 1.83 | % | 2.18 | % | 2.61 | % | 2.51 | % | 1.64 | % (i) | |||||||||||||
Portfolio turnover rate | 474 | % (k) | 151 | % (k) | 150 | % (k) | 248 | % (k) | 69 | % (l) | |||||||||||||
(a) Global Atlantic Goldman Sachs Core Fixed Income Portfolio inception date is November 1, 2017. The Fund commenced operations on November 6, 2017.
(b) Net investment income has been calculated using the average shares method, which more appropriately presents the per share data for the period.
(c) Recognition of net investment income by the Portfolio is affected by the timing of the declaration of dividends by the underlying investment companies in which the Portfolio invests.
(d) Realized and unrealized gain (loss) per share are balancing amounts necessary to reconcile the change in net asset value per share for the period, and may not reconcile with aggregate gains and losses in the statement of operations due to timing of share transactions.
(e) Less than $0.005 per share.
(f) Total returns are historical and assume changes in share price and reinvestment of dividends and capital gains distributions. Total return does not reflect the deduction of taxes that a shareholder may pay on Portfolio distributions or on the redemption of Portfolio shares, as well as other charges and expenses of the insurance contract or separate account. Total returns would have been lower absent fee waivers by the Adviser.
(g) For the period ended December 31, 2017 and the year ended December 31, 2018, the Portfolio received reimbursements from a related party. The reimbursements had no impact on the Portfolio's total return.
(h) Does not include the expenses of the investment companies in which the Portfolio invests.
(i) Annualized.
(j) Represents the ratio of expenses to average net assets absent fee waivers and/or expense reimbursements by the Adviser.
(k) The portfolio turnover rate excludes mortgage dollar roll transactions for the years ended December 31, 2021, December 31, 2020, December 31, 2019 and December 31, 2018. If these were included in the calculation, the portfolio turnover would be 548%, 701%, 689% and 486%, respectively. See Note 3 in the accompanying notes to financial statements.
(l) Not annualized.
See accompanying notes to financial statements.
102
Global Atlantic Portfolios
Notes to Financial Statements
December 31, 2021
1. ORGANIZATION
As of December 31, 2021, the Global Atlantic Portfolios were comprised of sixteen different actively managed portfolios, eight of which are discussed in this report (each, a "Portfolio" and collectively, the "Portfolios"). Each Portfolio is a series of shares of beneficial interest of Forethought Variable Insurance Trust (the "Trust"), a statutory trust organized under the laws of the State of Delaware, and registered under the Investment Company Act of 1940, as amended (the "1940 Act"), as an open-end management investment company.
Commencement Date* | Investment Objective | ||||||||||
Global Atlantic BlackRock Allocation Portfolio | November 6, 2017 | Total return. | |||||||||
Global Atlantic BlackRock Disciplined Core Portfolio | November 6, 2017 | Long-term capital appreciation. | |||||||||
Global Atlantic BlackRock Disciplined Growth Portfolio | November 6, 2017 | Long-term capital appreciation. | |||||||||
Global Atlantic BlackRock Disciplined International Core Portfolio | November 6, 2017 | Long-term capital appreciation. | |||||||||
Global Atlantic BlackRock Disciplined Mid Cap Growth Portfolio | November 6, 2017 | Long-term capital appreciation. | |||||||||
Global Atlantic BlackRock Disciplined Value Portfolio | November 6, 2017 | Long-term capital appreciation. | |||||||||
Global Atlantic BlackRock High Yield Portfolio | November 6, 2017 | Total return. | |||||||||
Global Atlantic Goldman Sachs Core Fixed Income Portfolio | November 6, 2017 | Total return consisting of capital appreciation and income. | |||||||||
* The Portfolios' inception date is November 1, 2017. The Portfolios commenced operations on November 6, 2017.
Each Portfolio is diversified. Certain of the Portfolios operate as "fund of funds." A "fund of funds" typically invests in multiple underlying funds and the level of its interest in any particular underlying fund may fluctuate. The Portfolios are intended to be funding vehicles for variable annuity and variable life insurance contracts offered by separate accounts of insurance companies. The assets of each Portfolio are segregated and a shareholder's interest is limited to the Portfolio in which shares are held. Each Portfolio pays its own expenses.
As of December 31, 2021, the Portfolios offered Class I and Class II shares at net asset value, except the Global Atlantic Goldman Sachs Core Fixed Income Portfolio (which only offered Class I shares). All classes of shares have equal voting privileges except that each class has exclusive voting rights with respect to its service and/or distribution plans. Each Portfolio's income, expenses (other than class specific distribution fees) and realized and unrealized gains and losses are allocated proportionately each day based upon the relative net assets of each class.
References herein to a Portfolio's investment in a particular instrument include direct investments and indirect investments through investment companies such as open-end funds (mutual funds), exchange-traded funds and closed-end funds, as applicable.
2. SIGNIFICANT ACCOUNTING POLICIES
The following is a summary of significant accounting policies followed by the Portfolios in preparation of their financial statements. The policies are in conformity with U.S. generally accepted accounting principles ("US GAAP"). The preparation of the financial statements requires management to make estimates and assumptions that affect the reported amounts of assets and liabilities and disclosure of contingent assets and liabilities at the date of the financial statements and the reported amounts of income and expenses for the period. Actual results could differ from those estimates. Each Portfolio is an investment company and accordingly follows the investment company accounting and reporting guidance of the Financial Accounting Standards Board ("FASB") Accounting Standard Codification Topic 946 "Financial Services – Investment Companies".
103
Global Atlantic Portfolios
Notes to Financial Statements (Continued)
December 31, 2021
Securities Valuation – Securities listed on an exchange are valued at the last reported sale price at the close of the regular trading session of the primary exchange on the business day the value is being determined, or in the case of securities listed on NASDAQ at the NASDAQ Official Closing Price. In the absence of a sale such securities shall be valued at the mean between the current bid and ask prices on the day of valuation. Futures and future options are valued at the final settle price or, in the absence of a settle price, at the last sale price on the day of valuation. Debt securities are valued on the basis of valuations provided by dealers or by an independent pricing service which take into account appropriate factors such as trading activity, readily available market quotations (including broker quotes), yield, quality, coupon rate, maturity, type of issue, trading characteristic, call features, credit ratings and other data. Short-term debt obligations having 60 days or less remaining until maturity, at time of purchase, may be valued at amortized cost to the extent it is determined that amortized cost approximates fair value.
Valuation of Investment Companies – The Portfolios may invest in one or more portfolios of open-end investment companies (the "Underlying Fund" or "Underlying Funds"). Each Underlying Fund is valued at its respective net asset value as reported by such investment company (except exchange-traded funds ("ETFs")). ETFs are valued daily at the last sale price or official closing price on the principal exchange or system on which the investment is traded. Each Underlying Fund values securities in its portfolio for which market quotations are readily available at their market values (generally the last reported sale price) and all other securities and assets at their fair value based on the methods established by each Underlying Fund's board(s) of trustees.
Illiquid Investments – Pursuant to Rule 22e-4 under the 1940 Act, a Portfolio may not acquire any "illiquid investment" if, immediately after the acquisition, the Portfolio would have invested more than 15% of its net assets in illiquid investments that are assets. An "illiquid investment" is any investment that a Portfolio reasonably expects cannot be sold or disposed of in current market conditions in seven calendar days or less without the sale or disposition significantly changing the market value of the investment. The Trust has implemented a liquidity risk management program and related procedures to identify illiquid investments pursuant to Rule 22e-4, and the Board of Trustees ("Board") has approved the designation of the Adviser to administer the Trust's liquidity risk management program and related procedures. Illiquid investments include securities subject to contractual or legal restrictions on resale (e.g., because they have not been registered under the Securities Act of 1933) and securities that are otherwise not readily marketable (e.g., because trading in the security is suspended or because market makers do not exist or will not entertain bids or offers).
These investments will be valued at their fair market value as determined using the valuation procedures approved by the Board. The Board has delegated execution of these procedures to a Fair Value Committee composed of one or more of the following: (i) Chief Compliance Officer of the Trust, (ii) Principal Financial Officer, and (iii) representative of the Global Atlantic Investment Advisors, LLC (the "Adviser") and/or Sub-Adviser. The Fair Value Committee at its discretion may also include a representative from The Bank of New York Mellon (the "Administrator") and third party consultants or advisers (such as an accounting firm or fair value pricing specialist) on an as-needed basis to assist in determining a security-specific fair value or valuation method. The Board reviews and approves the execution of this process and the resultant fair value prices at least quarterly to assure the process produces reliable results.
Fair Value Committee and Valuation Process – The Fair Value Committee is composed of one or more of the following: (i) Chief Compliance Officer of the Trust, (ii) Principal Financial Officer, and (iii) representative of the Adviser and/or Sub-Adviser. The Fair Value Committee at its discretion may also include a representative from the Administrator and third party consultants or advisers (such as an accounting firm or fair value pricing specialist) on an as-needed basis to assist in determining a security-specific fair value or valuation method. The applicable investments are valued collectively via inputs from each of these groups. For example, fair value determinations are required for the following securities: (i) securities for which market quotations are not readily available on a particular business day (including without limitation securities for which there is a short and temporary lapse in the provision of a price by the regular pricing source); (ii) securities for which, in the opinion of the Adviser or relevant Sub-Adviser, the prices or values available do not represent the fair value of the instrument (factors which may cause the Adviser or Sub-Adviser to make such a judgment include, but are not limited to, the following: the availability of only a bid price or an ask price; the spread between bid and ask prices; the frequency of sales; the thinness of the market; the size of reported trades; and actions of the securities markets or regulators, such as the suspension or limitation of trading); (iii) securities determined to be illiquid; (iv) securities with respect to which an event that will affect the value thereof has occurred (a "significant event") subsequent to the determination of the closing price
104
Global Atlantic Portfolios
Notes to Financial Statements (Continued)
December 31, 2021
reported on the principal exchange on which the securities are traded, but prior to the relevant Portfolio's calculation of its net asset value ("NAV"); and (v) mutual funds that do not provide timely NAV information. Specifically, interests in commodity pools or managed futures pools are valued on a daily basis by reference to the closing market prices of each futures contract or other asset held by a pool, as adjusted for pool expenses. Restricted or illiquid securities, such as private placements or non-traded securities are valued via inputs from the Adviser or Sub-Adviser valuation based upon the current bid for the security from two or more independent dealers or other parties reasonably familiar with the facts and circumstances of the security (who should take into consideration all relevant factors as may be appropriate under the circumstances). If the Adviser or Sub- Adviser is unable to obtain a current bid from such independent dealers or other independent parties, the fair value team shall determine the fair value of restricted or illiquid securities using certain factors, such as, but not limited to: (i) the type of security; (ii) the cost at date of purchase; (iii) the size and nature of the Portfolio's holdings; (iv) the discount from market value of unrestricted securities of the same class at the time of purchase and subsequent thereto; (v) information as to any transactions or offers with respect to the security; (vi) the nature and duration of restrictions on disposition of the security and the existence of any registration rights, as well as any estimation of the cost of registration or otherwise qualifying the security for public sale, including commissions; (vii) how the yield of the security compares to similar securities of companies of similar or equal creditworthiness; (viii) the level of recent trades of similar or comparable securities; (ix) the liquidity characteristics of the security; (x) current market conditions; (xi) the market value of any securities into which the security is convertible or exchangeable; (xii) the security's embedded option values; and (xiii) information about the financial condition of the issuer and its prospects.
Each Portfolio utilizes various methods to measure the fair value of all of its investments on a recurring basis. US GAAP establishes a hierarchy that prioritizes inputs to valuation methods. The three levels of input are:
Level 1 – Unadjusted quoted prices in active markets for identical assets and liabilities that the Portfolio has the ability to access.
Level 2 – Observable inputs other than quoted prices included in Level 1 that are observable for the asset or liability, either directly or indirectly. These inputs may include quoted prices for the identical instrument in an inactive market, prices for similar instruments, interest rates, prepayment speeds, credit risk, yield curves, default rates and similar data.
Level 3 – Unobservable inputs for the asset or liability, to the extent relevant observable inputs are not available, representing the Portfolio's own assumptions about the assumptions a market participant would use in valuing the asset or liability, and would be based on the best information available.
The availability of observable inputs can vary from security to security and is affected by a wide variety of factors, including, for example, the type of security, whether the security is new and not yet established in the marketplace, the liquidity of markets, and other characteristics particular to the security. To the extent that valuation is based on models or inputs that are less observable or unobservable in the market, the determination of fair value requires more judgment. Accordingly, the degree of judgment exercised in determining fair value is greatest for instruments categorized in Level 3.
The inputs used to measure fair value may fall into different levels of the fair value hierarchy. In such cases, for disclosure purposes, the level in the fair value hierarchy within which the fair value measurement falls in its entirety is determined based on the lowest level input that is significant to the fair value measurement in its entirety.
The inputs or methodology used for valuing securities are not necessarily an indication of the risk associated with investing in those securities. The following tables summarize the inputs used as of December 31, 2021 for each Portfolio's investments measured at fair value:
Global Atlantic BlackRock Allocation Portfolio
Assets | Level 1 | Level 2 | Level 3 | Total | |||||||||||||||
Exchange Traded Funds | $ | 77,265,316 | $ | - | $ | - | $ | 77,265,316 | |||||||||||
Short-Term Investments | 744,104 | - | - | 744,104 | |||||||||||||||
Total | $ | 78,009,420 | $ | - | $ | - | $ | 78,009,420 | |||||||||||
105
Global Atlantic Portfolios
Notes to Financial Statements (Continued)
December 31, 2021
Global Atlantic BlackRock Disciplined Core Portfolio
Assets | Level 1 | Level 2 | Level 3 | Total | |||||||||||||||
Common Stocks | $ | 707,010,017 | $ | - | $ | - | $ | 707,010,017 | |||||||||||
Short-Term Investments | 10,339,947 | - | - | 10,339,947 | |||||||||||||||
Futures Contracts* | 127,608 | - | - | 127,608 | |||||||||||||||
Total | $ | 717,477,572 | $ | - | $ | - | $ | 717,477,572 | |||||||||||
Global Atlantic BlackRock Disciplined Growth Portfolio
Assets | Level 1 | Level 2 | Level 3 | Total | |||||||||||||||
Common Stocks | $ | 124,290,039 | $ | - | $ | - | $ | 124,290,039 | |||||||||||
Short-Term Investments | 1,135,976 | - | - | 1,135,976 | |||||||||||||||
Futures Contracts* | 12,424 | - | - | 12,424 | |||||||||||||||
Total | $ | 125,438,439 | $ | - | $ | - | $ | 125,438,439 | |||||||||||
Global Atlantic BlackRock Disciplined International Core Portfolio
Assets | Level 1 | Level 2 | Level 3 | Total | |||||||||||||||
Common Stocks | $ | 155,141,125 | $ | 31,583 | $ | - | $ | 155,172,708 | |||||||||||
Exchange Traded Funds | 13,718,125 | - | - | 13,718,125 | |||||||||||||||
Preferred Stocks | 1,453,594 | - | - | 1,453,594 | |||||||||||||||
Rights | - | 0 | - | 0 | |||||||||||||||
Short-Term Investments | 2,915,273 | - | - | 2,915,273 | |||||||||||||||
Futures Contracts* | 54,759 | - | - | 54,759 | |||||||||||||||
Total | $ | 173,282,876 | $ | 31,583 | $ | - | $ | 173,314,459 | |||||||||||
Global Atlantic BlackRock Disciplined Mid Cap Growth Portfolio
Assets | Level 1 | Level 2 | Level 3 | Total | |||||||||||||||
Common Stocks | $ | 355,383,783 | $ | 0 | $ | - | $ | 355,383,783 | |||||||||||
Rights | - | 1,159 | - | 1,159 | |||||||||||||||
Warrants | 1,208 | - | - | 1,208 | |||||||||||||||
Short-Term Investments | 5,327,075 | - | - | 5,327,075 | |||||||||||||||
Futures Contracts* | 61,506 | - | - | 61,506 | |||||||||||||||
Total | $ | 360,773,572 | $ | 1,159 | $ | - | $ | 360,774,731 | |||||||||||
Global Atlantic BlackRock Disciplined Value Portfolio
Assets | Level 1 | Level 2 | Level 3 | Total | |||||||||||||||
Common Stocks | $ | 275,765,292 | $ | - | $ | - | $ | 275,765,292 | |||||||||||
Short-Term Investments | 4,077,510 | - | - | 4,077,510 | |||||||||||||||
Futures Contracts* | 46,353 | - | - | 46,353 | |||||||||||||||
Total | $ | 279,889,155 | $ | - | $ | - | $ | 279,889,155 | |||||||||||
Global Atlantic BlackRock High Yield Portfolio
Assets | Level 1 | Level 2 | Level 3 | Total | |||||||||||||||
Corporate Bonds & Notes | $ | - | $ | 62,891,265 | $ | - | $ | 62,891,265 | |||||||||||
Short-Term Investments | 1,358,562 | - | - | 1,358,562 | |||||||||||||||
Futures Contracts* | 11,718 | - | - | 11,718 | |||||||||||||||
Total | $ | 1,370,280 | $ | 62,891,265 | $ | - | $ | 64,261,545 | |||||||||||
106
Global Atlantic Portfolios
Notes to Financial Statements (Continued)
December 31, 2021
Global Atlantic BlackRock High Yield Portfolio (Continued)
Liabilities | Level 1 | Level 2 | Level 3 | Total | |||||||||||||||
Futures Contracts* | $ | 391 | $ | - | $ | - | $ | 391 | |||||||||||
Total | $ | 391 | $ | - | $ | - | $ | 391 | |||||||||||
Global Atlantic Goldman Sachs Core Fixed Income Portfolio
Assets | Level 1 | Level 2 | Level 3 | Total | |||||||||||||||
Agency Mortgage Backed Securities | $ | - | $ | 15,751,031 | $ | - | $ | 15,751,031 | |||||||||||
Corporate Bonds & Notes | - | 35,400,328 | - | 35,400,328 | |||||||||||||||
Asset Backed and Commercial Backed Securities | - | 7,089,926 | - | 7,089,926 | |||||||||||||||
Municipal Bonds | - | 1,128,655 | - | 1,128,655 | |||||||||||||||
Sovereign Debts | - | 1,416,048 | - | 1,416,048 | |||||||||||||||
U.S. Treasury Securities and Agency Bonds | - | 12,541,533 | - | 12,541,533 | |||||||||||||||
Short-Term Investments | 7,841,918 | 4,107,477 | - | 11,949,395 | |||||||||||||||
Futures Contracts* | 117,718 | - | - | 117,718 | |||||||||||||||
Swap Contracts* | - | 74,409 | - | 74,409 | |||||||||||||||
Swaptions Written | - | 2,506 | - | 2,506 | |||||||||||||||
Forward Foreign Exchange Contracts* | - | 3,923 | - | 3,923 | |||||||||||||||
Total | $ | 7,959,636 | $ | 77,515,836 | $ | - | $ | 85,475,472 | |||||||||||
Liabilities | Level 1 | Level 2 | Level 3 | Total | |||||||||||||||
Futures Contracts* | $ | 64,721 | $ | - | $ | - | $ | 64,721 | |||||||||||
Swap Contracts* | - | 42,568 | - | 42,568 | |||||||||||||||
Swaptions Purchased | - | 4,134 | - | 4,134 | |||||||||||||||
Forward Foreign Exchange Contracts* | - | 1,035 | - | 1,035 | |||||||||||||||
Total | $ | 64,721 | $ | 47,737 | $ | - | $ | 112,458 | |||||||||||
* Net unrealized appreciation/(depreciation) as presented in the Portfolio of Investments.
The Portfolios did not hold any Level 3 securities during the year.
Security Transactions and Related Income – Security transactions are accounted for on a trade date basis. Interest income is recognized on an accrual basis. Discounts are accreted and premiums are amortized on securities purchased over the lives of the respective securities. Dividend income is recorded on the ex-dividend date. Realized gains or losses from sales of securities are determined by comparing the identified cost of the security lot sold with the net sales proceeds.
Dividends and Distributions to Shareholders – Dividends from net investment income and distributions from net realized capital gains, if any, are declared and paid annually. Dividends and distributions to shareholders are recorded on ex-date and are determined in accordance with Federal income tax regulations, which may differ from US GAAP. These "book/tax" differences are considered either temporary (e.g., deferred losses, capital loss carryforwards) or permanent in nature. To the extent these differences are permanent in nature, such amounts are reclassified within the composition of net assets based on their Federal tax-basis treatment; temporary differences do not require reclassification. These reclassifications have no effect on net assets, results from operations or net asset values per share of the Portfolios.
Cash and Cash Equivalents – Cash and cash equivalents include cash and overnight investments in interest-bearing demand deposits with a financial institution with original maturities of three months or less. The Portfolios maintain deposits with a financial institution which are generally an amount that is in excess of federally insured limits. The Portfolios have not experienced any losses on their accounts.
Federal Income Tax – It is each Portfolio's policy to qualify as a regulated investment company by complying with the provisions of the Internal Revenue Code that are applicable to regulated investment companies and to distribute substantially all of their taxable income and net realized gains to shareholders. Therefore, no Federal income tax provision is required.
107
Global Atlantic Portfolios
Notes to Financial Statements (Continued)
December 31, 2021
Each Portfolio will recognize the tax benefits of uncertain tax positions only where the position is "more likely than not" to be sustained assuming examination by tax authorities. Management has analyzed each Portfolio's tax positions, and has concluded that no liability for unrecognized tax benefits should be recorded related to uncertain tax positions taken in each Portfolio's 2019 and 2020 tax returns, or is expected to be taken in each Portfolio's December 31, 2021 tax return. Each Portfolio identified its major tax jurisdictions as U.S. Federal and foreign jurisdictions where the Portfolios make significant investments; however, the Portfolios are not aware of any tax positions for which it is reasonably possible that the total amounts of unrecognized tax benefits will change materially in the next twelve months.
Foreign Currency Translation – The accounting records of the Portfolios are maintained in U.S. dollars. Foreign currencies, as well as investment securities and other assets and liabilities denominated in foreign currencies, are translated into U.S. dollars using exchange rates deemed appropriate by the investment adviser. Purchases and sales of securities, income receipts and expense payments are translated into U.S. dollars on the respective dates of such transactions.
Net realized gains and losses on foreign currency transactions represent net gains and losses from currency realized between the trade and settlement dates on securities transactions and the difference between income accrued versus income received. The effects of changes in foreign currency exchange rates on investments in securities are included with the net realized and change in unrealized gain or loss on foreign currency translations.
Forward Foreign Currency Contracts – As foreign securities are purchased, a Portfolio may enter into forward currency contracts in order to hedge against foreign currency exchange rate risks. A forward involves an obligation to purchase or sell a specific currency at a future date, which may be any fixed number of days from the date of the contract agreed upon by the parties, at a price set at the time of the contract. The market value of the contract fluctuates with changes in currency exchange rates. The contract is marked-to-market daily and the change in market value is recorded by a Portfolio as an unrealized gain or loss. As foreign securities are sold, a portion of the contract is generally closed and a Portfolio records a realized gain or loss equal to the difference between the value of the contract at the time it was opened and the value at the time it was closed. Realized gains and losses from contract transactions are included as a component of net realized gains/(losses) from forward foreign currency contracts in the Statements of Operations.
For the year ended December 31, 2021, realized gains/(losses) and the change in unrealized appreciation/(depreciation) on forward foreign currency contracts subject to currency risk, as disclosed in the Statements of Operations, is as follows:
Realized Gain/(Loss) | Change in Unrealized Appreciation/(Depreciation) | ||||||||||
Global Atlantic Goldman Sachs Core Fixed Income Portfolio | $ | (86,707 | ) | $ | 52,377 | ||||||
Options Transactions – Certain Portfolios are subject to equity price risk, interest rate risk and foreign currency risk in the normal course of pursuing their investment objectives and may purchase or sell options to help hedge against this risk.
A Portfolio may purchase and write (i.e., sell) put and call options. Such options may relate to particular securities or securities indices, including ETFs, and may or may not be listed on a domestic or foreign securities exchange and may or may not be issued by the Options Clearing Corporation. Options trading is a highly specialized activity that entails greater than ordinary investment risk. Options may be more volatile than the underlying instruments, and therefore, on a percentage basis, an investment in options may be subject to greater fluctuation than an investment in the underlying instruments themselves. A call option for a particular security gives the purchaser of the option, in return for a premium, the right, but not the obligation, to buy, and the writer (seller) the obligation to sell, the underlying security at the stated exercise price at any time prior to the expiration of the option for American options or only at expiration for European options, regardless of the market price of the security. The premium paid to the writer is in consideration for undertaking the obligation under the option contract. A put option for a particular security gives the purchaser the right, but not the obligation, to sell the security at the stated exercise price at any time prior to the expiration date of the option for American options or only at expiration for European options, regardless of the market price of the security.
Securities index options are put options and call options on various securities indices. In most respects, they are identical to listed options on common stocks. The primary difference between stock options and index options occurs when index options are exercised. In the case of stock options, the underlying security, common stock, is delivered. However, upon the exercise of an index option, settlement does not occur by delivery of the securities comprising the index. The option holder
108
Global Atlantic Portfolios
Notes to Financial Statements (Continued)
December 31, 2021
who exercises the index option receives an amount of cash if the closing level of the securities index upon which the option is based is greater than, in the case of a call, or less than, in the case of a put, the exercise price of the option. This amount of cash is equal to the difference between the closing price of the securities index and the exercise price of the option expressed in dollars times a specified multiple. A securities index fluctuates with changes in the market value of the securities included in the index.
The Portfolios may purchase and sell options on the same types of futures in which it may invest. Options on futures are similar to options on underlying instruments except that options on futures give the purchaser the right, but not the obligation, to buy in return for the premium paid, to assume a position in a futures contract (a long position if the option is a call and a short position if the option is a put), rather than to purchase or sell the futures contract, at a specified exercise price at any time during the period of the option. Upon exercise of the option, the delivery of the futures position by the writer of the option to the holder of the option will be accompanied by the delivery of the accumulated balance in the writer's futures margin account which represents the amount by which the market price of the futures contract, at exercise, exceeds (in the case of a call) or is less than (in the case of a put) the exercise price of the option on the futures contract. Purchasers of options who fail to exercise their options prior to the exercise date suffer a loss of the premium paid. For the year ended December 31, 2021, the Global Atlantic Goldman Sachs Core Fixed Income Portfolio had realized gains of $31,814 from option contracts written.
Futures Contracts – The Portfolios are subject to equity price risk in the normal course of pursuing their investment objectives. The Portfolios may sell futures contracts to hedge against market risk, foreign currency exchange rate risks, and to reduce return volatility. Futures are standardized, exchange-traded contracts that provide for the future sale by one party and purchase by another party of a specified amount of a specific financial instrument (e.g., units of a securities index) for a specified price, date, time and place designated at the time the contract is made. Brokerage fees are incurred when a futures contract is bought or sold and initial and variation margin deposits must be maintained. Entering into a contract to buy is commonly referred to as buying or purchasing a contract or holding a long position. Entering into a contract to sell is commonly referred to as selling a contract or holding a short position. The Portfolios may also buy or sell hedge instruments based on one or more market indices in an attempt to maintain the Portfolios' volatility at a targeted level. Initial margin deposits required upon entering into futures contracts are satisfied by the segregation of specific securities or cash as collateral for the account of the broker (the Portfolio's agent in acquiring the futures position). During the period the futures contracts are open, changes in the value of the contracts are recognized as unrealized gains or losses by "marking to market" on a daily basis to reflect the market value of the contracts at the end of each day's trading. Variation margin payments are received or made depending upon whether unrealized gains or losses are incurred. When the contracts are closed, a Portfolio recognizes a realized gain or loss equal to the difference between the proceeds from, or cost of, the closing transaction and the Portfolio's basis in the contract. If a Portfolio were unable to liquidate a futures contract and/or enter into an offsetting closing transaction, the Portfolio would continue to be subject to market risk with respect to the value of the contracts and continue to be required to maintain the margin deposits on the futures contracts. Each Portfolio segregates liquid securities having a value at least equal to the amount of the current obligation under any open futures contract. These amounts are disclosed on the Statements of Assets and Liabilities as Deposits with Brokers when applicable. Risks may exceed amounts recognized in the Statements of Assets and Liabilities. With futures, there is minimal counterparty credit risk to a Portfolio since futures are exchange traded and the exchange's clearinghouse, as counterparty to all exchange traded futures, guarantees the futures against default.
For the year ended December 31, 2021, realized gains/(losses) and the change in unrealized appreciation/(depreciation) on futures contracts by risk type, as disclosed in the Statements of Operations, is as follows:
Risk Type | Realized Gain/(Loss) | Change in Unrealized Appreciation/(Depreciation) | |||||||||||||
Global Atlantic BlackRock Disciplined Core Portfolio | Equity | $ | 4,008,492 | $ | (344,903 | ) | |||||||||
Global Atlantic BlackRock Disciplined Growth Portfolio | Equity | 159,036 | (4,635 | ) | |||||||||||
Global Atlantic BlackRock Disciplined International Core Portfolio | Equity | 353,569 | 1,365 | ||||||||||||
Global Atlantic BlackRock Disciplined Mid Cap Growth Portfolio | Equity | 1,428,241 | (122,269 | ) | |||||||||||
Global Atlantic BlackRock Disciplined Value Portfolio | Equity | 1,700,255 | (162,590 | ) | |||||||||||
Global Atlantic BlackRock High Yield Portfolio | Interest Rate | (5,154 | ) | 13,311 | |||||||||||
Global Atlantic Goldman Sachs Core Fixed Income Portfolio | Interest Rate | (315,193 | ) | 123,139 | |||||||||||
109
Global Atlantic Portfolios
Notes to Financial Statements (Continued)
December 31, 2021
Swap Agreements – Certain Portfolios are subject to equity price risk and/or interest rate risk in the normal course of pursuing their investment objectives. These Portfolios may enter into various swap transactions for investment purposes or to manage interest rate, equity, foreign exchange (currency), or credit risk. These are two-party contracts entered into primarily to exchange the returns (or differentials in rates of returns) earned or realized on particular pre-determined investments or instruments. In a standard over-the-counter ("OTC") swap, two parties agree to exchange the returns, differentials in rates of return or some other amount earned or realized on the "notional amount" (i.e., the return or increase in value of a particular dollar amount invested in a "basket" of securities, representing a particular index or industry sectors) of predetermined investments or instruments.
Certain Portfolios may enter into credit default swaps ("CDS"). CDS are two-party contracts that transfer credit exposure between the parties. One party (the "buyer") receives credit protection and the other party (the "seller") takes on credit risk. The buyer typically makes predetermined periodic payments to the seller in exchange for the seller's commitment to purchase the underlying reference obligation if a defined credit event occurs, such as a default, bankruptcy or failure to pay interest or principal on a reference debt instrument, with respect to a specified issuer or one of the reference issuers in a CDS portfolio. If the defined credit event occurs, the seller must pay the agreed-upon value of a reference obligation to the counterparty or perform pursuant to the agreement. The buyer must then surrender the reference obligation to the seller. As a seller of credit protection in a CDS, a Portfolio would be liable for the notional amount of the swap.
The swaps in which a Portfolio may invest may be centrally-cleared or bi-laterally traded. The gross returns to be exchanged or "swapped" between the parties are calculated with respect to a notional amount. Changes in the value of swap agreements are recognized as unrealized gains or losses in the Statements of Operations by "marking to market" on a daily basis to reflect the value of the swap agreement at the end of each trading day. Payments received or paid at the beginning of a swap agreement are reflected as such on the Statements of Assets and Liabilities and may be referred to as upfront payments. A Portfolio amortizes upfront payments and/or accrues for the fixed payment stream on swap agreements on a daily basis with the net amount recorded as a component of unrealized gain or loss on the Statements of Operations. Realized gains and losses from the decrease in notional value of the swap are recognized on trade date. A liquidation payment received or made at the termination of the swap agreement is recorded as a realized gain or loss on the Statements of Operations. A Portfolio segregates cash or liquid securities having a value at least equal to the amount of its current obligation under any swap transaction. Swap agreements involve, to varying degrees, lack of liquidity and elements of credit, market and counterparty risk in excess of amounts recognized on the Statements of Assets and Liabilities. Each Portfolio's maximum risk of loss from the counterparty credit risk is the discounted net value of the cash flow to be received from the counterparty over the contract's remaining life, to be the extent that amount is positive.
Swaps may involve greater risks than direct investments in securities because swaps may be leveraged and, when traded in the OTC markets, are subject to counterparty risk, credit risk and pricing risk, each of which individually and collectively, may have a considerable impact on the performance of a Portfolio. CDS in particular may involve greater risks than investing in a referenced instrument directly. Swaps, especially those that are not exchange-traded, may also be considered illiquid. It may not be possible for a Portfolio to liquidate a swap position at an advantageous time or price, which may result in significant losses. Although central clearing and exchange-trading of swaps may decrease counterparty risk and increase market liquidity, exchange-trading and clearing does not make the contracts risk free, but rather, the primary credit risk on such contracts is the creditworthiness of the clearing broker or the clearinghouse.
The Portfolios use cash and certain securities as collateral to swap agreements as indicated on the Portfolio of Investments and Statements of Assets and Liabilities. Such collateral is held for the benefit of the counterparty in a segregated account to prevent non-payment by the Portfolios. If the counterparty defaults, a Portfolio may seek return of this collateral and incur certain costs exercising their rights to the collateral.
For the year ended December 31, 2021, realized gains/(losses) and the change in unrealized appreciation/(depreciation) on swap agreements, as disclosed in the Statements of Operations, is as follows:
Risk Type | Realized Gain/(Loss) | Change in Unrealized Appreciation/(Depreciation) | |||||||||||||
Global Atlantic Goldman Sachs Core Fixed Income Portfolio | Interest Rate | $ | (202,178 | ) | $ | 12,078 | |||||||||
| Credit | 17,236 | (3,770 | ) | ||||||||||||
110
Global Atlantic Portfolios
Notes to Financial Statements (Continued)
December 31, 2021
For the year ended December 31, 2021, realized gains/(losses) and the change in unrealized appreciation/(depreciation) on swaptions, as disclosed in the Statements of Operations, is as follows:
Risk Type | Realized Gain/(Loss) | Change in Unrealized Appreciation/(Depreciation) | |||||||||||||
Global Atlantic Goldman Sachs Core Fixed Income Portfolio | Interest Rate | $ | 31,814 | $ | (2,510 | ) | |||||||||
Offsetting of Financial Assets/Liabilities and Derivative Assets/Liabilities – The following tables present certain of the Portfolios' asset/liability derivatives available for offset under a master netting arrangement net of collateral pledged as of December 31, 2021.
Global Atlantic BlackRock Disciplined Core Portfolio
| Gross Amounts of Recognized Assets (1) | Financial Instruments and Derivatives Available for Offset | Net Amount of Assets Presented in the Statements of Assets & Liabilities | Collateral Received (2) | Net Amount of Recognized Assets | Gross Amounts of Recognized Liabilities (1) | Financial Instruments and Derivatives Available for Offset | Net Amount of Liabilities Presented in the Statements of Assets & Liabilities | Collateral Pledged (2) | Net Amount of Recognized Liabilities | ||||||||||||||||||||||||||||||||||
| Goldman Sachs & Co. | $ | 127,608 | $ | - | $ | 127,608 | $ | - | $ | 127,608 | $ | - | $ | - | $ | - | $ | - | $ | - | |||||||||||||||||||||||
Total | $ | 127,608 | $ | - | $ | 127,608 | $ | - | $ | 127,608 | $ | - | $ | - | $ | - | $ | - | $ | - | |||||||||||||||||||||||
Global Atlantic BlackRock Disciplined Growth Portfolio
| Gross Amounts of Recognized Assets (1) | Financial Instruments and Derivatives Available for Offset | Net Amount of Assets Presented in the Statements of Assets & Liabilities | Collateral Received (2) | Net Amount of Recognized Assets | Gross Amounts of Recognized Liabilities (1) | Financial Instruments and Derivatives Available for Offset | Net Amount of Liabilities Presented in the Statements of Assets & Liabilities | Collateral Pledged (2) | Net Amount of Recognized Liabilities | ||||||||||||||||||||||||||||||||||
| Goldman Sachs & Co. | $ | 12,424 | $ | - | $ | 12,424 | $ | - | $ | 12,424 | $ | - | $ | - | $ | - | $ | - | $ | - | |||||||||||||||||||||||
Total | $ | 12,424 | $ | - | $ | 12,424 | $ | - | $ | 12,424 | $ | - | $ | - | $ | - | $ | - | $ | - | |||||||||||||||||||||||
Global Atlantic BlackRock Disciplined International Core Portfolio
| Gross Amounts of Recognized Assets (1) | Financial Instruments and Derivatives Available for Offset | Net Amount of Assets Presented in the Statements of Assets & Liabilities | Collateral Received (2) | Net Amount of Recognized Assets | Gross Amounts of Recognized Liabilities (1) | Financial Instruments and Derivatives Available for Offset | Net Amount of Liabilities Presented in the Statements of Assets & Liabilities | Collateral Pledged (2) | Net Amount of Recognized Liabilities | ||||||||||||||||||||||||||||||||||
| Goldman Sachs & Co. | $ | 54,759 | $ | - | $ | 54,759 | $ | - | $ | 54,759 | $ | - | $ | - | $ | - | $ | - | $ | - | |||||||||||||||||||||||
Total | $ | 54,759 | $ | - | $ | 54,759 | $ | - | $ | 54,759 | $ | - | $ | - | $ | - | $ | - | $ | - | |||||||||||||||||||||||
111
Global Atlantic Portfolios
Notes to Financial Statements (Continued)
December 31, 2021
Global Atlantic BlackRock Disciplined Mid Cap Growth Portfolio
| Gross Amounts of Recognized Assets (1) | Financial Instruments and Derivatives Available for Offset | Net Amount of Assets Presented in the Statements of Assets & Liabilities | Collateral Received (2) | Net Amount of Recognized Assets | Gross Amounts of Recognized Liabilities (1) | Financial Instruments and Derivatives Available for Offset | Net Amount of Liabilities Presented in the Statements of Assets & Liabilities | Collateral Pledged (2) | Net Amount of Recognized Liabilities | ||||||||||||||||||||||||||||||||||
| Goldman Sachs & Co. | $ | 61,506 | $ | - | $ | 61,506 | $ | - | $ | 61,506 | $ | - | $ | - | $ | - | $ | - | $ | - | |||||||||||||||||||||||
Total | $ | 61,506 | $ | - | $ | 61,506 | $ | - | $ | 61,506 | $ | - | $ | - | $ | - | $ | - | $ | - | |||||||||||||||||||||||
Global Atlantic BlackRock Disciplined Value Portfolio
| Gross Amounts of Recognized Assets (1) | Financial Instruments and Derivatives Available for Offset | Net Amount of Assets Presented in the Statements of Assets & Liabilities | Collateral Received (2) | Net Amount of Recognized Assets | Gross Amounts of Recognized Liabilities (1) | Financial Instruments and Derivatives Available for Offset | Net Amount of Liabilities Presented in the Statements of Assets & Liabilities | Collateral Pledged (2) | Net Amount of Recognized Liabilities | ||||||||||||||||||||||||||||||||||
| Goldman Sachs & Co. | $ | 46,353 | $ | - | $ | 46,353 | $ | - | $ | 46,353 | $ | - | $ | - | $ | - | $ | - | $ | - | |||||||||||||||||||||||
Total | $ | 46,353 | $ | - | $ | 46,353 | $ | - | $ | 46,353 | $ | - | $ | - | $ | - | $ | - | $ | - | |||||||||||||||||||||||
Global Atlantic BlackRock High Yield Portfolio
| Gross Amounts of Recognized Assets (1) | Financial Instruments and Derivatives Available for Offset | Net Amount of Assets Presented in the Statements of Assets & Liabilities | Collateral Received (2) | Net Amount of Recognized Assets | Gross Amounts of Recognized Liabilities (1) | Financial Instruments and Derivatives Available for Offset | Net Amount of Liabilities Presented in the Statements of Assets & Liabilities | Collateral Pledged (2) | Net Amount of Recognized Liabilities | ||||||||||||||||||||||||||||||||||
| Goldman Sachs & Co. | $ | 11,718 | $ | (391 | ) | $ | 11,327 | $ | - | $ | 11,327 | $ | 391 | $ | (391 | ) | $ | - | $ | - | $ | - | |||||||||||||||||||||
Total | $ | 11,718 | $ | (391 | ) | $ | 11,327 | $ | - | $ | 11,327 | $ | 391 | $ | (391 | ) | $ | - | $ | - | $ | - | |||||||||||||||||||||
Global Atlantic Goldman Sachs Core Fixed Income Portfolio
| Gross Amounts of Recognized Assets (1) | Financial Instruments and Derivatives Available for Offset | Net Amount of Assets Presented in the Statements of Assets & Liabilities | Collateral Received (2) | Net Amount of Recognized Assets | Gross Amounts of Recognized Liabilities (1) | Financial Instruments and Derivatives Available for Offset | Net Amount of Liabilities Presented in the Statements of Assets & Liabilities | Collateral Pledged (2) | Net Amount of Recognized Liabilities | ||||||||||||||||||||||||||||||||||
| JP Morgan Chase Bank | $ | 2,506 | $ | (2,506 | ) | $ | - | $ | - | $ | - | $ | 4,134 | $ | (2,506 | ) | $ | 1,628 | $ | (1,628 | ) | $ | - | ||||||||||||||||||||
Morgan Stanley | 196,050 | (108,324 | ) | 87,726 | - | 87,726 | 108,324 | (108,324 | ) | - | - | - | |||||||||||||||||||||||||||||||
Total | $ | 198,556 | $ | (110,830 | ) | $ | 87,726 | $ | - | $ | 87,726 | $ | 112,458 | $ | (110,830 | ) | $ | 1,628 | $ | (1,628 | ) | $ | - | ||||||||||||||||||||
(1) Gross unrealized appreciation/(depreciation) as presented in the Portfolio of Investments.
(2) The amount is limited to the net derivative balance and, accordingly, may not include collateral or excess collateral received or pledged.
112
Global Atlantic Portfolios
Notes to Financial Statements (Continued)
December 31, 2021
Impact of Derivatives on the Statements of Assets and Liabilities – The following table presents a summary of the location of derivative investments categorized by primary risk exposure on the Portfolios' Statements of Assets and Liabilities as of December 31, 2021:
Global Atlantic BlackRock Disciplined Core Portfolio
Equity | Interest Rate Contracts | Credit Contracts | Currency Contracts | Total | |||||||||||||||||||
Assets | |||||||||||||||||||||||
| Unrealized appreciation on Futures Contracts | $ | 127,608 | $ | - | $ | - | $ | - | $ | 127,608 | |||||||||||||
Total | $ | 127,608 | $ | - | $ | - | $ | - | $ | 127,608 | |||||||||||||
Global Atlantic BlackRock Disciplined Growth Portfolio
Equity | Interest Rate Contracts | Credit Contracts | Currency Contracts | Total | |||||||||||||||||||
Assets | |||||||||||||||||||||||
| Unrealized appreciation on Futures Contracts | $ | 12,424 | $ | - | $ | - | $ | - | $ | 12,424 | |||||||||||||
Total | $ | 12,424 | $ | - | $ | - | $ | - | $ | 12,424 | |||||||||||||
Global Atlantic BlackRock Disciplined International Core Portfolio
Equity | Interest Rate Contracts | Credit Contracts | Currency Contracts | Total | |||||||||||||||||||
Assets | |||||||||||||||||||||||
| Unrealized appreciation on Futures Contracts | $ | 54,759 | $ | - | $ | - | $ | - | $ | 54,759 | |||||||||||||
Total | $ | 54,759 | $ | - | $ | - | $ | - | $ | 54,759 | |||||||||||||
Global Atlantic BlackRock Disciplined Mid Cap Growth Portfolio
Equity | Interest Rate Contracts | Credit Contracts | Currency Contracts | Total | |||||||||||||||||||
Assets | |||||||||||||||||||||||
| Unrealized appreciation on Futures Contracts | $ | 61,506 | $ | - | $ | - | $ | - | $ | 61,506 | |||||||||||||
Total | $ | 61,506 | $ | - | $ | - | $ | - | $ | 61,506 | |||||||||||||
Global Atlantic BlackRock Disciplined Value Portfolio
Equity | Interest Rate Contracts | Credit Contracts | Currency Contracts | Total | |||||||||||||||||||
Assets | |||||||||||||||||||||||
| Unrealized appreciation on Futures Contracts | $ | 46,353 | $ | - | $ | - | $ | - | $ | 46,353 | |||||||||||||
Total | $ | 46,353 | $ | - | $ | - | $ | - | $ | 46,353 | |||||||||||||
Global Atlantic BlackRock High Yield Portfolio
Equity | Interest Rate Contracts | Credit Contracts | Currency Contracts | Total | |||||||||||||||||||
Assets | |||||||||||||||||||||||
| Unrealized appreciation on Futures Contracts | $ | 11,327 | $ | - | $ | - | $ | - | $ | 11,327 | |||||||||||||
Total | $ | 11,327 | $ | - | $ | - | $ | - | $ | 11,327 | |||||||||||||
113
Global Atlantic Portfolios
Notes to Financial Statements (Continued)
December 31, 2021
Global Atlantic Goldman Sachs Core Fixed Income Portfolio
Equity | Interest Rate Contracts | Credit Contracts | Currency Contracts | Total | |||||||||||||||||||
Assets | |||||||||||||||||||||||
| Unrealized appreciation on Futures Contracts | $ | - | $ | 117,718 | $ | - | $ | - | $ | 117,718 | |||||||||||||
| Unrealized appreciation on Swap Contracts | - | 55,830 | 18,579 | - | 74,409 | ||||||||||||||||||
| Unrealized appreciation on Swaptions Written | - | 2,506 | - | - | 2,506 | ||||||||||||||||||
| Unrealized appreciation on Forward Foreign Currency Contracts | - | - | - | 3,923 | 3,923 | ||||||||||||||||||
Liabilities | |||||||||||||||||||||||
| Unrealized depreciation on Futures Contracts | - | (64,721 | ) | - | - | (64,721 | ) | ||||||||||||||||
| Unrealized depreciation on swap contracts | - | (41,902 | ) | (666 | ) | - | (42,568 | ) | |||||||||||||||
| Unrealized depreciation on Swaptions Purchased | - | (4,134 | ) | - | - | (4,134 | ) | ||||||||||||||||
| Unrealized depreciation on Forward Foreign Currency Contracts | - | - | - | (1,035 | ) | (1,035 | ) | ||||||||||||||||
Total | $ | - | $ | 65,297 | $ | 17,913 | $ | 2,888 | $ | 86,098 | |||||||||||||
The notional value of the derivative instruments outstanding as of December 31, 2021, as disclosed in the Portfolios of Investments, and the amounts of realized and changes in unrealized gains and losses on derivative instruments during the year as disclosed above and within in the Statements of Operations serve as indicators of the volume of derivative activity for the Portfolios.
Short Sales – A Portfolio may make short sales of securities: (i) to offset potential declines in long positions in similar securities; (ii) to increase the flexibility of the Portfolio; (iii) for investment return; (iv) as part of a risk arbitrage strategy; and (v) as part of its overall portfolio management strategies involving the use of derivative instruments. A short sale is a transaction in which a Portfolio sells a security it does not own or have the right to acquire (or that it owns but does not wish to deliver) in anticipation that the market price of that security will decline.
When a Portfolio makes a short sale, the broker-dealer through which the short sale is made must borrow the security sold short and deliver it to the party purchasing the security. The Portfolio is required to make a margin deposit in connection with such short sales; the Portfolio may have to pay a fee to borrow particular securities and will often be obligated to pay over any dividends and accrued interest on borrowed securities.
If the price of the security sold short increases between the time of the short sale and the time a Portfolio covers its short position, the Portfolio will incur a loss; conversely, if the price declines, the Portfolio will realize a capital gain. Any gain will be decreased, and any loss increased, by the transaction costs described above. The successful use of short selling may be adversely affected by imperfect correlation between movements in the price of the security sold short and the securities being hedged.
To the extent a Portfolio sells securities short, it will provide collateral to the broker-dealer and (except in the case of short sales "against the box") will maintain additional asset coverage in the form of cash, U.S. government securities or other liquid securities with its custodian in a segregated account in an amount at least equal to the difference between the current market value of the securities sold short and any amounts required to be deposited as collateral with the selling broker (not including the proceeds of the short sale). A Portfolio does not intend to enter into short sales (other than short sales "against the box") if immediately after such sales the aggregate of the value of all collateral plus the amount in such segregated account exceeds 10% of the value of the Portfolio's net assets. This percentage may be varied by action of the Board of Trustees. A short sale is "against the box" to the extent a Portfolio contemporaneously owns, or has the right to obtain at no added cost, securities identical to those sold short. The SEC adopted a final rule related to the use of derivatives, reverse repurchase
114
Global Atlantic Portfolios
Notes to Financial Statements (Continued)
December 31, 2021
agreements and certain other transactions, which may include short sales in some cases, by registered investment companies that will rescind and withdraw the guidance of the SEC and its staff regarding asset segregation and coverage transactions.
When-Issued and Delayed-Delivery Transactions – The Portfolios may engage in when-issued or delayed-delivery transactions. The Portfolios record when-issued securities on the trade date and maintain security positions such that sufficient liquid assets will be available to make payment for the securities purchased. Securities purchased on a when-issued or delayed-delivery basis are marked to market daily and begin earning interest on the settlement date. Losses may occur on these transactions due to changes in market conditions or the failure of counterparties to perform under the contract.
Real Estate Investment Trusts – Certain Portfolios may invest in real estate investment trusts ("REITs"). REITs are pooled investment vehicles that own, and typically operate, income-producing real estate. If a REIT meets certain requirements, including distributing to shareholders substantially all of its taxable income (other than net capital gains), then it is not taxed on the income distributed to shareholders. REITs are subject to management fees and other expenses, and so a Portfolio that invests in REITs will bear its proportionate share of the costs of the REITs' operations. Along with the risks common to different types of real estate-related securities, such as loss to casualty or condemnation, increases in property taxes and operating expenses, zoning law amendments, changes in interest rates, overbuilding and increased competition, variations in market value, and possible environmental liabilities, REITs involve additional risk factors. These include poor performance by the REIT's manager, changes to the tax laws, and failure by the REIT to qualify for tax free distribution of income or exemption under the 1940 Act. In addition, REITs are not diversified and are heavily dependent on cash flow.
Distributions from a Portfolio's investments in REITs may be characterized as ordinary income, a net capital gain or a return of capital. The Portfolios record distributions that represent a net capital gain as a realized gain and distributions that represent a return of capital as a reduction of the cost of investment. REITs report information on the source of their distributions annually in the following calendar year. As a result, a Portfolio may estimate the source of REIT distributions for accounting purposes and then makes adjustments when the actual source information is reported by the REIT. These estimates are based on the most recent REIT distribution information available.
Mortgage Dollar Roll Transactions – A mortgage dollar roll transaction involves a sale by a Portfolio of mortgage related securities that it holds with an agreement by the Portfolio to repurchase similar securities at an agreed upon price and date. The securities purchased will bear the same interest rate as those sold, but generally will be collateralized by pools of mortgages with different prepayment histories than those securities sold. The Portfolios account for mortgage dollar rolls as purchases and sales transactions.
Expenses – Expenses of the Trust that are directly identifiable to a specific Portfolio are charged to that Portfolio. Expenses, which are not readily identifiable to a specific Portfolio, are allocated in such a manner as deemed equitable, taking into consideration the nature and type of expense and the relative sizes of the Portfolios in the Trust.
Indemnification – The Trust indemnifies its officers and Trustees for certain liabilities that may arise from the performance of their duties to the Trust. Additionally, in the normal course of business, the Portfolios enter into contracts that contain a variety of representations and warranties and which provide general indemnities. Each Portfolio's maximum exposure under these arrangements is unknown, as this would involve future claims that may be made against the Portfolios that have not yet occurred. However, the Portfolios expect the risk of loss due to these warranties and indemnities to be remote.
3. INVESTMENT TRANSACTIONS
For the year ended December 31, 2021, cost of purchases and proceeds from sales of portfolio securities, other than short- term investments, were as follows:
Purchases | Sales | ||||||||||
Global Atlantic BlackRock Allocation Portfolio | $ | 57,291,978 | $ | 68,461,140 | |||||||
Global Atlantic BlackRock Disciplined Core Portfolio | 702,036,329 | 772,242,066 | |||||||||
Global Atlantic BlackRock Disciplined Growth Portfolio | 77,223,254 | 90,452,844 | |||||||||
Global Atlantic BlackRock Disciplined International Core Portfolio | 181,957,116 | 193,593,317 | |||||||||
115
Global Atlantic Portfolios
Notes to Financial Statements (Continued)
December 31, 2021
Purchases | Sales | ||||||||||
Global Atlantic BlackRock Disciplined Mid Cap Growth Portfolio | $ | 493,501,896 | $ | 528,795,986 | |||||||
Global Atlantic BlackRock Disciplined Value Portfolio | 318,525,833 | 345,156,567 | |||||||||
Global Atlantic BlackRock High Yield Portfolio | 40,176,217 | 42,311,919 | |||||||||
Global Atlantic Goldman Sachs Core Fixed Income Portfolio | 379,926,389 | 397,813,144 | |||||||||
4. AGREEMENTS AND TRANSACTIONS WITH RELATED PARTIES
The Adviser serves as the Portfolios' investment adviser. The Adviser has engaged the following sub-advisers for the Portfolios:
Portfolio | Sub-Adviser | ||||||
Global Atlantic BlackRock Allocation Portfolio | BlackRock Investment Management, LLC | ||||||
Global Atlantic BlackRock Disciplined Core Portfolio | BlackRock Investment Management, LLC | ||||||
Global Atlantic BlackRock Disciplined Growth Portfolio | BlackRock Investment Management, LLC | ||||||
Global Atlantic BlackRock Disciplined International Core Portfolio | BlackRock Investment Management, LLC | ||||||
Global Atlantic BlackRock Disciplined Mid Cap Growth Portfolio | BlackRock Investment Management, LLC | ||||||
Global Atlantic BlackRock Disciplined Value Portfolio | BlackRock Investment Management, LLC | ||||||
Global Atlantic BlackRock High Yield Portfolio | BlackRock Investment Management, LLC | ||||||
Global Atlantic Goldman Sachs Core Fixed Income Portfolio | Goldman Sachs Asset Management, L.P. | ||||||
The Bank of New York Mellon serves as the Administrator, Fund Accountant and Custodian for the Portfolios and BNY Mellon Investment Servicing (US) Inc. (together with The Bank of New York Mellon, "BNYM") serves as the Transfer Agent for the Portfolios.
Pursuant to an Investment Advisory Agreement with the Trust, on behalf of the Portfolios, the Adviser, under the oversight of the Board, directs the daily investment operations of the Portfolios and supervises the performance of administrative and professional services provided by others. As compensation for its services and the related expenses borne by the Adviser, the Portfolios pay the Adviser an advisory fee, computed on average daily net assets and accrued daily and paid monthly.
The following chart details the annual advisory fee for each Portfolio for the year ended December 31, 2021.
Portfolio | Advisory Fee* | ||||||
Global Atlantic BlackRock Allocation Portfolio | 0.22% on first $1 billion | ||||||
0.21% on next $1 billion | |||||||
| 0.20% over $2 billion | |||||||
Global Atlantic BlackRock Disciplined Core Portfolio | 0.39% on first $1 billion | ||||||
0.37% on next $1 billion | |||||||
| 0.35% over $2 billion | |||||||
Global Atlantic BlackRock Disciplined Growth Portfolio** | 0.37% on first $250 million | ||||||
0.35% on next $250 million | |||||||
0.34% on next $500 million | |||||||
| 0.32% over $1 billion | |||||||
Global Atlantic BlackRock Disciplined International Core Portfolio** | 0.60% on first $500 million | ||||||
0.58% on next $500 million | |||||||
| 0.55% over $1 billion | |||||||
Global Atlantic BlackRock Disciplined Mid Cap Growth Portfolio** | 0.54% on first $250 million | ||||||
0.53% on next $250 million | |||||||
0.51% on next $500 million | |||||||
| 0.48% over $1 billion | |||||||
116
Global Atlantic Portfolios
Notes to Financial Statements (Continued)
December 31, 2021
Portfolio | Advisory Fee* | ||||||
Global Atlantic BlackRock Disciplined Value Portfolio | 0.45% on first $1 billion | ||||||
0.43% on next $1 billion | |||||||
| 0.41% over $2 billion | |||||||
Global Atlantic BlackRock High Yield Portfolio | 0.50% on first $1 billion | ||||||
0.48% on next $1 billion | |||||||
| 0.46% over $2 billion | |||||||
Global Atlantic Goldman Sachs Core Fixed Income Portfolio | 0.34% on first $250 million | ||||||
0.32% on next $250 million | |||||||
0.26% over $500 million | |||||||
* Calculated daily based on the average daily net assets.
** For the period January 1, 2021 through August 19, 2021, the advisory fees for the Portfolios were as follows:
Portfolio | Advisory Fee* | ||||||
Global Atlantic BlackRock Disciplined Growth Portfolio | 0.45% on first $1 billion | ||||||
0.43% on next $1 billion | |||||||
| 0.41% over $2 billion | |||||||
Global Atlantic BlackRock Disciplined International Core Portfolio | 0.60% on first $1 billion | ||||||
0.58% on next $1 billion | |||||||
| 0.56% over $2 billion | |||||||
Global Atlantic BlackRock Disciplined Mid Cap Growth Portfolio | 0.55% on first $1 billion | ||||||
0.53% on next $1 billion | |||||||
| 0.51% over $2 billion | |||||||
During the year ended December 31, 2021, with respect to each Portfolio, the Adviser contractually agreed to waive its fees and to reimburse expenses, at least until the expiration dates listed below, to ensure that total annual portfolio operating expenses after fee waiver and/or reimbursement (exclusive of any front-end or contingent deferred loads, brokerage fees and commissions, acquired fund fees and expenses, borrowing costs (such as interest and dividend expense on securities sold short), taxes and extraordinary expenses, such as litigation) will not exceed the average daily net asset percentages attributable to the Portfolio's shares listed below ("Waiver Agreements").
For the period beginning January 1, 2021 and ending April 30, 2021
Operating Expense Limitations | |||||||||||
Class I | Class II | ||||||||||
Global Atlantic BlackRock Allocation Portfolio | 0.31 | % | 0.56 | % | |||||||
Global Atlantic BlackRock Disciplined Core Portfolio | 0.48 | % | 0.73 | % | |||||||
Global Atlantic BlackRock Disciplined Growth Portfolio | N/A | 0.79 | % | ||||||||
Global Atlantic BlackRock Disciplined International Core Portfolio | 0.69 | % | 0.94 | % | |||||||
Global Atlantic BlackRock Disciplined Mid Cap Growth Portfolio | 0.63 | % | 0.88 | % | |||||||
Global Atlantic BlackRock Disciplined Value Portfolio | 0.54 | % | 0.79 | % | |||||||
Global Atlantic BlackRock High Yield Portfolio | 0.59 | % | 0.84 | % | |||||||
Global Atlantic Goldman Sachs Core Fixed Income Portfolio | 0.43 | % | N/A | ||||||||
For the period beginning May 1, 2021 and ending August 19, 2021
Operating Expense Limitations | |||||||||||
Class I | Class II | ||||||||||
Global Atlantic BlackRock Disciplined Growth Portfolio | 0.56 | % | 0.81 | % | |||||||
Global Atlantic BlackRock Disciplined Mid Cap Growth Portfolio | 0.65 | % | 0.90 | % | |||||||
117
Global Atlantic Portfolios
Notes to Financial Statements (Continued)
December 31, 2021
Effective May 1, 2021, unless otherwise noted, at least until the expiration dates listed below:
Operating Expense Limitations | |||||||||||||||
Class I | Class II | Expiration Date | |||||||||||||
Global Atlantic BlackRock Allocation Portfolio | 0.33 | % | 0.58 | % | May 1, 2022 | ||||||||||
Global Atlantic BlackRock Disciplined Core Portfolio | 0.50 | % | 0.75 | % | September 1, 2022 | ||||||||||
Global Atlantic BlackRock Disciplined Growth Portfolio*, ** | 0.48 | % | 0.73 | % | September 1, 2022 | ||||||||||
Global Atlantic BlackRock Disciplined International Core Portfolio*** | 0.74 | % | 0.99 | % | September 1, 2022 | ||||||||||
Global Atlantic BlackRock Disciplined Mid Cap Growth Portfolio* | 0.65 | % | 0.90 | % | September 1, 2022 | ||||||||||
Global Atlantic BlackRock Disciplined Value Portfolio | 0.56 | % | 0.81 | % | May 1, 2022 | ||||||||||
Global Atlantic BlackRock High Yield Portfolio | 0.61 | % | 0.86 | % | May 1, 2022 | ||||||||||
Global Atlantic Goldman Sachs Core Fixed Income Portfolio | 0.45 | % | N/A | May 1, 2022 | |||||||||||
* Effective August 20, 2021.
** The Portfolio is also subject to a Total Expense Limit of 0.48% and 0.73% for Class I and Class II shares, respectively, which includes Acquired Fund Fees and Expenses as defined in the Portfolio's prospectus, effective through August 31, 2022.
*** The Portfolio is also subject to a Total Expense Limit of 0.77% and 1.02% for Class I and Class II shares, respectively, which includes Acquired Fund Fees and Expenses as defined in the Portfolio's prospectus, effective through August 31, 2022.
In each case, the expense reimbursement is subject to possible recoupment from the Portfolio in future years on a rolling three year basis (within the three years after the fees have been waived or reimbursed) if such recoupment can be achieved within the lesser of the expense limits listed above and any expense limits applicable at the time of recoupment. The agreements may be terminated only by the Portfolio's Board of Trustees, on 60 days' written notice to the Adviser.
For the year ended December 31, 2021, the Adviser waived, reimbursed, or recaptured fees as follows:
| Investment Advisory Fee Waiver | Investment Advisory Fee Reimbursed* | Investment Advisory Fee Recaptured | Total | ||||||||||||||||
Global Atlantic BlackRock Allocation Portfolio | $ | 3,906 | $ | - | $ | - | $ | 3,906 | |||||||||||
Global Atlantic BlackRock Disciplined Core Portfolio | 26,103 | - | - | 26,103 | |||||||||||||||
Global Atlantic BlackRock Disciplined Growth Portfolio | 6,246 | 84 | - | 6,330 | |||||||||||||||
| Global Atlantic BlackRock Disciplined International Core Portfolio | 157,178 | 4,993 | - | 162,171 | |||||||||||||||
| Global Atlantic BlackRock Disciplined Mid Cap Growth Portfolio | 21,504 | 1,396 | - | 22,900 | |||||||||||||||
Global Atlantic BlackRock Disciplined Value Portfolio | 13,916 | - | - | 13,916 | |||||||||||||||
Global Atlantic BlackRock High Yield Portfolio | 4,298 | - | - | 4,298 | |||||||||||||||
Global Atlantic Goldman Sachs Core Fixed Income Portfolio | 8,039 | - | - | 8,039 | |||||||||||||||
* For additonal information on investment advisory fees reimbursed, please see Note 10, payments by affiliates.
If the Adviser waives any fee or reimburses any expense pursuant to the Waiver Agreements, and the Portfolio's operating expenses are subsequently less than the expense limitation, the Adviser shall be entitled to reimbursement by the Portfolio for such waived fees or reimbursed expenses provided that such reimbursement does not cause the Portfolio's expenses to exceed the amount of the expense limitation. If Portfolio operating expenses subsequently exceed the expense limitation, the reimbursements shall be suspended.
The Adviser may recapture the following amounts by the following dates:
December 31, 2022 | December 31, 2023 | December 31, 2024 | |||||||||||||
Global Atlantic BlackRock Allocation Portfolio | $ | 19,679 | $ | 14,847 | $ | 3,906 | |||||||||
Global Atlantic BlackRock Disciplined Core Portfolio | 93,032 | 107,215 | 26,103 | ||||||||||||
Global Atlantic BlackRock Disciplined Growth Portfolio | 10,039 | 14,202 | 6,246 | ||||||||||||
Global Atlantic BlackRock Disciplined International Core Portfolio | 48,584 | 186,121 | 157,178 | ||||||||||||
Global Atlantic BlackRock Disciplined Mid Cap Growth Portfolio | 55,910 | 68,221 | 21,503 | ||||||||||||
118
Global Atlantic Portfolios
Notes to Financial Statements (Continued)
December 31, 2021
December 31, 2022 | December 31, 2023 | December 31, 2024 | |||||||||||||
Global Atlantic BlackRock Disciplined Value Portfolio | $ | 49,384 | $ | 62,633 | $ | 13,916 | |||||||||
Global Atlantic BlackRock High Yield Portfolio | 22,317 | 16,144 | 4,298 | ||||||||||||
Global Atlantic Goldman Sachs Core Fixed Income Portfolio | 26,065 | 31,294 | 8,039 | ||||||||||||
The following amounts expired unrecouped as of the date listed below:
December 31, 2021 | |||||||
Global Atlantic BlackRock Allocation Portfolio | $ | 8,542 | |||||
Global Atlantic BlackRock Disciplined Core Portfolio | 50,540 | ||||||
Global Atlantic BlackRock Disciplined Growth Portfolio | 3,754 | ||||||
Global Atlantic BlackRock Disciplined International Core Portfolio | 9,810 | ||||||
Global Atlantic BlackRock Disciplined Mid Cap Growth Portfolio | 35,854 | ||||||
Global Atlantic BlackRock Disciplined Value Portfolio | 25,935 | ||||||
Global Atlantic BlackRock High Yield Portfolio | 8,365 | ||||||
Global Atlantic Goldman Sachs Core Fixed Income Portfolio | 9,926 | ||||||
On May 23, 2017, the U.S. Securities and Exchange Commission ("SEC") granted an order allowing Commonwealth Annuity and Life Insurance Company ("Commonwealth") to substitute certain variable investment options in which subaccounts of its Separate Accounts invest with the Portfolios included in this report.
As a condition of this order, the SEC required that Commonwealth or an affiliate thereof (other than the Trust) pay all expenses and transaction costs of the substitutions, including legal and accounting expenses, any applicable brokerage expenses and other fees and expenses so that no fees or charges were assessed to the affected contract owners to effect the substitutions. There were no substitution-related expenses for the year ended December 31, 2021.
The Trust, on behalf of the Portfolios, has adopted a distribution and shareholder servicing plan (the "Plan") pursuant to Rule 12b-1 under the 1940 Act for Class II shares. The fee charged under the Plan is calculated at an annual rate of 0.25% of the average daily net assets attributable to each Portfolio's Class II shares and, for the year ended December 31, 2021, was paid to Global Atlantic Distributors, LLC ("GAD") to provide compensation for ongoing distribution-related activities or services and/or maintenance of the Portfolios' shareholder accounts, not otherwise required to be provided by the Adviser. GAD is an affiliate of the Adviser.
For the year ended December 31, 2021, the Portfolios expensed the following distribution fees:
Fees Paid | |||||||
Global Atlantic BlackRock Allocation Portfolio | $ | 39,488 | |||||
Global Atlantic BlackRock Disciplined Core Portfolio | 96,736 | ||||||
Global Atlantic BlackRock Disciplined Growth Portfolio | 56,518 | ||||||
Global Atlantic BlackRock Disciplined International Core Portfolio | 118,273 | ||||||
Global Atlantic BlackRock Disciplined Mid Cap Growth Portfolio | 237,234 | ||||||
Global Atlantic BlackRock Disciplined Value Portfolio | 19,396 | ||||||
Global Atlantic BlackRock High Yield Portfolio | 2,007 | ||||||
Global Atlantic Goldman Sachs Core Fixed Income Portfolio | - | ||||||
For the year ended December 31, 2021, the Trustees received fees in the amounts as follows:
Fees Received | |||||||
Global Atlantic BlackRock Allocation Portfolio | $ | 6,810 | |||||
Global Atlantic BlackRock Disciplined Core Portfolio | 55,079 | ||||||
Global Atlantic BlackRock Disciplined Growth Portfolio | 3,960 | ||||||
Global Atlantic BlackRock Disciplined International Core Portfolio | 13,558 | ||||||
Global Atlantic BlackRock Disciplined Mid Cap Growth Portfolio | 22,496 | ||||||
Global Atlantic BlackRock Disciplined Value Portfolio | 22,798 | ||||||
Global Atlantic BlackRock High Yield Portfolio | 5,680 | ||||||
Global Atlantic Goldman Sachs Core Fixed Income Portfolio | 7,447 | ||||||
119
Global Atlantic Portfolios
Notes to Financial Statements (Continued)
December 31, 2021
5. CONTROL OWNERSHIP
The beneficial ownership, either directly or indirectly, of more than 25% of the voting securities of a Portfolio creates a presumption of the control of the Portfolio, under section 2(a)(9) of the 1940 Act. As of December 31, 2021, Commonwealth Annuity and Life Insurance Company owned 100% of the voting securities of each Portfolio. The Trust has no knowledge as to whether all or any portion of the shares owned of record are also owned beneficially.
Shareholder Concentration Risk – Commonwealth Annuity and Life Insurance Company, certain accounts, or the Adviser's affiliates may from time to time own (beneficially or of record) or control a significant percentage of a Portfolio's shares. Redemptions by these entities of their holdings in a Portfolio may impact the Portfolio's liquidity and NAV. These redemptions may also force a Portfolio to sell securities.
6. AGGREGATE UNREALIZED APPRECIATION AND DEPRECIATION – TAX BASIS
As of December 31, 2021, the aggregate cost of investments for federal income tax purposes, the gross unrealized appreciation and depreciation and the aggregated net unrealized appreciation (depreciation) on investments were as follows:
| Tax Cost | Gross Unrealized Appreciation | Gross Unrealized Depreciation | Net Unrealized Appreciation/ (Depreciation) | ||||||||||||||||
Global Atlantic BlackRock Allocation Portfolio | $ | 64,278,789 | $ | 14,074,837 | $ | (344,206 | ) | �� | $ | 13,730,631 | |||||||||
Global Atlantic BlackRock Disciplined Core Portfolio | 510,235,082 | 212,615,234 | (12,611,534 | ) | 200,003,700 | ||||||||||||||
Global Atlantic BlackRock Disciplined Growth Portfolio | 83,030,687 | 43,733,962 | (38,054,024 | ) | 5,679,938 | ||||||||||||||
| Global Atlantic BlackRock Disciplined International Core Portfolio | 152,928,454 | 31,332,109 | (16,710,017 | ) | 14,622,092 | ||||||||||||||
| Global Atlantic BlackRock Disciplined Mid Cap Growth Portfolio | 309,402,498 | 67,124,719 | (31,944,109 | ) | 35,180,610 | ||||||||||||||
Global Atlantic BlackRock Disciplined Value Portfolio | 237,814,575 | 46,724,412 | (4,649,832 | ) | 42,074,580 | ||||||||||||||
Global Atlantic BlackRock High Yield Portfolio | 62,097,796 | 2,498,091 | (346,060 | ) | 2,152,031 | ||||||||||||||
Global Atlantic Goldman Sachs Core Fixed Income Portfolio | 83,519,409 | 2,255,769 | (411,984 | ) | 1,843,785 | ||||||||||||||
7. DISTRIBUTIONS TO SHAREHOLDERS AND TAX COMPONENTS OF CAPITAL
The tax character of fund distributions paid for the years ended December 31, 2021 and 2020 were as follows:
| For fiscal year ended 12/31/2021 | Ordinary Income | Long-Term Capital Gains | Return of Capital | Total | |||||||||||||||
Global Atlantic BlackRock Allocation Portfolio | $ | 1,737,400 | �� | $ | 2,142,897 | $ | - | $ | 3,880,297 | ||||||||||
Global Atlantic BlackRock Disciplined Core Portfolio | 12,830,306 | 21,861,489 | - | 34,691,795 | |||||||||||||||
Global Atlantic BlackRock Disciplined Growth Portfolio | 699,793 | 1,173,202 | - | 1,872,995 | |||||||||||||||
| Global Atlantic BlackRock Disciplined International Core Portfolio | 2,551,441 | - | - | 2,551,441 | |||||||||||||||
| Global Atlantic BlackRock Disciplined Mid Cap Growth Portfolio | 6,491,316 | 17,190,734 | - | 23,682,050 | |||||||||||||||
Global Atlantic BlackRock Disciplined Value Portfolio | 3,594,121 | - | - | 3,594,121 | |||||||||||||||
Global Atlantic BlackRock High Yield Portfolio | 3,219,040 | - | - | 3,219,040 | |||||||||||||||
| Global Atlantic Goldman Sachs Core Fixed Income Portfolio | 4,071,545 | 1,756,085 | - | 5,827,630 | |||||||||||||||
| For fiscal year ended 12/31/2020 | Ordinary Income | Long-Term Capital Gains | Return of Capital | Total | |||||||||||||||
Global Atlantic BlackRock Allocation Portfolio | $ | 3,579,351 | $ | 1,661 | $ | - | $ | 3,581,012 | |||||||||||
Global Atlantic BlackRock Disciplined Core Portfolio | 17,282,042 | 14,099,837 | - | 31,381,879 | |||||||||||||||
Global Atlantic BlackRock Disciplined Growth Portfolio | 522,947 | 503,661 | - | 1,026,608 | |||||||||||||||
| Global Atlantic BlackRock Disciplined International Core Portfolio | 2,589,599 | - | - | 2,589,599 | |||||||||||||||
120
Global Atlantic Portfolios
Notes to Financial Statements (Continued)
December 31, 2021
| For fiscal year ended 12/31/2020 | Ordinary Income | Long-Term Capital Gains | Return of Capital | Total | |||||||||||||||
| Global Atlantic BlackRock Disciplined Mid Cap Growth Portfolio | $ | 5,422,684 | $ | 9,307,944 | $ | - | $ | 14,730,628 | |||||||||||
Global Atlantic BlackRock Disciplined Value Portfolio | 8,424,996 | 6,179,653 | - | 14,604,649 | |||||||||||||||
Global Atlantic BlackRock High Yield Portfolio | 3,704,548 | - | - | 3,704,548 | |||||||||||||||
| Global Atlantic Goldman Sachs Core Fixed Income Portfolio | 2,815,623 | 1,397,296 | - | 4,212,919 | |||||||||||||||
As of December 31, 2021, the components of accumulated earnings/(deficit) on a tax basis were as follows:
| Undistributed Ordinary Income | Undistributed Long-Term Capital Gains | Post-October Loss and Late Year Loss | Capital Loss Carryforward | Unrealized Appreciation/ (Depreciation) | Total Accumulated Earnings/ (Deficits) | ||||||||||||||||||||||
Global Atlantic BlackRock Allocation Portfolio | $ | 2,656,485 | $ | 5,617,663 | $ | - | $ | - | $ | 13,730,631 | $ | 22,004,779 | |||||||||||||||
| Global Atlantic BlackRock Disciplined Core Portfolio | 54,317,359 | 57,036,632 | - | - | 200,003,700 | 311,357,691 | |||||||||||||||||||||
| Global Atlantic BlackRock Disciplined Growth Portfolio | 4,216,620 | 10,935,545 | - | - | 5,679,938 | 20,832,103 | |||||||||||||||||||||
| Global Atlantic BlackRock Disciplined International Core Portfolio | 5,942,274 | 1,204,651 | - | (3,151,462 | ) | 14,622,092 | 18,617,555 | ||||||||||||||||||||
| Global Atlantic BlackRock Disciplined Mid Cap Growth Portfolio | 26,053,375 | 39,425,836 | - | - | 35,180,610 | 100,659,821 | |||||||||||||||||||||
| Global Atlantic BlackRock Disciplined Value Portfolio | 29,201,402 | 19,072,153 | - | - | 42,074,580 | 90,348,135 | |||||||||||||||||||||
Global Atlantic BlackRock High Yield Portfolio | 2,964,050 | - | - | (4,188,540 | ) | 2,152,031 | 927,541 | ||||||||||||||||||||
| Global Atlantic Goldman Sachs Core Fixed Income Portfolio | 1,342,237 | 84,853 | - | - | 1,843,785 | 3,270,875 | |||||||||||||||||||||
The difference between book basis and tax basis unrealized appreciation (depreciation), undistributed ordinary income (loss) and accumulated net realized gain (loss) from investments is primarily attributable to the tax deferral of losses on wash sales, return of capital distributions from C-Corporations, the mark-to-market on passive foreign investment companies, open 1256 options and futures contracts, forward foreign currency contracts and swaps. The unrealized appreciation (depreciation) in the table above includes unrealized foreign currency gains (losses) of $8,042 and $43 for Global Atlantic BlackRock Disciplined International Core Portfolio and Global Atlantic Goldman Sachs Core Fixed Income Portfolio, respectively.
At December 31, 2021, the Portfolios had capital loss carry forwards for federal income tax purposes available to offset future capital gains as follows:
| Non-Expiring Short-Term | Non-Expiring Long-Term | Total | |||||||||||||
Global Atlantic BlackRock Allocation Portfolio | $ | - | $ | - | $ | - | |||||||||
Global Atlantic BlackRock Disciplined Core Portfolio | - | - | - | ||||||||||||
Global Atlantic BlackRock Disciplined Growth Portfolio | - | - | - | ||||||||||||
Global Atlantic BlackRock Disciplined International Core Portfolio | - | 3,151,462 | 3,151,462 | ||||||||||||
Global Atlantic BlackRock Disciplined Mid Cap Growth Portfolio | - | - | - | ||||||||||||
Global Atlantic BlackRock Disciplined Value Portfolio | - | - | - | ||||||||||||
Global Atlantic BlackRock High Yield Portfolio | 2,443,866 | 1,744,674 | 4,188,540 | ||||||||||||
Global Atlantic Goldman Sachs Core Fixed Income Portfolio | - | - | - | ||||||||||||
During the year ended December 31, 2021, the following Portfolios utilized capital loss carryforwards:
Utilized | |||||||
Global Atlantic BlackRock Disciplined International Core Portfolio | $ | 11,207,030 | |||||
Global Atlantic BlackRock Disciplined Value Portfolio | 3,459,411 | ||||||
| Global Atlantic BlackRock High Yield Portfolio | 1,452,500 | ||||||
121
Global Atlantic Portfolios
Notes to Financial Statements (Continued)
December 31, 2021
Permanent book and tax differences, primarily attributable to the reclassification of Portfolio distributions, resulted in reclassifications for the Portfolios for the fiscal year ended December 31, 2021 as follows:
| Paid In Capital | Accumulated Earnings/(Losses) | ||||||||||
Global Atlantic BlackRock Disciplined Core Portfolio | $ | 70,038 | $ | (70,038 | ) | ||||||
Global Atlantic BlackRock Disciplined Growth Portfolio | 183,058 | (183,058 | ) | ||||||||
Global Atlantic BlackRock Disciplined International Core Portfolio | 57,835 | (57,835 | ) | ||||||||
Global Atlantic BlackRock Disciplined Mid Cap Growth Portfolio | 374,388 | (374,388 | ) | ||||||||
8. NEW ACCOUNTING PRONOUNCEMENTS
In March 2020, the FASB issued Accounting Standards Update No. 2020-04 ("ASU 2020-04"), "Reference Rate Reform (Topic 840): Facilitation of the Effects of Reference Rate Reform on Financial Reporting". ASU 2020-04 provides entities with optional guidance to ease the potential accounting burden associated with transitioning away from reference rates (e.g., LIBOR) that are expected to be discontinued. ASU 2020-04 allows, among other things, certain contract modifications to be accounted as a continuation of the existing contract. This ASU was effective upon the issuance and its optional relief can be applied through December 31, 2022. Management has reviewed the requirements and believes the adoption of this ASU will not have a material impact on the financial statements.
9. OTHER RISKS
The Portfolios' risks include, but are not limited to, the following:
Credit Risk – There is a risk that security issuers will not make interest and/or principal payments on their securities. In addition, the credit quality of securities may be lowered if an issuer's financial condition changes. Lower credit quality will lead to greater volatility in the price of a security and in shares of a Portfolio or an underlying fund. Lower credit quality also will affect liquidity and make it difficult to sell the security. This means that, compared to issuers of higher rated securities, issuers of lower rated securities are less likely to have the capacity to pay interest and repay principal when due in the event of adverse business, financial or economic conditions and/or may be in default or not current in the payment of interest or principal. Default, or the market's perception that an issuer is likely to default, tends to reduce the value and liquidity of fixed income securities, thereby reducing the value of your investment in Portfolio shares. In addition, default may cause a Portfolio to directly or indirectly incur expenses in seeking recovery of principal or interest.
A Portfolio could lose money on a debt security if an issuer or borrower is unable or fails to meet its obligations, including failing to make interest payments and/or to repay principal when due. Changes in an issuer's financial strength, the market's perception of the issuer's financial strength or in a security's credit rating, which reflects a third party's assessment of the credit risk presented by a particular issuer, may affect debt securities' value. A Portfolio may incur substantial losses on debt securities that are inaccurately perceived to present a different amount of credit risk by the market, the Sub-Adviser or the rating agencies than such securities actually do.
Derivatives Risk – The use of derivatives is a highly specialized activity that involves investment techniques and risks different from those associated with investments in more traditional securities and instruments. The use of derivatives may increase costs, reduce a Portfolio's returns and/or increase volatility. Volatility is defined as the characteristic of a security, an index or a market to fluctuate significantly in price within a short time period. Many types of derivatives are also subject to counterparty risk, which is the risk that the other party in the transaction will not fulfill its contractual obligation. A risk of a Portfolio's use of derivatives is that the fluctuations in their values may not correlate perfectly with, and may be more sensitive to market events than, the overall securities markets. The possible lack of a liquid secondary market for derivatives and the resulting inability to sell or otherwise close-out a derivatives position at an advantageous time or price could expose a Portfolio to losses and could make derivatives more difficult to value accurately. Derivatives typically give rise to a form of leverage and may expose a Portfolio to greater risk and increase its costs. The Dodd-Frank Wall Street Reform and Consumer Protection Act (the "Dodd-Frank Act") and related regulatory developments require the clearing and exchange-trading of many standardized over-the-counter ("OTC") derivative instruments deemed to be "swaps." The Commodity Futures Trading Commission ("CFTC") has implemented mandatory exchange-trading and clearing requirements under the Dodd-Frank Act and the CFTC continues to approve contracts for central clearing. Uncleared swaps are subject to margin requirements that
122
Global Atlantic Portfolios
Notes to Financial Statements (Continued)
December 31, 2021
are being implemented on a phase-in basis. In addition, the SEC recently adopted Rule 18f-4 under the 1940 Act which will regulate the use of derivatives for certain investment companies (the "Derivatives Rule"). The Derivatives Rule will require, among other things, that certain entities adopt a derivatives risk management program, comply with limitations on leveraged- related risk based on a relative "value-at-risk" test and update reporting and disclosure procedures. Although the full impact of the Derivatives Rule on the Portfolios remains uncertain, these requirements may limit the ability of a Portfolio to use derivatives, short sales, and reverse repurchase agreements and similar financing transactions as part of its investment strategies, as well as increase a Portfolio's expenses. Compliance with Rule 18f-4 will be required by August 2022. The regulation of the derivatives markets has increased over the past several years, and there can be no assurance that any new governmental regulation will not adversely affect a Portfolio's ability to achieve its investment result.
Exchange-Traded Funds Risk – The Portfolios may invest in passive ETFs. An ETF is a type of index fund that is bought and sold on a securities exchange. An ETF trades like common stock and represents a fixed portfolio of securities designed to track the performance and dividend yield of a particular domestic or foreign market index. A Portfolio may purchase an ETF to gain exposure to a portion of the U.S. or a foreign market while awaiting an opportunity to purchase securities directly. The risks of owning an ETF generally reflect the risks of owning the underlying securities it is designed to track, although lack of liquidity in an ETF could result in it being more volatile than the underlying securities, which may result in a Portfolio paying significantly more or receiving significantly less for ETF shares than the value of the relevant underlying securities. Additionally, an ETF has fees and expenses that increase the cost of investing in the ETF versus the costs of owning the underlying securities directly.
Market Risk – The market prices of securities may go up or down, sometimes rapidly or unpredictably, due to general market conditions, such as real or perceived adverse economic or political conditions, inflation, changes in interest rates or currency rates, limited dealer capacity, lack of liquidity in the markets or adverse investor sentiment. Each Portfolio has exposure to instruments that may be more volatile and carry more risk than some other forms of investment. Adverse market conditions may be prolonged and may not have the same impact on all types of securities. Market prices of securities also may go down due to events or conditions that affect particular sectors, industries or issuers. When market prices fall, the value of your investment will go down. Local, regional or global events such as war, acts of terrorism, the spread of infectious illness or other public health issues, natural disasters, recessions, or other events could also have a significant impact on the Portfolio and its investments. The market prices of securities may also be negatively impacted by trading activity and investor interest, including interest driven by factors unrelated to market conditions or financial performance. In these circumstances, the value of the Portfolio's investments, particularly any short positions or exposures, may fluctuate dramatically.
A Portfolio may experience a substantial or complete loss on any individual security. Since the global financial crisis that began in 2008, the U.S. and many foreign economies continue to experience its after-effects, which have resulted, and may continue to result, in slower growth and an unusually high degree of volatility in the financial markets, both domestic and foreign. Changes in the U.S. and governmental market support activities implemented since the financial crisis could negatively affect the markets generally and increase market volatility. This could reduce the value and liquidity of the securities in which the Portfolio invests and make identifying investment risks and opportunities especially difficult.
Policy and legislative changes in the U.S. and abroad affect many aspects of financial regulation and may, in some cases, contribute to decreased liquidity and increased volatility in the financial markets. Economies and financial markets around the world are becoming increasingly interconnected. As a result, whether or not a Portfolio has exposure to securities of issuers located in or with significant exposure to countries experiencing economic and financial difficulties, the value and liquidity of the Portfolio's investments may be negatively affected.
In addition, market prices of securities in broad market segments may be adversely affected by a prominent issuer having experienced losses or by the lack of earnings or such an issuer's failure to meet the market's expectations with respect to new products or services, or even by factors wholly unrelated to the value or condition of the issuer, such as changes in interest rates. An increase in interest rates or other adverse conditions (e.g., inflation/deflation, increased selling of fixed income investments across other pooled investment vehicles or accounts, changes in investor perception or changes in government intervention in the markets) may lead to increased redemptions and increased portfolio turnover, which could reduce liquidity for certain Portfolio investments, adversely affect values of portfolio holdings and increase a Portfolio's costs. If dealer capacity in fixed income markets is insufficient for market conditions, this has the potential to further inhibit liquidity and increase volatility in the fixed income markets. The spread of an infectious respiratory illness caused by a novel strain of coronavirus (known as "COVID-19") has caused volatility, severe market dislocations and liquidity constraints in many
123
Global Atlantic Portfolios
Notes to Financial Statements (Continued)
December 31, 2021
markets, including markets for the securities the Portfolios hold, and may adversely affect the Portfolios' investments and operations. The transmission of COVID-19 and efforts to contain its spread could lead to a significant economic downturn or recession, increased market volatility, a greater number of market closures, higher default rates and adverse effects on the values and liquidity of securities or other assets. Such impacts, which may vary across asset classes, may adversely affect the performance of the Portfolios. In certain cases, an exchange or market may close or issue trading halts on specific securities or even the entire market, which may result in the Portfolios being, among other things, unable to buy or sell certain securities or financial instruments or to accurately price their investments.
Quantitative Investing Risk – Investments selected using quantitative analysis or "models" may perform differently than expected as a result of the factors used in the models, the weight placed on each factor, changes from the factors' historical trends, and technical issues in the construction and implementation of the models (including, for example, data problems and/or software issues). In addition, investments selected using models may react differently to issuer, political, market, and economic developments from the market as a whole or securities selected using only fundamental analysis. There is no guarantee that the use of quantitative analysis will result in effective investment decisions for a Portfolio. Additionally, commonality of holdings across quantitative money managers may amplify losses.
10. PAYMENTS BY AFFILIATES
During the year ended December 31, 2021, in connection with the Reorganization (as defined below), the Adviser voluntarily reimbursed the Global Atlantic BlackRock Disciplined Growth Portfolio $1,818, the Global Atlantic BlackRock Disciplined International Core Portfolio $5,512, and the Global Atlantic BlackRock Disciplined Mid Cap Growth Portfolio $35,255 for brokerage commissions incurred. Additionally, the Adviser voluntarily reimbursed the Global Atlantic BlackRock Disciplined Growth Portfolio $84, the Global Atlantic BlackRock Disciplined International Core Portfolio $4,993, and the Global Atlantic BlackRock Disciplined Mid Cap Growth Portfolio $1,396 for custody transaction fees incurred. The dollar amounts of the voluntary custody transaction fee reimbursement are included in the statements of operations as expenses waived / reimbursed and are not available to be recouped by the Adviser.
11. OTHER RECENT DEVELOPMENTS
Ongoing concerns regarding the economies of certain countries in Europe, as well as the possibility that one or more countries could leave the European Union (the "EU"), create risks for investing in the European markets. These risks may be heightened due to the June 2016 referendum in which the United Kingdom ("UK") voted to exit the EU (commonly known as "Brexit"). On January 31, 2020, the UK withdrew from the EU. This commenced a transition period that lasted until December 31, 2020. On December 30, 2020, the EU and UK signed the EU-UK Trade and Cooperation Agreement ("TCA"), an agreement on the terms governing certain aspects of the EU's and the UK's relationship following the end of the transition period. Notwithstanding the TCA, there is likely to be considerable uncertainty as to the UK's post-transition framework. The full impact of Brexit on the UK and EU economies and the broader global economy is not yet known. The impact could be significant and could, among other outcomes, result in increased volatility and illiquidity, potentially lower economic growth and decreased asset valuations. Brexit may have a destabilizing impact on the EU to the extent other member states similarly seek to withdraw from the union. Brexit may also have a negative impact on the economy and currency of the UK as a result of anticipated, or actual changes to the UK's economic and political relations with the EU. Any or all of these challenges may affect the value of a Portfolio's investments economically tied to the UK or the EU.
On March 5, 2021, the United Kingdom's Financial Conduct Authority ("FCA") and ICE Benchmark Authority formally announced the dates after which the LIBORs will no longer be representative and subsequently cease publication. Certain LIBORs ceased publication on December 31, 2021, and others will cease publication after June 30, 2023. The unavailability or replacement of LIBOR presents risks to applicable Portfolios, including the risk that any pricing adjustments to a Portfolio's investments resulting from a substitute reference rate may adversely affect the Portfolio's performance and/or NAV. The impact of a substitute reference rate, if any, will vary on an investment-by-investment basis. The Adviser or Sub- Adviser may have discretion to determine a substitute reference rate, including any price or other adjustments to account for differences between the substitute reference rate and the previous rate. The substitute reference rate and any adjustments selected could negatively impact a Portfolio's investment performance or financial condition, including in ways unforeseen by the Adviser or Sub-Adviser.
124
Global Atlantic Portfolios
Notes to Financial Statements (Continued)
December 31, 2021
In addition, the current ongoing outbreak of COVID-19, a respiratory illness caused by a novel strain of coronavirus has caused volatility, severe market dislocations and liquidity constraints in many markets, including markets for the securities the Portfolios hold, and may adversely affect the Portfolios' investments and operations. The transmission of COVID-19 and efforts to contain its spread have resulted in, among other things: quarantines and travel restrictions, including border closings, strained healthcare systems, event cancellations, disruptions to business operations and supply chains, and a reduction in consumer and business spending, as well as general concern and uncertainty that has negatively affected the economy. These disruptions have led to instability in the market place, including equity and debt market losses and overall volatility, and the jobs market. The impact of COVID-19, and other infectious illness outbreaks, epidemics or pandemics that may arise in the future, could adversely affect the economies of many nations or the entire global economy, the financial well-being and performance of individual issuers, borrowers and sectors and the health of the markets generally in potentially significant and unforeseen ways. In addition, the impact of infectious illnesses, such as COVID-19, in emerging market countries may be greater due to generally less established healthcare systems. The COVID-19 crisis or other public health crises may exacerbate other pre-existing political, social and economic risks in certain countries or globally.
12. OTHER MATTERS
On February 1, 2021, Global Atlantic Financial Group Limited (together with its subsidiaries, "Global Atlantic") was acquired by KKR & Co. Inc (the "Transaction"). Under the 1940 Act, the Transaction resulted in the automatic termination of the existing: (i) investment advisory agreement between the Adviser and the Trust on behalf of each Portfolio; (ii) sub-advisory agreements between the Adviser, the sub- advisers and the Trust on behalf of each applicable Portfolio; and (iii) underwriting agreement between GAD and the Trust on behalf of the Portfolios (collectively, the "Existing Agreements").
At a meeting held on September 22, 2020, the Board, including all of the Trustees who are not "interested persons," as that term is defined in the 1940 Act, unanimously voted to approve each of the following to become effective upon the closing of the Transaction: (i) a new investment advisory agreement between the Adviser and the Trust on behalf of each Portfolio ("New Advisory Agreement"); (ii) new sub-advisory agreements between the Adviser, the sub-advisers and the Trust on behalf of each applicable Portfolio ("New Sub-Advisory Agreements"); and (iii) a new underwriting agreement between GAD and the Trust on behalf of each Portfolio (collectively , the "New Agreements").
The New Advisory Agreement and New Sub-Advisory Agreements were also subject to shareholder approval. At a special meeting of shareholders held on November 23, 2020, the New Advisory Agreement and New Sub-Advisory Agreements were approved by the shareholders of each Portfolio. The New Agreements took effect on February 1, 2021.
13. REORGANIZATION
At a meeting held on May 4, 2021, the Board of the Trust approved an Agreement and Plan of Reorganization (the "Plan") that provides for the reorganization of each Acquired Portfolio identified below (each an "Acquired Portfolio") into the corresponding Acquiring Portfolio identified below (each an "Acquiring Portfolio") (each a "Reorganization" and collectively, the "Reorganizations"). The purpose of the Reorganizations was to combine portfolios with the same investment objectives and fundamental investment policies. Each Reorganization occurred after the close of business on August 20, 2021.
Acquired Portfolio | Corresponding Acquiring Portfolio | ||||||
Global Atlantic BlackRock Disciplined Small Cap Portfolio | Global Atlantic BlackRock Disciplined Mid Cap Growth | ||||||
Portfolio | |||||||
Global Atlantic Goldman Sachs Mid Cap Value Insights | Global Atlantic BlackRock Disciplined Mid Cap Growth | ||||||
Portfolio | Portfolio | ||||||
Global Atlantic BlackRock Disciplined U.S. Core Portfolio | Global Atlantic BlackRock Disciplined Core Portfolio | ||||||
Global Atlantic Goldman Sachs Global Equity Insights | Global Atlantic BlackRock Disciplined International Core | ||||||
Portfolio | Portfolio | ||||||
Global Atlantic Goldman Sachs Large Cap Growth | |||||||
Insights Portfolio | Global Atlantic BlackRock Disciplined Growth Portfolio | ||||||
Pursuant to the terms of the Plan, after the close of business on August 20, 2021, each Acquired Portfolio transferred all of its assets to the corresponding Acquiring Portfolio, in exchange for shares of the corresponding Acquiring Portfolio and the assumption of all of the liabilities of the Acquired Portfolio by the corresponding Acquiring Portfolio.
125
Global Atlantic Portfolios
Notes to Financial Statements (Continued)
December 31, 2021
After the close of business on August 20, 2021, the consummation of each Reorganization was accomplished by a tax-free exchange of shares of each Acquiring Portfolio in the following amounts:
| Acquired Portfolio Name/ Share Class Name | Acquired Portfolio Net Assets | Acquired Portfolio Shares Outstanding | Acquiring Portfolio Name/ Share Class Name | Acquiring Portfolio Net Assets | Acquiring Portfolio Shares Outstanding | Net Assets Post Reorganization | Shares Outstanding Post Reorganization | ||||||||||||||||||||||||
Global Atlantic BlackRock Disciplined Small Cap Portfolio Class I | $ | 9,709,098 | 828,401 | Global Atlantic BlackRock Disciplined Mid Cap Growth Portfolio Class I | $ | 166,344,270 | 8,977,361 | 176,053,368 | 9,501,348 | ||||||||||||||||||||||
Global Atlantic BlackRock Disciplined Small Cap Portfolio Class II | 9,060,416 | 773,134 | Global Atlantic BlackRock Disciplined Mid Cap Growth Portfolio Class II | 63,417,068 | 3,430,265 | 72,477,484 | 3,920,349 | ||||||||||||||||||||||||
Global Atlantic Goldman Sachs Mid Cap Value Insights Portfolio Class I | 45,428,775 | 4,024,126 | Global Atlantic BlackRock Disciplined Mid Cap Growth Portfolio Class I | 166,344,270 | 8,977,361 | 211,773,045 | 11,429,087 | ||||||||||||||||||||||||
Global Atlantic Goldman Sachs Mid Cap Value Insights Portfolio Class II | 80,843,019 | 7,170,940 | Global Atlantic BlackRock Disciplined Mid Cap Growth Portfolio Class II | 63,417,068 | 3,430,265 | 144,260,087 | 7,803,113 | ||||||||||||||||||||||||
Global Atlantic BlackRock Disciplined U.S. Core Portfolio Class I | 23,443,474 | 1,769,184 | Global Atlantic BlackRock Disciplined Core Portfolio Class I | 632,960,015 | 38,005,570 | 656,403,489 | 39,413,213 | ||||||||||||||||||||||||
Global Atlantic BlackRock Disciplined U.S. Core Portfolio Class II | 4,453,624 | 336,517 | Global Atlantic BlackRock Disciplined Core Portfolio Class II | 37,550,691 | 2,261,392 | 42,004,315 | 2,529,601 | ||||||||||||||||||||||||
Global Atlantic Goldman Sachs Global Equity Insights Portfolio Class I | 15,500,428 | 1,226,678 | Global Atlantic BlackRock Disciplined International Core Portfolio Class I | 106,197,582 | 9,263,537 | 121,698,010 | 10,615,633 | ||||||||||||||||||||||||
Global Atlantic Goldman Sachs Global Equity Insights Portfolio Class II | 13,207,380 | 1,046,133 | Global Atlantic BlackRock Disciplined International Core Portfolio Class II | 41,333,839 | 3,615,693 | 54,541,219 | 4,771,007 | ||||||||||||||||||||||||
Global Atlantic Goldman Sachs Large Cap Growth Insights Portfolio Class I | 97,015,184 | 6,505,658 | Global Atlantic BlackRock Disciplined Growth Portfolio Class I* | - | - | 97,015,184 | 5,160,728 | ||||||||||||||||||||||||
Global Atlantic Goldman Sachs Large Cap Growth Insights Portfolio Class II | 6,398,918 | 429,990 | Global Atlantic BlackRock Disciplined Growth Portfolio Class II | 20,329,976 | 1,081,454 | 26,728,894 | 1,421,845 | ||||||||||||||||||||||||
* Global Atlantic BlackRock Disciplined Growth Portfolio Class I commenced operations with the reorganization.
The following shares were exchanged in connection with the reorganization:
Acquiring Portfolio | Class | New Shares | |||||||||
Global Atlantic BlackRock Disciplined Mid Cap Growth Portfolio | I | $ | 523,987 | ||||||||
Global Atlantic BlackRock Disciplined Mid Cap Growth Portfolio | II | 490,084 | |||||||||
Global Atlantic BlackRock Disciplined Mid Cap Growth Portfolio | I | 2,451,726 | |||||||||
Global Atlantic BlackRock Disciplined Mid Cap Growth Portfolio | II | 4,372,848 | |||||||||
Global Atlantic BlackRock Disciplined Core Portfolio | I | 1,407,644 | |||||||||
Global Atlantic BlackRock Disciplined Core Portfolio | II | 268,209 | |||||||||
Global Atlantic BlackRock Disciplined International Core Portfolio | I | 1,352,096 | |||||||||
Global Atlantic BlackRock Disciplined International Core Portfolio | II | 1,155,314 | |||||||||
Global Atlantic BlackRock Disciplined Growth Portfolio | I | 5,160,728 | |||||||||
Global Atlantic BlackRock Disciplined Growth Portfolio | II | 340,391 | |||||||||
126
Global Atlantic Portfolios
Notes to Financial Statements (Continued)
December 31, 2021
On the reorganization date, each Acquired Portfolio had the following total investment cost and value, representing the principal assets acquired by the corresponding Acquiring Portfolio:
Acquired Portfolios | Total Investment Value | Total Investment Cost | Unrealized Appreciation (Depreciation) on Investments | ||||||||||||
Global Atlantic BlackRock Disciplined Small Cap Portfolio | $ | 18,741,057 | $ | 15,779,515 | $ | 2,961,542 | |||||||||
Global Atlantic Goldman Sachs Mid Cap Value Insights Portfolio | 126,185,095 | 112,955,014 | 13,230,081 | ||||||||||||
Global Atlantic BlackRock Disciplined U.S. Core Portfolio | 27,882,029 | 20,642,968 | 7,239,061 | ||||||||||||
Global Atlantic Goldman Sachs Global Equity Insights Portfolio | 28,519,829 | 22,738,416 | 5,781,413 | ||||||||||||
| Global Atlantic Goldman Sachs Large Cap Growth Insights Portfolio | 104,246,809 | 67,518,995 | 36,727,814 | ||||||||||||
For financial reporting purposes, assets received and shares issued by an Acquiring Fund were recorded at fair value; however, the cost basis of the investments received from an Acquired Portfolio were carried forward to reflect the tax-free status of the acquisition.
The net assets and net unrealized appreciation (depreciation) immediately before the acquisition were as follows:
Acquired Portfolios | Class | Acquired Portfolios | Acquiring Portfolios | Class | |||||||||||||||||||||||
Net Assets | Unrealized Appreciation (Depreciation) on Investments | Net Assets | |||||||||||||||||||||||||
Global Atlantic BlackRock Disciplined Small Cap Portfolio | I | $ | 9,709,098 | $ | 1,522,944 | Global Atlantic BlackRock Disciplined Mid Cap Growth Portfolio | I | $ | 166,344,270 | ||||||||||||||||||
Global Atlantic BlackRock Disciplined Small Cap Portfolio | II | 9,060,416 | 1,438,598 | Global Atlantic BlackRock Disciplined Mid Cap Growth Portfolio | II | 63,417,068 | |||||||||||||||||||||
Global Atlantic Goldman Sachs Mid Cap Value Insights Portfolio | I | 45,428,775 | 4,709,765 | Global Atlantic BlackRock Disciplined Mid Cap Growth Portfolio | I | 166,344,270 | |||||||||||||||||||||
Global Atlantic Goldman Sachs Mid Cap Value Insights Portfolio | II | 80,843,019 | 8,520,316 | Global Atlantic BlackRock Disciplined Mid Cap Growth Portfolio | II | 63,417,068 | |||||||||||||||||||||
Global Atlantic BlackRock Disciplined U.S. Core Portfolio | I | 23,443,474 | 6,161,895 | Global Atlantic BlackRock Disciplined Core Portfolio | I | 632,960,015 | |||||||||||||||||||||
Global Atlantic BlackRock Disciplined U.S. Core Portfolio | II | 4,453,624 | 1,077,166 | Global Atlantic BlackRock Disciplined Core Portfolio | II | 37,550,691 | |||||||||||||||||||||
Global Atlantic Goldman Sachs Global Equity Insights Portfolio | I | 15,500,428 | 3,460,777 | Global Atlantic BlackRock Disciplined International Core Portfolio | I | 106,197,582 | |||||||||||||||||||||
Global Atlantic Goldman Sachs Global Equity Insights Portfolio | II | 13,207,380 | 2,320,636 | Global Atlantic BlackRock Disciplined International Core Portfolio | II | 41,333,839 | |||||||||||||||||||||
Global Atlantic Goldman Sachs Large Cap Growth Insights Portfolio | I | 97,015,184 | 34,899,540 | Global Atlantic BlackRock Disciplined Growth Portfolio | I | - | |||||||||||||||||||||
Global Atlantic Goldman Sachs Large Cap Growth Insights Portfolio | II | 6,398,918 | 1,828,274 | Global Atlantic BlackRock Disciplined Growth Portfolio | II | 20,329,976 | |||||||||||||||||||||
The financial statements reflect the operations of the Acquiring Portfolios for the period prior to the acquisition and the combined portfolios for the period subsequent to the portfolio mergers. Assuming the acquisition had been completed on
127
Global Atlantic Portfolios
Notes to Financial Statements (Continued)
December 31, 2021
January 1, 2021, the Acquiring Portfolios unaudited pro formas results of operations for the year ended December 31, 2021 would have been as follows:
| Acquiring Portfolios | Net Investment Income | Net Realized and Unrealized Gain (Loss) on Investments | Net Increase in Net Assets Resulting from Operations | ||||||||||||
| Global Atlantic BlackRock Disciplined Core Portfolio | $ | 5,334,121 | $ | 165,591,943 | $ | 170,926,064 | |||||||||
| Global Atlantic BlackRock Disciplined Growth Portfolio | 231,074 | 31,333,516 | 31,564,591 | ||||||||||||
| Global Atlantic BlackRock Disciplined International Core Portfolio | 3,071,630 | 14,443,303 | 17,514,933 | ||||||||||||
| Global Atlantic BlackRock Disciplined Mid Cap Growth Portfolio | 1,002,013 | 57,985,562 | 58,987,575 | ||||||||||||
Since the combined investment Porfolios have been managed as a single integrated portfolio since the acquisition was completed, it is also not practicable to separate the amounts of revenue and earnings of the Acquired Portfolios that have been included in the Acquiring Portfolio's Statements of Operations since August 20, 2021.
Since both the Acquired Portfolios and the Acquiring Portfolios sold and redeemed shares throughout the period, it is not practicable to provide pro-forma information on a per-share basis.
14. SUBSEQUENT EVENTS
The Portfolios evaluated subsequent events from December 31, 2021 through the date these financial statements were issued. There were no significant events that would have a material impact on the Portfolios' financial statements.
128
Report of Independent Registered Public Accounting Firm
To the Board of Trustees of Forethought Variable Insurance Trust
And the Shareholders of each of the Separate Series of Forethought Variable Insurance Trust
Opinion on the Financial Statements
We have audited the accompanying statements of assets and liabilities of Global Atlantic BlackRock Allocation Portfolio, Global Atlantic BlackRock Disciplined Core Portfolio, Global Atlantic BlackRock Disciplined Growth Portfolio, Global Atlantic BlackRock International Core Portfolio, Global Atlantic BlackRock Disciplined Mid Cap Growth Portfolio, Global Atlantic BlackRock Disciplined Value Portfolio, Global Atlantic BlackRock High Yield Portfolio, and Global Atlantic Goldman Sachs Core Fixed Income Portfolio (collectively, the Portfolios), including the schedules of investments, as of December 31, 2021, the related statements of operations for the year then ended, the statements of changes in net assets for each of the two years in the period then ended, and the related notes to the financial statements (collectively, the financial statements), and the financial highlights for each of the four years in the period then ended and for the period November 6, 2017 (commencement of operations) through December 31, 2017. In our opinion, the financial statements and financial highlights present fairly, in all material respects, the financial position of each of the portfolios as of December 31, 2021, the results of their operations for the year then ended, the changes in net assets for each of the two years in the period then ended, and the financial highlights for each of the four years in the period then ended and for the period from November 6, 2017 (commencement of operations) through December 31, 2017, in conformity with accounting principles generally accepted in the United States of America.
Basis for Opinion
These financial statements are the responsibility of the Portfolios' management. Our responsibility is to express an opinion on the Portfolios' financial statements and financial highlights based on our audits. We are a public accounting firm registered with the Public Company Accounting Oversight Board (United States) (PCAOB) and are required to be independent with respect to the Portfolios in accordance with U.S. federal securities laws and the applicable rules and regulations of the Securities and Exchange Commission and the PCAOB.
We conducted our audits in accordance with the standards of the PCAOB. Those standards require that we plan and perform the audits to obtain reasonable assurance about whether the financial statements are free of material misstatement, whether due to error or fraud. The Portfolios not required to have, nor were we engaged to perform, an audit of their internal control over financial reporting. As part of our audits, we are required to obtain an understanding of internal control over financial reporting but not for the purpose of expressing an opinion on the effectiveness of the Portfolios' internal control over financial reporting. Accordingly, we express no such opinion.
Our audits included performing procedures to assess the risks of material misstatement of the financial statements, whether due to error or fraud, and performing procedures that respond to those risks. Such procedures included examining, on a test basis, evidence regarding the amounts and disclosures in the financial statements. Our procedures included confirmation of investments owned as of December 31, 2021, by correspondence with the custodians and brokers or by other appropriate auditing procedures where replies from custodians or brokers were not received. Our audits also included evaluating the accounting principles used and significant estimates made by management, as well as evaluating the overall presentation of the financial statements. We believe that our audits provide a reasonable basis for our opinion.
/s/ RSM US LLP
We have served as the auditor of one or more investment companies advised by Global Atlantic Investment Advisors, LLC since 2013.
Denver, Colorado
February 23, 2022
129
Global Atlantic Portfolios
Expense Examples
December 31, 2021 (Unaudited)
As a shareholder of the Portfolios, you incur ongoing costs, including management fees; distribution and/or service (12b-1) fees; and other Portfolio expenses. This example is intended to help you understand your ongoing costs (in dollars) of investing in each Portfolio and to compare these costs with the ongoing costs of investing in other mutual funds.
The example is based on an investment of $1,000 invested at the beginning of the period and held for the entire period from July 1, 2021 through December 31, 2021.
Actual Expenses
The "Actual" expenses set of columns in the table below provides information about actual account values and actual expenses. You may use the information below together with the amount you invested, to estimate the expenses that you paid over the period. Simply divide your account value by $1,000 (for example, an $8,600 account value divided by $1,000 = 8.6), then multiply the result by the number in the table under the heading entitled "Expenses Paid During Period" to estimate the expenses you paid on your account during this period.
Hypothetical Example for Comparison Purposes
The "Hypothetical" expenses set of columns in the table below provides information about hypothetical account values and hypothetical expenses based on each Portfolio's actual expense ratio and an assumed rate of return of 5% per year before expenses, which is not the Portfolio's actual return. The hypothetical account values and expenses may not be used to estimate the actual ending account balances or expenses you paid for the period. You may use this information to compare this 5% hypothetical example for a specific Portfolio with the 5% hypothetical examples that appear in the shareholder reports of other funds.
Please note that the expenses shown in the table are meant to highlight your ongoing costs only and do not reflect any transactional costs, such as sales charges (loads), or redemption fees or other expenses charged by your insurance contract or separate account. Therefore, the Hypothetical columns of the table are useful in comparing ongoing costs only, and will not help you determine the relative total costs of owning different funds. In addition, if these transactional costs were included, your costs would have been higher.
Actual | Hypothetical (5% return before expenses) | ||||||||||||||||||||||||||||||
Class | Portfolio's Annualized Expense Ratio | Beginning Account Value 7-1-21 | Ending Account Value 12-31-21 | Expenses Paid During Period* | Ending Account Value 12-31-21 | Expenses Paid During Period* | |||||||||||||||||||||||||
| Global Atlantic BlackRock Allocation Portfolio | I | 0.32 | % | $ | 1,000 | $ | 1,038.30 | $ | 1.64 | $ | 1,023.59 | $ | 1.63 | ||||||||||||||||||
| Global Atlantic BlackRock Allocation Portfolio | II | 0.57 | % | $ | 1,000 | $ | 1,036.90 | $ | 2.93 | $ | 1,022.33 | $ | 2.91 | ||||||||||||||||||
| Global Atlantic BlackRock Disciplined Core Portfolio | I | 0.49 | % | $ | 1,000 | $ | 1,115.20 | $ | 2.61 | $ | 1,022.74 | $ | 2.50 | ||||||||||||||||||
| Global Atlantic BlackRock Disciplined Core Portfolio | II | 0.74 | % | $ | 1,000 | $ | 1,114.30 | $ | 3.94 | $ | 1,021.48 | $ | 3.77 | ||||||||||||||||||
| Global Atlantic BlackRock Disciplined Growth Portfolio | I | 0.48 | % | $ | 1,000 | $ | 1,091.20 | $ | 1.83 | ** | $ | 1,022.79 | $ | 2.45 | ** | ||||||||||||||||
| Global Atlantic BlackRock Disciplined Growth Portfolio | II | 0.75 | % | $ | 1,000 | $ | 1,126.00 | $ | 4.02 | $ | 1,021.42 | $ | 3.82 | ||||||||||||||||||
* Expenses are equal to the Portfolio's annualized expense ratio, multiplied by the number of days in the period (184) divided by the number of days in the fiscal year (365).
** Actual expense is equal to the Portfolio's annualized expense ratio, multiplied by the number of days in the period (133) divided by the number of days in the fiscal year (365) to reflect the period from August 20, 2021 (commencement of operations) to December 31, 2021.
130
Global Atlantic Portfolios
Expense Examples (Continued)
December 31, 2021 (Unaudited)
Actual | Hypothetical (5% return before expenses) | ||||||||||||||||||||||||||||||
Class | Portfolio's Annualized Expense Ratio | Beginning Account Value 7-1-21 | Ending Account Value 12-31-21 | Expenses Paid During Period* | Ending Account Value 12-31-21 | Expenses Paid During Period* | |||||||||||||||||||||||||
| Global Atlantic BlackRock Disciplined International Core Portfolio | I | 0.73 | % | $ | 1,000 | $ | 987.90 | $ | 3.66 | $ | 1,021.53 | $ | 3.72 | ||||||||||||||||||
| Global Atlantic BlackRock Disciplined International Core Portfolio | II | 0.98 | % | $ | 1,000 | $ | 986.70 | $ | 4.91 | $ | 1,020.27 | $ | 4.99 | ||||||||||||||||||
| Global Atlantic BlackRock Disciplined Mid Cap Growth Portfolio | I | 0.64 | % | $ | 1,000 | $ | 1,020.40 | $ | 3.26 | $ | 1,021.98 | $ | 3.26 | ||||||||||||||||||
| Global Atlantic BlackRock Disciplined Mid Cap Growth Portfolio | II | 0.89 | % | $ | 1,000 | $ | 1,019.00 | $ | 4.53 | $ | 1,020.72 | $ | 4.53 | ||||||||||||||||||
| Global Atlantic BlackRock Disciplined Value Portfolio | I | 0.55 | % | $ | 1,000 | $ | 1,078.00 | $ | 2.88 | $ | 1,022.43 | $ | 2.80 | ||||||||||||||||||
| Global Atlantic BlackRock Disciplined Value Portfolio | II | 0.80 | % | $ | 1,000 | $ | 1,076.90 | $ | 4.19 | $ | 1,021.17 | $ | 4.08 | ||||||||||||||||||
| Global Atlantic BlackRock High Yield Portfolio | I | 0.60 | % | $ | 1,000 | $ | 1,015.00 | $ | 3.05 | $ | 1,022.18 | $ | 3.06 | ||||||||||||||||||
| Global Atlantic BlackRock High Yield Portfolio | II | 0.85 | % | $ | 1,000 | $ | 1,013.40 | $ | 4.31 | $ | 1,020.92 | $ | 4.33 | ||||||||||||||||||
| Global Atlantic Goldman Sachs Core Fixed Income Portfolio | I | 0.45 | % | $ | 1,000 | $ | 999.20 | $ | 2.27 | $ | 1,022.94 | $ | 2.29 | ||||||||||||||||||
* Expenses are equal to the Portfolio's annualized expense ratio, multiplied by the number of days in the period (184) divided by the number of days in the fiscal year (365).
** Actual expense is equal to the Portfolio's annualized expense ratio, multiplied by the number of days in the period (133) divided by the number of days in the fiscal year (365) to reflect the period from August 20, 2021 (commencement of operations) to December 31, 2021.
131
Global Atlantic Portfolios
Supplemental Information
December 31, 2021 (Unaudited)
Approval of Amendment to Sub-Advisory Agreement with BlackRock Investment Management, LLC on behalf of GA BlackRock Allocation
At a meeting held on August 11, 2021, the Board of Trustees (the "Trustees" or the "Board") of Forethought Variable Insurance Trust (the "Trust"), including a majority of the Trustees who are not "interested persons" (the "Independent Trustees"), considered the approval of an amendment to the sub-advisory agreement between Global Atlantic Investment Advisors, LLC (the "Adviser"), BlackRock Investment Management, LLC ("BlackRock") and the Trust on behalf of Global Atlantic BlackRock Allocation Portfolio ("GA BlackRock Allocation") to lower the sub-advisory fee schedule, effective as of July 1, 2021, and to make certain other non-material changes to the sub-advisory agreement (the "Amendment").
The Trustees considered that they approved the sub-advisory agreement with BlackRock at their September 22, 2020 meeting with a two-year initial term. The Trustees considered the detailed information provided by BlackRock in the September 22, 2020 meeting materials in response to the questionnaire provided by counsel and noted the discussions from that meeting. The Trustees also considered the Adviser's representation that the Amendment is not expected to result in any changes to the nature, extent and quality of the services provided by BlackRock to GA BlackRock Allocation, the investment process and strategies employed in sub-advising GA BlackRock Allocation, the day-to-day management of GA BlackRock Allocation or the persons primarily responsible for such management. Finally, the Trustees considered that the Amendment would result in a lower sub-advisory fee schedule for GA BlackRock Allocation, however, it would not result in a lower overall advisory fee.
Having considered such information as the Trustees believed to be reasonably necessary to evaluate the terms of the Amendment, and as assisted by the advice of counsel, the Trustees unanimously concluded that approving the Amendment was in the best interests of GA BlackRock Allocation and its shareholders. The Trustees noted that, in considering the Amendment, they did not identify any one factor as all important and each Trustee may have afforded different weight to the various factors.
132
Global Atlantic Portfolios
Supplemental Information (Continued)
December 31, 2021 (Unaudited)
Trustees and Officers
The Trustees and officers of the Trust, together with information as to their principal business occupations during the past five years and other information, are shown below. Unless otherwise noted, the address of each Trustee and Officer is c/o Global Atlantic Investment Advisors, LLC, 10 West Market Street, Suite 2300, Indianapolis, Indiana 46204.
Independent Trustees
Name and Year of Birth | Position/ Term of Office1 | Principal Occupation During the Past Five Years | Number of Portfolios in Fund Complex Overseen by Trustee | Other Directorships held by Trustee During the Past Five Years | |||||||||||||||
| Mark Garbin (1951) | Trustee since 2013 | Mr. Garbin serves as Managing Principal of Coherent Capital Management LLC (since 2007). | 16 | Mr. Garbin serves as Director of OHA CLO Enhanced Equity II Genpar LLP (since 2021), Carlyle Tactical Private Credit Fund (since 2018), iCapital KKR Private Markets Fund (Formerly Altegris KKR Commitments Fund) (since 2014), Two Roads Shared Trust (since 2012), Northern Lights Fund Trust (since 2013), and Northern Lights Variable Trust (since 2013). Previously, Mr. Garbin served as Director of Oak Hill Advisors Mortgage Strategies Fund (Offshore) (2014–2017). | |||||||||||||||
| Mitchell E. Appel (1970) | Trustee since 2013 | Mr. Appel serves as President of Value Line Funds (since 2008), as Chief Financial Officer (since 2008) and President (since 2009) of EULAV Securities LLC, and as President (since 2009) and Treasurer (since 2011) of EULAV Asset Management. | 16 | Mr. Appel serves as Director of Value Line Funds (since 2010) and EULAV Asset Management (since 2010). | |||||||||||||||
| Joseph E. Breslin (1953) | Trustee since 2013 | Mr. Breslin serves as Senior Counsel of White Oak Global Advisors, LLC (since 2016) and has provided consultant services to investment managers (since 2009). Previously, Mr. Breslin served as Counsel of Common fund (2014–2016). | 16 | Mr. Breslin serves as Director of Kinetics Mutual Funds, Inc. (since 2000), Kinetics Portfolios Trust (since 2000) and Northern Lights Fund Trust IV (since 2015). Previously, Mr. Breslin served as Director of BlueArc Multi-Strategy Fund (2014–2017) and Hatteras Trust (2004–2016). | |||||||||||||||
133
Global Atlantic Portfolios
Supplemental Information (Continued)
December 31, 2021 (Unaudited)
Interested Trustee and Officers of the Trust
Name and Year of Birth | Position/ Term of Office1 | Principal Occupation During the Past Five Years | Number of Portfolios in Fund Complex Overseen by Trustee | Other Directorships held by Trustee During the Past Five Years | |||||||||||||||
| Robert M. Arena, Jr. (1968)2 | Trustee since 2013 | Mr. Arena serves as President of The Global Atlantic Financial Group LLC ("TGAFG") (since 2021); as Director of Global Atlantic Financial Group Limited ("GAFGL") (since 2021); as President and Head of Life and Retirement of Ariel Re (Holdings) Limited, Global Atlantic Financial Life Limited ("GAFLL") and Global Atlantic Financial Limited (formerly Commonwealth Re Midco Limited) ("GAFL") (since 2020); as Director and President of Global Atlantic Financial Company ("GAFC") (since 2017 and 2020, respectively); as Director of GAFL (since 2019); as Director, President and Head of Life and Retirement of Global Atlantic (Fin) Company (since 2017, 2019 and 2017, respectively); as Director, Chairman and President of Forethought Life Insurance Company ("FLIC") (since 2016, 2017 and 2016, respectively); as Director, Chairman and President of Commonwealth Annuity and Life Insurance Company ("CWA") and First Allmerica Financial Life Insurance Company (FAFLIC") (since 2017, 2017 and 2018, respectively); as Director, Chairman and Chief Executive Officer of Accordia Life and Annuity Company ("Accordia") (since 2016, 2017 and 2017, respectively); as Manager and Chairman of Global Atlantic Investment Advisors, LLC ("GAIA") (since 2016); and as Manager, Chairman and President of Global Atlantic Distributors, LLC ("GAD") (since 2012, 2012 and 2013, respectively); Previously, Mr. Arena has served as President and Head of Life and Retirement of GAFGL (2020–2021); as Co-President, Head of Life and Retirement of GAFGL, GAFL and GAFLL (2017–2020); as President and Head of Individual Markets (2019–2020) and Co-President and Head of Life and Retirement of GAFC (2017–2019 and 2016–2019, respectively); as Co-President of Global Atlantic (Fin) Company (2017–2019); as Executive Vice President of CWA (2017–2018); as Executive Vice President of Forethought Financial Group, Inc. ("FFG") (2013–2014); and as President of Forethought Annuity, FFG (2013–2015). | 16 | None | |||||||||||||||
134
Global Atlantic Portfolios
Supplemental Information (Continued)
December 31, 2021 (Unaudited)
Name and Year of Birth | Position/ Term of Office1 | Principal Occupation During the Past Five Years | Number of Portfolios in Fund Complex Overseen by Trustee | Other Directorships held by Trustee During the Past Five Years | |||||||||||||||
| Barrie Ribet (1982)3 | Trustee since 2021 | Ms. Ribet serves as Managing Director of GAFC (since 2017); Managing Director of FLIC, CWA, Accordia, and FAFLIC (since 2019) and Managing Director of Global Atlantic Equipment Management, LLC (since 2021). Previously, Ms. Ribet served as Senior Vice President, Head of Asset Origination of GAFC (from 2015 to 2017). | 16 | None | |||||||||||||||
| Eric Todd (1969) | President and Chief Executive Officer since 2021 | Mr. Todd is currently Chief Product Officer of GAFC, he also serves as Managing Director of GAFC (since 2015); Manager, President and Chief Investment Officer of GAIA (since 2013); Manager of GAD (since 2016); Director and Managing Director of FLIC (since 2014 and 2018, respectively); and Director and Managing Director of CWA, FAFLIC and Accordia (since 2017 and 2018, respectively). | N/A | N/A | |||||||||||||||
| Deborah Schunder (1967) | Vice President since 2014 | Ms. Schunder serves as Senior Vice President, Head of Investment Product Management, Sales Reporting, Analytics and Compensation of GAFC (since 2021). Previously, Ms. Schunder served as Vice President of Investment Product Management of GAFC (2013–2021). | N/A | N/A | |||||||||||||||
| Trent M. Statczar (1971) | Treasurer and Principal Financial Officer since 2019 | Mr. Statczar serves as Senior Director of Foreside Management Services, LLC (since 2008). | N/A | N/A | |||||||||||||||
| Sarah M. Patterson (1976) | Secretary/Chief Legal Officer since 2013 | Ms. Patterson serves as Managing Director, General Counsel for Individual Markets and Assistant Secretary for FLIC, Accordia, FAFLIC, CWA and GAFC (since 2019, 2020, and 2014, respectively); as Secretary of GAIA (since 2016); and as Assistant Secretary of GAD (since 2016). Previously Ms. Patterson served as Associate General Counsel of FLIC, Accordia, FAFLIC, CWA and GAFC (2014–2020), Senior Vice President (2016–2019) and Vice President (2014–2016) of GAFGL and Vice President and Assistant General Counsel of FFG (2013–2014). | N/A | N/A | |||||||||||||||
| David Capalbo (1968) | Chief Compliance Officer since 2018 | Mr. Capalbo serves as Vice President of Compliance Operations of GAFC (since 2021) and Chief Compliance Officer of GAIA (since 2018). Previously, Mr. Capalbo served as Assistant Vice President and Senior Compliance Officer of GAFC (2016–2021) and Senior Director of Asset Management Compliance of Columbia Threadneedle Investments (2006–2016). | N/A | N/A | |||||||||||||||
135
Global Atlantic Portfolios
Supplemental Information (Continued)
December 31, 2021 (Unaudited)
Name and Year of Birth | Position/ Term of Office1 | Principal Occupation During the Past Five Years | Number of Portfolios in Fund Complex Overseen by Trustee | Other Directorships held by Trustee During the Past Five Years | |||||||||||||||
| Elizabeth Constant (1976) | Assistant Secretary since 2017 | Ms. Constant serves as Vice President and Assistant General Counsel of GAFC (since 2020). Previously, Ms. Constant served as Assistant Vice President and Legal Counsel (2016–2020) and Associate Counsel (2014–2016) of GAFC. | N/A | N/A | |||||||||||||||
1 The term of office for each Trustee and officer listed above will continue indefinitely until the individual resigns or is removed.
2 Mr. Arena is an interested person of the Trust because he is an officer of GAFGL. Mr. Arena holds comparable positions with the GAIA, GAD, FLIC, CWA, and certain other companies affiliated with GAIA.
3 Ms. Ribet is an interested person of the Trust because she is Managing Director of GAFC. Ms. Ribet holds comparable positions with the FLIC, CWA, and certain other companies affiliated with GAIA.
136
PRIVACY NOTICE
FACTS | WHAT DOES FORETHOUGHT VARIABLE INSURANCE TRUST DO WITH YOUR PERSONAL INFORMATION? | ||||||
WHY? | Financial companies choose how they share your personal information. Federal law gives consumers the right to limit some, but not all sharing. Federal law also requires us to tell you how we collect, share, and protect your personal information. Please read this notice carefully to understand what we do. | ||||||
WHAT? | The types of personal information we collect and share depends on the product or service that you have with us. This information can include: ◼ Social Security number and wire transfer instructions ◼ account transactions and transaction history ◼ investment experience and purchase history When you are no longer our customer, we continue to share your information as described in this notice. | ||||||
HOW? | All financial companies need to share customers' personal information to run their everyday business. In the section below, we list the reasons financial companies can share their customers' personal information; the reasons Forethought Variable Insurance Trust chooses to share; and whether you can limit this sharing. | ||||||
| Reasons we can share your personal information: | Does Forethought Variable Insurance Trust share information? | Can you limit this sharing? | |||||||||
| For our everyday business purposes – such as to process your transactions, maintain your account(s), respond to court orders and legal investigations, or report to credit bureaus. | Yes | No | |||||||||
| For our marketing purposes – to offer our products and services to you. | No | We don't share | |||||||||
For joint marketing with other financial companies. | No | We don't share | |||||||||
| For our affiliates' everyday business purposes – information about your transactions and records. | No | We don't share | |||||||||
| For our affiliates' everyday business purposes – information about your credit worthiness. | No | We don't share | |||||||||
For nonaffiliates to market to you | No | We don't share | |||||||||
137
WHAT WE DO:
| How does Forethought Variable Insurance Trust protect my personal information? | To protect your personal information from unauthorized access and use, we use security measures that comply with federal law. These measures include computer safeguards and secured files and buildings. Our service providers are held accountable for adhering to strict policies and procedures to prevent any misuse of your nonpublic personal information. | ||||||
| How does Forethought Variable Insurance Trust collect my personal information? | We collect your personal information, for example, when you ◼ open an account or deposit money ◼ direct us to buy securities or direct us to sell your securities ◼ seek advice about your investments We also collect your personal information from others, such as credit bureaus, affiliates, or other companies. | ||||||
Why can't I limit all sharing? | Federal law gives you the right to limit only: ◼ sharing for affiliates' everyday business purposes – information about your creditworthiness. ◼ affiliates from using your information to market to you. ◼ sharing for nonaffiliates to market to you. State laws and individual companies may give you additional rights to limit sharing. | ||||||
DEFINITIONS
Affiliates | Companies related by common ownership or control. They can be financial and nonfinancial companies. ◼ Forethought Variable Insurance Trust has no affiliates. | ||||||
Nonaffiliates | Companies not related by common ownership or control. They can be financial and nonfinancial companies. ◼ Forethought Variable Insurance Trust does not share with nonaffiliates so they can market to you. | ||||||
Joint marketing | A formal agreement between nonaffiliated financial companies that together market financial products or services to you. ◼ Forethought Variable Insurance Trust does not jointly market. | ||||||
138
PROXY VOTING POLICY
Information regarding how the Portfolios voted proxies relating to portfolio securities during the most recent 12-month period ended June 30 is available (1) on or through the Portfolios' website at http://connect.rightprospectus.com/globalatlanticportfolios and (2) on the U.S. Securities and Exchange Commission's website at http://www.sec.gov.
PORTFOLIO HOLDINGS
Each Portfolio files its complete schedule of portfolio holdings with the SEC for the first and third quarters of each fiscal year on Form N-PORT. The Portfolios' Form N-PORTs are available: (i) on the SEC's website at http://www.sec.gov; and (ii) on the Portfolios' website at http://connect.rightprospectus.com/globalatlanticportfolios. Each Portfolio will post to http://connect.rightprospectus.com/globalatlanticportfolios, a complete list of its portfolio holdings as of the last calendar day of each month approximately 30 days following the end of the month. Each Portfolio's portfolio holdings will remain available on the website noted above at least until the next monthly update.
INVESTMENT ADVISER
Global Atlantic Investment Advisors, LLC
10 West Market Street, Suite 2300
Indianapolis, IN 46204
ADMINISTRATOR
The Bank of New York Mellon
240 Greenwich Street
New York, NY 10286
INVESTMENT SUB-ADVISERS
BlackRock Investment Management, LLC
1 University Square Drive
Princeton, NJ 08540-6455
Goldman Sachs Asset Management, L.P.
200 West Street
New York, NY 10282
| (b) | Not applicable. |
Item 2. Code of Ethics.
| (a) | As of the end of the period covered by this report, the registrant has adopted a code of ethics that applies to the registrant’s principal executive officer, principal financial officer, principal accounting officer or controller, or persons performing similar functions, regardless of whether these individuals are employed by the registrant or a third party. |
| (c) | Amendments: During the period covered by the report, there have not been any amendments to the provisions of the code of ethics. |
| (d) | Waivers: During the period covered by the report, the registrant has not granted any express or implicit waivers from the provisions of the code of ethics. |
| (e) | The Code of Ethics is not posted on the registrant’s website. |
| (f) | A copy of the Code of Ethics is filed herewith. |
Item 3. Audit Committee Financial Expert.
The board of Trustees of the registrant has determined that the registrant has at least one “audit committee financial expert” as defined by Item 3 of Form N-CSR serving on its audit committee. Joseph E. Breslin is the “audit committee financial expert” and is “independent” (as each term is defined in Item 3 of Form N-CSR).
Item 4. Principal Accountant Fees and Services.
Audit Fees
| (a) | The aggregate fees billed for each of the last two fiscal years for professional services rendered by the principal accountant for the audit of the registrant's annual financial statements or services that are normally provided by the accountant in connection with statutory and regulatory filings or engagements for those fiscal years are: |
| 2020 | 2021 | |||||
| $ | 392,750 | $ | 300,000 | |||
Audit-Related Fees
| (b) | The aggregate fees billed in each of the last two fiscal years for assurance and related services by the principal accountant that are reasonably related to the performance of the audit of the registrant's financial statements and are not reported under paragraph (a) of this Item are: |
| 2020 | 2021 | |||||
| $ | 0 | $ | 0 | |||
Tax Fees
| (c) | The aggregate fees billed in each of the last two fiscal years for professional services rendered by the principal accountant for tax compliance, tax advice, and tax planning are: |
| 2020 | 2021 | |||||
| $ | 78,250 | $ | 78,250 | |||
Preparation of Federal & State income tax returns, assistance with calculation of required income and capital gain distributions.
All Other Fees
| (d) | The aggregate fees billed in each of the last two fiscal years for products and services provided by the principal accountant, other than the services reported in paragraphs (a) through (c) of this Item are: |
| 2020 | 2021 | |||||
| $ | 14,250 | $ | 24,000 | |||
Review of annual registration statement filings for 2020 and 2021 and a fee for review of portfolio reorganization activities in 2021.
Audit Committee’s Pre-Approval Policies
| (e)(1) | The registrant’s Audit Committee is required to pre-approve all audit services and, when appropriate, any non-audit services (including audit-related, tax and all other services) to the registrant. The registrant’s Audit Committee also is required to pre-approve, when appropriate, any non-audit services (including audit-related, tax and all other services) to its adviser, or any entity controlling, controlled by or under common control with the adviser that provides ongoing services to the registrant, to the extent that the services may be determined to have an impact on the operations or financial reporting of the registrant. Services are reviewed on an engagement by engagement basis by the Audit Committee. |
Percentages of Services Approved by the Audit Committee
| (e)(2) | The percentage of services described in each of paragraphs (b) through (d) of this Item that were approved by the audit committee pursuant to paragraph (c)(7)(i)(C) of Rule 2-01 of Regulation S-X are as follows: |
All services described in paragraphs (b) through (d) of Item 4 were pre-approved by the Audit Committee.
| (f) | During the audit of registrant's financial statements for the most recent fiscal year, less than 50 percent of the hours expended on the principal accountant's engagement were attributed to work performed by persons other than the principal accountant's full-time, permanent employees. |
| (g) | The aggregate non-audit fees billed by the registrant's accountant for services rendered to the registrant, and rendered to the registrant's investment adviser (not including any sub-adviser whose role is primarily portfolio management and is subcontracted with or overseen by another investment adviser), and any entity controlling, controlled by, or under common control with the adviser that provides ongoing services to the registrant for each of the last two fiscal years of the registrant for the fiscal year ended December 31, 2021 were $102,250 and $0, respectively and for the fiscal year ended December 31, 2020, were $92,500 and $0, respectively. |
| (h) | The audit committee considered the non-audit services rendered to the registrant’s investment adviser and any entity controlling, controlled by, or under common control with the investment adviser, and believes the services are compatible with the principal accountant’s independence. |
Item 5. Audit Committee of Listed Registrants.
Not applicable.
Item 6. Investments.
| (a) | Schedule of Investments in securities of unaffiliated issuers as of the close of the reporting period is included as part of the report to shareholders filed under Item 1(a) of this form. |
| (b) | Not applicable. |
Item 7. Disclosure of Proxy Voting Policies and Procedures for Closed-End Management Investment Companies.
Not applicable.
Item 8. Portfolio Managers of Closed-End Management Investment Companies.
Not applicable.
Item 9. Purchases of Equity Securities by Closed-End Management Investment Company and Affiliated Purchasers.
Not applicable.
Item 10. Submission of Matters to a Vote of Security Holders.
Not applicable.
Item 11. Controls and Procedures.
| (a) | Based on an evaluation of the registrant’s disclosure controls and procedures as of a date within 90 days of filing date of this Form N-CSR, the principal executive officer and principal financial officer of the registrant have concluded that the disclosure controls and procedures of the registrant are reasonably designed to ensure that the information required in filings on Form N-CSR is recorded, processed, summarized, and reported by the filing date, including that information required to be disclosed is accumulated and communicated to the registrant’s management, including the registrant’s principal executive officer and principal financial officer, as appropriate to allow timely decisions regarding required disclosure. |
| (b) | There were no changes in the registrant’s internal control over financial reporting (as defined in Rule 30a-3(d) under the 1940 Act (17 CFR 270.30a-3(d)) that occurred during the period covered by this report that has materially affected, or are reasonably likely to materially affect, the registrant’s internal control over financial reporting. |
Item 12. Disclosure of Securities Lending Activities for Closed-End Management Investment Companies.
Not applicable.
Item 13. Exhibits.
| (a)(1) | Code of ethics, or any amendment thereto, that is the subject of disclosure required by Item 2 is filed herewith. |
| (a)(2) | Certifications pursuant to Rule 30a-2(a) under the 1940 Act and Section 302 of the Sarbanes-Oxley Act of 2002 are filed herewith. |
| (a)(2)(1) | Not applicable. |
| (a)(2)(2) | Not applicable. |
| (b) | Certifications pursuant to Rule 30a-2(b) under the 1940 Act and Section 906 of the Sarbanes-Oxley Act of 2002 are filed herewith. |
SIGNATURES
Pursuant to the requirements of the Securities Exchange Act of 1934 and the Investment Company Act of 1940, the registrant has duly caused this report to be signed on its behalf by the undersigned, thereunto duly authorized.
| (Registrant) | Forethought Variable Insurance Trust |
| By (Signature and Title)* | /s/ Trent M. Statczar |
| Trent M. Statczar, Treasurer | |
| (principal financial officer) |
| Date | February 25, 2022 |
Pursuant to the requirements of the Securities Exchange Act of 1934 and the Investment Company Act of 1940, this report has been signed below by the following persons on behalf of the registrant and in the capacities and on the dates indicated.
| By (Signature and Title)* | /s/ Eric D. Todd |
| Eric D. Todd President | |
| (principal executive officer) |
| Date | February 25, 2022 |
| By (Signature and Title)* | /s/ Trent M. Statczar |
| Trent M. Statczar, Treasurer | |
| (principal financial officer) |
| Date | February 25, 2022 |
* Print the name and title of each signing officer under his or her signature.