GreenPower Motor Company Inc.
Management’s Discussion and Analysis
For the period ended December 31, 2020
Discussion dated: as of February 11, 2021
|
Introduction
This Management's Discussion and Analysis ("MD&A") is dated as of February 11, 2021 unless otherwise indicated and should be read in conjunction with the unaudited consolidated financial statements of GreenPower Motor Company Inc. ("GreenPower", "the Company", "we", "our" or "us") for the three months ended December 31, 2020 and the related notes. This MD&A was written to comply with the requirements of National Instrument 51-102 - Continuous Disclosure Obligations. Results are reported in US dollars, unless otherwise noted. In the opinion of management, all adjustments (which consist only of normal recurring adjustments) considered necessary for a fair presentation have been included. The results presented for the three and nine months ended December 31, 2020 are not necessarily indicative of the results that may be expected for any future period. The consolidated financial statements are prepared in compliance with International Financial Reporting Standards.
For the purposes of preparing this MD&A, management, in conjunction with the Board of Directors, considers the materiality of information. Information is considered material if: (i) such information results in, or would reasonably be expected to result in, a significant change in the market price or value of the Company's common shares; or (ii) there is a substantial likelihood that a reasonable investor would consider it important in making an investment decision; or (iii) if it would significantly alter the total mix of information available to investors. Management, in conjunction with the Board of Directors, evaluates materiality with reference to all relevant circumstances, including potential market sensitivity.
Further information about the Company and its operations can be obtained from the offices of the Company or from www.sedar.com.
Cautionary Note Regarding Forward-Looking Information
Certain statements contained in the following MD&A constitute forward-looking statements. Such forward looking statements involve a number of known and unknown risks, uncertainties and other factors which may cause the actual results, performance or achievements of the Company to be materially different from any future results, performance or achievements expressed or implied by such forward-looking statements. Readers are cautioned not to place undue reliance on these forward-looking statements.
Description of Business
GreenPower designs, builds and distributes a full suite of high-floor and low-floor all-electric medium and heavy-duty vehicles, including transit buses, school buses, shuttles, cargo van and a cab and chassis. GreenPower employs a clean-sheet design to manufacture all-electric buses that are purpose built to be battery powered with zero emissions while integrating global suppliers for key components. This OEM platform allows GreenPower to meet the specifications of various operators while providing standard parts for ease of maintenance and accessibility for warranty requirements. GreenPower was founded in Vancouver, British Colombia, Canada with primary operational facilities in southern California. Listed on the Toronto exchange since November 2015, GreenPower completed its U.S. IPO and NASDAQ listing in August 2020. For further information go to www.greenpowermotor.com
Operations
The following is a description of GreenPower's business activities during the three months ended December 31, 2020. During the quarter the Company:
- completed and delivered a total of 17 buses, including 14 EV Stars to Green Commuter, one EV Star Cargo Plus to the City of Vancouver, and one EV Star and one EV Star plus to ABC Bus Inc. ("ABC"), Greenpower's dealer in the state of New York;
- increased production of B.E.A.S.T. all-electric school buses from five units per month to 10 units per month in response to positive feedback from demonstrations and anticipated future demand;
- continued to move forward with increased production of various EV Star models, including EV Star cab and chassis, EV Star+, and progressed the production of five EV 250 thirty-foot low floor transit buses;
- delivered an autonomous AV Star developed with Perrone Robotics to Jacksonville Transit Authority ("JTA"), and began development of a second vehicle with Perrone in partnership with First Transit to be used in a nationwide demonstration tour scheduled to begin in March 2021;
- announced that Greenpower's dealer Creative Bus Sales delivered an additional EV Star to UCLA for its Bruin Access program, a complimentary para-transit service provided by UCLA;
- completed demonstrations of a range of Greenpower vehicles to potential customers across several US states, laying the groundwork for potential future sales;
- continued to effectively manage its business operations to navigate impacts from the COVID-19 pandemic.
GreenPower delivered 14 EV Stars to Green Commuter during the quarter and provided 3-year lease financing to fund a portion of the purchase price. The majority of the sales price of these vehicles was funded from HVIP vouchers totaling $1.29 million that were previously reserved from funds allocated to the program in 2019. Green Commuter intends to use these vehicles in its shuttle and van pooling business in California.
GreenPower delivered its first EV Star Cargo Plus to the City of Vancouver during the quarter. The EV Star Cargo Plus will replace a traditional fossil fuel powered panel truck as part of the City of Vancouver's broader strategy to electrify its vehicle fleet. This vehicle was independently tested for a range of over 240 kilometers and is equipped with a 730 kilogram liftgate, a rolling door, an interior height of over two meters and a payload of over two metric tons.
During the quarter Greenpower also delivered an EV Star and an EV Star Plus to ABC Greenpower's dealer in the state of New York. ABC intends to use these vehicles in demonstrations to potential customers in New York in an effort to build out a sales pipeline in the state. Greenpower's vehicles are eligible for several funding programs in New York including the NYSERDA program and the New York Voucher Incentive Program that provides incentives of up to $100,000 for the purchase of Class 4 electric trucks and transit buses and up to $90,000 for the purchase of Class 4 battery electric school buses and shuttle buses in the state.
Greenpower announced that during the quarter, the fully autonomous AV Star developed with its partner Perrone Robotics, was delivered to the JTA. The JTA is working with local colleges, medical campuses, and other partners to create the nation's first public transportation network powered by autonomous vehicles. In addition, Greenpower and Perrone announced that they are developing a second AV Star in partnership with First Transit which they intend to use in a cross-country demonstration tour starting in March.
Greenpower continued to progress several production runs concurrently of various models, including EV Stars, EV Star cab and chassis, EV Star+, B.E.A.S.T. school buses, and EV 250 thirty-foot low floor transit buses. Immediately following Greenpower's Nasdaq IPO and capital raise that closed in September, management engaged with suppliers and contract manufacturers to plan for an expansion of all-electric vehicle production of various models, and announced that it was increasing production of EV Stars to 20 per month and increasing production of B.E.A.S.T. school buses to five per month. Production planning moved into implementation during the third quarter, and based on positive feedback from B.E.A.S.T. school bus demonstrations, management made the decision to increase B.E.A.S.T. school bus production from five buses to ten buses per month.
We anticipate that the increased EV Star production will start to deliver towards the end of our fourth quarter, and this level of production represents potential revenue of over $8 million on a quarterly basis. The increased production of ten B.E.A.S.T. school buses per month, which are expected to start delivering in mid-2021, represents potential quarterly sales of over $10 million.
As at December 31, 2020 the Company had:
- Three EV350's, one all-electric shuttle, two EV Stars, automobiles and ancillary equipment classified as property and ancillary equipment totaling approximately $910,000;
- Finished goods inventory of approximately $2.2 million comprised of 8 EV Stars, 2 EV Star Cab and Chassis, 1 all-electric school bus, 1 EV350 and charging stations;
- Work in process Inventory of $7.1 million including 5 EV 250s, 20 B.E.A.S.T. school buses, 58 EV Stars of various models plus parts inventory.
Trends
The Company does not know of any trends, commitments, events, or uncertainty that are expected to have a material effect on the Company's business, financial condition, or results of operations other than as disclosed herein under "Risk Factors" and the paragraph below.
Results of Operations
For the three-month period ended December 31, 2020
For the three-month period ended December 31, 2020 the Company recorded revenues of $2,398,781 and cost of revenues of $1,488,974 generating a gross profit of $909,807 or 37.9% of revenues. Revenue was generated from the delivery of 14 EV Stars for which the Company provided lease financing and which were accounted for as finance leases, from the sale of one EV Star Cargo Plus, one EV Star Plus, and one EV Star, as well as revenue from finance and operating leases and other sources. Operating costs consisted of administrative fees of $1,051,776 relating to salaries, project management, accounting, and administrative services; transportation costs of $65,963 which relate to the use of trucks, trailers, contractors as well as other operational costs needed to transport company products around North America; travel, accommodation, meals and entertainment costs of $73,854 related to travel for project management, demonstration of company products, and trade shows; product development costs of $186,977; sales and marketing costs of $182,790; professional fees of $117,901 consisting of legal and audit fees; and insurance expense of $233,415 and office expense of $84,561 consisting of rent and other office expenses, as well as non-cash expenses including $570,798 of share-based compensation expense and depreciation of $122,881, generating a loss from operations before interest, accretion and foreign exchange of $1,789,387.
Interest and accretion on the line of credit, convertible debentures and promissory notes totalled $362,230, and a foreign exchange gain of $18,511 resulted in a loss for the period of $2,133,106. Non-cash expenses consisting of depreciation, accretion and accrued interest, share-based compensation, warranty accrual, amortization of deferred financing fees, and allowance for credit losses totaled $1,056,014 in the three-month period.
The consolidated total comprehensive loss for the three-month period was impacted by $294,759 of other comprehensive loss as a result of the translation of the entities with a different functional currency than presentation currency.
For the nine-month period ended December 31, 2020
For the nine-month period ended December 31, 2020 the Company recorded revenues of $7,506,447 and cost of revenues of $5,094,338 generating a gross profit of $2,412,109 or 32.1% of revenues. Revenue was generated from the sale of 52 EV Stars for which the Company provided lease financing and which were accounted for as finance leases, from the sale of one all-electric school bus, from the sale of one EV Star cargo plus, one EV Star plus, one EV Star, and from the sale of parts, as well as revenue from finance and operating leases and other sources. Operating costs consisted of administrative fees of $2,769,949 relating to salaries, project management, accounting, and administrative services; transportation costs of
$119,459 which relate to the use of trucks, trailers, contractors as well as other operational costs needed to transport company products around North America; travel, accommodation, meals and entertainment costs of $178,715 related to travel for project management, demonstration of company products, and trade shows; product development costs of $643,785; sales and marketing costs of $235,834; professional fees of $275,977 consisting of legal and audit fees; insurance expense of $330,552 and office expense of $187,972 consisting of rent and other office expenses, as well as non-cash expenses including $820,567 of share-based compensation expense and depreciation of $355,113, generating a loss from operations before interest, accretion and foreign exchange of $3,500,925.
Interest and accretion on the line of credit, convertible debentures and promissory notes totalled $1,423,138, and a foreign exchange loss of $124,542 resulted in a loss for the period of $5,048,605.
The consolidated total comprehensive loss for the nine-month period was impacted by $470,947 of other comprehensive loss as a result of the translation of the entities with a different functional currency than presentation currency.
For the three-month period ended December 31, 2019
For the three-month period ended December 31, 2019 the Company recorded revenues of $4,977,548 and cost of revenues of $3,511,990 generating a gross profit of $1,465,558 or 29.4% of revenues. Revenue was generated from the sale of two Synapse Type D school buses, 3 EV Stars, and from the sale of 30 EV Stars for which the Company provided lease financing and were accounted for as finance leases, as well as revenue from finance and operating leases and other sources. Operating costs consisted of administrative fees of $1,055,706 relating to salaries, project management, accounting, and administrative services; transportation costs of $58,863 which relate to the use of trucks, trailers, contractors as well as other operational costs needed to transport company products around North America; travel, accommodation, meals and entertainment costs of $52,792 related to travel for project management, demonstration of company products, and trade shows; product development costs of $348,583; sales and marketing costs of $109,731; professional fees of $87,953 consisting of legal and audit fees; and office expense of $41,549 consisting of rent and other office expenses, as well as non-cash expenses including $34,885 of share-based compensation expense and depreciation of $157,970, generating a loss from operations before interest, accretion and foreign exchange of $482,474.
Interest and accretion on the line of credit, convertible debentures and promissory notes totalled $574,031, and a foreign exchange gain of $418 resulted in a loss for the period of $1,056,087. Non-cash expenses consisting of depreciation, accretion and accrued interest, share-based compensation, warranty accrual and amortization of deferred financing fees totaled $675,755 in the three-month period.
The consolidated total comprehensive loss for the three-month period was impacted by $14,932 of other comprehensive loss as a result of the translation of the entities with a different functional currency than presentation currency.
For the nine-month period ended December 31, 2019
For the nine-month period ended December 31, 2019 the Company recorded revenues of $12,858,002 and cost of revenues of $9,276,910 generating a gross profit of $3,581,092 or 27.9% of revenues. Revenue was generated from the sale of two EV 350s, four Synapse Type D school buses, 30 EV Stars EV Stars, and from the sale of 30 EV Stars for which the Company provided lease financing and were accounted for as finance leases, as well as revenue from finance and operating leases and other sources. Operating costs consisted of administrative fees of $2,505,075 relating to salaries, project management, accounting, and administrative services; transportation costs of $177,727 which relate to the use of trucks, trailers, contractors as well as other operational costs needed to transport company products around North America; travel, accommodation, meals and entertainment costs of $240,542 related to travel for project management, demonstration of company products, and trade shows; product development costs of $864,309; sales and marketing costs of $256,211; professional fees of $201,585 consisting of legal and
audit fees; and office expense of $135,157 consisting of rent and other office expenses, as well as non-cash expenses including $181,454 of share-based compensation expense and depreciation of $462,217, generating a loss from operations before interest, accretion and foreign exchange of $(1,443,185). Interest and accretion on the line of credit, convertible debentures and promissory notes totalled $1,584,685, and a foreign exchange loss of $4,069 resulted in a loss for the period of $3,031,939.
The consolidated total comprehensive loss for the nine-month period was impacted by $4,064 of other comprehensive loss as a result of the translation of the entities with a different functional currency than presentation currency.
The following tables provide a summary of selected information for the last eight quarters:
| | | Three Months Ended | |
| | | December 31, | | | September 30, | | | June 30, | | | March 31, | |
| | | 2020 | | | 2020 | | | 2020 | | | 2020 | |
| Financial results | | | | | | | | | | | | |
| Revenues | $ | 2,398,781 | | $ | 2,835,411 | | $ | 2,272,255 | | $ | 642,401 | |
| Income (loss) for the period | | (2,133,106 | ) | | (1,486,160 | ) | | (1,429,337 | ) | | (2,114,027 | ) |
| Basic and diluted earnings/(loss) per share* | $ | (0.11 | ) | $ | (0.09 | ) | $ | (0.09 | ) | $ | (0.14 | ) |
| Balance sheet data | | | | | | | | | | | | |
| Working capital (deficit) | | 31,310,393 | | | 32,477,352 | | | (707,573 | ) | | 743,131 | |
| Total assets | | 39,814,447 | | | 43,044,685 | | | 14,473,657 | | | 13,207,679 | |
| Shareholders' equity | | 36,956,028 | | | 34,647,254 | | | (2,396,707 | ) | | (1,174,956 | ) |
| | | Three Months Ended | |
| | | December 31, | | | September 30, | | | June 30, | | | March 31, | |
| | | 2019 | | | 2019 | | | 2019 | | | 2019 | |
| Financial results | | | | | | | | | | | | |
| Revenues | $ | 4,977,548 | | $ | 5,430,503 | | $ | 2,449,951 | | $ | 2,486,611 | |
| Income (loss) for the period | | (1,056,087 | ) | | (712,368 | ) | | (1,263,484 | ) | | (1,553,824 | ) |
| Basic and diluted earnings/(loss) per share* | $ | (0.07 | ) | $ | (0.05 | ) | $ | (0.09 | ) | $ | (0.12 | ) |
| Balance sheet data | | | | | | | | | | | | |
| Working capital (deficit) | | 2,319,481 | | | 1,648,610 | | | 2,775,679 | | | (155,176 | ) |
| Total assets | | 16,811,834 | | | 14,515,250 | | | 15,620,864 | | | 11,910,299 | |
| Shareholders' equity | | 876,200 | | | 1,951,725 | | | 2,439,746 | | | (85,636 | ) |
* Based upon the weighted average number of shares issued and outstanding for the period, retroactively restated for the seven-for-one share consolidation completed on August 28, 2020.
The following tables summarize vehicle deliveries pursuant to vehicle leases and vehicle sales for the last eight quarters:
| | For the three months ended |
| | December 31, | September 30, | June 30, | March 31, |
| | 2020 | 2020 | 2020 | 2020 |
| Vehicle Sales | | | | |
| EV 350 | 0 | 0 | 0 | 0 |
| EV Star | 3 | 0 | 0 | 8 |
| School bus | 0 | 1 | 0 | 0 |
| Total | 3 | 1 | 0 | 8 |
| Vehicle Leases | | | | |
| EV Star | 14 | 20 | 18 | 0 |
| Total | 14 | 20 | 18 | 0 |
| | | | | |
| Total Deliveries | 17 | 21 | 18 | 8 |
| | For the three months ended |
| | December 31, | September 30, | June 30, | March 31, |
| | 2019 | 2019 | 2019 | 2019 |
| Vehicle Sales | | | | |
| EV 350 | 0 | 1 | 1 | 3 |
| EV Star¹ | 3 | 24 | 3 | 3 |
| School bus | 2 | 2 | 0 | 0 |
| Total | 5 | 27 | 4 | 6 |
| Vehicle Leases | | | | |
| EV Star¹ | 22 | 0 | 2 | 0 |
| Total | 22 | 0 | 2 | 0 |
| | | | | |
| Total Deliveries | 27 | 27 | 6 | 6 |
1) - Leases associated with 8 EV Stars entered into during the quarter ended December 31, 2019 were cancelled during the quarter ended March 31, 2020 and the vehicles were subsequently sold.
The following tables summarize cash expenses for the last eight quarters:
| | | For the three months ended | |
| | | Dec 31, 2020 | | | Sept 30, 2020 | | | June 30, 2020 | | | March 31, 2020 | |
| | | | | | | | | | | | | |
| Total Expenses | $ | 3,042,913 | | $ | 2,369,878 | | $ | 2,047,920 | | $ | 2,361,841 | |
| Less: | | | | | | | | | | | | |
| Depreciation | | (122,881 | ) | | (117,471 | ) | | (114,761 | ) | | (116,338 | ) |
| Accretion and accrued interest | | (133,759 | ) | | (160,782 | ) | | (153,006 | ) | | (232,543 | ) |
| Share-based payments | | (570,798 | ) | | (117,737 | ) | | (132,032 | ) | | (126,652 | ) |
| Amortization of deferred financing fees | | (161,099 | ) | | (153,772 | ) | | (150,507 | ) | | (149,864 | ) |
| Warranty Accrual | | (59,199 | ) | | (97,268 | ) | | (77,377 | ) | | 20,494 | |
| Allowance for credit losses | | (8,278 | ) | | (20,385 | ) | | 33,552 | | | (46,447 | ) |
| | | | | | | | | | | | | |
| Total Cash Expenses (1) | $ | 1,986,899 | | $ | 1,702,463 | | $ | 1,453,789 | | $ | 1,710,491 | |
| | | For the three months ended | |
| | | Dec 31, 2019 | | | Sept 30, 2019 | | | June 30, 2019 | | | March 31, 2019 | |
| | | | | | | | | | | | | |
| Total Expenses | $ | 2,521,645 | | $ | 2,104,506 | | $ | 1,986,880 | | $ | 1,866,235 | |
| Less: | | | | | | | | | | | | |
| Depreciation | | (157,970 | ) | | (160,661 | ) | | (143,586 | ) | | (172,607 | ) |
| Accretion and accrued interest | | (151,525 | ) | | (133,373 | ) | | (129,989 | ) | | (104,952 | ) |
| Share-based payments | | (34,885 | ) | | (53,025 | ) | | (93,544 | ) | | (93,750 | ) |
| Amortization of deferred financing fees | | (157,915 | ) | | (154,883 | ) | | (156,732 | ) | | (92,948 | ) |
| Warranty Accrual | | (166,662 | ) | | (136,307 | ) | | (38,864 | ) | | (7,169 | ) |
| Allowance for credit losses | | - | | | - | | | - | | | - | |
| | | | | | | | | | | | | |
| Total Cash Expenses (1) | $ | 1,852,688 | | $ | 1,466,257 | | $ | 1,424,165 | | $ | 1,394,809 | |
The following tables summarize adjusted EBITDA for the last eight quarters:
| | | For the three months ended | |
| | | Dec 31, 2020 | | | Sept 30, 2020 | | | June 30, 2020 | | | March 31, 2020 | |
| | | | | | | | | | | | | |
| Loss for the period | $ | (2,133,106 | ) | $ | (1,486,160 | ) | $ | (1,429,337 | ) | $ | (2,114,027 | ) |
| Plus: | | | | | | | | | | | | |
| Depreciation | | 122,881 | | | 117,471 | | | 114,761 | | | 116,338 | |
| Interest and accretion | | 362,230 | | | 505,589 | | | 555,319 | | | 549,139 | |
| Share-based payments | | 570,798 | | | 117,737 | | | 132,032 | | | 126,652 | |
| Warranty Accrual | | 59,199 | | | 97,268 | | | 77,377 | | | (20,494 | ) |
| | | | | | | | | | | | | |
| Adjusted EBITDA (1) | $ | (1,017,998 | ) | $ | (648,095 | ) | $ | (549,848 | ) | $ | (1,342,392 | ) |
| | | For the three months ended | |
| | | Dec 31, 2019 | | | Sept 30, 2019 | | | June 30, 2019 | | | March 31, 2019 | |
| | | | | | | | | | | | | |
| Loss for the period | $ | (1,056,087 | ) | $ | (712,368 | ) | $ | (1,263,484 | ) | $ | (1,553,706 | ) |
| Plus: | | | | | | | | | | | | |
| Depreciation | | 157,970 | | | 160,661 | | | 143,586 | | | 172,607 | |
| Interest and accretion | | 574,031 | | | 510,042 | | | 500,612 | | | 428,668 | |
| Share-based payments | | 34,885 | | | 53,025 | | | 93,544 | | | 93,750 | |
| Warranty Accrual | | 166,662 | | | 188,554 | | | 38,864 | | | 88,589 | |
| | | | | | | | | | | | | |
| Adjusted EBITDA (1) | $ | (122,539 | ) | $ | 199,914 | | $ | (486,878 | ) | $ | (770,092 | ) |
(1) Non-IFRS Financial Measures: "Total Cash Expenses", as defined above, and "Adjusted EBITDA" reflects net income or loss before interest, taxes, share-based payments, depreciation and amortization, and warranty accrual. Adjusted EBITDA is a measure used by analysts and investors as an indicator of operating cash flow since it excludes the impact of movements in working capital items, non-cash charges and financing costs. Therefore, Adjusted EBITDA gives the investor information as to the cash generated from the operations of a business. However, Adjusted EBITDA is not a measure of financial performance under IFRS and should not be considered a substitute for other financial measures of performance. Adjusted EBITDA as calculated by GreenPower may not be comparable to Adjusted EBITDA as calculated and reported by other companies. The most comparable IFRS measure to Adjusted EBITDA is net income.
Liquidity
At December 31, 2020, the Company had a cash balance of $20,917,422 and working capital of $31,310,393. The Company's line of credit has a maximum credit limit of up to $8,000,000 and amounts available on the line of credit in excess of $5,000,000 are subject to margining requirements. The Company's primary bank account denominated in US dollars is linked to its Line of Credit such that funds deposited to the bank account reduce the outstanding balance on the Line of Credit, and as at December 31, 2020 the Line of Credit had a drawn balance of nil. The Company manages its capital structure and makes adjustments to it based on available funds to the Company. The Company may continue to rely on additional financings and the sale of its inventory to further its operations and meet its capital requirements to manufacture EV vehicles, expand its production capacity and further develop its sales, marketing, engineering, and technical resources.
Capital Resources
Three months ended December 31, 2020 and up to the date of this report
Authorized: Unlimited number of common shares without par value Authorized: Unlimited number of preferred shares without par value
As at March 31, 2020 the Company had a total of $CDN 5,596,000 in convertible debentures outstanding, which were converted into 1,703,240 common shares during the nine months ended December 31, 2020. The convertible debentures all had an 8% interest rate, an initial term of four years, and effective interest rates ranging from 28.3% to 38.5%.
| Issue Date | Outstanding Amount
March 31, 2020
($CDN) | Conversion
Price ($CDN) | Shares on
Conversion | Converted
Amount
($CDN) | Outstanding Amount
December 31, 2020
($CDN) |
| 17-May-17 | 1,900,000 | 4.55 | 417,582 | (1,900,000) | - |
| 31-May-17 | 250,000 | 4.55 | 54,945 | (250,000) | - |
| 25-Sep-17 | 1,476,000 | 2.80 | 527,143 | (1,476,000) | - |
| 12-Oct-17 | 1,970,000 | 2.80 | 703,571 | (1,970,000) | - |
| Total | 5,596,000 | | 1,703,241 | (5,596,000) | - |
During the nine months ended December 31, 2020 the following common shares were issued from the exercise of convertible debentures:
417,582 common shares were issued pursuant to the conversion of convertible debentures totaling CAD$200,000 (issued on May 31, 2017) which were converted at a price of CAD$4.55 per share;
54,945 common shares were issued pursuant to the conversion of convertible debentures totaling CAD$250,000 (issued on May 31, 2017) which were converted at a price of CAD$4.55 per share;
527,143 common shares were issued pursuant to the conversion of convertible debentures totaling $1,476,000 (issued on Sep 25, 2017) which were converted at a price of CAD$2.80 per share;
703,570 common shares were issued pursuant to the conversion of convertible debentures totaling CAD$1,115,000 (issued on October 12, 2017) which were converted at a price of CAD$2.80 per share.
The Company has an incentive stock option plan whereby it grants options to directors, officers, employees, and consultants of the Company. On May 14, 2019, the Company replaced its Fixed Stock Option Plan (the "2016 Plan") with a Rolling Stock Option Plan (the "2019 Plan"). Under the terms of the 2019 Plan, the aggregate number of Options that can be granted under the 2019 Plan cannot exceed ten (10%) of the total number of issued and outstanding Shares, calculated on a non-diluted basis. The exercise price of options granted under the 2019 Plan may not be less than the minimum prevailing price permitted by the TSXV policies with a maximum term of 10 years.
On March 9, 2016, the shareholders approved the previous stock option plan which allowed for the issuance of up to 1,491,541 shares (the "2016 Plan"). On March 30, 2017, the shareholders approved an increase in the number of common shares available for issuance under the 2016 Plan from 1,491,541 to 1,950,910. On May 4, 2018, the number available for issuance was further increased to 2,129,999.
The Company had the following incentive stock options granted under the 2019 Plan and the 2016 Plan that are issued and outstanding as at December 31, 2020:
| | | Exercise | | | Balance | | | | | | | | | Forfeited | | | Balance | |
| Expiry Date | | Price (CDN$) | | | March 31, 2020 | | | Granted | | | Exercised | | | or Expired | | | December 31, 2020 | |
| May 26, 2020 | $ | 4.20 | | | 21,429 | | | - | | | - | | | (21,429 | ) | | - | |
| July 10, 2020 | $ | 3.85 | | | 7,143 | | | - | | | - | | | (7,143 | ) | | - | |
| February 4, 2021 | $ | 2.45 | | | 57,143 | | | - | | | - | | | - | | | 57,143 | |
| May 6, 2021 | $ | 2.45 | | | 74,286 | | | - | | | - | | | (11,429 | ) | | 62,857 | |
| October 27, 2021 | $ | 4.34 | | | 71,429 | | | - | | | - | | | - | | | 71,429 | |
| February 2, 2022 | $ | 5.25 | | | 65,286 | | | - | | | - | | | - | | | 65,286 | |
| May 26, 2022 | $ | 5.25 | | | 148,214 | | | - | | | - | | | - | | | 148,214 | |
| December 18, 2022 | $ | 3.15 | | | 25,000 | | | - | | | - | | | - | | | 25,000 | |
| May 4, 2023 | $ | 3.50 | | | 75,714 | | | - | | | - | | | - | | | 75,714 | |
| November 30, 2023 | $ | 3.01 | | | 50,000 | | | - | | | - | | | - | | | 50,000 | |
| February 12, 2024 | $ | 3.50 | | | 78,571 | | | - | | | - | | | - | | | 78,571 | |
| January 30, 2022 | $ | 2.59 | | | 25,000 | | | - | | | - | | | - | | | 25,000 | |
| January 30, 2025 | $ | 2.59 | | | 319,286 | | | - | | | (1,429 | ) | | (2,679 | ) | | 315,178 | |
| July 3, 2022 | $ | 4.90 | | | - | | | 14,286 | | | - | | | - | | | 14,286 | |
| July 3, 2025 | $ | 4.90 | | | - | | | 51,429 | | | - | | | - | | | 51,429 | |
| November 19, 2025* | $ | 20.00 | | | - | | | 300,000 | | | - | | | - | | | 300,000 | |
| December 4, 2025* | $ | 20.00 | | | - | | | 20,000 | | | - | | | - | | | 20,000 | |
| Total outstanding | | | | | 1,018,501 | | | 385,715 | | | (1,429 | ) | | (42,680 | ) | | 1,360,107 | |
| Total exercisable | | | | | 629,750 | | | | | | | | | | | | 857,429 | |
| Weighted Average | | | | | | | | | | | | | | | | | | |
| Exercise Price (CDN$) | | | | $ | 3.47 | | $ | 17.43 | | $ | 2.59 | | $ | 3.57 | | $ | 8.99 | |
| Weighted Average Remaining Life | | | 3.0 years | | | | | | | | | | | | 3.0 years | |
| * Exercise price in US$ | | | | | | | | | | | | | | | | |
As at December 31, 2020, there were 701,323 stock options available for issuance under the 2019 plan.
During the nine-month period ended December 31, 2020, 42,679 options were forfeited or expired.
On July 3, 2020 the Company granted:
- 51,429 stock options to employees with an exercise price of CDN$4.90 per share and with a term of 5 years, and which vest 25% after 4 months, and then 25% after years 1, 2, and 3, and
- 14,286 stock options to a consultant (IR provider) with an exercise price of CDN$4.90 per share and with a term of 2 years and which vest 25% at the end of every 3 months for a period of twelve months.
On November 20, 2020 the Company granted an aggregate of 300,000 stock options, with 100,000 granted to each of three of Greenpower's officers. The stock options have an exercise price of US$20.00 per share, a term of 5 years, and are exercisable 25% after four months, and 25% after the first, second and third year from the grant date.
On December 4, 2020 the Company granted an aggregate of 20,000 stock options, with 5,000 granted to each of the Company's four independent directors. The stock options have an exercise price of US$20.00 per share, a term of 5 years, and are exercisable at the end of every 3 months for a period of twelve months.
During the nine months ended December 31, 2020, 1,429 common shares were issued pursuant to the issuance of 1,429 stock options.
During the three months ended December 31, 2020, the Company incurred share-based compensation expense with a measured fair value of $570,798. The fair value of the options granted and vested were recorded as share-based payments on the Consolidated Statements of Operations.
As at December 31, 2020, the Company had outstanding warrants, enabling the holders to acquire common shares as follows:

During the nine months ended December 31, 2020, a total of 472,387 warrants exercisable at CDN $5.25 per share expired unexercised.
During the nine months ended December 31, 2020 the Company issued the following common shares from the exercise of warrants:
44,498 common shares were issued at a price of CDN$7.70 per share pursuant to the exercise of 44,498 warrants;
736,071 common shares were issued at a price of CDN$3.50 per share pursuant to the exercise of 736,071 warrants, and
757,320 common shares were issued at a price of USD$2.6677 per share pursuant to the exercise of 757,320 warrants.
Off-Balance Sheet Arrangements
As of the date of this filing, the Company does not have any off-balance sheet arrangements that have, or are reasonably likely to have, a current or future effect on the results of operations or financial condition of the Company including, without limitation, such considerations as liquidity and capital resources that have not previously been discussed.
Related Party Transactions
A summary of compensation for directors, officers and key management personnel is as follows:
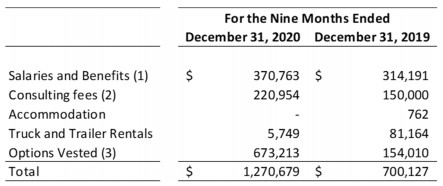
1) Salaries and benefits incurred with officers and a former officer are included in Administrative fees on the Consolidated Statements of Operations.
2) Consulting fees included in professional fees and sales and marketing on the Consolidated Statements of Operations are paid to, management service companies of the CEO and Chairman, and to the former CEO of the Company to provide accounting, management and consulting services.
3) Amounts recognized for related party stock-based compensation are included in Share-based payments on the Consolidated Statements of Operations.
Accounts payable and accrued liabilities at December 31, 2020 included nil (March 31, 2020 - $71,697) owed to officers, directors, and companies controlled by officers and directors, and shareholders, which is non-interest bearing, unsecured and has no fixed terms of repayment.
As at March 31, 2020, companies beneficially owned by the CEO and Chairman of the Company had loans outstanding to the Company with a total value of CDN $3,185,000 and USD $120,000. During the nine months ended December 31, 2020 the Company received loans totaling CAD$50,000 and USD$100,000 from companies beneficially owned by the CEO and Chairman. These loans were repaid in their entirety during the nine months ended December 31, 2020, and funds used to repay these loans were sourced from proceeds received from the exercise of warrants during the period.
A director of the Company and the Company's CEO and Chairman have both provided personal guarantees of USD $2,510,000, or $5,020,000 in total to support the Company's $8 million operating line of credit. In consideration for these guarantees, during 2018 the Company issued 628,571 non-transferrable common share purchase warrants exercisable at an exercise price of CDN $4.55 per share that expire on June 29, 2021 and during 2019 the Company issued 685,714 non-transferrable common share purchase warrants exercisable at an exercise price of CDN $4.20 per share that expire on March 14, 2022.
During the nine months ended December 31, 2020 all of the remaining convertible debentures of the Company were converted into common shares (Note 14), which included CDN$3,125,000 (March 31, 2020 - CDN$3,125,000) principal balance of convertible debentures owed to officers, directors and companies
controlled by officers and directors which was converted into 882,555 common shares of the company during the nine months ended December 31, 2020.
These transactions were measured at the exchange amount, which is the amount agreed upon by the transacting parties.
New and Amended Standards
Adoption of accounting standards
The following new or amended standards were adopted during the year ended March 31, 2020:
IFRS 15 Revenue from Contracts with Customers provides a single principle-based framework to be applied to all contracts with customers. IFRS 15 replaces the previous revenue standard IAS 18, Revenue, and the related Interpretations on revenue recognition. The standard scopes out contracts that are considered to be lease contracts, insurance contracts and financial instruments. The new standard is a control-based model as compared to the existing revenue standard which is primarily focused on risks and rewards. Under the new standard, revenue is recognized when a customer obtains control of a good or service. Transfer of control occurs when the customer has the ability to direct the use of and obtain the benefits of the good or service. This standard is effective for reporting periods beginning on or after January 1, 2018.
IFRS 9 Financial Instruments replaces the current standard IAS 39 Financial Instruments: Recognition and Measurement, replacing the current classification and measurement criteria for financial assets and liabilities with only two classification categories: amortized cost and fair value. This standard has an effective date of January 1, 2018.
IFRS 16 Leases was issued in January 2016 and specifies how an IFRS reporter will recognize, measure, present and disclose leases. The standard provides a single lessee accounting model, requiring lessees to recognize assets and liabilities for all leases unless the lease term is 12 months or less or the underlying asset has a low value. Lessors continue to classify leases as operating or finance, with IFRS 16's approach to lessor accounting substantially unchanged from its predecessor, IAS 17. This standard is effective for reporting periods beginning on or after January 1, 2019.
The adoption of the above accounting policies impacted the consolidated financial statements for the three months ended December 31, 2020 as described in the respective notes.
Future accounting pronouncements
Certain new accounting standards and interpretations have been published by the IASB or the IFRS Interpretations Committee that are not mandatory for the December 31, 2020 reporting period.
The Company has reviewed new and revised accounting pronouncements that have been issued but are not yet effective. The Company has not early adopted any of these standards and is currently evaluating the impact, if any, that these standards might have on its consolidated financial statements.
Critical Accounting Estimates
Significant assumptions about the future and other sources of estimation uncertainty that management has made at the end of the reporting period, that could result in a material adjustment to the carrying amounts of assets and liabilities, in the event that actual results differ from assumptions made, relate to, but are not limited to, the inputs used in the Black-Scholes option pricing model to measure stock-based compensation and warrants, determination of the liability portion of convertible debentures, determination of the useful life of equipment, net realizable value of inventory, provision for warranty expense, and the $nil provision for income taxes. Critical estimates used in the preparation of these accounting statements include but are not limited to the following:
Critical accounting judgments
i. the determination of the discount rate to use to discount the promissory note receivable, finance lease receivable and lease liabilities;
ii. the determination of the functional currency of each entity within the consolidated Company;
iii. the Company's ability to continue as a going concern.
iv. The classification of leases as either financial leases or operating leases;
v. The determination that there are no material undisclosed matters requiring recognition on the financial statements as either a provision, a contingent liability, or a contingent asset; and
vi. The identification of performance obligations in revenue contracts and the determination of when they are satisfied.
Financial Instruments
The Company's financial instruments consist of cash and restricted cash, accounts receivable, finance lease receivable, promissory note receivable, line of credit, accounts payable and accrued liabilities, note payable, loans payable to related parties, promissory note payable, convertible debentures and lease liabilities. As at December 31, 2020, the Company had working capital of $31,310,393.
The Company has exposure to the following financial instrument related risks.
Credit risk
The Company's exposure to credit risk is on its cash, finance lease, and promissory note receivable. Cash consists of cash bank balances held in major financial institutions in Canada and the United States with a high credit quality and therefore the Company is exposed to minimal risk. The Company assesses the credit risk of its promissory note receivable counterparty and lease counterparty on an annual basis and believes it is exposed to minimal credit risk.
Liquidity risk
The Company manages liquidity to ensure that there is sufficient capital in order to meet short-term business requirements, after taking into account the Company's cash balance and available liquidity on the Company's operating line of credit. The Company's cash is invested in bank accounts at major financial institutions in Canada and the United States and is available on demand. The Company's primary bank account denominated in US dollars is linked to its Line of Credit such that funds deposited to the bank account reduce the outstanding balance on the Line of Credit. As at December 31, 2020 the Company had a cash balance of $20,917,422 and its Line of Credit remained undrawn.
Trade Tariffs
The Company manufactures and imports key components from overseas that are subject to tariffs on importation into the United States, and for which the Company is currently paying tariffs. In particular, the Company is subject to tariffs on goods imported from China, which increases the cost of these goods and negatively impacts the company's profitability and financial position.
Market risks
Market risk is the risk of loss that may arise from changes in market factors such as interest rates and foreign exchange. The Company believes interest rate risk is not material.
The Company is exposed to foreign exchange risk as it conducts business in both the United States and Canada. Management monitors its foreign currency balances but the Company does not engage in any hedging activities to reduce its foreign currency risk.
At December 31, 2020, the Company was exposed to currency risk through the following monetary assets and liabilities in CDN Dollars.
| Cash | $ | 206,005 | |
| Accounts Receivable | | 297,110 | |
| Promissory Notes Receivable | | 650,000 | |
| Accounts Payable and Accrued Liabilities | $ | 110,446 | |
Based on the net exposure and assuming all other variables remain constant, a 10% change in the appreciation or depreciation of the Canadian dollar relative to the US dollar would result in a change of approximately $99,000 to other comprehensive income/loss.
Capital Management
The Company's capital management objective is to obtain sufficient capital to develop new business opportunities for the benefit of its shareholders. To meet these objectives, management monitors the Company's ongoing capital requirements on specific business opportunities on a case-by-case basis. The capital structure of the Company consists of cash, operating line of credit, secured and unsecured promissory notes, convertible debentures and equity attributable to common shareholders, consisting of issued share capital and deficit.
During the second quarter the Company completed an initial public offering and concurrent private placement for gross proceeds of US$37.7 million less underwriting discounts and offering costs. As at December 31, 2020, the Company had a cash balance of $20,917,422, working capital of $31,310,393, retained earnings of ($28,901,236), and shareholder's equity of $36,956,026. Subject to market conditions and other factors the Company may raise additional capital in the future to fund and grow its business for the benefit of shareholders. The Company is subject to externally imposed capital requirements with respect to its line of credit (Note 10).
Outlook
For the immediate future, the Company plans to:
Complete production and delivery of several models of EV Stars, BEAST school buses, and EV 250s, currently in various stages of production;
Deliver the remaining vehicles in finished goods inventory;
Continue to expand assembly and manufacturing capabilities, including the recently announced increased production of BEAST school buses and several models of EV Stars;
Continue to develop and expand sales opportunities and increase its sales backlog;
Further develop its sales and marketing, engineering and technical resources;
Capitalization and Outstanding Security Data
The total number of common shares issued and outstanding is 20,614,304 as of December 31, 2020. There are no preferred shares issued and outstanding.
An incentive stock option plan was established for the benefit of directors, officers, employees and consultants of the Company. As of December 31, 2020, there are 1,360,107 options granted and outstanding. The total number of common share warrants outstanding as of the same date is 2,059,805.
As at February 11, 2021, the company had 20,813,218 issued shares, 1,285,856 options outstanding and 1,942,141 warrants outstanding.
Disclosure of Internal Controls
Management has established processes to provide them sufficient knowledge to support representations that they have exercised reasonable diligence that (i) the financial statements do not contain any untrue statement of material fact or omit to state a material fact required to be stated or that is necessary to make a statement not misleading in light of the circumstances under which it is made, as of the date of and for the periods presented by the financial statements, and (ii) the financial statements fairly present in all material respects the financial condition, results of operations and cash flow of the Company, as of the date of and for the periods presented.
In contrast to the certificate required for non-venture issuers under National Instrument 52-109, Certification of Disclosure in Issuers' Annual and Interim Filings ("NI 52-109"), the Venture Issuer Basic Certificate does not include representations relating to the establishment and maintenance of disclosure controls and procedures ("DC&P") and internal control over financial reporting ("ICFR"), as defined in NI 52-109. In particular, the certifying officers filing this certificate are not making any representations relating to the establishment and maintenance of:
i. controls and other procedures designed to provide reasonable assurance that information required to be disclosed by the issuer in its annual filings, interim filings or other reports filed or submitted under securities legislation is recorded, processed, summarized and reported within the time periods specified in securities legislation; and
ii. a process to provide reasonable assurance regarding the reliability of financial reporting and the preparation of financial statements for external purposes in accordance with the issuer's GAAP (IFRS).
The issuer's certifying officers are responsible for ensuring that processes are in place to provide them with sufficient knowledge to support the representations they are making in the certificate. Investors should be aware that inherent limitations on the ability of certifying officers of a venture issuer to design and implement on a cost effective basis DC&P and ICFR as defined in NI 52-109 may result in additional risks to the quality, reliability, transparency and timeliness of interim and annual filings and other reports provided under securities legislation.
Risk Factors
Investing in the common shares of the Company involves risk. Prospective investors should carefully consider the risks described below, together with all of the other information included in this MD&A before making an investment decision. If any of the following risks actually occurs, the business, financial condition or results of operations of the Company could be harmed. In such an event, the trading price of the common shares could decline and prospective investors may lose part or all of their investment.
Operational Risk
The Company is exposed to many types of operational risks that affect all companies. Operational risk is the risk of loss resulting from inadequate or failed internal processes, people and/or systems. Operational risk is present in all of the Company's business activities, and incorporates exposure relating to fiduciary breaches, product liability claims, product recalls, regulatory compliance failures, legal disputes, business disruption, technology failures, business integration, damage to physical assets, employee safety, dependence on suppliers, foreign exchange fluctuations, insurance coverage and rising insurance costs. Such risks also include the risk of misconduct, theft or fraud by employees or others, unauthorized transactions by employees, operational or human error or not having sufficient levels or quality of staffing resources to successfully achieve the Company's strategic or operational objectives.
As a result of the acquisition of land in Porterville described in the Investing Activities section, the Company is subject to the risks normally associated with the ownership of land including requirements for governmental permits and approvals.
The occurrence of an event caused by an operational risk that is material could have a material adverse effect on the Company's business, financial condition, liquidity and operating results.
COVID-19 Global Pandemic
The Company faces risks from the COVID-19 global pandemic which has had, and will continue to have, a material adverse impact on our business and financial condition. The future impact of the COVID-19 global pandemic is inherently uncertain, and is expected to negatively impact the financial ability of our customers to purchase vehicles from us, of our suppliers ability to deliver products used in the manufacture of our all-electric vehicles in a timely manner, in our employees' ability to manufacture our vehicles and to carry out their other duties in order to sustain our business, and in our ability to collect certain receivables owing to us, among other factors. In addition, COVID-19 has caused a significant reduction in public transit ridership, which is one of the primary market segments served by Greenpower, which may lead to reduced future sales to this segment, as transit properties adjust to changing demand for their services. We have taken steps to modify our business and staffing levels in order to manage impacts caused by the COVID-19 global pandemic and resulting government and regulatory health orders, these factors are expected to continue to have a negative impact on our financial results, operations, outlook, goals, growth prospects, cash flows, liquidity and share price, and the potential timing and ultimate duration of these negative impacts is uncertain.
No Operating History
The Company has not paid any dividends and may not produce earnings or pay dividends in the immediate or foreseeable future.
Reliance on Management
The Company is relying solely on the past business success of its directors and officers. The success of the Company is dependent upon the efforts and abilities of its directors, officers and employees. The loss of any of its directors, officers or employees could have a material adverse effect upon the business and prospects of the Company.
Volatile Operating Results
Our orders with our customers may require time-consuming customization and specification. We incur significant operating expenses when we are building a bus prior to sale or designing and testing a new bus. If there are delays in the sale of buses to customers, such delays may lead to significant fluctuations in results of operations from quarter to quarter, making it difficult to predict our financial performance on a quarterly basis.
Current requirements and regulations may change or become more onerous
The Company's products must comply with local regulatory and safety requirements in order to be allowed to operate within the relevant jurisdiction or to qualify for funding. These requirements are subject to change and one regulatory environment is not indicative of another.
Competition in the industry
The Company competes against a number of existing manufacturers of all-electric buses and vehicles, traditional diesel buses and other medium-duty vehicles with various models based on size, purpose or performance features. The Company competes in the non-diesel or alternative fuel segment of this market. Several of the company's competitors, both publicly listed and privately owned, have recently raised a
significant amount of capital to invest in the growth and development of their businesses which has increased the competitive threat from several well-capitalized competitors. In addition to existing competitors in various market segments, there is the potential for future competitors to enter the market over the next several years.
Provision for Warranty Costs
The Company offers warranties on the vehicles it sells. Management estimates the related provision for future warranty claims based on historical warranty claim information as well as recent trends that might suggest past cost information may differ from future claims. Factors that could impact the estimated claim information include the success of the Company's productivity and quality initiatives as well as parts and labour costs. Actual warranty expense will differ from the provisions which are estimated by management.
Sales, Marketing, and Government Grants and Subsidies
Presently, the initial price of the Company's products are higher than a traditional diesel bus and certain grants and subsidies are available to offset these higher prices. These grants and subsidies include but are not limited to the Hybrid and Zero-Emission Truck and Bus Voucher Incentive Project ("HVIP") from the California Air Resources Board ("CARB") in partnership with Calstart, the Specialty-Use Vehicle Incentive Program funded by the Province of British Columbia, Canada, the clean trucks NYSERDA program and the New York Voucher Incentive Program in the state of New York, the South Coast AQMD funding in California, Federal Transit Authority funding for eligible transit properties across the US, and VW Mitigation Trust Funds allocated to programs throughout the US. The ability for potential purchasers to receive funding from these programs is subject to the risk of the programs being funded by governments, and the risk of the delay in the timing of advancing funds to the specific programs. To the extent that program funding is not approved, or if the funding is approved but timing of advancing of funds is delayed, subject to cancellation, or otherwise uncertain, this could have a material adverse effect on our business, financial condition, operating results and prospects.
Litigation and Legal Proceedings
As of the date of this report the Company is not currently a party to any litigation or legal proceedings which are material, either individually or in the aggregate. However, the company may in the future be involved in litigation or legal proceedings that are material and may require recognition as a provision or contingent liability on the Company's financial statements. The Company has filed a civil claim against the prior CEO and Director of the Company in the Province of British Columbia, and the prior CEO and Director has filed a response with a counterclaim for wrongful dismissal in the Province of British Columbia. The Company does not expect the outcome of either its claim, or the claim filed against it, to be material, and as of the date of this report the resolution of these claims, including the potential timing or financial impact of these claims is inherently uncertain.
Tariffs and Trade Restrictions
The United States and China signed a trade agreement in January 2020 after a trade war between the two countries that led to the implementation of tariffs on approximately $360 billion of Chinese imports to the United States. GreenPower's buses include parts and components imported from China, and tariffs are applied to imports of these products to the United States. These tariffs have increased the cost of GreenPower's buses imported to the United States and have had and will continue to have a negative impact on our gross margins, profitability, financial performance and financial position. Any escalation of the tariffs on imported goods from China and other countries to the United States, or the imposition of other types of trade restrictions, will cause further negative impacts to our gross margin, profitability, financial performance and financial position.