This Management's Discussion and Analysis ("MD&A") is dated as of November 12, 2021 unless otherwise indicated and should be read in conjunction with the unaudited consolidated condensed interim financial statements of GreenPower Motor Company Inc. ("GreenPower", "the Company", "we", "our" or "us") for the three and six months ended September 30, 2021 and the related notes. This MD&A was written to comply with the requirements of National Instrument 51-102 - Continuous Disclosure Obligations. Results are reported in US dollars, unless otherwise noted. In the opinion of management, all adjustments (which consist only of normal recurring adjustments) considered necessary for a fair presentation have been included. The results presented for the three and six months ended September 30, 2021 are not necessarily indicative of the results that may be expected for any future period. The consolidated condensed interim financial statements are prepared in compliance with International Financial Reporting Standards.
For the purposes of preparing this MD&A, management, in conjunction with the Board of Directors, considers the materiality of information. Information is considered material if: (i) such information results in, or would reasonably be expected to result in, a significant change in the market price or value of the Company's common shares; or (ii) there is a substantial likelihood that a reasonable investor would consider it important in making an investment decision; or (iii) if it would significantly alter the total mix of information available to investors. Management, in conjunction with the Board of Directors, evaluates materiality with reference to all relevant circumstances, including potential market sensitivity.
Further information about the Company and its operations can be obtained from the offices of the Company or from www.sedar.com.
Cautionary Note Regarding Forward-Looking Information
Certain statements contained in the following MD&A constitute forward-looking statements. Such forward looking statements involve a number of known and unknown risks, uncertainties and other factors which may cause the actual results, performance or achievements of the Company to be materially different from any future results, performance or achievements expressed or implied by such forward-looking statements. Readers are cautioned not to place undue reliance on these forward-looking statements.
Description of Business
GreenPower designs, manufactures and distributes a line of electric vehicles, including transit buses, school buses, shuttles, cargo vans, double-deckers and trucks. GreenPower employs a clean-sheet design to build all-electric commercial vehicles that are purpose built to be battery powered with zero emissions. GreenPower incorporates the latest technology into all of their compelling vehicles. The GreenPower solution incorporates: Vehicles with best in class range and payload coupled with industry best after sales support equals a competitive edge in the medium and heavy duty, commercial EV Space. For further information go to www.greenpowermotor.com
Operations
The following is a description of GreenPower's business activities during the three months ended September 30, 2021. During the quarter the Company completed and delivered 10 EV Star Cab and Chassis for which the Company provided lease financing, and which were accounted for as finance leases, and completed the sale of 2 BEAST school buses, 1 EV Star Plus, and the sale of 3 EV Stars. In addition, Greenpower sold 28 EV Stars that were previously on lease, where the leases were cancelled and the vehicles subsequently sold, and recognized revenue from finance and operating leases and other sources. During the quarter, GreenPower continued to invest in the production of its all-electric medium and heavy-duty vehicles, with a particular emphasis on the BEAST all-electric school bus and its suite of six models of EV Stars, and completed the quarter with over 70 vehicles in finished goods inventory, nearly 260 vehicles under production, as well as spare parts inventory in excess of $300k.
GreenPower has continued to focus on production and finished the quarter with its highest ever finished goods inventory, including over 70 completed vehicles ready to deliver to customers over the coming months and additional vehicles under production that are expected to be completed this quarter. With this increased level of inventory ready to deliver to customers, GreenPower anticipates that we will see a corresponding increase in sales as we enter the second half of the year. We are encouraged as we continue this progression, and credit the ongoing efforts and dedication of our talented team as they navigate a challenging business environment and continue to execute on our stated goals.
GreenPower is one of only a handful of manufacturers that has been consistently delivering all-electric medium and heavy-duty vehicles to customers for several years and with completed units in inventory ready to deliver to customers. We believe these factors differentiate GreenPower from competitors, and positions us well in a market where demand is growing significantly and is expected to continue this growth trajectory for several years. This quarter, we were excited to deliver vehicles in both Canada and the US with several new customers that included EV Stars that will be used for employee transportation at Fortune 500 companies. This ongoing diversification of our customer base and of our geographic footprint is the culmination of years of effort. We anticipate that we will continue to reach new milestones in our business as we continue this growth progression.
This quarter GreenPower delivered its first two BEAST all-electric school buses to school districts in Southern California. The BEAST is an all-electric 40-foot, 90 seat, Type D school bus delivering a range of up to 150 miles on a single charge via a 194kWh battery pack. The deliveries were made to some of the largest school districts in Southern California with school bus fleets that provide potential for ongoing business as districts transition to zero-emission student transportation.
During the quarter, GreenPower completed its first delivery of 10 EV Star cab and chassis ("EV Star CC") to WeShip, which were primarily funded with HVIP vouchers, and the remainder through lease financing. WeShip will be utilizing the vehicles in a first of its kind utility in Southern California. GreenPower continues to receive significant interest in the EV Star CC, as this versatile all-electric cab and chassis can be upfitted to meet the unique specifications of customers for a wide range of end uses. We anticipate that EV Star CC deliveries will continue to increase over time based on the versatility of this vehicle and the demand we are seeing in the marketplace.
GreenPower completed a follow-on sale of 24 EV Stars to Zeem Solutions during the quarter, in addition to the 30 EV Stars delivered to Zeem since the beginning of the year. The EV Stars were previously on lease to Green Commuter and the leases were cancelled prior to the sale. The vehicles will be used in Zeem's operations providing e-mobility solutions to fleet operators across the US. Based on their business plans and growth, GreenPower anticipates that additional vehicles will be delivered to Zeem by the end of the year. Additionally, a total of seven EV Stars were sold to a diverse group of customers in California, to be used for employee transportation at Fortune 500 companies, public transportation in the City of Temecula, and to a vehicle upfitter.
GreenPower completed the delivery of an EV Star Plus to a school in Vancouver, Canada during the quarter, which utilized rebates available from the Province of British Columbia to fund a portion of the purchase price. The vehicle will be used by the school for student transportation, and represents the ongoing diversification of GreenPower's customer base, sales geography, and access to government funding incentives.
In summary, the continued focus on building out GreenPower's inventory and sales capabilities in different geographies has positioned the company well for the current market environment. Management remains committed to capitalizing on near term growth opportunities, and believes that our efforts will translate to increased sales and cash flow in the second half of the year.
Inventory, Property and Equipment
As at September 30, 2021 the Company had:
- Three EV350's, two Synapse shuttles, 5 EV Stars, 8 vehicles and ancillary equipment classified as property and equipment on the balance sheet totaling $1,376,273
- Work in process inventory and production supplies representing EV Star's, EV 250's, BEAST Type D school buses, spare parts and supplies totaling $14,422,581 and;
- Finished goods inventory representing EV Star Transit +, EV Star Cab and Chassis, BEAST school buses, EV Stars, EV Star Cargo, an EV 350 and charging stations totaling $8,417,053.
Trends
The Company does not know of any trends, commitments, events, or uncertainty that are expected to have a material effect on the Company's business, financial condition, or results of operations other than as disclosed herein under "Risk Factors" and the paragraph below.
Results of Operations
For the three-month period ended September 30, 2021
For the three-month period ended September 30, 2021 the Company recorded revenues of $4,441,963 and cost of sales of $3,488,972 generating a gross profit of $952,991 or 21.5% of revenues. GreenPower's gross profit margin for the quarter was below its 30% target primarily due to the sale of vehicles that were previously on lease at a gross margin of below 20%, as well as the sale of EV Star Cab and Chassis for which the company provided lease financing and the sale of BEAST school buses at a gross margin of slightly above 20%. Revenue was generated from the sale of 31 EV Stars, 2 BEAST school buses, 1 EV Star+, from the sale of parts and from the sale of 10 EV Star Cab and Chassis for which the Company provided lease financing and which were accounted for as finance leases, as well as from finance and operating leases and other sources. Operating costs consisted of administrative fees of $1,451,545 relating to salaries, project management, accounting, and administrative services; transportation costs of $92,328 which relate to the use of trucks, trailers, contractors as well as other operational costs needed to transport company products around North America; travel, accommodation, meals and entertainment costs of $134,704 related to travel for project management, demonstration of company products, and trade shows; product development costs of $307,175; sales and marketing costs of $197,532; insurance expense of $236,652; professional fees of $329,655 consisting of legal and audit fees; and office expense of $97,496 consisting of rent and other office expenses, as well as non-cash expenses including $934,804 of share-based compensation expense and depreciation of $133,113, generating a loss from operations before interest, accretion, foreign exchange and other income of $2,989,155.
Interest and accretion of $87,211, other income of $362,978 primarily related to the forgiveness of a loan, and a foreign exchange gain of $100 resulted in a loss for the period of $2,713,288. Non-cash expenses consisting of depreciation, accretion and accrued interest, share-based payments, warranty accrual, amortization of deferred financing fees and recovery for credit losses totaled $1,333,583 in the three-month period.
The consolidated total comprehensive loss for the three-month period was impacted by $29,078 of other comprehensive loss as a result of the translation of the entities with a different functional currency than presentation currency.
For the six-month period ended September 30, 2021
For the six-month period ended September 30, 2021 the Company recorded revenues of $7,100,965 and cost of sales of $5,297,342 generating a gross profit of $1,803,623 or 25.4% of revenues. Revenue was generated from the sale of 32 EV Stars, 5 EV Star CC's, 2 BEAST school buses, 1 EV Star+, from the sale of parts and from the sale of 15 EV Stars and 10 EV Star Cab and Chassis for which the Company provided lease financing and which were accounted for as finance leases, as well as from finance and operating leases and other sources. Operating costs consisted of administrative fees of $2,519,157 relating to salaries, project management, accounting, and administrative services; transportation costs of $133,695 which relate to the use of trucks, trailers, contractors as well as other operational costs needed to transport company products around North America; travel, accommodation, meals and entertainment costs of $216,311 related to travel for project management, demonstration of company products, and trade shows; product development costs of $640,668; sales and marketing costs of $287,844; insurance expense of $430,623; professional fees of $519,764 consisting of legal and audit fees; and office expense of $163,930 consisting of rent and other office expenses, as well as non-cash expenses including $1,678,317 of share-based compensation expense and depreciation of $265,475, generating a loss from operations before interest, accretion, foreign exchange and other income of $5,064,633.
Interest and accretion of $271,482, other income of $362,978 primarily related to the forgiveness of a loan, and a foreign exchange loss of $1,774 resulted in a loss for the period of $4,974,911.
The consolidated total comprehensive loss for the three-month period was impacted by $26,876 of other comprehensive loss as a result of the translation of the entities with a different functional currency than presentation currency.
For the three-month period ended September 30, 2020
For the three-month period ended September 30, 2020 the Company recorded revenues of $2,835,411 and cost of sales of $1,951,692 generating a gross profit of $883,719 or 31.2% of revenues. Revenue was generated from the delivery of 20 EV Stars for which the Company provided lease financing and which were accounted for as finance leases, from the sale of one all-electric school bus, from the sale of parts, as well as revenue from finance and operating leases and other sources. Operating costs consisted of administrative fees of $759,906 relating to salaries, project management, accounting, and administrative services; transportation costs of $26,755 which relate to the use of trucks, trailers, contractors as well as other operational costs needed to transport company products around North America; travel, accommodation, meals and entertainment costs of $68,008 related to travel for project management, demonstration of company products, and trade shows; product development costs of $235,699; sales and marketing costs of $62,574; insurance expense of $100,337; professional fees of $61,650 consisting of legal and audit fees; and office expense of $149,589 consisting of rent and other office expenses, as well as non-cash expenses including $117,737 of share-based compensation expense and depreciation of $117,471, generating a loss from operations before interest, accretion and foreign exchange of $836,391.
Interest and accretion on the line of credit, convertible debentures and promissory notes totalled $505,589, and a foreign exchange loss of $144,179 resulted in a loss for the period of $1,486,160. Non-cash expenses consisting of depreciation, accretion and accrued interest, share-based payments, warranty accrual, amortization of deferred financing fees and allowance for credit losses totaled $667,415 in the three-month period.
The consolidated total comprehensive loss for the three-month period was impacted by $184,157 of other comprehensive loss as a result of the translation of the entities with a different functional currency than presentation currency.
For the six-month period ended September 30, 2020
For the six-month period ended September 30, 2020 the Company recorded revenues of $5,107,666 and cost of revenues of $3,605,364 generating a gross profit of $1,502,302 or 29.4% of revenues. Revenue was generated from the sale of 38 EV Stars for which the Company provided lease financing and which were accounted for as finance leases, from the sale of one all-electric school bus, from the sale of parts, as well as revenue from finance and operating leases and other sources. Operating costs consisted of administrative fees of $1,509,198 relating to salaries, project management, accounting, and administrative services; transportation costs of $53,496 which relate to the use of trucks, trailers, contractors as well as other operational costs needed to transport company products around North America; travel, accommodation, meals and entertainment costs of $104,861 related to travel for project management, demonstration of company products, and trade shows; product development costs of $456,808; sales and marketing costs of $53,044; insurance expense of $208,975; professional fees of $158,076 consisting of legal and audit fees; and office expense of $200,548 consisting of rent and other office expenses, as well as non-cash expenses including $249,769 of share-based compensation expense and depreciation of $232,232, generating a loss from operations before interest, accretion and foreign exchange of $(1,711,536).
Interest and accretion on the line of credit, convertible debentures and promissory notes totalled $1,060,908, and a foreign exchange loss of $143,053 resulted in a loss for the period of $2,915,497.
The consolidated total comprehensive loss for the six-month period was impacted by $176,187 of other comprehensive loss as a result of the translation of the entities with a different functional currency than presentation currency.
The following tables provide a summary of selected information for the last eight quarters:
| | | Three Months Ended | |
| | | September 30, | | | June 30, | | | March 31, | | | December 31, | |
| | | 2021 | | | 2021 | | | 2021 | | | 2020 | |
| Financial results | | | | | | | | | | | | |
| Revenues | $ | 4,441,963 | | $ | 2,659,002 | | $ | 4,378,131 | | $ | 2,398,781 | |
| Income (loss) for the period | | (2,713,288 | ) | | (2,261,623 | ) | | (2,788,149 | ) | | (2,133,105 | ) |
| Basic and diluted earnings/(loss) per share* | $ | (0.12 | ) | $ | (0.11 | ) | $ | (0.13 | ) | $ | (0.11 | ) |
| Balance sheet data | | | | | | | | | | | | |
| Working capital | | 31,327,058 | | | 31,391,694 | | | 30,808,375 | | | 31,310,393 | |
| Total assets | | 40,864,596 | | | 40,930,620 | | | 39,619,355 | | | 39,814,446 | |
| Shareholders' equity | | 36,700,920 | | | 36,967,980 | | | 36,152,448 | | | 36,956,026 | |
| | | | | | | | | | | | | |
| | | Three Months Ended | |
| | | September 30, | | | June 30, | | | March 31, | | | December 31, | |
| | | 2020 | | | 2020 | | | 2020 | | | 2019 | |
| Financial results | | | | | | | | | | | | |
| Revenues | $ | 2,835,411 | | $ | 2,272,255 | | $ | 642,401 | | $ | 4,977,548 | |
| Income (loss) for the period | | (1,486,160 | ) | | (1,429,337 | ) | | (2,114,027 | ) | | (1,056,087 | ) |
| Basic and diluted earnings/(loss) per share* | $ | (0.09 | ) | $ | (0.09 | ) | $ | (0.14 | ) | $ | (0.07 | ) |
| Balance sheet data | | | | | | | | | | | | |
| Working capital (deficit) | | 32,477,352 | | | (707,573 | ) | | 743,131 | | | 2,319,481 | |
| Total assets | | 43,044,685 | | | 14,473,657 | | | 13,207,679 | | | 16,811,834 | |
| Shareholders' equity | | 34,647,254 | | | (2,396,707 | ) | | (1,174,956 | ) | | 876,200 | |
| * Based upon the weighted average number of shares issued and outstanding for the period, retroactively restated for the seven-for-one share consolidation completed on August 28, 2020. |
The following table summarizes vehicle deliveries pursuant to vehicle leases and vehicle sales for the last four quarters:
| | For the three months ended |
| | Sept 30, | June 30, | March 31, | December 31, |
| | 2021 | 2021 | 2021 | 2020 |
| Vehicle Sales | | | | |
| EV Star (1,2) | 32 | 6 | 30 | 3 |
| BEAST school bus | 2 | 0 | 0 | 0 |
| Total | 34 | 6 | 30 | 3 |
| Vehicle Leases | | | | |
| EV 250 | 0 | 0 | 5 | 0 |
| EV Star (1,2) | 10 | 15 | 0 | 14 |
| Total | 10 | 15 | 5 | 14 |
| | | | | |
| Total Deliveries | 44 | 21 | 35 | 17 |
| 1) Includes various models of EV Stars. | | |
| 2) 28 EV Stars sold in the quarter ended September 30, 2021 were previously on leases that were cancelled and subsequently sold, and the leases were originally entered into in the quarters ending June 30, 2021 (14 EV Stars), December 31, 2020 (9 EV Stars), September 30, 2020 (2 EV Stars), June 30, 2020 (1 EV Star), and December 31, 2019 (2 EV Stars). 30 EV Stars sold in the quarter ended March 30, 2021 were previously on leases that were entered into in December 2019 (13 EV Stars), June 2020 (11 EV Stars), and September 2020 (6 EV Stars). These 30 leases were cancelled during the quarter and the vehicles were subsequently sold. |
The following table summarizes cash expenses for the last four quarters:
| | | For the three months ended | |
| | | Sept 30, 2021 | | | June 30, 2021 | | | March 31, 2021 | | | Dec 31, 2020 | |
| | | | | | | | | | | | | |
| Total Expenses | $ | 4,029,457 | | $ | 3,112,255 | | $ | 3,910,503 | | $ | 3,042,913 | |
| Less: | | | | | | | | | | | | |
| Depreciation | | (133,113 | ) | | (132,363 | ) | | (82,150 | ) | | (122,881 | ) |
| Accretion and accrued interest | | (5,185 | ) | | (6,482 | ) | | 65,482 | | | (133,759 | ) |
| Share-based payments | | (934,804 | ) | | (743,513 | ) | | (1,278,194 | ) | | (570,798 | ) |
| Amortization of deferred financing fees | | (80,409 | ) | | (177,408 | ) | | (163,105 | ) | | (161,099 | ) |
| Warranty Accrual | | (152,930 | ) | | (93,898 | ) | | (78,019 | ) | | (136,576 | ) |
| (Allowance) / recovery for credit losses | | (27,142 | ) | | 14,670 | | | (338,818 | ) | | (8,278 | ) |
| | | | | | | | | | | | | |
| Total Cash Expenses (1) | $ | 2,695,874 | | $ | 1,973,261 | | $ | 2,035,699 | | $ | 1,909,522 | |
The following table summarizes adjusted EBITDA for the last four quarters:
| | | For the three months ended | |
| | | Sept 30, 2021 | | | June 30, 2021 | | | March 31, 2021 | | | Dec 31, 2020 | |
| | | | | | | | | | | | | |
| Loss for the period | $ | (2,713,288 | ) | $ | (2,261,623 | ) | $ | (2,788,149 | ) | $ | (2,133,106 | ) |
| Plus: | | | | | | | | | | | | |
| Depreciation | | 133,113 | | | 132,363 | | | 82,150 | | | 122,881 | |
| Interest and accretion | | 87,211 | | | 184,271 | | | 175,450 | | | 362,230 | |
| Share-based payments | | 934,804 | | | 743,513 | | | 1,278,194 | | | 570,798 | |
| Allowance / (recovery) for credit losses | | 27,142 | | | (14,670 | ) | | 338,818 | | | 8,278 | |
| Warranty Accrual | | 152,930 | | | 93,898 | | | 78,019 | | | 136,576 | |
| | | | | | | | | | | | | |
| Adjusted EBITDA (1) | $ | (1,378,088 | ) | $ | (1,122,248 | ) | $ | (835,518 | ) | $ | (932,343 | ) |
(1) Non-IFRS Financial Measures:
"Total Cash Expenses" as reflected above reflects the total expenses of the Company (total sales, general and administrative costs including interest and accretion, and the foreign exchange gain or loss) excluding depreciation, accretion and accrued interest, share-based payments, amortization of deferred financing fees, warranty accrual and (allowance)/recovery for credit losses. Total Cash Expenses is a measure used by the Company as an indicator of cash expenses that excludes the impact of certain non-cash charges. Therefore, Total Cash Expenses gives the investor information as to the ongoing cash expenses from the operations of the business. However, Total Cash Expenses is not a measure of financial performance under IFRS and should not be considered a substitute for other financial measures of performance. Total Cash Expenses as calculated by GreenPower may not be comparable to Total Cash Expenses as calculated and reported by other companies.
"Adjusted EBITDA" as reflected above reflects net income or loss before interest, taxes, share-based payments, depreciation and amortization, allowance/(recovery) for credit losses and warranty accrual. Adjusted EBITDA is a measure used by analysts and investors as an indicator of operating cash flow since it excludes the impact of movements in working capital items, non-cash charges and financing costs. Therefore, Adjusted EBITDA gives the investor information as to the cash generated from the operations of a business. However, Adjusted EBITDA is not a measure of financial performance under IFRS and should not be considered a substitute for other financial measures of performance. Adjusted EBITDA as calculated by GreenPower may not be comparable to Adjusted EBITDA as calculated and reported by other companies. The most comparable IFRS measure to Adjusted EBITDA is net income.
Liquidity
At September 30, 2021, the Company had a cash and restricted cash balance of $7,995,378 and working capital of $31,327,058. The Company's line of credit has a maximum credit limit of up to $8,000,000 and amounts available on the line of credit in excess of $5,000,000 are subject to margining requirements, and as at September 30, 2021 the Line of Credit had a drawn balance of nil. The Company manages its capital structure and makes adjustments to it based on available funds to the Company. The Company may continue to rely on additional financings and the sale of its inventory to further its operations and meet its capital requirements to manufacture EV vehicles, expand its production capacity and further develop its sales, marketing, engineering, and technical resources.
Capital Resources
Three months ended September 30, 2021 and up to the date of this report
Authorized: Unlimited number of common shares without par value
Authorized: Unlimited number of preferred shares without par value
The Company has an incentive stock option plan whereby it grants options to directors, officers, employees, and consultants of the Company. On May 14, 2019, the Company replaced its Fixed Stock Option Plan (the "2016 Plan") with a Rolling Stock Option Plan (the "2019 Plan"). Under the terms of the 2019 Plan, the aggregate number of Options that can be granted under the 2019 Plan cannot exceed ten (10%) of the total number of issued and outstanding Shares, calculated on a non-diluted basis. The exercise price of options granted under the 2019 Plan may not be less than the minimum prevailing price permitted by the TSXV policies with a maximum term of 10 years.
The Company completed a seven-for-one share consolidation on August 28, 2020. All figures in this Note have been retroactively restated to give effect to this share consolidation.
On March 9, 2016, the shareholders approved the previous stock option plan which initially allowed for the issuance of up to 1,491,541 shares and which was subsequently further increased to allow up to 2,129,999 shares to be issued under the plan (the "2016 Plan"). Prior to the adoption of the 2016 Plan, the Company had adopted an incentive stock option plan (the "Plan"), whereby it could grant options to directors, officers, employees, and consultants of the Company.
The Company had the following incentive stock options granted under the 2019 Plan, and 2016 Plan that are issued and outstanding as at September 30, 2021:
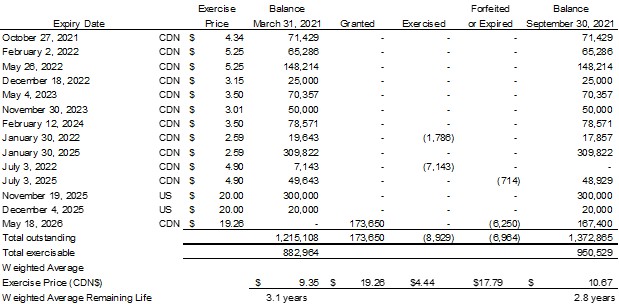
As at September 30, 2021, there were 829,850 stock options available for issuance under the 2019 plan.
During the three months ended September 30, 2021, the Company incurred share-based compensation expense with a measured fair value of $934,804 (September 30, 2020 - $117,737). The fair value of the options granted and vested were recorded as share-based payments on the Consolidated Condensed Interim Statements of Operations and Comprehensive Loss. During the three months ended June 30, 2021, the Company incurred share-based compensation expense with a measured fair value of $743,513 (June 30, 2020 - $132,032). The fair value of the options granted and vested were recorded as share-based payments on the Consolidated Condensed Interim Statements of Operations and Comprehensive Loss. Subsequent to the end of the quarter 71,429 shares were issued to Brendan Riley, the President and Director of GreenPower, at CDN$4.34 per share pursuant to the exercise of stock options.
As at September 30, 2021, the Company had outstanding warrants, enabling the holders to acquire common shares as follows:
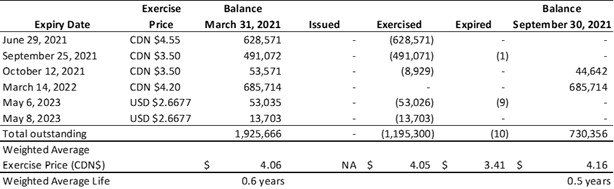
During the quarter ended September 30, 2021 GreenPower issued a total of 566,729 shares pursuant to the exercise of warrants, summarized as follows:
- 500,000 shares issued from the exercise of warrants at a price of CDN $3.50 per share, including 357,143 shares issued to Countryman, a company beneficially owned by GreenPower's director David Richardson, 80,357 shares issued to KFS, a company beneficially owned by GreenPower's CEO and Chairman, Fraser Atkinson, and 53,571 shares issued to Malcolm Clay, a director of Greenpower
- 66,729 shares issued from the exercise of warrants at a price of USD$2.6677 per share
During the quarter a total of 10 warrants expired unexercised. Subsequent to the end of the quarter, 44,642 shares were issued from the exercise of warrants at a price of CDN $3.50 per share.
Off-Balance Sheet Arrangements
As of the date of this filing, the Company does not have any off-balance sheet arrangements that have, or are reasonably likely to have, a current or future effect on the results of operations or financial condition of the Company including, without limitation, such considerations as liquidity and capital resources that have not previously been discussed.
Related Party Transactions
A summary of compensation for directors, officers and key management personnel is as follows:
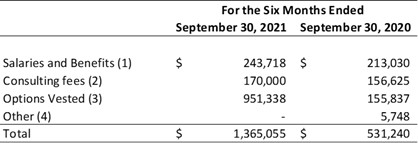
1) Salaries and benefits incurred with officers and a former officer are included in Administrative fees on the Consolidated Condensed Interim Statements of Operations and Comprehensive Loss.
2) Consulting fees included in Administrative Fees on the Consolidated Condensed Interim Statements of Operations and Comprehensive Loss are paid to the current Chairman and CEO for management consulting services, as well as Director's fees paid to GreenPower's four independent directors.
3) Amounts recognized for related party stock-based compensation are included in Share-based payments on the Consolidated Condensed Interim Statements of Operations and Comprehensive Loss.
4) Other fees for truck and trailer rentals paid to a company that the CEO and Chairman of GreenPower was previously an officer and director and the former CEO of GreenPower is an officer and director. These costs are included in Transportation costs on the Consolidated Condensed Interim Statements of Operations and Comprehensive Loss.
Accounts payable and accrued liabilities at September 30, 2021 included $1,586 (March 31, 2021 - $95,741) owed to officers, directors, and companies controlled by officers and directors, and shareholders, which is non-interest bearing, unsecured and has no fixed terms of repayment.
A director of the Company and the Company's CEO and Chairman have each provided personal guarantees of $2,510,000, or $5,020,000 in total to support the Company's $8 million line of credit. In consideration for these guarantees, in June 2018 the Company issued 628,571 non-transferrable common share purchase warrants exercisable at an exercise price of CDN $4.55 per share that were exercised during the quarter ended June 30, 2021, and in March 2019 the Company issued 685,714 non-transferrable common share purchase warrants exercisable at an exercise price of CDN $4.20 per share that expire on March 14, 2022.
On May 31, 2021 the Company issued 342,857 shares to a company beneficially owned by David Richardson, a director of GreenPower, pursuant to the exercise of 342,857 warrants at a price of CDN $4.55 per warrant, for gross proceeds of CDN $1,559,999.
On June 14, 2021 the Company issued 285,714 shares to a company beneficially owned by Fraser Atkinson, the Chairman and CEO of GreenPower, pursuant to the exercise of 285,714 warrants at a price of CDN $4.55 per warrant, for gross proceeds of CDN $1,299,999.
On August 24, 2021 the Company issued 357,143 shares to a company beneficially owned by David Richardson, a director of GreenPower, pursuant to the exercise of 357,143 warrants at a price of CDN $3.50 per warrant, for gross proceeds of CDN $1,250,001.
On August 27, 2021 the Company issued 80,357 shares to a company beneficially owned by Fraser Atkinson, the Chairman and CEO of GreenPower, pursuant to the exercise of 80,357 warrants at a price of CDN $3.50 per warrant, for gross proceeds of CDN $281,250.
On September 20, 2021 the Company issued 53,571 shares to Malcolm Clay, a director of GreenPower, pursuant to the exercise of 53,571 warrants at a price of CDN $3.50 per warrant, for gross proceeds of CDN $187,499.
Subsequent to the end of the quarter 71,429 shares were issued to Brendan Riley, the President and Director of GreenPower pursuant to the exercise of stock options, at a price of CDN $4.34 per share for gross proceeds of CDN $310,002.
These transactions were measured at the exchange amount, which is the amount agreed upon by the transacting parties.
New and Amended Standards
Adoption of accounting standards
The Company did not adopt any new or amended accounting standards during the three months ended September 30, 2021.
Future accounting pronouncements
Certain new accounting standards and interpretations have been published by the IASB or the IFRS Interpretations Committee that are not mandatory for the September 30, 2021 reporting period.
The Company has reviewed new and revised accounting pronouncements that have been issued but are not yet effective. The Company has not early adopted any of these standards and is currently evaluating the impact, if any, that these standards might have on its consolidated condensed interim financial statements.
Critical Accounting Estimates
Significant assumptions about the future and other sources of estimation uncertainty that management has made at the end of the reporting period, that could result in a material adjustment to the carrying amounts of assets and liabilities, in the event that actual results differ from assumptions made, relate to, but are not limited to, the inputs used in the Black-Scholes option pricing model to measure share-based compensation and warrants, determination of the useful life of equipment, the carrying value of accounts receivable and the promissory note receivable and the associated allowance for credit losses, net realizable value of inventory, provision for warranty expense, and the $nil provision for income taxes. Critical estimates used in the preparation of these accounting statements include but are not limited to the following:
Critical accounting judgments
i. the determination of the discount rate to use to discount the promissory note receivable, finance lease receivable and lease liabilities;
ii. the determination of the functional currency of each entity within the consolidated Company;
iii. the Company's ability to continue as a going concern.
iv. The classification of leases as either financial leases or operating leases; and
v. The identification of performance obligations in revenue contracts and the determination of when they are satisfied.
Financial Instruments
The Company's financial instruments consist of cash and restricted cash, accounts receivable, finance lease receivables, promissory note receivable, accounts payable and accrued liabilities, promissory note payable, payroll protection loan, and lease liabilities. As at September 30, 2021, the Company had working capital of $31,327,058.
The Company has exposure to the following financial instrument related risks.
Credit risk
The Company's exposure to credit risk is on its cash, restricted cash, accounts receivable, promissory note receivable, and on its finance lease receivables. The maximum exposure to credit risk is their carrying amounts in the consolidated statement of Financial Statements.
Cash and restricted cash consists of cash bank balances held in major financial institutions in Canada and the United States with a high credit quality and therefore the Company is exposed to minimal risk. The Company assesses the credit risk of its account receivable, finance lease receivables and promissory note receivable at each reporting period end and on an annual basis. As at September 30, 2021 the Company recognized an allowance for credit losses, net of recoveries, of $27,142 against its accounts receivable (September 30, 2020 - $20,384).
Liquidity risk
The Company tries to ensure that there is sufficient capital in order to meet short-term business requirements, after taking into account the Company's cash balances and available liquidity on the Company's $8 million operating line of credit. The Company's cash is invested in bank accounts at major financial institutions in Canada and the United States and is available on demand. The Company will continue to rely on additional financings to further its operations and meet its capital requirements.
Market risks
Market risk is the risk of loss that may arise from changes in market factors such as interest rates and foreign exchange. The Company believes interest rate risk is not material.
The Company is exposed to foreign exchange risk as it conducts business in both the United States and Canada. Management monitors its foreign currency balances but the Company does not engage in any hedging activities to reduce its foreign currency risk.
At September 30, 2021, the Company was exposed to currency risk through the following monetary assets and liabilities in CDN Dollars.
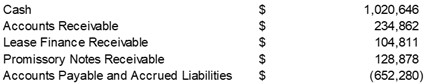
The CDN/USD exchange rate as at September 30, 2021 was $0.7849 (March 31, 2021 - $0.7952). Based on the net exposure and assuming all other variables remain constant, a 10% change in the appreciation or depreciation of the Canadian dollar relative to the US dollar would result in a change of approximately $66,000 to other comprehensive income/loss.
Capital Management
The Company's capital management objective is to obtain sufficient capital to develop new business opportunities for the benefit of its shareholders. To meet these objectives, management monitors the Company's ongoing capital requirements on specific business opportunities on a case-by-case basis. The capital structure of the Company consists of cash, operating line of credit, secured and unsecured promissory notes, convertible debentures and equity attributable to common shareholders, consisting of issued share capital and deficit.
During the second quarter of fiscal 2021 the Company completed an initial public offering and concurrent private placement for gross proceeds of US$37.7 million less underwriting discounts and offering costs. As at September 30, 2021, the Company had a cash and restricted cash balance of $7,995,378, working capital of $31,327,058 accumulated deficit of ($36,600,299), and shareholder's equity of $36,700,920. Subject to market conditions and other factors the Company may raise additional capital in the future to fund and grow its business for the benefit of shareholders.
Outlook
For the immediate future, the Company plans to:
Complete production and delivery of several models of EV Stars and BEAST school buses currently in various stages of production;
Deliver the remaining vehicles in finished goods inventory;
Continue to expand assembly and manufacturing capabilities, including the increased production of BEAST school buses and several models of EV Stars;
Continue to develop and expand sales opportunities and increase its sales backlog;
Further develop its sales and marketing, engineering and technical resources and capabilities.
Capitalization and Outstanding Security Data
The total number of common shares issued and outstanding is 22,096,789 as of September 30, 2021. There are no preferred shares issued and outstanding.
An incentive stock option plan was established for the benefit of directors, officers, employees and consultants of the Company. As of September 30, 2021, there are 1,372,865 options granted and outstanding. The total number of common share warrants outstanding as of the same date is 730,356.
As at November 12, 2021 the company had 22,212,860 issued shares, 1,301,436 options outstanding, and 685,714 warrants outstanding.
Disclosure of Internal Controls
Management is responsible for establishing and maintaining disclosure controls and procedures in order to provide reasonable assurance that material information relating to the Company is made known to them in a timely manner and that information required to be disclosed is reported within time periods prescribed by applicable securities legislation. There are inherent limitations to the effectiveness of any system of disclosure controls and procedures, including the possibility of human error and the circumvention or overriding of the controls and procedures. Accordingly, even effective disclosure controls and procedures can only provide reasonable assurance of achieving their control objectives. The Company's CEO and CFO have concluded that disclosure controls and procedures as at September 30, 2021 were effective.
Risk Factors
Investing in the common shares of the Company involves risk. Prospective investors should carefully consider the risks described below, together with all of the other information included in this MD&A before making an investment decision. If any of the following risks actually occurs, the business, financial condition or results of operations of the Company could be harmed. In such an event, the trading price of the common shares could decline and prospective investors may lose part or all of their investment.
Operational Risk
The Company is exposed to many types of operational risks that affect all companies. Operational risk is the risk of loss resulting from inadequate or failed internal processes, people and/or systems. Operational risk is present in all of the Company's business activities, and incorporates exposure relating to fiduciary breaches, product liability claims, product recalls, regulatory compliance failures, legal disputes, business disruption, technology failures, business integration, damage to physical assets, employee safety, dependence on suppliers, foreign exchange fluctuations, insurance coverage and rising insurance costs. Such risks also include the risk of misconduct, theft or fraud by employees or others, unauthorized transactions by employees, operational or human error or not having sufficient levels or quality of staffing resources to successfully achieve the Company's strategic or operational objectives.
The occurrence of an event caused by an operational risk that is material could have a material adverse effect on the Company's business, financial condition, liquidity and operating results.
COVID-19 Global Pandemic
The Company faces risks from the COVID-19 global pandemic which has had, and may continue to have, a material adverse impact on our business and financial condition. While we have recently seen a gradual re-opening of the economy, and a resumption of travel and sales activity, this activity is not at the level it was prior to the pandemic and the future impact of the COVID-19 global pandemic is inherently uncertain, and may negatively impact the financial ability of our customers to purchase vehicles from us, of our suppliers' ability to deliver products used in the manufacture of our all-electric vehicles, in our employees' ability to manufacture our vehicles and to carry out their other duties in order to sustain our business, and in our ability to collect certain receivables owing to us, among other factors. These factors may continue to have a negative impact on our financial results, operations, outlook, goals, growth prospects, cash flows, liquidity and share price, and the potential timing, severity, and ultimate duration of any potential negative impacts is uncertain.
No Operating History
The Company has not paid any dividends and may not produce earnings or pay dividends in the immediate or foreseeable future.
Reliance on Management
The Company is relying solely on the past business success of its directors and officers. The success of the Company is dependent upon the efforts and abilities of its directors, officers and employees. The loss of any of its directors, officers or employees could have a material adverse effect upon the business and prospects of the Company.
Volatile Operating Results
Our orders with our customers generally require time-consuming customization and specification. We incur significant operating expenses when we are building a bus prior to sale or designing and testing a new bus. If there are delays in the sale of buses to customers, such delays may lead to significant fluctuations in results of operations from quarter to quarter, making it difficult to predict our financial performance on a quarterly basis.
Competition in the industry
The Company competes against a number of existing manufacturers of all-electric buses, traditional diesel buses and other buses with various models based on size, purpose or performance features. The Company competes in the non-diesel or alternative fuel segment of this market. Several of the company's competitors, both publicly listed and privately owned, have recently raised a significant amount of capital to invest in the growth and development of their businesses which has increased the competitive threat from several well-capitalized competitors. In addition to existing competitors in various market segments, there is the potential for future competitors to enter the market over the next several years.
Current requirements and regulations may change or become more onerous
The Company's products must comply with local regulatory and safety requirements in order to be allowed to operate within the relevant jurisdiction or to qualify for funding. These requirements are subject to change and one regulatory environment is not indicative of another.
Reliance on Key Suppliers
Our products contain numerous purchased parts which we source globally directly from suppliers, many of which are single-source suppliers, although we attempt to qualify and obtain components from multiple sources whenever feasible. Any significant increases in our production may require us to procure additional components in a short amount of time, and in the past we have also replaced certain suppliers because of their failure to provide components that met our quality control standards or our timing requirements. There is no assurance that we will be able to secure additional or alternate sources of supply for our components or develop our own replacements in a timely manner, if at all. If we encounter unexpected difficulties with key suppliers, and if we are unable to fill these needs from other suppliers, we could experience production delays and potential loss of access to important technology and parts for producing, servicing and supporting our products.
Provision for Warranty Costs
The Company offers warranties on the transit, charter and school buses it sells. Management estimates the related provision for future warranty claims based on historical warranty claim information as well as recent trends that might suggest past cost information may differ from future claims. Factors that could impact the estimated claim information include the success of the Company's productivity and quality initiatives as well as parts and labour costs. Actual warranty expense will differ from the provisions which are estimated by management.
Sales, Marketing, and Government Grants and Subsidies
Presently, the initial price of the Company's products are higher than a traditional diesel bus and certain grants and subsidies are available to offset these higher prices. These grants and subsidies include but are not limited to the Hybrid and Zero-Emission Truck and Bus Voucher Incentive Project ("HVIP") from the California Air Resources Board ("CARB") in partnership with Calstart, the Specialty-Use Vehicle Incentive Program funded by the Province of British Columbia, Canada, the clean trucks NYSERDA program and the New York Voucher Incentive Program in the state of New York, the South Coast AQMD funding in California, Federal Transit Authority funding for eligible transit properties across the US, and VW Mitigation Trust Funds allocated to programs throughout the US. The ability for potential purchasers to receive funding from these programs is subject to the risk of the programs being funded by governments, and the risk of the delay in the timing of advancing funds to the specific programs. To the extent that program funding is not approved, or if the funding is approved but timing of advancing of funds is delayed, subject to cancellation, or otherwise uncertain, this could have a material adverse effect on our business, financial condition, operating results and prospects.
Litigation and Legal Proceedings
As of the date of this report the Company is not currently a party to any litigation or legal proceedings which are material, either individually or in the aggregate. However, the company may in the future be involved in litigation or legal proceedings that are material and may require recognition as a provision or contingent liability on the Company's financial statements. The Company has filed a civil claim against the prior CEO and Director of the Company in the Province of British Columbia, and the prior CEO and Director has filed a response with a counterclaim for wrongful dismissal in the Province of British Columbia and has also filed a claim for wrongful dismissal in the state of California. In addition, a company owned and controlled by a former employee who provided services to a subsidiary company of GreenPower until August 2013 filed a claim for breach of confidence against GreenPower in July 2020. In May 2021 GreenPower did not renew the dealership agreement with Creative Bus Sales ("CBS"), and CBS is disputing that it should have been renewed. In spite of this dispute, GreenPower continues to work on customer orders with CBS. The Company does not expect the outcome of either its claim, or the claims filed against it, to be material, and as of the date of this report the resolution of these claims, including the potential timing or financial impact of these claims is inherently uncertain.
Tariffs and Trade Restrictions
The United States and China signed a trade agreement in January 2020 after a trade war between the two countries that led to the implementation of tariffs on approximately $360 billion of Chinese imports to the United States. GreenPower's buses include parts and components imported from China, and tariffs are applied to imports of these products to the United States. These tariffs have increased the cost of GreenPower's buses imported to the United States and have had and will continue to have a negative impact on our gross margins, profitability, financial performance and financial position. Any escalation of the tariffs on imported goods from China and other countries to the United States, or the imposition of other types of trade restrictions, will cause further negative impacts to our gross margin, profitability, financial performance and financial position.
Reliance on Shipping
We rely on global shipping for vehicles that we produce at contract manufacturers, and for certain parts and components sourced from our global network of suppliers. We have experienced an increase in shipping costs and have experienced delays of deliveries of parts and components from our global suppliers, and on vehicles arriving from our contract manufacturers. While these delays and cost increases are not currently at a level that they have caused a material disruption or negative impact to our profitability, these delays and costs may increase to a point that they may negatively impact our financial results and ability to grow our business.
Subsequent Events
Subsequent to the end of the quarter:
- 71,429 shares were issued to Brendan Riley, the President and Director of GreenPower at a price of CDN$4.34 per share pursuant to the exercise of stock options, and
- 44,642 shares were issued at a price of CDN$3.50 per share pursuant to the exercise of warrants.