Filed Pursuant to Rule 424(b)(3)
Registration No. 333-251136
HINES GLOBAL INCOME TRUST, INC.
SUPPLEMENT NO. 4, DATED AUGUST 18, 2021
TO THE PROSPECTUS, DATED JUNE 2, 2021
This prospectus supplement (this “Supplement”) is part of and should be read in conjunction with the prospectus of Hines Global Income Trust, Inc., dated June 2, 2021 (the “Prospectus”), as supplemented by Supplement No. 1, dated June 16, 2021, Supplement No. 2, dated July 16, 2021 and Supplement No. 3, dated August 17, 2021. Unless otherwise defined herein, capitalized terms used in this Supplement shall have the same meanings as in the Prospectus.
The purpose of this Supplement is to include our Quarterly Report on Form 10-Q for the quarter ended June 30, 2021, as filed with the Securities and Exchange Commission on August 16, 2021. The report (without exhibits) is attached to this Supplement.
UNITED STATES SECURITIES AND EXCHANGE COMMISSION
Washington, D.C. 20549
FORM 10-Q
| (Mark One) | |||||
| ☒ | QUARTERLY REPORT PURSUANT TO SECTION 13 OR 15(d) OF THE SECURITIES EXCHANGE ACT OF 1934 | ||||
For the quarterly period ended June 30, 2021
or
| ☐ | TRANSITION REPORT PURSUANT TO SECTION 13 OR 15(d) OF THE SECURITIES EXCHANGE ACT OF 1934 | ||||
For the transition period from to
Commission file number: 000-55599
Hines Global Income Trust, Inc.
(Exact name of registrant as specified in its charter)
| Maryland | 80-0947092 | |||||||
| (State or other jurisdiction of incorporation or organization) | (I.R.S. Employer Identification No.) | |||||||
| 2800 Post Oak Boulevard | ||||||||
| Suite 5000 | ||||||||
| Houston | Texas | 77056-6118 | ||||||
| (Address of principal executive offices) | (Zip code) | |||||||
(888) 220-6121
(Registrant’s telephone number, including area code)
Securities registered pursuant to Section 12(b) of the Exchange Act: None.
Indicate by check mark whether the registrant (1) has filed all reports required to be filed by Section 13 or 15(d) of the Securities Exchange Act of 1934 during the preceding 12 months (or for such shorter period that the registrant was required to file such reports), and (2) has been subject to such filing requirements for the past 90 days. Yes ☒ No ☐
Indicate by check mark whether the registrant has submitted electronically every Interactive Data File required to be submitted pursuant to Rule 405 of Regulation S-T (§232.405 of this chapter) during the preceding 12 months (or for such shorter period that the registrant was required to submit such files). Yes ☒ No ☐
Indicate by check mark whether the registrant is a large accelerated filer, an accelerated filer, a non-accelerated filer, smaller reporting company, or an emerging growth company. See the definitions of “large accelerated filer,” “accelerated filer,” “smaller reporting company,” and “emerging growth company” in Rule 12b-2 of the Exchange Act.
| Large accelerated filer | ☐ | Accelerated filer | ☐ | Non-accelerated filer | ☒ | ||||||||||||||||||
| Smaller reporting company | ☐ | Emerging growth company | ☐ | ||||||||||||||||||||
| If an emerging growth company, indicate by check mark if the registrant has elected not to use the extended transition period for complying with any new or revised financial accounting standards provided pursuant to Section 13 (a) of the Exchange Act. | ☐ | ||||||||||||||||||||||
Indicate by check mark whether the registrant is a shell company (as defined in Rule 12b-2 of the Exchange Act). Yes ☐ No ☒
As of August 1, 2021, approximately 25.4 million shares of the registrant’s Class AX common stock, 11.9 million shares of the registrant’s Class TX common stock, 0.1 million shares of the registrant’s Class IX common stock, 48.5 million shares of the registrant’s Class T common stock, 15.1 million shares of the registrant’s Class D common stock and 31.3 million shares of the registrant’s Class I common stock were outstanding.
TABLE OF CONTENTS
| PART I – FINANCIAL INFORMATION | ||||||||
| Item 1. | Condensed Consolidated Financial Statements (Unaudited): | |||||||
| Item 2. | ||||||||
| Item 3. | ||||||||
| Item 4. | ||||||||
| PART II – OTHER INFORMATION | ||||||||
| Item 1. | ||||||||
| Item 1A. | ||||||||
| Item 2. | ||||||||
| Item 3. | ||||||||
| Item 4. | ||||||||
| Item 5. | ||||||||
| Item 6. | ||||||||
PART I - FINANCIAL INFORMATION
Item 1. Condensed Consolidated Financial Statements
HINES GLOBAL INCOME TRUST, INC.
CONDENSED CONSOLIDATED BALANCE SHEETS
(UNAUDITED)
| June 30, 2021 | December 31, 2020 | ||||||||||
| (in thousands, except per share amounts) | |||||||||||
| ASSETS | |||||||||||
| Investment property, net | $ | 1,880,960 | $ | 1,558,060 | |||||||
| Investments in real estate-related securities | 65,146 | 51,137 | |||||||||
| Cash and cash equivalents | 65,399 | 55,998 | |||||||||
| Restricted cash | 15,803 | 21,565 | |||||||||
| Derivative instruments | 240 | 286 | |||||||||
| Tenant and other receivables, net | 20,625 | 16,644 | |||||||||
| Intangible lease assets, net | 218,367 | 121,830 | |||||||||
| Right-of-use asset, net | 4,284 | 4,367 | |||||||||
| Deferred leasing costs, net | 33,508 | 17,471 | |||||||||
| Deferred financing costs, net | 843 | 1,372 | |||||||||
| Other assets | 15,723 | 14,687 | |||||||||
| Total assets | $ | 2,320,898 | $ | 1,863,417 | |||||||
| LIABILITIES AND EQUITY | |||||||||||
| Liabilities: | |||||||||||
| Accounts payable and accrued expenses | $ | 51,389 | $ | 35,549 | |||||||
| Due to affiliates | 40,088 | 39,295 | |||||||||
| Intangible lease liabilities, net | 39,428 | 21,393 | |||||||||
| Operating lease liability | 1,578 | 1,598 | |||||||||
| Other liabilities | 20,932 | 17,637 | |||||||||
| Derivative instruments | — | 22 | |||||||||
| Distributions payable | 5,971 | 4,909 | |||||||||
| Notes payable, net | 1,143,947 | 880,796 | |||||||||
| Total liabilities | 1,303,333 | 1,001,199 | |||||||||
| Commitments and contingencies (Note 11) | — | — | |||||||||
| Equity: | |||||||||||
| Stockholders’ equity: | |||||||||||
| Preferred shares, $0.001 par value per share; 500,000 preferred shares authorized, none issued or outstanding as of June 30, 2021 and December 31, 2020 | — | — | |||||||||
| Common shares, $0.001 par value per share (Note 6) | 125 | 104 | |||||||||
| Additional paid-in capital | 1,147,965 | 938,736 | |||||||||
| Accumulated distributions in excess of earnings | (149,756) | (99,451) | |||||||||
| Accumulated other comprehensive income (loss) | 19,231 | 22,829 | |||||||||
| Total stockholders’ equity | 1,017,565 | 862,218 | |||||||||
| Noncontrolling interests | — | — | |||||||||
| Total equity | 1,017,565 | 862,218 | |||||||||
| Total liabilities and equity | $ | 2,320,898 | $ | 1,863,417 | |||||||
See notes to the condensed consolidated financial statements.
1
HINES GLOBAL INCOME TRUST, INC.
CONDENSED CONSOLIDATED STATEMENTS OF OPERATIONS AND COMPREHENSIVE INCOME (LOSS)
(UNAUDITED)
| Three Months Ended June 30, | Six Months Ended June 30, | ||||||||||||||||||||||
| 2021 | 2020 | 2021 | 2020 | ||||||||||||||||||||
| (in thousands, except per share amounts) | |||||||||||||||||||||||
| Revenues: | |||||||||||||||||||||||
| Rental revenue | $ | 40,424 | $ | 27,001 | $ | 77,900 | $ | 60,120 | |||||||||||||||
| Other revenue | 967 | 813 | 1,783 | 1,539 | |||||||||||||||||||
| Total revenues | 41,391 | 27,814 | 79,683 | 61,659 | |||||||||||||||||||
| Expenses: | |||||||||||||||||||||||
| Property operating expenses | 10,239 | 7,139 | 19,613 | 15,213 | |||||||||||||||||||
| Real property taxes | 4,777 | 3,489 | 9,180 | 6,971 | |||||||||||||||||||
| Property management fees | 1,426 | 1,192 | 2,910 | 2,549 | |||||||||||||||||||
| Depreciation and amortization | 24,916 | 14,457 | 44,943 | 30,686 | |||||||||||||||||||
| Acquisition related expenses | 15 | 274 | 15 | 291 | |||||||||||||||||||
| Asset management fees | 3,845 | 2,747 | 7,306 | 5,538 | |||||||||||||||||||
| Performance participation allocation | 5,249 | — | 7,483 | — | |||||||||||||||||||
| General and administrative expenses | 1,445 | 1,286 | 2,810 | 2,324 | |||||||||||||||||||
| Total expenses | 51,912 | 30,584 | 94,260 | 63,572 | |||||||||||||||||||
| Other income (expenses): | |||||||||||||||||||||||
| Gain (loss) on derivative instruments | (185) | 1,514 | (276) | 8,470 | |||||||||||||||||||
| Gain (loss) on investments in real estate-related securities | 5,750 | 3,136 | 9,089 | (4,601) | |||||||||||||||||||
| Gain on sale of real estate | 1,402 | 80,457 | 1,440 | 130,101 | |||||||||||||||||||
| Foreign currency gains (losses) | 1,397 | 1,374 | 367 | (1,145) | |||||||||||||||||||
| Interest expense | (6,370) | (4,463) | (11,748) | (10,395) | |||||||||||||||||||
| Interest and other income | 470 | 159 | 976 | 710 | |||||||||||||||||||
| Income (loss) before benefit (provision) for income taxes | (8,057) | 79,407 | (14,729) | 121,227 | |||||||||||||||||||
| Benefit (provision) for income taxes | (3,637) | 1,906 | (2,683) | 1,838 | |||||||||||||||||||
| Provision for income taxes related to sale of real estate | — | (7,773) | — | (7,773) | |||||||||||||||||||
| Net income (loss) | (11,694) | 73,540 | (17,412) | 115,292 | |||||||||||||||||||
| Net (income) loss attributable to noncontrolling interests | (4) | (4) | (7) | (7) | |||||||||||||||||||
| Net income (loss) attributable to common stockholders | $ | (11,698) | $ | 73,536 | $ | (17,419) | $ | 115,285 | |||||||||||||||
| Basic and diluted income (loss) per common share | $ | (0.10) | $ | 0.77 | $ | (0.15) | $ | 1.23 | |||||||||||||||
| Weighted average number of common shares outstanding | 120,707 | 95,490 | 115,175 | 93,900 | |||||||||||||||||||
| Comprehensive income (loss): | |||||||||||||||||||||||
| Net income (loss) | $ | (11,694) | $ | 73,540 | $ | (17,412) | $ | 115,292 | |||||||||||||||
| Other comprehensive income (loss): | |||||||||||||||||||||||
| Foreign currency translation adjustment | 4,080 | 5,483 | (3,598) | (10,130) | |||||||||||||||||||
| Comprehensive income (loss) | $ | (7,614) | $ | 79,023 | $ | (21,010) | $ | 105,162 | |||||||||||||||
| Comprehensive (income) loss attributable to noncontrolling interests | (4) | (4) | (7) | (7) | |||||||||||||||||||
| Comprehensive income (loss) attributable to common stockholders | $ | (7,618) | $ | 79,019 | $ | (21,017) | $ | 105,155 | |||||||||||||||
See notes to the condensed consolidated financial statements.
2
HINES GLOBAL INCOME TRUST, INC.
CONDENSED CONSOLIDATED STATEMENTS OF EQUITY
(UNAUDITED)
(In thousands)
| Hines Global Income Trust, Inc. Stockholders | |||||||||||||||||||||||||||||||||||||||||
| Common Shares | Additional Paid-in Capital | Accumulated Distributions in Excess of Earnings | Accumulated Other Comprehensive Income (Loss) | Total Stockholders’ Equity | Noncontrolling Interests | ||||||||||||||||||||||||||||||||||||
| Shares | Amount | ||||||||||||||||||||||||||||||||||||||||
| Balance as of January 1, 2021 | 103,781 | $ | 104 | $ | 938,736 | $ | (99,451) | $ | 22,829 | $ | 862,218 | $ | — | ||||||||||||||||||||||||||||
| Issuance of common shares | 10,424 | 10 | 105,427 | — | — | 105,437 | — | ||||||||||||||||||||||||||||||||||
| Distributions declared | — | — | — | (15,593) | — | (15,593) | (3) | ||||||||||||||||||||||||||||||||||
| Redemption of common shares | (1,354) | (1) | (11,741) | — | — | (11,742) | — | ||||||||||||||||||||||||||||||||||
| Selling commissions, dealer manager fees and distribution and stockholder servicing fees | — | — | (2,717) | — | — | (2,717) | — | ||||||||||||||||||||||||||||||||||
| Offering costs | — | — | (723) | — | — | (723) | — | ||||||||||||||||||||||||||||||||||
| Net income (loss) | — | — | — | (5,721) | — | (5,721) | 3 | ||||||||||||||||||||||||||||||||||
| Foreign currency translation adjustment | — | — | — | — | (7,678) | (7,678) | — | ||||||||||||||||||||||||||||||||||
| Balance as of March 31, 2021 | 112,851 | $ | 113 | $ | 1,028,982 | $ | (120,765) | $ | 15,151 | $ | 923,481 | $ | — | ||||||||||||||||||||||||||||
| Issuance of common shares | 13,297 | 13 | 135,778 | — | — | 135,791 | — | ||||||||||||||||||||||||||||||||||
| Distributions declared | — | — | — | (17,293) | — | (17,293) | (4) | ||||||||||||||||||||||||||||||||||
| Redemption of common shares | (1,296) | (1) | (10,871) | — | — | (10,872) | — | ||||||||||||||||||||||||||||||||||
| Selling commissions, dealer manager fees and distribution and stockholder servicing fees | — | — | (5,238) | — | — | (5,238) | — | ||||||||||||||||||||||||||||||||||
| Offering costs | — | — | (686) | — | — | (686) | — | ||||||||||||||||||||||||||||||||||
| Net income (loss) | — | — | — | (11,698) | — | (11,698) | 4 | ||||||||||||||||||||||||||||||||||
| Foreign currency translation adjustment | — | — | — | — | 4,080 | 4,080 | — | ||||||||||||||||||||||||||||||||||
| Balance as of June 30, 2021 | 124,852 | $ | 125 | $ | 1,147,965 | $ | (149,756) | $ | 19,231 | $ | 1,017,565 | $ | — | ||||||||||||||||||||||||||||
| Hines Global Income Trust, Inc. Stockholders | |||||||||||||||||||||||||||||||||||||||||
| Common Shares | Additional Paid-in Capital | Accumulated Distributions in Excess of Earnings | Accumulated Other Comprehensive Income (Loss) | Total Stockholders’ Equity | Noncontrolling Interests | ||||||||||||||||||||||||||||||||||||
| Shares | Amount | ||||||||||||||||||||||||||||||||||||||||
| Balance as of January 1, 2020 | 81,847 | $ | 83 | $ | 735,545 | $ | (146,830) | $ | 2,723 | $ | 591,521 | $ | — | ||||||||||||||||||||||||||||
| Issuance of common shares | 10,735 | 12 | 112,179 | — | — | 112,191 | — | ||||||||||||||||||||||||||||||||||
| Distributions declared | — | — | — | (12,401) | — | (12,401) | (3) | ||||||||||||||||||||||||||||||||||
| Redemption of common shares | (464) | — | (5,395) | — | — | (5,395) | — | ||||||||||||||||||||||||||||||||||
| Selling commissions, dealer manager fees and distribution and stockholder servicing fees | — | — | (6,240) | — | — | (6,240) | — | ||||||||||||||||||||||||||||||||||
| Offering costs | — | — | (863) | — | — | (863) | — | ||||||||||||||||||||||||||||||||||
| Net income (loss) | — | — | — | 41,749 | — | 41,749 | 3 | ||||||||||||||||||||||||||||||||||
| Foreign currency translation adjustment | — | — | — | — | (15,613) | (15,613) | — | ||||||||||||||||||||||||||||||||||
| Balance as of March 31, 2020 | 92,118 | $ | 95 | $ | 835,226 | $ | (117,482) | $ | (12,890) | $ | 704,949 | $ | — | ||||||||||||||||||||||||||||
| Issuance of common shares | 4,822 | 3 | 49,404 | — | — | 49,407 | — | ||||||||||||||||||||||||||||||||||
| Distributions declared | — | — | — | (13,452) | — | (13,452) | (4) | ||||||||||||||||||||||||||||||||||
| Redemption of common shares | (1,037) | (1) | (11,399) | — | — | (11,400) | — | ||||||||||||||||||||||||||||||||||
| Selling commissions, dealer manager fees and distribution and stockholder servicing fees | — | — | (4,009) | — | — | (4,009) | — | ||||||||||||||||||||||||||||||||||
| Offering costs | — | — | (987) | — | — | (987) | — | ||||||||||||||||||||||||||||||||||
| Net income (loss) | — | — | — | 73,536 | — | 73,536 | 4 | ||||||||||||||||||||||||||||||||||
| Foreign currency translation adjustment | — | — | — | — | 2,323 | 2,323 | — | ||||||||||||||||||||||||||||||||||
| Foreign currency translation adjustment reclassified into earnings | — | — | 3,160 | 3,160 | — | ||||||||||||||||||||||||||||||||||||
| Balance as of June 30, 2020 | 95,903 | $ | 97 | $ | 868,235 | $ | (57,398) | $ | (7,407) | $ | 803,527 | $ | — | ||||||||||||||||||||||||||||
See notes to the condensed consolidated financial statements.
3
HINES GLOBAL INCOME TRUST, INC.
CONDENSED CONSOLIDATED STATEMENTS OF CASH FLOWS
(UNAUDITED)
| Six Months Ended June 30, | |||||||||||
| 2021 | 2020 | ||||||||||
| (In thousands) | |||||||||||
| CASH FLOWS FROM OPERATING ACTIVITIES: | |||||||||||
| Net income (loss) | $ | (17,412) | $ | 115,292 | |||||||
| Adjustments to reconcile net income (loss) to net cash from (used in) operating activities: | |||||||||||
| Depreciation and amortization | 46,693 | 31,842 | |||||||||
| Gain on sale of real estate | (1,440) | (130,101) | |||||||||
| Foreign currency (gains) losses | (367) | 1,145 | |||||||||
| (Gain) loss on derivative instruments | 276 | (8,470) | |||||||||
| (Gain) loss on investments in real estate-related securities | (9,089) | 4,601 | |||||||||
| Changes in assets and liabilities: | |||||||||||
| Change in other assets | 211 | (4,453) | |||||||||
| Change in tenant and other receivables | (2,884) | (3,016) | |||||||||
| Change in deferred leasing costs | (17,918) | (2,691) | |||||||||
| Change in accounts payable and accrued expenses | 10,275 | (569) | |||||||||
| Change in other liabilities | 1,809 | (6,510) | |||||||||
| Change in due to affiliates | (1,357) | (8,941) | |||||||||
| Net cash from (used in) operating activities | 8,797 | (11,871) | |||||||||
| CASH FLOWS FROM INVESTING ACTIVITIES: | |||||||||||
| Investments in acquired properties and lease intangibles | (436,811) | (164,096) | |||||||||
| Capital expenditures at operating properties | (5,607) | (4,613) | |||||||||
| Proceeds from sale of real estate | — | 340,532 | |||||||||
| Purchases of real estate-related securities | (32,251) | (24,575) | |||||||||
| Proceeds from settlement of real estate-related securities | 27,331 | 18,812 | |||||||||
| Net cash from (used in) investing activities | (447,338) | 166,060 | |||||||||
| CASH FLOWS FROM FINANCING ACTIVITIES: | |||||||||||
| Proceeds from issuance of common shares | 223,869 | 147,932 | |||||||||
| Redemption of common shares | (26,619) | (14,985) | |||||||||
| Payment of offering costs | (3,129) | (2,850) | |||||||||
| Payment of selling commissions, dealer manager fees and distribution and stockholder servicing fees | (4,965) | (5,516) | |||||||||
| Distributions paid to stockholders and noncontrolling interests | (15,517) | (11,575) | |||||||||
| Proceeds from notes payable | 376,549 | 75,970 | |||||||||
| Payments on notes payable | (107,448) | (248,750) | |||||||||
| Payments on related party note payable | — | (75,000) | |||||||||
| Change in security deposit liability | 294 | 736 | |||||||||
| Deferred financing costs paid | (71) | (404) | |||||||||
| Payments related to interest rate contracts | (12) | — | |||||||||
| Net cash from (used in) financing activities | 442,951 | (134,442) | |||||||||
| Effect of exchange rate changes on cash, restricted cash and cash equivalents | (771) | 1,495 | |||||||||
| Net change in cash, restricted cash and cash equivalents | 3,639 | 21,242 | |||||||||
| Cash, restricted cash and cash equivalents, beginning of period | 77,563 | 56,438 | |||||||||
| Cash, restricted cash and cash equivalents, end of period | $ | 81,202 | $ | 77,680 | |||||||
See notes to the condensed consolidated financial statements.
4
HINES GLOBAL INCOME TRUST INC, INC.
NOTES TO THE CONDENSED CONSOLIDATED FINANCIAL STATEMENTS (UNAUDITED)
For the Three and Six Months Ended June 30, 2021 and 2020
1. ORGANIZATION
The accompanying interim unaudited condensed consolidated financial information has been prepared according to the rules and regulations of the United States Securities and Exchange Commission (“SEC”). In the opinion of management, all adjustments and eliminations, consisting only of normal recurring adjustments, necessary to present fairly and in conformity with accounting principles generally accepted in the United States of America (“GAAP”) the financial position of Hines Global Income Trust, Inc. as of June 30, 2021 and December 31, 2020, and the results of operations for the three and six months ended June 30, 2021 and 2020, the changes in stockholders’ equity for each of the quarterly periods in the six months ended June 30, 2021 and 2020, and cash flows for the six months ended June 30, 2021 and 2020 have been included. The results of operations for such interim periods are not necessarily indicative of the results for the full year. Certain information and footnote disclosures normally included in financial statements prepared in accordance with GAAP have been condensed or omitted according to such rules and regulations. For further information, refer to the financial statements and footnotes included in Hines Global Income Trust, Inc.’s Annual Report on Form 10-K for the year ended December 31, 2020.
Hines Global Income Trust, Inc. (the “Company”), is a Maryland corporation formed to invest in a diversified portfolio of quality commercial real estate properties and other real estate investments throughout the United States and internationally, and to a lesser extent, invest in real-estate related securities. The Company is sponsored by Hines Interests Limited Partnership (“Hines”), a fully integrated global real estate investment and management firm that has acquired, developed, owned, operated and sold real estate for over 60 years. The Company is managed by HGIT Advisors LP (the “Advisor”), an affiliate of Hines. The Company conducts substantially all of its operations through HGIT Properties, LP (the “Operating Partnership”). An affiliate of the Advisor, Hines Global REIT II Associates LP, owns less than a 1% limited partner interest in the Operating Partnership as of June 30, 2021 and the Advisor also owns the special limited partnership interest in the Operating Partnership. The Company has elected to be taxed as a real estate investment trust, or REIT, for U.S. federal income tax purposes beginning with its taxable year ended December 31, 2015.
As of June 30, 2021, the Company owned direct real estate investments in 26 properties totaling 12.9 million square feet that were 95% leased. The Company raises capital for its investments through continuous public offerings of its common stock. The Company launched its third public offering of up to $2.5 billion in shares of its common stock (the “Third Offering”) on June 2, 2021 through which it is offering of up to $2.5 billion in shares of common stock including $500.0 million of shares offered under its distribution reinvestment plan. The Company terminated its second public offering immediately prior to the commencement of the Third Offering. As of August 16, 2021, the Company had received gross offering proceeds of approximately $1.5 billion from the sale of 143.5 million shares through its public offerings, including shares issued pursuant to its distribution reinvestment plan.
5
2. SUMMARY OF SIGNIFICANT ACCOUNTING POLICIES
Basis of Presentation
The condensed consolidated financial statements of the Company included in this Quarterly Report on Form 10-Q include the accounts of Hines Global Income Trust, Inc. and the Operating Partnership (over which the Company exercises financial and operating control). All intercompany balances and transactions have been eliminated in consolidation.
Coronavirus Outbreak
The preparation of financial statements in conformity with U.S GAAP requires the Company’s management to make estimates and assumptions that affect the amounts reported in the financial statements. Although these estimates are based on management’s knowledge of current events and actions it may undertake in the future, actual results may differ from these estimates. In particular, the COVID-19 pandemic (more commonly referred to as the Coronavirus pandemic), has adversely impacted and may further adversely impact the Company’s business, the businesses of the Company’s tenants and the real estate market generally. The full extent to which the pandemic will directly or indirectly impact the Company's business, results of operations and financial condition, including fair value measurements, and asset impairment charges, will depend on future developments that are highly uncertain and difficult to predict. These developments include, but are not limited to, the duration and spread of the outbreak, its severity, the actions to contain the virus or address its impact, governmental actions to contain the spread of the pandemic and respond to the reduction in global economic activity, and how quickly and to what extent normal economic and operating conditions can resume.
The ongoing global outbreak of the Coronavirus pandemic continues to adversely impact global commercial activity. It has disrupted global travel and supply chains, adversely impacted global commercial activity, and its long-term economic impact remains uncertain. Although the outlook is improving in certain areas of the world, including the United States, the United Kingdom and Europe, considerable uncertainty still surrounds the Coronavirus and its potential effects on the population, as well as the effectiveness of any responses taken on a national and local level by government authorities and businesses. The travel restrictions, limits on hours of operations and/or closures of non-essential businesses and other efforts to curb the spread of the Coronavirus have significantly disrupted business activity globally, including in the markets where the Company invests, and has had an adverse impact on the performance of certain of the Company’s investments. Many of the Company’s tenants have been subject to various quarantine restrictions. These restrictions particularly adversely impacted many of the Company’s retail tenants (other than grocery tenants), as government instructions regarding social distancing, capacity limitations and mandated closures have reduced and, in some cases, eliminated customer foot traffic, causing many of the Company’s retail tenants to temporarily close their brick and mortar stores for a portion of 2020. Although businesses in most markets where the Company invests have been permitted to fully or partially re-open, certain areas have experienced a return to restrictions such as mask mandates subsequent to re-opening and no assurance can be given as to when such restrictions will be lifted or that additional closures will not occur. While vaccines have been widely administered, vaccination rates in the U.S. and markets outside the U.S. where the Company invests lag behind the levels desired by public health officials and it is unclear when businesses around the world will return to pre-pandemic activity levels. As of June 30, 2021, the Company owned two retail properties in the U.S., which comprised 16% of the Company’s total revenue for the six months ended June 30, 2021. The Company agreed to grant $3.8 million of rent relief to its retail tenants during the year ended December 31, 2020, as a result of their lost revenues resulting from the Coronavirus pandemic at these properties. Such rent relief consisted of rental payments that were forgiven or reduced due to the conversion of fixed rental payments to rental payments based on a percentage of the tenant’s revenues as well as rent payments that were deferred to future periods. We have not granted significant additional rent relief during the six months ended June 30, 2021. While rent collections were adversely affected in the early months of the pandemic, consumer traffic at these properties has recovered to near pre-pandemic levels in recent months. During the six months ended June 30, 2021, rent collections had recovered to 99% of billed rent, which includes the collection of certain 2020 rent payments that were deferred to 2021. However, if infection rates begin to materially increase and there are additional government mandated shutdowns it could reduce consumer traffic at the Company’s retail properties and negatively impact future rent collections.
Additionally, the Company refunded $2.2 million in rent to students across its international student housing portfolio during the year ended December 31, 2020 and $0.7 million for the six months ended June 30, 2021 as a result of temporary university closures. The Company expects in-campus learning to resume at the start of the 2021/2022 school year, but it is difficult to predict whether additional closures may occur. The Company’s other property types have not been materially impacted by the Coronavirus pandemic to date. The Company is unable to estimate the impact the Coronavirus pandemic will have on its results in future periods.
6
Correction of Immaterial Error
During the quarter ended June 30, 2021, the Company identified an immaterial error in the calculation of deferred tax assets and related valuation allowance at one of its properties. As a result of this error, “Other Assets” included in the Company’s Consolidated Balance Sheet as of December 31, 2020 was overstated by $2.9 million and the “Benefit (provision) for income taxes” and “Net Income” included in the Consolidated Statements of Operations and Comprehensive Income (Loss) was overstated by $2.9 million for the year then ended. Additionally, “Other Assets” included in the Company’s Condensed Consolidated Balance Sheet as of March 31, 2021 was overstated by $3.9 million and the “Benefit (provision) for income taxes” included in the condensed Consolidated Statements of Operations and Comprehensive Income (Loss) was overstated by $1.0 million, resulting in an understated “Net loss”. The Company corrected these errors in the quarterly period ended June 30, 2021, which increased net loss by $3.9 million and $2.9 million for the three and six months then ended, respectively. Management evaluated the effects of these out-of-period adjustments, both qualitatively and quantitatively, and concluded that the errors and the related correction were not material both individually and in the aggregate to the current period or prior periods.
Investments in Real Estate-Related Securities
The Company holds investments in real estate-related securities, which consist of common equities, preferred equities and debt investments of publicly traded REITs. The Company has elected to classify these investments as trading securities and carry such investments at fair value. These assets are valued on a recurring basis. The Company earns interest and dividend income monthly related to these securities, which is recorded in interest and other income in the Company’s Condensed Consolidated Statements of Operations and Comprehensive Income (Loss). The table below presents the effects of the changes in fair value of the Company’s real estate-related securities in the Company’s Condensed Consolidated Statements of Operations and Comprehensive Income (Loss) for the three and six months ended June 30, 2021 and 2020 (in thousands):
| Gain (Loss) Recorded on Investments in Real Estate-Related Securities | ||||||||||||||||||||||||||
| Three months ended June 30, | Six months ended June 30, | |||||||||||||||||||||||||
| 2021 | 2020 | 2021 | 2020 | |||||||||||||||||||||||
| Unrealized gain (loss) | $ | 3,091 | $ | 4,548 | $ | 5,541 | $ | (2,839) | ||||||||||||||||||
| Realized gain (loss) | 2,659 | (1,412) | 3,548 | (1,762) | ||||||||||||||||||||||
| Total gain (loss) on real estate-related securities | $ | 5,750 | $ | 3,136 | $ | 9,089 | $ | (4,601) | ||||||||||||||||||
Tenant and Other Receivables
Tenant and other receivables consists primarily of base rents, tenant reimbursements and receivables attributable to straight-line rent, and are carried at cost. As of June 30, 2021 and December 31, 2020, the Company had receivables related to base rents and tenant reimbursements of $5.4 million and $4.6 million, respectively. Additionally, as of June 30, 2021, approximately $0.8 million of these receivables relate to rent that has been deferred at the Company’s retail properties and is expected to be repaid at a later date. As of June 30, 2021 and December 31, 2020, the Company had an allowance of approximately $0.4 million and $0.5 million related to these deferred rents, respectively.
Straight-line rent receivable consists of the difference between the tenants’ rents calculated on a straight-line basis from the date of acquisition or lease commencement over the remaining terms of the related leases and the tenants’ actual rents due under the lease agreements. Straight-line rent receivables were $11.1 million and $9.1 million as of June 30, 2021 and December 31, 2020, respectively.
7
Other Assets
Other assets included the following (in thousands):
| June 30, 2021 | December 31, 2020 | |||||||||||||
| Prepaid insurance | $ | 1,506 | $ | 1,133 | ||||||||||
| Prepaid property taxes | 2,403 | 1,845 | ||||||||||||
Deferred tax assets (1) | 8,681 | 9,478 | ||||||||||||
| Other | 3,133 | 2,231 | ||||||||||||
| Other assets | $ | 15,723 | $ | 14,687 | ||||||||||
(1)Includes the effects of a valuation allowance of $9.5 million and $3.3 million as of June 30, 2021 and December 31, 2020, respectively.
3. INVESTMENT PROPERTY
Investment property consisted of the following amounts as of June 30, 2021 and December 31, 2020 (in thousands):
| June 30, 2021 | December 31, 2020 | ||||||||||
| Buildings and improvements | $ | 1,478,563 | $ | 1,216,004 | |||||||
| Less: accumulated depreciation | (76,738) | (60,019) | |||||||||
| Buildings and improvements, net | 1,401,825 | 1,155,985 | |||||||||
| Land | 479,135 | 402,075 | |||||||||
| Investment property, net | $ | 1,880,960 | $ | 1,558,060 | |||||||
The Company proactively closed the residential accommodations at Montrose Student Residences in August 2020 to more efficiently perform renovations including the replacement of certain building safety equipment systems. In conjunction with the renovation, the Company determined that an additional €4.7 million (approximately $5.5 million assuming a rate of $1.17 per EUR as of March 31, 2021) of the building assets, which were included in Investment property, net on the Condensed Consolidated Balance Sheets with an offset to Depreciation and amortization on the Condensed Consolidated Statements of Operations and Comprehensive Income (Loss), were taken out of service and written off as of March 31, 2021. During the three months ended June 30, 2021, the Company increased the scope of the renovations from the previous estimates and determined that an additional write off of €4.7 million (approximately $5.5 million assuming a rate of $1.19 per EUR as of June 30, 2021) was necessary, which was included in Investment property, net on the Condensed Consolidated Balance Sheets with an offset to Depreciation and amortization on the Condensed Consolidated Statements of Operations and Comprehensive Income (Loss). The Company expects the renovation to be completed by May 2022.
Recent Acquisitions of Investment Property
In February 2021, the Company acquired 5301 Patrick Henry Drive, a manufacturing research and development campus located in Santa Clara, California. The net purchase price for 5301 Patrick Henry Drive was $68.0 million, exclusive of transaction costs and working capital reserves.
In April 2021, the Company acquired an additional building at ABC Westland, the industrial property located in The Hague, Netherlands. The net purchase price for the additional building, ABC Westland A3.2, was €7.3 million (approximately $8.9 million, assuming a rate of $1.22 per EUR as of the acquisition date), exclusive of transaction costs and working capital reserves.
In May 2021, the Company acquired 900 Patrol Road, an industrial logistics property located in Jeffersonville, Indiana. The net purchase price for 900 Patrol Road was $98.7 million, exclusive of transaction costs and working capital reserves.
In May 2021, the Company acquired 1015 Half Street, an office property located in Washington, D.C. The net purchase price for 1015 Half Street was $223.3 million, exclusive of transaction costs and working capital reserves.
8
In June 2021, the Company acquired Miramar Activity Business Center, an industrial logistics property located in San Diego, California. The net purchase price for Miramar Activity Business Center was $41.0 million, exclusive of transaction costs and working capital reserves.
The amounts recognized for the asset acquisitions as of the acquisition dates were determined by allocating the net purchase price as follows (in thousands):
| Property Name | Acquisition Date | Building and Improvements | Land | In-place Lease Intangibles | Out-of-Market Lease Intangibles, Net | Total | ||||||||||||||||||||||||||||||||
| 5301 Patrick Henry Drive | 2/10/2021 | $ | 36,651 | $ | 19,089 | $ | 15,136 | $ | (2,711) | $ | 68,165 | |||||||||||||||||||||||||||
| ABC Westland A3.2 | 4/30/2021 | $ | 8,400 | $ | — | $ | 678 | $ | — | $ | 9,078 | |||||||||||||||||||||||||||
| 900 Patrol Road | 5/17/2021 | $ | 79,242 | $ | 7,977 | $ | 11,656 | $ | — | $ | 98,875 | |||||||||||||||||||||||||||
| 1015 Half Street | 5/19/2021 | $ | 131,745 | $ | 32,884 | $ | 81,861 | $ | (17,391) | $ | 229,099 | |||||||||||||||||||||||||||
| Miramar Activity Business Center | 6/30/2021 | $ | 17,007 | $ | 19,573 | $ | 4,411 | $ | 34 | $ | 41,025 | |||||||||||||||||||||||||||
As of June 30, 2021, the cost basis and accumulated amortization related to lease intangibles are as follows (in thousands):
| Lease Intangibles | |||||||||||||||||
| In-Place Leases | Out-of-Market Lease Assets | Out-of-Market Lease Liabilities | |||||||||||||||
| Cost | $ | 258,308 | $ | 12,309 | $ | (47,841) | |||||||||||
| Less: accumulated amortization | (49,604) | (2,646) | 8,413 | ||||||||||||||
| Net | $ | 208,704 | $ | 9,663 | $ | (39,428) | |||||||||||
As of December 31, 2020, the cost basis and accumulated amortization related to lease intangibles were as follows (in thousands):
| Lease Intangibles | |||||||||||||||||
| In-Place Leases | Out-of-Market Lease Assets | Out-of-Market Lease Liabilities | |||||||||||||||
| Cost | $ | 153,358 | $ | 12,362 | $ | (27,792) | |||||||||||
| Less: accumulated amortization | (41,998) | (1,892) | 6,399 | ||||||||||||||
| Net | $ | 111,360 | $ | 10,470 | $ | (21,393) | |||||||||||
Amortization expense of in-place leases was $8.9 million and $7.5 million for the three months ended June 30, 2021 and 2020, respectively. Net amortization of out-of-market leases resulted in an increase to rental revenue of $0.7 million and $0.3 million for the three months ended June 30, 2021 and 2020, respectively.
Amortization expense of in-place leases was $16.1 million and $16.5 million for the six months ended June 30, 2021 and 2020, respectively. Net amortization of out-of-market leases resulted in an increase to rental revenue of $1.1 million and $0.9 million for the six months ended June 30, 2021 and 2020, respectively.
9
Anticipated amortization of the Company’s in-place leases and out-of-market leases, net for the period from July 1, 2021 through December 31, 2021 and for each of the years ending December 31, 2022 through December 31, 2026 are as follows (in thousands):
| In-Place Lease | Out-of-Market Leases, Net | ||||||||||
| July 1, 2021 through December 31, 2021 | $ | 22,036 | $ | (2,486) | |||||||
| 2022 | $ | 40,808 | $ | (5,432) | |||||||
| 2023 | $ | 35,439 | $ | (5,106) | |||||||
| 2024 | $ | 28,945 | $ | (4,195) | |||||||
| 2025 | $ | 23,298 | $ | (2,973) | |||||||
| 2026 | $ | 16,181 | $ | (1,288) | |||||||
Commercial Leases
The Company’s commercial leases are generally for terms of 15 years or less and may include multiple options to extend the lease term upon tenant election. The Company’s leases typically do not include an option to purchase. Generally, the Company does not expect the value of its real estate assets to be impacted materially at the end of any individual lease term, as the Company is typically able to re-lease the space and real estate assets tend to hold their value over a long period of time. Tenant terminations prior to the lease end date occasionally result in a one-time termination fee based on the remaining unpaid lease payments including variable payments and could be material to the tenant. Many of the Company’s leases have increasing minimum rental rates during the terms of the leases through escalation provisions. In addition, the majority of the Company’s leases provide for separate billings for variable rent, such as, reimbursements of real estate taxes, maintenance and insurance and may include an amount based on a percentage of the tenants’ sales. Total billings related to expense reimbursements from tenants for the three and six months ended June 30, 2021 were $5.9 million and $11.6 million, respectively, and for the three and six months ended June 30, 2020 were $3.8 million and $8.7 million, respectively, which are included in rental revenue on the Condensed Consolidated Statements of Operations and Comprehensive Income (Loss).
The Company has entered into non-cancelable lease agreements with tenants for space. As of June 30, 2021, the approximate fixed future minimum rentals for the period from July 1, 2021 through December 31, 2021, for each of the years ending December 31, 2022 through 2026 and thereafter related to the Company’s commercial properties are as follows (in thousands):
| Fixed Future Minimum Rentals | |||||
| July 1, 2021 through December 31, 2021 | $ | 59,669 | |||
| 2022 | 115,457 | ||||
| 2023 | 104,117 | ||||
| 2024 | 92,098 | ||||
| 2025 | 82,505 | ||||
| 2026 | 66,131 | ||||
| Thereafter | 229,240 | ||||
| Total | $ | 749,217 | |||
During the six months ended June 30, 2021 and 2020, the Company did not earn more than 10% of its revenue from any individual tenant.
The Company also enters into leases with tenants at its student housing properties and multi-family properties. These leases generally have terms less than one year and do not contain options to extend, terminate or purchase, escalation clauses, or other such terms, which are common in the Company’s commercial leases.
10
4. DEBT FINANCING
As of June 30, 2021 and December 31, 2020, the Company had approximately $1.1 billion and $885.5 million of debt outstanding, with weighted average years to maturity of 1.7 years and 2.4 years, respectively, and a weighted average interest rate of 1.99% and 2.08%, respectively. The following table provides additional information regarding the Company’s debt outstanding at June 30, 2021 and December 31, 2020 (in thousands):
| Description | Origination or Assumption Date | Maturity Date | Maximum Capacity in Functional Currency | Interest Rate Description | Interest Rate as of June 30, 2021 | Principal Outstanding at June 30, 2021 | Principal Outstanding at December 31, 2020 | |||||||||||||||||||||||||||||||||||||
| Secured Mortgage Debt | ||||||||||||||||||||||||||||||||||||||||||||
| Cottonwood Corporate Center | 7/5/2016 | 8/1/2023 | $ | 78,000 | Fixed | 2.98% | $ | 69,632 | $ | 70,555 | ||||||||||||||||||||||||||||||||||
| Rookwood Commons | 1/6/2017 | 7/1/2023 | $ | 67,000 | Fixed | 4.25% | 54,500 | 54,500 | ||||||||||||||||||||||||||||||||||||
| Rookwood Pavilion | 1/6/2017 | 7/1/2023 | $ | 29,000 | Fixed | 4.25% | 29,000 | 29,000 | ||||||||||||||||||||||||||||||||||||
| Montrose Student Residences | 3/24/2017 | 3/23/2022 | € | 22,605 | Euribor + 2.00% (1) | 2.00% | 26,850 | 27,723 | ||||||||||||||||||||||||||||||||||||
| Queen's Court Student Residences | 12/18/2017 | 12/18/2022 | £ | 29,500 | Libor + 2.10% (1) | 2.16% | 40,813 | 40,265 | ||||||||||||||||||||||||||||||||||||
| Venue Museum District | 9/21/2018 | 10/9/2021 | $ | 45,000 | Libor + 1.95% (1) | 4.02% | 27,601 | 27,601 | ||||||||||||||||||||||||||||||||||||
| Fresh Park Venlo | 10/3/2018 | 8/15/2023 | € | 80,197 | Euribor + 1.55% (1) | 1.55% | 95,258 | (2) | 91,958 | |||||||||||||||||||||||||||||||||||
| Maintal Logistics | 2/21/2019 | 2/28/2024 | € | 23,500 | Euribor + 1.10% (1) | 1.10% | 27,262 | 28,292 | ||||||||||||||||||||||||||||||||||||
| ABC Westland | 5/3/2019 | 2/15/2024 | € | 82,830 | Euribor + 1.55% (1) | 1.55% | 93,753 | (2) | 87,197 | |||||||||||||||||||||||||||||||||||
| Łódź Urban Logistics | 9/20/2019 | 9/20/2024 | € | 13,600 | Fixed (3) | 1.05% | 15,881 | 16,492 | ||||||||||||||||||||||||||||||||||||
| Glasgow West End | 9/26/2019 | 9/26/2024 | £ | 43,200 | Libor + 1.80% (1) | 1.86% | 59,767 | 58,964 | ||||||||||||||||||||||||||||||||||||
| Gdańsk PL II | 10/4/2019 | 9/20/2024 | € | 16,800 | Fixed (3) | 1.05% | 19,618 | 20,372 | ||||||||||||||||||||||||||||||||||||
| Madrid Airport Complex | 6/19/2020 | 6/19/2023 | € | 15,150 | Fixed | 2.80% | 15,629 | 17,358 | ||||||||||||||||||||||||||||||||||||
| UK Logistics | 7/7/2020 | 7/7/2023 | £ | 55,138 | (4) | Libor + 1.75% (1) | 1.84% | 76,283 | 75,257 | |||||||||||||||||||||||||||||||||||
| Other Notes Payable | ||||||||||||||||||||||||||||||||||||||||||||
| JPMorgan Chase Revolving Credit Facility | 9/13/2019 | 11/15/2022 | $ | 275,000 | Variable | 1.60% | 238,000 | 140,000 | ||||||||||||||||||||||||||||||||||||
| JPMorgan Chase Revolving Credit Facility - Term Loan | 9/13/2019 | 11/15/2022 | $ | 150,000 | Variable | 1.53% | 150,000 | 100,000 | ||||||||||||||||||||||||||||||||||||
| JPMorgan Chase Bridge Loan | 5/14/2021 | 8/12/2021 | $ | 108,000 | Variable | 1.85% | 108,000 | (5) | — | |||||||||||||||||||||||||||||||||||
| Notes Payable | $ | 1,147,847 | $ | 885,534 | ||||||||||||||||||||||||||||||||||||||||
| Affiliate Note Payable | ||||||||||||||||||||||||||||||||||||||||||||
| Credit Facility with Hines | 10/2/2017 | 12/31/2021 | $ | 75,000 | Variable | N/A | — | — | ||||||||||||||||||||||||||||||||||||
| Total Note Payable to Affiliate | $ | — | $ | — | ||||||||||||||||||||||||||||||||||||||||
| Total Principal Outstanding | $ | 1,147,847 | $ | 885,534 | ||||||||||||||||||||||||||||||||||||||||
| Unamortized discount | — | — | ||||||||||||||||||||||||||||||||||||||||||
| Unamortized financing fees | (3,900) | (4,738) | ||||||||||||||||||||||||||||||||||||||||||
| Total | $ | 1,143,947 | $ | 880,796 | ||||||||||||||||||||||||||||||||||||||||
(1)On the loan origination date, the Company entered into an interest rate cap agreement as an economic hedge against the variability of future interest rates on this borrowing. See Note 5—Derivative Instruments for further details.
(2)The Company entered into amendments to increase the capacity of the secured mortgage loans for Fresh Park Venlo and ABC Westland in 2021 and made additional borrowings on these loans during the three months ended June 30, 2021.
(3)On the loan origination date, the Company entered into an interest rate swap contract effectively fixing the interest rate for the full term of the facility. See Note 5—Derivative Instruments for further details.
(4)This credit facility is collateralized by the following four industrial logistics properties: Charles Tyrwhitt DC, DSG Bristol, Royal Mail and Wakefield Logistics.
(5)The Company entered into a $108.0 million bridge loan facility with JPMorgan in May 2021, to provide funding for the Company’s May 2021 acquisitions. This bridge loan was fully repaid in July 2021 using proceeds from the amended credit facility described below, and the bridge loan facility was terminated in accordance with its terms.
11
JPMorgan Chase Revolving Credit Facility
During the six months ended June 30, 2021, the Company made draws of approximately $253.0 million and made payments of $105.0 million on its revolving loan commitment with JPMorgan Chase, N.A., (the “Revolving Credit Facility”), resulting in an outstanding balance of $388.0 million on June 30, 2021.
On July 30, 2021, the Company entered into an Amended and Restated Credit Facility (the “Amended Revolving Credit Facility”) with JP Morgan Chase Bank, N.A. as administrative agent for itself and the various lenders named in the credit agreement. The Amended Revolving Credit Facility increased the total capacity of the original credit agreement dated November 15, 2019, and amended as of November 13, 2020 from $425.0 million to $725.0 million. The Amended Revolving Credit Facility provides for borrowings of up to $425.0 million under a senior, unsecured revolving credit facility and $300.0 million under a senior, unsecured term loan. Additionally, the Amended Revolving Credit Facility provides options for the Company to increase the total capacity up to $1.25 billion, subject to certain requirements. The maturity date was also extended to November 15, 2023, subject to two one-year extensions options that the Company may exercise if it meets certain conditions.
As of July 30, 2021, the Company had outstanding amounts of $300.0 million on the Term Loan, $173.0 million on the Amended Revolving Credit Facility, and retired the $108.0 million bridge loan. From August 1, 2021 through August 16, 2021, the Company made $33.0 million in additional payments under the Amended Revolving Credit Facility.
Financial Covenants
The Company’s mortgage agreements and other loan documents for the debt described in the table above contain customary events of default, with corresponding grace periods, including payment defaults, bankruptcy-related defaults, and customary covenants, including limitations on liens and indebtedness and maintenance of certain financial ratios. The Company is not aware of any instances of noncompliance with financial covenants on any of its loans as of June 30, 2021. The Company’s continued compliance with these and other covenants depends on many factors and could be impacted by current or future economic conditions associated with the Coronavirus pandemic. Failure to comply with any covenants would result in a default which, if the Company were unable to cure or obtain a waiver from the lenders, could accelerate the repayment obligations and impact the liquidity of the Company.
Principal Payments on Debt
The Company is required to make the following principal payments on its outstanding notes payable for the period from July 1, 2021 through December 31, 2021, for each of the years ending December 31, 2022 through December 31, 2025 and for the period thereafter (in thousands).
| Payments Due by Year | |||||||||||||||||||||||||||||||||||
| July 1, 2021 through December 31, 2021 | 2022 | 2023 | 2024 | 2025 | Thereafter | ||||||||||||||||||||||||||||||
| Principal payments | $ | 143,081 | $ | 460,572 | $ | 329,514 | $ | 214,680 | $ | — | $ | — | |||||||||||||||||||||||
LIBOR is expected to be phased out or modified by June 2023, and the writing of contracts using LIBOR is expected to stop by the end of 2021. As of June 30, 2021, $700.5 million of the Company’s outstanding debt had a variable interest rate tied to LIBOR. The loan agreements provide procedures for determining a replacement or alternative rate in the event that LIBOR is unavailable. However, there can be no assurances as to whether such replacement or alternative rate will be more or less favorable than LIBOR. The Company intends to monitor the developments with respect to the potential phasing out of LIBOR and work with its lenders to ensure any transition away from LIBOR will have minimal impact on its financial condition, but can provide no assurances regarding the impact of the discontinuation of LIBOR.
12
5. DERIVATIVE INSTRUMENTS
The Company has entered into several interest rate swap contracts and interest rate cap contracts in connection with certain of its secured mortgage loans in order to limit its exposure against the variability of future interest rates on its variable interest rate borrowings. The Company’s interest rate swaps effectively fixed the interest rates on each of the loans to which they relate and the interest rate cap agreements have limited the interest rate on each of the loan to which they relate. The Company has not designated any of these derivatives as hedges for accounting purposes. The Company has not entered into a master netting arrangement with its third-party counterparty and does not offset on its Condensed Consolidated Balance Sheets the fair value amount recorded for its derivative instruments.
The Company has also entered into foreign currency forward contracts as economic hedges against the variability of foreign exchange rates related to certain cash flows of some of its international investments. These forward contracts fixed the currency exchange rates on each of the investments to which they related. The Company did not designate any of these contracts as fair value or cash flow hedges for accounting purposes.
The table below provides additional information regarding the Company’s interest rate contracts as of June 30, 2021 (in thousands, except percentages).
| Interest Rate Contracts | ||||||||||||||||||||||||||||||||||||||||||||
| Type | Property | Effective Date | Expiration Date | Maximum Capacity of Debt in Functional Currency | Notional Amount | Interest Rate Received | Pay Rate /Strike Rate | |||||||||||||||||||||||||||||||||||||
| Interest rate cap | Montrose Student Residences | March 24, 2017 | March 23, 2022 | € | 22,605 | € | 16,954 | Euribor | 1.25 | % | ||||||||||||||||||||||||||||||||||
| Interest rate cap | Fresh Park Venlo | October 8, 2018 | August 15, 2023 | € | 80,197 | € | 52,487 | Euribor | 2.00 | % | ||||||||||||||||||||||||||||||||||
| Interest rate cap | Fresh Park Venlo | May 27, 2021 | August 15, 2023 | € | — | (2) | € | 5,215 | Euribor | 1.00 | % | |||||||||||||||||||||||||||||||||
| Interest rate cap | Maintal Logistics | February 28, 2019 | February 28, 2024 | € | 23,500 | € | 16,450 | Euribor | 2.00 | % | ||||||||||||||||||||||||||||||||||
| Interest rate cap | ABC Westland | May 3, 2019 | February 15, 2024 | € | 82,830 | € | 52,500 | Euribor | 1.00 | % | ||||||||||||||||||||||||||||||||||
| Interest rate cap | ABC Westland | May 27, 2021 | February 15, 2024 | € | — | (2) | € | 7,830 | Euribor | 1.00 | % | |||||||||||||||||||||||||||||||||
| Interest rate cap | Glasgow West End | September 27, 2019 | September 24, 2024 | € | 43,200 | € | 32,400 | LIBOR | 2.00 | % | ||||||||||||||||||||||||||||||||||
| Interest rate swap | Łódź Urban Logistics | October 10, 2019 | September 20, 2024 | € | 13,600 | € | 13,600 | Euribor | (0.36) | % | ||||||||||||||||||||||||||||||||||
| Interest rate swap | Gdańsk PL II | October 10, 2019 | September 20, 2024 | € | 16,800 | € | 16,800 | Euribor | (0.36) | % | ||||||||||||||||||||||||||||||||||
| Interest rate cap | Charles Tyrwhitt | July 2, 2020 | July 2, 2023 | £ | 9,598 | (1) | £ | 9,598 | LIBOR | 1.50 | % | |||||||||||||||||||||||||||||||||
| Interest rate cap | DSG Bristol | July 2, 2020 | July 2, 2023 | £ | 20,240 | (1) | £ | 20,240 | LIBOR | 1.50 | % | |||||||||||||||||||||||||||||||||
| Interest rate cap | Royal Mail | July 2, 2020 | July 2, 2023 | £ | 13,970 | (1) | £ | 13,970 | LIBOR | 1.50 | % | |||||||||||||||||||||||||||||||||
| Interest rate cap | Wakefield Logistics | July 2, 2020 | July 2, 2023 | £ | 11,330 | (1) | £ | 11,330 | LIBOR | 1.50 | % | |||||||||||||||||||||||||||||||||
| Interest rate cap | Venue Museum District | October 9, 2020 | October 9, 2022 | $ | 45,000 | $ | 27,601 | LIBOR | 2.00 | % | ||||||||||||||||||||||||||||||||||
(1)Represents an allocation of a total maximum capacity of £55.1 million borrowed under one facility agreement. See Note 4—Debt Financing for more information on the borrowing.
(2)The notional amount for these interest rate caps are in addition to the already existing caps for the corresponding maximum capacity of debt in functional currency for the property listed above in this table.
13
The table below provides additional information regarding the Company’s foreign currency forward contracts that were active during the three and six months ended June 30, 2021 (in thousands).
| Foreign Currency Forward Contracts | ||||||||||||||||||||||||||
| Effective Date | Expiration Date | Notional Amount | Buy/Sell | Traded Currency Rate | ||||||||||||||||||||||
| December 17, 2020 | March 31, 2021 | £ | 9,000 | USD/GBP | $ | 1.36 | ||||||||||||||||||||
| March 30, 2021 | June 30, 2021 | £ | 9,000 | USD/GBP | $ | 1.37 | ||||||||||||||||||||
| June 25, 2021 | September 30, 2021 | £ | 9,000 | USD/GBP | $ | 1.39 | ||||||||||||||||||||
The table below presents the effects of the changes in fair value of the Company’s derivative instruments in the Company’s Condensed Consolidated Statements of Operations and Comprehensive Income (Loss) for the three and six months ended June 30, 2021 and 2020 (in thousands):
| Gain (Loss) Recorded on Derivative Instruments | ||||||||||||||||||||||||||
| Three months ended June 30, | Six months ended June 30, | |||||||||||||||||||||||||
| 2021 | 2020 | 2021 | 2020 | |||||||||||||||||||||||
| Derivatives not designated as hedging instruments: | ||||||||||||||||||||||||||
| Interest rate swaps | $ | (86) | $ | 165 | $ | (157) | $ | 348 | ||||||||||||||||||
| Interest rate caps | (38) | 14 | 45 | (73) | ||||||||||||||||||||||
| Foreign currency forward contracts | (61) | 1,335 | (164) | 8,195 | ||||||||||||||||||||||
| Total gain (loss) on derivatives | $ | (185) | $ | 1,514 | $ | (276) | $ | 8,470 | ||||||||||||||||||
6. STOCKHOLDERS’ EQUITY
Public Offering
The Company raises capital for its investments primarily through public offerings of its common stock. In connection with the Restructuring and the Second Offering, on November 30, 2017, the Company (i) redesignated its issued and outstanding Class A shares of common stock, Class T shares of common stock, Class I shares of common stock and Class J shares of common stock as “Class AX shares,” “Class TX shares,” “Class IX shares” and “Class JX shares,” (collectively, the “IPO Shares”) respectively, and (ii) reclassified the authorized but unissued portion of its common stock into four additional classes of shares of common stock: “Class T shares,” “Class S shares,” “Class D shares,” and “Class I shares.” The Company is offering its shares of common stock in the Second Offering in any combination of Class T shares, Class S shares, Class D shares and Class I shares. All shares of the Company’s common stock have the same voting rights and rights upon liquidation, although distributions received by the Company’s stockholders are expected to differ due to the distribution and stockholder servicing fees payable with respect to the applicable share classes, which reduce distributions.
The Company complies with the FASB ASC 480 “Distinguishing Liabilities from Equity” which requires, among other things, that financial instruments that represent a mandatory obligation of the Company to repurchase shares be classified as liabilities and reported at settlement value. When shares are tendered for redemption and approved by the board of directors, the Company will reclassify such obligations from equity to an accrued liability based upon their respective settlement values and redeem those shares in the subsequent month pursuant to the Company’s current share redemption program.
14
Common Stock
As of June 30, 2021 and December 31, 2020, the Company had the following classes of shares of common stock authorized, issued and outstanding (in thousands):
| June 30, 2021 | December 31, 2020 | ||||||||||||||||||||||
| Shares Authorized | Shares Issued and Outstanding | Shares Authorized | Shares Issued and Outstanding | ||||||||||||||||||||
| Class AX common stock, $0.001 par value per share | 40,000 | 24,281 | 40,000 | 19,990 | |||||||||||||||||||
| Class TX common stock, $0.001 par value per share | 40,000 | 12,979 | 40,000 | 18,152 | |||||||||||||||||||
| Class IX common stock, $0.001 par value per share | 10,000 | 90 | 10,000 | 95 | |||||||||||||||||||
| Class JX common stock, $0.001 par value per share | 10,000 | — | 10,000 | — | |||||||||||||||||||
| Class T common stock, $0.001 par value per share | 350,000 | 45,766 | 350,000 | 40,036 | |||||||||||||||||||
| Class S common stock, $0.001 par value per share | 350,000 | — | 350,000 | — | |||||||||||||||||||
| Class D common stock, $0.001 par value per share | 350,000 | 13,844 | 350,000 | 10,217 | |||||||||||||||||||
| Class I common stock, $0.001 par value per share | 350,000 | 27,892 | 350,000 | 15,291 | |||||||||||||||||||
The tables below provide information regarding the issuances and redemptions of each class of the Company’s common stock during the six months ended June 30, 2021 and 2020 (in thousands). There were no Class JX and S shares issued, redeemed or outstanding during the six months ended June 30, 2021.
| Class AX | Class TX | Class IX | Class T | Class D | Class I | Total | |||||||||||||||||||||||||||||||||||||||||||||||||||||||||||||||||||||||||||||
| Shares | Amount | Shares | Amount | Shares | Amount | Shares | Amount | Shares | Amount | Shares | Amount | Shares | Amount | ||||||||||||||||||||||||||||||||||||||||||||||||||||||||||||||||||||||
| Balance as of January 1, 2021 | 19,990 | $ | 20 | 18,152 | $ | 21 | 95 | $ | — | 40,036 | $ | 39 | 10,217 | $ | 9 | 15,291 | $ | 15 | 103,781 | $ | 104 | ||||||||||||||||||||||||||||||||||||||||||||||||||||||||||||||
| Issuance of common shares | 181 | — | 87 | — | 1 | — | 2,668 | 3 | 1,170 | 1 | 6,317 | 6 | 10,424 | 10 | |||||||||||||||||||||||||||||||||||||||||||||||||||||||||||||||||||||
Conversion of common shares (1) | 2,260 | 2 | (2,260) | (2) | — | — | — | — | — | — | — | — | — | — | |||||||||||||||||||||||||||||||||||||||||||||||||||||||||||||||||||||
| Redemption of common shares | (402) | — | (356) | — | (3) | — | (431) | (1) | (64) | — | (98) | — | (1,354) | (1) | |||||||||||||||||||||||||||||||||||||||||||||||||||||||||||||||||||||
| Balance as of March 31, 2021 | 22,029 | $ | 22 | 15,623 | $ | 19 | 93 | $ | — | 42,273 | $ | 41 | 11,323 | $ | 10 | 21,510 | $ | 21 | 112,851 | $ | 113 | ||||||||||||||||||||||||||||||||||||||||||||||||||||||||||||||
| Issuance of common shares | 170 | — | 95 | — | 1 | — | 3,827 | 4 | 2,578 | 3 | 6,626 | 6 | 13,297 | 13 | |||||||||||||||||||||||||||||||||||||||||||||||||||||||||||||||||||||
| Redemption of common shares | (493) | (1) | (164) | — | (4) | — | (334) | — | (57) | — | (244) | — | (1,296) | (1) | |||||||||||||||||||||||||||||||||||||||||||||||||||||||||||||||||||||
Conversion of common shares (1) | 2,575 | 3 | (2,575) | (3) | — | — | — | — | — | — | — | — | — | — | |||||||||||||||||||||||||||||||||||||||||||||||||||||||||||||||||||||
| Balance as of June 30, 2021 | 24,281 | $ | 24 | 12,979 | $ | 16 | 90 | $ | — | 45,766 | $ | 45 | 13,844 | $ | 13 | 27,892 | $ | 27 | 124,852 | $ | 125 | ||||||||||||||||||||||||||||||||||||||||||||||||||||||||||||||
(1)The Company will cease paying distribution and stockholder servicing fees with respect to Class TX shares when the total of such fees reach certain thresholds. Once these thresholds are reached, Class TX shares are converted into Class AX shares, as indicated in the table above.
| Class AX | Class TX | Class IX | Class T | Class D | Class I | Total | |||||||||||||||||||||||||||||||||||||||||||||||||||||||||||||||||||||||||||||
| Shares | Amount | Shares | Amount | Shares | Amount | Shares | Amount | Shares | Amount | Shares | Amount | Shares | Amount | ||||||||||||||||||||||||||||||||||||||||||||||||||||||||||||||||||||||
| Balance as of January 1, 2020 | 18,885 | $ | 19 | 19,901 | $ | 22 | 91 | $ | — | 28,837 | $ | 29 | 6,927 | $ | 6 | 7,206 | $ | 7 | 81,847 | $ | 83 | ||||||||||||||||||||||||||||||||||||||||||||||||||||||||||||||
| Issuance of common shares | 126 | — | 146 | 1 | 1 | — | 5,809 | 6 | 1,696 | 2 | 2,957 | 3 | 10,735 | 12 | |||||||||||||||||||||||||||||||||||||||||||||||||||||||||||||||||||||
| Redemption of common shares | (159) | — | (183) | — | — | — | (86) | — | (20) | — | (16) | — | (464) | — | |||||||||||||||||||||||||||||||||||||||||||||||||||||||||||||||||||||
| Balance as of March 31, 2020 | 18,852 | $ | 19 | 19,864 | $ | 23 | 92 | $ | — | 34,560 | $ | 35 | 8,603 | $ | 8 | 10,147 | $ | 10 | 92,118 | $ | 95 | ||||||||||||||||||||||||||||||||||||||||||||||||||||||||||||||
| Issuance of common shares | 150 | — | 127 | — | 1 | — | 2,528 | 2 | 702 | — | 1,314 | 1 | 4,822 | 3 | |||||||||||||||||||||||||||||||||||||||||||||||||||||||||||||||||||||
| Redemption of common shares | (383) | (1) | (211) | — | — | — | (319) | — | (68) | — | (56) | — | (1,037) | (1) | |||||||||||||||||||||||||||||||||||||||||||||||||||||||||||||||||||||
| Balance as of June 30, 2020 | 18,619 | $ | 18 | 19,780 | $ | 23 | 93 | $ | — | 36,769 | $ | 37 | 9,237 | $ | 8 | 11,405 | $ | 11 | 95,903 | $ | 97 | ||||||||||||||||||||||||||||||||||||||||||||||||||||||||||||||
15
Distributions
With the authorization of the Company’s board of directors, the Company declared distributions monthly from January 2020 through August 2021 at a gross distribution rate of $0.05208 per month for each share class (represents an annualized rate of $0.625 per share per year if this rate is declared for an entire year), less any applicable distribution and stockholder servicing fees.
Distributions were made on all classes of the Company’s common stock at the same time. All distributions were paid in cash or reinvested in shares of the Company’s common stock for those participating in the Company’s distribution reinvestment plan and have been paid or issued, respectively, on the first business day following the completion of the month to which they relate. Distributions reinvested pursuant to the Company’s distribution reinvestment plan were reinvested in shares of the same class as the shares on which the distributions were made. Some or all of the cash distributions may be paid from sources other than cash flows from operations.
The following table outlines the Company’s total distributions declared to stockholders for each of the quarters ended during 2021 and 2020, including the breakout between the distributions declared in cash and those reinvested pursuant to the Company’s distribution reinvestment plan (in thousands).
| Stockholders | ||||||||||||||||||||||||||
| Distributions for the Three Months Ended | Cash Distributions | Distributions Reinvested | Total Declared | |||||||||||||||||||||||
| 2021 | ||||||||||||||||||||||||||
| June 30, 2021 | $ | 8,378 | $ | 8,915 | $ | 17,293 | ||||||||||||||||||||
| March 31, 2021 | 7,615 | 7,978 | 15,593 | |||||||||||||||||||||||
| Total | $ | 15,993 | $ | 16,893 | $ | 32,886 | ||||||||||||||||||||
| 2020 | ||||||||||||||||||||||||||
| December 31, 2020 | $ | 6,981 | $ | 7,531 | $ | 14,513 | ||||||||||||||||||||
| September 30, 2020 | 6,486 | 7,309 | 13,795 | |||||||||||||||||||||||
| June 30, 2020 | 6,262 | 7,190 | 13,452 | |||||||||||||||||||||||
| March 31, 2020 | 5,669 | 6,732 | 12,401 | |||||||||||||||||||||||
| Total | $ | 25,398 | $ | 28,762 | $ | 54,161 | ||||||||||||||||||||
The table below outlines the net distributions declared for each class of shares for the three and six months ended June 30, 2021 and 2020. The net distributions presented below are representative of the gross distribution rate declared by the Company’s board of directors, less any applicable ongoing distribution and stockholder servicing fees.
| Three Months Ended June 30, | Six Months Ended June 30, | |||||||||||||||||||||||||||||||||||||
| 2021 | 2020 | 2021 | 2020 | |||||||||||||||||||||||||||||||||||
| Distributions declared per Class AX share, net | $ | 0.16 | $ | 0.16 | $ | 0.31 | $ | 0.31 | ||||||||||||||||||||||||||||||
| Distributions declared per Class TX share, net | $ | 0.13 | $ | 0.13 | $ | 0.26 | $ | 0.26 | ||||||||||||||||||||||||||||||
| Distributions declared per Class IX share, net | $ | 0.15 | $ | 0.15 | $ | 0.30 | $ | 0.30 | ||||||||||||||||||||||||||||||
| Distributions declared per Class T share, net | $ | 0.13 | $ | 0.13 | $ | 0.26 | $ | 0.26 | ||||||||||||||||||||||||||||||
| Distributions declared per Class S share, net | $ | 0.13 | $ | 0.13 | $ | 0.26 | $ | 0.26 | ||||||||||||||||||||||||||||||
| Distributions declared per Class D share, net | $ | 0.15 | $ | 0.15 | $ | 0.30 | $ | 0.30 | ||||||||||||||||||||||||||||||
| Distributions declared per Class I share, net | $ | 0.16 | $ | 0.16 | $ | 0.31 | $ | 0.31 | ||||||||||||||||||||||||||||||
16
7. RELATED PARTY TRANSACTIONS
The table below outlines fees and expense reimbursements incurred that are payable by the Company to the Advisor and the Hines Securities, Inc. (the "Dealer Manager"), Hines and its affiliates for the periods indicated below (in thousands):
| Incurred | ||||||||||||||||||||||||||||||||||||||
| Three Months Ended June 30, | Six Months Ended June 30, | Unpaid as of | ||||||||||||||||||||||||||||||||||||
| Type and Recipient | 2021 | 2020 | 2021 | 2020 | June 30, 2021 | December 31, 2020 | ||||||||||||||||||||||||||||||||
Selling Commissions- Dealer Manager (1) | $ | 1,030 | $ | 658 | $ | 1,660 | $ | 2,304 | $ | — | $ | — | ||||||||||||||||||||||||||
| Dealer Manager Fee- Dealer Manager | 190 | 117 | 312 | 413 | — | — | ||||||||||||||||||||||||||||||||
| Distribution & Stockholder Servicing Fees- Dealer Manager | 4,018 | 3,234 | 5,983 | 7,532 | 29,267 | 26,271 | ||||||||||||||||||||||||||||||||
| Organization and Offering Costs- the Advisor | 1,586 | 987 | 2,359 | 1,850 | 5,493 | 6,263 | ||||||||||||||||||||||||||||||||
| Asset Management Fees- the Advisor | 3,845 | 2,747 | 7,306 | 5,538 | 841 | 2,672 | ||||||||||||||||||||||||||||||||
Other- the Advisor (2) | 1,497 | 692 | 866 | 1,054 | 720 | 1,249 | ||||||||||||||||||||||||||||||||
Performance Participation Allocation- the Advisor (3) | 5,249 | — | 7,483 | — | 7,483 | — | ||||||||||||||||||||||||||||||||
Interest expense- Hines and its affiliates (4) | — | 2 | — | 362 | — | — | ||||||||||||||||||||||||||||||||
| Property Management Fees- Hines and its affiliates | 749 | 513 | 1,393 | 1,195 | 203 | 91 | ||||||||||||||||||||||||||||||||
| Development and Construction Management Fees- Hines and its affiliates | 229 | 27 | 276 | 90 | 579 | 650 | ||||||||||||||||||||||||||||||||
| Leasing Fees- Hines and its affiliates | 382 | 126 | 795 | 219 | 455 | 230 | ||||||||||||||||||||||||||||||||
Expense Reimbursement- Hines and its affiliates (with respect to management and operations of the Company's properties) (5) | 2,050 | 1,843 | 4,175 | 3,759 | (4,953) | (6) | 1,869 | |||||||||||||||||||||||||||||||
| Total | $ | 20,825 | $ | 10,946 | $ | 32,608 | $ | 24,316 | $ | 40,088 | $ | 39,295 | ||||||||||||||||||||||||||
(1)Some or all of these fees may be reallowed to participating broker dealers rather than being retained by the Dealer Manager.
(2)Includes amounts the Advisor paid on behalf of the Company such as general and administrative expenses and acquisition-related expenses. These amounts are generally reimbursed to the Advisor during the month following the period in which they are incurred.
(3)Through its ownership of the special limited partner interest in the Operating Partnership, the Advisor is entitled to an annual performance participation allocation of 12.5% of the Operating Partnership’s total return. Total return is defined as distributions paid or accrued plus the change in net asset value of the Company’s shares of common stock for the applicable period. This performance participation allocation is subject to the Company earning a 5% total return annually (as defined above), after considering the effect of any losses carried forward from the prior period (as defined in the Operating Partnership’s agreement of limited partnership (the "Operating Partnership Agreement"). The performance participation allocation accrues monthly and is payable after the completion of each calendar year.
(4)Includes amounts paid related to the Company’s credit facility with Hines (the “Hines Credit Facility”).
(5)Includes amounts with respect to the management and operation of the Company’s properties. These amounts are generally reimbursed to Hines and its affiliates during the month following the period in which they are incurred. Reimbursement of third party costs are not included in the incurred amounts.
(6)As of June 30, 2021, the balance included $5.5 million in receivables related to rents collected by the Hines-affiliated property manager at the international student housing properties, which were being held in the property manager controlled bank accounts.
8. FAIR VALUE MEASUREMENTS
Fair values determined by Level 1 inputs utilize quoted prices (unadjusted) in active markets for identical assets or liabilities the Company has the ability to access. Fair values determined by Level 2 inputs utilize inputs other than quoted prices included in Level 1 that are observable for the asset or liability, either directly or indirectly. Level 2 inputs include quoted prices for similar assets and liabilities in active markets and inputs other than quoted prices observable for the asset or liability, such as interest rates and yield curves observable at commonly quoted intervals. Level 3 inputs are unobservable inputs for the asset or liability, and include situations where there is little, if any, market activity for the asset or liability. In instances in which the inputs used to measure fair value may fall into different levels of the fair value hierarchy, the level in the fair value hierarchy within which the fair value measurement in its entirety has been determined is based on the lowest level
17
input significant to the fair value measurement in its entirety. The Company’s assessment of the significance of a particular input to the fair value measurement in its entirety requires judgment, and considers factors specific to the asset or liability.
Financial Instruments Measured on a Recurring Basis
As described in Note 5—Derivative Instruments, the Company entered into several interest rate contracts as hedges against the variability of future interest rates on its variable interest rate borrowings. The valuation of these derivative instruments is determined based on assumptions that management believes market participants would use in pricing, using widely accepted valuation techniques including discounted cash flow analysis on the expected cash flows of each derivative. This analysis reflects the contractual terms of the derivatives, including the period to maturity, and uses observable market-based inputs, including interest rate curves and implied volatilities. The fair values of interest rate contracts have been determined using the market standard methodology of netting the discounted future fixed cash receipts (or payments) and the discounted expected variable cash payments (or receipts). The variable cash payments (or receipts) are based on an expectation of future interest rates (forward curves) derived from observable market interest rate curves.
Although the Company has determined the majority of the inputs used to value its interest rate contracts fall within Level 2 of the fair value hierarchy, the credit valuation adjustments associated with its derivatives utilize Level 3 inputs, such as estimates of current credit spreads, to evaluate the likelihood of default by the Company and its counterparties. In adjusting the fair values of its derivative contracts for the effect of nonperformance risk, the Company has considered the impact of netting and any applicable credit enhancements, such as collateral postings, thresholds and guarantees. However, as of June 30, 2021 and 2020, the Company has assessed the significance of the impact of the credit valuation adjustments on the overall valuation of its derivative positions and has determined that the credit valuation adjustments are not significant to the overall valuations of its derivatives. As a result, the Company has determined its derivative valuations are classified in Level 2 of the fair value hierarchy.
Additionally, as described in Note 5—Derivative Instruments, the Company has entered into foreign currency forward contracts as hedges against the variability of foreign exchange rates. The valuation of these forward contracts is determined based on assumptions that management believes market participants would use in pricing, using widely accepted valuation techniques, including discounted cash flow analysis on the expected cash flows of each derivative. This analysis reflects the contractual terms of the derivatives, including the period to maturity, and uses observable market-based inputs, including currency exchange rate curves and implied volatilities. The Company has determined its foreign currency forward contracts valuations are classified in Level 2 of the fair value hierarchy, as they are based on observable inputs but are not traded in active markets.
The Company holds investments in real estate-related securities, which consist of common equities, preferred equities and debt investments of publicly traded REITs. The Company has elected to classify these investments as trading securities and carry such investments at fair value. The following table summarizes activity for the Company’s real estate-related securities measured at fair value on a recurring basis.
| Basis of Fair Value Measurements | ||||||||||||||||||||||||||||||||
| As of | Description | Fair Value of Assets | Quoted Prices In Active Markets for Identical Items (Level 1) | Significant Other Observable Inputs (Level 2) | Significant Unobservable Inputs (Level 3) | |||||||||||||||||||||||||||
| June 30, 2021 | Investments in real estate-related securities | $ | 65,146 | $ | 65,146 | $ | — | $ | — | |||||||||||||||||||||||
| December 31, 2020 | Investments in real estate-related securities | $ | 51,137 | $ | 51,137 | $ | — | $ | — | |||||||||||||||||||||||
18
Financial Instruments Fair Value Disclosures
As of June 30, 2021, the Company estimated that the fair value of its notes payable, excluding deferred financing costs, which had a book value of $1.1 billion, was $1.1 billion. As of December 31, 2020, the Company estimated that the fair value of its notes payable, excluding deferred financing costs, which had a book value of $885.5 million, was $884.7 million. Management has utilized available market information such as interest rate and spread assumptions of notes payable with similar terms and remaining maturities, to estimate the amounts required to be disclosed. Although the Company has determined that the majority of the inputs used to value its notes payable fall within Level 2 of the fair value hierarchy, the credit quality adjustments associated with its fair value of notes payable utilize Level 3 inputs. However, the Company has assessed the significance of the impact of the credit quality adjustments on the overall valuations of the fair market value of its notes payable and has determined they are not significant. Other financial instruments not measured at fair value on a recurring basis include cash and cash equivalents, restricted cash, tenant and other receivables, accounts payable and accrued expenses, other liabilities, due to affiliates and distributions payable. The carrying value of these items reasonably approximates their fair value based on their highly-liquid nature and/or short-term maturities. Due to the short-term nature of these instruments, Level 1 inputs are utilized to estimate the fair value of the cash and cash equivalents and restricted cash and Level 2 inputs are utilized to estimate the fair value of the remaining financial instruments.
19
9. REPORTABLE SEGMENTS
As described previously, the Company invests the net proceeds from its public offerings into its portfolio of quality commercial real estate properties and other real estate investments throughout the United States and internationally. The Company’s business consists of owning, operating, acquiring, developing, investing in, and disposing of real estate assets and all of the Company’s consolidated revenues and property expenses are from these real estate properties.
Management evaluates the operating performance of each of its real estate properties at an individual investment level and considers each investment to be an operating segment. The Company has aggregated its operating segments into seven reportable segments: domestic office investments, domestic residential/living investments, domestic retail investments, domestic industrial investments, international industrial investments, international office investments, and international residential/living investments. In April 2020, the Company sold Bishop’s Square, which comprised the international office investments reportable segment included in the tables below.
The tables below provide additional information related to each of the Company’s segments (in thousands) and a reconciliation to the Company’s net income (loss), as applicable. “Corporate-Level Accounts” includes amounts incurred by the corporate-level entities which are not allocated to any of the reportable segments.
| Three Months Ended June 30, | Six Months Ended June 30, | ||||||||||||||||||||||
| 2021 | 2020 | 2021 | 2020 | ||||||||||||||||||||
| Revenues | |||||||||||||||||||||||
| Domestic office investments | $ | 6,129 | $ | 3,836 | $ | 10,018 | $ | 7,771 | |||||||||||||||
| Domestic residential/living investments | 5,242 | 4,908 | 10,374 | 9,314 | |||||||||||||||||||
| Domestic retail investments | 6,353 | 5,151 | 12,994 | 12,524 | |||||||||||||||||||
| Domestic industrial investments | 7,131 | — | 12,874 | 533 | |||||||||||||||||||
| International industrial investments | 13,925 | 10,723 | 28,002 | 21,758 | |||||||||||||||||||
| International office investments | — | 528 | — | 3,042 | |||||||||||||||||||
| International residential/living investments | 2,611 | 2,668 | 5,421 | 6,717 | |||||||||||||||||||
| Total revenues | $ | 41,391 | $ | 27,814 | $ | 79,683 | $ | 61,659 | |||||||||||||||
For the three and six months ended June 30, 2021 and 2020, the Company’s total revenues were attributable to the following countries:
| Three Months Ended June 30, | Six Months Ended June 30, | ||||||||||||||||||||||
| 2021 | 2020 | 2021 | 2020 | ||||||||||||||||||||
| Total revenues | |||||||||||||||||||||||
| United States | 60 | % | 49 | % | 58 | % | 49 | % | |||||||||||||||
| The Netherlands | 19 | % | 25 | % | 20 | % | 23 | % | |||||||||||||||
| United Kingdom | 12 | % | 13 | % | 13 | % | 14 | % | |||||||||||||||
| Poland | 4 | % | 5 | % | 4 | % | 4 | % | |||||||||||||||
| Spain | 3 | % | 1 | % | 3 | % | — | % | |||||||||||||||
| Germany | 2 | % | 3 | % | 2 | % | 3 | % | |||||||||||||||
| Ireland | — | % | 4 | % | — | % | 7 | % | |||||||||||||||
20
For the three and six months ended June 30, 2021 and 2020, the Company’s property revenues in excess of expenses by segment were as follows (in thousands):
| Three Months Ended June 30, | Six Months Ended June 30, | ||||||||||||||||||||||
| 2021 | 2020 | 2021 | 2020 | ||||||||||||||||||||
Revenues in excess of property expenses (1) | |||||||||||||||||||||||
| Domestic office investments | $ | 3,842 | $ | 2,600 | $ | 6,319 | $ | 5,170 | |||||||||||||||
| Domestic residential/living investments | 3,010 | 2,461 | 5,741 | 4,757 | |||||||||||||||||||
| Domestic retail investments | 3,529 | 2,217 | 7,004 | 6,598 | |||||||||||||||||||
| Domestic industrial investments | 5,484 | (3) | 9,876 | 364 | |||||||||||||||||||
| International industrial investments | 8,981 | 6,718 | 17,417 | 13,386 | |||||||||||||||||||
| International office investments | — | 370 | — | 2,333 | |||||||||||||||||||
| International residential/living investments | 103 | 1,631 | 1,623 | 4,318 | |||||||||||||||||||
| Total revenues in excess of property expenses | $ | 24,949 | $ | 15,994 | $ | 47,980 | $ | 36,926 | |||||||||||||||
(1)Revenues less property operating expenses, real property taxes and property management fees.
As of June 30, 2021 and December 31, 2020, the Company’s total assets by segment were as follows (in thousands):
| June 30, 2021 | December 31, 2020 | ||||||||||
| Assets | |||||||||||
| Domestic office investments | $ | 373,263 | $ | 120,757 | |||||||
| Domestic residential/living investments | 275,597 | 279,861 | |||||||||
| Domestic retail investments | 284,658 | 282,550 | |||||||||
| Domestic industrial investments | 446,368 | 240,854 | |||||||||
| International industrial investments | 631,844 | 632,760 | |||||||||
International office investments(1) | 11,887 | 14,106 | |||||||||
| International residential/living investments | 204,353 | 216,321 | |||||||||
| Corporate-level accounts | 92,928 | 76,208 | |||||||||
| Total assets | $ | 2,320,898 | $ | 1,863,417 | |||||||
(1)Comprised of cash and receivables related to post-closing activities at Bishop’s Square, in accordance with the selling agreement. Once these post-closing activities are concluded, any remaining cash will be repatriated.
As of June 30, 2021 and December 31, 2020, the Company’s total assets were attributable to the following countries:
| June 30, 2021 | December 31, 2020 | ||||||||||
| Total assets | |||||||||||
| United States | 63 | % | 54 | % | |||||||
| United Kingdom | 15 | % | 18 | % | |||||||
| The Netherlands | 14 | % | 17 | % | |||||||
| Ireland | 2 | % | 3 | % | |||||||
| Poland | 3 | % | 3 | % | |||||||
| Germany | 2 | % | 3 | % | |||||||
| Spain | 1 | % | 2 | % | |||||||
21
For the three and six months ended June 30, 2021 and 2020 the Company’s reconciliation of the Company’s revenues in excess of property expenses to the Company’s net income (loss) is as follows (in thousands):
| Three Months Ended June 30, | Six Months Ended June 30, | ||||||||||||||||||||||
| 2021 | 2020 | 2021 | 2020 | ||||||||||||||||||||
| Reconciliation to revenues in excess of property expenses | |||||||||||||||||||||||
| Net income (loss) | $ | (11,694) | $ | 73,540 | $ | (17,412) | $ | 115,292 | |||||||||||||||
| Depreciation and amortization | 24,916 | 14,457 | 44,943 | 30,686 | |||||||||||||||||||
| Acquisition related expenses | 15 | 274 | 15 | 291 | |||||||||||||||||||
| Asset management fees | 3,845 | 2,747 | 7,306 | 5,538 | |||||||||||||||||||
| Performance participation allocation | 5,249 | — | 7,483 | — | |||||||||||||||||||
| General and administrative expenses | 1,445 | 1,286 | 2,810 | 2,324 | |||||||||||||||||||
| (Gain) loss on derivative instruments | 185 | (1,514) | 276 | (8,470) | |||||||||||||||||||
| (Gain) loss on investments in real estate-related securities | (5,750) | (3,136) | (9,089) | 4,601 | |||||||||||||||||||
| Gain on sale of real estate | (1,402) | (80,457) | (1,440) | (130,101) | |||||||||||||||||||
| Foreign currency (gains) losses | (1,397) | (1,374) | (367) | 1,145 | |||||||||||||||||||
| Interest expense | 6,370 | 4,463 | 11,748 | 10,395 | |||||||||||||||||||
| Interest and other income | (470) | (159) | (976) | (710) | |||||||||||||||||||
| (Benefit) provision for income taxes | 3,637 | (1,906) | 2,683 | (1,838) | |||||||||||||||||||
| Provision for income taxes related to sale of real estate | — | 7,773 | — | 7,773 | |||||||||||||||||||
| Total revenues in excess of property expenses | $ | 24,949 | $ | 15,994 | $ | 47,980 | $ | 36,926 | |||||||||||||||
22
10. SUPPLEMENTAL CASH FLOW DISCLOSURES
Supplemental cash flow disclosures for the six months ended June 30, 2021 and 2020 (in thousands):
| Six Months Ended June 30, | |||||||||||
| 2021 | 2020 | ||||||||||
| Supplemental Disclosure of Cash Flow Information | |||||||||||
| Cash paid for interest | $ | 10,191 | $ | 9,686 | |||||||
| Cash paid for income taxes | $ | 781 | $ | 123 | |||||||
| Cash paid for income taxes related to sale of real estate | $ | — | $ | 7,773 | |||||||
| Supplemental Schedule of Non-Cash Investing and Financing Activities | |||||||||||
| Distributions declared and unpaid | $ | 5,971 | $ | 4,501 | |||||||
| Distributions reinvested | $ | 16,314 | $ | 13,618 | |||||||
| Shares tendered for redemption | $ | 1,846 | $ | 3,489 | |||||||
| Non-cash net liabilities (assets) assumed | $ | 9,813 | $ | 848 | |||||||
| Offering costs payable to the Advisor | $ | 2,359 | $ | 1,850 | |||||||
| Distribution and stockholder servicing fees payable to the Dealer Manager | $ | 5,977 | $ | 7,532 | |||||||
| Accrued capital additions | $ | 3,615 | $ | 961 | |||||||
| Accrued acquisition costs | $ | 228 | $ | 1,084 | |||||||
11. COMMITMENTS AND CONTINGENCIES
The Company may be subject to various legal proceedings and claims that arise in the ordinary course of business. These matters are generally covered by insurance. While the resolution of these matters cannot be predicted with certainty, management believes the final outcome of such matters will not have a material adverse effect on the Company’s condensed consolidated financial statements.
12. SUBSEQUENT EVENTS
JPMorgan Facility Agreement Amendment
In July 2021, the Company entered into the Amended Revolving Credit Facility with JPMorgan to increase the capacity of the facility from $425 million to $725 million and make certain other changes. See Note 4 for additional information regarding the Amended Revolving Credit Facility.
*****
23
Item 2. Management’s Discussion and Analysis of Financial Condition and Results of Operations
The following discussion and analysis of our financial condition and results of operations should be read in conjunction with our unaudited condensed consolidated financial statements and the notes thereto included in Item 1 in this Quarterly Report on Form 10-Q. The following discussion should also be read in conjunction with our audited consolidated financial statements and the notes thereto and “Management’s Discussion and Analysis of Financial Condition and Results of Operations” included in our Annual Report on Form 10-K for the year ended December 31, 2020.
Cautionary Note Regarding Forward-Looking Statements
This Quarterly Report on Form 10-Q includes forward-looking statements within the meaning of Section 27A of the Securities Act of 1933 (the “Securities Act”), as amended, and Section 21E of the Securities Exchange Act of 1934, as amended (the “Exchange Act”), as amended. Such statements include statements concerning future financial performance and distributions, future debt and financing levels, acquisitions and investment objectives, payments to HGIT Advisors LP (the “Advisor”), and its affiliates and other plans and objectives of management for future operations or economic performance, or assumptions or forecasts related thereto as well as all other statements that are not historical statements. These statements are only predictions. We caution that forward-looking statements are not guarantees. Actual events or our investments and results of operations could differ materially from those expressed or implied in forward-looking statements. Forward-looking statements are typically identified by the use of terms such as “may,” “should,” “expect,” “could,” “intend,” “plan,” “anticipate,” “estimate,” “believe,” “continue,” “predict,” “potential” or the negative of such terms and other comparable terminology.
The forward-looking statements included in this Quarterly Report on Form 10-Q are based on our current expectations, plans, estimates, assumptions and beliefs that involve numerous risks and uncertainties. Assumptions relating to the foregoing involve judgments with respect to, among other things, future economic, competitive and market conditions, the availability of future financing and future business decisions, all of which are difficult or impossible to predict accurately and many of which are beyond our control. Any of the assumptions underlying forward-looking statements could prove to be inaccurate. To the extent that our assumptions differ from actual results, our ability to meet such forward-looking statements, including our ability to generate positive cash flow from operations, pay distributions to our shareholders and maintain the value of any real estate investments and real estate-related investments in which we may hold an interest in the future, may be significantly hindered.
The following are some of the risks and uncertainties, which could cause actual results to differ materially from those presented in certain forward-looking statements:
| — | Risks associated with adverse changes in general economic or local market conditions, including the impact of the ongoing Coronavirus pandemic and efforts to prevent its spread, which may adversely affect the markets in which we and our tenants operate; | ||||
| — | Whether we will be successful in raising substantial additional capital, and whether we will have the opportunity to invest offering and distribution reinvestment plan proceeds to acquire properties or other investments rather than using such proceeds to redeem shares or for other purposes, and if proceeds are available for investment, our ability to make such investments in a timely manner and at appropriate amounts that provide acceptable returns; | ||||
| — | Competition for tenants and real estate investment opportunities, including competition with other programs sponsored by or affiliated with Hines Interests Limited Partnership (“Hines”); | ||||
| — | Our reliance on our Advisor, Hines and affiliates of Hines for our day-to-day operations and the selection of real estate investments, and our Advisor’s ability to attract and retain high-quality personnel who can provide service at a level acceptable to us; | ||||
| — | Our ability to complete acquisitions of properties under contract; | ||||
| — | Risks associated with conflicts of interests that result from our relationship with our Advisor and Hines, as well as conflicts of interests certain of our officers and directors face relating to the positions they hold with other entities; | ||||
| — | The potential need to fund tenant improvements, lease-up costs or other capital expenditures, as well as increases in property expenses and costs of compliance with environmental matters or discovery of previously undetected environmentally hazardous or other undetected adverse conditions at our properties; | ||||
| — | The availability and timing of distributions we may pay is uncertain and cannot be assured; | ||||
24
| — | Our distributions have been paid using cash flows from financing activities, including proceeds from our public offerings, as well as cash from the waiver of fees by our Advisor, and some or all of the distributions we pay in the future may be paid from similar sources or sources such as cash advances by our Advisor, cash resulting from a waiver or deferral of fees, borrowings and/or proceeds from our public offerings. When we pay distributions from sources other than our cash flow from operations, we will have less funds available for the acquisition of properties, and your overall return may be reduced; | ||||
| — | Risks associated with debt, our ability to secure financing and our ability to comply with covenants in our debt agreements; | ||||
| — | Catastrophic events, such as hurricanes, earthquakes, tornadoes and terrorist attacks; and our ability to secure adequate insurance at reasonable and appropriate rates; | ||||
| — | The failure of any bank in which we deposit our funds could reduce the amount of cash we have available to pay distributions and make additional investments; | ||||
| — | Changes in governmental, tax, real estate and zoning laws and regulations and the related costs of compliance and increases in our administrative operating expenses, including expenses associated with operating as a public company; | ||||
| — | International investment risks, including the burden of complying with a wide variety of foreign laws and the uncertainty of such laws, the tax treatment of transaction structures, political and economic instability, foreign currency fluctuations, and inflation and governmental measures to curb inflation may adversely affect our operations and our ability to make distributions; | ||||
| — | The lack of liquidity associated with our assets; and | ||||
| — | Our ability to continue to qualify as a real estate investment trust (“REIT”) for U.S. federal income tax purposes. | ||||
These risks are more fully discussed in, and all forward-looking statements should be read in light of, all of the risk factors under the heading “Risk Factors” in our Annual Report on Form 10-K for the year ended December 31, 2020.
You are cautioned not to place undue reliance on any forward-looking statements included in this Quarterly Report on Form 10-Q. All forward-looking statements are made as of the date of this Quarterly Report on Form 10-Q and the risk that actual results will differ materially from the expectations expressed in this Quarterly Report on Form 10-Q may increase with the passage of time. In light of the significant uncertainties inherent in the forward-looking statements included in this Quarterly Report on Form 10-Q, the inclusion of such forward-looking statements should not be regarded as a representation by us or any other person that the objectives and plans set forth in this Quarterly Report on Form 10-Q will be achieved. All subsequent written and oral forward-looking statements attributable to us or persons acting on our behalf are expressly qualified in their entirety by reference to these risks and uncertainties. Each forward-looking statement speaks only as of the date of the particular statement, and we do not undertake to update any forward-looking statement.
The Company
Hines Global Income Trust, Inc. (“Hines Global”), is a Maryland corporation formed to invest in a diversified portfolio of quality commercial real estate properties and other real estate investments located throughout the United States and internationally. Hines Global is sponsored by Hines Interests Limited Partnership (“Hines”), a fully integrated global real estate investment and management firm that has acquired, developed, owned, operated and sold real estate for over 60 years. The Company has elected to be taxed as a REIT for U.S. federal income tax purposes beginning with its taxable year ended December 31, 2015.
We raise capital for our investments through public offerings of our common stock. We intend to conduct a continuous public offering with unlimited duration by registering a series of consecutive public offerings with the Securities and Exchange Commission ("SEC"). We commenced our initial public offering of up to $2.5 billion in shares of our common stock (the “Initial Offering”) in August 2014 and commenced our second public offering of up to $2.5 billion in shares of common stock including $500.0 million of shares offered under our distribution reinvestment plan (the “Second Offering”) in December 2017 immediately following the termination of the Initial Offering. As a result of the changing landscape in the non-traded REIT industry, the Second Offering reflects a restructuring (the “Restructuring”), which resulted in a reduction of many of the fees payable to our Advisor and Hines Securities, Inc., the dealer manager for our public offerings (the “Dealer Manager”). Consistent with our strategy of providing a continuous public offering, we launched our third public offering of up to $2.5 billion in shares of common stock, including $500.0 million of shares offered under our distribution reinvestment plan (the “Third Offering”) on June 2, 2021, which had its first monthly closing on July 1, 2021. The second public offering was terminated immediately prior to the commencement of our Third Offering on June 2, 2021. As of August 16, 2021, we had
25
received aggregate gross offering proceeds of $1.5 billion from the sale of 143.5 million shares through our public offerings, including shares issued pursuant to our distribution reinvestment plan.
26
Portfolio Highlights
We intend to continue to meet our primary investment objectives by investing in a portfolio of quality commercial real estate properties and other real estate investments that relate to properties that are generally diversified by property type, geographic area, lease expirations and tenant industries. As of June 30, 2021, we owned interests in 26 real estate investments consisting of 12.9 million square feet of leasable space that was 95% leased. The following chart depicts the percentage of our portfolio’s investment types based on the estimated value of each real estate investment as of June 30, 2021 (“Estimated Values”), which are consistent with the values used to determine our net asset value (“NAV”) per share on that date.
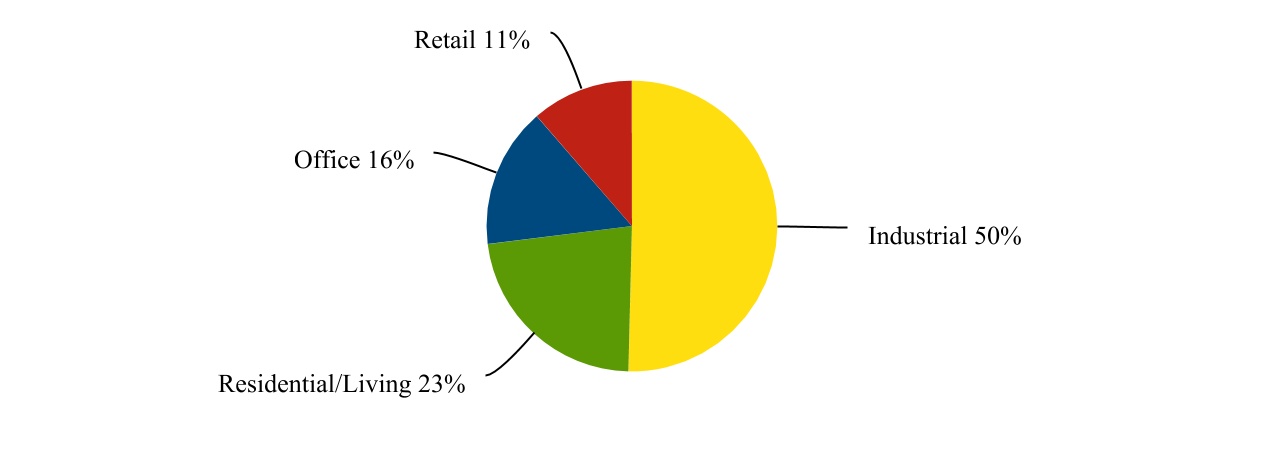
The following charts depict the location of our real estate investments as of June 30, 2021. Approximately 59% of our portfolio is located throughout the United States and approximately 41% is located internationally, based on the Estimated Values.

The following table provides additional information regarding each of our properties and is presented as of June 30, 2021 except as described in the footnotes below.
27
| Property | Location | Date Acquired/ Net Purchase Price (in millions) (1) | Estimated Going-in Capitalization Rate (2) | Leasable Square Feet | Percent Leased | ||||||||||||||||||||||||||||||
| Domestic Office | |||||||||||||||||||||||||||||||||||
| Cottonwood Corporate Center | Salt Lake City, Utah | 7/2016; $139.2 | 6.9% | 486,322 | 93 | % | |||||||||||||||||||||||||||||
| 1015 Half Street | Washington D.C. | 5/2021; $223.3 | 5.6% | 396,344 | 95 | % | |||||||||||||||||||||||||||||
| Total Domestic Office | 882,666 | 94 | % | ||||||||||||||||||||||||||||||||
| Domestic Residential/Living | |||||||||||||||||||||||||||||||||||
| Venue Museum District | Houston, Texas | 9/2018; $72.9 | 3.9% | 294,964 | 97 | % | |||||||||||||||||||||||||||||
| The Alloy | College Park, Maryland | 11/2019; $98.0 | 5.0% | 230,902 | 98 | % | |||||||||||||||||||||||||||||
| The Emerson | Centreville, Virginia | 1/2020; $117.0 | 4.5% | 328,341 | 96 | % | |||||||||||||||||||||||||||||
| Total Domestic Residential/Living | 854,207 | 97 | % | ||||||||||||||||||||||||||||||||
| Domestic Retail | |||||||||||||||||||||||||||||||||||
| Rookwood | Cincinnati, Ohio | 1/2017; $193.7 | 6.0% | 600,071 | 86 | % | |||||||||||||||||||||||||||||
| Promenade Shops at Briargate | Colorado Springs, Colorado | 9/2019; $93.2 | 7.7% | 236,539 | 88 | % | |||||||||||||||||||||||||||||
| Total Domestic Retail | 836,610 | 87 | % | ||||||||||||||||||||||||||||||||
| Domestic Industrial | |||||||||||||||||||||||||||||||||||
| Advanced Manufacturing Portfolio | Santa Clara, California | 8/2020; $107.0 | 6.1% | 417,023 | 96 | % | |||||||||||||||||||||||||||||
| 6000 Schertz Parkway | Schertz, Texas | 12/2020; $129.2 | 5.2% | 1,262,294 | 100 | % | |||||||||||||||||||||||||||||
| 5301 Patrick Henry Drive | Santa Clara, California | 2/2021; $68.0 | 5.4% | 129,199 | 100 | % | |||||||||||||||||||||||||||||
| 900 Patrol Road | Jeffersonville, Indiana | 5/2021; $98.7 | 5.5% | 1,015,740 | 100 | % | |||||||||||||||||||||||||||||
| Miramar Activity Business Center | Miramar, California | 6/2021; $41.0 | 5.2% | 161,168 | 89 | % | |||||||||||||||||||||||||||||
| Total Domestic Industrial | 2,985,424 | 99 | % | ||||||||||||||||||||||||||||||||
| International Industrial | |||||||||||||||||||||||||||||||||||
| Central Europe Industrial | |||||||||||||||||||||||||||||||||||
| Fresh Park Venlo | Venlo, Netherlands | 10/2018; $136.3 | 6.7% | 2,960,657 | 92 | % | |||||||||||||||||||||||||||||
| Maintal Logistics | Frankfurt, Germany | 12/2018; $43.8 | 5.7% | 387,264 | 96 | % | |||||||||||||||||||||||||||||
| ABC Westland | The Hague, Netherlands | 5/2019; $142.8 | 6.2% | 1,515,062 | 96 | % | |||||||||||||||||||||||||||||
| Gdańsk PL II | Gdańsk, Poland | 9/2019; $29.9 | 6.7% | 346,996 | 100 | % | |||||||||||||||||||||||||||||
| Łódź Urban Logistics | Łódź, Poland | 9/2019; $25.2 | 6.6% | 389,233 | 100 | % | |||||||||||||||||||||||||||||
| Madrid Airport Complex | Madrid, Spain | 6/2020; $33.2 | 12.7% | 467,014 | 100 | % | |||||||||||||||||||||||||||||
| Total Central Europe Industrial | 6,066,226 | 95 | % | ||||||||||||||||||||||||||||||||
| U.K. Industrial | |||||||||||||||||||||||||||||||||||
| Charles Tyrwhitt DC | Milton Keynes, United Kingdom | 11/2019; $19.9 | 5.7% | 145,452 | 100 | % | |||||||||||||||||||||||||||||
| DSG Bristol | Bristol, United Kingdom | 11/2019; $47.0 | 5.0% | 269,089 | 100 | % | |||||||||||||||||||||||||||||
| Royal Mail | Edinburgh, United Kingdom | 12/2019; $33.4 | 5.3% | 212,028 | 100 | % | |||||||||||||||||||||||||||||
| Wakefield Logistics | Wakefield, United Kingdom | 7/2020; $25.6 | 5.5% | 207,115 | 100 | % | |||||||||||||||||||||||||||||
| Cross Point Business Park | Coventry, United Kingdom | 12/2020; $22.8 | 4.7% | 146,652 | 100 | % | |||||||||||||||||||||||||||||
| Total U.K. Industrial | 980,336 | 100 | % | ||||||||||||||||||||||||||||||||
| Total International Industrial | 7,046,562 | 96 | % | ||||||||||||||||||||||||||||||||
| International Residential/Living | |||||||||||||||||||||||||||||||||||
| Montrose Student Residences | Dublin, Ireland | 3/2017; $40.6 | 5.5% | 53,835 | 17 | % | (3) | ||||||||||||||||||||||||||||
| Queen’s Court Student Residences | Reading, United Kingdom | 10/2017; $65.3 | 6.2% | 79,115 | 42 | % | (4) | ||||||||||||||||||||||||||||
| Glasgow West End | Glasgow, United Kingdom | 9/2019; $89.5 | 5.5% | 113,389 | 98 | % | (4) | ||||||||||||||||||||||||||||
| Total International Residential/Living | 246,339 | 62 | % | ||||||||||||||||||||||||||||||||
| Total for All Investments | 12,851,808 | 95 | % | ||||||||||||||||||||||||||||||||
(1)For acquisitions denominated in a foreign currency, amounts have been translated to U.S. dollars at a rate based on the exchange rate in effect on the acquisition date.
28
(2)The estimated going-in capitalization rate is determined as of the date of acquisition by dividing the projected property revenues in excess of expenses for the first fiscal year by the net purchase price (excluding closing costs and taxes). Property revenues in excess of expenses includes all projected operating revenues (rental income, tenant reimbursements, parking and any other property-related income) less all projected operating expenses (property operating and maintenance expenses, property taxes, insurance and property management fees). The projected property revenues in excess of expenses includes assumptions which may not be indicative of the actual future performance of the property, including the assumption that the tenants will perform under their lease agreements during the 12 months following our acquisition of the properties and assumptions concerning estimates of timing and rental rates related to re-leasing vacant space.
(3)In August 2020, we proactively closed the residential accommodations at Montrose, our student housing property located in Ireland, in order to more efficiently perform renovations including the replacement of certain building safety equipment systems. During the six months ended June 30, 2021, we expanded the scope of the overall renovation beyond what was originally planned for the project. We currently estimate the total renovation cost to be approximately $26.0 million to $28.0 million, and expect the renovation to be completed by May 2022. As a result of this closure, we expect a reduction of revenues in excess of property expenses of approximately $3.0 million to $4.0 million compared to prior years.
(4)Represents the projected occupancy for these projects for the Fall 2021 semester based on leases signed to date. Leases at student housing properties are signed in advance of an academic year and units in our student housing properties are considered occupied if we have a signed lease for the unit for the academic year and have not issued a refund for the unit even if the property is not physically occupied. Our international student housing properties have been significantly impacted by the Coronavirus pandemic as a result of school closures, which resulted in refunded rent during the year ended December 31, 2020 following the closing of nearby universities for the remainder of the 2019/2020 school year, as well as additional refunds granted from January through May 2021 in response to the closing of in-campus learning in early 2021 by local governments. If there are additional school closures related to the Coronavirus pandemic in the future, we could be required to issue additional refunds, which would result in our actual occupancy differing from the projections included in the table above.
29
NAV and Distributions
We began determining a net asset value (“NAV”) per share on a monthly basis in January 2018. Since that time, our NAV per share has increased from $9.78 in the beginning of 2018 to $10.24 as of February 29, 2020. As illustrated in the chart below, the NAV per share fell to a low of $9.71 as of April 30, 2020 before increasing to $10.25 as of June 30, 2021. As described elsewhere in this Quarterly Report on Form 10-Q, the Coronavirus pandemic has had, and may continue to have, an adverse impact on global commercial activity. While it is difficult to ascertain the long term impact it will have on commercial real estate markets and our investments, it presents material uncertainty and risk with respect to the current and future performance and value of our investments. Investments in real properties and real estate-related securities have not been immune to the impact of the pandemic, which was the primary cause of the decline in our NAV during 2020. Set forth below is additional historical information regarding our NAV per share since February 29, 2016 (the date as of which our board of directors first determined an NAV per share).
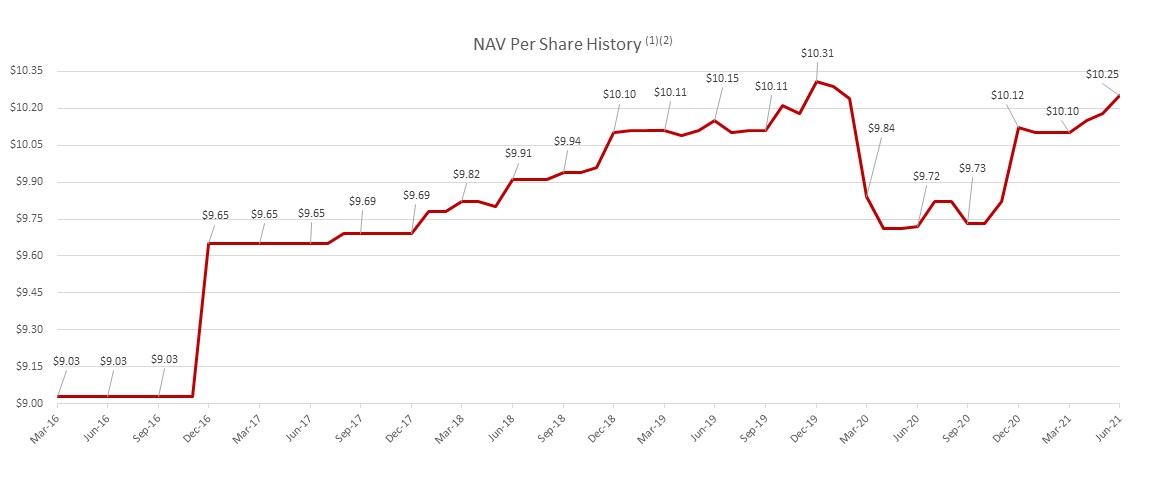
1.Please see our Current Report on Form 8-K filed with the SEC on July 16, 2021 for additional information concerning the methodology used to determine, and the limitations of, the NAV per share as of June 30, 2021. Please see our Annual Reports on Form 10-K for the years ended December 31, 2020, 2019, 2018, and 2017 as well as our Current Reports on Form 8-K for additional information concerning the NAV per share determined as of prior dates.
2.Our board of directors determined an NAV per share of $9.03 as of February 29, 2016. Prior thereto, $8.92 was considered to be the “net investment value” per share of our common stock, which was equal to the offering price per share of $10.00 in effect at that time, as arbitrarily determined by our board of directors, net of the applicable selling commissions, dealer manager fees and issuer costs.
30
We declare distributions monthly with the authorization of our board of directors. Set forth below is information regarding our historical gross annualized distribution rate, excluding any applicable distribution and stockholder servicing fees, since October 1, 2014 (the date our board first authorized distributions to be declared). As illustrated in the chart below, our gross annualized distribution rate has remained at $0.625 per share since January 2019. As described previously, the Coronavirus pandemic has had adverse effects on the operations of several of our real estate investments, which could affect our ability to maintain the current distribution rate.
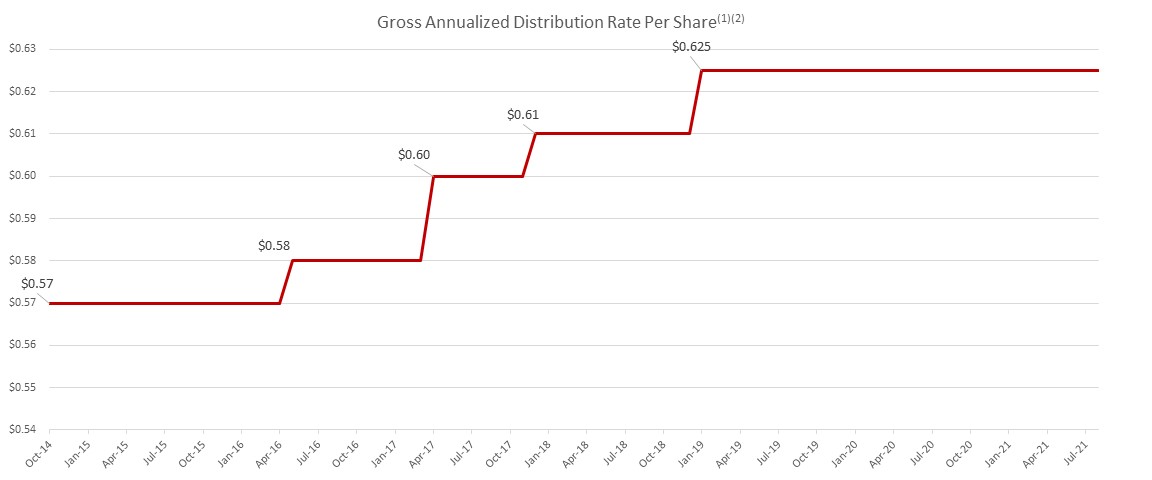
1.With the authorization of our board of directors, we declared distributions as of daily record dates and paid them on a monthly basis through December 31, 2017. Beginning in January 2018, we began declaring, and intend to continue to declare, distributions as of monthly record dates and pay them on a monthly basis.
2. We have not generated and we may continue to be unable to generate sufficient cash flows from operations to fully fund distributions. Therefore, some or all of our distributions have been and may continue to be paid, and during the offering phase, are likely to be paid at least partially from other sources, such as proceeds from the sales of assets, proceeds from our debt financings, proceeds from our public offerings, cash advances by our Advisor and/or cash resulting from a waiver or deferral of fees. See “— Financial Condition, Liquidity and Capital Resources” for additional information concerning our distributions.
Performance Summary of Share Classes
The tables presented below disclose the total returns for each of our share classes. The total returns shown reflect the percent change in the NAV per share from the beginning of the applicable period, plus the amount of any distribution per share declared during the period. The total returns shown are calculated assuming reinvestment of distributions pursuant to our distribution reinvestment plan, are derived from unaudited financial information, and are net of all Hines Global expenses, including general and administrative expenses, transaction-related expenses, management fees, the performance participation allocation, and share class specific fees, but exclude the impact of early redemption deductions on the redemption of shares that have been outstanding for less than one year. Total returns would be lower if calculated assuming that distributions were not reinvested. The returns have been prepared using unaudited data and valuations of the underlying investments in our portfolio, which are estimates of fair value and form the basis for our NAV per share. Valuations based upon unaudited reports from the underlying investments may be subject to later adjustments, may not correspond to realized value and may not accurately reflect the price at which assets could be liquidated. Past performance is not a guarantee of future results. Actual returns realized by individual stockholders will vary.
31
The table below discloses the total returns for the classes of shares that are available for investment:
| As of June 30, 2021 | ||||||||||||||||||||
Shares Class (1) | 1-Year | 3-Year | ITD | |||||||||||||||||
Class I Shares (2) | 12.24 | % | 7.59 | % | 8.11 | % | ||||||||||||||
Class D Shares (2) | 11.96 | % | 7.33 | % | 7.85 | % | ||||||||||||||
Class S Shares (No Sales Load) (3) | 11.14 | % | 6.53 | % | 7.04 | % | ||||||||||||||
Class S Shares (With Sales Load) (4) | 7.27 | % | 5.27 | % | 5.96 | % | ||||||||||||||
Class T Shares (No Sales Load) (3) | 11.14 | % | 6.53 | % | 7.04 | % | ||||||||||||||
Class T Shares (With Sales Load) (4) | 7.27 | % | 5.27 | % | 5.96 | % | ||||||||||||||
(1)The inception date for Class I, Class D, Class S and Class T Shares is December 6, 2017.
(2)Class I Shares and Class D Shares are sold without an upfront sales load.
(3)Class S Shares and Class T Shares listed as (No Sales Load) exclude up-front selling commissions and dealer manager fees.
(4)Class S Shares and Class T Shares listed as (With Sales Load) reflect the returns after the maximum up-front selling commission and dealer manager fees, which total 3.5% for both share classes.
The table below discloses the total returns for the classes of shares that were sold in the Initial Offering, but are no longer available for investment:
| As of June 30, 2021 | ||||||||||||||||||||||||||
Shares Class (1) | 1-Year | 3-Year | 5-Year | ITD | ||||||||||||||||||||||
| Class AX Shares (No Sales Load) | 12.24 | % | 7.59 | % | 9.15 | % | 8.58 | % | ||||||||||||||||||
| Class AX Shares (With Sales Load) | N/A | N/A | 6.69 | % | 6.76 | % | ||||||||||||||||||||
| Class TX Shares (No Sales Load) | 11.14 | % | 6.53 | % | 8.07 | % | 7.93 | % | ||||||||||||||||||
| Class TX Shares (With Sales Load) | N/A | N/A | 6.85 | % | 6.87 | % | ||||||||||||||||||||
| Class IX Shares (No Sales Load) | 11.96 | % | 7.33 | % | N/A | 7.69 | % | |||||||||||||||||||
| Class IX Shares (With Sales Load) | N/A | N/A | N/A | 7.48 | % | |||||||||||||||||||||
(1)The inception date for Class AX Shares, Class TX Shares, and Class IX Shares are October 1, 2014, September 1, 2015, and May 1, 2017, respectively.
32
Critical Accounting Policies
Each of our critical accounting policies involve the use of estimates that require management to make assumptions that are subjective in nature. Management relies on its experience, collects historical and current market data, and analyzes these assumptions in order to arrive at what it believes to be reasonable estimates. In addition, application of these accounting policies involves the exercise of judgment regarding assumptions as to future uncertainties. Actual results could materially differ from these estimates. For a discussion of significant accounting policies, see Note 2—Summary of Significant Accounting Policies to the accompanying condensed consolidated financial statements. Also, a disclosure of our critical accounting policies is included in our Annual Report on Form 10-K for the year ended December 31, 2020 under the heading “Management’s Discussion and Analysis of Financial Condition and Results of Operations.” There have been no significant changes to our policies during 2021.
Financial Condition, Liquidity and Capital Resources
Our principal demands for funds are to make real estate investments, including investments in real estate-related securities and capital expenditures, for the payment of operating expenses and distributions, and for the payment of principal and interest on any indebtedness we incur. Generally, we expect to meet operating cash needs from our cash flows from operating activities, and we expect to fund our investments using proceeds from our public offerings, debt proceeds and proceeds from the sales of real estate investments.
As of June 30, 2021 our portfolio was approximately 47% leveraged, based on the Estimated Values of our real estate investments owned as of that date, with a weighted average interest rate of 1.99%. We generally expect our debt financing, including our pro rata share of the debt financing of entities in which we invest, will be in the range of approximately 40% to 60% of the aggregate value of our real estate investments and other assets. Financing for acquisitions and investments may be obtained at the time an asset is acquired or an investment is made or at such later time as determined to be appropriate. In addition, debt financing may be used from time to time for property improvements, lease inducements, tenant improvements, purchase of real estate-related securities and other working capital needs, including the payment of distributions and redemptions.
Notwithstanding the above, depending on market conditions and other factors, we may choose not to place debt on our portfolio or our assets and may choose not to borrow to finance our operations or to acquire properties. Any indebtedness we do incur will likely be subject to continuing covenants, and we will likely be required to make continuing representations and warranties about our company in connection with such debt. Moreover, some or all of our debt may be secured by some or all of our assets. If we default in the payment of interest or principal on any such debt, breach any representation or warranty in connection with any borrowing or violate any covenant in any loan document, our lender may accelerate the maturity of such debt requiring us to immediately repay all outstanding principal. If we are unable to make such payment, our lender could foreclose on our assets that are pledged as collateral to such lender. The lender could also sue us or force us into bankruptcy. Any such event would have a material adverse effect on the value of an investment in our common shares.
The Coronavirus pandemic had an adverse impact on our liquidity and capital resources for the year ended December 31, 2020, which resulted from reduced rent collections at our retail properties, rent refunds at our international student housing properties and a reduction of capital raised from the Second Offering as compared to prior periods.
Despite these adverse effects, our liquidity position was bolstered by the sale of three properties in the first half of 2020, and our capital raising efforts improved significantly during the second half of 2020. As a result, we acquired five real estate investments during the second half of 2020 and four real estate investments during the first half of 2021 using offering proceeds along with debt capital. We expect proceeds from our public offerings, available capacity on our credit facilities and mortgage financing to provide sufficient capital to fund near-term cash needs, including the acquisitions of additional real estate investments during 2021. See Note 2—Summary of Significant Accounting Policies for additional information.
The following discussions provide additional details regarding our cash flows.
Cash Flows from Operating Activities
Our real estate properties generate cash flow in the form of rental revenues, which are used to pay leasing costs, property-level operating expenses, and interest payments. Additionally, we incur corporate level expenses such as general and administrative expenses, asset management fees, and the performance participation allocation.
33
Cash flows from operating activities for the six months ended June 30, 2021 increased by $20.7 million as compared to the same period in the prior year. We generally expect cash flows from operating activities to increase each year as we continue to acquire additional properties. However, some of these increases in the current year were offset by the effect of three dispositions of real estate investments completed during 2020, including the payment of $7.8 million of taxes related to the sale of Bishop’s Square in April 2020. Additionally, cash flows from operating activities were higher in the current year since no performance participation allocation was paid to our Advisor during 2021. We paid a performance participation allocation to our Advisor of $7.7 million in 2020, which was earned by our Advisor during 2019.
Cash Flows from Investing Activities
Net cash used in investing activities for the six months ended June 30, 2021 and from investing activities for the six months ended June 30, 2020 were primarily due to the following:
Six months ended June 30, 2021
•Payment of $436.8 million, primarily related to the acquisition of four real estate investments.
•Capital expenditures of approximately $5.6 million at our real estate properties.
•Payments of $32.3 million to purchase real estate-related securities, including $5.0 million of additional offering proceeds invested into our real estate-related securities portfolio. We also received proceeds of $27.3 million from the sales of these securities.
Six months ended June 30, 2020
•Payment of $164.1 million, primarily related to the acquisitions of three real estate investments.
•Capital expenditures of approximately $4.6 million at our real estate properties.
•We received proceeds of $340.5 million from the sale of the Domain Apartments in January 2020, Goodyear Crossing II in February 2020 and Bishop’s Square in April 2020. We sold the Domain Apartments for a contract sales price of $80.1 million and we acquired the Domain Apartments in January 2016 for a net purchase price of $58.1 million. We sold Goodyear Crossing II for a contract sales price of $72.0 million and we acquired Goodyear Crossing II in August 2016 for a net purchase price of $56.2 million. We sold Bishop’s Square for a contract sales price of €181.6 million (approximately $198.0 million assuming a rate of $1.09 per EUR as of the date of transaction) and we acquired Bishop’s Square in March 2015 for $92.0 million (approximately $103.5 million assuming a rate of $1.13 per EUR as of the acquisition date). Proceeds from these sales were used to pay off the secured debt outstanding on the two real estate investments in full as well as to fund additional real estate investments.
•Payments of $24.6 million to purchase real estate-related securities, including $5.0 million of additional offering proceeds invested into our real estate-related securities portfolio. We also received proceeds of $18.8 million from the sales of real estate-related securities.
Cash Flows from Financing Activities
Public Offerings
We raised gross proceeds of $223.9 million and $147.9 million from our Second Offering during the six months ended June 30, 2021 and 2020, respectively, excluding proceeds from the distribution reinvestment plan. In addition, during the six months ended June 30, 2021 and 2020, we redeemed $26.6 million and $15.0 million in shares of our common stock pursuant to our share redemption program, respectively. We launched our Third Offering on June 2, 2021, which had its first monthly closing on July 1, 2021. Our Second Offering was terminated immediately prior to the commencement of our Third Offering.
In addition to the investing activities described previously, we use proceeds from our public offerings to make certain payments to our Advisor, our Dealer Manager and Hines and its affiliates during the various phases of our organization and operation which include, without limitation, payments to our Dealer Manager for selling commissions, dealer manager fees, distribution and stockholder servicing fees and payments to our Advisor for reimbursement of organization and offering costs. During the six months ended June 30, 2021 and 2020, we made payments of $5.0 million and $5.5 million, respectively, for selling commissions, dealer manager fees and distribution and stockholder servicing fees related to our public offerings. The change in these fees is generally attributable to the amount of offering proceeds raised, but is also impacted by variations in the amount of each share class sold during the year. During the six months ended June 30, 2021 and 2020, we reimbursed our Advisor $3.1 million and $2.9 million, respectively, for organization and offering costs.
34
Distributions
With the authorization of our board of directors, we declared distributions monthly from January 2020 through August 2021 at a gross distribution rate of $0.05208 per month ($0.625 annualized) for each share class less any applicable distribution and stockholder servicing fees. Distributions are made on all classes of the Company’s common stock at the same time. All distributions were or will be paid in cash or reinvested in shares of the Company’s common stock for those participating in our distribution reinvestment plan and have been or will be paid or issued, respectively, on the first business day following the completion of the month to which they relate. Distributions reinvested pursuant to our distribution reinvestment plan were or will be reinvested in shares of the same class as the shares on which the distributions are made. Some or all of the cash distributions may be paid from sources other than cash flows from operations, as described below.
Distributions paid to stockholders during the six months ended June 30, 2021 and 2020 were $31.8 million and $25.2 million, respectively, including those reinvested in shares pursuant to our distribution reinvestment plan. We have not generated and we may continue to be unable to generate sufficient cash flows from operations to fully fund distributions paid. Therefore, some or all of our distributions have been and may continue to be paid at least partially from other sources, such as proceeds from the sales of assets, proceeds from our debt financings, proceeds from our public offerings, cash advances by our Advisor and/or cash resulting from a waiver or deferral of fees. We have not placed a cap on the amount of distributions that may be paid from any of these sources. For example, for the six months ended June 30, 2021 and June 30, 2020, we funded 73% and 100% of total distributions with cash flows from investing activities, which include proceeds from the sale of real estate.
The following table outlines our total distributions declared to stockholders for each quarter during 2021 and 2020, including the breakout between the distributions declared in cash and those reinvested pursuant to our distribution reinvestment plan (in thousands, except percentages).
| Stockholders | Distributions Paid With Cash Flows From Operating Activities (1) | |||||||||||||||||||||||||||||||||||||||||||||||||
| Distributions for the Three Months Ended | Cash Distributions | Distributions Reinvested | Total Declared | |||||||||||||||||||||||||||||||||||||||||||||||
| 2021 | ||||||||||||||||||||||||||||||||||||||||||||||||||
| June 30, 2021 | $ | 8,378 | $ | 8,915 | $ | 17,293 | $ | 3,583 | 21 | % | ||||||||||||||||||||||||||||||||||||||||
| March 31, 2021 | 7,615 | 7,978 | 15,593 | 5,215 | 33 | % | ||||||||||||||||||||||||||||||||||||||||||||
| Total | $ | 15,993 | $ | 16,893 | $ | 32,886 | $ | 8,798 | 27 | % | ||||||||||||||||||||||||||||||||||||||||
| 2020 | ||||||||||||||||||||||||||||||||||||||||||||||||||
| December 31, 2020 | $ | 6,981 | $ | 7,531 | $ | 14,513 | $ | 8,056 | 55 | % | ||||||||||||||||||||||||||||||||||||||||
| September 30, 2020 | 6,486 | 7,309 | 13,795 | 13,721 | 99 | % | ||||||||||||||||||||||||||||||||||||||||||||
| June 30, 2020 | 6,262 | 7,190 | 13,452 | — | — | % | ||||||||||||||||||||||||||||||||||||||||||||
| March 31, 2020 | 5,669 | 6,732 | 12,401 | — | — | % | ||||||||||||||||||||||||||||||||||||||||||||
| Total | $ | 25,398 | $ | 28,762 | $ | 54,161 | $ | 21,777 | 40 | % | ||||||||||||||||||||||||||||||||||||||||
(1)Includes distributions paid to noncontrolling interests.
35
Debt Financings
As mentioned above under “—Financial Condition, Liquidity and Capital Resources,” our portfolio was approximately 47% leveraged as of June 30, 2021 (based on the most recent valuations of our real estate investments). Our total loan principal outstanding had a weighted average interest rate of 1.99% as of June 30, 2021. Below is additional information regarding our loan activity for the six months ended June 30, 2021 and 2020. See Note 4—Debt Financing for additional information regarding our outstanding debt and our interest rate exposure.
Six months ended June 30, 2021
•We received proceeds from notes payable of $376.5 million, which is comprised primarily of $253.0 million in draws on our Revolving Credit Facility and $108.0 million from a bridge loan with JPMorgan. These proceeds were used primarily to provide cash for the four acquisitions during the period.
•We made payments on notes payable of $107.4 million, which included $105.0 million in payments on our Revolving Credit Facility as well as principal payments of $2.4 million relating to our permanent mortgage financing. Our Revolving Credit Facility had an outstanding balance of $388.0 million as of June 30, 2021.
Six months ended June 30, 2020
•We received proceeds of $76.0 million from draws on our Revolving Credit Facility and mortgage financing. We used these proceeds primarily to provide cash for the acquisition of real estate investments during the period. We borrowed $59.0 million and made payments of $123.0 million on the Revolving Credit Facility during the period, resulting in an outstanding balance of $40.0 million as of June 30, 2020.
•We made payments of $248.8 million on notes payable, which includes payments of $123.0 million on the Revolving Credit Facility, and the repayment of outstanding balances of our secured debt relating to the Domain Apartments, Goodyear Crossing II, and Bishop’s Square, using the proceeds from the sales of the properties.
•We repaid the $75.0 million outstanding balance under the Hines Credit Facility in April 2020. No amounts have been outstanding under this facility since that time.
36
Results of Operations
Three months ended June 30, 2021 compared to the three months ended June 30, 2020
The table below includes information regarding changes in our results of operations for the three months ended June 30, 2021 compared to the three months ended June 30, 2020, including explanations for significant changes and any significant or unusual activity. As described more completely below, most amounts increased in 2021 compared to 2020 as a result of additional capital raised and invested in real estate, as offset by recent property dispositions. All amounts are in thousands, except for percentages:
| Three Months Ended June 30, | Change | ||||||||||||||||||||||
| 2021 | 2020 | $ | % | ||||||||||||||||||||
| Revenues: | |||||||||||||||||||||||
| Rental revenue | $ | 40,424 | $ | 27,001 | $ | 13,423 | 50 | % | |||||||||||||||
| Other revenue | 967 | 813 | 154 | 19 | % | ||||||||||||||||||
| Total revenues | 41,391 | 27,814 | 13,577 | 49 | % | ||||||||||||||||||
| Expenses: | |||||||||||||||||||||||
| Property operating expenses | 10,239 | 7,139 | 3,100 | 43 | % | ||||||||||||||||||
| Real property taxes | 4,777 | 3,489 | 1,288 | 37 | % | ||||||||||||||||||
| Property management fees | 1,426 | 1,192 | 234 | 20 | % | ||||||||||||||||||
| Depreciation and amortization | 24,916 | 14,457 | 10,459 | 72 | % | ||||||||||||||||||
| Acquisition related expenses | 15 | 274 | (259) | (95) | % | ||||||||||||||||||
| Asset management fees | 3,845 | 2,747 | 1,098 | 40 | % | ||||||||||||||||||
| Performance participation allocation | 5,249 | — | 5,249 | 100 | % | ||||||||||||||||||
| General and administrative expenses | 1,445 | 1,286 | 159 | 12 | % | ||||||||||||||||||
| Total expenses | 51,912 | 30,584 | 21,328 | 70 | % | ||||||||||||||||||
| Other income (expenses): | |||||||||||||||||||||||
| Gain (loss) on derivative instruments | (185) | 1,514 | (1,699) | (112) | % | ||||||||||||||||||
| Gain (loss) on investments in real estate-related securities | 5,750 | 3,136 | 2,614 | 83 | % | ||||||||||||||||||
| Gain on sale of real estate | 1,402 | 80,457 | (79,055) | (98) | % | ||||||||||||||||||
| Foreign currency gains (losses) | 1,397 | 1,374 | 23 | 2 | % | ||||||||||||||||||
| Interest expense | (6,370) | (4,463) | (1,907) | 43 | % | ||||||||||||||||||
| Interest and other income | 470 | 159 | 311 | 196 | % | ||||||||||||||||||
| Income (loss) before benefit (provision) for income taxes | (8,057) | 79,407 | (87,464) | (110) | % | ||||||||||||||||||
| Benefit (provision) for income taxes | (3,637) | 1,906 | (5,543) | (291) | % | ||||||||||||||||||
| Provision for income taxes related to sale of real estate | — | (7,773) | 7,773 | 100 | % | ||||||||||||||||||
| Net income (loss) | $ | (11,694) | $ | 73,540 | $ | (85,234) | (116) | % | |||||||||||||||
* Not a meaningful percentage
Total revenues: The increase in total revenues is primarily due to the additional real estate investments acquired between June 30, 2020 and June 30, 2021. During that time, we acquired eight real estate investments since June 30, 2020 and had a portfolio of 26 real estate investments as of June 30, 2021 that contained 12.9 million leasable square feet, of which 95% was leased. Additionally, total revenues of our same-store properties increased $2.7 million for the three months ended June 30, 2021 compared to the same period in 2020. Please refer to our “Same Store Analysis” below for additional discussion on the results of operations of our portfolio.
Property operating expenses: The increase in property operating expenses is primarily due to our significant acquisition activity since June 30, 2020, as described above. Property operating expenses of our same-store properties increased $2.0 million for the three months ended June 30, 2021 compared to the same period in 2020. Please refer to our “Same Store Analysis” below for additional discussion on the results of operations of our portfolio.
37
Real property taxes: The increase in real property taxes is primarily due to our significant acquisition activity since June 30, 2020, as described above. Real property taxes of our same-store properties decreased $164,000 for the three months ended June 30, 2021 compared to the same period in 2020. Please refer to our “Same Store Analysis” below for additional discussion on the results of operations of our portfolio.
Property management fees: The increase in property management fees is primarily due to our significant acquisition activity since June 30, 2020, as described above. Property management fees of our same-store properties increased $77,000 for the three months ended June 30, 2021 compared to the same period in 2020. Please refer to our “Same Store Analysis” below for additional discussion on the results of operations of our portfolio.
Depreciation and amortization: The increase in depreciation and amortization expense is primarily due to the additional real estate investments acquired since June 30, 2020, offset by dispositions of three real estate investments during the year ended December 31, 2020.
Asset management fees: Asset management fees are charged based on the aggregate valuation of our real estate investments, as most recently determined in connection with the determination of our NAV. The increase in these fees is primarily due to the additional real estate investments made since June 30, 2020, as previously described.
Performance participation allocation: The increase in performance participation allocation is primarily due to increases in our NAV per share during 2021. The performance participation allocation was not earned by our Advisor for the year ended December 31, 2020 as a result of a decline in our NAV per share during 2020. Please see Item 2—Management’s Discussion and Analysis—NAV and Distributions for additional information concerning the change in NAV per share.
General and administrative expenses: General and administrative expenses increased primarily due to increased legal costs and shareholder costs. We generally expect our general and administrative expenses to continue to increase as we continue raising capital from our public offerings.
Gain (loss) on derivative instruments: We enter into interest rate hedging instruments in order to limit our exposure against the variability of future interest rates on our variable interest rate borrowings as well as foreign currency forward contracts as economic hedges against the variability of foreign exchange rates. During the three months ended June 30, 2021, such losses were primarily related to the position of our foreign currency forward contracts.
Gain (loss) on investments in real estate-related securities: We hold investments in real estate-related securities which consist of common equities, preferred equities and debt investments of publicly traded REITs. These amounts include realized gains (losses) related to securities sold during the year and unrealized gains (losses) based on values determined on a recurring basis. We incurred realized and unrealized losses during 2020 resulting from stock market declines related to the Coronavirus pandemic. Performance has been significantly better during 2021, and we have experienced realized and unrealized gains for the three months ended June 30, 2021. For further detail on the gains and losses relating to our investments in real estate-related securities, see Note 2—Significant Accounting Policies in the notes to the accompanying financial statements.
Gain on sale of real estate: We acquired Bishop’s Square in March 2015 for €92.0 million (approximately $103.5 million assuming a rate of $1.13 per EUR as of the acquisition date) and we sold Bishop’s Square in April 2020 for €181.6 million (approximately $198.0 million assuming a rate of $1.09 per EUR as of the date of the transaction). We recognized a gain on sale of this asset of $80.4 million, excluding taxes related to the sale, which are described below. We had no property dispositions during the three months ended June 30, 2021.
Foreign currency gains (losses): Foreign currency gains (losses) primarily reflects the effect of changes in foreign currency exchange rates on transactions that were denominated in currencies other than the functional currency of the related entity. During the three months ended June 30, 2021, these losses were primarily related to the effect of remeasuring debt and cash held in foreign currencies into their related functional currencies.
Interest expense: Interest expense increased due to additional indebtedness outstanding during the period resulting from additional real estate investments acquired since June 30, 2020, offset by the net decrease in our principal amount of indebtedness outstanding as a result of the properties sold during 2020. Our portfolio was 47% levered at June 30, 2021 compared to 39% at June 30, 2020.
Interest and other income: Primarily relates to interest and dividend income associated with our investments in real estate-related securities.
Benefit (provision) for income taxes: The change from a $1.9 million benefit to a provision of $3.6 million is primarily a result of recording $3.9 million of tax expense during the quarter to correct the deferred tax asset and related valuation allowance at one of our properties. See Note 2—Significant Accounting Policies in the notes to the financial statements.
38
Same-Store Analysis
We evaluate our consolidated results of operations on a same-store basis, which allows us to analyze our property operating results excluding the effects of acquisitions and dispositions during the periods under comparison. Properties in our portfolio are considered same-store if they were owned for the full periods presented. Same-store properties for the three months ended June 30, 2021 includes 17 properties. The tables below include additional information regarding the operating results of our same-store properties for the current period as compared to the same period in the prior year.
The following table presents the same-store revenues for the three months ended June 30, 2021, as compared to the three months ended June 30, 2020, by reportable segment. In total, revenues increased by $13.6 million. $10.9 million of this increase is due to the acquisition of eight additional properties between June 30, 2020 and June 30, 2021. Additionally, revenues of our same-store properties increased by $2.7 million. See below for additional explanations of notable changes in same-store revenues. All amounts are in thousands, except for percentages.
| Three Months Ended June 30, | Change | ||||||||||||||||||||||
| 2021 | 2020 | $ | % | ||||||||||||||||||||
| Revenues | |||||||||||||||||||||||
| Same-store properties | |||||||||||||||||||||||
| Domestic office investments | $ | 3,722 | $ | 3,835 | $ | (113) | (3) | % | |||||||||||||||
| Domestic residential/living investments | 5,242 | 4,908 | 334 | 7 | % | ||||||||||||||||||
| Domestic retail investments | 6,353 | 5,151 | 1,202 | (1) | 23 | % | |||||||||||||||||
| International industrial investments | 11,886 | 10,584 | 1,302 | (2) | 12 | % | |||||||||||||||||
| International residential/living investments | 2,612 | 2,668 | (56) | (2) | % | ||||||||||||||||||
| Total same-store properties | $ | 29,815 | $ | 27,146 | $ | 2,669 | 10 | % | |||||||||||||||
| Recent acquisitions | 11,576 | 140 | 11,436 | N/A* | |||||||||||||||||||
| Disposed properties | — | 528 | (528) | (100) | % | ||||||||||||||||||
| Total revenues | $ | 41,391 | $ | 27,814 | $ | 13,577 | 49 | % | |||||||||||||||
* Not a meaningful percentage
(1)The increase is primarily due to rent concessions negotiated with our tenants in 2020 as a result of the Coronavirus pandemic during 2020, which resulted in forgiven rental payments granted in 2020 and reduced rent due to the conversion of fixed rental payments to rental payments based on a percentage of the tenant’s revenues. Consumer traffic at these properties has improved to pre-pandemic levels in recent months. We have not granted significant additional rent relief during the three months ended June 30, 2021.
(2)The increase is primarily due to the additional building acquisitions at ABC Westland as well as the impact of the strengthening of the Euro, British pound and Polish zloty against the U.S. dollar, during the three months ended June 30, 2021 compared with the same period in 2020.
39
The following table presents the property expenses of each reportable segment for the three months ended June 30, 2021, as compared to the three months ended June 30, 2020. Generally, property expenses increased as a result of eight additional property acquisitions made between June 30, 2020 and June 30, 2021. Property expenses of our same-store properties also increased. See below for additional explanations of notable changes in same-store property expenses. All amounts are in thousands, except for percentages.
| Three Months Ended June 30, | Change | ||||||||||||||||||||||
| 2021 | 2020 | $ | % | ||||||||||||||||||||
Property expenses(1) | |||||||||||||||||||||||
| Same-store properties | |||||||||||||||||||||||
| Domestic office investments | $ | 1,448 | $ | 1,237 | $ | 211 | 17 | % | |||||||||||||||
| Domestic residential/living investments | 2,232 | 2,446 | (214) | (9) | % | ||||||||||||||||||
| Domestic retail investments | 2,825 | 2,935 | (110) | (4) | % | ||||||||||||||||||
| International industrial investments | 4,640 | 3,974 | 666 | (2) | 17 | % | |||||||||||||||||
| International residential/living investments | 2,509 | 1,040 | 1,469 | (3) | 141 | % | |||||||||||||||||
| Total same-store properties | $ | 13,654 | $ | 11,632 | $ | 2,022 | 17 | % | |||||||||||||||
| Recent acquisitions | 2,788 | 26 | 2,762 | N/A* | |||||||||||||||||||
| Disposed properties | — | 162 | (162) | (100) | % | ||||||||||||||||||
| Total property expenses | $ | 16,442 | $ | 11,820 | $ | 4,622 | 39 | % | |||||||||||||||
* Not a meaningful percentage
(1)Property expenses include property operating expenses, real property taxes and property management fees.
(2)The increase is primarily due to the additional building acquisitions at ABC Westland as well as the impact of the strengthening of the Euro, British pound and Polish zloty against the U.S. dollar, during the three months ended June 30, 2021.
(3)The increase is primarily due to the demolition costs incurred during the period for the renovations at the Montrose property, as well as the impact of the strengthening of the Euro, British pound and Polish zloty against the U.S. dollar, during the three months ended June 30, 2021 compared with the same period in 2020.
40
The following table presents revenues in excess of property expenses for the three months ended June 30, 2021, as compared to the three months ended June 30, 2020, by reportable segment. Total revenues in excess of property expenses increased primarily as a result of our significant recent acquisition activity. Total revenues in excess of property expenses of our same-store properties increased by 4%. See above for additional explanations of notable changes in same-store revenues in excess of expenses. All amounts below are in thousands, except for percentages.
| Three Months Ended June 30, | Change | ||||||||||||||||||||||
| 2021 | 2020 | $ | % | ||||||||||||||||||||
Revenues in excess of property expenses(1) | |||||||||||||||||||||||
| Same-store properties | |||||||||||||||||||||||
| Domestic office investments | $ | 2,274 | $ | 2,598 | $ | (324) | (12) | % | |||||||||||||||
| Domestic residential/living investments | 3,010 | 2,462 | 548 | 22 | % | ||||||||||||||||||
| Domestic retail investments | 3,528 | 2,216 | 1,312 | (2) | 59 | % | |||||||||||||||||
| International industrial investments | 7,246 | 6,610 | 636 | (2) | 10 | % | |||||||||||||||||
| International residential/living investments | 103 | 1,628 | (1,525) | (2) | (94) | % | |||||||||||||||||
| Total same-store properties | $ | 16,161 | $ | 15,514 | $ | 647 | 4 | % | |||||||||||||||
| Recent acquisitions | 8,788 | 114 | 8,674 | N/A* | |||||||||||||||||||
| Disposed properties | — | 366 | (366) | (100) | % | ||||||||||||||||||
| Total revenues in excess of property expenses | $ | 24,949 | $ | 15,994 | $ | 8,955 | 56 | % | |||||||||||||||
* Not a meaningful percentage
(1)Revenues in excess of property expenses include total revenues less property operating expenses, real property taxes and property management fees.
(2)Please refer to the tables above for explanations regarding these changes.
41
Six months ended June 30, 2021 compared to the six months ended June 30, 2020
The table below includes information regarding changes in our results of operations for the six months ended June 30, 2021 compared to the six months ended June 30, 2020, including explanations of significant changes and any significant or unusual activity. As described more completely below, most amounts increased in 2021 compared to 2020 as a result of additional capital raised and invested in real estate, as offset by recent property dispositions. All amounts are in thousands, except for percentages:
| Six Months Ended June 30, | Change | ||||||||||||||||||||||
| 2021 | 2020 | $ | % | ||||||||||||||||||||
| Revenues: | |||||||||||||||||||||||
| Rental revenue | $ | 77,900 | $ | 60,120 | $ | 17,780 | 30 | % | |||||||||||||||
| Other revenue | 1,783 | 1,539 | 244 | 16 | % | ||||||||||||||||||
| Total revenues | 79,683 | 61,659 | 18,024 | 29 | % | ||||||||||||||||||
| Expenses: | |||||||||||||||||||||||
| Property operating expenses | 19,613 | 15,213 | 4,400 | 29 | % | ||||||||||||||||||
| Real property taxes | 9,180 | 6,971 | 2,209 | 32 | % | ||||||||||||||||||
| Property management fees | 2,910 | 2,549 | 361 | 14 | % | ||||||||||||||||||
| Depreciation and amortization | 44,943 | 30,686 | 14,257 | 46 | % | ||||||||||||||||||
| Acquisition related expenses | 15 | 291 | (276) | N/A* | |||||||||||||||||||
| Asset management fees | 7,306 | 5,538 | 1,768 | 32 | % | ||||||||||||||||||
| Performance participation allocation | 7,483 | — | 7,483 | N/A* | |||||||||||||||||||
| General and administrative expenses | 2,810 | 2,324 | 486 | 21 | % | ||||||||||||||||||
| Total expenses | 94,260 | 63,572 | 30,688 | 48 | % | ||||||||||||||||||
| Other income (expenses): | |||||||||||||||||||||||
| Gain (loss) on derivative instruments | (276) | 8,470 | (8,746) | N/A* | |||||||||||||||||||
| Gain (loss) on investments in real estate-related securities | 9,089 | (4,601) | 13,690 | N/A* | |||||||||||||||||||
| Gain on sale of real estate | 1,440 | 130,101 | (128,661) | N/A* | |||||||||||||||||||
| Foreign currency gains (losses) | 367 | (1,145) | 1,512 | N/A* | |||||||||||||||||||
| Interest expense | (11,748) | (10,395) | (1,353) | 13 | % | ||||||||||||||||||
| Interest and other income | 976 | 710 | 266 | 37 | % | ||||||||||||||||||
| Income (loss) before benefit (provision) for income taxes | (14,729) | 121,227 | (135,956) | N/A* | |||||||||||||||||||
| Benefit (provision) for income taxes | (2,683) | 1,838 | (4,521) | N/A* | |||||||||||||||||||
| Provision for income taxes related to sale of real estate | — | (7,773) | 7,773 | N/A* | |||||||||||||||||||
| Net income (loss) | $ | (17,412) | $ | 115,292 | $ | (132,704) | N/A* | ||||||||||||||||
* Not a meaningful percentage
Total revenues: The increase in total revenue is primarily due to the additional real estate investments acquired between June 30, 2020 and June 30, 2021. During that time, we acquired eight real estate investments and had a portfolio of 26 real estate investments as of June 30, 2021 that contained 12.9 million leasable square feet, of which 95% was leased. Total revenues of our same-store properties increased $1.44 million for the six months ended June 30, 2021 compared to the same period in 2020. Please refer to our “Same Store Analysis” below for additional discussion on the results of operations of our portfolio.
Property operating expenses: The increase in property operating expenses is primarily due to our significant acquisition activity since June 30, 2020, as described above. Property operating expenses of our same-store properties increased $3.1 million for the six months ended June 30, 2021 compared to the same period in 2020. Please refer to our “Same Store Analysis” below for additional discussion on the results of operations of our portfolio.
42
Real property taxes: The increase in real property taxes is primarily due to our significant acquisition activity since June 30, 2020. Despite this increase, real property taxes of our same-store properties decreased $219,000 for the six months ended June 30, 2021 compared to the same period in 2020. Please refer to our “Same Store Analysis” below for additional discussion on the results of operations of our portfolio.
Property management fees: The increase in property management fees is primarily due to our significant acquisition activity since June 30, 2020. Property management fees of our same-store properties increased $117,000 for the six months ended June 30, 2021 compared to the same period in 2020. Please refer to our “Same Store Analysis” below for additional discussion on the results of operations of our portfolio.
Depreciation and amortization: The increase in depreciation and amortization expense is primarily due to the additional real estate investments acquired since June 30, 2020, offset by dispositions of three real estate investments during the year ended December 31, 2020.
Asset management fees: Asset management fees are charged based on the aggregate valuation of our real estate investments, as most recently determined in connection with the determination of our NAV. The increase in these fees is primarily due to the additional real estate investments made since June 30, 2020, as previously described.
Performance participation allocation: The increase in performance participation allocation is a result of the fee not being earned by the Advisor for the six months ended June 30, 2020 due to a decline in our NAV per share during 2020. Please see Item 2—Management’s Discussion and Analysis—NAV and Distributions for additional information concerning the change in NAV per share.
General and administrative expenses: General and administrative expenses increased primarily due to increased legal costs and shareholder costs. We generally expect our general and administrative expenses to continue to increase as we continue raising capital in our public offerings.
Gain (loss) on derivative instruments: We enter into interest rate hedging instruments in order to limit our exposure against the variability of future interest rates on our variable interest rate borrowings as well as foreign currency forward contracts as economic hedges against the variability of foreign exchange rates. During the six months ended June 30, 2021, losses were primarily related to the position of our foreign currency forward contracts. Gains recorded during the six months ended June 30, 2020 primarily related to foreign currency forward contracts on the sale proceeds from Bishop’s Square.
Gain (loss) on investments in real estate-related securities: We hold investments in real estate-related securities which consist of common equities, preferred equities and debt investments of publicly traded REITs. These amounts include realized gains (losses) related to securities sold during the year and unrealized gains (losses) based on values determined on a recurring basis. We incurred realized and unrealized losses during 2020 resulting from stock market declines related to the Coronavirus pandemic. Performance has been significantly better during 2021, and we have experienced realized and unrealized gains for the six months ended June 30, 2021. For further detail on the gains and losses relating to our investments in real estate-related securities, see Note 2—Significant Accounting Policies in the notes to the accompanying financial statements.
Gain on sale of real estate: We acquired the Domain Apartments in January 2016 for a contract purchase price of $58.1 million and we sold the Domain Apartments for a contract sales price of $80.1 million on January 7, 2020, resulting in the recognition of a gain of $29.5 million related to this sale. Additionally, we acquired Goodyear Crossing II in August 2016 for a contract purchase price of $56.2 million and we sold Goodyear Crossing II for a contract sales price of $72.0 million on February 14, 2020, resulting in a recognition of a gain of $20.2 million related to this sale. We acquired Bishop’s Square in March 2015 for €92.0 million (approximately $103.5 million assuming a rate of $1.13 per EUR as of the acquisition date) and we sold Bishop’s Square in April 2020 for €181.6 million (approximately $198.0 million assuming a rate of $1.09 per EUR as of the date of transaction). We recognized a gain on sale of this asset of $80.4 million, excluding taxes related to the sale, which are described below. We had no property dispositions during the six months ended June 30, 2021.
Foreign currency gains (losses): Foreign currency gains (losses) primarily reflects the effect of changes in foreign currency exchange rates on transactions that were denominated in currencies other than the functional currency of the related entity. During the six months ended June 30, 2021 and 2020, these gains and losses were primarily related to the effect of remeasuring cash held in foreign currencies into their related functional currencies.
Interest expense: Interest expense increased due to the net increase in our principal amount of indebtedness outstanding during the period resulting from additional real estate investments acquired since June 30, 2020, as offset by the effects of the properties sold during 2020.
Interest and other income: Primarily relates to interest and dividend income associated with our investments in real estate-related securities. The increase in interest and dividend income earned during the six months ended June 30, 2021 compared to 2020 is due to additional investments in real estate-related securities since June 30, 2020.
43
Benefit (provision) for income taxes: The change from a $1.8 million benefit to a $2.7 million provision is primarily a result of recording $2.9 million of tax expense during the six months ended June 30, 2021 to correct the deferred tax asset and related valuation allowance at one of our properties. See Note 2—Significant Accounting Policies in the notes to the financial statements.
Provision for income taxes related to sale of real estate: The decrease during the six months ended June 30, 2021 compared to 2020 relates to the income tax incurred as a result of the sale of Bishop’s Square during April 2020, as described above.
Same-Store Analysis
We evaluate our consolidated results of operations on a same-store basis, which allows us to analyze our property operating results excluding the effects of acquisitions and dispositions during the periods under comparison. Properties in our portfolio are considered same-store if they were owned for the full periods presented. Same-store properties for the six months ended June 30, 2021 includes sixteen properties. The tables below include additional information regarding the operating results of our same-store properties for the current period as compared to the same period in the prior year.
The following table presents the same-store revenues for the six months ended June 30, 2021, as compared to the six months ended June 30, 2020, by reportable segment. Total revenues increased by $18.0 million. $16.6 million of this increase is a result of eight additional property acquisitions made between June 30, 2020 and June 30, 2021. The remaining $1.4 million increase is related to our same-store properties. See below for additional explanations of notable changes in same-store revenues. All amounts below are in thousands, except for percentages.
| Six months ended June 30, | Change | ||||||||||||||||||||||
| 2021 | 2020 | $ | % | ||||||||||||||||||||
| Revenues | |||||||||||||||||||||||
| Same-store properties | |||||||||||||||||||||||
| Domestic office investments | $ | 7,611 | $ | 7,771 | $ | (160) | (2) | % | |||||||||||||||
| Domestic residential/living investments | 6,459 | 6,468 | (9) | — | % | ||||||||||||||||||
| Domestic retail investments | 12,994 | 12,524 | 470 | 4 | % | ||||||||||||||||||
| International industrial investments | 24,056 | 21,619 | 2,437 | (1) | 11 | % | |||||||||||||||||
| International residential/living investments | 5,419 | 6,717 | (1,298) | (2) | (19) | % | |||||||||||||||||
| Total same-store properties | $ | 56,539 | $ | 55,099 | $ | 1,440 | 3 | % | |||||||||||||||
| Recent acquisitions | 23,144 | 2,901 | 20,243 | N/A* | |||||||||||||||||||
| Disposed properties | — | 3,659 | (3,659) | (100) | % | ||||||||||||||||||
| Total revenues | $ | 79,683 | $ | 61,659 | $ | 18,024 | 29 | % | |||||||||||||||
* Not a meaningful percentage
(1)The increase is primarily due to additional building acquisitions at ABC Westland as well as the impact of the strengthening of the Euro, British pound and Polish zloty against the U.S. dollar,
(2)The decrease is primarily due to the closing of one of our student housing properties in August 2020 for renovation and replacement of certain building safety equipment systems.
44
The following table presents the property expenses of each reportable segment for the six months ended June 30, 2021, as compared to the six months ended June 30, 2020, by reportable segment. Generally, property expenses increased by $7.0 million primarily as a result of eight additional property acquisitions made between June 30, 2020 and June 30, 2021. Property expenses of our same-store properties also increased by $3.0 million. See above for additional explanations of notable changes in same-store property expenses. All amounts below are in thousands, except for percentages.
| Six months ended June 30, | Change | ||||||||||||||||||||||
| 2021 | 2020 | $ | % | ||||||||||||||||||||
Property expenses(1) | |||||||||||||||||||||||
| Same-store properties | |||||||||||||||||||||||
| Domestic office investments | $ | 2,860 | $ | 2,598 | $ | 262 | 10 | % | |||||||||||||||
| Domestic residential/living investments | 2,895 | 3,180 | (285) | (9) | % | ||||||||||||||||||
| Domestic retail investments | 5,990 | 5,925 | 65 | 1 | % | ||||||||||||||||||
| International industrial investments | 9,920 | 8,346 | 1,574 | (2) | 19 | % | |||||||||||||||||
| International residential/living investments | 3,799 | 2,402 | 1,397 | (3) | 58 | % | |||||||||||||||||
| Total same-store properties | $ | 25,464 | $ | 22,451 | $ | 3,013 | 13 | % | |||||||||||||||
| Recent acquisitions | 6,239 | 1,319 | 4,920 | N/A* | |||||||||||||||||||
| Disposed properties | — | 963 | (963) | (100) | % | ||||||||||||||||||
| Total property expenses | $ | 31,703 | $ | 24,733 | $ | 6,970 | 28 | % | |||||||||||||||
* Not a meaningful percentage
(1)Property expenses include property operating expenses, real property taxes and property management fees.
(2)The increase is primarily due to additional building acquisitions at ABC Westland acquired as well as the impact of the strengthening of the Euro, British pound and Polish zloty against the U.S. dollar,
(3)The increase is primarily due to the demolition costs incurred during the period for the renovations at the Montrose property, as well as the impact of the strengthening of the Euro, British pound and Polish zloty against the U.S. dollar, during the three months ended June 30, 2021 compared with the same period in 2020.
45
The following table presents revenues in excess of property expenses for the six months ended June 30, 2021, as compared to the six months ended June 30, 2020, by reportable segment. Total revenues in excess of property expenses increased by $11.1 million primarily as a result of our significant recent acquisition activity. Additionally, total revenues in excess of property expenses of our same-store properties decreased by $1.6 million. See below for additional explanations of notable changes in same-store property revenues in excess of expenses. All amounts below are in thousands, except for percentages.
| Six months ended June 30, | Change | ||||||||||||||||||||||
| 2021 | 2020 | $ | % | ||||||||||||||||||||
Revenues in excess of property expenses(1) | |||||||||||||||||||||||
| Same-store properties | |||||||||||||||||||||||
| Domestic office investments | $ | 4,751 | $ | 5,173 | $ | (422) | (8) | % | |||||||||||||||
| Domestic residential/living investments | 3,564 | 3,288 | 276 | 8 | % | ||||||||||||||||||
| Domestic retail investments | 7,004 | 6,599 | 405 | 6 | % | ||||||||||||||||||
| International industrial investments | 14,136 | 13,273 | 863 | 7 | % | ||||||||||||||||||
| International residential/living investments | 1,620 | 4,315 | (2,695) | (2) | (62) | % | |||||||||||||||||
| Total same-store properties | $ | 31,075 | $ | 32,648 | $ | (1,573) | (5) | % | |||||||||||||||
| Recent acquisitions | 16,905 | 1,582 | 15,323 | N/A* | |||||||||||||||||||
| Disposed properties | — | 2,696 | (2,696) | (100) | % | ||||||||||||||||||
| Total revenues in excess of property expenses | $ | 47,980 | $ | 36,926 | $ | 11,054 | 30 | % | |||||||||||||||
* Not a meaningful percentage
(1)Revenues in excess of property expenses include total revenues less property operating expenses, real property taxes and property management fees.
(2)Please refer to the tables above for explanations regarding these changes.
46
Funds from Operations
We believe funds from operations (“FFO”) is a meaningful supplemental non-GAAP operating metric. FFO is a non-GAAP financial performance measure defined by the National Association of Real Estate Investment Trusts (“NAREIT”) and is widely recognized by investors and analysts as one measure of operating performance of a real estate company. FFO excludes items such as real estate depreciation and amortization. Depreciation and amortization, as applied in accordance with GAAP, implicitly assumes that the value of real estate assets diminishes predictably over time and also assumes that such assets are adequately maintained and renovated as required in order to maintain their value. Since real estate values have historically risen or fallen with market conditions such as occupancy rates, rental rates, inflation, interest rates, the business cycle, unemployment and consumer spending, it is management’s view, and we believe the view of many industry investors and analysts, that the presentation of operating results for real estate companies using historical cost accounting alone is insufficient. In addition, FFO excludes gains and losses from the sale of real estate, impairment charges related to depreciable real estate assets and in-substance real estate equity investments and realized and unrealized gains and losses related to investments in real estate-related securities, which we believe provides management and investors with a helpful additional measure of the historical performance of our real estate portfolio, as it allows for comparisons, year to year, that reflect the impact on operations from trends in items such as occupancy rates, rental rates, operating costs, general and administrative expenses and interest costs. A property will be evaluated for impairment if events or circumstances indicate that the carrying amount may not be recoverable (i.e. the carrying amount exceeds the total estimated undiscounted future cash flows from the property). Undiscounted future cash flows are based on anticipated operating performance, including estimated future net rental and lease revenues, net proceeds on the sale of the property, and certain other ancillary cash flows. While impairment charges are excluded from the calculation of FFO as described above, stockholders are cautioned that we may not recover any impairment charges.
FFO should not be construed to be more relevant or accurate than the current GAAP methodology in calculating net income or in its applicability in evaluating our operating performance. In addition, FFO should not be considered as an alternative to net income (loss) or income (loss) from continuing operations as an indication of our performance or as an alternative to cash flows from operating activities as an indication of our liquidity, but rather should be reviewed in conjunction with these and other GAAP measurements. Further, FFO is not intended to be used as a liquidity measure indicative of cash flow available to fund our cash needs, including our ability to make distributions to our stockholders. Please see the limitations listed below associated with the use of FFO:
•Prior to January 1, 2018, FFO included costs related to our acquisitions, including acquisition fees payable to our Advisor. Although these amounts reduced net income for periods prior to January 1, 2018, we generally funded such costs with proceeds from our public offerings and/or acquisition-related indebtedness and did not consider these fees and expenses in the evaluation of our operating performance. In January 2018, we adopted ASU 2017-01 which clarified the definition of a business and added guidance to assist entities with evaluating whether transactions should be accounted for as acquisitions (or disposals) of assets or businesses. We expect that all of our real estate transactions completed after that date will be accounted for using the asset acquisition guidance and, accordingly, the related acquisition-related expenses incurred will be capitalized and included in the allocated purchase price and will not be expensed. Prior to ASU 2017-01, real estate acquisitions were generally considered business combinations and the acquisition-related expenses and acquisition fees were treated as operating expenses under GAAP. Additionally, effective as of December 6, 2017, we no longer pay acquisition fees to our Advisor.
•We utilize the definition of FFO as set forth by NAREIT. Our FFO may not be comparable to amounts calculated by other REITs, if they use different approaches.
•Our business is subject to volatility in the real estate markets and general economic conditions, and adverse changes in those conditions could have a material adverse impact on our business, results of operations and FFO. Accordingly, the predictive nature of FFO is uncertain and past performance may not be indicative of future results.
Neither the SEC, NAREIT nor any regulatory body has passed judgment on the acceptability of the adjustments that we use to calculate FFO. In the future, the SEC, NAREIT or a regulatory body may decide to standardize the allowable adjustments across the non-listed REIT industry and we would have to adjust our calculation and characterization of FFO.
47
The following section presents our calculation of FFO attributable to common stockholders and provides additional information related to our operations for the three and six months ended June 30, 2021 and 2020 and the period from inception through June 30, 2021 (in thousands, except per share amounts). As we are in the capital raising and acquisition phase of our operations, FFO may not be useful in comparing operations for the periods presented below. We expect revenues and expenses to increase in future periods as we raise additional offering proceeds and use them to make additional real estate investments.
| Three Months Ended June 30, | Six Months Ended June 30, | Period from July 31, 2013 (date of inception) through June 30, 2021 | ||||||||||||||||||||||||||||||
| 2021 | 2020 | 2021 | 2020 | |||||||||||||||||||||||||||||
| Net income (loss) | $ | (11,694) | $ | 73,540 | $ | (17,412) | $ | 115,292 | $ | 28,221 | ||||||||||||||||||||||
Depreciation and amortization (1) | 24,916 | 14,457 | 44,943 | 30,686 | 241,622 | |||||||||||||||||||||||||||
| Gain on sale of real estate | (1,402) | (80,457) | (1,440) | (130,101) | (146,025) | |||||||||||||||||||||||||||
| Taxes related to sale of real estate | — | 7,773 | — | 7,773 | 7,773 | |||||||||||||||||||||||||||
(Gain) loss on securities (2) | (5,750) | (3,136) | (9,089) | 4,601 | (10,552) | |||||||||||||||||||||||||||
Adjustments for noncontrolling interests (3) | — | — | — | — | 117 | |||||||||||||||||||||||||||
| Funds From Operations attributable to common stockholders | $ | 6,070 | $ | 12,177 | $ | 17,002 | $ | 28,251 | $ | 121,156 | ||||||||||||||||||||||
| Basic and diluted income (loss) per common share | $ | (0.10) | $ | 0.77 | $ | (0.15) | $ | 1.23 | $ | 0.70 | ||||||||||||||||||||||
| Funds From Operations attributable to common stockholders per common share | $ | 0.05 | $ | 0.13 | $ | 0.15 | $ | 0.30 | $ | 3.00 | ||||||||||||||||||||||
| Weighted average shares outstanding | 120,707 | 95,490 | 115,175 | 93,900 | 40,414 | |||||||||||||||||||||||||||
Notes to the table:
(1)Represents the depreciation and amortization of real estate assets. Historical cost accounting for real estate assets in accordance with GAAP implicitly assumes that the value of real estate assets diminishes predictably over time. Since real estate values have historically risen or fallen with market conditions, we believe that such depreciation and amortization may be of limited relevance in evaluating current operating performance and, as such, these items are excluded from our determination of FFO.
(2)Represents the realized and unrealized gains and losses related to investments in real estate-related securities, which consist of common equities, preferred equities and debt investments of publicly traded REITs. These securities are incidental to our operations. As such, these gains and losses were excluded from our determination of FFO, as defined by NAREIT, in the current period. Additionally, certain immaterial amounts have now been included in prior periods for comparative purposes.
(3)Includes income attributable to noncontrolling interests and all adjustments to eliminate the noncontrolling interests’ share of the adjustments to convert our net loss to FFO.
Set forth below is additional information, which may be helpful in assessing our operating results:
•For the three and six months ended June 30, 2021, our Dealer Manager earned distribution and stockholder servicing fees of $1.5 million and $3.0 million, respectively, which are paid by Hines Global. For the three and six months ended June 30, 2020, our Dealer Manager earned distribution and stockholder servicing fees of $1.4 million and $2.8 million, respectively. Total distribution and stockholder servicing fees earned by the Dealer Manager from inception through June 30, 2021 were $16.6 million.
•As of December 6, 2017, through its ownership of the special limited partner interest in the Operating Partnership, our Advisor is entitled to an annual performance participation allocation of 12.5% of the Operating Partnership’s total return subject to the Company earning a 5% total return annually, after considering the effect of any losses carried forward from the prior year. The performance participation allocation accrues monthly and is payable after the completion of each calendar year. We do not consider the performance participation allocation in evaluating our operating performance. For the three and six months ended June 30, 2021, we incurred $5.2 million and $7.5 million, respectively, in performance participation allocation fees. For the three and six months ended June 30, 2020, we did not incur any performance participation allocation fees. Total performance participation allocation fees incurred were $21.4 million from inception through June 30, 2021. Refer to Note 7—Related Party Transactions for more information on the performance participation allocation.
48
•For the three and six months ended June 30, 2021, we recorded adjustments primarily related to amortization of out-of-market lease intangibles and lease incentives and straight-line rent adjustments, which resulted in a net increase to rental revenue of $0.4 million and $0.2 million, respectively. For the three and six months ended June 30, 2020 these adjustments resulted in a net increase to rental revenue of $0.5 million and $1.4 million, respectively. Total of such adjustments from inception through June 30, 2021 amounted to a net increase to rental revenue of $15.2 million. Included in these adjustments is the amortization of deferred financing costs, which amounted to $1.2 million and $1.8 million for the three and six months ended June 30, 2021, respectively, and $0.5 million and $1.1 million for the three and six months ended June 30, 2020, respectively.
•We recorded adjustments related to derivative instruments and foreign currencies, which increased net income by approximately $1.1 million and $0.1 million for the three and six months ended June 30, 2021, respectively. For the three and six months ended June 30, 2020 these adjustments increased net income by approximately $2.8 million and $7.5 million, respectively. The total of such adjustments from inception through June 30, 2021 increased net income by $2.9 million.
As noted previously, our cash flows from operations have been and may continue to be insufficient to fund distributions to stockholders. We may continue to choose to use proceeds from the sales of assets, proceeds from our debt financings, proceeds from our public offerings, cash advances by our Advisor and/or cash resulting from a waiver or deferral of fees to fund distributions to our stockholders. For example, we funded 73% and 100% of total distributions for the six months ended June 30, 2021 and 2020, respectively, with cash flows from other sources, such as cash flows from investing activities, which may include proceeds from the sale of real estate. We have not placed a cap on the amount of our distributions that may be paid from sources other than cash flows from operations, including proceeds from our debt financings, proceeds from our public offerings, cash advances by our Advisor and cash resulting from a waiver or deferral of fees.
From inception through June 30, 2021, we declared $178.1 million of distributions to our stockholders, compared to our total aggregate FFO of $121.2 million and our total aggregate net income of $28.2 million for that period. For the six months ended June 30, 2021, we declared $32.9 million of distributions to our stockholders compared to our total aggregate FFO of $17.0 million. For the six months ended June 30, 2020, we declared $25.9 million of distributions to our stockholders compared to our total aggregate FFO of $28.3 million.
Related Party Transactions and Agreements
We have entered into agreements with our Advisor, our Dealer Manager and Hines and its affiliates, whereby we pay certain fees and reimbursements to these entities during the various phases of our organization and operation. Relating to organization and offering stage, these include payments to our Dealer Manager for selling commissions, the dealer manager fee, distribution and stockholder servicing fees, and payments to our Advisor for reimbursement of organization and offering costs. Relating to acquisition and operational stages, these include payments for certain services related to the management and performance of our investments and operations provided to us by our Advisor and Hines and its affiliates pursuant to various agreements we have entered into with these entities. See Note 7—Related Party Transactions in Item 1 of this Quarterly Report on Form 10-Q, as well as Note 8—Related Party Transactions in our Annual Report on Form 10-K for the year ended December 31, 2020 for additional information concerning our related party transactions and agreements.
Off-Balance Sheet Arrangements
As of June 30, 2021 and December 31, 2020, we had no off-balance sheet arrangements that have or are reasonably likely to have a current or future effect on our financial condition, changes in financial condition, revenues or expenses, results of operations, liquidity, capital expenditures or capital resources.
Subsequent Events
Revolving Credit Facility Amendment
In July 2020, we entered into the Amended Revolving Credit Facility with JPMorgan to increase the capacity of the facility from $425 million to $725 million and to make certain other changes. See Note 4 for additional information regarding the Amended Revolving Credit Facility, as amended.
*****
49
Item 3. Quantitative and Qualitative Disclosures About Market Risk
Market risk includes risks that arise from changes in interest rates, foreign currency exchange rates, commodity prices, equity prices and other market changes that affect market-sensitive instruments. In pursuing our business plan, we believe that interest rate risk and currency risk are the primary market risks to which we are exposed. As of June 30, 2021, we were exposed to the market risks described below.
Interest Rate Risk
We are exposed to the effects of interest rate changes primarily as a result of debt used to maintain liquidity and fund expansion of our real estate investment portfolio and operations. As of June 30, 2021, we had $944 million of variable-rate debt outstanding. If interest rates were to increase by 1%, we would incur an additional $9.4 million in interest expense. Additionally, we entered into interest rate swap and cap agreements to limit our exposure to rising interest rates related to our mortgage loans secured by our real estate investments. See Note 4—Debt Financing in the Notes to the Condensed Consolidated Financial Statements for more information concerning our outstanding debt and our interest rate exposure.
Foreign Currency Risk
We currently have real estate investments located in countries outside of the U.S. that are subject to the effects of exchange rate movements between the foreign currency of each real estate investment and the U.S. dollar, which may affect future costs and cash flows as well as amounts translated into U.S. dollars for inclusion in our condensed consolidated financial statements. We have entered into mortgage loans denominated in foreign currencies for these investments, which provide natural hedges with regard to changes in exchange rates between the foreign currencies and U.S. dollar and reduce our exposure to exchange rate differences. Additionally, we are typically a net receiver of these foreign currencies, and, as a result, our foreign operations benefit from a weaker U.S. dollar and are adversely affected by a stronger U.S. dollar. The table below identifies the effect that a 10% immediate, unfavorable change in the exchange rates would have on the net book value of our international real estate investments, including any foreign currency mortgage loans and their year-to-date net income (loss), by foreign currency (in thousands)(1):
| Reduction in Book Value as of June 30, 2021 | Reduction in Net Income (Loss) for the Six months ended June 30, 2021 | ||||||||||||||||
| EUR | $12,429 | $(1,553) | |||||||||||||||
| GBP | $6,215 | $(195) | |||||||||||||||
(1) Our real estate assets in Poland were purchased in Euros and we expect that when we dispose of these assets, the sale transactions will also be denominated in Euros. Accordingly, we do not expect to have Polish zloty exposure upon disposition.
Item 4. Controls and Procedures
Disclosure Controls and Procedures
In accordance with Exchange Act Rules 13a-15 and 15d-15, we carried out an evaluation, under the supervision and with the participation of management, including our Chief Executive Officer and Chief Financial Officer, of the effectiveness of our disclosure controls and procedures as of the end of the period covered by this report. Based on that evaluation, our Chief Executive Officer and Chief Financial Officer concluded that our disclosure controls and procedures were effective as of June 30, 2021, to provide reasonable assurance that information required to be disclosed in our reports filed or submitted under the Exchange Act is (i) recorded, processed, summarized and reported within the time periods specified in the Securities and Exchange Commission’s rules and forms, and (ii) accumulated and communicated to our management, including our Chief Executive Officer and Chief Financial Officer, as appropriate to allow timely decisions regarding required disclosure.
50
Change in Internal Controls
No changes have occurred in our internal controls over financial reporting (as defined in Rule 13a-15(f) of the Exchange Act) during the quarter ended June 30, 2021 that have materially affected, or are reasonably likely to materially affect, our internal controls over financial reporting. We have not experienced any material impact to our internal control over financial reporting to date as a result of most of the employees of Hines and its affiliates working remotely due to the Coronavirus pandemic. We are continually monitoring and assessing the impact of the Coronavirus pandemic on our internal controls to minimize its impact on the design and operating effectiveness of our internal controls.
51
PART II - OTHER INFORMATION
Item 1. Legal Proceedings
From time to time in the ordinary course of business, we or our subsidiaries may become subject to legal proceedings, claims or disputes. As of August 16, 2021, neither we nor any of our subsidiaries were a party to any material pending legal proceedings.
Item 1A. Risk Factors
Except as set forth below, as of June 30, 2021, there have been no material changes to the risk factors previously disclosed in response to “Part I - Item 1A. ‘Risk Factors’” in our Annual Report on Form 10-K for the year ended December 31, 2020, filed with the SEC on March 26, 2021.
Payments to our Advisor in respect of any common stock or OP Units it elects to receive in lieu of fees or distributions will dilute future cash available for distribution to our stockholders.
Our Advisor may choose to receive our common shares or OP Units in lieu of certain fees or distributions. The holders of all OP Units will be entitled to receive cash from operations pro rata with the distributions being paid to us and such distributions to the holders of OP Units will reduce the cash available for distribution to us and to our stockholders. Furthermore, under certain circumstances the OP Units held by our Advisor are required to be repurchased, in cash at the holder’s election and there may not be sufficient cash to make such a repurchase payment; therefore, we may need to use cash from operations, borrowings, offering proceeds, or other sources to make the payment, which will reduce cash available for distribution to our stockholders or for investment in our operations. Redemptions of any of our shares or OP Units that were received by our Advisor in lieu of a cash asset management fee or in lieu of a cash distribution with respect to its performance participation allocation are not subject to the 5% holding discount under our share redemption program, but, in the case of shares, such redemptions are subject to the monthly and quarterly volume limitations and do not receive priority over other shares being put for redemption during such period.
Our stockholders’ ability to have their shares redeemed is limited under our share redemption program. If they are able to have their shares redeemed, it may be at a price that is less than the price they paid for the shares and the then-current market value of the shares.
Our share redemption program contains significant restrictions and limitations. For example, only stockholders who purchase their shares directly from us or who received their shares through a non-cash transaction, not in the secondary market, are eligible to participate and if holders of shares do not hold their shares for a minimum of one year, then they will only be eligible for redemption at 95% of the transaction price that would otherwise apply. We may choose to redeem fewer shares than have been requested in any particular month to be redeemed under our share redemption program, or none at all, in our discretion at any time. We may redeem fewer shares than have been requested to be redeemed due to lack of readily available funds because of adverse market conditions beyond our control, the need to maintain liquidity for our operations or because we have determined that investing in real property or other illiquid investments is a better use of our capital than the redemption of our shares. In addition, the total amount of shares that may be redeemed under our share redemption program is limited, in any calendar month, to shares whose aggregate value (based on the transaction price per share on the date on the redemption) is 2% of our aggregate NAV as of the last calendar day of the previous month and during any calendar quarter whose aggregate value (based on the transaction price per share in effect when the redemption is effected) is up to 5% of our aggregate NAV as of the last calendar day of the prior calendar quarter.
The vast majority of our assets consist of properties which cannot generally be readily liquidated on short notice without impacting our ability to realize full value upon their disposition. Therefore, we may not always have a sufficient amount of cash to immediately satisfy redemption requests. Further, we may invest in real estate-related securities and other securities with the primary goal of maintaining liquidity in support of our share redemption program. Any such investments may result in lower returns than an investment in real estate assets, which could adversely impact our ability to pay distributions and their overall return. Further, if redemption requests, in the business judgment of our board of directors, place an undue burden on our liquidity, adversely affect our operations, risk having an adverse impact on stockholders whose shares are not redeemed, or should we otherwise determine that investing our liquid assets in real properties or other investments rather than redeeming our shares is in the best interests of the Company as a whole, then our board of directors may make exceptions to, modify or suspend our share redemption program if in its reasonable judgement it deems such actions to be in our best interest and the best interest of our stockholders. Although our board of directors has the discretion to suspend our share redemption program, our board of directors will not terminate our share redemption program other than in connection with a liquidity event which results in our stockholders receiving cash or securities listed on a national securities exchange or where otherwise required by law. Upon suspension of our share redemption program, our share redemption program requires our board of directors to
52
consider at least quarterly whether the continued suspension of the program is in our best interest and the best interest of our stockholders; however, we are not required to authorize the re-commencement of the share redemption program within any specified period of time and any suspension may be for an indefinite period, which would be tantamount to a termination. As a result of these limitations, our stockholders’ ability to have their shares redeemed by us may be limited, our shares should be considered as having only limited liquidity and at times may be illiquid. In addition, the redemption price our stockholders may receive upon any such redemption may not be indicative of the price they would receive if our shares were actively traded or if we were liquidated, and our stockholders should not assume that they will be able to sell all or any portion of their shares back to us pursuant to our share redemption program or to third parties at a price that reflects the then current market value of the shares or at all.
Our bylaws designate the Circuit Court for Baltimore City, Maryland as the sole and exclusive forum for certain types of actions and proceedings that may be initiated by our stockholders, which could limit our stockholders’ ability to obtain a favorable judicial forum for disputes with us or our directors, officers or employees.
Our bylaws provide that, unless we consent in writing to the selection of an alternative forum, the Circuit Court for Baltimore City, Maryland, or if that Court does not have jurisdiction, the United States District Court for the District of Maryland, Baltimore Division, shall be the sole and exclusive forum for certain types of actions and proceedings that may be initiated by our stockholders with respect to our company, our directors, our officers or our employees (we note we currently have no employees). This choice of forum provision will not apply to claims under the Securities Act or the Exchange Act. Similarly, this choice of forum provision will not apply to actions arising out of, or in connection with, the sale of securities in, or the violation of the laws of, the states and other (non-federal) jurisdictions in which our shares are sold pursuant to the Third Offering; provided that the inapplicability of this choice of forum provision to such actions will not cause this provision to be inapplicable to other types of claims, whether they are brought concurrently with or before or after actions arising out of, or in connection with, the sale of securities in, or the violation of the laws of, the states and other (non-federal) jurisdictions in which the Issuer’s shares are sold pursuant to the offering. This choice of forum provision may limit a stockholder’s ability to bring a claim in a judicial forum that the stockholder believes is favorable for disputes with us or our directors, officers or employees, which may discourage meritorious claims from being asserted against us and our directors, officers and employees. Alternatively, if a court were to find this provision of our bylaws inapplicable to, or unenforceable in respect of, one or more of the specified types of actions or proceedings, we may incur additional costs associated with resolving such matters in other jurisdictions, which could adversely affect our business, financial condition or results of operations. We adopted this provision because we believe it makes it less likely that we will be forced to incur the expense of defending duplicative actions in multiple forums and less likely that plaintiffs’ attorneys will be able to employ such litigation to coerce us into otherwise unjustified settlements, and we believe the risk of a court declining to enforce this provision is remote, as the Maryland General Corporation Law expressly authorizes the adoption of such provisions.
Legislative or regulatory action could adversely affect us and/or our investors.
In recent years, numerous legislative, judicial and administrative changes have been made to the U.S. federal income tax laws applicable to investments in real estate and REITs, including the passage of the Tax Cuts and Jobs Act of 2017. Federal legislation intended to ameliorate the economic impact of the COVID-19 pandemic, the Coronavirus Aid, Relief and Economic Security Act, or the CARES Act, has been enacted that makes technical corrections to, or modifies on a temporary basis, certain of the provisions of the Tax Cut and Jobs Act of 2017, and it is possible that additional such legislation may be enacted in the future. The full impact of the Tax Cuts and Jobs Act of 2017 and the CARES Act may not become evident for some period of time. In addition, there can be no assurance that future changes to the U.S. federal income tax laws or regulatory changes will not be proposed or enacted that could impact our business and financial results. The REIT rules are constantly under review by persons involved in the legislative process and by the Internal Revenue Service and the U.S. Treasury Department, which may result in revisions to regulations and interpretations in addition to statutory changes. If enacted, certain of such changes could have an adverse impact on our business and financial results. We cannot predict whether, when or to what extent any new U.S. federal tax laws, regulations, interpretations or rulings will impact the real estate investment industry or REITs. Although REITs generally receive better tax treatment than entities taxed as regular corporations, it is possible that future legislation would result in a REIT having fewer tax advantages, and it could become more advantageous for a company that invests in real estate to elect to be treated for U.S. federal income tax purposes as a regular corporation. As a result, our charter provides our board of directors with the power, under certain circumstances, to revoke or otherwise terminate our REIT election and cause us to be taxed as a regular corporation, without our stockholders’ vote.
We urge our stockholders to consult with their own tax advisor with respect to the status of the Tax Act and other legislative, regulatory or administrative developments and proposals and their potential effect on an investment in shares of our common stock.
53
Item 2. Unregistered Sales of Equity Securities and Use of Proceeds
During the three months ended June 30, 2021, we did not sell or issue any equity securities that were not registered under the Securities Act.
Issuer Redemptions of Equity Securities
Our share redemption program may allow stockholders who have purchased shares from us or received their shares through a non-cash transaction, not in the secondary market, to have their shares redeemed subject to certain limitations and restrictions. Redemptions under our share redemption program will be made on a monthly basis. Subject to the limitations of and restrictions on our share redemption program, and subject to funds being available as described below, shares redeemed under our share redemption program will be redeemed at the transaction price in effect on the date of redemption, which generally will be a price equal to the NAV per share applicable to the class of shares being redeemed and most recently disclosed by us in a public filing with the SEC (subject to the 5% holding discount described below).
Under our share redemption program, we may redeem during any calendar month shares whose aggregate value (based on the redemption price per share in effect when the redemption is effected) is 2% of our aggregate NAV as of the last calendar day of the previous month (the “2% Monthly Limitation”) and during any calendar quarter whose aggregate value (based on the redemption price per share in effect when the redemption is effected) is up to 5% of our aggregate NAV as of the last calendar day of the prior calendar quarter (the “5% Quarterly Limitation”). During a given quarter, if in each of the first two months of such quarter the 2% Monthly Limitation is reached and stockholders’ redemptions are reduced pro rata for such months, then in the third and final month of that quarter, the applicable limit for such month will likely be less than 2% of our aggregate NAV as of the last calendar day of the previous month because the redemptions for that month, combined with the redemptions in the previous two months, cannot exceed the 5% Quarterly Limitation.
There is no minimum holding period for shares under our share redemption program and stockholders may request that we redeem their shares at any time. However, shares that have not been outstanding for at least one year will be redeemed at 95% of the transaction price (the “5% holding discount”) that would otherwise apply; provided, that, the period that a share was held prior to being converted into a share of another class pursuant to our charter will count toward the total hold period for such share, as converted. Upon request, we may waive the 5% holding discount in the case of death or disability of a stockholder. The 5% holding discount also will be waived with respect to shares issued pursuant to our distribution reinvestment plan and any shares that we issue as stock dividends. In addition, the discount may not apply to transactions initiated by the trustee or advisor to a donor-advised charitable gift fund, collective trust fund, common trust fund, fund of fund(s) or other institutional accounts, strategy funds or programs if we determine, in our sole discretion, such account, fund or program has an investment strategy or policy that is reasonably likely to control short-term trading. Further, shares of our common stock may be sold to certain employer sponsored plans, bank or trust company accounts and accounts of certain financial institutions or intermediaries for which we may not apply the discount to the underlying stockholders, often because of administrative or systems limitations. The discount also will not apply to shares taken by the Advisor or Sponsor in lieu of fees or expense reimbursements under the advisory agreement among us, the Advisor and the Operating Partnership or the Operating Partnership Agreement.
Unless our board of directors determines otherwise, we intend to fund redemptions pursuant to our share redemption program from any available cash sources at our disposal, including available cash, cash flow from operations, the sale of real estate-related securities and other assets, borrowings or offering proceeds, without any limitation on the amounts we may pay from such sources. If during any consecutive 24-month period, we do not have at least one month in which we fully satisfy 100% of properly submitted redemption requests or accept all properly submitted tenders in a self-tender offer for our shares, we will not make any new investments (excluding short-term cash management investments under 30 days in duration) and we will use all available investable assets to satisfy redemption requests (subject to the limitations under this program) until all outstanding redemption requests, or “Unfulfilled Redemptions,” have been satisfied. For purposes of this policy, investable assets include net proceeds from new subscription agreements, unrestricted cash, working capital, proceeds from marketable securities, proceeds from our distribution reinvestment plan, and net operating cash flows. Notwithstanding this policy, investable assets may be used at any time to fund any of our operating cash needs (as well as to establish reserves to meet such needs), including, without limitation, the following: property operating expenses, taxes and insurance, debt service and repayment or refinancing of debt, debt financing expenses, funding commitments related to real estate, including without limitation, commitments to acquire new real estate investments (provided such commitments were made at least twelve (12) months prior to the end of such 24-consecutive-month period), obligations imposed by law, courts, or arbitration, necessary capital improvements, lease-related expenditures, customary general and administrative expenses, asset management fees and other fees payable to our Advisor as described in the prospectus, or shareholder distributions. Our Advisor also will defer payment of the performance participation allocation until all Unfulfilled Redemptions are satisfied. Furthermore, our board of directors and management will consider additional ways to improve shareholder liquidity through our share redemption
54
program or otherwise. Exceptions to the limitations of this paragraph may be made to complete like-kind exchanges under Section 1031 of the Code necessary to avoid adverse tax consequences, or to take actions necessary to maintain our qualification as a REIT under the Code.
Our board of directors has complete discretion to determine whether all available cash sources at our disposal will be applied to redemptions pursuant to the program, whether such funds are needed for other purposes or whether additional funds from other sources may be used for redemptions pursuant to the program.
If redemption requests, in the business judgment of our board of directors, place an undue burden on our liquidity, adversely affect our operations or risk having an adverse impact on stockholders whose shares are not redeemed, then our board of directors may make exceptions to, modify or suspend the share redemption program if in its reasonable judgment it deems such actions to be in our best interest and the best interest of our stockholders. Our board of directors cannot terminate our share redemption program absent a liquidity event which results in our stockholders receiving cash or securities listed on a national securities exchange or where otherwise required by law (including in the event that our shares ever become listed on a national securities exchange or in the event a secondary market for our common shares develops). In addition, our board of directors may determine to suspend the share redemption program due to regulatory changes, changes in law, if our board of directors becomes aware of undisclosed material information that it believes should be publicly disclosed before shares are redeemed, a lack of available funds, a determination that redemption requests are having an adverse effect on our operations or other factors. Upon suspension of our share redemption program, our board of directors shall consider at least quarterly whether the continued suspension of the program is in our best interest and the best interest of our stockholders; however, our board of directors is not required to authorize the re-commencement of our share redemption program within any specified period of time. Material modifications, including any reduction to the monthly or quarterly limitations on redemptions, and suspensions of the program will be promptly disclosed to stockholders in a prospectus supplement (or post-effective amendment if required by the Securities Act) or current report on Form 8-K filed with the SEC. Any material modifications will also be disclosed on our website.
Any new transaction price may be higher or lower than the most recently disclosed transaction price. The transaction price is not a representation, warranty or guarantee that (i) a stockholder would be able to realize such per share amount if such stockholder attempts to sell his or her shares; (ii) a stockholder would ultimately realize distributions per share equal to such per share amount upon our liquidation or sale; (iii) shares of our common stock would trade at such per share amount on a national securities exchange; or (iv) a third party would offer such per share amount in an arm’s-length transaction to purchase all or substantially all of our shares of common stock.
The following table lists shares we redeemed under our share redemption program during the period covered by this report, including the average price paid per share, which represents all of the share repurchase requests received for the same period.
| Period | Total Number of Shares Redeemed | Average Price Paid Per Share | Total Number of Shares Purchased as Part of Publicly Announced Plans of Programs | Maximum Number of Shares that May Yet be Redeemed Under the Plans or Programs(1) | ||||||||||||||||||||||
| April 1, 2021 to April 30, 2021 | 403,532 | $ | 10.10 | 403,532 | 1,854,065 | |||||||||||||||||||||
| May 1, 2021 to May 31, 2021 | 484,655 | $ | 10.10 | 484,655 | 1,867,883 | |||||||||||||||||||||
| June 1, 2021 to June 30, 2021 | 406,954 | $ | 10.15 | 406,954 | 2,422,974 | |||||||||||||||||||||
| Total | 1,295,141 | 1,295,141 | ||||||||||||||||||||||||
(1)Amount provided represents the 2% Monthly Limitation which can be further limited by the 5% Quarterly Limitation. See the description of the share redemption program above for a description of the limitations on the number of shares that may be redeemed pursuant to the share redemption program.
Item 3. Defaults Upon Senior Securities
Not applicable.
Item 4. Mine Safety Disclosures
Not applicable.
55
Item 5. Other Information
Not applicable.
56
Item 6. Exhibits
| Exhibit No. | Description | |||||||||||||
| 3.1 | ||||||||||||||
| 3.2 | ||||||||||||||
| 3.3 | ||||||||||||||
| 3.4 | ||||||||||||||
| 3.5 | ||||||||||||||
| 3.6 | ||||||||||||||
| 3.7 | ||||||||||||||
| 3.8 | ||||||||||||||
| 3.9 | ||||||||||||||
| 3.10 | ||||||||||||||
| 3.11 | ||||||||||||||
| 4.1 | ||||||||||||||
| 10.1 | ||||||||||||||
| 31.1* | ||||||||||||||
| 31.2* | ||||||||||||||
| 32.1* | ||||||||||||||
| 99.1 | ||||||||||||||
| 101.INS* | Instance Document—The instance document does not appear in the interactive data file because its XBRL tags are embedded within the inline XBRL document. | |||||||||||||
| 101 SCH* | XBRL Taxonomy Extension Schema Document | |||||||||||||
| 101.CAL* | XBRL Taxonomy Extension Calculation Linkbase Document | |||||||||||||
| 101.DEF* | XBRL Taxonomy Extension Definition Linkbase Document | |||||||||||||
| 101.LAB* | XBRL Taxonomy Extension Labels Linkbase Document | |||||||||||||
| 101.PRE* | XBRL Taxonomy Extension Presentation Linkbase Document | |||||||||||||
| * | Filed herewith | |||||||||||||
57
SIGNATURES
Pursuant to the requirements of the Securities Exchange Act of 1934, the registrant has duly caused this report to be signed on its behalf by the undersigned thereunto duly authorized.
| HINES GLOBAL INCOME TRUST, INC. | ||||||||||||||||||||
| August 16, 2021 | By: | /s/ Jeffrey C. Hines | ||||||||||||||||||
| Jeffrey C. Hines | ||||||||||||||||||||
| Chief Executive Officer and | ||||||||||||||||||||
| Chairman of the Board of Directors | ||||||||||||||||||||
| August 16, 2021 | By: | /s/ J. Shea Morgenroth | ||||||||||||||||||
| J. Shea Morgenroth | ||||||||||||||||||||
| Chief Financial Officer | ||||||||||||||||||||
58