Table of Contents
Confidential Draft Submission No. 2 submitted to the Securities and Exchange Commission on December 17, 2013
This draft registration statement has not been publicly filed with the Securities and Exchange Commission and all information herein remains strictly confidential.
Registration No.
UNITED STATES
SECURITIES AND EXCHANGE COMMISSION
Washington, D.C. 20549
FORM S-1
REGISTRATION STATEMENT
UNDER
THE SECURITIES ACT OF 1933
APTALIS HOLDINGS INC.
(Exact name of registrant as specified in its charter)
| Delaware | 2834 | 74-3249874 | ||
(State or other jurisdiction of incorporation or organization) | (Primary standard industrial classification code number) | (I.R.S. employer identification number) |
100 Somerset Corporate Boulevard
Bridgewater, NJ 08807
(908) 927-9600
(Address, including zip code, and telephone number, including area code, of registrant’s principal executive offices)
Frank Verwiel, M.D.
Chief Executive Officer
100 Somerset Corporate Boulevard
Bridgewater, NJ 08807
(908) 927-9600
(Name, address, including zip code, and telephone number, including area code, of agent for service)
Copies to:
Patrick O’Brien Ropes & Gray LLP Prudential Tower, 800 Boylston Street Boston, MA 02199-3600 Telephone: (617) 951 7527 Facsimile: (617) 235 0392 | Richard E. Maroun General Counsel Aptalis Holdings Inc. 100 Somerset Corporate Boulevard Bridgewater, NJ 08807 (908) 927-9600 | David Lopez Cleary Gottlieb Steen & Hamilton LLP One Liberty Plaza New York, NY 10006 Telephone: (212) 225-2632 Facsimile: (212) 225-3999 |
Approximate date of commencement of proposed sale to the public:
As soon as practicable after this registration statement becomes effective.
If any of the securities being registered on this form are to be offered on a delayed or continuous basis pursuant to Rule 415 under the Securities Act of 1933, check the following box. ¨
If this Form is filed to register additional securities for an offering pursuant to Rule 462(b) under the Securities Act, check the following box and list the Securities Act registration statement number of the earlier effective registration statement for the same offering. ¨
If this Form is a post-effective amendment filed pursuant to Rule 462(c) under the Securities Act, check the following box and list the Securities Act registration statement number of the earlier effective registration statement for the same offering. ¨
If this Form is a post-effective amendment filed pursuant to Rule 462(d) under the Securities Act, check the following box and list the Securities Act registration statement number of the earlier effective registration statement for the same offering. ¨
Indicate by check mark whether the registrant is a large accelerated filer, an accelerated filer, a non-accelerated filer, or a smaller reporting company. See the definitions of “large accelerated filer,” “accelerated filer” and “smaller reporting company” in Rule 12b-2 of the Exchange Act. (Check one).
| Large accelerated filer ¨ | Accelerated filer ¨ | Non-accelerated filer x | Smaller reporting company ¨ | |||
| (Do not check if a smaller reporting company) | ||||||
CALCULATION OF REGISTRATION FEE
| ||||
| Title of Each Class of Securities to be Registered | Proposed Maximum Aggregate Offering Price(1) | Amount of Registration Fee(2) | ||
Common Stock, par value $0.001 per share | $ | $ | ||
| ||||
| (1) | Estimated solely for the purpose of calculating the registration fee in accordance with Rule 457(o) of the Securities Act of 1933, amended. |
| (2) | Calculated pursuant to Rule 457(o) under the Securities Act of 1933, as amended. |
The Registrant hereby amends this Registration Statement on such date or dates as may be necessary to delay its effective date until the Registrant shall file a further amendment which specifically states that this Registration Statement shall thereafter become effective in accordance with Section 8(a) of the Securities Act of 1933 or until the Registration Statement shall become effective on such date as the Securities and Exchange Commission, acting pursuant to said Section 8(a), may determine.
Table of Contents
The information in this preliminary prospectus is not complete and may be changed. These securities may not be sold until the registration statement filed with the Securities and Exchange Commission is effective. This preliminary prospectus is not an offer to sell these securities nor does it seek an offer to buy these securities in any jurisdiction where the offer or sale is not permitted.
Subject to Completion. Dated December 17, 2013.
Shares

APTALIS HOLDINGS INC.
Common Stock
$ per share
This is an initial public offering of shares of common stock of Aptalis Holdings Inc.
We are offering of the shares to be sold in the offering. The selling stockholders identified in this prospectus are offering an additional shares. We will not receive any of the proceeds from the sale of the shares being sold by the selling stockholders.
Prior to this offering, there has been no public market for our common stock. It is currently estimated that the initial public offering price per share will be between $ and $ . We intend to apply to list our common stock on the NASDAQ Stock Market under the symbol “APTA.”
We are an “emerging growth company” as that term is defined in Section 2(a) of the Securities Act of 1933, as amended, or the Securities Act, and, as such, have elected to comply with certain reduced public company reporting requirements in this prospectus and future filings. See “Prospectus Summary—Implications of Being an Emerging Growth Company.”
See “Risk Factors” beginning on page 18 to read about factors you should consider before buying shares of the common stock.
Neither the Securities and Exchange Commission nor any other regulatory body has approved or disapproved of these securities or passed upon the accuracy or adequacy of this prospectus. Any representation to the contrary is a criminal offense.
| Per Share | Total | |||||||
Initial public offering price | $ | $ | ||||||
Underwriting discount(1) | $ | $ | ||||||
Proceeds, before expenses, to us | $ | $ | ||||||
Proceeds, before expenses, to the selling stockholders | $ | $ | ||||||
| (1) | We have agreed to reimburse the underwriters for certain FINRA-related expenses. See “Underwriting.” |
To the extent that the underwriters sell more than shares of common stock, the underwriters have the option to purchase up to an additional shares from us and an additional shares from the selling stockholders at the initial public offering price less the underwriting discount.
The underwriters expect to deliver the shares against payment in New York, New York on , .
| Goldman, Sachs & Co. | J.P. Morgan | |
| Barclays | Evercore | |||||
Prospectus dated , 2013
Table of Contents
| Page | ||||
| 1 | ||||
| 18 | ||||
| 54 | ||||
| 56 | ||||
| 57 | ||||
| 59 | ||||
| 60 | ||||
| 62 | ||||
| 64 | ||||
MANAGEMENT’S DISCUSSION AND ANALYSIS OF FINANCIAL CONDITION AND RESULTS OF OPERATIONS | 74 | |||
| 108 | ||||
| 141 | ||||
| 149 | ||||
| 163 | ||||
| 164 | ||||
| 167 | ||||
| 171 | ||||
| 175 | ||||
| 177 | ||||
| 181 | ||||
| 186 | ||||
| 187 | ||||
| 187 | ||||
| 187 | ||||
| F-1 | ||||
Through and including , (the 25th day after the date of this prospectus), all dealers effecting transactions in these securities, whether or not participating in this offering, may be required to deliver a prospectus. This is in addition to a dealer’s obligation to deliver a prospectus when acting as an underwriter and with respect to an unsold allotment or subscription.
We have not authorized anyone to provide any information or to make any representations other than those contained in this prospectus or in any free writing prospectuses we have prepared. We take no responsibility for, and can provide no assurance as to the reliability of, any other information that others may give you. This prospectus is an offer to sell only the shares offered hereby, but only under circumstances and in jurisdictions where it is lawful to do so. The information contained in this prospectus is current only as of its date.
i
Table of Contents
About this Prospectus
In this prospectus, unless otherwise stated or the context otherwise requires, references to “Aptalis,” “Axcan,” “Company,” “we,” “us,” “our,” or similar references mean Aptalis Holdings Inc. and its subsidiaries on a consolidated basis. References to “Aptalis Holdings” refer to Aptalis Holdings Inc. on an unconsolidated basis. References to “Aptalis Pharma” refer to Aptalis Pharma Inc., Aptalis Holdings’ wholly-owned subsidiary through which we conduct our operations. References to “TPG Global” are to TPG Global, LLC, and references to “TPG” are to TPG Global and its affiliates. References to the “TPG Funds” are to TPG Partners V, L.P., TPG FOF V-A, L.P., TPG FOF V-B, L.P., TPG Biotechnology Partners II, L.P., TPG Axcan Co-Invest II, LLC and TPG Axcan Co-Invest, LLC. References to our “Sponsors” are to the TPG Funds and Investor Growth Capital, Ltd., collectively our financial sponsors. References to a “fiscal year” refer to the fiscal year ended on September 30 of such year.
The names APTALISTM, ADVATAB®, BIORISE™, CANASA®, CARAFATE®, CITRAFLEET®, DIFFUCAPS®, DIFFUTAB®, DELURSAN®, EURAND®, LACTEOL®, LIQUITARD® MICROCAPS®, ORBEXA®, PANZYTRAT®, PYLERA®, RECTIV®, SALOFALK®, SULCRATE®, ULTRASE®, ULTRESA®, URSO®, VIOKASE®, VIOKACE™, ZENPEP® and are trademarks or registered trademarks owned or used under license by the Company and/or its affiliated companies.
All other trademarks or service marks appearing in this prospectus that are not identified as marks owned by us, including ACTIGALL™, ADVIL®, AMRIX®, APRISO®, ASACOL®, CAYSTON®, COLAZAL®, CREON®, DIPENTUM®, eFLOW®, HELIDAC®, KREON®, LAMICTAL® ODT, LIALDA®, MEZAVANT®, PANCREAZE™, PENTASA®, PERTZYE™, PHOTOBARR®, PHOTOFRIN®, PHOSPHO-SODA®, PREVPAC®, ROWASA®, SOLPURA®, TOBI®, TOBI® Podhaler™ and URSOLVAN®, are the property of their respective owners.
ii
Table of Contents
This summary highlights information contained elsewhere in this prospectus. This summary does not contain all of the information that you should consider before investing in our common stock. You should read the entire prospectus, including the more detailed information and the financial statements appearing elsewhere in this prospectus.
Our Company
Our mission is to improve health and quality of care by providing specialty therapies for patients around the world. Our vision is to become the reference specialty pharmaceutical company providing innovative, effective therapies for unmet medical needs, including in cystic fibrosis, or CF, and in gastrointestinal, or GI, disorders. We develop, manufacture, license and market a broad range of therapies.
We have built market-leading franchises in CF and GI disorders by growing sales of our products, many of which command a number one or number two position in their respective markets, including ZENPEP, CANASA, CARAFATE, PYLERA and RECTIV. Our revenues are highly diversified, with our largest product accounting for only 21% of our total revenue in fiscal year 2013 and with operations outside the United States accounting for 20% of our total revenue during the same period. The CF and GI markets are each characterized by a concentrated base of high-volume prescribing physicians, which allows our highly efficient and effective sales force of 227 experienced sales specialists, including 155 sales specialists in the United States, to reach substantially all Cystic Fibrosis Foundation care centers and approximately half of the GI physicians in the United States. We have established sales and marketing operations in the United States, Canada, France and Germany and proprietary manufacturing capabilities in North America and Europe. In addition, we have proven product development capabilities and a demonstrated ability to selectively acquire complementary products, product candidates and companies. We believe our pipeline of four clinical product candidates targets major commercial opportunities in the European Union, or EU, and the United States and we have lifecycle management opportunities for our existing products using the proprietary technology platforms of our Pharmaceutical Technologies, or PT, business.
We have generated double-digit revenue growth since the beginning of fiscal year 2011. This strong performance has been achieved by driving continued growth of our market-leading products and by successfully integrating products and companies, including Eurand N.V., or Eurand. Our total revenue has grown from $470.4 million for fiscal year 2011 to $687.9 million for fiscal year 2013, representing a compound annual growth rate, or CAGR, of 20.9%. Revenue from assets acquired or licensed during this period, including ZENPEP, RECTIV and PT, has grown from $122.0 million in fiscal year 2011 to $244.8 million in fiscal year 2013, while the remainder of our portfolio grew at a CAGR of 12.8%, from $348.4 million in fiscal year 2011 to $443.1 million in fiscal year 2013. We had Adjusted EBITDA of $160.0 million in fiscal year 2011 and $314.6 million in fiscal year 2013, Adjusted pre-tax income of $67.5 million in fiscal year 2011 and $241.4 million in fiscal year 2013, and a net loss of $191.6 million in fiscal year 2011 compared to net income of $86.9 million in fiscal year 2013. Adjusted EBITDA and Adjusted pre-tax income are non-GAAP financial metrics. Please see “Selected Consolidated Financial and Operating Data” for reconciliations of Adjusted EBITDA to net (loss) income and Adjusted pre-tax income to income (loss) before income tax.
Our Products
Our portfolio of market-leading products has a demonstrated track record of sustained growth. In addition, we have four clinical product candidates, as well as a number of early-stage projects in
1
Table of Contents
development related to our existing products and therapeutic spaces. We also continually seek to enhance our existing promoted and pipeline products by using our proprietary PT platforms. These platforms both support our internal drug development efforts and contribute to our revenue through third-party business-to-business development agreements under which we formulate enhanced pharmaceutical and biopharmaceutical products using novel oral drug delivery technologies.
We believe that our products benefit from one or more intellectual property, regulatory, clinical, sourcing and manufacturing barriers to entry. These include patent protection; data exclusivity under Drug Price Competition and Patent Term Restoration Act of 1984, known as the Hatch-Waxman Act; U.S. Food and Drug Administration, or FDA, requirements for generic entrants to conduct clinical trials with clinical efficacy endpoints; complexity in matching formulation characteristics; proprietary manufacturing processes; difficulty in sourcing certain active pharmaceutical ingredients that must match narrow specifications; and the know-how required to manufacture certain dosage forms.
Our principal products and clinical product candidates are:
Product | Summary of Indications | Commercial Markets | Position in Our | Fiscal Year Ended September 30, 2013 Net Sales (in millions) | Net Sales CAGR Fiscal Year 2011-2013 (%) | |||||||||
Pancreatic Enzyme Products |
| |||||||||||||
ZENPEP | Treatment of exocrine pancreatic insufficiency, or EPI, due to CF or other conditions | U.S. | 2 | $ | 141 | 49.9 | % | |||||||
ULTRESA | Treatment of EPI due to CF or other conditions | U.S. | Launched December 2012 | $ | 2 | n.a. | ||||||||
VIOKACE | In combination with a proton pump inhibitor, VIOKACE is indicated in adults for the treatment of EPI due to chronic pancreatitis or pancreatectomy | U.S. | Launched August 2012 | $ | 3 | n.a. | ||||||||
PANZYTRAT | Treatment of EPI and pancreatic enzyme deficiency | Selected EU countries | 3 (Germany) | $ | 11 | (15.3 | )% | |||||||
Ulcer Treatments | ||||||||||||||
CARAFATE | Short-term (up to 8 weeks) treatment of active duodenal ulcers | U.S. | 2 | $ | 145 | 17.0 | % | |||||||
PYLERA | Treatment of patients with Helicobacter pylori, orH. pylori, infection and duodenal ulcer disease (active or history of within the past five years) to eradicateH. pylori | U.S./EU | 2 (United States); Launched January 2013 in Germany; Launched April 2013 in France. | $ | 21 | 28.0 | % | |||||||
Mesalamines | ||||||||||||||
CANASA | Short-term treatment of mild to moderately active ulcerative proctitis, or UP | U.S. | 1 | $ | 133 | 18.9 | % | |||||||
SALOFALK | Depending on the dosage form of Salofalk, indications comprise treatment of acute ulcerative colitis, or UC, management of distal UC and prevention of relapse of distal UC. | Canada | 1 | $ | 23 | (0.4 | )% | |||||||
Chronic Anal Fissure | ||||||||||||||
RECTIV | Treatment of moderate to severe pain associated with chronic anal fissure | U.S. | 1 | $ | 16 | n.a. | ||||||||
| 1. | Company estimate based on IMS NPA and Insight Health data as of September 30, 2013. |
2
Table of Contents
Pipeline Product | Summary of Indications | Jurisdiction | Stage / Status | |||
APT-1026 | Chronic lung infection withPseudomonas aeruginosa in CF | U.S. / EU / Canada | Phase III EU study completed.
Marketing Authorization Application with EMA submitted in November 2013.
EU launch expected in 2015. | |||
| Currently in discussions with FDA regarding results of our single U.S. phase III study. | ||||||
APT-1008 (ZENPEP-EU) | EPI | EU | Phase III EU study enrolled. Completion of study expected in 2014. | |||
APT-1016 | Bowel cleansing preparation for colonoscopy | U.S. | Phase II U.S. study completed. | |||
APT-1011 | Eosinophilic esophagitis, or EoE | U.S. / EU | Phase IIb study expected to commence in 2014. | |||
Our Industry
We believe the markets for CF and GI disorders are large and highly attractive, with significant opportunities for specialty pharmaceutical companies to run highly efficient, profitable businesses. These markets are fragmented and underserved by large pharmaceutical companies and are characterized by products used for chronic conditions, leaving significant unmet medical needs. Because the CF and GI specialty physician bases are relatively concentrated, a high percentage of prescriptions are written by a small number of physicians who can be reached effectively by a relatively small sales force. Further, the CF market has a highly organized patient advocacy base, allowing for a targeted and relationship-driven marketing approach by specialty pharmaceutical companies.
We also believe that the ability of generic entrants to obtain approval for many products that treat CF and GI disorders is more difficult than for many other therapeutic areas. In addition to traditional barriers to generic entry, such as intellectual property and data exclusivity, many products that treat CF and GI disorders have features that create additional barriers to generic entry, including:
| Ÿ | Insignificant or highly variable absorption into the blood, or bioavailability. Many products in other therapeutic areas act primarily via the drug’s absorption into the blood, leading to the FDA’s requirement that generic entrants demonstrate similar blood levels of drug, or bioequivalence, to gain approval. Because many CF and GI products often show insignificant or highly variable systemic bioavailability, we believe that bioequivalence is difficult to demonstrate and may not be applicable to the FDA’s generic approval process. Therefore, we believe generic manufacturers will be required to conduct full clinical trials with efficacy and safety endpoints for some products, which will increase the cost and risk of generic development. |
| Ÿ | Locally acting mechanisms. Because many CF and GI products act locally, delivering drug to the site of the disease is critical for clinical efficacy. Therefore, potential generic entrants will encounter additional clinical risk in demonstrating equivalent levels of both local activity and efficacy in clinical trials. |
| Ÿ | Complex formulations. We believe that the complexity of formulations of many CF and GI products, as well as manufacturing know-how and trade secrets, leads to difficulties in demonstrating similar technical specifications, such as dissolution characteristics, which the FDA also typically requires for approval of generic products. |
3
Table of Contents
| Ÿ | Evolving FDA guidance. FDA guidance on the requirements for approval of generic forms of branded CF and GI products has been evolving. We believe that in certain circumstances this will make it more challenging to develop products and clinical packages which will support generic approvals. |
GI disorders are generally grouped into four categories: functional disorders of the upper GI tract such as gastroesophageal reflux disease, gastroparesis and functional dyspepsia; functional disorders of the lower GI tract such as constipation and irritable bowel syndrome, or IBS; inflammatory/immunologic GI disorders such as Crohn’s disease, EoE and celiac disease; and disorders of organs involved in the digestive process, such as the gallbladder, liver and pancreas. While some of these disorders can be treated through currently available pharmacologic interventions, significant unmet needs still exist, particularly for indications such as IBS, Crohn’s disease, UC and other emerging GI-related disease areas such as EoE and autoimmune hepatitis. According to a 2011 Business Insight report, the worldwide GI drug market was $38 billion in 2010, with the United States accounting for more than 36% of the total.
Based on a 2009 U.S. Department of Health and Human Services report, at least 60 to 70 million Americans are affected each year by GI disorders, placing a burden on society that exceeds $100 billion in direct medical costs in the United States. Annually, in the United States, about 14 million hospitalizations—10% of total hospitalizations—and 15% of all in-patient hospital procedures are attributed to treatment of GI disorders. In addition, in the United States, 105 million doctor visits occur each year for digestive diseases, frequently in response to symptoms such as abdominal pain, diarrhea, vomiting or nausea. GI disorders, even conditions that are not immediately life-threatening, can severely affect a patient’s quality of life and ability to work and engage in daily activities.
CF is a life-threatening genetic disease that begins at birth and, because of one or more defective genes, causes the body to produce faulty proteins that lead to abnormally thick, sticky mucus that clogs the lungs, obstructs ducts in the pancreas and results in a number of other digestive conditions. CF is one of the most prevalent genetic diseases among Caucasians in the United States and can result in a number of related conditions requiring treatment. The disease affects an estimated 30,000 adults and children in the United States and 70,000 patients worldwide, an estimated 85% to 90% of whom suffer from exocrine pancreatic insufficiency, or EPI, and/or chronic lung infections. The sticky mucus that clogs the lungs can lead to serious lung infections, which are becoming increasingly resistant to current antibiotic standards of care. When CF affects the pancreas, the body does not absorb sufficient nutrients to grow and thrive. There is no cure for most forms of CF, necessitating ongoing treatment for chronic concomitant conditions such as EPI and lung infections. These treatments have contributed to increasing life expectancy for CF patients in the United States, from 33 years in 2001 to 37 years in 2011.
Our Competitive Strengths
Focus on High Value Specialty Pharmaceutical Areas with Unmet Needs. We focus on the high value specialty CF and GI markets, which we believe provide opportunities to focus on diseases or disorders with significant unmet needs. Many of our products are used to treat CF and GI disorders that are chronic and treated by a small number of high-volume prescribing physicians, who can be reached by our effective and efficient sales force.
Differentiated and Market-Leading Branded Products. We believe that our products have a compelling value proposition for physicians, patients and payors and are often the first line oftreatment. As a result, we believe that our products experience a high degree of physician and patient loyalty, allowing many of our products to maintain a number one or number two position in their respective markets.
4
Table of Contents
Highly Diversified Revenue Base. We have acquired, developed and/or launched nine products since the beginning of fiscal year 2010, which have significantly diversified our revenue base. We currently market branded products that treat a broad range of CF and GI diseases and disorders in North America and Europe. In fiscal year 2013, our largest product accounted for only 21% of our total revenue and operations outside of the United States accounted for 20% of our total revenue. Diversification remains an important part of our ongoing corporate strategy.
Proven Track Record of Acquiring and Integrating Products, Product Candidates and Companies. We have a proven track record of successfully acquiring products and product candidates, including the acquisition of CARAFATE. In addition, we have efficiently integrated, developed and grown the businesses we have acquired, including Eurand (ZENPEP and PT) and Mpex Pharmaceuticals, Inc., or Mpex (APT-1026).
Substantial Development Capabilities and Robust Pipeline. Our pipeline has four clinical product candidates which target major commercial opportunities in the EU and the United States. We have proven research and development capabilities with a track record of developing and gaining regulatory approvals for our product candidates, including obtaining approval for and launching multiple product candidates in a number of markets simultaneously. In addition, we leverage our PT platforms to improve the safety and efficacy, or otherwise develop enhanced formulations, of our products and product candidates.
Sustainable Growth Due to Significant Barriers to Entry. We have demonstrated multiple years of growth for each of our principal products, which we believe is due in part to the fact that many of our products benefit from one or more intellectual property, regulatory, clinical, sourcing and manufacturing barriers to entry. These include patent protection, data exclusivity under the Hatch-Waxman Act, FDA requirements for generic entrants to conduct clinical trials with clinical efficacy endpoints, complexity in matching formulation characteristics, proprietary manufacturing processes, difficulty in sourcing certain active pharmaceutical ingredients that must match narrow specifications, and the know-how required to manufacture certain dosage forms.
Experienced and Dedicated Management Team. We have a highly experienced management team with an average of 26 years of experience in the healthcare industry, as well as a broad spectrum of general business experience. Several members of our management team have devoted large parts of their careers to the CF and GI markets.
Our Growth Strategy
We intend to enhance our position as a leading specialty pharmaceutical company concentrating on the fields of CF and GI by pursuing the following strategic initiatives:
Grow Sales of Existing Products. We intend to grow sales of our products by leveraging the value of our products and our strong relationships in our target markets. We intend to focus and build on our relationships with high-volume prescribers of drugs that treat the diseases and disorders that our products address, as well as our relationships with patients, payors and patient advocacy groups.
Utilize our Commercial Infrastructure to Launch New and Differentiated Products. We have established a comprehensive infrastructure to commercialize products in the United States, Canada, France and Germany. We intend to leverage these capabilities to launch products from our pipeline and from potential future acquisitions.
5
Table of Contents
Advance our Pipeline and Enhance our Product Portfolio. We are working to develop the next generation of products to address unmet needs in the CF and GI markets. Currently, our most advanced product candidates are APT-1026 and ZENPEP-EU. We completed a pivotal phase III trialof APT-1026 in the EU in 2012 and we expect to launch in the EU in 2015. We recently completed enrollment for a pivotal phase III clinical trial in the EU for ZENPEP-EU, which is expected to be completed in 2014. In addition, by utilizing our PT capabilities, we expect to continue lifecycle management and enhancement of our current portfolio and pipeline.
Selectively Acquire Complementary Products, Product Candidates and Companies. We seek to selectively acquire or in-license new products and product candidates, or acquire companies, that complement the strategic focus of our existing product portfolio and pipeline. We will also consider the acquisition of products, product candidates and companies in therapeutic areas that we consider adjacent to our core areas of expertise.
Leverage our Platform to Expand Internationally. In addition to our current infrastructures in the United States, Canada, France and Germany, we have partners and distributors in over 50 countries worldwide. We intend to leverage our existing international commercial platform to market and distribute our products, including PYLERA and, if approved in the EU, APT-1026 and ZENPEP-EU. In addition, we will evaluate opportunities to expand our commercial presence in EU countries where we currently operate and to establish commercial operations in selected additional EU countries.
Risk Factors
Our business is subject to numerous risks, including, without limitation, the following:
| Ÿ | the pharmaceutical industry is highly competitive, with some of our competitors having more resources than we do, and is subject to rapid and significant change, which could render our products obsolete or uncompetitive; |
| Ÿ | the potential for entry of generic versions of our products, particularly those without patent coverage, into the markets in which we operate could lead to price erosion and decreased sales of our products; |
| Ÿ | our top three products, ZENPEP, CANASA and CARAFATE, account for a large portion of our revenues and any significant setback with respect to any of them, including setbacks with respect to shipping, supply, generic product entry, and regulatory issues, would have a material adverse effect on our business; |
| Ÿ | we have invested significant time and resources in developing our pipeline products and we may be unable to gain regulatory approval for and successfully commercialize any of our pipeline products, or experience significant delays in doing so, which would negatively impact our prospects; |
| Ÿ | our business is subject to extensive regulations in the markets in which we operate; |
| Ÿ | our product candidates may fail in clinical studies; and |
| Ÿ | as of September 30, 2013, on an as adjusted basis after giving effect to the Recapitalization (defined below) and the offering and the application of the proceeds therefrom, we had total indebtedness of $ million and our degree of leverage could adversely affect our ability to raise additional capital to fund our operations and make payments on our indebtedness as well as increase our vulnerability to general economic and industry conditions. |
6
Table of Contents
The above list is not exhaustive, and the additional risks and challenges we face are described under the section titled “Risk Factors” beginning on page 18 of this prospectus. These risks and challenges or other unforeseen events could impair our ability to operate our business or inhibit our strategic plans.
Acquisition and Development History
Since our acquisition by TPG in February 2008, we have demonstrated a track record of successful product development and acquisition and integration of major products and companies, including our:
| Ÿ | March 2010 acquisition of APT-1016, which has completed phase II studies; |
| Ÿ | February 2011 acquisition of Eurand, including ZENPEP and PT; |
| Ÿ | August 2011 acquisition of Mpex, including APT-1026, which has completed a pivotal phase III study in the EU and is expected to launch in the EU in 2015; |
| Ÿ | 2012 commercial launches of ULTRESA and VIOKACE, which were two internally developed product candidates. |
Our management team has efficiently integrated, developed, and grown the businesses we have acquired, including Eurand. For example, we have grown our ZENPEP franchise, which was launched at the end of 2009, from $46 million in revenue in calendar year 2010 to $141 million in fiscal year 2013. We have also realized significant synergies in excess of our initial internal objectives.
Recent Developments
On October 4, 2013, Aptalis Pharma Inc., or Aptalis Pharma, our wholly-owned subsidiary, and certain of our other wholly-owned subsidiaries effected a refinancing consisting of (i) the repayment, in full, of our outstanding indebtedness, in aggregate principal amount of $926.4 million, under our second amended and restated credit agreement dated April 18, 2012, or the Second A&R Credit Agreement, and termination of our Second A&R Credit Agreement and (ii) the entry into our new senior secured credit facilities providing for senior secured term loans in the amount of $1,250 million and a new senior secured revolving credit facility allowing for borrowings of up to $150 million, which we collectively refer to as the Refinancing. See “Description of Certain Indebtedness—Senior Secured Credit Facilities.”
Following the Refinancing, through a series of transactions, including repayment of intercompany debt, redemptions of subsidiary equity, dividends, distributions and mergers, we made a distribution in aggregate amount of $399.5 million to our shareholders, holders of our restricted stock units and certain holders of options to purchase shares of our common stock, which we refer to as the Distribution. Certain holders of options received an adjustment to the per share exercise price of the options in accordance with the relevant option plan to reflect the effects of the Distribution. The Refinancing, the Distribution and the other transactions referred to above are collectively referred to as the Recapitalization.
On November 8, 2013, in conjunction with the Refinancing, we terminated our existing interest rate swap and interest rate cap agreements and paid a total of $13.5 million to our derivative counterparties. We then entered into two new interest rate cap agreements with an effective date of December 31, 2013. The interest rate caps each have a notional amount of $275.0 million amortizing to $25.0 million by their maturity in December 2019. The interest rate caps are designated as cash flow hedges of interest rate risk and are designated to fix our interest payments on the hedged debt at 6.78%.
7
Table of Contents
Our Principal Stockholder
TPG is a leading global private investment firm founded in 1992 with $55.7 billion of assets under management as of September 30, 2013 and offices in San Francisco, Fort Worth, Austin, Beijing, Chongqing, Hong Kong, London, Luxembourg, Melbourne, Moscow, Mumbai, New York, Paris, São Paulo, Shanghai, Singapore and Tokyo. TPG has extensive experience with global public and private investments executed through leveraged buyouts, recapitalizations, spinouts, growth investments, joint ventures and restructurings.
Following the completion of this offering, TPG will own approximately % of our common stock, or % if the underwriters’ option to purchase additional shares of our common stock from us and the selling stockholders is fully exercised. As a result, we expect to be a “controlled company” within the meaning of the corporate governance standards of the NASDAQ Stock Market (“NASDAQ”). on which we intend to apply for our shares to be listed. See “Risk Factors—Risks Relating to our Common Stock and this Offering—TPG will continue to have significant influence over us after this offering, including control over decisions that require the approval of stockholders, which could limit your ability to influence the outcome of matters submitted to stockholders for a vote.”
8
Table of Contents
Corporate Information and Structure
The principal executive offices of Aptalis Holdings Inc. are located at 100 Somerset Corporate Boulevard, Bridgewater, NJ 08807. Our website is www.AptalisPharma.com. The information contained in, or accessible through, our website is not deemed to be part of this prospectus, and you should not rely on any such information in connection with your decision regarding whether or not to purchase our common stock.
The following charts shows our simplified organizational structure immediately following the consummation of this offering:
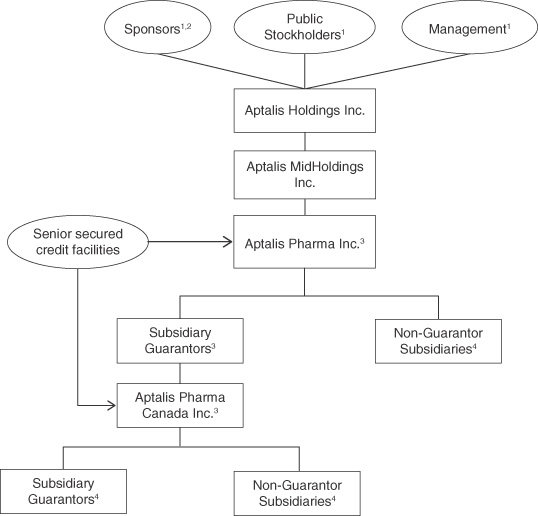
| (1) | Represents %, % and % of the total voting power in the Company, respectively. |
| (2) | Sponsors refers to the TPG Funds and Investor Growth Capital, Ltd., collectively. Following the consummation of this offering, the TPG Funds will own % of the total voting power in the Company, or % if the underwriters exercise their option to purchase additional shares, and Investor Growth Capital, Ltd. will own % of the total voting power in the Company or % if the underwriters exercise their option to purchase additional shares. |
| (3) | Co-borrowers under our senior secured credit facilities. |
| (4) | Substantially all of Aptalis Pharma’s domestic 100% owned subsidiaries and certain foreign 100% owned subsidiaries guarantee our senior secured credit facilities. Other subsidiaries, including foreign subsidiaries, do not guarantee our senior secured credit facilities. See “Description of Certain Indebtedness” for more information. |
9
Table of Contents
Implications of Being an Emerging Growth Company
As a company with less than $1.0 billion in revenue during our most recently completed fiscal year, we qualify as an “emerging growth company” as defined in Section 2(a) of the Securities Act, as modified by the Jumpstart Our Business Startups Act of 2012, or the JOBS Act. As an emerging growth company, we may take advantage of certain reduced disclosures and other requirements that are otherwise unavailable, in general, to public companies that are not emerging growth companies. These provisions include:
| Ÿ | reduced disclosures about our executive compensation arrangements; |
| Ÿ | no non-binding shareholder advisory votes on executive compensation or golden parachute arrangements; |
| Ÿ | exemption from the auditor attestation requirement in the assessment of our internal controls over financial reporting; and |
| Ÿ | reduced disclosures of financial information in this prospectus. |
We may take advantage of these exemptions for up to five years or such earlier time that we are no longer an emerging growth company. We would cease to be an emerging growth company if we have more than $1.0 billion in annual revenues as of the end of a fiscal year, if we are deemed to be a large-accelerated filer under the rules of the Securities and Exchange Commission, or SEC, or if we issue more than $1.0 billion ofnon-convertible debt securities over a rolling three-year period.
The JOBS Act permits an emerging growth company to take advantage of an extended transition period to comply with new or revised accounting standards applicable to public companies. We are choosing to “opt out” of this provision.
10
Table of Contents
Offering
Common stock offered by us | shares |
Common stock offered by the selling stockholders | shares |
Common stock to be outstanding immediately after this offering | shares ( shares if the underwriters exercise their option to purchase additional shares from us and the selling stockholders in full) |
Option to purchase additional shares | The underwriters have a 30-day option to purchase a maximum of additional shares of common stock from us and additional shares of common stock from the selling stockholders. |
Use of Proceeds | We expect to receive net proceeds, after deducting estimated offering expenses and underwriting discounts and commissions, of approximately $ million (or approximately $ million if the underwriters exercise their option to purchase additional shares in full), based on an assumed offering price of $ per share (the midpoint of the price range set forth on the cover of this prospectus). We intend to use the net proceeds from this offering to repay approximately $ million of the $1,250 million outstanding under our senior secured credit facilities, and the remainder for working capital and general corporate purposes, which may include the repayment of additional indebtedness and the funding of strategic growth opportunities. We will not receive any proceeds from the sale of shares of common stock by the selling stockholders. See “Use of Proceeds.” |
Risk Factors | You should read carefully the “Risk Factors” section beginning on page 18 of this prospectus for a discussion of factors that you should consider before deciding to invest in shares of our common stock. |
Stock Exchange and Listing Symbol | We intend to apply to list our common stock on the NASDAQ under the symbol “APTA.” |
Certain Material U.S. Federal Income and Estate Tax Considerations for Non-U.S. Holders of Shares of Our Common Stock | For a discussion of certain material U.S. federal income and estate tax considerations that may be relevant to certain prospective stockholders who are not individual citizens or residents of the United States, please read “Certain Material U.S. Federal Income and Estate Tax Considerations for Non-U.S. Holders of Shares of Our Common Stock” beginning on page 177. |
11
Table of Contents
The number of shares to be outstanding after this offering is based on 67,696,126 shares of common stock outstanding as of September 30, 2013, and the shares of common stock offered pursuant to this prospectus. This number of shares excludes 3,989,250 shares of common stock issuable upon the exercise of outstanding stock options at a weighted-average exercise price of $11.55 per share as of September 30, 2013, of which 2,086,650 were vested and exercisable; 235,842 shares of common stock issuable upon the exercise of outstanding penny stock options, with a grant date exercise price of $0.01 per share, all of which were vested and exercisable; 5,000 restricted stock units, all of which were vested but not yet settled into common stock of the Company as of September 30, 2013; and 893,721 shares of common stock reserved for future issuance under our equity incentive plans.
Except as otherwise indicated herein, all information in this prospectus, including the number of shares that will be outstanding after this offering, assumes:
| Ÿ | an initial public offering price of $ per share of common stock, the midpoint of the estimated initial public offering price range set forth on the cover page of this prospectus; |
| Ÿ | no exercise of the outstanding options described above; and |
| Ÿ | no exercise of the underwriters’ option to purchase additional shares of common stock. |
12
Table of Contents
Summary Historical Financial and Other Data
The summary statement of operations data for the fiscal years ended September 30, 2013, 2012 and 2011 and the summary balance sheet data as of September 30, 2013 have been derived from and are qualified by reference to our audited consolidated financial statements and related notes included elsewhere in this prospectus. You should read this data together with our financial statements and related notes included elsewhere in this prospectus and the information under the captions “Selected Consolidated Financial and Operating Data” and “Management’s Discussion and Analysis of Financial Condition and Results of Operations.” Our historical results are not necessarily indicative of our future results.
| Fiscal Year Ended September 30, 2013 | Fiscal Year Ended September 30, 2012 | Fiscal Year Ended September 30, 2011 | ||||||||||
| (in millions of U.S. dollars, except per share data) | ||||||||||||
Statement of Operations Data: | ||||||||||||
Net product sales | $ | 667.7 | $ | 600.9 | $ | 461.4 | ||||||
Other revenue | 20.2 | 14.2 | 9.0 | |||||||||
|
|
|
|
|
| |||||||
Total revenue | 687.9 | 615.1 | 470.4 | |||||||||
Cost of goods sold(1) | 146.6 | 144.2 | 135.4 | |||||||||
Selling and administrative expenses(1) | 172.5 | 168.8 | 143.5 | |||||||||
Management fees | 7.0 | 5.7 | 3.6 | |||||||||
Research and development expenses(1) | 65.5 | 72.6 | 58.0 | |||||||||
Acquired in-process research | 0.0 | 0.0 | 65.5 | |||||||||
Depreciation and amortization | 94.7 | 101.7 | 72.8 | |||||||||
Loss (gain) on disposal of product line | (1.0 | ) | 0.0 | 7.4 | ||||||||
Transaction, restructuring and integration costs | 2.5 | 12.4 | 50.9 | |||||||||
Fair value adjustments to intangible assets and contingent consideration | 10.0 | (3.4 | ) | — | ||||||||
|
|
|
|
|
| |||||||
Operating income (loss) | 190.1 | 113.1 | (66.7 | ) | ||||||||
Financial expenses | 68.8 | 80.2 | 89.5 | |||||||||
Loss on extinguishment of debt | — | 23.1 | 28.3 | |||||||||
Other interest income | (0.4 | ) | (0.2 | ) | (0.4 | ) | ||||||
Loss on foreign currencies | 0.1 | 0.2 | 0.1 | |||||||||
|
|
|
|
|
| |||||||
Income (loss) before income taxes | 121.6 | 9.8 | (184.2 | ) | ||||||||
Income taxes | 34.7 | 21.8 | 7.4 | |||||||||
|
|
|
|
|
| |||||||
Net (loss) income | $ | 86.9 | $ | (12.0 | ) | $ | (191.6 | ) | ||||
|
|
|
|
|
| |||||||
Earnings per common share attributable to common shareholders: | ||||||||||||
Basic earnings per share | $ | 1.28 | $ | (0.18 | ) | $ | (3.32 | ) | ||||
Diluted earnings per share | $ | 1.26 | $ | (0.18 | ) | $ | (3.32 | ) | ||||
Weighted average common shares outstanding: | ||||||||||||
Basic | 67,987,312 | 67,699,784 | 57,742,284 | |||||||||
Diluted | 69,174,681 | 67,699,784 | 57,742,284 | |||||||||
13
Table of Contents
| Fiscal Year Ended September 30, 2013 | Fiscal Year Ended September 30, 2012 | Fiscal Year Ended September 30, 2011 | ||||||||||
| (in millions of U.S. dollars, except per share data) | ||||||||||||
As Adjusted Data(3)(4)(5)(6): | ||||||||||||
Net (loss) income | $ | |||||||||||
Basic earnings per common share | $ | |||||||||||
Diluted earnings per common share | $ | |||||||||||
Weighted average common shares outstanding: | ||||||||||||
Basic | ||||||||||||
Diluted | ||||||||||||
Other Financial Data: | ||||||||||||
EBITDA(2)(7) | $ | 284.7 | $ | 191.5 | $ | (22.3 | ) | |||||
Adjusted EBITDA(2)(7) | $ | 314.6 | $ | 244.9 | $ | 160.0 | ||||||
Adjusted pre-tax income (2)(7) | $ | 241.4 | $ | 161.6 | $ | 67.5 | ||||||
| September 30, 2013 | ||||||
| Actual | As Adjusted (3)(4)(5) | |||||
| (in millions of U.S. dollars) | ||||||
Balance Sheet Data (at period end): | ||||||
Cash and cash equivalents | $ | 229.9 | ||||
Short-term investments, available for sale | — | |||||
Total current assets | 401.2 | |||||
Total assets | 1,341.2 | |||||
Total short-term borrowings | 9.5 | |||||
Total current liabilities | 261.6 | |||||
Total long-term debt | 911.8 | |||||
Total liabilities | 1,294.6 | |||||
Total shareholders’ equity | 46.6 | |||||
| (1) | Exclusive of depreciation and amortization which is separately reported in the Statement of Operations. |
| (2) | EBITDA, Adjusted EBITDA and Adjusted pre-tax income are financial measures that are not defined under generally accepted accounting principles in the United States, or GAAP, and are presented in this prospectus because our management considers them important supplemental measures of our performance and believes that they provide greater transparency into our results of operation and are frequently used by investors in the evaluation of companies in the industry. In addition, our management believes that EBITDA, Adjusted EBITDA and Adjusted pre-tax income are useful financial metrics to assess our operating performance from period to period by excluding certain material non-cash items, unusual or non-recurring items that we do not expect to continue in the future and certain other adjustments we believe are not reflective of our ongoing operations and our performance. |
None of EBITDA, Adjusted EBITDA or Adjusted pre-tax income are measures of net income, operating income or any other performance measure derived in accordance with GAAP, and each is subject to important limitations. EBITDA, as we use it, is net income before financial expenses, interest income, income taxes and depreciation and amortization. Adjusted EBITDA, as we use it, is EBITDA adjusted to exclude certain non-cash charges, unusual or nonrecurring items, impact of discontinued operations, impairment of intangible assets, restructuring activities, litigation settlements and contingencies, upfront and development milestone payments, stock-based compensation and other adjustments set forth below. Adjusted pre-tax income, as we use |
14
Table of Contents
it, is income before income taxes as reported under GAAP, adjusted to exclude certain non-cash charges, unusual or nonrecurring items, impact of discontinued operations, impairment of intangible assets, restructuring activities, litigation settlements and contingencies, upfront and development milestone payments, stock-based compensation and other adjustments set forth below. |
| We understand that although EBITDA, Adjusted EBITDA and Adjusted pre-tax income are frequently used by securities analysts, investors and others in their evaluation of companies, they have limitations as analytical tools, and you should not consider them in isolation, or as a substitute for analysis of our results as reported under GAAP. Some of these limitations are: |
| Ÿ | EBITDA, Adjusted EBITDA and Adjusted pre-tax income do not reflect all cash expenditures, future requirements for capital expenditures, or contractual commitments; |
| Ÿ | EBITDA, Adjusted EBITDA and Adjusted pre-tax income do not reflect changes in, or cash requirements for, working capital needs; |
| Ÿ | EBITDA and Adjusted EBITDA do not reflect the significant interest expense, or the cash requirements necessary to service interest or principal payments, on our debt; |
| Ÿ | EBITDA, Adjusted EBITDA and Adjusted pre-tax income do not reflect expenditures related to current business development and product acquisition activities, including payments due under existing agreements related to products in various stages of development or contingent payments tied to the achievement of sales milestones; |
| Ÿ | although depreciation and amortization are non-cash charges, the assets being depreciated and amortized will often have to be replaced in the future, and EBITDA, Adjusted EBITDA and Adjusted pre-tax income do not reflect any cash requirements for such replacements; |
| Ÿ | EBITDA, Adjusted EBITDA and Adjusted pre-tax income exclude income tax payments that represent a reduction in cash available to us; |
| Ÿ | EBITDA, Adjusted EBITDA and Adjusted pre-tax income do not reflect the impact of earnings or charges resulting from matters we consider not to be indicative of our ongoing operations; and |
| Ÿ | other companies in our industry may calculate EBITDA, Adjusted EBITDA and Adjusted pre-tax income differently than we do, limiting their usefulness as comparative measures. |
| Because of these limitations, EBITDA, Adjusted EBITDA and Adjusted pre-tax income should not be considered as measures of discretionary cash available to us to invest in our business. Our management compensates for these limitations by relying primarily on our GAAP results and using EBITDA, Adjusted EBITDA and Adjusted pre-tax income as supplemental information. Investors and potential investors are encouraged to review the reconciliations of EBITDA, Adjusted EBITDA and Adjusted pre-tax income to our closest reported GAAP measures contained within “Selected Consolidated Financial and Operating Data” included elsewhere in this prospectus. |
| (3) | As adjusted consolidated financial data reflects (i) the Recapitalization, including (a) the distribution in aggregate amount of $399.5 million to our shareholders, holders of our restricted stock units and certain holders of options to purchase shares of our common stock on October 7, 2013, and (b) the refinancing of our previously existing credit facilities, which were replaced with our senior secured credit facilities providing for senior secured term loans in the amount of $1,250 million and a senior secured revolving credit facility allowing for borrowings of up to $150 million; (ii) the elimination of fees paid under our management agreements with our Sponsors; (iii) the offering of million shares of common stock by us in this offering, assuming an initial public offering price of $ per share, the midpoint of the price range set forth on the cover page of this prospectus, after deducting underwriting discounts and commissions and estimated offering |
15
Table of Contents
expenses payable by us; and (iv) the application of the estimated proceeds of the offering as described in “Use of Proceeds.” This as adjusted consolidated financial data is presented for informational purposes only and does not purport to represent what our consolidated results of operations or financial position actually would have been had the transactions reflected occurred on the date indicated or to project our financial condition as of any future date or results of operations for any future period. |
| (4) | A $1.00 increase (decrease) in the assumed initial public offering price of $ per share, the midpoint of the price range set forth on the cover of this prospectus, would increase (decrease) the as adjusted amount of each of cash and cash equivalents, total current assets, total assets and total shareholders’ equity by approximately $ million, assuming that the number of shares offered by us, as set forth on the cover of this prospectus, remains the same and after deducting underwriting discounts and commissions and estimated offering expenses payable by us. |
A share increase in the number of shares offered by us together with a concomitant $1.00 increase in the assumed initial public offering price of $ per share, the midpoint of the price range set forth on the cover of this prospectus, would increase the as adjusted amount of each of cash and cash equivalents, total current assets and total assets by approximately $ million after deducting underwriting discounts and commissions and any estimated offering expenses payable by us. Conversely, a share decrease in the number of shares offered by us together with a concomitant $1.00 decrease in the assumed initial public offering price of $ per share, the midpoint of the price range set forth on the cover of this prospectus, would decrease the as adjusted amount of each of cash and cash equivalents, total current assets and total assets by approximately $ million after deducting underwriting discounts and commissions and any estimated offering expenses payable by us.
| (5) | As adjusted information is unaudited. |
| (6) | As adjusted earnings per share. |
The as adjusted earnings per share gives effect to (a) the Recapitalization, (b) the elimination of fees paid under our management agreements with our Sponsors (which will be terminated in connection with the offering) and (c) the issuance of shares of our common stock offered by this prospectus and the use of the proceeds therefrom as described in “Use of Proceeds,” as if each had occurred on October 1, 2012.
16
Table of Contents
The following presents the computation of as adjusted basic and diluted earnings per share:
| Fiscal Year Ended September 30, 2013 | ||||
| (in millions of U.S. dollars, except per share data) | ||||
Numerator: | ||||
Net income as reported | $ | |||
Net income as adjusted adjustments: | ||||
Interest expense, net of tax(a) | ||||
Amortization of debt issuance costs and discount, net of tax(a) | ||||
Reduction of management fees, net of tax(b) | ||||
As adjusted net income | $ | |||
Denominator: | ||||
Weighted average common shares used in computing basic income per common share | ||||
Adjustment for common stock assumed issued in this offering | ||||
As adjusted basic common shares outstanding(c) | ||||
As adjusted basic earnings per share | $ | |||
Weighted average common shares used in computing diluted income per common share outstanding | ||||
Adjustment for common stock assumed issued in this offering | ||||
As adjusted diluted common shares outstanding(c) | ||||
As adjusted diluted earnings per share | $ | |||
| (a) | These adjustments reflect the change to historical interest expense and amortization of debt issuance costs and discount (net of tax at an applicable blended statutory rate of % for the fiscal year ended September 30, 2013) after reflecting the Refinancing and use of proceeds from this offering to repay $ million of our senior secured credit facilities. |
| (b) | After the offering, we will no longer incur expenses under the management agreements with our Sponsors, resulting in the elimination of management fees of $ million, net of tax at an applicable blended statutory rate of % for the fiscal year ended September 30, 2013. This as adjusted calculation does not include the approximately $ million expense to be paid to the Sponsors as a fee in connection with the termination of the management agreements, as these costs will not have a continuing impact on our consolidated results of operations. |
| (c) | The as adjusted basic and diluted earnings per share is calculated based upon the weighted-average common shares outstanding during the period including the issuance of common stock in this offering as if the offering occurred on October 1, 2012. We also assume that the underwriters of the offering do not exercise their option to purchase up to $ million additional common stock from us and the selling stockholders. |
| (7) | For a reconciliation of EBITDA and Adjusted EBITDA to Net (loss) income and Adjusted pre-tax income to income before income tax, see “Selected Consolidated Financial and Operating Data.” |
17
Table of Contents
Investing in our common stock involves a high degree of risk. You should carefully consider the risks and uncertainties described below, as well as all of the other information contained in this prospectus, including our consolidated financial statements and the notes thereto and the “Cautionary Note Regarding Forward-Looking Statements,” before making an investment decision. The risks described below are those which we believe are the material risks that we face. Any of the following risks and uncertainties and those discussed elsewhere in this prospectus could materially adversely affect our business, financial condition or results of operations. In such case, the trading price of our common stock may decline and you may lose all or part of your original investment.
Risks Related to Our Business
The pharmaceutical industry is highly competitive and is subject to rapid and significant change, which could render our products obsolete or uncompetitive.
Competition in our industry is intense and characterized by extensive research efforts and rapid technological progress. Technological developments by competitors, regulatory approval for marketing competitive products, including potential generic or over-the-counter products, or competitors’ superior marketing resources could adversely affect the commercial potential of our products and could have a material adverse effect on our revenue and results of operations. We are aware that there are numerous pharmaceutical and biotechnology companies, including large, well-known pharmaceutical companies, as well as academic research groups, throughout the world, engaged in research and development efforts with respect to pharmaceutical products targeted at CF and GI disorders addressed by our current and potential products. Competitors might overcome the significant barriers to entry described in the “Business” section of this prospectus and develop products that render our current products and pipeline product candidates obsolete or uncompetitive. They may complete development and regulatory approval processes sooner, whether by virtue of their greater experience in clinical testing and human clinical trials of pharmaceutical products or otherwise, and, therefore, market their products earlier than we can. They may also succeed in developing products that are more effective or less expensive to use than any that we may develop or license. These developments would limit the demand for our products and have a material adverse effect on our business and financial results.
The entry of generic versions of our products into the market could have a material adverse impact on our financial position, cash flows and results of operations.
The entry of generic and unbranded competitors to branded products leads to price erosion and decreased sales of the branded product. For example, during the fiscal years ended September 30, 2012 and September 30, 2013, generic competitors of DELURSAN 250mg entered the market in France, which we believe contributed to a reduction in revenue from sales of DELURSAN 250mg from $26.2 million in fiscal year 2011 to $14.7 million in fiscal year 2013. In addition, generic competitors of URSO entered the U.S. market during the fiscal year ended September 30, 2010, which we believe contributed to a reduction in revenue from sales of URSO from $50.0 million in fiscal year 2009 to $12.3 million in fiscal year 2013. The Company is at risk of further erosion of its net sales for its products that face generic competition. We have no patent protection for certain of our products, such as ULTRESA, VIOKACE and CARAFATE, which could make it easier for generic competitors to enter the market. While we believe our products benefit from a variety of intellectual property, regulatory, clinical, sourcing and manufacturing barriers to competitive entry, there can be no assurance that these barriers will be effective in preventing generic versions of our products from being approved. See “Business—Our Products” for an additional description of certain of these barriers. Some of these barriers depend upon the FDA or other regulatory agencies following guidance or practice they have previously issued and followed. Typically such guidance and practice is not binding on the regulatory
18
Table of Contents
agency and is subject to change and varying interpretation. For example, in March 2013, the FDA revised its draft guidance with respect to determining bioequivalency of mesalamine rectal suppository products. In its revised draft guidance, the FDA now recommends in vivo and in vitro studies to demonstrate the bioequivalency of generic mesalamine rectal suppositories with pharmacokinetic endpoints and comparative in vitro studies, rather than clinical trials with clinical efficacy endpoints as previous FDA guidance had provided.
Particularly in the United States, government and commercial payors often provide significant financial incentives to encourage patients to purchase generic products instead of branded products as a way to reduce healthcare costs, and pharmacists may substitute generic or unbranded products for our products even if physicians prescribe our products by name. Governmental and other pressures toward the dispensing of generic or biosimilar products may rapidly and significantly reduce, or slow the growth in, the sales and profitability of our products and may adversely affect our future results and financial condition.
We have received letters from two parties indicating that each party had filed an Abbreviated New Drug Application, or ANDA, seeking approval to market a generic version of CANASA. In July 2013, we filed patent infringement lawsuits against each party, alleging infringement of certain of our patents and seeking, among other things, injunctive relief. See “Business—Legal Proceedings” for more information regarding the infringement suits. We believe the ANDAs were filed before the patents covering CANASA were listed in the FDA’s publication, “Approved Drug Products with Therapeutics Evaluations” (commonly referred to as the “Orange Book”), which generally means that we are not entitled to the 30-month stay of the approval of these ANDAs provided for by the Hatch-Waxman Act.
In October 2013, we also filed a citizen’s petition to request that the FDA require any ANDAs for a generic version of CANASA to demonstrate bioequivalence to CANASA using a clinical endpoint study, as opposed to a confirmation of quantitative and qualitative equivalence and limited physical testing along with a pharmacokinetics assessment. We believe that a clinical endpoint study is necessary due to mesalamine’s drug release characteristics and the kinetics of drug disposition at the local site. We can offer no assurances as to whether the FDA will grant our petition, nor can we predict the impact, if any, the petition will have on the FDA’s consideration of any pending or future ANDAs relating to CANASA.
We can offer no assurance as to when the pending litigation will be resolved, whether the lawsuit will be successful or that a generic equivalent of CANASA will not be approved and enter the market. The launch of generic versions of any of our products would likely reduce prices and unit sales and could have a material adverse impact on our financial position, cash flows and results of operations.
Our top three products account for a large portion of our revenues; any significant setback with respect to any of these products could have a material adverse effect on our business.
Any factor that adversely affects the sale or price of our principal products could significantly decrease our sales and profits. ZENPEP, CANASA and CARAFATE sales accounted for 21%, 19% and 21%, respectively, of our total revenue for fiscal 2013 and 20%, 19% and 20%, respectively, of our total revenue for fiscal year 2012 and 13%, 20% and 22%, respectively, of our total revenue for fiscal year 2011. Any significant setback with respect to any one of these three products, including setbacks with respect to shipping, manufacturing, supply, regulatory issues, product safety, marketing, government licenses and approvals, intellectual property rights, formulary losses, or generic or other forms of competition related to these products could have a material adverse effect on our financial position, cash flows or overall trends in results of operations.
19
Table of Contents
If we are unable to gain regulatory approval for and successfully commercialize any of our pipeline products, or experience significant delays in doing so, our growth prospects will be materially harmed.
We have invested significant time and financial resources in the development of our pipeline products, including APT-1026, ZENPEP-EU, APT-1016 and APT-1011, and impediments or delays in gaining regulatory approval or commercializing any of our pipeline product candidates would materially harm our prospects.
The commercial success of any of our product candidates for which we obtain marketing approval from the FDA, Health Canada’s Therapeutic Products Directorate, or the TPD, the European Medicines Agency, or the EMA, or other regulatory authorities will depend upon the acceptance of these products by the medical community, including physicians, patients and payors. The degree of market acceptance of any of our approved products will depend on a number of factors, including:
| Ÿ | demonstration of clinical safety and efficacy and obtaining regulatory approval in the jurisdictions where we operate; |
| Ÿ | the relative convenience and ease of administration; |
| Ÿ | the expectedness, incidence and severity of any adverse side effects; |
| Ÿ | limitations or warnings contained in a product’s FDA-, TPD- or EMA- approved labeling; |
| Ÿ | the availability of alternative treatments for the indications we target; |
| Ÿ | pricing and comparative effectiveness to competing products, particularly generic products and the current standard of care; |
| Ÿ | the effectiveness of our sales and marketing strategies; |
| Ÿ | the effectiveness of our supply arrangements and manufacturing and distribution plants, and the continued operation of our and our suppliers’ facilities in compliance with current good manufacturing practices, or cGMPs; |
| Ÿ | our ability to supply the evidence required to obtain timely and sufficient third-party coverage and reimbursement; and |
| Ÿ | the willingness of patients to pay out-of-pocket costs for co-insurance or higher co-pays, or in the absence of third-party coverage. |
If any of our product candidates are approved but do not achieve an adequate level of acceptance by physicians, payors and patients, we may not generate sufficient revenue from these products for such products to become or remain profitable. In addition, our efforts to educate the medical community and payors on the benefits of our product candidates may require significant resources and may not be successful.
Our initial analysis of the data on the placebo-controlled phase III clinical trial for U.S. approval for APT-1026 indicates that the clinical trial did not meet its primary endpoint, time to exacerbation, but did demonstrate efficacy in key secondary endpoints, including superiority over placebo in improving lung function. We are currently in discussions with the FDA to explore alternatives to advanceAPT-1026 in the United States. We can give no assurance that our applications for approval in the EU and Canada will be successful, or that we will seek or receive regulatory approval for APT-1026 in the United States or in any other jurisdiction. Our ability to develop and commercialize APT-1026 will depend on numerous factors, including those listed above. Failure to achieve any of these requirements for the successful development and commercialization of APT-1026 could prevent us from commercializing APT-1026 in the timeframe anticipated, or at all, and would materially harm our prospects and have an
20
Table of Contents
adverse effect on our business. Even if we do receive regulatory approval for APT-1026, commercial success depends on a variety of factors, some of which are beyond our control, and we can provide no assurance as to the revenue we will realize from APT-1026.
Our business could suffer as a result of adverse drug reactions to the products we market.
Unexpected adverse drug reactions by patients to any of our products could negatively impact utilization or market availability of our product. Patients taking our principal products have experienced adverse events, the most common of which include, in the case of ZENPEP, abdominal pain, flatulence, headache, cough, decreased weight, early satiety and confusion, in the case of CARAFATE, constipation, and, in the case of CANASA, dizziness, rectal pain, fever, rash, acne and colitis. If the incidence or severity of adverse drug reactions to the products we market increases substantially or if previously unknown problems with any of our approved commercial products, manufacturers or manufacturing processes are discovered, we will suffer reputational harm and we could be subject to administrative or judicially imposed sanctions or other setbacks, including:
| Ÿ | restrictions on the products, manufacturers or manufacturing processes; |
| Ÿ | warning letters; |
| Ÿ | civil penalties and criminal prosecutions and penalties; |
| Ÿ | injunctions; |
| Ÿ | product seizures or detentions; |
| Ÿ | import or export bans or restrictions; |
| Ÿ | extensive warnings on product labels; |
| Ÿ | imposition of restricted distribution programs; |
| Ÿ | risk evaluation mitigation and risk management strategies; |
| Ÿ | voluntary or mandatory product recalls and related publicity requirements; |
| Ÿ | suspension or withdrawal of regulatory approvals; |
| Ÿ | total or partial suspension of production; and |
| Ÿ | refusal to approve pending applications for marketing approval of new products or of supplements to approved applications. |
Any of these could have an adverse impact on our financial condition or results of operations.
The publication of negative results of studies or clinical trials may adversely impact our sales revenue.
We, academics, government agencies and others conduct studies or clinical trials on various aspects of pharmaceutical products. The results of these studies or trials may have a dramatic effect on the market for the pharmaceutical product that is the subject of the study. The publication of negative results of studies or clinical trials related to our products or the therapeutic areas in which our products compete could adversely affect our sales, the prescription trends for our products and the reputation of our products. In the event of the publication of negative results of studies or clinical trials related to our products or the therapeutic areas in which our products compete, our business, financial condition, results of operations and cash flows could be materially adversely affected.
21
Table of Contents
Any difficulties with or interruptions in our own manufacturing operations could delay output of products, which would have a material adverse effect on our business.
Any difficulties with or interruptions in our proprietary manufacturing operations could delay our output of products. We rely on production capabilities at our manufacturing facilities in Pessano, Italy, San Guiliano, Italy, Houdan, France, Mont St. Hilaire, Canada and Vandalia, Ohio. Due to regulatory and technical requirements, we have limited ability to shift production among our facilities or to outsource any part of our manufacturing activities to third parties in order to avoid disruptions in supply of our products. Delays in site transfers or scale-up of production to commercial quantities could delay clinical studies, regulatory submissions and approvals and commercialization or continued commercialization of our products and product candidates. Damage to any of our manufacturing facilities caused by human error, physical or electronic security breaches, power loss or other failures or circumstances beyond our control, including acts of God, fire, explosion, flooding, war, insurrection or civil disorder, acts of, or authorized by, any government, terrorism, accidents, labor troubles or shortages, or the inability to obtain material, equipment or transportation, could interrupt or delay our manufacturing operations. Likewise, natural disasters could interrupt supply of our manufacturing operations. Any interruption in our own manufacturing, whether due to limitations in manufacturing capacity or arising from factors outside our control, could impede our ability to produce sufficient supplies of our products for clinical studies or commercial distribution, which would have a material adverse effect on our business.
We depend on third-party providers, including sole-source suppliers, to manufacture our products and the active pharmaceutical ingredient for our products. We may not be able to maintain these relationships and could experience supply disruptions outside of our control.
We rely on a network of third-party providers to manufacture certain of our finished products or supply the active pharmaceutical ingredient for our products. As a result of our reliance on these third-party providers, including sole-source suppliers of certain components of our products and product candidates, we could be subject to significant supply disruptions outside of our control.
Damage to any of our third-party providers’ manufacturing facilities caused by human error, physical or electronic security breaches, power loss or other failures or circumstances beyond our control, including acts of God, fire, explosion, flooding, war, insurrection or civil disorder, acts of, or authorized by, any government, terrorism, accidents, labor troubles or shortages, or the inability to obtain material, equipment or transportation, could interrupt or delay their manufacturing operations. Likewise, natural disasters could interrupt supply of our third-party providers manufacturing operations. Any such disruptions could disrupt sales of our products and/or the timing of our clinical trials. Any such disruptions could have a material adverse effect on our sales and revenue.
Our agreements for the manufacture of the active pharmaceutical ingredient for ZENPEP, with Nordmark Arzneimittel GmbH & Co., and CANASA, with Infar, S.A., expire in the next 12 months. We are currently negotiating the extension of the terms of these agreements, but there can be no assurance that such negotiations will be successful. Our agreement for the supply of finished-product CARAFATE, with Sanofi-Aventis U.S. LLC, expires in 2016. We have no direct agreement for the supply of the active pharmaceutical ingredient in CARAFATE and currently source it through the supplier from which we buy CARAFATE finished product. To the extent we are unable to maintain our arrangements with the current suppliers of our finished product or active pharmaceutical ingredients, or to contract with alternative suppliers on acceptable terms, or at all, our business may be materially adversely affected. In addition, if any of these manufacturers fail to supply us with sufficient quantities of high-quality active pharmaceutical ingredient at an acceptable cost and on a timely basis, this could result in the delay of clinical development or commercialization of our product candidates or a decline in our sales and revenue.
22
Table of Contents
In some instances, our regulatory approvals require that we obtain prior approval of any change of third-party providers for our products or raw materials by the relevant regulatory agency, such as the FDA or the EMA. This regulatory approval process typically takes a minimum of 12 to 18 months, and could take longer and involve significant costs if new clinical trials are required. During the period of any such transition, we could face a shortage of supply of our products. Some of our contracts with our current providers prohibit us from using alternative providers for the products supplied under these contracts. As a result of these factors, it is difficult for us to reduce our dependence on single sources of supply, and, even where that is not the case, there are a limited number of manufacturers capable of manufacturing our marketed products and our product candidates. In addition, some of our contracts contain purchase commitments that require us to make minimum purchases that might exceed our needs or limit our ability to negotiate with other manufacturers, which might increase costs.
Our current and anticipated future dependence upon third-party providers for the manufacturing and supply and testing of our products and product candidates, together with the regulatory constraints on transfer of manufacturing and supply, may adversely affect sales of our products and our ability to develop and commercialize additional products that receive regulatory approval in a timely and competitive manner. If these third-party providers fail to supply us with sufficient quantities of finished product or active pharmaceutical ingredient at an acceptable cost and on a timely basis, this could result in the delay of clinical development or commercialization of our product candidates or a decline in our sales and revenues.
Our business is subject to international economic, political and other risks that could negatively affect our results of operations and financial condition.
We have operations in the United States, Canada and the EU and distribution and licensing contracts in many other countries where our products are distributed. For fiscal years 2013, 2012 and 2011, 20%, 24% and 28% of our revenues, respectively, were derived from sources outside the United States. As a result, we are subject to heightened risks inherent in conducting business internationally, including the following risks:
| Ÿ | foreign countries could enact legislation or impose regulations or other restrictions, including unfavorable labor regulations or tax policies, which could have an adverse effect on our ability to conduct business in or expatriate profits from those countries; |
| Ÿ | the regulatory or judicial authorities of foreign countries may not enforce legal rights and recognize business procedures in a manner to which we are accustomed or that we would reasonably expect; |
| Ÿ | changes in general political, social and economic conditions may lead to changes in the business environment in which we operate, as well as inflation and changes in foreign currency exchange rates; |
| Ÿ | customers in foreign jurisdictions may have longer payment cycles, and it may be more difficult to collect receivables in foreign jurisdictions; |
| Ÿ | adverse tax consequences; |
| Ÿ | inadequate protection of intellectual property; and |
| Ÿ | natural disasters, pandemics or international conflict, including terrorist acts, could endanger our personnel, damage our facilities and interrupt our operations. |
Any such events could negatively impact our ability to operate our business outside of the United States and could have an adverse impact on our financial condition and results of operations.
23
Table of Contents
In addition, we face several risks relating to compliance with international and U.S. laws and regulations that apply to our international operations. These laws and regulations include data privacy requirements, labor relations laws, tax laws, anti-competition regulations, import and trade restrictions, export requirements and anti-bribery laws and regulations, such as the United States Foreign Corrupt Practices Act and the UK Anti-Bribery Act, and other laws that prohibit payments to governmental officials and certain payments or remunerations to customers. Given the high level of complexity of these laws and regulations there is a risk that some provisions may be inadvertently breached, through fraudulent or negligent behavior of individual employees or our partners, our failure to comply with certain formal documentation requirements or otherwise. Violations of these laws and regulations could result in fines, criminal sanctions against us, our officers, our partners or our employees, and prohibitions on the conduct of our business. Any such violations could include prohibitions on our ability to offer our products in one or more countries and could materially damage our reputation, our brand, our international expansion efforts, our ability to attract and retain employees, our business and our operating results.
The scope of these laws is broad and there may not be regulations, guidance or court decisions that definitively interpret these laws and apply them to particular industry practices. This uncertainty in the way such laws will be interpreted increases the risk of violations. In addition, these laws and their interpretations are subject to change. Our business success depends in part on our ability to anticipate and effectively manage these and other regulatory, economic, social and political risks inherent in multinational business. We cannot provide assurances that we will be able to effectively manage these risks or that they will not have a material adverse effect on our multinational business or on our business as a whole.
We rely on third parties to conduct, supervise and monitor our clinical trials, and those third parties may perform in an unsatisfactory manner.
We rely on third parties, such as clinical research organizations, or CROs, medical institutions and clinical investigators to enroll qualified patients and conduct, supervise and monitor our clinical trials. Our reliance on these third parties for clinical development activities reduces our control over these activities. Such third parties may not complete activities on schedule, or may not conduct our preclinical studies or clinical trials in accordance with regulatory requirements or our trial design, either of which could delay or impede our efforts to obtain regulatory approvals for, and to commercialize, our product candidates.
The potential loss or delay of our access agreements or purchase-based contracts could adversely affect our results.
As is the case for other companies in our industry, we rely on access agreements with payors, especially in the United States, in order to make our products accessible to the patients of physicians who prescribe our products. These access agreements between us and payors are for varying terms and generally may be revised or terminated during their terms for various reasons, including upon entry by a generic into the market. We currently have access agreements for certain of our products with commercial pharmacy benefit management organizations, or PBMs, the Department of Veterans Affairs, Medicare, Medicaid and various national commercial insurers. We also rely on purchase-based agreements (such as with group purchasing organizations) that are in place for all key PEP brands to drive exclusive utilization in key institutions for the PEPs. Any failure to maintain or obtain favorable access agreements or purchase-based agreements could have a material effect on our results of operations and financial condition.
24
Table of Contents
Sales of our products may be adversely affected by the concentration of our product sales with a small number of wholesale distributors. If there is a disruption in any of these arrangements, and we cannot negotiate agreements with replacement wholesale distributors on commercially reasonable terms, we may not be able to effectively distribute our products, which would reduce revenues and cash flows.
There are a small number of large pharmaceutical wholesale distributors that have the capacity to be effective distribution partners for us. As a result, the majority of our sales are to a small number of pharmaceutical wholesale distributors, which in turn sell our products primarily to pharmacies, which ultimately dispense our products to the end consumers. In fiscal year 2013, sales to our three largest customers, which are U.S. wholesalers, accounted for 65% of our net product sales. Although we have distribution service agreements, or DSAs, that outline the terms of our business arrangements with these three U.S. wholesalers, these agreements are either terminable at will, with proper notice, or by mutual consent, and the pricing and other terms we have negotiated under each agreement are subject to change during the term of the agreement. If we cease doing business with any of these distributors for any or all of our products, or if the amount purchased from us by any or all of them is materially reduced, and we cannot negotiate agreements with replacement wholesale distributors on commercially reasonable terms, or at all, we could experience a material reduction in revenues and cash flows and we might not be able to effectively distribute our products through pharmacies.
Future litigation and the outcome of current litigation, including product liability litigation, may harm our business.
We face an inherent business risk of exposure to product liability and other claims in the event that the use of our products results, or is alleged to have resulted, in adverse effects. We have generally agreed to indemnify our licensors, distributors and certain of our contract manufacturers for product liability claims and there is a risk that we will be subject to product liability claims and claims for indemnification under these agreements. Although we currently carry product liability insurance, there can be no assurance that we have sufficient coverage, or can in the future obtain sufficient coverage at a reasonable cost. An inability to obtain product liability insurance at an acceptable cost or to otherwise protect against potential product liability claims could prevent or inhibit successful marketing of products and the growth of our business. Our obligation to pay indemnities, the withdrawal of a product following complaints, or a product liability claim could have a material adverse effect on our business, results of operations, cash flows and financial condition.
Our business depends on key scientific, sales and managerial personnel for continued success.
Much of our success to date has resulted from the skills of certain of our officers and scientific personnel, our marketing and market access team, our sales force and our business development team. High demand exists for these key personnel in the pharmaceutical industry. The loss of any of these people may negatively impact our ability to manage our company effectively and to carry out our business plan. If any of these individuals were no longer employed by us, we might not be able to attract or retain employees with similar skills or carry out our business plan. In particular, the continued service of our senior management team, including Frank Verwiel, Steve Gannon, John Fraher, David Mims, Jean-Louis Anspach and Ruth Thieroff-Ekerdt, who are responsible for the development and implementation of our business strategy, is critical to our success. The loss of service of any member of our senior management team or key personnel could prevent, impair or delay the acquisition of new products or companies, the successful completion of our planned clinical trials and the commercialization of our products and product candidates. Of our senior management team, only four have employment agreements. We do not carry key man insurance for any member of our senior management team.
25
Table of Contents
Certain of our employees outside the United States are represented by collective bargaining or other labor agreements and we could face disruptions that would interfere with our operations as a result.
Certain of our employees located in Canada and most of our employees in Europe are represented by collective bargaining or other labor agreements or arrangements that provide bargaining or other rights to employees. Such employment rights require us to expend greater time and expense in making changes to employees’ terms of employment or carrying out staff reductions. In addition, any national or other labor disputes in these regions could result in a work stoppage or strike by employees that could delay or interrupt our ability to supply products and conduct operations. Due to the nature of these collective bargaining agreements, we will have no control over such work stoppages or strikes by our employees, and a strike may occur even if our employees do not have any grievances against us. Any interruption in manufacturing or operations would interfere with our business and could have a material adverse effect on our revenues.
A significant component of our growth strategy is to continue to pursue additional acquisitions, which will present certain risks to us.
A significant component of our strategy will continue to be growth by selectively acquiring product candidates, products and businesses. However, we cannot be certain that acquisition candidates will be appropriate, available or actionable. Even if an acquisition candidate is appropriate, available and actionable, there can be no assurance we will be able to successfully negotiate any such acquisition on favorable terms, or at all, finance such an acquisition or successfully integrate such an acquired product or business into our existing business. We face significant competition from other pharmaceutical companies for acquisition candidates, which makes it more difficult to find attractive transaction opportunities for product candidates, products and businesses on acceptable terms. Furthermore, the negotiation of potential acquisitions could divert management’s time and resources and require significant financial resources to consummate. To consummate any acquisition, we may need to incur additional debt or issue additional equity securities and, depending on market conditions, we may not be able to obtain necessary financing for any acquisitions on terms acceptable to us, or at all. We may also be required to pay external costs such as legal advisory, market research consultancy and due diligence fees related to our pursuit and evaluation of potential acquisitions, even if the acquisitions are never consummated. Failure to acquire new products may diminish our rate of growth and adversely affect our competitive position.
Any acquisition transactions involve various inherent risks, such as assessing the value, strengths, weaknesses, contingent and other liabilities and potential profitability of the acquisition; the potential loss of key personnel of an acquired business; the ability to achieve operating and financial synergies anticipated to result from an acquisition and unanticipated changes in business, industry or general economic conditions that affect the assumptions underlying the acquisition. Any one or more of these factors could cause us not to realize the anticipated benefits from the acquisition of product candidates, products or businesses.
Integrating acquired companies or products requires significant effort, including the coordination of information technologies, research and development, sales and marketing, operations, manufacturing and finance operations. These efforts result in additional expenses and involve significant amounts of management’s time. Factors that will affect the success of our acquisitions include the strength of the acquired companies’ or products’ underlying technology and ability to execute on strategic goals, results of clinical trials, regulatory approvals and reimbursement levels of the acquired products and related procedures, our ability to adequately fund acquired in-process research and development projects and retain key employees, and our ability to achieve synergies with our acquired companies and products, such as increasing sales of our products, achieving cost
26
Table of Contents
savings and effectively combining technologies to develop new products. Our failure to manage successfully and coordinate the growth of these acquisitions could have an adverse impact on our business. In addition, we cannot be certain that the businesses or products we acquire will become profitable or remain so, and if our acquisitions are not successful, we may record related asset impairment charges in the future.
We may be required to record a significant charge to earnings if our goodwill or amortizable intangible assets become impaired.
We are required under GAAP to test goodwill for impairment at least annually and to review our amortizable intangible assets for impairment when events or changes in circumstance indicate the carrying value may not be recoverable. Factors that could lead to impairment of goodwill and amortizable intangible assets include significant adverse changes in the business climate and declines in the financial condition of our business. We have had impairments in the past. For instance, in fiscal year 2013 we were required to take impairment charges with respect to RECTIV intangible assets and our intangible assets related to our supply agreement for LAMICTAL. See Note 12 to our consolidated financial statements for the fiscal year ended September 30, 2013. We may suffer impairment in the future and may be required in the future to record charges. Any such charge would adversely impact our financial results.
We may be impacted by unfavorable decisions in proceedings related to future tax assessments.
We operate in a number of jurisdictions and are from time to time subject to audits and reviews by various taxation authorities with respect to income, consumption, payroll and other taxes and remittances, for current as well as past periods. Accordingly, we may become subject to future tax assessments by various authorities. Any amount we might be required to pay in connection with a future tax assessment may have a material adverse effect on our financial position, cash flows or overall results of operations. There is a possibility of a material adverse effect on the results of operations of the period in which the matter is ultimately resolved, if it is resolved unfavorably, or in the period in which an unfavorable outcome becomes probable and reasonably estimable.
Taxing authorities could reallocate our taxable income among our subsidiaries, which could increase our consolidated tax liability and adversely affect our financial condition, results of operations and cash flows.
We conduct operations worldwide through subsidiaries in various tax jurisdictions. Certain aspects of the transactions between our subsidiaries, including our transfer pricing (which is the pricing we use in the transfer of products and services among our subsidiaries) and our intercompany financing arrangements, could be challenged by applicable taxing authorities. While we believe both our transfer pricing and our intercompany financing arrangements are reasonable, either or both could be challenged by the applicable taxing authorities and, following such challenge, our taxable income could be reallocated among our subsidiaries. Such reallocation could both increase our consolidated tax liability and adversely affect our financial condition, results of operations and cash flows.
We are currently unable to accurately predict what our short-term and long-term effective tax rates will be in the future.
We are subject to taxes in the United States and the various other jurisdictions in which we operate, and will become subject to taxes in additional jurisdictions. Significant judgment is required in determining our worldwide provision for taxes and, in the ordinary course of business, there are many transactions and calculations where the ultimate tax determination is uncertain. Our effective tax rates
27
Table of Contents
could be adversely affected by changes in the mix of earnings (losses) in countries with differing statutory tax rates, changes in the valuation of deferred tax assets and liabilities or changes in tax laws, as well as other factors. Our judgments may be subject to audits or reviews by local tax authorities in each of these jurisdictions, which could adversely affect our tax provisions.
Breaches of our information technology systems could have a material adverse effect on our operations.
We are increasingly dependent on information technology systems and infrastructure. Any significant breakdown, invasion, destruction or interruption of these systems by employees, others with authorized access to our systems, or unauthorized persons could negatively impact operations. There is also a risk that we could experience a business interruption, theft of information or reputational damage as a result of a cyber attack, such as an infiltration of a data center or data leakage of confidential information either internally or at our third-party providers. Cyber attacks are becoming more sophisticated and frequent, and there can be no assurance that our efforts will prevent breakdowns or breaches in our systems that could adversely affect our business.
Risks Related to Regulatory Matters
Pharmaceutical suppliers are subject to U.S. and foreign governmental statutory and regulatory oversight. Failure to comply with such laws and regulations may have a material adverse impact on our business.
Our activities in the development, manufacture, packaging or repackaging of our pharmaceutical products subject us to a wide variety of laws and regulations in the countries in which we conduct business, including those related to pharmaceutical products intended for human use. These regulations normally require extensive clinical trials and other testing in addition to governmental review and final approval before products can be marketed.
The FDA, the EMA, the TPD and other regulatory agencies promulgate regulations and standards, commonly referred to as current Good Clinical Practices, or cGCP, for designing, conducting, monitoring, auditing and reporting the results of clinical trials to ensure that the data and results are accurate and that the rights and welfare of trial participants are adequately protected. The FDA, the EMA and other regulatory agencies enforce cGCP through periodic inspections of trial sponsors, principal investigators and trial sites, CROs and institutional review boards, or IRBs. If our studies fail to comply with applicable cGCP, the clinical data generated in our clinical trials may be deemed unreliable and relevant regulatory agencies may require us to perform additional clinical trials before approving our marketing applications. Noncompliance can also result in civil or criminal sanctions. We rely on third parties, including CROs, to carry out many of our clinical-trial-related activities. Failure of any such third party to comply with cGCP can likewise result in rejection of our clinical trial data or other sanctions.
We also are required to register for permits and/or licenses with, seek approvals from and comply with operating and security standards of the FDA, the U.S. Department of Health and Human Services, or HHS, the TPD, the EMA and various state and provincial boards of pharmacy, state and provincial controlled substance agencies, state and provincial health departments and/or comparable state and provincial agencies, as well as foreign agencies and certain accrediting bodies depending upon the type of operations and location of product distribution, manufacture and sale. Manufacturing facilities must be approved by the FDA and other regulatory bodies before they can be used to manufacture our products. Other regulations prescribe research and development, laboratory, manufacturing, testing and safety procedures for pharmaceutical products.
28
Table of Contents
On October 25, 2013, we received a Warning Letter from the FDA regarding compliance with cGMPs related to our class II medical device called FLUTTER, which had net sales of $2.4 million in fiscal year 2013 and which was manufactured by a third party with whom we have since discontinued our relationship. The Warning Letter followed an FDA inspection which concluded on August 29, 2013. At the conclusion of that inspection, the FDA issued a Form 483 Inspectional Observations, to which we responded in September 2013. We are currently drafting a response to the Warning Letter. We are also working with a new manufacturer to begin manufacturing FLUTTER. While the resolution of this Warning Letter is difficult to predict, we do not currently believe it will result in any material effect on our results of operations.
The cost of complying with governmental regulations can be substantial, particularly because the regulations vary by country and state and may change intermittently. Failure to obtain necessary regulatory approvals, the restriction, suspension or revocation of existing approvals, or any other failure to comply with regulatory requirements might impair our ability to produce and market our products or otherwise have a material negative impact on our business.
Our product candidates may fail in clinical studies, which could have a material adverse effect on our business.
Our product candidates may not be successful in clinical trials. Our ongoing development and clinical studies may be delayed or halted, or additional studies may be necessary, for various reasons, including the following: our product candidates are shown not to be effective; we are unable to demonstrate that a product candidate’s benefits outweigh its risks; we are unable to demonstrate that a product candidate presents an advantage over existing products; we do not comply with requirements concerning the investigational new drug applications, or INDAs, for the protection of the rights and welfare of human subjects; the FDA, the EMA or other applicable regulatory authorities require additional or expanded trials or disagree with the manner in which the results from preclinical studies or clinical trials are interpreted; we experience delays in obtaining, or the inability to obtain or maintain, required approvals from IRBs or other reviewing entities at clinical sites selected for participation in our clinical trials; patients experience unacceptable side effects or die during clinical trials; patients do not enroll in studies at expected rates; a drug is modified during testing; product supplies are delayed or are insufficient to treat the participating patients; our manufacturers or suppliers are non-compliant with any of the FDA’s or other relevant foreign counterparts’ regulations; or the applicable governmental or agency statutory or regulatory authority changes. For example, as described below, with respect to the two phase III clinical trials we have conducted of APT-1026, one met its primary endpoint and the other did not, which has delayed our anticipated timeframe for seeking regulatory approval of APT-1026 in the United States. Likewise, we can provide no assurances that the phase III clinical study for ZENPEP-EU that we currently are conducting or the anticipated U.S. phase III clinical trial for APT-1016 will be completed in the timeframe anticipated, or at all, or that either trial will be determined to be successful upon completion. The failure of these or any other of our product candidates in clinical studies could have a material adverse effect on our business.
We may encounter difficulties in obtaining regulatory approval for our new products or for new indications of existing products, which would have a material adverse effect on our business.
Generally, a product must be approved by regulatory authorities in the jurisdiction in which we intend to market it prior to the commencement of marketing. Requirements for approval can vary widely from jurisdiction to jurisdiction. There may be significant delays in obtaining required clearances from regulatory authorities after applications are filed. There is also no assurance that we will obtain regulatory approvals or that we will not incur significant costs in obtaining or maintaining such regulatory approvals. Even if we do receive regulatory approval for a product, commercial success depends on a variety of factors, some of which are beyond our control, and we can provide no assurance as to the revenue we will realize from our product candidates.
29
Table of Contents
Sales of our products outside the United States and any of our product candidates that are commercialized are subject to the regulatory requirements of each country in which the products are sold. Accordingly, the introduction of our products and product candidates in markets outside the United States will be subject to regulatory clearances in those jurisdictions, although once we obtain regulatory approval from one EU country or by the EMA we may be able to achieve approval in other EU countries through a quicker mutual recognition process. Approval and other regulatory requirements vary by jurisdiction and we may be required to perform additional preclinical or clinical studies even if FDA approval has been obtained. In addition, failures in European preclinical or clinical studies could impact our filings in the United States. Many countries also impose product standards, packaging and labeling requirements and import restrictions on our products. The approval by government authorities outside of the United States is unpredictable and uncertain and can be expensive. Our ability to market our approved products could be substantially limited due to delays in the receipt of, or failure to receive, the necessary approvals or clearances.
Moreover, our product candidates may not be granted the approval status that we seek. Under the U.S. Orphan Drug Act, the FDA may grant orphan drug designation to drugs intended to treat a “rare disease or condition,” which generally is a disease or condition that affects fewer than 200,000 individuals in the United States. If a product that has an orphan drug designation subsequently receives the first FDA approval for the indication for which it has such designation, the product is entitled to orphan drug exclusivity. If a drug obtains orphan drug exclusivity, the FDA may not approve any other applications to market the same drug for the same indication for a period of seven years following marketing approval, except in certain very limited circumstances, such as if the later product is shown to be clinically superior to the orphan product. Legislation similar to the U.S. Orphan Drug Act has been enacted in other countries, including within the EU. We were granted U.S. orphan drug designation in 2010 for use of CANASA in pediatric UC. This provides us with some tax and research benefits, but we will not have exclusivity under the U.S. Orphan Drug Act unless CANASA is given the first FDA approval for pediatric UC. APT-1011 was also designated as an orphan drug in 2011. There can be no assurance that future drugs for which we seek orphan drug status will also be approved as orphan drugs. If other drugs with which our products seek to compete are granted orphan drug exclusivity, this would delay and impede our ability to market and sell our products and would have an adverse impact on our business.
Our products may be subject to postmarketing requirements or to REMS, either of which could materially adversely affect our business.
Even if regulatory approval is obtained, we remain subject to heavy regulatory oversight from the FDA and other agencies. Pharmaceutical suppliers, like us, are required to comply with FDA postmarketing reporting, including adverse drug experience reporting and annual and other reports concerning approved drugs. Failure to comply with these reporting requirements may result in the withdrawal of FDA approval for the approved drug. Certain data reported may result in mandatory postmarketing studies, as discussed below. Post-approval labeling and promotional activities are also subject to continual scrutiny by the regulatory agencies, in particular the FDA, and, in some circumstances, the Federal Trade Commission. FDA enforcement policy prohibits the marketing of approved products for unapproved, or off-label, uses. These regulations and the FDA’s interpretation of them might impair our ability to effectively market our products.
In accordance with expanded post-approval authority gained pursuant to the Food and Drug Administration Amendments Act of 2007, or the FDAAA, the FDA may impose postmarketing requirements that may include additional studies or clinical trials. By imposing such post-approval requirements, the FDA would be seeking to assess a known serious risk related to the use of a drug, to assess signals of serious risk related to the use of the drug, or to identify an unexpected serious risk when available data indicates the potential for a serious risk.
30
Table of Contents
The FDA has mandated various postmarketing requirements and commitments for PEP products, including our PEP products (other than VIOKACE). The postmarketing requirements include long-term observational studies to assess the known serious risk of fibrosing colonopathy, as well as observational studies to evaluate the risk of transmission of selected porcine viruses to patients. For ZENPEP and ULTRESA, those studies are ongoing, with due dates in 2022 for ZENPEP and 2022 and 2016 for ULTRESA. The FDA also required that PEP suppliers develop age-appropriate formulations for certain pediatric sub-populations for the PEP products. As a condition of granting marketing approval of a product, the FDA may also obtain certain postmarketing commitments from a company. For example, with regard to PEP products, including our PEP products, the FDA has requested that PEP suppliers undertake certain postmarketing commitments, including developing assays with increased sensitivity to detect potential viral contamination and revising animal surveillance programs. A number of other chemistry, manufacturing and control commitments are applicable for ZENPEP, ULTRESA and VIOKACE as well, most of which are ongoing or we have met. In some cases we have requested that the FDA extend the deadline for these commitments, but no extension has been granted to date. If we do not complete the postmarketing requirements or clinical studies on a timely basis or if any of the data or information derived from these long-term postmarketing studies or postmarketing commitments indicates that a known safety risk is more prevalent than expected or identifies previously undetected safety risks, such events could have a material adverse effect on the applicable product or class of products, which could adversely affect our business and financial performance.
In addition, under the Pediatric Research Equity Act we are required to conduct postmarketing pediatric clinical trials for both RECTIV and CANASA. We are in discussions with FDA regarding potential amendments to the requirements for these pediatric studies for RECTIV and CANASA in regard to the number and timing of such studies and are awaiting a response from the FDA.
The FDAAA also authorized the FDA to require risk evaluation and mitigation strategies, or REMS, for a product if the FDA believes there is a reason to monitor the safety of the drug in the marketplace. The FDA initially imposed a REMS on ZENPEP that included the creation and distribution of a medication guide to apprise potential patients of specific risks related to taking ZENPEP. This REMS was eliminated in June 2011; however, the medication guide continues to be distributed as part of the approved product labeling outside of any REMS requirement. There can be no assurance that the FDA will not impose a REMS on ZENPEP, or on any of our other products, in the future. If the FDA requires a REMS with respect to any of our products, such a requirement could have a material adverse effect on our business and financial performance.
Our approved products and pipeline products are subject to ongoing regulatory requirements. Failure to comply with these requirements may subject us to civil and criminal liability, penalties, sanctions, additional reporting obligations and exclusion from government-payor programs, including Medicare and Medicaid, any of which could harm our business.
After receipt of initial regulatory approval, each product remains subject to extensive regulatory requirements relating to, among other things, manufacturing, labeling, packaging, adverse event reporting, storage, advertising, promotion, distribution and recordkeeping. For example, any regulatory approval is limited to those specific diseases and indications for which our products are deemed to be safe and effective by the FDA, the TPD, the EMA or other applicable regulatory authorities. In addition to approval required for new formulations, any new indication for an approved product also requires regulatory approval.
Moreover, the FDA and other regulatory agencies strictly regulate the promotional claims that may be made about prescription products. A product may not be marketed for uses that are not approved by the FDA or such other regulatory agencies as reflected in the product’s approved labeling or other prescribing information. Although we have a compliance policy in place to train employees
31
Table of Contents
about the prohibition on improper marketing for off-label uses of our products, there can be no assurance that our employees will comply with such policy or that our policy will be effective in preventing improper marketing for off-label uses of our products. If we are found to have marketed such off-label uses, we may become subject to significant liability. The U.S. federal government has levied large civil and criminal fines against companies for alleged improper promotion and has enjoined several companies from engaging in off-label promotion. The FDA has also requested that companies deemed to be engaged in improper promotion enter into consent decrees or permanent injunctions under which specified promotional conduct is changed or curtailed. Our failure to follow rules and guidelines relating to promotion and advertising could also cause regulatory authorities to delay approval or refuse to approve a product, the suspension or withdrawal of an approved product from the market, recalls, fines, disgorgement of profits, operating restrictions and injunctions, any of which could harm our business.
Regulatory approval of a product also may be conditioned on postmarketing testing or surveillance to monitor product safety or efficacy. These limitations or conditions may be costly or may render the approved product not commercially viable. In addition, clinical experience with a drug after approval may reveal side effects and other problems that were not observed or anticipated during pre-approval clinical trials. This might cause subsequent withdrawal of the product from the market or require reformulation of the drug, additional testing or changes in labeling of the product.
The FDA, the EMA and other regulatory agencies regulate and inspect equipment, facilities, and processes used in the manufacturing of pharmaceutical products prior to approving a product. If, after receiving clearance from regulatory agencies, a company makes a material change in manufacturing equipment, location, or process, additional regulatory review and approval may be required. We also must adhere to cGMPs and product-specific regulations enforced by the FDA following product approval. cGMP regulations include requirements relating to quality control and quality assurance, as well as the corresponding maintenance of records and documentation. The cGMP requirements apply to all stages of the manufacturing process, including the production, processing, sterilization, packaging, labeling, storage and shipment of the drug product. Manufacturers must establish validated systems to ensure that products meet specifications and regulatory standards, and test each product batch or lot prior to its release. The FDA, the EMA and other regulatory agencies also conduct periodic visits to re-inspect equipment, facilities and processes following the initial approval of a product. If, as a result of these inspections, it is determined that our equipment, facilities or processes do not comply with applicable regulations and conditions of product approval, regulatory agencies may seek civil, criminal or administrative sanctions or remedies against us, including the suspension of our manufacturing operations. In April 2010, for example, the manufacturing and control process deficiencies of a third-party manufacturer of the active ingredient for ULTRASE MT and VIOKASE resulted in delay of approval of the new drug applications, or NDAs, for these products beyond the deadline set by FDA regulations for this product class. This required us to cease distribution of these products.
We also are required to comply with the Prescription Drug Marketing Act, or PDMA, which governs the distribution of prescription drug samples to healthcare practitioners, because, as part of our commercialization efforts, we provide physicians with samples. Among other things, the PDMA prohibits the sale, purchase or trade of prescription drug samples of certain products. It also sets out record keeping and other requirements for distributing samples to licensed healthcare providers. If we fail to comply with applicable regulatory requirements, we may be subject to fines, suspension or withdrawal of regulatory approvals, product recalls, seizure of products, significant disbursements, operating restrictions and criminal prosecution.
Our operations may be affected by the Health Insurance Portability and Accountability Act of 1996, or HIPAA, and its implementing regulations, which established uniform standards for certain
32
Table of Contents
“covered entities” (e.g., healthcare providers, health plans and healthcare clearinghouses) governing the conduct of certain electronic healthcare transactions and protecting the security and privacy of protected health information. The American Recovery and Reinvestment Act of 2009, commonly referred to as the economic stimulus package, included the Health Information Technology for Economic and Clinical Health Act, or HITECH, which became effective on February 17, 2010 and expands HIPAA’s privacy and security standards. Among other things, HITECH makes certain HIPAA privacy and security standards directly applicable to “business associates,” including independent contractors of covered entities that receive or obtain protected health information in connection with providing a service on their behalf. HITECH also increased the civil and criminal penalties that may be imposed and gave state attorneys general new authority to file civil actions for damages or injunctions in federal courts to enforce the federal HIPAA laws and seek attorney fees and costs associated with pursuing federal civil actions. Although we believe that we are neither a “covered entity” nor a “business associate” under HIPAA or HITECH, we cannot be assured that regulatory authorities would agree with our assessment. In addition, HIPAA and HITECH may affect our interactions with customers who are covered entities or their business associates and affect our ability to conduct the necessary research studies to obtain and maintain regulatory approval of our products.
Imposition of any of the sanctions described above could have a material adverse effect on our business.
Pharmaceutical companies are subject to reporting, disclosure and marketing obligations under government-payor programs and federal and state fraud and abuse laws. Failure to comply with such requirements may subject us to civil and criminal liability, penalties, sanctions and/or exclusion from government-payor programs.
Pharmaceutical companies are subject to reporting, disclosure and marketing obligations under federal and state laws. In order to receive federal healthcare funding for their products, for example, pharmaceutical suppliers must participate in several federal pricing programs. These programs require reporting of pricing data in order to set payment rates for government-payor programs.
The Medicaid Drug Rebate program requires pharmaceutical manufacturers to report the average manufacturer price, or AMP, the average price paid by wholesalers and retail community pharmacies for a drug, and “best price,” the lowest price paid for a drug by any retailer or other purchaser, including discounts, rebates and the value of free goods provided, on a monthly and/or quarterly basis to the Centers for Medicare and Medicaid Services, or CMS. The Medicaid Drug Rebate program allows the Medicaid program to receive a rebate for each unit of drug dispensed to Medicaid beneficiaries equal to a percentage of the AMP or the difference between the AMP and the best price, whichever is greater. The reported pricing data determines the rebate amount, updated quarterly, that each state Medicaid program is entitled to receive on the state’s quarterly claimed payments of the pharmaceutical supplier’s product.
The Medicare program also requires pharmaceutical suppliers to report quarterly average sales price, or ASP, data to CMS, as a condition of Medicare reimbursement under Medicare Part B. CMS uses the ASP data to determine the appropriate reimbursed rates, updated quarterly, to be paid under Medicare Part B.
The Public Health Service 340B Program, or PHS, a program that limits the price a manufacturer may charge certain federal grantees, federally-qualified health center look-alikes and qualified disproportionate share hospitals known as “covered entities” for covered outpatient drugs. This discount requirement only applies to covered entity purchases of drugs for use in the outpatient setting. The statutorily defined PHS ceiling price, updated quarterly, also relies on pharmaceutical suppliers’ accurate reporting of the AMP. The PHS ceiling price is determined by subtracting the Medicaid unit rebate amount from the AMP.
33
Table of Contents
The Veterans Health Care Act requires manufacturers to make their Covered Drugs readily available for purchase on the Federal Supply Schedule, or FSS, as a condition of federal payment for their products under the Medicaid program. The price paid by the Department of Veteran’s Affairs, or VA, Department of Defense, or DOD, Indian Health Service or Coast Guard may not exceed 76% of the Non-Federal Average Manufacturer Price, or NFAMP, with an additional discount subtracted. The NFAMP, similar to the AMP, is a price that manufacturers must report, in this case to the VA on a quarterly basis. Commercial discounting practices may, by operation of the NFAMP, trigger lower government prices for the agencies listed above. Companies must disclose their commercial pricing practices, and those practices become the basis for negotiation of the government contracts with the VA, DOD, Indian Health Service or Coast Guard. Companies also negotiate a “tracking customer” with these agencies. If during the term of the government contract a company lowers the price at which it offers the reference drug to that commercial tracking customer, it is required to disclose that lowered price and offer it to the FSS covered entities with which it holds contracts. False NFAMPs or failure to report this information may trigger government civil money penalties.
Federal and state laws and regulations also regulate the sales and marketing practices of pharmaceutical manufacturers. Certain federal and state laws, for example, require governmental and public disclosure of interactions between pharmaceutical suppliers and healthcare providers. The federal “sunshine” provisions, enacted in 2010 as part of the comprehensive federal healthcare reform legislation, require pharmaceutical suppliers, among others, to disclose annually to the federal government (for re-disclosure to the public) certain payments made to physicians and certain other healthcare practitioners or to teaching hospitals. State laws also may require disclosure of pharmaceutical pricing information and marketing expenditures. These laws have been recently enacted and modifications to our systems for reporting have been based on interpretations of the regulations. If it is determined that these interpretations are incorrect, our reporting may be deficient.
Compliance with these obligations is complex, and requires the collection and analysis of large quantities of data, as well as timely and accurate reporting pursuant to federal and state programs. This process could be impacted by systems failures, inadvertent errors in compiling or interpreting data or intentional misreporting by employees, which could result in inaccurate or delayed reports. Pharmaceutical companies are increasingly subject to federal and state criminal and civil investigations and liability in connection with the reporting of prices for pharmaceutical products reimbursed under federal and state healthcare programs. Private litigants also have brought actions under federal and state false claims acts and other fraud and abuse laws alleging violations of price reporting that led to inflated reimbursement. Failure to comply with the federal and state reporting, disclosure and marketing obligations may subject us to criminal and/or civil liability, penalties, sanctions, additional reporting obligations and/or exclusion from government-payor programs. Even unsubstantiated allegations of non-compliance with these laws may cause us to incur significant legal fees, reputational harm and damage to our business.
Our relationships with customers and payors are subject to fraud and abuse laws and regulations, which could expose us to criminal sanctions, civil penalties, contractual damages, exclusion from government-payor programs, reputational harm and diminished profits and future earnings.
Healthcare providers, physicians and others play a primary role in the recommendation and prescription of our products. Our arrangements with payors and customers may expose us to broadly applicable fraud and abuse and other healthcare laws and regulations that may constrain the business or financial arrangements and relationships through which we market, sell and distribute our products. Violations of fraud and abuse laws may be punishable by criminal or civil sanctions, including fines and civil monetary penalties and/or exclusion from government-payor programs. Federal and state authorities are paying increased attention to enforcement of these laws within the pharmaceutical
34
Table of Contents
industry and private individuals have been active in alleging violations of the laws and bringing suits on behalf of the government under the false claims act as discussed below. If we were subject to allegations concerning, or were convicted of violating, these laws, our business, including our reputation, could be harmed. Applicable U.S. federal statutes, include, but are not limited to, the following statutes:
| Ÿ | The federal Anti-Kickback Statute, which prohibits, among other things, persons from knowingly and willfully soliciting, offering, receiving or providing remuneration, directly or indirectly, in cash or in kind, to induce or reward either the referral of an individual for, or the purchase, order or recommendation of, any good or service for which payment may be made under government-payor programs. |
| Ÿ | The federal False Claims Act, which imposes criminal and civil penalties against individuals or entities for knowingly presenting, or causing to be presented, to the federal government, claims for payment that are false or fraudulent or making a false statement to avoid, decrease or conceal an obligation to pay money to the federal government. |
| Ÿ | The federal False Statements Statute, which prohibits knowingly and willfully falsifying, concealing or covering up a material fact or making any materially false statement in connection with the delivery of or payment for healthcare benefits, items or services. |
| Ÿ | The federal Prohibition Against Beneficiary Inducements statute, which imposes civil monetary penalties for any offers or transfers of remuneration to any individual eligible for Medicare or Medicaid benefits that is likely to influence the individual to order or receive a Medicare or Medicaid covered services from a particular provider, practitioner or supplier. |
| Ÿ | The Civil Monetary Penalties law, which authorizes the imposition of substantial civil money penalties against an entity, including pharmaceutical suppliers, that engages in activities including (1) knowingly presenting, or causing to be presented, a claim for services not provided as claimed or that is otherwise false or fraudulent in any way; (2) offering or giving remuneration to any beneficiary of a government-payor program likely to influence the receipt of reimbursable items or services; (3) arranging for reimbursable services with an entity that is excluded from participation from a government-payor healthcare program; or (4) knowingly or willfully soliciting or receiving remuneration for a referral of a government-payor program beneficiary. |
| Ÿ | Analogous state laws and regulations, such as state anti-kickback and false claims laws, may apply to sales or marketing arrangements and claims involving healthcare items or services reimbursed by non-governmental payors, including private insurers, and some state laws require pharmaceutical companies to comply with the pharmaceutical industry’s voluntary compliance guidelines and the relevant compliance guidance promulgated by the federal government. |
The scope of these laws is broad and there may not be regulations, guidance or court decisions that definitively interpret these laws and apply them to particular industry practices. This uncertainty in the way such laws will be interpreted increases the risk of violations. In addition, these laws and their interpretations are subject to change.
Compliance with applicable and evolving healthcare laws and regulations is costly, and it is possible that governmental authorities or courts will conclude that our business practices do not comply with current or future statutes, regulations or case law involving applicable fraud and abuse or other healthcare laws and regulations. If our past or present operations, including activities conducted by our sales team or agents, are found to be in violation of any of these laws or any other governmental regulations that may apply to us, we may be subject to significant civil, criminal and
35
Table of Contents
administrative penalties, damages, fines, exclusion from federally funded payor programs, such as Medicare and Medicaid, and the curtailment or restructuring of our operations, any of which could have a material adverse effect on our business.
Changes in laws and regulations could affect our results of operations, financial position or cash flows.
Our future operating results, financial position or cash flows could be adversely affected by changes in laws and regulations, such as (i) changes in the FDA, the TPD or the EMA (or other foreign equivalents) approval processes that may cause delays in, or prevent the approval of, new products; (ii) new laws, regulations and judicial decisions affecting product development, marketing, promotion or the healthcare field generally; (iii) new laws or judicial decisions affecting intellectual property rights; and (iv) changes in the application of tax principles, including tax rates, new tax laws, or revised interpretations of existing tax laws and precedents, which result in a shift of taxable earnings between tax jurisdictions.
We deal with hazardous materials and must comply with environmental health and safety laws and regulations, which can be expensive, restrict how we do business and give rise to significant liabilities.
We are subject to various environmental, health and safety laws and regulations, including those governing air emissions, including greenhouse gases, water and wastewater discharges, noise emissions, the use, management and disposal of hazardous and biological materials and wastes, and the cleanup of contaminated sites. The cost of compliance with these laws and regulations could be significant. In the event of a violation of these laws and regulations, including from accidental contamination or injury, we could be held liable for damages exceeding our available financial resources. We could be subject to monetary fines, penalties or third-party damage claims as a result of violations of such laws and regulations or noncompliance with environmental permits required at our facilities.
As an owner and operator of real property and a generator of hazardous materials and wastes, we also could be subject to environmental cleanup liability, in some cases without regard to fault or whether we were aware of the conditions giving rise to such liability. In addition, we may be subject to liability and may be required to comply with new or existing environmental laws regulating pharmaceuticals in the environment. Environmental laws or regulations, or their interpretation, may become more stringent in the future. If any such future changes to environmental laws and regulations require significant changes in our operations, or if we engage in the development and manufacture of new products or otherwise expand our operations in ways that require new or different environmental controls, we will have to dedicate additional management resources and incur additional expenses to comply with such laws and regulations.
In the event of an accident, applicable authorities may curtail our use of hazardous materials and interrupt our business operations. In addition, with respect to our manufacturing facilities, we may incur substantial costs to comply with environmental laws and regulations and may become subject to the risk of accidental contamination or injury from the use of hazardous materials in our manufacturing process. We cannot eliminate the risk of accidental contamination or discharge and any resultant injury from these materials. Laws and regulations govern the use, manufacture, storage, handling and disposal of hazardous materials. We may face liability for any injury or contamination that results from our use or the use by third parties of these materials, and such liability may exceed our insurance coverage and our total assets. Compliance with environmental laws and regulations may be expensive, and current or future environmental regulations may impair our research, development and production efforts.
36
Table of Contents
We maintain limited insurance coverage for the foregoing types of risks. In the event of environmental discharge, contamination or accident, we may be held liable for any resulting damages, and any such liability could exceed our resources.
Risks Related to Our Industry
Product pricing and reimbursement for government-payor programs are highly regulated and subject to change. Additionally, product pricing and reimbursement for private-payor and government-payor programs are subject to cost control measures. There can be no assurance that current levels of reimbursement for our products will continue in the future. Reductions in the pricing or reimbursement available for our products could have a material adverse effect on our business.
In both domestic and foreign markets, sales of our products depend on the availability and amount of reimbursement by payors, including governments and private health plans. Governments may regulate coverage, reimbursement and/or pricing of our products to control cost or affect utilization of our products. Private health plans may also seek to manage cost and utilization by implementing coverage and reimbursement limitations. Substantial uncertainty exists regarding the reimbursement by payors of newly approved healthcare products. The U.S. and foreign governments regularly consider reform measures that affect healthcare coverage and costs. Such reforms may include changes to the coverage and reimbursement of our products which may have a significant impact on our business.
Government-payor programs
Within the United States
Medicaid is a joint federal and state program that is administered by the states for low income and disabled beneficiaries. Under the Medicaid Drug Rebate Program, we are required to pay a rebate for each unit of product reimbursed by the state Medicaid programs. The amount of the rebate for each product fluctuates. It is set by law as the greater of 23.1% of the AMP or the difference between AMP and the “best price” paid by any commercial customer, with limited exceptions. The rebate amount must be adjusted upward if AMP increases more than inflation, as measured by the Consumer Price Index—Urban. The adjustment can cause the rebate amount to exceed the minimum 23.1% rebate amount. The rebate amount is calculated each quarter based on our report of current AMP and the best price for each of our products to CMS. The requirements for calculating AMP and best price are complex. We are required to report any revisions to AMP or “best price” previously reported within a certain period, which revisions could affect our rebate liability for prior quarters. There can be no assurance that our current levels of rebate liability will continue in the future. In addition, if we fail to provide timely information or we are found to have knowingly submitted false information to the government, we may be subject to criminal and civil liability as well as other sanctions and penalties.
Additionally, each state sets its own payment methodology for its Medicaid program, with some guidance and requirements from CMS. As a result, reimbursement under Medicaid is governed by myriad state regulations, which may conflict with regulations in other states. We may fail to comply with the unique state-specific requirements for reimbursement in certain markets, which may lead to potential liability, sanctions or exclusion from that state’s Medicaid program. These state reimbursement regulations are subject to change, which may also affect our ability to seek reimbursement for our products.
Medicare is a federal program that is administered by the federal government and covers individuals age 65 and over, as well as those with certain disabilities. Medicare Part B generally covers
37
Table of Contents
drugs that must be administered by physicians or other healthcare practitioners, are provided in connection with certain durable medical equipment or are certain oral anti-cancer drugs or oral immunosuppressive drugs. Medicare Part B pays for such drugs under a payment methodology based on the ASP of the drugs. Suppliers, including us, are required to provide ASP information to CMS on a quarterly basis. This information is used to calculate Medicare payment rates. The current payment rate for Medicare Part B drugs is ASP plus 6% outside the hospital outpatient setting and ASP plus 4% for most drugs in the hospital outpatient setting. The Medicare payment rate is subject to periodic adjustment. CMS also has the statutory authority to adjust payment rates for specific drugs outside the hospital outpatient setting based on a comparison of ASP payment rates to widely available market prices or to AMP, which could decrease Medicare payment rates. There can be no assurance that our current Medicare Part B reimbursement will remain at its current levels. In addition, if a pharmaceutical supplier, like us, is found to have made a misrepresentation in the reporting of ASP, it may be subject to criminal and civil liability, as well as other sanctions and penalties.
Medicare Part D provides coverage to enrolled Medicare patients for self-administered drugs, i.e., drugs that do not need to be injected or otherwise administered by a physician. Medicare Part D is administered by private prescription drug plans approved by the U.S. government and each drug plan establishes its own Medicare Part D formulary for prescription drug coverage and pricing, which the drug plan may modify from time to time. The prescription drug plans negotiate pricing with manufacturers and may condition formulary placement on the availability of manufacturer discounts. In addition, beginning in 2011, the new law requires drug manufacturers to provide a 50% discount to Medicare beneficiaries for any covered prescription drugs purchased during a Medicare Part D coverage gap (i.e., the “donut hole”), which rose to 52.5% in 2013. There can be no assurance that our current levels of Medicare Part D reimbursement will continue in the future.
Our products are subject to discounted pricing when purchased by federal agencies via the FSS. FSS participation is required for our products to be covered and reimbursed by the VA, DOD, Coast Guard and PHS. Coverage under Medicaid, the Medicare Part B program and the PHS pharmaceutical pricing program is also conditioned upon FSS participation. FSS pricing is negotiated periodically. FSS pricing is intended not to exceed the price that we charge our most-favored non-federal customer for a product. Prices for drugs purchased by the VA, DOD (including drugs purchased by military personnel and dependents through the DOD’s healthcare program for military personnel and their dependents, commonly known as the TriCare retail pharmacy program), Coast Guard and PHS are subject to a cap on pricing equal to 76% of the non-federal average manufacturer price, or non-FAMP. An additional discount applies if non-FAMP increases more than inflation, as measured by the Consumer Price Index—Urban. There can be no assurance that our current levels of FSS pricing will continue in the future. In addition, if pharmaceutical suppliers like us fail to provide timely information or are found to have knowingly submitted false information to the government, we may be subject to civil and criminal liability, as well as other sanctions and penalties.
Pharmaceutical suppliers also are required to provide discounts to certain purchasers under the PHS pharmaceutical pricing program as a condition of maintaining coverage of our products under the Medicaid Drug Rebate Program and Medicare Part B. Purchasers eligible for discounts include hospitals that serve a disproportionate share of financially needy patients, community health clinics and other entities that receive health services grants from the PHS. There can be no assurance that the current discount levels will continue in the future or that such discounts will not be required to be extended to other healthcare entities.
Outside the United States
Outside the United States, the EU represents our major market. Within the EU, our products are paid for by a variety of payors, with governments being the primary source of payment. Governments
38
Table of Contents
may determine or influence coverage of products. Governments may also set prices or otherwise regulate pricing. Negotiating prices with governmental authorities can delay commercialization of our products. Governments may use a variety of cost-containment measures, including price cuts, mandatory rebates, value-based pricing, and reference pricing (i.e., referencing prices in other countries and using those reference prices to set a price). Recent budgetary pressures in many EU countries are causing governments to consider or to implement various cost-containment measures, such as price freezes, additional price cuts and rebates. If budget pressures continue, governments may implement additional cost-containment measures.
Cost control initiatives regarding product pricing and reimbursement
Our ability to successfully commercialize our products also depends on whether appropriate reimbursement levels for the cost of the products and related treatments are obtained from private health insurers and other organizations, such as PBMs, managed-care organizations, or MCOs, and government formularies. Payors continue to try to contain or reduce the costs of healthcare through coverage restrictions and price controls, as well as increasingly restrictive benefit designs, including greater consumer out-of-pocket cost sharing. Significant uncertainty exists as to the reimbursement status of newly approved healthcare products and payors are increasingly challenging the prices charged for such products, especially those that do not come to the market with a distinct and proven advantage over the current standard of care. As a result, we may find it more difficult to raise prices for our products than we have in the past. If the reimbursement we receive for any of our current or future products or product candidates is inadequate in light of its development and other costs, our ability to realize profits from the affected product or product candidate would be limited and may cause us to reduce the price of our products, which would further reduce our margins.
MCOs and other private payors in the United States are increasingly relying on utilization management and payment or reimbursement reductions to contain costs, and consolidation among MCOs has increased the negotiating power of these entities. These payors may require pre-approval for branded products when generic alternatives are available or that a patient first fail on one or more generic products before accessing a branded medicine. MCOs and government-sponsored healthcare systems also seek to control their costs by developing formularies to encourage plan beneficiaries to use generics first, followed by preferred products for which the plans have negotiated favorable terms. Exclusion of a product from a formulary, or placement of a product on a disfavored formulary tier, can lead to sharply reduced usage in the patient population covered by the applicable MCO or government-sponsored healthcare. If our products are not included in an adequate number of formularies or if adequate reimbursement levels are not provided to support the consumer’s willingness to pay for prescriptions, or if reimbursement policies increasingly favor generic products, our market share and business could be materially and negatively affected. We cannot predict the availability or amount of reimbursement for our product candidates, and current reimbursement policies for marketed products may change at any time.
In other countries, particularly those of the European Economic Area, or the EEA, price constraints imposed by legislation and government authorities are even more restrictive, resulting in lower pricing or reimbursement rates than in the United States. In these countries, pricing negotiations with governmental authorities can take considerable time and delay the commercialization of a product. To obtain reimbursement or pricing approval in some countries, we may be required to conduct a clinical trial to demonstrate comparative effectiveness, including cost-effectiveness, of our product candidate against other available products. If reimbursement of our product is unavailable or limited in scope or amount in these countries, or if pricing is set at unsatisfactory levels, our business could be adversely affected.
Our ability to continue to successfully commercialize our products may be adversely affected if we are unable to secure adequate market access, consumer-friendly out-of-pocket contribution levels
39
Table of Contents
and coverage by and reimbursement from payors. If we are unable to obtain and maintain adequate reimbursement and market access from government health administration authorities, private health insurers and other organizations, our products may be too costly for regular use, negatively affecting our ability to generate revenues. If payors do not provide consumers cost-sensitive coverage and reimbursement for our products, or provide an insufficient level of coverage and reimbursement, our products may be unattractive to consumers in comparison to other branded alternatives. Physicians may not prescribe our products and patients may not fill prescriptions. Restrictions such as pre-approval processes, high co-payment requirements or proof of failure on another type of treatment before covering a particular drug may also constrain the performance of our products. In addition, government and private third-party pricing algorithms may limit future price increases and constrain our ability to create additional revenue. Any of these impediments to successful commercialization of our products could have a material adverse effect on our business.
Reforms to the U.S. healthcare system may adversely affect our business.
The Patient Protection and Affordable Care Act of 2010 and the Health Care and Education Reconciliation Act of 2011, known together as the Affordable Care Act, enacted in the United States in March 2011 contain several provisions that could impact our business, including (1) an increase in the minimum Medicaid rebate to States participating in the Medicaid program on our branded prescription drugs (from 15.6% to 23.1%) (effective January 1, 2010); (2) the extension of the Medicaid rebate to MCOs that dispense drugs to Medicaid beneficiaries; (3) the expansion of the 340B Public Health Service Act drug pricing program, which provides outpatient drugs at reduced rates, to include certain children’s hospitals, free standing cancer hospitals, critical access hospitals and rural referral centers; (4) the state-based option of the expansion of Medicaid in 2014 to families with incomes up to 133% of U.S. federal poverty levels; and (5) the creation of the individual mandate pursuant to which each U.S. citizen will be required to purchase insurance effective January 1, 2014, and may do so via federally subsidized programs like the healthcare marketplaces, or the exchanges.
The law also requires drug manufacturers to provide a 50% discount to Medicare beneficiaries for any covered prescription drugs purchased during a Medicare Part D coverage gap (commonly referred to as the “donut hole”) and provides for a fee to be assessed on all branded prescription drug manufacturers and importers. This fee will be calculated based upon each organization’s percentage share of total branded prescription drug sales to U.S. government-payor programs (such as Medicare Parts B and D, Medicaid, the Department of Veterans Affairs, the DOD and the TriCare retail pharmacy program) made during the previous year. The aggregated industry-wide fee is expected to total $28 billion through 2019, ranging from $2.5 billion to $4.1 billion annually. The U.S. Internal Revenue Service, or the IRS, has issued guidance for calculating preliminary fees, but there is still uncertainty as to final implementation, because the IRS has requested public comment and may make changes in response. Effective March 31, 2013, pharmaceutical, medical device, biological, and medical supply manufacturers were required to report to the federal government the payments they make to physicians and teaching hospitals, and physician ownership interests in those entities. The law also provides for the creation of an abbreviated regulatory pathway for FDA approval of biosimilars and interchangeable biosimilar products. These and future reforms could negatively impact our financial performance. Based on the fact that some large states have not fully submitted their Managed Medicaid claims, it is possible that we could have changes to our estimates of the impact of health reform based on additional information received from the states, and such amounts could be material to our financial statements.
40
Table of Contents
Risks Related to Intellectual Property
Our intellectual property rights might not afford us with meaningful protection, and certain of our products do not have patent protection at all.
We have limited patent protection for certain products, such as CANASA, and no patent protection for other products, such as ULTRESA, VIOKACE or CARAFATE. The other intellectual property rights protecting our products, such as trade secrets, might not afford us with meaningful protection from generic and other competition. The laws and regulations of certain foreign countries do not protect intellectual property rights to the same extent as those of the United States, which may render our protection and enforcement of such rights difficult or impossible in such foreign jurisdictions. In addition, because our strategy is to in-license or acquire pharmaceutical products that typically have been discovered and initially researched by others, future products might have limited or no remaining patent protection due to the time elapsed since their discovery. Competitors could also design around any of our intellectual property or otherwise design competitive products that do not infringe our intellectual property. For additional information on our products, see “Business–Our Products.”
We may not be able to protect or successfully enforce our intellectual property, and are currently engaged in patent litigation (especially as relates to ANDAs filed by potential competitors seeking to market generic versions of certain of our products).
Our continued success will depend, in part, on our ability to obtain, protect and maintain intellectual property rights. To protect our intellectual property, we have historically relied on trademarks, trade secrets, patents, know-how, technological advances and other proprietary information. We have filed and/or licensed patent applications related to certain of our products (including with respect to certain co-development products and product candidates), but such applications may fail to be granted, or, even if granted, may be challenged or invalidated. Additionally, patent applications in the United States and most other countries are confidential for a period of time until they are published, and publication of discoveries in scientific or patent literature typically lags behind actual discoveries by several months or more. As a result, we cannot be certain that we were the first to conceive inventions covered by our patents and pending patent applications or that we were the first to file patent applications for inventions covered by our patents. Thus, there is no guarantee that we will be granted patent protection. Competitors could also design around any of our intellectual property or otherwise design competitive products that do not infringe our intellectual property.
We own a number of registered trademarks and trademark applications. However, our trademark applications may not be granted, our trademarks could become generic, or the degree of our trademark protection could be limited such that competitors may adopt similar names, impeding our ability to build brand identity and leading to customer confusion and adversely affecting sales or profitability. Moreover, the ability to protect and enforce such trademarks can vary, especially depending on the jurisdiction.
We seek to protect our trade secrets, technological advances and proprietary know-how, in part, through confidentiality agreements with employees, consultants, vendors and suppliers prohibiting them from taking proprietary information and technology or from using or disclosing proprietary information to third parties except in specified circumstances. However, confidentiality agreements may be breached despite all precautions taken, and we may not have adequate remedies for any breach. Third parties may gain access to our proprietary information or may independently develop substantially equivalent proprietary information. Our inability to protect and maintain intellectual property rights in our products may impair our competitive position and adversely affect our sales and growth.
41
Table of Contents
The strength of patents and other intellectual property rights in the pharmaceutical industry involves complex legal and scientific questions and can be uncertain. Litigation or patent interference proceedings, either of which could result in substantial cost to us, might be necessary to defend any patents to which we have rights and our other proprietary rights or to determine the scope and validity of other parties’ proprietary rights. Furthermore, because of the substantial amount of discovery required in connection with intellectual property litigation, there is a risk that some of our confidential information could be compromised by disclosure during any such litigation. The defense of patent and intellectual property claims is both costly and time consuming, even if the outcome is favorable. If a third party is able to demonstrate that it is not infringing our patents or that our patents are invalid, then we may not be able to stop them (or other third parties) from competing with us or launching competitive products. Any adverse outcome could result in the narrowing of our intellectual property rights (including a ruling that a patent of ours is not valid or is unenforceable).
We are currently involved (and expect to continue to be involved from time to time) in patent litigation relating to ANDAs filed by potential competitors seeking to market generic versions of our products. For example, in July 2013, in response to notice letters regarding the filings of ANDAs by Mylan Pharmaceuticals, Inc. and Mylan Inc., or, collectively, Mylan, as well as Sandoz Inc., or Sandoz, seeking approval to market a generic version of CANASA, we filed patent infringement lawsuits alleging infringement of certain of our patents and seeking, among other things, injunctive relief. Mylan filed its Answer and Counterclaims in August 2013 and Sandoz filed its Answer and Counterclaims in September 2013, in each case contending that our patents are invalid or not infringed. We believe the ANDAs were filed before the patents covering CANASA were listed in the Orange Book, which generally means that we are not entitled to the 30-month stay of the approval of these ANDAs provided for by the Hatch-Waxman Act. While we intend to vigorously defend these and other patents and pursue our legal rights, we can offer no assurance as to when the pending or any future litigation will be decided, whether such lawsuits will be successful or that a generic equivalent of one or more of our products will not be approved and enter the market. An adverse outcome in such patent litigation could materially and adversely affect our revenues. For a description of the ANDA process, see “Business—Government Regulation—U.S. Regulations,” and for a fuller description of the ANDA litigation in which we are involved at the present time, see “Business—Legal Proceedings.”
We rely on the intellectual property and development efforts of others.
The proprietary rights in certain of our products, such as RECTIV, and in certain know-how related to certain of our products, such as APT-1016, are held by third parties, from whom we license rights relating to the use, manufacture or sale of products. Such rights may have limited duration, increasing the likelihood of potential competition using similar technology. For example, the patents relevant to RECTIV, which we license under the agreement with Strakan International S.A.R.L. and Prostrakan Inc., will expire in 2014. We also enter into development agreements, including related licensing arrangements, with third parties for a variety of purposes, including lifecycle management and creation of potential new products. We cannot guarantee the successful outcome of such efforts, nor that they will result in any intellectual property rights or products that inure to our benefit. In connection with licenses and development agreements with third parties, we may agree (and have agreed) to pay royalties or other forms of compensation, for example, on existing or potential products, which can impact the profitability of our products or operations.
Third-party licensors may breach or otherwise fail to perform their obligations. Furthermore, third-party licensors may claim that we have breached our agreement or otherwise attempt to terminate their license agreements with us. Challenges to such third parties’ intellectual property rights may be brought against us directly or against the licensor, and we cannot guarantee that such third-party intellectual property rights provide us with meaningful protection. The expiration of patents we license may further enable third parties to offer products that are competitive with ours. Further, we cannot
42
Table of Contents
guarantee that future third party intellectual property rights that we may need or that may be useful will be available to us for license or, even if they are, that the terms of such license will be financially and commercially viable.
Litigation or third-party claims of intellectual property infringement could require substantial time and money to resolve. Unfavorable outcomes to these proceedings could limit our intellectual property rights and materially restrict our ability to develop, make or sell products.
Our commercial success depends upon our ability to develop and market products without infringing the proprietary rights of third parties. As the pharmaceutical industry expands and more patents are issued, the risk increases that our products or product candidates may give rise to claims of infringement of the patent rights of others. Third-party patents (now or in the future) may not only cover our products, but may also cover the materials or methods of treatment related to our products, and third parties may make allegations of infringement, regardless of merit. Because patent applications can take many years to issue, there may be currently pending applications that may later result in issued patents that our products may infringe. We cannot provide any assurances that our products or activities, or those of our licensors, will not infringe patents, trademarks or other intellectual property owned by third parties or that our patent, trademark or other proprietary rights related to our products do not conflict with the current or future intellectual property rights of others. From time to time we may be (and have been) notified by third parties that consider their patents, trademarks or other intellectual property infringed by, or otherwise relevant to, our products.
In addition, we may from time to time have access to confidential or proprietary information of third parties that could bring a claim against us asserting that we have misappropriated their information or other technology (which, although not patented, may be protected as trade secret) and that we have improperly incorporated that technology into our products. Some of our employees may have been employed by other pharmaceutical or biotechnology companies that may allege misappropriation of their trade secrets by these individuals, irrespective of the steps that we may take to prevent such violations.
If a lawsuit is commenced against us with respect to any alleged intellectual property infringement, the uncertainties inherent in such litigation make the outcome difficult to predict, and the costs that we may incur as a result may have an adverse effect on our profitability. Such litigation would involve significant expense and would be a substantial diversion of the efforts of our scientific and management teams. During the course of any intellectual property litigation, there may be public announcements regarding claims and defenses, and regarding the results of hearings, motions and other interim proceedings or developments in the litigation. If securities analysts or investors perceive these announcements as negative, the market price of the secured notes or any other securities that we may issue from time to time may decline.
Any such lawsuit that results in an adverse determination may result in the award of monetary damages to the intellectual property holder and payment by us of any such damages. Such adverse determination could also result in an injunction prohibiting all of our business activities that infringe the intellectual property, or may require us to obtain licenses from third parties on terms that may not be commercially acceptable to us, which would, in each case, adversely affect our profitability and our business. If so, we may attempt to redesign our processes, products or technologies so that they do not infringe, but that might not be possible. If we cannot obtain a necessary or desirable license, cannot obtain such a license on terms that we consider to be acceptable or cannot redesign our products or processes to avoid potential patent or other intellectual property infringement, then we may be restricted or prevented from developing and commercializing our products and our business may be harmed.
43
Table of Contents
Risks Related to General Economic and Financial Conditions
Currency exchange rate fluctuations may have a negative effect on our financial condition.
We operate internationally, but a majority of our revenue and expense activities, including our debt service obligations and capital expenditures, are denominated in U.S. dollars. The other currencies in which we engage in significant transactions are Canadian dollars and euros. As a consequence, we are exposed to currency fluctuations from purchases of goods, services and equipment and investments in other countries, and funding denominated in the currencies of other countries. In particular, we are exposed to the fluctuations in the exchange rate between the U.S. dollar, the euro and the Canadian dollar. During fiscal years 2013, 2012 and 2011, 15.2%, 17.8% and 20.3% of our revenues were denominated in euros, respectively, and 5.1%, 5.9% and 7.9% of our revenues were denominated in Canadian dollars, respectively, while the remainder were denominated in U.S. dollars.
Fluctuations in currency exchange rates may affect the results of our operations and the value of our assets and revenues, and increase our liabilities and costs, which in turn may adversely affect reported earnings and the comparability of period-to-period results of operations. We experienced an insignificant foreign exchange effect on revenue in fiscal year 2013. Changes in currency exchange rates may affect the relative prices at which we and our competitors sell products in the same market. Changes in the value of the relevant currencies also may affect the cost of goods, services and equipment required in our operations.
In addition, due to the constantly changing currency exposures and the potential substantial volatility of currency exchange rates, we cannot predict the effect of exchange rate fluctuations on our future results and, because we do not currently hedge fully against all currency risks and fluctuations between the U.S. dollar and the Canadian dollar and euro, such fluctuations may result in currency exchange rate losses. Fluctuations in exchange rates could result in our realizing a lower profit margin on sales of our product candidates than we anticipate at the time of entering into commercial agreements. Adverse movements in exchange rates could have a material adverse effect on our financial condition and results of operations.
A 1% change in the value of foreign currencies in which we had sales, income or expense in 2013, as compared to the U.S. dollar, would have increased or decreased the translation of foreign sales by $1.4 million and income by $0.8 million, respectively.
44
Table of Contents
Risks Related to Our Indebtedness
Our substantial level of indebtedness could adversely affect our ability to raise additional capital to fund our operations, limit our ability to react to changes in the economy or our industry, expose us to interest rate risk to the extent of our variable rate debt and prevent us from meeting obligations on our indebtedness.
We have a substantial amount of indebtedness. As of September 30, 2013, as adjusted to reflect the Refinancing and the application of the proceeds from this offering, our total indebtedness was $ million (excluding capital lease obligations). Certain of our subsidiaries have an additional $150.0 million of borrowing capacity available under the senior secured revolving credit facility (as defined below). In addition, certain of our subsidiaries have the right to request up to (a) $100.0 million of additional commitments plus (b) an unlimited amount at any time, subject to compliance on a pro forma basis with a senior secured first lien net leverage ratio of no greater than 3.50:1.00, in each case under the senior secured credit facilities. The following chart shows our level of indebtedness under our senior secured credit facilities as of September 30, 2013, as adjusted to reflect the Refinancing and the application of net proceeds from this offering.
| As of September 30, 2013 | ||||
| As Adjusted | ||||
| (in millions of U.S. dollars) | ||||
| (unaudited) | ||||
Debt: | ||||
Senior secured term loan facility | $ | |||
Senior secured revolving credit facility | ||||
|
| |||
Total: | $ | |||
In addition, we have significant other commitments, including milestone and royalty payments. As of September 30, 2013, pro forma to reflect the Refinancing, we had outstanding approximately $ million in aggregate principal amount of indebtedness under the senior secured credit facilities that would bear interest at a floating rate. Although we may enter into interest rate swap agreements, we are exposed to interest rate increases on the floating portion of the senior secured credit facilities that are not covered by interest rate swaps.
Our substantial level of indebtedness could adversely affect our financial condition and increases the possibility that we may be unable to generate cash sufficient to pay, when due, the principal of, interest on or other amounts due in respect of our indebtedness. Our substantial indebtedness, combined with our other existing and any future financial obligations and contractual commitments, could have important consequences. For example, it could:
| Ÿ | make it more difficult for us to satisfy our obligations with respect to our indebtedness, and any failure to comply with the obligations under any of our debt instruments, including restrictive covenants, could result in an event of default under the agreements governing such indebtedness; |
| Ÿ | require us to dedicate a substantial portion of our cash flow from operations to payments on our indebtedness, thereby reducing funds available for working capital, capital expenditures, acquisitions, selling and marketing efforts, research and development and other purposes; |
| Ÿ | increase our vulnerability to adverse economic and industry conditions, which could place us at a competitive disadvantage compared to our competitors that have relatively less indebtedness; |
| Ÿ | cause us to incur substantial fees from time to time in connection with debt amendments or refinancings; |
45
Table of Contents
| Ÿ | increase our exposure to rising interest rates because a portion of our borrowings is at variable interest rates; |
| Ÿ | limit our flexibility in planning for, or reacting to, changes in our business and the industries in which we operate; and |
| Ÿ | limit our ability to borrow additional funds, or to dispose of assets to raise funds, if needed, for working capital, capital expenditures, acquisitions, selling and marketing efforts, research and development and other corporate purposes. |
Despite our level of indebtedness, we are able to incur more debt and undertake additional obligations. Incurring such debt or undertaking such additional obligations could further exacerbate the risks our indebtedness poses to our financial condition.
We, including our subsidiaries, may be able to incur significant additional indebtedness in the future. Although the credit agreement governing the senior secured credit facilities contains restrictions on the incurrence of additional indebtedness, these restrictions are subject to a number of significant qualifications and exceptions, and any indebtedness incurred in compliance with these restrictions could be substantial. These restrictions also will not prevent us from incurring obligations that do not constitute indebtedness, may be waived by certain votes of debt holders and, if we refinance existing indebtedness, such refinancing indebtedness may contain fewer restrictions on our activities. Further, Aptalis Holdings is not a party to the credit agreement governing the senior secured credit facilities and is not subject to these restrictions. To the extent new debt is added to our and our subsidiaries’ currently anticipated debt levels, the related risks that we and our subsidiaries face could intensify.
While the credit agreement governing the senior secured credit facilities also contains restrictions on making certain loans and investments, these restrictions are subject to a number of qualifications and exceptions, and the investments incurred in compliance with these restrictions could be substantial.
Restrictions imposed in the senior secured credit facilities and our other outstanding indebtedness may limit our ability to operate our business and to finance our future operations or capital needs or to engage in other business activities.
The terms of the senior secured credit facilities restrict Aptalis Pharma and its restricted subsidiaries from engaging in specified types of transactions. These covenants restrict the ability of Aptalis Pharma and its restricted subsidiaries, among other things, to:
| Ÿ | incur or guarantee additional indebtedness; |
| Ÿ | pay dividends on their capital stock or redeem, repurchase or retire their capital stock or indebtedness; |
| Ÿ | make investments, loans, advances and acquisitions; |
| Ÿ | make certain optional payments or modify certain debt instruments in respect of subordinated debt; |
| Ÿ | enter into arrangements that restrict their ability to pay dividends or other amounts; |
| Ÿ | engage in transactions with affiliates; |
| Ÿ | sell assets, including capital stock of their subsidiaries; |
| Ÿ | consolidate or merge; and |
| Ÿ | incur or assume certain liens. |
In addition, the credit agreement governing the senior secured revolving credit facility contains a “springing” financial ratio maintenance covenant, based on Aptalis Pharma’s senior secured first lien
46
Table of Contents
net leverage ratio, if there are outstanding borrowings in excess of 25% of the aggregate commitments thereunder (excluding letters of credit to the extent cash collateralized) as of the last day of the applicable test period. The “springing” financial ratio maintenance covenant will not be tested until December 31, 2013. As of December 1, 2013, the senior secured revolving credit facility was undrawn. Our ability to comply with this ratio can be affected by events beyond our control, and we may not be able to satisfy it. Aptalis MidHoldings Inc. is subject to a customary passive “holding company” covenant, subject to certain exceptions (including the issuance of certain debt). See “Description of Certain Indebtedness.”
A breach of any of these covenants could result in a default under the senior secured credit facilities. In the event of any default under the senior secured credit facilities, the applicable lenders could elect to terminate borrowing commitments and declare all borrowings and loans outstanding, together with accrued and unpaid interest and any fees and other obligations, to be due and payable. In addition, or in the alternative, the applicable lenders could exercise their rights under the security documents entered into in connection with the senior secured credit facilities. We have pledged a significant portion of our assets as collateral under the senior secured credit facilities.
If we were unable to repay or otherwise refinance these borrowings and loans when due, the applicable lenders could proceed against the collateral granted to them to secure that indebtedness, which could force us into bankruptcy or liquidation. In the event the applicable lenders accelerate the repayment of our borrowings, we and our subsidiaries may not have sufficient assets to repay that indebtedness. Any acceleration of amounts due under the credit agreement governing the senior secured credit facilities or the exercise by the applicable lenders of their rights under the security documents would likely have a material adverse effect on us.
We may not be able to generate sufficient cash to service all of our indebtedness and may be forced to take other actions to satisfy our obligations under our indebtedness, which may not be successful.
Our ability to make scheduled payments on or to refinance our debt obligations and to fund our planned capital expenditures, acquisitions and other ongoing liquidity needs depends on our financial condition and operating performance, which is subject to prevailing economic and competitive conditions and to certain financial, business and other factors beyond our control. There can be no assurance that we will maintain a level of cash flows from operating activities or that future borrowings will be available to us under the senior secured credit facilities or otherwise in an amount sufficient to permit us to pay the principal, premium, if any, and interest on our indebtedness. For fiscal year 2013, on an as adjusted basis after giving effect to the Refinancing and the offering and the application of the proceeds therefrom our interest expense was $ million.
If our cash flows and capital resources are insufficient to fund our debt service obligations, we may be forced to reduce or delay investments and capital expenditures, or to sell assets, seek additional capital or restructure or refinance our indebtedness. Our ability to restructure or refinance our debt will depend on the condition of the capital markets and our financial condition at such time. Any refinancing of our debt could be at higher interest rates and may require us to comply with more onerous covenants, which could further restrict our business operations. The terms of existing or future debt instruments may restrict us from adopting some of these alternatives. In addition, any failure to make payments of interest and principal on our outstanding indebtedness on a timely basis would likely result in a reduction of our credit rating, which could harm our ability to incur additional indebtedness. In the absence of such operating results and resources, we could face substantial liquidity problems and might be required to dispose of material assets or operations to meet our debt service and other obligations. The senior secured credit facilities restrict the ability of Aptalis MidHoldings Inc., Aptalis Pharma and its restricted subsidiaries to dispose of assets and use the proceeds from the disposition. We may not be able to
47
Table of Contents
consummate those dispositions or to obtain the proceeds that we could realize from them and these proceeds may not be adequate to meet any debt service obligations then due. These alternative measures may not be successful and may not permit us to meet our debt service obligations.
A ratings downgrade of Aptalis Pharma or other negative action by a ratings organization could adversely affect the trading price of the shares of our common stock.
Credit rating agencies continually revise their ratings for companies they follow. The condition of the financial and credit markets and prevailing interest rates have fluctuated in the past and are likely to fluctuate in the future. In addition, developments in our business and operations could lead to a ratings downgrade for Aptalis Pharma. For instance, Aptalis Pharma’s senior secured bank debt has been downgraded in the past, including by Moody’s and Standard & Poor’s in April 2012. Any such fluctuation in the rating of Aptalis Pharma may impact its ability to access debt markets in the future or increase its cost of future debt which could have a material adverse effect on the operations and financial condition of Aptalis Pharma and its subsidiaries, which in return may adversely affect the trading price of shares of our common stock.
Risks Relating to Our Common Stock and this Offering
TPG will continue to have significant influence over us after this offering, including control over decisions that require the approval of stockholders, which could limit your ability to influence the outcome of matters submitted to stockholders for a vote.
We are currently controlled, and after this offering is completed will continue to be controlled, by TPG. Upon completion of this offering, the TPG Funds will beneficially own % of our outstanding common stock ( % if the underwriters exercise in full their option to purchase additional shares from us and the selling stockholders). As long as TPG owns or controls at least a majority of our outstanding voting power, it has the ability to exercise substantial control over all corporate actions requiring stockholder approval, irrespective of how our other stockholders may vote, including the election and removal of directors and the size of our board, any amendment of our articles of incorporation or bylaws, the approval of any merger or other significant corporate transaction, including a sale of substantially all of our assets. Even if its ownership falls below 50%, TPG will continue to be able to strongly influence or effectively control our decisions.
Additionally, TPG is in the business of making investments in companies and may acquire and hold interests in businesses that compete directly or indirectly with us. TPG may also pursue acquisition opportunities that may be complementary to our business, and, as a result, those acquisition opportunities may not be available to us.
We are a “controlled company” within the meaning of the NASDAQ rules and, as a result, qualify for, and intend to rely on, exemptions from certain corporate governance requirements. You will not have the same protections afforded to stockholders of companies that are subject to such requirements.
After completion of this offering, TPG will continue to control a majority of the voting power of our outstanding common stock. As a result, we will be a “controlled company” within the meaning of the NASDAQ corporate governance standards. Under these rules, a company of which more than 50% of the voting power for the election of directors is held by an individual, group or another company is a “controlled company” and may elect not to comply with certain corporate governance requirements, including the requirements that, within one year of the date of the listing of our common stock:
| Ÿ | we have a board that is composed of a majority of “independent directors,” as defined under the rules of such exchange; |
48
Table of Contents
| Ÿ | we have a compensation committee that is composed entirely of independent directors; and |
| Ÿ | we have a nominating and corporate governance committee that is composed entirely of independent directors. |
As a result, we may not have a majority of independent directors on our board. In addition, our compensation committee and our nominating and corporate governance committee may not consist entirely of independent directors or be subject to annual performance evaluations. Accordingly, you will not have the same protections afforded to stockholders of companies that are subject to all of the corporate governance requirements of the .
Provisions of our corporate governance documents could make an acquisition of our company more difficult and may prevent attempts by our stockholders to replace or remove our current management, even if beneficial to our stockholders.
In addition to TPG’s beneficial ownership of a controlling percentage of our common stock, our certificate of incorporation and by-laws and the Delaware General Corporation Law, or DGCL, contain provisions that could make it more difficult for a third party to acquire us, even if doing so might be beneficial to our stockholders. These provisions include a classified board of directors and limitations on actions by our stockholders. In addition, our board of directors has the right to issue preferred stock without stockholder approval that could be used to dilute a potential hostile acquiror. As a result, you may lose your ability to sell your stock for a price in excess of the prevailing market price due to these protective measures, and efforts by stockholders to change the direction or management of the company may be unsuccessful. See “Description of Capital Stock.”
We are eligible to be treated as an “emerging growth company,” as defined in the JOBS Act, and we cannot be certain if the reduced disclosure requirements applicable to emerging growth companies will make our common stock less attractive to investors.
We are an “emerging growth company,” as defined in the JOBS Act. For as long as we continue to be an emerging growth company, we may take advantage of exemptions from various reporting requirements that are applicable to other public companies that are not emerging growth companies, including (1) not being required to comply with the auditor attestation requirements of Section 404 of the Sarbanes-Oxley Act of 2002, which we refer to as the Sarbanes-Oxley Act, (2) reduced disclosure obligations regarding executive compensation in this prospectus and our periodic reports and proxy statements and (3) exemptions from the requirements of holding a nonbinding advisory vote on executive compensation and stockholder approval of any golden parachute payments not previously approved. In addition, as an emerging growth company, we are only required to provide two years of audited financial statements and two years of selected financial data in this prospectus. We could be an emerging growth company for up to five years, although circumstances could cause us to lose that status earlier, including if the market value of our common stock held by non-affiliates exceeds $700.0 million as of any March 31 before that time or if we have total annual gross revenue of $1.0 billion or more during any fiscal year before that time, after which, in each case, we would no longer be an emerging growth company as of the following September 30 or, if we issue more than $1.0 billion in non-convertible debt during any three-year period before that time, we would cease to be an emerging growth company immediately.
Under the JOBS Act, emerging growth companies can also delay adopting new or revised accounting standards until such time as those standards apply to private companies. We have irrevocably elected not to avail ourselves of this exemption from new or revised accounting standards and, therefore, will be subject to the same new or revised accounting standards as other public companies that are not emerging growth companies.
49
Table of Contents
If you purchase shares of common stock in this offering, you will suffer immediate and substantial dilution of your investment.
The initial public offering price of our common stock is substantially higher than the net tangible book deficit per share of our common stock. Therefore, if you purchase shares of our common stock in this offering, you will pay a price per share that substantially exceeds our net tangible book deficit per share after this offering. As a result, you will experience immediate dilution of $ per share, representing the difference between our pro forma net tangible book deficit per share after giving effect to this offering and the initial public offering price of $ per share. In addition, purchasers of common stock in this offering will have contributed % of the aggregate price paid by all purchasers of our stock but will own only approximately % of our common stock outstanding after this offering. We also have a large number of outstanding stock options to purchase common stock with exercise prices that are below the estimated initial public offering price of our common stock. To the extent that these options are exercised, you will experience further dilution. See “Dilution” for more detail.
An active, liquid trading market for our common stock may not develop, which may limit your ability to sell your shares.
Prior to this offering, there was no public market for our common stock. We cannot predict the extent to which investor interest in our company will lead to the development of an active trading market for our shares on the NASDAQ or otherwise. The initial public offering price was determined by negotiations between us, the selling stockholders and the representatives of the underwriters and may not be indicative of market prices of our common stock that will prevail in the open market after the offering. A public trading market having the desirable characteristics of depth, liquidity and orderliness depends upon the existence of willing buyers and sellers at any given time, such existence being dependent upon the individual decisions of buyers and sellers over which neither we nor any market maker has control. The failure of an active and liquid trading market to develop and continue would likely have a material adverse effect on the value of our common stock. The market price of our common stock may decline below the initial public offering price, and you may not be able to sell your shares of our common stock at or above the price you paid in this offering, or at all. An inactive market may also impair our ability to raise capital to continue to fund operations by selling shares and may impair our ability to acquire other companies or technologies by using our shares as consideration.
Our results of operations might fluctuate from period to period, and a failure to meet the expectations of investors or the financial community at large could result in a decline in the market price of our stock below the price you pay.
Our quarterly operating results are likely to fluctuate in the future as a publicly traded company. In addition, securities markets worldwide have experienced, and are likely to continue to experience, significant price and volume fluctuations. This market volatility, as well as general economic, market or political conditions, could subject the market price of our shares to wide price fluctuations, regardless of our operating performance. We and the underwriters will negotiate to determine the initial public offering price. You may not be able to resell your shares at or above the initial public offering price, or at all. Our operating results and the trading price of our shares may fluctuate in response to various factors, including
| Ÿ | changing business and economic conditions; |
| Ÿ | actual or anticipated fluctuations in our quarterly financial and operating results; |
| Ÿ | the results of clinical trials of our product candidates and the timing of regulatory reviews and approvals for our pipeline products; |
| Ÿ | our ability to successfully develop or acquire and launch new products and to supply product in amounts sufficient to meet customer demand; |
50
Table of Contents
| Ÿ | inventory levels at our distributors and wholesalers; |
| Ÿ | the size and timing of product orders, which can be affected by customer budgeting and buying patterns; |
| Ÿ | our dependence on a small number of products for the majority of our revenues; |
| Ÿ | introduction of new products or services by us or our competitors; |
| Ÿ | price erosion and customer consolidation; |
| Ÿ | the timing of significant milestone payments to us or that become due to development partners; |
| Ÿ | the timing of operating and other expenses, including costs of acquisitions, development, sales and marketing; |
| Ÿ | issuance of new or changed securities analysts’ reports or recommendations; |
| Ÿ | sales, or anticipated sales, of large blocks of our stock; |
| Ÿ | internal factors, such as changes in business strategies, additions or departures in key personnel and the impact of restructurings; |
| Ÿ | regulatory or political developments; |
| Ÿ | litigation and governmental investigations; and |
| Ÿ | exchange rate fluctuations. |
These and other factors, many of which are beyond our control, may cause our operating results and the market price and demand for our shares to fluctuate substantially. While we believe that operating results for any particular quarter are not necessarily a meaningful indication of future results, fluctuations in our quarterly operating results could limit or prevent investors from readily selling their shares and may otherwise negatively affect the market price and liquidity of our shares. In addition, in the past, when the market price of a stock has been volatile, holders of that stock have sometimes instituted securities class action litigation against the company that issued the stock. If any of our stockholders brought a lawsuit against us, we could incur substantial costs defending the lawsuit. Such a lawsuit could also divert the time and attention of our management from our business, which could significantly harm our profitability and reputation.
A significant portion of our total outstanding shares are restricted from immediate resale but may be sold into the market in the near future. This could cause the market price of our common stock to drop significantly, even if our business is doing well.
Sales of a substantial number of shares of our common stock in the public market could occur at any time. These sales, or the perception in the market that the holders of a large number of shares intend to sell shares, could reduce the market price of our common stock. After this offering, we will have outstanding shares of common stock based on the number of shares outstanding as of September 30, 2013. This includes shares that we are selling in this offering (or shares assuming the underwriters exercise in full their option to purchase additional shares), as well as the shares to be sold by the selling stockholders, all of which may be resold in the public market immediately, and assumes no exercises of outstanding options. We expect that shares of common stock, or if the underwriters exercise in full their option to purchase additional shares, will be subject to a 180-day lock-up period pursuant to agreements executed in connection with this offering. These shares will, however, be able to be resold after the expiration of the lock-up agreement as described in the “Shares Eligible for Future Sale” section of this prospectus. In connection with this offering, we expect to file a registration statement on Form S-8 under the Securities Act to register all of the shares of our common stock subject to outstanding options and other awards issuable pursuant
51
Table of Contents
to our stock incentive plans. These shares can be freely sold in the public market upon issuance, subject to the lock-up agreements described in the “Underwriting” section of this prospectus. As restrictions on resale end, the market price of our stock could decline if the holders of currently restricted shares sell them or are perceived by the market as intending to sell them.
Since we have no current plans to pay regular cash dividends on our common stock following this offering, you may not receive any return on investment unless you sell your common stock for a price greater than that which you paid for it.
Although we have previously made a distribution to our stockholders, we do not anticipate paying any regular cash dividends on our common stock following this offering. Any decision to declare and pay dividends in the future will be made at the discretion of our board and will depend on, among other things, our results of operations, financial condition, cash requirements, contractual restrictions and other factors that our board may deem relevant. In addition, our ability to pay dividends is, and may be, limited by covenants of existing and any future outstanding indebtedness we or our subsidiaries incur, including under the senior secured credit facilities. Therefore, any return on investment in our common stock is solely dependent upon the appreciation of the price of our common stock on the open market, which may not occur. See “Dividend Policy” for more detail.
As a public company, we will become subject to additional laws, regulations and stock exchange listing standards, which will impose additional costs on us and may strain our resources and divert our management’s attention. These factors could also make it more difficult for us to attract and retain executive officers and qualified members of our board of directors.
As a public company, we will incur significant legal, insurance, accounting and other expenses that we did not incur as a private company. In addition, our administrative staff will be required to perform additional tasks. For example, in anticipation of becoming a public company, we will need to adopt additional internal disclosure controls and procedures, retain a transfer agent, adopt an insider trading policy and bear all of the internal and external costs of preparing and distributing periodic public reports in compliance with our obligations under the securities laws. We intend to invest resources to comply with evolving laws, regulations and standards, and this investment will result in increased general and administrative expenses and may divert management’s time and attention from product development activities. If our efforts to comply with new laws, regulations and standards differ from the activities intended by regulatory or governing bodies due to ambiguities related to practice, regulatory authorities may initiate legal proceedings against us and our business may be harmed. In connection with this offering, we are increasing our directors’ and officers’ insurance coverage, which will increase our insurance cost. In the future, it will be more expensive for us to obtain director and officer liability insurance, and we may be required to accept reduced coverage or incur substantially higher costs to obtain coverage.
In addition, in order to comply with the requirements of being a public company, we may need to undertake various actions, including implementing new internal controls and procedures and hiring new accounting or internal audit staff. The Sarbanes-Oxley Act requires that we maintain effective disclosure controls and procedures and internal control over financial reporting. We are continuing to develop and refine our disclosure controls and other procedures that are designed to ensure that information required to be disclosed by us in the reports that we file with the SEC is recorded, processed, summarized and reported within the time periods specified in the SEC’s rules and forms, and that information required to be disclosed in reports under the Securities Exchange Act of 1934, as amended, or the Exchange Act, is accumulated and communicated to our principal executive and financial officers. Any failure to develop or maintain effective controls could adversely affect the results of periodic management evaluations. In the event that we are not able to demonstrate compliance with the Sarbanes-Oxley Act, that our internal control over financial reporting is perceived as inadequate or
52
Table of Contents
that we are unable to produce timely or accurate financial statements, investors may lose confidence in our operating results and the price of our ordinary shares could decline. In addition, if we are unable to continue to meet these requirements, we may not be able to remain listed on .
We are not currently required to comply with the SEC’s rules that implement Section 404 of the Sarbanes-Oxley Act, and are therefore not yet required to make a formal assessment of the effectiveness of our internal control over financial reporting for that purpose. Upon becoming a public company, we will be required to comply with certain of these rules, which will require management to certify financial and other information in our quarterly and annual reports and provide an annual management report on the effectiveness of our internal control over financial reporting commencing with our second annual report. This assessment will need to include the disclosure of any material weaknesses in our internal control over financial reporting identified by our management or our independent registered public accounting firm. We are just beginning the costly and challenging process of implementing the system and processing documentation needed to comply with such requirements. We may not be able to complete our evaluation, testing and any required remediation in a timely fashion.
Our independent registered public accounting firm will not be required to formally attest to the effectiveness of our internal control over financial reporting until the later of our second annual report or the first annual report required to be filed with the SEC following the date we are no longer an “emerging growth company” as defined in the JOBS Act. We cannot assure you that there will not be material weaknesses or significant deficiencies in our internal controls in the future.
If securities or industry analysts do not publish research or reports about our business, if they adversely change their recommendations regarding our shares or if our results of operations do not meet their expectations, our share price and trading volume could decline.
The trading market for our shares will be influenced by the research and reports that industry or securities analysts publish about us or our business. We do not have any control over these analysts. If one or more of these analysts cease coverage of our company or fail to publish reports on us regularly, we could lose visibility in the financial markets, which in turn could cause our share price or trading volume to decline. Moreover, if one or more of the analysts who cover us downgrade our stock, or if our results of operations do not meet their expectations, our share price could decline.
We may need to raise additional capital that may not be available.
Although we do not have any plans to do so in the near term, we may in the future need to raise additional capital. Any potential public offering or private placement may or may not be similar to the transactions that we have completed in the past. Any debt financing may be on terms that, among other things, include conversion features that could result in dilution to our then-existing stockholders and restrict our ability to pay interest and dividends—although we do not intend to pay dividends for the foreseeable future in any event. Any equity financings would result in dilution to our then-existing stockholders. If adequate funds are not available on acceptable terms, or at all, we may be required to curtail significantly or discontinue one or more of our research, drug discovery or development programs, including clinical trials, incur significant cash exit costs or attempt to obtain funds through arrangements with collaborators or others that may require us to relinquish rights to certain of our technologies, drugs or drug candidates. Based on many factors, including general economic conditions, additional financing may not be available on acceptable terms, if at all.
53
Table of Contents
CAUTIONARY NOTE REGARDING FORWARD-LOOKING STATEMENTS
All statements other than statements of historical facts included in this prospectus, including, without limitation, statements regarding our future financial position, business strategy, budgets, projected costs and plans, future industry growth and objectives of management for future operations, are forward-looking statements. In addition, forward-looking statements generally can be identified by the use of forward-looking terminology such as “may,” “will,” “expect,” “intend,” “estimate,” “project,” “forecast,” “anticipate,” “believe” or “continue” or the negative thereof or variations thereon or similar terminology. Important factors that could cause actual results to differ materially from our expectations, or “cautionary statements,” are disclosed under “Risk Factors” and elsewhere in this prospectus.
These forward-looking statements include, among other things, statements about:
| Ÿ | our expectations related to the use of proceeds from this offering; |
| Ÿ | the progress of, timing of and amount of expenses associated with our research, development and commercialization activities; |
| Ÿ | the timing, conduct and success of our clinical studies for our product candidates; |
| Ÿ | our ability to obtain U.S. and foreign regulatory approval for our product candidates and the ability of our product candidates to meet existing or future regulatory standards; |
| Ÿ | our expectations regarding federal, state and foreign regulatory requirements; |
| Ÿ | the therapeutic benefits and effectiveness of our product candidates; |
| Ÿ | the accuracy of our estimates of the size and characteristics of the markets that may be addressed by our product candidates; |
| Ÿ | our ability to manufacture sufficient amounts of our product candidates for clinical studies and products for commercialization activities; |
| Ÿ | our plans with respect to collaborations and licenses related to the development, manufacture or sale of our product candidates; |
| Ÿ | our expectations as to future financial performance, expense levels and liquidity sources; |
| Ÿ | the timing of commercializing our product candidates; |
| Ÿ | our ability to compete with other companies that are or may be developing or selling products that are competitive with our product candidates; |
| Ÿ | anticipated trends and challenges in our potential markets; |
| Ÿ | our ability to attract, retain and motivate key personnel; and |
| Ÿ | other factors discussed elsewhere in this prospectus. |
Any or all of our forward-looking statements in this prospectus may turn out to be inaccurate. We have based these forward-looking statements largely on our current expectations and projections about future events and financial trends that we believe may affect our financial condition, results of operations, business strategy and financial needs. They may be affected by inaccurate assumptions we might make or by known or unknown risks and uncertainties, including the risks, uncertainties and assumptions described in “Risk Factors,” beginning on page 18. In light of these risks, uncertainties and assumptions, the forward-looking events and circumstances discussed in this prospectus may not occur as contemplated, and actual results could differ materially from those anticipated or implied by the forward-looking statements.
54
Table of Contents
You should not rely on these forward-looking statements, which speak only as of the date of this prospectus, in any significant way. Unless required by law, we undertake no obligation to publicly update or revise any forward-looking statements to reflect new information or future events or otherwise. You should, however, review the factors and risks we describe in the reports we will file from time to time with the SEC after the date of this prospectus. See “Where You Can Find More Information.”
55
Table of Contents
MARKET AND OTHER INDUSTRY DATA
Although we are responsible for all of the disclosure contained in this prospectus, we rely on and refer to information regarding the pharmaceutical industry, which has been compiled from market research reports, governmental studies and other publicly available information. Other industry and market data included in this prospectus are from internal analyses based upon data available from known sources or other proprietary research and analysis. We believe this data to be accurate as of the date of this prospectus. However, such data involves risks and uncertainties and is subject to change based on various factors including those discussed in “Risk Factors”. Unless otherwise indicated, all market share information contained in this prospectus is based upon data prepared by IMS Health Ltd., or IMS, and U.S. Department of Health and Human Services, National Institutes of Health. The data provided by IMS that relates to the size of a market in terms of sales was determined based upon the sum of total prescription volume and total non-retail volume multiplied by the weighted average cost.
56
Table of Contents
We expect to receive net proceeds, after deducting estimated offering expenses and underwriting discounts and commissions, of approximately $ million (or approximately $ million if the underwriters exercise their option to purchase additional shares in full), based on an assumed offering price of $ per share (the midpoint of the price range set forth on the cover of this prospectus). We intend to use the net proceeds from this offering to repay approximately $ million of the $1,250 million outstanding under our senior secured credit facilities, and the remainder for working capital and general corporate purposes, which may include repayment of additional indebtedness and the funding of strategic growth opportunities.
The expected use of the net proceeds from this offering represents our intentions based upon our current plans and business conditions, which could change in the future as our plans and business conditions evolve. As a result, our management will have broad discretion in applying the net proceeds of this offering. Although we may use a portion of the net proceeds of this offering for the acquisition or licensing, as the case may be, of product candidates, technologies, compounds, other assets or complementary businesses, we have no current understandings, agreements or commitments to do so.
Pending the use of the proceeds from this offering, we intend to invest the net proceeds in short-term, interest-bearing, investment-grade securities, certificates of deposit or government securities.
Borrowings under the senior secured credit facilities bear interest at a rate per annum equal to, at the Borrowers’ option, either a base rate (subject to a floor of 2.0% in the case of term B loans) or a LIBOR rate (subject to a floor of 1.0% in the case of term B loans), in each case plus an applicable margin. Subject to the floor described in the immediately preceding sentence, the base rate is determined by reference to the highest of (1) the prime rate of Bank of America, N.A., (2) the federal funds effective rate plus 1/2 of 1.0% and (3) the one-month LIBOR rate plus 1.0%. Subject to the floor described in the first sentence of this paragraph, the LIBOR rate is determined by reference to the costs of funds for U.S. dollar deposits for the interest period relevant to such borrowing adjusted for certain additional costs. The applicable margin for borrowings of term B loans under the senior secured term loan facility are equal to 4.00% per annum with respect to base rate borrowings and 5.00% per annum with respect to LIBOR borrowings. The applicable margin on the term B loans are subject to increase pursuant to the senior secured credit facilities in connection with the making of certain refinancing, extended or replacement term loans under the senior secured credit facilities with an all-in yield greater than the applicable all-in yield payable in respect of the applicable loans at such time plus 50 basis points. Further, upon or after the consummation of this offering, so long as Aptalis Pharma’s senior secured net leverage ratio does not exceed 3.25:1.00, the applicable margin with respect to term B loans and revolving loans (otherwise determined in accordance with the above) shall be reduced by 0.50%. We used the proceeds of the term loan under our senior secured credit facilities to make a distribution to our shareholders, holders of our restricted stock and certain holders of options to purchase shares of our common stock and to repay all amounts outstanding under our previously existing credit facility. Our term B loans mature on October 4, 2020.
A $1.00 increase (decrease) in the assumed public offering price of $ , based upon the midpoint of the estimated price range set forth on the cover of this prospectus, would increase (decrease) the net proceeds to us from this offering by $ million, assuming the number of shares we offer, as set forth on the cover page of this prospectus, remains the same and after deducting underwriting discounts and commissions and estimated offering expenses payable by us. A share increase in the number of shares offered by us together with a concomitant $1.00 increase in the assumed initial public offering price of $ per share, the midpoint of the price range set forth on the cover of this prospectus, would increase the net proceeds to us from this offering by $ million after
57
Table of Contents
deducting underwriting discounts and commissions and any estimated offering expenses payable by us. Conversely, a share decrease in the number of shares offered by us together with a concomitant $1.00 decrease in the assumed initial public offering price of $ per share, the midpoint of the price range set forth on the cover of this prospectus, would decrease the net proceeds to us from this offering by $ million after deducting underwriting discounts and commissions and any estimated offering expenses payable by us.
For additional information regarding our liquidity and outstanding indebtedness, see “Management’s Discussion and Analysis of Financial Condition and Results of Operations—Liquidity and Capital Resources.”
We will not receive any proceeds from the sale of shares of common stock by our selling stockholders.
58
Table of Contents
On October 7, 2013, we made a cash distribution of $399.5 million in aggregate to our shareholders, holders of our restricted stock units and certain holders of options to purchase shares of our common stock. We did not pay any other dividends in the past two years. Our board of directors does not currently intend to pay regular dividends on our common stock. However, we expect to reevaluate our dividend policy on a regular basis following this offering and may, subject to compliance with the covenants contained in the senior secured credit facilities and other considerations, determine to pay dividends in the future.
59
Table of Contents
The following table sets forth our cash and cash equivalents and capitalization at September 30, 2013:
| Ÿ | on an actual basis; |
| Ÿ | on an as adjusted basis to give effect to (1) the Recapitalization, (2) the issuance of shares of common stock by us in this offering, after deducting underwriting discounts and commissions and estimated offering expenses, (3) the termination of our management agreements with our Sponsors, and (4) the application of the estimated net proceeds from the offering as described in “Use of Proceeds.” |
You should read this table in conjunction with the information contained in “Use of Proceeds,” “Selected Consolidated Financial and Operating Data” and “Management’s Discussion and Analysis of Financial Condition and Results of Operations,” as well as our consolidated financial statements and the related notes included elsewhere in this prospectus.
| As of September 30, 2013 | ||||||||
| Actual | As Adjusted(3)(4) | |||||||
| (in millions of U.S. dollars) | ||||||||
Cash and cash equivalents | $ | 229.9 | $ | |||||
|
|
|
| |||||
Long-term debt, including current portions: | ||||||||
Senior secured credit facilities: | ||||||||
Prior term loan facility(1) | 921.3 | — | ||||||
Prior revolving credit facility | — | |||||||
Senior secured revolving credit facility | — | |||||||
Senior secured term loan facility(2) | — | |||||||
|
|
|
| |||||
Total debt | 921.3 | |||||||
|
|
|
| |||||
Shareholders’ equity: | ||||||||
Common stock, par value $0.001 per share; 100,000,000 shares authorized and 67,696,126 shares issued and outstanding on an actual basis, shares authorized and shares issued and outstanding on a as adjusted basis | 0.1 | |||||||
Additional paid-in capital | 691.3 | |||||||
Accumulated deficit | (596.7 | ) | ||||||
Accumulated other comprehensive loss | (48.1 | ) | ||||||
|
|
|
| |||||
Total shareholder’s equity | 46.6 | |||||||
|
|
|
| |||||
Total capitalization | $ | 967.9 | $ | |||||
|
|
|
| |||||
| (1) | As presented on the face of our consolidated balance sheet, which is net of unamortized discounts of $5.0 million. |
| (2) | Net of unamortized discounts of $ million. |
| (3) | As adjusted reflects (i) the Recapitalization, including (a) the distribution in aggregate amount of $399.5 million to our shareholders, holders of our restricted stock units and certain holders of options to purchase shares of our common stock on October 7, 2013, (b) the refinancing of our previously existing credit facilities, which were replaced with our senior secured credit facilities providing for senior secured term loans in the amount of $1,250 million and a senior secured revolving credit facility allowing for borrowings of up to $150 million and (c) a write-off of $ million (net of tax of $ million) in unamortized deferred debt issuance costs; (ii) the payment of $ million in connection with the termination of our management agreements with our Sponsors (iii) the offering of shares of common stock by us in this offering, assuming an |
60
Table of Contents
initial public offering price of $ per share, the midpoint of the price range set forth on the cover page of this prospectus, after deducting underwriting discounts and commissions and estimated offering expenses payable by us; and (iv) the application of the estimated proceeds of the offering as described in “Use of Proceeds.” |
| (4) | A $1.00 increase (decrease) in the assumed initial public offering price of $ per share, the midpoint of the price range set forth on the cover of this prospectus, would increase (decrease) the as adjusted amount of each of cash and cash equivalents and total shareholders’ equity by approximately $ million, assuming that the number of shares offered by us, as set forth on the cover of this prospectus, remains the same and after deducting underwriting discounts and commissions and estimated offering expenses payable by us. |
| A share increase in the number of shares offered by us together with a concomitant $1.00 increase in the assumed initial public offering price of $ per share, the midpoint of the price range set forth on the cover of this prospectus, would increase the as adjusted amount of each of cash and cash equivalents and total shareholders’ equity by approximately $ million after deducting underwriting discounts and commissions and any estimated offering expenses payable by us. Conversely, a share decrease in the number of shares offered by us together with a concomitant $1.00 decrease in the assumed initial public offering price of $ per share, the midpoint of the price range set forth on the cover of this prospectus, would decrease the as adjusted amount of each of cash and cash equivalents and total shareholders’ equity by approximately $ million after deducting underwriting discounts and commissions and any estimated offering expenses payable by us. |
61
Table of Contents
If you invest in our common stock, your interest will be diluted immediately to the extent of the difference between the initial public offering price per share of our common stock and the as adjusted net tangible book deficit per share of our common stock immediately after this offering. Dilution results from the fact that the initial public offering price per share of common stock is substantially in excess of the net tangible book deficit per share of our common stock attributable to the existing shareholders for our presently outstanding shares of common stock. Our net tangible book deficit per share represents the amount of our total tangible assets (total assets less intangible assets and goodwill) less total liabilities, divided by the number of shares of common stock issued and outstanding.
Our net tangible book deficit as of September 30, 2013 was $722.6 million, or $10.67 per share, based on 67,696,126 shares of our common stock outstanding as of September 30, 2013. Dilution is calculated by subtracting net tangible book deficit per share of our common stock from the assumed initial public offering price per share of our common stock.
Without taking into account any other changes in such net tangible book deficit after September 30, 2013, after giving effect to the sale of shares of our common stock in this offering assuming an initial public offering price of $ per share (the midpoint of the offering range shown on the cover of this prospectus), less the underwriting discounts and commissions and estimated offering expenses payable by us, our pro forma net tangible book deficit as of September 30, 2013 would have been approximately $ million, or $ per share of common stock. This amount represents an immediate decrease in net tangible book deficit of $ per share of our common stock to the existing shareholders and immediate dilution in net tangible book deficit of $ per share of our common stock to investors purchasing shares of our common stock in this offering. The following table illustrates this dilution on a per share basis:
Assumed initial public offering price per share | $ | |||
Net tangible book deficit per share as of September 30, 2013, before giving effect to this offering | $ | |||
Decrease in net tangible book deficit per share attributable to investors purchasing shares in this offering | $ | |||
As adjusted net tangible book deficit per share, after giving effect to this offering | $ | |||
Dilution in as adjusted net tangible book deficit per share to investors in this offering | $ | |||
If the underwriters exercise their option in full to purchase additional shares, the as adjusted net tangible book deficit per share of our common stock after giving effect to this offering would be $ per share of our common stock. This represents an increase in as adjusted net tangible book deficit of $ per share of our common stock to existing shareholders and dilution in as adjusted net tangible book deficit of $ per share of our common stock to new investors.
A $1.00 increase (decrease) in the assumed public offering price of $ , based upon the midpoint of the estimated price range set forth on the cover of this prospectus, would increase (decrease) the net proceeds to us from this offering by $ million, assuming the number of shares we offer, as set forth on the cover page of this prospectus, remains the same and after deducting underwriting discounts and commissions and estimated offering expenses payable by us. A share increase in the number of shares offered by us together with a concomitant $1.00 increase in the assumed initial public offering price of $ per share, the midpoint of the price range set forth on the cover of this prospectus, would increase each of cash and cash equivalents and total shareholders’ equity by approximately $ million after deducting underwriting discounts and commissions and any estimated offering expenses payable by us. Conversely, a share decrease in the number of
62
Table of Contents
shares offered by us together with a concomitant $1.00 decrease in the assumed initial public offering price of $ per share, the midpoint of the price range set forth on the cover of this prospectus, would decrease each of cash and cash equivalents and total shareholders’ equity by approximately $ million after deducting underwriting discounts and commissions and any estimated offering expenses payable by us.
The following table summarizes, as of September 30, 2013, on the as adjusted basis described above, the total number of shares of our common stock purchased from us, the total consideration paid to us, and the average price per share of our common stock paid by purchasers of such shares and by new investors purchasing shares of our common stock in this offering.
| Shares Purchased (000s) | Total Consideration (000s) | Average Price Per Share | ||||||||||||||||
| Number | Percent | Amount | Percent | |||||||||||||||
Existing shareholders | % | $ | % | $ | ||||||||||||||
New investors | % | $ | % | $ | ||||||||||||||
|
|
|
|
|
|
|
|
| ||||||||||
Total | % | $ | % | $ | ||||||||||||||
|
|
|
|
|
|
|
|
| ||||||||||
The total number of shares of our common stock reflected in the table and discussion above is based on shares of common stock outstanding on an adjusted basis, as of September 30, 2013, and excludes, as of September 30, 2013
| Ÿ | shares of common stock issuable upon exercise of options outstanding as of September 30, 2013 at a weighted-average exercise price of $ per share; and |
| Ÿ | an aggregate of shares of common stock reserved for future issuance under our stock incentive plans. |
To the extent that we grant options to our employees or directors in the future, and those options or existing options are exercised or other issuances of shares of our common stock are made, there will be further dilution to new investors.
63
Table of Contents
SELECTED CONSOLIDATED FINANCIAL AND OPERATING DATA
The information set forth below should be read in conjunction with the “Capitalization” and “Management’s Discussion and Analysis of Financial Condition and Results of Operations” section of this prospectus and with our consolidated financial statements and notes thereto included elsewhere in this prospectus.
The following selected statements of operations and comprehensive income (loss) data for the fiscal years ended September 30, 2013, 2012 and 2011 and the balance sheet data as of September 30, 2013, 2012 and 2011 have been derived from our audited consolidated financial statements included elsewhere in this prospectus. Our historical results for any prior period are not necessarily indicative of results to be expected in any future period.
| Fiscal Year Ended September 30, 2013 | Fiscal Year Ended September 30, 2012 | Fiscal Year Ended September 30, 2011 | ||||||||||
| (in millions of U.S. dollars, except per share data) | ||||||||||||
Statement of Operations Data: | ||||||||||||
Net product sales | $ | 667.7 | $ | 600.9 | $ | 461.4 | ||||||
Other revenue | 20.2 | 14.2 | 9.0 | |||||||||
|
|
|
|
|
| |||||||
Total revenue | $ | 687.9 | $ | 615.1 | $ | 470.4 | ||||||
Cost of goods sold(1) | 146.6 | 144.2 | 135.4 | |||||||||
Selling and administrative expenses(1) | 172.5 | 168.8 | 143.5 | |||||||||
Management fees | 7.0 | 5.7 | 3.6 | |||||||||
Research and development expenses(1) | 65.5 | 72.6 | 58.0 | |||||||||
Acquired in-process research | 0.0 | 0.0 | 65.5 | |||||||||
Depreciation and amortization | 94.7 | 101.7 | 72.8 | |||||||||
Loss (gain) on disposal of product line | (1.0 | ) | 0.0 | 7.4 | ||||||||
Transaction, restructuring and integration costs | 2.5 | 12.4 | 50.9 | |||||||||
Fair value adjustments to intangible assets and contingent consideration | 10.0 | (3.4 | ) | — | ||||||||
|
|
|
|
|
| |||||||
Operating income (loss) | 190.1 | 113.1 | (66.7 | ) | ||||||||
Financial expenses | 68.8 | 80.2 | 89.5 | |||||||||
Loss on extinguishment of debt | — | 23.1 | 28.3 | |||||||||
Other interest income | (0.4 | ) | (0.2 | ) | (0.4 | ) | ||||||
Loss on foreign currencies | 0.1 | 0.2 | 0.1 | |||||||||
|
|
|
|
|
| |||||||
Income (loss) before income taxes | 121.6 | 9.8 | (184.2 | ) | ||||||||
Income taxes | 34.7 | 21.8 | 7.4 | |||||||||
|
|
|
|
|
| |||||||
Net (loss) income | $ | 86.9 | $ | (12.0 | ) | $ | (191.6 | ) | ||||
|
|
|
|
|
| |||||||
Earnings per common share attributable to common shareholders: | ||||||||||||
Basic earnings per share | $ | 1.28 | $ | (0.18 | ) | $ | (3.32 | ) | ||||
Diluted earnings per share | $ | 1.26 | $ | (0.18 | ) | $ | (3.32 | ) | ||||
Weighted average common shares outstanding: | ||||||||||||
Basic | 67,987,312 | 67,699,784 | 57,742,284 | |||||||||
Diluted | 69,174,681 | 67,699,784 | 57,742,284 | |||||||||
64
Table of Contents
| Fiscal Year Ended September 30, 2013 | Fiscal Year Ended September 30, 2012 | Fiscal Year Ended September 30, 2011 | ||||||||||
| (in millions of U.S. dollars, except per share data) | ||||||||||||
As Adjusted Data(3)(5)(6): | ||||||||||||
Net (loss) income | $ | |||||||||||
Basic earnings per common share | $ | |||||||||||
Diluted earnings per common share | $ | |||||||||||
Weighted average common shares outstanding: | ||||||||||||
Basic | ||||||||||||
Diluted | ||||||||||||
Other Financial Data: | ||||||||||||
EBITDA(2)(7) | $ | 284.7 | $ | 191.5 | $ | (22.3 | ) | |||||
Adjusted EBITDA(2)(7) | $ | 314.6 | $ | 244.9 | $ | 160.0 | ||||||
Adjusted pre-tax income(2)(7) | $ | 241.4 | $ | 161.6 | $ | 67.5 | ||||||
| September 30, 2013 | September 30, 2012 | September 30, 2011 | ||||||||||||||
| Actual | As Adjusted (3)(4)(5) | Actual | Actual | |||||||||||||
| (in millions of U.S.dollars) | ||||||||||||||||
Balance Sheet Data (at period end): | ||||||||||||||||
Cash and cash equivalents | $ | 229.9 | $ | $ | 115.0 | $ | 126.9 | |||||||||
Total current assets | 401.2 | 287.9 | 272.0 | |||||||||||||
Total assets | 1,341.2 | 1,316.8 | 1,257.6 | |||||||||||||
Total short-term borrowings | 9.5 | 10.5 | 8.5 | |||||||||||||
Total current liabilities | 261.6 | 236.5 | 177.6 | |||||||||||||
Total long-term debt | 911.8 | 920.0 | 968.4 | |||||||||||||
Total liabilities | 1,294.6 | 1,376.0 | 1,297.6 | |||||||||||||
Total shareholders’ equity | 46.6 | (59.2 | ) | (40.1 | ) | |||||||||||
| (1) | Exclusive of depreciation and amortization which is separately reported in the Statement of Operations. |
| (2) | EBITDA, Adjusted EBITDA and Adjusted pre-tax income are financial measures that are not defined under generally accepted accounting principles in the United States, or GAAP, and are presented in this prospectus because our management considers them important supplemental measures of our performance and believes that they provide greater transparency into our results of operation and are frequently used by investors in the evaluation of companies in the industry. In addition, our management believes that EBITDA, Adjusted EBITDA and Adjusted pre-tax income are useful financial metrics to assess our operating performance from period to period by excluding certain material non-cash items, unusual or non-recurring items that we do not expect to continue in the future and certain other adjustments we believe are not reflective of our ongoing operations and our performance. |
None of EBITDA, Adjusted EBITDA or Adjusted pre-tax income are measures of net income, operating income or any other performance measure derived in accordance with GAAP, and each is subject to important limitations. EBITDA, as we use it, is net income before financial expenses, interest income, income taxes and depreciation and amortization. Adjusted EBITDA, as we use it, is EBITDA adjusted to exclude certain non-cash charges, unusual or nonrecurring items, impact of discontinued operations, impairment of intangible assets, restructuring activities, litigation settlements and contingencies, upfront and development milestone payments, stock-based compensation and other adjustments set forth below. Adjusted pre-tax income, as we use it, is income before income taxes as reported under GAAP, adjusted to exclude certain |
65
Table of Contents
non-cash charges, unusual or nonrecurring items, impact of discontinued operations, impairment of intangible assets, restructuring activities, litigation settlements and contingencies, upfront and development milestone payments, stock-based compensation and other adjustments set forth below. |
| We understand that although EBITDA, Adjusted EBITDA and Adjusted pre-tax income are frequently used by securities analysts, investors and others in their evaluation of companies, they have limitations as analytical tools, and you should not consider them in isolation, or as a substitute for analysis of our results as reported under GAAP. Some of these limitations are: |
| Ÿ | EBITDA, Adjusted EBITDA and Adjusted pre-tax income do not reflect all cash expenditures, future requirements for capital expenditures, or contractual commitments; |
| Ÿ | EBITDA, Adjusted EBITDA and Adjusted pre-tax income do not reflect changes in, or cash requirements for, working capital needs; |
| Ÿ | EBITDA and Adjusted EBITDA do not reflect the significant interest expense, or the cash requirements necessary to service interest or principal payments, on our debt; |
| Ÿ | EBITDA, Adjusted EBITDA and Adjusted pre-tax income do not reflect expenditures related to current business development and product acquisition activities, including payments due under existing agreements related to products in various stages of development or contingent payments tied to the achievement of sales milestones; |
| Ÿ | although depreciation and amortization are non-cash charges, the assets being depreciated and amortized will often have to be replaced in the future, and EBITDA, Adjusted EBITDA and Adjusted pre-tax income do not reflect any cash requirements for such replacements; |
| Ÿ | EBITDA, Adjusted EBITDA and Adjusted pre-tax income exclude income tax payments that represent a reduction in cash available to us; |
| Ÿ | EBITDA, Adjusted EBITDA and Adjusted pre-tax income do not reflect the impact of earnings or charges resulting from matters we consider not to be indicative of our ongoing operations; and |
| Ÿ | other companies in our industry may calculate EBITDA, Adjusted EBITDA and Adjusted pre-tax income differently than we do, limiting their usefulness as comparative measures. |
| Because of these limitations, EBITDA, Adjusted EBITDA and Adjusted pre-tax income should not be considered as measures of discretionary cash available to us to invest in our business. Our management compensates for these limitations by relying primarily on our GAAP results and using EBITDA, Adjusted EBITDA and Adjusted pre-tax income as supplemental information. Investors and potential investors are encouraged to review the reconciliations of EBITDA, Adjusted EBITDA and Adjusted pre-tax income to our closest reported GAAP measures contained within “Selected Consolidated Financial and Operating Data” included elsewhere in this prospectus. |
| (3) | As adjusted consolidated financial data reflects (i) the Recapitalization, including (a) the distribution in aggregate amount of $399.5 million to our shareholders, holders of our restricted stock units and certain holders of options to purchase shares of our common stock on October 7, 2013, and (b) the refinancing of our previously existing credit facilities, which were replaced with our senior secured credit facilities providing for senior secured term loans in the amount of $1,250 million and a senior secured revolving credit facility allowing for borrowings of up to $150 million; (ii) the elimination of fees paid under our management agreements with our Sponsors; (iii) the offering of million shares of common stock by us in this offering, assuming an initial public offering price of $ per share, the midpoint of the price range set forth on the cover page of this prospectus, after deducting underwriting discounts and commissions and estimated offering expenses payable by us; and (iv) the application of the estimated proceeds of the offering as described in “Use of Proceeds.” This as adjusted consolidated financial data is presented for informational purposes only and does not purport to represent what our consolidated results of operations or financial position actually would have been had the transactions reflected occurred on the date indicated or to project our financial condition as of any future date or results of operations for any future period. |
66
Table of Contents
| (4) | A $1.00 increase (decrease) in the assumed initial public offering price of $ per share, the midpoint of the price range set forth on the cover of this prospectus, would increase (decrease) the as adjusted amount of each of cash and cash equivalents, total current assets, total assets and total shareholders’ equity by approximately $ million, assuming that the number of shares offered by us, as set forth on the cover of this prospectus, remains the same and after deducting underwriting discounts and commissions and estimated offering expenses payable by us. |
A share increase in the number of shares offered by us together with a concomitant $1.00 increase in the assumed initial public offering price of $ per share, the midpoint of the price range set forth on the cover of this prospectus, would increase the as adjusted amount of each of cash and cash equivalents, total current assets and total assets by approximately $ million after deducting underwriting discounts and commissions and any estimated offering expenses payable by us. Conversely, a share decrease in the number of shares offered by us together with a concomitant $1.00 decrease in the assumed initial public offering price of $ per share, the midpoint of the price range set forth on the cover of this prospectus, would decrease the as adjusted amount of each of cash and cash equivalents, total current assets and total assets by approximately $ million after deducting underwriting discounts and commissions and any estimated offering expenses payable by us.
| (5) | As Adjusted information is unaudited. |
| (6) | As Adjusted earnings per share. |
The as adjusted earnings per share gives effect to (a) the Recapitalization, (b) the elimination of fees paid under our management agreements with our Sponsors (which will be terminated in connection with the offering) and (c) the issuance of shares of our common stock offered by this prospectus and the use of proceeds therefrom as described in “Use of Proceeds,” as if each had occurred on October 1, 2012.
��
67
Table of Contents
The following presents the computation of as adjusted basic and diluted earnings per share:
| Fiscal Year Ended September 30, 2013 | ||||
| (in millions of U.S. dollars, except per share data) | ||||
Numerator: | ||||
Net income as reported | $ | |||
Net income as adjusted adjustments: | ||||
Interest expense, net of tax(a) | ||||
Amortization of debt issuance costs and discount, net of tax(a) | ||||
Reduction of management fees, net of tax(b) | ||||
As adjusted net income | $ | |||
Denominator: | ||||
Weighted average common shares used in computing basic income per common share | ||||
Adjustment for common stock assumed issued in this offering | ||||
As adjusted basic common shares outstanding(c) | ||||
As adjusted basic earnings per share | $ | |||
Weighted average common shares used in computing diluted income per common share outstanding | ||||
Adjustment for common stock assumed issued in this offering | ||||
As adjusted diluted common shares outstanding(c) | ||||
As adjusted diluted earnings per share | $ | |||
| (a) | These adjustments reflect the change to historical interest expense and amortization of debt issuance costs and discount (net of tax at an applicable blended statutory rate of % for fiscal year 2013) after reflecting the Refinancing and use of proceeds from this offering to repay $ million of our senior secured credit facilities. |
| (b) | After the offering, we will no longer incur expenses under the management services agreements with our Sponsors, resulting in the elimination of management fees of $ million, net of tax at an applicable blended statutory rate of % for the fiscal year ended September 30, 2013. This pro forma calculation has not included the approximately $ million expense to be paid to the Sponsors as a fee in connection with the termination of the management services agreements, as these costs will not have a continuing impact on our consolidated results of operations. |
| (c) | The as adjusted basic and diluted earnings per share is calculated based on weighted-average common shares outstanding during the period including the issuance of common stock in this offering as if the offering occurred on October 1, 2012. We also assume that the underwriters of the offering do not exercise their option to purchase up to $ million additional common stock from us and the selling stockholders. |
68
Table of Contents
| (7) | The following table reconciles EBITDA and Adjusted EBITDA to net income (loss), and adjusted pre-tax income to income (loss) before income taxes. |
| Fiscal Year Ended September 30, 2013 | Fiscal Year Ended September 30, 2012 | Fiscal Year Ended September 30, 2011 | ||||||||||
| (in millions of U.S. dollars) | ||||||||||||
Net income (loss) to EBITDA: | ||||||||||||
Net income (loss) | $ | 86.9 | $ | (12.0 | ) | $ | (191.6 | ) | ||||
Financial expenses | 68.8 | 80.2 | 89.5 | |||||||||
Interest income | (0.4 | ) | (0.2 | ) | (0.4 | ) | ||||||
Income taxes expense | 34.7 | 21.8 | 7.4 | |||||||||
Depreciation and amortization | 94.7 | 101.7 | 72.8 | |||||||||
|
|
|
|
|
| |||||||
EBITDA | $ | 284.7 | $ | 191.5 | $ | (22.3 | ) | |||||
EBITDA to Adjusted EBITDA: | ||||||||||||
EBITDA | $ | 284.7 | $ | 191.5 | $ | (22.3 | ) | |||||
Transaction, integration, refinancing costs and other payments to third parties(a) | 11.1 | 19.8 | 50.6 | |||||||||
Management Fees(b) | 7.0 | 5.7 | 3.6 | |||||||||
Stock-based compensation expense(c) | 2.8 | 8.2 | 7.8 | |||||||||
Loss on extinguishment of debt | — | 23.1 | 28.3 | |||||||||
Loss (gain) on disposal of product line (d) | (1.0 | ) | 0.0 | 7.4 | ||||||||
Inventories stepped-up value expensed(e) | 0.0 | 0.0 | 19.1 | |||||||||
Acquired in-process research(f) | 0.0 | 0.0 | 65.5 | |||||||||
Fair value adjustments to intangible assets and related liabilities(g) | 10.0 | (3.4 | ) | — | ||||||||
|
|
|
|
|
| |||||||
Adjusted EBITDA | $ | 314.6 | $ | 244.9 | $ | 160.0 | ||||||
|
|
|
|
|
| |||||||
Income (loss) before income taxes to Adjusted pre-tax income: | ||||||||||||
Income (loss) before income taxes | $ | 121.6 | $ | 9.8 | $ | (184.2 | ) | |||||
Transaction, integration, refinancing costs and other payments to third parties(a) | 11.1 | 19.8 | 50.6 | |||||||||
Management Fees(b) | 7.0 | 5.7 | 3.6 | |||||||||
Stock-based compensation expense(c) | 2.8 | 8.2 | 7.8 | |||||||||
Loss on extinguishment of debt | — | 23.1 | 28.3 | |||||||||
Loss (gain) on disposal of product line (d) | (1.0 | ) | 0.0 | 7.4 | ||||||||
Inventories stepped-up value expensed(e) | 0.0 | 0.0 | 19.1 | |||||||||
Acquired in-process research(f) | 0.0 | 0.0 | 65.5 | |||||||||
Non-cash financial expenses(h) | 9.1 | 9.4 | 8.8 | |||||||||
Amortization expense and fair value adjustments to intangible assets and related liabilities (i) | 90.8 | 85.6 | 60.6 | |||||||||
|
|
|
|
|
| |||||||
Adjusted pre-tax income | $ | 241.4 | $ | 161.6 | $ | 67.5 | ||||||
|
|
|
|
|
| |||||||
| (a) | Represents transaction, integration, refinancing and restructuring costs related to the Eurand Transaction and other corporate initiatives as well as to certain other business development projects, and certain payments to third parties in respect of research and development milestones and other progress payments, deferred revenue related to RECTIV, ULTRESA and VIOKACE, adjustments and other write-downs resulting from the impacts of the one-time removal of ULTRASE and VIOKASE from the market in 2010, and unrealized foreign exchange losses. |
| (b) | Represents management fees and other charges associated with the management agreements with our Sponsors. |
| (c) | Represents stock-based employee compensation expense under the provisions of GAAP. |
69
Table of Contents
| (d) | Loss (gain) resulting from the disposal of the PHOTOFRIN/PHOTOBARR product line. |
| (e) | As part of the purchase price allocation for the acquisition of Eurand, the book value of inventory acquired was stepped-up to fair value by $18.7 million as at acquisition date. The stepped-up value has been recorded as charge to cost of goods sold as acquired inventory was sold, until acquired inventory was sold off. |
| (f) | Represents the initial non-contingent payment of $12.0 million, the discounted value of future time-based non-contingent payments payable under the option agreement of $44.8 million and the payment towards certain pre-agreement incurred development expenses of $8.7 million related to the acquisition of Mpex Transaction. |
| (g) | Represents impairment of the RECTIV and LAMICTAL intangible assets and change in fair value of the contingent consideration liability related to the Rectiv Transaction. |
| (h) | Represents amortization of original issuance discounts on our term-loans, changes in fair-value including accretion expense on amounts payable for the Mpex Transaction and Rectiv Transaction and amortization of deferred debt issue expense. |
| (i) | Represents amortization of intangible assets and impairment charges on intangible assets and goodwill. |
Selected quarterly financial data
The following tables present selected quarterly financial data for the fiscal year ended September 30, 2013 and should be read in conjunction with our historical audited consolidated financial statements and related notes contained elsewhere in this prospectus. Our operating results for any quarter are not necessarily indicative of results for any future quarter or for a full fiscal year.
| For the quarters ended | ||||||||||||||||
| September 30, 2013 | June 30, 2013 | March 31, 2013 | December 31, 2012 | |||||||||||||
| (in millions of U.S. dollars) | ||||||||||||||||
Statement of Operations Data: | ||||||||||||||||
Net product sales | $ | 155.8 | $ | 171.0 | $ | 173.9 | $ | 167.0 | ||||||||
Other revenue | 3.1 | 4.0 | 5.8 | 7.3 | ||||||||||||
|
|
|
|
|
|
|
| |||||||||
Total revenue | 158.9 | 175.0 | 179.7 | 174.3 | ||||||||||||
Cost of goods sold (a) | 36.0 | 38.8 | 39.5 | 32.3 | ||||||||||||
Selling and administration expenses (a) | 44.1 | 42.5 | 43.2 | 42.7 | ||||||||||||
Management fees | 1.6 | 1.7 | 2.0 | 1.7 | ||||||||||||
Research and development expenses (a) | 17.4 | 15.7 | 14.9 | 17.5 | ||||||||||||
Depreciation and amortization | 23.1 | 22.6 | 23.7 | 25.3 | ||||||||||||
Gain on disposal of product line | — | — | — | (1.0 | ) | |||||||||||
Transaction, restructuring and integration costs | 0.6 | 0.1 | 1.2 | 0.6 | ||||||||||||
Fair value adjustments to intangible assets and contingent consideration | 7.3 | (2.1 | ) | 1.9 | 2.9 | |||||||||||
|
|
|
|
|
|
|
| |||||||||
Operating income (loss) | 28.8 | 55.7 | 53.3 | 52.3 | ||||||||||||
Financial expenses | 16.8 | 17.6 | 16.5 | 17.9 | ||||||||||||
Interest income | (0.1 | ) | (0.2 | ) | — | (0.1 | ) | |||||||||
Loss (gain) on foreign currencies | (0.1 | ) | 0.4 | 0.2 | (0.4 | ) | ||||||||||
|
|
|
|
|
|
|
| |||||||||
Total other expenses | 16.6 | 17.8 | 16.7 | 17.4 | ||||||||||||
|
|
|
|
|
|
|
| |||||||||
Income before income taxes | 12.2 | 37.9 | 36.6 | 34.9 | ||||||||||||
Income taxes expense | 8.3 | 7.9 | 10.3 | 8.2 | ||||||||||||
|
|
|
|
|
|
|
| |||||||||
Net income | 3.9 | 30.0 | 26.3 | 26.7 | ||||||||||||
|
|
|
|
|
|
|
| |||||||||
EBITDA (b) | 52.0 | 77.9 | 76.8 | 78.0 | ||||||||||||
Adjusted EBITDA (b) | 65.6 | 74.5 | 87.7 | 86.8 | ||||||||||||
Adjusted pre-tax income (b) | $ | 47.4 | $ | 55.0 | $ | 70.4 | $ | 68.6 | ||||||||
|
|
|
|
|
|
|
| |||||||||
70
Table of Contents
| (a) | Exclusive of depreciation and amortization |
| (b) | The following table reconciles EBITDA and Adjusted EBITDA to net income, and adjusted pre-tax income to income before income taxes for each of the quarters ended in fiscal year 2013: |
| For the quarters ended | ||||||||||||||||
| September 30, 2013 | June 30, 2013 | March 31, 2013 | December 31, 2012 | |||||||||||||
| (in millions of U.S. dollars) | ||||||||||||||||
Net income to EBITDA: | ||||||||||||||||
Net income | $ | 3.9 | $ | 30.0 | $ | 26.3 | $ | 26.7 | ||||||||
Financial expenses | 16.8 | 17.6 | 16.5 | 17.9 | ||||||||||||
Interest income | (0.1 | ) | (0.2 | ) | — | (0.1 | ) | |||||||||
Income taxes expense | 8.3 | 7.9 | 10.3 | 8.2 | ||||||||||||
Depreciation and amortization | 23.1 | 22.6 | 23.7 | 25.3 | ||||||||||||
|
|
|
|
|
|
|
| |||||||||
EBITDA (h) | 52.0 | 77.9 | 76.8 | 78.0 | ||||||||||||
|
|
|
|
|
|
|
| |||||||||
EBITDA to Adjusted EBITDA: | ||||||||||||||||
Transaction, integration, refinancing costs and payments to third parties (a) | 4.5 | (2.3 | ) | 5.1 | 3.8 | |||||||||||
Management fees (b) | 1.6 | 1.7 | 2.0 | 1.7 | ||||||||||||
Stock-based compensation expense (c) | 0.2 | (0.7 | ) | 1.9 | 1.4 | |||||||||||
Fair value adjustments to intangible assets and contingent consideration (d) | 7.3 | (2.1 | ) | 1.9 | 2.9 | |||||||||||
Gain on disposal of product line (e) | — | — | — | (1.0 | ) | |||||||||||
|
|
|
|
|
|
|
| |||||||||
Adjusted EBITDA (h) | 65.6 | 74.5 | 87.7 | 86.8 | ||||||||||||
|
|
|
|
|
|
|
| |||||||||
Income before income taxes to Adjusted pre-tax income: | ||||||||||||||||
Income before income taxes | 12.2 | 37.9 | 36.6 | 34.9 | ||||||||||||
Transaction, integration, refinancing costs and other payments to third parties (a) | 4.5 | (2.3 | ) | 5.1 | 3.8 | |||||||||||
Management Fees (b) | 1.6 | 1.7 | 2.0 | 1.7 | ||||||||||||
Stock-based compensation expense (c) | 0.2 | (0.7 | ) | 1.9 | 1.4 | |||||||||||
Gain on disposal of product line (e) | — | — | — | (1.0 | ) | |||||||||||
Non-cash financial expenses (g) | 2.4 | 2.2 | 2.0 | 2.5 | ||||||||||||
Amortization expense and fair value adjustments to intangible assets and related liabilities (f) | 26.5 | 16.2 | 22.8 | 25.3 | ||||||||||||
|
|
|
|
|
|
|
| |||||||||
Adjusted pre-tax income (h) | $ | 47.4 | $ | 55.0 | $ | 70.4 | $ | 68.6 | ||||||||
|
|
|
|
|
|
|
| |||||||||
| (a) | Represents transaction, integration, refinancing and restructuring costs related to the Eurand Transaction and other corporate initiatives as well as to certain other business development projects, and certain payments to third parties in respect of research and development milestones and other progress payments, deferred revenue related to RECTIV, ULTRESA and VIOKACE, adjustments and other write-downs resulting from the impacts of the one-time removal of ULTRASE and VIOKASE from the market in 2010, and unrealized foreign exchange losses. |
| (b) | Represents management fees and other charges associated with the management agreements with our Sponsors. |
| (c) | Represents stock-based employee compensation expense under the provisions of GAAP. |
| (d) | Represents impairment of the RECTIV and LAMICTAL intangible assets and change in fair value of the contingent consideration liability related to the Rectiv Transaction. |
| (e) | Gain resulting from the disposal of the PHOTOFRIN/PHOTOBARR product line. |
| (f) | Represents amortization of intangible assets and fair value adjustments to intangible assets and goodwill. |
71
Table of Contents
| (g) | Represents amortization of original issuance discounts on our term-loans, changes in fair value including accretion expense on amounts payable for the Mpex Transaction and Rectiv Transaction and amortization of deferred debt issue expense. |
| (h) | EBITDA, Adjusted EBITDA and Adjusted pre-tax income are financial measures that are not defined under generally accepted accounting principles in the United States, or GAAP, and are presented in this prospectus because our management considers them important supplemental measures of our performance and believes that they provide greater transparency into our results of operation and are frequently used by investors in the evaluation of companies in the industry. In addition, our management believes that EBITDA, Adjusted EBITDA and Adjusted pre-tax income are useful financial metrics to assess our operating performance from period to period by excluding certain material non-cash items, unusual or non-recurring items that we do not expect to continue in the future and certain other adjustments we believe are not reflective of our ongoing operations and our performance. |
| None of EBITDA, Adjusted EBITDA or Adjusted pre-tax income are measures of net income, operating income or any other performance measure derived in accordance with GAAP, and each is subject to important limitations. EBITDA, as we use it, is net income before financial expenses, interest income, income taxes and depreciation and amortization. Adjusted EBITDA, as we use it, is EBITDA adjusted to exclude certain non-cash charges, unusual or nonrecurring items, impact of discontinued operations, impairment of intangible assets, restructuring activities, litigation settlements and contingencies, upfront and development milestone payments, stock-based compensation and other adjustments set forth below. Adjusted pre-tax income, as we use it, is income before income taxes as reported under GAAP, adjusted to exclude certain noncash charges, unusual or nonrecurring items, impact of discontinued operations, impairment of intangible assets, restructuring activities, litigation settlements and contingencies, upfront and development milestone payments, stock-based compensation and other adjustments set forth below. |
| We understand that although EBITDA, Adjusted EBITDA and Adjusted pre-tax income are frequently used by securities analysts, investors and others in their evaluation of companies, they have limitations as analytical tools, and you should not consider them in isolation, or as a substitute for analysis of our results as reported under GAAP. Some of these limitations are: |
| Ÿ | EBITDA, Adjusted EBITDA and Adjusted pre-tax income do not reflect all cash expenditures, future requirements for capital expenditures, or contractual commitments; |
| Ÿ | EBITDA, Adjusted EBITDA and Adjusted pre-tax income do not reflect changes in, or cash requirements for, working capital needs; |
| Ÿ | EBITDA and Adjusted EBITDA do not reflect the significant interest expense, or the cash requirements necessary to service interest or principal payments, on our debt; |
| Ÿ | EBITDA, Adjusted EBITDA and Adjusted pre-tax income do not reflect expenditures related to current business development and product acquisition activities, including payments due under existing agreements related to products in various stages of development or contingent payments tied to the achievement of sales milestones; |
| Ÿ | although depreciation and amortization are non-cash charges, the assets being depreciated and amortized will often have to be replaced in the future, and EBITDA, Adjusted EBITDA and Adjusted pre-tax income do not reflect any cash requirements for such replacements; |
| Ÿ | EBITDA, Adjusted EBITDA and Adjusted pre-tax income exclude income tax payments that represent a reduction in cash available to us; |
| Ÿ | EBITDA, Adjusted EBITDA and Adjusted pre-tax income do not reflect the impact of earnings or charges resulting from matters we consider not to be indicative of our ongoing operations; and |
| Ÿ | other companies in our industry may calculate EBITDA, Adjusted EBITDA and Adjusted pre-tax income differently than we do, limiting their usefulness as comparative measures. |
72
Table of Contents
Because of these limitations, EBITDA, Adjusted EBITDA and Adjusted pre-tax income should not be considered as measures of discretionary cash available to us to invest in our business. Our management compensates for these limitations by relying primarily on our GAAP results and using EBITDA, Adjusted EBITDA and Adjusted pre-tax income as supplemental information.
73
Table of Contents
MANAGEMENT’S DISCUSSION AND ANALYSIS OF FINANCIAL CONDITION AND RESULTS OF OPERATIONS
You should read the following discussion and analysis of our financial condition and results of operations together with our consolidated financial statements and the related notes included elsewhere in this prospectus. This discussion and analysis includes forward-looking statements that involve risks and uncertainties. You should read the “Cautionary Note Regarding Forward-Looking Statements” and “Risk Factors” sections of this prospectus for a discussion of important factors that could cause actual results to differ materially from the results described in or implied by the forward-looking statements contained in the following discussion and analysis.
Overview
Our Business
Our mission is to improve health and quality of care by providing specialty therapies for patients around the world. Our vision is to become the reference specialty pharmaceutical company providing innovative, effective therapies for unmet medical needs, including in cystic fibrosis, or CF, and in gastrointestinal, or GI, disorders. We develop, manufacture, license and market a broad range of therapies.
We have built market-leading franchises in CF and GI disorders by growing sales of our products, many of which command a number one or number two position in their respective markets, including ZENPEP, CANASA, CARAFATE, PYLERA and RECTIV. Our revenues are highly diversified, with our largest product accounting for only 21% of our total revenue in fiscal year 2013 and with operations outside the United States accounting for 20% of our total revenue during the same period. The CF and GI markets are each characterized by a concentrated base of high-volume prescribing physicians, which allows our highly efficient and effective sales force of 227 experienced sales specialists, including 155 sales specialists in the United States to reach substantially all Cystic Fibrosis Foundation care centers and approximately half of the GI physicians in the United States. We have established sales and marketing operations in the United States, Canada, France and Germany and proprietary manufacturing capabilities in North America and Europe. In addition, we have proven product development capabilities and a demonstrated ability to selectively acquire complementary products, product candidates and companies. We believe our pipeline of four clinical product candidates targets major commercial opportunities in the EU and the United States and we have lifecycle management opportunities for our existing products using the proprietary technology platforms of our Pharmaceutical Technologies, or PT, business.
We have generated double-digit revenue growth since the beginning of fiscal year 2011. This strong performance has been achieved by driving continued growth in our market-leading products and by successfully integrating products and companies, including Eurand N.V., or Eurand. Our total revenue has grown from $470.4 million for fiscal year 2011 to $687.9 million for fiscal year 2013, representing a compound annual growth rate, or CAGR, of 20.9%. Revenue from assets acquired or licensed during this period, including ZENPEP, RECTIV and PT, has grown from $122.0 million in fiscal year 2011 to $ 244.8 million in fiscal year 2013, while the remainder of our portfolio grew at a CAGR of 12.8%, from $348.4 million in fiscal year 2011 to $443.1 million in fiscal year 2013. We had Adjusted EBITDA of $160.0 million in fiscal year 2011 and $314.6 million in fiscal year 2013, Adjusted pre-tax income of $67.5 million in fiscal year 2011 and $241.4 million in fiscal year 2013, and a net loss of $191.6 million in fiscal year 2011 compared to net income of $86.9 million in fiscal year 2013. Adjusted EBITDA and Adjusted pre-tax income are non-GAAP financial metrics. Please see “Selected Consolidated Financial and Operating Data” for reconciliations of Adjusted EBITDA to net (loss) income and Adjusted pre-tax income to income (loss) before income tax.
74
Table of Contents
Recent Acquisitions and Dispositions
On December 28, 2011, we entered into a license agreement with Strakan International S.A.R.L. and Prostrakan Inc., together ProStrakan, to acquire the exclusive rights and related business and supply agreement to commercialize and develop RECTIV in the United States, referred to as the Rectiv Transaction, which we recorded as a business combination. RECTIV received FDA approval in June 2011 and is indicated for the treatment of moderate to severe pain associated with chronic anal fissure. We made an upfront payment to ProStrakan of $20 million in January 2012, as well as an additional milestone payment of $20 million in December 2012. As we recorded the Rectiv Transaction as a business combination, we record the present value of estimated future payments in connection with certain milestones and royalties on net sales related to the Rectiv Transaction as a contingent liability on our balance sheet. As at September 30, 2013, we had $29.6 million of contingent liability related to the Rectiv Transaction on our balance sheet. For more information regarding our sensitivity analysis related to these contingent payments, see Note 4 to our consolidated financial statements included elsewhere in this prospectus. The next milestone payment of $5 million is expected to occur, if at all, upon net sales of RECTIV of $25 million in any calendar year. We began shipping RECTIV during the quarter ended March 31, 2012.
On April 11, 2011, we received the proceeds of a $55.0 million equity investment from funds managed by Investor Growth Capital Limited, which was used to fund a portion of the cost of our August 31, 2011 acquisition of Mpex Pharmaceuticals Inc., or Mpex. As a result of the asset acquisition, or the Mpex Transaction, we obtained the rights to APT-1026 and we have assumed all related research and development expenses since the date of acquisition. The transaction was accounted for as an asset acquisition, as Mpex did not include any processes or outputs to qualify as a business, as defined in GAAP. The total consideration in relation to the Mpex Transaction consists of (i) time-based, non-contingent payments amounting to $62.5 million to be paid in a number of installments, of which $37.5 million has been paid up to September 30, 2013, plus (ii) contingent payments of up to an aggregate of $195.0 million upon the achievement of certain regulatory milestones, such as acceptance for substantive review of an NDA or foreign equivalent, EU approval or U.S. approval and certain annual net sales milestones, and (iii) earn-out payments based on net sales of APT-1026. These contingent payments have not been recorded on our balance sheet because the applicable milestones have not been met. The final installments on the time-based non-contingent payments of $25.0 million are due in the next fiscal year ending September 30, 2014 and are recorded as a current liability as of September 30, 2013. On November 1, 2013, we paid $15.0 million of these remaining installments. Also, in November 2013, we filed a Marketing Authorization Application with the EMA. Upon acceptance for substantive review, a development milestone of $10 million would be due within 10 days of acceptance.
On March 28, 2011, we entered into a definitive agreement with Pinnacle Biologics, Inc., or Pinnacle, pursuant to which we sold all of our global assets and rights related to PHOTOFRIN/PHOTOBARR, a photo-sensitizer approved for use in photodynamic therapy, for non-contingent payments amounting to $4.3 million, plus additional contingent consideration. We received milestone payments of $1 million and recorded a corresponding gain during fiscal year 2013.
On February 11, 2011, we acquired Eurand for total consideration of $589.6 million, or the Eurand Transaction. As a result of the acquisition, Eurand is a subsidiary of the Company and its results of operations have been consolidated within our financial statements since the date of acquisition. Prior to the Eurand Transaction, Eurand was a specialty pharmaceutical company that developed, manufactured and commercialized enhanced pharmaceutical and biopharmaceutical products based on proprietary technology platforms. Eurand was a global company with facilities in the United States and Europe.
October 2013 Recapitalization
On October 4, 2013, Aptalis Pharma, our wholly-owned subsidiary, and certain of our other wholly-owned subsidiaries effected a refinancing consisting of (i) the repayment, in full, of our
75
Table of Contents
outstanding indebtedness, in aggregate principal amount of $926.4 million, under our Second A&R Credit Agreement (defined below) and termination of our Second A&R Credit Agreement and (ii) the entry into our new senior secured credit facilities providing for senior secured term loans in the amount of $1,250 million and a new senior secured revolving credit facility allowing for borrowing of up to $150 million, which we collectively refer to as the Refinancing. See “Description of Certain Indebtedness—Senior Secured Credit Facilities.”
Following the Refinancing, through a series of transactions, including repayment of intercompany debt, redemptions of subsidiary equity, dividends, distributions and mergers, we made a distribution in aggregate amount of $399.5 million to our shareholders, holders of our restricted stock units and certain holders of options to purchase shares of our common stock, which we refer to as the Distribution. Certain holders of options received an adjustment to the per share exercise price in accordance with the relevant option plan to reflect the effects of the Distribution. The Refinancing, Distribution and the transactions referred to above are collectively referred to as the Recapitalization.
On November 8, 2013, in conjunction with the Refinancing, we terminated our existing interest rate swap and interest rate cap agreements and paid a total of $13.5 million to our derivative counterparties. We then entered into two new interest rate cap agreements with an effective date of December 31, 2013. The interest rate caps each have a notional amount of $275.0 million amortizing to $25.0 million by their maturity in December 2019. The interest rate caps are designated as cash flow hedges of interest rate risk and are designed to fix our interest payments on the hedged debt at 6.78%.
Affordable Care Act
The Affordable Care Act, enacted in the United States in March 2011, contains several provisions that could impact our business. In June 2012, the Supreme Court upheld the constitutionality of most aspects of the Affordable Care Act but found that states could not be forced to participate in the expansion of Medicaid provided for in the Affordable Care Act.
Although many provisions of the new legislation did not take effect immediately, several provisions became effective during the fiscal year ended September 30, 2010. These include (1) an increase in the minimum Medicaid rebate to states participating in the Medicaid program on our branded prescription drugs; (2) the extension of the Medicaid rebate to managed care organizations that dispense drugs to Medicaid beneficiaries; and (3) the expansion of the 340(B) Public Health Service Act drug pricing program, which provides outpatient drugs at reduced rates, to include certain children’s hospitals, free-standing cancer hospitals, critical access hospitals, and rural referral centers. In the aggregate, Medicaid rebates negatively impacted our revenue by $42.1 million during the fiscal year ended September 30, 2013 and by $31.3 million and $20.2 million in fiscal years 2012 and 2011, respectively. Based on the fact that some large states have not fully submitted their Managed Medicaid claims, it is possible that we could have changes to our estimates of the impact of healthcare reform based on additional information received from the states, and such amounts could be material to our financial statements.
In addition, beginning in 2011, the new law requires drug manufacturers to provide a 50% discount to Medicare beneficiaries for any covered prescription drugs purchased during a Medicare Part D coverage gap (i.e. the “donut hole”), which rose to 52.5% in 2013. The Medicare Part D coverage gap had the effect of reducing our revenue by $9.9 million during the fiscal year ended September 30, 2013 and by $6.5 million and $1.5 million in fiscal years 2012 and 2011, respectively. Also, beginning in 2011, new fees are assessed on all branded prescription drug manufacturers and importers. This fee is calculated on each organization’s percentage share of total branded prescription drug sales to U.S. government programs (such as Medicare Parts B and D, Medicaid, Department of Veterans Affairs and Department of Defense programs and TRICARE retail pharmacy program) made during the previous
76
Table of Contents
fiscal year. The aggregated industry wide fee is expected to total $28 billion through 2019, ranging from $2.5 billion to $4.1 billion annually. The IRS has issued guidance for calculating preliminary fees, but there is still uncertainty as to final implementation, since the IRS has requested public comment and may make changes in response. This industry wide branded prescription drug fee negatively impacted our earnings by $0.5 million during the fiscal year ended September 30, 2013 and by $0.4 million and $0.3 million in fiscal years 2012 and 2011, respectively. Further, the law requires pharmaceutical, medical device, biological, and medical supply manufacturers to begin reporting to the federal government by March 31, 2014, the payments they make to physicians and teaching hospitals, and physician ownership interests in those entities. The effective date of such reporting is August 1, 2013. The law also provides for the creation of an abbreviated regulatory pathway for FDA approval of biosimilars and interchangeable biosimilar products. While creation of the biosimilars program is authorized as of passage of the legislation in 2010, the process of creating the regulatory pathway for approval of biosimilars will likely be lengthy, and the FDA is in the process of soliciting public input.
While certain aspects of the new legislation implemented in 2010 are expected to reduce our revenues in future years, other provisions of this legislation may offset, at some level, any reduction in revenues when these provisions become effective. In future years these other provisions are expected to result in higher revenues due to an increase in the total number of patients covered by health insurance and an expectation that existing insurance coverage will provide more comprehensive consumer protections. This would include a federal subsidy for a portion of a beneficiary’s out-of-pocket cost under Medicare Part D. However, these higher revenues may be negatively impacted by the branded prescription drug manufacturers’ increased emphasis on co-insurance and incentives driving the greater use of generic alternatives.
Factors Affecting Our Results of Operations
Revenue
We generate two types of revenue: revenue from product sales (including revenue we generate from the sale of products we manufacture for third parties) and other revenue, which currently includes development fees, royalties and other revenue.
Net Product Sales
We currently sell products in various product categories that treat CF and a broad range of GI diseases and disorders. During fiscal year 2013, sales of three product lines, ZENPEP, CANASA and CARAFATE, accounted for 63% of our net product sales (61% in fiscal year 2012), but no single product line accounted for more than 22% of our net product sales (21% in fiscal year 2012). Our portfolio of products is also geographically diverse, with 20% of our net product sales being generated from sales outside the United States in fiscal year 2013 (24% in fiscal year 2012). While the ultimate end users of our products are the individual patients to whom our products are prescribed by physicians, the majority of our sales are to large pharmaceutical wholesale distributors. These distributors sell our products primarily to pharmacies, which ultimately dispense our products to the end consumers. In addition, many of our products have been commercialized in export markets through licensing and distribution agreements with local marketing partners.
Net product sales are stated net of deductions for product returns, chargebacks, contract rebates, distribution service agreement, or DSA, fees, discounts and other allowances.
Included in net product sales are amounts earned under agreements pursuant to which we manufacture products for third parties. Revenue from these types of arrangements was $86.2 million for the fiscal year ended September 30, 2013 ($85.3 million in fiscal year 2012).
77
Table of Contents
Changes in revenue from sales of our products from period to period are affected by factors that include the following:
| Ÿ | changes in the level of promotional or marketing support for our products and the size of our sales force; |
| Ÿ | changes in the level of competition faced by our products, including changes due to the launch of new branded products by our competitors and the introduction of generic equivalents of our branded products or those of our competitors prior to, or following, the loss of regulatory exclusivity or patent protection. For example, during fiscal years 2012 and 2013, generic competitors of DELURSAN 250mg entered the market, which may negatively impact future sales of DELURSAN 250mg and DELURSAN 500mg; |
| Ÿ | price changes, which are common in the branded pharmaceutical industry and, for the purposes of our period-over-period comparisons, reflect the average gross selling price billed to our customers before any sales-related deductions; |
| Ÿ | changes in the regulatory environment, including the impact of healthcare reforms in the United States and other markets we serve; |
| Ÿ | our ability to successfully develop or acquire and launch new products; |
| Ÿ | our ability to supply product in amounts sufficient to meet customer demand; |
| Ÿ | changes in the level of demand for our products, including changes based on general economic conditions in North American and Western European economies or industry-specific business conditions; |
| Ÿ | long-term growth or contraction of our core therapeutic markets, including CF and GI disorders; |
| Ÿ | inventory levels at our distributors and wholesalers; |
| Ÿ | the size and timing of product orders, which can be affected by customer budgeting and buying patterns; |
| Ÿ | internal factors, such as changes in business strategies and the impact of restructurings and business combinations; and |
| Ÿ | changes in the levels of sales-related deductions, including those resulting from changes in utilization levels or the terms of our patient assistance programs and the utilization and/or rebates paid under commercial and government rebate programs. |
Other Revenue
Other revenue consists of development fees, royalties and other revenue, which can vary depending on the timing, stage of development or commercialization. We earn royalty revenues from some of our collaborators equal to a percentage of their sales of products for which we provided development assistance.
Development of a new pharmaceutical formulation generally includes the following stages:
| Ÿ | feasibility and prototype development; |
| Ÿ | formulation optimization and preparation of pilot clinical samples; |
| Ÿ | scale-up, validation and preparation of clinical samples for regulatory and commercial purposes; |
| Ÿ | clinical trials; and |
| Ÿ | preparation of documents and regulatory filings. |
78
Table of Contents
We apply our proprietary PT platforms in one of two ways—either to develop products on behalf of our collaborators or to develop or enhance our internal products. In both situations, we are involved in all stages of the formulation development process and perform largely the same types of work although, in general, we only perform clinical trials for the products we develop internally. Clinical trials for co-developed products are typically performed by our collaboration partners. For internal projects, we fund all of the development costs with a view either to out-license the product once it is fully developed and has obtained the applicable regulatory approvals, or to market it directly.
Cost of Goods Sold (excluding depreciation and amortization)
Cost of goods sold consists principally of materials costs, internal labor and overhead from our owned manufacturing sites, third-party processing costs, other supply chain costs and royalties paid to our licensors. The manufacturing supply chain for our products is supported by our manufacturing facilities located in the United States and Europe and by third parties. We manufacture ZENPEP and ULTRESA at one of our facilities in Italy, LACTEOL at our facility in France, CANASA and rectal formulations of SALOFALK at our facility in Canada and other PT products in the United States and Italy. We have entered into agreements with third parties to manufacture the finished dosage form of most of our promoted products, other than ULTRESA, ZENPEP, LACTEOL, rectal formulations of SALOFALK and for certain parts of the manufacturing process for CANASA. Depending on the particular arrangement, either we or the third-party manufacturer sources the active pharmaceutical ingredient. With the exception of LACTEOL, we rely on third parties to supply the active pharmaceutical ingredient used in our finished products and have entered into supply agreements with most of our suppliers. Active pharmaceutical ingredients and excipients for certain of our products, including ZENPEP, are sourced from single suppliers. We use third parties and internal laboratories to perform analytical testing on our raw materials, active pharmaceutical ingredients, finished products and product candidates.
Our agreements with suppliers, manufacturers and testing laboratories include, among others, specific supply terms, product specifications, testing and release mechanisms, batch size requirements, price, payment terms, forecast requirements, shipping and quality assurance conditions. Under some of these agreements, we are obligated to purchase all or a specified percentage of our requirements for the product or active pharmaceutical ingredient supplied under the agreement. These agreements generally permit the manufacturer or supplier to pass on to us increases in cost of production or materials.
Selling and Administrative Expenses (excluding depreciation and amortization)
Selling and administrative expenses, on an ongoing basis, consist principally of salaries and other costs associated with our sales force and marketing activities and general administration of our business. Selling and administrative expenses may be affected by a number of factors, including the launch of new products, new marketing programs, changes in our sales force personnel, certain administrative functions, including IT initiatives, and any acquisition synergies we are able to achieve.
Management fees
Management fees consist of fees and other charges associated with the management agreements with our Sponsors, which automatically terminate upon consummation of this offering. See “Certain Relationships and Related Party Transactions.”
Research and development expenses (excluding depreciation and amortization)
Research and development expenses refer to (i) internal research and development expenses which consist principally of fees paid to outside parties that we use to conduct clinical studies and to
79
Table of Contents
submit governmental approval applications on our behalf, as well as the salaries and benefits paid to personnel involved in research and development projects, as well as payments to third parties and (ii) research and development expenses on a number of external projects with third parties that generate development fee revenues and consist principally of personnel costs. These expenses vary depending on the number of clinical trials being run by us during any reporting period.
Acquired in-process research
The fair value of in-process research acquired in a business combination is capitalized as an indefinite-lived intangible asset subject to impairment testing until completion or abandonment of the project. The fair value of in-process research acquired as part of an asset acquisition is expensed on acquisition.
Depreciation and amortization
Depreciation and amortization consists principally of the amortization of intangible assets with a finite life and also includes the depreciation of property, plants and equipment. Intangible assets include trademarks, trademark licenses and manufacturing rights.
Transaction, restructuring and integration costs
Transaction, restructuring and integration costs consists principally of costs incurred in relation with our restructuring measures in conjunction with the integration of the operations of Eurand as well as within our ongoing legacy operations. These measures are intended to capture further synergies and generate cost savings across the Company. Restructuring actions taken include workforce reductions across the Company and other organizational changes. These reductions come primarily from the elimination of redundancies and the consolidation of staff in the sales and marketing, manufacturing, research and development, and general and administrative functions.
Financial expenses
Financial expenses consist principally of (i) interest and fees, inclusive of the effects of our hedging instruments, paid in connection with (a) funds borrowed in connection with the Eurand Transaction, (b) funds borrowed for the acquisition of the Company by TPG in February 2008 and (c) any refinancing expenses incurred in connection with our borrowings and (ii) accretion expense on amounts payable for the Mpex Transaction and Rectiv Transaction.
Financial Overview for the Fiscal Years Ended September 30, 2013 and 2012
This discussion and analysis is based on our audited annual consolidated financial statements at and for the fiscal years ended September 30, 2013 and 2012 and the related notes thereto reported under GAAP. For a description of our products, see “Business—Our Products.”
For the fiscal year ended September 30, 2013, total revenue was $687.9 million as compared to $615.1 million in fiscal year 2012, operating income was $190.1 million as compared to $113.1 million in fiscal year 2012 and net income was $86.9 million as compared to a net loss of $12.0 million in fiscal year 2012.
Total revenue in the United States was $548.6 million (79.7% of total revenue) for the fiscal year ended September 30, 2013, compared to $469.5 million (76.3% of total revenue) in fiscal year 2012. Total revenue earned outside the United States was $139.3 million (20.3% of total revenue) for the fiscal year ended September 30, 2013, compared to $145.6 million (23.7% of total revenue) in fiscal year 2012.
80
Table of Contents
Fiscal year ended September 30, 2013, compared to the fiscal year ended September 30, 2012
Overview of results of operations
| Year Ended September 30, | Change | |||||||||||||||
| 2013 | 2012 | |||||||||||||||
| (in millions of U.S. dollars, except percentages) | ||||||||||||||||
Net product sales | $ | 667.7 | $ | 600.9 | $ | 66.8 | 11.1 | % | ||||||||
Other revenue | 20.2 | 14.2 | 6.0 | 42.3 | ||||||||||||
|
|
|
|
|
|
|
| |||||||||
Total revenue | 687.9 | 615.1 | 72.8 | 11.8 | ||||||||||||
Cost of goods sold(a) | 146.6 | 144.2 | 2.4 | 1.7 | ||||||||||||
Selling and administration expenses(a) | 172.5 | 168.8 | 3.7 | 2.2 | ||||||||||||
Management fees | 7.0 | 5.7 | 1.3 | 22.8 | ||||||||||||
Research and development expenses(a) | 65.5 | 72.6 | (7.1 | ) | (9.8 | ) | ||||||||||
Depreciation and amortization | 94.7 | 101.7 | (7.0 | ) | (6.9 | ) | ||||||||||
Gain on disposal of product line | (1.0 | ) | — | (1.0 | ) | * | ||||||||||
Transaction, restructuring and integration costs | 2.5 | 12.4 | (9.9 | ) | (79.8 | ) | ||||||||||
Fair value adjustments to intangible assets and contingent consideration | 10.0 | (3.4 | ) | 13.4 | 392.4 | |||||||||||
|
|
|
|
|
|
|
| |||||||||
Total operating expenses | 497.8 | 502.0 | (4.2 | ) | (0.8 | ) | ||||||||||
|
|
|
|
|
|
|
| |||||||||
Operating income | 190.1 | 113.1 | 77.0 | 68.1 | ||||||||||||
Financial expenses | 68.8 | 80.2 | (11.4 | ) | (14.2 | ) | ||||||||||
Loss on extinguishment of debt | — | 23.1 | (23.1 | ) | (100.0 | ) | ||||||||||
Interest income | (0.4 | ) | (0.2 | ) | (0.2 | ) | (100.0 | ) | ||||||||
Loss on foreign currencies | 0.1 | 0.2 | (0.1 | ) | (50.0 | ) | ||||||||||
Total other expenses | 68.5 | 103.3 | (34.8 | ) | (33.7 | ) | ||||||||||
|
|
|
|
|
|
|
| |||||||||
Income before income taxes | 121.6 | 9.8 | 111.8 | 1,140.8 | ||||||||||||
Income tax expense | 34.7 | 21.8 | 12.9 | 59.2 | ||||||||||||
|
|
|
|
|
|
|
| |||||||||
Net income (loss) | $ | 86.9 | $ | (12.0 | ) | $ | 98.9 | * | % | |||||||
|
|
|
|
|
|
|
| |||||||||
| (a) | Exclusive of depreciation and amortization |
| * | Not meaningful |
Net product sales
Net product sales in the United States increased $74.8 million to $532.7 million for the fiscal year ended September 30, 2013 as compared to $457.9 million for the preceding fiscal year, primarily due to strong sales performance within our U.S. specialty pharmaceuticals product portfolio which accounted for $67.8 million of the increase while our U.S. PT product portfolio accounted for the remaining $7.0 million increase. This growth in our U.S. specialty pharmaceuticals product portfolio is attributable to a mixture of sales price increases as well as increased sales volume across most of our product portfolio. Gross product sales increased by $121.9 million in aggregate and were partially offset by increases in sales deductions of $54.1 million.
Net product sales from our international operations decreased by $8.0 million to $135.0 million for the fiscal year ended September 30, 2013, compared to $143.0 million for the preceding fiscal year. This decrease is due mostly to lower sales performance of $6.1 million in our international PT product portfolio compared to the previous fiscal year and a decrease of $1.9 million in sales performance within our international specialty pharmaceuticals product portfolio.
81
Table of Contents
Net product sales are stated net of deductions for product returns, chargebacks, contract rebates, DSA fees, discounts and other allowances. The following table summarizes our gross-to-net product sales adjustments for each significant category:
| Year Ended September 30, | Change | |||||||||||||||
| 2013 | 2012 | |||||||||||||||
| (in millions of U.S. dollars, except percentages) | ||||||||||||||||
Gross product sales | $ | 867.2 | $ | 746.1 | $ | 121.1 | 16.2 | % | ||||||||
Gross-to-net product sales adjustments: | ||||||||||||||||
Product returns | 1.2 | 2.5 | (1.3 | ) | (52.0 | ) | ||||||||||
Medicaid and other government programs | 71.8 | 51.8 | 20.0 | 38.6 | ||||||||||||
Chargebacks | 52.0 | 37.7 | 14.3 | 37.9 | ||||||||||||
Contract rebates | 38.5 | 30.9 | 7.6 | 24.6 | ||||||||||||
DSA fees, discounts and other allowances | 36.0 | 22.3 | 13.7 | 61.4 | ||||||||||||
|
|
|
|
|
|
|
| |||||||||
Total gross-to-net product sales adjustments | 199.5 | 145.2 | 54.3 | 37.4 | ||||||||||||
|
|
|
|
|
|
|
| |||||||||
Total net product sales | $ | 667.7 | $ | 600.9 | $ | 66.8 | 11.1 | % | ||||||||
|
|
|
|
|
|
|
| |||||||||
Total gross-to-net sales adjustments totaled $199.5 million (23.0% of gross product sales) for the fiscal year ended September 30, 2013, compared to $145.2 million (19.5% of gross product sales) for the preceding fiscal year. The increase in total deductions as a percentage of gross product sales is due in part to:
| Ÿ | changes in sales mix toward products with higher sales deductions as percentage of gross sales; |
| Ÿ | the continued effects of the Affordable Care Act, which in turn have driven an increase in Medicaid, and other government programs, as well as an increase in chargebacks; and |
| Ÿ | an increase in DSA fees, discounts and other allowances which have increased primarily as a result of our patient assistance programs. |
The following table summarizes our net product sales by category. U.S. specialty pharmaceutical sales includes net product sales in the United States for CANASA, CARAFATE, PYLERA and RECTIV, as well as for our PEPs, including ZENPEP, ULTRESA and VIOKACE. The “other” category includes net product sales from all other products, other than PT, we sell in the United States. International specialty pharmaceuticals, or ISP, includes all net product sales outside of the United States of SALOFALK, PANZYTRAT and PYLERA. Worldwide PT reflects the revenue we generate from manufacturing products for third parties.
| Year Ended September 30, | ||||||||||||||||
| 2013 | 2012 | Change | ||||||||||||||
| (in millions of U.S. dollars, except percentages) | ||||||||||||||||
Pancreatic Enzyme Portfolio (PEPs) | $ | 145.8 | $ | 126.6 | $ | 19.2 | 15.2 | % | ||||||||
CARAFATE | 144.5 | �� | 121.7 | 22.8 | 18.7 | |||||||||||
CANASA | 132.7 | 118.9 | 13.8 | 11.6 | ||||||||||||
PYLERA | 21.3 | 16.7 | 4.6 | 27.5 | ||||||||||||
RECTIV | 15.9 | 4.0 | 11.9 | 297.5 | ||||||||||||
Other | 24.9 | 29.4 | (4.5 | ) | (15.3 | ) | ||||||||||
|
|
|
|
|
|
|
| |||||||||
Total U.S. Specialty Pharmaceuticals | 485.1 | 417.3 | 67.8 | 16.2 | ||||||||||||
International Specialty Pharmaceuticals (ISP) | 96.4 | 98.3 | (1.9 | ) | (1.9 | ) | ||||||||||
Worldwide Pharmaceutical Technology (PT) product sales | 86.2 | 85.3 | 0.9 | 1.0 | ||||||||||||
|
|
|
|
|
|
|
| |||||||||
Total | $ | 667.7 | $ | 600.9 | $ | 66.8 | 11.1 | % | ||||||||
|
|
|
|
|
|
|
| |||||||||
82
Table of Contents
Other Revenue
Development fees decreased by $1.8 million (22.0%) to $6.4 million for the fiscal year ended September 30, 2013, compared to $8.2 million for the preceding fiscal year.
Royalties and other revenue increased by $7.8 million (130.0%) to $13.8 million for the fiscal year ended September 30, 2013, compared to $6.0 million for the preceding fiscal year. The increase for the fiscal year ended September 30, 2013 primarily relates to one-time milestone payments of $4.9 million in aggregate related to arrangements pertaining to our LACTEOL and Innopran XL product lines recorded in the first quarter of fiscal year 2013. We generally earn royalty revenues from certain of our collaborators based on a percentage of their sales of products developed with our assistance.
Cost of goods sold
For the fiscal year ended September 30, 2013, cost of goods sold increased $2.4 million (1.7%) to $146.6 million, from $144.2 million for the preceding fiscal year. As a percentage of net product sales, cost of goods sold for the fiscal year ended September 30, 2013, decreased to 22.0% compared to 24.0% for the corresponding period of the preceding fiscal year. The decrease as a percentage of net product sales is explained mainly by the effects of price increases within our U.S. Specialty Pharmaceuticals product portfolio.
Selling and administrative expenses
For the fiscal year ended September 30, 2013, selling and administrative expenses increased $3.7 million (2.2%) to $172.5 million, from $168.8 million for the preceding fiscal year. The increase is mainly due to (a) a $2.0 million increase related to an expansion of our contract sales force; (b) $0.9 million higher compensation costs, which in turn are primarily due to additional headcount due in part to the expansion of our sales force; and (c) $2.2 million of increases in marketing and selling costs primarily due to increased sampling, all offset by (d) a decrease of $1.8 million related to sales and marketing efforts related to the launch of RECTIV and VIOKACE as compared to the preceding fiscal year.
Management fees
Management fees consist of fees and other charges associated with the management agreements with our Sponsors. For the fiscal year ended September 30, 2013, management fees increased by $1.3 million to $7.0 million from $5.7 million for the preceding fiscal year. The increase is due to a corresponding increase in Adjusted EBITDA, which is the main driver of determining the management fees paid to our Sponsors.
Research and development expenses
For the fiscal year ended September 30, 2013, research and development expenses decreased $7.1 million (9.8%) to $65.5 million, from $72.6 million for preceding fiscal year. Our main research and development initiatives in 2013 were APT-1026, APT-1016, APT-1011 and APT-1008. The decrease in research and development expenses was mainly due to (a) $11.4 million lower spending on the development of APT-1026 as a result of having completed the clinical trials; (b) $1.2 million lower spending on our research and development related to our PEP products including APT-1008; (c) lower spending associated with other research and development initiatives amounting to $2.2 million compared to the preceding fiscal year. These decreases were partially offset by additional spending on development of suspension products amounting to $6.0 million, which in turn is inclusive of a development royalty related to APT-1011 which we began incurring during the fourth quarter of fiscal year 2012 and is charged to research and development expenses.
83
Table of Contents
Depreciation and amortization
For the fiscal year ended September 30, 2013, depreciation and amortization decreased by $7.0 million (6.9%) to $94.7 million, from $101.7 million for the preceding fiscal year. The decrease in depreciation and amortization was due to the offsetting effects of certain intangible assets having become fully amortized at the end of the first quarter of fiscal year 2013 and the additional amortization expenses included in fiscal year 2013 compared to fiscal year 2012 related to the Rectiv Transaction. In addition, during the quarter ended on June 30, 2013, we revised the estimated remaining useful life of CANASA intangible assets, which resulted in $1.7 million in additional amortization expense during the fiscal year ended September 30, 2013 and will increase annual amortization expense by approximately $5.0 million over the remaining useful life of four years.
Gain on disposal of product line
On March 28, 2011, we entered into a definitive agreement with Pinnacle, pursuant to which it acquired all global assets and rights related to PHOTOFRIN/PHOTOBARR, including inventory, for non-contingent payments to us amounting to $4.3 million. In addition to the non-contingent payments, Pinnacle is required to make additional contingent payments to us if certain milestone events are achieved. We also receive royalties on annual net sales of PHOTOFRIN/PHOTOBARR.
Consideration for additional contingent payments to be made to us, if any, will be recorded as a gain in the period in which they are received. We earned milestone payments of $1.0 million in the first quarter of fiscal year 2013 and recorded a corresponding gain, as compared to fiscal year 2012 in which we did not record gains or losses from contingent payments.
Transaction, restructuring and integration costs
We did not incur transaction-related costs during the fiscal years ended September 30, 2013 or 2012.
During the fiscal year ended September 30, 2013, we recorded a restructuring expense of $1.9 million ($1.9 million during the fiscal year ended September 30, 2012) related to planned employee termination costs. Employee termination costs are generally recorded when the actions are communicated, probable and estimable and include accrued severance benefits and health insurance continuation, many of which may be paid out during periods after termination.
During the fiscal year ended September 30, 2013, we incurred integration costs of $0.6 million as compared to $10.5 million during the preceding fiscal year. Integration costs mainly represent certain external incremental costs directly related to integrating Eurand and primarily include expenditures for consulting and systems integration. We completed phase I of our initiative to optimize our enterprise resource planning systems across the organization in fiscal year 2012 and launched phase II in the first quarter of fiscal year 2013. The decreases in integration costs during the fiscal year ended September 30, 2013 as compared to the preceding fiscal year are a result of having substantially completed phase I of the integration of Eurand.
Fair value adjustments to intangible assets and contingent consideration
We recorded a trademark license intangible asset of $139.2 million resulting from the Rectiv Transaction in the first quarter of fiscal year 2012. Due to the continuing effects of RECTIV sales having performed below initial expectations, we revisited our long-term projection assumptions used in our assessment of the carrying value of our intangible asset and the contingent consideration liability relating to RECTIV during the fourth quarter of the fiscal year ended September 30, 2013. These changes to long-term projection assumptions were made as a result of ongoing competition from compounding pharmacies as well as the issue surrounding the introduction of the Compounding
84
Table of Contents
Quality Act, which was introduced during the fourth quarter of fiscal year 2013 and was signed into law on November 27, 2013. As a result, we recorded an impairment charge of $65.2 million relating to the RECTIV intangible asset.
We recorded accretion expense related to the increase in the net present value of the contingent liability related to RECTIV of $13.0 million for the fiscal year ended September 30, 2013 ($11.4 million for the preceding fiscal year). We also recorded a change in the fair value of the contingent consideration related to the Rectiv Transaction which reduced the liability by $74.7 million for the fiscal year ended September 30, 2013 ($14.7 million for the preceding fiscal year). These two offsetting adjustments inclusive of accretion expense were recorded as fair value adjustments to intangible assets and contingent consideration within our consolidated statement of operations.
Similarly, during the fourth quarter of the fiscal year ended September 30, 2013, Actavis Inc. announced that it had received an approval from the FDA on its ANDA for Lamotrigine Orally Disintegrating Tablets, a generic equivalent to LAMICTAL® ODT, which we manufacture for GlaxoSmithKline. As a result of this approval, we revised our forecasts and determined that our intangible assets tied to our supply agreement for LAMICTAL were impaired. As a result, we recorded an impairment charge of $6.5 million related to our LAMICTAL supply agreement intangible asset to reduce the asset value to zero.
Financial expenses
For the fiscal year ended September 30, 2013, financial expenses decreased by $11.4 million (14.2%) to $68.8 million, from $80.2 million for the preceding fiscal year.
The $11.4 million decrease in financial expenses is mainly due to fiscal year 2013 savings in interest expense amounting to $10.0 million resulting from redeeming our $235.0 million 12.75% senior unsecured notes and funded by a $200 million term loan bearing a lower interest rate based on the three-month LIBOR (subject to a floor of 1.5% in the case of Term B-1 Loans and Term B-2 Loans) plus a margin of 4.0%.
Loss on extinguishment of debt
On March 19, 2012, we redeemed $40.0 million aggregate principal amount of our senior unsecured notes at a redemption price of 106.375%. On April 18, 2012, we redeemed all of the remaining outstanding principal amount of 12.75% senior unsecured notes through a cash tender offer. The total redemption amount consisted of $195.0 million in aggregate principal and $13.6 million of redemption premiums. The difference between the net carrying value and the repayment price of the notes was recognized as a loss on extinguishment of debt. For the fiscal year ended September 30, 2012, loss on extinguishment of debt amounted to $23.1 million and comprised of the write-off of the unamortized deferred financing fees, the original issuance discount and the redemption premium. We did not have any loss on extinguishment of debt in the fiscal year ended September 30, 2013.
Interest income
For the fiscal year ended September 30, 2013, total interest income amounted to $0.4 million compared to $0.2 million for the preceding fiscal year.
Income taxes
For the fiscal year ended September 30, 2013, income tax expense amounted to $34.7 million compared to $21.8 million for the preceding fiscal year. The effective tax rate was 28.6% for the fiscal year ended September 30, 2013, compared to 222.6% for the preceding fiscal year.
85
Table of Contents
The effective tax rate for the year ended September 30, 2013 is affected by a number of elements, the most important being: (a) the decrease in valuation allowance of $36.9 million; (b) the difference in foreign tax rates, which accounted for a difference of $24.8 million; (c) unrecognized outside basis difference for foreign subsidiaries of $30.8 million; (d) previously unrecognized outside basis difference for foreign subsidiaries of $101.0 million; (e) foreign tax credits of $ 56.3 million and (f) a $16.5 million tax benefit arising from a financing structure. The effective tax rate for the year ended September 30, 2012 is affected by a number of items, the most important being (i) the impact of relative fixed amounts of permanent tax effects compared to a small pre-tax result from operations, (ii) a $16.6 million tax benefit arising from a financing structure, (iii) the increase of a valuation allowance of $50.0 million, (iv) an $11.0 million difference attributable to differences in foreign tax rates; (v) non-deductible items of $3.7 million; and (vi) research and development tax credits of $6.7 million. If, in future periods, the deferred tax assets are determined by management to be more likely than not to be realized, the tax benefits relating to the reversal of the valuation allowance will be recorded in the Consolidated Statements of Operations.
The difference between our effective tax rate of 28.6% for the year ended September 30, 2013 and the statutory income tax rate of 35% is summarized as follows:
| Year Ended September 30, | ||||||||||||||||
| 2013 | 2012 | |||||||||||||||
| (in millions of U.S. dollars, except percentages) | ||||||||||||||||
Combined statutory rate applied to pre-tax income (loss) | 35.00 | % | $ | 42.5 | 35.00 | % | $ | 3.4 | ||||||||
Increase (decrease) in taxes resulting from: | ||||||||||||||||
Change in promulgated rates | — | — | 0.62 | — | ||||||||||||
Difference with foreign tax rates | (20.42 | ) | (24.8 | ) | (112.76 | ) | (11.0 | ) | ||||||||
Unrecognized outside basis difference for foreign subsidiaries | 25.35 | 30.8 | — | — | ||||||||||||
Previously unrecognized outside basis difference for foreign subsidiaries | 83.09 | 101.0 | — | — | ||||||||||||
Foreign tax credits | (46.33 | ) | (56.3 | ) | ||||||||||||
Tax benefit arising from a financing structure | (13.61 | ) | (16.5 | ) | (169.79 | ) | (16.6 | ) | ||||||||
Unrecognized tax benefit reversal | — | — | (20.68 | ) | (2.0 | ) | ||||||||||
Non-deductible items | 1.06 | 1.3 | 37.55 | 3.7 | ||||||||||||
Research and development tax credits | (3.50 | ) | (4.3 | ) | (68.24 | ) | (6.7 | ) | ||||||||
State taxes | 0.18 | 0.2 | 5.57 | 0.5 | ||||||||||||
Change in valuation allowance | (30.36 | ) | (36.9 | ) | 510.54 | 50.0 | ||||||||||
Other | (1.81 | ) | (2.3 | ) | 4.79 | 0.5 | ||||||||||
|
|
|
|
|
|
|
| |||||||||
| 28.55 | % | $ | 34.7 | 222.60 | % | $ | 21.8 | |||||||||
|
|
|
|
|
|
|
| |||||||||
On September 30, 2013, we elected under applicable provisions of the Internal Revenue Code to recharacterize foreign taxes previously deducted as foreign tax credit carry forwards. The net adjustment resulting from the changes to the net operating loss carry forward deferred tax assets, the foreign tax credit carry forward deferred tax assets and valuation allowance is presented in the effective rate reconciliation above.
As of September 30, 2013, we had $287 million ($229 million as of September 30, 2012) of unremitted earnings in respect to our international subsidiaries. As a result of the distribution made to the shareholders in October 2013, cash was repatriated from the foreign subsidiaries. We commenced the associated income tax planning and other efforts prior to the end of fiscal year 2013 and, as such, we can no longer assert the permanent reinvestment of earnings of our foreign subsidiaries. A deferred income tax liability amounting to $101 million on the outside basis of a subsidiary that was not recorded
86
Table of Contents
as of June 2013 has been recorded in the fourth quarter of fiscal year 2013. The recognition of such deferred income liability allowed us to decrease our valuation allowance for the same amount in the United States. The repatriation of earnings that was done in the first quarter of the fiscal year 2014 will reduce the United States net operating losses and tax credits available by an equivalent amount. While deferred income tax assets will offset this deferred income tax liability, the allocation of the valuation allowance on a pro rata basis resulted in the presentation of current deferred income tax liability and non-current deferred income tax assets of $52.9 million. As of September 30, 2013, the outside tax basis of certain of our foreign subsidiaries exceeded the GAAP basis and, therefore, deferred income tax assets have not been recorded given that the amounts are not projected to reverse in the foreseeable future.
Balance sheets as at September 30, 2013 and September 30, 2012
The following table summarizes balance sheet information as at September 30, 2013, compared to September 30, 2012.
| September 30, 2013 | September 30, 2012 | Change | ||||||||||||||
| (in millions of U.S. dollars, except percentages) | ||||||||||||||||
Cash and cash equivalents | $ | 229.9 | $ | 115.0 | $ | 114.9 | 99.9 | % | ||||||||
Current assets | 401.2 | 287.9 | 113.3 | 39.4 | ||||||||||||
Total assets | 1,341.2 | 1,316.8 | 24.4 | 1.9 | ||||||||||||
Current liabilities | 261.6 | 236.5 | 25.1 | 10.6 | ||||||||||||
Long-term debt | 911.8 | 920.0 | (8.2 | ) | (0.9 | ) | ||||||||||
Total liabilities | 1,294.6 | 1,376.0 | (81.4 | ) | (5.9 | ) | ||||||||||
Shareholders’ equity (deficit) | 46.6 | (59.2 | ) | 105.8 | 178.7 | |||||||||||
Working capital, exclusive of cash | $ | (90.3 | ) | $ | (63.6 | ) | $ | (26.7 | ) | 42.0 | % | |||||
Working capital, exclusive of cash decreased by $26.7 million (42.0%) to $(90.3) million as at September 30, 2013, from $(63.6) million as at September 30, 2012 primarily as a result of a net increase in current liabilities of $25.1 million. The increase in current liabilities is due to an increase in deferred income tax liability of $52.9 million partially offset by a reduction in accounts payable and accrued liabilities of $10.6 million, which in turn was largely a result of having made $32.0 million of milestone payments on RECTIV and APT-1026 during the first quarter of fiscal year 2013 and a decrease in income tax payable of $16.2 million.
Total assets increased by $24.4 million (1.9%) to $1,341.2 million as at September 30, 2013, from $1,316.8 million as at September 30, 2012, primarily due to (a) an increase in cash and cash equivalents of $114.9 million, and (b) an increase in deferred income tax assets of $51.8 million, partially offset by a reduction of non-current assets of $141.8 million, which in turn is largely a result of the effects of impairment of intangible assets of $71.7 million and depreciation and amortization which amounted to $94.8 million.
Long-term debt decreased by $8.2 million (0.9 %) to $911.8 million as at September 30, 2013, from $920.0 million as at September 30, 2012, mainly as a result of capital repayments made and partially offset by amortization of the original issuance discounts on the debt.
Financial Overview for the Fiscal Years Ended September 30, 2012 and 2011
This discussion and analysis is based on our audited annual consolidated financial statements at and for the fiscal years ended September 30, 2012 and 2011 and the related notes thereto reported under GAAP. The results of Eurand’s business have been included in our results of operations, financial condition and cash flows only for the period subsequent to the completion of the Eurand Transaction on February 11, 2011. For a description of our products, see “Business—Our Products.”
87
Table of Contents
For the fiscal year ended September 30, 2012, total revenue was $615.1 million as compared to $470.4 million in fiscal year 2011, operating income was $113.1 million as compared to operating loss of $66.7 million in fiscal year 2011 and net loss was $12.0 million as compared to $191.6 million in fiscal year 2011.
Total revenue in the United States was $469.4 million (76.3% of total revenue) for the fiscal year ended September 30, 2012, compared to $337.7 million (71.8% of total revenue) in fiscal year 2011. Total revenue earned outside the United States was $145.7 million (23.7% of total revenue) for the fiscal year ended September 30, 2012, compared to $132.7 million (28.2% of total revenue) in fiscal year 2011.
Fiscal year ended September 30, 2012, compared to the fiscal year ended September 30, 2011
Overview of results of operations
| Year Ended September 30, | ||||||||||||||||
| 2012 | 2011 | Change | ||||||||||||||
| (in millions of U.S. dollars, except percentages) | ||||||||||||||||
Net product sales | $ | 600.9 | $ | 461.4 | $ | 139.5 | 30.2 | % | ||||||||
Other revenue | 14.2 | 9.0 | 5.2 | 57.8 | ||||||||||||
|
|
|
|
|
|
|
| |||||||||
Total revenue | 615.1 | 470.4 | 144.7 | 30.8 | ||||||||||||
Cost of goods sold(a) | 144.2 | 135.4 | 8.8 | 6.5 | ||||||||||||
Selling and administration expenses(a) | 168.8 | 143.5 | 25.3 | 17.6 | ||||||||||||
Management fees | 5.7 | 3.6 | 2.1 | 58.3 | ||||||||||||
Research and development expenses(a) | 72.6 | 58.0 | 14.6 | 25.2 | ||||||||||||
Acquired in-process research | — | 65.5 | (65.5 | ) | (100.0 | ) | ||||||||||
Depreciation and amortization | 101.7 | 72.8 | 28.9 | 39.7 | ||||||||||||
Loss on disposal of product line | — | 7.4 | (7.4 | ) | (100.0 | ) | ||||||||||
Transaction, restructuring and integration costs | 12.4 | 50.9 | (38.5 | ) | (75.6 | ) | ||||||||||
Fair value adjustments to intangible assets and contingent consideration | (3.4 | ) | — | (3.4 | ) | * | ||||||||||
|
|
|
|
|
|
|
| |||||||||
Total operating expenses | 502.0 | 537.1 | (35.1 | ) | (6.5 | ) | ||||||||||
|
|
|
|
|
|
|
| |||||||||
Operating income (loss) | 113.1 | (66.7 | ) | 179.8 | 269.6 | |||||||||||
|
|
|
|
|
|
|
| |||||||||
Financial expenses | 80.2 | 89.5 | (9.3 | ) | (10.4 | ) | ||||||||||
Loss on extinguishment of debt | 23.1 | 28.3 | (5.2 | ) | (18.4 | ) | ||||||||||
Interest income | (0.2 | ) | (0.4 | ) | 0.2 | 50.0 | ||||||||||
Loss on foreign currencies | 0.2 | 0.1 | 0.1 | 100.0 | ||||||||||||
Total other expenses | 103.3 | 117.5 | (14.2 | ) | (12.1 | ) | ||||||||||
|
|
|
|
|
|
|
| |||||||||
Income (loss) before income taxes | 9.8 | (184.2 | ) | 194.0 | 105.3 | |||||||||||
Income tax expense | 21.8 | 7.4 | 14.4 | 194.6 | ||||||||||||
|
|
|
|
|
|
|
| |||||||||
Net loss | $ | (12.0 | ) | $ | (191.6 | ) | $ | 179.6 | 93.7 | % | ||||||
|
|
|
|
|
|
|
| |||||||||
| (a) | Exclusive of depreciation and amortization |
| * | Not meaningful |
Net product sales
Net product sales in the United States increased by $127.9 million (38.8%) to $457.9 million for the fiscal year ended September 30, 2012, compared to $330.0 million for the preceding fiscal year. This increase is mostly due to (a) the inclusion of a full year of sales of Eurand products and growth on
88
Table of Contents
those products, most notably ZENPEP, amounting to $77.8 million, (b) the launch of RECTIV and VIOKACE with sales amounting to $5.0 million and (c) an increase of $45.1 million in the sales performance of our other products, most notably CANASA and CARAFATE.
Net product sales in our international operations increased by $11.6 million (8.8%) to $143.0 million for the fiscal year ended September 30, 2012, compared to $131.4 million for the preceding fiscal year. The increase is due mostly to the inclusion of post-acquisition sales of Eurand PT products amounting to $19.4 million partially offset by an unfavorable sales performance of other portfolio products compared to the prior year amounting to $7.8 million including the effects of $5.2 million of unfavorable foreign currency fluctuations.
The following table summarizes our gross-to-net product sales adjustments for each significant category:
| Year Ended September 30, | ||||||||||||||||
| 2012 | 2011 | Change | ||||||||||||||
| (in millions of U.S. dollars, except percentages) | ||||||||||||||||
Gross product sales | $ | 746.1 | $ | 579.3 | $ | 166.8 | 28.8 | % | ||||||||
Gross-to-net product sales adjustments: | ||||||||||||||||
Product returns | 2.5 | 8.5 | (6.0 | ) | (70.6 | ) | ||||||||||
Medicaid and other government programs | 51.8 | 34.5 | 17.3 | 50.1 | ||||||||||||
Chargebacks | 37.7 | 22.4 | 15.3 | 68.3 | ||||||||||||
Contract rebates | 30.9 | 34.0 | (3.1 | ) | (9.1 | ) | ||||||||||
DSA fees, discounts and other allowances | 22.3 | 18.5 | 3.8 | 20.5 | ||||||||||||
Total gross-to-net product sales adjustments | 145.2 | 117.9 | 27.3 | 23.2 | ||||||||||||
|
|
|
|
|
|
|
| |||||||||
Total net product sales | $ | 600.9 | $ | 461.4 | $ | 139.5 | 30.2 | % | ||||||||
|
|
|
|
|
|
|
| |||||||||
Total gross-to-net sales adjustments totaled $145.2 million (19.5% of gross product sales) for the fiscal year ended September 30, 2012, compared to $117.9 million (20.4% of gross product sales) for the preceding fiscal year. The decrease in total deductions as a percentage of gross product sales was mainly due to changes to estimates during fiscal year 2012 related to product returns which positively impacted net sales following the integration of the legacy Eurand business.
The following table summarizes our net product sales by category. U.S. specialty pharmaceutical sales includes net product sales in the United States for CANASA, CARAFATE, PYLERA and RECTIV, as well as for our PEPs, including ZENPEP, ULTRESA and VIOKACE. The “other” category includes net product sales from all other products, other than PT, we sell in the United States. International specialty pharmaceuticals, or ISP, includes all net product sales outside of the United States of SALOFALK, PANZYTRAT and PYLERA. Worldwide PT reflects the revenue we generate from manufacturing products for third parties.
| Year Ended September 30, | ||||||||||||||||
| 2012 | 2011 | Change | ||||||||||||||
| (in millions of U.S. dollars, except percentages) | ||||||||||||||||
Pancreatic Enzyme Portfolio (PEPs) | $ | 126.6 | $ | 65.7 | $ | 60.9 | 92.7 | % | ||||||||
CARAFATE | 121.7 | 105.5 | 16.2 | 15.4 | ||||||||||||
CANASA | 118.9 | 93.9 | 25.0 | 26.6 | ||||||||||||
PYLERA | 16.7 | 13.0 | 3.7 | 28.5 | ||||||||||||
RECTIV | 4.0 | 0.0 | 4.0 | * | ||||||||||||
Other | 29.4 | 28.8 | 0.6 | 2.1 | ||||||||||||
|
|
|
|
|
|
|
| |||||||||
Total U.S. Specialty Pharmaceuticals | 417.3 | 306.9 | 110.4 | 36.0 | ||||||||||||
International Specialty Pharmaceuticals (ISP) | 98.3 | 105.3 | (7.0 | ) | (6.6 | ) | ||||||||||
Worldwide Pharmaceutical Technology (PT) product sales | 85.3 | 49.2 | 36.1 | 73.4 | ||||||||||||
|
|
|
|
|
|
|
| |||||||||
Total | $ | 600.9 | $ | 461.4 | $ | 139.5 | 30.2 | % | ||||||||
|
|
|
|
|
|
|
| |||||||||
| * | Not meaningful |
89
Table of Contents
Other Revenue
Development fees increased by $4.6 million (127.8%) to $8.2 million for the fiscal year ended September 30, 2012, compared to $3.6 million for the preceding fiscal year.
Royalties increased by $1.0 million (20.0%) to $6.0 million for the fiscal year ended September 30, 2012, compared to $5.0 million for the preceding fiscal year resulting mostly from the inclusion of Eurand’s business following the Eurand Transaction. We earn royalty revenues from our collaborators equal to a percentage of their sales of products for which we provided assistance to develop.
Cost of goods sold
For the fiscal year ended September 30, 2012, cost of goods sold increased $8.8 million (6.5%) to $144.2 million, from $135.4 million for the preceding fiscal year. As a percentage of net product sales, cost of goods sold for the fiscal year ended September 30, 2012, decreased to 24.0% compared to 29.3% for the preceding fiscal year. The decrease as a percentage of revenue is the result of a charge of $18.7 million reflecting the expense associated with the inventory stepped up to fair value resulting from the Eurand Transaction, which was reflected in the cost of goods sold in the fiscal year 2011 but not in fiscal year 2012.
Selling and administrative expenses
For the fiscal year ended September 30, 2012, selling and administrative expenses increased $25.3 million (17.6%) to $168.8 million, from $143.5 million for the preceding fiscal year. The increase primarily relates to the additional sales and marketing efforts related to the launch of RECTIV and VIOKACE amounting to $6.5 million for the fiscal year ended September 30, 2012, and the inclusion of expenses associated with the operation of the Eurand business.
Management fees
For the fiscal year ended September 30, 2012, management fees increased by $2.1 million (58.3%) to $5.7 million from $3.6 million for the preceding fiscal year.
Research and development expenses
For the fiscal year ended September 30, 2012, research and development expenses increased $14.6 million (25.2%) to $72.6 million, from $58.0 million for the preceding fiscal year.
The increases are mainly due to expenses incurred in connection with our development of APT-1026, amounting to an additional $7.4 million incurred in fiscal year ended September 30, 2012 as compared to the preceding fiscal year, spending associated with other research and development initiatives amounting to $8.3 million and the inclusion of expenses associated with Eurand activities in the post-acquisition period net of integration savings, partially offset by a reduction in research and development expenses in our remaining portfolio of product candidates.
On March 14, 2011, we entered into an agreement with a third-party to jointly develop a new product including sucralfate. Under the terms of this agreement, we will pay a series of contingent and non-contingent milestone-based payments. Upon commercialization of the new product, we will pay the third party a single digit royalty percentage on net sales of the new product. Additionally, to help cover the costs of research and development and to enhance continued collaboration, we began paying the third party a single digit sales-based royalty on CARAFATE, beginning on January 1, 2013, and will continue to do so until December 31, 2019.
90
Table of Contents
Acquired in-process research
During the fiscal year ended September 30, 2011, we expensed $65.5 million as acquired in-process research and development relating to the Mpex Transaction that was recorded as an asset acquisition. We did not incur expense for acquired in-process research and development in fiscal year 2012.
Depreciation and amortization
For the fiscal year ended September 30, 2012, depreciation and amortization increased $28.9 million (39.7%) to $101.7 million, from $72.8 million for the preceding fiscal year. This increase is due mainly to (a) additional depreciation and amortization of intangible assets recognized on the acquisition of Eurand, (b) additional amortization of $11.3 million due to a change in the useful life of DELURSAN-related intangible assets and (c) additional amortization of intangible assets recognized on the acquisition of RECTIV amounting to $13.1 million.
Loss on disposal of product line
On March 28, 2011, we entered into a definitive agreement with Pinnacle Biologics, Inc., which acquired all global assets and rights related to PHOTOFRIN/PHOTOBARR, including inventory, for non-contingent payments amounting to $4.3 million. In addition to the non-contingent payments, Pinnacle is required to make additional contingent payments to us if certain milestones events are achieved. In addition, we receive royalties on annual net sales of PHOTOFRIN/PHOTOBARR.
During the fiscal year ended September 30, 2011, we recorded a loss of $7.4 million as a result of the disposal of the PHOTOFRIN/PHOTOBARR product line. Consideration for additional contingent payments to be made to us will be recorded as a gain in the period in which they are received. We did not receive any milestone payments in fiscal years 2012 and 2011.
Transaction, restructuring and integration costs
During the fiscal year ended September 30, 2011, we expensed $11.9 million of costs relating to legal, financial, valuation and accounting advisory services performed in connection with the Eurand Transaction, which are included in Transaction, restructuring and integration costs in the accompanying consolidated statement of operations. We did not incur transaction-related costs during the fiscal year ended September 30, 2012.
During the fiscal year ended September 30, 2012, we recorded a restructuring expense of $1.9 million as compared to $16.0 million during the fiscal year ended September 30, 2011, related to planned employee termination costs. Employee termination costs are generally recorded when the actions are communicated, probable and estimable and include accrued severance benefits and health insurance continuation, many of which may be paid out during periods after termination.
During the fiscal year ended September 30, 2012, we incurred integration costs of $10.5 million as compared to $23.0 million during the fiscal year ended September 30, 2011 representing certain external incremental costs directly related to integrating the Eurand business and primarily including expenditures for consulting and systems integration. We completed phase 1 of our initiative to optimize our enterprise resource planning systems across the organization during fiscal year 2012.
Fair value adjustments to intangible assets and contingent consideration
We recorded accretion expense related to the increase in the net present value of the contingent liability of $11.4 million for the fiscal year ended September 30, 2012. At September 30, 2012, we
91
Table of Contents
assessed market acceptance after the product launch of RECTIV in March 2012 and subsequently revised our revenue estimates from the estimates used at the date of the Rectiv Transaction and recorded a favorable change in the fair value of the contingent consideration liability of $14.6 million. These two offsetting adjustments were recorded as fair value adjustments to intangible assets and contingent consideration within our consolidated statement of operations.
Financial expenses
For the fiscal year ended September 30, 2012, financial expenses decreased by $9.3 million (10.4%) to $80.2 million, from $89.5 million for the preceding fiscal year. The decrease is due to (a) certain one-time fees related to the bridge financing and the renegotiation of the original Credit Agreement (as defined below) in connection with the Eurand Transaction amounting to $10.5 million incurred in fiscal year 2011 and (b) fiscal year 2012 savings in interest expense amounting to $4.0 million resulting from redeeming $235.0 million in aggregate principal amount of our 12.75% senior unsecured notes and funded by a $200 million term loan bearing a lower interest rate based on the three-month LIBOR (subject to a floor of 1.5% in the case of Term B-1 Loans and Term B-2 Loans) plus a margin of 4.0%. The decrease is partially offset by additional accretion expense of $1.6 million recorded in fiscal year 2012 for the Mpex Transaction.
Loss on extinguishment of debt
On March 19, 2012, we redeemed $40.0 million in aggregate principal amount of our Senior Unsecured Notes at a redemption price of 106.375%. On April 18, 2012, we redeemed all of the remaining outstanding Senior Unsecured Notes through a cash tender offer. The total redemption amount consisted of $195.0 million in aggregate principal, and $13.6 million of redemption premiums. The difference between the net carrying value and the repayment price of the Senior Unsecured Notes was recognized as a loss on extinguishment of debt. For the fiscal year ended September 30, 2012, loss on extinguishment of debt amounted to $23.1 million and comprised of the write-off of the unamortized deferred financing fees, the original issuance discount and the redemption premium.
On February 11, 2011, the proceeds of the debt and equity financing obtained in connection with the Eurand Transaction were used to repay the outstanding term loan amounting to $125.7 million under the Original Credit Agreement. Subsequent to the Eurand Transaction, we redeemed $228 million in aggregate principal amount of our 9.25% senior secured notes at a premium of 106.938%. The difference between the net carrying value and the repayment price of the outstanding term loan and 9.25% senior secured notes was recognized as a loss on extinguishment of debt. For the fiscal year ended September 30, 2011, loss on extinguishment of debt amounted to $28.3 million and comprised of the write-off of the unamortized deferred financing fees, the original issuance discount and the redemption premium.
Interest income
For the fiscal year ended September 30, 2012, total interest income decreased to $0.2 million from $0.4 million for the preceding fiscal year.
Income taxes
For the fiscal year ended September 30, 2012, income tax expense amounted to $21.8 million compared to $7.4 million for the preceding fiscal year. The effective tax rate was 222.6% for the fiscal year ended September 30, 2012, compared to (4.04)% for the preceding fiscal year. The effective tax rate for the fiscal year ended September 30, 2012 is affected by a number of items, the most important being (i) the impact of relative fixed amounts of permanent tax effects compared to a small pre-tax
92
Table of Contents
result from operations, (ii) the tax benefit arising from a financing structure of $16.6 million, (iii) the increase of a valuation allowance of $50.0 million, (iv) the difference in foreign tax rates of $11.0 million; (v) non-deductible items of $3.7 million; and (vi) the research and development tax credits of $6.7 million. The effective tax rate for the fiscal year ended September 30, 2011 is affected by a number of items, the most important being (i) the non-deductibility of certain expenses and the establishment of a valuation allowance of $57.8 million mainly against our net deferred tax assets generated in the United States (ii) the tax benefit arising from a financing structure of $14.2 million, and (iii) non-deductible items of $25 million. If, in future periods, the deferred tax assets are determined by management to be more likely than not to be realized, the tax benefits relating to the reversal of the valuation allowance will be recorded in the Consolidated Statements of Operations.
The difference between our effective tax rate of 222.6% for the year ended September 30, 2012 and the statutory income tax rate of 35% is summarized as follows:
| Year Ended September 30, | ||||||||||||||||
| 2012 | 2011 | |||||||||||||||
| (in millions of U.S. dollars, except percentages) | ||||||||||||||||
Combined statutory rate applied to pre-tax income (loss) | 35.00 | % | $ | 3.4 | 35.00 | % | $ | (64.4 | ) | |||||||
Increase (decrease) in taxes resulting from: | ||||||||||||||||
Change in promulgated rates | 0.62 | — | (0.03 | ) | — | |||||||||||
Difference with foreign tax rates | (112.76 | ) | (11.0 | ) | (0.70 | ) | 1.3 | |||||||||
Tax benefit arising from a financing structure | (169.79 | ) | (16.6 | ) | 7.71 | (14.2 | ) | |||||||||
Unrecognized tax benefit reversal | (20.68 | ) | (2.0 | ) | — | — | ||||||||||
Non-deductible items | 37.55 | 3.7 | (13.59 | ) | 25.0 | |||||||||||
Investment tax credits | (68.24 | ) | (6.7 | ) | 0.54 | (1.0 | ) | |||||||||
State taxes | 5.57 | 0.5 | (0.20 | ) | 0.4 | |||||||||||
Change in valuation allowance | 510.54 | 50.0 | (31.40 | ) | 57.8 | |||||||||||
Other | 4.79 | 0.5 | (1.37 | ) | 2.5 | |||||||||||
|
|
|
|
|
|
|
| |||||||||
Effective tax rate | 222.60 | % | $ | 21.8 | (4.04 | )% | $ | 7.4 | ||||||||
|
|
|
|
|
|
|
| |||||||||
The significant increase in the benefit derived from differences in foreign tax rates from fiscal year 2011 to fiscal year 2012 was mainly attributable to new subsidiaries in foreign jurisdictions with low statutory rates, which were acquired in fiscal year 2011 as part of the Eurand transaction. Fiscal year 2012 reflects a full fiscal year of impact, whereas the Company’s fiscal year 2011 results only included these subsidiaries for a portion of the fiscal year. Our foreign subsidiaries were also more profitable in fiscal year 2012 than they were in fiscal year 2011, which contributed further to the significant difference year over year.
Balance sheets as at September 30, 2012 and September 30, 2011
The following table summarizes balance sheet information as at September 30, 2012, compared to September 30, 2011.
| September 30, 2012 | September 30, 2011 | Change | ||||||||||||||
| (in millions of U.S. dollars, except percentages) | ||||||||||||||||
Cash and cash equivalents | $ | 115.0 | $ | 126.9 | $ | (11.9 | ) | (9.4 | )% | |||||||
Current assets | 287.9 | 272.0 | 15.9 | 5.8 | ||||||||||||
Total assets | 1,316.8 | 1,257.6 | 59.2 | 4.7 | ||||||||||||
Current liabilities | 236.5 | 177.6 | 58.9 | 33.2 | ||||||||||||
Long-term debt | 920.0 | 968.4 | (48.4 | ) | (5.0 | ) | ||||||||||
Total liabilities | 1,376.0 | 1,297.6 | 78.4 | 6.0 | ||||||||||||
Shareholders’ deficit | (59.2 | ) | (40.1 | ) | (19.1 | ) | (47.6 | ) | ||||||||
Working capital, exclusive of cash | (63.6 | ) | (32.5 | ) | (31.1 | ) | (95.7 | ) | ||||||||
93
Table of Contents
Working capital, exclusive of cash, decreased by $31.1 million (95.7%) to ($63.6) million as at September 30, 2012, from ($32.5) million as at September 30, 2011, primarily as a result of: (1) a $58.8 million increase in current liabilities, which in turn was mainly due to: (a) a $40.1 million increase in accounts payable and accrued liabilities, which in turn was largely due to the inclusion as at September 30, 2012 of $30.9 million consideration payable under the Rectiv Transaction, as well as an increase in accounts payable of $18.7 million and partially offset by other smaller items; and (b) an increase in income taxes payable of $16.7 million; and (2) a $27.8 million increase of current assets, exclusive of cash, which was mainly due to an increase in accounts receivable of $25.1 million as a result of increased revenue.
Total assets increased $59.2 million (4.7%) to $1,316.8 million as at September 30, 2012, from $1,257.6 million as at September 30, 2011, primarily as a result of the Rectiv Transaction, which resulted in the recognition of an intangible asset of $139.2 million and an increase in current assets, exclusive of cash of $27.8 million partially offset by the senior secured debt repayments and prepayment of our 12.75% Senior Unsecured Notes and a decrease of $89.0 million in intangible assets from the amortization.
Long-term debt decreased $48.4 million (5.0%) to $920.0 million as at September 30, 2012, from $968.4 million as at September 30, 2011, as a result of senior secured debt repayments and prepayment of our 12.75% Senior Unsecured Notes.
Liquidity and Capital Resources
Cash requirements
Working capital, exclusive of cash, was $(90.3) million as at September 30, 2013 and $(63.6) million as at September 30, 2012. Cash and cash equivalents were $229.9 million as at September 30, 2013 compared to $115.0 million at September 30, 2012. Cash generated from operations is used to fund working capital, capital expenditures, milestone payments, debt service and business development activities. During the fiscal year ended September 30, 2013, we generated $163.3 million in cash flows from operating activities, made milestone payments totaling $32.4 million, invested $12 million of cash in the acquisition of property, plant and equipment and made $10.5 million in long-term debt repayments.
During the fiscal year ended September 30, 2012, we redeemed our $235.0 million 12.75% Senior Unsecured Notes. The aggregate redemption amount consisted of $235.0 million in aggregate principal, and $16.2 million of redemption premium. We funded the redemptions and related fees and expenses with cash generated from operations together with borrowings under a new tranche of term loans in the amount of $200.0 million pursuant to an amendment to the A&R Credit Agreement (as defined below).
On February 11, 2011, we acquired all of the outstanding equity of Eurand. The aggregate equity purchase price of $589.6 million plus acquisition costs (including related fees and expenses) for the Eurand Transaction were funded by cash equity contributions amounting to $140.0 million from TPG and certain co-investors, the proceeds from the borrowings under the A&R Credit Agreement and related security and other agreements and cash on hand from Aptalis Pharma and Eurand. We borrowed $500.0 million of the amount available under the A&R Credit Agreement at the closing of the Eurand Transaction.
A portion of the proceeds of the equity and debt financings, together with cash on hand of Aptalis Pharma and Eurand, were also used to repay the outstanding term loan portion amounting to $125.7 million under Aptalis Pharma’s prior credit agreement, dated as of February 25, 2008, referred to as the Original Credit Agreement, and to pay related fees and expenses. The remaining amount of $250.0 million of the term loan facility was used on March 15, 2011 to redeem 100% of our then existing 9.25% senior secured notes due 2015.
94
Table of Contents
Long-term debt and Credit Facility
On April 18, 2012, Aptalis Pharma’s amended and restated credit agreement, dated as of February 11, 2011, referred to as the A&R Credit Agreement, was amended and restated in its entirety as the second amended and restated credit agreement, referred to as the Second A&R Credit Agreement. The amendments included redesignating all then outstanding term loans as Term B-1 Loans and providing a new tranche of term loans in an aggregate principal amount of $200.0 million, or Term B-2 Loans. The proceeds of the Term B-2 Loans were used to finance the redemption of the Senior Unsecured Notes.
Facilities under the Second A&R Credit Agreement totaling $1,097.0 million were comprised of Term B-1 Loans amounting to $750.0 million, Term B-2 Loans amounting to $200.0 million and a revolving credit facility totaling $147.0 million. The revolving credit facility was comprised of $115.0 million of existing revolving credit commitments that were extended or issued, referred to as the Extended Commitments and $32.0 million of existing revolving credit commitments that were not extended, referred to as Unextended Commitments pursuant to the Second A&R Credit Agreement. Borrowings under the Second A&R Credit Agreement bore interest at a rate per annum equal to, at Aptalis Pharma’s option, either a base rate or a LIBOR rate (subject to a floor of 1.5% in the case of Term B-1 Loans and Term B-2 Loans), in each case plus the applicable margin. The base rate was determined by reference to the highest of (1) the prime rate of Bank of America, N.A., (2) the federal funds effective rate plus 1/2 of 1.0% and (3) the one-month LIBOR rate plus 1.0%. Subject to the floor of 1.5% for the Term B-1 Loans and Term B-2 Loans, the LIBOR rate was determined by reference to the costs of funds for U.S. dollar deposits for the interest period relevant to such borrowing adjusted for certain additional costs.
The applicable margin for borrowings of revolving loans under the Second A&R Credit Agreement was subject to adjustment each fiscal quarter based on Aptalis Pharma’s total leverage ratio and ranged from (A) 1.75% to 3.50% per annum with respect to revolving loans that were base rate borrowings and (B) 2.75% to 4.50% per annum with respect to revolving loans that were LIBOR borrowings.
The applicable margin for borrowings of term loans under Second A&R Credit Agreement was equal to 3.00% per annum with respect to base rate borrowings and 4.00% per annum with respect to LIBOR borrowings. The applicable margin on the Term B-2 Loans was subject to increase pursuant to the Second A&R Credit Agreement in connection with the making of certain refinancing, extended or replacement term loans under Second A&R Credit Agreement with an all-in yield greater than the applicable all-in yield payable in respect of the applicable loans at such time plus 50 basis points.
The principal amount of the Term B-1 Loans and Term B-2 Loans amortized in equal quarterly installments in aggregate annual amounts equal to 1.0% of the original principal amount with payments beginning in fiscal year 2012. The principal amount outstanding of the Term B-1 Loans and Term B-2 Loans was due and payable on February 11, 2017. The principal amount of outstanding loans under the revolving credit facility was due and payable on February 11, 2016 with respect to Extended Commitments and on February 25, 2014 with respect to Unextended Commitments.
No amounts had been drawn during fiscal year 2012 against the revolving credit facility. The Term B-1 Loans and Term B-2 Loans were priced at $0.995 and $0.980 respectively, with a yield to maturity of 5.6% and 6.0% respectively, before the effect of interest rate hedging transactions.
We use interest rate swaps as part of our interest rate risk management strategy to add stability to interest expense and to manage our exposure to interest rate movements. See Note 19, “Derivatives and Hedging Activities,” to our consolidated financial statements, “Management’s Discussion and Analysis of Financial Condition and Results of Operations—Interest Rates and “Management’s Discussion and Analysis of Financial Conditions and Results of Operations—October 2013 Recapitalization.”
95
Table of Contents
The Second A&R Credit Agreement required Aptalis Pharma to prepay outstanding term loans with the proceeds of the following events, subject to certain exceptions: (1) 100% of the net cash proceeds of any incurrence of debt other than debt permitted under the Second A&R Credit Agreement, (2) commencing with the fiscal year ending September 30, 2012, 50% (which percentage will be reduced if the senior secured leverage ratio is less than a specified ratio) of the annual excess cash flow (as defined in the Second A&R Credit Agreement) and (3) 100% of the net cash proceeds of all non-ordinary course asset sales or other dispositions of property (including casualty events) by Aptalis Pharma or its subsidiaries, subject to reinvestment rights and certain other exceptions. We were not required to make any such prepayments in the fiscal year ended September 30, 2013.
In connection with the Recapitalization, the Second A&R Credit Agreement was repaid in full with the proceeds of borrowings under the senior secured credit facilities. The senior secured credit facilities consist of (a) a senior secured revolving credit facility (the “senior secured revolving credit facility”), allowing for borrowings of up to $150.0 million, of which $25.0 million may be in the form of letters of credit, and (b) term B loans (the “term B loans” and the facility the “senior secured term loan facility” and, together with the senior secured revolving credit facility, the “senior secured credit facilities”) with an outstanding principal amount as of September 30, 2013, pro forma to reflect the Refinancing of $1,250 million (excluding original issuance discount and upfront payments). The senior secured revolving credit facility includes borrowing capacity available for letters of credit and for short-term borrowings, referred to as swingline loans. See “Description of Certain Indebtedness.”
Related party transactions
We recorded charges pursuant to the terms of the management fee arrangements with our Sponsors of $7.0 million for the fiscal year ended September 30, 2013, $5.7 million for the fiscal year ended September 30, 2012, and $3.6 million for the fiscal year ended September 30, 2011. Upon consummation of this offering our management agreements with our sponsors will automatically terminate and we will pay them a termination fee of $ million.
Off-balance sheet arrangements
We do not have any transactions, arrangements and other relationships with unconsolidated entities that are likely to affect our operating results, liquidity or capital resources. We have no special-purpose or limited-purpose entities that provide off-balance sheet financing, liquidity or market or credit risk support, and do not engage in leasing, hedging, research and development services, or other relationships that expose us to liability that is not reflected on the consolidated financial statements.
Cash flows
The following table sets forth the primary sources and uses of cash for each of the periods set forth below:
| Year ended September 30, | ||||||||||||
| 2013 | 2012 | 2011 | ||||||||||
| (in millions of U.S. dollars) | ||||||||||||
Net cash provided by (used in) operating activities | $ | 163.3 | $ | 82.3 | (49.1 | ) | ||||||
Net cash used in investing activities | (32.0 | ) | (36.6 | ) | (530.0 | ) | ||||||
Net cash provided by (used in) financing activities | (16.7 | ) | (56.7 | ) | 543.4 | |||||||
Cash flows provided by operating activities increased by $81.0 million to $163.3 million for the fiscal year ended September 30, 2013 compared to $82.3 million for the preceding fiscal year, mainly due to a $77.0 million increase in operating income compared to the preceding fiscal year. Cash flows
96
Table of Contents
provided by operating activities increased by $131.4 million to $82.3 million of cash provided by operating activities for the fiscal year ended September 30, 2012 from $49.1 million of cash used in operating activities for the fiscal year ended September 30, 2011. The increase in net cash provided by operating activities is mainly due to the inclusion of legacy Eurand business net of integration savings in the post-acquisition period as well a decrease in the transaction, restructuring and integration costs related to the Eurand Transaction.
Cash flows used in investing activities decreased by $4.6 million to $32.0 million for the fiscal year ended September 30, 2013 as compared to $36.6 million for the preceding fiscal year. Cash flows used in investing activities decreased by $493.4 million to $36.6 million for the fiscal year ended September 30, 2012 from $530.0 million for the fiscal year ended September 30, 2011. The cash flows used in investing activities are related to the Rectiv Transaction in the year ended September 30, 2012 and to the Eurand Transaction in year ended September 30, 2011.
Cash flows used in financing activities decreased by $40.0 million to $16.7 million for the fiscal year ended September 30, 2013 from $56.7 million for preceding fiscal year. This reduction was due to the redemption of our $235.0 million 12.75% Senior Unsecured Notes which occurred in the prior fiscal year. The redemption was funded with cash generated from operations together with $200.0 million of borrowings under a new tranche of term loans pursuant to an amendment to the A&R Credit Agreement. Cash flows provided by financing activities decreased by $600.1 million to $56.7 million of cash flows used in financing activities from $543.4 million of cash flows provided by financing activities for the fiscal years ended September 30, 2012 and 2011 respectively. On February 11, 2011, we entered into an amended and restated credit agreement and related security and other agreements in connection with the Eurand Transaction. During the fiscal year ended September 30, 2012, we redeemed $235 million in aggregate principal amount of our of 12.75% Senior Unsecured Notes due March 1, 2016. The redemption was funded with cash generated from operations together with borrowings under a new tranche of term loans in the amount of $200.0 million pursuant to an amendment to the A&R Credit Agreement.
Contractual Obligations and Commitments
For the purpose of the table below, contractual obligations for the purchase of goods or services are required to be included in other commitments where there exist agreements that are legally binding and enforceable on us and that specify all significant terms. Our purchase orders are based on current needs and are fulfilled by our vendors within relatively short timetables. We do not have significant agreements for the purchase of raw materials or finished goods specifying minimum quantities or set prices that exceed our short-term expected requirements. In the ordinary course of business, we enter into arrangements to acquire raw materials, finished goods and other goods and services with varying terms. It is not practicable to determine which purchase orders represent a legally binding obligation or only represent nonbinding authorizations to purchase, providing a framework for future specific orders. We also enter into contracts for outsourced services; however, the obligations under these contracts are not significant and the contracts generally contain clauses allowing for cancellation without significant penalty.
The expected timing of payment of the obligations discussed below is estimated based on current information. The timing of payments and actual amounts paid may differ depending on the timing of receipt of goods or services, or, for some obligations, changes to agreed-upon amounts.
As at September 30, 2013, we had unrecognized tax benefits of $5.9 million ($5.9 million as at September 30, 2012 and $14.8 million as at September 30, 2011). Due to the nature and timing of the ultimate outcome of these uncertain tax positions, we cannot make a reasonably reliable estimate of the amount and period of related future payments. Therefore, our unrecognized tax benefits with respect to our uncertain tax positions has been excluded from the below contractual obligations table.
97
Table of Contents
Below is a summary of our future payment commitments by year under contractual obligations as of September 30, 2013 (in thousands of U.S. dollars):
Contractual Obligations | Payment due by period | |||||||||||||||||||
| Less than 1 year | 1-3 years | 3-5 years | More than 5 years | Total | ||||||||||||||||
Principal on indebtedness under our Second A&R Credit Agreement | $ | 9,500 | $ | 19,000 | $ | 897,875 | $ | — | $ | 926,375 | ||||||||||
Interest on indebtedness under our Second A&R Credit Agreement(1) | 56,799 | 110,763 | 20,728 | — | 188,290 | |||||||||||||||
|
|
|
|
|
|
|
|
|
| |||||||||||
Total indebtedness under our Second A&R Credit Agreement | 66,299 | 129,763 | 918,603 | — | 1,114,665 | |||||||||||||||
Operating leases | 1,741 | 2,342 | 616 | — | 4,705 | |||||||||||||||
Non-Contingent Milestone Payments | 25,000 | — | — | — | 25,000 | |||||||||||||||
|
|
|
|
|
|
|
|
|
| |||||||||||
Total | $ | 93,040 | $ | 132,105 | $ | 919,219 | $ | — | $ | 1,144,370 | ||||||||||
|
|
|
|
|
|
|
|
|
| |||||||||||
| (1) | Estimated interest payable on indebtedness under our Second A&R Credit Agreement based on interest rate and hedging of interest rates (see Note 19, “Derivatives and Hedging Activities,” to our consolidated financial statements). On October 4, 2013, we repaid, in full, of our outstanding indebtedness, in aggregate principal amount of $926.4 million, under our Second A&R Credit Agreement, and entered into our new senior secured credit facilities providing for senior secured term loans in aggregate principal amount of $1,250 million, referred to as the Refinancing. This new indebtedness is described in more detail in the “Description of Certain Indebtedness.” The contractual obligations described above do not give effect to the Refinancing or the offering of our common stock and application of the process therefrom. |
In addition to the commitments discussed above, we have commitments to make certain potential future contingent milestone payments. As milestone payments are primarily contingent upon successfully achieving clinical milestones or on receiving regulatory approval for products under development, they do not have defined maturities and therefore are not included in these tables. See Note 4 to our consolidated financial statements for additional disclosure related to these contingent milestone payments.
Significant Accounting Policies
Our consolidated financial statements are prepared in accordance with GAAP, applied on a consistent basis. Some of our critical accounting policies require the use of judgment in their application or require estimates of inherently uncertain matters. Therefore, a change in the facts and circumstances of an underlying transaction could significantly change the application of our accounting policies to that transaction, which could have an effect on our financial statements. Certain of the policies that management believes are critical and require the use of complex judgment in their application are discussed below.
Use of estimates
The preparation of financial statements in accordance with GAAP requires management to make estimates and assumptions that affect the recorded amounts of assets and liabilities and disclosure of contingent assets and liabilities at the date of the financial statements and also affect the recognized amounts of revenues and expenses during the fiscal year. Estimates are used when accounting for amounts recorded in connection with acquisitions, including fair value determinations of assets and liabilities. Other significant estimates and assumptions made by management include those related to
98
Table of Contents
allowances for accounts receivable, inventories, reserves for product returns, rebates, chargebacks and DSA fees, including those related to U.S. healthcare reform, the classification of intangible assets between finite life and indefinite life, the useful lives of long-lived assets, the expected cash flows used in evaluating long-lived assets including intangible assets and goodwill for impairment, fair value of liability for contingent consideration, stock-based compensation costs, pending legal settlements and the establishment of provisions for income taxes including the realizability of deferred tax assets. The estimates are made using the historical information and various other relevant factors available to management. We review all significant estimates affecting the financial statements on a recurring basis and record the effect of any adjustments when necessary. Actual results could differ from those estimates based on future events, which could include, among other risks, changes in regulations governing the manner in which we sell our products, changes in the healthcare environment, foreign exchange rates and managed care and managed Medicaid consumption patterns.
Revenue recognition
We recognize revenue from sales of products at the time title of goods passes to the customer and the customer assumes the risks and rewards of ownership, after the product has been delivered to the customer, persuasive evidence of an arrangement with the customer exists, the products’ price is fixed or determinable, and collectability is reasonably assured. Provisions for sales discounts and estimates for chargebacks, managed care and Medicaid rebates, product returns and DSA fees are established as a deduction of product sales revenues at the time such revenues are recognized. These revenue deductions are established by us at the time of sale, based on historical experience adjusted to reflect known changes in the factors that impact such reserves, such as contract charges, volume tiers being met, or changes in actual experience. In certain circumstances, product returns are allowed under our policy and provisions are maintained accordingly. These revenue deductions are generally reflected as an addition to accrued liabilities. Amounts received from customers as prepayments for products to be delivered in the future are reported as deferred revenue.
The following table summarizes the activity in the balance sheet accounts related to revenue reductions:
| Product returns | Medicaid and other government programs | Contract rebates | Charge- backs | DSA fees, discounts and other | Reserves related to PEPs withdrawal | Total | ||||||||||||||||||||||
| (in millions of U.S. dollars) | ||||||||||||||||||||||||||||
Balance as at September 30, 2012 | 19.0 | 27.5 | 10.1 | 4.2 | 3.8 | 0.9 | 65.5 | |||||||||||||||||||||
Provisions | 1.3 | 71.8 | 38.5 | 52.0 | 36.0 | (0.1 | ) | 199.5 | ||||||||||||||||||||
Settlements | (4.9 | ) | (69.2 | ) | (39.4 | ) | (51.7 | ) | (35.0 | ) | (0.8 | ) | (201.0 | ) | ||||||||||||||
|
|
|
|
|
|
|
|
|
|
|
|
|
| |||||||||||||||
Balance as at September 30, 2013 | 15.4 | 30.1 | 9.2 | 4.5 | 4.8 | 0 | 64.0 | |||||||||||||||||||||
|
|
|
|
|
|
|
|
|
|
|
|
|
| |||||||||||||||
Product returns
We do not provide any form of price protection to our wholesale customers and we generally permit product returns only if the product is returned in the six months prior to and twelve months following its expiration date. Under our policy, credit for returns generally is issued to the original purchaser at current wholesale acquisition cost less 10%.
We estimate the proportion of recorded revenue that will result in a return by considering relevant factors, including:
| Ÿ | past product returns activity; |
99
Table of Contents
| Ÿ | the duration of time taken for products to be returned; |
| Ÿ | the estimated level of inventory in the distribution channel; |
| Ÿ | product recalls and discontinuances; |
| Ÿ | the shelf life of products; |
| Ÿ | the launch of new drugs or new formulations; and |
| Ÿ | the loss of patent protection or new competition. |
Our estimate of the level of inventory in the distribution channel is based on inventory data provided by wholesalers, retail surveys and third-party prescription data.
Returns for new products are more difficult to estimate than for established products. For shipments made to support the commercial launch of a new product under standard terms, our estimates of sales return accruals are based primarily on the historical sales returns experience of similar products, such as those within the same line of product or those within the same or similar therapeutic category. Once sufficient historical data on actual returns of the product are available, the returns provision is based on this data and any other relevant factors as noted above. In limited circumstances, where the new product is not an extension of an existing product line or where we have no historical experience with products in a similar therapeutic category, such that we cannot reliably estimate expected returns of the new product, we defer recognition of revenue until the right of return no longer exists or until we have developed sufficient historical experience to estimate sales returns. Estimated levels of inventory in the distribution channel and projected demand are also considered for new products.
During the fiscal year ended September 30, 2012 we shipped RECTIV to wholesalers and began promoting this drug to physicians. Because we had limited experience with RECTIV’s indication we did not have the ability to estimate returns for RECTIV. We recognized revenue for RECTIV based upon prescription pull-through until we had enough historical information to estimate returns. Effective May 1, 2013, we discontinued deferring revenue and started to recognize revenue for RECTIV when the product is delivered to the customer. At September 30, 2013 we have applied a similar revenue recognition pattern for ULTRESA and VIOKACE. As of September 30, 2013, the balance of deferred revenue was $1.7 million and is included in accounts payable and accrued liabilities.
The accrual estimation process for product returns involves in each case a number of interrelating assumptions, which vary for each combination of product and customer. Accordingly, it would not be meaningful to quantify the sensitivity to change for any individual assumption or uncertainty. However, we do not believe that the effect of uncertainties, as a whole, significantly impacts our financial condition or results of operations.
The accrued liabilities include reserves of $15.4 million as at September 30, 2013, ($19.0 million as at September 30, 2012) for estimated product returns.
Rebates, chargebacks and other sales deductions
In the United States, we establish and maintain reserves for amounts payable to MCOs, state Medicaid, Managed Medicaid, Medicare Part D and other government programs for the reimbursement of portions of the retail price of prescriptions filled that are covered by these programs. We also establish and maintain reserves for amounts payable to wholesale distributors for the difference between their regular sale price and the contract price for the products sold to our contract customers.
The amounts are recognized as revenue deductions at the time of sale based on our best estimate of the product’s utilization by these managed care and state Medicaid patients and sales to
100
Table of Contents
our contract customers using historical experience, the timing of payments, the level of reimbursement claims, changes in prices (both normal selling prices and statutory or negotiated prices), changes in prescription demand patterns, and the levels of inventory in the distribution channel.
Amounts payable to MCOs and state Medicaid programs are based on statutory or negotiated discounts to the selling price. Medicaid rebates generally increase as a percentage of the selling price over the life of the product. As it can take up to six months for information to reach us on actual usage of our products in managed care and Medicaid programs and on the total discounts to be reimbursed, we maintain reserves for amounts payable under these programs relating to sold products. We estimate the level of inventory in the distribution channels based on inventory data provided by wholesalers, retail surveys and third-party prescription data.
Revisions or clarification of guidelines related to state Medicaid and other government program reimbursement practices which are meant to apply to prior periods, or retrospectively, can result in changes to management’s estimates of the rebates reported in prior periods. However, since the prices of our products are fixed at the time of sale and the quantum of rebates are therefore reasonably determinable at the outset of each transaction, these factors would not impact the recording of revenues in accordance with generally accepted accounting principles.
The accrual estimation process for MCOs, state Medicaid and other government program rebates involves in each case a number of interrelating assumptions, which vary for each combination of products and programs. Accordingly, it would not be meaningful to quantify the sensitivity to change for any individual assumption or uncertainty. However, we do not believe that the effect of uncertainties, as a whole, significantly impacts our financial condition or results of operations.
Accrued liabilities include reserves of $30.1 million as at September 30, 2013 ($27.5 million as at September 30, 2012) for estimated Medicaid and other government programs, $9.2 million ($10.1 million as at September 30, 2012) for estimated contract rebates and $4.5 million ($4.2 million as at September 30, 2012) for chargebacks.
If the levels of chargebacks, fees pursuant to DSAs, managed care, Medicaid, Managed Medicaid and other government rebates, our portion of the Medicare coverage gap, product returns and discounts fluctuate significantly and/or if our estimates do not adequately reserve for these reductions of net product revenues, our reported revenue could be negatively affected.
Intangible assets and goodwill
Intangible assets with a finite life are amortized over their estimated useful lives mainly according to the straight-line method over periods varying from 4 to 18 years. The straight-line method of amortization is used because it reflects, in the opinion of management, the pattern in which the intangible assets with a finite life are used. In determining the useful life of intangible assets, we consider many factors, including the intention of management to support the asset on a long-term basis by maintaining the level of expenditure necessary to support the asset, the use of the asset, the existence and expiration date of a patent, the existence of a generic version of, or competitor to, the product, and any legal or regulatory provisions that could limit the use of the asset.
101
Table of Contents
The following table summarizes the changes to the carrying value of the intangible assets and goodwill from September 30, 2012 to September 30, 2013:
| Intangible assets | Goodwill | |||||||
| (in millions of U.S. dollars) | ||||||||
Balance at October 1, 2012 | $ | 737.4 | $ | 178.3 | ||||
Depreciation and amortization | (80.8 | ) | — | |||||
Impairment | (71.7 | ) | — | |||||
Foreign exchange translation adjustments | 4.3 | 1.8 | ||||||
|
|
|
| |||||
Balance at September 30, 2013 | $ | 589.2 | $ | 180.1 | ||||
|
|
|
| |||||
Income taxes
Income taxes are calculated using the asset and liability method. Under this method, deferred income tax assets and liabilities are recognized to account for the estimated taxes that will result from the recovery or settlement of assets and liabilities recorded at their financial statement carrying amounts. Deferred income tax assets and liabilities are measured based on enacted tax rates and laws at the date of the financial statements for the fiscal years in which the temporary differences are expected to reverse. A valuation allowance is provided for the portion of deferred tax assets that is more likely than not to remain unrealized. Adjustments to the deferred income tax asset and liability balances are recognized in net income as they occur.
We conduct business in various countries throughout the world and are subject to tax in numerous jurisdictions. As a result of our business activities, we file a significant number of tax returns that are subject to examination by various federal, state and local tax authorities. Tax examinations are often complex as tax authorities may disagree with the treatment of items reported by us and this may require several years to resolve.
Share-based compensation expense
Our stock-based compensation expense is estimated at the grant date based on an award’s fair value as calculated by the Black-Scholes option-pricing model for service-based options and the Monte Carlo simulation model for performance-based options and is recognized as expense over the requisite service period. The Black-Scholes model and Monte Carlo model require various highly judgmental assumptions including expected volatility and option life. If any of the assumptions used in the Black-Scholes model and Monte Carlo model change significantly, stock-based compensation expense may differ materially in the future from that recorded in the current period. In addition, we estimate the expected forfeiture rate and only recognize expense for those shares expected to vest. We estimate the forfeiture rate based on historical experience. To the extent our actual forfeiture rate is different from our estimate, stock-based compensation expense is adjusted accordingly. See Note 15 to our consolidated financial statements.
Common Stock Valuation
In the absence of a public trading market, our board of directors, with input from management, determined a reasonable estimate of the then-current fair value of our common stock for purposes of determining fair value of our stock options on the date of grant. With the assistance of a reputable third-party valuation firm, on a quarterly basis, we determined the fair value of our common stock utilizing methodologies, approaches and assumptions consistent with the American Institute of Certified Public Accountants Practice Aid, “Valuation of Privately-Held-Company Equity Securities Issued as Compensation.” Our approach considered contemporaneous common stock valuations in
102
Table of Contents
determining the equity value of our company using a combination of various methodologies, each of which can be categorized under either of the following two valuation approaches: the income approach and the market approach. In addition, we exercised judgment in evaluating and assessing the foregoing based on several factors including:
| Ÿ | the nature and history of our business; |
| Ÿ | our current and historical operating performance; |
| Ÿ | our expected future operating performance; |
| Ÿ | our financial condition at the grant date; |
| Ÿ | the value of companies we consider peers based on a number of factors, including, but not limited to, similarity to us with respect to industry, business model, stage of growth, intangible value, company size, geographic diversification, profitability, financial risk and other factors; |
| Ÿ | likelihood of achieving a liquidity event, such as an IPO or a merger or acquisition of our company given prevailing market conditions; |
| Ÿ | industry information such as market size and growth; and |
| Ÿ | macroeconomic conditions. |
Income approach
The income approach estimates the value of our company based on expected future cash flows discounted to a present value rate of return commensurate with the risks associated with the cash flows, or DCF method. The cash flows utilized in the DCF method have been based on our most recent long-range forecasts available at the time each applicable valuation was performed. The discount rate is intended to reflect the risks inherent in the future cash flows of our Company. Because the cash flows are only projected over a limited number of years, it is also necessary under the income approach to compute a terminal value as of the last period for which discrete cash flows are projected. This terminal value capitalizes the future cash flows beyond the projection period and is determined by calculating the value of a perpetuity of the cash flows associated with the final year of the projections, which for the purpose of our quarterly valuations has consistently been the end of the tenth full projected fiscal year. This amount is then discounted to its present value using a discount rate to arrive at the present value of the terminal value. The discounted projected cash flows and terminal value are totaled to arrive at an indicated aggregate equity value under the income approach. In applying the income approach, we derived the discount rate from an analysis of the cost of capital of our comparable industry peer companies as of each valuation date and adjusted it to reflect the risks inherent in our business cash flows. A range of discount rates from 11.75% to 13.25% have been used in our fiscal year 2012 and fiscal year 2013 quarterly valuations. We then reviewed the valuation multiple implied by the terminal value to assess the reasonableness of the value determined by the perpetuity method.
Market approach
The market approach incorporates various methodologies to estimate the equity value of a company and includes the guideline public company method, which utilizes market multiples of comparable companies that are publicly traded, and the guideline merged and acquired company, or GMAC, method, which utilizes multiples achieved in comparable industry mergers and acquisition transactions.
When considering which companies to include in our comparable industry peer companies, we focused on publicly traded companies in the industry in which we operate and selected comparable industry peer companies and transactions on the basis of operational and economic similarity to our
103
Table of Contents
business at the time of the valuation. The selection of our comparable industry peer companies requires us to make judgments as to the comparability of these companies to us. We considered a number of factors including the business in which the peer company is engaged, business size, market share, revenue model, product development pipeline and historical operating results. We then analyzed the business and financial profiles of the peer companies for relative similarities to us and, based on this assessment, we selected our comparable industry peer companies. The selection of our comparable peer companies has changed over time as we continue evaluating whether the selected companies remain comparable to us and considering sale transactions. Based on these considerations, we believe the comparable peer companies are a representative group for purposes of selecting sales and EBITDA multiples in the performance of contemporaneous valuations.
For each valuation in fiscal year 2012 and fiscal year 2013, we equally weighted the income and market approaches. We believe the two methods are equally appropriate as they utilize both management’s expectations of future results and an estimate of the market’s valuation of companies similar to ours. Determining fair value requires the exercise of significant judgment, including judgment about risk, appropriate discount rates, the amount and timing of expected future cash flows, as well as the relevant comparable company sales and earnings multiples for the market approach.
Once we determined our enterprise value, we adjusted the value for items such as expected contingent payments and tax items, and then allocated this value between our outstanding debt and common stock. The amount allocated to our outstanding debt is based on the public trading activity of such debt. The residual enterprise value, after allocation of value to outstanding debt, is further reduced by the value of outstanding stock options. The remaining value is then prescribed to our outstanding common stock in order to estimate a per share value.
The following table provides, by grant date, the number of stock options awarded during fiscal year 2012 and fiscal year 2013, the exercise price for each set of grants, the associated estimated fair value of our common stock and the fair value of the option:
| Grant Date | Options Granted | Exercise Price | Grant Date Fair Value of Common Stock | Grant Date Fair Value of Option | ||||||||||||
December 3, 2013 Time-based MEIP options | 72,500 | $ | 16.83 | $ | 16.83 | $ | 7.54 | |||||||||
December 3, 2013 Premium MEIP options | 36,250 | $ | 16.83 | $ | 16.83 | $ | 5.50 | |||||||||
December 3, 2013 Performance MEIP options | 36,250 | $ | 16.83 | $ | 16.83 | $ | 4.48 | |||||||||
March 5, 2013 Time-based MEIP options | 17,500 | $ | 20.50 | $ | 20.50 | $ | 4.54 | |||||||||
March 5, 2013 Premium MEIP options | 8,750 | $ | 20.50 | $ | 20.50 | $ | 3.76 | |||||||||
March 5, 2013 Performance MEIP options | 8,750 | $ | 20.50 | $ | 20.50 | $ | 5.56 | |||||||||
February 8, 2013 Time-based MEIP options | 17,500 | $ | 20.50 | $ | 20.50 | $ | 4.54 | |||||||||
February 8, 2013 Premium MEIP options | 8,750 | $ | 20.50 | $ | 20.50 | $ | 3.76 | |||||||||
February 8, 2013 Performance MEIP options | 8,750 | $ | 20.50 | $ | 20.50 | $ | 5.56 | |||||||||
January 7, 2013 Time-based MEIP options | 17,500 | $ | 19.00 | $ | 19.00 | $ | 4.54 | |||||||||
January 7, 2013 Premium MEIP options | 8,750 | $ | 19.00 | $ | 19.00 | $ | 3.76 | |||||||||
January 7, 2013 Performance MEIP options | 8,750 | $ | 19.00 | $ | 19.00 | $ | 5.56 | |||||||||
December 4, 2012 Time-based MEIP options | 10,000 | $ | 19.00 | $ | 19.00 | $ | 3.98 | |||||||||
December 4, 2012 Premium MEIP options | 5,000 | $ | 19.00 | $ | 19.00 | $ | 2.96 | |||||||||
December 4, 2012 Performance MEIP options | 5,000 | $ | 19.00 | $ | 19.00 | $ | 4.83 | |||||||||
September 11, 2012 Time-based MEIP options | 17,500 | $ | 15.00 | $ | 15.00 | $ | 3.98 | |||||||||
September 11, 2012 Premium MEIP options | 8,750 | $ | 16.50 | $ | 15.00 | $ | 2.96 | |||||||||
September 11, 2012 Performance MEIP options | 8,750 | $ | 15.00 | $ | 15.00 | $ | 4.83 | |||||||||
July 16, 2012 Time-based MEIP options | 125,000 | $ | 13.25 | $ | 13.25 | $ | 3.98 | |||||||||
July 16, 2012 Premium MEIP options | 62,500 | $ | 14.58 | $ | 13.25 | $ | 2.96 | |||||||||
July 16, 2012 Performance MEIP options | 62,500 | $ | 13.25 | $ | 13.25 | $ | 4.83 | |||||||||
May 11, 2012 Time-based MEIP options | 80,000 | $ | 13.25 | $ | 13.25 | $ | 3.55 | |||||||||
May 11, 2012 Premium MEIP options | 40,000 | $ | 14.58 | $ | 13.25 | $ | 2.65 | |||||||||
May 11, 2012 Performance MEIP options | 40,000 | $ | 13.25 | $ | 13.25 | $ | 4.16 | |||||||||
February 9, 2012 Time-based MEIP options | 35,000 | $ | 11.25 | $ | 11.25 | $ | 3.46 | |||||||||
February 9, 2012 Premium MEIP options | 17,500 | $ | 12.38 | $ | 11.25 | $ | 2.75 | |||||||||
February 9, 2012 Performance MEIP options | 17,500 | $ | 11.25 | $ | 11.25 | $ | 3.24 | |||||||||
November 30, 2011 Time-based MEIP options | 30,000 | $ | 11.00 | $ | 11.00 | $ | 3.46 | |||||||||
November 30, 2011 Premium MEIP options | 15,000 | $ | 12.10 | $ | 11.00 | $ | 2.75 | |||||||||
November 30, 2011 Performance MEIP options | 15,000 | $ | 11.00 | $ | 11.00 | $ | 3.24 | |||||||||
104
Table of Contents
The board of directors and management intended all options granted to be exercisable at a price per share, with the exception of Premium Options, equal to the per share fair value of our common stock underlying those options on the date of grant.
The increase in the grant date fair value of common stock from $11.00 to $15.00 is reflective of the Company exceeding its forecast throughout fiscal year 2012, with a 30.8% increase in Total Revenue and a 53.1% increase in Adjusted EBITDA compared to fiscal year 2011, and a similar improvement in management’s future forecast based on results throughout fiscal year 2012 and improving market conditions. Similarly, the increase in grant date fair value of common stock from $15.00 to $20.50 is reflective of the Company’s improved performance for fiscal year ended September 30, 2013, with a 11.8% increase in Total Revenue and a 28.5% increase in Adjusted EBITDA compared to the preceding fiscal year. In addition, our successful integration of Eurand and the Mpex Transaction, which all occurred in fiscal year 2012, favorably impacted our valuation.
The intrinsic value of options outstanding as at September 30, 2013, is as follows:
| Vested options | Unvested options | |||||||||||||||
| Number of options | Weighted average intrinsic value(1) | Number of options | Weighted average intrinsic value(1) | |||||||||||||
| (in millions of U.S. dollars, except number of options) | ||||||||||||||||
Exercise price | ||||||||||||||||
$10.00—$14.00 | 1,629,900 | $ | 1,685,100 | $ | ||||||||||||
$14.01—$18.00 | 454,000 | 86,500 | ||||||||||||||
$18.01—$20.50 | 2,750 | 131,000 | ||||||||||||||
|
|
|
|
|
|
|
| |||||||||
| 2,086,650 | $ | 1,902,600 | $ | |||||||||||||
|
|
|
|
|
|
|
| |||||||||
| (1) | The weighted average intrinsic value is calculated by taking the difference of the weighted average of exercise price of the options and the fair value of the underlying common stock, assuming an initial public offering price of $ per share, the midpoint of the price range set forth on the cover page of this prospectus. |
Changes in accounting standards
See Note 3 to our consolidated financial statements for the fiscal year ended September 30, 2013 included elsewhere in this prospectus for a description of recently issued accounting standards, including our expected adoption dates and the estimated effects, if any, on our results of operations, financial condition and cash flows.
Quantitative and Qualitative Disclosures About Market Risk
Market risk is the potential loss arising from adverse changes in market rates and prices, such as foreign currency exchange rates, interest rates and other relevant market rate or price changes. In the ordinary course of business, we are exposed to various market risks, including changes in foreign currency exchange rates, interest rates and equity price changes, and inflation risk due to operations in various countries with different Consumer Price Index growth rates. We regularly evaluate our exposure to such changes. Our overall risk management strategy seeks to balance the magnitude of the exposure and the cost and availability of appropriate financial instruments. From time to time, we have utilized forward exchange contracts to manage our foreign currency exchange rate risk. The following analyses present the sensitivity of our financial instruments to hypothetical changes in interest rates and equity prices that are reasonably possible over a one-year period.
105
Table of Contents
Foreign Currency Exchange Rates
We operate internationally; however, a substantial portion of revenue and expense activities as well as capital expenditures are transacted in U.S. dollars. Our results of operations are also affected by fluctuations of currencies other than the U.S. dollar, in particular Euros and Canadian dollars. Our exposure to exchange rate fluctuations in these currencies is reduced because, in general, our revenues denominated in currencies other than the U.S. dollar are partially offset by a corresponding amount of costs denominated in the same currency. However, significant long-term fluctuations in relative currency values could have an adverse effect on future profitability.
A 1% change in the value of foreign currencies as compared to the U.S. dollar in which we had sales, income or expense in fiscal year 2013 would have increased or decreased the translation of foreign sales by $1.4 million and income by $0.8 million.
We have used derivative instruments historically to reduce exposure to foreign currency risk. As at September 30, 2013, September 30, 2012 and September 30, 2011, we have no foreign exchange contracts outstanding.
Interest Rates
The primary objective of our investment policy is the protection of capital. Accordingly, investments are made in high-grade government and corporate securities with varying maturities, but typically less than 180 days. Therefore, we do not have a material exposure to interest rate risk on our cash and short-term investments, and a 100 basis-point adverse change in interest rates would not have a material effect on our consolidated results of operations, financial position or cash flows. We are exposed to interest rate risk on borrowings under our credit facilities bearing interest based on LIBOR.
We have entered into derivative financial instruments to manage the exposure from the variable interest rate changes to reduce our overall cost of borrowing. See Note 19, “Derivatives and Hedging Activities,” to our consolidated financial statements.
Derivative financial instruments are measured at fair value and are recognized as assets or liabilities on the balance sheet, with changes in the fair value of the derivatives recognized in either net income (loss) or other comprehensive income (loss), depending on the timing and designated purpose of the derivative. When we pay interest on the portion of the debt designated as hedged, the gain or loss on the swap designated as hedging the interest payment will be reclassified from accumulated other comprehensive income to interest expense. These derivative instruments are designated as cash flow hedges with the related gains or losses recorded in other comprehensive income, with an offsetting amount included in other long-term liabilities. The fair value of the interest rate swaps liability was $11.7 million as at September 30, 2013, compared to $17.3 million as at September 30, 2012, and the fair value of the interest rate cap liability was $0.3 million as at September 30, 2013 compared to $0.5 million as at September 30, 2012. See “Management’s Discussion and Analysis of Financial Conditions and Results of Operations — October 2013 Recapitalization.”
Inflation
Inflation generally affects us by increasing our cost of labor and clinical trial costs, as well as market prices of the products that we sell. We do not believe that inflation has had a material effect on our business, financial condition or results of operations during the fiscal years ended September 30, 2013, 2012 and 2011.
106
Table of Contents
JOBS Act
Section 107 of the JOBS Act provides that an “emerging growth company” can take advantage of the extended transition period provided in Section 7(a)(2)(B) of the Securities Act of 1933, as amended, for complying with new or revised accounting standards. Thus, an emerging growth company can delay the adoption of certain accounting standards until those standards would otherwise apply to private companies. We have irrevocably elected not to avail ourselves of this extended transition period and, as a result, we will adopt new or revised accounting standards on the relevant dates on which adoption of such standards is required for non-emerging growth companies.
107
Table of Contents
Our Company
Our mission is to improve health and quality of care by providing specialty therapies for patients around the world. Our vision is to become the reference specialty pharmaceutical company providing innovative, effective therapies for unmet medical needs, including in cystic fibrosis, or CF, and in gastrointestinal, or GI, disorders. We develop, manufacture, license and market a broad range of therapies.
We have built market-leading franchises in CF and GI disorders by growing sales of our products, many of which command a number one or number two position in their respective markets, including ZENPEP, CANASA, CARAFATE, PYLERA and RECTIV. Our revenues are highly diversified, with our largest product accounting for only 21% of our total revenue in fiscal year 2013 and with operations outside the United States accounting for 20% of our total revenue during the same period. The CF and GI markets are each characterized by a concentrated base of high-volume prescribing physicians, which allows our highly efficient and effective sales force of 227 experienced sales specialists, including 155 sales specialists in the United States, to reach substantially all Cystic Fibrosis Foundation care centers and approximately half of the GI physicians in the United States. We have established sales and marketing operations in the United States, Canada, France and Germany and proprietary manufacturing capabilities in North America and Europe. In addition, we have proven product development capabilities and a demonstrated ability to selectively acquire complementary products, product candidates and companies. We believe our pipeline of four clinical product candidates targets major commercial opportunities in the EU and the United States and we have various lifecycle management opportunities for our existing products using the proprietary technology platforms of our Pharmaceutical Technologies, or PT, business.
We have generated double-digit revenue growth since the beginning of fiscal year 2011. This strong performance has been achieved by driving continued growth of our market-leading products and by successfully integrating products and companies, including Eurand N.V., or Eurand. Our total revenue has grown from $470.4 million for fiscal year 2011 to $687.9 million for fiscal year 2013, representing a compound annual growth rate, or CAGR, of 20.9%. Revenue from assets acquired or licensed during this period, including ZENPEP, RECTIV and PT, has grown from $122.0 million in fiscal year 2011 to $244.8 million in fiscal year 2013, while the remainder of our portfolio grew at a CAGR of 12.8%, from $348.4 million in fiscal year 2011 to $443.1 million in fiscal year 2013. We had Adjusted EBITDA of $160.0 million in fiscal year 2011 and $314.6 million in fiscal year 2013, Adjusted pre-tax income of $67.5 million in fiscal year 2011 and $241.4 million in fiscal year 2013, and a net loss of $191.6 million in fiscal year 2011 compared to net income of $86.9 million in fiscal year 2013. Adjusted EBITDA and Adjusted pre-tax income are non-GAAP financial metrics. See “Selected Consolidated Financial and Operating Data” for reconciliations of Adjusted EBITDA to net (loss) income and Adjusted pre-tax income to income (loss) before income tax.
Our Industry
We believe the markets for CF and GI disorders are large and highly attractive, with significant opportunities for specialty pharmaceutical companies to run highly efficient, profitable businesses. These markets are fragmented and underserved by large pharmaceutical companies and are characterized by products used for chronic conditions, leaving significant unmet medical needs. Because the CF and GI specialty physician bases are relatively concentrated, a high percentage of prescriptions are written by a small number of physicians who can be reached effectively by a relatively small sales force. Further, the CF market has a highly organized patient advocacy base, allowing for a targeted and relationship-driven marketing approach by specialty pharmaceutical companies.
108
Table of Contents
We also believe that the ability of generic entrants to obtain approval for many products that treat CF and GI disorders is more difficult than for many other therapeutic areas. In addition to traditional barriers to generic entry, such as intellectual property and data exclusivity, many products that treat CF and GI disorders have features that create additional barriers to generic entry, including:
| Ÿ | Insignificant or highly variable absorption into the blood, or bioavailability. Many products in other therapeutic areas act primarily via the drug’s absorption into the blood, leading to the FDA’s requirement that generic entrants demonstrate similar blood levels of drug, or bioequivalence, to gain approval. Because many CF and GI products often show insignificant or highly variable systemic bioavailability, we believe that bioequivalence is often difficult to demonstrate and may not be applicable to the FDA’s generic approval process. Therefore, we believe generic manufacturers will be required to conduct full clinical trials with efficacy and safety endpoints for some products, which will increase the cost and risk of generic development. |
| Ÿ | Locally acting mechanisms. Because many CF and GI products act locally, delivering drug to the site of the disease is critical for clinical efficacy. Therefore, potential generic entrants will encounter additional clinical risk in demonstrating equivalent levels of both local activity and efficacy in clinical trials. |
| Ÿ | Complex formulations. We believe that the complexity of formulations of many CF and GI products, as well as manufacturing know-how and trade secrets, leads to difficulties in demonstrating similar technical specifications, such as dissolution characteristics, which the FDA also typically requires for approval of generic products. |
| Ÿ | Evolving FDA guidance. FDA guidance on the requirements for approval of generic forms of branded CF and GI products has been evolving. We believe that in certain circumstances this will make it more challenging to develop products and clinical packages which will support generic approvals. |
GI disorders are generally grouped into four categories: functional disorders of the upper GI tract such as gastroesophageal reflux disease, gastroparesis and functional dyspepsia; functional disorders of the lower GI tract such as constipation and IBS; inflammatory/immunologic GI disorders such as Crohn’s disease, UC, EoE, and celiac disease; and disorders of organs involved in the digestive process, such as the gallbladder, liver and pancreas. While some of these disorders can be treated through currently available pharmacologic interventions, significant unmet needs still exist, particularly for indications such as IBS, Crohn’s disease, UC and other emerging GI-related disease areas such as EoE and auto immune hepatitis. According to a 2011 Business Insight report, the worldwide GI drug market was $38 billion in 2010, with the United States accounting for more than 36% of that total.
Based on a 2009 U.S. Department of Health and Human Services report, at least 60 to 70 million Americans are affected each year by GI disorders, placing a burden on society that exceeds $100 billion in direct medical costs in the United States. Annually, in the United States, about 14 million hospitalizations—10% of total hospitalizations—and 15% of all in-patient hospital procedures are attributed to treatment of GI disorders. In addition, in the United States, 105 million doctor visits occur each year for digestive diseases, frequently in response to symptoms such as abdominal pain, diarrhea, vomiting or nausea. GI disorders, even conditions that are not immediately life-threatening, can severely affect a patient’s quality of life and ability to work and engage in daily activities.
CF is a life-threatening genetic disease that begins at birth and, because of one or more defective genes, causes the body to produce faulty proteins that lead to abnormally thick, sticky mucus that clogs the lungs, obstructs ducts in the pancreas and results in a number of other digestive conditions. CF is one of the most prevalent genetic diseases among Caucasians in the United States and can result in a number of related conditions requiring treatment. The disease affects an estimated 30,000
109
Table of Contents
adults and children in the United States and 70,000 patients worldwide, an estimated 85% to 90% of whom suffer from EPI and/or chronic lung infections. The sticky mucus that clogs the lungs can lead to serious lung infections, which are becoming increasingly resistant to current antibiotic standards of care. When CF affects the pancreas, the body does not absorb sufficient nutrients to grow and thrive. There is no cure for most forms of CF, necessitating ongoing treatment for chronic concomitant conditions such as EPI and lung infections. These treatments have contributed to increasing life expectancy for CF patients in the United States from 33 years in 2001 to 37 years in 2011.
Our Competitive Strengths
Focus on High Value Specialty Pharmaceutical Areas with Unmet Needs. We focus on the high value specialty CF and GI markets, which we believe provide opportunities to focus on diseases or disorders with significant unmet needs. We believe the markets for CF and GI disorders are large, fragmented and underserved, providing an opportunity to profitably develop and commercialize differentiated products. Many of our products are used to treat CF and GI disorders that are chronic and treated by a small number of high-volume prescribing physicians, who can be reached by our effective and efficient sales force. As a result, we are able to leverage the strong physician relationships that our sales force has established in order to drive significant growth in our product franchises. In our therapeutic specialty areas, we also utilize our expertise and experience to advance our pipeline and successfully target and execute strategic transactions.
Differentiated and Market-Leading Branded Products. We believe that our products have a compelling value proposition for physicians, patients and payors and are often the first line of treatment. As a result, we believe that our products experience a high degree of physician and patient loyalty allowing many of our products to maintain a number one or number two position in their respective markets. Our products are highlighted by the following key attributes:
| Ÿ | 90% percent of ZENPEP, CANASA and CARAFATE claims are approved by commercial insurers when a patient goes to fill a prescription; |
| Ÿ | ZENPEP is the second most prescribed PEP in the United States, and with ULTRESA and VIOKACE, the only non-enteric coated, immediate-release PEP, we market and sell three out of the six currently FDA-approved PEPs on the market; |
| Ÿ | CANASA accounts for 65% of the U.S. market for rectally-administered mesalamine products in terms of prescriptions and is the only mesalamine suppository available; |
| Ÿ | CARAFATE is the only oral suspension-form sucralfate product in the U.S. market and accounts for over 29% of the prescriptions for sucralfate products in the United States; |
| Ÿ | PYLERA represents 25% of branded prescriptions to eradicateHelicobacter pylori, orH. pylori, infection in the United States; |
| Ÿ | RECTIV, launched in the United States in March 2012, is the only FDA approved product to treat pain from chronic anal fissure; and |
| Ÿ | PANZYTRAT, which treats EPI and enzyme deficiency in several EU countries, including Germany and the Netherlands, is the third most prescribed PEP in Germany. |
Highly Diversified Revenue Base. We have acquired, developed and/or launched nine products since the beginning of fiscal year 2010, which have significantly diversified our revenue base. We currently market branded products that treat a broad range of CF and GI diseases and disorders in North America and Europe. In fiscal year 2013 our largest product accounted for only 21% ofour total revenue and operations outside of the United States accounted for 20% of our total revenue. Diversification remains an important part of our ongoing corporate strategy.
110
Table of Contents
Proven Track Record of Acquiring and Integrating Products, Product Candidates and Companies. We have a proven track record of successfully acquiring products and product candidates, including the acquisition of CARAFATE. We acquired CARAFATE following patent expiration and we have more than doubled its annual net sales over the last five fiscal years. In addition, we have efficiently integrated, developed and grown the businesses and assets we have acquired, including Eurand (ZENPEP and PT) and Mpex (APT-1026). For example, we have grown our ZENPEP franchise from $46 million in revenue in calendar year 2010 to $141 million in fiscal year 2013. We also realized significant synergies from the Eurand Transaction, which were in excess of our initial internal objectives.
Substantial Development Capabilities and Robust Pipeline. Our pipeline has four clinical product candidates which target major commercial opportunities in the EU and the United States. We have proven research and development capabilities with a track record of developing and gaining regulatory approvals for our product candidates, including obtaining approval for and launching multiple product candidates in a number of jurisdictions simultaneously. For example, in fiscal year 2011, we launched products in the United States, France and Germany. Currently, our most advanced product candidates are APT-1026, which completed a pivotal phase III trial in the EU in 2012, ZENPEP-EU, which recently completed enrollment for its phase III trial in the EU, andAPT-1016, which completed its phase II clinical trial in the United States. We believe that by focusing on developing known chemical entities, we are able to accelerate the development cycle and reduce the overall risk of our pipeline.
In addition, we leverage our PT platforms to improve the safety and efficacy, or otherwise develop enhanced formulations, of our products and product candidates. Our PT development team was instrumental in the development of ZENPEP and ULTRESA. Not only do our PT platforms complement our product portfolio and pipeline, they also contribute a growing revenue stream through collaborations with other pharmaceutical companies. Our PT platforms have produced six FDA approved products in the last 10 years for commercial partners. PT contributed $86.2 million in revenue during fiscal year 2013 from commercial partners.
Sustainable Growth Due to Significant Barriers to Entry. We have demonstrated multiple years of growth for each of our principal products, which we believe is due in part to the fact that many of our products benefit from one or more intellectual property, regulatory, clinical, sourcing and manufacturing barriers to entry. These include patent protection, data exclusivity under the Hatch-Waxman Act, FDA requirements for generic entrants to conduct clinical trials with clinical efficacy endpoints, complexity in matching formulation characteristics, proprietary manufacturing processes, difficulty in sourcing certain active pharmaceutical ingredients that must match narrow specifications, and the know-how required to manufacture certain dosage forms. We believe that these barriers to entry create impediments for generic competitors to introduce and market generic versions of most of our principal products, or for new entrants to launch branded products in the markets in which we operate.
Experienced and Dedicated Management Team. We have a highly experienced management team with a proven track record of driving robust financial performance while managing in a highly regulated industry. Our management team is led by our Chief Executive Officer, Frank Verwiel, who has over 25 years of experience in the healthcare industry, including 10 years at Merck & Co., and Steve Gannon, our Chief Financial Officer, who has over 25 years of experience holding various seniorfinancial positions at CryoCath Technologies Inc., AstraZeneca and Mallinckrodt. In addition to our Chief Executive Officer and Chief Financial Officer, our management team has an average of nearly 26 years of experience in healthcare-related businesses, as well as a broad spectrum of general business experience, including:
| Ÿ | David Mims, President, U.S. Specialty Pharmaceuticals, who has over 25 years of experience in the pharmaceutical industry; |
111
Table of Contents
| Ÿ | John Fraher, President, Aptalis Pharma, who has over 20 years of experience in the pharmaceutical industry; and |
| Ÿ | Jean Louis Anspach, President, International Specialty Pharmaceuticals, who has over 25 years of experience in the pharmaceutical industry. |
Further, several members of our management team have devoted large parts of their careers to the CF and GI markets.
Our Growth Strategy
We intend to enhance our position as a leading specialty pharmaceutical company concentrating on the fields of CF and GI by pursuing the following strategic initiatives:
Grow Sales of Existing Products. We intend to leverage the value of our products and our strong relationships in our markets to grow sales of our existing products. We build relationships with high-volume prescribers of drugs that treat, and patient advocacy groups related to, the diseases and disorders that our products address and we actively manage reimbursement and commercial and governmental payor, or payor, relationships using a tailored product-by-product approach. We employ this type of targeted marketing and contracting approach to balance patient access with profitability. We also enhance product lifecycles and extend exclusivity through the staged introduction of product enhancements, including new indications, improvements in the frequency of administration of drug products, improvements in the convenience of administration, compliance and adherence, reduction of side effects (improved tolerability) and improved efficacy. For instance, we were able to extend the exclusivity of our CANASA franchise by conducting clinical trials and launching a higher strength dosage with a more convenient dosing schedule. We will continue to develop patient programs, such as our Live2Thrive program, to maintain and enhance our customer loyalty.
Utilize our Commercial Infrastructure to Launch New and Differentiated Products. We have established a comprehensive infrastructure to commercialize products in the United States, Canada, France and Germany. We intend to leverage these capabilities to launch products from our pipeline and potential acquisitions. Most recently, we launched RECTIV in the United States, providing the only FDA approved product for the treatment of pain associated with chronic anal fissure. In addition, our existing pipeline has product candidates that target major commercial opportunities in the EU and in the United States.
Advance our Pipeline and Enhance our Product Portfolio. We are working to develop the next generation of products to address unmet needs in the CF and GI markets. Our experienced research and development team of over 65 personnel focuses on the development of late-stage novel molecules, as well as reformulations of established drugs including lifecycle management opportunities for our own portfolio. Currently, our most advanced product candidates are APT-1026 and ZENPEP-EU. We completed a pivotal phase III trial for APT-1026 in the EU in 2012 and we expect to launch in the EU in 2015. We recently completed enrollment for a phase III clinical trial in the EU for ZENPEP-EU, which is expected to be completed in 2014. Utilizing our PT capabilities, we expect to continue lifecycle management and enhancement of our current portfolio and pipeline.
Selectively Acquire Complementary Products, Product Candidates and Companies. We seek to selectively acquire or in-license new products and product candidates, or acquire companies, that complement the strategic focus of our existing product portfolio and pipeline. Our experienced business development team uses a rigorous and disciplined approach to identify and acquire products and companies that can be grown by our sales force using the strong relationships we have with our physician, patient advocacy groups and payor audience. We will also consider the acquisition of products, product candidates and companies in therapeutic areas that we consider adjacent to our core areas of expertise.
112
Table of Contents
Leverage our Platform to Expand Internationally. In addition to our current infrastructures in the United States, Canada, France and Germany, we have partners and distributors in over 50 countries worldwide. We intend to leverage our existing international commercial platform to market and distribute our products, including PYLERA, and, if approved, APT-1026 and ZENPEP-EU. In addition, we will evaluate opportunities to expand our commercial presence in EU countries where we currently operate and to establish commercial operations in selected additional EU countries. We may also in-license new assets and expand our partnership and distributorship network outside of the markets in which we currently operate.
Our Products
Our portfolio of market-leading products has a demonstrated track record of sustained growth. In addition, we have four clinical product candidates, as well as a number of early-stage projects in development related to our existing products and therapeutic spaces. We also continually seek to enhance our existing promoted and pipeline products by using our proprietary PT platforms. These platforms both support our internal drug development efforts and contribute to our revenue through third-party business-to-business development agreements under which we formulate enhanced pharmaceutical and biopharmaceutical products using novel oral drug delivery technology.
We believe that our products benefit from one or more intellectual property, regulatory, clinical, sourcing and manufacturing barriers to entry. These include patent protection, data exclusivity under the Hatch-Waxman Act, FDA requirements for generic entrants to conduct clinical trials with clinical efficacy endpoints, complexity in matching formulation characteristics, proprietary manufacturing processes, difficulty in sourcing certain active pharmaceutical ingredients that must match narrow specifications, and the know-how required to manufacture certain dosage forms.
113
Table of Contents
Our principal products and clinical product candidates are:
Product | Summary of Indications | Commercial Markets | Position in Our Commercial Markets1 | Fiscal Year Ended September 30, 2013 Net Sales (in millions) | Net Sales CAGR Fiscal Year 2011-2013 (%) | |||||||||
Pancreatic Enzyme Products |
| |||||||||||||
ZENPEP | Treatment of EPI due to CF or other conditions | U.S. | 2 | $ | 141 | 49.9 | % | |||||||
ULTRESA | Treatment of EPI due to CF or other conditions | U.S. | Launched December 2012 | $ | 2 | n.a. | ||||||||
VIOKACE | In combination with a proton pump inhibitor, VIOKACE is indicated in adults for the treatment of EPI due to chronic pancreatitis or pancreatectomy | U.S. | Launched August 2012 | $ | 3 | n.a. | ||||||||
PANZYTRAT | Treatment of EPI and pancreatic enzyme deficiency | Selected EU countries | 3 (Germany) | $ | 11 | (15.3 | )% | |||||||
Ulcer Treatments | ||||||||||||||
CARAFATE | Short-term (up to 8 weeks) treatment of active duodenal ulcers | U.S. | 2 | $ | 145 | 17.0 | % | |||||||
PYLERA | Treatment of patients withH. pylori infection and duodenal ulcer disease (active or history of within the past five years) to eradicateH. pylori | U.S./EU | 2 (United States); Launched Launched April | $ | 21 | 28.0 | % | |||||||
Mesalamines | ||||||||||||||
CANASA | Short-term treatment of mild to moderately active UP | U.S. | 1 | $ | 133 | 18.9 | % | |||||||
SALOFALK | Depending on the dosage form of Salofalk, indications comprise treatment of acute UC, management of distal UC and prevention of relapse of distal UC. | Canada | 1 | $ | 23 | (0.4 | )% | |||||||
Chronic Anal Fissure | ||||||||||||||
RECTIV | Treatment of moderate to severe pain associated with chronic anal fissure | U.S. | 1 | $ | 16 | n.a. | ||||||||
Pipeline Product | Summary of Indications | Proposed | Stage / Status | |||
APT-1026 | Chronic lung infection withPseudomonas aeruginosa in CF | U.S. /EU/Canada | Phase III EU study completed. Marketing Authorization Application with EMA submitted in November 2013. | |||
EU launch expected in 2015.
Currently in discussions with FDA regarding results of our single U.S. phase III study. | ||||||
APT-1008 (ZENPEP-EU) | EPI | EU | Phase III EU study enrolled. Completion of study expected in 2014. | |||
APT-1016 | Bowel cleansing preparation for colonoscopy | U.S. | Phase II U.S. study completed. | |||
APT-1011 | EoE | U.S. / EU | Phase IIb study expected to commence in 2014. | |||
| 1. | Company estimate based on IMS NPA and Insight Health data as of September 30, 2013. |
114
Table of Contents
Pancreatic Enzyme Products
PEPs are sourced from porcine pancreases and enable the digestion and absorption of fats, carbohydrates and proteins in food for patients who suffer from EPI. EPI is caused by a deficiency of digestive enzymes normally produced by the pancreas and secreted into the digestive tract. If the pancreas is not able to produce and secrete sufficient amounts of these enzymes, food cannot be digested and the appropriate levels of nutrients cannot be absorbed into the bloodstream. Maldigestion and malabsorption associated with pancreatic insufficiency cause malnutrition, which can lead to impaired growth, impaired immune response and shortened life expectancy. EPI is typically associated with various diseases, such as CF, chronic pancreatitis, or CP, and pancreatic cancer. In addition, EPI can result from surgical procedures, including open gastric bypass, extensive small bowel resection and pancreatectomy. Porcine-derived PEPs are comparable in composition to human pancreatic secretions and contain the key enzymes, coenzymes and cofactors necessary for proper digestion. The primary users of PEPs are patients with EPI due to CF, pancreatectomy and CP. CP is a chronic disease that gradually destroys the pancreas and is often idiopathic or caused by excessive alcohol consumption and other conditions, such as hyperlipidemia, hyperparathyroidism, injuries or obstruction of the pancreatic duct. Because CP often has symptoms, such as abdominal pain and diarrhea, that are characteristic of many GI disorders, it often goes undiagnosed and therefore its exact prevalence is unknown. We believe CP results in more than 500,000 physician visits per year in the United States. CF patients begin taking PEPs shortly after birth in small amounts and increase their daily intake of these products as they grow and age, requiring PEPs for their entire life. For the twelve months ended September 30, 2013, there were 1.2 million prescriptions for all PEPs in the United States, producing $753 million in sales, based on IMS prescription data.
We actively promote three PEPs in the United States, ZENPEP, ULTRESA and VIOKACE. ZENPEP and ULTRESA are enteric-coated PEPs with a delayed-release profile while VIOKACE is the only FDA-approved non-enteric coated PEP that has an immediate release profile. PEPs were available in the United States as unapproved prescription products until 2010, at which time the FDA required that all non-FDA approved PEPs be removed from the market. As of September 30, 2013 there were six FDA approved PEPs on the market, including ZENPEP, ULTRESA and VIOKACE. We are the only company with multiple FDA-approved PEPs, allowing us to offer patients a portfolio of products to best meet their needs.
Our PEPs benefit from several factors that reduce the potential for approval of a generic competitor including:
| Ÿ | Lack of ANDA Pathway. Current FDA guidance indicates that the FDA expects that NDA filings, including 505(b)(2) applications, contain substantial evidence to demonstrate safety and efficacy, as the mechanism for approval of a PEP. In addition, in its “Guidance for Industry—Exocrine Pancreatic Insufficiency Drug Products—Submitting NDAs” issued in April 2006, FDA indicated that pancreatic extract drug products currently are not likely to be appropriate for ANDAs. This is because currently approved PEPs are sourced from porcine pancreases and are a complex biologic mixture of extracted porcine pancreatic proteins, called enzymes, including among others, lipase, amylase and proteases, which serve as the active pharmaceutical ingredient. This complex biologic mixture makes it difficult for a company seeking to develop a generic form of an approved PEP to demonstrate that the enzyme extract of the proposed generic product is equivalent to the branded PEP as required under the FDA’s regulations for ANDAs. |
| Ÿ | Limited Suppliers for Active Pharmaceutical Ingredient. FDA requirements for PEP active pharmaceutical ingredient include challenging analytical methodologies to characterize the enzyme extracts. As a result, there are currently only three suppliers worldwide approved by the FDA to manufacture the active pharmaceutical ingredients for FDA-approved PEPs. |
115
Table of Contents
| Ÿ | Regulatory Exclusivity. Each of our PEPs is also a new chemical entity, or NCE, and, as a result, each has five years of “clinical data exclusivity” pursuant to the Hatch-Waxman Act from the date of the approval of its NDA. Even if it were possible to submit an ANDA for approval of a PEP, data exclusivity generally prohibits the FDA from reviewing an ANDA containing the same active moiety during the exclusivity period. The data exclusivity period for ZENPEP runs until 2014 and for ULTRESA and VIOKACE until 2017. |
| Ÿ | Intellectual Property. ZENPEP also benefits from patent protection as described below. |
ZENPEP
ZENPEP is a proprietary porcine-derived PEP developed under the 2004 FDA guidance on pancreatic enzyme replacement therapies. It has been approved for the treatment of EPI due to CF and other conditions in infants, children and adults. ZENPEP has a broad base of clinical data and the greatest number of dosage strengths, ranging from 3,000 units to 25,000 units, in the PEP market, which allows physicians greater flexibility to meet patients’ needs. ZENPEP was approved by the FDA in August 2009 and we commercially launched the ZENPEP franchise in the US in November 2009. For the twelve months ended September 30, 2013, ZENPEP captured approximately 22.1% of the U.S. pancrelipase extended unit market share, based on IMS extended unit prescription data.
In addition to receiving regulatory exclusivity until August 2014 as an NCE pursuant to the Hatch-Waxman Act, we have filed a number of patent applications that include claims intended to cover certain commercial aspects of ZENPEP, including formulation, methods of manufacturing, methods of using and commercial packaging of ZENPEP. We have been issued the following U.S. Patents, each of which is listed in the Orange Book: USP 7,658,918, issued on February 9, 2010, which covers ZENPEP and pancrelipase dosage forms, in general; USP 8,221,747, issued on July 17, 2012, which covers capsule dosage forms for digestive enzymes such as ZENPEP; and USP 8,246,950, issued on August 21, 2012, which covers methods of treating a digestive enzyme deficiency disorder with pancrelipase compositions such as ZENPEP. In addition, we were issued the following U.S. Patents: 8,293,229 on October 23, 2012, and on October 22, 2013, 8,562,978, 8,562,979, 8,562,980, and 8,562,981. None of the patents we have for ZENPEP expires earlier than 2028. We also maintain as trade secrets or know-how certain of the technology used in developing or manufacturing ZENPEP.
Consistent with other FDA-approved PEPs currently marketed in the United States, ZENPEP has postmarketing requirements and commitments. We believe we are on track to meet these commitments. In addition to ZENPEP’s on-going lifecycle management, we submitted a supplemental NDA to the FDA in November 2013 for an additional dosage strength of 40,000 unit dose for the treatment of EPI due to CF or other conditions.
ULTRESA
ULTRESA was approved by the FDA on March 1, 2012 for the treatment of patients with EPI due to CF and other conditions and we commercially launched ULTRESA in the United States in December 2012. ULTRESA is the successor product to ULTRASE MS and ULTRASE MT which we ceased distributing on April 28, 2010 in accordance with FDA requirements. ULTRESA’s predecessor product had a loyal patient and prescribing physician base some of whom have returned to prescribing ULTRESA since its launch in 2012 following FDA approval. For the period since we launched until September 30, 2013, ULTRESA captured approximately 0.2% of the U.S. CF pancrelipase market share, based on IMS prescription data.
ULTRESA has been granted the status of an NCE which entitles it to certain market exclusivity protections pursuant to the Hatch-Waxman Act until 2017. This affords ULTRESA a measure of
116
Table of Contents
protection from new competition in the marketplace, as this exclusivity generally prohibits the FDA from reviewing ANDAs for products containing the same active moiety for a period of five years from the date of the relevant NDA.
In compliance with our postmarketing requirements and in order to expand the ULTRESA franchise, we are currently developing a dosage of ULTRESA for patients aged two to six years old and expect to submit a supplemental NDA to expand the product’s labeling in the first half of 2014.
VIOKACE
VIOKACE was approved by the FDA on March 1, 2012 for the treatment of EPI due to CP or pancreatectomy in combination with a proton pump inhibitor. We commercially launched VIOKACE in the United States in August 2012. VIOKACE is the successor product to VIOKASE which we ceased distributing on April 28, 2010 in accordance with FDA requirements. VIOKACE is the only non-enteric coated PEP available in the United States. For the twelve months ended September 30, 2013, VIOKACE had captured approximately 0.4% of the U.S. pancrelipase market share, based on IMS prescription data.
VIOKACE has been granted the status of an NCE which entitles it to certain market exclusivity protections pursuant to the Hatch-Waxman Act until 2017. This affords VIOKACE a measure of protection from new competition in the marketplace, as this exclusivity generally prohibits the FDA from reviewing ANDAs for products containing the same active moiety for a period of five years from the date of the relevant NDA.
PANZYTRAT
PANZYTRAT is a PEP that consists of enteric-coated microtablets for use in the treatment of EPI and pancreatic enzyme deficiency. PANZYTRAT is distributed and sold in several EU countries, mainly Germany, the Netherlands and Switzerland, as well as a several Eastern European markets and other countries. PANZYTRAT is not approved or promoted in the United States.
In November 2012, we completed a European multicenter phase IV study aimed at assessing and comparing the efficacy of PANZYTRAT 25,000 to that of KREON 25,000 in the control of steatorrhea in patients with EPI due to CF and demonstrated non-inferiority to KREON. We believe this study will allow us to better position our product in the markets where it is currently available.
PEP Marketing and Positioning
We believe that our PEP franchise allows us to offer physicians a complete suite of treatment options for EPI and intend to grow each of our PEPs simultaneously.
ZENPEP is the primary PEP promoted by our CF, GI and PCP sales forces. By offering physicians the broadest range of dosing strengths of all the PEPs, ZENPEP provides physicians easy to titrate dosing options and may allow patients to take fewer capsules or optimize dosage. We believe ZENPEP benefits from a compelling set of clinical data, an award-winning patient support program, and the broadest range of dosing strengths available in the United States.
In addition, as part of the ZENPEP launch strategy in late 2009, Eurand launched an authorized generic, or AG, for ZENPEP, solely in a 5000 lipase units dosage strength, to obtain tier 1 reimbursement in order to quickly capture a portion of the low strength PEP market as unbranded PEPs exited the market at that time. As part of that strategy, Eurand entered into a distribution agreement authorizing X-GEN Pharmaceuticals, Inc., or X-GEN, to sell the AG. As the successor to
117
Table of Contents
that agreement, we continue to supplyX-GEN with finished AG product at prices and volumes determined from time to time through mutual agreement. The agreement renews annually, unless notice is provided 90 days prior thereto, and is terminable by us at any time upon 180 days’ notice. Net sales of the AG in fiscal year 2013 were $8.9 million. We anticipate sales of the AG relative to sales of branded ZENPEP products will remain constant or decrease.
We promote ULTRESA predominantly to CF physicians. We focus mainly on physicians who previously prescribed ULTRASE MT and ULTRASE MS or who would like to have an alternative PEP formulation for their patients, or have not adopted ZENPEP for treating their patients.
As VIOKACE is the only non-enteric-coated, immediate-release PEP available in the United States there is limited competition between VIOKACE and our other enteric-coated PEPs. We intend to promote VIOKACE and conduct awareness campaigns informing physicians who prescribe PEPs that VIOKACE is on the market as part of our strategy to grow our VIOKACE market share.
We also continue to improve and launch new offerings in our innovative, award-winning patient support program, Live2Thrive. This program is free and easy to use for CF patients using any of our enteric-coated PEPs. Members in the program are eligible to receive free shipments of vitamins and nutritional supplements. The Live2Thrive website offers educational content tailored to different age groups and features videos of real people with CF and their caregivers talking about how they manage life with CF. The program also offers patients live support from trained customer service representatives who are available to answer any questions or concerns patients may have regarding topics such as: preferred pharmacy identification, financial assistance and benefits investigation, prior authorization and appeals support and product and vitamin fulfillment. We believe Live2Thrive positions us well with health systems, payors, specialty pharmacies and physician groups since each stakeholder is investing in quality improvement programs.
PEP Competition
Currently, our principal competitors in the U.S. PEP market are CREON (AbbVie Inc., a spinoff from Abbott Laboratories with the rights to commercialize CREON only in the United States), PANCREAZE (Johnson & Johnson) and PERTZYE (Cornerstone Therapeutics). In addition, Eli Lilly is currently developing SOLPURA (liprotamase) for the treatment of EPI associated with CF and pancreatectomy, which, if approved by the FDA, will also compete with our PEPs. Although the FDA currently requires an NDA including a full data package proving clinical efficacy for any new PEP before it can be marketed or sold in the United States, new products and technologies may be introduced in the future.
The main competitor for PANZYTRAT in Germany is KREON (CREON/KREON is commercialized outside of the United States by Abbott Laboratories).
Ulcer Treatments
CARAFATE
Our CARAFATE franchise is indicated for the short-term (up to 8 weeks) treatment of active duodenal ulcers. CARAFATE is sold in the United States primarily as an oral suspension formulation of sucralfate and is not actively promoted through our sales force. CARAFATE has been on the market for approximately 20 years, with a loyal physician prescriber base, and the number of prescriptions written by physicians is growing. CARAFATE is the only available sucralfate oral suspension product in the United States. For the twelve months ended September 30, 2013, CARAFATE oral suspension captured 29.4% of the overall U.S. sucralfate market based on IMS prescription data. For the twelve
118
Table of Contents
months ended September 30, 2013, there were 3.5 million prescriptions for sucralfate resulting in sales of $210.8 million, based on IMS prescription data.
CARAFATE oral suspension benefits from a number of factors that reduce the likelihood of the introduction of a generic form, including:
| Ÿ | Need for Clinical Trials with Efficacy Endpoints. FDA guidance from 2003 (Guidance for industry bioavailability and bioequivalence studies for orally administered drug products—general considerations) and a public presentation by the FDA in 2008 indicate that approval of locally acting GI products would likely require successful completion of clinical trials with clinical efficacy endpoints. We believe this FDA guidance is applicable to sucralfate products that act locally in the GI tract and are not absorbed systemically, and, as such, typical pharmacokinetic studies seeking to establish comparability based on amounts of the drug in the patient’s blood levels are not adequate to demonstrate the bioequivalence of another product seeking approval. |
| Ÿ | Standard of Care. Given changes in the standard of care for treating ulcers and changes in methods for assessing endpoints in clinical trials of ulcer treatments, we believe the design, conduct and successful completion of clinical trials to demonstrate bioequivalence to CARAFATE oral suspension would be difficult. |
| Ÿ | Complex Specifications. The specifications for the active pharmaceutical ingredient of sucralfate suspension products are complex. The specifications for the active pharmaceutical ingredient for the sucralfate suspension product are interrelated with the specifications for the final product and are difficult to replicate and require proprietary know-how. |
We also have ongoing lifecycle management initiatives with respect to our CARAFATE franchise.
CARAFATE competes primarily against proton pump inhibitors and generic sucralfate tablets; however, there are currently no generic versions of CARAFATE oral suspension that are commercially available in the United States.
We also sell SULCRATE products, sucralfate oral tablets and oral suspension, for treatment of active duodenal products in Canada and CARAFATE oral tablets in the United States which have generic competitors.
PYLERA
PYLERA is a three-in-one combination of metronidazole, tetracycline, and bismuth subcitrate potassium contained in a patented capsule-within-capsule technology, indicated for the treatment of patients withH. pylori infection and duodenal ulcers disease (active or a history of within the past five years) to eradicateH. pylori. PYLERA is approved by regulatory authorities in the United States and several countries in the EU, including the United Kingdom, or the UK, Ireland, Germany, France, Belgium, Poland, France and Spain. We have also applied for approval of PYLERA in Italy and Portugal and intend to make applications for approval in several new markets (Central and Eastern Europe, Middle East and North Africa, Russia and the Commonwealth of Independent States).
H. pylori is a bacterium recognized as being the main cause of gastric and duodenal ulcers and long-term infection is associated with gastric cancer and mucosa-associated lymphoid tissue lymphoma, a rare malignant disorder of the lymphatic system. PYLERA does not contain macrolide antibiotics, the use of which is believed to contribute to the growing rate of clarithromycin-resistantH. pylori and ineffectiveness of current macrolide-based standard therapy forH. pylori eradication. PYLERA has demonstrated very high eradication rates forH. pylori patients, including those withH. pylori strains resistant to clarithromycin and metronidazole. In our recent pivotal phase III European study, PYLERA eradicated greater than 90% of clarithromycin resistantH. Pylori, compared to only 8% in those treated with clarithromycin based triple therapy.
119
Table of Contents
We actively promote PYLERA with our U.S. sales force and PYLERA has gained significant market share and continues to grow despite declining sales in the overall brandedH. pylori eradication market. For the twelve months ended September 30, 2013 PYLERA was the number two brandedH. pylori treatment in the United States and captured 25% of the overall brandedH. pylori eradication market based on IMS prescription data. It is also the recommended first-line therapy by the American College of Gastroenterology, or ACG. In August 2013, we launched the PYLERA 10 Day Therapy PAK in the United States, a blister pack which provides patients with new, more convenient packaging option.
PYLERA was recently launched in France and Germany, where an increasing number of patients are showing resistance to clarithromycin. Bismuth quadruple therapy (i.e., PYLERA) is now a recommended first-line treatment in those regions of the EU with high clarithromycin resistance (i.e., greater than 20%) and as either a first-line therapy option (with standard triple therapy as an alternative) or second-line option in low clarithromycin resistance regions in the EU (i.e., lower than 20%).
PYLERA is protected by U.S. patent 6,350,468 for its capsule-in-capsule formulation, which expires in 2018 and EP patent 1037614 which expires in 2018. The U.S. patent is listed in the FDA’s Orange Book. Accordingly, we are eligible to benefit from the automatic stay provisions of the Hatch-Waxman Act for any ANDA submitted subsequent to the date the patent was listed in the Orange Book which contains a Paragraph IV certification.
We also believe PYLERA benefits from challenges associated with the clinical pharmacokinetic testing and in vitro dissolution testing that would be required for a generic version of PYLERA. PYLERA consists of a proprietary formulation of three active ingredients, bismuth potassium subcitrate, tetracycline HCl and metronidazole. Any generic version of PYLERA would need to demonstrate bioequivalence of each active ingredient in both fasting and food clinical trials. We believe demonstrating bioequivalence to the bismuth portion of PYLERA, in particular, through pharmacokinetic studies would be challenging due to the negligible systemic absorption of bismuth. We have ongoing lifecycle management for our PYLERA franchise and several studies will be initiated in France as part of our European risk management plan, including a pharmacokinetic study to investigate the exposure of patients to bismuth in a real life setting; the profile ofH. pylori resistance at a population level to commonly used antibiotics; and a drug utilization study.
In the United States, PYLERA competes primarily with other pre-packaged products including HELIDAC (Prometheus Laboratories Inc.), PREVPAC (TAP Pharmaceutical Products Inc.), OMECLAMOX (Pernix Therapeutics) and generic PREVPAC (Teva Pharmaceuticals). In the EU, PYLERA competes with generic combinations or branded pack products such as ZacPac in Germany.
Mesalamines
CANASA
CANASA, a 1,000mg mesalamine suppository sold in the United States, is indicated for the short-term treatment of mild to moderately active ulcerative proctitis, or UP, a distal form of inflammatory bowel disease. UP is an idiopathic mucosal inflammatory disease involving only the rectum (the area between the colon and the anus) and is therefore an anatomically limited form of UC. Symptoms of UP include diarrhea, bleeding, tenesmus, mucus discharge and pain. According to data published in 2007, in the United States, approximately 238 out of every 100,000 adults have UC. The estimated prevalence of each type of UC varies but a study published in 1993 found 46.2% of UC patients had UP or Proctosigmoiditis. The incidence of UC tends to be higher among individuals in their 20s and 30s with a second, smaller, increase in incidence in individuals in their 60s.
120
Table of Contents
CANASA is the only FDA-approved mesalamine suppository available in the United States. The ACG guidelines recommend topical mesalamines, such as CANASA, as a first-line therapy for mild-to-moderate UP. CANASA offers fast symptom relief and more convenient administration compared to other rectal topical mesalamine formulations, such as mesalamine enemas. We actively promote CANASA with our U.S. sales force. For the twelve months ended September 30, 2013, CANASA captured 65.2% of the rectal mesalamine market based on IMS prescription data. For the twelve months ended September 30, 2013, there were approximately 381,000 prescriptions in the rectal mesalamine market resulting in sales of approximately $195.5 million, based on IMS prescription data.
We believe there are several challenges that would need to be overcome in order for a generic form of CANASA to be approved by FDA, including:
| Ÿ | Requirement for Same Excipient and Bioequivalence. Under current FDA draft guidelines revised in March 2013, a proposed generic entrant would need to demonstrate that the proposed mesalamine formulation has the same excipients as CANASA and demonstrate bioequivalency to CANASA through in vivo studies with pharmacokinetic endpoints and in vitro dissolution studies, rather than clinical trials with clinical efficacy endpoints as previous FDA guidance had provided. The draft guidance requires that a generic match the excipients in CANASA both qualitatively and quantitatively. Because there is no publicly available information on the precise composition of CANASA, we believe it may be difficult to develop a formulation that is identical to CANASA. If a generic sponsor cannot match the CANASA formulation, such sponsor would be required to submit an NDA with full clinical data. In addition, due to the high variability and poor absorption of mesalamine through the rectum, we believe demonstrating bioequivalence could be difficult. |
| Ÿ | Complex Manufacturing Process. There is also significant know-how involved in the manufacturing process for both the active pharmaceutical ingredient and the finished product which will make it more difficult for a generic or new entrant to match the dissolution specifications and sameness of the pharmaceutical formulation of CANASA. |
| Ÿ | Intellectual Property. In addition, we have been issued two patents (U.S. Patent Nos. 8,217,083 and 8,436,051) which we believe would make it more difficult for new entrants to compete with CANASA. The U.S. patents, which expire in 2028, cover mesalamine rectal suppositories and certain methods of treatment relevant to our CANASA franchise. |
We have received letters from two parties indicating that they had each filed an ANDA seeking approval to market a generic version of CANASA. In July 2013, we filed patent infringement suits against each party. We believe the ANDAs were filed before the patents covering CANASA were listed in the FDA’s Orange Book, which generally means that we are not entitled to the 30-month stay of the approval of these ANDAs provided for by the Hatch-Waxman Act. See “Risk Factors—Risks Related to our Business—The entry of generic versions of our products into the market could have a material adverse impact on our financial position, cash flows and results of operations” and “Business—Legal Proceedings” for more information regarding the infringement suits.
CANASA competes directly with mesalamine enemas and to a lesser degree with topical corticosteroids including enemas and suppositories. In the United States, CANASA primarily competes with ROWASA enemas sold by MEDA AB and with various generic mesalamine enemas. It also indirectly competes with oral mesalamine products such as ASACOL, ASACOL HD®, and DELZICOL (Warner Chilcott Company, LLC), PENTASA and LIALDA (Shire US Inc.), and APRISO and COLAZAL (Salix Pharmaceuticals, Inc.).
121
Table of Contents
SALOFALK
SALOFALK is a mesalamine-based product line, including oral tablets, oral suspensions and suppositories, that we actively promote to gastroenterologists in Canada for the treatment of certain inflammatory bowel diseases, such as UC, UP and Crohn’s disease.
In Canada, SALOFALK competes with several products containing mesalamine in controlled-release tablets or capsules, including ASACOL (Warner Chilcott Company, LLC), PENTASA (Ferring Inc.) and MEZAVANT (Shire plc). Generic versions of certain mesalamine tablet and suspension formulations are also available on the market.
Chronic Anal Fissure
RECTIV
RECTIV (nitroglycerin) Ointment 0.4% is a prescription medicine used to treat moderate to severe pain caused by chronic anal fissure in the United States. An anal fissure is a cut or tear in the lining of the anus which affects as many as 400,000 people annually in the United States. The most common reasons for anal fissure are constipation, hard and dry bowel movements and other conditions that may cause injury to the anus. When an anal fissure does not heal with diet or lifestyle changes, and a patient has multiple physician visits to treat the condition, physicians consider it chronic. Chronic anal fissure affects approximately 136,000 people annually. For the month of September 2013, RECTIV generated over 3,700 prescriptions, representing approximately 67% growth versus the month of September 2012, based on IMS prescription data.
RECTIV is the only FDA approved medication for the treatment of pain associated with chronic anal fissure. RECTIV competes with a variety of unapproved products including compounded nitroglycerin, compounded calcium channel blockers, and corticosteroid creams, ointments and suppositories, but does not currently have any FDA-approved competitors. We acquired a license for the exclusive rights to RECTIV in the United States in December 2011 and launched RECTIV in March of 2012. RECTIV is actively promoted by our U.S. sales force to GI physicians, colorectal surgeons and high-prescribing primary care physicians.
The licensed U.S. patents 5,504,117, 5,693,676 and 7,189,761, which cover RECTIV and contain claims directed towards methods of treating pain associated with anal fissure, expire in 2014. U.S. patent 7,189,761 is listed in the Orange Book. The FDA has also granted RECTIV certain market exclusivity protections pursuant to the Hatch-Waxman Act until 2014. This affords RECTIV a measure of protection from new competition in the marketplace, as this exclusivity generally prohibits the FDA from reviewing ANDAs for generic products until the exclusivity protections expire. After 2014, because RECTIV acts topically and there is no correlation between systemic nitroglycerin levels and pain reduction, we believe the FDA would require clinical trials with clinical efficacy endpoints prior to approval of a generic version of RECTIV.
Other Products
In addition to the products mentioned above, we also have over 15 products available in the United States or internationally for the treatment of a broad range of GI disorders which represented 15.2% of our total revenue for the fiscal year ended September 30, 2013. These products include DELURSAN, URSO, FLEET PHOSPHO-SODA, LACTEOL, TRANSULOSE, BENTYL and CITRAFLEET, among others.
122
Table of Contents
Products in Development
Our research and development team leverages its expertise in the fields of CF and GI disorders to develop product line enhancements and modifications to existing products and to develop new product candidates, consistent with our development growth strategy. Our research and development capabilities include pharmaceutical development, clinical development, regulatory affairs, quality and compliance, medical affairs and pharmacovigilance.
Our staff of research scientists has expertise in the drug development process on an international basis, from pre-formulation studies and formulation development, to scale-up and manufacturing. The clinical development and medical affairs team assumes product stewardship from pre-clinical testing and first-in-man studies up to post-marketing studies, risk management and pharmacovigilance activities and contributes to market access strategies and tactics. Since October 1, 2011, we have obtained regulatory approval to promote 8 products in 13 countries and have commercially launched 7 products in 7 countries. In addition, over the same time period, we have in-licensed two products.
Our pipeline products are in various stages of development and mostly consist of repurposed and reformulated drugs. Despite the reduced risk profile of our pipeline programs (relative to new chemical entities), they do carry potential development risks, and as such, we do not anticipate the commercialization of all of these products. From time to time, we review our portfolio of products under development to set priorities for the various development programs underway and to ensure that internal and budgeted resources are allocated accordingly. As a result of these reviews, the contents of certain development programs and related timelines may be modified or certain programs terminated. This is standard practice in the pharmaceutical industry.
The following is a description of our most active and disclosed pipeline projects.
APT-1026
APT-1026, a proprietary formulation of levofloxacin for inhalation, acquired in the Mpex Transaction, is being developed for the treatment of chronic lung infections with Pseudomonas aeruginosain patients with CF.
Chronic lung infections in CF patients are incurable, requiring long-term disease management. CF affects an estimated 30,000 adults and children in the United States and 70,000 patients worldwide. The prevalence ofPseudomonas aeruginosa increases as patients age, infecting approximately 20% of CF patients aged five or younger, 40% of patients aged 11 to 17, 60% of patients aged 18 to 24 and 80% of patients aged 25 to 34. In the United States, such infections are treated with various antibiotics often given by inhalation, including: TOBI (tobramycin inhalation solution, or TIS), TOBI Podhaler (tobramycin inhalation powder) and CAYSTON (aztreonam for inhalation solution). In 2012, TOBI had revenue of approximately $332 million and Cayston had revenue of approximately $88 million. In the EU, colistimethate sodium is also frequently prescribed. The goal of antibiotic treatment of chronic lung infection is to reduce the serious morbidity and mortality that accompanies lung infections. Existing antibiotics are not always well tolerated, and patients often exhibit a diminished response to them over time. Thus, additional antibiotics of different classes are needed to improve treatment options for patients.
The active ingredient of APT-1026, levofloxacin, is a well-studied drug in the fluoroquinolone class of broad-spectrum antibiotics that is widely administered through oral and parenteral administration routes to treat various serious infections, including acute and chronic lung infections in patients with CF. If approved, APT-1026 would be the first approved inhaled fluoroquinolone for treatingPseudomonas aeruginosain patients with CF.
123
Table of Contents
APT-1026 is a novel formulation of levofloxacin that has been optimized for inhalation, with rapid and efficient delivery of liquid aerosolized drug to the sites of lung infection via a customized configuration of the Pari eFLOW® nebulizer, a common device for inhaled therapies. APT-1026 thus delivers far higher concentrations of levofloxacin to the sites of lung infection than are achievable with oral or intravenous administration, while maintaining blood levels of antibiotic below those of comparable oral or intravenous doses, leading to a higher therapeutic index.
In support of this profile of APT-1026, we recently completed two phase III studies in CF patient populations representative of chronically infected patients with CF in the United States and Europe (i.e., intensively managed with drug and other established treatments, including multiple courses of inhaled antibiotics). Study 209 was a pivotal active-controlled phase III trial intended for EU approval, and Study 207 was a pivotal placebo-controlled phase III trial intended for U.S. approval.
Study 209 was a multinational, randomized, open-label, active-controlled, parallel-group study in stable CF patients with chronicPseudomonas aeruginosa lung infection to evaluate the efficacy and safety of APT-1026 (240 mg BID) as compared with TIS (300 mg BID) over three consecutive56-day cycles (28 days on treatment and 28 days off treatment). Patients were at least 12 years of age and weighed at least 30 kilograms. Documentation of chronicPseudomonasaeruginosa lung infection was required, as was completion of at least three 28-day courses (or 84 days in total) of TIS in the prior 12 months with at least one course completed within 29 to 56 days of enrollment and with no inhaled antibiotics in the 28 days prior to enrollment (or thereafter during the study, unless needed to treat suspected disease exacerbation). APT-1026 was added to current medications. We enrolled 282 patients in the trial with patient randomized in a two-to-one ratio, resulting in 189 patients receiving APT-1026 and 93 patients receiving TOBI. The primary efficacy measure in Study 209 was change in lung function as determined by forced expiratory volume in one second (FEV1). FEV1 may be represented by a number of related values, one of which is the percent predicted value, which is the value predicted after accounting for factors known to influence FEV1 in all people (typically gender, race, age and height). FEV1 is a well-recognized marker of lung function in patients with CF and other respiratory diseases and is used routinely by physicians to measure short-term changes in patient functional status. FEV1 correlates with mortality in CF patients, and quality of life when measured repeatedly over longer periods of time (years). One goal of inhaled antimicrobial therapy in practice is maintenance of lung function as determine by FEV1.
The primary efficacy endpoint in Study 209 was noninferiority to TIS in a comparison of the relative change from baseline in FEV1 percent predicted value between the two active treatments at day 28 (i.e., the final day of therapy before the “off-treatment” period). The primary endpoint was met, with a mean treatment difference of 1.86 points favoring APT-1026, and with the lower limit of the 95% confidence interval of -0.66% and upper limit of 4.39%. The treatment effect size is considered to be clinically meaningful.
APT-1026 also demonstrated benefits relative to TIS for quality-of-life, which was a secondary endpoint of the trial. Quality of life was measured by patient response to the Cystic Fibrosis Questionnaire-Revised respiratory domain, which is a disease-specific health-related qualify of life, or HRQOL, measure for children, adolescents and adults with CF and is one of the most widely used HRQOL measures for CF.
We filed a Marketing Authorization Application with the EMA in November 2013, and we plan to launch in the EU in 2015, if approved.
Study 207 was a multinational, randomized, placebo-controlled, parallel-group study in stable CF patients with chronicPseudomonas aeruginosa lung infection to evaluate the efficacy and safety of APT-1026 (240 mg BID). Patients were at least 12 years of age and weighed at least 30 kilograms.
124
Table of Contents
Documentation of chronicPseudomonasaeruginosa lung infection was required, as was completion of at least three 28-day courses (or 84 days in total) of any inhaled antibiotic in the prior 12 months with at least one course completed within 29-84 days of enrollment and no inhaled antibiotics in the 28 days prior to enrollment (or thereafter during the study, unless needed to treat suspected disease exacerbation). APT-1026 was added to current medications. We enrolled 330 patients in the trial, with patients randomized in a two to one ratio, resulting in 220 patients receiving APT-1026 and 110 patients receiving the placebo. The study consisted of a screening period of up to 14 days, a 28-day treatment period, and a 28-day follow-up period.
Study 207 did not meet the primary endpoint of time to first exacerbation (i.e., acute worsening of functional status accompanied by specific signs and/or symptoms). There was no statistical difference between APT-1026 and placebo for the primary efficacy endpoint (Hazard Ratio = 1.33 (favoring placebo)), with the lower limit of the 95% confidence interval of 0.96% and upper limit of 1.84%. A higher proportion of patients in the APT-1026 group experienced an exacerbation during the study compared with placebo (55.5% versus 47.3%, respectively).
Superiority over placebo was demonstrated for improving lung function as determined by FEV1, a key secondary endpoint, with the least-squares mean treatment difference of 2.42 for FEV1 percent predicted relative change from baseline at Day 28 favoring APT-1026, with the lower limit of the 95% confidence interval of 0.53% and upper limit of 4.31%. Absolute change from baseline at Day 28 also favored APT-1026, with the least-squares mean treatment difference of 1.31, and the lower limit of the 95% confidence interval of 0.27% and upper limit of 2.34%. Superiority of APT-1026 over placebo was also shown for reduction inPseudomonas aeruginosa density cultured from sputum; however, no evidence of a benefit of APT-1026 on clinical outcomes, such as quality-of-life or requirements for systemic antibiotics, was observed. We are currently discussing results of these studies with the FDA to determine the appropriate regulatory path forward in the United States.
APT-1026 was well-tolerated in the CF efficacy and safety studies conducted to date in the EU and the United States, with the most commonly observed adverse events consistent with the underlying disease and dysgeusia. There were no serious adverse events indicative of lung, musculoskeletal, liver, kidney or nervous system toxicity, and blood levels of the drug were consistent with those measured in earlier-phase studies.
If approved, our commercial strategy for APT-1026 is to use our existing CF sales force to market APT-1026 in the markets where we have direct commercial infrastructure in the EU, Canada and the United States and evaluate opportunities to expand outside our commercial footprint. We have U.S. patents covering composition of matter of APT-1026 which expire no earlier than 2026.
APT-1008 (ZENPEP-EU)
ZENPEP-EU is being developed for the treatment of EPI in the EU based on the U.S. ZENPEP franchise. ZENPEP-EU is a proprietary porcine-derived PEP developed under the 2004 FDA guidance on PEPs, which was approved in the United States under the name ZENPEP in August 2009 for the treatment of EPI due to CF or other conditions. Due to the increased stability of enzymes in this formulation and lack of overfill, we believe that ZENPEP-EU provides a more predictable and precise dosage than other PEPs currently available in the EU and meets the EU guidance on development of CF products.
The European PEP market, including PANZYTRAT, had approximately€190 million in net sales
for the twelve months ended September 30, 2012, while experiencing approximately 2% net sales growth from 2008 to 2012. The top five EU markets (Germany, France, UK, the Netherlands and Poland) accounted for 67% of the EU market. The primary competitor for ZENPEP-EU is CREON/KREON, which is commercialized by Abbott Laboratories outside of the United States.
125
Table of Contents
We are seeking a marketing authorization in the EU under the centralized procedure and are conducting a phase III study in the EU based on scientific advice from the CHMP to generate data in support of a filing. The phase III study is a randomized, double-blind, active-controlled, two treatment crossover, multinational, multicenter study to evaluate safety and efficacy of ZENPEP-EU as compared to Kreon in patients age 12 and older with EPI due to CF. The goal of the study is to demonstrate noninferiority of ZENPEP-EU to Kreon with a margin of 5% for the primary efficacy endpoint, coefficient of fat absorption, which is an established surrogate endpoint accepted by the EMA. Secondary endpoints include the coefficient of nitrogen absorption as an indicator of improved protein absorption, signs and symptoms of EPI, change in body weight and effect on quality of life based on a validated patient-reported outcome instrument in CF patients. The study completed enrollment in October 2013, and is being conducted in 36 sites in western and eastern Europe. We expect to announce data from the trial in 2014. A waiver from the requirement to perform pediatric clinical studies in any age groups has been granted by the EMA. There is a pending European patent application with claims directed to the same subject matter as the U.S. patents that cover ZENPEP.
APT-1016
We are currently designing a phase III clinical development plan for APT-1016, a novel bowel cleansing agent to be used in preparation for a colonoscopy.
Colonoscopy is recommended for anyone over 50 years old at average risk for developing colorectal cancer by the American Cancer Society and is a standard procedure used for diagnosing cancer and other ailments. Colonoscopy procedures require the proper cleaning of the lower GI tract using bowel preparations, or bowel preps, to aid in visual identification of polyps and other premalignant and malignant tissues. The U.S. bowel prep market generated approximately $258 million in sales in the 12 months ended August 31, 2013, based on IMS data. Many of the current bowel preps available on the market have an unpleasant taste or require the patient to consume up to four liters of preparation solution to obtain effective results in the colonoscopy. APT-1016 is designed to be a more palatable and lower-volume solution, without compromised efficacy compared to existing higher-volume bowel preps. Evidence supporting these attributes comes from the clinical data generated by the company from which we acquired APT-1016, C.B. Fleet Company, Incorporated, or Fleet. Fleet conducted a phase II study of APT-1016 which was a single-blind, active-controlled, randomized multicenter study, conducted in three sites in the United States, to evaluate safety and efficacy of APT-1016 as compared to Moviprep (PEG-AA). The study included 148 subjects, aged 18 and older without a history of suspected electrolyte abnormalities or of inflammatory bowel disease, scheduled for an elective colonoscopy, with 95 patients receiving APT-1016 and 49 patients receiving Moviprep. A split dose regimen ofAPT-1016 (evening before and morning of colonoscopy) with 52.8 g each of L-glucose monohydrate dissolved in 8 fl oz (0.24L) was compared to a Moviprep split dose with administration of 1L of Moviprep each. Total fluid intake (active and additional clear fluid) was 1.42L with APT-1016 and 3L with Moviprep. The percentage of bowel preparations rated as excellent or good by the examining physician for theAPT-1016 cohort was 97.9% and for the Moviprep cohort was 93.9%. The segmental evaluations showed a significantly higher total residual stool score (based on a 12 point composite scale, which is comprised of unweighted 0-4 scales for each of stool amount, stool consistency and percent wall visualized) in the cecum vs rectum for both APT-1016 (score of 1.9 and 1.4, p=0.024) and Moviprep (2.6 and 1.4, p<0.0001), however there was no significant difference between the cecal and rectal scores for percent bowel wall visualized forAPT-1016 (score of 0.1 for cecum and 0.1 for rectum p=0.253), in contrast to Moviprep (score of 0.3 for cecum and 0.0 for rectum p=0.021).
126
Table of Contents
The majority of adverse events reported were mild or moderate in intensity. There were two reports of serious adverse events during the study, neither of which was deemed related to study medications. 88% of subjects in the APT-1016 group were willing to repeat their regimen, compared to 86% in the Moviprep group. We conducted an additional renal safety study with APT-1016 in 70 healthy volunteers in comparison to the Moviprep (100 g PEG3350 + 7.5g sodium sulfate) vehicle, administered as split dose regimen, 12 hours apart (same doses as in the phase II study groups), with close monitoring of renal function and markers of acute kidney injury. There was no evidence of acute kidney injury for any group; no clinically relevant changes were observed within or between treatment groups for any renal parameters. 8% of the ingested dose of APT-1016 was excreted with the urine.
We are currently working to scale up the manufacturing of the active pharmaceutical ingredient forAPT-1016. We intend to have an end of phase II meeting with the FDA in 2014 and commence a phase III trial of APT-1016 in 2015, using the same doses as in the phase II study. An Orange Book listable patent (U.S. patent 8,470,983) protecting APT-1016 was recently granted in the United States on June 25, 2013 and expires in 2031. We also have one allowed patent application for APT-1016. In addition, APT-1016 is an NCE and is expected to receive five years of data exclusivity under the Hatch-Waxman Act starting from the date of approval.
APT-1011
APT-1011 is being developed for the treatment of EoE, a rare inflammatory/immunological disease of the esophagus resulting in progressive swallowing disorders. APT-1011 is an oral disintegrating tablet, or ODT, proprietary formulation of fluticasone propionate (FP), a highly potent glucocorticosteroid with less than 1% systemic bioavailability upon oral administration. ODT tablets are developed in-house, based on our PT platform, and are designed to rapidly disintegrate in the oral cavity after administration, without the need for water. The ODT formulation of FP is designed to provide an accurate dose of APT-1011 in a convenient and palatable dosage form and allow for an efficient delivery of FP to the esophagus, the target site of action.
EoE is a rare GI disease and there is currently no FDA-approved product indicated for the treatment of EoE in the United States. EoE is a chronic, antigen-induced, immune-mediated esophageal inflammatory disease, which affects approximately 175,000 adults and children in the United States and the number of affected patients has been rising in recent years. ACG guidelines recommend treatment using topical steroids and dietary restriction for the treatment of EoE, however no topical steroid formulation has been approved by the FDA for the treatment of EoE. We recently completed a phase I/II clinical proof of concept study(PR-021) for APT-1011. This study was a multicenter, randomized, double-blind, placebo-controlled, safety and tolerability study of two dosing regimens of APT-1011 in subjects with EoE aged between 12 and 55 years old conducted in seven sites in the United States. APT-1011 at doses of 1.5 mg BID or 3 mg QD or placebo were administered over eight weeks. APT-1011 was well tolerated in the study; specifically, no effects on endogenous cortisol levels or oral candidiasis were observed. All efficacy endpoints in the study were exploratory. Eleven of 16 patients in the APT-1011 groups achieved a reduction of peak number of eosinophils to a value below the number defined as diagnostic threshold per ACG guidelines (less than or equal to 15 per high power field), in contrast to one of eight placebo patients; one patient was treated with a systemic glucocorticoid for another condition. Symptom relief was observed in 12 of 16 patients in the APT-1011 groups compared to three of eight patients in the placebo group. In a non-treatment follow-up observation phase to investigate the natural history of disease, all subjects relapsed within 12 weeks.
In a subsequent phase I pharmacokinetic study in 16 healthy subjects, we confirmed that the systemic exposure of fluticasone is low following administration of swallowed FP (APT-1011 up to a total daily dose of 6.0 mg). These data are consistent with a reported oral bioavailability of FP less than
127
Table of Contents
1%. Administration of APT-1011 with food was associated with a 41% decrease in AUC(0-24h) for the full study population. Overall, as the oral bioavailability is very low (< 1%), as previously observed, these differences in the fed and fasted scenarios are not expected to be clinically meaningful.
We are currently designing a phase IIb dose-finding study following our end of phase I meeting with the FDA in October 2013.
APT-1011 has been granted orphan drug status in the United States and is the subject of patent applications that, if granted, are expected to expire in 2030. We intend to submit an application for an orphan drug designation in Europe.
Others
We also have other early-stage projects in development related to our existing products and therapeutic spaces.
Pharmaceutical Technologies
Our PT business consists of a portfolio of proprietary technology platforms that has produced over 35 approved products in over 35 countries, supports our specialty pharmaceutical business, is a central component of our lifecycle management programs and provides us with the opportunity to develop innovative products for our internal product pipeline and the flexibility to offer third-parties co-development programs, product out-licensing and manufacturing programs. Our experienced PT development team was integral to the development of the formulations for ZENPEP and ULTRESA in support of our specialty pharmaceutical business.
Our PT platforms are protected by various patents in the United States and EU, some of which expire in the next few years. We have several patents pending which we believe will extend the protection afforded these technologies.
Customized Release
Our customized release platform has four separate technologies: Diffucaps®, Diffutab®, Eurand Minitabs and Orbexa. These technologies can be used to provide a modified release of the drug to reduce daily dosing requirements, or to release at selected sites in the GI tract or at selected times after ingestion to potentially improve therapeutic benefits or the safety profile. Alternatively, the drug can be set to release at a time of day when patients are most at risk from the acute disease effects, such as the early morning for cardiovascular disease. These technologies can be selected on the basis of the desired pharmacokinetic profile, the nature of the drug substance and the market requirements for the finished dosage form.
Taste-masking/ODT
Our Microcaps® taste-masking technology, our AdvaTab® orally disintegrating tablets technology, licensed from Kyowa, and Liquitard® liquid suspension technologies create convenient, patient-friendly dosage forms which can mask bitter or irritant characteristics of many drugs or aid ingestion in patients who have difficulties swallowing.
Bioavailability Enhancement
Biorise® technology enhances solubility and absorption of poorly soluble drugs by creating stable nanocrystalline and amorphous drug forms that can be formulated as capsules or tablets. The result is
128
Table of Contents
that the onset of therapeutic action is faster, lower amounts of a drug can be used for equivalent efficacy, reduction of food effect and variability can be achieved and promising molecules that could not ordinarily be drug candidates due to low absorption can now enter a development pipeline.
Our Diffucaps® technology can be used to improve the solubility of “pH-dependent” drugs. The inherent solubility of these drugs is affected by the pH of their surrounding environment. This phenomenon can affect the absorption of certain drugs from the GI tract, where the pH varies significantly, thereby limiting the ability to deliver the drug over a prolonged period of time. The Diffucaps® technology can be used to overcome this limitation.
Collaboration Agreements
Through our collaboration arrangements, we have successfully applied our PT platform to drug products in a diverse range of therapeutic areas, including cardiovascular, GI, pain, nutrition and respiratory. Traditionally, we have entered into agreements whereby we manufactured and supplied the resultant product and our collaboration partners or licensee commercialized the product, frequently subject to royalty and milestone obligations.
Sales and Marketing
In the United States, we sell our products to most major wholesale drug companies and distributors, which in turn distribute our products to chain and independent pharmacies, hospitals and mail-order pharmacies. At September 30, 2013, our U.S. sales force consisted of 19 CF account managers covering substantially all of the Cystic Fibrosis Foundation care centers (including more than 110 Cystic Fibrosis Foundation accredited centers, 55 affiliate programs and satellite offices for the accredited centers) promoting ZENPEP and ULTRESA and our associated patient support program; 97 sales specialists promoting ZENPEP, ULTRESA, CANASA, PYLERA and RECTIV to high-volume prescribing gastroenterologists and colorectal surgeons; and 39 contract primary care sales specialists promoting ZENPEP, ULTRESA, CANASA, PYLERA and RECTIV to a select group of high-volume prescribing primary care physicians. Our U.S. managed markets team consists of seven commercial/governmental account managers, two corporate account managers and a federal account manager.
We use a “pull-through” marketing approach that is typical of pharmaceutical companies. Under this approach, our sales representatives actively promote our products by demonstrating the features and benefits of our products to physicians and, in particular, gastroenterologists who may prescribe our products for their patients. The patients, in turn, take the prescriptions to pharmacies to be filled. The pharmacies then place orders, directly or through buying groups, with the wholesalers, to whom we sell our products.
In Europe our sales force is primarily located in France and Germany. In France, we sell our products to wholesalers and pharmacies. As of September 30, 2013, in France we had 35 sales representatives who, under the supervision of four regional sales directors, regularly visit high-volume prescribing physicians and pharmacies to promote PYLERA, DELURSAN, CITRAFLEET and TRANSULOSE. We also have a detailing partnership agreement to co-promote LACTEOL in French pharmacies. In Germany, we have an exclusive contracted sales force consisting of 18 sales representatives under the supervision of three regional sales managers who promote PANZYTRAT, LACTEOL and PYLERA.
In Canada, we sell our products to hospitals and wholesale drug companies, which in turn distribute our products to pharmacies. Our major products are included in most provincial drug benefit formularies. In Canada, our SALOFALK product line is promoted by our 11 sales representatives and a
129
Table of Contents
market access manager, under the supervision of a regional sales manager. The sales representatives call on gastroenterologists and internal medicine specialists with a particular interest in GI diseases.
In other markets, we sell our products to distributors, which in turn distribute them to wholesale drug companies, which in turn distribute them to retail pharmacies and hospitals. We currently have such distribution partnerships in over 50 countries throughout the world.
Customers
While the ultimate end users of our products are the individual patients to whom our products are prescribed by physicians, our direct customers include a number of large pharmaceutical wholesale distributors and large pharmacy chains. The pharmaceutical wholesale distributors that comprise a significant portion of our customer base sell our products primarily to retail pharmacies, which ultimately dispense our products to the end consumers.
The following table sets forth the percentage of total net product sales for each of the last three fiscal years for each of our wholesale customers that accounted for 10% or more of our total net product sales in any of the last three fiscal years.
| For the year ended September 30, | ||||||||||||
| 2013 | 2012 | 2011 | ||||||||||
McKesson Medical | 27.3 | % | 29.1 | % | 26.3 | % | ||||||
Cardinal Health | 24.3 | % | 24.8 | % | 25.5 | % | ||||||
Amerisource Bergen | 13.2 | % | 10.2 | % | 10.0 | % | ||||||
|
|
|
|
|
| |||||||
| 64.8 | % | 64.1 | % | 61.8 | % | |||||||
|
|
|
|
|
| |||||||
Manufacturing and Supply
The manufacturing supply chain for our products is supported by our manufacturing facilities located in the United States and Europe and by third parties. We manufacture ZENPEP and ULTRESA at one of our facilities in Italy, LACTEOL at our facility in France, rectal formulations of SALOFALK and CANASA at our facility in Canada and other PT products in the United States and Italy. We also outsource aspects of the manufacturing of certain of our products. We intend to continue outsourcing the manufacturing, analytical testing and distribution of certain of our products for the foreseeable future.
Our internal and third-party manufacturing operations are subject to extensive government regulations as prescribed by regulatory authorities in the countries in which we operate, including the United States, Canada, France and Italy. For example, the FDA requires that the drug product be manufactured, packaged and labeled in conformity with current good manufacturing practices, or cGMP. In complying with cGMP regulations, manufacturers must continue to invest time, money and effort in manufacturing and quality control and quality assurance to ensure that their products meet applicable specifications and regulatory requirements. Similar guidelines apply to manufacturers outside of the United States. We strive to maintain, and depend on our third-party suppliers and manufacturers to maintain, compliance with cGMP requirements and other applicable regulations and standards.
With the exception of LACTEOL, we rely on third parties to supply the active pharmaceutical ingredients used in our finished products. While we believe there are alternative sources of supply for
130
Table of Contents
the active pharmaceutical ingredients and raw materials required for the manufacturing of our products, active pharmaceutical ingredients and excipients for certain of our products, such as ZENPEP and CARAFATE oral suspension, are sourced from single-source suppliers. Should any of our current suppliers be unable to meet our business needs, there is a possibility we could not be able to qualify alternative suppliers in a timely manner, or obtain the required materials under favorable terms. For some of our promoted products the finished dosage manufacturer also packages the product, while for others we use a separate third-party packaging company. Supply agreements are in place with most third-party suppliers and typically have two to five-year terms; our current contracts will expire at various dates over the next three to five years. We believe, but cannot guarantee, that we will be able to renew these agreements under satisfactory terms and conditions as they expire or we will be able to find suitable alternate suppliers and manufacturers. Should we be unable to renew these agreements under favorable terms and conditions or find suitable alternatives, our business may be adversely affected.
With the exception of the manufacturers of CANASA, CARAFATE, VIOKACE and RECTIV, our manufacturers and suppliers are not prevented from supplying similar product to third parties. Our suppliers of mesalamine and the manufacturer of CANASA have each agreed not to supply similar or the same mesalamine active ingredient or mesalamine product to a third-party in the United States or Canada. Our supplier of CARAFATE has agreed not to supply a suspension formulation of sucralfate, the active pharmaceutical ingredient in CARAFATE, to a third party in the United States. Our supplier of RECTIV has agreed not to directly or indirectly sell the product in the United States.
We have entered into agreements with third parties to manufacture the finished dosage form of all our promoted products other than rectal formulations of SALOFALK, ULTRESA and ZENPEP and for certain parts of the manufacturing process for CANASA. Depending on the particular arrangement, either we or the third-party manufacturer sources the active pharmaceutical ingredient. We use third parties and internal laboratories to perform analytical testing on our raw materials, active ingredients, finished products and product candidates.
Our agreements with suppliers, manufacturers and testing laboratories include, among others, specific supply terms, product specifications, testing and release mechanisms, batch size requirements, price, payment terms, forecast requirements, shipping and quality assurance conditions. Under some of these agreements, we are obligated to purchase all or a specified percentage of our requirements for the product or active pharmaceutical ingredient supplied under the agreement. These agreements generally permit the manufacturer or supplier to pass on to us increases in cost of production or materials.
Sanofi-Aventis U.S. LLC
In October 2003, we entered into a finished product supply agreement with Sanofi-Aventis U.S. LLC, or Sanofi, under which Sanofi agrees to supply and we agree to purchase, exclusively from Sanofi, all of our requirement of finished product forms of sulfacrate, which we sell as CARAFATE, within the United States.
The term of the distribution and supply agreement will continue until August 1, 2016. The finished product supply agreement may also be terminated under certain other specified circumstances, including: (a) if the other party commits a material breach of this Agreement, other than a payment default, which in the case of a breach capable of remedy shall not have been remedied within thirty (30) days of the receipt by the other party of a written notice, (b) if the other party ceases for any reason to carry on business, (c) if a law is enacted that would render it impossible for the other party to perform its obligations and (d) in the event that Sanofi fails to deliver as a result of force majeure, and such failure continues for three consecutive months.
131
Table of Contents
Paddock Laboratories Inc.
In May 2004, we entered into a supply agreement with Paddock Laboratories Inc., or Paddock, under which we agree to purchase and Paddock agrees to manufacture and supply mesalamine suppository in final packaged form. Under the terms of the supply agreement, which was amended in September 2013, Paddock is obligated to devote the necessary capacity to meet our forecast requirements.
The term of the supply agreement will continue until 2016, and automatically renews for a successive two year term immediately thereafter absent written notice on or before May 4, 2016. The supply agreement may also be terminated under certain other specified circumstances. Either party may terminate the supply agreement upon written notice if (a) the other party shall become financially unstable, (b) the other party enters involuntary or voluntary bankruptcy or reorganization proceedings, (c) the other party fails to make a payment due under the terms of this Agreement and fails to cure such payment default within thirty days and (d) the other party fails to comply with any condition or breaches any representation or warranty and fails to cure such noncompliance or breach within sixty days. In addition, we may terminate the supply agreement pursuant to a force majeure.
Infar, S.A.
In September 2008, we entered a supply agreement with Infar, S.A. under which Infar, S.A. is obligated to supply us the active pharmaceutical agreement related to CANASA on an exclusive basis. The term of the supply agreement, which was amended in January 2013, will continue through September 16, 2014. The supply agreement may also be terminated under certain other specified circumstances. Either party may terminate the supply agreement upon written notice if (a) the other party has failed to remedy a material breach within thirty days or (b) the other party is declared insolvent or bankrupt enters voluntary bankruptcy or this agreement is assigned for the benefit of creditors. Additionally, we may terminate the supply agreement (a) upon ninety days’ written notice in the event that any governmental agency takes any action, or raises any objection, that prevents us from purchasing, using or commercializing the relevant active pharmaceutical ingredient and (b) upon sixty prior days’ written notice if recurring quality or compliance difficulties with this active pharmaceutical ingredient and affecting the manufacturing of the associated finished product occur.
Nordmark Arzneimittel GmbH & Co.
In January 2006, we entered a supply contract with Nordmark Arzneimittel GmbH & Co., or Nordmark, under which Nordmark supplies us with the active pharmaceutical ingredient related to ZENPEP. The supply contract has an initial term ending on August 27, 2014. Either party may terminate the supply contract upon the occurrence and during the continuation of any event of default under such supply contract. An event of default is deemed to exist upon (a) either party’s failure to correctly and fully perform certain of its obligations, (b) either party’s failure to perform any material provision of the supply contract for sixty days following notice of such non-performance and (c) the liquidation of either party’s business or the beginning of any insolvency proceedings with respect to either party.
Commercialization and License Agreements
Strakan International S.à r.l
We entered into a commercialization and license agreement on December 28, 2011 with Strakan International S.à r.l, or Strakan, under which Strakan grants us an exclusive (even as to Strakan), royalty-bearing license to know-how and patents related to RECTIV and to manufacture or
132
Table of Contents
commercialize RECTIV as well as a non-exclusive, royalty-free, license to conduct development of RECTIV. We are also committed to pay various royalty and milestone payments based on net sales. The commercialization and license agreement remains in effect for as long as we continue to sell RECTIV in the relevant territory. Either party may terminate the commercialization and license agreement (a) upon the other party’s material breach and failure to cure such breach within sixty days or (b) if there is a permanent recall or withdrawal of RECTIV in the relevant territory.
Nordmark Arzneimittel GmbH & Co.
In April 2008, we entered a license agreement with Nordmark under which Nordmark provides and grants a license to use the necessary documentation to maintain our marketing authorizations related to ZENPEP. The term of the license agreement continues throughout the life of the supply contract or any new agreement between us and Nordmark concerning the same active pharmaceutical ingredient. Nordmark may terminate the license agreement upon thirty days’ written notice to us if we fail to make a required payment within six months of such payment being due. Either party may terminate the license agreement upon the other’s material breach or default of any material obligations thereunder where such default continues for forty-five days after the breaching or defaulting party receives written notice thereof or, if such default cannot be cured in forty-five days, where the breaching party fails to commence and diligently continue actions to cure such default.
Government Regulation
The research and development, manufacture, and marketing of pharmaceutical products are subject to regulation by U.S., Canadian and foreign governmental authorities and agencies. Such national agencies and other federal, state, provincial and local entities regulate the testing, manufacturing, safety and promotion of our products. The regulations applicable to our products may be subject to change as regulators acquire additional experience in the specific area.
U.S. Regulations
New Drug Application
We are required by the FDA to comply with NDA procedures for our branded products prior to commencement of marketing. New drug compounds and new formulations for existing drug compounds that cannot be filed ANDAs are subject to NDA procedures. These procedures include (1) preclinical laboratory and animal toxicology tests; (2) submission of an INDA and its required acceptance by the FDA before any human clinical trials can commence; (3) adequate and well-controlled human clinical trials to establish the safety and efficacy of a drug for its intended indication; (4) submission of an NDA to the FDA; and (5) FDA approval of an NDA prior to any commercial sale or shipment of the product, including pre-approval and post-approval inspections of its manufacturing and testing facilities.
In seeking FDA approval for a drug through an NDA, applicants are required to list each patent with claims that cover the applicant’s product or an approved use of the product. Upon approval of a drug, each of the patents listed in the application for the drug is, where eligible, published in the FDA’s Approved Drug Products with Therapeutic Equivalence Evaluations, commonly known as the Orange Book.
133
Table of Contents
Abbreviated New Drug Application
When a drug is listed in the Orange Book and when a potential competitor seeks to market a generic version of such a product, an ANDA may be filed in lieu of an NDA. An ANDA provides for marketing of a drug product that has the same active pharmaceutical ingredients in the same strengths and dosage form as the listed drug and has been shown through bioequivalence testing to be therapeutically equivalent to the listed drug. Under the ANDA procedure, the FDA waives the requirement to submit complete reports of preclinical and clinical studies of safety and efficacy and, instead, requires the submission of bioequivalency data, that is, demonstration that the generic drug produces the same blood levels of drug in the body as its brand-name counterpart, although the FDA may agree to accept or require other means of establishing bioequivalence.
For each patent listed for the approved product in the Orange Book, the ANDA applicant must certify to the FDA that (1) the required patent information has not been filed; (2) the listed patent has expired; (3) the listed patent has not expired, but will expire on a particular date and approval is sought after patent expiration; or (4) the listed patent is invalid or unenforceable or will not be infringed by the manufacture, use or sale of the new product. A certification that the new product will not infringe the already approved product’s listed patents or that such patents are invalid or unenforceable is called a Paragraph IV certification.
If the ANDA applicant has made a Paragraph IV certification, it must also send notice to the NDA and patent holders once the ANDA has been accepted for filing by the FDA. The NDA and patent holders may then initiate a patent infringement lawsuit against the ANDA applicant. The filing of a patent infringement lawsuit within 45 days of the receipt of a Paragraph IV notice automatically prevents the FDA from approving the ANDA until the earlier of 30 months from the receipt of notice by the patent holder, expiration of the patent, or a decision or settlement in the infringement case finding the patent to be invalid, unenforceable or not infringed. However, if an ANDA is filed prior to the listing of patents in the Orange Book with respect to an approved drug product, then the 30-month stay will not be available to the patent owner.
The Hatch-Waxman Act explicitly encourages generic challenges to listed patents by providing for a 180 day period of generic product exclusivity to the first generic applicant to file an ANDA with a Paragraph IV certification. Thus, many, if not most, successful new drug products are subject to generic applications and patent challenges prior to the expiration of all listed patents.
505(b)(2) Application Process
Most drug products obtain FDA marketing approval pursuant to an NDA or an ANDA but a third alternative is a special type of NDA, commonly referred to as a Section 505(b)(2) NDA, which enables the applicant to rely, in part, on the FDA’s findings of safety and efficacy of an approved product, or published literature, in support of its application. Section 505(b)(2) NDAs often provide an alternate path to FDA approval for new or improved formulations or new uses of previously approved products. A 505(b)(2) application allows the applicant to file an application where at least some of the information required for approval comes from studies not conducted by or for the applicant and for which the applicant has not obtained a right of reference. The applicant may rely upon the FDA’s findings with respect to particular preclinical studies or clinical trials conducted for an approved product, although the FDA may also require companies to perform additional studies or measurements to support the change from the approved product.
Relative to normal regulatory requirements for a 505(b)(1) NDA, regulation may permit a 505(b)(2) applicant to forego costly and time-consuming drug development studies by relying on the FDA’s finding of safety and efficacy for a previously approved drug product. Under some circumstances, the extent of this reliance approaches that permitted under the generic drug approval
134
Table of Contents
provisions. This approach is intended to encourage innovation in drug development without requiring duplicative studies to demonstrate what is already known about a drug, while protecting the patent and exclusivity rights for the approved drug. Notwithstanding the approval of many products by the FDA pursuant to Section 505(b)(2), over the last few years, some pharmaceutical companies and others have objected to the FDA’s interpretation of Section 505(b)(2).
Data Exclusivity
Under the Hatch-Waxman Act, newly-approved drugs and indications may benefit from a statutory period of clinical data exclusivity. The Hatch-Waxman Act provides five-year data exclusivity to the first applicant to gain approval of an NDA for an NCE, meaning that the FDA has not previously approved any other drug containing the same active pharmaceutical ingredient. Although protection under the Hatch-Waxman Act will not prevent the submission or approval of another full NDA, such an NDA applicant would be required to conduct its own preclinical and adequate, well-controlled clinical trials to demonstrate safety and effectiveness.
The Hatch-Waxman Act also provides three years of data exclusivity for the approval of new and supplemental NDAs, including Section 505(b)(2) applications, for, among other things, new indications, dosage forms, routes of administration, or strengths of an existing drug, or for a new use, if new clinical investigations that were conducted or sponsored by the applicant are determined by the FDA to be essential to the approval of the application. This exclusivity, which is sometimes referred to as clinical investigation or clinical data exclusivity, would not prevent the approval of another application if the applicant has conducted its own adequate, well-controlled clinical trials demonstrating safety and efficacy, nor would it prevent approval of a generic product that did not incorporate the exclusivity-protected changes of the approved drug product.
Canadian Regulations
The requirements for selling pharmaceutical drugs in Canada are substantially similar to those of the United States described above, with the exception of the 505(b)(2) application process, which is not available in Canada. Canadian regulations also include provisions relating to marketing and data exclusivity.
European Economic Area
A medicinal product may only be placed on the market in the EEA, composed of the 28 EU member states, plus Norway, Iceland and Lichtenstein, when a marketing authorization has been issued by the competent authority of a member state. There are essentially three community procedures created under prevailing European pharmaceutical legislation that, if successfully completed, allow an applicant to place a medicinal product on the market in the EEA.
Centralized Procedure
A centralized procedure exists when a marketing authorization is granted by the European Commission, acting in its capacity as the European Licensing Authority on the advice of the EMA. That authorization is valid throughout the entire community and directly, or indirectly (in the case of Norway, Iceland and Liechtenstein), allows the applicant to place the product on the market in all member states of the EEA. The EMA is the administrative body responsible for coordinating the existing scientific resources available in the member states for evaluation, supervision and pharmacovigilance of medicinal products.
135
Table of Contents
Mutual Recognition and Decentralized Procedures
The competent authorities of the member states are responsible for granting marketing authorizations for medicinal products that are placed on their markets. If the applicant for a marketing authorization intends to market the same medicinal product in more than one member state, the applicant may seek an authorization progressively in the community under the mutual recognition or decentralized procedure.
Mutual Recognition
Mutual recognition is used if the medicinal product has already been authorized in one member state. In this case, the holder of this marketing authorization requests the member state where the authorization has been granted to act as reference member state by preparing an updated assessment report that is then used to facilitate mutual recognition of the existing authorization in the other member states in which approval is sought (the so-called concerned member states). The reference member state must prepare an updated assessment report which, together with the approved Summary of Product Characteristics, or SmPC (which sets out the conditions of use of the product), and a labeling and package leaflet are sent to the concerned member states for their consideration. The concerned member states are required to make an approval decision on the assessment report, the SmPC, and the labeling and package leaflet within 90 days of receipt of these documents. Because all member states must agree on a common SmPC, a lack of consensus can result in delays to the mutual recognition process as the contentious issues are referred to the Co-ordination Group for Mutual Recognition and Decentralized Procedures and then on to EMA for resolution.
Decentralized Procedure
This procedure is used in cases where the medicinal product has not received a marketing authorization in the EU at the time of application. The applicant sends its application simultaneously to all concerned member states and requests a member state of its choice to act as reference member state to prepare an assessment report that is then used to facilitate agreement with the concerned member states and the granting of a national marketing authorization in all of these member states. In this procedure, the reference member state must prepare, for consideration by the concerned member states, the draft assessment report, a draft SmPC and a draft of the labeling and package leaflet within 120 days after receipt of a valid application. As in the case of mutual recognition, the concerned member states are required to make an approval decision on these documents within 90 days of their receipt.
International Regulations
Sales of our products outside the United States, Canada and the EU are subject to local statutory and regulatory requirements governing the testing, approval, registration and marketing of pharmaceuticals, which vary widely from country to country.
Approval in one country does not assure that a product will be approved in another country. Activities related to our PT business outside the United States are subject to regulatory requirements governing the testing, approval, safety, effectiveness, manufacturing, labeling and marketing of our products, notwithstanding our FDA approvals or U.S. regulatory compliance. These regulatory requirements vary from country to country. Each product must receive approval by the regulatory authority of the country where it is being marketed prior the marketing of the product in that country. The approval process may be more or less rigorous than the U.S. approval process, and the time required for approval may be longer or shorter than that required in the United States.
136
Table of Contents
Pharmaceutical suppliers also are subject to laws and regulations under provincial, state, federal and foreign laws, relating to occupational safety, laboratory practices, environmental protection and hazardous substance control. These laws and regulations are subject to change. We believe that we are in compliance in all material respects with existing laws and regulations. There can be no assurance, however, that future laws and regulations will not negatively impact our business.
Other countries in which we do business also have payment and cost controls similar to those that exist in the United States. In many markets outside the United States, we operate in an environment of government-mandated, cost-containment programs. Several governments have placed restrictions on physician prescription levels and patient reimbursements, emphasized greater use of generic drugs and/or enacted across-the-board price cuts as methods of cost control. In most EU countries, the government regulates pricing of a new product at launch often through direct price controls, international price comparisons, controlling profits and/or reference pricing. In other markets, the government does not set pricing restrictions at launch, but pricing freedom is subsequently limited. In some countries, pharmaceutical suppliers may encounter significant delays in market access for new products; in some European countries, more than two years can elapse before new medicines become nationally available. Member states of the EU have regularly imposed new or additional cost containment measures for pharmaceuticals. In recent years, Italy, for example, has imposed mandatory price decreases.
Similarly, in recent years, Congress and some state legislatures have considered a number of proposals and have enacted laws that could effect major changes in the healthcare system, either nationally or at the state level. Driven in part by budget concerns, Medicaid access and reimbursement restrictions have been implemented in some states and proposed in many others. There can be no assurance, therefore, that the pricing or availability of our products inside and outside the United States will not be adversely affected by national and local legislation.
Patents and Trademarks
We rely on a combination of patents, trademarks, trade secrets, know-how, technological advances, other proprietary information and knowledge and regulatory barriers to entry to protect our products and product candidates. Not all of our products have patent protection, including CARAFATE, and some of the patents protecting our products expire in the near future, including RECTIV. As a result, we rely heavily and expect to continue to rely heavily upon unpatented proprietary know-how and technological innovation in the development and manufacture of many of our marketed products and product candidates. We also maintain and rely on trade secrets, know-how, product innovations, in-licensed technologies and in-licensing opportunities to develop and maintain our proprietary positions. Our success depends, in part, on our ability to obtain and maintain proprietary protection for our products and product candidates, to operate without infringing the proprietary rights of others, and to prevent others from infringing our proprietary rights as we develop products or expand into new territories.
Trademark protection is also an important part of establishing our product and brand recognition. We own a number of registered trademarks and trademark applications, including for our key product lines, and have licensed the rights to trademarks for several of our other product lines from third parties.
Employees
As of September 30, 2013, we had 961 full time regular employees. Of these employees, 463 were located in the United States, 106 were located in Canada and 392 were located in the EU, specifically two in Ireland, 120 in France and 270 in Italy. In Canada, we are party to a collective
137
Table of Contents
bargaining agreement that expires March 24, 2015. As of September 30, 2013, there were 32 employees in this bargaining unit. All of our employees in the EU, with the exception of our executive management, are represented by one of a number of trade unions, national labor councils or their equivalents. We believe that relations with both our unionized and non-unionized employees are good.
As of September 30, 2013, we had 39 contract primary care sales specialists in the United States and 21 contract sales specialists in Germany.
We believe that our future success will depend in part on our continued ability to attract, hire, and retain qualified personnel, including sales and marketing personnel and research and development in particular. Competition for such personnel is intense, and there can be no assurance that we will be able to identify, attract, and retain such personnel in the future.
Property
We own and lease space for manufacturing, warehousing, research, development, sales, marketing, and administrative purposes. A number of these facilities are inspected on a regular basis by regulatory authorities, and our own internal auditing team ensures compliance on an ongoing basis with such standards.
We own and operate 107,000 square feet of office space, manufacturing facilities and warehousing in Mont-Saint-Hilaire, Quebec (Canada). The building houses administrative and pharmaceutical manufacturing operations as well as our research and development activities. We further own property next to that building, which could be used to expand.
We own and operate two facilities near Milan, Italy. The main facility, which houses administrative, research, production and warehouse activities, is approximately 220,401 total square feet in size and was built in 1995. The laboratory and office space were expanded in 2001 and the office space was expanded again in 2008, adding an additional 3,700 square feet. We acquired the second facility in 2000 through the acquisition of Pharmatec International S.r.l. This approximately 43,056 square-foot production facility was completely renovated in 2003.
We own 606,837 square feet of office space and manufacturing facilities in Houdan, France.
Our U.S. manufacturing operations are based near Vandalia, Ohio, where we own a facility of approximately 101,000 square feet, which houses our administrative, research, production and warehouse operations in the United States This facility was built in 1985 and completely renovated and expanded in 2001. In 2008, we completed a construction project which included the renovation of approximately 13,000 square feet of our existing building, as well as a 13,000 square-foot addition. In addition, adjacent to the facility, we lease approximately 5,000 square feet of office space that houses certain administrative personnel.
All our manufacturing facilities are operated in compliance with cGMPs and GLPs and are periodically audited by the relevant authorities and customers. We believe that all of our present facilities are suitable for their intended purposes. We believe our current manufacturing capabilities in our existing facilities are sufficient for our present and future operations, and we currently have no material expansion plans. We believe, however, that we have the ability to expand our manufacturing capacity in our existing facilities, if needed.
We lease approximately 18,233 square feet of office space in Birmingham, Alabama, United States under a lease which expires on December 31, 2018.
We lease approximately 52,320 square feet of office space in Bridgewater, New Jersey, United States under a lease which expires on March 31, 2018, but which can be extended for two five-year renewal periods.
138
Table of Contents
Legal Proceedings
From time to time, we are party to various disputes, governmental and/or regulatory inquiries and proceedings and litigation matters that arise from time to time, some of which are described below. While we believe that we have meritorious defenses with respect to the claims asserted against us and intend to vigorously defend our position, the process of resolving matters through litigation or other means is inherently uncertain, and it is not possible to predict the ultimate resolution of any such proceeding. It is possible that an unfavorable resolution of any of the matters described below could have a material effect on our financial position, results of operations and cash flows. Unless otherwise disclosed below, we are unable to predict the outcome of the respective litigation or to provide an estimate of the range of reasonably possible losses.
In October 2008, Eurand and Cephalon (which exclusively licenses certain patents from Eurand) received Paragraph IV certification letters relating to ANDAs submitted to the FDA by Mylan and Barr Laboratories, Inc., or Barr, each requesting approval to market and sell a generic version of the 15 mg and 30 mg strengths of extended-release cyclobenzaprine hydrochloride (AMRIX). In November 2008, Eurand received a similar certification letter from Impax Laboratories, Inc., or Impax. In May 2009, Eurand received a similar certification letter from Anchen Pharmaceuticals, Inc., or Anchen. Mylan, Impax, and Anchen alleged that U.S. Patent Number 7,387,793, or the ‘793 Patent, entitled “Modified Release Dosage Forms of Skeletal Muscle Relaxants,” issued to Eurand, will not be infringed by the manufacture, use or sale of the product described in the applicable ANDA and reserved the right to challenge the validity and/or enforceability of the ‘793 Patent. Barr alleged that the ‘793 Patent is invalid, unenforceable and/or will not be infringed by its manufacture, use or sale of the product described in its ANDA. In late November 2008, Eurand filed a lawsuit with Cephalon, in the U.S. District Court in Delaware against Mylan (and its parent) and Barr (and its parent) for infringement of the ’793 Patent. In January 2009, Eurand filed a lawsuit with Cephalon in the U.S. District Court in Delaware against Impax for infringement of the ’793 Patent. In July 2009, Eurand filed a lawsuit with Cephalon in the U.S. District Court in Delaware against Anchen (and its parent) for infringement of the ’793 Patent. Subsequently, in response to additional Paragraph IV certification letters regarding U.S. Patent Number 7,544,372, or the ’372 Patent, entitled “Modified Release Dosage Forms of Skeletal Muscle Relaxants” Eurand and Cephalon also filed lawsuits against Mylan, Barr, and Anchen for the infringement of the ’372 Patent. All cases were consolidated in one action in the U.S. District Court in Delaware, and were tried in a bench trial in September-October 2010.
On October 7, 2010, both Eurand and Anesta AG, or Anesta, a wholly-owned subsidiary of Cephalon, reached an agreement to settle the pending patent infringement litigation over AMRIX with Impax. Under terms of the settlement, both Eurand and Anesta will grant to Impax anon-exclusive, royalty-bearing license to market and sell a generic version of AMRIX in the United States beginning one year prior to expiration of the ’793 Patent, which is expected to expire in February 2025, or earlier under certain circumstances.
On May 12, 2011, the U.S. District Court in Delaware rendered a decision against Eurand and Cephalon. On May 13, 2011, Mylan launched its product. Eurand and Cephalon appealed the District Court’s finding of obviousness to the Federal Circuit, and on May 24, 2011, the District Court issued an injunction order enjoining Mylan from selling any additional products pending the Federal Circuit’s decision. On April 16, 2012, the Federal Circuit reversed and vacated the judgment of invalidity by the U.S. District Court in Delaware in the patent infringement lawsuit by Eurand and Cephalon. Mylan filed a petition for rehearing en banc and on July 25, 2012, the petition was denied. Subsequently Mylan filed a petition for certiorari to the United States Supreme Court on October 23, 2012 and on January 14, 2013, the petition was denied. The case was remanded to the District Court for consideration of the issue of damages. The trial on the issue of damages is scheduled to commence on September 2, 2014.
139
Table of Contents
In July 2013, we filed patent infringement lawsuits in the United States District Court for the District of New Jersey against Mylan and Sandoz Inc., or Sandoz, alleging infringement of certain of our patents and seeking, among other things, injunctive relief. We filed these lawsuits in response to notice letters we received from each of Mylan and Sandoz regarding the filing of their respective ANDAs seeking approval to market a generic version of CANASA before the expiration of our United States Patent No. 8,217,083 and United States Patent No. 8,436,051. In November 2013, we filed our First Amended Complaint to the patent infringement lawsuits alleging infringement of our United States Patent No. 7,541,384. Mylan filed its Answer and Counterclaims to our original Complaint in August 2013 and to our First Amended Complaint in November 2013, and Sandoz filed its Answer and Counterclaims to our original Complaint in September 2013, in each case contending that our patents are invalid or not infringed. While we intend to vigorously defend these patents and pursue our legal rights, we can offer no assurance as to when the pending litigation will be decided, whether the lawsuit will be successful or that a generic equivalent of CANASA will not be approved and enter the market.
140
Table of Contents
Directors and Executive Officers
Below is a list of the names, ages and positions, and a brief account of the business experience, of the individuals who serve as our executive officers and as members of our Board of Directors, or the Board.
Name | Age | Position | ||
Frank Verwiel, M.D. | 51 | President and Chief Executive Officer; Director | ||
Steve Gannon | 52 | Senior Vice President, Chief Financial Officer and Treasurer | ||
John Fraher | 48 | President, Aptalis Pharma | ||
David Mims | 51 | President, U.S. Specialty Pharmaceuticals | ||
Jean-Louis Anspach | 54 | President, International Specialty Pharmaceuticals | ||
Robert Becker, Ph.D. | 58 | Senior Vice President, Chief Research Officer | ||
Richard DeVleeschouwer | 56 | Senior Vice President, Chief Human Resources Officer | ||
Richard E. Maroun | 58 | Senior Vice President, General Counsel and Corporate Secretary | ||
Theresa Stevens, Esq. | 52 | Senior Vice President, Chief Corporate Development Officer | ||
Ruth Thieroff-Ekerdt, M.D. | 56 | Senior Vice President, Chief Medical Officer | ||
Todd Sisitsky | 42 | Director and Chairman of the Board of Directors | ||
Fred Cohen, M.D., D. Phil | 57 | Director | ||
Paul Hackwell | 33 | Director | ||
David Kessler, M.D. | 60 | Director | ||
Ron Labrum | 57 | Director | ||
Abhijeet J. Lele | 48 | Director |
Frank Verwiel, M.D., has been a director on our Board since February 2008. Dr. Verwiel joined Aptalis Pharma Inc. as President and Chief Executive Officer in July 2005. Dr. Verwiel previously held the position of Vice President, Hypertension, Worldwide Human Health Marketing, with Merck & Co., Inc., while concurrently serving as a member of Merck’s worldwide hypertension business strategy team. He joined Merck in 1996 and was appointed managing director of MSD in the Netherlands in 1997. Prior to joining Merck, from 1988 to 1996, Dr. Verwiel held a number of executive positions with Laboratoires Servier in the EU. Dr. Verwiel holds a Medical Doctor (M.D. or “Arts”) degree from Erasmus University in Rotterdam, the Netherlands. He also attended INSEAD in Fontainebleau, France, where he earned his Masters of Business Administration. For these reasons, we believe he is well qualified to serve on our Board of Directors.
Steve Gannon, Senior Vice President, Chief Financial Officer and Treasurer, has been an officer since February 2008. Mr. Gannon joined Aptalis Pharma Inc. as Senior Vice President and Chief Financial Officer in February 2006. He has extensive financial experience in corporate growth initiatives, such as acquisitions, corporate alliances, and partnerships within the biotechnology and pharmaceutical sector. Prior to joining Aptalis, Mr. Gannon was Chief Financial Officer at CryoCath Technologies Inc., in addition to serving in a number of senior financial roles at AstraZeneca and Mallinckrodt Medical Inc. Mr. Gannon earned a chartered accountant’s designation (CA) in 1985 and holds a Bachelor of Commerce degree from the Concordia University, Montreal, Canada.
John Fraher has been President, Aptalis Pharma since February 2011. In this role he assists with setting strategic direction for our Company and has specific responsibility for leading our Pharmaceutical Technologies, Manufacturing, and Global Supply Chain. Prior to joining Aptalis, Mr. Fraher served in a number of senior roles at Eurand including interim Chief Executive Officer and Director January and February 2011. Previously he was Chief Commercial Officer at Eurand since
141
Table of Contents
August 2006; the President of Eurand, Inc., from April 1999 to August 2006; and was the Vice President of Eurand, Inc., from 1995 to April 1999. Mr. Fraher holds a B.Sc. (Hons) degree in Biochemistry from the University College Dublin, Ireland.
David Mims, President, U.S. Specialty Pharmaceuticals. Mr. Mims has served as an officer since February 2008. Mr. Mims joined Aptalis Pharma Inc. as Executive Vice President and Chief Operating Officer in February 2000, shortly after Aptalis Pharma Inc.’s acquisition of Scandipharm, Inc. He served as senior accountant at a major accounting firm before joining Russ Pharmaceuticals, Inc. in 1987 as Accounting Services Manager. In 1991, Mr. Mims helped found Scandipharm, Inc., and served as Vice President, Chief Operating Officer and Chief Financial Officer. He resigned from Scandipharm, Inc., in March 1998 to join Cebert Pharmaceuticals, Inc., as Executive Vice President and Chief Operating Officer. Previously a director of the University of Alabama at Birmingham Research Foundation, Mr. Mims is also a member of the American Institute of Certified Public Accountants and Alabama Society of Certified Public Accountants. He is a licensed Certified Public Accountant (CPA) (inactive) in the state of Alabama and holds a Bachelor of Science degree in accounting from Auburn University.
Jean-Louis Anspach, President, International Specialty Pharmaceuticals and Aptalis Pharma SAS, joined our Company in February 2011. Prior to joining Aptalis, Mr. Anspach served as President of Eurand Pharmaceuticals, Inc. from June 2010 to February 2011. Earlier in his career, he served as Executive Vice President, Marketing for Solvay Pharmaceuticals, Inc. In this role, he successfully led the development and execution of business plans for the cardio-metabolic, neuroscience, gastroenterology, women’s health and specialized markets franchises. His 25-year career at Solvay included positions of increasing scope and responsibility in general management, marketing, sales, business development, investor relations and corporate finance. Mr. Anspach received his “Ingenieur Commercial” degree from the Universite Libre de Bruxelles (Belgium) and his MBA from the University of Wisconsin in Madison.
Robert Becker, Ph.D., Senior Vice President and Chief Research Officer joined our Company in February 2011. Dr. Becker has more than 29 years experience in the pharmaceutical industry. Prior to joining Aptalis, Dr. Becker served as Eurand’s Chief Research Officer since April 2009 and prior to that he led the Small Molecule Development business as Senior Director from April 2005 to March 2009 with responsibilities in San Diego, Cambridge, and Zug, Switzerland. He established a broad vendor network for API, DP and Methods Development and established strategic partnerships with BIIB’s major collaboration partners for small molecule and protein formulation development. Earlier in his career, he held various leadership positions at Boehringer-Ingelheim, Eli Lilly and Company, and Biogen Idec, including Director of Pharmaceutical Research and Development, and Senior Director of Biopharmaceutical Development. Dr. Becker is an expert in process chemistry, design and development of formulations across all pharmaceutical dosage forms and drug delivery systems. Dr. Becker is a Chemist by training with a focus on Physical Chemistry and holds his Ph.D. from the Technical University Munich, Germany.
Richard DeVleeschouwer joined Aptalis in March 2010 and is Senior Vice President, Chief Human Resources Officer. Mr. DeVleeschouwer has more than 26 years of experience as a Human Resources professional and more than 17 years of experience in the health-care industry. Prior to joining Aptalis, Mr. DeVleeschouwer served for nearly a decade in a number of senior human resources roles at Schering-Plough Corporation, a global pharmaceutical company, most recently as Group Vice President, Human Resources Global Human Health and Global HR Operations. Earlier in his career, Mr. DeVleeschouwer held various leadership positions at Pharmacia Corporation and Monsanto Company. He holds a Bachelor of Arts degree in Social Organization and Human Relations from the University of Western Ontario, London, Ontario, Canada, and is a graduate from George Brown College of Applied Arts and Technology, Toronto, Ontario, Canada.
142
Table of Contents
Richard E. Maroun,Esq., Senior Vice President, General Counsel and Corporate Secretary since July 2012. Mr. Maroun has served as a General Counsel and Chief Administrative Officer in the generic and biopharmaceutical industry, as well as with major financial organizations and independent law firms. From 2007 to 2011, he was Executive Vice President, Chief Administrative Officer, General Counsel, Business Development Officer and Corporate Secretary for APP Pharmaceuticals, Inc., and has also held senior positions with Abraxis BioScience Inc. and American BioScience, Inc. In addition, he has held both legal and financial positions with companies including Merrill Lynch Pierce Fenner & Smith Incorporated and Deloitte & Touche, LLP, and has served as an attorney with law firms including McDonough, Holland & Allen; Blum, Kay & Merkle; and Skjerven, Morrill, MacPherson LLP. He received his J.D. from the University of Santa Clara and an LLM in Taxation from Boston University.
Theresa Stevens, Esq., CLP., Senior Vice President, Chief Corporate Development Officer, joined our Company in May 2009 as Senior Vice President, Business Development. Before joining Aptalis, Ms. Stevens was with Novartis for over 9 years holding a number of executive positions in the US and Switzerland, most recently on the US Executive Committee reporting to the CEO, as Vice President, U.S. Business Development and Licensing, Life Cycle Management and Generics-Brands Strategies in East Hanover, New Jersey. Previous companies include DuPont, and the DuPont Merck Pharma Co, now part of BristolMyersSquibb. Ms. Stevens holds a Bachelor of Science in Animal Science, cum laude, and a Master of Science in Molecular and Cell Biology, summa cum laude, both from the University of Maryland in College Park, and a Juris Doctorate, magna cum laude, from Widener University of Law in Wilmington, Delaware. Ms. Stevens was admitted to the U.S. Patent and Trademark Office (USPTO) in 1992, the State Bars of Pennsylvania and the District of Columbia in 1993, and the U.S. Court of Appeals for the Federal Circuit in 1994.
Ruth Thieroff-Ekerdt, M.D., has served as Aptalis’ Chief Medical Officer since February 2011. Dr. Thieroff-Ekerdt has over 25 years international experience in the pharmaceutical industry. Prior to joining our Company, she served as Eurand’s Chief Medical Officer since December 2008. Earlier in her career, she held the position of Vice President of Clinical and Medical Affairs at Bayer Consumer Care. In addition, she held various positions with Berlex, Inc. and Schering AG, including Vice President of Medical Development Management and Operations, Vice President of Clinical Development, and Director of Clinical Development, Dermatology, and Head of the Laboratory of Vitamin D Research. Dr. Thieroff-Ekerdt graduated from medical school at the Free University of Berlin. Dr. Thieroff-Ekerdt holds a medical degree and specialized in Pharmacology/Toxicology.
Todd Sisitskyhas been the chairman of our board of directors and a director since February 2008 and is a partner at TPG, where he leads the firm’s investment activities in the healthcare sector globally. He played leadership roles in connection with TPG’s investments in Aptalis Pharma, HealthScope, IASIS Healthcare, IMS Health, Immucor, Par Pharmaceuticals Companies, Inc. and Surgical Care Affiliates and previously served on the boards of Biomet Inc. and Fenwal Inc. Mr. Sisitsky also serves on the board of directors of the global not-for-profit organization, the Campaign for Tobacco Free Kids, as well as on the Dartmouth Medical School Board of Overseers. Prior to joining TPG in 2003, Mr. Sisitsky worked at Forstmann Little & Company and Oak Hill Capital Partners. He received an MBA from the Stanford Graduate School of Business, where he was an Arjay Miller Scholar, and earned his undergraduate degree from Dartmouth College, where he graduatedsumma cum laude.Mr. Sisitsky’s financial expertise and experience leading investments in numerous healthcare companies make him a valuable asset to the Board of Directors.
Fred E. Cohen, M.D., D. Phil.,has been a director since February 2008. Dr. Cohen is a partner at TPG, a private equity firm he joined in 2001, and serves as co-head of TPG’s biotechnology group. Prior to joining TPG in 2001, Dr. Cohen was a Professor of Medicine, Cellular and Molecular Pharmacology, Biochemistry and Biophysics and Pharmaceutical Chemistry at the University of
143
Table of Contents
California, San Francisco. In this context, he was Chief of the Division of Endocrinology and Metabolism and directed an active research program in the areas of prion biology, structure-based drug design, bioinformatics and heteropolymer chemistry. He is a Fellow of the American College of Physicians and the American College of Medical Informatics, a member of the American Society for Clinical Investigation and the Association of American Physicians, and the recipient of several awards and honors including the Burroughs-Wellcome New Initiatives in Malaria Award, the LVMH Science Pour L’Art Prize (shared with Stanley Prusiner), a Searle Scholars Award and Young Investigator Awards from the Endocrine Society and the Western Society for Clinical Investigation. He holds a Bachelor of Arts degree,magna cum laude, from Yale University, a D. Phil. from Oxford University as a Rhodes Scholar, and a Doctor of Medicine degree from Stanford Medical School. He was an American Cancer Society postdoctoral fellow at the University of California, San Francisco. He currently serves on the boards of Genomic Health, FivePrime, BioCryst, Expression Diagnostics (XDx), CardioDx, Quintiles Transnational Corp, Roka and Vercyte. Dr. Cohen was elected to the Institute of Medicine of the National Academies in 2004 and to the American Academy of Arts and Sciences in 2008. We believe Dr. Cohen is qualified to serve on our board of directors due to his significant leadership experience in the medical and finance fields through his background as an M.D. and a venture capitalist, his extensive technical expertise relevant to our business, and his experience as an investor in and on the boards of numerous life sciences and healthcare companies.
Paul Hackwelljoined our Board of Directors in December 2013. Mr. Hackwell is a Vice President at TPG in the North American Buyout Group. Since joining TPG in 2006, Paul has been involved with the firm’s investments in Aptalis Pharma, AV Homes, where he is a director, Norwegian Cruise Line, Savers, and Taylor Morrison, among other debt and equity investments. Prior to joining TPG, Paul worked at the Boston Consulting Group. Paul holds an A.B. summa cum laude from Princeton University, an M.Phil. from the University of Oxford, where he was a Keasbey Scholar, and an M.B.A from the Stanford Graduate School of Business, where he was an Arjay Miller Scholar. We believe Mr. Hackwell’s financial expertise and investment experience qualify him to serve on our Board of Directors.
David A. Kessler,M.D., has been a director since May 2011. Dr. Kessler has a wide range of experience in research, clinical medicine, education, administration, and the law. He is currently Professor of Pediatrics and Epidemiology and Biostatistics at the School of Medicine, University of California, San Francisco (UCSF). Since 2009, Dr. Kessler has also served on the board of directors of Tokai Pharmaceuticals, Inc. and in 2011 he joined the board of directors of Immucor, Inc. He was Dean of the School of Medicine and the Vice Chancellor for Medical Affairs at UCSF from 2003 through 2007 and Dean of the Yale University School of Medicine from 1997 until 2003. Dr. Kessler, who served as Commissioner of the FDA from November 1990 until March 1997, was appointed by President Bush and reappointed by President Clinton. In 1993, Dr. Kessler was elected to be a member of the Institute of Medicine. Dr. Kessler is a 1973,magna cum laude, Phi Beta Kappa graduate of Amherst College. He received his J.D. degree from The University of Chicago Law School in 1978, where he was a member of the Law Review and his M.D. degree from Harvard Medical School in 1979. In 1986, he earned an Advanced Professional Certificate from the New York University Graduate School of Business Administration. We believe Dr. Kessler is well qualified to serve on our Board of Directors because of his extensive healthcare and regulatory experience.
Ronald Labrumhas been a director since May 2011. Mr. Labrum served as the President of Fenwal, Inc., a provider of products and technologies that support and improve blood collection, processing and transfusion medicine, and was its Chief Executive Officer from 2007 through 2012. Earlier in his career, Mr. Labrum held various executive positions with Cardinal Health, Inc. including Chief Executive Officer. He also served as the Chief Executive Officer and President of Integrated Provider Solutions; Group President of Medical-Surgical Products and Services—DIV; Corporate Vice President of Regional Companies Health Systems of Allegiance; Chief Executive Officer and Chairman
144
Table of Contents
of Healthcare Supply Chain Services; and President of the southwest region at Baxter. Mr. Labrum served various top-tier posts with Allegiance Healthcare Corporation. He began his career with American Hospital Supply Corporation in 1982. Mr. Labrum served as the Chairman of Cardinal Health—International and Chairman of Integrated Provider Solutions. He currently serves on several Boards including Wright Medical Group Inc. and ProCure Treatment Centers, Inc. Previously, Mr. Labrum served as a Director of Cardinal Health—International; Integrated Provider Solutions; and Healthcare Supply Chain Services. Mr. Labrum holds a Bachelor’s Degree in Business Administration from Utah State University. We believe Mr. Labrum is well qualified to serve on our Board of Directors because of his experience in leading healthcare companies.
Abhijeet J. Lele joined the Board as a Director in September 2011. Mr. Lele leads Investor Growth Capital’s Healthcare investing activities in North America. He joined as a Managing Director in April 2009, and is based in Investor Growth Capital’s New York office. Before Investor Growth Capital, Mr. Lele spent 10 years as a Managing Member of EGS Healthcare Capital Partners, a venture capital firm focusing on private and public investments in biotechnology, specialty pharmaceutical and medical device companies. Prior to EGS, Mr. Lele was with the New York office of McKinsey & Co., where he primarily served medical device, pharmaceutical and health insurance clients. He previously held operating positions with Lederle Laboratories, Progenics Pharmaceuticals and Clontech Laboratories. Mr. Lele received an M.B.A. (with Distinction) from Cornell University and an M.A. from Cambridge University, where he studied Natural Sciences. He currently serves on the board of Agile Therapeutics, Transcend Medical and Tear Science. For these reasons, we believe he is well qualified to serve on our Board of Directors.
Board Structure and Committee Composition
Upon the completion of this offering, we will have an audit committee, a compensation committee, a nominating and corporate governance committee and a compliance committee with the compositions and responsibilities described below. Each committee will operate under a charter that will be approved by our board of directors prior to completion of the offering. The members of each committee are appointed by and serve at the pleasure of the board of directors. In addition, from time to time, special committees may be established under the direction of the board of directors when necessary to address specific issues.
We intend to avail ourselves of the “controlled company” exception under the NASDAQ rules. As a result, we are not required to have a majority of independent directors, and our nominating and corporate governance committee and compensation committee may not be composed entirely of independent directors as defined under the rules. The controlled company exception does not modify the independence requirements for the audit committee, and we intend to comply with the requirements of the Sarbanes-Oxley Act and the NASDAQ rules with respect to the audit committee. These rules require that our audit committee be composed of at least three members, one of whom must be independent on the date of listing, a majority of whom must be independent within 90 days of the effective date of the registration statement containing this prospectus, and all of whom must be independent within one year of the effective date of the registration statement containing this prospectus.
145
Table of Contents
Audit Committee
The Audit Committee will oversee our corporate accounting and financial reporting processes and the audits of our financial statements. The Audit Committee will also assist the Board in providing oversight with respect to:
| Ÿ | the quality and integrity of our financial statements and internal accounting and financial controls; |
| Ÿ | our compliance with legal and regulatory requirements; |
| Ÿ | the independent auditor’s qualifications and independence; and |
| Ÿ | the performance of the internal audit function and independent auditors. |
Other responsibilities of the Audit Committee include, among other things:
| Ÿ | selecting and evaluating the qualifications, performance, internal quality controls and independence of the independent auditor (including resolution of disagreements between our management and the independent auditor regarding financial reporting); |
| Ÿ | deciding whether to appoint, retain or terminate the independent auditors and to pre-approve all audit, audit-related, tax and other services, if any, to be provided by the independent auditors; |
| Ÿ | preparing the disclosure required by Item 407(d)(3)(i) of Regulation S-K and the report required by the SEC rules to be included in the Company’s annual proxy statement; |
| Ÿ | reviewing and discussing with management and the independent auditor the annual audited and quarterly unaudited financial statements, as well as our disclosures under “Management’s Discussion and Analysis of Financial Condition and Results of Operations;” |
| Ÿ | reviewing and discussing with management, internal audit staff (or other personnel responsible for the internal audit function) and the independent auditor any material issues regarding accounting principles and financial statement presentations, including any significant changes in our selection or application of accounting principles; |
| Ÿ | reviewing and discussing reports from the independent auditors with regard to (i) critical accounting policies and practices to be used; (ii) alternative treatments of financial information within generally accepted accounting principles that have been discussed with management, ramifications of the use of such alternative disclosures and treatments, and the treatment preferred by the independent auditor; (iii) material judgmental areas where there may have been differing views between management and the independent auditor, including with regard to accounting, disclosure and presentation matters; (iv) the effect of regulatory and accounting pronouncements and initiatives on our financial statements, (v) off-balance sheet structures; and (vi) other material written communications between the independent auditor and management, including any management letter or schedules of unadjusted differences; |
| Ÿ | reviewing and discussing earnings press releases and the financial information and earnings guidance provided to analysts and rating agencies; |
| Ÿ | reviewing with the independent auditor the matters required to be discussed by Statement on Auditing Standards No. 61 (Codification of Statements on Accounting Standards, AU § 380, as amended, as adopted by the Public Company Accounting Oversight Board) relating to the conduct of the audit; |
| Ÿ | reviewing and advising management with respect to ethics and compliance functions; |
| Ÿ | ensuring that a public announcement of our receipt of an audit opinion that contains a going concern qualification is made promptly; |
146
Table of Contents
| Ÿ | discussing with management and the independent auditor any correspondence with regulators or governmental agencies and any published reports that raise material issues regarding, or call into question the integrity of, our financial statements or accounting policies; |
| Ÿ | establishing procedures for receipt, retention and treatment of complaints we receive regarding accounting, auditing or internal controls and the confidential, anonymous submission of anonymous employee concerns regarding questionable accounting and auditing matters; |
| Ÿ | overseeing the Company’s information technology systems and reviewing the adequacy of security for the Company’s information technology systems, processes and data and the Company’s contingency plans in the event of a breach affecting Company information; |
| Ÿ | reviewing and approving all related person transactions; |
| Ÿ | reviewing and assessing the adequacy of the Audit Committee charter and submitting any changes to the Board for approval; and |
| Ÿ | performing an annual evaluation of the performance of the Audit Committee, the results of which shall be presented to the Board. |
Upon the listing of our shares on NASDAQ, the Audit Committee will consist of (Chairman), and , each of whom the Board has determined meets the definition of “independent director” for purposes of the �� rules, including the independence requirements of Rule 10A-3 of the Exchange Act. The Board has determined that qualifies as an “audit committee financial expert” under Item 407(d)(5) of RegulationS-K.
Compensation Committee
The Compensation Committee will oversee our corporate compensation and benefit programs. The responsibilities of the Compensation Committee will include, among other things:
| Ÿ | assisting the Board in developing and evaluating potential candidates for executive positions (including the Chief Executive Officer) and oversee the development of executive succession plans; |
| Ÿ | reviewing and approving our goals and objectives relevant to Chief Executive Officer and other executive officer compensation, evaluating the Chief Executive Officer’s and other executive officers’ performance in light of those goals and objectives and determining and approving the Chief Executive Officer’s and other executive officers’ compensation level based on this evaluation; |
| Ÿ | making recommendations to the Board regarding compensation, if any, of directors; |
| Ÿ | making recommendations to the Board regarding the adoption of new employee incentive compensation plans and equity-based plans and administering our existing incentive compensation plans and equity-based plans; |
| Ÿ | preparing the Compensation Committee report on executive officer compensation as required by the SEC to be included in our annual proxy statement or annual report on Form 10-K; |
| Ÿ | reviewing and assessing the adequacy of the Compensation Committee charter and submitting any changes to the Board for approval; and |
| Ÿ | performing, or participating in, an annual evaluation of the performance of the Compensation Committee, the results of which shall be presented to the Board. |
Upon the listing of our shares on NASDAQ, the members of the Compensation Committee will be (Chairman), , , and .
147
Table of Contents
Compensation Committee Interlocks and Insider Participation
Dr. Verwiel is our Chief Executive Officer. Mr. Sisitsky and Dr. Cohen are affiliated with TPG, which holds the majority of our outstanding common stock and is a party to the management agreement with us. The management agreement is described in greater detail in “Certain Relationships and Related Party Transactions.” During fiscal year 2013, we had no compensation committee “interlocks”—meaning that no executive officer of ours served as a director or member of the compensation committee of another entity while an executive officer of the other entity served as a director or member of our Compensation Committee.
Nominating and Corporate Governance Committee
The purpose of the Nominating and Corporate Governance Committee will be to assist the Board in fulfilling its responsibilities relating to identifying individuals qualified to become members of the Board, to recommend to the Board nominees for the next annual meeting of shareholders, to develop and recommend to the Board a set of corporate governance principles applicable to the Company and to oversee the evaluation of the Board and its dealings with management and appropriate committees of the board. Upon completion of this offering, the governance and nominating committee will consist of (Chair), and .
Compliance Committee
The purpose of the Compliance Committee will be to assist the Board with the review and oversight of matters related to compliance and to promote a Company-wide culture of compliance through oversight of and coordination with management on development and implementation of a robust and effective compliance program. Upon completion of this offering, the governance and nominating committee will consist of (Chair), and .
Code of Ethics
We have a Business Ethics and Conduct Code that applies to, among others, our principal executive officer, principal financial officer, principal accounting officer, and persons performing similar functions, among others. A copy of our Business Ethics and Conduct Code can be obtained on our website, http://www.AptalisPharma.com, by clicking the link for “Aptalis Code of Conduct” in the Compliance section. Any future amendments to the Business Ethics and Conduct Code, and any waivers thereto involving our executive officers, also will be posted to our website. Information on our website is not incorporated herein by reference.
148
Table of Contents
Overview
The following discussion relates to the compensation of our named executive officers for fiscal year 2013, which include our President and Chief Executive Officer, Dr. Frank Verwiel, and our other two most highly compensated executive officers, Steven Gannon, our Senior Vice President, Chief Financial Officer and Treasurer, and John Fraher, our President, Aptalis Pharma. Our compensation committee reviews and approves at the end of each fiscal year the level and form of compensation to be offered to our named executive officers, as well as other company executives. Our executive compensation philosophy is to provide and maintain a total compensation program that is internally equitable in relation to the value of each position, externally competitive in relation to the total compensation levels and practices at other comparable companies in the pharmaceutical industry, and that also recognizes company and individual performance.
Our executive compensation program is designed to attract, motivate and retain experienced and high quality leadership and to incentivize our executive officers and other key employees to achieve overall company results and individual performance goals that will contribute to our short- and long-term success. Our executive program has been developed and administered in a manner to reward superior operating performance while maximizing shareholder value; and our performance-based compensation is directly linked to the accomplishment of specific business goals and individual performance.
Executive Compensation Elements
The following section is a narrative discussion of the elements of compensation that would be useful for purposes of understanding the Summary Compensation Table set forth below. As an emerging growth company, the following discussion is neither required nor intended to be a “Compensation Discussion and Analysis” of the type required by Item 402 of Regulation S-K. The principal elements of compensation for our named executive officers consist of (1) base salary; (2) performance-based annual cash bonuses; (3) long-term equity incentives; and (4) other employee benefits and perquisites, as described below.
Base Salaries
The base salaries for our named executive officers are established after consideration of various factors, including each officer’s responsibilities, experience and contributions to our company, as well as maintaining internal equity and external competitiveness. The compensation committee reviews and determines annually our named executive officers’ base salaries based on each executive officer’s individual performance and contributions to our company, company performance and general industry conditions, but does not assign specific weighting to any factor. For fiscal year 2013, the compensation committee approved a base salary for each of our named executive officers as follows: USD $721,000 for Dr. Verwiel, CDN $425,286 for Mr. Gannon and USD $422,300 for Mr. Fraher, representing increases of 3%, 4%, and 3%, respectively, from the base salary of each such executive officer in fiscal year 2012.
Performance-Based Cash Incentives
Our named executive officers are eligible to participate in our annual cash incentive program, or Incentive Program, which is designed to promote and reward achievement of corporate goals and individual performance. Corporate goals are based upon achievement of pre-determined financial targets. Based on our financial performance in fiscal year 2013, the actual corporate performance
149
Table of Contents
achievement was 99% of target, and our compensation committee approved a corporate performance payout of 100% of target. The individual performance of our named executive officers, other than our President and Chief Executive Officer, is evaluated by Dr. Verwiel and recommended to the compensation committee for determination and approval. Dr. Verwiel’s individual performance is evaluated and determined by the compensation committee.
Cash incentives awarded to the named executive officers under the Incentive Program require the approval of the compensation committee. Regardless of corporate or individual performance, no awards under the Incentive Program are guaranteed and all such awards are subject to the discretion of the compensation committee. The target and maximum amounts of any annual bonus that may be earned by an executive officer are expressed as a percentage of the executive’s annual base salary in effect with respect to the applicable year.
For fiscal year 2013, Dr. Verwiel had a target annual bonus of 60% of his annual base salary, up to a maximum of 120% of base salary for high achievement, and 100% of his bonus opportunity was based on the achievement of corporate performance. For fiscal year 2013, Mr. Gannon had a target annual bonus of 50% of annual base salary, up to 100% of base salary for high achievement; 85% of Mr. Gannon’s bonus opportunity was based on the achievement of corporate performance measures, and the remaining 15% was based on individual performance measures. For fiscal year 2013, Mr. Fraher had a target annual bonus of 50% of annual base salary; 90% of Mr. Fraher’s bonus opportunity was based on the achievement of corporate performance measures, and the remaining 10% was based on individual performance measures. The bonuses paid to each of our named executive officers for fiscal year 2013 are set forth in the Summary Compensation Table below.
Long-Term Equity Incentives
Dr. Verwiel and Mr. Gannon participate in the Aptalis Holdings Inc. Management Equity Incentive Plan, effective as of April 15, 2008 (the “2008 Management Equity Incentive Plan”), which provides for the grant of stock option awards. Dr. Verwiel and Mr. Gannon have each been awarded options, a portion of which are subject to time-based vesting conditions, and a portion of which are subject to performance-based vesting conditions. A portion of the options that are subject to time-based vesting conditions also contains an annual accreting exercise price. Dr. Verwiel and Mr. Gannon received equity incentive awards under the 2008 Management Equity Incentive Plan between fiscal years 2008 and 2009. All of the time-based vesting options granted to Dr. Verwiel and Mr. Gannon are fully vested. As of September 30, 2013, none of the performance vesting options have vested. No stock options were granted to Dr. Verwiel and Mr. Gannon during fiscal year 2013. For more information regarding the awards granted under the 2008 Management Equity Incentive Plan, including a description of the vesting conditions applicable to such awards, please refer to “—Management Equity Incentive Plans” below.
The 2008 Management Equity Incentive Plan was amended and restated effective February 11, 2011 (the “2011 Management Equity Incentive Plan”). Mr. Fraher currently participates in the 2011 Management Equity Incentive Plan and he was awarded stock options in fiscal year 2011, a portion of which are subject to time-based vesting conditions and a portion of which are subject to performance-based vesting conditions. A portion of the options that are subject to time-based vesting conditions also contain an annual accreting exercise price. As of September 30, 2013, 40% of his time-based options have vested and none of his performance vesting options have vested. For more information regarding the awards granted under the 2011 Management Equity Incentive Plan, including a description of the vesting conditions applicable to such awards, please refer to “—Management Equity Incentive Plans,” below.
For more information regarding the equity awards granted to our named executive officers, please refer to “—Employment Arrangements” below. As of September 30, 2013, all options granted to our named executive officers remained outstanding.
150
Table of Contents
Other Benefits and Perquisites
The benefit programs provided to our named executive officers are generally the same benefits provided to all other eligible employees. Our benefit programs are targeted to be competitive with other pharmaceutical companies and include participation in competitive health, welfare and retirement plans.
During fiscal year 2013, we also provided our named executive officers with additional compensation in the form of perquisites. This compensation was targeted to be competitive with other pharmaceutical companies and included, in the case of each named executive officer, a car allowance or a company-provided vehicle. The benefits and perquisites paid to each of our named executive officers for fiscal year 2013 are set forth in the Summary Compensation Table below.
Summary Compensation Table
The following table summarizes information regarding the compensation awarded to, earned by, or paid to our named executive officers in fiscal year 2013.
Name and Principal Position | Fiscal Year | Salary ($)(1) | Non-Equity Incentive Plan Compensation ($)(2) | All other Compensation ($) | Total Compensation ($) | |||||||||||||||
Dr. Frank Verwiel President and Chief Executive Officer | 2013 | 721,000 | 432,600 | 269,935 | (3) | 1,423,535 | ||||||||||||||
Steve Gannon Senior Vice President, Chief Financial Officer and Treasurer | 2013 | 418,630 | 212,455 | 30,848 | (4) | 661,933 | ||||||||||||||
John Fraher President, Aptalis Pharma | 2013 | 422,300 | 214,951 | 45,036 | (5) | 682,287 | ||||||||||||||
| (1) | The values in this column represent, in U.S. dollars, the base salary earned by our named executive officers during fiscal year 2013. The salary paid to Mr. Gannon was paid in Canadian dollars and was converted to U.S. dollars. For purposes of this table, an exchange rate of 1.0159 Canadian dollars to one U.S. dollar was used for fiscal year 2013. |
| (2) | The actual cash incentive awards for our named executive officers under the Incentive Program for fiscal year 2013 were approved at a meeting of the compensation committee in December 2013. Since the incentive award granted to Mr. Gannon will be paid in Canadian dollars, the value for such award has been converted to U.S. dollars for purposes of this table at the exchange rate described in note (1) above. |
| (3) | Represents (i) company car allowance in the amount of $18,000; (ii) company contribution under the 401(k) Plan in the amount of $23,000; (iii) company payments for the preparation of annual tax returns and for financial planning services in the amount of $12,635 and (iv) a Match Payment of $216,300, representing one-half of Dr. Verwiel’s fiscal year 2013 Incentive Program award. |
| (4) | Represents (i) company car allowance in the amount of $10,040; and (ii) company contribution under the Canadian RRSP/DPSP in the amount of $20,808. These amounts were paid in Canadian dollars and were converted to U.S. dollars as described in note (1) above. |
| (5) | Represents (i) company car allowance in the amount of $10,200; (ii) the value of a company car service from executive’s residence to the company’s offices, and taxes owed by the executive thereon, of $20,417; and (iii) company contribution under the 401(k) Plan in the amount of $14,419. |
151
Table of Contents
Outstanding Equity Awards at Fiscal Year-End
The following table shows the outstanding equity awards as of the end of fiscal year 2013 for each of our named executive officers:
| Option Awards | Stock Awards | |||||||||||||||||||||||
Name and Principal Position | Number of Securities Underlying Unexercised Options (#) Exercisable | Number of Securities Underlying Unexercised Options (#) Unexercisable | Equity Incentive Plan Awards: Number of Securities Underlying Unexercised Unearned Options(4) | Option Exercise Price ($)(5) | Option Expiration Date | Number of Shares or Units of Stock that Have Not Vested (#) | Market Value of Shares or Units of Stock that Have Not Vested | |||||||||||||||||
Dr. Frank Verwiel | 320,000 | (1) | — | 160,000 | 10.00 | 4/15/2018 | ||||||||||||||||||
President and Chief Executive Officer | 160,000 | (2) | — | — | 16.10 | (2) | 4/15/2018 | |||||||||||||||||
Steve Gannon | 96,436 | (3) | — | — | 0.01 | 4/15/2018 | ||||||||||||||||||
Senior Vice President Chief Financial Officer and Treasurer | 167,500 | (1) | — | 83,750 | 10.00 | 4/15/2018 | ||||||||||||||||||
| 83,750 | (2) | — | — | 16.10 | (2) | 4/15/2018 | ||||||||||||||||||
John Fraher | 60,000 | (1) | 90,000 | 75,000 | 10.00 | 2/11/2021 | ||||||||||||||||||
President, Aptalis Pharma | 30,000 | (2) | 45,000 | — | 12.10 | (2) | 2/11/2021 | |||||||||||||||||
| (1) | These amounts reflect the number of vested time-based options granted to our named executive officers under the 2008 and 2011 Management Equity Incentive Plans. Time-based options vest ratably on each of the first through fifth anniversaries of the date of grant, subject to the named executive officer’s continued employment with us through each anniversary. Dr. Verwiel and Mr. Gannon’s time-based options became fully vested on April 15, 2013. Mr. Fraher’s time-based options became 40% vested on February 11, 2013. For additional information regarding the terms of the 2008 and 2011 Management Equity Incentive Programs, please see “—Management Equity Incentive Plans” below. |
| (2) | These amounts reflect the number of vested premium options granted to our named executive officers under the 2008 and 2011 Management Equity Incentive Plans. Premium options vest ratably on each of the first through fifth anniversaries of the date of grant, subject to the named executive officer’s continued employment with us through each anniversary. Dr. Verwiel and Mr. Gannon’s premium options became fully vested on April 15, 2013. Mr. Fraher’s premium options became 40% vested on February 11, 2013. |
| The exercise price of premium options granted under the 2008 and 2011 Management Equity Incentive Plans increases at a 10% compounded rate on each anniversary of the date of grant of such options until, with certain exceptions, the earlier of: (a) the exercise of such options; (b) the fifth anniversary of the grant date of such options; (c) a Liquidity Event (as defined in the Management Equity Incentive Plans) or (d) the occurrence of a Change in Control (as defined in the Management Equity Incentive Plans). On April 15, 2013, the exercise prices of premium options held by Dr. Verwiel and Mr. Gannon reached their maximum levels. |
| (3) | This amount reflects the number of penny options (i.e., options to purchase our common stock for $0.01), granted to Mr. Gannon, pursuant to his penny option grant agreement. Approximately one-third of the penny options immediately vested upon grant on April 15, 2008, one-third vested on August 25, 2009, and the remainder of the penny options vested on August 25, 2010. |
| (4) | These amounts reflect the number of performance-based options granted to our named executive officers under the 2008 and 2011 Management Equity Incentive Plans. The vesting of performance-based options depends upon the occurrence of a Liquidity Event (as defined in the Management Equity Incentive Plans and summarized below) and the realization of certain investment returns by TPG and its affiliates as a result of such event(s), subject to the named executive officer’s continued employment with us through such Liquidity Event. For Dr. Verwiel and Mr. Gannon, whose option grants are subject to the 2008 Management Equity Incentive Plan, such returns are calculated on the basis of receipt by TPG and its affiliates of a return on investment taking into account only the initial Sponsor Price (as defined in the 2008 Management Equity Incentive Plan). For Mr. Fraher, whose option grants are subject to the 2011 Management Equity Incentive Plan, such returns are calculated on the basis of receipt by TPG and its affiliates of a return on investment taking into account the initial Sponsor Price, plus the aggregate purchase price of, and all related transaction expenses paid by TPG and its affiliates in connection with the acquisition of, any Subsequent Majority Stockholder Shares (as defined in the 2011 Management Equity Incentive Plan). The occurrence of the IPO will not, by itself, result in a Liquidity Event. |
| (5) | All options, with the exception of the penny options granted to Mr. Gannon, were granted with an exercise price equal to the fair market value of our common stock, as determined by our Board, on the date of grant. The penny options granted to Mr. Gannon had an exercise price equal to USD $0.01 per share of common stock. |
152
Table of Contents
Recent Developments
In connection with the Refinancing and Recapitalization, we paid to our option holders, including our named executive officers, a special cash bonus payment based on the number of vested but unexercised time-based vested options and certain performance options held by such option holders. In addition, the exercise price of certain options was adjusted to preserve the value of such options following the Refinancing and Recapitalization. The Refinancing and Recapitalization constituted a Liquidity Event (as defined in the Management Equity Incentive Plans) and, as a result, the exercise price for time-based options that have an accreting exercise price, including those held by Mr. Fraher, ceased to increase as of the date of such transactions. As a result of these transactions, all penny options held by Mr. Gannon were required to be exercised and settled into shares of company common stock.
Employment Arrangements
The following are descriptions of the employment agreements with each of our named executive officers in effect as of the end of fiscal year 2013.
Employment Agreement with Dr. Frank Verwiel
On May 16, 2008, we entered into an amended and restated employment agreement with Dr. Verwiel to continue his service as our President and Chief Executive Officer. The agreement has an initial five-year term beginning on February 25, 2008. By its terms, the contract is subject to automatic twelve-month extensions, unless either the company or Dr. Verwiel provides 60 days’ prior notice of termination. The first automatic extension occurred on February 25, 2013.
Under his employment agreement, Dr. Verwiel is entitled to receive a base salary of USD $645,000 per year, subject to annual review. For fiscal year 2013, the compensation committee approved an increase in Dr. Verwiel’s base salary to $721,000 per year. Although no annual bonus is guaranteed to Dr. Verwiel, he has the opportunity to earn an annual cash bonus of 60% of his base salary for target company performance, with the possibility of achieving 120% of base salary for high achievement. In addition, if in any year Dr. Verwiel receives an annual cash bonus, he is also entitled to receive a Match Payment, as described above in Note 3 to the Summary Compensation Table.
In addition, Dr. Verwiel received a one-time grant of 640,000 stock options to purchase shares of our common stock under the 2008 Management Equity Incentive Plan on April 15, 2008. These options vest in accordance with our 2008 Management Equity Incentive Plan and have an initial exercise price of $10.00 per share, which our Board determined was the fair market value of our common stock on the date of grant.
Pursuant to his employment agreement, Dr. Verwiel received a grant of 77,834 restricted stock units on April 15, 2008, which vested immediately upon grant and settled on April 15, 2011. Dr. Verwiel received an additional grant of 155,666 restricted stock units on August 25, 2009, one-half of which vested immediately upon grant and one-half of which vested on August 25, 2010. The additional grant settled on August 25, 2012.
In addition, pursuant to his employment agreement, on April 15, 2008, Dr. Verwiel purchased 75,000 shares of our common stock for aggregate consideration of USD $750,000 pursuant to a subscription agreement and a Management Stockholders’ Agreement.
Dr. Verwiel’s agreement also provides that we will pay for certain of his tax planning and filing, financial planning and accounting expenses, not to exceed $50,000 in the aggregate on an annual basis. In addition, Dr. Verwiel is entitled to a company car benefit, as described above in Note 3 to the Summary Compensation Table.
153
Table of Contents
Dr. Verwiel is entitled to certain severance benefits following a termination of employment. If the company terminates Dr. Verwiel’s employment without cause or if Dr. Verwiel terminates his employment for good reason (each as defined in the agreement), all outstanding options granted to Dr. Verwiel pursuant to the Management Equity Incentive Plans will expire under the terms of such plan as described below in “—Management Equity Incentive Plans” except that any performance-based options that have not vested as of the date of termination will remain outstanding for the 12-month period following termination, and if a Liquidity Event (as defined under the 2008 Management Equity Incentive Plan and summarized below) occurs within such period, all, none or one-half of the unvested performance-based options will become vested and exercisable in accordance with the 2008 Management Equity Incentive Plan. In addition, Dr. Verwiel would be entitled to the following:
| Ÿ | An amount equal to accrued but unused vacation and base salary through the date of termination, payable within thirty (30) days following the date of termination (the “Accrued Benefits”). |
| Ÿ | An amount equal to (a) two times his base salary in effect at the date of termination, plus (b) two times his target annual bonus (which is 60% of Dr. Verwiel’s base salary). This amount is payable in equal, ratable installments in accordance with our regular payroll policies over the course of 24 months. |
| Ÿ | Medical benefits, which are substantially similar to the benefits provided to our executive officers, for 24 months after the date of termination (the provision of medical benefits after the 18-month period following termination will be treated as an in-kind payment to Dr. Verwiel). However, if Dr. Verwiel is employed by another employer and is eligible to receive comparable benefits, we are not required to provide continued medical benefits. |
If Dr. Verwiel is terminated without cause or terminates his employment for good reason within twelve (12) months following a Change of Control (as defined in the agreement), Dr. Verwiel is entitled to the benefits described above, except that he shall receive an amount equal to two times his base salary and two times his target annual bonus immediately, rather than over a 24-month period. Upon a termination of employment by the company for cause or by Dr. Verwiel without good reason, or on account of Dr. Verwiel’s death or disability, the company will pay Dr. Verwiel the Accrued Benefits.
Pursuant to his employment agreement, Dr. Verwiel is subject to a covenant not to compete with the company for a period of 18 months following the termination of his employment.
Employment Agreement with Steve Gannon
On July 3, 2008, we entered into an employment agreement with Mr. Gannon to continue his service as our Senior Vice President and Chief Financial Officer. The agreement had an initial five-year term beginning on February 25, 2008, and was amended effective February 26, 2013 to clarify the terms of Mr. Gannon’s annual cash bonus and termination pay entitlement, as described below. By its terms, the agreement is subject to automatic twelve-month extensions, unless either we or Mr. Gannon provides 60 days’ prior notice of termination. The first automatic extension occurred on February 25, 2013.
Under his employment agreement, Mr. Gannon is entitled to receive a base salary of CDN $338,550 per year, subject to annual review. For fiscal year 2013, the compensation committee approved an increase in Mr. Gannon’s base salary to CDN $425,286 per year. Mr. Gannon has the opportunity to earn an annual cash bonus of at least 50% of his base salary for target company and individual performance, with the possibility of achieving 100% of base salary for high achievement pursuant to the terms of the Incentive Program.
In addition, Mr. Gannon received a one-time grant of 335,000 stock options under the 2008 Management Equity Incentive Plan on April 15, 2008. These options vest in accordance with our 2008
154
Table of Contents
Management Equity Incentive Plan and have an initial exercise price of $10.00 per share, which our Board determined was the fair market value of our common stock on the date of grant.
Mr. Gannon also received a grant of 96,436 options on April 15, 2008 to purchase a share of our common stock for USD $0.01. Subject to Mr. Gannon’s continued employment with us, these options vested in three approximately equal installments, the last of which vested in full on August 25, 2010.
In addition, pursuant to his employment agreement, on April 15, 2008, Mr. Gannon purchased 20,640 shares of our common stock for aggregate consideration of USD $206,400 pursuant to a subscription agreement and a Management Stockholders’ Agreement.
Mr. Gannon is entitled to a company car benefit, as described above in Note 4 to the Summary Compensation Table.
Mr. Gannon is entitled to certain severance benefits following a termination of employment. If the company terminates Mr. Gannon’s employment without cause or if Mr. Gannon terminates his employment for good reason (each as defined in the agreement), all outstanding options granted to Mr. Gannon pursuant to the Management Equity Incentive Plans will expire under the terms of such plan as described below in “—Management Equity Incentive Plans” except that any performance-based options that have not vested as of the date of termination will remain outstanding for the 12-month period following termination, and if a Liquidity Event (as defined under the 2008 Management Equity Incentive Plan and summarized below) occurs within such period, all, none or one-half of the unvested performance-based options will become vested and exercisable in accordance with the 2008 Management Equity Incentive Plan. In addition, Mr. Gannon would be entitled to the following:
| Ÿ | An amount equal to Mr. Gannon’s Accrued Benefits. |
| Ÿ | An amount equal to (a) one-and-a-half times (1.5x) his base salary in effect at the date of termination, plus (b) one-and-a-half times (1.5x) his target annual bonus (which is 50% of Mr. Gannon’s base salary). This amount is payable in equal, ratable installments in accordance with our regular payroll policies over the course of 18 months. |
| Ÿ | Medical benefits, which are substantially similar to the benefits provided to our executive officers, for 18 months after the date of termination. However, if Mr. Gannon is employed with another employer and is eligible to receive comparable benefits, we are not required to provide continued medical benefits. |
If Mr. Gannon is terminated without cause or terminates his employment for good reason within twelve (12) months following a Change of Control (as defined in the agreement), Mr. Gannon shall be entitled to the benefits described above, except that he shall receive an amount equal to one-and-a-half times (1.5x) his base salary and target annual bonus immediately, rather than over an 18-month period. Upon a termination of employment by the company for cause or by Mr. Gannon without good reason, or on account of Mr. Gannon’s death or disability, we will pay Mr. Gannon the Accrued Benefits.
Pursuant to his employment agreement, Mr. Gannon is subject to a covenant not to compete with the company for a period of 18 months following the termination of his employment.
Employment Agreement with John Fraher
On February 27, 2011, we entered into an employment agreement with Mr. Fraher to serve as our President, Aptalis Pharma. The agreement has an initial five-year term beginning on February 16, 2011, and was amended effective January 21, 2013 to update the car allowance benefits provided to him. By its terms, the agreement is subject to automatic twelve-month extensions, unless either we or Mr. Fraher provide 60 days’ prior notice of termination.
155
Table of Contents
Under his employment agreement, Mr. Fraher is entitled to receive a base salary of USD $410,000 per year, subject to annual review. For fiscal year 2013, the compensation committee approved an increase in Mr. Fraher’s base salary to $422,300 per year. Mr. Fraher has the opportunity to earn an annual cash bonus of at least 50% of his base salary for target company and individual performance.
In addition, Mr. Fraher received a one-time grant of 300,000 options under the 2011 Management Equity Incentive Plan on February 11, 2011. These options will vest in accordance with our 2011 Management Equity Incentive Plan and have an initial exercise price of $10.00 per share, which our Board determined was the fair market value of our common stock on the date of grant.
In addition, pursuant to his employment agreement, on September 22, 2011, Mr. Fraher purchased 13,000 shares of our common stock for aggregate consideration of $130,000 pursuant to a subscription agreement and a Management Stockholders’ Agreement.
Mr. Fraher is entitled to a company car benefit and service, as described above in Note 5 to the Summary Compensation Table.
Mr. Fraher is entitled to certain severance benefits following termination of employment. If the company terminates Mr. Fraher’s employment without cause or if Mr. Fraher terminates his employment for good reason (as defined in the agreement), Mr. Fraher would be entitled to the following:
| Ÿ | An amount equal to Mr. Fraher’s Accrued Benefits. If Mr. Fraher’s employment is terminated following the end of a fiscal year but before his annual bonus is paid, the amount of such annual bonus shall be paid to him at the same payment time applicable to other senior executives. |
| Ÿ | An amount equal to (a) one-and-a-half times (1.5x) his base salary in effect at the date of termination, plus (b) one-and-a-half times (1.5x) his target annual bonus (which is 50% of Mr. Fraher’s base salary). This amount is payable in equal, ratable installments in accordance with our regular payroll policies over the course of 18 months. |
| Ÿ | Company payment of COBRA premiums for 12 months after the date of termination. However, if Mr. Fraher is employed with another employer and is eligible to receive comparable benefits, we are not required to provide continued medical benefits. |
If Mr. Fraher is terminated without cause or terminates his employment for good reason within twelve (12) months following a Change of Control (as defined in the agreement), Mr. Fraher shall be entitled to the benefits described above, except that he shall receive an amount equal to one-and-a-half times (1.5x) his base salary and his target annual bonus immediately, rather than over an 18-month period. Upon a termination of employment by the company for cause or by Mr. Fraher without good reason, or on account of Mr. Fraher’s death or disability, we will pay Mr. Fraher the Accrued Benefits. If Mr. Fraher is terminated without cause or terminates his employment for good reason during the two-year period following a Change of Control (as defined in the 2011 Management Equity Incentive Plan), all of his time-based options and premium options, to the extent unvested, shall immediately become vested and exercisable.
Pursuant to his employment agreement, Mr. Fraher is subject to a covenant not to compete with the company for a period of 12 months following the termination of his employment.
156
Table of Contents
Retirement Plans
During fiscal year 2013, we maintained a group registered retirement savings plan (RRSP/DPSP) for our Canadian employees and a tax-qualified defined contribution plan in the form of a 401(k) Plan for all of our U.S. employees, including in each case for our named executive officers residing in each location. The 401(k) Plan provides for a 6% company matching contribution on employee deferrals, which is subject to a three-year cliff vesting requirement. Additionally, we maintain a non-registered Employee Profit Sharing Plan for Canadian executives designed to allow salaried employees above a certain salary level to contribute to and benefit from matching employer contributions up to a certain threshold, as described below, because the amount of contributions under the RRSP/DPSP is capped under applicable Canadian regulations. An employee was eligible to participate in the Employee Profit Sharing Plan during fiscal year 2013 if he or she (1) was a regular employee working in Canada with a base salary of at least $238,200 during fiscal year 2013 and (2) was a participant in the RRSP/DPSP during fiscal year 2013 and his or her total contribution reached the maximum allowed by the Canadian government ($23,820 in 2013). Once a participant meets the annual fiscal maximum of $23,820, a participant can make after income tax contributions into the non-registered Employee Profit Sharing Plan and receive matching employer contributions, subject to the 5% threshold. Employer contributions are made before income tax and an employee pays taxes at the end of the calendar year on his/her income tax return. Mr. Gannon participated in this program in fiscal years 2009 through 2013. Lastly, we maintain statutorily required retirement plans in Italy and France, but none of our named executive officers participate in these plans.
Potential Payments upon Certain Terminations or a Change in Control
As described above in “—Employment Arrangements,” each of the employment agreements with our named executive officers contains severance provisions that would entitle the named executive officer to certain payments or benefits upon a termination of employment without cause or for good reason (as defined in the agreements), including in the twelve (12) month period following a change in control.
In addition, the Management Equity Incentive Plans contain vesting provisions that are applicable following a named executive officer’s termination of employment. In general, upon the termination of employment of a named executive officer, any unvested options are forfeited. However, if such termination of employment is without cause or by the participant for good reason and occurred during the two-year period following a Change of Control (as defined in the Management Equity Incentive Plans), such unvested options that are time-based and premium options immediately vest and become exercisable as of the date of such termination. Pursuant to their employment agreements, in the event that Dr. Verwiel or Mr. Gannon is terminated by us without cause or resigns for good reason, any options that are performance-based options that had not vested as of the date of termination will remain outstanding for a 12-month period following termination, and if a Liquidity Event (as defined in the 2008 Management Equity Incentive Plan and summarized below) were to occur within such period, all, none or one-half of such unvested performance-based options would become vested and exercisable in accordance with the 2008 Management Equity Incentive Plan.
Although the reduced disclosure obligations that apply to us as an emerging growth company do not require us to do so, we have elected to provide the following table showing the potential compensation that we would have had to pay to each of our named executive officers in the event of a termination of such named executive officer’s employment under the scenarios described above. The table values are based solely on each named executive officer’s respective employment agreement. The amounts shown below assume that termination of employment was effective September 30, 2013. Although the calculations are intended to provide reasonable estimates of the potential benefits, they
157
Table of Contents
are based on numerous assumptions and do not represent the actual amount, if any, an executive would receive if an eligible termination event were to occur. Actual amounts to be paid can only be determined at the time of separation from employment.
| Severance Agreements Assuming Termination of Service at the end of Fiscal Year 2013 | ||||||||||||||||||
Name & Principal Position | Benefit Type | Termination with Cause or without Good Reason($) | Termination without Cause or for Good Reason ($)(1) | Termination due to Death or Disability ($) | Change in Control(2)($) | |||||||||||||
Dr. Frank Verwiel | Severance Payment – Salary Component | — | $ | 1,442,000 | — | $ | 1,442,000 | |||||||||||
President and Chief Executive Officer | Severance Payment – Bonus Component | — | $ | 865,200 | — | $ | 865,200 | |||||||||||
| Benefits | — | $ | 43,607 | — | $ | 43,607 | ||||||||||||
| Value of Equity | — | — | — | — | ||||||||||||||
| Award Acceleration(3) | — | — | ||||||||||||||||
|
|
|
| |||||||||||||||
| Total | — | $ | 2,350,807 | — | $ | 2,350,807 | ||||||||||||
Steve Gannon | Severance Payment – Salary | — | $ | 627,945 | — | $ | 627,945 | |||||||||||
Senior Vice President and Chief Financial Officer and Treasurer | Severance Payment – Bonus Component | — | $ | 313,972 | — | $ | 313,972 | |||||||||||
| Benefits | — | $ | 3,467 | — | $ | 3,467 | ||||||||||||
| Value of Equity | — | — | — | — | ||||||||||||||
| Award Acceleration(3) | — | — | ||||||||||||||||
|
|
|
| |||||||||||||||
| Total | — | $ | 945,384 | — | $ | 945,384 | ||||||||||||
John Fraher | Severance Payment – Salary Component | — | $ | 633,450 | — | $ | 633,450 | |||||||||||
President, Aptalis Pharma | Severance Payment – Bonus Component | — | $ | 316,725 | — | $ | 316,725 | |||||||||||
| Benefits | — | $ | 15,561 | — | $ | 15,561 | ||||||||||||
| Value of Equity | — | — | — | — | ||||||||||||||
| Award Acceleration(3) | — | $ | 1,593,000 | |||||||||||||||
|
|
|
| |||||||||||||||
| Total | — | $ | 965,736 | — | $ | 2,558,736 | ||||||||||||
| (1) | The severance payments set forth in this column would have been paid to Dr. Verwiel in equal installments over a period of 24 months in accordance with our standard payroll procedures and any benefits would be provided over a period of 24 months. For Mr. Gannon and Mr. Fraher, the severance payments set forth in this column would have been paid to each executive in equal installments over a period of 18 months in accordance with our standard payroll procedures and any benefits would be provided for a period of 18 months to Mr. Gannon and a period of 12 months to Mr. Fraher. |
| (2) | All severance payments set forth in this column would have been paid immediately as a lump sum. |
| (3) | In general, upon the termination of employment of a named executive officer, any unvested company options are forfeited. However, if such termination of employment is without cause or by the participant for good reason and occurred during the two-year period following a Change of Control (as defined in the Management Equity Incentive Plans), such unvested company options that are time-based and premium options immediately vest and become exercisable as of the date of such termination. With respect to the acceleration of Mr. Fraher’s unvested time-based and premium options, the value shown is the spread value of such options as of September 30, 2013 using a fair market value of $22.50 per share. In the event either Dr. Verwiel or Mr. Gannon is terminated by us without cause or resigns for good reason, any company options that are performance-based options that have not vested as of the date of termination will remain outstanding for a 12-month period following termination, and if a Liquidity Event (as defined in the 2008 Management Equity Incentive Plan and summarized below) were to occur within such period, such unvested performance-based options would become vested and exercisable in accordance with the 2008 Management Equity Incentive Plan. |
158
Table of Contents
Management Equity Incentive Plans
The following summary describes what we consider to be the material terms of the Management Equity Incentive Plans. This summary is not a complete description of all of the provisions of the Management Equity Incentive Plans. You are encouraged to read the full text of the plans which have been filed as an exhibit to the registration statement of which this prospectus forms a part. All capitalized terms used herein shall have the meanings set forth in the applicable Management Equity Incentive Plan.
2008 Management Equity Incentive Plan
The 2008 Management Equity Incentive Plan was originally adopted on April 15, 2008, and was amended and restated effective February 11, 2011.
Plan Administration. The 2008 Management Equity Incentive Plan is administered by the Board or a committee appointed by the Board.
Authorized Shares. A total of 5,033,307 shares of our common stock have been reserved for issuance under the 2008 Management Equity Incentive Plan. The number of shares was increased by 1,200,000 in February 2011 in connection with the adoption of the 2011 Management Equity Incentive Plan, an amendment and restatement of the 2008 Management Equity Incentive Plan, described below.
Types of Awards; Vesting. The 2008 Management Equity Incentive Plan provides for grants of non-qualified stock options. For each grant made under the 2008 Management Equity Incentive Plan, 50% of the options vest based solely on continued employment (“time-based options”), 25% of the options vest based on continued employment and have an annual accreting exercise price (“premium options”), and 25% of the options vest, subject to a participant’s continued employment upon the occurrence of a Liquidity Event, based on the achievement of specified performance targets (“performance-based options”). A Liquidity Event is generally defined to include (i) a transaction that, when aggregated with any prior transaction, results in the payment to TPG and its affiliates of at least one-half of the Sponsor Price (as defined in the 2008 Management Equity Incentive Plan) in cash with respect to its initial shares in the company, including as a result of receipt of sale consideration, dividends, distributions, redemption proceeds or other consideration or (ii) any other transaction or series of transactions determined by the Board in its good faith discretion to constitute a Liquidity Event.
In general, for each grant made under the 2008 Management Equity Incentive Plan: (a) the time-based options and premium options vest and become exercisable, if at all, ratably on each of the first through fifth anniversaries of the grant date, subject to continued employment of the option holder through the vesting date; and (b) the performance-based options vest and become exercisable, if at all, upon the achievement of certain investment return targets by TPG and its affiliates as a result of the occurrence of a Liquidity Event, subject to continued employment of the option holder through the Liquidity Event. For grants of options prior to the effective date of the 2011 amendment and restatement of the 2008 Management Equity Incentive Plan, such investment return targets were calculated on the basis of receipt by TPG and its affiliates of a certain required return on investment taking into account only the initial Sponsor Price. For information on the investment return targets applicable to performance-based options granted under the 2011 Management Equity Incentive Plan, please see “—2011 Management Equity Incentive Plan” below.
Termination of Employment. Upon termination of a participant’s employment, the 2008 Management Equity Incentive Plan provides that, subject to the terms of any participant’s stock option grant agreement, any unvested portion of a participant’s options will be forfeited, and the vested
159
Table of Contents
portion of his or her options will expire on the earlier of (1) the date the participant’s employment is terminated for cause, (2) 90 days after the date the participant’s employment is terminated for any reason other than cause, death or disability, (3) one year after the date the participant’s employment is terminated by reason of death or disability, or (4) the tenth anniversary of the grant date of the options. However, if a participant’s employment is terminated by us without cause or by the participant for good reason during the two-year period following a Change in Control, all time-based and premium options will immediately vest and become exercisable as of the date of such termination.
Adjustment. In the event of certain changes in our capital structure, the Administrator is required to make appropriate adjustments to the maximum number of shares that may be delivered under the 2008 Management Equity Incentive Plan, and shall also make appropriate adjustments to the number and kinds of shares or stock or securities subject to the awards, the exercise prices of such awards and any other terms of the awards affected by such change in our capital structure. The Administrator may also make the types of adjustments described above to take into account events other than those specifically described in the 2008 Management Equity Incentive Plan if it determines that such adjustments are appropriate to preserve the value of awards.
French Sub-Plan. For our employees who are residents of France, the 2008 Management Equity Incentive Plan includes a French sub-plan, which amends certain guidelines set forth in the 2008 Management Equity Incentive Plan, including certain provisions regarding termination of employment, in order to allow our French employees to benefit from, as it relates to the stock options granted under the plan, a favorable tax and social regime under French law.
2011 Management Equity Incentive Plan
The 2011 Management Equity Incentive Plan is an amendment and restatement of the 2008 Management Equity Incentive Plan that was adopted in connection with an option exchange program, whereby eligible option holders chose whether to keep their outstanding eligible stock options granted under the 2008 Management Equity Incentive Plan or to exchange such stock options for an equal amount of replacement options granted under the 2011 Management Equity Incentive Plan, with an exercise price and performance vesting terms that were different than the original stock options (“Replacement Options”). Under the option exchange program, stock options representing options to purchase an aggregate of 785,000 shares of our common stock were cancelled in exchange for Replacement Options. No named executive officer participated in the option exchange program.
Nineteen option holders participated in the option exchange program, and each such holder received Replacement Options under the 2011 Management Equity Incentive Plan that had substantially the same terms and conditions as their tendered options, except that:
| Ÿ | The exercise price of each share underlying the Replacement Options was reduced to the fair market value of a share of our common stock as of the grant date of the Replacement Options; |
| Ÿ | The portion of the Replacement Options that were time-based options retained the same vesting schedule as the original options, measured from the original grant date; |
| Ÿ | The portion of the Replacement Options that were premium options contained the following vesting schedule: (a) 20% of the shares underlying the premium option vested immediately on the grant date of the Replacement Options; and (b) 20% of the shares underlying the premium options will vest on each of the first, second, third and fourth anniversary of the grant date of the Replacement Options. In addition, the portion of the Replacement Options that were premium options had an accreting exercise price whose initial value was reset to the fair market value at the grant date of the Replacement Options and that increased on each anniversary of that date, rather than the original grant date of the tendered options; and |
160
Table of Contents
| Ÿ | The portion of the Replacement Options that were performance-based options are eligible for vesting on the basis of receipt by TPG and its affiliates of a return on investment, taking into account the initial Sponsor Price, plus the aggregate purchase price of, and all related transaction expenses paid by TPG and its affiliates in connection with the acquisition of, any Subsequent Majority Stockholder Shares, subject to the participant’s continued employment through the applicable vesting date. The required return on the investment applicable to the Replacement Options was reduced from the return on investment applicable to the original company options. Subsequent grants of performance-based options under the 2011 Management Equity Incentive Plan are also subject to the reduced required return on investment thresholds and the receipt by TPG and its affiliates of a return on investment, as described above. |
In addition, the number of shares authorized under the 2008 Management Equity Incentive Plan was increased by 1,200,000 shares as a result of the amendment and restatement.
Director Compensation
The following table sets forth information concerning the compensation earned by our directors during fiscal year 2013. Directors who are employees of the company, including Dr. Verwiel, do not receive any fees for their services as directors. Dr. Frank Verwiel’s compensation is included above with that of our named executive officers. We have two non-employee directors who are not employed by our Sponsors, Dr. Kessler and Mr. Labrum.
Name | Fees Earned or Paid in Cash ($) | Stock Awards ($)(d) | Option Awards ($)(e) | Non-Equity Incentive Plan Compensation ($) | Change in Pension Value and Nonqualified Deferred Compensation Earnings ($) | All other Compensation ($) | Total Compensation ($) | |||||||||||||||||||
David A. Kessler, MD(a) | 130,000 | (b) | — | — | — | — | 130,000 | |||||||||||||||||||
Ronald Labrum(a) | 55,000 | (c) | — | — | — | — | 55,000 | |||||||||||||||||||
| (a) | Dr. Kessler and Mr. Labrum were appointed as directors of the company on May 13, 2011. |
| (b) | This figure reflects payments earned by Dr. Kessler in fiscal year 2013 for his services as an outside director and his services as a consultant to the company. During fiscal year 2013, Dr. Kessler earned $55,000 for his services as an outside director. Pursuant to his Consulting Agreement (as described below), Dr. Kessler earned $75,000 for his services as a consultant during fiscal year 2013. |
| (c) | This figure reflects quarterly payments earned by Mr. Labrum in fiscal year 2013 for his services as an outside director. |
| (d) | As of September 30, 2013, Dr. Kessler held 5,000 restricted stock units. |
| (e) | As of September 30, 2013, Dr. Kessler held options to acquire 40,000 shares and Mr. Labrum held options to acquire 25,000 shares. |
Dr. David Kessler’s Consulting Arrangement
Pursuant to a consulting arrangement, Dr. Kessler provides advice and guidance on regulatory and product management matters affecting our business, including assisting our senior management team with the preparation of our strategic research and development plan. In exchange for these services, Dr. Kessler receives annual compensation of $75,000, payable in quarterly installments. In addition, Dr. Kessler received a grant of 5,000 stock options in 2008 to purchase shares of our common stock under the 2008 Management Equity Incentive Plan, which were subsequently exchanged under the option exchange program. Please see “—2011 Management Equity Incentive Plan” above. Dr. Kessler subsequently received an additional grant of 5,000 restricted stock units (as described below) and two additional grants, each of 5,000 stock options under the 2011 Management Equity Incentive Program, which occurred in 2011 and 2012, respectively.
161
Table of Contents
Dr. David Kessler’s Restricted Stock Unit Grant Agreement
On January 12, 2010, we entered into a restricted stock unit grant agreement with Dr. Kessler, under which Dr. Kessler received a grant of 5,000 restricted stock units (the “Restricted Stock Unit Grant Agreement”). Pursuant to the agreement, approximately one-third of the restricted stock units vested on October 1, 2010, one-third vested on October 1, 2011, and the remainder of the restricted stock units vested on October 1, 2012. The restricted stock units settle into shares of company common stock on the earliest of a termination of Dr. Kessler’s consulting services to the company, a Liquidity Event or a Change of Control (in each case as defined in the Restricted Stock Unit Grant Agreement); provided that, in order to settle, any Liquidity Event or Change in Control must constitute a change in the ownership or effective control of the company or a change in the ownership of a substantial portion of the company’s assets, as defined in Internal Revenue Code Section 409A.
Although the Refinancing and Recapitalization resulted in a Liquidity Event, Dr. Kessler’s RSUs did not settle as a result of such transactions because the Liquidity Event did not constitute a change in the ownership or effective control of the company or a change in the ownership of a substantial portion of the company’s assets. However, in connection with the Refinancing and Recapitalization, Dr. Kessler received a special cash bonus payment in respect of his RSUs.
162
Table of Contents
CERTAIN RELATIONSHIPS AND RELATED PARTY TRANSACTIONS
Agreements with our Sponsors
In 2008, in connection with our going private transaction we entered into a stockholders agreement and a registration rights agreement with certain of the stockholders of the Company. These agreements contain provisions relating to election of directors, participation rights, restrictions on transfer of shares, tag along rights, drag along rights, a call right exercisable by us upon departure of a manager, a right of first offer upon disposition of shares, registration rights and other actions requiring the approval of stockholders. In addition, we entered into management agreements with our Sponsors for the provision of certain consulting and management advisory services to us.
Stockholders Agreement
We intend to enter into an amended and restated stockholders’ agreement with the TPG Funds that will provide that, for so long as the stockholders’ agreement remains in effect, we and the TPG Funds are required to take actions reasonably necessary, subject to applicable regulatory and stock exchange listing requirements (including director independence requirements), to cause the membership of our board of directors and any committees of our board of directors to be consistent with the terms of the agreement.
Registration Rights Agreement
We plan to enter into an amended and restated registration rights agreement with TPG and certain other coinvestors. We refer to this agreement as the Registration Rights Agreement. The Registration Rights Agreement will provide the shareholders party to the agreement with the right to require us to register their equity securities under the Securities Act. In addition, in most circumstances when we propose (other than pursuant to a demand registration) to register any of our equity securities under the Securities Act, the shareholders party to the Registration Rights Agreement will have the opportunity to register their registrable securities on such registration statement. We will generally be required to bear our own expenses in connection with any registration of shares under the Registration Rights Agreement, including this offering, as well as the reasonable fees of a single counsel for the holders of registration rights. The Registration Rights Agreement will also contain certain restrictions on the sale of shares by the investors party to that agreement, as well as customary indemnification provisions.
Management Agreements
We have entered into management agreements with our Sponsors pursuant to which our Sponsors provide management and other advisory services to us. In consideration for ongoing management and other advisory services, the management agreements require us to pay our Sponsors an annual management fee and to reimburse our Sponsors for out-of-pocket expenses incurred in connection with their services. The management agreements include customary indemnification provisions in favor of our Sponsors. The management agreements were amended in connection with the Recapitalization to extend their term consistent with the maturity date of the senior secured term loan facility. Upon consummation of this offering, the management agreements will terminate and we will pay our Sponsors a termination fee of $ million.
Other
Our Sponsors and their affiliates have ownership interests in a broad range of companies, which we refer to as “Sponsor portfolio companies.” In the ordinary course of business, we enter into agreements with a number of companies, which may include some sponsor portfolio companies.
163
Table of Contents
PRINCIPAL AND SELLING STOCKHOLDERS
Beneficial Ownership
The following table sets forth information with respect to the ownership as of September 30, 2013 for (a) each person known by us to own beneficially more than a 5% of our outstanding common stock, (b) each member of our Board of Directors, (c) each of our named executive officers, (d) all of our executive officers and directors as a group and (e) each shareholder selling stock in this offering.
The amounts and percentages of shares beneficially owned are reported on the basis of SEC regulations governing the determination of beneficial ownership of securities. Under SEC rules, a person is deemed to be a “beneficial owner” of a security if that person has or shares voting power or investment power, which includes the power to dispose of or to direct the disposition of such security. A person is also deemed to be a beneficial owner of any securities of which that person has a right to acquire beneficial ownership within 60 days. Securities that can be so acquired are deemed to be outstanding for purposes of computing such person’s ownership percentage, but not for purposes of computing any other person’s percentage. Under these rules, more than one person may be deemed to be a beneficial owner of the same securities and a person may be deemed to be a beneficial owner of securities with respect to which such person has no economic interest. The percentages of shares outstanding provided in the table are based on a total of 67,696,126 shares of our common stock outstanding on September 30, 2013 and also lists applicable percentage ownership based on shares of common stock assumed to be outstanding immediately after closing of the offering.
Except as otherwise indicated in the footnotes below, each of the beneficial owners has, to our knowledge, sole voting and investment power with respect to the indicated shares. Unless otherwise noted, the address of each beneficial owner is c/o Aptalis Pharma Inc., General Counsel, 100 Somerset Corporate Boulevard, Bridgewater, New Jersey, United States 08807. The table is current as of September 30, 2013.
Name and Address of Beneficial Owner | Shares Beneficially Owned Prior to this Offering | Number of Shares Being Offered | Number of Shares Subject to Option | Shares Beneficially Owned After this Offering (without Option) | Shares Beneficially Owned After this Offering (with Option) | |||||||||||||||
| Number | Percent | Number | Percent | Number | Percent | |||||||||||||||
TPG Funds(1) | 61,499,999 | 90.85 | % | |||||||||||||||||
Investor Growth Capital Funds(2) | 5,500,000 | 8.12 | % | |||||||||||||||||
Dr. Frank Verwiel(3) | 698,051 | * | ||||||||||||||||||
David Mims(4) | 423,891 | * | ||||||||||||||||||
Steve Gannon(5) | 368,326 | * | ||||||||||||||||||
John Fraher (7) | 103,000 | * | ||||||||||||||||||
Jean-Louis Anspach(8) | 63,000 | * | ||||||||||||||||||
Theresa Stevens, Esq.(9). | 100,000 | * | ||||||||||||||||||
Richard DeVleeschouwer(10) | 54,000 | * | ||||||||||||||||||
Richard E. Maroun(11) | 29,550 | * | ||||||||||||||||||
Robert Becker(14) | 53,000 | |||||||||||||||||||
Ruth Thieroff-Ekerdt(15) | 51,750 | |||||||||||||||||||
Dr. Fred Cohen(6) | 0 | — | ||||||||||||||||||
Paul Hackwell(6) | 0 | — | ||||||||||||||||||
Todd Sisitsky(6) | 0 | — | ||||||||||||||||||
Dr. David Kessler(12) | 15,750 | * | ||||||||||||||||||
Ron Labrum(13) | 22,500 | * | ||||||||||||||||||
Abhijeet J. Lele(16) | 0 | — | ||||||||||||||||||
All executive officers and directors as a group (16 people) | 1,982,818 | 2.87 | % | |||||||||||||||||
Other selling stockholders | ||||||||||||||||||||
164
Table of Contents
| * | Represents less than one percent |
| (1) | Shares shown as beneficially owned by TPG Funds (as defined below) reflect an aggregate of the following record ownership: (i) 39,948,067.80 shares held by TPG Partners V, L.P., a Delaware limited partnership, or TPG Partners V, (ii) 104,505 shares held by TPG FOF V-A, L.P., a Delaware limited partnership, or TPG FOF V-A, (iii) 84,269.20 shares held by TPG FOF V-B, L.P., a Delaware limited partnership, or TPG FOF V-B, (iv) 3,236,842 shares held by TPG Biotechnology Partners II, L.P., a Delaware limited partnership, or Biotech II (v) 5,178,947 shares held by TPG Axcan Co-Invest II, LLC, a Delaware limited liability company, or Co-Invest II and (vi) 12,947,368 shares held by TPG Axcan Co-Invest, LLC, a Delaware limited liability company, or Co-Invest and, together with TPG Partners V, TPG FOF V-A, TPG FOF V-B, Biotech II and Co-Invest II, the TPG Funds. The general partner of each of TPG Partners V, TPG FOF V-A and TPG FOF V-B is TPG GenPar V, L.P., a Delaware limited partnership, whose general partner is TPG GenPar V Advisors, LLC, a Delaware limited liability company, whose sole member is TPG Holdings I, L.P., a Delaware limited partnership, or Holdings I, whose general partner is TPG Holdings I-A, LLC, a Delaware limited liability company, whose sole member is TPG Group Holdings (SBS), L.P., a Delaware limited partnership, whose general partner is TPG Group Holdings (SBS) Advisors, Inc., a Delaware corporation, or Group Advisors. The general partner of Biotech II is TPG Biotechnology GenPar II, L.P., a Delaware limited partnership, whose general partner is TPG Biotechnology GenPar II Advisors, LLC, a Delaware limited liability company, whose sole member is Holdings I. The managing member of each of Co-Invest and Co-Invest II is TPG Advisors V, Inc., a Delaware corporation, or Advisors V. Messrs. Bonderman and Coulter are officers and sole shareholders of each of Group Advisors and Advisors V and may therefore be deemed to beneficially own the shares held by the TPG Funds. Messrs. Bonderman and Coulter disclaim beneficial ownership of the shares held by the TPG Funds except to the extent of their pecuniary interest therein. The address of the TPG Funds is c/o TPG Global, LLC, 301 Commerce Street, Suite 3300, Fort Worth, TX 76102. |
| (2) | Shares shown as beneficially owned by Investor AB, a limited liability company incorporated under the laws of Sweden and whose address is Arsenalsgatan 8c, S-103, 32 Stockholm, Sweden, reflect an aggregate of the following record ownership: (i) Invifed AB, a Swedish company and an indirectly wholly owned subsidiary of Investor AB, holds 2,450,000 shares of Common Stock; (ii) Duba AB, a Swedish company and an indirectly wholly owned subsidiary of Investor AB, holds 2,000,000 shares of Common Stock; and (iii) Investor Group LP, a Guernsey limited partnership of which Investor AB serves as the ultimate general partner, holds 1,050,000 shares of Common Stock. As a result, Investor AB possesses the sole power to vote and the sole power to direct the disposition of the shares of the Company’s Common Stock held by each of Invifed AB, Duba AB, and Investor Group LP (collectively, the “Record Owners”). Investor AB is controlled by its executive officers and directors (the “Control Persons”). Investor AB’s current Control Persons (and their present position with Investor AB) are: Jacob Wallenberg (Chairman); Sune Carlsson (Vice Chairman); Gunnar Brock (Director); Bôrje Ekholm (Director, President and CEO); Tom Johnstone (Director); Carola Lemne (Director); Grace Reksten Skaugen (Director); O. Griffith Sexton (Director); Hans Stråberg (Director); Lena Treschow Torell (Director); Peter Wallenberg, Jr. (Director); Marcus Wallenberg (Director); Josef Ackermann (Director) ; Johan Forssell (Managing Director); Petra Hedengran (Managing Director); Lennart Johansson (Managing Director); and Susanne Ekblom (Managing Director). Investor AB, the Record Owners, and each of the Control Persons disclaims beneficial ownership of the shares held by the Record Owners except to the extent of its or their pecuniary interest, if any. |
| (3) | Dr. Verwiel’s amount includes 480,000 vested options, 143,051 shares of stock from RSU settlement (net of shares withheld to pay taxes), and 75,000 shares of stock purchased by Dr. Verwiel. |
| (4) | Mr. Mims’ amount includes 307,500 vested options, 66,391 shares of stock from RSU settlement (net of shares withheld to pay taxes), and 50,000 shares of stock purchased by Mr. Mims. |
165
Table of Contents
| (5) | Mr. Gannon’s amount includes 347,686 vested options, and 20,640 shares of stock purchased by Mr. Gannon. |
| (6) | Neither Dr. Cohen, Mr. Hackwell or Mr. Sisitsky has voting power over and disclaims beneficial ownership of the shares held by the TPG Funds. The address of each of Dr. Cohen, Mr. Hackwell, and Mr. Sisitsky is c/o TPG Global, LLC, 301 Commerce Street, Suite 3300, Fort Worth, TX 76102. |
| (7) | Mr. Fraher’s amount includes 90,000 vested options and 13,000 shares of stock purchased by Mr. Fraher. |
| (8) | Mr. Anspach’s amount includes 60,000 vested options, and 3,000 shares of stock purchased by Mr. Anspach. |
| (9) | Ms. Stevens amount includes 100,000 vested options. |
| (10) | Mr. DeVleeshouwer’s amount includes 54,000 vested options. |
| (11) | Mr. Maroun’s amount includes 27,750 vested options, and 1,800 shares of stock purchased by Mr. Maroun. |
| (12) | Dr. Kessler’s amount includes 10,750 vested options and 5,000 vested RSUs. |
| (13) | Mr. Labrum’s amount includes 7,500 vested options, and 15,000 shares of stock purchased by Mr. Labrum. |
| (14) | Dr. Becker’s amount includes 45,000 vested options, and 8,000 shares of stock purchased by Dr. Becker. |
| (15) | Dr. Thieroff-Ekerdt’s amount includes 48,750 vested options, and 3,000 shares of stock purchased by Dr. Thieroff-Ekerdt. |
| (16) | Mr. Lele does not have voting power over and disclaims beneficial ownership of all shares held by the IAB entities except to the extent of his pecuniary interest therein, if any. The address of Mr. Lele is c/o Investor Growth Capital Inc., One Rockefeller Plaza, Suite 2801, New York, NY 10020. |
166
Table of Contents
DESCRIPTION OF CERTAIN INDEBTEDNESS
See “Risks Related To Our Indebtedness” in the Risk Factors section of this prospectus.
Senior Secured Credit Facilities
Overview
In connection with the Refinancing and the Recapitalization, Aptalis MidHoldings Inc., Aptalis Pharma, as the parent borrower, and Aptalis Pharma Canada Inc., as the co-borrower (together with Aptalis Pharma, the “Borrowers”), entered into a credit agreement and related security and other agreements.
The senior secured credit facilities consist of (a) a senior secured revolving credit facility allowing for borrowings of up to $150.0 million, of which $25.0 million may be in the form of letters of credit, and (b) term B loans with an outstanding principal amount as of September 30, 2013, pro forma to reflect the Refinancing of $1,250 million (excluding OID and upfront payments). The senior secured revolving credit facility includes borrowing capacity available for letters of credit and for short-term borrowings, referred to as swingline loans. An upfront fee of 50 basis points was paid on commitments under the senior secured revolving credit facility and an upfront fee of 1.00% was paid on the principal amount of the term B loans.
The Borrowers have the right to request up to (a) $100.0 million of additional commitments plus (b) an unlimited amount at any time, subject to compliance on a pro forma basis with a senior secured first lien net leverage ratio of no greater than 3.50:1.00, in each case under the senior secured credit facilities, although the lenders thereunder are not under any obligation to provide any such additional commitments and any increase in commitments is subject to certain conditions precedent.
Interest rate and fees
Borrowings under the senior secured credit facilities bear interest at a rate per annum equal to, at the Borrowers’ option, either a base rate (subject to a floor of 2.0% in the case of term B loans) or a LIBOR rate (subject to a floor of 1.0% in the case of term B loans), in each case plus an applicable margin. Subject to the floor described in the immediately preceding sentence, the base rate is determined by reference to the highest of (1) the prime rate of Bank of America, N.A., (2) the federal funds effective rate plus 1/2 of 1.0% and (3) the one-month LIBOR rate plus 1.0%. Subject to the floor described in the first sentence of this paragraph, the LIBOR rate is determined by reference to the costs of funds for U.S. dollar deposits for the interest period relevant to such borrowing adjusted for certain additional costs.
The applicable margin for borrowings of revolving loans under the senior secured revolving credit facility are subject to adjustment each fiscal quarter based on Aptalis Pharma’s senior secured net leverage ratio and range from (A) 3.50% to 3.75% per annum with respect to revolving loans that are base rate borrowings and (B) 4.50% to 4.75% per annum with respect to revolving loans that are LIBOR borrowings.
The applicable margin for borrowings of term B loans under the senior secured term loan facility are equal to 4.00% per annum with respect to base rate borrowings and 5.00% per annum with respect to LIBOR borrowings. The applicable margin on the term B loans are subject to increase pursuant to the senior secured credit facilities in connection with the making of certain refinancing, extended or replacement term loans under the senior secured credit facilities with an all-in yield greater than the applicable all-in yield payable in respect of the applicable loans at such time plus 50 basis points.
167
Table of Contents
Further, upon or after the consummation of a Qualifying IPO (as defined in the credit agreement governing the senior secured credit facilities), so long as Aptalis Pharma’s senior secured net leverage ratio does not exceed 3.25:1.00, the applicable margin with respect to term B loans and revolving loans (otherwise determined in accordance with the above) shall be reduced by 0.50%. The consummation of the sale of shares offered by this prospectus will constitute a Qualifying IPO for the purposes of the credit agreement governing our senior secured credit facilities.
In addition to paying interest on outstanding principal under the senior secured credit facilities, the Borrowers are required to pay a commitment fee of 0.50% per annum in respect of the unutilized commitments under the senior secured revolving credit facility. This commitment fee is subject to adjustment to 0.375% each fiscal quarter based on Aptalis Pharma’s senior secured net leverage ratio. The Borrowers are also required to pay customary letter of credit fees, determined by multiplying the applicable margin of LIBOR loans by the daily maximum amount then available to be drawn under such letter of credit, and agency fees, under the senior secured revolving credit facility.
We have entered into derivative financial instruments to manage the exposure from the variable interest rate changes to reduce our overall cost of borrowing. As of September 30, 2013, we had two interest rate swaps with a combined notional amount of $388.0 million and one interest rate cap with a notional amount of $100.0 million that were designated as cash flow hedges of interest rate risk. The interest rate swaps were designated as cash flow hedges of interest rate risk. The interest rate swaps fix the interest payments on the hedged debt at 2.386% for the first swap and 3.18% for the second swap, inclusive of a LIBOR floor of 1.0% (in the case of the term B loans), plus the appropriate margin on each debt interest period which is currently 5.0%. On November 8, 2013, in conjunction with the Refinancing, we terminated our existing interest rate swap and interest rate cap agreements and paid a total of $13.5 million to our derivative counterparties. We then entered into two new interest rate cap agreements with an effective date of December 31, 2013. The interest rate caps each have a notional amount of $275.0 million amortizing to $25.0 million by their maturity in December 2019. The interest rate caps are designated as cash flow hedges of interest rate risk and are designated to fix our interest payments on the hedged debt at 6.78%. Considering the interest swap and cap agreements in place on and after November 8, 2013, as at September 30, 2013, proforma to reflect the refinancing and interest rate swaps entered into on November 8, 2013 excluding the effects of the 1.0% LIBOR floor (in the case of the term B loans) on our variable rate debt, a 100 basis-point increase or decrease in interest rates would result in a $ change in our interest rate expense per year.
Mandatory repayments
The Borrowers are required to prepay outstanding term B loans under the senior secured credit facilities with (x) 100% of the net cash proceeds of any debt issued by Aptalis Pharma or its subsidiaries (with exceptions for certain debt permitted to be incurred under the senior secured credit facilities), (y) 50% (which percentage is reduced to 25% and to 0% if Aptalis Pharma’s senior secured net leverage ratio is less than or equal to 3.50:1.00 and 3.00:1.00, respectively) of Aptalis Pharma’s annual excess cash flow (as defined in the credit agreement governing the senior secured credit facilities) and (z) 100% of the net cash proceeds of all non-ordinary course asset sales, casualty events or other dispositions of property by Aptalis Pharma or its subsidiaries, subject to reinvestment rights and certain other exceptions.
Voluntary repayments
The Borrowers may voluntarily prepay outstanding loans under the senior secured credit facilities and reduce the unutilized portion of the commitment amount in respect of the senior secured revolving credit facility at any time without premium or penalty other than customary “breakage” costs with respect to LIBOR loans;provided, that if either of the Borrowers prepays or undertakes certain
168
Table of Contents
amendments to the term B loans on or prior to October 4, 2014, then the Borrowers will be required to pay to the term B lenders a fee equal to 1.0% of the aggregate principal amount of the term B loans so prepaid or, in the case of amendments, 1.0% of the aggregate principal amount of the term B loans outstanding immediately prior to such amendment.
Amortization and final maturity
The Borrowers are required to make scheduled quarterly payments under the senior secured term loan facility equal to 0.25% of the original principal amount of the term B loans, with the balance of the term B loans paid on October 4, 2020.
The principal amount outstanding of the revolving loans under the senior secured revolving credit facility is due and payable in full on October 4, 2018.
Co-Borrower, Guarantees and security
All obligations under the senior secured credit facilities are unconditionally guaranteed jointly and severally on a senior basis by Aptalis MidHoldings Inc., Aptalis Pharma (in the case of the obligations of Aptalis Pharma Canada Inc.) and certain of Aptalis Pharma’s existing and subsequently acquired or organized wholly-owned domestic subsidiaries and certain wholly-owned foreign subsidiaries (in each case, with certain agreed-upon exceptions), which are referred to herein as the “subsidiary guarantors.” In addition, Aptalis Pharma Canada Inc. acts as co-borrower under the senior secured credit facilities and is jointly and severally liable for all obligations thereunder.
All obligations under the senior secured credit facilities, and the guarantees of those obligations, will be secured, subject to certain exceptions, by substantially all of Aptalis Pharma’s assets and the assets of Aptalis MidHoldings Inc. and the subsidiary guarantors, including:
| Ÿ | A first-priority pledge of 100% of Aptalis Pharma’s capital stock and certain of the capital stock held by Aptalis Pharma or any subsidiary guarantor (which pledge, in the case of any foreign subsidiary (with certain agreed-upon exceptions) or of any domestic subsidiary that holds capital stock of a foreign subsidiary (and substantially all of the assets of such domestic subsidiary consist of capital stock and/or indebtedness of such foreign subsidiaries) and is a disregarded entity for U.S. federal income tax purposes, is limited to 65% of the voting stock of such subsidiary), in each case subject to certain agreed-upon exceptions; and |
| Ÿ | A first-priority security interest in, and mortgages on, substantially all other tangible and intangible assets of Aptalis Pharma, Aptalis MidHoldings Inc., and each subsidiary guarantor (in each case, subject to certain exceptions). |
Certain covenants and events of default
The credit agreement governing the senior secured credit facilities contains a number of covenants that, among other things and subject to certain exceptions, restrict the ability of Aptalis Pharma and its restricted subsidiaries to:
| Ÿ | incur or guarantee additional debt and issue or sell certain preferred stock; |
| Ÿ | pay dividends on, redeem or repurchase its capital stock; |
| Ÿ | make certain acquisitions or investments; |
| Ÿ | incur or assume certain liens; |
| Ÿ | enter into transactions with affiliates; |
169
Table of Contents
| Ÿ | merge or consolidate with another company; |
| Ÿ | transfer or otherwise dispose of assets; |
| Ÿ | make certain optional payments or modify certain debt instruments in respect of subordinated debt; |
| Ÿ | enter into arrangements that restrict their ability to pay dividends or other amounts; and |
| Ÿ | create or designate unrestricted subsidiaries. |
In addition, the credit agreement governing the senior secured revolving credit facility contains a “springing” financial ratio maintenance covenant, based on Aptalis Pharma’s senior secured first lien net leverage ratio, if there are outstanding borrowings in excess of 25% of the aggregate commitments thereunder (excluding letters of credit to the extent cash collateralized) as of the last day of the applicable test period. Aptalis MidHoldings Inc. is subject to a customary passive “holding company” covenant, subject to certain exceptions (including the issuance of certain debt and the public offering of stock).
The senior secured credit facilities also contain certain customary affirmative covenants and events of default, including an event of default that would result from the failure to make payment beyond any applicable grace period in respect of any indebtedness having an aggregate principal amount of not less than $25 million, the failure to observe or perform any other agreement or condition relating to any such indebtedness which results in the acceleration of, or permits the holders of such indebtedness to accelerate, the maturity of such indebtedness.
170
Table of Contents
The following are descriptions of our capital stock and material provisions of our amended and restated articles of incorporation and amended and restated bylaws as each has been amended and restated in connection with this offering. These descriptions are summaries and are qualified by reference to our amended and restated articles of incorporation and amended and restated bylaws, as well as the Stockholders Agreement, as supplemented and amended, which includes certain other provisions that materially impact the rights of our shareholders, including voting provisions and transfer restrictions. Copies of these documents will be filed with the SEC as exhibits to the registration statement of which this prospectus forms a part. The description of the capital stock reflects changes to our capital structure that will be in effect upon completion of this offering.
Authorized Capital
Upon the consummation of this offering, the total amount of our authorized capital stock will consist of shares of common stock, par value $0.001 per share and shares of preferred stock, par value $0.001 per share. As of September 30, 2013, we had 67,696,126 shares of common stock outstanding and shareholders of record.
After consummation of this offering and the use of proceeds therefrom, we expect to have shares of our common stock outstanding and shares of our preferred stock outstanding.
The following summary describes all material provisions of our capital stock. We urge you to read our certificate of incorporation and our by-laws, which are included as exhibits to the registration statement of which this prospectus forms a part.
Common Stock
Voting Rights
Each outstanding share of common stock will be entitled to one vote on all matters submitted to a vote of stockholders. Holders of shares of our common stock shall have no cumulative voting rights.
Dividend Rights
Subject to preferences that may apply to shares of preferred stock outstanding at the time, holders of outstanding shares of common stock will be entitled to receive dividends out of assets legally available at the times and in the amounts as the board of directors may from time to time determine, if any.
Preemptive Rights
Our common stock will not be entitled to preemptive or other similar subscription rights to purchase any of our securities.
Conversion or Redemption Rights
Our common stock will be neither convertible nor redeemable.
Liquidation Rights
Upon our liquidation, the holders of our common stock will be entitled to receive pro rata our assets which are legally available for distribution, after payment of all debts and other liabilities.
Listing
We intend to list our common stock on the NASDAQ under the symbol “APTA.”
171
Table of Contents
Preferred Stock
Our amended and restated articles of incorporation will grant broad authority to our Board to determine the designations, preferences, relative rights and powers, including voting powers (or qualifications, limitations or restrictions thereof), of classes or series of such preferred stock without shareholder approval. Our authorized preferred stock will be available for issuance from time to time in one or more series at the discretion of our Board without shareholder approval. Our Board will have the authority to prescribe for each series of preferred stock (1) the number of shares in that series, (2) the consideration for such shares in that series and (3) the designations, preferences, relative rights and powers, including voting powers, full or limited, or no voting power, of the shares in that series, or the qualifications, limitations or restrictions of the shares in that series.
Anti-Takeover Effects of Our Certificate of Incorporation and Our By-Laws
Our certificate of incorporation and by-laws will contain certain provisions that are intended to enhance the likelihood of continuity and stability in the composition of the board of directors and which may have the effect of delaying, deferring or preventing a future takeover or change in control of the company unless such takeover or change in control is approved by the board of directors.
These provisions include:
Classified Board. Our certificate of incorporation will provide that our board of directors will be divided into three classes of directors, with the classes as nearly equal in number as possible. As a result, approximately one-third of our board of directors will be elected each year. The classification of directors will have the effect of making it more difficult for stockholders to change the composition of our board. Our certificate of incorporation will also provide that, subject to any rights of holders of preferred stock to elect additional directors under specified circumstances and the Stockholders Agreement, the number of directors will be fixed exclusively pursuant to a resolution adopted by our board of directors. Upon completion of this offering, we expect that our board of directors will have members.
Action by Written Consent; Special Meetings of Stockholders. Our certificate of incorporation will provide that stockholder action can be taken only at an annual or special meeting of stockholders and cannot be taken by written consent in lieu of a meeting once TPG ceases to beneficially own more than 50% of our outstanding shares. Our certificate of incorporation and the by-laws will also provide that, except as otherwise required by law, special meetings of the stockholders can only be called by the chairman or vice-chairman of the board, the chief executive officer, or pursuant to a resolution adopted by a majority of the board of directors or, until the date that TPG ceases to beneficially own more than 40% of the shares owned by TPG immediately following completion of the offering, at the request of TPG. Except as described above, stockholders will not be permitted to call a special meeting or to require the board of directors to call a special meeting.
Advance Notice Procedures. Our by-laws will establish an advance notice procedure for stockholder proposals to be brought before an annual meeting of our stockholders, including proposed nominations of persons for election to the board of directors, other than directors nominated pursuant to the Stockholders Agreement. Stockholders at an annual meeting will only be able to consider proposals or nominations specified in the notice of meeting or brought before the meeting by or at the direction of the board of directors or by a stockholder who was a stockholder of record on the record date for the meeting, who is entitled to vote at the meeting and who has given our Secretary timely written notice, in proper form, of the stockholder’s intention to bring that business before the meeting.
172
Table of Contents
Although the by-laws will not give the board of directors the power to approve or disapprove stockholder nominations of candidates or proposals regarding other business to be conducted at a special or annual meeting, the by-laws may have the effect of precluding the conduct of certain business at a meeting if the proper procedures are not followed or may discourage or deter a potential acquiror from conducting a solicitation of proxies to elect its own slate of directors or otherwise attempting to obtain control of the company.
Super Majority Approval Requirements. The DGCL generally provides that the affirmative vote of a majority of the shares entitled to vote on any matter is required to amend a corporation’s certificate of incorporation or by-laws, unless either a corporation’s certificate of incorporation or by-laws requires a greater percentage. Our certificate of incorporation and by-laws will provide that the affirmative vote of holders of at least 75% of the total votes eligible to be cast in the election of directors will be required to amend, alter, change or repeal specified provisions once investment funds affiliated with TPG cease to beneficially own more than 50% of our outstanding shares. This requirement of a supermajority vote to approve amendments to our certificate of incorporation and by-laws could enable a minority of our stockholders to exercise veto power over any such amendments.
Authorized but Unissued Shares. Our authorized but unissued shares of common stock and preferred stock will be available for future issuance without stockholder approval. These additional shares may be utilized for a variety of corporate purposes, including future public offerings to raise additional capital, corporate acquisitions and employee benefit plans. The existence of authorized but unissued shares of common stock and preferred stock could render more difficult or discourage an attempt to obtain control of a majority of our common stock by means of a proxy contest, tender offer, merger or otherwise.
Exclusive Forum. Our certificate of incorporation will provide that, subject to limited exceptions, the Court of Chancery of the State of Delaware will be the sole and exclusive forum for (1) any derivative action or proceeding brought on our behalf, (2) any action asserting a claim of breach of a fiduciary duty owed by any of our directors, officers or other employees to us or our stockholders, (3) any action asserting a claim against us arising pursuant to any provision of the DGCL, our certificate of incorporation or our by-laws, or (4) any other action asserting a claim against us that is governed by the internal affairs doctrine. Any person or entity purchasing or otherwise acquiring any interest in shares of our capital stock shall be deemed to have notice of and to have consented to the provisions of our certificate of incorporation described above. Although we believe these provisions benefit us by providing increased consistency in the application of Delaware law for the specified types of actions and proceedings, the provisions may have the effect of discouraging lawsuits against our directors and officers. The enforceability of similar choice of forum provisions in other companies’ certificates of incorporation has been challenged in legal proceedings, and it is possible that, in connection with one or more actions or proceedings described above, a court could find the choice of forum provisions contained in our certificate of incorporation to be inapplicable or unenforceable.
Section 203 of the Delaware General Corporation Law
We have elected to not be subject to Section 203 of the DGCL, which regulates business combinations with “interested stockholders,” until such time as TPG is an no longer an “interested stockholder” under the DGCL.
Corporate Opportunities
Our certificate of incorporation will provide that we renounce any interest or expectancy of the Company in the business opportunities of TPG and of its officers, directors, agents, shareholders, members, partners, affiliates and subsidiaries and each such party shall not have any obligation to offer us those opportunities.
173
Table of Contents
Limitations on Liability and Indemnification of Officers and Directors
Our certificate of incorporation will limit the liability of our directors to the fullest extent permitted by the DGCL and provides that we will indemnify them to the fullest extent permitted by such law. We expect to enter into indemnification agreements with our current directors and executive officers prior to the completion of this offering and expect to enter into a similar agreement with any new directors or executive officers.
Transfer Agent and Registrar
The transfer agent and registrar for our common stock is . The transfer agent and registrar’s address is .
174
Table of Contents
SHARES ELIGIBLE FOR FUTURE SALE
Prior to this offering, there has not been a public market for our common stock, and a liquid trading market for our common stock may not develop or be sustained after this offering. Future sales of substantial amounts of common stock, including shares issued upon exercise of outstanding options, in the public market after this offering, or the possibility of these sales occurring, could adversely affect the market price of our common stock prevailing from time to time and could impair our ability to raise capital through sales of our equity securities in the future.
Upon the closing of this offering, we will have outstanding shares of common stock, or shares if the underwriters exercise in full their option to purchase additional shares, in each case assuming that there are no exercises of stock options.
Of the shares that will be outstanding immediately after the closing of this offering, the shares to be sold by us, as well as the shares to be sold by the selling stockholders, in this offering will be freely tradable without restriction or further registration under the Securities Act unless these shares are held by our “affiliates,” as that term is defined in Rule 144 under the Securities Act. The remaining shares of common stock are “restricted securities” as that term is defined under Rule 144 of the Securities Act. Of these restricted securities shares will be subject to the 180 day lock-up period described below.
Immediately following completion of this offering, shares of these restricted securities will be eligible for sale in the public market only if registered under the Securities Act or if they qualify for an exemption from registration, including under Rule 144 or 701 under the Securities Act, which exemptions are summarized below. After expiration of the 180 day lock-up period under the lock-up agreements described below, additional shares of restricted securities will be eligible for sale in the public market, subject to the same limitations described in the preceding sentence.
Rule 144. In general, under Rule 144, as currently in effect, a person who is not deemed to be our affiliate for purposes of the Securities Act or to have been one of our affiliates at any time during the three months preceding a sale and who has beneficially owned the shares of common stock proposed to be sold for at least six months, including the holding period of any prior owner other than our affiliates, is entitled to sell those shares without complying with the manner of sale, volume limitation or notice provisions of Rule 144, subject to compliance with the public information requirements of Rule 144. If such a person has beneficially owned the shares of common stock proposed to be sold for at least one year, including the holding period of any prior owner other than our affiliates, then that person is entitled to sell those shares without complying with any of the requirements of Rule 144. In general, under Rule 144, as currently in effect, our affiliates or persons selling shares of common stock on behalf of our affiliates are entitled to sell, within any three-month period, a number of shares of common stock that does not exceed the greater of (1) 1% of the number of shares of common stock then outstanding and (2) the average weekly trading volume of the common stock during the four calendar weeks preceding the filing of a notice on Form 144 with respect to that sale. Sales under Rule 144 by our affiliates or persons selling common stock on behalf of our affiliates are also subject to certain manner of sale provisions and notice requirements and to the availability of current public information about us.
Rule 701. In general, under Rule 701 of the Securities Act as currently in effect, any of our employees, consultants or advisors who purchase shares from us in connection with a compensatory stock or option plan or other written agreement in a transaction that was completed in reliance on Rule 701 and complied with the requirements of Rule 701 will be eligible to resell such shares 90 days after the effective date of this offering in reliance on Rule 144, but without compliance with certain restrictions, including the holding period, contained in Rule 144. Subject to the 180 day lock-up period described below, approximately shares of our common stock will be eligible for sale in accordance with Rule 701, excluding any shares held by our affiliates.
175
Table of Contents
Lock-up Agreements. We, all of our directors and executive officers, and substantially all of our shareholders have agreed with the underwriters that, subject to certain exceptions, without the prior written consent of our underwriters, we and they will not, during the period ending 180 days after the date of this prospectus, subject to exceptions specified in the lock-up agreements, offer, sell, contract to sell or otherwise dispose of, directly or indirectly, or hedge our common stock or securities convertible into or exchangeable for or exercisable for our common stock, sell any option or contract to purchase, purchase any option or contract to sell, grant any option, right or warrant to purchase, lend or otherwise dispose of, directly or indirectly, any shares of our common stock or any securities convertible into or exercisable for our common stock. Further, we and each such person have agreed that, during this period, they will not make any demand for, or exercise any right with respect to, the registration of our common stock or warrants or other rights to purchase the common stock. Please see “Underwriting” for additional information regarding these lock-up arrangements.
Registration Rights. Upon the closing of this offering, the holders of an aggregate of shares of our common stock will have the right to require us to register these shares under the Securities Act under specified circumstances. After registration pursuant to these rights, these shares will become freely tradable without restriction under the Securities Act. Please see “Certain Relationships and Related Party Transactions—Registration Rights Agreement” for additional information regarding these registration rights.
Stock Options. As of September 30, 2013, we had outstanding options to purchase 4,225,092 shares of common stock (of which 235,842 were penny options), of which options to purchase 2,329,992 shares were vested. Following this offering, we intend to file a registration statement on Form S-8 under the Securities Act to register all of the shares of common stock subject to outstanding options and options and other awards issuable pursuant to our stock incentive plans. Please see “Executive Compensation—Outstanding Equity Awards at Fiscal Year-End” for additional information regarding these plans. This registration statement will become effective immediately upon filing and, accordingly, shares of our common stock registered under these registration statements will be available for sale in the open market, subject to Rule 144 volume limitations applicable to affiliates, and subject to any vesting restrictions and lock-up agreements applicable to these shares.
176
Table of Contents
CERTAIN MATERIAL U.S. FEDERAL INCOME AND ESTATE TAX CONSIDERATIONS FOR
NON-U.S. HOLDERS OF SHARES OF OUR COMMON STOCK
The following is a summary of the material U.S. federal income and estate tax considerations relating to the purchase, ownership and disposition of our common stock by Non-U.S. Holders (defined below). This summary does not purport to be a complete analysis of all the potential tax considerations relevant to Non-U.S. Holders of our common stock. This summary is based upon the Internal Revenue Code, the Treasury regulations promulgated or proposed thereunder and administrative and judicial interpretations thereof, all as of the date hereof and all of which are subject to change at any time, possibly on a retroactive basis.
This summary assumes that shares of our common stock are held as “capital assets” within the meaning of Section 1221 of the Internal Revenue Code (generally, property held for investment). This summary does not purport to deal with all aspects of U.S. federal income and estate taxation that might be relevant to particular Non-U.S. Holders in light of their particular investment circumstances or status, nor does it address specific tax considerations that may be relevant to particular persons (including, for example, financial institutions, broker-dealers, insurance companies, partnerships or other pass-through entities, certain U.S. expatriates, tax-exempt organizations, pension plans, “controlled foreign corporations,” “passive foreign investment companies,” corporations that accumulate earnings to avoid U.S. federal income tax, persons in special situations, such as those who have elected to mark securities to market or those who hold common stock as part of a straddle, hedge, conversion transaction, synthetic security or other integrated investment, persons that have a “functional currency” other than the U.S. dollar, or holders subject to the alternative minimum or the unearned income Medicare contribution tax). In addition, except as explicitly addressed herein with respect to estate tax, this summary does not address estate and gift tax considerations or considerations under the tax laws of any state, local or non-U.S. jurisdiction.
For purposes of this summary, a “Non-U.S. Holder” means a beneficial owner of common stock that for U.S. federal income tax purposes is not classified as a partnership and is not:
| Ÿ | an individual who is a citizen or resident of the United States; |
| Ÿ | a corporation or any other organization taxable as a corporation for U.S. federal income tax purposes, created or organized in or under the laws of the United States, any state thereof or the District of Columbia; |
| Ÿ | an estate, the income of which is included in gross income for U.S. federal income tax purposes regardless of its source; or |
| Ÿ | a trust if (1) a U.S. court is able to exercise primary supervision over the trust’s administration and one or more U.S. persons have the authority to control all of the trust’s substantial decisions or (2) the trust has a valid election in effect under applicable U.S. Treasury regulations to be treated as a U.S. person. |
If an entity that is classified as a partnership for U.S. federal income tax purposes holds our common stock, the tax treatment of persons treated as its partners for U.S. federal income tax purposes will generally depend upon the status of the partner and the activities of the partnership. Entities that are classified as partnerships for U.S. federal income tax purposes and persons holding our common stock through such entities are urged to consult their own tax advisors.
There can be no assurance that the IRS will not challenge one or more of the tax consequences described herein, and we have not obtained, nor do we intend to obtain a ruling from the IRS with respect to the U.S. federal income or estate tax consequences to a Non-U.S. Holder of the purchase, ownership or disposition of our common stock.
177
Table of Contents
THIS SUMMARY IS FOR GENERAL INFORMATION ONLY AND IS NOT INTENDED TO BE TAX ADVICE. HOLDERS ARE URGED TO CONSULT THEIR TAX ADVISORS CONCERNING THE U.S. FEDERAL INCOME AND ESTATE TAXATION, STATE, LOCAL AND NON-U.S. TAXATION AND OTHER TAX CONSEQUENCES TO THEM OF THE PURCHASE, OWNERSHIP AND DISPOSITION OF OUR COMMON STOCK.
Distributions on Our Common Stock
As discussed under “Dividend Policy” above, we do not currently expect to pay regular dividends on our outstanding shares of common stock. In the event that we do make a distribution of cash or property with respect to our common stock, any such distributions generally will constitute dividends for U.S. federal income tax purposes to the extent of our current and accumulated earnings and profits, as determined under U.S. federal income tax principles. If a distribution exceeds our current and accumulated earnings and profits, the excess will constitute a return of capital and will first reduce the holder’s adjusted tax basis in our common stock, but not below zero. Any remaining excess will be treated as capital gain, subject to the tax treatment described below in “—Gain on Sale, Exchange or Other Taxable Disposition of Our Common Stock.” Any such distribution would also be subject to the discussion below under the section titled “—Additional Withholding and Reporting Requirements.”
Distributions treated as dividends that are paid to a Non-U.S. Holder generally will be subject to a 30% U.S. federal withholding tax unless such Non-U.S. Holder provides us or our agent, as the case may be, with the appropriate IRS Form W-8, such as:
| Ÿ | IRS Form W-8BEN (or successor form) certifying, under penalties of perjury, a reduction in withholding under an applicable income tax treaty, or |
| Ÿ | IRS Form W-8ECI (or successor form) certifying that a dividend paid on common stock is not subject to withholding tax because it is effectively connected with a trade or business in the United States of the Non-U.S. Holder (in which case such dividend generally will be subject to regular graduated U.S. tax rates as described below). |
The certification requirement described above must be provided to us or our agent prior to the payment of dividends and must be updated periodically. The certification also may require a Non-U.S. Holder that provides an IRS form or that claims treaty benefits to provide its U.S. taxpayer identification number. Special certification and other requirements apply in the case of certain Non-U.S. Holders that hold shares of our common stock through intermediaries or are pass-through entities for U.S. federal income tax purposes.
Each Non-U.S. Holder is urged to consult its own tax advisor about the specific methods for satisfying these requirements. A claim for exemption will not be valid if the person receiving the applicable form has actual knowledge or reason to know that the statements on the form are false.
If dividends are effectively connected with a trade or business in the United States of a Non-U.S. Holder (and, if required by an applicable income tax treaty, attributable to a U.S. permanent establishment), the Non-U.S. Holder, although exempt from the withholding tax described above (provided that the certifications described above are satisfied), generally will be subject to U.S. federal income tax on such dividends on a net income basis in the same manner as if it were a resident of the United States. In addition, if a Non-U.S. Holder is treated as a corporation for U.S. federal income tax purposes, the Non-U.S. Holder may be subject to an additional “branch profits tax” equal to 30% (unless reduced by an applicable income treaty) of its earnings and profits in respect of such effectively connected dividend income.
178
Table of Contents
Non-U.S. Holders that do not timely provide us or our agent with the required certification, but which are eligible for a reduced rate of U.S. federal withholding tax pursuant to an income tax treaty, may obtain a refund or credit of any excess amount withheld by timely filing an appropriate claim for refund with the IRS.
Gain on Sale, Exchange or Other Taxable Disposition of Our Common Stock
Subject to the discussion below under the section titled “—Additional Withholding and Reporting Requirements,” in general, a Non-U.S. Holder will not be subject to U.S. federal income tax or withholding tax on gain realized upon such holder’s sale, exchange or other taxable disposition of shares of our common stock unless (i) such Non-U.S. Holder is an individual who is present in the United States for 183 days or more in the taxable year of disposition, and certain other conditions are met, (ii) we are or have been a “United States real property holding corporation,” or a USRPHC, as defined in the Internal Revenue Code, at any time within the shorter of the five-year period preceding the disposition and the Non-U.S. Holder’s holding period in the shares of our common stock, and certain other requirements are met, or (iii) such gain is effectively connected with the conduct by such Non-U.S. Holder of a trade or business in the United States (and, if required by an applicable income tax treaty, is attributable to a permanent establishment maintained by such Non-U.S. Holder in the United States).
If the first exception applies, the Non-U.S. Holder generally will be subject to U.S. federal income tax at a rate of 30% (or at a reduced rate under an applicable income tax treaty) on the amount by which such Non-U.S. Holder’s capital gains allocable to U.S. sources exceed capital losses allocable to U.S. sources during the taxable year of the disposition. If the third exception applies, the Non-U.S. Holder generally will be subject to U.S. federal income tax with respect to such gain on a net income basis in the same manner as if it were a resident of the United States and a Non-U.S. Holder that is a corporation for U.S. federal income tax purposes may also be subject to a branch profits tax with respect to any earnings and profits attributable to such gain at a rate of 30% (or at a reduced rate under an applicable income tax treaty).
Generally, a corporation is a USRPHC only if the fair market value of its U.S. real property interests (as defined in the Internal Revenue Code) equals or exceeds 50% of the sum of the fair market value of its worldwide real property interests plus its other assets used or held for use in a trade or business. Although there can be no assurance in this regard, we believe that we are not, and do not anticipate becoming, a USRPHC in the future. However, because the determination of whether we are a USRPHC depends on the fair market value of our U.S. real property interests relative to the fair market value of other business assets, there can be no assurance that we will not become a USRPHC in the future. Even if we became a USRPHC, a Non-U.S. Holder would not be subject to U.S. federal income tax on a sale, exchange or other taxable disposition of our common stock by reason of our status as a USRPHC so long as our common stock is regularly traded on an established securities market at any time during the calendar year in which the disposition occurs and such Non-U.S. Holder does not own and is not deemed to own (directly, indirectly or constructively) more than 5% of our common stock at any time during the shorter of the five year period ending on the date of disposition and the holder’s holding period. However, no assurance can be provided that our common stock will be regularly traded on an established securities market for purposes of the rules described above. Prospective investors are encouraged to consult their own tax advisors regarding the possible consequences to them if we are, or were to become, a USRPHC.
Additional Withholding and Reporting Requirements
Legislation enacted in March 2010, commonly referred to as FATCA, generally will impose U.S. federal withholding at a rate of 30% on payments to certain non-U.S. entities (including certain intermediaries) of dividends on, and the gross proceeds from a sale or other disposition of our, common
179
Table of Contents
stock, unless such persons comply with a U.S. information reporting, disclosure and certification regime. This new regime may require, among other things, a broad class of persons, including “foreign financial institutions” that hold stock directly or on behalf of another person, to enter into agreements with the IRS to obtain disclose and report information about their investors and account holders or comply with the terms of an intergovernmental agreement, as applicable. This new regime and its requirements are different from and in addition to the certification requirements described elsewhere in this discussion. As currently proposed, the FATCA withholding rules would apply to dividend payments on our common stock, if any, paid after June 30, 2014, and to payments of gross proceeds from the sale or other disposition of our common stock that occurs after December 31, 2016.
Although administrative guidance and final regulations have been issued, the exact scope of these rules remains unclear and potentially subject to material changes. Prospective investors should consult their own tax advisors regarding the possible impact of these rules on their investment in our common stock, and the entities through which they hold our common stock, including, without limitation, the process and deadlines for meeting the applicable requirements to prevent the imposition of this 30% withholding tax under FATCA.
Backup Withholding and Information Reporting
We must report annually to the IRS and to each Non-U.S. Holder the gross amount of the distributions on our common stock paid to the holder and the tax withheld, if any, with respect to the distributions. Non-U.S. Holders may have to comply with specific certification procedures to establish that the holder is not a United States person (as defined in the Internal Revenue Code) in order to avoid backup withholding at the applicable rate, currently 28%, with respect to dividends on our common stock. Dividends paid to Non-U.S. Holders subject to the U.S. withholding tax, as described above under the section titled “—Distributions on Our Common Stock,” generally will be exempt from U.S. backup withholding.
Information reporting and backup withholding will generally apply to the proceeds of a disposition of our common stock by a Non-U.S. Holder effected by or through the U.S. office of any broker, U.S. or foreign, unless the holder certifies its status as a Non-U.S. Holder and satisfies certain other requirements, or otherwise establishes an exemption. Generally, information reporting and backup withholding will not apply to a payment of disposition proceeds to a Non-U.S. Holder where the transaction is effected outside the United States through a non-U.S. office of a broker. However, for information reporting purposes, dispositions effected through a non-U.S. office of a broker with substantial U.S. ownership or operations generally will be treated in a manner similar to dispositions effected through a U.S. office of a broker. Prospective investors should consult their own tax advisors regarding the application of the information reporting and backup withholding rules to them.
Copies of information returns may be made available to the tax authorities of the country in which the Non-U.S. Holder resides, or in which the Non-U.S. Holder is incorporated, under the provisions of a specific treaty or agreement.
Backup withholding is not an additional tax. Any amounts withheld under the backup withholding rules from a payment to a Non-U.S. Holder can be refunded or credited against the Non-U.S. Holder’s U.S. federal income tax liability, if any, provided that an appropriate claim is timely filed with the IRS.
Federal Estate Tax
Common stock owned (or treated as owned) by an individual who is not a citizen or a resident of the United States (as defined for U.S. federal estate tax purposes) at the time of death will be included in the individual’s gross estate for U.S. federal estate tax purposes unless an applicable estate or other tax treaty provides otherwise, and therefore, may be subject to U.S. federal estate tax.
180
Table of Contents
The Company, the selling stockholders and the underwriters named below have entered into an underwriting agreement with respect to the shares being offered. Subject to certain conditions, each underwriter has severally agreed to purchase the number of shares indicated in the following table. Goldman, Sachs & Co. and J.P. Morgan Securities LLC are the representatives of the underwriters.
Underwriters | Number of Shares | |
Goldman, Sachs & Co. | ||
J.P. Morgan Securities LLC | ||
Barclays Capital Inc. | ||
Evercore Group L.L.C. | ||
Total |
The underwriters are committed to take and pay for all of the shares being offered, if any are taken, other than the shares covered by the option described below unless and until this option is exercised.
The underwriters have an option to buy up to an additional shares from the Company and an additional an additional shares from the selling stockholders to cover sales by the underwriters of a greater number of shares than the total number set forth in the table above. They may exercise that option for 30 days. If any shares are purchased pursuant to this option, the underwriters will severally purchase shares in approximately the same proportion as set forth in the table above.
The following tables show the per share and total underwriting discounts and commissions to be paid to the underwriters by the Company and the selling stockholders. Such amounts are shown assuming both no exercise and full exercise of the underwriters’ option to purchase additional shares.
Paid by the Company
| No Exercise | Full Exercise | |||||||
Per Share | $ | $ | ||||||
Total | $ | $ | ||||||
Paid by the Selling Stockholders
| No Exercise | Full Exercise | |||||||
Per Share | $ | $ | ||||||
Total | $ | $ | ||||||
Shares sold by the underwriters to the public will initially be offered at the initial public offering price set forth on the cover of this prospectus. Any shares sold by the underwriters to securities dealers may be sold at a discount of up to $ per share from the initial public offering price. After the initial offering of the shares, the representatives may change the offering price and the other selling terms. The offering of the shares by the underwriters is subject to receipt and acceptance and subject to the underwriters’ right to reject any order in whole or in part.
The Company and its officers, directors, and holders of substantially all of the Company’s common stock, including the selling stockholders, have agreed with the underwriters, subject to certain exceptions, not to dispose of or hedge any of their common stock or securities convertible into or
181
Table of Contents
exchangeable for shares of common stock during the period from the date of this prospectus continuing through the date 180 days after the date of this prospectus, except with the prior written consent of the representatives. This agreement does not apply to any existing employee benefit plans. See “Shares Eligible for Future Sale” for a discussion of certain transfer restrictions.
Prior to the offering, there has been no public market for the shares. The initial public offering price has been negotiated among the Company and the representatives. Among the factors to be considered in determining the initial public offering price of the shares, in addition to prevailing market conditions, will be the company’s historical performance, estimates of the business potential and earnings prospects of the company, an assessment of the company’s management and the consideration of the above factors in relation to market valuation of companies in related businesses.
We intend to apply to list our common stock on the NASDAQ under the symbol “APTA.”
In connection with the offering, the underwriters may purchase and sell shares of common stock in the open market. These transactions may include short sales, stabilizing transactions and purchases to cover positions created by short sales. Short sales involve the sale by the underwriters of a greater number of shares than they are required to purchase in the offering, and a short position represents the amount of such sales that have not been covered by subsequent purchases. A “covered short position” is a short position that is not greater than the amount of additional shares for which the underwriters’ option described above may be exercised. The underwriters may cover any covered short position by either exercising their option to purchase additional shares or purchasing shares in the open market. In determining the source of shares to cover the covered short position, the underwriters will consider, among other things, the price of shares available for purchase in the open market as compared to the price at which they may purchase additional shares pursuant to the option described above. “Naked” short sales are any short sales that create a short position greater than the amount of additional shares for which the option described above may be exercised. The underwriters must cover any such naked short position by purchasing shares in the open market. A naked short position is more likely to be created if the underwriters are concerned that there may be downward pressure on the price of the common stock in the open market after pricing that could adversely affect investors who purchase in the offering. Stabilizing transactions consist of various bids for or purchases of common stock made by the underwriters in the open market prior to the completion of the offering.
The underwriters may also impose a penalty bid. This occurs when a particular underwriter repays to the underwriters a portion of the underwriting discount received by it because the representatives have repurchased shares sold by or for the account of such underwriter in stabilizing or short covering transactions.
Purchases to cover a short position and stabilizing transactions, as well as other purchases by the underwriters for their own accounts, may have the effect of preventing or retarding a decline in the market price of the company’s stock, and together with the imposition of the penalty bid, may stabilize, maintain or otherwise affect the market price of the common stock. As a result, the price of the common stock may be higher than the price that otherwise might exist in the open market. The underwriters are not required to engage in these activities and may end any of these activities at any time. These transactions may be effected on the NASDAQ, in the over-the-counter market or otherwise.
European Economic Area
In relation to each Member State of the European Economic Area which has implemented the Prospectus Directive (each, a Relevant Member State), each underwriter has represented and agreed that with effect from and including the date on which the Prospectus Directive is implemented in that
182
Table of Contents
Relevant Member State (the Relevant Implementation Date) it has not made and will not make an offer of shares to the public in that Relevant Member State prior to the publication of a prospectus in relation to the shares which has been approved by the competent authority in that Relevant Member State or, where appropriate, approved in another Relevant Member State and notified to the competent authority in that Relevant Member State, all in accordance with the Prospectus Directive, except that it may, with effect from and including the Relevant Implementation Date, make an offer of shares to the public in that Relevant Member State at any time:
| (a) | to legal entities which are qualified investors as defined in the Prospectus Directive; |
| (b) | to fewer than 100, or, if the Relevant Member State has implemented the relevant provisions of the 2010 PD Amending Directive, 150, natural or legal persons (other than qualified investors as defined in the Prospectus Directive), as permitted under the Prospectus Directive, subject to obtaining the prior consent of the representatives for any such offer; or |
| (c) | in any other circumstances falling within Article 3(2) of the Prospectus Directive, |
provided that no such offer of shares shall require the Issuer or the representative for any such offer to publish a prospectus pursuant to Article 3 of the Prospectus Directive.
For the purposes of this provision, the expression an “offer of shares to the public” in relation to any shares in any Relevant Member State means the communication in any form and by any means of sufficient information on the terms of the offer and any shares to be offered so as to enable an investor to decide to purchase or subscribe for any shares, as the same may be varied in that Relevant Member State by any measure implementing the Prospectus Directive in that Relevant Member State, the expression Prospectus Directive means Directive 2003/71/EC (and amendments thereto, including the 2010 PD Amending Directive, to the extent implemented in the Relevant Member State), and includes any relevant implementing measure in each Relevant Member State and the expression “2010 PD Amending Directive” means Directive 2010/73/EU.
United Kingdom
Each underwriter has represented, warranted and agreed that:
| (a) | it has only communicated or caused to be communicated and will only communicate or cause to be communicated an invitation or inducement to engage in investment activity (within the meaning of Section 21 of the Financial Services and Markets Act 2000 (the “FSMA”) received by it in connection with the issue or sale of the shares in circumstances in which Section 21(1) of the FSMA would not apply to the Issuer; and |
| (b) | it has complied and will comply with all applicable provisions of the FSMA with respect to anything done by it in relation to the shares in, from or otherwise involving the United Kingdom. |
Hong Kong
The shares may not be offered or sold by means of any document other than (i) in circumstances which do not constitute an offer to the public within the meaning of the Companies Ordinance (Cap.32, Laws of Hong Kong), or (ii) to “professional investors” within the meaning of the Securities and Futures Ordinance (Cap.571, Laws of Hong Kong) and any rules made thereunder, or (iii) in other circumstances which do not result in the document being a “prospectus” within the meaning of the Companies Ordinance (Cap.32, Laws of Hong Kong), and no advertisement, invitation or document relating to the shares may be issued or may be in the possession of any person for the purpose of issue (in each case whether in Hong Kong or elsewhere), which is directed at, or the contents of which
183
Table of Contents
are likely to be accessed or read by, the public in Hong Kong (except if permitted to do so under the laws of Hong Kong) other than with respect to shares which are or are intended to be disposed of only to persons outside Hong Kong or only to “professional investors” within the meaning of the Securities and Futures Ordinance (Cap. 571, Laws of Hong Kong) and any rules made thereunder.
Singapore
This prospectus has not been registered as a prospectus with the Monetary Authority of Singapore. Accordingly, this prospectus and any other document or material in connection with the offer or sale, or invitation for subscription or purchase, of the shares may not be circulated or distributed, nor may the shares be offered or sold, or be made the subject of an invitation for subscription or purchase, whether directly or indirectly, to persons in Singapore other than (i) to an institutional investor under Section 274 of the Securities and Futures Act, Chapter 289 of Singapore (the “SFA”), (ii) to a relevant person pursuant to Section 275(1), or any person pursuant to Section 275(1A), and in accordance with the conditions, specified in Section 275 of the SFA or (iii) otherwise pursuant to, and in accordance with the conditions of, any other applicable provision of the SFA.
Where the shares are subscribed or purchased under Section 275 of the SFA by a relevant person which is:
| (a) | a corporation (which is not an accredited investor (as defined in Section 4A of the SFA)) the sole business of which is to hold investments and the entire share capital of which is owned by one or more individuals, each of whom is an accredited investor; or |
| (b) | a trust (where the trustee is not an accredited investor) whose sole purpose is to hold investments and each beneficiary of the trust is an individual who is an accredited investor, |
securities (as defined in Section 239(1) of the SFA) of that corporation or the beneficiaries’ rights and interest (howsoever described) in that trust shall not be transferred within six months after that corporation or that trust has acquired the shares pursuant to an offer under Section 275 of the SFA except:
| (1) | to an institutional investor or to a relevant person defined in Section 275(2) of the SFA, or to any person arising from an offer referred to in Section 275(1A) or Section 276(4)(i)(B) of the SFA; |
| (2) | where no consideration is or will be given for the transfer; |
| (3) | where the transfer is by operation of law; |
| (4) | as specified in Section 276(7) of the SFA; or |
| (5) | as specified in Regulation 32 of the Securities and Futures (Offers of Investments) (Shares and Debentures) Regulations 2005 of Singapore. |
Japan
The securities have not been and will not be registered under the Financial Instruments and Exchange Law of Japan (the Financial Instruments and Exchange Law) and each underwriter has agreed that it will not offer or sell any securities, directly or indirectly, in Japan or to, or for the benefit of, any resident of Japan (which term as used herein means any person resident in Japan, including any corporation or other entity organized under the laws of Japan), or to others for re-offering or resale, directly or indirectly, in Japan or to a resident of Japan, except pursuant to an exemption from the registration requirements of, and otherwise in compliance with, the Financial Instruments and Exchange Law and any other applicable laws, regulations and ministerial guidelines of Japan.
184
Table of Contents
The underwriters do not expect sales to discretionary accounts to exceed five percent of the total number of shares offered.
The Company and the selling stockholders estimate that their share of the total expenses of the offering, excluding underwriting discounts and commissions, will be approximately $ .
The Company and the selling stockholders have agreed to indemnify the several underwriters against certain liabilities, including liabilities under the Securities Act.
The underwriters and their respective affiliates are full service financial institutions engaged in various activities, which may include sales and trading, commercial and investment banking, advisory, investment management, investment research, principal investment, hedging, market making, brokerage and other financial and non-financial activities and services. Certain of the underwriters and their respective affiliates have provided, and may in the future provide, a variety of these services to the issuer and to persons and entities with relationships with the issuer, for which they received or will receive customary fees and expenses. In addition, affiliates of some of the underwriters are lenders under our senior secured revolving credit facility.
In the ordinary course of their various business activities, the underwriters and their respective affiliates, officers, directors and employees may purchase, sell or hold a broad array of investments and actively trade securities, derivatives, loans, commodities, currencies, credit default swaps and other financial instruments for their own account and for the accounts of their customers, and such investment and trading activities may involve or relate to assets, securities and/or instruments of the issuer (directly, as collateral securing other obligations or otherwise) and/or persons and entities with relationships with the issuer. The underwriters and their respective affiliates may also communicate independent investment recommendations, market color or trading ideas and/or publish or express independent research views in respect of such assets, securities or instruments and may at any time hold, or recommend to clients that they should acquire, long and/or short positions in such assets, securities and instruments.
185
Table of Contents
We engaged PricewaterhouseCoopers LLP, or PWC, as our independent registered public accounting firm effective December 20, 2011. Concurrent with this appointment, we dismissed Raymond Chabot Grant Thornton LLP effective December 20, 2011. The decision to change our principal independent registered public accounting firm was approved by our audit committee.
The report of Raymond Chabot Grant Thornton LLP on our financial statements for the fiscal year ended September 30, 2011 contained no adverse opinion or disclaimer of opinion and were not qualified or modified as to uncertainty, audit scope or accounting principle. Furthermore, from October 28, 2011 through December 20, 2011, there were no disagreements with Raymond Chabot Grant Thornton LLP on any matter of accounting principles or practices, financial statement disclosure, or auditing scope or procedure, which disagreements, if not resolved to the satisfaction of Raymond Chabot Grant Thornton LLP, would have caused Raymond Chabot Grant Thornton LLP to make reference to the subject matter of the disagreements in its report on our financial statements for the fiscal year ended September 30, 2011. From October 28, 2011 through December 20, 2011, there were no “reportable events,” as defined in Item 304(a)(1)(v) of Regulation S-K.
We provided a copy of the foregoing disclosure to Raymond Chabot Grant Thornton LLP and requested that it promptly furnish the Registrant with a letter addressed to the SEC stating whether it agrees with the foregoing disclosure and, if not, stating the aspects in which it does not agree. A copy of that letter, dated November 1, 2013, has been filed as Exhibit 16.1 to the registration statement of which this prospectus forms a part.
We announced the intent to engage PWC on October 27, 2011. From October 27, 2011 through the date of our engagement of PWC, we did not consult with PWC regarding (i) the application of accounting principles to a specified transaction, either completed or proposed; or the type of audit opinion that might be rendered on our financial statements; or (ii) any matter that was either the subject of a disagreement (as that term is defined in Item 304(a)(1)(iv) of Regulation S-K and the related instructions to Item 304 of Regulation S-K) or a reportable event (as that term is defined in Item 304(a)(1)(v) of Regulation S-K).
186
Table of Contents
The validity of the issuance of the shares of common stock to be sold in this offering will be passed upon for us by Ropes & Gray LLP, Boston, Massachusetts. Cleary Gottlieb Steen & Hamilton LLP, New York, New York will act as counsel to the underwriters.
The financial statements as of and for the years ended September 30, 2013 and September 30, 2012 included in this prospectus have been so included in reliance on the report of PricewaterhouseCoopers LLP, an independent registered public accounting firm, given on the authority of said firm as experts in auditing and accounting.
The financial statements for the year ended September 30, 2011 included in this prospectus and elsewhere in the registration statement have been so included in reliance upon the report of Raymond Chabot Grant Thornton LLP, independent registered public accountants, upon the authority of said firm as experts in accounting and auditing in giving said reports.
WHERE YOU CAN FIND MORE INFORMATION
Our reports filed with the SEC are available free of charge on the SEC’s website, http://www.sec.gov, or at 100 F Street, NE, Washington, DC 20549. You may also obtain information by calling the SEC at 1-800-SEC-0330. These reports may also be accessed through, the “Investor Relations” section of the Company’s website as soon as reasonably practicable after we file or furnish such material with or to the SEC. In addition, copies of these reports will be made available free of charge, upon written request to Jim Porter, Senior Director, Communications, Aptalis Holdings Inc., 100 Somerset Corporate Boulevard, Bridgewater, NJ 08807, United States. Aptalis Holdings Inc.’s corporate office is located at 100 Somerset Corporate Boulevard, Bridgewater, NJ 08807.
We have filed with the SEC a registration statement on Form S-1 under the Securities Act with respect to the shares of our common stock being offered by this prospectus. This prospectus, which forms a part of the registration statement, does not contain all of the information set forth in the registration statement and exhibits and schedules thereto. For further information with respect to us and the shares of our common stock, reference is made to the registration statement and the exhibits and schedules filed as a part thereof. Statements contained in this prospectus as to the contents of any contract or other document are not necessarily complete. As a result of the offering of the shares of our common stock, we will become subject to the informational requirements of the Exchange Act and, in accordance therewith, will file reports and other information with the SEC. The registration statement, such reports and other information can be inspected and copied at the SEC located at 100 F Street, N.E., Washington, D.C. 20549. Copies of such materials, including copies of all or any portion of the registration statement, can be obtained from the SEC at prescribed rates. You can call the SEC at1-800-SEC-0330 to obtain information. Such materials may also be accessed electronically by means of the SEC’s website at www.sec.gov.
187
Table of Contents
APTALIS HOLDINGS INC.
Consolidated financial statements for the years ended September 30, 2013, 2012 and 2011 | ||||
| F-2 | ||||
| F-4 | ||||
| F-5 | ||||
| F-6 | ||||
| F-7 | ||||
| F-8 | ||||
| F-9 | ||||
F-1
Table of Contents
REPORT OF INDEPENDENT REGISTERED PUBLIC ACCOUNTING FIRM
To the Board of Directors and Shareholders of
Aptalis Holdings Inc.
In our opinion, the accompanying consolidated balance sheets and the related consolidated statements of operations, comprehensive income (loss), shareholders’ equity (deficit) and cash flows present fairly, in all material respects, the financial position of Aptalis Holdings Inc. and its subsidiaries (the “Company”) at September 30, 2013 and 2012, and the results of their operations and their cash flows for the years then ended in conformity with accounting principles generally accepted in the United States of America. These financial statements are the responsibility of the Company’s management. Our responsibility is to express an opinion on these financial statements based on our audits. We conducted our audits of these statements in accordance with the standards of the Public Company Accounting Oversight Board (United States). Those standards require that we plan and perform the audit to obtain reasonable assurance about whether the financial statements are free of material misstatement. An audit includes examining, on a test basis, evidence supporting the amounts and disclosures in the financial statements, assessing the accounting principles used and significant estimates made by management, and evaluating the overall financial statement presentation. We believe that our audits provide a reasonable basis for our opinion.
/s/ PricewaterhouseCoopers LLP
Florham Park, New Jersey
December 16, 2013
F-2
Table of Contents
Report of Independent Registered Public Accounting Firm
To the Board of Directors and Shareholders of
Aptalis Holdings Inc.
We have audited the accompanying consolidated statements of operations, comprehensive loss, shareholders’ deficit and cash flows of Aptalis Holdings Inc. and subsidiaries for the year ended September 30, 2011. These financial statements are the responsibility of the Company’s management. Our responsibility is to express an opinion on these financial statements based on our audit.
We conducted our audit in accordance with the standards of the Public Company Accounting Oversight Board (United States). Those standards require that we plan and perform an audit to obtain reasonable assurance about whether the financial statements are free of material misstatement. The Company is not required to have, nor were we engaged to perform an audit of its internal control over financial reporting. An audit includes consideration of internal control over financial reporting as a basis for designing audit procedures that are appropriate in the circumstances, but not for the purpose of expressing an opinion on the effectiveness of the Company’s internal control over financial reporting. Accordingly, we express no such opinion. An audit also includes examining, on a test basis, evidence supporting the amounts and disclosures in the financial statements, assessing the accounting principles used and significant estimates made by management, as well as evaluating the overall financial statement presentation. We believe that our audit provides a reasonable basis for our opinion.
In our opinion, the consolidated financial statements referred to above present fairly, in all material respects, the results of operations and cash flows of Aptalis Holdings Inc. and subsidiaries for the year ended September 30, 2011, in conformity with accounting principles generally accepted in the United States of America.
/s/ Raymond Chabot Grant Thornton LLP1
Montréal, Québec, Canada
November 30, 2011, except for Note 23 as to which the date is November 1, 2013
| 1 | CPA auditor, CA public accountancy permit no. A 105359 |
F-3
Table of Contents
Consolidated Balance Sheets
(in thousands of U.S. dollars, except share related data)
| September 30, 2013 | September 30, 2012 | Pro forma September 30, 2013 | ||||||||
| $ | $ | $ | ||||||||
| (unaudited) | ||||||||||
Assets | ||||||||||
Current assets | ||||||||||
Cash and cash equivalents | 229,903 | 115,010 | ||||||||
Accounts receivable, net (Note 8) | 86,234 | 100,747 | ||||||||
Income taxes receivable (Note 10) | 5,963 | 4,567 | ||||||||
Inventories, net (Note 9) | 61,059 | 45,297 | ||||||||
Prepaid expenses and other current assets | 9,832 | 12,974 | ||||||||
Deferred income taxes, net (Note 10) | 8,176 | 9,288 | ||||||||
|
|
|
| |||||||
Total current assets | 401,167 | 287,883 | ||||||||
Property, plant and equipment, net (Note 11) | 95,470 | 87,237 | ||||||||
Intangible assets, net (Note 12) | 589,173 | 737,375 | ||||||||
Goodwill (Note 12) | 180,058 | 178,325 | ||||||||
Deferred debt issue expenses, net of accumulated amortization of $18,959 ($12,979 as of September 30, 2012) | 22,454 | 25,984 | ||||||||
Deferred income taxes, net (Note 10) | 52,895 | — | ||||||||
|
|
|
| |||||||
Total assets | 1,341,217 | 1,316,804 | ||||||||
|
|
|
| |||||||
Liabilities | ||||||||||
Current liabilities | ||||||||||
Accounts payable and accrued liabilities (Note 13) | 188,896 | 199,485 | ||||||||
Income taxes payable (Note 10) | 10,354 | 26,527 | ||||||||
Current portion of long-term debt (Note 14) | 9,500 | 10,464 | ||||||||
Deferred income taxes, net (Note 10) | 52,895 | — | ||||||||
|
|
|
|
| ||||||
Total current liabilities | 261,645 | 236,476 | ||||||||
Long-term debt (Note 14) | 911,844 | 920,029 | ||||||||
Other long-term liabilities (Notes 4 and 6) | 56,086 | 149,105 | ||||||||
Deferred income taxes (Note 10) | 64,997 | 70,418 | ||||||||
|
|
|
|
| ||||||
Total liabilities | 1,294,572 | 1,376,028 | ||||||||
Commitments and contingencies(Note 22) | ||||||||||
Shareholders’ Equity (Deficit) | ||||||||||
Capital stock (Note 15) | ||||||||||
Common shares, par value $0.001; 100,000,000 shares authorized: 67,696,126 issued and outstanding as of September 30, 2013, 67,789,341 as at September 30, 2012, xx issued and outstanding as of September 30, 2013 pro forma (unaudited) | 67 | 67 | ||||||||
Accumulated deficit | (596,724 | ) | (683,033 | ) | ||||||
Additional paid-in capital | 691,378 | 682,246 | ||||||||
Accumulated other comprehensive loss (Note 16) | (48,076 | ) | (58,504 | ) | ||||||
|
|
|
|
| ||||||
Total shareholders’ equity (deficit) | 46,645 | (59,224 | ) | |||||||
|
|
|
|
| ||||||
Total liabilities and shareholders’ equity (deficit) | 1,341,217 | 1,316,804 | ||||||||
|
|
|
|
| ||||||
The accompanying notes are an integral part of the consolidated financial statements.
F-4
Table of Contents
APTALIS HOLDINGS INC.
Consolidated Statements of Operations
(in thousands of U.S. dollars, except share related data)
| Year Ended September 30, | ||||||||||||
| 2013 | 2012 | 2011 | ||||||||||
| $ | $ | $ | ||||||||||
Net product sales | 667,697 | 600,844 | 461,430 | |||||||||
Other revenue | 20,209 | 14,231 | 8,954 | |||||||||
|
|
|
|
|
| |||||||
Total revenue | 687,906 | 615,075 | 470,384 | |||||||||
|
|
|
|
|
| |||||||
Cost of goods sold(a) | 146,565 | 144,164 | 135,439 | |||||||||
Selling and administrative expenses(a) | 172,495 | 168,748 | 143,387 | |||||||||
Management fees (Note 21) | 7,021 | 5,675 | 3,607 | |||||||||
Research and development expenses(a) | 65,509 | 72,632 | 57,991 | |||||||||
Acquired in-process research (Note 6) | — | — | 65,540 | |||||||||
Depreciation and amortization (Note 16) | 94,762 | 101,738 | 72,829 | |||||||||
Fair value adjustments to intangible assets and contingent consideration (Notes 4 and 12) | 10,001 | (3,326 | ) | — | ||||||||
Loss (gain) on disposal of product line (Note 7) | (1,000 | ) | — | 7,365 | ||||||||
Transaction, restructuring and integration costs (Note 5) | 2,498 | 12,367 | 50,912 | |||||||||
|
|
|
|
|
| |||||||
Total operating expenses | 497,851 | 501,998 | 537,070 | |||||||||
|
|
|
|
|
| |||||||
Operating income (loss) | 190,055 | 113,077 | (66,686 | ) | ||||||||
|
|
|
|
|
| |||||||
Financial expenses (Note 16) | 68,777 | 80,128 | 89,495 | |||||||||
Loss on extinguishment of debt (Note 14) | — | 23,127 | 28,311 | |||||||||
Interest and other income | (412 | ) | (231 | ) | (461 | ) | ||||||
Loss on foreign currencies | 140 | 263 | 112 | |||||||||
|
|
|
|
|
| |||||||
Total other expenses | 68,505 | 103,287 | 117,457 | |||||||||
|
|
|
|
|
| |||||||
Income (loss) before income taxes | 121,550 | 9,790 | (184,143 | ) | ||||||||
Income tax expense (Note 10) | 34,698 | 21,791 | 7,447 | |||||||||
|
|
|
|
|
| |||||||
Net income (loss) | 86,852 | (12,001 | ) | (191,590 | ) | |||||||
|
|
|
|
|
| |||||||
Net income (loss) per share (Note 23) | ||||||||||||
Basic | $ | 1.28 | $ | (0.18 | ) | $ | (3.32 | ) | ||||
Diluted | $ | 1.26 | $ | (0.18 | ) | $ | (3.32 | ) | ||||
Weighted average shares outstanding (Note 23) | ||||||||||||
Basic | 67,987,312 | 67,699,784 | 57,742,284 | |||||||||
Diluted | 69,174,681 | 67,699,784 | 57,742,284 | |||||||||
Pro forma net income (unaudited) | $ | |||||||||||
Pro forma net earnings per share (unaudited) | ||||||||||||
Basic | $ | |||||||||||
Diluted | $ | |||||||||||
Pro forma weighted average shares outstanding (unaudited) | ||||||||||||
Basic | ||||||||||||
Diluted | ||||||||||||
| (a) | Excluding depreciation and amortization |
The accompanying notes are an integral part of the consolidated financial statements.
F-5
Table of Contents
Consolidated Statements of Comprehensive Income (Loss)
(in thousands of U.S. dollars)
| Year Ended September 30, | ||||||||||||
| 2013 | 2012 | 2011 | ||||||||||
| $ | $ | $ | ||||||||||
Net income (loss) | 86,852 | (12,001 | ) | (191,590 | ) | |||||||
Other comprehensive income (loss), net of tax: | ||||||||||||
Foreign currency translation adjustments, net of taxes of $(1,467) ($1,518 in 2012 and $577 in 2011) | 7,081 | (7,118 | ) | (164 | ) | |||||||
Fair value adjustments of hedging contracts: | ||||||||||||
Unrealized loss arising during period, net of taxes of $78 ($195 in 2012 and $519 in 2011) | (131 | ) | (7,783 | ) | (17,583 | ) | ||||||
Reclassification to earnings for realized losses, net of taxes of ($2,097) (($173) in 2012 and ($90) in 2011) (Notes 19 and 24) | 3,478 | 6,366 | 1,618 | |||||||||
|
|
|
|
|
| |||||||
Net change | 3,347 | (1,417 | ) | (15,965 | ) | |||||||
Other comprehensive income (loss) | 10,428 | (8,535 | ) | (16,129 | ) | |||||||
|
|
|
|
|
| |||||||
Comprehensive income (loss) | 97,280 | (20,536 | ) | (207,719 | ) | |||||||
|
|
|
|
|
| |||||||
The accompanying notes are an integral part of the consolidated financial statements.
F-6
Table of Contents
APTALIS HOLDINGS INC.
Consolidated Statements of Shareholders’ Equity (Deficit)
(in thousands of U.S. dollars, except share related data)
| Common Shares | Accumulated Deficit | Additional Paid-in Capital | Accumulated Other Comprehensive Loss | Total Shareholders’ Equity (Deficit) | ||||||||||||||||||||
| Shares | Amount | |||||||||||||||||||||||
| (number) | $ | $ | $ | $ | $ | |||||||||||||||||||
Balance, October 1, 2010 | 47,874,340 | 48 | (479,095 | ) | 483,432 | (33,840 | ) | (29,455 | ) | |||||||||||||||
Net loss | — | — | (191,590 | ) | — | — | (191,590 | ) | ||||||||||||||||
Other comprehensive loss | (16,129 | ) | (16,129 | ) | ||||||||||||||||||||
Shares issued for cash | 19,775,711 | 19 | — | 195,401 | — | 195,420 | ||||||||||||||||||
Buy-back of shares | (242,301 | ) | — | — | (440 | ) | — | (440 | ) | |||||||||||||||
Stock-based compensation expense | — | — | — | 2,153 | — | 2,153 | ||||||||||||||||||
Stock-based compensation on exercised options | 202,477 | — | — | (18 | ) | — | (18 | ) | ||||||||||||||||
|
|
|
|
|
|
|
|
|
|
|
| |||||||||||||
Balance, September 30, 2011 | 67,610,227 | 67 | (670,685 | ) | 680,528 | (49,969 | ) | (40,059 | ) | |||||||||||||||
|
|
|
|
|
|
|
|
|
|
|
| |||||||||||||
Balance, October 1, 2011 | 67,610,227 | 67 | (670,685 | ) | 680,528 | (49,969 | ) | (40,059 | ) | |||||||||||||||
Net loss | — | — | (12,001 | ) | — | — | (12,001 | ) | ||||||||||||||||
Other comprehensive loss | (8,535 | ) | (8,535 | ) | ||||||||||||||||||||
Investment shares issued for cash | — | — | — | 26 | — | 26 | ||||||||||||||||||
Buy-back of Investment shares | — | — | — | (507 | ) | — | (507 | ) | ||||||||||||||||
Buy-back of shares | (546,958 | ) | — | (347 | ) | (770 | ) | — | (1,117 | ) | ||||||||||||||
Stock-based compensation expense | — | — | — | 2,118 | — | 2,118 | ||||||||||||||||||
Stock-based compensation on exercised options | 726,072 | — | — | 851 | — | 851 | ||||||||||||||||||
|
|
|
|
|
|
|
|
|
|
|
| |||||||||||||
Balance, September 30, 2012 | 67,789,341 | 67 | (683,033 | ) | 682,246 | (58,504 | ) | (59,224 | ) | |||||||||||||||
|
|
|
|
|
|
|
|
|
|
|
| |||||||||||||
Balance, October 1, 2012 | 67,789,341 | 67 | (683,033 | ) | 682,246 | (58,504 | ) | (59,224 | ) | |||||||||||||||
Net income | — | — | 86,852 | — | — | 86,852 | ||||||||||||||||||
Other comprehensive income | — | — | — | — | 10,428 | 10,428 | ||||||||||||||||||
Buy-back of shares | (149,023 | ) | — | (543 | ) | (569 | ) | — | (1,112 | ) | ||||||||||||||
Stock-based compensation expense | — | — | — | 1,995 | — | 1,995 | ||||||||||||||||||
Stock-based compensation on exercised options | 54,008 | — | — | 473 | — | 473 | ||||||||||||||||||
Reclassification of stock-based compensation awards from liability to equity | — | — | — | 7,233 | — | 7,233 | ||||||||||||||||||
Shares issued for cash | 1,800 | — | — | — | — | — | ||||||||||||||||||
|
|
|
|
|
|
|
|
|
|
|
| |||||||||||||
Balance, September 30, 2013 | 67,696,126 | 67 | (596,724 | ) | 691,378 | (48,076 | ) | 46,645 | ||||||||||||||||
|
|
|
|
|
|
|
|
|
|
|
| |||||||||||||
The accompanying notes are an integral part of the consolidated financial statements.
F-7
Table of Contents
Consolidated Statements of Cash Flows
(in thousands of U.S. dollars)
| Year Ended September 30, | ||||||||||||
| 2013 | 2012 | 2011 | ||||||||||
| $ | $ | $ | ||||||||||
Cash flows from operating activities | ||||||||||||
Net income (loss) | 86,852 | (12,001 | ) | (191,590 | ) | |||||||
Adjustments to reconcile net income (loss) to cash flows from operating activities: | ||||||||||||
Accretion expenses on amounts payable for the Mpex transaction | 1,822 | 2,509 | 901 | |||||||||
Loss on extinguishment of debt | — | 6,609 | 12,492 | |||||||||
Other non-cash financial expenses | 7,302 | 6,794 | 7,846 | |||||||||
Inventory stepped-up value expensed | — | — | 19,062 | |||||||||
Depreciation and amortization | 94,762 | 101,738 | 72,829 | |||||||||
Stock-based compensation expense | 2,847 | 8,209 | 7,873 | |||||||||
Loss (gain) on disposal of product line and write-down of assets | 193 | (14 | ) | 8,807 | ||||||||
Fair value adjustments to intangible assets and contingent consideration (Note 12) | 10,001 | (3,326 | ) | — | ||||||||
Non-cash loss (gain) on foreign exchange | (116 | ) | 899 | (146 | ) | |||||||
Change in fair value of derivatives | (385 | ) | — | — | ||||||||
Deferred income taxes | (8,834 | ) | (13,338 | ) | (4,444 | ) | ||||||
Other non-cash adjustment related to PEPs withdrawal | (121 | ) | (1,760 | ) | (3,064 | ) | ||||||
Changes in assets and liabilities: | ||||||||||||
Accounts receivable | 15,630 | (26,047 | ) | (19,856 | ) | |||||||
Income taxes receivable | (1,312 | ) | (1,657 | ) | 2,566 | |||||||
Inventories | (14,461 | ) | 1,580 | 108 | ||||||||
Prepaid expenses and other current assets | 3,229 | 973 | (6,906 | ) | ||||||||
Accounts payable and accrued liabilities | 10,075 | 22,065 | 13,989 | |||||||||
Other long-term liabilities | (28,127 | ) | (27,751 | ) | 24,199 | |||||||
Income taxes payable | (16,028 | ) | 16,777 | 6,187 | ||||||||
|
|
|
|
|
| |||||||
Net cash provided by (used in) operating activities | 163,329 | 82,259 | (49,147 | ) | ||||||||
|
|
|
|
|
| |||||||
Cash flows from investing activities | ||||||||||||
Business acquisition, net of cash acquired (Note 4) | (20,000 | ) | (20,410 | ) | (525,667 | ) | ||||||
Acquisition of intangible assets | — | (1,150 | ) | (431 | ) | |||||||
Disposal of intangible assets | — | — | 3,000 | |||||||||
Acquisition of property, plant and equipment | (12,034 | ) | (15,082 | ) | (7,408 | ) | ||||||
Disposal of property, plant and equipment | 28 | 24 | 498 | |||||||||
|
|
|
|
|
| |||||||
Net cash used in investing activities | (32,006 | ) | (36,618 | ) | (530,008 | ) | ||||||
|
|
|
|
|
| |||||||
Cash flows from financing activities | ||||||||||||
Proceeds from issuance of long-term debt | — | 196,000 | 746,250 | |||||||||
Repayment of long-term debt | (10,488 | ) | (244,814 | ) | (373,522 | ) | ||||||
Deferred debt issue expenses | (2,457 | ) | (7,571 | ) | (22,963 | ) | ||||||
Payments of contingent consideration related to Rectiv | (3,138 | ) | — | — | ||||||||
Buy-back of shares | (1,112 | ) | (1,130 | ) | (1,805 | ) | ||||||
Proceeds from exercise of options | 473 | 852 | — | |||||||||
Issuance of shares | — | — | 195,420 | |||||||||
|
|
|
|
|
| |||||||
Net cash provided by (used in) financing activities | (16,722 | ) | (56,663 | ) | 543,380 | |||||||
|
|
|
|
|
| |||||||
Foreign exchange gain (loss) on cash held in foreign currencies | 292 | (846 | ) | 1,064 | ||||||||
|
|
|
|
|
| |||||||
Net increase (decrease) in cash and cash equivalents | 114,893 | (11,868 | ) | (34,711 | ) | |||||||
Cash and cash equivalents, beginning of year | 115,010 | 126,878 | 161,589 | |||||||||
|
|
|
|
|
| |||||||
Cash and cash equivalents, end of year | 229,903 | 115,010 | 126,878 | |||||||||
|
|
|
|
|
| |||||||
The accompanying notes are an integral part of the consolidated financial statements.
F-8
Table of Contents
Notes to Consolidated Financial Statements
(amounts in the tables are stated in thousands of U.S. dollars, except share related data)
| 1. | Governing Statutes, Description of Business and Basis of Presentation |
Aptalis Holdings Inc. (formerly Axcan Holdings Inc.) is a corporation incorporated on January 10, 2008, under the General Corporation Law of the State of Delaware. The corporation and its subsidiaries (together the “Company”) commenced active operations with the purchase, through a wholly owned subsidiary, on February 25, 2008 of all of the outstanding common shares of Axcan Pharma Inc., a company incorporated under the Canada Business Corporations Act. The Company provides innovative, effective therapies for unmet medical needs including cystic fibrosis and gastrointestinal disorders. The Company has manufacturing and commercial operations in the United States, the European Union and Canada. The Company also formulates and clinically develops enhanced pharmaceutical and biopharmaceutical products for itself and others using its proprietary technology platforms including bioavailability enhancement of poorly soluble drugs, custom release profiles, and taste-masking/orally disintegration tablet (ODT) formulations.
On February 11, 2011, the Company completed the acquisition of Eurand N.V. (“Eurand”) through a wholly owned subsidiary pursuant to a Share Purchase Agreement dated November 30, 2010 (as amended), resulting in Eurand becoming a subsidiary of the Company. Eurand was a specialty pharmaceutical company which was engaged in the development, manufacturing and commercialization of enhanced pharmaceutical and biopharmaceutical products based on its proprietary pharmaceutical technologies.
On December 28, 2011, the Company entered into a license agreement to acquire the exclusive rights to commercialize Rectiv (nitroglycerin) Ointment 0.4% (“Rectiv”) in the U.S. As described in Note 4, the Eurand and Rectiv transactions have been accounted for in accordance with the acquisition method of accounting for business combinations. Accordingly, the Company’s consolidated financial statements reflect the assets, liabilities and results of operations of Eurand and Rectiv from the date of acquisition.
These consolidated financial statements are prepared in accordance with accounting principles generally accepted in the United States of America (GAAP) and are presented in U.S. dollars, the reporting currency. The financial statements reflect all adjustments (including those that are normal and recurring) that are necessary for a fair presentation of the results of operations for the periods shown. Certain prior period amounts have been reclassified to conform to the current period presentation, most notably, the Company has reclassified its presentation of fair value adjustments related to contingent consideration payable relating to business combinations from financial expenses to operating expenses within its consolidated statement of operations. These reclassifications did not change net income, total or net assets or cash and were not material.
Pro Forma Financial Information
Pro Forma Balance Sheet Information
The pro forma balance sheet information has been presented to give effect to the Recapitalization, including:
| Ÿ | the adjustment of $399.5 million to accumulated earnings to reflect the distribution declared and paid after September 30, 2013 and prior to the effective date of this registration statement; |
| Ÿ | the refinancing of our previously existing senior secured credit facilities, which were replaced with new senior secured credit facilities providing for secured term loans in the amount of $1,250 million and a new senior secured revolving credit facility allowing for borrowing of up to $150 million; |
F-9
Table of Contents
APTALIS HOLDINGS INC.
Notes to Consolidated Financial Statements
(amounts in the tables are stated in thousands of U.S. dollars, except share related data)
| Ÿ | repayment of $ million of the $1,250 million outstanding under our senior secured term loan with proceeds from the offering as discussed in this prospectus, assuming an initial public offering price of $ per share, the midpoint of the price range set forth on the cover of this prospectus; and |
| Ÿ | the issuance of shares of common stocks in this offering at $ per share, the midpoint of the range set forth on the cover of this prospectus, to fund the above Recapitalization. |
Pro forma Earnings Per Share
For the purposes of the pro forma earnings per share of common stock calculations, the Company has assumed that the Recapitalization had occurred as of October 1, 2012. The basic and diluted pro forma per share of common stock calculations presented below give effect to the Recapitalization and the number of shares whose proceeds would be necessary to fund the Recapitalization in addition to historical EPS. The basic pro forma earnings per share of common stock is computed by dividing net income available to common shareholders by the pro forma weighted average number of shares of common stock outstanding during the period. The diluted pro forma earnings per share of common stock calculation also assumes the conversion, exercise or issuance of all potential shares of common stock, unless the effect of inclusion would be anti-dilutive.
Basic and Diluted pro forma earnings per share
| Year Ended September 30, 2013 | ||||
Numerator: | ||||
Net income as reported | $ | |||
Net income pro forma adjustments: | ||||
Interest expense, net of tax | ||||
Amortization of debt issuance costs and discount, net of tax | ||||
|
| |||
Pro forma net income | $ | |||
Denominator: | ||||
Weighted average common shares used in computing basic income per common share outstanding | ||||
Adjustment for common stock issued whose proceeds will be used to fund the Recapitalization | ||||
Pro forma weighted average common shares used in computing basic income per common share outstanding | ||||
|
| |||
Pro forma basic earnings per share | $ | |||
|
| |||
Weighted average common shares used in computing diluted income per common share outstanding | ||||
Adjustment for common stock issued whose proceeds will be used to fund the Recapitalization | ||||
Pro forma weighted average common shares used in computing diluted income per common share outstanding | ||||
|
| |||
Pro forma diluted earnings per share | $ | |||
|
| |||
F-10
Table of Contents
APTALIS HOLDINGS INC.
Notes to Consolidated Financial Statements
(amounts in the tables are stated in thousands of U.S. dollars, except share related data)
| 2. | Significant Accounting Policies |
Use of estimates
The preparation of financial statements in accordance with generally accepted accounting principle requires management to make estimates and assumptions that affect the recorded amounts of assets and liabilities and the disclosure of contingent assets and liabilities as at the date of the financial statements, and also affect the recognized amounts of revenues and expenses during the year. Significant estimates and assumptions made by management include those related to the fair value of acquired assets and businesses, including the fair value of contingent consideration, the changes recorded in conjunction with ceasing of distributing pancreatic enzyme products, allowances for accounts receivable, inventories, reserves for product returns, rebates, chargebacks and distribution service agreement fees, including those related to U.S. healthcare reform, the classification of intangible assets between finite life and indefinite life, the useful lives of long-lived assets, the expected cash flows used in evaluating long-lived assets, goodwill and investments for impairment, reporting unit fair values in testing goodwill for impairment, stock-based compensation costs, pending legal settlements, the establishment of provisions for income taxes including the realizability of deferred tax assets and restructuring costs. The estimates are made using the historical information and other relevant factors available to management. The Company reviews all significant estimates affecting the financial statements on a recurring basis and records the effect of any adjustments when necessary. Actual results could differ from those estimates based upon future events, which could include, among other risks, changes in regulations governing the manner in which the Company sells its products, changes in the health care environment and regulations, foreign exchange and managed care consumption patterns.
Principles of consolidation
These financial statements include the accounts of Aptalis Holdings Inc. and its wholly-owned subsidiaries, the most significant being Aptalis Pharma Canada Inc., Aptalis Pharma U.S. Inc., Aptalis Pharmatech Inc., Aptalis Pharma Srl, Aptalis Pharma Ltd. and Aptalis Pharma S.A. Intercompany balances and transactions have been eliminated on consolidation.
Revenue recognition
The Company recognizes revenue from sales of products at the time title of goods passes to the customer and the customer assumes the risks and rewards of ownership, after the product has been delivered to the customer, persuasive evidence of an arrangement with the customer exists, the products’ price is fixed or determinable, and collectability is reasonably assured. Provisions for sales discounts and estimates for chargebacks, managed care and Medicaid rebates, product returns and distribution service agreement fees are recorded as a deduction of product sales revenues at the time such revenues are recognized. These revenue deductions are established by the Company at the time of sale, based on historical experience adjusted to reflect known changes in the factors that impact such reserves such as contract changes, volume tiers being met, or changes in actual experience. In certain circumstances, returns of products are allowed under the Company’s policy and provisions are maintained accordingly. These revenue deductions are generally reflected as an addition to accrued liabilities. Amounts received from customers as prepayments for products to be shipped in the future are reported as deferred revenue and classified in accounts payable and accrued expenses.
The Company presents, on a net basis, taxes collected from customers and remitted to governmental authorities; that is, they are excluded from revenues.
F-11
Table of Contents
APTALIS HOLDINGS INC.
Notes to Consolidated Financial Statements
(amounts in the tables are stated in thousands of U.S. dollars, except share related data)
Other revenue, which includes revenue from collaborative agreements, consists primarily of payments for research and development services, up-front fees, milestone payments and royalty payments. The Company enters into arrangements for the license, research and development, manufacture and/or commercialization/supply of products and product candidates utilizing the Company’s technology platforms. Non-refundable up-front license fees where continuing involvement is required of the Company are deferred and recognized in revenue over the related performance period. The Company estimates its performance period based on the specific terms of each agreement, and adjusts the performance periods, if appropriate, based on the applicable facts and circumstances. Periodic payments are recognized as revenue over the period and proportionate to the performance of the related activities under the terms of the agreements. The Company immediately recognizes the full amount of developmental milestone payments due to us upon the achievement of the milestone event if the event is substantive, objectively determinable, and represents an important point in the development life cycle of the product. Payments for achieving milestones which are not considered substantive are deferred and recognized in revenue over the related performance period. Such payments have not been material in the periods presented.
Royalty revenue from licensees are based on third party sales of licensed products, and recognized as earned in accordance with the contract terms when third party sales can be reliably measured and collection is reasonably assured.
Amounts recognized under collaborative arrangements consisted of the following:
| Year Ended September 30, | ||||||||||||
| 2013 | 2012 | 2011 | ||||||||||
| $ | $ | $ | ||||||||||
Net product sales | 4,804 | 4,528 | 3,782 | |||||||||
Other revenue | 10,836 | 8,744 | 4,784 | |||||||||
|
|
|
|
|
| |||||||
Total | 15,640 | 13,272 | 8,566 | |||||||||
|
|
|
|
|
| |||||||
Business and asset acquisitions
The consolidated financial statements include the operations of an acquired business after the completion of the acquisition. Acquired businesses are accounted for using the acquisition method of accounting, which requires that assets acquired and liabilities assumed be recorded at the date of acquisition at their fair values. Any excess of the purchase price over the fair value of the net assets acquired is recorded as goodwill. If the acquired net assets do not constitute a business, the transaction is accounted for as an asset acquisition and no goodwill is recognized.
Contingent consideration payable for an acquired business, if any, is included as part of the acquisition cost and is recognized at fair value as of the acquisition date. Any liability resulting from contingent consideration is remeasured to fair value at each reporting date until the contingency is resolved. These changes in fair value are recognized in operating income. Contingent consideration payable in an asset acquisition, if any, is recognized as a charge to operating income in the period incurred.
F-12
Table of Contents
APTALIS HOLDINGS INC.
Notes to Consolidated Financial Statements
(amounts in the tables are stated in thousands of U.S. dollars, except share related data)
Cash and cash equivalents
Cash and cash equivalents consist of U.S. Treasury backed securities, bank deposits, time deposits and money market funds. Cash equivalents are primarily highly liquid short-term investments with maturities of three months or less at the time of purchase and are recorded at cost, which approximates fair value.
Accounts receivable
The majority of the Company’s accounts receivable is due from companies in the pharmaceutical industry including major U.S. wholesalers of pharmaceutical products. Credit is extended based on an evaluation of a customer’s financial condition and, generally, collateral is not required. Accounts receivable are generally due within 30 to 60 days and are stated at amounts due from customers net of an allowance for doubtful accounts. Accounts outstanding longer than the contractual payment terms are considered past due. The Company determines its allowance by considering a number of factors, including the length of time trade accounts receivable are past due, the Company’s previous loss history, the customer’s current ability to pay its obligation to the Company and the condition of the general economy and the industry as a whole. The Company writes off accounts receivable when they become uncollectible and payments subsequently received on such receivables are credited to bad debt expense.
Inventory valuation
Inventories of raw materials and packaging material are valued at the lower of cost and replacement cost. Inventories of work in progress and finished goods are valued at the lower of cost and net realizable value. Cost is determined by the first-in, first-out method. Cost for work in progress and finished goods include raw materials, direct labor, subcontracts and an allocation for overhead. Allowances are maintained for slow-moving inventories based on the remaining shelf life of products and estimated time required to sell such inventories. Obsolete inventory and rejected products are written-off to cost of goods sold.
Inventory costs associated with products that have not yet received regulatory approval are capitalized if the Company believes there is probable future commercial use and future economic benefit. If future commercial use and future economic benefit are not considered probable, then costs associated with pre-launch inventory that has not yet received regulatory approval are expensed as research and development expense during the period the costs are incurred. The Company could be required to expense previously capitalized costs related to pre-approval inventory if the probability of future commercial use and future economic benefit changes due to denial or delay of regulatory approval, a delay in commercialization, or other factors.
Research and development
Research and development (“R&D”) expenses are expensed as incurred. These expenses include the costs of our proprietary R&D efforts, as well as costs incurred in connection with certain co-development contracts. Upfront and milestone payments made to third parties in connection with agreements with third parties (or research and development collaborations) are expensed as incurred up to the point of regulatory approval, in the absence of an alternative future use. Payments made to third parties subsequent to regulatory approval are capitalized and amortized over the remaining useful life of the related product. Amounts capitalized for such payments are included in intangible assets.
F-13
Table of Contents
APTALIS HOLDINGS INC.
Notes to Consolidated Financial Statements
(amounts in the tables are stated in thousands of U.S. dollars, except share related data)
In-process research and development
In-process research and development (“IPR&D”) represents the fair value assigned to incomplete research and development projects acquired in a business combination or asset acquisition which, at the time of acquisition, are determined to have no alternative future use. The fair value of IPR&D projects acquired in a business combination are capitalized as indefinite lived intangible assets, subject to impairment testing until completion or abandonment of the projects. Conversely, the fair value of IPR&D projects acquired as part of an asset acquisition is expensed on acquisition.
Depreciation and amortization
Property, plant and equipment and intangible assets with a finite life are reported at acquisition cost, less accumulated depreciation and amortization, and are generally depreciated or amortized over their estimated useful lives according to the straight-line method over the following periods:
Buildings | 10 to 36 years | |||
Machinery, equipment and office furnishings | 3 to 10 years | |||
Automotive equipment | 2 to 5 years | |||
Computer equipment and software | 1 to 7 years | |||
Leasehold improvements | 3 to 10 years | |||
Trademarks, trademark licenses, manufacturing rights and other | 5 to 20 years |
Impairment of long lived-assets and goodwill
The value of goodwill and intangible assets with an indefinite life are subject to an annual impairment test. Indefinite-life intangible assets and goodwill are tested for impairment more often, when events or changes in circumstances indicate that the carrying amounts of these assets may not be recoverable.
The intangible assets with a finite life and property, plant and equipment are subject to an impairment test whenever events or changes in circumstances indicate that the carrying amounts of these assets may not be recoverable. The Company compares the carrying value of the unamortized portion of property, plant and equipment and intangible assets with a finite life to estimated future undiscounted cash flows. If the carrying value exceeds the estimated undiscounted future cash flows, an impairment exists. An impairment loss measured as the excess of the carrying value over the fair value, based on the related estimated discounted future cash flows, is recorded in earnings and the cost basis is adjusted.
During the fourth quarter of fiscal 2011, the Company early adopted the recently issued guidance on annual testing of goodwill for impairment which gives entities the option to first assess qualitative factors to determine whether it is necessary to perform the two-step quantitative goodwill impairment test. The Company tests goodwill for impairment at a reporting unit level by first assessing a range of qualitative factors, including but not limited to macroeconomic conditions, industry conditions, the competitive environment, changes in the market for the Company’s products, regulatory and political developments, entity specific factors such as strategy and changes in key personnel, and overall financial performance. If after completing this assessment, it is determined that it is more likely than not that the fair value of a reporting unit is less than its carrying value, the Company proceeds to a two-step impairment testing process. Step one consists of a comparison of the fair value of a reporting unit with its carrying amount, including the goodwill allocated to the reporting unit. Measurement of the fair
F-14
Table of Contents
APTALIS HOLDINGS INC.
Notes to Consolidated Financial Statements
(amounts in the tables are stated in thousands of U.S. dollars, except share related data)
value of a reporting unit may be based on one or more fair value measures including present value technique of estimated future cash flows and estimated amounts at which the unit as a whole could be bought or sold in a current transaction between willing parties. If the carrying amount of the reporting unit exceeds the fair value, step two requires the fair value of the reporting unit to be allocated to the underlying tangible and intangible assets and liabilities of that reporting unit, resulting in an implied fair value of goodwill. If the carrying amount of the goodwill of the reporting unit exceeds the implied fair value of that goodwill, an impairment loss equal to the excess is recorded in earnings.
In the fiscal fourth quarter, the Company conducted a qualitative assessment for its annual goodwill impairment test for the years ended September 30, 2013 and 2012, noting no impairment. As further disclosed in Note 12, the Company impaired its Rectiv and Lamictal intangible assets in the fourth quarter of the fiscal year ended September 30, 2013.
Income taxes
Income taxes are calculated using the asset and liability method. Under this method, deferred income tax assets and liabilities are recognized to account for the estimated taxes that will result from the recovery or settlement of assets and liabilities recorded at their financial statement carrying amounts. Deferred income tax assets and liabilities are measured based on enacted tax rates and laws at the date of the financial statements for the years in which the temporary differences are expected to reverse. A valuation allowance is provided for the portion of deferred tax assets that is more likely than not to remain unrealized. Adjustments to the deferred income tax asset and liability balances are recognized in net income as they occur.
The Company conducts business in various countries throughout the world and is subject to tax in numerous jurisdictions. As a result of its business activities, the Company files a significant number of tax returns that are subject to examination by various federal, state and local tax authorities. Tax examinations are often complex as tax authorities may disagree with the treatment of items reported by the Company and this may require several years to resolve.
Selling and administrative expenses
Selling and administrative expenses include shipping and handling expenses, other than distribution service agreement fees, costs of marketing, advertising, information technology and the associated employee compensation. Distribution service agreement fees are deducted from revenue. Advertising costs are expensed as incurred.
Restructuring costs
The Company incurs restructuring charges in connection with acquisitions when it implements plans to restructure and integrate the acquired operations or in connection with cost-reduction initiatives that are initiated from time to time. Termination costs are a significant component of restructuring costs and are generally recorded when the actions are probable and estimable. Costs for one-time termination benefits in which the employee is required to render service until termination in order to receive the benefits are recognized ratably over the future service period.
F-15
Table of Contents
APTALIS HOLDINGS INC.
Notes to Consolidated Financial Statements
(amounts in the tables are stated in thousands of U.S. dollars, except share related data)
Foreign currency translation
The Company has operations in the United States of America, Canada and some European Union countries, the most significant of which are France, Italy and Ireland. For foreign subsidiaries where the local currencies have been determined to be the functional currency, the net assets of these subsidiaries are translated into U.S. dollars for consolidation purposes using the current rate method. Assets and liabilities are translated at the rate of exchange prevailing on the balance sheet date and revenues and expenses are translated using the average exchange rate for the period. The resulting gains and losses arising from the translation of the financial statements of subsidiaries are deferred in a cumulative foreign currency translation adjustments account reported as a component of Other comprehensive income (loss) in the Consolidated Statements of Comprehensive Income (Loss).
Deferred debt issue expenses
Financing costs incurred in connection with the issuance of debt are deferred and included in deferred debt issue expenses on the Consolidated Balance Sheets and are presented net of amortization. These financing costs are being expensed over the terms of the respective debt using the effective interest method and included in financial expenses in the Consolidated Statements of Operations.
Fair value measurements
As summarized on Note 20, Fair Value Measurements, the Company recognizes and measures certain financial costs and liabilities on a fair value basis. Fair value is defined as the exchange price that would be received for an asset or paid to transfer a liability (an exit price) in the principal or most advantageous market for the asset or liability in an orderly transaction between market participants on the measurement date. The guidance also establishes a fair value hierarchy which requires an entity to maximize the use of observable inputs and minimize the use of unobservable inputs when measuring fair value. The guidance describes three levels of inputs that may be used to measure fair value:
Level 1—Quoted prices in active markets for identical assets or liabilities.
The Company has not used any level 1 measurement to prepare these financial statements.
Level 2—Observable inputs other than Level 1 prices, such as quoted prices for similar assets or liabilities; or other inputs that are observable or can be corroborated by observable market data for substantially the full term of the assets or liabilities.
Level 2 derivative instruments are valued using an Overnight Indexed Swap (OIS) discount curve, the London Interbank Offered Rate (LIBOR) forward curve and volatility surface.
Level 3—Inputs that are unobservable and significant to the overall fair value measurement.
The Company uses level 3 measurements, which consist primarily of present value probability weighted cash flow projections and other relevant valuation techniques.
If the inputs used to measure the financial assets and financial liabilities fall within the different levels described above, the categorization is based on the lowest level input that is significant to the fair value measurement of the instrument.
F-16
Table of Contents
APTALIS HOLDINGS INC.
Notes to Consolidated Financial Statements
(amounts in the tables are stated in thousands of U.S. dollars, except share related data)
Derivative instruments and hedging activities
The Company formally documents all relationships between hedging instruments and hedged items contemporaneously, as well as its risk management objective and strategy for undertaking various hedge transactions.
The Company records all derivatives on the balance sheets at fair value. Derivative instruments are recorded as assets or liabilities, depending on the Company’s rights or obligations under the applicable derivative contract. The accounting for changes in the fair value of derivatives depends on the intended use of the derivatives, whether the Company has elected to designate a derivative in a hedging relationship and apply hedge accounting and whether the hedging relationship has satisfied the criteria necessary to apply hedge accounting. Derivatives designated and qualifying as a hedge of the exposure to changes in the fair value of an asset, liability, or firm commitment attributable to a particular risk, such as interest rate risk, are considered fair value hedges. Derivatives designated and qualifying as a hedge of the exposure to variability in expected future cash flows, or other types of forecasted transactions, are considered cash flow hedges. Hedge accounting generally provides for the matching of the timing of gain or loss recognition on the hedging instrument with the recognition of the changes in the fair value of the hedged asset or liability that are attributable to the hedged risk in a fair value hedge or the earnings effect of the hedged forecasted transactions in a cash flow hedge. The Company may enter into derivative contracts that are intended to economically hedge certain of its risk, even though hedge accounting does not apply or the Company elects not to apply hedge accounting.
The Company has designated its interest rate swaps and interest rate cap as cash flow hedges of interest rate risk (Note 19). On an ongoing basis, the Company assesses whether each derivative continues to be highly effective in offsetting changes in the cash flows of hedged items. Hedge ineffectiveness, if any, is immediately recognized in earnings.
Stock incentive plans
The Company recognizes stock-based compensation expense related to stock options granted to employees and directors for their services on the Board of Directors based on the estimated fair value of each stock option on the date of grant, net of estimated forfeitures, using the Black-Scholes option-pricing model for service-based options and the Monte Carlo simulation model for performance based options. The grant date fair value of awards subject to service-based vesting, net of estimated forfeitures, is recognized on a straight-line basis over the requisite service period, which is generally the vesting period of the respective awards. All stock-based awards are approved by the Board of Directors prior to the grant.
Net income per share
Basic income (loss) per share is computed by dividing net income (loss) available to common shareholders by the weighted average number of common shares outstanding for the period. Diluted income per share reflects the potential dilution that could occur if stock options and restricted stock units granted under the Company’s stock compensation plans were exercised or converted into common stock using the treasury stock method.
| 3. | Recently Issued Accounting Standards |
In July 2013, the Financial Accounting Standards Board (“FASB”) issued a clarification regarding the presentation of an unrecognized tax benefit related to a net operating loss carryforward, a similar
F-17
Table of Contents
APTALIS HOLDINGS INC.
Notes to Consolidated Financial Statements
(amounts in the tables are stated in thousands of U.S. dollars, except share related data)
tax loss or a tax credit carryforward. Under this new standard, the liability related to an unrecognized tax benefit, or a portion thereof, should be presented in the financial statements as a reduction to a deferred tax asset if available under the tax law of the applicable jurisdiction to settle any additional income taxes that would result from the disallowance of a tax position. Otherwise, the unrecognized tax benefit should be presented in the financial statements as a separate liability. The assessment is based on the unrecognized tax benefit and deferred tax asset that exist at the reporting date. The amendments in this Update are effective for fiscal years, and interim periods within those years, beginning after December 15, 2013. Early adoption is permitted. While we are still determining the impact of this standard on the presentation of both our deferred tax assets and income taxes payable.
In July 2013, the FASB issued guidance that permits the Fed Funds Effective Swap Rate to be used as a U.S. benchmark interest rate for hedge accounting purposes, in addition to the United States Treasury rate and London Interbank Offered Rate (“LIBOR”). In addition, the restriction on using different benchmark rates for similar hedges is removed. The provisions of this guidance are effective prospectively for qualifying new or redesignated hedging relationships entered into on or after July 17, 2013. The adoption of this guidance is not expected to have a material impact on the Company’s consolidated financial statements.
In March 2013, the FASB issued guidance on foreign currency matters on parent’s accounting for the cumulative translation adjustment upon derecognition of certain subsidiaries or groups of assets within a foreign entity or of an investment in a foreign entity. This amendment clarifies the timing of release of currency translation adjustments from accumulated other comprehensive income upon deconsolidation or derecognition of a foreign entity, subsidiary or a group of assets within a foreign entity and in step acquisitions. This guidance is effective prospectively for reporting periods beginning after December 15, 2013, with early adoption permitted. The adoption of this guidance is not expected to have a material impact on the Company’s consolidated financial statements.
In February 2013, the FASB issued guidance on the recognition, measurement and disclosure of obligations resulting from joint and several liability arrangements for which the total amount of the obligation within the scope of this guidance is fixed at the reporting date. The guidance requires an entity to measure those obligations as the sum of the amount the reporting entity agreed to pay on the basis of its arrangement among its co-obligors as well as any additional amount the reporting entity expects to pay on behalf of its co-obligors. This guidance also requires an entity to disclose the nature and amount of those obligations. These amendments are effective for reporting periods beginning after December 15, 2013, with early adoption permitted. Retrospective application is required. The adoption of this guidance is not expected to have a material impact on the Company’s consolidated financial statements.
In February 2013, the FASB issued guidance on presentation of comprehensive income and requires an entity to present, either on the face of the financial statement or in the notes, the effects of significant amounts reclassified out of accumulated other comprehensive income on the respective line items of net income and to cross-reference to other required disclosures, where applicable. These disclosure requirements are effective for reporting periods beginning after December 15, 2012, with early adoption permitted. The adoption of this guidance will require enhanced disclosures and is not expected to have a material impact on the Company’s consolidated financial statements.
In January 2013, the FASB issued guidance that limits the scope of existing disclosure requirements about offsetting assets and liabilities to derivatives, repurchase agreements, and securities borrowings and securities lending transactions that are either offset in the financial
F-18
Table of Contents
APTALIS HOLDINGS INC.
Notes to Consolidated Financial Statements
(amounts in the tables are stated in thousands of U.S. dollars, except share related data)
statements or subject to an enforceable master netting arrangement or similar agreement. These amendments are effective for fiscal years beginning on or after January 1, 2013, and interim periods within those annual periods. Retrospective application is required. The adoption of this guidance will require enhanced disclosures and is not expected to have a material impact on the Company’s consolidated financial statements.
In July 2012, the FASB issued guidance to simplify how entities test indefinite-lived intangible assets other than goodwill for impairment. After an assessment of certain qualitative factors, if it is determined to be more likely than not that an indefinite-lived asset is impaired, entities must perform the quantitative impairment test. Otherwise, the quantitative test is optional. The amended guidance is effective for annual and interim impairment tests performed for fiscal years beginning after September 15, 2012, with early adoption permitted. The adoption of this guidance has not had a material impact on the Company’s consolidated financial statements.
In September 2011, the FASB amended the existing guidance on the annual testing of goodwill for impairment. The amended guidance gives an entity the option to first assess qualitative factors to determine whether it is necessary to perform the two-step quantitative goodwill impairment test. An entity no longer will be required to calculate the fair value of a reporting unit unless the entity determines, based on a qualitative assessment, that it is more likely than not that its fair value is less than its carrying amount. This new guidance is effective for annual and interim goodwill impairment tests performed for fiscal years beginning after December 15, 2011 with early adoption permitted. The Company has early adopted this new guidance in connection with the performance of its annual goodwill impairment test for fiscal year ended September 30, 2011.
In June 2011, the FASB issued new guidance on the presentation of comprehensive income. The new guidance allows an entity two options to present the components of net income and other comprehensive income: (1) in a single continuous financial statement, the statement of comprehensive income or (2) in two separate but consecutive financial statements, consisting of an income statement followed by a separate statement of other comprehensive income. The new guidance eliminated the option to report other comprehensive income and its components in the statement of changes in deficit. In December 2011, the FASB issued an amendment to indefinitely defer the specific requirement to present reclassification adjustments out of accumulated other comprehensive income by component in both the statement in which net income is presented and the statement in which other comprehensive income is presented. During the deferral period, the existing requirements in GAAP for the presentation of reclassification adjustments must continue to be followed. All other provisions of this new guidance require retrospective application and are effective for fiscal years, and interim periods within those years, beginning after December 15, 2011. The adoption of this guidance changes the Company’s presentation of other comprehensive income (loss), which has been historically presented as part of the consolidated statement of shareholders’ equity (deficit).
In May 2011, the FASB issued new guidance to achieve common fair value measurement and disclosure requirements between GAAP and International Financial Reporting Standards (“IFRS”). Additional disclosure requirements include: (1) for Level 3 fair value measurements, quantitative information about unobservable inputs used, a description of the valuation processes used by the entity, and a qualitative discussion about the sensitivity of the measurements to changes in the unobservable inputs; (2) for an entity’s use of a non-financial asset that is different from the asset’s highest and best use, the reason for the difference; (3) for financial instruments not measured at fair value but for which disclosure of fair value is required, the fair value hierarchy level in which the fair value measurements were determined; and (4) the disclosure of all transfers between Level 1 and
F-19
Table of Contents
APTALIS HOLDINGS INC.
Notes to Consolidated Financial Statements
(amounts in the tables are stated in thousands of U.S. dollars, except share related data)
Level 2 of the fair value hierarchy. This new guidance is effective for annual and interim periods beginning after December 15, 2011. The adoption of this guidance did not have a material impact on the Company’s consolidated financial statements.
| 4. | Business Combinations |
Acquisition of Eurand N.V. (“Eurand”)
Description of the transaction
On February 11, 2011 (or the “Acquisition Date”), the Company and Axcan Pharma Holding B.V. (“Axcan AcquisitionCo”), a subsidiary of the Company, pursuant to a Share Purchase Agreement dated November 30, 2010 (as amended) acquired the outstanding equity of Eurand N.V. (“Eurand”) for total cash consideration of approximately $589,555,000. As a result of the acquisition, Eurand has become a subsidiary of the Company. Prior to the transaction, Eurand was a specialty pharmaceutical company that developed, manufactured and commercialized enhanced pharmaceutical and biopharmaceutical products based on its proprietary pharmaceutical technologies. Its technology platforms include bioavailability enhancement of poorly soluble drugs, custom release profiles and taste-masking/orally disintegrating tablet (ODT) formulations. Eurand was a global company with facilities in the U.S. and Europe. The acquisition of Eurand enables the Company to leverage the combination of two leading specialty pharmaceutical players, expand its gastroenterology product portfolio and provide the Company with a proprietary R&D growth engine and technology platforms supported by an extensive patent portfolio to meaningfully diversify its business and expand its geographic and manufacturing footprint.
Fair value of consideration transferred
The table below details the consideration transferred to acquire Eurand:
| Conversion Calculation | Fair Value | Form of Consideration | ||||||||||
| $ | ||||||||||||
Eurand common stock outstanding as of acquisition date | 48,359,433 | 580,313 | Cash | |||||||||
Multiplied by cash consideration per common share outstanding | 12.00 | |||||||||||
Eurand stock options canceled for a cash payment(a) | 9,242 | Cash | ||||||||||
|
| |||||||||||
Total fair value of consideration transferred | 589,555 | |||||||||||
|
| |||||||||||
| (a) | Each Eurand stock option, whether or not vested and exercisable on the acquisition date, was canceled for a cash payment equal to the excess of the per share value of the acquisition consideration over the per share exercise price of the Eurand stock option. |
The aggregate equity purchase price of $589,555,000 plus acquisition costs (including related fees and expenses) were funded by cash equity contributions amounting to $140,000,000 from affiliates of TPG Capital L.P. and certain co-investors, the proceeds from the borrowings under the Company’s amended and restated credit agreement and related security and other agreements and cash on hand from the Company and Eurand.
The Company borrowed $500,000,000 of the amount available under the term loan facility under the amended and restated credit agreement at the closing of the acquisition. A portion of the proceeds of the equity and debt financings, together with cash on hand of the Company and Eurand, were also
F-20
Table of Contents
APTALIS HOLDINGS INC.
Notes to Consolidated Financial Statements
(amounts in the tables are stated in thousands of U.S. dollars, except share related data)
used to repay the outstanding term loan portion amounting to $125,660,000 of the Company’s prior senior secured credit facilities and to pay related fees and expenses. The remaining amount of $250,000,000 of the term loan facility was used on March 15, 2011 to redeem 100% of the Company’s existing 9.25% senior secured notes due 2015.
Basis of presentation
The transaction has been accounted for in accordance with the acquisition method of accounting for business combinations under existing GAAP. The acquisition method of accounting requires, among other things, that assets acquired and liabilities assumed be recognized at their fair values as of the acquisition date including acquired in-process research and development assets.
Assets acquired and liabilities assumed
The following table summarizes the fair values of the assets acquired and liabilities assumed as of the acquisition date.
| Book value | Step-up to fair value | Amounts recognized as of acquisition date | ||||||||||
| $ | $ | $ | ||||||||||
Cash and cash equivalents | 63,888 | — | 63,888 | |||||||||
Accounts receivable(a) | 22,662 | — | 22,662 | |||||||||
Inventories(b) | 25,465 | 18,727 | 44,192 | |||||||||
Other current assets(c) | 6,552 | — | 6,552 | |||||||||
Property, plant and equipment | 44,652 | 10,874 | 55,526 | |||||||||
Identifiable intangible assets(d) | 7,053 | 406,876 | 413,929 | |||||||||
Current liabilities(e) | (51,960 | ) | — | (51,960 | ) | |||||||
Long-term debt, including current portion | (3,394 | ) | — | (3,394 | ) | |||||||
Deferred income taxes liabilities, net(f) | (237 | ) | (61,012 | ) | (61,249 | ) | ||||||
Other non-current liabilities | (8,489 | ) | 2,278 | (6,211 | ) | |||||||
|
|
|
|
|
| |||||||
Total identifiable net assets | 106,192 | 377,743 | 483,935 | |||||||||
Goodwill(g) | 37,540 | 68,977 | 106,517 | |||||||||
|
|
|
|
|
| |||||||
Net assets acquired | 143,732 | 446,720 | 590,452 | |||||||||
|
|
|
|
|
| |||||||
Effective settlement of pre-existing relationships(h) | (897 | ) | ||||||||||
|
| |||||||||||
Total fair value of consideration transferred | 589,555 | |||||||||||
|
| |||||||||||
| (a) | As of the Acquisition Date, the fair value of accounts receivable acquired approximated book value. The gross contractual amount receivable was $23,118,000 of which $456,000 was not expected to be collected. |
| (b) | Reflects the adjustment to step-up the carrying value of inventory acquired by $18,727,000 to estimated fair value as of February 11, 2011. The stepped-up value is recorded as a charge to cost of goods sold as acquired inventory is sold. |
| (c) | Includes prepaid assets and income tax receivable. |
| (d) | Identifiable intangible assets comprise trademarks, trademark licenses, manufacturing rights and other intangible assets with a finite life with weighted average useful lives of 17.04 years. The estimated aggregate amortization expense for the five succeeding years will be $25,599,000 |
F-21
Table of Contents
APTALIS HOLDINGS INC.
Notes to Consolidated Financial Statements
(amounts in the tables are stated in thousands of U.S. dollars, except share related data)
annually. The Company determined the useful lives for amortizing the Eurand intangible assets acquired based on Management’s best estimates of the economic useful lives of the related assets, which in turn were based on consideration of various factors including: patent expiration; the existence and significance of non-patent barriers to entry; market exclusivity periods granted by regulatory agencies; the potential threat of new branded drug competition or development of new novel therapies that could compete with the applicable assets and other relevant factors. |
The following table summarizes the amounts and useful lives assigned to identifiable intangible assets:
| Weighted-Average Useful Lives (Years) | Amounts Recognized as of Acquisition Date | |||||||
| $ | ||||||||
Trademarks, trademark licenses, patents and other product rights | 18 | 326,601 | ||||||
Platforms and technologies | 14 | 69,706 | ||||||
Supply agreements | 12 | 17,622 | ||||||
|
| |||||||
Total identifiable intangible assets acquired | 413,929 | |||||||
|
| |||||||
| (e) | Includes accounts payable, accrued liabilities and income taxes payable. |
| (f) | Comprises of current deferred tax assets $823,000, noncurrent deferred tax assets $15,703,000, current deferred tax liabilities $3,000 and noncurrent deferred tax liabilities $77,772,000. |
| (g) | The excess of purchase price over the fair value amounts assigned to the assets acquired and liabilities assumed represents the goodwill amount resulting from the acquisition. The goodwill recorded as part of the acquisition is largely attributable to synergies expected to result from combining the operations of Eurand and the Company and intangible assets that do not qualify for separate recognition. The Company does not expect any portion of this goodwill to be deductible for tax purposes. |
| (h) | Prior to the acquisition, the Company had entered into an exclusive development license and supply agreement with Eurand. No gain or loss was recognized in conjunction with the effective settlement of the contractual relationship between the Company and Eurand as a result of this acquisition. |
Transaction-related costs
For the fiscal year ended September 30, 2011, the Company expensed $11,874,000 of costs relating to legal, financial, valuation and accounting advisory services performed in connection with effecting the transaction with Eurand, which are included in transaction, restructuring and integration costs in the accompanying Consolidated Statements of Operations. The Company did not incur transaction-related costs during the years ended September 30, 2013 and 2012.
Actual and pro forma information
The revenue derived from the Eurand entities for the period from the Acquisition Date to September 30, 2011 were $121,943,000 and loss before income taxes was $39,647,000.
F-22
Table of Contents
APTALIS HOLDINGS INC.
Notes to Consolidated Financial Statements
(amounts in the tables are stated in thousands of U.S. dollars, except share related data)
The following table presents unaudited pro forma consolidated results of operations as if the acquisition of Eurand had occurred as of October 1, 2010:
| Year Ended September 30, | ||||
| 2011 | ||||
| $ | ||||
Total revenue | 534,483 | |||
Loss before income taxes | (94,649 | ) | ||
|
| |||
Net loss | (108,139 | ) | ||
|
| |||
The pro forma consolidated results of operations were prepared using the acquisition method of accounting and are based on the historical financial information of the Company and Eurand. The pro forma information does not reflect any synergies and other benefits that the Company may achieve as a result of the acquisition, or the costs necessary to achieve these synergies. In addition, the pro forma information does not reflect the costs to integrate the operations of the Company and Eurand.
The pro forma information is not necessarily indicative of what the Company’s consolidated results of operations actually would have been had the transaction been completed on October 1, 2010. In addition, the pro forma information does not purport to project the future results of operations of the Company. The pro forma information reflects primarily the following pro forma adjustments:
| Ÿ | elimination of product sales and royalties between Eurand and the Company, an elimination of the Company’s cost of sales for Eurand-sourced inventories, and the elimination of certain PEP-related charges stemming from intercompany transactions; |
| Ÿ | elimination of Eurand’s historical intangible asset amortization expense; |
| Ÿ | additional amortization expense related to the fair value of identifiable intangible assets acquired; |
| Ÿ | additional depreciation expense related to the fair value adjustment to property, plant and equipment acquired; |
| Ÿ | elimination of interest expense and amortization of deferred financing costs related to the Company’s term loan under the legacy senior secured credit facilities and 9.25% senior secured notes due 2015 that were repaid as part of the acquisition transaction; |
| Ÿ | additional interest expense and amortization of deferred financing costs associated with financing obtained under the Amended and Restated Senior Secured Credit Facilities obtained by the Company in connection with the acquisition transaction; |
| Ÿ | reduction of interest income associated with cash and cash equivalents that were used to partially fund the acquisition; |
| Ÿ | elimination of acquisition-related costs and acquisition-related restructuring charges; |
| Ÿ | elimination of $19,062,000 of the acquisition accounting adjustment on Eurand’s inventory that was sold subsequent to the Acquisition Date, which will not have a continuing impact on the Company’s operations. |
The pro forma effective tax rate differs from the statutory rate due to the relatively large impact of actual permanent differences on relatively small pro forma income before tax, valuation allowances on deferred tax assets in certain jurisdictions, and the expected impact of foreign withholding taxes upon repatriation of foreign earnings.
F-23
Table of Contents
APTALIS HOLDINGS INC.
Notes to Consolidated Financial Statements
(amounts in the tables are stated in thousands of U.S. dollars, except share related data)
Acquisition of Rectiv
On December 28, 2011 (or the “Rectiv Acquisition Date”), the Company entered into a license agreement with Strakan International S.A.R.L. and Prostrakan Inc. (collectively “ProStrakan”) to acquire the exclusive rights and related business and supply agreement to commercialize Rectiv (nitroglycerin) Ointment 0.4% (“Rectiv”) in the U.S (the “Rectiv Transaction”). In addition, the Company and ProStrakan have the right to undertake development work with respect to Rectiv. Rectiv received FDA approval in June 2011 and is indicated for the treatment of moderate to severe pain associated with chronic anal fissure. On January 10, 2012, the Company made an upfront payment to ProStrakan of $20,000,000 as well as an additional milestone payment of $20,000,000 paid in December 2012. The Company is required to pay a series of potential milestones up to $40,000,000 upon the achievement of certain sales milestones and double-digit royalties on net sales of Rectiv. The next milestone payment of $5,000,000 is payable upon the achievement of $25,000,000 of sales in any calendar year. The Company has also entered into a separate supply agreement with ProStrakan and has the ability to change its source of supply of the product in the future. The Company began shipping Rectiv during the quarter ended March 31, 2012.
The Rectiv Transaction has been accounted for as a business combination under the acquisition method of accounting. The fair value of the consideration payable was determined to be $139,200,000 as of the acquisition date comprising of non-contingent milestones of $38,878,000 and contingent milestones and royalty payments of $100,322,000. The current and long-term portions of consideration payable were determined to be $43,478,000 and $95,722,000 respectively and are reflected within accounts payable and accrued liabilities and other long-term liabilities respectively. The total fair value of the consideration transferred has been assigned to trademark license intangible asset valued at $139,200,000. The trademark license intangible asset has an estimated useful life of approximately eight years and is amortized on a straight-line basis.
The Company finalized its purchase price allocation during the fourth quarter of the fiscal year ended September 30, 2012 resulting in no retrospective adjustments to the provisional amounts recognized at the Rectiv Acquisition Date.
The Company determined the Rectiv Acquisition Date fair value of the contingent consideration based on a probability weighted income approach. The fair value measurement is based on significant inputs not observable in the market and thus represents a Level 3 measurement within the fair value hierarchy. These inputs include the estimated amount and timing of projected cash payments, the probability of the achievement of future milestone events, the risk-adjusted discount rate used to present value the probability-weighted cash flows, revenue estimates and other factors. These inputs are significant assumptions and changes in the fair value of the contingent consideration obligation may result from changes in discount periods and rates, changes in the timing and amount of revenue estimates and changes in probability assumptions with respect to the likelihood of achieving the various milestone criteria. A 1% change in the discount rate, assuming all other assumptions remain consistent, would result in a change of $1,100,000 to the contingent consideration obligation. A 10% change in the projected cash flows, assuming all other assumptions remain consistent, would result in a change of $4,700,000 to the contingent consideration obligation.
On a quarterly basis at each reporting date, the contingent consideration liability is measured at fair value with changes recorded in operating income. Due to the continuing effects of Rectiv sales having performed below expectations, during the fourth quarter of the fiscal year ended September 30, 2013, the Company revisited its long-term projection assumptions used in its assessment of the
F-24
Table of Contents
APTALIS HOLDINGS INC.
Notes to Consolidated Financial Statements
(amounts in the tables are stated in thousands of U.S. dollars, except share related data)
carrying value of its intangible asset and its contingent consideration liability relating to Rectiv. These changes to long-term projection assumptions were made as a result of ongoing competition from compounding pharmacies as well as the issue surrounding the introduction of the Compounding Quality Act (“CQA”), which was introduced during the fourth quarter of fiscal year 2013 and was signed into law on November 27, 2013. As a result of this analysis, the Company recorded an impairment charge of $65,250,000 relating to its Rectiv intangible assets, which is further described in Note 12. The Company also recorded a change in the fair value of the contingent consideration which reduced the liability by $74,707,000 for the year ended September 30, 2013 ($14,706,000 for the year ended September 30, 2012). These two offsetting adjustments along with accretion expense described below were recorded as fair value adjustments to intangible assets and contingent consideration within our consolidated statement of operations.
As of September 30, 2013, the fair value of the contingent consideration liability was $29,594,000. The Company recorded an accretion expense of $13,000,000 for the year ended September 30, 2013 ($11,380,000 for the year ended September 30, 2012). As of September 30, 2013, total consideration payable was $29,594,000 of which $25,764,000 was included in other long-term liabilities and $3,830,000 was included in accounts payable and accrued expenses.
During the quarter ended March 31, 2012, the Company shipped Rectiv™ to wholesalers and began detailing this product to physicians. Because of the inherent difficulties in estimating returns for product launches of product in new indications, as well as the potential impact of retroactive rebate adjustments during the launch phase, the Company had recognized revenue for Rectiv based upon prescription pull-through. As of September 30, 2012, the balance of deferred revenue recorded was $1,517,000 and is included in accounts payable and accrued liabilities. Effective May 2013, the Company discontinued deferring revenue and started to recognize revenue for Rectiv when the product is delivered to the customer. This change in revenue recognition methodology resulted in the recognition of $1,517,000 of deferred revenue being recognized into earnings in the fiscal year ended September 30, 2013.
| 5. | Restructuring and Integration |
Acquisition related cost-rationalization and integration initiatives
The Company has initiated restructuring measures in conjunction with the integration of the operations of Eurand as well as within its ongoing legacy operations. These measures are intended to capture synergies and generate cost savings across the Company.
Restructuring actions taken thus far include workforce reductions across the Company and other organizational changes. These reductions come primarily from the elimination of redundancies and consolidation of staff in the sales and marketing, manufacturing, research and development, and general and administrative functions, as well as from the closure of Eurand’s manufacturing facility in Nogent-Oise, France.
The Company recorded a restructuring expense of $1,925,000 during the year ended September 30, 2013 ($1,884,000 and $16,051,000 during the years ended September 30, 2012 and September 30, 2011 respectively) related to planned employee termination costs included in Transaction, restructuring and integration on the consolidated statements of operations. Employee termination costs are generally recorded when the actions are communicated, probable and estimable, and include accrued severance benefits and health insurance continuation, many of which may be paid out during periods after termination.
F-25
Table of Contents
APTALIS HOLDINGS INC.
Notes to Consolidated Financial Statements
(amounts in the tables are stated in thousands of U.S. dollars, except share related data)
The following table summarizes the restructuring liability activity related to the Eurand Transaction through September 30, 2013:
| Severance and related benefits | ||||||||||||
| Year Ended September 30, | ||||||||||||
| 2013 | 2012 | 2011 | ||||||||||
| $ | $ | $ | ||||||||||
Balance, beginning of year | 770 | 3,699 | — | |||||||||
Expense | 1,925 | 1,884 | 16,051 | |||||||||
Payments | (2,256 | ) | (4,813 | ) | (12,297 | ) | ||||||
Foreign currency translation | — | — | (55 | ) | ||||||||
|
|
|
|
|
| |||||||
Balance, end of year | 439 | 770 | 3,699 | |||||||||
|
|
|
|
|
| |||||||
The Company has incurred integration costs of $573,000 during the year ended September 30, 2013 ($10,483,000 and $22,987,000 during the years ended September 30, 2012 and September 30, 2011 respectively) representing certain external incremental costs directly related to integrating the Eurand business and primarily include expenditures for consulting and systems integration. The Company has completed phase 1 of its initiative to optimize its enterprise resource planning systems across the organization in fiscal year 2012 and the Company launched phase 2 during the three months ended December 31, 2012 and this initiative is ongoing. Restructuring and integration costs are included in Transaction, restructuring and integration costs in the accompanying consolidated statements of operations.
| 6. | Acquisitions, Research Collaborations and License Agreements |
Agreements with Mpex Pharmaceuticals Inc. for acquisition and development of APT-1026
On April 11, 2011, the Company and its affiliate, Axcan Lone Star Inc, entered into a series of agreements with Mpex Pharmaceuticals Inc. (“Mpex”) for the acquisition and development of APT-1026 (the “Mpex Transaction”), a proprietary aerosol formulation of levofloxacin, which recently completed Phase 3 clinical trials for the treatment of pulmonary infections in patients with cystic fibrosis (CF). Subsequently on August 31, 2011, under the terms of these agreements, the Company and Merger Sub acquired all of Mpex’s assets related to APT-1026 in a merger of Mpex with and into Merger Sub, with Mpex being the surviving corporation and a direct, wholly owned unrestricted subsidiary of the Company. Prior to the merger, Mpex transferred all of its assets not related to APT-1026 to Rempex Pharmaceuticals Inc. (“Rempex”), a newly formed company that is owned primarily by the previous Mpex stockholders. Total consideration in relation to the Mpex Transaction consists of (i) time-based, non-contingent payments amounting to $62,500,000 to be paid in a number of installments, of which $37,500,000 has been paid to date, plus (ii) contingent payments of up to $195,000,000 upon the achievement of certain regulatory and commercial milestones, such as, acceptance for substantive review of an NDA or foreign equivalent, EU approval or U.S. approval and certain net sales milestones and (iii) earn-out payments based on net sales of APT-1026. Indemnity obligations of the Mpex security holders will be satisfied by set-off against a portion of the foregoing merger consideration payments. The final installments on the time-based non-contingent payments of $25,000,000 are due in the fiscal year ending September 30, 2014. On November 1, 2013, we paid $15,000,000 of these remaining installments. Also, in November 2013, we filed a Marketing Authorization Application with the EMA. Upon acceptance for substantive review, a development milestone of $10,000,000 would be due within 10 days of acceptance. The Mpex transaction was accounted for as an asset acquisition as Mpex did not entail the necessary processes or outputs to qualify as a business as defined in GAAP. The Company reached the conclusion that
F-26
Table of Contents
APTALIS HOLDINGS INC.
Notes to Consolidated Financial Statements
(amounts in the tables are stated in thousands of U.S. dollars, except share related data)
Mpex was an asset acquisition because it obtained the rights to access inputs through its co-development of pre-clinical intellectual property and did not employ Rempex’s scientists. The Company did not acquire processes that are capable of producing outputs given the intellectual property was early-stage. Given that the intellectual property acquired was still in development, it requires significant development effort by the Company and the scientists retained by the seller in order to produce outputs. Additionally, any substantive decisions related to APT-1026 required the approval of the development steering committee, which had equal representation from the Company and Rempex.
The further development of APT-1026 was conducted pursuant to the terms of the Development Agreement dated April 11, 2011, which was subsequently amended on October 25, 2013 among the Company, Merger Sub and Mpex. Since the completion of the divestiture of assets and liabilities unrelated to APT-1026 (the “Divestiture”) to Rempex, Rempex has assumed all of Mpex’s obligations under the Development Agreement. Under the Development Agreement, Mpex (and after the Divestiture, Rempex) has been paid for the actual development costs of APT-1026 and has had primary responsibility for conducting day-to-day development activities. Prior to the amendment of the Development Agreement, the Company was required to pay certain development costs estimated for the next three months in advance based on a rolling three-month forecast. The Company and Merger Sub have input regarding development strategy. Pursuant to the Development Agreement, on April 12, 2011, Mpex was paid $8,731,000 for development expenses it incurred from November 15, 2010 to March 31, 2011, which has been expensed as acquired in-process research, and an additional $9,913,000 for estimated development costs to be incurred during the first three months of the Development Agreement, of which $8,514,000 has been expensed as research and development. All payments under the Development Agreement, Option Agreement and Merger Agreement to Mpex or Mpex security holders, as applicable, will be made by or on behalf of Merger Sub (or after the consummation of the Merger, the Surviving Company). During the year ended September 30, 2011, the Company expensed $65,540,000 as acquired in-process research and development reflecting the initial non-contingent payment of $12,000,000, the discounted value of future time-based non-contingent payments payable under the Option and Merger agreements of $44,809,000 (with a corresponding liability) and the payment for certain pre-agreement incurred development expenses of $8,731,000.
During the year ended September 30, 2013, the Company expensed $11,955,000 in research and development related to the development of APT-1026 ($23,362,000 and $15,842,000 during the years ended September 30, 2012 and September 30, 2011, respectively). As of September 30, 2013, $24,540,000 representing the amount accrued for the non-contingent payments payable under the Option and Merger agreements, is included in accounts payable and accrued liabilities. During the year ended September 30, 2013, the Company made milestone payments of $12,000,000 related to this liability.
On July 18, 2012, the Company received preliminary data on the placebo-controlled phase III clinical trial for U.S. approval for APT-1026. The Company’s initial analysis of this data showed that the clinical trial did not meet its primary endpoint, time to exacerbation, while it demonstrated efficacy in key secondary endpoints. The Company recently completed its second active controlled phase III clinical trials for EU approval where APT-1026 was compared to tobramycin. In this trial, the primary endpoint, non inferiority versus tobramycin in lung function, was met and efficacy in key secondary endpoints was also demonstrated. The Company has determined to take the next steps toward a regulatory filing for APT-1026 in the EU. On Friday, November 29, 2013, Aptalis filed the Marketing Authorization Application (MAA) in Europe, via the Centralized procedure, for APT-1026 (APT-1026, levofloxacin 240 mg Nebulizer Solution), a new formulation of levofloxacin for inhalation for the long-term management of chronic Pseudomonas aeruginosa infection in cystic fibrosis.
F-27
Table of Contents
APTALIS HOLDINGS INC.
Notes to Consolidated Financial Statements
(amounts in the tables are stated in thousands of U.S. dollars, except share related data)
Equity investment in the Company
Simultaneous with the execution of the Mpex agreements, the Company received the proceeds of a $55,000,000 equity investment from funds managed by Investor Growth Capital Limited. Aptalis Holdings contributed the proceeds of the equity investment to its subsidiaries to fund a portion of the cost of the Mpex transactions.
| 7. | Disposal of the PHOTOFRIN/PHOTOBARR Product line |
On March 28, 2011, the Company entered into a definitive agreement with Pinnacle Biologics, Inc., which acquired all global assets and rights related to PHOTOFRIN/PHOTOBARR, including inventory, for non-contingent payments amounting to $4,252,000. In addition to the non-contingent payments, additional payments shall be made to the Company after the achievement of certain milestones events. The Company will also be paid royalties on annual net sales of PHOTOFRIN/PHOTOBARR.
During the year ended September 30, 2011, the Company recorded a loss of $7,365,000 as a result of the disposal of the PHOTOFRIN/PHOTOBARR product line. Consideration for additional contingent payments to be made to the Company shall be recorded as a gain in the period in which they are received. The Company received milestone payments of $1,000,000 during the year ended September 30, 2013 and recorded a gain (nil during the year ended September 30, 2012).
| 8. | Accounts Receivable |
| September 30, 2013 | September 30, 2012 | |||||||
| $ | $ | |||||||
Trade accounts receivable, net of allowance for doubtful amounts of $491 ($559 as at September 30, 2012)a) | 80,736 | 93,438 | ||||||
Taxes receivable | 1,690 | 718 | ||||||
Other, net of allowance for doubtful amounts of $0 ($32 as at September 30, 2012) | 3,808 | 6,591 | ||||||
|
|
|
| |||||
| 86,234 | 100,747 | |||||||
|
|
|
| |||||
The Company believes that there is no unusual exposure associated with the collection of these accounts receivable.
| a) | At September 30, 2013, the accounts receivable include amounts receivable from three major customers which represent approximately 68% (approximately 58% at September 30, 2012) of the Company’s total trade accounts receivable (Note 17). |
| 9. | Inventories |
| September 30, 2013 | September 30, 2012 | |||||||
| $ | $ | |||||||
Raw materials and packaging materials, net of reserve for obsolescence of $555 ($1,460 as at September 30, 2012) | 22,543 | 17,663 | ||||||
Work in progress, net of reserve for obsolescence of $449 ($821 as at September 30, 2012) | 9,479 | 7,708 | ||||||
Finished goods, net of reserve for obsolescence of $981 ($749 as at September 30, 2012) | 29,037 | 19,926 | ||||||
|
|
|
| |||||
| 61,059 | 45,297 | |||||||
|
|
|
| |||||
F-28
Table of Contents
APTALIS HOLDINGS INC.
Notes to Consolidated Financial Statements
(amounts in the tables are stated in thousands of U.S. dollars, except share related data)
| 10. | Income Taxes |
Income taxes included in the Consolidated Statements of Operations are as follows:
| Year Ended September 30, | ||||||||||||
| 2013 | 2012 | 2011 | ||||||||||
| $ | $ | $ | ||||||||||
Current | 43,532 | 35,129 | 11,892 | |||||||||
|
|
|
|
|
| |||||||
Deferred | ||||||||||||
Increase and reversal of temporary differences | (8,834 | ) | (13,399 | ) | (4,496 | ) | ||||||
Change in promulgated rates | — | 61 | 51 | |||||||||
|
|
|
|
|
| |||||||
| (8,834 | ) | (13,338 | ) | (4,445 | ) | |||||||
|
|
|
|
|
| |||||||
| 34,698 | 21,791 | 7,447 | ||||||||||
|
|
|
|
|
| |||||||
Domestic | ||||||||||||
Current | 363 | 117 | 2,837 | |||||||||
Deferred | (1,868 | ) | (1,428 | ) | (301 | ) | ||||||
|
|
|
|
|
| |||||||
| (1,505 | ) | (1,311 | ) | 2,536 | ||||||||
|
|
|
|
|
| |||||||
Foreign | ||||||||||||
Current | 43,169 | 35,012 | 9,055 | |||||||||
Deferred | (6,966 | ) | (11,910 | ) | (4,144 | ) | ||||||
|
|
|
|
|
| |||||||
| 36,203 | 23,102 | 4,911 | ||||||||||
|
|
|
|
|
| |||||||
| 34,698 | 21,791 | 7,447 | ||||||||||
|
|
|
|
|
| |||||||
The Company’s effective income tax rate of 28.55% for the year ended September 30, 2013 differs from the U.S. statutory federal income tax rate of 35.00%. This difference arises from the following:
| Year Ended September 30, | ||||||||||||||||||||||||
| 2013 | 2012 | 2011 | ||||||||||||||||||||||
| % | $ | % | $ | % | $ | |||||||||||||||||||
Combined statutory rate applied to pre-tax income (loss) | 35.00 | 42,543 | 35.00 | 3,427 | 35.00 | (64,450 | ) | |||||||||||||||||
Increase (decrease) in taxes resulting from: | ||||||||||||||||||||||||
Change in promulgated rates | — | — | 0.62 | 61 | (0.03 | ) | 51 | |||||||||||||||||
Difference with foreign tax rates | (20.42 | ) | (24,826 | ) | (112.76 | ) | (11,040 | ) | (0.70 | ) | 1,295 | |||||||||||||
Unrecognized outside basis difference for foreign subsidiaries | 25.35 | 30,810 | — | — | — | — | ||||||||||||||||||
Previously unrecognized outside basis difference for foreign subsidiaries | 83.09 | 101,000 | — | — | — | — | ||||||||||||||||||
Foreign tax credits | (46.33 | ) | (56,313 | ) | — | — | — | — | ||||||||||||||||
Tax benefit arising from a financing structure | (13.61 | ) | (16,547 | ) | (169.79 | ) | (16,622 | ) | 7.71 | (14,193 | ) | |||||||||||||
Unrecognized tax benefit reversal | — | — | (20.68 | ) | (2,025 | ) | — | — | ||||||||||||||||
Non-deductible items | 1.06 | 1,287 | 37.55 | 3,676 | (13.59 | ) | 25,017 | |||||||||||||||||
Research and development tax credits | (3.50 | ) | (4,253 | ) | (68.24 | ) | (6,680 | ) | 0.54 | (990 | ) | |||||||||||||
State taxes | 0.18 | 216 | 5.57 | 546 | (0.20 | ) | 364 | |||||||||||||||||
Change in valuation allowance | (30.36 | ) | (36,900 | ) | 510.54 | 49,982 | (31.40 | ) | 57,813 | |||||||||||||||
Other | (1.91 | ) | (2,319 | ) | 4.79 | 466 | (1.37 | ) | 2,540 | |||||||||||||||
|
|
|
|
|
|
|
|
|
|
|
| |||||||||||||
| 28.55 | 34,698 | 222.60 | 21,791 | (4.04 | ) | 7,447 | ||||||||||||||||||
|
|
|
|
|
|
|
|
|
|
|
| |||||||||||||
F-29
Table of Contents
APTALIS HOLDINGS INC.
Notes to Consolidated Financial Statements
(amounts in the tables are stated in thousands of U.S. dollars, except share related data)
On September 30, 2013, the Company has elected under applicable provisions of the Internal Revenue Code to recharacterize foreign taxes previously deducted as foreign tax credit carry forwards. The net adjustment resulting from the changes to the net operating loss carry forward deferred tax assets and the foreign tax credit carry forward deferred tax assets is presented in the effective rate reconciliation above.
As of September 30, 2013, the Company had approximately $287,000,000 ($229,000,000 as of September 30, 2012) of unremitted earnings in respect to its international subsidiaries. As a result of the distribution made to the shareholders in October 2013, cash was repatriated from certain of the Company’s foreign subsidiaries. The Company commenced the associated income tax planning and other efforts prior to the end of fiscal year 2013 and as such, the Company can no longer assert the permanent reinvestment of earnings of its foreign subsidiaries. A deferred income tax liability amounting to $ 101,000,000 on the outside basis of a subsidiary that was not recorded as of June 2013 has been recorded in the fourth quarter of fiscal year 2013. The recognition of such deferred income liability allowed the Company to decrease its valuation allowance for the same amount in the US. The repatriation of earnings that was done in the first quarter of fiscal year 2014 will reduce the United States net operating losses and tax credits available by an equivalent amount. While deferred income tax assets will offset this deferred income tax liability, the allocation of the valuation allowance on a pro rata basis resulted in the presentation of current deferred income tax liability and non-current deferred income tax assets of $52,895,000. As of September 30, 2013, the outside tax basis of certain of the Company’s foreign subsidiaries exceeded the GAAP basis and, therefore, deferred income tax assets have not been recorded given that the amounts are not projected to reverse in the foreseeable future.
The deferred income tax assets and liabilities result from differences between the tax value and book value of the following items:
| September 30, 2013 | September 30, 2012 | |||||||
| $ | $ | |||||||
Assets | ||||||||
Inventories | 8,975 | 9,074 | ||||||
Accounts payable and accrued liabilities | 17,255 | 27,708 | ||||||
Tax credits | 129,182 | 22,557 | ||||||
Deferred debt issue expenses | 2,113 | 1,845 | ||||||
Other long-term liabilities | 9,628 | 31,329 | ||||||
Unused tax losses | 122,269 | 177,532 | ||||||
Interest expense deduction | 1,435 | 768 | ||||||
Stock-based compensation | 1,891 | 1,603 | ||||||
Foreign exchange translation | 863 | 2,011 | ||||||
Interest rates swap | 4,676 | 6,695 | ||||||
Other | 979 | 950 | ||||||
Liabilities | ||||||||
Prepaid expenses and other current assets | (2,394 | ) | (2,045 | ) | ||||
Property, plant and equipment | (4,570 | ) | (2,978 | ) | ||||
Intangible assets | (59,862 | ) | (106,973 | ) | ||||
Outside basis difference for foreign subsidiaries | (101,000 | ) | — | |||||
Other | (449 | ) | (218 | ) | ||||
|
|
|
| |||||
| 130,991 | 169,858 | |||||||
Valuation allowance | (187,812 | ) | (230,988 | ) | ||||
|
|
|
| |||||
Net deferred income tax liabilities | (56,821 | ) | (61,130 | ) | ||||
|
|
|
| |||||
F-30
Table of Contents
APTALIS HOLDINGS INC.
Notes to Consolidated Financial Statements
(amounts in the tables are stated in thousands of U.S. dollars, except share related data)
Recorded as:
| September 30, 2013 | September 30, 2012 | |||||||
| $ | $ | |||||||
Deferred income tax assets—Current | 8,176 | 9,288 | ||||||
Deferred income tax assets—Non-Current | 52,895 | — | ||||||
Deferred income tax liabilities—Current | (52,895 | ) | — | |||||
Deferred income tax liabilities—Non-Current | (64,997 | ) | (70,418 | ) | ||||
|
|
|
| |||||
Net deferred income tax liabilities | (56,821 | ) | (61,130 | ) | ||||
|
|
|
| |||||
Current and non-current deferred income tax assets and liabilities within the same jurisdiction are generally offset for presentation in the Consolidated Balance sheets.
As of September 30, 2013, the Company had tax benefit carryovers of $122,269,000 ($177,532,000 as of September 30, 2012) relating to operating losses and capital losses and $129,182,000 ($22,557,000 as of September 30, 2012) relating to tax credits which are available to reduce future U.S. federal and state, as well as international, income taxes payable with either an indefinite life in Italy and France or expiring at various times in the United States between 2016 and 2032. Certain of our U.S. net operating losses are subject to limitations under Internal Revenue Code Section 382.
As of September 30, 2013, net operating losses in the U.S. at the federal level amounted to $236,021,000 ($445,560,000 as of September 30, 2012) that will expire at various date between 2016 and 2032, of which $90,101,000 are restricted under IRC 382. As of September 30, 2013, the Company had tax benefits amounting to $129,250,000 ($22,557,000 as of September 30, 2012) relating to tax credits which are available to reduce future U.S. federal income taxes payable which expire at various times between 2016 and 2033. The amount of tax credits restricted under IRC 382 is $9,995,721.
A valuation allowance against deferred tax assets is established when it is not more likely than not that the deferred tax assets will be realized. Based on all available evidence, both positive and negative, the Company has determined that it was more likely than not that the deferred tax assets related to substantially all of the U.S. and French cumulative gross net operating loss carry forwards, and certain other deferred assets, would not be realized. The recording of the deferred tax liability related to the outside basis difference for U.S. tax purposes resulted in a reversal of valuation allowance amounting to $101,000,000 in the year ended September 30, 2013. Such release was partially offset by an incremental valuation allowance required on the U.S. foreign tax credits established on September 30, 2013, as a result of the company’s election to recharacterize certain foreign taxes which had previously been deducted and included in net operating loss carryforwards. The total reduction in valuation allowance on a worldwide basis amounted to $36,900,000.
As at September 30, 2013, the Company had a total valuation allowance of $187,812,000. The jurisdictions in which the Company recorded valuation allowances are the United States for $162,362,000, France for $23,820,000, Canada for $1,016,000 and Italy for $614,000.
In future periods, if the deferred tax assets are determined by management to be more likely than not to be realized, the recognized tax benefits relating to the reversal of the valuation allowance will be recorded in the Consolidated Statements of Operations.
F-31
Table of Contents
APTALIS HOLDINGS INC.
Notes to Consolidated Financial Statements
(amounts in the tables are stated in thousands of U.S. dollars, except share related data)
The accounting for uncertainty in income taxes prescribe a recognition threshold and a measurement attribute for the financial statement recognition and measurement of tax positions taken or expected to be taken in a tax return. For those benefits to be recognized, a tax position must be more-likely-than-not to be sustained upon examination by taxing authorities. If recognized, the total amount of unrecognized tax benefits of $5,939,000 as at September 30, 2013, ($5,885,000 as at September 30, 2012) would affect the Company’s effective tax rate. The Company believes that the total amounts of unrecognized tax benefits will not significantly increase or decrease within the next twelve months
The following table presents a summary of the changes to unrecognized tax benefits:
| Year Ended September 30, | ||||||||||||
| 2013 | 2012 | 2011 | ||||||||||
| $ | $ | $ | ||||||||||
Balance, beginning of year | 5,885 | 14,769 | 11,485 | |||||||||
Acquisition of Eurand | — | — | 401 | |||||||||
Additions based on tax positions related to the current year | 76 | — | 137 | |||||||||
Additions for tax positions of prior years | 260 | 691 | 4,240 | |||||||||
Settlements | (282 | ) | (7,555 | ) | (1,063 | ) | ||||||
Reductions for tax positions of prior years | — | (2,020 | ) | (431 | ) | |||||||
|
|
|
|
|
| |||||||
Balance, end of year | 5,939 | 5,885 | 14,769 | |||||||||
|
|
|
|
|
| |||||||
The Company has historically recognized interest relating to income tax matters as a component of financial expenses and penalties related to income tax matters as a component of income tax expense. As of September 30, 2013, the Company had accrued $1,446,000 ($1,480,000 as of September 30, 2012) for interest relating to income tax matters. There were no amounts recorded for penalties as of September 30, 2013 and 2012.
The Company and its subsidiaries file tax returns in the U.S. federal jurisdiction and various states, local and foreign jurisdictions including Canada and France. In many cases, the Company’s uncertain tax positions are related to tax years that remain subject to examination by relevant tax authorities. The Company is subject to federal and state income tax examination by U.S. tax authorities for fiscal years 2006 through 2013. The Company is subject to Canadian and provincial income tax examination for fiscal years 2009 through 2013. There are numerous other income jurisdictions for which tax returns are not yet settled, none of which is individually significant.
As a result of the completion by the Canada Revenue Agency’s domestic audit for taxation years 2005 to 2008 in October 2011, an effective settlement occurred and the Company paid $7,555,000. A favorable tax benefit of approximately $2,025,000 was recorded in the consolidated statement of operations for the year ended September 30, 2012.
F-32
Table of Contents
APTALIS HOLDINGS INC.
Notes to Consolidated Financial Statements
(amounts in the tables are stated in thousands of U.S. dollars, except share related data)
| 11. | Property, Plant and Equipment |
| September 30, 2013 | ||||||||||||
| Cost | Accumulated depreciation | Net | ||||||||||
| $ | $ | $ | ||||||||||
Land | 4,730 | — | 4,730 | |||||||||
Buildings | 47,870 | 9,931 | 37,939 | |||||||||
Machinery, equipment and office furnishings | 56,167 | 15,975 | 40,192 | |||||||||
Automotive equipment | 6,216 | 1,395 | 4,821 | |||||||||
Computer equipment and software | 30,996 | 25,484 | 5,512 | |||||||||
Leasehold improvements | 3,689 | 1,413 | 2,276 | |||||||||
|
|
|
|
|
| |||||||
| 149,668 | 54,198 | 95,470 | ||||||||||
|
|
|
|
|
| |||||||
| September 30, 2012 | ||||||||||||
| Cost | Accumulated depreciation | Net | ||||||||||
| $ | $ | $ | ||||||||||
Land | 4,590 | — | 4,590 | |||||||||
Buildings | 44,836 | 7,970 | 36,866 | |||||||||
Machinery, equipment and office furnishings | 46,538 | 11,177 | 35,361 | |||||||||
Automotive equipment | 2,577 | 501 | 2,076 | |||||||||
Computer equipment and software | 27,299 | 20,018 | 7,281 | |||||||||
Leasehold improvements | 1,888 | 825 | 1,063 | |||||||||
|
|
|
|
|
| |||||||
| 127,728 | 40,491 | 87,237 | ||||||||||
|
|
|
|
|
| |||||||
Acquisitions of property, plant and equipment amount to $20,408,000 for the year ended September 30, 2013 ($15,082,000 for the year ended September 30, 2012).
The cost and accumulated depreciation of equipment under capital leases amount to $6,355,000 and $1,446,000, respectively, in 2013 ($2,708,000 and $501,000, respectively, in 2012).
| 12. | Goodwill and Intangible Assets |
Goodwill
The following table reflects the changes in the carrying amount of goodwill:
| September 30, 2013 | September 30, 2012 | |||||||
| $ | $ | |||||||
Balance, beginning of year | 178,325 | 179,843 | ||||||
Foreign exchange | 1,733 | (1,518 | ) | |||||
|
|
|
| |||||
Balance, end of year | 180,058 | 178,325 | ||||||
|
|
|
| |||||
The Company conducted a qualitative assessment for its annual goodwill impairment test in the fourth fiscal quarter for the years ended September 30, 2013 and 2012 and noted no impairment.
F-33
Table of Contents
APTALIS HOLDINGS INC.
Notes to Consolidated Financial Statements
(amounts in the tables are stated in thousands of U.S. dollars, except share related data)
Intangible assets with a finite life
The following table reflects the gross carrying amount and accumulated amortization roll-forward by major intangible asset class:
| September 30, 2013 | ||||||||||||
| Cost | Accumulated amortization | Net | ||||||||||
| $ | $ | $ | ||||||||||
Trademarks, trademark licenses, patents and other product rights related to commercialized products | 818,761 | 293,427 | 525,334 | |||||||||
Platforms and technologies | 69,782 | 12,941 | 56,841 | |||||||||
Supply agreements | 9,668 | 2,670 | 6,998 | |||||||||
|
|
|
|
|
| |||||||
| 898,211 | 309,038 | 589,173 | ||||||||||
|
|
|
|
|
| |||||||
| September 30, 2012 | ||||||||||||
| Cost | Accumulated amortization | Net | ||||||||||
| $ | $ | $ | ||||||||||
Trademarks, trademark licenses, patents and other product rights related to commercialized products | 910,595 | 247,154 | 663,441 | |||||||||
Platforms and technologies | 66,550 | 7,653 | 58,897 | |||||||||
Supply agreements | 17,622 | 2,585 | 15,037 | |||||||||
|
|
|
|
|
| |||||||
| 994,767 | 257,392 | 737,375 | ||||||||||
|
|
|
|
|
| |||||||
The following table reflects the changes in the carrying amounts of intangible assets:
| September 30, 2013 | ||||||||||||
| Cost | Accumulated amortization | Net | ||||||||||
| $ | $ | $ | ||||||||||
Balance, at October 1, 2012 | 994,767 | 257,392 | 737,375 | |||||||||
Impairment | (103,654 | ) | (31,946 | ) | (71,708 | ) | ||||||
Amortization | — | 80,801 | (80,801 | ) | ||||||||
Foreign exchange | 7,098 | 2,791 | 4,307 | |||||||||
|
|
|
|
|
| |||||||
Balance, at September 30, 2013 | 898,211 | 309,038 | 589,173 | |||||||||
|
|
|
|
|
| |||||||
| September 30, 2012 | ||||||||||||
| Cost | Accumulated amortization | Net | ||||||||||
| $ | $ | $ | ||||||||||
Balance, at October 1, 2011 | 860,614 | 169,721 | 690,893 | |||||||||
Addition related to the Rectiv Transaction (Note 4) | 139,200 | — | 139,200 | |||||||||
Other additions | 1,150 | — | 1,150 | |||||||||
Amortization | — | 88,971 | (88,971 | ) | ||||||||
Foreign exchange | (6,197 | ) | (1,300 | ) | (4,897 | ) | ||||||
|
|
|
|
|
| |||||||
Balance, at September 30, 2012 | 994,767 | 257,392 | 737,375 | |||||||||
|
|
|
|
|
| |||||||
F-34
Table of Contents
APTALIS HOLDINGS INC.
Notes to Consolidated Financial Statements
(amounts in the tables are stated in thousands of U.S. dollars, except share related data)
During the year ended September 30, 2013, Management revised its estimate of the remaining useful life of Canasa intangible assets as a result of certain regulatory events and litigation more thoroughly described in Note 22. This resulted in increased amortization of approximately $1,662,000 during the fiscal year ended September 30, 2013. This change in estimated useful life will increase annual amortization by approximately $5,000,000 over the remaining useful life.
As disclosed in Note 4, a trademark license intangible asset of $139,200,000 resulting from the Rectiv Transaction was recorded in the first quarter of fiscal 2012 and is reflected in the table above as additions. Due to the continuing effects of Rectiv sales having performed below expectations, during the fourth quarter of the fiscal year ended September 30, 2013, the Company revisited its long-term projection assumptions used in its assessment of the carrying value of its intangible asset and its contingent consideration liability relating to Rectiv. These changes to long-term projection assumptions were made as a result of ongoing competition from compounding pharmacies as well as the issue surrounding the introduction of the Compounding Quality Act (“CQA”), which was introduced during the fourth quarter of fiscal year 2013 and was signed into law on November 27, 2013. As a result of this analysis, the Company recorded an impairment charge of $65,250,000 relating to its Rectiv intangible assets. The Company also recorded a change in the fair value of the contingent consideration which reduced the liability by $74,707,000 for the year ended September 30, 2013 ($14,706,000 for the year ended September 30, 2012). These two offsetting adjustments along with accretion expense described in Note 4 were recorded as fair value adjustments to intangible assets and contingent consideration within our consolidated statement of operations. As a result of this impairment charge, the Company has assigned a new cost base of $43,500,000 for its Rectiv intangible assets as of September 30, 2013.
Similarly, during the fourth quarter of the fiscal year ended September 30, 2013, Actavis Inc. announced that it had received an approval from the U.S. Food and Drug Administration (FDA) on its Abbreviated New Drug Application (ANDA) for Lamotrigine Orally Disintegrating Tablets, a generic equivalent to Lamictal(R) ODT, which we manufacture for GlaxoSmithKline. As a result of this approval, Management revised its forecasts and determined that our intangible assets recorded in the Eurand transaction related to our supply agreement for Lamictal were impaired. As a result, we recorded an impairment charge of $6,458,000 related to our Lamictal supply agreement intangible asset.
During the year ended September 30, 2012, the Company received notification from A.N.S.M. (Agence nationale de sécurité du médicament et des produits de santé) of the approval of five generic competitors of Delursan® 250mg. During the year ended September 2012, the Company also launched a new 500mg dosage form of Delursan®.
During the quarter ended December 31, 2011, the Company considered the possible impact of one or more generic entrants in the market on Delursan®’s future revenues. On reassessment, the Company reduced the remaining estimated useful life of the Delursan® intangible asset to 5 years. As a result, an additional amortization expense of $5,178,000 was recorded during the fiscal year ended September 30, 2013 ($11,303,000 during the fiscal year ended September 30, 2012). During the year ended September 2013, three generic competitors of Delursan® 250mg entered the market.
As of September 30, 2013, the intangible assets with a finite life have a weighted average remaining amortization period of approximately 12 years (12 years as of September 30, 2012).
F-35
Table of Contents
APTALIS HOLDINGS INC.
Notes to Consolidated Financial Statements
(amounts in the tables are stated in thousands of U.S. dollars, except share related data)
The annual amortization expenses, without taking into account any future acquisitions expected, are as follows:
| $ | ||||
2014 | 63,429 | |||
2015 | 61,502 | |||
2016 | 61,001 | |||
2017 | 57,892 | |||
2018 | 49,912 | |||
2019 and thereafter | 295,437 | |||
| 13. | Accounts Payable and Accrued Liabilities |
| September 30, 2013 | September 30, 2012 | |||||||
| $ | $ | |||||||
Accounts payable | 44,785 | 41,577 | ||||||
Contract rebates, product returns and accrued chargebacks | 63,999 | 64,583 | ||||||
Accrued compensation and benefits | 24,311 | 22,898 | ||||||
Current portion of purchase consideration on business combination (Note 4) | 3,830 | 30,867 | ||||||
Accrued research and development costs | 30,414 | 16,525 | ||||||
Accrued royalties | 3,254 | 3,597 | ||||||
Deferred revenue | 2,179 | 3,027 | ||||||
Other accrued liabilities | 16,124 | 16,411 | ||||||
|
|
|
| |||||
| 188,896 | 199,485 | |||||||
|
|
|
| |||||
| 14. | Long-Term Debt |
| September 30, 2013 | September 30, 2012 | |||||||
| $ | $ | |||||||
Senior secured term loans of $926,375 as at September 30, 2013 ($935,875 as at September 30, 2012), bearing interest at a rate per annum equal to an applicable margin plus, at the Company’s option, either (1) a base rate determined by reference to the highest of (a) the prime rate of Bank of America, N.A., (b) the federal funds effective rate plus 1/2 of 1.00%, and (c) the one-month LIBOR plus 1.00% or (2) LIBOR determined by reference to the costs of funds for U.S. dollar deposits for the interest period relevant to such borrowing adjusted for certain additional costs. The applicable margins for borrowings under the Senior Secured Term Loan Facility are 3.00% with respect to base rate borrowings and 4.00% with respect to LIBOR borrowings. In addition, the LIBOR and base rate for borrowings under the Senior Secured Term Loan Facility are subject to a floor of 150 basis points and 250 basis points, respectively, secured by substantially all of the present and future assets of the Company, payable in quarterly installments, maturing in February 2017, subject to interest rate swap and cap agreements as further disclosed in Note 19 | 921,344 | 929,529 | ||||||
Unsecured loan of 750 euros as at September 30, 2012 | — | 964 | ||||||
|
|
|
| |||||
| 921,344 | 930,493 | |||||||
Installments due within one year | 9,500 | 10,464 | ||||||
|
|
|
| |||||
| 911,844 | 920,029 | |||||||
|
|
|
| |||||
F-36
Table of Contents
APTALIS HOLDINGS INC.
Notes to Consolidated Financial Statements
(amounts in the tables are stated in thousands of U.S. dollars, except share related data)
On April 18, 2012, the Company’s existing credit agreement was amended and restated in its entirety as the Second Amended and Restated Credit Agreement (the “Amended Credit Agreement”), which governs the Amended Credit Facilities. The amendments included redesignating all outstanding term loans as “Term B-1 Loans” and providing a new tranche of term loans in an aggregate principal amount of $200,000,000 (“Term B-2 Loans”). The proceeds of the Term B-2 Loans were used to finance the redemption of the Senior Unsecured Notes.
The Company’s Amended Credit Facilities totaling $1,097,000,000 is comprised of Term B-1 Loans amounting to $750,000,000, Term B2- Loans amounting to $200,000,000 and a Senior Secured Revolving Credit Facility totaling $147,000,000. The Senior Secured Revolving Credit Facility is comprised of $115,000,000 of existing revolving credit commitments that were extended or issued (the “Extended Commitments”) and $32,000,000 of existing revolving credit commitments that were not extended (the “ Unextended Commitments”) pursuant to the Senior Secured Revolving Credit Facility. The Amended Credit Facilities bear interest at a variable rate available composed of either the Federal Funds Rate or the British Banker Association LIBOR, at the option of the Company, plus the applicable rate based on the consolidated total leverage ratio of the Company and certain of its subsidiaries for the preceding twelve months. The principal amount of the Term B-1 loans and Term B-2 loans amortize in equal quarterly installments in aggregate annual amounts equal to 1% of the original principal amount with payments beginning in fiscal year 2012. The principal amount outstanding of the Term B-1 loans and Term B-2 loans will be due and payable on February 11, 2017. The principal amount of outstanding loans under the Senior Secured Revolving Facility will be due and payable on February 11, 2016 with respect to Extended Commitments and on February 25, 2014 with respect to Unextended Commitments. As at September 30, 2013, $950,000,000 of term loans comprised of Term B-1 Loans amounting to $750,000,000 and Term B2- Loans amounting to $200,000,000 had been issued of which $926,375,000 remains outstanding. No amounts had been drawn during the year against the revolving credit facility. The term loans were priced at $0.995 and $0.980 respectively, with yields to maturity of 5.6% and 6.0% respectively, before the effect of interest rate hedging transactions as disclosed in Note 19.
The credit agreement governing the Amended and Restated Senior Secured Credit Facilities requires the Company to prepay outstanding term loans contingent upon the occurrence of events, subject to certain exceptions, with: (1) 100% of the net cash proceeds of any incurrence of debt other than debt permitted under the Amended and Restated Senior Secured Credit Facilities, (2) commencing with the fiscal year ended September 30, 2012, 50% (which percentage will be reduced if the senior secured leverage ratio is less than a specified ratio) of the annual excess cash flow (as defined in the credit agreement governing the Senior Secured Term Loan Facility) and (3) 100% of the net cash proceeds of all non-ordinary course asset sales or other dispositions of property (including casualty events) by the Company or its subsidiaries, subject to reinvestment rights and certain other exceptions.
Pursuant to the annual excess cash flow requirements defined in the preceding credit agreement, the Company was required to prepay $13,163,000 of outstanding term loans in the year ended September 30, 2011. On October 4, 2013, the Company completed a refinancing of the term loans outstanding under the Amended Credit Facilities further described in Note 24. As a result of the refinancing, the Company is not required to make prepayments in the year ending September 30, 2013. The Company was not required to make prepayments in the year ending September 30, 2012.
During year ended September 30, 2011, the Company had borrowed $500,000,000 of the Term B-1 Loans at the closing of the acquisition of Eurand. A portion of the proceeds were used to repay the outstanding term loan portion amounting to $125,660,000 of the Company’s then existing senior
F-37
Table of Contents
APTALIS HOLDINGS INC.
Notes to Consolidated Financial Statements
(amounts in the tables are stated in thousands of U.S. dollars, except share related data)
secured credit facilities. Following the repayment, all unamortized deferred financing fees of $2,653,000 and original issuance discount of $3,188,000 related to the term loan were written off and are included in Loss on extinguishment of debt in the accompanying statement of consolidated operations during the year ended September 30, 2011.
On May 6, 2008, the Company had issued $235,000,000 of 12.75% senior unsecured notes due March 1, 2016, (the “Senior Unsecured Notes”). The Senior Unsecured Notes were priced at $0.9884 with a yield to maturity of 13.16%. On March 19, 2012, the Company redeemed $40,000,000 of the Senior Unsecured Notes at a redemption price of 106.375%. The aggregate redemption amount consisted of $40,000,000 in aggregate principal, and $2,550,000 of redemption premium which is included in Loss on extinguishment of debt in the accompanying consolidated statements of operations during the year ended September 30, 2012. Following the redemption, unamortized deferred financing fees of $892,000 and original issuance discount of $241,000 related to the redeemed portion of the notes were written off and included in Loss on extinguishment of debt during the year ended September 30, 2012.
On April 4, 2012, the Company commenced a cash tender offer for any and all of its outstanding 12.75% Senior Unsecured Notes due March 1, 2016 as well as a solicitation of consents to amend the Senior Unsecured Notes Indenture dated as of May 6, 2008, among the Company, the guarantors party thereto and The Bank of New York, as trustee. Note holders received a consent payment of $30 per $1,000 principal amount of notes properly tendered and consents to the proposed amendments to the Indenture delivered before the close of business on April 17, 2012. Note holders received a tender offer consideration of $1,041.25 per $1,000 principal amount of notes, plus any accrued and unpaid interest on the notes up to, but not including, the payment date for the notes properly tendered before midnight on May 1, 2012. The terms of the offer are described in the Offer to Purchase and Consent Solicitation Statement dated April 4, 2012 and a related Consent and Letter of Transmittal which were sent to the Note holders.
The Company received tenders and consents from the holders of approximately of $157,442,000 or 80.7%, of the aggregate principal amount of its senior unsecured notes and accepted for payment all notes validly tendered. Based on the consents received, on April 18, 2012, the Company and the trustee under the indenture governing the senior unsecured notes (the “Indenture”) entered into a supplemental indenture (the “Supplemental Indenture”) that eliminated substantially all of the affirmative and restrictive covenants (other than, among other covenants, the covenant to pay interest and premium, if any, on, and principal of, the notes when due) and certain events of default and related provisions under the Indenture. The supplemental indenture also eliminated the requirement to disclose consolidating financial information for the Company and its subsidiary guarantors and non-guarantors. In addition, the Company discharged its remaining obligations under the Indenture, as amended by the Supplemental Indenture, by causing to be delivered a notice of redemption, delivered on April 18, 2012, to holders of the remaining notes and deposited in trust, funds sufficient to pay and discharge all remaining indebtedness on the notes, including accrued and unpaid interest. As a result of the Company’s entering into a supplemental indenture that eliminates any requirement to be a voluntary filer, and the satisfaction and discharge of the indenture governing all the Company’s outstanding Notes, the Company has ceased to file quarterly and annual reports with the SEC.
The Company used cash on hand, together with the proceeds of the Term B-2 loans to fund payments to holders who validly tendered their notes prior to the consent deadline of April 17, 2012 and funded the repurchase, redemption or other retirement of the remaining Notes as described in the Supplemental Indenture.
F-38
Table of Contents
APTALIS HOLDINGS INC.
Notes to Consolidated Financial Statements
(amounts in the tables are stated in thousands of U.S. dollars, except share related data)
The total redemption amount consisted of $195,000,000 in aggregate principal, and $13,611,000 of redemption premiums which is included in Loss on extinguishment of debt in the accompanying consolidated statements of operations during year ending September 30, 2012. Following the redemption, all unamortized deferred financing fees of $4,313,000 and original issuance discount of $1,163,000 related to these notes were written off and along with related expenses of $357,000 are included in Loss on extinguishment of debt during the year ended September 30, 2012.
Payments required in each of the next four years from the date of the balance sheet to meet the retirement provisions of the long-term debt are as follows:
| $ | ||||
2014 | 9,500 | |||
2015 | 9,500 | |||
2016 | 9,500 | |||
2017 | 897,875 | |||
|
| |||
| 926,375 | ||||
Unamortized original issuance discount | 5,031 | |||
|
| |||
| 921,344 | ||||
|
| |||
| 15. | Stock Incentive Plans |
Management equity incentive plan
In April 2008, the Company adopted a Management Equity Incentive Plan (the “MEIP”), pursuant to which options are granted to select employees and directors of the Company. The MEIP provides that a maximum of 3,833,307 common shares of the Company are issuable pursuant to the exercise of options. The per share purchase price cannot be less than the fair value of the common share of the Company at the grant date and the option expires no later than ten years from the date of grant. Vesting of these stock options is split into three categories: (1) time-based options: 50% of option grants generally vest ratably over five years and feature a fixed exercise price equal to the fair value of common shares of the Company on grant date; (2) premium options: 25% of stock option grants with an exercise price initially equal to the fair value of common shares on grant date that will increase by 10% each year and generally vesting ratably over five years; and (3) performance-based options: 25% of stock option grants with a fixed exercise price equal to the fair value of common shares on grant date which vest upon the occurrence of a liquidity event (as defined under the terms of the MEIP) based on the achievement of return targets calculated based on the return received by majority shareholders from the liquidity event. While the time-based options and the premium options are expensed over the requisite service period, the performance-based options will not be expensed until the occurrence of the liquidity event. The MEIP was amended and restated effective February 11, 2011 primarily to reflect an increase to a maximum of 5,033,507 common shares of the Company issuable pursuant to the exercise of options and to change the required return targets that need to be achieved for vesting performance-based options issued under the amended and restated plan.
In May 2011, the Company approved a one-time voluntary stock option exchange program (the “Program”) under which eligible employees (which included executive officers and directors) were given the opportunity to surrender all of their outstanding options with an exercise price of $10.00 per share or higher and granted on or prior to February 10, 2011 for cancellation in exchange for the grant of an equal number of replacement options with an exercise price per share equal to the fair market value on the exchange date
F-39
Table of Contents
APTALIS HOLDINGS INC.
Notes to Consolidated Financial Statements
(amounts in the tables are stated in thousands of U.S. dollars, except share related data)
($10 at the “cancellation and exchange date”) and with different vesting terms for premium and performance-based options. The terms of the time-based options remain unchanged. The terms of the premium and performance-based options were modified in the replacement options as follows:
| Ÿ | Premium options—option grants with an exercise price initially equal to the fair value of common stock on the regrant date that will increase by 10% each year. 20% of options vested immediately on the cancellation and exchange date and the remaining 80% will vest ratably over 4 years from the cancellation and exchange date. |
| Ÿ | Performance based options—options grants with a fixed exercise price equal to the fair value of common stock on the cancellation and exchange date which vest upon the occurrence of a liquidity event based on the achievement of return targets calculated based on the return received by majority shareholders from the liquidity event and defined under the terms of the MEIP plan amended and restated effective February 11, 2011. |
The goal of the exchange offer was to help reinforce the intended purpose of the equity incentive plan, which is to retain and motivate key employees and ultimately help build shareholder value. The Program commenced on July 21, 2011 and expired on September 16, 2011. On September 22, 2011, the Company accepted for cancellation eligible options to purchase 785,000 shares of its common stock and 785,000 replacement options were granted with an exercise price of $10 which represented fair market value on the cancellation and exchange date. The replacement options have a contractual term of 10 years. The exchange was treated as a modification and the incremental expense associated with the exchange was immaterial.
The following table presents the changes to the number of stock options outstanding under the MEIP:
| Year Ended September 30, | ||||||||||||||||
| 2013 | 2012 | |||||||||||||||
| Number of options | Weighted average exercise price | Number of options | Weighted average exercise price | |||||||||||||
| $ | $ | |||||||||||||||
Balance, beginning of period | 4,113,000 | 10.94 | 3,970,250 | 10.40 | ||||||||||||
Granted | 125,000 | 19.84 | 575,000 | 12.88 | ||||||||||||
Exercised | (46,536 | ) | 10.36 | (85,050 | ) | 10.42 | ||||||||||
Canceled and forfeited | (202,214 | ) | 11.06 | (347,200 | ) | 11.46 | ||||||||||
|
|
|
|
|
|
|
| |||||||||
Balance, end of period | 3,989,250 | 11.55 | 4,113,000 | 10.94 | ||||||||||||
|
|
|
|
|
|
|
| |||||||||
Options exercisable at end of year | 2,086,650 | 11.57 | 1,628,850 | 11.06 | ||||||||||||
|
|
|
|
|
|
|
| |||||||||
F-40
Table of Contents
APTALIS HOLDINGS INC.
Notes to Consolidated Financial Statements
(amounts in the tables are stated in thousands of U.S. dollars, except share related data)
Stock options outstanding as at September 30, 2013, are as follows:
| Options outstanding | Options exercisable | |||||||||||||||||||||||
| Number of options | Weighted average remaining contractual life | Weighted average exercise price | Number of options | Weighted average remaining contractual life | Weighted average exercise price | |||||||||||||||||||
| $ | $ | |||||||||||||||||||||||
Exercise price | ||||||||||||||||||||||||
$10.00—$14.00 | 3,315,000 | 6.39 | 10.52 | 1,629,900 | 5.79 | 10.31 | ||||||||||||||||||
$14.01—$18.00 | 540,500 | 5.37 | 15.82 | 454,000 | 4.75 | 16.03 | ||||||||||||||||||
$18.01—$20.50 | 133,750 | 9.30 | 19.73 | 2,750 | 8.95 | 18.15 | ||||||||||||||||||
|
|
|
|
|
|
|
|
|
|
|
| |||||||||||||
| 3,989,250 | 6.35 | 11.55 | 2,086,650 | 5.57 | 11.57 | |||||||||||||||||||
|
|
|
|
|
|
|
|
|
|
|
| |||||||||||||
Stock options outstanding as at September 30, 2012, are as follows:
| Options outstanding | Options exercisable | |||||||||||||||||||||||
| Number of options | Weighted average remaining contractual life | Weighted average exercise price | Number of options | Weighted average remaining contractual life | Weighted average exercise price | |||||||||||||||||||
| $ | $ | |||||||||||||||||||||||
Exercise price | ||||||||||||||||||||||||
$10.00—$14.00 | 3,649,000 | 7.50 | 10.47 | 1,285,350 | 6.62 | 10.10 | ||||||||||||||||||
$14.01—$18.00 | 464,000 | 5.87 | 14.67 | 343,500 | 5.54 | 14.64 | ||||||||||||||||||
$18.01—$20.50 | — | — | — | — | — | — | ||||||||||||||||||
|
|
|
|
|
|
|
|
|
|
|
| |||||||||||||
| 4,113,000 | 7.32 | 10.94 | 1,628,850 | 6.39 | 11.06 | |||||||||||||||||||
|
|
|
|
|
|
|
|
|
|
|
| |||||||||||||
The changes to the number of non-vested stock options for the years ended September 30, 2013, and September 30, 2012, are as follows:
| September 30, 2013 | September 30, 2012 | |||||||||||||||
| Number of options | Weighted average grant date fair value | Number of options | Weighted average grant date fair value | |||||||||||||
| $ | $ | |||||||||||||||
Balance, beginning of period | 2,484,150 | 3.25 | 2,730,450 | 3.15 | ||||||||||||
Granted | 125,000 | 4.49 | 575,000 | 3.65 | ||||||||||||
Vested | (546,950 | ) | 3.34 | (544,600 | ) | 3.26 | ||||||||||
Canceled and forfeited | (159,600 | ) | 2.99 | (276,700 | ) | 3.09 | ||||||||||
|
|
|
|
|
|
|
| |||||||||
Balance, end of period | 1,902,600 | 3.33 | 2,484,150 | 3.25 | ||||||||||||
|
|
|
|
|
|
|
| |||||||||
The weighted average grant date fair value of stock options granted under the MEIP was $4.49 for the year ended September 30, 2013 ($3.65 for the year ended September 30, 2012). The weighted average fair value of shares vested under the MEIP was $3.34 for the year ended September 30, 2013 ($3.26 for the year ended September 30, 2012).
F-41
Table of Contents
APTALIS HOLDINGS INC.
Notes to Consolidated Financial Statements
(amounts in the tables are stated in thousands of U.S. dollars, except share related data)
The fair value of each option award is estimated on the date of grant using the Black-Scholes valuation model for the service-based options and the Monte Carlo simulation model for the performance-based options. The expected life of options is based on the weighted contractual life based on the probability of change in control or a liquidity event. The expected volatility is based on historical volatility peer companies. The risk free interest rate is based on the average rate of return on U.S. Government Strips with a remaining term equal to the expected term of the option. The dividend yield reflects that the Company has not paid any cash dividends since inception and does not intend to pay any cash dividends in the foreseeable future.
The fair value estimates are based on the following weighted average assumptions for options granted:
| Year Ended September 30, | ||||||||
| 2013 | 2012 | |||||||
Expected term of options (years) | 4.23 | 4.87 | ||||||
Expected stock price volatility | 41.12 | % | 42.85 | % | ||||
Risk-free interest rate | 0.67 | % | 0.69 | % | ||||
Expected dividend | — | — | ||||||
Special equity grant
In April 2008, the Company approved the Restricted Stock Unit grant agreement and the penny option grant agreement (collectively “Equity Grant Agreements”) pursuant to which a one-time grant of equity-based awards of either restricted stock units (“RSUs”) or options to purchase shares of common stock of the Company for a penny (“Penny Options”) was made to certain employees of the Company. A maximum of 1,343,348 shares of common stock of the Company are issuable with respect to the special grants. As a result of the option to allow the recipients to elect to have an amount withheld that is in excess of the required minimum withholding under the current tax law, the special grants will be accounted for as liability awards. As a liability award, the fair value on which the expense is based is remeasured each period based on the estimated fair value and the final expense will be based on the fair value of the shares on the date the award is settled. Such final expense is reclassified to additional paid-in capital six months after the settlement of awards on the lapse of the aforementioned option allowed to the recipients. The RSUs and Penny Options expire no later than four years and ten years respectively from the date of grant. One third of the granted RSUs and Penny Options vested immediately on date of grant; one third vested on August 25, 2009, and the remainder vested on August 25, 2010.
The carrying value of an RSU or Penny Option is always equal to the estimated fair value of one common share of the Company. The RSUs and Penny Options entitle the holders to receive common shares of the Company at the end of a vesting period. The total number of RSUs and Penny Options granted was 1,343,348 with an initial fair value of $10, equal to the share price at the date of grant. As at September 30, 2013, there were 240,842 RSUs and Penny Options outstanding (248,314 as at September 30, 2012), all of which were vested (246,647 as at September 30, 2012).
The Company recorded share-based compensation expense of $2,847,000 relative to the MEIP and the Special Equity Grant for the year ended September 30, 2013, ($8,209,000 and $7,873,000 for the years ended September 30, 2012 and September 30, 2011 respectively) with related income tax benefits excluding the impact of valuation allowance of $299,000 ($1,755,000 and $1,409,000 for the years ended September 30, 2012 and September 30, 2011 respectively). The amount of expense has
F-42
Table of Contents
APTALIS HOLDINGS INC.
Notes to Consolidated Financial Statements
(amounts in the tables are stated in thousands of U.S. dollars, except share related data)
been reduced to take into account estimated forfeitures. As of September 30, 2013, there was $2,587,000 ($4,224,000 as of September 30, 2012) of total unrecognized compensation costs related to MEIP Grant based on the recorded fair value. These costs are expected to be recognized over a weighted average period of 4.5 years. As of September 30, 2013, there was $3,755,000 ($3,668,000 as at September 30, 2012) of compensation expense related to the performance based options that will be recognized upon the occurrence of a liquidity event.
Annual grant
In June 2008, the Company adopted a Long-Term Incentive Plan (the “LTIP”), whereby the Company is expected to grant annual awards to certain employees of the Company (the “participants”). The number of awards is initially based on the participant’s job level and base salary and is subsequently adjusted based on the outcome of certain financial performance conditions relating to the fiscal year. Each award that vests is ultimately settleable at the option of the participant in cash or in common shares of equivalent value. The awards vest (i) upon the occurrence of a liquidity event (as defined under the terms of the LTIP) and (ii) in varying percentages based on the level of return realized by majority shareholders as a result of the liquidity event.
The awards granted under this LTIP are eventually to be classified as liabilities in accordance with the FASB issued guidance on distinguishing liabilities from equity, since the award is for a fixed amount of value that can be settled at the option of the participant in (i) cash, or (ii) a variable number of common shares of equivalent value.
The Company will not recognize any compensation expense until such time as the occurrence of a liquidity event generating sufficient return to the majority shareholders (in order for the award to vest) is probable. If such an event were probable as of September 30, 2013, the value of the awards to be expensed by the Company would range between $11,318,000 and $13,582,000 depending on the level of return expected to be realized by the majority shareholders.
| 16. | Information Included in the Consolidated Operations and Cash Flows |
a) Financial expenses
| Year Ended September 30, | ||||||||||||
| 2013 | 2012 | 2011 | ||||||||||
| $ | $ | $ | ||||||||||
Interest on long-term debt , including amortization of original issuance discount of $1,316 in 2013 ($1,041 in 2012 and $1,459 in 2011) | 53,801 | 63,803 | 68,160 | |||||||||
Accretion expenses on amounts payable for the Mpex transaction | 1,822 | 2,509 | 901 | |||||||||
Interest and bank charges | 695 | 368 | 856 | |||||||||
Interest rate swaps and cap (Note 19) | 5,626 | 6,539 | 1,708 | |||||||||
Financing fees | 853 | 1,168 | 11,491 | |||||||||
Amortization of deferred debt issue expenses | 5,980 | 5,741 | 6,379 | |||||||||
|
|
|
|
|
| |||||||
| 68,777 | 80,128 | 89,495 | ||||||||||
|
|
|
|
|
| |||||||
F-43
Table of Contents
APTALIS HOLDINGS INC.
Notes to Consolidated Financial Statements
(amounts in the tables are stated in thousands of U.S. dollars, except share related data)
b) Other information
| Year Ended September 30, | ||||||||||||
| 2013 | 2012 | 2011 | ||||||||||
| $ | $ | $ | ||||||||||
Rental expenses | 3,451 | 3,896 | 4,223 | |||||||||
Shipping and handling expenses | 6,532 | 7,626 | 7,424 | |||||||||
Advertising expenses | 13,747 | 14,670 | 8,779 | |||||||||
Depreciation of property, plant and equipment | 13,961 | 12,767 | 12,261 | |||||||||
Amortization of intangible assets | 80,801 | 88,971 | 60,568 | |||||||||
Stock-based compensation expense | 2,847 | 8,209 | 7,873 | |||||||||
c) Accumulated other comprehensive loss
The components of accumulated other comprehensive loss are as follows:
| Foreign currency translation | Hedging contracts | Accumulated other comprehensive loss | ||||||||||
| $ | $ | |||||||||||
Balance, October 1, 2011 | (34,004 | ) | (15,965 | ) | (49,969 | ) | ||||||
Other comprehensive loss | (7,118 | ) | (1,417 | ) | (8,535 | ) | ||||||
|
|
|
|
|
| |||||||
Balance, September 30, 2012 | (41,122 | ) | (17,382 | ) | (58,504 | ) | ||||||
|
|
|
|
|
| |||||||
Balance, October 1, 2012 | (41,122 | ) | (17,382 | ) | (58,504 | ) | ||||||
Other comprehensive income | 7,081 | 3,347 | 10,428 | |||||||||
|
|
|
|
|
| |||||||
Balance, September 30, 2013 | (34,041 | ) | (14,035 | ) | (48,076 | ) | ||||||
|
|
|
|
|
| |||||||
Amounts in accumulated other comprehensive loss are presented net of the related tax impact. Foreign currency translation is not adjusted for income taxes as it relates to permanent investments in international subsidiaries.
d) Supplemental cash flow information
| Year Ended September 30, | ||||||||||||
| 2013 | 2012 | 2011 | ||||||||||
| $ | $ | $ | ||||||||||
Interest received | 412 | 231 | 441 | |||||||||
Interest paid | 58,147 | 71,766 | 57,616 | |||||||||
Income taxes received | 1,057 | 588 | 776 | |||||||||
Income taxes paid | 61,192 | 19,366 | 11,030 | |||||||||
Non-cash investing and financing activities: | ||||||||||||
Acquisition of Rectiv, purchase consideration at fair value | — | 139,200 | — | |||||||||
Accrual for purchase of property, plant and equipment | 3,887 | — | — | |||||||||
Stock-based compensation plan redemptions | — | (1,496 | ) | — | ||||||||
| 17. | Concentration of Credit Risk and Geographic Information |
The Company operates in one segment, pharmaceutical products, due to the internal reporting structure in place, the composition of its business operations and the level of detail contained in the Company’s Chief Operating Decision Maker financial information package.
F-44
Table of Contents
APTALIS HOLDINGS INC.
Notes to Consolidated Financial Statements
(amounts in the tables are stated in thousands of U.S. dollars, except share related data)
Three major customers in the U.S. market for which the sales represent 64.8% of revenue for the year ended September 30, 2013, (64.1% and 61.8% of revenue for the years ended September 30, 2012 and 2011 respectively) are detailed as follows:
| Year Ended September 30, | ||||||||||||
| 2013 | 2012 | 2011 | ||||||||||
| % | % | % | ||||||||||
McKesson Medical | 27.3 | 29.1 | 26.3 | |||||||||
Cardinal Health | 24.3 | 24.8 | 25.5 | |||||||||
Amerisource Bergen | 13.2 | 10.2 | 10.0 | |||||||||
|
|
|
|
|
| |||||||
| 64.8 | 64.1 | 61.8 | ||||||||||
|
|
|
|
|
| |||||||
Purchases from one supplier represent approximately 13% of the cost of goods sold for the year ended September 30, 2013, (11% and 12% for the years ended September 30, 2012 and 2011 respectively).
The Company purchases the majority of its inventory from third party manufacturers, many of whom are the sole source of products for the Company. The failure of such manufacturers to provide an uninterrupted supply of products could adversely impact the Company’s ability to sell such products.
The Company operates in the following geographic areas:
| Year Ended September 30, | ||||||||||||
| 2013 | 2012 | 2011 | ||||||||||
| $ | $ | $ | ||||||||||
Total revenue | ||||||||||||
United States | ||||||||||||
Domestic sales | 529,497 | 455,733 | 330,099 | |||||||||
Foreign sales | 19,055 | 13,675 | 7,542 | |||||||||
International | ||||||||||||
Canadian and EU sales | 109,394 | 116,625 | 113,797 | |||||||||
Other sales | 29,960 | 29,042 | 18,946 | |||||||||
|
|
|
|
|
| |||||||
| 687,906 | 615,075 | 470,384 | ||||||||||
|
|
|
|
|
| |||||||
Revenue is attributed to geographic areas based on the country of origin of the sales.
| September 30, 2013 | September 30, 2012 | |||||||
| $ | $ | |||||||
Property, plant, equipment and intangible assets | ||||||||
United States | 91,692 | 177,100 | ||||||
Europe | 401,623 | 428,300 | ||||||
Canada | 191,328 | 219,212 | ||||||
|
|
|
| |||||
| 684,643 | 824,612 | |||||||
|
|
|
| |||||
| September 30, 2013 | September 30, 2012 | |||||||
| $ | $ | |||||||
Goodwill | ||||||||
United States | 20,931 | 20,931 | ||||||
Europe | 97,240 | 95,507 | ||||||
Canada | 61,887 | 61,887 | ||||||
|
|
|
| |||||
| 180,058 | 178,325 | |||||||
|
|
|
| |||||
F-45
Table of Contents
APTALIS HOLDINGS INC.
Notes to Consolidated Financial Statements
(amounts in the tables are stated in thousands of U.S. dollars, except share related data)
| 18. | Financial Instruments |
Interest rate risk
The Company is exposed to interest rate risk on its variable interest-bearing term loans. The term loans bear interest based on British Banker Association LIBOR. As further disclosed in Note 19, the Company may enter into derivative financial instruments to manage its exposure to interest rate changes and reduce its overall cost of borrowing.
Currency risk
The Company is exposed to financial risk arising from fluctuations in foreign exchange rates and the degree of volatility of the rates. The Company has used derivative instruments historically to reduce its exposure to foreign currency risk. As at September 30, 2013, and September 30, 2012, no foreign exchange contracts were outstanding. As at September 30, 2013, the financial assets totaling $316,137,000 ($215,757,000 as at September 30, 2012) include cash and cash equivalents and accounts receivable for 4,738,000 Canadian dollars, 14,379,000 euros and 1,084,000 Swiss francs respectively (4,385,000 Canadian dollars, 23,006,000 euros and 1,036,000 Swiss francs as at September 30, 2012). As at September 30, 2013, the financial liabilities totaling $1,110,240,000 ($1,129,978,000 as at September 30, 2012) include accounts payable, accrued liabilities and long-term debt of 6,828,000 Canadian dollars, 21,119,000 euros and 1,000 Swiss francs respectively (6,308,000 Canadian dollars, 21,781,000 euros and 1,135,000 Swiss francs as at September 30, 2012).
Credit risk
Generally, the carrying amount of the Company’s financial assets exposed to credit risk, net of applicable provisions for losses, represents the maximum amount of exposure to credit risk. As at September 30, 2013 and September 30, 2012, the Company’s financial assets exposed to credit risk are composed primarily of cash and cash equivalents and accounts receivable.
As at September 30, 2013, the Company has approximately 85.2% of its cash and cash equivalents with one financial institution. At times, such deposits may exceed the amount insured by Federal Deposit Insurance Corporation.
Fair value of financial instruments held at carrying amount on the consolidated balance sheet
The estimated fair value of the financial instruments held at carrying amount is as follows:
| September 30, 2013 | September 30, 2012 | |||||||||||||||
| Fair value | Carrying amount | Fair value | Carrying amount | |||||||||||||
| $ | $ | $ | $ | |||||||||||||
Assets | ||||||||||||||||
Cash and cash equivalents | 229,903 | 229,903 | 115,010 | 115,010 | ||||||||||||
Accounts receivable, net | 86,234 | 86,234 | 100,747 | 100,747 | ||||||||||||
Liabilities | ||||||||||||||||
Accounts payable and accrued liabilities | 188,896 | 188,896 | 199,485 | 199,485 | ||||||||||||
Long-term debt | 925,819 | 921,344 | 934,499 | 930,493 | ||||||||||||
F-46
Table of Contents
APTALIS HOLDINGS INC.
Notes to Consolidated Financial Statements
(amounts in the tables are stated in thousands of U.S. dollars, except share related data)
The following methods and assumptions were used to calculate the estimated fair value of the financial instruments that are held at carrying amount on the consolidated balance sheet:
a) Financial instruments for which fair value approximates carrying amount
The estimated fair value of certain financial instruments shown on the consolidated balance sheet approximates their carrying amount. These financial instruments include cash and cash equivalents, accounts receivable, net, accounts payable and accrued liabilities.
b) Long-term debt
The fair value of the variable interest-bearing term loan has been established based on broker-dealer quotes and represents a Level 2 input for both 2012 and 2013.
| 19. | Derivates and Hedging Activities |
Risk management objective of using derivatives
The Company is exposed to certain risks arising from both its business operations and economic conditions. The Company principally manages its exposures to a wide variety of business and operational risks through management of its core business activities. The Company manages economic risks, including interest rate, liquidity, currency and credit risks primarily by managing the amount, sources, conditions and duration of its debt funding and the use of derivative financial instruments. Specifically, the Company enters into derivative financial instruments to manage exposures that arise from business activities that result in the payment of future known and uncertain cash amounts, the value of which is determined by interest rates. The Company’s derivative financial instruments, if any, are used to manage differences in the amount, timing and duration of the Company’s known or expected cash payments principally related to the Company’s borrowings.
Cash flow hedges of interest rate risk
The Company’s objectives in using interest rate derivatives are to add stability to interest expense and to manage its exposure to interest rate movements. To accomplish this objective, the Company primarily uses interest rate swaps and/or caps as part of its interest rate risk management strategy. While the Company seeks to mitigate interest rate risk by entering into hedging arrangements with counterparties that are large financial institutions that the Company deems to be creditworthy, it is possible that the hedging transactions, which are intended to limit losses, could adversely affect earnings. Furthermore, if the Company terminates a hedging arrangement, it may be obligated to pay certain costs, such as transaction or breakage fees. Interest rate swaps designated as cash flow hedges involve the receipt of variable-rate amounts from a counterparty in exchange for the Company making fixed-rate payments over the life of the agreements without exchange of the underlying notional amount. Interest rate caps designated as cash flow hedges protect the Company from increases in interest rates above the strike rate of the interest rate cap. During the fiscal year ended September 30, 2013, such derivatives were used to hedge the variable cash flows associated with a portion of the existing variable-rate debt.
The effective portion of changes in the fair value of derivatives designated and that qualify as cash flow hedges is recorded in Accumulated other comprehensive loss and is subsequently reclassified to earnings in the period in which the hedged forecasted transaction affects earnings. The ineffective portion of the change in fair value of the derivatives is recognized directly in earnings. The Company has an option to change the interest period on its LIBOR borrowings and selected the
F-47
Table of Contents
APTALIS HOLDINGS INC.
Notes to Consolidated Financial Statements
(amounts in the tables are stated in thousands of U.S. dollars, except share related data)
1 month interest period in June 2013. This created a basis mismatch with the Company’s hedged transaction and resulted in an insignificant hedge ineffectiveness recorded in earnings during the year ended September 30, 2013. The Company has selected the 3 month interest period in September 2013. There was no hedge ineffectiveness for the fiscal years ended September 30, 2012 and 2011.
As at September 30, 2013, the Company had two interest rate swaps outstanding with a combined current notional amount of $388,000,000 and one interest rate cap outstanding with a notional amount of $100,000,000 and were designated as cash flow hedges of interest rate risk on LIBOR-based debt and are further described below. The weighted average fixed interest rate on the swaps is 2.83%.
On April 4, 2011, the Company entered into two separate pay-fixed, receive-floating interest rate swap agreements with an effective date of June 30, 2011 which convert a portion of the variable rate debt under its Amended and Restated Senior Secured Credit Facilities to fixed rate debt. The first swap has a notional amount of $331,000,000, amortizing to $84,000,000 by its maturity in December 2015. At September 30, 2013, the notional amount of the first swap was $169,000,000. The second swap has a notional amount of $219,000,000 and matures in December 2016. These swaps are designated as cash flow hedges of interest rate risk. The interest rate swaps will fix the Company’s interest payments on the hedged debt at 2.386% for the first swap and 3.18% for the second swap, inclusive of a LIBOR floor of 1.5%, plus the appropriate margin on each debt interest period which is currently 4%. On June 25, 2013, the Company re-designated its interest rate swaps in order to expand the definition of the hedged transactions as part of its overall risk management strategy.
On June 27, 2012, the Company entered in an interest rate cap agreement with an effective date of September 30, 2012 which protects the Company from increases in the cash flows on its variable rate debt under its Second Amended and Restated Senior Secured Credit Facilities attributable to changes in LIBOR above the strike rate of the interest rate cap. The interest rate cap has a notional amount of $100,000,000 and matures in September 2016. The interest rate cap is designated as a cash flow hedge of interest rate risk and limits the Company’s interest payments on the hedged debt at 1.5%, plus the appropriate margin on each debt interest period which is currently 4%. On July 8, 2013, the Company re-designated its interest rate cap in order to expand the definition of the hedged transactions as part of its overall risk management strategy.
Amounts reported in Accumulated other comprehensive income related to derivatives are reclassified to interest expense as interest payments are made on the Company’s variable-rate debt. The Company estimates that $5,133,000 presently classified in Accumulated other comprehensive loss will be reclassified as an increase to interest expense during the next twelve months.
The table below presents the fair value of the Company’s derivative financial instruments as well as their classification on the consolidated balance sheet as at September 30, 2013:
| Liability Derivatives – Fair Value | ||||||||||
| September 30, 2013 | September 30, 2012 | ||||||||
Balance sheet location | ||||||||||
Derivatives designated as hedging instruments | $ | $ | ||||||||
Interest rate swaps | Other long-term liabilities | 11,733 | 17,305 | |||||||
Interest rate cap | Other long-term liabilities | 277 | 529 | |||||||
|
|
|
| |||||||
Total derivatives designated as hedging instruments | 12,010 | 17,834 | ||||||||
|
|
|
| |||||||
F-48
Table of Contents
APTALIS HOLDINGS INC.
Notes to Consolidated Financial Statements
(amounts in the tables are stated in thousands of U.S. dollars, except share related data)
The table below presents the effect of the Company’s derivative financial instruments on the consolidated operations for the fiscal years ended September 30, 2013, 2012 and 2011:
| Location in the Consolidated Financial Statements | Years Ended September 30, | |||||||||||||
| 2013 | 2012 | 2011 | ||||||||||||
Interest rate swaps and cap in cash flow hedging relationships | $ | $ | $ | |||||||||||
Loss recognized in other comprehensive income (loss) on derivatives (effective portion), net of tax of $78 ($195 in 2012 and $519 in 2011) | OCL | (131 | ) | (7,783 | ) | (17,583 | ) | |||||||
Loss reclassified from other comprehensive income (loss) into income (effective portion) | Financial expenses | (5,575 | ) | (6,539 | ) | (1,708 | ) | |||||||
Gain (loss) recognized in income on derivatives (ineffective portion and amount excluded from effectiveness testing) | Financial expenses | — | — | — | ||||||||||
The Company considers the impact of its and its counterparties’ credit risk on the fair value of the derivative financial instruments. At September 30, 2013, credit risk did not materially change the fair value of the Company’s derivative financial instruments.
The Company has agreements with each of its derivative counterparties that contain a provision whereby the Company could be declared in default on its derivative obligations if repayment of the underlying indebtedness is accelerated by the lender due to the Company’s default on the indebtedness. If the Company had breached this provision, it could have been required to settle its obligations under the agreements at their termination value, including accrued interest and excluding any adjustment for non-performance risk, related to these agreements of $12,732,000.
On November 8, 2013, the Company terminated its existing interest rate swap and cap agreements and entered into two new interest rate cap agreements. This transaction is further described in Note 24.
| 20. | Fair Value Measurements |
Financial assets and financial liabilities measured or disclosed at fair value on a recurring basis as at September 30, 2013 and September 30, 2012 are summarized below:
| Quoted prices in active markets for identical assets and liabilities (Level 1) | Significant other observable inputs (Level 2) | Significant unobservable inputs (Level 3) | Balance at September 30, 2013 | |||||||||||||
| $ | $ | $ | $ | |||||||||||||
Liabilities | ||||||||||||||||
Derivative financial instruments | — | 12,010 | — | 12,010 | ||||||||||||
Contingent consideration obligations | — | — | 29,594 | 29,594 | ||||||||||||
Long-term debt(1) | — | 925,819 | — | 925,819 | ||||||||||||
|
|
|
|
|
|
|
| |||||||||
| — | 937,829 | 29,594 | 967,423 | |||||||||||||
|
|
|
|
|
|
|
| |||||||||
F-49
Table of Contents
APTALIS HOLDINGS INC.
Notes to Consolidated Financial Statements
(amounts in the tables are stated in thousands of U.S. dollars, except share related data)
| Quoted prices in active markets for identical assets and liabilities (Level 1) | Significant other observable inputs (Level 2) | Significant unobservable inputs (Level 3) | Balance at September 30, 2012 | |||||||||||||
| $ | $ | $ | $ | |||||||||||||
Liabilities | ||||||||||||||||
Derivative financial instruments | — | 17,834 | — | 17,834 | ||||||||||||
Contingent consideration obligations | — | — | 95,249 | 95,249 | ||||||||||||
Long-term debt(1) | 934,499 | — | 934,499 | |||||||||||||
|
|
|
|
|
|
|
| |||||||||
| — | 952,333 | 95,249 | 1,047,582 | |||||||||||||
|
|
|
|
|
|
|
| |||||||||
| (1) | Long-term debt is measured at amortized cost and shown in the table above at Fair Value. |
Derivative financial instruments represent interest rate swap and interest rate cap agreements as more fully described in Note 19 and are measured at fair value based on market observable interest rate curves as of the measurement date.
The contingent consideration obligations are related to the Rectiv Transaction and the fair value measurement is determined using Level 3 inputs. The fair value of contingent consideration obligations is based on a probability-weighted income approach. The measurement is based on unobservable inputs supported by little or no market activity based on the Company’s assumptions. Significant unobservable inputs include the projected revenue estimates and the risk adjusted discount rate used to present value the probability weighted cash flows. Generally, a change in the discount rate assumption would result in a directionally opposite change in the contingent consideration obligation. The discount rate used in the fair value measurement is in the range of 7%-13% depending on the type of contingent payment. Changes in the fair value of the contingent consideration obligations are recorded in the Company’s consolidated statement of operations and included in operating income. The Company continues to monitor performance of Rectiv and may make adjustments to its valuation models in future periods. Given the sensitivity of the valuation in relation to changes in the above noted assumptions, such changes, if required, could have a material impact on our financial statements. As further described in Note 4, as a result of triggering events during the fourth quarter of the fiscal year ended September 30, 2013, the Company revisited its long-term projection assumptions used in its assessment of the contingent consideration obligations related to the Rectiv Transaction and recorded a change in the fair value of the contingent consideration which reduced the liability by $74,707,000 for the year ended September 30, 2013 in fair value adjustments to intangible assets and contingent consideration in our statements of operations.
The table below provides a summary of the changes in fair value, including net transfers in and/or out, of all financial assets and financial liabilities measured at fair value on a recurring basis using significant unobservable inputs (Level 3) for the years ended September 30, 2013 and September 30, 2012:
| Balance at October 1, 2012 | Transfers into (out of) Level 3 | Purchases and settlements, | Accretion and fair value adjustments recorded in income | Balance at September 30, 2013 | ||||||||||||||||
| $ | $ | $ | $ | $ | ||||||||||||||||
Liabilities | ||||||||||||||||||||
Contingent consideration obligations | 95,249 | — | (3,610 | ) | (62,045 | ) | 29,594 | |||||||||||||
F-50
Table of Contents
APTALIS HOLDINGS INC.
Notes to Consolidated Financial Statements
(amounts in the tables are stated in thousands of U.S. dollars, except share related data)
| Balance at October 1, 2011 | Transfers into (out of) Level 3 | Purchases and settlements | Accretion and fair value adjustments recorded in income | Balance at September 30, 2012 | ||||||||||||||||
| $ | $ | $ | $ | $ | ||||||||||||||||
Liabilities | ||||||||||||||||||||
Contingent consideration obligations | — | — | 99,424 | (4,175 | ) | 95,249 | ||||||||||||||
Certain financial assets and financial liabilities are measured at estimated fair value on a non-recurring basis. These instruments are subject to fair value adjustments only in certain circumstances (for example, when there is evidence of impairment).
Financial assets and liabilities measured or disclosed at fair value on a non-recurring basis as at
September 30, 2013 and September 30, 2012 are summarized below:
| Quoted prices in active markets for identical assets and liabilities (Level 1) | Significant other observable inputs (Level 2) | Significant unobservable inputs (Level 3) | Balance at September 30, 2013 | |||||||||||||
| $ | $ | $ | $ | |||||||||||||
Assets | ||||||||||||||||
Intangible assets | — | — | 589,173 | 589,173 | ||||||||||||
|
|
|
|
|
|
|
| |||||||||
| — | — | 589,173 | 589,173 | |||||||||||||
|
|
|
|
|
|
|
| |||||||||
| Quoted prices in active markets for identical assets and liabilities (Level 1) | Significant other observable inputs (Level 2) | Significant unobservable inputs (Level 3) | Balance at September 30, 2012 | |||||||||||||
| $ | $ | $ | $ | |||||||||||||
Assets | ||||||||||||||||
Intangible assets | — | — | 737,375 | 737,375 | ||||||||||||
|
|
|
|
|
|
|
| |||||||||
| — | — | 737,375 | 737,375 | |||||||||||||
|
|
|
|
|
|
|
| |||||||||
As is more fully described in Note 12, the Company recorded an impairment charge and fair value changes of $71,708,000 related to its Rectiv and Lamictal intangible assets during the fiscal year ended September 30, 2013.
| 21. | Related Party Transactions |
The Company recorded charges pursuant to the terms of a management fee arrangement with a controlling shareholding company of $7,021,000 during the year ended September 30, 2013 ($5,675,000 and $3,607,000 during the years ended September 30, 2012 and 2011 respectively). Additionally, during the year ended September 30, 2011, the Company recorded fees to a controlling shareholding company amounting to $5,028,000 of which $1,508,000 was accounted for as deferred debt issue costs, $2,514,000 as selling and administrative expense and $1,006,000 as financing fees. As at September 30, 2013, the Company accrued fees payable to a controlling shareholding company amounting to $1,724,000 ($1,419,000 as at September 30, 2012).
F-51
Table of Contents
APTALIS HOLDINGS INC.
Notes to Consolidated Financial Statements
(amounts in the tables are stated in thousands of U.S. dollars, except share related data)
| 22. | Commitments and Contingencies |
a) Commitments
The Company has entered into non-cancellable operating leases and service agreements with fixed minimum payment obligations expiring on different dates for the rental of office space, automotive equipment and other equipment and for administrative, research and development and other services.
Minimum future payments under these commitments for the next 5 years are as follows:
| (in millions of U.S. dollars) | For the years ending September 30, | |||||||||||||||||||||||
| 2014 | 2015 | 2016 | 2017 | 2018 and thereafter | Total | |||||||||||||||||||
| $ | $ | $ | $ | $ | $ | |||||||||||||||||||
Capital and Operating leases | 3,711 | 3,109 | 1,716 | 569 | 90 | 9,195 | ||||||||||||||||||
Other commitments | 2,714 | 2,458 | 2,512 | 316 | — | 8,000 | ||||||||||||||||||
|
|
|
|
|
|
|
|
|
|
|
| |||||||||||||
| 6,425 | 5,567 | 4,228 | 885 | 90 | 17,195 | |||||||||||||||||||
|
|
|
|
|
|
|
|
|
|
|
| |||||||||||||
b) Licensing agreements
The Company has recorded milestones of $3,250,000 and royalties of $5,502,000 as research and development expenses for the year ended September 30, 2013 (milestones of $3,500,000 and $1,250,000 for the years ended September 30, 2012 and 2011 respectively).
c) Royalties
The Company pays royalties on the sales of certain of its marketed products to unrelated third parties and technologies under license and similar agreements. The royalties charged to cost of goods sold for the years ended September 30, 2013, 2012 and 2011 were not material.
d) Contingencies
The Company and its subsidiaries are involved in litigation matters arising in the ordinary course and conduct of its business.
In May 2009, the Company entered into an agreement with the U.S. Department of Defense, or DOD, to remain eligible for inclusion on the DOD’s formulary and pursuant to which the Company agreed to pay rebates under the TRICARE retail pharmacy program. The Company began accounting for these rebates in the third quarter of fiscal year 2009. Under its contracting process, the DOD is further seeking rebates from pharmaceutical manufacturers on all prescriptions of covered prescription drugs filled under TRICARE from January 28, 2008, forward, unless DOD agrees to a waiver or compromise of amounts due. On November 30, 2009, in litigation initiated by third parties seeking to have the DOD’s ability to seek retroactive rebates invalidated, the Court affirmed DOD’s position that it is entitled to retroactive refunds on prescriptions filled on or after January 28, 2008. In October 2010, the DOD affirmed its former rulemaking which was the subject of litigation and its intention to seek to collect rebates for periods prior to the contract date. The Company estimated that its exposure to the retroactive rebates claimed by the DOD would not be material and recorded an accrual in fiscal year 2010. During the fiscal year ended September 30, 2013, the Company settled the matter and paid the rebates claimed at an amount substantially equivalent to its initial accrual.
F-52
Table of Contents
APTALIS HOLDINGS INC.
Notes to Consolidated Financial Statements
(amounts in the tables are stated in thousands of U.S. dollars, except share related data)
e) Litigation
In October 2008, Eurand and Cephalon (which exclusively licenses certain patents from Eurand) received Paragraph IV certification letters relating to ANDAs submitted to the FDA by Mylan Pharmaceuticals, Inc., or Mylan, and Barr Laboratories, Inc., or Barr, each requesting approval to market and sell a generic version of the 15 mg and 30 mg strengths of extended-release cyclobenzaprine hydrochloride (AMRIX). In November 2008, Eurand received a similar certification letter from Impax Laboratories, Inc., or Impax. In May 2009, Eurand received a similar certification letter from Anchen Pharmaceuticals, Inc., or Anchen. Mylan, Impax, and Anchen alleged that U.S. Patent Number 7,387,793, or the ‘793 Patent, entitled “Modified Release Dosage Forms of Skeletal Muscle Relaxants,” issued to Eurand, will not be infringed by the manufacture, use or sale of the product described in the applicable ANDA and reserved the right to challenge the validity and/or enforceability of the ‘793 Patent. Barr alleged that the ‘793 Patent is invalid, unenforceable and/or will not be infringed by its manufacture, use or sale of the product described in its ANDA. In late November 2008, Eurand filed a lawsuit with Cephalon, in the U.S. District Court in Delaware against Mylan (and its parent) and Barr (and its parent) for infringement of the ’793 Patent. In January 2009, Eurand filed a lawsuit with Cephalon in the U.S. District Court in Delaware against Impax for infringement of the ’793 Patent. In July 2009, Eurand filed a lawsuit with Cephalon in the U.S. District Court in Delaware against Anchen (and its parent) for infringement of the ’793 Patent. Subsequently, in response to additional Paragraph IV certification letters regarding U.S. Patent Number 7,544,372, or the ’372 Patent, entitled “Modified Release Dosage Forms of Skeletal Muscle Relaxants” Eurand and Cephalon also filed lawsuits against Mylan, Barr, and Anchen for the infringement of the ’372 Patent. All cases were consolidated in one action in the U.S. District Court in Delaware, and were tried in a bench trial in September-October 2010.
On October 7, 2010, both Eurand and Anesta AG, or Anesta, a wholly-owned subsidiary of Cephalon, reached an agreement to settle the pending patent infringement litigation over AMRIX with Impax. Under terms of the settlement, both Eurand and Anesta will grant to Impax a non-exclusive, royalty-bearing license to market and sell a generic version of AMRIX in the United States beginning one year prior to expiration of the ’793 Patent, which is expected to expire in February 2025, or earlier under certain circumstances.
On May 12, 2011, the U.S. District Court in Delaware rendered a decision against Eurand and Cephalon. On May 13, 2011, Mylan launched its product. Eurand and Cephalon appealed the District Court’s finding of obviousness to the Federal Circuit, and on May 24, 2011, the District Court issued an injunction order enjoining Mylan from selling any additional products pending the Federal Circuit’s decision. On April 16, 2012, the Federal Circuit reversed and vacated the judgment of invalidity by the U.S. District Court in Delaware in the patent infringement lawsuit by Eurand and Cephalon. Mylan filed a petition for rehearing en banc and on July 25, 2012, the petition was denied. Subsequently Mylan filed a petition for certiorari to the United States Supreme Court on October 23, 2012 and on January 14, 2013, the petition was denied. The case was remanded to the District Court for consideration of the issue of damages. The trial on the issue of damages is scheduled to commence on September 2, 2014.
The Company is involved (and expects to continue to be involved from time to time) in patent litigation relating to ANDAs filed by potential competitors seeking to market generic versions of the Company’s products. For example, in July 2013, in response to notice letters regarding the filings of ANDAs by Mylan Pharmaceuticals, Inc. and Mylan Inc. (collectively, “Mylan”), as well as Sandoz Inc. (“Sandoz”), seeking approval to market a generic version of CANASA, the Company filed patent infringement lawsuits alleging infringement of certain of its patents and seeking, among other things, injunctive relief. Mylan filed its Answer and Counterclaims in August 2013 and Sandoz filed its Answer and Counterclaims in September 2013, in each case contending that the Company’s patents are
F-53
Table of Contents
APTALIS HOLDINGS INC.
Notes to Consolidated Financial Statements
(amounts in the tables are stated in thousands of U.S. dollars, except share related data)
invalid or not infringed. The Company believes the ANDAs were filed before the patents covering CANASA were listed in the Orange Book, which generally means that the Company is not entitled to the 30-month stay of the approval of these ANDAs provided for by the Hatch-Waxman Act. While the Company intends to vigorously defend these and other patents and pursue its legal rights, it can offer no assurance as to when the pending or any future litigation will be decided, whether such lawsuits will be successful or that a generic equivalent of one or more of its products will not be approved and enter the market. An adverse outcome in such patent litigation could materially and adversely affect the Company’s revenues.
| 23. | Earnings Per Share |
The following table presents a reconciliation of basic and diluted loss per share:
| September 30, 2013 | September 30, 2012 | September 30, 2011 | ||||||||||
| $ | $ | $ | ||||||||||
Net income (loss) | 86,852 | (12,001 | ) | (191,590 | ) | |||||||
Weighted average shares outstanding: | ||||||||||||
Basic | 67,987,312 | 67,699,784 | 57,742,284 | |||||||||
Effect of dilutive securities | 1,187,369 | — | — | |||||||||
|
|
|
|
|
| |||||||
Diluted | 69,174,681 | 67,699,784 | 57,742,284 | |||||||||
|
|
|
|
|
| |||||||
Net income (loss) per share | ||||||||||||
Basic | 1.28 | (0.18 | ) | (3.32 | ) | |||||||
Diluted | 1.26 | (0.18 | ) | (3.32 | ) | |||||||
| 24. | Subsequent Events |
On October 4, 2013, the Company and certain other wholly-owned subsidiaries completed a refinancing consisting of the (i) repayment of all outstanding indebtedness under preexisting senior secured credit facilities, (ii) termination of preexisting senior secured credit facilities and (iii) execution of a new senior secured credit facility that provides for senior secured term loans in the amount of $1,250,000,000 and a senior secured revolving credit facility that allows borrowings of up to $150,000,000 (collectively, the “Refinancing”). As the result of the Refinancing, we anticipate recording a loss on extinguishment of approximately $5,300,000 in the first quarter of the 2014 fiscal year.
Following the Refinancing, we distributed approximately $399,500,000 to our shareholders, holders of our restricted stock units and certain holders of options (the “Distribution”). We also reduced the per share exercise prices of certain outstanding stock options, as allowable under the relevant option plan, to reflect the effects of the Distribution. The Distribution also resulted in the exercise of all vested penny options outstanding. As a result of these per share exercise price reductions of $5.67 per underlying share of each unvested option, we anticipate recording additional compensation cost charges of $4,000,000, beginning in the first quarter of fiscal year 2014, which will be recognized over the remaining vesting period of these options. The Refinancing and the Distribution are collectively referred to as the Recapitalization.
Our new senior secured credit facilities consist of (i) a revolving credit facility allowing for borrowings of up to $150,000,000, of which $25,000,000 may be in the form of letters of credit, and (ii) term B loans with an outstanding principal amount of $1,250,000,000 (excluding OID and upfront payments). The new senior secured revolving credit facility includes borrowing capacity available for letters of credit and for short-term borrowings. The term B loans were priced at $0.99 and an upfront fee of 50 basis points was paid on commitments under the senior secured revolving credit facility.
F-54
Table of Contents
APTALIS HOLDINGS INC.
Notes to Consolidated Financial Statements
(amounts in the tables are stated in thousands of U.S. dollars, except share related data)
Borrowings under the new senior secured credit facilities bear interest at a rate per annum equal, at our option, to either a base rate (subject to a floor of 2.0% in the case of term B loans) or a LIBOR rate (subject to a floor of 1.0% in the case of term B loans), plus, in each case, an applicable margin. Subject to the floor described in the immediately preceding sentence, the base rate is the highest of (1) the prime rate of Bank of America, N.A., (2) the federal funds effective rate plus 1/2 of 1.0% and (3) the one-month LIBOR rate plus 1.0%. Subject to the floor described in the first sentence of this paragraph, the LIBOR rate is determined by reference to the costs of funds for U.S. dollar deposits for the associated interest period and is adjusted for certain additional costs. The applicable margins for term B loan borrowings are 4.00% per annum on base rate borrowings and 5.00% per annum on LIBOR borrowings. The applicable margin for revolving loan borrowings are subject to quarterly adjustment based on Aptalis Pharma’s senior secured net leverage ratio and will range from (A) 3.50% to 3.75% per annum on revolving loans that are base rate borrowings and (B) 4.50% to 4.75% per annum on revolving loans that are LIBOR borrowings.
Further, upon or after the consummation of a Qualifying IPO, as defined, so long as Aptalis Pharma’s senior secured net leverage ratio does not exceed 3.25:1.00, the applicable margin with respect to term B loans and revolving loans (otherwise determined in accordance with the above) will be reduced by 0.50%.
In addition to paying interest on outstanding principal under the senior secured credit facilities, we are required to pay a commitment fee of 0.50% per annum on unutilized commitments under the senior secured revolving credit facility. This unutilized commitment fee is subject to quarterly adjustment based on Aptalis Pharma’s senior secured net leverage ratio but in no event will the commitment fee increase to higher than 0.5%. We are also required to pay customary letter of credit fees and agency fees.
On November 8, 2013, in conjunction with the refinancing, the Company terminated its existing interest rate swap and interest rate cap agreements and paid a total of $13,547,000 to its derivative counterparties. The Company then entered in two new interest rate cap agreements with an effective date of December 31, 2013 which protects the Company from increases in the cash flows on its variable rate debt under its October 4, 2013 Refinancing attributable to changes in LIBOR above the strike rate of the interest rate cap. The interest rate caps each have a notional amount of $275,000,000 amortizing to $25,000,000 by their maturity in December 2019. The interest rate caps are designated as cash flow hedges of interest rate risk and limits the Company’s interest payments on the hedged October 4, 2013 refinanced debt at 1.0%, plus the appropriate margin on each debt interest period which is currently 5.0%. The interest rate caps will fix the Company’s interest payments on the hedged debt at 6.78%.
F-55
Table of Contents
Shares
APTALIS HOLDINGS INC.
Common Stock
PROSPECTUS
| Goldman, Sachs & Co. | J.P. Morgan LLC |
| Barclays | Evercore | |
Through and including (the 25th day after the date of this prospectus), all dealers effecting transactions in these securities, whether or not participating in this offering, may be required to deliver a prospectus. This is in addition to a dealer’s obligation to deliver a prospectus when acting as an underwriter and with respect to an unsold allotment or subscription.
Table of Contents
Part II
INFORMATION NOT REQUIRED IN PROSPECTUS
| ITEM 13. | OTHER EXPENSES OF ISSUANCE AND DISTRIBUTION. |
The following table sets forth the fees and expenses payable by us in connection with the issuance and distribution of the common stock being registered hereunder. All amounts shown are estimates except the SEC registration fee, FINRA filing fee and listing fee.
| Amount To Be Paid | ||||
SEC registration fee | $ | |||
FINRA filing fee | $ | |||
Stock exchange listing fee and expenses | * | |||
Printing fees and engraving expenses | * | |||
Transfer agent and registrar fees and expenses | * | |||
Legal fees and expenses | * | |||
Accounting fees and expenses | * | |||
Miscellaneous expenses | * | |||
|
| |||
Total | $ | * | ||
|
| |||
| * | To be provided by amendment. |
| ITEM 14. | INDEMNIFICATION OF DIRECTORS AND OFFICERS. |
Section 145 of the DGCL provides as follows:
A corporation shall have the power to indemnify any person who was or is a party or is threatened to be made a party to any threatened, pending or completed action, suit or proceeding, whether civil, criminal, administrative or investigative (other than an action by or in the right of the corporation) by reason of the fact that the person is or was a director, officer, employee or agent of the corporation, or is or was serving at the request of the corporation as a director, officer, employee or agent of another corporation, partnership, joint venture, trust or other enterprise, against expenses (including attorneys’ fees), judgments, fines and amounts paid in settlement actually and reasonably incurred by him in connection with such action, suit or proceeding if the person acted in good faith and in a manner the person reasonably believed to be in or not opposed to the best interest of the corporation, and, with respect to any criminal action or proceeding, had no reasonable cause to believe his conduct was unlawful. The termination of any action, suit or proceeding by judgment, order, settlement, conviction or upon a plea of nolo contendere or its equivalent shall not, of itself, create a presumption that the person did not act in good faith and in a manner which the person reasonably believed to be in or not opposed to the best interests of the corporation, and, with respect to any criminal action or proceeding, had reasonable cause to believe that his conduct was unlawful.
A corporation shall have the power to indemnify any person who was or is a party or is threatened to be made a party to any threatened, pending or completed action or suit by or in the right of the corporation to procure a judgment in its favor by reason of the fact that the person is or was a director, officer, employee or agent of the corporation, or is or was serving at the request of the corporation as a director, officer, employee or agent of another corporation, partnership, joint venture, trust or other enterprise against expenses (including attorneys’ fees) actually and reasonably incurred by him in connection with the defense or settlement of such action or suit if the person acted in good faith and in a manner the person reasonably believed to be in or not opposed to the best interests of the corporation and except that no indemnification shall be made with respect to any claim, issue or matter
II-1
Table of Contents
as to which such person shall have been adjudged to be liable to the corporation unless and only to the extent that the Court of Chancery or the court in which such action or suit was brought shall determine upon application that, despite the adjudication of liability but in view of all the circumstances of the case, such person is fairly and reasonably entitled to indemnity for such expenses which the Court of Chancery or such other court shall deem proper.
As permitted by the DGCL, we have included in our restated certificate of incorporation a provision to eliminate the personal liability of our directors for monetary damages for breach of their fiduciary duties as directors, subject to certain exceptions. In addition, our restated certificate of incorporation and by-laws provide that we are required to indemnify our officers and directors under certain circumstances, including those circumstances in which indemnification would otherwise be discretionary, and we are required to advance expenses to our officers and directors as incurred in connection with proceedings against them for which they may be indemnified.
We intend to enter into indemnification agreements with our directors and officers. These agreements will provide broader indemnity rights than those provided under the DGCL and our restated certificate of incorporation. The indemnification agreements are not intended to deny or otherwise limit third-party or derivative suits against us or our directors or officers, but to the extent a director or officer were entitled to indemnity or contribution under the indemnification agreement, the financial burden of a third-party suit would be borne by us, and we would not benefit from derivative recoveries against the director or officer. Such recoveries would accrue to our benefit but would be offset by our obligations to the director or officer under the indemnification agreement.
The underwriting agreement provides that the underwriters are obligated, under certain circumstances, to indemnify our directors, officers and controlling persons against certain liabilities, including liabilities under the Securities Act. Reference is made to the form of underwriting agreement filed as Exhibit 1.1 hereto.
We maintain directors’ and officers’ liability insurance for the benefit of our directors and officers.
| ITEM 15. | RECENT SALES OF UNREGISTERED SECURITIES. |
Except as set forth below, in the three years preceding the filing of this registration statement, we have not issued any securities that were not registered under the Securities Act:
(1) On January 12, 2010, we granted a total of 5,000 restricted stock units pursuant to a consulting agreement to be settled in shares of our common stock.
(2) During the year ended December 31, 2010, we issued 8,250 shares of our common stock upon exercise of vested options for aggregate consideration of $85,250 under our 2008 Management Equity Incentive Plan.
(3) On February 11, 2011 we issued 14,000,000 shares of common stock to the TPG Funds for aggregate consideration of $140,000,000.
(4) During the year ended December 31, 2011, we issued an aggregate of 42,000 shares of our common stock for aggregate consideration of $420,000 under our Equity Investment Program.
(5) On April 12, 2011, we issued 5,500,000 shares of common stock to Investor Growth Capital, Ltd. for aggregate consideration of $55,000,000.
II-2
Table of Contents
(6) During the year ended December 31, 2012, we issued 85,050 shares of our common stock upon exercise of vested options for aggregate consideration of $850,500 under our 2011 Management Equity Incentive Plan and 1,800 shares of our common stock for aggregate consideration of $27,000 under our Equity Investment Program.
(7) Between January 1, 2013 and September 30, 2013, we issued 46,536 shares of our common stock upon exercise of vested options for aggregate consideration of $473,360 under our 2011 Management Equity Incentive Plan.
(8) On October 7, 2013, in connection with the Recapitalization, we also issued an aggregate of 118,883 shares of our common stock upon the exercise of certain penny options for aggregate consideration of $1,189.
(9) During the three years ended December 31, 2012, we issued options to purchase an aggregate of 2,622,000 shares of our common stock under our Management Equity Incentive Plans.
We deemed the offers, sales and issuances of the securities described above in paragraphs (3) and (5) to be exempt from registration under the Securities Act, in reliance on Section 4(a)(2) of the Securities Act, including Regulation D and Rule 506 promulgated thereunder, regarding transactions by an issuer not involving a public offering. All purchasers of securities in transactions exempt from registration pursuant to Regulation D represented to us that they were accredited investors and were acquiring the shares for investment purposes only and not with a view to, or for sale in connection with, any distribution thereof and that they could bear the risks of the investment and could hold the securities for an indefinite period of time. The purchasers received written disclosures that the securities had not been registered under the Securities Act and that any resale must be made pursuant to a registration statement or an available exemption from such registration.
We deemed the grants of stock options and the issuances of shares of common stock upon the exercise of stock options described above in paragraphs (1), (2), (4) and (6)–(9) as exempt from registration pursuant to Section 4(a)(2) of the Securities Act or in reliance on Rule 701 of the Securities Act as offers and sales of securities under compensatory benefit plans and contracts relating to compensation in compliance with Rule 701. Each of the recipients of securities in any transaction exempt from registration either received or had adequate access, through employment, business or other relationships, to information about us.
All certificates representing the securities issued in the transactions described in paragraphs (1)–(9) above included appropriate legends setting forth that the securities had not been offered or sold pursuant to a registration statement and describing the applicable restrictions on transfer of the securities. There were no underwriters employed in connection with any of the transactions set forth in this Item 15.
| ITEM 16. | EXHIBITS AND FINANCIAL STATEMENT SCHEDULES |
(a) Exhibits
A list of exhibits filed herewith is contained in the exhibit index that immediately precedes such exhibits and is incorporated herein by reference.
(b) Financial Statement Schedule
See page F-1 for financial statement schedules included in this Registration Statement, which are incorporated by reference herein.
II-3
Table of Contents
| ITEM 17. | UNDERTAKINGS |
The undersigned Registrant hereby undertakes to provide to the underwriters at the closing specified in the underwriting agreement certificates in such denominations and registered in such names as required by the underwriters to permit prompt delivery to each purchaser.
Insofar as indemnification by the Registrant for liabilities arising under the Securities Act may be permitted to directors, officers and controlling persons of the Registrant pursuant to the provisions described in Item 14 or otherwise, the Registrant has been advised that in the opinion of the Securities and Exchange Commission such indemnification is against public policy as expressed in the Securities Act and is, therefore, unenforceable. In the event that a claim for indemnification against such liabilities (other than the payment by the Registrant of expenses incurred or paid by a director, officer or controlling person of the Registrant in the successful defense of any action, suit or proceeding) is asserted by such director, officer or controlling person in connection with the securities being registered, the Registrant will, unless in the opinion of its counsel the matter has been settled by controlling precedent, submit to a court of appropriate jurisdiction the question whether such indemnification by it is against public policy as expressed in the Securities Act and will be governed by the final adjudication of such issue.
The undersigned Registrant hereby undertakes that:
(1) For purposes of determining any liability under the Securities Act, the information omitted from the form of prospectus filed as part of this registration statement in reliance upon Rule 430A and contained in a form of prospectus filed by the Registrant pursuant to Rule 424(b)(l) or (4) or 497(h) under the Securities Act shall be deemed to be part of this registration statement as of the time it was declared effective.
(2) For the purpose of determining any liability under the Securities Act, each post-effective amendment that contains a form of prospectus shall be deemed to be a new registration statement relating to the securities offered therein, and the offering of such securities at that time shall be deemed to be the initial bona fide offering thereof.
II-4
Table of Contents
SIGNATURES
Pursuant to the requirements of the Securities Act of 1933, the registrant has duly caused this registration statement to be signed on its behalf by the undersigned, thereunto duly authorized, in the City of and State of on , 2013.
APTALIS HOLDINGS INC. (Registrant) | ||||
By: |
| |||
| Name: Frank Verwiel | ||||
| Title: | President and Chief Executive Officer; Director | |||
II-5
Table of Contents
POWER OF ATTORNEY
The undersigned directors and officers of Aptalis Holdings Inc. hereby appoint each of Richard E. Maroun and Steve Gannon as attorney-in-fact for the undersigned, with full power of substitution for, and in the name, place and stead of, the undersigned, to sign and file with the Securities and Exchange Commission under the Securities Act, and to sign any registration statement for the same offering covered by this registration statement that is to be effective upon filing pursuant to Rule 462(b) promulgated under the Securities Act, any and all amendments (including post-effective amendments) and exhibits to this registration statement on Form S-1 and any and all applications and other documents to be filed with the Securities and Exchange Commission pertaining to the registration of the securities covered hereby, with full power and authority to do and perform any and all acts and things whatsoever requisite and necessary or desirable, hereby ratifying and confirming all that said attorney-in-fact, or his substitute or substitutes, may lawfully do or cause to be done by virtue hereof.
Pursuant to the requirements of the Securities Act, this registration statement onForm S-1 has been signed by the following persons in the capacities and on the dates indicated.
Signature | Title | Date | ||
Frank Verwiel, M.D. | President and Chief Executive Officer; Director (Principal Executive Officer) | , 2013 | ||
Steve Gannon | Senior Vice President, Chief Financial Officer and Treasurer (Principal Financial and Accounting Officer) | , 2013 | ||
Todd Sisitsky | Director | , 2013 | ||
Fred Cohen | Director | , 2013 | ||
Paul Hackwell | Director | , 2013 | ||
David Kessler | Director | , 2013 | ||
Ron Labrum | Director | , 2013 | ||
Abhijeet J. Lele | Director | , 2013 | ||
II-6
Table of Contents
Exhibit List
Exhibit | Description | |
| 1.1* | Form of Underwriting Agreement. | |
| 3.1* | Form of Amended and Restated Certificate of Incorporation of Aptalis Holdings Inc. | |
| 3.2* | Form of Amended and Restated Bylaws of Aptalis Holdings Inc. | |
| 4.1* | Form of Registration Rights Agreement, by and among Aptalis Holdings Inc. and the stockholders party thereto. | |
| 4.2 | U.S. Pledge and Security Agreement, dated as of October 4, 2013, between certain subsidiaries of Aptalis Pharma Inc. identified therein, as Grantors, and Bank of America, N.A., as Administrative Agent. | |
| 4.3 | Canadian Pledge and Security Agreement, dated as of October 4, 2013, between Aptalis Pharma Canada Inc., certain subsidiaries of Aptalis Pharma Inc. identified therein, as Grantors, and Bank of America, N.A., as Administrative Agent. | |
| 4.4 | Deed of Hypothec in favor of Bank of America, N.A., dated as of October 3, 2013. | |
| 4.5 | Debenture, dated as of October 4, 2013, between Aptalis Pharma Canada Inc. and Bank of America, N.A. | |
| 4.6 | Pledge of Debentures, dated as of October 4, 2013, between Aptalis Pharma Canada Inc. and the Secured Parties (as defined therein). | |
| 5.1* | Opinion of Ropes & Gray LLP. | |
| 10.1 | Finished Product Supply Agreement, dated as of October 8, 2003, by and between Sanofi-Aventis U.S. LLC (successor in interest of Aventis Pharmaceuticals Inc.) and Aptalis Pharma Inc. (f/k/a Axcan Pharma Inc.). | |
| 10.2 | Amendment No. 1 to Finished Product Supply Agreement, dated as of August 2, 2008, by and between Sanofi-Aventis U.S. LLC (successor in interest of Aventis Pharmaceuticals Inc.) and Aptalis Pharma Inc. (f/k/a Axcan Pharma Inc.). | |
| 10.3 | Supply Agreement, dated May 7, 2004, between Paddock Laboratories Inc. and Aptalis Pharma Canada Inc. (f/k/a Axcan Pharma Inc.). | |
| 10.4 | Amendment, dated as of August 29, 2013, to the Supply Agreement between Aptalis Pharma Canada, Inc. and Paddock Laboratories, LLC (assignee from Paddock Laboratories, Inc.). | |
| 10.5 | Supply Agreement, dated as of September 16, 2008, between Infar, S.A. and Aptalis Pharma Inc. (f/k/a Axcan Pharma Inc.). | |
| 10.6 | Amendment No. 1, dated as of January 2, 2013, to the Supply Agreement between Aptalis Pharma Canada, Inc. and Infar, S.A. | |
| 10.7 | Supply Contract by and among Aptalis Pharma S.r.l. (f/k/a Eurand S.p.A) and Nordmark Arzneimittel GmbH & Co., dated as of January 3, 2006. | |
| 10.8 | License Agreement between Nordmark Arzneimittel GmbH & Co. KG and Aptalis Pharma S.r.l. (f/k/a Eurand S.p.A), dated as of April 10, 2008. | |
| 10.9 | Credit Agreement, dated as of October 4, 2013, among Aptalis Pharma Inc. (f/k/a Axcan Intermediate Holdings, Inc.), as Parent Borrower, Aptalis Pharma Canada Inc., as Co-borrower, Aptalis MidHoldings Inc. (f/k/a Axcan Midco Inc.), as Holdings, Bank of America, N.A., as Administrative Agent, Swing Line Lender and L/C Issuer, and each other lender and agent from time to time party thereto. | |
E-1
Table of Contents
Exhibit | Description | |
| 10.10 | Guaranty, dated as of October 4, 2013, among Aptalis MidHoldings Inc. (f/k/a Axcan Midco Inc.), Aptalis Pharma Inc. (f/k/a Axcan Intermediate Holdings, Inc.), Aptalis Pharma Canada Inc., certain other subsidiaries of Aptalis Pharma Inc. from time to time party thereto and Bank of America, N.A., as Administrative Agent. | |
| 10.11* | Form of Stockholders Agreement, by and among Aptalis Holdings Inc. and the stockholders party thereto. | |
| 10.12 | Amended and Restated Aptalis Holdings Inc. Management Equity Incentive Plan, dated as of February 11, 2011. | |
| 10.13 | Aptalis Holdings Inc., (f/k/a Axcan Holdings Inc.) Management Equity Plan 2008 Appendix: French Sub-Plan. | |
| 10.14 | Aptalis Holdings Inc. Amended & Restated Employee Long Term Incentive Plan, dated February 11, 2011. | |
| 10.15 | Lease Agreement, dated as of August 28, 1991, by and between Teachers Insurance and Annuity Association of America and Aptalis Pharma US, Inc. (f/k/a Axcan Pharma US Inc.). | |
| 10.16 | Eleventh Amendment to Lease, dated as of November 18, 2008, by and between Teachers Insurance and Annuity Association of America and Aptalis Pharma US, Inc. (f/k/a Axcan Pharma US Inc.). | |
| 10.17 | Agreement of Lease, dated as of January 22, 2009, between SCC Building I Limited Partnership and Aptalis Pharma U.S., Inc. (f/k/a Axcan Pharma US, Inc.). | |
| 10.18 | First Amendment to Lease, dated September 12, 2011, by and between SCC Building I Limited Partnership and Aptalis Pharma US, Inc. | |
| 10.19 | Second Amendment to Lease, dated as of August 21, 2012, by and between SCC Building I Limited Partnership and Aptalis Pharma US, Inc. | |
| 10.20 | Agreement and Plan of Merger, by and among Aptalis Holdings Inc. (f/k/a Axcan Holdings Inc.), Mpex Pharmaceuticals, Inc. and the Securityholders’ Representative Committee, dated April 11, 2011. | |
| 10.21 | Commercialization and License Agreement entered into as of December 28, 2011, by and among Strakan International S.ÀR.L., ProStrakan Inc. and Aptalis Pharma US, Inc. | |
| 10.22* | Employment Agreement, dated July 3, 2008, between Aptalis Pharma Inc., Aptalis Pharma US, Inc., Aptalis Holdings Inc. and Steve Gannon. | |
| 10.23* | First Amendment to Employment Agreement dated February 6, 2013, between Aptalis Pharma Inc., Aptalis Pharma US, Inc., Aptalis Holdings Inc. and Steve Gannon. | |
| 10.24* | Amendment and Restatement of Employment Agreement, dated as of May 16, 2008, between Aptalis Pharma Canada, Inc. (f/k/a Axcan Pharma, Inc.), Aptalis Pharma US, Inc. (f/k/a Axcan Pharma US Inc.), Aptalis Holdings Inc., (f/k/a Axcan Holdings Inc.) and Dr. Frank A.G.M. Verwiel. | |
| 10.25* | Employment Agreement, dated February 27, 2011, between Aptalis Pharma Inc., Aptalis Pharma US, Inc., Aptalis Holdings, Inc. and John Fraher. | |
| 10.26* | First Amendment to Employment Agreement, dated as of January 21, 2013, between Aptalis Pharma Inc., Aptalis Pharma US, Inc., Aptalis Holdings, Inc. and John Fraher. | |
| 10.27 | Share Purchase Agreement, dated as of November 30, 2010, by and among Aptalis Holdings Inc. (f/k/a Axcan Holdings Inc.), Aptalis Holding B.V. (f/k/a Axcan Pharma Holding B.V.) and Eurand N.V. | |
E-2
Table of Contents
Exhibit | Description | |
| 10.28 | Amendment No. 1, dated as of December 16, 2010, to the Share Purchase Agreement by and among Aptalis Holdings Inc. (f/k/a Axcan Holdings Inc.), Aptalis Holding B.V. (f/k/a Axcan Pharma Holding B.V.) and Eurand N.V. | |
| 16.1 | Letter from Raymond Chabot Grant Thornton LLP regarding change of auditors. | |
| 21.1† | Subsidiaries of Aptalis Holdings Inc. | |
| 23.1† | Consent of PricewaterhouseCoopers LLP. | |
| 23.2† | Consent of Raymond Chabot Grant Thornton LLP. | |
| 23.3* | Consent of Ropes & Gray LLP. | |
| * | To be filed by amendment. |
| † | To be provided upon filing with the SEC. |
E-3