UNITED STATES
SECURITIES AND EXCHANGE COMMISSION
Washington, D.C. 20549
FORM N-CSR
CERTIFIED SHAREHOLDER REPORT OF REGISTERED MANAGEMENT
INVESTMENT COMPANIES
Investment Company Act File Number 811-22920
The Advisors’ Inner Circle Fund III
(Exact name of registrant as specified in charter)
SEI Investments
One Freedom Valley Drive
Oaks, PA 19456
(Address of principal executive offices) (Zip code)
SEI Investments
One Freedom Valley Drive
Oaks, PA 19456
(Name and address of agent for service)
Registrant’s telephone number, including area code: (877) 446-3863
Date of fiscal year end: October 31, 2022
Date of reporting period: October 31, 2022
| Item 1. | Reports to Stockholders. |
A copy of the report transmitted to stockholders pursuant to Rule 30e-1 under the Investment Company Act of 1940, as amended (the “Act”) (17 CFR § 270.30e-1), is attached hereto.
The Advisors’ Inner Circle Fund III
MetLife Core Plus Fund
| Annual Report | October 31, 2022 |
Investment Adviser: MetLife Investment Management, LLC
|
| THE ADVISORS’ INNER CIRCLE FUND III | MetLife Core Plus Fund October 31, 2022
|
|
| |||
| 1 | ||||
| 7 | ||||
| 30 | ||||
| 31 | ||||
| 32 | ||||
| 34 | ||||
| 36 | ||||
| 47 | ||||
| 48 | ||||
Trustees and Officers of the Advisors’ Inner Circle Fund III | 50 | |||
| 56 | ||||
The Fund files its complete schedule of investments with the Securities and Exchange Commission (“SEC”) for the first and third quarters of each fiscal year as an exhibit to its report on Form N-PORT. The Fund’s Forms N-Q and N-PORT are available on the SEC’s website at http://www.sec.gov, and may be reviewed and copied at the SEC’s Public Reference Room in Washington, DC. Information on the operation of the Public Reference Room may be obtained by calling 1-800-SEC-0330.
A description of the policies and procedures that the Fund uses to determine how to vote proxies relating to fund securities, as well as information relating to how the Fund voted proxies relating to fund securities during the most recent 12-month period ended June 30, will be available (i) without charge, upon request, by calling 1-800-252-4993; and (ii) on the Commission’s website at https://www.sec.gov.
| THE ADVISORS’ INNER CIRCLE FUND III | MetLife Core Plus Fund October 31, 2022
|
Investment Objective
The investment objective of the MetLife Core Plus Fund (the “Fund”) is to seek to maximize capital appreciation and income.
Review
The overweight to spread sectors and underweight allocation to US Treasuries detracted as credit spreads were volatile and widened out during the course of the 12-month period. Rates were also extremely volatile and the curve inverted. A slight underweight to duration and a flattening bias in the portfolio were modestly positive contributors to performance.
Overall, investment grade corporates led the bulk of underperformance with the driver being security selection within Industrials. The Energy, Tobacco, and Cable subsectors were all sources of challenged security selection. In Financials, subordinated holdings drove underperformance, in addition to those holdings in the Banking sector with European exposure. Generically, less liquid and underfollowed credits struggled in 2022, and a number of overweights fall into this category. An allocation to High Yield was also a detractor to performance, as the out-of-benchmark sector was under pressure amidst a turbulent macro environment.
Collateralized Mortgage-Backed Security (“CMBS”) exposure was positive, driven by an overweight to Fixed Rate Non-Agency AAA rated paper. Floating Rate CMBS bonds partially offset relative returns. Asset-Backed Securities (“ABS”) added to relative returns due to sector allocation. In a volatile year within fixed income markets, shorter high-quality sectors such as ABS outperformed nearly all other asset classes. Thus, our overweight to the sector aided performance. Collateralized Loan Obligations (“CLOs”) modestly detracted from performance as index spreads widened and the credit curve steepened. The primary driver was the portfolio’s allocation to AA CLOs. Residential Mortgage-Backed Securities (“RMBS”) drove underperformance due to an overweight to 30-year, low coupon Conventionals in Specified Pools.
Outlook
Looking ahead, it is hard to ignore the irrefutable truth that the Federal Reserve has one goal right now (and one goal only), and that is to temper inflation. To accomplish this will require more restrictive monetary policy and slower growth – which is not supportive of risk assets. To get the pendulum to shift to a more attractive environment for risk taking, the market will need to be able to better grasp both the timing of achieving peak inflation and the duration of the adjustment period necessary to return to the Fed’s targeted level of inflation. Neither of those signposts seem imminent. Brief rallies in the market have generally been accompanied by murmurs of Fed easing. We believe these to be misguided. Fed speakers are going out of their way to emphasize that their job will not be done until inflation is tamed – and we believe them. To us, the inflation battle is the overarching risk factor in the market right now, but that is not to diminish the quantity or severity of the other risks present. The war in Ukraine, the European gas crisis, and COVID lockdowns in China are part of a myriad of “knowns” in the market. What is more troubling are the second, third, fourth derivative “unknowns”. The recent UK pension fund crisis was a sobering reminder of the intertwined nature of markets, with collateral calls in the UK being met by selling of US credit (which is a much deeper market for the long duration
1
| THE ADVISORS’ INNER CIRCLE FUND III | MetLife Core Plus Fund October 31, 2022
|
assets owned in these funds). It is hard enough to assess the value of credit amidst the known issues – but the likelihood of further knock-on effects is too high to not anticipate a further discount for spreads.
It is not all bad news for credit investors. Valuations are getting more attractive by the day. Investment grade corporates ended the quarter at +159 OAS – 67 basis points wider year-to-date. More eye-popping is the 5.69% yield of the Bloomberg US Corporate Index. That is 336 basis points higher on the year. The phrase “There is No Alternative” or “TINA” was in vogue for the last few years when there seemed to be no attractive alternative for equities. We are not creative enough to invent new acronyms, but we feel comfortable suggesting TINA can be retired for now because the alternatives are plentiful. If you wanted 4% yields at the start of 2022 you had to buy high yield. Now you can get 4% from T-Bills. The resetting of valuations in 2022 should ultimately provide some level of support for fixed income assets – though the buyer base is likely to shift. Yield hungry domestic buyers – both institutional (e.g., pension, insurance) and retail are likely to welcome the new paradigm of a higher rate environment, while foreign investors are pulling back. They are pulling back due to the rapidly changing economics of hedged yields which have made US corporates hedged back to their local currency increasingly unattractive. It is too early to decipher which flow dynamic is likely to win out – but there are likely to be periods of uneven transition to add to an already volatile environment.
As we evaluate current valuations, we are reticent to get too mesmerized by spreads and yields that we have not seen since the onset of COVID. Historically there has been no magic ceiling for spreads, but credit has been no stranger to visiting OAS levels in the low 200s during periods of elevated volatility and recession. We may not reach those levels this time around due to the health of consumer and corporate balance sheets, but we believe there is enough global uncertainty that a future moment of capitulation could ultimately propel spreads towards those levels.
This process could take some time. There has been a well-defined trend this year of wider wides and wider tights in credit spreads. We would expect this pattern to persist within a broader widening trend. We recognize the difficulty in picking the lows, and so we will use these backups to gradually add risk back to the portfolio. One area of the market we feel comfortable adding to right now is short-dated credit. Flatter rate and spread curves have created extremely attractive opportunities to allocate capital in a maturity window in which we believe we can get very comfortable with the trajectory of the balance sheet. We believe we can structure portfolios to continue to add some yield advantage to the portfolio (at the expense of cash and Treasuries) while still maintaining a generally conservative risk posture until valuations cheapen further. Away from these front-end opportunities, we are intensely focused on the fundamental outlooks for the credits in which we are invested, and their ability to generate attractive risk adjusted returns in the context of a recessionary environment. To the extent that we can identify better opportunities, we are going to reposition into those more resilient credits. We will also continue to be active in the new issue market. Primary issuance has slowed dramatically as many issuers are waiting for calmer conditions, but elevated volatility has resulted in elevated concessions that offers us an opportunity to allocate to liquid credit at attractive valuations. Liquidity is valuable in this market, and so any tactical trading opportunities will likely be concentrated in the primary market, whereas we recognize that relative value trades into less liquid curve points will take longer to monetize.
The “all clear” for credit remains just a dot in the distance, but we believe this to be an
2
| THE ADVISORS’ INNER CIRCLE FUND III | MetLife Core Plus Fund October 31, 2022
|
environment where fundamental credit research will be critical to not only picking winners, but also avoiding the losers in what is likely to be a period of elevated volatility.
Structured Products
In last quarter’s update, we pointed out the Fed’s desired balance sheet run-off regarding agency MBS was going to fall well short of the targeted $35 billion a month. That has raised the specter of possible asset sales to reach their desired objective. We continue to maintain that MBS sales are a very tenuous proposition, and that active selling of MBS may damage an already challenging liquidity environment, ultimately pressuring mortgage spreads and contributing to even high mortgage rates. With mortgage rates up over 3.50% this year, a dysfunctional mortgage market is not something the Fed can easily solve given the current inflationary environment. However, high interest rate volatility combined with a technical backdrop where banks and REITs are dealing with an inverted curve, duration extension, and book value losses, make it difficult to construct a picture that improves the outlook for agency MBS – especially one that doesn’t involve more clarity into the Fed’s ultimate end game.
Over most of the Covid related recovery in asset prices, we maintained an underweight to agency MBS, as spreads were artificially suppressed by the Fed’s asset purchase program. Now that they have embarked on a passive quantitative tightening program, their support is no longer present and valuations are more compelling, making us much more constructive on spreads. Thus, we took advantage of the recent volatility to move to a modest overweight position. We continue to rotate out of TBA mortgages as roll specialness diminishes, and instead favor specified pools, a trend we expect to continue. We continue to focus on specified pools in lower coupons that have the propensity to pay faster than generic collateral, enhancing their yield profile. In higher coupons where negative convexity is more of a concern, our strategy it to buy call protection in the event interest rates fall, allowing portfolios to hold onto that high coupon for longer. With valuations as of this writing sitting on the cheaper side for the first time in years, we expect to move further overweight the basis. However, with volatility at extreme levels, we are operating under a regime where we are going to take what the market gives us in the quarter ahead.
The Non-Agency market has been especially hard hit by the sharp rise in interest rates during the year. While this is not a concern relative to credit quality, it points to the broader slowdown that is hitting the housing market. Underwriting has been strong during the run up in home prices, but with affordability stretched given high prices and high interest rates, we expect some modest stress to start to surface. Unlike the mid 2000’s where ARMs with low teasers were all the rage, the majority of what is in new production Non-Agency pools are loans to high quality borrowers with substantial down payments. In addition, Covid-era home buyers/ refinancers locked in ultra-cheap fixed rate financing, providing them with the ability to weather an economic downturn and incenting them to continue to pay their mortgage debt provided their employment situation remains stable. Unemployment will be the key driver of housing market stress during this cycle. Non-Agency spreads remain volatile taking their que from the broader risk markets. The new issue non-QM market is still pricing to structures we do not prefer given the ongoing uncertainty in the rates market. We continue to be patient in the sub-sector looking for seasoned securities at discount dollar prices. In addition, our focus in the reperforming loan market is on discount securities where speeds are supported by the seasoned nature of the collateral. We are focused on the AAA portion of the capital structure within the sector.
3
| THE ADVISORS’ INNER CIRCLE FUND III | MetLife Core Plus Fund October 31, 2022
|
We remain overweight CMBS and are comfortable with this positioning as the majority of this exposure is to shorter duration cashflows of seasoned deals; despite current headwinds much of the collateral properties within the deals have entrenched valuation improvements to allow for continued good performance and the ability to refinance. We favor bonds with stable cashflows such as front cash flow discount AAAs, which will not extend but are also protected from prepay risk due to their discount nature. We also are overweight AAA rated floating rate SASB and CRE CLO paper trading with spreads greater than 200. We find valuations attractive but also at the whim of increased secondary supply.
The ABS spread movements wider both this quarter and year to date have been immense. With these now wider spreads, we find several high-quality areas of ABS to be attractive, notably top of the credit stack paper within private student loans, subprime auto, equipment loans, and fleet lease auto paper. Tiering between issuers can be steep and we likely will invest primarily in first and second tier names to maintain liquidity as we enter a part of the year with likely diminished trading activity. We are avoiding unsecured consumer loans and subprime auto mezzanine bonds due to elevated credit risks.
In CLOs, we maintained our exposure throughout the quarter. Like other asset classes, spreads were volatile but ended the quarter off the wides. Higher coupons, because of the Fed’s aggressive hiking campaign, have kept high quality CLO floaters supported. However, these rate hikes will start to weigh on levered loans as the cost of capital increases to the end borrower. Defaults are expected to climb, but off very low levels. Even if defaults were to rise unexpectedly, the portfolio’s focus on the top of the capital structure (AAA/AA) will mitigate potential downgrade risks via robust credit enhancement and structural protections.
High Yield
As fixed income spreads have continued to widen out, coupled with rising rates, there has been renewed value in the High Yield universe. HY yields are nearing the peaks of 2011 and 2016, on pace to reach levels last seen in 2009. The spread differential relative to US Investment Grade assets has continued to widen, offering opportunities with additional compensation for down in quality risk. HY fundamentals appear strong with net leverage decreasing off the peaks, therefore we are comfortable going out the curve from a credit risk perspective. However, with lingering recession concerns, we continue to prefer securities within the BB portion of the market as well as stable, less cyclical single-B issuers, to buffer against potential declining corporate fundamentals in a broad sell-off. Dispersion and inflationary pressures will be continued themes, so we will look to shorter duration holdings to limit the downside risk, as a higher yielding environment will compensate us through shorter breakevens amid increased dispersion.
Emerging Markets
Macro uncertainty will continue to present challenges in the near term for Emerging Markets; however, as inflation peaks and interest rate volatility subsides, opportunities will likely arise in the space. We believe this current environment presents opportunities in the EM space, where yields on the indices are at levels not seen since 2009. Security selection has proven to be more important than ever in identifying issuers with strong fundamentals despite a sell-off due to market technicals. With EM corporates down 16% year-to-date and on track for the second worst year on record since the inception of the index, this weakness could drive performance over the next year horizon. EM Sovereigns, down 24% year-to-date, are also poised for strong
4
| THE ADVISORS’ INNER CIRCLE FUND III | MetLife Core Plus Fund October 31, 2022
|
upside if inflation peaks, if countries are able to stabilize currencies, and if IMF support remains strong for lower quality issuers.
The views present are MIM’s only, are subject to change, and may not reflect the manager’s current views. There can be no assurance that the views expressed above will prove accurate and should not be relied upon as a reliable indicator of future events. Any securities mentioned are for informational purposes only and do not represent a recommendation or an offer to buy, hold or sell any securities, and may not be held in client portfolios. Any performance or portfolio holdings cited here were current as of the date stated and are subject to change.
Definition of Comparative Index and Other Investment Terms
Bloomberg US Aggregate Bond Index is an index generally representing fixed rate, investment-grade government bonds, corporate debt securities, mortgage-backed securities, and asset-backed securities with minimum maturity dates of at least one year.
Bloomberg US Corporate Index measures the investment grade, fixed-rate, taxable corporate bond market. It includes USD-denominated securities publicly issued by US and non-US industrial, utility and financial issuers.
5
| THE ADVISORS’ INNER CIRCLE FUND III | MetLife Core Plus Fund October 31, 2022
|
Comparison of Change in the Value of a $5,000,000 Investment in the MetLife Core Plus Fund, I Class Shares versus the Bloomberg US Aggregate Bond Index.
TOTAL RETURN FOR THE YEAR ENDED OCTOBER 31, 2022 | ||||||||
| One Year Return | Three Year Return | Five Year Return | Annualized Inception to Date* | |||||
I Class Shares | -16.88% | -3.99% | -0.63% | 0.54% | ||||
R Class Shares** | -16.96% | -5.10% | -2.13% | -0.43% | ||||
Bloomberg US Aggregate Bond Index | -15.68% | -3.77% | -0.54% | 0.46% | ||||
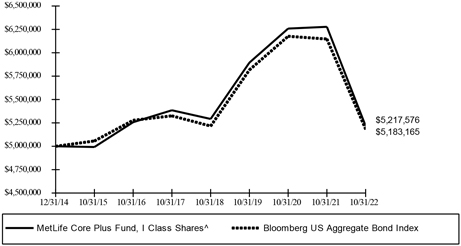
* The MetLife Core Plus Fund, I Class and R Class Shares, commenced operations on December 31, 2014.
** As R Class Shares only held seed money, Class R Shares did not incur distribution fees due to low net assets. If these fees were incurred the performance disclosed would have been lower.
^ The graph is based on only the I Class Shares.
The Fund’s performance assumes the reinvestment of dividends and capital gains. Index returns assume reinvestment of dividends and, unlike a portfolio’s returns, do not reflect any fees or expenses. If such fees and expenses were included in the index returns, the performance would have been lower. Please note that one cannot invest directly in an unmanaged index.
There are no assurances that the Fund will meet its stated objectives. The Fund’s holdings and allocations are subject to change because it is actively managed and should not be considered recommendations to buy individual securities.
Returns shown do not reflect the deduction of taxes that a shareholder would pay on Fund distributions or the redemption of Fund shares.
See definition of comparative index on page 5.
6
| THE ADVISORS’ INNER CIRCLE FUND III | MetLife Core Plus Fund October 31, 2022
|
SECTOR WEIGHTING † (unaudited)
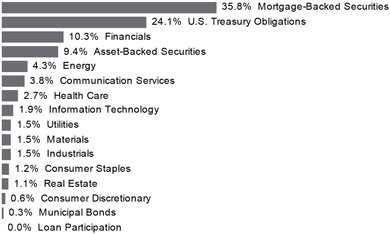
† Percentages are based on total investments.
The accompanying notes are an integral part of the financial statements.
7
| THE ADVISORS’ INNER CIRCLE FUND III | MetLife Core Plus Fund October 31, 2022
|
| MORTGAGE-BACKED SECURITIES — continued
| ||||||||
| Face Amount | Value | |||||||
| AGENCY MORTGAGE-BACKED OBLIGATIONS — continued | ||||||||
FHLMC Multifamily Structured Pass-Through Certificates, Ser X3FX, Cl A2FX | ||||||||
3.000%, 06/25/27 | $ | 910,000 | $ | 849,939 | ||||
FHLMC, Ser 2006-R006, Cl ZA | ||||||||
6.000%, 04/15/36 | 7,097 | 7,302 | ||||||
FHLMC, Ser 2010-3632, Cl PK | ||||||||
5.000%, 02/15/40 | 20,350 | 20,113 | ||||||
FHLMC, Ser 2012-271, Cl 30 | ||||||||
3.000%, 08/15/42 | 37,932 | 34,133 | ||||||
FHLMC, Ser 2015-4479, Cl HA | ||||||||
3.750%, 05/15/39 | 18,341 | 18,145 | ||||||
FHLMC, Ser 2017-356, Cl 300 | ||||||||
3.000%, 09/15/47 | 156,736 | 141,447 | ||||||
FNMA | ||||||||
6.000%, 09/01/39 | 676 | 700 | ||||||
5.500%, 04/01/36 to 07/01/40 | 136,647 | 136,269 | ||||||
5.000%, 02/01/31 | 15,650 | 15,561 | ||||||
4.500%, 04/01/35 to 06/01/52 | 904,736 | 864,877 | ||||||
4.000%, 06/01/42 to 05/01/52 | 4,975,184 | 4,608,871 | ||||||
3.500%, 07/01/30 to 04/01/52 | 4,357,015 | 3,911,032 | ||||||
3.040%, 01/01/28 | 165,000 | 151,292 | ||||||
3.000%, 12/01/31 to 12/01/51 | 10,218,970 | 8,948,776 | ||||||
2.500%, 06/01/50 to 04/01/52 | 11,947,368 | 9,911,211 | ||||||
2.000%, 05/01/36 to 12/01/51 | 18,401,944 | 14,749,163 | ||||||
1.850%, 09/01/35 | 281,089 | 231,360 | ||||||
FNMA, Ser 2001-T4, Cl A1 | ||||||||
7.500%, 07/25/41 | 1,426 | 1,419 | ||||||
FNMA, Ser 2005-24, Cl ZE | ||||||||
5.000%, 04/25/35 | 3,798 | 3,746 | ||||||
FNMA, Ser 2012-121, Cl TB | ||||||||
7.000%, 11/25/42 | 19,494 | 20,708 | ||||||
FNMA, Ser 2012-411, Cl A3 | ||||||||
3.000%, 08/25/42 | 421,841 | 373,002 | ||||||
The accompanying notes are an integral part of the financial statements.
8
| THE ADVISORS’ INNER CIRCLE FUND III | MetLife Core Plus Fund October 31, 2022
|
| MORTGAGE-BACKED SECURITIES — continued | ||||||||
| Face Amount | Value | |||||||
| AGENCY MORTGAGE-BACKED OBLIGATIONS — continued | ||||||||
GNMA | ||||||||
5.500%, 07/20/43 to 09/20/43 | $ | 4,081 | $ | 4,205 | ||||
4.690%, 06/20/62 (A) | 356 | 346 | ||||||
4.548%, 01/20/67 (A) | 51,732 | 50,730 | ||||||
4.500%, 03/15/42 | 45,992 | 44,828 | ||||||
3.000%, 04/20/45 | 72,335 | 64,676 | ||||||
2.500%, 04/20/51 to 11/20/51 | 1,924,759 | 1,634,554 | ||||||
GNMA TBA | ||||||||
4.000%, 11/01/35 | 1,059,000 | 975,753 | ||||||
3.500%, 11/15/41 | 889,000 | 795,576 | ||||||
3.000%, 11/15/52 | 912,000 | 793,796 | ||||||
GNMA, Ser 2010-H14, Cl BI, IO | ||||||||
1.388%, 07/20/60 (A) (B) | 1,554 | 57 | ||||||
GNMA, Ser 2017-H16, Cl PT | ||||||||
4.709%, 05/20/66 (A) | 228 | 226 | ||||||
UMBS TBA | ||||||||
5.000%, 11/01/37 | 1,910,000 | 1,841,732 | ||||||
4.500%, 11/15/34 | 4,767,346 | 4,471,622 | ||||||
4.000%, 11/12/39 | 2,265,997 | 2,059,543 | ||||||
3.500%, 11/01/40 | 2,172,000 | 1,908,792 | ||||||
3.000%, 11/15/42 | 1,023,000 | 869,310 | ||||||
2.500%, 11/25/27 to 11/15/52 | 5,054,253 | 4,285,987 | ||||||
2.000%, 11/15/37 to 11/15/52 | 3,684,620 | 3,066,665 | ||||||
|
| |||||||
| 83,212,189 | ||||||||
|
| |||||||
NON-AGENCY MORTGAGE-BACKED OBLIGATIONS — 8.6% |
| |||||||
1345 Avenue of the Americas & Park Avenue Plaza Trust, Ser 2005-1, Cl A3 | ||||||||
5.278%, 08/10/35 (C) | 331,081 | 317,372 | ||||||
Alen Mortgage Trust, Ser 2021-ACEN, Cl A | ||||||||
4.562%, ICE LIBOR USD 1 Month + 1.150%, 04/15/34 (C) | 585,000 | 556,072 | ||||||
Arbor Multifamily Mortgage Securities Trust, Ser 2021-MF2, Cl B | ||||||||
2.560%, 06/15/54 (A) (C) | 360,000 | 261,974 | ||||||
The accompanying notes are an integral part of the financial statements.
9
| THE ADVISORS’ INNER CIRCLE FUND III | MetLife Core Plus Fund October 31, 2022
|
| MORTGAGE-BACKED SECURITIES — continued | ||||||||
| Face Amount | Value | |||||||
NON-AGENCY MORTGAGE-BACKED OBLIGATIONS — continued |
| |||||||
BANK, Ser 2022-BNK40, Cl A4 | ||||||||
3.394%, 03/15/64 (A) | $ | 340,000 | $ | 285,514 | ||||
Bayview Commercial Asset Trust, Ser 2004-3, Cl A1 | ||||||||
4.141%, ICE LIBOR USD 1 Month + 0.555%, 01/25/35 (C) | 47,392 | 47,017 | ||||||
BBCMS Mortgage Trust, Ser 2020-C6, Cl AS | ||||||||
2.840%, 02/15/53 | 340,000 | 268,134 | ||||||
BBCMS Trust, Ser 2015-SRCH, Cl A1 | ||||||||
3.312%, 08/10/35 (C) | 581,925 | 540,127 | ||||||
Benchmark Mortgage Trust, Ser 2021-B31, Cl A5 | ||||||||
2.669%, 12/15/54 | 635,000 | 498,389 | ||||||
Benchmark Mortgage Trust, Ser 2022-B33, Cl A5 | ||||||||
3.458%, 03/15/55 | 525,000 | 444,367 | ||||||
Benchmark Mortgage Trust, Ser 2022-B35, Cl AS | ||||||||
4.445%, 05/15/55 (A) | 445,000 | 387,066 | ||||||
BMO Mortgage Trust, Ser 2022-C3, Cl AS | ||||||||
5.504%, 09/15/54 (A) | 410,000 | 387,064 | ||||||
BPR Trust, Ser 2022-OANA, Cl A | ||||||||
5.274%, TSFR1M + 1.898%, 04/15/37 (C) | 630,000 | 610,394 | ||||||
BWAY Mortgage Trust, Ser 2015-1740, Cl A | ||||||||
2.917%, 01/10/35 (C) | 1,185,000 | 1,055,966 | ||||||
BX Commercial Mortgage Trust, Ser 2019-XL, Cl A | ||||||||
4.332%, ICE LIBOR USD 1 Month + 0.920%, 10/15/36 (C) | 596,787 | 584,825 | ||||||
BX Mortgage Trust, Ser 2022-MVRK, Cl B | ||||||||
5.332%, TSFR1M + 1.916%, 03/15/39 (C) | 950,000 | 903,736 | ||||||
BX Trust, Ser 2019-MMP, Cl A | ||||||||
4.412%, ICE LIBOR USD 1 Month + 1.000%, 08/15/36 (C) | 497,510 | 481,315 | ||||||
BX Trust, Ser 2022-PSB, Cl A | ||||||||
5.827%, TSFR1M + 2.451%, 08/15/39 (C) | 100,000 | 99,689 | ||||||
CG-CCRE Commercial Mortgage Trust, Ser 2014-FL2, Cl A | ||||||||
5.266%, ICE LIBOR USD 1 Month + 1.854%, 11/15/31 (C) | 18,121 | 17,511 | ||||||
The accompanying notes are an integral part of the financial statements.
10
| THE ADVISORS’ INNER CIRCLE FUND III | MetLife Core Plus Fund October 31, 2022
|
| MORTGAGE-BACKED SECURITIES — continued | ||||||||
| Face Amount | Value | |||||||
NON-AGENCY MORTGAGE-BACKED OBLIGATIONS — continued |
| |||||||
CIM Trust, Ser 2021-R6, Cl A1 | ||||||||
1.425%, 07/25/61 (A) (C) | $ | 845,904 | $ | 738,149 | ||||
CIM Trust, Ser 2022-R2, Cl A1 | ||||||||
3.750%, 12/25/61 (A) (C) | 499,208 | 464,643 | ||||||
Citigroup Mortgage Loan Trust, Ser 2021-INV1, Cl A3A | ||||||||
2.500%, 05/25/51 (A) (C) | 734,242 | 566,083 | ||||||
COMM Mortgage Trust, Ser 2013-LC6, Cl AM | ||||||||
3.282%, 01/10/46 | 1,010,000 | 1,006,281 | ||||||
COMM Mortgage Trust, Ser 2015-CR26, Cl C | ||||||||
4.469%, 10/10/48 (A) | 715,000 | 645,166 | ||||||
COMM Mortgage Trust, Ser 2020-CBM, Cl A2 | ||||||||
2.896%, 02/10/37 (C) | 145,000 | 132,327 | ||||||
Commercial Mortgage Trust, Ser 2022-LPFL, Cl B | ||||||||
5.271%, TSFR1M + 1.896%, 03/15/39 (C) | 195,000 | 186,770 | ||||||
CSAIL Commercial Mortgage Trust, Ser 2015-C3, Cl A3 | ||||||||
3.447%, 08/15/48 | 112,615 | 106,024 | ||||||
CSAIL Commercial Mortgage Trust, Ser 2015-C3, Cl ASB | ||||||||
3.448%, 08/15/48 | 319,449 | 310,367 | ||||||
CSAIL Commercial Mortgage Trust, Ser 2016-C7, Cl ASB | ||||||||
3.314%, 11/15/49 | 424,419 | 408,078 | ||||||
CSMC Trust, Ser 2016-NXSR, Cl A4 | ||||||||
3.795%, 12/15/49 (A) | 430,000 | 397,766 | ||||||
CSMC Trust, Ser 2021-RPL3, Cl A1 | ||||||||
2.000%, 01/25/60 (A) (C) | 751,858 | 646,797 | ||||||
CSMC, Ser 2014-USA, Cl A2 | ||||||||
3.953%, 09/15/37 (C) | 610,000 | 548,433 | ||||||
CSMC, Ser 2021-NQM8, Cl A1 | ||||||||
1.841%, 10/25/66 (A) (C) | 820,865 | 648,335 | ||||||
DBCCRE Mortgage Trust, Ser 2014-ARCP, Cl A | ||||||||
4.238%, 01/10/34 (C) | 300,000 | 288,005 | ||||||
DBCCRE Mortgage Trust, Ser 2014-ARCP, Cl C | ||||||||
4.935%, 01/10/34 (A) (C) | 450,000 | 421,543 | ||||||
The accompanying notes are an integral part of the financial statements.
11
| THE ADVISORS’ INNER CIRCLE FUND III | MetLife Core Plus Fund October 31, 2022
|
| MORTGAGE-BACKED SECURITIES — continued | ||||||||
| Face Amount | Value | |||||||
NON-AGENCY MORTGAGE-BACKED OBLIGATIONS — continued |
| |||||||
EQUS Mortgage Trust, Ser 2021-EQAZ, Cl B | ||||||||
4.512%, ICE LIBOR USD 1 Month + 1.100%, 10/15/38 (C) | $ | 455,000 | $ 428,226 | |||||
FHLMC Whole Loan Securities Trust, Ser 2016-SC01, Cl 2A | ||||||||
3.500%, 07/25/46 | 31,798 | 29,683 | ||||||
Finance of America Structured Securities Trust, Ser 2021-JR1, Cl A2 | ||||||||
2.000%, 04/25/51 | 840,539 | 785,150 | ||||||
Finance of America Structured Securities Trust, Ser 2021-S2 | ||||||||
1.750%, 09/25/51 | 948,744 | 867,917 | ||||||
FREMF Mortgage Trust, Ser 2013-K31, Cl C | ||||||||
3.632%, 07/25/46 (A) (C) | 25,000 | 24,602 | ||||||
FWD Securitization Trust, Ser 2019-INV1, Cl A1 | ||||||||
2.810%, 06/25/49 (A) (C) | 47,628 | 42,916 | ||||||
GPMT, Ser 2021-FL3, Cl A | ||||||||
4.693%, ICE LIBOR USD 1 Month + 1.250%, 07/16/35 (C) | 315,596 | 307,319 | ||||||
JPMBB Commercial Mortgage Securities Trust, Ser 2013- C15, Cl AS | ||||||||
4.420%, 11/15/45 | 535,000 | 523,981 | ||||||
JPMBB Commercial Mortgage Securities Trust, Ser 2014- C21, Cl AS | ||||||||
3.997%, 08/15/47 | 825,000 | 788,955 | ||||||
JPMBB Commercial Mortgage Securities Trust, Ser 2014- C25, Cl B | ||||||||
4.347%, 11/15/47 (A) | 330,000 | 305,907 | ||||||
JPMorgan Chase Commercial Mortgage Securities Trust, Ser 2018-BCON, Cl B | ||||||||
3.756%, 01/05/31 (A) (C) | 145,000 | 143,650 | ||||||
JPMorgan Mortgage Trust, Ser 2021-INV2, Cl A2 | ||||||||
2.500%, 12/25/51 (A) (C) | 1,101,716 | 849,398 | ||||||
MFA Trust, Ser 2022-NQM2, Cl A1 | ||||||||
4.000%, 05/25/67 (C) | 657,831 | 600,816 | ||||||
The accompanying notes are an integral part of the financial statements.
12
| THE ADVISORS’ INNER CIRCLE FUND III | MetLife Core Plus Fund October 31, 2022
|
| MORTGAGE-BACKED SECURITIES — continued | ||||||||
| Face Amount | Value | |||||||
NON-AGENCY MORTGAGE-BACKED OBLIGATIONS — continued |
| |||||||
Mill City Mortgage Loan Trust, Ser 2021-NMR1, Cl A1 | ||||||||
1.125%, 11/25/60 (A) (C) | $ | 449,863 | $ 414,074 | |||||
Morgan Stanley Bank of America Merrill Lynch Trust, Ser 2015-C24, Cl C | ||||||||
4.332%, 05/15/48 (A) | 210,000 | 189,998 | ||||||
Morgan Stanley Capital I Trust, Ser 2022-L8, Cl AS | ||||||||
3.795%, 04/15/55 (A) | 405,000 | 335,856 | ||||||
MortgageIT Trust, Ser 2005-1, Cl 1A1 | ||||||||
4.226%, ICE LIBOR USD 1 Month + 0.640%, 02/25/35 | 1,692 | 1,617 | ||||||
MSCG Trust, Ser 2015-ALDR, Cl A2 | ||||||||
3.462%, 06/07/35 (A) (C) | 380,000 | 343,067 | ||||||
OBX Trust, Ser 2020-EXP3, Cl 2A1A | ||||||||
4.486%, ICE LIBOR USD 1 Month + 0.900%, 01/25/60 (C) | 7,450 | 7,423 | ||||||
OBX Trust, Ser 2022-NQM1, Cl A1 | ||||||||
2.305%, 11/25/61 (A) (C) | 917,705 | 730,195 | ||||||
Sequoia Mortgage Trust, Ser 2018-CH4, Cl B1B | ||||||||
4.993%, 10/25/48 (A) (C) | 697,986 | 647,921 | ||||||
Towd Point Mortgage Trust, Ser 2018-2, Cl A1 | ||||||||
3.250%, 03/25/58 (A) (C) | 28,962 | 27,638 | ||||||
Towd Point Mortgage Trust, Ser 2019-4, Cl A1 | ||||||||
2.900%, 10/25/59 (A) (C) | 91,422 | 83,336 | ||||||
Towd Point Mortgage Trust, Ser 2020-3, Cl A1 | ||||||||
3.088%, 02/25/63 (A) (C) | 104,763 | 97,453 | ||||||
UBS Commercial Mortgage Trust, Ser 2017-C4, Cl A3 | ||||||||
3.301%, 10/15/50 | 273,308 | 244,193 | ||||||
UBS Commercial Mortgage Trust, Ser 2017-C7, Cl A3 | ||||||||
3.418%, 12/15/50 | 290,000 | 266,519 | ||||||
Wells Fargo Commercial Mortgage Trust, Ser 2022-C62,Cl A4 | ||||||||
4.000%, 04/15/55 (A) | 575,000 | 497,843 | ||||||
WFRBS Commercial Mortgage Trust, Ser 2013-C12, Cl C | ||||||||
4.314%, 03/15/48 (A) | 50,000 | 49,243 | ||||||
The accompanying notes are an integral part of the financial statements.
13
| THE ADVISORS’ INNER CIRCLE FUND III | MetLife Core Plus Fund October 31, 2022
|
| MORTGAGE-BACKED SECURITIES — continued | ||||||||
| Face Amount | Value | |||||||
NON-AGENCY MORTGAGE-BACKED OBLIGATIONS — continued |
| |||||||
WFRBS Commercial Mortgage Trust, Ser 2014-C22, Cl B | ||||||||
4.371%, 09/15/57 (A) | $ | 425,000 | $ | 403,206 | ||||
|
| |||||||
| 25,299,401 | ||||||||
|
| |||||||
TOTAL MORTGAGE-BACKED SECURITIES | ||||||||
(Cost $121,124,814) | 108,511,590 | |||||||
|
| |||||||
CORPORATE OBLIGATIONS — 31.5% |
| |||||||
COMMUNICATION SERVICES — 3.9% |
| |||||||
AT&T | ||||||||
6.000%, 11/15/34 | 20,000 | 18,995 | ||||||
3.550%, 09/15/55 | 1,290,000 | 820,907 | ||||||
3.500%, 06/01/41 | 505,000 | 356,789 | ||||||
1.700%, 03/25/26 | 820,000 | 723,160 | ||||||
Charter Communications Operating | ||||||||
3.900%, 06/01/52 | 710,000 | 439,662 | ||||||
Cox Communications | ||||||||
4.800%, 02/01/35 (C) | 710,000 | 614,230 | ||||||
Nokia | ||||||||
6.625%, 05/15/39 | 350,000 | 319,305 | ||||||
Paramount Global | ||||||||
6.375%, US Treas Yield Curve Rate T Note Const Mat 5 Yr + 3.999%, 03/30/62 | 880,000 | 743,969 | ||||||
6.250%, ICE LIBOR USD 3 Month + 3.899%, 02/28/57 | 225,000 | 188,384 | ||||||
5.900%, 10/15/40 | 455,000 | 369,441 | ||||||
4.750%, 05/15/25 | 474,000 | 462,898 | ||||||
Sprint | ||||||||
7.875%, 09/15/23 | 515,000 | 523,448 | ||||||
Sprint Spectrum | ||||||||
5.152%, 03/20/28 (C) | 1,955,000 | 1,902,359 | ||||||
Time Warner Cable | ||||||||
5.875%, 11/15/40 | 790,000 | 640,820 | ||||||
T-Mobile USA | ||||||||
4.500%, 04/15/50 | 845,000 | 669,488 | ||||||
The accompanying notes are an integral part of the financial statements.
14
| THE ADVISORS’ INNER CIRCLE FUND III | MetLife Core Plus Fund October 31, 2022
|
| CORPORATE OBLIGATIONS — continued | ||||||||
| Face Amount | Value | |||||||
COMMUNICATION SERVICES — continued |
| |||||||
Verizon Communications | ||||||||
5.250%, 03/16/37 | $ | 760,000 | $ | 704,498 | ||||
4.016%, 12/03/29 | 251,000 | 226,225 | ||||||
3.550%, 03/22/51 | 255,000 | 172,124 | ||||||
Warnermedia Holdings | ||||||||
5.141%, 03/15/52 (C) | 2,150,000 | 1,501,170 | ||||||
|
| |||||||
| 11,397,872 | ||||||||
|
| |||||||
CONSUMER DISCRETIONARY — 0.6% |
| |||||||
Lowe’s | ||||||||
5.625%, 04/15/53 | 500,000 | 450,271 | ||||||
Resorts World Las Vegas | ||||||||
4.625%, 04/06/31 (C) | 670,000 | 454,155 | ||||||
Volkswagen Group of America Finance | ||||||||
1.250%, 11/24/25 (C) | 1,115,000 | 973,660 | ||||||
|
| |||||||
| 1,878,086 | ||||||||
|
| |||||||
CONSUMER STAPLES — 1.3% |
| |||||||
Altria Group | ||||||||
10.200%, 02/06/39 | 40,000 | 47,648 | ||||||
5.800%, 02/14/39 | 785,000 | 670,738 | ||||||
Anheuser-Busch InBev Worldwide | ||||||||
5.450%, 01/23/39 | 750,000 | 704,600 | ||||||
BAT Capital | ||||||||
4.390%, 08/15/37 | 670,000 | 485,309 | ||||||
3.557%, 08/15/27 | 370,000 | 322,123 | ||||||
Constellation Brands | ||||||||
4.400%, 11/15/25 | 445,000 | 433,225 | ||||||
JBS USA LUX | ||||||||
6.500%, 12/01/52 (C) | 790,000 | 693,367 | ||||||
Land O’ Lakes | ||||||||
7.250%, (C) (D) | 65,000 | 60,450 | ||||||
Reynolds American | ||||||||
8.125%, 05/01/40 | 45,000 | 46,342 | ||||||
7.250%, 06/15/37 | 220,000 | 209,695 | ||||||
|
| |||||||
| 3,673,497 | ||||||||
|
| |||||||
The accompanying notes are an integral part of the financial statements.
15
| THE ADVISORS’ INNER CIRCLE FUND III | MetLife Core Plus Fund October 31, 2022
|
| CORPORATE OBLIGATIONS — continued | ||||||||
| Face Amount | Value | |||||||
ENERGY — 4.5% |
| |||||||
Cheniere Corpus Christi Holdings | ||||||||
3.700%, 11/15/29 | $ | 1,073,000 | $ | 934,523 | ||||
Continental Resources | ||||||||
2.268%, 11/15/26 (C) | 1,370,000 | 1,164,705 | ||||||
Devon Energy | ||||||||
7.875%, 09/30/31 | 195,000 | 214,933 | ||||||
Diamondback Energy | ||||||||
6.250%, 03/15/33 | 1,070,000 | 1,074,162 | ||||||
Energy Transfer | ||||||||
5.250%, 04/15/29 | 1,315,000 | 1,232,314 | ||||||
4.000%, 10/01/27 | 70,000 | 63,320 | ||||||
Eni | ||||||||
4.000%, 09/12/23 (C) | 1,370,000 | 1,344,996 | ||||||
Galaxy Pipeline Assets Bidco | ||||||||
1.750%, 09/30/27 (C) | 604,933 | 548,369 | ||||||
Hess | ||||||||
6.000%, 01/15/40 | 740,000 | 693,128 | ||||||
HF Sinclair | ||||||||
5.875%, 04/01/26 | 365,000 | 354,985 | ||||||
Hilcorp Energy I | ||||||||
6.250%, 04/15/32 (C) | 1,127,000 | 1,033,718 | ||||||
MPLX | ||||||||
4.950%, 03/14/52 | 805,000 | 622,313 | ||||||
4.800%, 02/15/29 | 625,000 | 578,496 | ||||||
Reliance Industries | ||||||||
3.625%, 01/12/52 (C) | 755,000 | 443,175 | ||||||
Sabine Pass Liquefaction | ||||||||
5.000%, 03/15/27 | 1,145,000 | 1,103,434 | ||||||
Saudi Arabian | ||||||||
Oil 1.625%, 11/24/25 (C) | 590,000 | 527,082 | ||||||
Tennessee Gas Pipeline | ||||||||
8.375%, 06/15/32 | 135,000 | 148,962 | ||||||
2.900%, 03/01/30 (C) | 690,000 | 561,745 | ||||||
Tullow Oil | ||||||||
10.250%, 05/15/26 (C) | 510,000 | 434,020 | ||||||
|
| |||||||
| 13,078,380 | ||||||||
|
| |||||||
The accompanying notes are an integral part of the financial statements.
16
| THE ADVISORS’ INNER CIRCLE FUND III | MetLife Core Plus Fund October 31, 2022
|
| CORPORATE OBLIGATIONS — continued | ||||||||
| Face Amount | Value | |||||||
FINANCIALS — 10.6% |
| |||||||
Apollo Management Holdings | ||||||||
4.400%, 05/27/26 (C) | $ | 160,000 | $ | 150,282 | ||||
Athene Global Funding | ||||||||
2.950%, 11/12/26 (C) | 990,000 | 866,151 | ||||||
Athene Holding | ||||||||
4.125%, 01/12/28 | 1,205,000 | 1,073,171 | ||||||
Banco Santander | ||||||||
1.722%, US Treas Yield Curve Rate T Note Const Mat 1 Yr + 0.900%, 09/14/27 | 1,000,000 | 816,173 | ||||||
Banco Santander Mexico Institucion de Banca Multiple Grupo Financiero Santand | ||||||||
5.375%, 04/17/25 (C) | 365,000 | 354,050 | ||||||
Bank of America | ||||||||
4.571%, U.S. SOFR + 1.830%, 04/27/33 | 1,615,000 | 1,431,200 | ||||||
3.366%, ICE LIBOR USD 3 Month + 0.810%, 01/23/26 | 1,220,000 | 1,149,881 | ||||||
2.572%, U.S. SOFR + 1.210%, 10/20/32 | 845,000 | 637,503 | ||||||
Bank of Nova Scotia | ||||||||
4.900%, US Treas Yield Curve Rate T Note Const Mat 5 Yr + 4.551%, (D) | 870,000 | 805,987 | ||||||
Barclays | ||||||||
4.375%, 01/12/26 | 1,070,000 | 993,343 | ||||||
Blackstone Secured Lending Fund | ||||||||
3.625%, 01/15/26 | 590,000 | 531,505 | ||||||
Cantor Fitzgerald | ||||||||
4.500%, 04/14/27 (C) | 775,000 | 712,682 | ||||||
CI Financial | ||||||||
4.100%, 06/15/51 | 600,000 | 337,343 | ||||||
3.200%, 12/17/30 | 1,215,000 | 879,024 | ||||||
Citigroup | ||||||||
8.125%, 07/15/39 | 415,000 | 478,663 | ||||||
5.610%, U.S. SOFR + 1.546%, 09/29/26 | 655,000 | 646,322 | ||||||
4.910%, U.S. SOFR + 2.086%, 05/24/33 | 815,000 | 740,389 | ||||||
Citigroup Capital III | ||||||||
7.625%, 12/01/36 | 15,000 | 15,540 | ||||||
Cooperatieve Rabobank UA | ||||||||
3.758%, US Treas Yield Curve Rate T Note Const Mat 1 Yr + 1.420%, 04/06/33 (C) | 875,000 | 704,527 | ||||||
The accompanying notes are an integral part of the financial statements.
17
| THE ADVISORS’ INNER CIRCLE FUND III | MetLife Core Plus Fund October 31, 2022
|
| CORPORATE OBLIGATIONS — continued | ||||||||
| Face Amount | Value | |||||||
FINANCIALS — continued |
| |||||||
F&G Global Funding | ||||||||
1.750%, 06/30/26 (C) | $ | 475,000 | $ | 410,266 | ||||
Farmers Exchange Capital III | ||||||||
5.454%, ICE LIBOR USD 3 Month + 3.454%, 10/15/54 (C) | 615,000 | 544,594 | ||||||
Finance of America Funding | ||||||||
7.875%, 11/15/25 (C) | 1,245,000 | 753,225 | ||||||
Goldman Sachs Group | ||||||||
3.272%, ICE LIBOR USD 3 Month + 1.201%, 09/29/25 | 1,025,000 | 972,214 | ||||||
3.102%, U.S. SOFR + 1.410%, 02/24/33 | 915,000 | 716,619 | ||||||
HSBC Bank | ||||||||
7.650%, 05/01/25 | 75,000 | 75,699 | ||||||
Intercontinental Exchange | ||||||||
4.950%, 06/15/52 | 240,000 | 205,527 | ||||||
Intesa Sanpaolo | ||||||||
4.198%, US Treas Yield Curve Rate T Note Const Mat 1 Yr + 2.600%, 06/01/32 (C) | 650,000 | 440,006 | ||||||
Jackson Financial | ||||||||
3.125%, 11/23/31 | 800,000 | 589,746 | ||||||
JPMorgan Chase | ||||||||
1.045%, U.S. SOFR + 0.800%, 11/19/26 | 950,000 | 818,334 | ||||||
KKR Group Finance III | ||||||||
5.125%, 06/01/44 (C) | 120,000 | 101,317 | ||||||
Macquarie Bank | ||||||||
3.624%, 06/03/30 (C) | 550,000 | 434,430 | ||||||
Massachusetts Mutual Life Insurance | ||||||||
3.375%, 04/15/50 (C) | 700,000 | 452,364 | ||||||
Mercury General | ||||||||
4.400%, 03/15/27 | 819,000 | 754,940 | ||||||
Midcap Financial Issuer Trust | ||||||||
5.625%, 01/15/30 (C) | 775,000 | 596,750 | ||||||
Mitsubishi UFJ Financial Group | ||||||||
5.063%, US Treas Yield Curve Rate T Note Const Mat 1 Yr + 1.550%, 09/12/25 | 1,155,000 | 1,138,216 | ||||||
Morgan Stanley | ||||||||
1.593%, U.S. SOFR + 0.879%, 05/04/27 | 745,000 | 637,538 | ||||||
Morgan Stanley MTN | ||||||||
2.511%, U.S. SOFR + 1.200%, 10/20/32 | 795,000 | 598,547 | ||||||
The accompanying notes are an integral part of the financial statements.
18
| THE ADVISORS’ INNER CIRCLE FUND III | MetLife Core Plus Fund October 31, 2022
|
| CORPORATE OBLIGATIONS — continued | ||||||||
| Face Amount | Value | |||||||
FINANCIALS — continued |
| |||||||
Mutual of Omaha Insurance | ||||||||
4.297%, ICE LIBOR USD 3 Month + 2.640%, 07/15/54 (C) | $ | 73,000 | $ | 69,198 | ||||
NatWest Group | ||||||||
1.642%, US Treas Yield Curve Rate T Note Const Mat 1 Yr + 0.900%, 06/14/27 | 750,000 | 623,136 | ||||||
Ohio National Financial Services | ||||||||
6.050%, 01/24/30 (C) | 590,000 | 532,107 | ||||||
Principal Life Global Funding II | ||||||||
2.250%, 11/21/24 (C) | 990,000 | 926,896 | ||||||
Prospect Capital | ||||||||
3.706%, 01/22/26 | 290,000 | 248,216 | ||||||
Santander Holdings USA | ||||||||
3.450%, 06/02/25 | 690,000 | 644,264 | ||||||
Societe Generale | ||||||||
3.625%, 03/01/41 (C) | 435,000 | 246,228 | ||||||
Societe Generale MTN | ||||||||
2.625%, 01/22/25 (C) | 1,050,000 | 962,966 | ||||||
SVB Financial Group | ||||||||
4.700%, US Treas Yield Curve Rate T Note Const Mat 10 Yr + 3.064%, (D) | 885,000 | 590,738 | ||||||
Toronto-Dominion Bank MTN | ||||||||
4.456%, 06/08/32 | 990,000 | 889,701 | ||||||
US Bancorp | ||||||||
4.967%, U.S. SOFR + 2.110%, 07/22/33 | 660,000 | 601,008 | ||||||
Validus Holdings | ||||||||
8.875%, 01/26/40 | 115,000 | 138,400 | ||||||
Wells Fargo MTN | ||||||||
3.196%, ICE LIBOR USD 3 Month + 1.170%, 06/17/27 | 1,040,000 | 942,181 | ||||||
Westpac Banking | ||||||||
2.668%, US Treas Yield Curve Rate T Note Const Mat 5 Yr + 1.750%, 11/15/35 | 580,000 | 410,876 | ||||||
|
| |||||||
| 31,389,983 | ||||||||
|
| |||||||
HEALTH CARE — 2.9% |
| |||||||
Advocate Health & Hospitals | ||||||||
2.211%, 06/15/30 | 395,000 | 314,302 | ||||||
The accompanying notes are an integral part of the financial statements.
19
| THE ADVISORS’ INNER CIRCLE FUND III | MetLife Core Plus Fund October 31, 2022
|
| CORPORATE OBLIGATIONS — continued | ||||||||
| Face Amount | Value | |||||||
HEALTH CARE — continued |
| |||||||
Amgen | ||||||||
6.375%, 06/01/37 | $ | 535,000 | $ | 554,653 | ||||
3.000%, 01/15/52 | 855,000 | 526,685 | ||||||
Bayer US Finance | ||||||||
3.375%, 10/08/24 (C) | 30,000 | 28,841 | ||||||
Bayer US Finance II | ||||||||
4.700%, 07/15/64 (C) | 765,000 | 545,113 | ||||||
Bon Secours Mercy Health | ||||||||
3.464%, 06/01/30 | 220,000 | 192,879 | ||||||
2.095%, 06/01/31 | 440,000 | 334,336 | ||||||
Bristol-Myers Squibb | ||||||||
3.700%, 03/15/52 | 715,000 | 530,317 | ||||||
2.950%, 03/15/32 | 345,000 | 291,858 | ||||||
Cigna | ||||||||
4.800%, 08/15/38 | 594,000 | 523,423 | ||||||
CommonSpirit Health | ||||||||
4.350%, 11/01/42 | 45,000 | 34,849 | ||||||
4.187%, 10/01/49 | 70,000 | 49,568 | ||||||
3.910%, 10/01/50 | 740,000 | 496,660 | ||||||
Royalty Pharma | ||||||||
1.200%, 09/02/25 | 740,000 | 652,710 | ||||||
Smith & Nephew | ||||||||
2.032%, 10/14/30 | 595,000 | 437,108 | ||||||
Takeda Pharmaceutical | ||||||||
5.000%, 11/26/28 | 750,000 | 723,816 | ||||||
Teva Pharmaceutical Finance Netherlands III | ||||||||
2.800%, 07/21/23 | 1,055,000 | 1,025,703 | ||||||
UnitedHealth Group | ||||||||
5.875%, 02/15/53 | 1,035,000 | 1,056,315 | ||||||
|
| |||||||
| 8,319,136 | ||||||||
|
| |||||||
INDUSTRIALS — 1.5% |
| |||||||
AerCap Ireland Capital DAC | ||||||||
3.000%, 10/29/28 | 830,000 | 670,533 | ||||||
Boeing | ||||||||
2.196%, 02/04/26 | 920,000 | 812,999 | ||||||
CoStar Group | ||||||||
2.800%, 07/15/30 (C) | 765,000 | 603,035 | ||||||
The accompanying notes are an integral part of the financial statements.
20
| THE ADVISORS’ INNER CIRCLE FUND III | MetLife Core Plus Fund October 31, 2022
|
| CORPORATE OBLIGATIONS — continued | ||||||||
| Face Amount | Value | |||||||
INDUSTRIALS — continued |
| |||||||
GE Capital International Funding Unlimited | ||||||||
4.418%, 11/15/35 | $ | 424,000 | $ | 374,092 | ||||
Raytheon Technologies | ||||||||
3.950%, 08/16/25 | 595,000 | 577,067 | ||||||
Triton Container International | ||||||||
2.050%, 04/15/26 (C) | 450,000 | 380,051 | ||||||
Union Pacific | ||||||||
4.950%, 09/09/52 | 500,000 | 449,795 | ||||||
United Airlines | ||||||||
4.375%, 04/15/26 (C) | 615,000 | 561,285 | ||||||
|
| |||||||
| 4,428,857 | ||||||||
|
| |||||||
INFORMATION TECHNOLOGY — 1.9% |
| |||||||
Apple | ||||||||
4.100%, 08/08/62 | 560,000 | 434,998 | ||||||
Broadcom | ||||||||
4.926%, 05/15/37 (C) | 327,000 | 269,615 | ||||||
4.150%, 11/15/30 | 242,000 | 208,137 | ||||||
3.419%, 04/15/33 (C) | 364,000 | 276,587 | ||||||
Kyndryl Holdings | ||||||||
2.050%, 10/15/26 | 675,000 | 527,864 | ||||||
Marvell Technology | ||||||||
1.650%, 04/15/26 | 972,000 | 839,706 | ||||||
Oracle | ||||||||
3.800%, 11/15/37 | 990,000 | 719,575 | ||||||
3.600%, 04/01/40 | 650,000 | 439,806 | ||||||
2.950%, 04/01/30 | 120,000 | 97,716 | ||||||
PayPal Holdings | ||||||||
5.050%, 06/01/52 | 840,000 | 727,914 | ||||||
TSMC Arizona | ||||||||
1.750%, 10/25/26 | 750,000 | 647,205 | ||||||
Vontier | ||||||||
2.950%, 04/01/31 | 285,000 | 199,993 | ||||||
1.800%, 04/01/26 | 330,000 | 273,389 | ||||||
|
| |||||||
| 5,662,505 | ||||||||
|
| |||||||
The accompanying notes are an integral part of the financial statements.
21
| THE ADVISORS’ INNER CIRCLE FUND III | MetLife Core Plus Fund October 31, 2022
|
| CORPORATE OBLIGATIONS — continued | ||||||||
| Face Amount | Value | |||||||
MATERIALS — 1.6% | ||||||||
Celanese US Holdings | ||||||||
6.379%, 07/15/32 | $ | 620,000 | $ | 564,127 | ||||
6.330%, 07/15/29 | 695,000 | 646,496 | ||||||
6.050%, 03/15/25 | 1,700,000 | 1,653,160 | ||||||
Freeport-McMoRan | ||||||||
5.450%, 03/15/43 | 110,000 | 90,365 | ||||||
Industrias Penoles | ||||||||
4.150%, 09/12/29 (C) | 800,000 | 694,535 | ||||||
Newcrest Finance Pty | ||||||||
3.250%, 05/13/30 (C) | 545,000 | 440,448 | ||||||
Sealed Air | ||||||||
1.573%, 10/15/26 (C) | 465,000 | 389,243 | ||||||
|
| |||||||
| 4,478,374 | ||||||||
|
| |||||||
REAL ESTATE — 1.2% | ||||||||
Essential Properties | ||||||||
2.950%, 07/15/31 | 760,000 | 540,728 | ||||||
Newmark Group | ||||||||
6.125%, 11/15/23 | 550,000 | 548,207 | ||||||
Sabra Health Care | ||||||||
3.900%, 10/15/29 | 585,000 | 464,340 | ||||||
Scentre Group Trust | ||||||||
1 3.625%, 01/28/26 (C) | 185,000 | 170,881 | ||||||
Scentre Group Trust 2 | 960,000 | 811,699 | ||||||
Simon Property Group | ||||||||
2.450%, 09/13/29 | 1,020,000 | 817,130 | ||||||
|
| |||||||
| 3,352,985 | ||||||||
|
| |||||||
UTILITIES — 1.5% | ||||||||
Enel Finance International | ||||||||
6.800%, 10/14/25 (C) | 420,000 | 421,747 | ||||||
Oncor Electric Delivery | ||||||||
2.750%, 05/15/30 | 815,000 | 685,065 | ||||||
Pacific Gas and Electric | ||||||||
2.500%, 02/01/31 | 150,000 | 112,081 | ||||||
2.100%, 08/01/27 | 1,035,000 | 851,032 | ||||||
1.700%, 11/15/23 | 1,125,000 | 1,078,196 | ||||||
The accompanying notes are an integral part of the financial statements.
22
| THE ADVISORS’ INNER CIRCLE FUND III | MetLife Core Plus Fund October 31, 2022
|
| CORPORATE OBLIGATIONS — continued | ||||||||
| Face Amount | Value | |||||||
UTILITIES — continued |
| |||||||
Texas Electric Market Stabilization Funding N | ||||||||
4.265%, 08/01/34 (C) | $ | 1,165,000 | $ | 1,097,490 | ||||
Vistra Operations | ||||||||
4.300%, 07/15/29 (C) | 415,000 | 362,041 | ||||||
|
| |||||||
| 4,607,652 | ||||||||
|
| |||||||
TOTAL CORPORATE OBLIGATIONS | ||||||||
(Cost $111,274,939)
| 92,267,327 | |||||||
|
| |||||||
U.S. TREASURY OBLIGATIONS — 25.0%
|
| |||||||
U.S. Treasury Bills | ||||||||
3.204%, 12/27/22(E) | 9,805,000 | 9,746,698 | ||||||
2.506%, 11/10/22(E) | 8,575,000 | 8,569,382 | ||||||
U.S. Treasury Bonds | ||||||||
3.375%, 08/15/42 | 3,340,000 | 2,881,272 | ||||||
3.000%, 08/15/52 | 1,315,000 | 1,053,027 | ||||||
2.875%, 05/15/52 | 3,415,000 | 2,650,360 | ||||||
2.375%, 02/15/42 | 9,485,000 | 6,925,532 | ||||||
2.000%, 11/15/41 | 845,000 | 576,052 | ||||||
1.750%, 08/15/41 | 7,870,000 | 5,136,405 | ||||||
1.375%, 08/15/50 | 10,855,000 | 5,786,648 | ||||||
U.S. Treasury Notes | ||||||||
4.250%, 10/15/25 | 3,475,000 | 3,456,539 | ||||||
4.125%, 09/30/27 | 10,370,000 | 10,313,289 | ||||||
3.875%, 09/30/29 | 400,000 | 392,875 | ||||||
3.250%, 06/30/29 | 2,275,000 | 2,148,098 | ||||||
3.000%, 07/15/25 | 1,005,000 | 967,941 | ||||||
2.750%, 08/15/32 | 685,000 | 612,968 | ||||||
2.375%, 03/31/29 | 13,415,000 | 12,020,049 | ||||||
|
| |||||||
TOTAL U.S. TREASURY OBLIGATIONS | ||||||||
(Cost $85,121,898) | 73,237,135 | |||||||
|
| |||||||
ASSET-BACKED SECURITIES — 9.7% |
| |||||||
AccessLex Institute, Ser 2007-A, Cl A3 | 292,444 | 282,344 | ||||||
The accompanying notes are an integral part of the financial statements.
23
| THE ADVISORS’ INNER CIRCLE FUND III | MetLife Core Plus Fund October 31, 2022
|
| ASSET-BACKED SECURITIES — continued | ||||||||
| Face Amount | Value | |||||||
Affirm Asset Securitization Trust, Ser 2022-A, Cl A | ||||||||
4.300%, 05/17/27 (C) | $ | 380,000 | $ | 358,552 | ||||
Antares CLO, Ser 2021-1A, Cl A1R | ||||||||
5.785%, ICE LIBOR USD 3 Month + 1.460%, | 285,000 | 268,716 | ||||||
ARI Fleet Lease Trust, Ser 2022-A, Cl A2 | ||||||||
3.120%, 01/15/31 (C) | 575,000 | 562,028 | ||||||
Arivo Acceptance Auto Loan Receivables Trust, Ser 2021-1A, Cl A | ||||||||
1.190%, 01/15/27 (C) | 122,438 | 117,751 | ||||||
Carlyle US CLO, Ser 2021-1A, Cl A2R | ||||||||
5.893%, ICE LIBOR USD 3 Month + 1.650%, 07/20/34 (C) | 920,000 | 862,299 | ||||||
CARS-DB5 LP, Ser 2021-1A, Cl A2 | ||||||||
2.280%, 08/15/51 (C) | 602,260 | 458,804 | ||||||
Chesapeake Funding II, Ser 2019-1A, Cl A1 | ||||||||
2.940%, 04/15/31 (C) | 665 | 665 | ||||||
Chesapeake Funding II, Ser 2020-1A, Cl B | ||||||||
1.240%, 08/15/32 (C) | 295,000 | 284,791 | ||||||
Chesapeake Funding II, Ser 2020-1A, Cl D | ||||||||
2.830%, 08/15/32 (C) | 160,000 | 153,487 | ||||||
CNH Equipment Trust, Ser 2022-B, Cl A3 | ||||||||
3.890%, 08/16/27 | 475,000 | 455,963 | ||||||
College Avenue Student Loans, Ser 2021-B, Cl B | ||||||||
2.420%, 06/25/52 (C) | 280,000 | 237,326 | ||||||
DataBank Issuer, Ser 2021-1A, Cl A2 | ||||||||
2.060%, 02/27/51 (C) | 1,070,000 | 913,273 | ||||||
DLLST, Ser 2022-1A, Cl A3 | ||||||||
3.400%, 01/21/25 (C) | 300,000 | 290,162 | ||||||
Donlen Fleet Lease Funding 2, Ser 2021-2, Cl A2 | 305,797 | 294,250 | ||||||
Donlen Fleet Lease Funding 2, Ser 2021-2, Cl B | 340,000 | 315,930 | ||||||
Donlen Fleet Lease Funding 2, Ser 2021-2, Cl C | 600,000 | 555,462 | ||||||
Dryden 77 CLO, Ser 2021-77A, Cl BR | 875,000 | 814,335 | ||||||
Enterprise Fleet Financing, Ser 2022-3, Cl A2 | 460,000 | 451,619 | ||||||
The accompanying notes are an integral part of the financial statements.
24
| THE ADVISORS’ INNER CIRCLE FUND III | MetLife Core Plus Fund October 31, 2022
|
| ASSET-BACKED SECURITIES — continued | ||||||||
| Face Amount | Value | |||||||
Enterprise Fleet Funding, Ser 2021-1, Cl A3 | ||||||||
0.700%, 12/21/26 (C) | $ | 285,000 | $ | 261,838 | ||||
Flagship Credit Auto Trust, Ser 2021-3, Cl A | ||||||||
0.360%, 07/15/27 (C) | 403,437 | 387,852 | ||||||
Goodgreen Trust, Ser 2021-1A, Cl A | ||||||||
2.660%, 10/15/56 (C) | 525,905 | 458,765 | ||||||
Hertz Vehicle Financing III, Ser 2022-1A, Cl A | ||||||||
1.990%, 06/25/26 (C) | 520,000 | 471,700 | ||||||
Hertz Vehicle Financing, Ser 2022-5A, Cl B | ||||||||
4.280%, 09/25/28 (C) | 475,000 | 433,454 | ||||||
Hilton Grand Vacations Trust, Ser 2020-AA, Cl A | ||||||||
2.740%, 02/25/39 (C) | 71,192 | 66,479 | ||||||
HIN Timeshare Trust, Ser 2020-A, Cl A | ||||||||
1.390%, 10/09/39 (C) | 483,993 | 438,415 | ||||||
Hotwire Funding, Ser 2021-1, Cl A2 | ||||||||
2.311%, 11/20/51 (C) | 470,000 | 400,895 | ||||||
John Deere Owner Trust, Ser 2022-A, Cl A3 | ||||||||
2.320%, 09/16/26 | 330,000 | 313,673 | ||||||
JPMorgan Chase, Ser 2020-2, Cl B | ||||||||
0.840%, 02/25/28 (C) | 144,562 | 140,562 | ||||||
JPMorgan Chase, Ser 2021-2, Cl B | ||||||||
0.889%, 12/26/28 (C) | 281,609 | 270,038 | ||||||
JPMorgan Chase, Ser 2021-3, Cl B | ||||||||
0.760%, 02/26/29 (C) | 136,636 | 129,359 | ||||||
LoanCore Issuer, Ser 2021-CRE6, Cl A | ||||||||
4.712%, ICE LIBOR USD 1 Month + 1.300%, 11/15/38 (C) | 610,000 | 579,784 | ||||||
Master Credit Card Trust, Ser 2022-4A, Cl B | ||||||||
6.240%, 04/21/29 (C) | 380,000 | 379,087 | ||||||
MF1, Ser 2021-FL7, Cl A | ||||||||
4.523%, ICE LIBOR USD 1 Month + 1.080%, 10/16/36 (C) | 510,000 | 486,233 | ||||||
MVW, Ser 2021-1WA, Cl A | ||||||||
1.140%, 01/22/41 (C) | 342,395 | 307,125 | ||||||
MVW, Ser 2022-1A, Cl A | ||||||||
4.150%, 11/21/39 (C) | 345,507 | 330,101 | ||||||
Navient Private Education Refi Loan Trust, Ser 2018-CA,Cl A2 | ||||||||
3.520%, 06/16/42 (C) | 79,847 | 78,205 | ||||||
The accompanying notes are an integral part of the financial statements.
25
| THE ADVISORS’ INNER CIRCLE FUND III | MetLife Core Plus Fund October 31, 2022
|
| ASSET-BACKED SECURITIES — continued | ||||||||
| Face Amount | Value | |||||||
Navient Private Education Refi Loan Trust, Ser 2019-FA,Cl A2 | ||||||||
2.600%, 08/15/68 (C) | $ | 43,566 | $ | 39,972 | ||||
Navient Private Education Refi Loan Trust, Ser 2020-DA,Cl A | ||||||||
1.690%, 05/15/69 (C) | 442,366 | 397,988 | ||||||
Navient Private Education Refi Loan Trust, Ser 2021-CA,Cl A | ||||||||
1.060%, 10/15/69 (C) | 143,157 | 122,104 | ||||||
Navient Private Education Refi Loan Trust, Ser 2022-A,Cl A | ||||||||
2.230%, 07/15/70 (C) | 258,616 | 220,629 | ||||||
Navient Private Education Refi Loan Trust, Ser 2022-BA,Cl A | ||||||||
4.160%, 10/15/70 (C) | 468,514 | 433,790 | ||||||
Nelnet Student Loan Trust, Ser 2021-CA, Cl AFX | ||||||||
1.320%, 04/20/62 (C) | 691,936 | 604,126 | ||||||
NovaStar Mortgage Funding Trust, Ser 2003-3, Cl A1 | ||||||||
4.296%, ICE LIBOR USD 1 Month + 0.710%, 12/25/33 | 9,321 | 8,914 | ||||||
Orange Lake Timeshare Trust, Ser 2018-A, Cl A | ||||||||
3.100%, 11/08/30 (C) | 73,857 | 71,262 | ||||||
Orange Lake Timeshare Trust, Ser 2019-A, Cl A | ||||||||
3.060%, 04/09/38 (C) | 140,450 | 132,412 | ||||||
Santander Consumer Auto Receivables Trust, Ser 2021- AA, Cl A3 | ||||||||
0.330%, 10/15/25 (C) | 925,288 | 905,575 | ||||||
Santander Drive Auto Receivables Trust, Ser 2021-2, Cl C | ||||||||
0.900%, 06/15/26 | 595,000 | 576,807 | ||||||
Santander Drive Auto Receivables Trust, Ser 2022-3,Cl A3 | ||||||||
3.400%, 12/15/26 | 560,000 | 547,937 | ||||||
Santander Drive Auto Receivables Trust, Ser 2022-5,Cl A3 | ||||||||
4.110%, 08/17/26 | 915,000 | 894,025 | ||||||
Santander Drive Auto Receivables Trust, Ser 2022-6,Cl A3 | ||||||||
4.490%, 11/16/26 | 660,000 | 648,420 | ||||||
SBA Small Business Investment, Ser 2018-10B, Cl 1 | ||||||||
3.548%, 09/10/28 | 45,323 | 42,243 | ||||||
The accompanying notes are an integral part of the financial statements.
26
| THE ADVISORS’ INNER CIRCLE FUND III | MetLife Core Plus Fund October 31, 2022
|
| ASSET-BACKED SECURITIES — continued | ||||||||
| Face Amount | Value | |||||||
SBA Small Business Investment, Ser 2022-10A, Cl 1 | ||||||||
2.938%, 03/10/32 | $ | 598,412 | $ | 537,888 | ||||
SBA Small Business Investment, Ser 2022-10B, Cl 1 | ||||||||
4.262%, 09/10/32 | 325,000 | 313,670 | ||||||
Scholar Funding Trust, Ser 2011-A, Cl A | ||||||||
5.274%, ICE LIBOR USD 3 Month + 0.900%, 10/28/43 (C) | 360,303 | 351,322 | ||||||
Sequoia Infrastructure Funding I, Ser 2021-1A, Cl A | ||||||||
5.479%, ICE LIBOR USD 3 Month + 1.400%, 04/15/31 (C) | 283,499 | 280,621 | ||||||
SLM Private Credit Student Loan Trust, Ser 2004-B, Cl A3 | ||||||||
3.623%, ICE LIBOR USD 3 Month + 0.330%, 03/15/24 | 2,559 | 2,550 | ||||||
SMB Private Education Loan Trust, Ser 2021-B, Cl A | ||||||||
1.310%, 07/17/51 (C) | 418,390 | 370,521 | ||||||
SMB Private Education Loan Trust, Ser 2021-B, Cl B | ||||||||
2.650%, 07/17/51 (C) | 295,000 | 229,919 | ||||||
SMB Private Education Loan Trust, Ser 2021-D, Cl A1A | ||||||||
1.340%, 03/17/53 (C) | 552,639 | 485,210 | ||||||
SoFi Professional Loan Program Trust, Ser 2021-A,Cl AFX | ||||||||
1.030%, 08/17/43 (C) | 249,626 | 208,990 | ||||||
South Carolina Student Loan, Ser 2015-A, Cl A | ||||||||
5.086%, ICE LIBOR USD 1 Month + 1.500%, 01/25/36 | 545,490 | 541,952 | ||||||
Southwick Park CLO, Ser 2021-4A, Cl A1R | ||||||||
5.303%, ICE LIBOR USD 3 Month + 1.060%, 07/20/32 (C) | 1,490,000 | 1,446,924 | ||||||
Stack Infrastructure Issuer, Ser 2019-1A, Cl A2 | ||||||||
4.540%, 02/25/44 (C) | 481,667 | 469,008 | ||||||
Stack Infrastructure Issuer, Ser 2020-1A, Cl A2 | ||||||||
1.893%, 08/25/45 (C) | 415,000 | 367,772 | ||||||
Strata CLO II, Ser 2021-1A, Cl A1 | ||||||||
5.833%, ICE LIBOR USD 3 Month + 1.590%, 10/20/33 (C) | 1,100,000 | 1,065,184 | ||||||
STWD, Ser 2019-FL1, Cl A | ||||||||
4.610%, TSFR1M + 1.194%, 07/15/38 (C) | 291,875 | 288,778 | ||||||
Tesla Auto Lease Trust, Ser 2021-B, Cl B | ||||||||
0.910%, 09/22/25 (C) | 925,000 | 855,250 | ||||||
Towd Point Mortgage Trust, Ser 2019-MH1, Cl A1 | ||||||||
3.000%, 11/25/58 (A) (C) | 333,115 | 325,212 | ||||||
The accompanying notes are an integral part of the financial statements.
27
| THE ADVISORS’ INNER CIRCLE FUND III | MetLife Core Plus Fund October 31, 2022
|
| ASSET-BACKED SECURITIES — continued | ||||||||
| Face Amount | Value | |||||||
United States Small Business Administration, Ser 2022-25F, Cl 1 | ||||||||
4.010%, 06/01/47 | $ | 505,000 | $ | 476,016 | ||||
Wheels SPV 2, Ser 2020-1A, Cl A2 | ||||||||
0.510%, 08/20/29 (C) | 71,529 | 70,523 | ||||||
Z Capital Credit Partners CLO, Ser 2021-1A, Cl A1R | ||||||||
5.589%, ICE LIBOR USD 3 Month + 1.510%, 07/16/31 (C) | 555,000 | 546,947 | ||||||
|
| |||||||
TOTAL ASSET-BACKED SECURITIES | ||||||||
(Cost $30,463,027) | 28,491,783 | |||||||
|
| |||||||
MUNICIPAL BONDS — 0.3% |
| |||||||
GEORGIA — 0.3% |
| |||||||
Georgia State, Municipal Electric Authority, RB, Ser 2010-A | ||||||||
7.055%, 04/01/57 | 204,000 | 197,075 | ||||||
6.637%, 04/01/57 | 616,000 | 620,282 | ||||||
|
| |||||||
TOTAL MUNICIPAL BONDS | ||||||||
(Cost $1,193,753) | 817,357 | |||||||
|
| |||||||
LOAN PARTICIPATION — 0.0% |
| |||||||
Sungard AS New Holdings III LLC, Initial Loan (2020), 1st Lien | ||||||||
8.500%, 07/01/24 | 4,361 | 2,987 | ||||||
|
| |||||||
TOTAL LOAN PARTICIPATION | ||||||||
|
| |||||||
(Cost $4,345) | 2,987 | |||||||
|
| |||||||
COMMON STOCK — 0.0% |
| |||||||
| Shares | ||||||||
INFORMATION TECHNOLOGY — 0.0% |
| |||||||
Sungard AS * | 190 | 2 | ||||||
|
| |||||||
TOTAL COMMON STOCK | ||||||||
(Cost $4,750) | 2 | |||||||
|
| |||||||
TOTAL INVESTMENTS — 103.5% | ||||||||
(Cost $349,187,526) | $ | 303,328,181 | ||||||
|
| |||||||
The accompanying notes are an integral part of the financial statements.
28
| THE ADVISORS’ INNER CIRCLE FUND III | MetLife Core Plus Fund October 31, 2022
|
Percentages are based on Net Assets of $293,029,714.
| * | Non-income producing security. |
| (A) | Variable or floating rate security, the interest rate of which adjusts periodically based on changes in current interest rates and prepayments on the underlying pool of assets. |
| (B) | Securities considered illiquid. The total value of such securities as of October 31, 2022 was $57 and represented 0.0% of Net Assets. |
| (C) | Securities sold within terms of a private placement memorandum, exempt from registration under Section 144A of the Securities Act of 1933, as amended, and may be sold only to dealers in that program or other “accredited investors.” The total value of these securities at October 31, 2022 was $66,282,349 and represents 22.6% of Net Assets. |
| (D) | Perpetual security with no stated maturity date. |
| (E) | The rate reported on the Schedule of Investments is the effective yield at time of purchase. |
Cl — Class
CLO — Collateralized Loan Obligation
DAC — Designated Activity Company
FHLMC — Federal Home Loan Mortgage Corporation
FNMA — Federal National Mortgage Association
FREMF — Freddie Mac Multi-Family
GNMA — Government National Mortgage Association
ICE — Intercontinental Exchange
IO — Interest Only - face amount represents notional amount
LIBOR — London Interbank Offered Rates
LLC — Limited Liability Company
MTN — Medium Term Note
Pty — Proprietary
RB — Revenue Bond
Ser — Series
SOFR — Secured Overnight Financing Rate
TBA — To Be Announced
TSFR1M — One Month Term SOFR
UMBS — Uniform Mortgage-Backed Security
USD — U.S. Dollar
As of October 31, 2022, all of the Fund’s investments were considered Level 2 in accordance with the authoritative guidance on fair value measurements and disclosure under U.S. generally accepted accounting principles.
For more information on valuation inputs, see Note 2 — Significant Accounting Policies in the Notes to Financial Statements.
The accompanying notes are an integral part of the financial statements.
29
| THE ADVISORS’ INNER CIRCLE FUND III | MetLife Core Plus Fund October 31, 2022
|
| * | Net Assets divided by Shares do not calculate to the stated NAV because Net Assets are shown rounded. |
The accompanying notes are an integral part of the financial statements.
30
| THE ADVISORS’ INNER CIRCLE FUND III | MetLife Core Plus Fund For the Year Ended October 31, 2022
|
The accompanying notes are an integral part of the financial statements.
31
| THE ADVISORS’ INNER CIRCLE FUND III | MetLife Core Plus Fund
|
| STATEMENTS OF CHANGES IN NET ASSETS | ||||||
| | Year Ended October 31, 2022 | | | Year Ended October 31, 2021 | | |||
|
| |||||||
Operations: | ||||||||
Net Investment Income | $ | 6,642,743 | $ | 3,433,995 | ||||
Net Realized Loss on Investments and Foreign Currency Transactions | (22,081,367 | ) | (2,368,732) | |||||
Net Change in Unrealized Depreciation on Investments and Foreign Currency Translation | (45,150,475 | ) | (1,801,160) | |||||
|
| |||||||
Net Decrease in Net Assets Resulting from Operations | (60,589,099 | ) | (735,897) | |||||
|
| |||||||
Distributions | ||||||||
I Class Shares | (6,449,449 | ) | (5,556,617) | |||||
|
| |||||||
Total Distributions | (6,449,449 | ) | (5,556,617) | |||||
|
| |||||||
Capital Share Transactions: | ||||||||
I Class Shares: | ||||||||
Issued | 74,462,320 | 208,711,816 | ||||||
Reinvestment of Dividends | 6,443,612 | 5,552,803 | ||||||
Redeemed | (23,000,327 | ) | (6,094,488) | |||||
|
| |||||||
Increase from I Class Shares Capital Share Transactions | 57,905,605 | 208,170,131 | ||||||
|
| |||||||
R Class Shares: | ||||||||
Issued | — | — | ||||||
Reinvestment of Dividends | — | — | ||||||
Redeemed | — | — | ||||||
|
| |||||||
Increase from R Class Shares Capital Share Transactions | — | — | ||||||
|
| |||||||
Net Increase in Net Assets from Capital Share Transactions | 57,905,605 | 208,170,131 | ||||||
|
| |||||||
Total Increase (Decrease) in Net Assets | (9,132,943 | ) | 201,877,617 | |||||
|
| |||||||
Net Assets: | ||||||||
Beginning of Year | 302,162,657 | 100,285,040 | ||||||
|
| |||||||
End of Year | $ | 293,029,714 | $ | 302,162,657 | ||||
|
| |||||||
Amounts designated as “—” are $0 or have been rounded to $0.
The accompanying notes are an integral part of the financial statements.
32
| THE ADVISORS’ INNER CIRCLE FUND III | MetLife Core Plus Fund
|
| STATEMENTS OF CHANGES IN NET ASSETS (continued) |
| |||||||
| | Year Ended October 31, 2022 | | | Year Ended October 31, 2021 | | |||
|
| |||||||
Shares Issued and Redeemed: | ||||||||
I Class Shares: | ||||||||
Issued | 7,621,412 | 19,890,196 | ||||||
Reinvestment of Dividends | 707,791 | 538,494 | ||||||
Redeemed | (2,749,151) | (591,278) | ||||||
|
|
|
| |||||
Increase in Shares Outstanding from I Class Share Transactions | 5,580,052 | 19,837,412 | ||||||
|
|
|
| |||||
R Class Shares: | ||||||||
Issued | — | — | ||||||
Reinvestment of Dividends | — | — | ||||||
Redeemed | — | — | ||||||
|
|
|
| |||||
Increase in Shares Outstanding from R Class Share Transactions | — | — | ||||||
|
|
|
| |||||
Net Increase in Shares Outstanding from Share Transactions | 5,580,052 | 19,837,412 | ||||||
|
|
|
| |||||
Amounts designated as “—” are zero or have been rounded to zero.
The accompanying notes are an integral part of the financial statements.
33
| THE ADVISORS’ INNER CIRCLE FUND III | MetLife Core Plus Fund
|
Selected Per Share Data & Ratios For a Share
Outstanding Throughout the Years
| I Class Shares | ||||||||||||||||||||
| Year Ended October 31, 2022 | Year Ended October 31, 2021 | Year Ended October 31, 2020 | Year Ended October 31, 2019 | Year Ended October 31, 2018 | ||||||||||||||||
Net Asset Value, Beginning of Year | $ | 10.26 | $ | 10.42 | $ | 10.36 | $ | 9.55 | $ | 10.00 | ||||||||||
|
|
|
|
|
|
|
|
|
| |||||||||||
Income from Operations: | ||||||||||||||||||||
Net Investment Income(1) | 0.19 | 0.12 | 0.23 | 0.29 | 0.28 | |||||||||||||||
Net Realized and Unrealized Gain (Loss) on Investments | (1.91) | (0.09) | 0.39 | 0.79 | (0.45) | |||||||||||||||
|
|
|
|
|
|
|
|
|
| |||||||||||
Total from Operations | (1.72) | 0.03 | 0.62 | 1.08 | (0.17) | |||||||||||||||
|
|
|
|
|
|
|
|
|
| |||||||||||
Dividends and Distributions from: | ||||||||||||||||||||
Net Investment Income | (0.18) | (0.13) | (0.26) | (0.27) | (0.28) | |||||||||||||||
Net Realized Gains | — | (0.06) | (0.30) | — | — | |||||||||||||||
|
|
|
|
|
|
|
|
|
| |||||||||||
Total Dividends and Distributions | (0.18) | (0.19) | (0.56) | (0.27) | (0.28) | |||||||||||||||
|
|
|
|
|
|
|
|
|
| |||||||||||
Net Asset Value, End of Year | $ | 8.36 | $ | 10.26 | $ | 10.42 | $ | 10.36 | $ | 9.55 | ||||||||||
|
|
|
|
|
|
|
|
|
| |||||||||||
Total Return † | (16.88)% | 0.30% | 6.17% | 11.39% | (1.73)% | |||||||||||||||
|
|
|
|
|
|
|
|
|
| |||||||||||
Ratios and Supplemental Data | ||||||||||||||||||||
Net Assets, End of Year (Thousands) | $ | 293,030 | $ | 302,163 | $ | 100,285 | $ | 47,291 | $ | 20,036 | ||||||||||
Ratio of Expenses to Average Net Assets (including waivers, reimbursements, excluding fees paid indirectly) | 0.45 | % | 0.45 | % | 0.45 | % | 0.45 | % | 0.45 | % | ||||||||||
Ratio of Expenses to Average Net Assets (excluding waivers, reimbursements and fees paid indirectly) | 0.62 | % | 0.64 | % | 1.22 | % | 1.38 | % | 3.26 | % | ||||||||||
Ratio of Net Investment Income to Average Net Assets | 2.07 | % | 1.20 | % | 2.24 | % | 2.91 | % | 2.84 | % | ||||||||||
Portfolio Turnover Rate† | 329 | % | 463 | % | 300 | % | 356 | % | 311 | % | ||||||||||
Amounts designated as “—” are $0 or round to $0. |
| (1) | Per share calculations were performed using average shares method. |
| † | Total return and portfolio turnover rate are for the period indicated and have not been annualized. Return shown does not reflect the deductions of taxes that a shareholder would pay on Fund distributions or the redemption of Fund shares. Total return would have been lower had the Adviser not waived its fee and/or reimbursed other expenses. |
The accompanying notes are an integral part of the financial statements.
34
| THE ADVISORS’ INNER CIRCLE FUND III | MetLife Core Plus Fund
|
FINANCIAL HIGHLIGHTS (continued) | ||
Selected Per Share Data & Ratios For a Share
Outstanding Throughout the Years
| R Class Shares | ||||||||||||||||||||
| Year Ended October 31, 2022 | Year Ended October 31, 2021 | Year Ended October 31, 2020 | Year Ended October 31, 2019 | Year Ended October 31, 2018 | ||||||||||||||||
Net Asset Value, Beginning of Year | $ | 9.45 | $ | 9.57 | $ | 9.92 | $ | 9.52 | $ | 9.98 | ||||||||||
|
|
|
|
|
|
|
|
|
|
|
|
| ||||||||
Income from Operations: | ||||||||||||||||||||
Net Investment Income (Loss)(1) | 0.22 | 0.16 | (0.01) | 0.20 | 0.27 | |||||||||||||||
Net Realized and Unrealized Gain (Loss) on Investments | (1.81) | (0.09) | 0.21 | 0.47 | (0.45) | |||||||||||||||
|
|
|
|
|
|
|
|
|
|
|
|
| ||||||||
Total from Operations | (1.59) | 0.07 | 0.20 | 0.67 | (0.18) | |||||||||||||||
|
|
|
|
|
|
|
|
|
|
|
|
| ||||||||
Dividends and Distributions from: | ||||||||||||||||||||
Net Investment Income | (0.18) | (0.13) | (0.25) | (0.27) | (0.28) | |||||||||||||||
Net Realized Gains | — | (0.06) | (0.30) | — | — | |||||||||||||||
|
|
|
|
|
|
|
|
|
|
|
|
| ||||||||
Total Dividends and Distributions | (0.18) | (0.19) | (0.55) | (0.27) | (0.28) | |||||||||||||||
|
|
|
|
|
|
|
|
|
|
|
|
| ||||||||
Net Asset Value, End of Year | $ | 7.68 | $ | 9.45 | $ | 9.57 | $ | 9.92 | $ | 9.52 | ||||||||||
|
|
|
|
|
|
|
|
|
|
|
|
| ||||||||
Total Return † | (16.96)% | 0.74% | 2.05% | 7.05% | (1.83)% | |||||||||||||||
|
|
|
|
|
|
|
|
|
|
|
|
| ||||||||
Ratios and Supplemental Data | ||||||||||||||||||||
Net Assets, End of Year (Thousands) | $ | — | $ | — | $ | — | $ | — | $ | — | ||||||||||
Ratio of Expenses to Average Net Assets (including waivers, reimbursements, excluding fees paid indirectly)‡ | 0.45% | 0.45% | 0.45% | 0.45% | 0.45% | |||||||||||||||
Ratio of Expenses to Average Net Assets (excluding waivers, reimbursements and fees paid indirectly) | 0.62% | 0.64% | 1.22% | 1.38% | 3.26% | |||||||||||||||
Ratio of Net Investment Income (Loss) | 2.52% | 1.65% | (0.11)% | 2.05% | 2.79% | |||||||||||||||
Portfolio Turnover Rate† | 329% | 463% | 300% | 356% | 311% | |||||||||||||||
Amounts designated as “—” are $0 or round to $0.
| (1) | Per share calculations were performed using average shares method. |
| † | Total return and portfolio turnover rate are for the period indicated and have not been annualized. Return shown does not reflect the deductions of taxes that a shareholder would pay on Fund distributions or the redemption of Fund shares. Total return would have been lower had the Adviser not waived its fee and/or reimbursed other expenses. |
| ‡ | The share class is expected to run at the expense limit of 0.70% when assets are contributed. Amounts have been revised to reflect an estimation of expenses based on I Class Shares. |
The accompanying notes are an integral part of the financial statements.
35
| THE ADVISORS’ INNER CIRCLE FUND III | MetLife Core Plus Fund October 31, 2022
|
| NOTES TO FINANCIAL STATEMENTS |
1. Organization:
The Advisors’ Inner Circle Fund III (the “Trust”) is organized as a Delaware statutory trust under an Agreement and Declaration of Trust, dated December 4, 2013. The Trust is registered under the Investment Company Act of 1940, as amended, as an open-end management investment company with 65 funds. The financial statements herein are those of the MetLife Core Plus Fund (the “Fund”). The Fund is diversified and its investment objective is to seek to maximize capital appreciation and income. The Fund invests in a portfolio of investment grade, U.S. fixed income securities of any maturity or duration. The Fund also may invest up to 20% of its net assets in any combination of high yield bonds (also known as “junk bonds”) and non-U.S. fixed income securities, including emerging market bonds. The financial statements of the remaining funds of the Trust are presented separately. The assets of each fund are segregated, and a shareholder’s interest is limited to the fund in which shares are held.
2. Significant Accounting Policies:
The following are significant accounting policies, which are consistently followed in the preparation of the financial statements of the Fund. The Fund is an investment company that applies the accounting and reporting guidance issued in Topic 946 by the U.S. Financial Accounting Standards Board (“FASB”).
Use of Estimates — The preparation of financial statements in conformity with U.S. generally accepted accounting principles (“U.S. GAAP”) requires management to make estimates and assumptions that affect the reported amounts of assets and liabilities and disclosure of contingent assets and liabilities at the date of the financial statements and the reported amounts of increases and decreases in net assets from operations during the reporting period. Actual results could differ from those estimates and such differences could be material.
Security Valuation — Securities listed on a securities exchange, market or automated quotation system for which quotations are readily available (except for securities traded on NASDAQ), including securities traded over the counter, are valued at the last quoted sale price on an exchange or market (foreign or domestic) on which they are traded on valuation date (or at approximately 4:00 pm ET if a security’s primary exchange is normally open at that time), or, if there is no such reported sale on the valuation date, at the most recent quoted bid price. For securities traded on NASDAQ, the NASDAQ Official Closing Price will be used. If available, debt securities are priced based upon valuations provided by independent, third-party pricing agents. Such values generally reflect the last reported sales price if the security is actively traded. The third-party pricing agents may also value debt securities at an evaluated bid price by employing methodologies that utilize actual market transactions, broker-supplied valuations, or other methodologies designed to identify the market value for such securities. Such methodologies generally consider such factors as security prices, yields, maturities, call features, ratings and developments relating to specific securities in arriving at valuations. On the first day a new debt security purchase is recorded, if a price is not available on the automated pricing feeds from our primary and secondary pricing vendors nor is it available from an independent broker, the security may be valued at its purchase price. Each day thereafter, the debt security will be valued according to the Trust’s fair value procedures until an independent source can be
36
| THE ADVISORS’ INNER CIRCLE FUND III | MetLife Core Plus Fund October 31, 2022
|
secured. Debt obligations with remaining maturities of sixty days or less may be valued at their amortized cost, which approximates market value provided that it is determined the amortized cost continues to approximate fair value. Should existing credit, liquidity or interest rate conditions in the relevant markets and issuer specific circumstances suggest that amortized cost does not approximate fair value, then the amortized cost method may not be used.
Securities for which market prices are not “readily available” are required to be fair valued under the 1940 Act.
In December 2020, the SEC adopted Rule 2a-5 under the 1940 Act, establishing requirements to determine fair value in good faith for purposes of the 1940 Act. The rule permits fund boards to designate a fund’s investment adviser to perform fair-value determinations, subject to board oversight and certain other conditions. The rule also defines when market quotations are “readily available” for purposes of the 1940 Act and requires a fund to fair value a portfolio investment when a market quotation is not readily available. The SEC also adopted new Rule 31a-4 under the 1940 Act, which sets forth recordkeeping requirements associated with fair-value determinations. The compliance date for Rule 2a-5 and Rule 31a-4 was September 8, 2022.
Effective September 8, 2022, and pursuant to the requirements of Rule 2a-5, the Trust’s Board of Trustees (the “Board”) designated the Adviser as the Board’s valuation designee to perform fair-value determinations for the Fund through a Fair Value Committee (the “Committee”) established by the Adviser and approved new Adviser Fair Value Procedures for the Fund. Prior to September 8, 2022, fair-value determinations were performed in accordance with the Trust’s Fair Value Procedures established by the Board and were implemented through a Fair Value Committee designated by the Board.
Some of the more common reasons that may necessitate that a security be valued using fair value procedures include: the security’s trading has been halted or suspended; the security has been de-listed from a national exchange; the security’s primary trading market is temporarily closed at a time when under normal conditions it would be open; the security has not been traded for an extended period of time; the security’s primary pricing source is not able or willing to provide a price; or trading of the security is subject to local government imposed restrictions. When a security is valued in accordance with the fair value procedures, the Committee will determine the value after taking into consideration relevant information reasonably available to the Committee. As of October 31, 2022, there were no fair valued securities.
In accordance with the authoritative guidance on fair value measurement under U.S. GAAP, the Fund discloses fair value of its investments in a hierarchy that prioritizes the inputs to valuation techniques used to measure the fair value. The objective of a fair value measurement is to determine the price that would be received to sell an asset or paid to transfer a liability in an orderly transaction between market participants at the measurement date (an exit price). Accordingly, the fair value hierarchy gives the highest priority to quoted prices (unadjusted) in active markets for identical assets or liabilities (Level 1) and the lowest priority to unobservable inputs (Level 3). The three levels of the fair value hierarchy are described below:
37
| THE ADVISORS’ INNER CIRCLE FUND III | MetLife Core Plus Fund October 31, 2022
|
| ● | Level 1 — Unadjusted quoted prices in active markets for identical, unrestricted assets or liabilities that the Fund has the ability to access at the measurement date; |
| ● | Level 2 — Other significant observable inputs (includes quoted prices for similar securities, interest rates, prepayment speeds, credit risk, referenced indices, quoted prices in inactive markets, adjusted quoted prices in inactive markets, etc.); and |
| ● | Level 3 — Prices, inputs or exotic modeling techniques which are both significant to the fair value measurement and unobservable (supported by little or no market activity). |
Investments are classified within the level of the lowest significant input considered in determining fair value. Investments classified within Level 3 whose fair value measurement considers several inputs may include Level 1 or Level 2 inputs as components of the overall fair value measurement.
For details of the investment classifications, refer to the Schedule of Investments.
Federal Income Taxes — It is the Fund’s intention to continue to qualify as a regulated investment company for Federal income tax purposes by complying with the appropriate provisions of Subchapter M of the Internal Revenue Code of 1986, as amended. Accordingly, no provision for Federal income taxes has been made in the financial statements.
The Fund evaluates tax positions taken or expected to be taken in the course of preparing the Fund’s tax returns to determine whether it is “more-likely-than-not” (i.e., greater than 50-percent) that each tax position will be sustained upon examination by a taxing authority based on the technical merits of the position. Tax positions not deemed to meet the more-likely-than-not threshold are recorded as a tax benefit or expense in the current period. The Fund did not record any tax provision in the current period. However, management’s conclusions regarding tax positions taken may be subject to review and adjustment at a later date based on factors including, but not limited to, examination by tax authorities (i.e., all open tax year ends, since inception), on-going analysis of and changes to tax laws, regulations and interpretations thereof.
As of and during the year ended, the Fund did not have a liability for any unrecognized tax benefits. The Fund recognizes interest and penalties, if any, related to unrecognized tax benefits as income tax expense in the Statement of Operations. During the year ended October 31, 2022, the Fund did not incur any interest or penalties.
Security Transactions and Investment Income — Security transactions are accounted for on trade date. Costs used in determining realized gains and losses on the sale of investment securities are based on the specific identification method. Dividend income is recorded on the ex-dividend date. Dividend income is recorded net of unrecoverable withholding tax. Interest income and expense is recorded on an accrual basis. Interest income is recognized on the accrual basis from settlement date and includes the amortization of premiums and the accretion of discount. Realized gains (losses) on paydowns of mortgage-backed and asset-backed securities are recorded as an adjustment to interest income.
38
| THE ADVISORS’ INNER CIRCLE FUND III | MetLife Core Plus Fund October 31, 2022
|
Foreign Currency Translation — The books and records of the Fund are maintained in U.S. dollars. Investment securities and other assets and liabilities denominated in a foreign currency are translated into U.S. dollars on the date of valuation. The Fund does not isolate that portion of realized or unrealized gains and losses resulting from changes in the foreign exchange rate from fluctuations arising from changes in the market prices of the securities. These gains and losses are included in net realized and unrealized gains and losses on investments on the Statement of Operations. Net realized and unrealized gains and losses on foreign currency transactions represent net foreign exchange gains or losses from foreign currency exchange contracts, disposition of foreign currencies, currency gains or losses realized between trade and settlement dates on securities transactions and the difference between the amount of the investment income and foreign withholding taxes recorded on the Fund’s books and the U.S. dollar equivalent of the amounts actually received or paid.
Expenses — Expenses that are directly related to the Fund are charged to the Fund. Other operating expenses of the Trust are prorated to the funds based on the number of funds and/or relative net assets.
Classes — Class specific expenses are borne by that class of shares. Income, realized and unrealized gains (losses), and non-class specific expenses are allocated to the respective class on the basis of relative daily net assets.
Dividends and Distributions to Shareholders — The Fund will distribute its net investment income quarterly. Distributions from net realized capital gains, if any, are declared and paid annually. All distributions are recorded on ex-dividend date.
Cash — Idle cash may be swept into various money market sweep accounts and is classified as cash equivalents on the Statement of Assets and Liabilities. The Fund maintains cash in bank deposit accounts which, at times, may exceed United States federally insured limits. Amounts invested are available on the same business day.
Futures Contracts — To the extent consistent with its investment objective and strategies, the Fund uses futures contracts for tactical hedging purposes as well as to enhance the Fund’s return. Initial margin deposits of cash or securities are made upon entering into futures contracts. Variation margin payments are paid or received, depending upon whether unrealized gains or losses are incurred. The cumulative appreciation (depreciation) of futures contracts is included on the Statement of Assets and Liabilities as net unrealized appreciation (depreciation) on futures contracts.
When the futures contract is closed, the Fund records a realized gain or loss equal to the difference between the proceeds from (or cost of) the closing transaction and the amount invested in the futures contract. Net realized and unrealized gains or losses occurring during the holding period of futures contracts are found on the Statement of Operations as a component of net realized gain (loss) on futures contracts and net change in unrealized appreciation (depreciation) on futures contracts, respectively.
Risks of entering into futures contracts include the possibility that there will be an imperfect price correlation between the futures and the underlying securities. Second, it is possible that a lack of liquidity for futures contracts could exist in the secondary market, resulting in an inability to close a position prior to its maturity date. Third, the futures contract involves the risk that the Fund could lose more than the original margin deposit required to initiate
39
| THE ADVISORS’ INNER CIRCLE FUND III | MetLife Core Plus Fund October 31, 2022
|
a futures transaction. Finally, the risk exists that losses could exceed amounts disclosed on the Statement of Assets and Liabilities. As of October 31, 2022, the Fund did not hold any futures contracts.
3. Transactions with Affiliates:
Certain officers of the Trust are also employees of SEI Investments Global Funds Services (the “Administrator”), a wholly owned subsidiary of SEI Investments Company, and/or SEI Investments Distribution Co. (the “Distributor”). Such officers are paid no fees by the Trust, other than the Chief Compliance Officer (“CCO”) as described below, for serving as officers of the Trust.
A portion of the services provided by the CCO and his staff, whom are employees of the Administrator, are paid for by the Trust as incurred. The services include regulatory oversight of the Trust’s advisors and service providers, as required by SEC regulations. The CCO’s services and fees have been approved by, and are reviewed by, the Board.
4. Administration, Shareholder Servicing, Custodian and Transfer Agent Agreements:
The Fund and the Administrator are parties to an Administration Agreement under which the Administrator provides management and administrative services to the Fund. For these services, the Administrator is paid an asset-based fee, which will vary depending on the number of share classes and the average daily net assets of the Fund. For the year ended October 31, 2022, the Fund paid $321,339 for these services.
The Fund has adopted a shareholder servicing plan that provides that the Fund may pay financial intermediaries for shareholder services in an annual amount not to exceed 0.25% based on the Fund’s R Class Shares’ average net assets. For the year ended October 31, 2022, the R Class Shares incurred no shareholder servicing fees.
The Trust and the Distributor are parties to a Distribution Agreement. The Distributor receives no fees under the Agreement.
Brown Brothers Harriman & Co. acts as custodian (the “Custodian”) for the Fund. The Custodian plays no role in determining the investment policies of the Fund or which securities are to be purchased or sold by the Fund.
DST Systems, Inc. serves as the transfer agent and dividend disbursing agent for the Fund under a transfer agency agreement with the Trust.
5. Investment Advisory Agreement:
Under the terms of an investment advisory agreement, MetLife Investment Management, LLC, (the “Adviser”) provides investment advisory services to the Fund at a fee, which is calculated daily and paid monthly at an annual rate of 0.40% of the Fund’s average daily net assets. The Adviser has contractually agreed to reduce fees and/or reimburse expenses to the extent necessary to keep the total annual Fund operating expenses (excluding interest, taxes, brokerage commissions, acquired fund fees and expenses and extraordinary expenses (collectively, “excluded expenses”)) from exceeding 0.45% of the Fund’s I Class Shares’ average daily net assets and 0.70% of the Fund’s R Class Shares’ average daily net assets until February 28, 2023. This Agreement may be terminated: (i) by the Board, for any reason at any time; or (ii) by the Adviser, upon ninety (90) days’ prior written notice to the Trust,
40
| THE ADVISORS’ INNER CIRCLE FUND III | MetLife Core Plus Fund October 31, 2022
|
effective as of the close of business on February 28, 2023. Refer to waiver of investment advisory fees on the Statement of Operations for fees waived for the year ended October 31, 2022. In addition, if at any point it becomes unnecessary for the Adviser to reduce fees or make expense reimbursements, the Adviser may retain the difference between the total annual operating expenses and the aforementioned expense limitations to recapture all or a portion of its prior expense limitation reimbursements made during the preceding three-year period. As of October 31, 2022, fees which were previously waived and/or reimbursed by the Adviser which may be subject to possible future reimbursement to the Adviser were $396,934, expiring in 2023, $552,680, expiring in 2024, and $549,837, expiring in 2025. The Adviser is a wholly owned subsidiary of MetLife, Inc., a publicly held company.
6. Investment Transactions:
The cost of security purchases and the proceeds from security sales, other than short-term investments, for the year ended October 31, 2022, were as follows:
| | U.S. Government | | Other | Total | ||||||||||||||||
Purchases | $ | 984,121,799 | $ | 88,414,148 | $ | 1,072,535,947 | ||||||||||||||
Sales | 932,984,773 | 90,249,669 | 1,023,234,442 |
7. Federal Tax Information:
The amount and character of income and capital gain distributions to be paid, if any, are determined in accordance with Federal income tax regulations, which may differ from U.S. GAAP. As a result, net investment income (loss) and net realized gain (loss) on investment transactions for a reporting period may differ significantly from distributions during such period. These book/tax differences may be temporary or permanent. The permanent differences primarily consist of foreign currency translations, gains and losses on paydowns of mortgage and asset-backed securities for tax purposes, Perpetual Bond adjustment, and distribution reclassification. There are no permanent differences that are credited or charged to Paid-in Capital and Distributable Earnings as of October 31, 2022.
The tax character of dividends and distributions declared during the years ended October 31, were as follows:
| Ordinary Income | Long-Term Capital Gain | Total | ||||||||||
2022 | $6,449,449 | $— | $6,449,449 | |||||||||
2021 | 5,465,438 | 91,179 | 5,556,617 | |||||||||
As of October 31, 2022, the components of accumulated losses on a tax basis were as follows:
Undistributed Ordinary Income | $ | 950,761 | ||
Capital Loss Carryforwards Short-Term | (11,008,572) | |||
Capital Loss Carryforwards Long-Term | (13,367,399) | |||
Unrealized Depreciation | (47,067,016) | |||
Other Temporary Differences | (32,002) | |||
|
| |||
Total Accumulated Losses | $ | (70,524,228) | ||
|
|
41
| THE ADVISORS’ INNER CIRCLE FUND III | MetLife Core Plus Fund October 31, 2022
|
For Federal income tax purposes, capital losses incurred may be carried forward and applied against future capital gains. Such capital losses retain their character as either short-term or long-term capital losses. During the year ended October 31, 2022, the Fund did not utilize capital loss carryforwards to offset capital gains.
For Federal income tax purposes the difference between Federal tax cost and book cost primarily relates to wash sales, which cannot be used for Federal income tax purposes in the current year and have been deferred for use in future years. The Federal tax cost and aggregate gross unrealized appreciation and depreciation for the investments held by the Fund at October 31, 2022, were as follows:
Federal | Aggregate | Aggregate | Net Appreciation/ (Depreciation) | |||||||||||||||
| $350,395,122 | $ | 65,719 | $ | (47,132,735 | ) | $ | (47,067,016 | ) | ||||||||||
8. Other:
At October 31, 2022, 87% of I Class Shares total shares outstanding were held by three record shareholders and 100% of R Class Shares total shares outstanding were held by one record related party shareholder, owning 10% or greater of the aggregate total shares outstanding. These are comprised of omnibus accounts that are held on behalf of various individual shareholders.
9. Concentration of Risks:
As with all mutual funds, there is no guarantee that the Fund will achieve its investment objective. You could lose money by investing in the Fund. An investment in the Fund is not a bank deposit and is not insured or guaranteed by the FDIC or any government agency. The principal risks affecting shareholders’ investments in the Fund are set forth below.
Credit Risk — The risk that the issuer of a security or the counterparty to a contract will default or otherwise become unable to honor a financial obligation. A decline in the credit rating of an individual security held by the Fund may have an adverse impact on its price. Rating agencies might not always change their credit rating on an issuer or security in a timely manner to reflect events that could affect the issuer’s ability to make timely payments on its obligations.
Interest Rate Risk — The risk that the value of fixed income securities, including U.S. Government securities, will fall due to rising interest rates.
Liquidity Risk — Liquidity risk is the risk that certain securities may be difficult or impossible to sell at the time and the price that the Fund would like. The Fund may have to accept a lower price to sell a security, sell other securities to raise cash, or give up an investment opportunity, any of which could have a negative effect on Fund management or performance.
Market Risk — The risk that the market value of an investment may move up and down, sometimes rapidly and unpredictably. Markets for securities in which the Fund invests may decline significantly in response to adverse issuer, political, regulatory, market, economic or other developments that may cause broad changes in market value, public perceptions concerning these developments, and adverse investor sentiment or publicity. Similarly, the
42
| THE ADVISORS’ INNER CIRCLE FUND III | MetLife Core Plus Fund October 31, 2022
|
impact of any epidemic, pandemic or natural disaster, or widespread fear that such events may occur, could negatively affect the global economy, as well as the economies of individual countries, the financial performance of individual companies and sectors, and the markets in general in significant and unforeseen ways. Any such impact could adversely affect the prices and liquidity of the securities and other instruments in which the Fund invests, which in turn could negatively impact the Fund’s performance and cause losses on your investment in the Fund.
Issuer Risk — The risk that the value of a security may decline for a reason directly related to the issuer, such as management performance, financial leverage and reduced demand for the issuer’s goods or services.
Privately Issued Securities Risk — Investment in privately placed securities may be less liquid than in publicly traded securities. Although these securities may be resold in privately negotiated transactions, the prices realized from these sales could be less than those originally paid by the Fund or less than what may be considered the fair value of such securities. Further, companies whose securities are not publicly traded may not be subject to the disclosure and other investor protection requirements that might be applicable if their securities were publicly traded.
Unrated Securities Risk — Debt securities that are not rated by Moody’s, S&P or Fitch may not have an active trading market or may be difficult to value, which means the Fund might have difficulty selling them promptly at an acceptable price.
Call Risk — The risk that an issuer may exercise its right to redeem a fixed income security earlier than expected (a call). If an issuer calls a security that the Fund has invested in, the Fund may not recoup the full amount of its initial investment and may be forced to reinvest in lower-yielding securities, securities with greater credit risks or securities with other, less favorable features.
Prepayment Risk — The risk that, with declining interest rates, fixed income securities with stated interest rates may have the principal paid earlier than expected. Such sooner-than-expected principal payments may reduce the returns of the Fund because of loss of expected future interest payments on the principal amount paid back early and requires the Fund to invest the proceeds at generally lower interest rates.
Extension Risk — The risk that rising interest rates may extend the duration of a fixed income security, typically reducing the security’s value.
Asset-Backed Securities Risk — Payment of principal and interest on asset-backed securities is dependent largely on the cash flows generated by the assets backing the securities, and asset-backed securities may not have the benefit of any security interest in the related assets.
Mortgage-Backed Securities Risk — Mortgage-backed securities are affected by, among other things, interest rate changes and the possibility of prepayment of the underlying mortgage loans. Mortgage-backed securities are also subject to the risk that underlying borrowers will be unable to meet their obligations. TBA Transactions involve the additional risk that the value of the mortgage-backed securities to be purchased declines prior to settlement date or the counterparty does not deliver the securities as promised.
Derivatives Risk — The Fund’s use of futures contracts, forward contracts and swaps is subject
43
| THE ADVISORS’ INNER CIRCLE FUND III | MetLife Core Plus Fund October 31, 2022
|
to market risk, leverage risk, correlation risk and liquidity risk. Market risk and liquidity risk are described elsewhere in this section. Leverage risk is the risk that the use of leverage may amplify the effects of market volatility on the Fund’s share price and may also cause the Fund to liquidate portfolio positions when it would not be advantageous to do so in order to satisfy its obligations. Correlation risk is the risk that changes in the value of the derivative may not correlate perfectly with the underlying asset, rate or index. The Fund’s use of forward contracts and swaps is also subject to credit risk and valuation risk. Credit risk is described elsewhere in this section. Valuation risk is the risk that the derivative may be difficult to value and/or valued incorrectly. Each of these risks could cause the Fund to lose more than the principal amount invested in a derivative instrument.
Fixed Income Market Risk — The prices of the Fund’s fixed income securities respond to regulatory and economic developments, particularly interest rate changes, as well as to perceptions about the creditworthiness of individual issuers, including governments and their agencies. In the case of foreign securities, price fluctuations will reflect international economic and political events, as well as changes in currency valuations relative to the U.S. dollar. Events in the fixed income markets may lead to periods of volatility, liquidity issues and, in some cases, credit downgrades and increased likelihood of default.
Hedging Risk — The Fund may use derivative instruments for hedging purposes. Hedging through the use of these instruments does not eliminate fluctuations in the underlying prices of the securities that the Fund owns or intends to purchase or sell. While entering into these instruments tends to reduce the risk of loss due to a decline in the value of the hedged asset, such instruments also limit any potential gain that may result from the increase in value of the asset. There can be no assurance that any hedging strategy will be effective or that there will be a hedge in place at any given time.
Portfolio Turnover Risk — The Fund may buy and sell securities frequently. Such a strategy often involves higher expenses, including brokerage commissions, and may increase the amount of capital gains (in particular, short term gains) realized by the Fund. Shareholders may pay tax on such capital gains and will indirectly incur additional expenses related to a fund with a higher portfolio turnover rate.
High Yield Bond Risk — High yield, or “junk,” bonds involve greater risks of default or downgrade and are more volatile than investment grade securities because the prospect for repayment of principal and interest of many of these securities is speculative. High-yield bonds also may be less liquid than higher quality investments.
Emerging Markets Securities Risk — Investments in emerging markets securities are considered speculative and subject to heightened risks in addition to the general risks of investing in foreign securities. Unlike more established markets, emerging markets may have governments that are less stable, markets that are less liquid and economies that are less developed. In addition, the securities markets of emerging market countries may consist of companies with smaller market capitalizations and may suffer periods of relative illiquidity; significant price volatility; restrictions on foreign investment; and possible restrictions on repatriation of investment income and capital. Furthermore, foreign investors may be required to register the proceeds of sales, and future economic or political crises could lead to price controls, forced mergers, expropriation or confiscatory taxation, seizure, nationalization or creation of government monopolies.
Foreign Company Risk — Investing in foreign companies poses additional risks since political
44
| THE ADVISORS’ INNER CIRCLE FUND III | MetLife Core Plus Fund October 31, 2022
|
and economic events unique to a country or region will affect those markets and their issuers. These risks will not necessarily affect the U.S. economy or similar issuers located in the U.S. Securities of foreign companies may not be registered with the SEC and foreign companies are generally not subject to the regulatory controls imposed on U.S. issuers and, as a consequence, there is generally less publically available information about foreign securities than is available about domestic securities. Income from foreign securities owned by the Fund may be reduced by a withholding tax at the source, which would reduce income received from the securities comprising the Fund’s portfolio. Foreign securities may also be more difficult to value than securities of U.S. issuers.
Currency Risk — As a result of the Fund’s investments in securities or other investments denominated in, and/or receiving revenues in, foreign currencies, the Fund will be subject to currency risk. Currency risk is the risk that foreign currencies will decline in value relative to the U.S. dollar or, in the case of hedging positions, that the U.S. dollar will decline in value relative to the currency hedged. In either event, the dollar value of an investment in the Fund would be adversely affected.
LIBOR Replacement Risk — The elimination of the London Inter-Bank Offered Rate (“LIBOR”) may adversely affect the interest rates on, and value of, certain Fund investments for which the value is tied to LIBOR. The U.K. Financial Conduct Authority has announced that it intends to stop compelling or inducing banks to submit LIBOR rates after 2021. However, it remains unclear if LIBOR will continue to exist in its current, or a modified, form. Alternatives to LIBOR are established or in development in most major currencies, including the Secured Overnight Financing Rate (“SOFR”), which is intended to replace U.S. dollar LIBOR. Markets are slowly developing in response to these new rates. Questions around liquidity impacted by these rates, and how to appropriately adjust these rates at the time of transition, remain a concern for the Fund. Accordingly, it is difficult to predict the full impact of the transition away from LIBOR on the Fund until new reference rates and fallbacks for both legacy and new products, instruments and contracts are commercially accepted.
The foregoing is not intended to be a complete discussion of the risks associated with investing in the Fund. A more complete description of risks associated with the Fund is included in the prospectus and statement of additional information.
10. New Accounting Pronouncement:
In March 2020, FASB issued ASU 2020-04, Reference Rate Reform: Facilitation of the Effects of Reference Rate Reform on Financial Reporting. The main objective of the new guidance is to provide relief to companies that will be impacted by the expected change in benchmark interest rates at the end of 2021, when participating banks will no longer be required to submit LIBOR quotes by the Financial Conduct Authority. The new guidance allows companies to, provided the only change to existing contracts are a change to an approved benchmark interest rate, account for modifications as a continuance of the existing contract without additional analysis. For new and existing contracts, the Fund may elect to apply the amendments as of March 12, 2020 through December 31, 2022. Management is currently assessing the impact of the ASU’s adoption to the Fund’s financial statements and various filings.
11. Indemnifications:
In the normal course of business, the Fund enters into contracts that provide general indemnifications. The Fund’s maximum exposure under these arrangements is dependent
45
| THE ADVISORS’ INNER CIRCLE FUND III | MetLife Core Plus Fund October 31, 2022
|
on future claims that may be made against the Fund and, therefore, cannot be established; however, based on experience, the risk of loss from such claim is considered remote.
12. Subsequent Events:
The Fund has evaluated the need for additional disclosures and/or adjustments resulting from subsequent events through the date the financial statements were issued. Based on this evaluation, no additional disclosures and/or adjustments were required to the financial statements.
46
| THE ADVISORS’ INNER CIRCLE FUND III | MetLife Core Plus Fund October 31, 2022
|
REPORT OF INDEPENDENT REGISTERED PUBLIC ACCOUNTING FIRM
|
To the Shareholders of MetLife Core Plus Fund and the Board of Trustees of The Advisors’ Inner Circle Fund III:
Opinion on the Financial Statements and Financial Highlights
We have audited the accompanying statement of assets and liabilities, including the schedule of investments, of MetLife Core Plus Fund (the “Fund”), one of the funds constituting The Advisors’ Inner Circle Fund III (the “Trust”), as of October 31, 2022, the related statement of operations for the year then ended, the statements of changes in net assets for each of the two years in the period then ended, the financial highlights for each of the five years in the period then ended, and the related notes. In our opinion, the financial statements and financial highlights present fairly, in all material aspects, the financial position of the Fund as of October 31, 2022, and the results of its operations for the year then ended, the changes in its net assets for each of the two years in the period then ended, and the financial highlights for each of the five years in the period then ended in conformity with accounting principles generally accepted in the United States of America.
Basis for Opinion
These financial statements and financial highlights are the responsibility of the Fund’s management. Our responsibility is to express an opinion on the Fund’s financial statements and financial highlights based on our audits. We are a public accounting firm registered with the Public Company Accounting Oversight Board (United States) (PCAOB) and are required to be independent with respect to the Fund in accordance with the U.S. federal securities laws and the applicable rules and regulations of the Securities and Exchange Commission and the PCAOB.
We conducted our audits in accordance with the standards of the PCAOB. Those standards require that we plan and perform the audit to obtain reasonable assurance about whether the financial statements and financial highlights are free of material misstatement, whether due to error or fraud. The Fund is not required to have, nor were we engaged to perform, an audit of its internal control over financial reporting. As part of our audits we are required to obtain an understanding of internal control over financial reporting but not for the purpose of expressing an opinion on the effectiveness of the Fund’s internal control over financial reporting. Accordingly, we express no such opinion.
Our audits included performing procedures to assess the risks of material misstatement of the financial statements and financial highlights, whether due to error or fraud, and performing procedures that respond to those risks. Such procedures included examining, on a test basis, evidence regarding the amounts and disclosures in the financial statements and financial highlights. Our audits also included evaluating the accounting principles used and significant estimates made by management, as well as evaluating the overall presentation of the financial statements and financial highlights. Our procedures included confirmation of securities owned as of October 31, 2022, by correspondence with the custodian and brokers; when replies were not received from brokers, we performed other auditing procedures. We believe that our audits provide a reasonable basis for our opinion.
Deloitte & Touche LLP
Philadelphia, Pennsylvania
December 27, 2022
We have served as the auditor of one or more of The Advisors’ Inner Circle Fund III investment companies since 2017.
47
| THE ADVISORS’ INNER CIRCLE FUND III | MetLife Core Plus Fund October 31, 2022
|
DISCLOSURE OF FUND EXPENSES (unaudited)
|
All mutual funds have operating expenses. As a shareholder of a mutual fund, your investment is affected by these ongoing costs, which include (among others) costs for fund management, administrative services, and shareholder reports like this one. It is important for you to understand the impact of these costs on your investment returns.
Operating expenses such as these are deducted from the mutual fund’s gross income and directly reduce your final investment return. These expenses are expressed as a percentage of the mutual fund’s average net assets; this percentage is known as the mutual fund’s expense ratio.
The following examples use the expense ratio and are intended to help you understand the ongoing costs (in dollars) of investing in your Fund and to compare these costs with those of other mutual funds. The examples are based on an investment of $1,000 made at the beginning of the period shown and held for the entire period (May 1, 2022 to October 31, 2022).
The table on the next page illustrates your Fund’s costs in two ways:
Actual Fund Return. This section helps you to estimate the actual expenses after fee waivers that your Fund incurred over the period. The “Expenses Paid During Period” column shows the actual dollar expense cost incurred by a $1,000 investment in the Fund, and the “Ending Account Value” number is derived from deducting that expense cost from the Fund’s gross investment return.
You can use this information, together with the actual amount you invested in the Fund, to estimate the expenses you paid over that period. Simply divide your ending starting account value by $1,000 to arrive at a ratio (for example, an $8,600 account value divided by $1,000 = 8.6), then multiply that ratio by the number shown for your Fund under “Expenses Paid During Period.”
Hypothetical 5% Return. This section helps you compare your Fund’s costs with those of other mutual funds. It assumes that the Fund had an annual 5% return before expenses during the year, but that the expense ratio (Column 3) for the period is unchanged. This example is useful in making comparisons because the Securities and Exchange Commission requires all mutual funds to make this 5% calculation. You can assess your Fund’s comparative cost by comparing the hypothetical result for your Fund in the “Expenses Paid During Period” column with those that appear in the same charts in the shareholder reports for other mutual funds.
48
| THE ADVISORS’ INNER CIRCLE FUND III | MetLife Core Plus Fund October 31, 2022
|
DISCLOSURE OF FUND EXPENSES (unaudited) (continued)
|
NOTE: Because the return is set at 5% for comparison purposes — NOT your Fund’s actual return — the account values shown may not apply to your specific investment.
| Beginning Account Value 5/1/22 | Ending Account Value 10/31/22 | Annualized Expense Ratios | Expenses Paid During Period* | |||||||||||||||||
| MetLife Core Plus Fund | ||||||||||||||||||||
Actual Fund Return |
| |||||||||||||||||||
I Class Shares | $ | 1,000.00 | $ | 923.90 | 0.45 | % | $ | 2.18 | ||||||||||||
R Class Shares | 1,000.00 | 922.10 | 0.45 | %(1) | 2.18 | |||||||||||||||
Hypothetical 5% Return |
| |||||||||||||||||||
I Class Shares | $ | 1,000.00 | $ | 1,022.94 | 0.45 | % | $ | 2.29 | ||||||||||||
R Class Shares | 1,000.00 | 1,021.68 | 0.70 | % | 3.57 | |||||||||||||||
| * | Expenses are equal to the Fund’s annualized expense ratio multiplied by the average account value over the period, multiplied by 184/365 (to reflect the one-half year period). |
| (1) | The share class is expected to run at the expense limit of 0.70% when assets are contributed. |
49
| THE ADVISORS’ INNER CIRCLE FUND III | MetLife Core Plus Fund October 31, 2022 Unaudited
|
| TRUSTEES AND OFFICERS OF THE ADVISORS’ INNER CIRCLE FUND III |
Set forth below are the names, years of birth, positions with the Trust, length of term of office, and the principal occupations for the last five years of each of the persons currently serving as Trustees and Officers of the Trust. Unless otherwise noted, the business address of each Trustee is SEI Investments Company, One Freedom Valley Drive, Oaks Pennsylvania 19456. Trustees who are deemed not to be “interested persons” of the Trust are referred to as “Independent Trustees.” Mr. Doran is a Trustee who may be an
| Name and Year of Birth | Position with Trust and Length of Time Served1 | Principal Occupations in the Past Five Years | ||
| INTERESTED TRUSTEES3,4 | ||||
William M. Doran (Born: 1940) | Chairman of the Board of Trustees | Self-Employed Consultant since 2003. Partner at Morgan, Lewis & Bockius LLP (law firm) from 1976 to 2003. Counsel to the Trust, SEI Investments, SIMC, the Administrator and the Distributor. Secretary of SEI Investments since 1978.
| ||
| INDEPENDENT TRUSTEES3 | ||||
Jon C. Hunt (Born: 1951) | Trustee and Lead Independent Trustee (since 2014) | Retired since 2013. Consultant to Management, Convergent Capital Management, LLC (“CCM”) from 2012 to 2013. Managing Director and Chief Operating Officer, CCM from 1998 to 2012.
| ||
Thomas P. Lemke (Born: 1954) | Trustee (since 2014) | Retired since 2013. Executive Vice President and General Counsel, Legg Mason, Inc. from 2005 to 2013.
| ||
Nichelle Maynard-Elliott (Born: 1968) | Trustee (since 2021) | Independent Director since 2018. Executive Director, M&A at Praxair Inc. from 2011-2019.
| ||
| 1 | Each Trustee shall hold office during the lifetime of this Trust until the election and qualification of his or her successor, or until he or she sooner dies, resigns, or is removed in accordance with the Trust’s Declaration of Trust. |
| 2 | Directorships of Companies required to report to the Securities and Exchange Commission under the Securities Exchange Act of 1934 (i.e., “public companies”) or other investment companies under the 1940 Act. |
| 3 | Trustees oversee 65 funds in The Advisors’ Inner Circle Fund III. |
| 4 | Denotes Trustees who may be deemed to be “interested” persons of the Fund as that term is defined in the 1940 Act by virtue of their affiliation with the Distributor and/or its affiliates. |
50
| THE ADVISORS’ INNER CIRCLE FUND III | MetLife Core Plus Fund October 31, 2022 Unaudited
|
“interested” persons of the Trust as that term is defined in the 1940 Act by virtue of their affiliation with the Trust’s Distributor. The Trust’s Statement of Additional Information (“SAI”) includes additional information about the Trustees and Officers. The SAI may be obtained without charge by calling 1-800-252-4993. The following chart lists Trustees and Officers as of October 31, 2022.
Other Directorships Held in the Past Five Years2
|
Current Directorships: Trustee of Gallery Trust, Delaware Wilshire Private Markets Master Fund, Delaware Wilshire Private Markets Fund, Delaware Wilshire Private Markets Tender Fund, SEI Daily Income Trust, SEI Institutional International Trust, SEI Institutional Investments Trust, SEI Institutional Managed Trust, SEI Asset Allocation Trust, SEI Tax Exempt Trust, Adviser Managed Trust, New Covenant Funds, SEI Insurance Products Trust and SEI Catholic Values Trust. Director of SEI Investments, SEI Investments (Europe), Limited, SEI Investments—Global Funds Services, Limited, SEI Investments Global, Limited, SEI Investments (Asia), Limited, SEI Global Nominee Ltd., SEI Investments – Unit Trust Management (UK) Limited and SEI Investments Co. Director of the Distributor.
Former Directorships: Trustee of Winton Series Trust to 2017. Trustee of The Advisors’ Inner Circle Fund, The Advisors’ Inner Circle Fund II, Bishop Street Funds, The KP Funds and Winton Diversified Opportunities Fund (closed-end investment company) to 2018. Trustee of Schroder Global Series Trust to 2021. Trustee of Schroder Series Trust to 2022. |
Current Directorships: Trustee of City National Rochdale Funds, Gallery Trust, Delaware Wilshire Private Markets Master Fund, Delaware Wilshire Private Markets Fund and Delaware Wilshire Private Markets Tender Fund. Director of Chiron Capital Allocation Fund Ltd.
Former Directorships: Trustee of Winton Series Trust to 2017. Trustee of Winton Diversified Opportunities Fund (closed-end investment company) to 2018. Trustee of Schroder Global Series Trust to 2021. Trustee of Schroder Series Trust to 2022. |
Current Directorships: Trustee of Gallery Trust, Delaware Wilshire Private Markets Master Fund, Delaware Wilshire Private Markets Fund, Delaware Wilshire Private Markets Tender Fund, J.P. Morgan Active Exchange-Traded Funds (171 Portfolios) and Symmetry Panoramic Trust (16 Portfolios). Director of Chiron Capital Allocation Fund Ltd.
Former Directorships: Trustee of Munder Funds to 2014. Trustee of Victory Funds to 2015. Trustee of O’Connor EQUUS (closed-end investment company) to 2016. Trustee of Winton Series Trust and AXA Premier VIP Trust to 2017. Trustee of Winton Diversified Opportunities Fund (closed-end investment company) to 2018. Trustee of Schroder Global Series Trust to 2021. Trustee of Schroder Series Trust to 2022. |
Current Directorships: Trustee of Gallery Trust, Delaware Wilshire Private Markets Master Fund, Delaware Wilshire Private Markets Fund, Delaware Wilshire Private Markets Tender Fund. Director of Chiron Capital Allocation Fund Ltd. Director of Element Solutions Inc., Director of Xerox Holdings Corporation, and Director of Lucid Group, Inc.
Former Directorships: Trustee of Schroder Global Series Trust to 2021. Trustee of Schroder Series Trust to 2022. |
51
| THE ADVISORS’ INNER CIRCLE FUND III | MetLife Core Plus Fund October 31, 2022 Unaudited
|
TRUSTEES AND OFFICERS OF THE ADVISORS’ INNER CIRCLE FUND III
| ||||
Name and Year of Birth | Position with Trust and Length of Time Served1 | Principal Occupations in the Past Five Years | ||
| INDEPENDENT TRUSTEES (continued)3 | ||||
Jay C. Nadel (Born: 1958) | Trustee (since 2016) | Self-Employed Consultant since 2004. Executive Vice President, Bank of New York Broker Dealer from 2002 to 2004. Partner/Managing Director, Weiss Peck & Greer/Robeco from 1986 to 2001.
| ||
Randall S. Yanker (Born: 1960) | Trustee (since 2014) | Co-Founder and Senior Partner, Alternative Asset Managers, L.P. since 2004.
| ||
OFFICERS
| ||||
Michael Beattie (Born: 1965) | President (since 2014) | Director of Client Service, SEI Investments Company, since 2004.
| ||
James Bernstein (Born: 1962) | Vice President (since 2017) Secretary (since 2020) | Attorney, SEI Investments, since 2017.
Prior Positions: Self-employed consultant, 2017. Associate General Counsel & Vice President, Nationwide Funds Group and Nationwide Mutual Insurance Company, from 2002 to 2016. Assistant General Counsel & Vice President, Market Street Funds and Provident Mutual Insurance Company, from 1999 to 2002.
| ||
John Bourgeois (Born: 1973) | Assistant Treasurer (since 2017) | Fund Accounting Manager, SEI Investments, since 2000.
| ||
| 1 | Each Trustee shall hold office during the lifetime of this Trust until the election and qualification of his or her successor, or until he or she sooner dies, resigns, or is removed in accordance with the Trust’s Declaration of Trust. |
| 2 | Directorships of Companies required to report to the Securities and Exchange Commission under the Securities Exchange Act of 1934 (i.e., “public companies”) or other investment companies under the 1940 Act. |
| 3 | Trustees oversee 65 funds in The Advisors’ Inner Circle Fund III. |
52
| THE ADVISORS’ INNER CIRCLE FUND III | MetLife Core Plus Fund October 31, 2022 Unaudited
|
Other Directorships
Held in the Past Five Years2
Current Directorships: Chairman of the Board of Trustees of City National Rochdale Funds. Trustee of Gallery Trust, Schroder Series Trust, Schroder Global Series Trust, Delaware Wilshire Private Markets Master Fund, Delaware Wilshire Private Markets Fund and Delaware Wilshire Private Markets Tender Fund. Director of Chiron Capital Allocation Fund Ltd.
Former Directorships: Trustee of Winton Series Trust to 2017. Director of Lapolla Industries, Inc. to 2017. Trustee of Winton Diversified Opportunities Fund (closed-end investment company) to 2018.
Current Directorships: Trustee of Gallery Trust, Schroder Series Trust, Schroder Global Series Trust, Delaware Wilshire Private Markets Master Fund, Delaware Wilshire Private Markets Fund and Delaware Wilshire Private Markets Tender Fund. Independent Non-Executive Director of HFA Holdings Limited. Director of Chiron Capital Allocation Fund Ltd.
Former Directorships: Trustee of O’Connor EQUUS (closed-end investment company) to 2016. Trustee of Winton Series Trust to 2017. Trustee of Winton Diversified Opportunities Fund (closed-end investment company) to 2018.
None.
None.
None.
53
| THE ADVISORS’ INNER CIRCLE FUND III | MetLife Core Plus Fund October 31, 2022 Unaudited
|
| TRUSTEES AND OFFICERS OF THE ADVISORS’ INNER CIRCLE FUND III |
| Name and Year of Birth | Position(s) with Trust and Length of Time Served | Principal Occupation in the Past Five Years | ||
| OFFICERS (continued) | ||||
Eric C. Griffith (Born: 1969) | Vice President and Assistant Secretary (since 2020) | Counsel at SEI Investments since 2019. Vice President and Assistant General Counsel, JPMorgan Chase & Co., from 2012 to 2018.
| ||
Matthew M. Maher (Born: 1975) | Vice President and Assistant Secretary (since 2018) | Counsel at SEI Investments since 2018. Attorney, Blank Rome LLP, from 2015 to 2018. Assistant Counsel & Vice President, Bank of New York Mellon, from 2013 to 2014. Attorney, Dilworth Paxson LLP, from 2006 to 2013.
| ||
Andrew Metzger (Born: 1980) | Treasurer, Controller and Chief Financial Officer (since 2021) | Director of Fund Accounting, SEI Investments, since 2020. Senior Director, Embark, from 2019 to 2020. Senior Manager, PricewaterhouseCoopers LLP, from 2002 to 2019.
| ||
Robert Morrow (Born: 1968) | Vice President
| Account Manager, SEI Investments, since 2007.
| ||
Stephen F. Panner (Born: 1970) | Chief Compliance Officer (since 2022) | Chief Compliance Officer of SEI Asset Allocation Trust, SEI Daily Income Trust, SEI Institutional In- vestments Trust, SEI Institutional International Trust, SEI Institutional Managed Trust, SEI Tax Exempt Trust, Adviser Managed Trust, New Covenant Funds, SEI Catholic Values Trust, SEI Exchange Traded Funds, SEI Structured Credit Fund LP, The Advisors’ Inner Circle Fund, The Advisors’ Inner Circle Fund II, The Advisors’ Inner Circle Fund III, Bishop Street Funds, Frost Family of Funds, Gallery Trust, Delaware Wilshire Private Markets Fund, Delaware Wilshire Private Markets Master Fund, Delaware Wilshire Private Markets Tender Fund and Catholic Responsible Investments Funds since September 2022. Fund Compliance Officer of SEI Investments Company from February 2011 to September 2022. Fund Accounting Director and CFO and Controller for the SEI Funds from July 2005 to February 2011.
| ||
Alexander F. Smith (Born: 1977) | Vice President and Assistant Secretary (since 2020) | Counsel at SEI Investments since 2020. Associate Counsel & Manager, Vanguard, 2012 to 2020. Attorney, Stradley Ronon Stevens & Young, LLP, 2008 to 2012.
| ||
Bridget E. Sudall (Born: 1980) | Privacy Officer
Anti-Money Laundering Officer | Senior Associate and AML Officer, Morgan Stanley Alternative Investment Partners, from 2011 to 2015. Investor Services Team Lead, Morgan Stanley Alter- native Investment Partners, from 2007 to 2011. | ||
54
| THE ADVISORS’ INNER CIRCLE FUND III | MetLife Core Plus Fund October 31, 2022 Unaudited
|
Other Directorships Held in the Past Five Years |
|
None.
|
None.
|
None.
|
None.
|
None.
|
None.
|
None.
|
55
| THE ADVISORS’ INNER CIRCLE FUND III | MetLife Core Plus Fund October 31, 2022
|
| NOTICE TO SHAREHOLDERS (unaudited) |
For shareholders that do not have an October 31, 2022 tax year end, this notice is for informational purposes only. For shareholders with an October 31, 2022 tax year end, please consult your tax advisor as to the pertinence of this notice. For the fiscal year ended October 31, 2022, the Fund is designating the following items with regard to distributions paid during the year.
Long-Term | Ordinary | Total | Qualifying for | Qualifying | U.S. | Interest Related | Short-Term | |||||||
0.00% | 100.00% | 100.00% | 0.00% | 0.00% | 22.54% | 93.44% | 0.00% |
(1) Qualifying dividends represent dividends which qualify for the corporate dividends received deduction and is reflected as a percentage of ordinary Income distributions (the total of short-term capital gain and net investment income distributions).
(2) The percentage in this column represents the amount of “Qualifying Dividend Income” as created by the Jobs and Growth Tax Relief Reconciliation Act of 2003 and is reflected as a percentage of ordinary income distributions (the total of short-term capital gain and net investment income distributions). It is the intention of each of the aforementioned funds to designate the maximum amount permitted by law.
(3) “U.S. Government Interest” represents the amount of interest that was derived from direct U.S. Government obligations and distributed during the fiscal year. This amount is reflected as a percentage of ordinary income. Generally, interest from direct U.S. Government obligations is exempt from state income tax. However, for shareholders who are residents of California, Connecticut and New York, the statutory threshold requirements were not satisfied to permit exemption of these amounts from state income.
(4) The percentage in this column represents the amount of “Interest Related Dividends” and is reflected as a percentage of ordinary income distribution. Interest related dividends are exempt from U.S. withholding tax when paid to foreign investors.
(5) The percentage of this column represents the amount of “Short-Term Capital Gain Dividends” and is reflected as a percentage of short-term capital gain distribution that is exempt from U.S. withholding tax when paid to foreign investors.
The information reported herein may differ from the information and distributions taxable to the shareholder for the calendar year ending December 31, 2022. Complete information will be computed and reported with your 2022 Form 1099-DIV.
56
(This page intentionally left blank)
MetLife Funds
P.O. Box 219009
Kansas City, MO 64121-9009
1-800-252-4993
Adviser:
MetLife Investment Management, LLC
One MetLife Way
Whippany, NJ 07981
Distributor:
SEI Investments Distribution Co.
One Freedom Valley Drive
Oaks, PA 19456
Administrator:
SEI Investments Global Funds Services
One Freedom Valley Drive
Oaks, PA 19456
Legal Counsel:
Morgan, Lewis & Bockius LLP
1701 Market Street
Philadelphia, PA 19103
Independent Registered Public Accounting Firm:
Deloitte & Touche
1700 Market Street
Philadelphia, PA 19103
This information must be preceded or accompanied by a current prospectus for the Fund described.
MIM-AR-001-0300
| Item 2. | Code of Ethics. |
The Registrant (also referred to as the “Trust”) has adopted a code of ethics that applies to the Registrant’s principal executive officer, principal financial officer, controller or principal accounting officer, and any person who performs a similar function. There have been no amendments to or waivers granted to this code of ethics during the period covered by this report.
| Item 3. | Audit Committee Financial Expert. |
(a)(1) The Registrant’s board of trustees has determined that the Registrant has at least one audit committee financial expert serving on the audit committee.
(a)(2) The Registrant’s audit committee financial experts are Thomas P. Lemke and Jay Nadel, and each of Mr. Lemke and Mr. Nadel is “independent” as that term is defined in Form N-CSR Item 3 (a)(2).
| Item 4. | Principal Accountant Fees and Services. |
Fees billed by PricewaterhouseCoopers LLP (“PwC”) relate to The Advisors’ Inner Circle Fund III (the “Trust”).
PwC billed the Trust aggregate fees for services rendered to the Trust for the last two fiscal years as follows:
| 2022 | 2021 | |||||||||||||
All fees and services to approved | All fees and that were approved | All other approval | All fees and approved | All fees and approved | All other approval | |||||||||
(a) | Audit Fees(1) | $682,615 | None | None | $730,515 | None | $11,990 | |||||||
(b) | Audit-Related Fees | None | None | None | $4,000 | None | None | |||||||
(c) | Tax Fees | $88,500(4) | None | $126,709(2) | None | None | $90,000(2) | |||||||
(d) | All Other Fees | None | None | $5,301 | None | None | $1,473 | |||||||
Fees billed by Ernst & Young LLP (“E&Y”) relate to the Trust
E&Y billed the Trust aggregate fees for services rendered to the Trust for the last two fiscal years as follows:
| 2022 | 2021 | |||||||||||||
All fees and services to approved | All fees and that were approved | All other approval | All fees and approved | All fees and that were approved | All other approval | |||||||||
(a) | Audit Fees(1) | $131,900 | None | None | $128,050 | None | None | |||||||
(b) | Audit-Related Fees | None | None | None | None | None | None | |||||||
(c) | Tax Fees | None | None | None | None | None | None | |||||||
(d) | All Other Fees | None | None | None | None | None | None | |||||||
Fees billed by Deloitte & Touche LLP (“D&T”) relate to the Trust
D&T billed the Trust aggregate fees for services rendered to the Trust for the last two fiscal years as follows
| 2022 | 2021 | |||||||||||||
All fees and services to approved | All fees and services to service affiliates that were pre- approved | All other fees and services to service affiliates that did not require pre- approval | All fees and services to the Trust that were pre- approved | All fees and services to service affiliates that were pre- approved | All other fees and services to service affiliates that did not require pre- approval | |||||||||
(a) | Audit Fees(1) | $30,050 | None | None | $26,800 | None | None | |||||||
(b) | Audit-Related Fees | None | None | None | None | None | None | |||||||
(c) | Tax Fees | None | None | None | None | None | None | |||||||
(d) | All Other Fees | None | None | None | None | None | None | |||||||
Fees billed by KPMG (“KPMG”) relate to the Trust
KPMG billed the Trust aggregate fees for services rendered to the Trust for the last two fiscal years as follows
| 2022 | 2021 | |||||||||||||
| All fees and services to the Trust that were pre- approved | All fees and that were | All other fees and services to service affiliates that did not require pre- approval | All fees and services to the Trust that were pre- approved | All fees and that were | All other fees and services to service affiliates that did not require pre- approval | |||||||||
(a) | Audit Fees(1) | $322,500 | None | None | $25,000 | None | None | |||||||
(b) | Audit-Related Fees | None | None | None | None | None | None | |||||||
(c) | Tax Fees | None | None | None | None | None | None | |||||||
(d) | All Other Fees | None | None | $218,015(3) | None | None | $206,957(3) | |||||||
Notes:
| (1) | Audit fees include amounts related to the audit of the Trust’s annual financial statements and services normally provided by the accountant in connection with statutory and regulatory filings. |
| (2) | Tax return preparation fees for affiliates of the Funds. |
| (3) | Non-audit fees consist of SSAE No. 18 report over investment management activities and non-statutory audit reports of Legal & General Investment Management America, Inc. |
| (4) | Fees in connection with international withholding tax analysis. |
(e)(1) The Trust’s Audit Committee has adopted and the Board of Trustees has ratified an Audit and Non-Audit Services Pre-Approval Policy (the “Policy”), which sets forth the procedures and the conditions pursuant to which services proposed to be performed by the independent auditor of the Funds may be pre-approved.
The Policy provides that all requests or applications for proposed services to be provided by the independent auditor must be submitted to the Registrant’s Chief Financial Officer (“CFO”) and must include a detailed description of the services proposed to be rendered. The CFO will determine whether such services:
(1) require specific pre-approval;
(2) are included within the list of services that have received the general pre-approval of the Audit Committee pursuant to the Policy; or
(3) have been previously pre-approved in connection with the independent auditor’s annual engagement letter for the applicable year or otherwise. In any instance where services require pre-approval, the Audit Committee will consider whether such services are consistent with SEC’s rules and whether the provision of such services would impair the auditor’s independence.
Requests or applications to provide services that require specific pre-approval by the Audit Committee will be submitted to the Audit Committee by the CFO. The Audit Committee will be informed by the CFO on a quarterly basis of all services rendered by the independent auditor. The Audit Committee has delegated specific pre-approval authority to either the Audit Committee Chair or financial expert, provided that the estimated fee for any such proposed pre-approved service does not exceed $100,000 and any pre-approval decisions are reported to the Audit Committee at its next regularly-scheduled meeting.
Services that have received the general pre-approval of the Audit Committee are identified and described in the Policy. In addition, the Policy sets forth a maximum fee per engagement with respect to each identified service that has received general pre-approval.
All services to be provided by the independent auditor shall be provided pursuant to a signed written engagement letter with the Registrant, the investment adviser, or applicable control affiliate (except that matters as to which an engagement letter would be impractical because of timing issues or because the matter is small may not be the subject of an engagement letter) that sets forth both the services to be provided by the independent auditor and the total fees to be paid to the independent auditor for those services.
In addition, the Audit Committee has determined to take additional measures on an annual basis to meet the Audit Committee’s responsibility to oversee the work of the independent auditor and to assure the auditor’s independence from the Registrant, such as (a) reviewing a formal written statement from the independent auditor delineating all relationships between the independent auditor and the Registrant, and (b) discussing with the independent auditor the independent auditor’s methods and procedures for ensuring independence.
(e)(2) Percentage of fees billed applicable to non-audit services pursuant to waiver of pre-approval requirement were as follows (PwC):
| 2022 | 2021 | ||||||
Audit-Related Fees
| None
| None
| ||||||
Tax Fees
| None
| None
| ||||||
All Other Fees
| None
| None
|
(e)(2) Percentage of fees billed applicable to non-audit services pursuant to waiver of pre-approval requirement were as follows (E&Y):
| 2022 | 2021 | ||||||
Audit-Related Fees
| None
| None
| ||||||
Tax Fees
| None
| None
| ||||||
All Other Fees
| None
| None
|
(e)(2) Percentage of fees billed applicable to non-audit services pursuant to waiver of pre-approval requirement were as follows (D&T):
| 2022 | 2021 | |||||||
Audit-Related Fees
| None
| None
| ||||||
Tax Fees
| None
| None
| ||||||
All Other Fees
| None
| None
|
(e)(2) Percentage of fees billed applicable to non-audit services pursuant to waiver of pre-approval requirement were as follows (KPMG):
| 2022 | 2021 | |||||||
Audit-Related Fees
| None
| None
| ||||||
Tax Fees
| None
| None
| ||||||
All Other Fees
| None
| None
|
(f) Not applicable.
(g) The aggregate non-audit fees and services billed by PwC for services rendered to the Registrant, and rendered to the Registrant’s investment adviser (not including any sub-adviser whose role is primarily portfolio management and is subcontracted with or overseen by another investment adviser), and any entity controlling, controlled by, or under common control with the adviser that provides ongoing services to the Registrant for the last two fiscal-years-ended October 31st were $132,010 and $91,473 for 2022 and 2021, respectively.
(g) The aggregate non-audit fees and services billed by E&Y for services rendered to the Registrant, and rendered to the Registrant’s investment adviser (not including any sub-adviser whose role is primarily portfolio management and is subcontracted with or overseen by another investment adviser), and any entity controlling, controlled by, or under common control with the adviser that provides ongoing services to the Registrant for the last two fiscal-years-ended October 31st were $0 and $0 for 2022 and 2021, respectively.
(g) The aggregate non-audit fees and services billed by D&T for services rendered to the Registrant, and rendered to the Registrant’s investment adviser (not including any sub-adviser whose role is primarily portfolio management and is subcontracted with or overseen by another investment adviser), and any entity controlling, controlled by, or under common control with the adviser that provides ongoing services to the Registrant for the last two fiscal-years-ended October 31st were $0 and $0 for 2022 and 2021, respectively.
(g) The aggregate non-audit fees and services billed by KPMG for services rendered to the Registrant, and rendered to the Registrant’s investment adviser (not including any sub-adviser whose role is primarily portfolio management and is subcontracted with or overseen by another investment adviser), and any entity controlling, controlled by, or under common control with the adviser that provides ongoing services to the Registrant for the last two fiscal-years-ended October 31st were $218,015 and $206,957 for 2022 and 2021, respectively.
(h) During the past fiscal year, all non-audit services provided by the Registrant’s principal accountant to either the Registrant’s investment adviser or to any entity controlling, controlled by,
or under common control with the Registrant’s investment adviser that provides ongoing services to the Registrant were pre-approved by the Audit Committee of Registrant’s Board of Trustees. Included in the Audit Committee’s pre-approval of these non-audit service were the review and consideration as to whether the provision of these non-audit services is compatible with maintaining the principal accountant’s independence.
(i) Not applicable. The Registrant has not retained, for the preparation of the audit report on the financial statements included in the Form N-CSR, a registered public accounting firm that has a branch or office that is located in a foreign jurisdiction and that the Public Company Accounting Oversight Board (the “PCAOB”) has determined that the PCAOB is unable to inspect or investigate completely because of a position taken by an authority in the foreign jurisdiction.
(j) Not applicable. The Registrant is not a “foreign issuer,” as defined in 17 CFR 240.3b-4.
| Item 5. | Audit Committee of Listed Registrants. |
Not applicable to open-end management investment companies.
| Item 6. | Schedule of Investments. |
Schedule of Investments is included as part of the Report to Shareholders filed under Item 1 of this form.
| Item 7. | Disclosure of Proxy Voting Policies and Procedures for Closed-End Management Investment Companies. |
Not applicable to open-end management investment companies.
| Item 8. | Portfolio Managers of Closed-End Management Investment Companies. |
Not applicable to open-end management investment companies.
| Item 9. | Purchases of Equity Securities by Closed-End Management Company and Affiliated Purchasers. |
Not applicable to open-end management investment companies.
| Item 10. | Submission of Matters to a Vote of Security Holders. |
There have been no changes to the procedures by which shareholders may recommend nominees to the Registrant’s Board of Trustees during the period covered by this report.
| Item 11. | Controls and Procedures. |
(a) The Registrant’s principal executive and principal financial officers, or persons performing similar functions, have concluded that the Registrant’s disclosure controls and procedures, as defined in Rule 30a-3(c) under the Act (17 CFR § 270.30a-3(c)), as of a date within 90 days of the filing date of the report, are effective based on the evaluation of these controls and procedures required by Rule 30a-3(b) under the Act (17 CFR § 270.30a-3(b)) and Rule 13a-15(b) or Rule 15d-15(b) under the Exchange Act, as amended (17 CFR § 240.13a-15(b) or § 240.15d-15(b)).
(b) There has been no change in the Registrant’s internal control over financial reporting (as defined in Rule 30a-3(d) under the Act (17 CFR § 270.3a-3(d)) that occurred during the period covered by this report that has materially affected, or is reasonably likely to materially affect, the Registrant’s internal control over financial reporting.
| Item 12. | Disclosure of Securities Lending Activities for Closed-End Management Investment Companies. |
Not applicable to open-end management investment companies.
| Items 13. | Exhibits. |
SIGNATURES
Pursuant to the requirements of the Securities Exchange Act of 1934 and the Investment Company Act of 1940, the Registrant has duly caused this report to be signed on its behalf by the undersigned, thereunto duly authorized.
(Registrant) | The Advisors’ Inner Circle Fund III | |||||
By (Signature and Title) | /s/ Michael Beattie | |||||
Michael Beattie, President | ||||||
Date: January 6, 2023 | ||||||
Pursuant to the requirements of the Securities Exchange Act of 1934 and the Investment Company Act of 1940, this report has been signed below by the following persons on behalf of the Registrant and in the capacities and on the dates indicated.
By (Signature and Title) | /s/ Michael Beattie | |||||
Michael Beattie, President | ||||||
Date: January 6, 2023 |
By (Signature and Title) | /s/ Andrew Metzger | |||||
Andrew Metzger, | ||||||
Treasurer, Controller, and CFO | ||||||
Date: January 6, 2023 |