UNITED STATES
SECURITIES AND EXCHANGE COMMISSION
Washington, D.C. 20549
FORM N-CSR
CERTIFIED SHAREHOLDER REPORT OF REGISTERED
MANAGEMENT INVESTMENT COMPANIES
Investment Company Act File Number 811-22920
The Advisors’ Inner Circle Fund III
(Exact name of registrant as specified in charter)
SEI Investments
One Freedom Valley Drive
Oaks, PA 19456
(Address of principal executive offices) (Zip code)
SEI Investments
One Freedom Valley Drive
Oaks, PA 19456
(Name and address of agent for service)
Registrant’s telephone number, including area code: (877) 446-3863
Date of fiscal year end: October 31, 2022
Date of reporting period: October 31, 2022
| Item 1. | Reports to Stockholders. |
A copy of the report transmitted to stockholders pursuant to Rule 30e-1 under the Investment Company Act of 1940, as amended (the “Act”) (17 CFR § 270.30e-1), is attached hereto.
The Advisors’ Inner Circle Fund III

Barrow Hanley Concentrated Emerging Markets ESG Opportunities Fund
Barrow Hanley Credit Opportunities Fund
Barrow Hanley Emerging Markets Value Fund
Barrow Hanley Floating Rate Fund
Barrow Hanley International Value Fund
Barrow Hanley Total Return Bond Fund
Barrow Hanley US Value Opportunities Fund
Annual Report | October 31, 2022 | |
Investment Adviser:
Perpetual US Services LLC, Doing Business As PGIA
Sub-Adviser:
Barrow, Hanley, Mewhinney & Strauss, LLC
| ||
| The Advisors’ Inner Circle Fund III | Barrow Hanley | |
| October 31, 2022 | ||
| 1 | ||||
| 13 | ||||
| 38 | ||||
| 40 | ||||
| 42 | ||||
| 46 | ||||
| 47 | ||||
| 60 | ||||
| 62 | ||||
Trustees and Officers of the Advisors’ Inner Circle Fund III | 64 | |||
| 67 |
The Funds file their complete schedules of investments with the Securities and Exchange Commission (“SEC”) for the first and third quarters of each fiscal year as an exhibit to its reports on Form N-PORT. The Funds’ Form N-PORT reports are available on the SEC’s website at https://www.sec.gov, and may be reviewed and copied at the SEC’s Public Reference Room in Washington, DC. Information on the operation of the Public Reference Room may be obtained by calling 1-800-SEC-0330.
A description of the policies and procedures that the Funds use to determine how to vote proxies relating to fund securities, as well as information relating to how the Fund voted proxies relating to fund securities during the most recent 12-month period ended June 30, is available (i) without charge, upon request, by calling 1-866-778-6397; and (ii) on the SEC’s website at https://www.sec.gov.
| The Advisors’ Inner Circle Fund III | Barrow Hanley | |
| Concentrated Emerging Markets ESG Opportunities Fund | ||
| October 31, 2022 (Unaudited) | ||
Management’s Discussion and Analysis of Fund Performance
Since inception (April 12, 2022) and through the period ended October 31, 2022, the Barrow Hanley Concentrated Emerging Markets ESG Opportunities Fund returned -20.30% versus a return of -20.74% for the Fund’s benchmark, the MSCI Emerging Markets Value Index.
Effective stock selection in the Real Estate, Financials and Consumer Discretionary sectors combined with an overweight to the Consumer Staples sector were the primary contributors to relative returns. Challenging selection in the Materials and Industrials sectors detracted from performance over the period.
Top contributors:
Shandong Weigao Group Medical Polymer Co. Ltd. Class H is one of the leading domestic medical device and consumable firms in China. The stock outperformed on strong Q2 results when it delivered double digit sales and profit growth. In addition, as per our original investment thesis, regulatory pressure in the Health Care sector is peaking and the latest round of centralized purchase tenders resulted in price cuts that are in line to slightly better than what the market was expecting. Weigao will offset most of the price cuts via expanding market share and cost efficiency improvement. Trading at a low teen P/E multiple with a strong net cash balance sheet, we believe Weigao remains an attractive value play in the growing healthcare sector in China.
PT Bank Mandiri (Persero) Tbk performed well over the period following a set of robust results in 2Q. Mandiri has been firing on most cylinders in terms of loans, net interest margins, provisioning recovery, and expense control. A recent key comment from the management team is that it now sees sustainable returns on equity near 20%, a level not consistently achieved in the past. This is due to the bank’s relatively stable strategy, including reliance on the strength of its corporate lending origins while also seeing some growth from consumer segments. Mandiri is also benefitting from a tailwind on the macro-economic front, with the rupiah and local GDP growth relatively better than many countries in the world.
Top detractors:
Gold Fields Limited is a gold miner with operations in Australia, Ghana, Peru, South Africa, and a large development project in Chile called Salares Norte. The stock sold off heavily during the second quarter after the company announced a planned all-stock merger with Yamana Gold. The deal priced Yamana at a significant premium to its share price and would cause significant dilution to existing Gold Fields shareholders. While Barrow Hanley is not in favor of the deal, the share price is already pricing in the planned equity dilution. In addition, Gold Fields requires 75% shareholder approval to execute the transaction, which is highly uncertain given the negative feedback Gold Fields has received on the transaction. We continue to own the stock because post the sell-off in Gold Fields share price on a pro-forma basis, a combined Gold Fields/Yamana company is trading at an attractive valuation, while there is potential for near-term upside if shareholders vote down the proposed transaction.
E-MART Inc. is the largest hypermarket chain in Korea and with an online ecommerce site for fresh food. The stock sold off after posting weak results early in the year with higher-than-expected operating losses from higher SG&A and investments as it continues its investments in online and integrates its operations with eBay Korea. After monitoring this position closely, we sold out of the stock in the third quarter.
1
| The Advisors’ Inner Circle Fund III | Barrow Hanley | |
| Concentrated Emerging Markets ESG Opportunities Fund | ||
| October 31, 2022 (Unaudited) | ||
Comparison of change in the value of a $100,000 investment in the Barrow Hanley Concentrated Emerging Markets ESG Opportunities Fund, I Shares versus the MSCI Emerging Markets Value Index.
AVERAGE ANNUAL TOTAL RETURN FOR THE PERIOD ENDED OCTOBER 31, 2022 | ||
| Cumulative Inception to Date* | ||
Barrow Hanley Concentrated Emerging Markets ESG Opportunities Fund, I Shares | -20.30% | |
MSCI Emerging Markets Value Index | -20.74% |
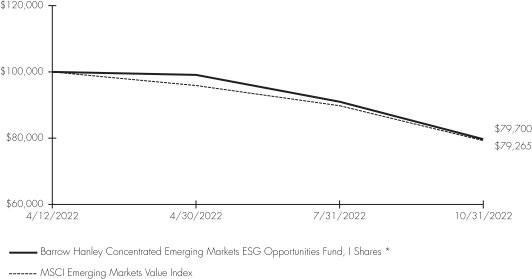
*Commenced operations on April 12, 2022.
The MSCI Emerging Markets Value Index captures large and mid cap securities exhibiting overall value style characteristics across 25 Emerging Markets (EM) countries: Brazil, Chile, China, Colombia, Czech Republic, Egypt, Greece, Hungary, India, Indonesia, Korea, Kuwait, Malaysia, Mexico, Peru, Philippines, Poland, Qatar, Russia, Saudi Arabia, South Africa, Taiwan, Thailand, Turkey and United Arab Emirates.
The performance data quoted herein represents past performance and the return and value of an investment in the Fund will fluctuate so that, when redeemed, it may be worth less than its original cost. Past performance is no guarantee of future performance and should not be considered as a representation of the future results of the Fund. The Fund’s performance assumes the reinvestment of dividends and capital gains. Index returns assume reinvestment of dividends and, unlike a fund’s returns, do not reflect any fees or expenses. If such fees and expenses were included in the index returns, the performance would have been lower.
Please note that one cannot invest directly in an unmanaged index.
There are no assurances that the Fund will meet its stated objectives. The Fund’s holdings and allocations are subject to change because it is actively managed and should not be considered recommendations to buy individual securities.
Returns shown do not reflect the deduction of taxes that a shareholder would pay on Fund distributions or the redemption of Fund shares.
See definition of the comparative index above.
2
| The Advisors’ Inner Circle Fund III | Barrow Hanley | |
| Credit Opportunities Fund | ||
| October 31, 2022 (Unaudited) |
Management’s Discussion and Analysis of Fund Performance
Since inception (April 12, 2022) and through the period ended October 31, 2022, the Barrow Hanley Credit Opportunities Fund returned -6.63% versus a return of -5.28% for the Fund’s benchmark, the ICE BofA US High Yield BB – B Index.
The Fund’s allocation to Bank Loans, which generated better relative performance than high yield corporate bonds during the period, was additive to performance. Also benefiting performance were the Fund’s Energy holdings which generated returns ahead of the subsector in the Index. The Fund’s holdings in Basic Industry and Consumer Non-Cyclicals lagged their peers in the Index which detracted from relative performance. In addition, security selection in Finance Companies hurt performance during the period.
Comparison of change in the value of a $100,000 investment in the Barrow Hanley Credit Opportunities Fund, I Shares versus the ICE BofA US High Yield BB-B Index.
AVERAGE ANNUAL TOTAL RETURN FOR THE PERIOD ENDED OCTOBER 31, 2022 | ||
| Cumulative Inception to Date* | ||
Barrow Hanley Credit Opportunities Fund, I Shares | -6.63% | |
ICE BofA US High Yield BB-B Index | -5.28% |
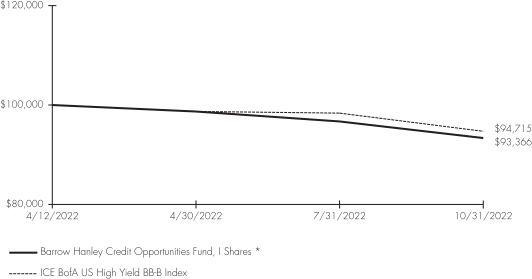
*Commenced operations on April 12, 2022.
The ICE BofA U.S. High Yield BB-B Index tracks the performance of U.S. dollar denominated, below investment-grade rated corporate debt publicly issued in the U.S. domestic market.
The performance data quoted herein represents past performance and the return and value of an investment in the Fund will fluctuate so that, when redeemed, it may be worth less than its original cost. Past performance is no guarantee of future performance and should not be considered as a representation of the future results of the Fund. The Fund’s performance assumes the reinvestment of dividends and capital gains. Index returns assume reinvestment of dividends and, unlike a fund’s returns, do not reflect any fees or expenses. If such fees and expenses were included in the index returns, the performance would have been lower.
Please note that one cannot invest directly in an unmanaged index.
There are no assurances that the Fund will meet its stated objectives. The Fund’s holdings and allocations are subject to change because it is actively managed and should not be considered recommendations to buy individual securities.
Returns shown do not reflect the deduction of taxes that a shareholder would pay on Fund distributions or the redemption of Fund shares.
See definition of the comparative index above.
3
| The Advisors’ Inner Circle Fund III | Barrow Hanley | |
| Emerging Markets Value Fund | ||
| October 31, 2022 (Unaudited) |
Management’s Discussion and Analysis of Fund Performance
Since inception (December 29, 2021) and through the period ended October 31, 2022, the Barrow Hanley Emerging Markets Value Fund, I Shares returned -15.30% versus a return of -23.98% for the Fund’s benchmark, the MSCI Emerging Markets Value Index.
The Fund outperformed over the period with stock selection and country and sector allocations all contributing positively. Effective stock selection in the Consumer Discretionary, Communication Services and Energy sectors combined with an underweight to the Information Technology sector were the primary contributors to relative returns. Challenging selection in the Materials and Industrials sectors detracted from performance over the period. The strategy benefitted from its underweight to China and Taiwan tech and e-commerce companies which we have seen as richly valued for an extended period but where we continue to monitor for potential opportunities.
Top contributors:
PTT Exploration & Production Plc, the upstream arm of the Thai National Oil Company, PTT Group delivered strong results over the period benefiting from higher oil prices, particularly in the early part of the year.
Emaar Properties (P.J.S.C) is the largest developer in Dubai and owns mall and hotel operations in the areas. The stock has been over the strongest performers in the portfolio. We see Emaar as a beneficiary of the ongoing strong recovery in the local residential real estate market. Meanwhile, the strong growth in the retail and tourism sectors also supported its operations improvement at malls and in the hospitality business.
Top detractors:
Russia-based ALROSA PJSC is the largest diamond miner by volume and second largest by value globally. We started reducing our holdings in ALROSA as tensions between Russia and Ukraine increased in January and early February given our concern about a possible Russian invasion of Ukraine, but we did not want to make a blanket top-down call to completely sell out of Russia. We reduced our position by more than half prior to Russia’s invasion of Ukraine and attempted to sell the entirety of our remaining position once the invasion commenced. We were able to partially sell our remaining holdings before Russia closed the Russian stock market and restricted access to foreigners. Given our inability to further transact in Russia and seeing no resolution in sight to sell our remaining holding, we wrote the value of ALROSA to zero in our portfolio.
Similar to ALROSA, we wrote down our holding to zero in our holding of Public Joint Stock Company Moscow Exchange MICEX-RTS due to the imposition of capital controls in Russia, international sanctions affecting a variety of entities and companies within Russia, the uncertain nature of the Russian capital markets and financial system (including the stock exchange), and the general inability for cash generating companies in Russia to distribute dividends to shareholders, especially foreign investors.
4
| The Advisors’ Inner Circle Fund III | Barrow Hanley | |
| Emerging Markets Value Fund | ||
| October 31, 2022 (Unaudited) |
Comparison of change in the value of a $100,000 investment in the Barrow Hanley Emerging Markets Value Fund, I Shares versus the MSCI Emerging Markets Value Index.
AVERAGE ANNUAL TOTAL RETURN FOR THE PERIOD ENDED OCTOBER 31, 2022 | ||
| Cumulative Inception to Date* | ||
Barrow Hanley Emerging Markets Value Fund, I Shares | -15.30% | |
Barrow Hanley Emerging Markets Value Fund, Y Shares† | -15.40% | |
MSCI Emerging Markets Value Index | -23.98% |
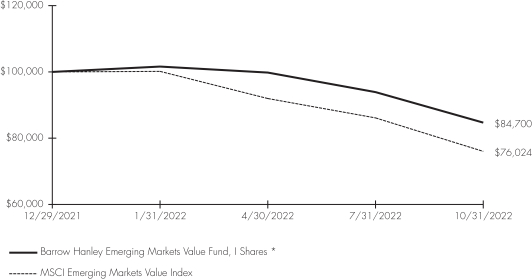
*Commenced operations on December 29, 2021.
† The graph is based on I Shares only. Returns for Y Shares are substantially similar to those of the I Shares and differ only to the extent that Y Shares have higher total annual fund operating expenses than I Shares.
The MSCI Emerging Markets Value Index captures large and mid cap securities exhibiting overall value style characteristics across 25 Emerging Markets (EM) countries: Brazil, Chile, China, Colombia, Czech Republic, Egypt, Greece, Hungary, India, Indonesia, Korea, Kuwait, Malaysia, Mexico, Peru, Philippines, Poland, Qatar, Russia, Saudi Arabia, South Africa, Taiwan, Thailand, Turkey and United Arab Emirates.
The performance data quoted herein represents past performance and the return and value of an investment in the Fund will fluctuate so that, when redeemed, it may be worth less than its original cost. Past performance is no guarantee of future performance and should not be considered as a representation of the future results of the Fund. The Fund’s performance assumes the reinvestment of dividends and capital gains. Index returns assume reinvestment of dividends and, unlike a fund’s returns, do not reflect any fees or expenses. If such fees and expenses were included in the index returns, the performance would have been lower.
Please note that one cannot invest directly in an unmanaged index.
There are no assurances that the Fund will meet its stated objectives. The Fund’s holdings and allocations are subject to change because it is actively managed and should not be considered recommendations to buy individual securities.
Returns shown do not reflect the deduction of taxes that a shareholder would pay on Fund distributions or the redemption of Fund shares.
See definition of the comparative index above.
5
| The Advisors’ Inner Circle Fund III | Barrow Hanley | |
| Floating Rate Fund | ||
| October 31, 2022 (Unaudited) |
Management’s Discussion and Analysis of Fund Performance
Since inception (April 12, 2022) and through the period ended October 31, 2022, the Barrow Hanley Floating Rate Fund returned -2.81% versus a return of -2.85% for the Fund’s benchmark, the Credit Suisse Leveraged Loan Index.
During the period, the Fund’s holdings in Information Technology and Manufacturing benefited performance as they outperformed the subsectors in the Index. In addition, an underweight to Consumer Durables added to relative performance as the subsector was the worst performing in the Index. An underweight in Food/Tobacco and Media/Telcom detracted from performance as these two subsectors generated returns ahead of the Credit Suisse Leveraged Loan Index. The Fund’s holdings in Consumer Non-Durables lagged their peers in the Index which also detracted from performance.
Comparison of change in the value of a $100,000 investment in the Barrow Hanley Floating Rate Fund, I Shares versus the Credit Suisse Leveraged Loan Index.
| AVERAGE ANNUAL TOTAL RETURN FOR THE PERIOD ENDED OCTOBER 31, 2022 | ||
| Cumulative Inception to Date* | ||
Barrow Hanley Floating Rate Fund, I Shares | -2.81% | |
Credit Suisse Leveraged Loan Index | -2.85% |
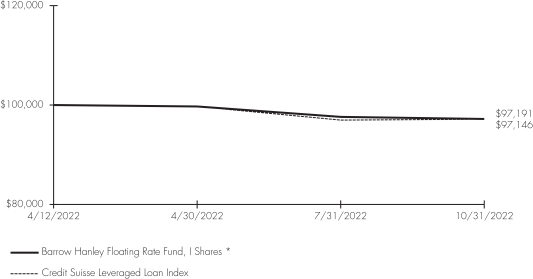
*Commenced operations on April 12, 2022.
The Credit Suisse Leveraged Loan Index tracks the investable market of the U.S. dollar denominated leverage loan market. All loans are funded term loans with a tenor of at least one year and are made by issuers domiciled in developed countries.
The performance data quoted herein represents past performance and the return and value of an investment in the Fund will fluctuate so that, when redeemed, it may be worth less than its original cost. Past performance is no guarantee of future performance and should not be considered as a representation of the future results of the Fund. The Fund’s performance assumes the reinvestment of dividends and capital gains. Index returns assume reinvestment of dividends and, unlike a fund’s returns, do not reflect any fees or expenses. If such fees and expenses were included in the index returns, the performance would have been lower.
Please note that one cannot invest directly in an unmanaged index.
There are no assurances that the Fund will meet its stated objectives. The Fund’s holdings and allocations are subject to change because it is actively managed and should not be considered recommendations to buy individual securities.
Returns shown do not reflect the deduction of taxes that a shareholder would pay on Fund distributions or the redemption of Fund shares.
See definition of the comparative index above.
6
| The Advisors’ Inner Circle Fund III | Barrow Hanley | |
| International Value Fund | ||
| October 31, 2022 (Unaudited) |
Management’s Discussion and Analysis of Fund Performance
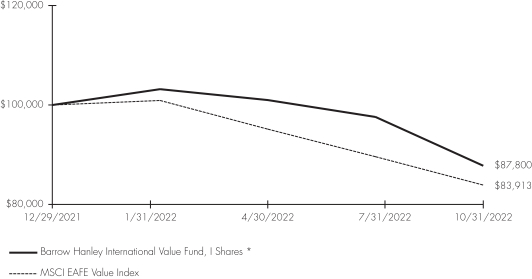
Since inception (December 29, 2021) and through the period ended October 31, 2022, the Barrow Hanley International Value Fund, I Shares returned -12.20% versus a return of -16.09% for the Fund’s benchmark, the MSCI EAFE Value Index.
The Fund outperformed over the period driven primarily by positive stock selection. Effective stock selection in the Industrials, Financials and Consumer Discretionary sectors were the primary contributors to relative returns. Challenging selection in the Health Care and Energy sectors detracted from performance over the period.
Top contributors:
Rheinmetall AG is one of the leading defense contractors in Europe with market leading positions in land vehicles, large to medium caliber weapons, and ammunition and electronic solutions. Rheinmetall is a key supplier to the German army as well as a range of NATO and non-NATO partner countries around the world. The company also operates a smaller tier one auto supply business. Rheinmetall is well positioned to benefit from a material step-up in defense spending following the invasion of Ukraine. This transformation of the growth outlook drove very significant outperformance in the first half of the year with the stock nearly doubling. The stock then underperformed in the third quarter as it gave back some gains and momentum cooled, with some large orders expected for 2022 deferred to 2023. The strong growth outlook remains intact, however, and we believe the valuation remains attractive.
Grupo Financiero Banorte SAB de CV Class O outperformed throughout the year after a weak share price in 1Q and the release of 2Q results which demonstrated strength in margins from higher interest rates, better asset quality, and tighter cost control.
Top detractors:
KION GROUP AG is a global leader in integrated warehouse automation and is one of the few listed players with significant exposure to this attractive space. We have owned the stock in the past and sold down our position at the end of last year after significant outperformance. The stock has sold off heavily since and, with the valuation compressing to reflect a very negative economic outlook, and the company issued an unexpected profit warning in the third quarter. KION has been negatively impacted by production inefficiencies that have pushed up costs as the company struggles to deliver on the large order book with constrained supply chains and labor. We recently sold out of the position as we do not expect the headwinds to higher costs to abate in the near term and believed the risk/reward profile of the stock was no longer attractive.
Persimmon Plc, one of the UK’s leading housebuilders, saw weak performance after reporting declining earnings over the last year. This and the weakening economic outlook have led to less favorable sentiment and a sell-off in the stock over the course of 2022.
As markets have turned to favor value investing, we are pleased with our longer-term performance in not only outpacing the MSCI EAFE Value Index by also the broader MSCI EAFE Index. We recognize that this is what our clients expect of us in these times. Although we have seen very strong performance, we believe the changes we have made during the period of solid performance have enhanced the portfolio’s current positioning to provide positive relative returns despite the challenging macro-economic environment.
7
| The Advisors’ Inner Circle Fund III | Barrow Hanley | |
| International Value Fund | ||
| October 31, 2022 (Unaudited) |
Comparison of change in the value of a $100,000 investment in the Barrow Hanley International Value Fund, I Shares versus the MSCI EAFE Value Index.
AVERAGE ANNUAL TOTAL RETURN FOR THE PERIOD ENDED OCTOBER 31, 2022 | ||
| Cumulative Inception to Date* | ||
Barrow Hanley International Value Fund, I Shares | -12.20% | |
Barrow Hanley International Value Fund, Y Shares† | -12.30% | |
MSCI EAFE Value Index | -16.09% |
*Commenced operations on December 29, 2021.
† The graph is based on I Shares only. Returns for Y Shares are substantially similar to those of the I Shares and differ only to the extent that Y Shares have higher total annual fund operating expenses than I Shares.
The MSCI EAFE (EAFE - Europe, Australasia, and the Far East) Value Index captures large and mid-cap securities exhibiting overall value style characteristics across Developed Markets countries around the world, excluding the US and Canada. Developed Markets countries include: Australia, Austria, Belgium, Denmark, Finland, France, Germany, Hong Kong, Ireland, Israel, Italy, Japan, the Netherlands, New Zealand, Norway, Portugal, Singapore, Spain, Sweden, Switzerland and the UK.
The performance data quoted herein represents past performance and the return and value of an investment in the Fund will fluctuate so that, when redeemed, it may be worth less than its original cost. Past performance is no guarantee of future performance and should not be considered as a representation of the future results of the Fund. The Fund’s performance assumes the reinvestment of dividends and capital gains. Index returns assume reinvestment of dividends and, unlike a fund’s returns, do not reflect any fees or expenses. If such fees and expenses were included in the index returns, the performance would have been lower.
Please note that one cannot invest directly in an unmanaged index.
There are no assurances that the Fund will meet its stated objectives. The Fund’s holdings and allocations are subject to change because it is actively managed and should not be considered recommendations to buy individual securities.
Returns shown do not reflect the deduction of taxes that a shareholder would pay on Fund distributions or the redemption of Fund shares.
See definition of the comparative index above.
8
| The Advisors’ Inner Circle Fund III | Barrow Hanley | |
| Total Return Bond Fund | ||
| October 31, 2022 (Unaudited) |
Management’s Discussion and Analysis of Fund Performance
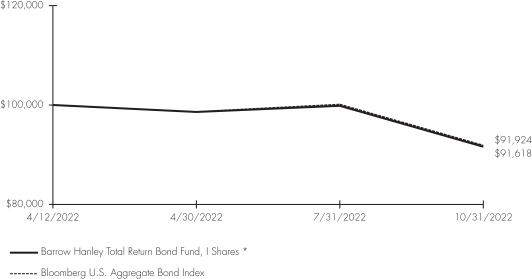
Since inception (April 12, 2022) and through the period ended October 31, 2022, the Barrow Hanley Total Return Bond Fund returned -8.38% versus a return of -8.08% for the Fund’s benchmark, the Bloomberg U.S. Aggregate Bond Index.
During the period, an overweight allocation to Asset Backed Securities benefited performance as their shorter duration characteristics helped in a rising rate environment. The Fund’s holdings in Utilities were additive as they generated returns ahead of the sector in the Index. Additionally, security selection in Energy and Consumer Cyclicals helped performance as the holdings posted returns ahead of the subsectors in the Index. The Fund’s holdings in US Treasuries detracted from performance due to their longer duration stance. An underweight to Non-Corporate Credit also hurt relative performance as the sector posted returns ahead of the Index. Lastly, security selection in Banks detracted from performance as they failed to keep pace with the subsector in the Index.
Comparison of change in the value of a $100,000 investment in the Barrow Hanley Total Return Bond Fund, I Shares versus the Bloomberg U.S. Aggregate Bond Index.
AVERAGE ANNUAL TOTAL RETURN FOR THE PERIOD ENDED OCTOBER 31, 2022 | ||
| Cumulative Inception to Date* | ||
Barrow Hanley Total Return Bond Fund, I Shares | -8.38% | |
Bloomberg U.S. Aggregate Bond Index | -8.08% |
*Commenced operations on April 12, 2022.
The Bloomberg US Aggregate Bond Index is a broad-based flagship benchmark that measures the investment grade, US dollar-denominated, fixed-rate taxable bond market. The index includes Treasuries, government-related and corporate securities, MBS (agency fixed-rate and hybrid ARM pass-through), ABS and CMBS (agency and non-agency). Provided the necessary inclusion rules are met, US Aggregate eligible securities also contribute to the multi-currency Global Aggregate Index and the US Universal Index, which includes high yield and emerging markets debt. The US Aggregate Bond Index was created in 1986.
The performance data quoted herein represents past performance and the return and value of an investment in the Fund will fluctuate so that, when redeemed, it may be worth less than its original cost. Past performance is no guarantee of future performance and should not be considered as a representation of the future results of the Fund. The Fund’s performance assumes the reinvestment of dividends and capital gains. Index returns assume reinvestment of dividends and, unlike a fund’s returns, do not reflect any fees or expenses. If such fees and expenses were included in the index returns, the performance would have been lower.
9
| The Advisors’ Inner Circle Fund III | Barrow Hanley | |
| Total Return Bond Fund | ||
| October 31, 2022 (Unaudited) |
Please note that one cannot invest directly in an unmanaged index.
There are no assurances that the Fund will meet its stated objectives. The Fund’s holdings and allocations are subject to change because it is actively managed and should not be considered recommendations to buy individual securities.
Returns shown do not reflect the deduction of taxes that a shareholder would pay on Fund distributions or the redemption of Fund shares.
See definition of the comparative index on previous page.
10
| The Advisors’ Inner Circle Fund III | Barrow Hanley | |
| US Value Opportunities Fund | ||
| October 31, 2022 (Unaudited) |
Management’s Discussion and Analysis of Fund Performance
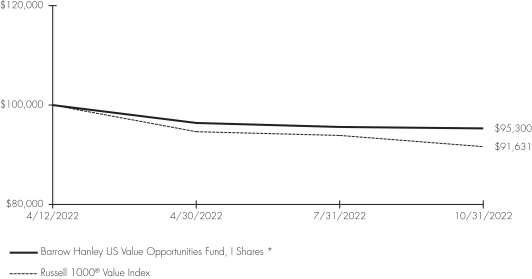
Since inception (April 12, 2022) and through the period ended October 31, 2022, the Barrow Hanley US Value Opportunities Fund returned -4.70% versus a return of -8.37% for the Fund’s benchmark, the Russell 1000® Value Index.
The Fund outperformed over the period driven primarily by positive stock selection. Effective stock selection in the Communication Services, Real Estate and Materials sectors were the primary contributors to relative returns. Modestly less favorable selection in the Utilities sector combined with an underweight to the Energy sector detracted from performance over the period.
Top contributors:
Hess Corporation, a global independent oil and gas producer, boosted relative performance as its operations in Guyana continued to deliver. Recent discoveries have increased the resource base and production proceeds are starting to contribute to overall cash flow. Management reactivated its share repurchase in order to return this excess cash to shareholders, in addition to dividends. The valuation remains attractive ahead of the continued ramp-up in Guyana asset growth potential as well as its other production areas, including the Bakken and Gulf of Mexico.
Vertiv Holdings Co. Class A, a leader in electrical and cooling products for data centers, contributed positively to relative performance. Recent margin pressure began to abate in the quarter, with pricing beginning to flow through and more expected given the increases already embedded in the record backlog. Along with supply chain challenges easing, management pointed to the robust demand driving the decision to accelerate investments in capacity as new suppliers are being qualified to diversify their future partners and the industry backdrop remains healthy. The valuation is still depressed relative to the potential outlook, creating opportunities as these improvements materialize.
Top detractors:
Stanley Black & Decker, Inc, a global leader in power tools, hand tools, and other industrial accessories, detracted from relative performance as concerns increased regarding residential housing slowing, rising inventory levels at retailers, and potential competitive pressures. During the quarter, the company announced the retirement of long-time CEO Jim Loree and appointed veteran CFO Don Allan as his successor. While rising mortgage rates may affect housing turnover, spending on home improvement has generally held up well in such periods. Margins have been impacted, similar to other firms, and management continues to point to improvements later this year as the company embarks on an aggressive cost-cutting program. With a heavily discounted valuation of just 12x earnings together with a 4.0% dividend yield, shares remain attractive, trading at a significant discount to peers, the market, and its own history.
Howard Hughes Corporation, which owns and develops premiere commercial real estate assets in addition to owning a large land position, detracted from relative performance as housing concerns outweighed the positive actions being taken by the management team. Concerns over rising mortgage rates and slowing economic growth pressured shares given management’s goal of harvesting cash from residential sales to reinvest in recurring commercial assets. Management also continues to buy back shares given their view of a discounted valuation, supported by their balance sheet and cash generation. We believe shares remain attractive trading at a significant discount to historical valuation and net asset value.
11
| The Advisors’ Inner Circle Fund III | Barrow Hanley | |
| US Value Opportunities Fund | ||
| October 31, 2022 (Unaudited) |
Comparison of change in the value of a $100,000 investment in the Barrow Hanley US Value Opportunities Fund, I Shares versus the Russell 1000® Value Index.
AVERAGE ANNUAL TOTAL RETURN FOR THE PERIOD ENDED OCTOBER 31, 2022 | ||
| Cumulative Inception to Date* | ||
Barrow Hanley US Value Opportunities Fund, I Shares | -4.70% | |
Russell 1000® Value Index | -8.37% |
*Commenced operations on April 12, 2022.
The Russell 1000® Value Index measures the performance of the large-cap value segment of the US equity universe. It includes those Russell 1000® companies with lower price-to-book ratios and lower expected growth values.
The performance data quoted herein represents past performance and the return and value of an investment in the Fund will fluctuate so that, when redeemed, it may be worth less than its original cost. Past performance is no guarantee of future performance and should not be considered as a representation of the future results of the Fund. The Fund’s performance assumes the reinvestment of dividends and capital gains. Index returns assume reinvestment of dividends and, unlike a fund’s returns, do not reflect any fees or expenses. If such fees and expenses were included in the index returns, the performance would have been lower.
Please note that one cannot invest directly in an unmanaged index.
There are no assurances that the Fund will meet its stated objectives. The Fund’s holdings and allocations are subject to change because it is actively managed and should not be considered recommendations to buy individual securities.
Returns shown do not reflect the deduction of taxes that a shareholder would pay on Fund distributions or the redemption of Fund shares.
See definition of the comparative index above.
12
| The Advisors’ Inner Circle Fund III | Barrow Hanley | |
| Concentrated Emerging Markets ESG Opportunities Fund | ||
| October 31, 2022 |
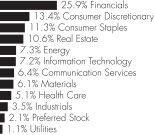
SECTOR WEIGHTINGS † (UNAUDITED)
|
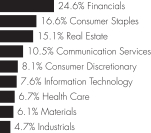
† Percentages are based on total investments.
SCHEDULE OF INVESTMENTS |
| |||||||
| COMMON STOCK — 99.4%
| ||||||||
| Shares | Value | |||||||
BRAZIL — 6.4% |
| |||||||
Dexco | 83,304 | $ | 155,948 | |||||
TIM | 68,303 | 174,807 | ||||||
|
| |||||||
| 330,755 | ||||||||
|
| |||||||
CHINA — 22.3% |
| |||||||
Baidu, Cl A * | 9,470 | 90,602 | ||||||
BOC Hong Kong Holdings | 52,582 | 163,447 | ||||||
China International Capital, Cl H | 119,863 | 166,747 | ||||||
Haier Smart Home, Cl H | 68,102 | 170,393 | ||||||
Nexteer Automotive Group | 201,477 | 109,085 | ||||||
Ping An Insurance Group of China, Cl H | 24,684 | 98,740 | ||||||
Shandong Weigao Group Medical Polymer, Cl H | 147,890 | 203,852 | ||||||
Tingyi Cayman Islands Holding | 94,705 | 148,157 | ||||||
|
| |||||||
| 1,151,023 | ||||||||
|
| |||||||
HONG KONG — 13.0% |
| |||||||
ASMPT | 20,451 | 112,551 | ||||||
Hang Lung Properties | 93,263 | 117,267 | ||||||
Hongkong Land Holdings | 43,493 | 167,448 | ||||||
Sino Biopharmaceutical | 286,104 | 138,867 | ||||||
WH Group | 271,503 | 137,314 | ||||||
|
| |||||||
| 673,447 | ||||||||
|
| |||||||
INDIA — 2.6% |
| |||||||
IndusInd Bank | 9,702 | 133,925 | ||||||
|
| |||||||
INDONESIA — 3.0% |
| |||||||
Bank Mandiri Persero | 225,618 | 152,606 | ||||||
|
| |||||||
MEXICO — 11.5% |
| |||||||
Fibra Uno Administracion ‡ | 167,210 | 195,204 | ||||||
Gruma, Cl B | 15,212 | 175,553 | ||||||
Kimberly-Clark de Mexico, Cl A | 142,954 | 225,257 | ||||||
|
| |||||||
| 596,014 | ||||||||
|
| |||||||
| COMMON STOCK — (continued)
| ||||||||
| Shares | Value | |||||||
PHILIPPINES — 6.4% |
| |||||||
Ayala Land | 435,238 | $ | 193,154 | |||||
BDO Unibank | 61,734 | 136,456 | ||||||
|
| |||||||
| 329,610 | ||||||||
|
| |||||||
SINGAPORE — 2.3% |
| |||||||
Singapore Telecommunications | 66,692 | 117,780 | ||||||
|
| |||||||
SOUTH AFRICA — 8.0% |
| |||||||
Gold Fields | 19,249 | 155,606 | ||||||
Growthpoint Properties ‡ | 143,111 | 100,893 | ||||||
Vodacom Group | 23,000 | 156,904 | ||||||
|
| |||||||
| 413,403 | ||||||||
|
| |||||||
SOUTH KOREA — 10.7% |
| |||||||
Hankook Tire & Technology | 5,299 | 135,967 | ||||||
Korea Investment Holdings | 4,944 | 171,979 | ||||||
Shinhan Financial Group | 4,587 | 116,893 | ||||||
SK Hynix | 2,241 | 130,107 | ||||||
|
| |||||||
| 554,946 | ||||||||
|
| |||||||
TAIWAN — 9.9% |
| |||||||
Bizlink Holding | 13,088 | 100,122 | ||||||
Cathay Financial Holding | 105,480 | 123,738 | ||||||
Hiwin Technologies | 27,247 | 140,368 | ||||||
Pegatron | 80,286 | 147,005 | ||||||
|
| |||||||
| 511,233 | ||||||||
|
| |||||||
VIETNAM — 3.3% |
| |||||||
Vietnam Dairy Products JSC | 53,494 | 168,985 | ||||||
|
| |||||||
TOTAL COMMON STOCK |
| |||||||
(Cost $6,000,482) | 5,133,727 | |||||||
|
| |||||||
TOTAL INVESTMENTS— 99.4% |
| |||||||
(Cost $6,000,482) | $ | 5,133,727 | ||||||
|
| |||||||
Percentages are based on Net Assets of $5,163,444.
* Non-income producing security.
‡ Real Estate Investment Trust.
Cl — Class
JSC — Joint Stock Company
The accompanying notes are an integral part of the financial statements.
13
| The Advisors’ Inner Circle Fund III | Barrow Hanley | |
| Concentrated Emerging Markets ESG Opportunities Fund | ||
| October 31, 2022 |
The following is a summary of the inputs used as of October 31, 2022 in valuing the Fund’s investments carried at value:
| Investments in Securities | Level 1 | Level 2 | Level 3 | Total | ||||||||||||
Common Stock | ||||||||||||||||
Brazil | $ | 330,755 | $ | – | $ | – | $ | 330,755 | ||||||||
China | 1,151,023 | – | – | 1,151,023 | ||||||||||||
Hong Kong | 673,447 | – | – | 673,447 | ||||||||||||
India | 133,925 | – | – | 133,925 | ||||||||||||
Indonesia | 152,606 | – | – | 152,606 | ||||||||||||
Mexico | 596,014 | – | – | 596,014 | ||||||||||||
Philippines | – | 329,610 | – | 329,610 | ||||||||||||
Singapore | 117,780 | – | – | 117,780 | ||||||||||||
South Africa | 413,403 | – | – | 413,403 | ||||||||||||
South Korea | 554,946 | – | – | 554,946 | ||||||||||||
Taiwan | 511,233 | – | – | 511,233 | ||||||||||||
Vietnam | 168,985 | – | – | 168,985 | ||||||||||||
|
|
|
|
|
|
|
|
|
|
| ||||||
Total Common Stock | 4,804,117 | 329,610 | – | 5,133,727 | ||||||||||||
|
|
|
|
|
|
|
|
|
|
| ||||||
Total Investments in Securities | $ | 4,804,117 | $ | 329,610 | $ | – | $ | 5,133,727 | ||||||||
|
|
|
|
|
|
|
|
|
|
| ||||||
Amounts designated as “—” are $0.
For more information on valuation inputs, see Note 2 — Significant Accounting Policies in the Notes to Financial Statements.
The accompanying notes are an integral part of the financial statements.
14
| The Advisors’ Inner Circle Fund III | Barrow Hanley | |
| Credit Opportunities Fund | ||
| October 31, 2022 |
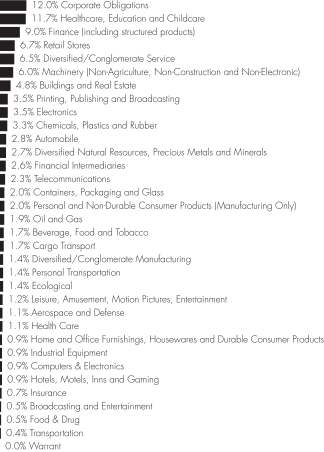
SECTOR WEIGHTINGS † (UNAUDITED)
|

† Percentages are based on total investments.
SCHEDULE OF INVESTMENTS |
| |||||||
| CORPORATE OBLIGATIONS — 69.2%
| ||||||||
| Face Amount | Value | |||||||
COMMUNICATION SERVICES — 5.6% |
| |||||||
CCO Holdings | ||||||||
4.750%, 03/01/2030 (A) | $ | 1,500,000 | $ | 1,260,600 | ||||
CSC Holdings | ||||||||
4.625%, 12/01/2030 (A) | 1,000,000 | 719,773 | ||||||
4.125%, 12/01/2030 (A) | 750,000 | 590,077 | ||||||
LCPR Senior Secured Financing DAC | ||||||||
5.125%, 07/15/2029 (A) | 1,000,000 | 842,500 | ||||||
Virgin Media Secured Finance | ||||||||
5.500%, 05/15/2029 (A) | 1,250,000 | 1,135,900 | ||||||
VTR Comunicaciones | ||||||||
4.375%, 04/15/2029 (A) | 1,000,000 | 560,000 | ||||||
VZ Secured Financing BV | ||||||||
5.000%, 01/15/2032 (A) | 500,000 | 398,545 | ||||||
|
|
| ||||||
| 5,507,395 | ||||||||
|
|
| ||||||
CONSUMER DISCRETIONARY — 6.0% |
| |||||||
Allied Universal Holdco | ||||||||
4.625%, 06/01/2028 (A) | 750,000 | 625,042 | ||||||
Gap | ||||||||
3.875%, 10/01/2031 (A) | 500,000 | 345,000 | ||||||
Goodyear Tire & Rubber | ||||||||
5.625%, 04/30/2033 | 1,000,000 | 837,085 | ||||||
Ken Garff Automotive | ||||||||
4.875%, 09/15/2028 (A) | 600,000 | 498,133 | ||||||
Lithia Motors | ||||||||
3.875%, 06/01/2029 (A) | 250,000 | 201,425 | ||||||
PetSmart | ||||||||
7.750%, 02/15/2029 (A) | 500,000 | 469,480 | ||||||
4.750%, 02/15/2028 (A) | 250,000 | 228,222 | ||||||
Rent-A-Center | ||||||||
6.375%, 02/15/2029 (A) | 1,500,000 | 1,168,545 | ||||||
Sonic Automotive | ||||||||
4.875%, 11/15/2031 (A) | 1,000,000 | 754,422 | ||||||
Sotheby’s | ||||||||
5.875%, 06/01/2029 (A) | 500,000 | 417,883 | ||||||
Wynn Macau | ||||||||
5.125%, 12/15/2029 (A) | 500,000 | 302,500 | ||||||
|
|
| ||||||
| 5,847,737 | ||||||||
|
|
| ||||||
| CORPORATE OBLIGATIONS — (continued)
| ||||||||
| Face Amount | Value | |||||||
CONSUMER STAPLES — 3.5% |
| |||||||
Ashton Woods USA | ||||||||
6.625%, 01/15/2028 (A) | $ | 250,000 | $ | 212,266 | ||||
Darling Ingredients | ||||||||
6.000%, 06/15/2030 (A) | 1,000,000 | 962,500 | ||||||
Energizer Holdings | ||||||||
6.500%, 12/31/2027 (A) | 50,000 | 45,747 | ||||||
Medline Borrower | ||||||||
5.250%, 10/01/2029 (A) | 500,000 | 389,375 | ||||||
3.875%, 04/01/2029 (A) | 500,000 | 408,500 | ||||||
STL Holding | ||||||||
7.500%, 02/15/2026 (A) | 250,000 | 217,840 | ||||||
United Natural Foods | ||||||||
6.750%, 10/15/2028 (A) | 1,000,000 | 965,870 | ||||||
US Foods | ||||||||
4.625%, 06/01/2030 (A) | 205,000 | 177,842 | ||||||
|
|
| ||||||
| 3,379,940 | ||||||||
|
|
| ||||||
ENERGY — 6.2% |
| |||||||
CQP Holdco | ||||||||
5.500%, 06/15/2031 (A) | 1,073,000 | 952,288 | ||||||
DCP Midstream Operating | ||||||||
5.850%, ICE LIBOR USD 3 Month + 3.850%, 05/21/2043 (A)(B) | 2,000,000 | 1,935,124 | ||||||
Global Partners | ||||||||
7.000%, 08/01/2027 | 1,500,000 | 1,426,023 | ||||||
Kinetik Holdings | ||||||||
5.875%, 06/15/2030 (A) | 1,500,000 | 1,407,260 | ||||||
PBF Holding | ||||||||
6.000%, 02/15/2028 | 315,000 | 286,256 | ||||||
|
|
| ||||||
| 6,006,951 | ||||||||
|
|
| ||||||
FINANCIALS — 8.2% |
| |||||||
Burford Capital Global Finance | ||||||||
6.250%, 04/15/2028 (A) | 1,500,000 | 1,305,686 | ||||||
Freedom Mortgage | ||||||||
8.250%, 04/15/2025 (A) | 532,000 | 454,848 | ||||||
6.625%, 01/15/2027 (A) | 500,000 | 373,200 | ||||||
LFS Topco | ||||||||
5.875%, 10/15/2026 (A) | 340,000 | 265,683 | ||||||
LPL Holdings | ||||||||
4.000%, 03/15/2029 (A) | 1,250,000 | 1,090,988 | ||||||
MSCI | ||||||||
3.250%, 08/15/2033 (A) | 1,250,000 | 966,310 | ||||||
Nationstar Mortgage Holdings | ||||||||
5.750%, 11/15/2031 (A) | 750,000 | 575,340 | ||||||
5.500%, 08/15/2028 (A) | 250,000 | 202,777 | ||||||
PROG Holdings | ||||||||
6.000%, 11/15/2029 (A) | 2,000,000 | 1,632,600 | ||||||
Rithm Capital | ||||||||
6.250%, 10/15/2025 (A) | 1,250,000 | 1,096,963 | ||||||
|
|
| ||||||
| 7,964,395 | ||||||||
|
|
| ||||||
HEALTH CARE — 5.5% |
| |||||||
180 Medical | ||||||||
3.875%, 10/15/2029 (A) | 500,000 | 422,500 | ||||||
The accompanying notes are an integral part of the financial statements.
15
| The Advisors’ Inner Circle Fund III | Barrow Hanley | |
| Credit Opportunities Fund | ||
| October 31, 2022 |
| CORPORATE OBLIGATIONS — (continued)
| ||||||||
| Face Amount | Value | |||||||
AHP Health Partners | ||||||||
5.750%, 07/15/2029 (A) | $ | 1,000,000 | $ | 765,000 | ||||
Bausch Health | ||||||||
6.250%, 02/15/2029 (A) | 100,000 | 39,000 | ||||||
6.125%, 02/01/2027 (A) | 250,000 | 164,110 | ||||||
5.250%, 01/30/2030 (A) | 1,500,000 | 581,250 | ||||||
5.250%, 02/15/2031 (A) | 50,000 | 19,625 | ||||||
5.000%, 02/15/2029 (A) | 125,000 | 48,795 | ||||||
4.875%, 06/01/2028 (A) | 250,000 | 153,125 | ||||||
Emergent BioSolutions | ||||||||
3.875%, 08/15/2028 (A) | 500,000 | 299,770 | ||||||
Garden Spinco | ||||||||
8.625%, 07/20/2030 (A) | 400,000 | 411,422 | ||||||
HCA | ||||||||
3.500%, 07/15/2051 | 1,500,000 | 934,378 | ||||||
HealthEquity | ||||||||
4.500%, 10/01/2029 (A) | 250,000 | 218,438 | ||||||
Jazz Securities DAC | ||||||||
4.375%, 01/15/2029 (A) | 250,000 | 221,875 | ||||||
Organon | ||||||||
4.125%, 04/30/2028 (A) | 250,000 | 220,205 | ||||||
Pediatrix Medical Group | ||||||||
5.375%, 02/15/2030 (A) | 500,000 | 430,000 | ||||||
Tenet Healthcare | ||||||||
4.375%, 01/15/2030 (A) | 500,000 | 419,500 | ||||||
|
|
| ||||||
| 5,348,993 | ||||||||
|
|
| ||||||
INDUSTRIALS — 13.2% |
| |||||||
AerCap Global Aviation Trust | ||||||||
6.500%, ICE LIBOR USD 3 Month + 4.300%, 06/15/2045 (A)(B) | 500,000 | 456,250 | ||||||
American Airlines | ||||||||
5.750%, 04/20/2029 (A) | 500,000 | 455,000 | ||||||
5.500%, 04/20/2026 (A) | 750,000 | 714,241 | ||||||
Ardagh Metal Packaging Finance USA | ||||||||
6.000%, 06/15/2027 (A) | 125,000 | 119,946 | ||||||
BWX Technologies | ||||||||
4.125%, 06/30/2028 (A) | 500,000 | 437,500 | ||||||
Cemex | ||||||||
5.200%, 09/17/2030 (A) | 250,000 | 212,637 | ||||||
Covanta Holding | ||||||||
4.875%, 12/01/2029 (A) | 1,125,000 | 957,881 | ||||||
Dycom Industries | ||||||||
4.500%, 04/15/2029 (A) | 1,300,000 | 1,133,769 | ||||||
First Student Bidco | ||||||||
4.000%, 07/31/2029 (A) | 250,000 | 203,150 | ||||||
GFL Environmental | ||||||||
4.750%, 06/15/2029 (A) | 50,000 | 43,579 | ||||||
4.375%, 08/15/2029 (A) | 250,000 | 211,743 | ||||||
4.000%, 08/01/2028 (A) | 800,000 | 692,320 | ||||||
Harsco | ||||||||
5.750%, 07/31/2027 (A) | 1,757,000 | 1,246,855 | ||||||
ILFC E-Capital Trust I | ||||||||
5.115%, 12/21/2065 (A)(B) | 2,455,000 | 1,497,550 | ||||||
ILFC E-Capital Trust II | ||||||||
5.365%, 12/21/2065 (A)(B) | 1,000,000 | 650,000 | ||||||
| CORPORATE OBLIGATIONS — (continued)
| ||||||||
| Face Amount | Value | |||||||
Interface | ||||||||
5.500%, 12/01/2028 (A) | $ | 1,324,000 | $ | 1,044,717 | ||||
ITT Holdings | ||||||||
6.500%, 08/01/2029 (A) | 1,000,000 | 803,505 | ||||||
Roller Bearing of America | ||||||||
4.375%, 10/15/2029 (A) | 125,000 | 109,685 | ||||||
SPX FLOW | ||||||||
8.750%, 04/01/2030 (A) | 250,000 | 203,125 | ||||||
TransMontaigne Partners | ||||||||
6.125%, 02/15/2026 | 1,000,000 | 854,999 | ||||||
Wabash National | ||||||||
4.500%, 10/15/2028 (A) | 125,000 | 105,080 | ||||||
Waste Pro USA | ||||||||
5.500%, 02/15/2026 (A) | 750,000 | 694,058 | ||||||
|
|
| ||||||
| 12,847,590 | ||||||||
|
|
| ||||||
INFORMATION TECHNOLOGY — 2.1% |
| |||||||
America Movil | ||||||||
5.375%, 04/04/2032 (A) | 500,000 | 423,250 | ||||||
Ciena | ||||||||
4.000%, 01/31/2030 (A) | 200,000 | 169,000 | ||||||
Entegris Escrow | ||||||||
5.950%, 06/15/2030 (A) | 500,000 | 456,250 | ||||||
Total Play Telecomunicaciones | ||||||||
6.375%, 09/20/2028 (A) | 1,500,000 | 1,028,090 | ||||||
|
|
| ||||||
| 2,076,590 | ||||||||
|
|
| ||||||
MATERIALS — 12.8% |
| |||||||
Ardagh Metal Packaging Finance USA | ||||||||
4.000%, 09/01/2029 (A) | 1,000,000 | 758,590 | ||||||
ATI | ||||||||
5.125%, 10/01/2031 | 1,000,000 | 824,410 | ||||||
Axalta Coating Systems | ||||||||
3.375%, 02/15/2029 (A) | 1,000,000 | 821,875 | ||||||
Canpack | ||||||||
3.875%, 11/15/2029 (A) | 250,000 | 198,437 | ||||||
Chemours | ||||||||
4.625%, 11/15/2029 (A) | 2,500,000 | 1,950,000 | ||||||
Diamond BC BV | ||||||||
4.625%, 10/01/2029 (A) | 500,000 | 367,305 | ||||||
Graham Packaging | ||||||||
7.125%, 08/15/2028 (A) | 500,000 | 409,807 | ||||||
Graphic Packaging International | ||||||||
3.750%, 02/01/2030 (A) | 750,000 | 644,820 | ||||||
Kaiser Aluminum | ||||||||
4.500%, 06/01/2031 (A) | 500,000 | 392,250 | ||||||
LABL | ||||||||
8.250%, 11/01/2029 (A) | 750,000 | 597,383 | ||||||
5.875%, 11/01/2028 (A) | 250,000 | 217,165 | ||||||
Mativ Holdings | ||||||||
6.875%, 10/01/2026 (A) | 1,000,000 | 916,307 | ||||||
Mercer International | ||||||||
5.125%, 02/01/2029 | 500,000 | 410,625 | ||||||
Pactiv Evergreen Group Issuer | ||||||||
4.375%, 10/15/2028 (A) | 1,750,000 | 1,531,250 | ||||||
Polar US Borrower | ||||||||
6.750%, 05/15/2026 (A) | 2,000,000 | 954,747 | ||||||
The accompanying notes are an integral part of the financial statements.
16
| The Advisors’ Inner Circle Fund III | Barrow Hanley | |
| Credit Opportunities Fund | ||
| October 31, 2022 |
| CORPORATE OBLIGATIONS — (continued)
| ||||||||
| Face Amount | Value | |||||||
TMS International | ||||||||
6.250%, 04/15/2029 (A) | $ | 1,500,000 | $ | 1,051,986 | ||||
WR Grace Holdings | ||||||||
5.625%, 08/15/2029 (A) | 500,000 | 386,490 | ||||||
|
|
| ||||||
| 12,433,447 | ||||||||
|
|
| ||||||
REAL ESTATE — 5.0% |
| |||||||
Howard Hughes | ||||||||
4.375%, 02/01/2031 (A) | 2,500,000 | 1,878,500 | ||||||
Iron Mountain | ||||||||
5.625%, 07/15/2032 (A) | 250,000 | 214,343 | ||||||
5.250%, 07/15/2030 (A) | 500,000 | 431,406 | ||||||
5.000%, 07/15/2028 (A) | 250,000 | 223,650 | ||||||
4.875%, 09/15/2029 (A) | 250,000 | 214,938 | ||||||
Realogy Group | ||||||||
5.250%, 04/15/2030 (A) | 1,000,000 | 693,420 | ||||||
Service Properties Trust | ||||||||
7.500%, 09/15/2025 | 1,250,000 | 1,218,750 | ||||||
|
|
| ||||||
| 4,875,007 | ||||||||
|
|
| ||||||
UTILITIES — 1.1% |
| |||||||
Vistra | ||||||||
7.000%, US Treas Yield Curve Rate T Note Const Mat 5 Yr + 5.740%(A)(B)(C) | 1,000,000 | 884,605 | ||||||
Vistra Operations | ||||||||
4.375%, 05/01/2029 (A) | 250,000 | 213,819 | ||||||
|
|
| ||||||
| 1,098,424 | ||||||||
|
|
| ||||||
TOTAL CORPORATE OBLIGATIONS | 67,386,469 | |||||||
|
|
| ||||||
| REGISTERED INVESTMENT COMPANY — 25.5%
| ||||||||
| Shares | ||||||||
Barrow Hanley Floating Rate Fund † | 2,624,456 | 24,799,011 | ||||||
|
|
| ||||||
TOTAL REGISTERED INVESTMENT COMPANY (Cost $26,084,973) | 24,799,011 | |||||||
|
|
| ||||||
TOTAL INVESTMENTS— 94.7% |
| $ | 92,185,480 | |||||
|
|
| ||||||
Percentages are based on Net Assets of $97,302,076. |
| † | Investment in Affiliated Security. |
| (A) | Security exempt from registration under Rule 144A of the Securities Act of 1933. These securities may be resold in transactions exempt from registration normally to qualified institutions. On October 31, 2022, the value of these securities amounted to $60,593,943, representing 62.3% of the Net Assets of the Fund. |
| (B) | Variable or floating rate security. The rate shown is the effective interest rate as of period end. The rates on certain securities are not based on published reference rates and spreads and are either determined by the issuer or agent based on current market conditions; by using a formula based on the rates of underlying loans; or by adjusting periodically based on prevailing interest rates. |
| (C) | Perpetual security with no stated maturity date. |
ICE — Intercontinental Exchange
LIBOR — London Interbank Offered Rate
MSCI — Morgan Stanley Capital International
The following is a summary of the inputs used as of October 31, 2022 in valuing the Fund’s investments carried at value:
| Investments in Securities | Level 1 | Level 2 | Level 3 | Total | ||||||||||||
Corporate Obligations | $ | — | $ | 67,386,469 | $ | — | $ | 67,386,469 | ||||||||
Registered Investment Company | 24,799,011 | — | — | 24,799,011 | ||||||||||||
|
|
|
|
|
|
|
| |||||||||
Total Investments in Securities | $ | 24,799,011 | $ | 67,386,469 | $ | — | $ | 92,185,480 | ||||||||
|
|
|
|
|
|
|
| |||||||||
Amounts designated as “–” are $0.
For more information on valuation inputs, see Note 2 — Significant Accounting Policies in the Notes to Financial Statements.
The accompanying notes are an integral part of the financial statements.
17
| The Advisors’ Inner Circle Fund III | Barrow Hanley | |
| Credit Opportunities Fund | ||
| October 31, 2022 |
The following is a summary of the Fund’s transactions with affiliates for the period ended October 31, 2022:
| Security Description | Value 4/12/2022 | Purchases at Cost | Proceeds from Sales | Realized Gain/ (Loss) | Net Unrealized Depreciation | Value 10/31/2022 | Shares | Income | Capital Gains | |||||||||||||||||||||||||||
Barrow Hanley Floating Rate Fund | $ | — | $ | 31,378,146 | $ | (5,000,000 | ) | $ | (293,173 | ) | $ | (1,285,962 | ) | $ | 24,799,011 | 2,624,456 | $ | 805,728 | $ | — | ||||||||||||||||
|
|
|
| |||||||||||||||||||||||||||||||||
Amounts designated as “–” are $0.
The accompanying notes are an integral part of the financial statements.
18
| The Advisors’ Inner Circle Fund III | Barrow Hanley | |
| Emerging Markets Value Fund | ||
| October 31, 2022 |
SECTOR WEIGHTINGS † (UNAUDITED)
|
| † | Percentages are based on total investments. |
SCHEDULE OF INVESTMENTS |
| |||||||
| COMMON STOCK — 97.6%
| ||||||||
| Shares | Value | |||||||
BRAZIL — 5.8% |
| |||||||
Dexco | 25,081 | $ | 46,953 | |||||
TIM | 16,582 | 42,438 | ||||||
Ultrapar Participacoes | 13,580 | 35,386 | ||||||
|
|
| ||||||
| 124,777 | ||||||||
|
|
| ||||||
CHILE — 1.3% |
| |||||||
Antofagasta PLC | 1,986 | 26,773 | ||||||
|
|
| ||||||
CHINA — 21.9% |
| |||||||
Baidu, Cl A * | 2,696 | 25,793 | ||||||
BOC Hong Kong Holdings | 15,175 | 47,170 | ||||||
China International Capital, Cl H | 36,799 | 51,193 | ||||||
China Petroleum & Chemical, Cl H | 92,706 | 36,612 | ||||||
Haier Smart Home, Cl H | 13,552 | 33,907 | ||||||
Kunlun Energy | 39,273 | 23,465 | ||||||
Nexteer Automotive Group | 68,245 | 36,950 | ||||||
PICC Property & Casualty, Cl H | 51,796 | 47,773 | ||||||
Ping An Insurance Group of China, Cl H | 5,719 | 22,877 | ||||||
Shandong Weigao Group Medical Polymer, Cl H | 45,875 | 63,234 | ||||||
Tingyi Cayman Islands Holding | 27,671 | 43,289 | ||||||
TravelSky Technology, Cl H | 25,331 | 36,788 | ||||||
|
|
| ||||||
| 469,051 | ||||||||
|
|
| ||||||
GREECE — 1.8% |
| |||||||
OPAP | 3,094 | 37,915 | ||||||
|
|
| ||||||
HONG KONG — 8.0% |
| |||||||
ASMPT | 3,732 | 20,539 | ||||||
Hang Lung Properties | 27,302 | 34,329 | ||||||
Hongkong Land Holdings | 10,195 | 39,250 | ||||||
Sino Biopharmaceutical | 92,986 | 45,133 | ||||||
WH Group | 62,270 | 31,493 | ||||||
|
|
| ||||||
| 170,744 | ||||||||
|
|
| ||||||
| COMMON STOCK — (continued)
| ||||||||
| Shares | Value | |||||||
INDIA — 4.4% |
| |||||||
Axis Bank | 4,393 | $ | 48,081 | |||||
IndusInd Bank | 3,411 | 47,085 | ||||||
|
|
| ||||||
| 95,166 | ||||||||
|
|
| ||||||
INDONESIA — 4.0% |
| |||||||
Astra International | 113,216 | 48,270 | ||||||
Bank Mandiri Persero | 56,082 | 37,933 | ||||||
|
|
| ||||||
| 86,203 | ||||||||
|
|
| ||||||
MACAO — 1.3% |
| |||||||
Galaxy Entertainment Group | 6,140 | 28,042 | ||||||
|
|
| ||||||
MALAYSIA — 2.3% |
| |||||||
Genting Malaysia | 86,691 | 50,240 | ||||||
|
|
| ||||||
MEXICO — 9.5% |
| |||||||
Fibra Uno Administracion ‡ | 40,031 | 46,733 | ||||||
Gruma, Cl B | 3,798 | 43,830 | ||||||
Grupo Financiero Banorte, Cl O | 7,069 | 57,546 | ||||||
Kimberly-Clark de Mexico, Cl A | 35,633 | 56,148 | ||||||
|
|
| ||||||
| 204,257 | ||||||||
|
|
| ||||||
PHILIPPINES — 3.5% |
| |||||||
Ayala Land | 73,943 | 32,815 | ||||||
BDO Unibank | 18,859 | 41,686 | ||||||
|
|
| ||||||
| 74,501 | ||||||||
|
|
| ||||||
RUSSIA — 0.0% |
| |||||||
Alrosa PJSC *(A) | 12,058 | – | ||||||
Moscow Exchange MICEX-RTS PJSC (A) | 8,812 | – | ||||||
|
|
| ||||||
| – | ||||||||
|
|
| ||||||
SINGAPORE — 1.7% |
| |||||||
Singapore Telecommunications | 20,241 | 35,746 | ||||||
|
|
| ||||||
SOUTH AFRICA — 4.7% |
| |||||||
Gold Fields | 2,701 | 21,835 | ||||||
Growthpoint Properties ‡ | 64,210 | 45,268 | ||||||
Vodacom Group | 4,846 | 33,059 | ||||||
|
|
| ||||||
| 100,162 | ||||||||
|
|
| ||||||
SOUTH KOREA — 13.9% |
| |||||||
E-MART | 471 | 27,973 | ||||||
Hankook Tire & Technology | 1,972 | 50,600 | ||||||
Korea Investment Holdings | 1,303 | 45,325 | ||||||
POSCO Holdings | 194 | 33,912 | ||||||
Samsung Fire & Marine Insurance | 254 | 35,663 | ||||||
Shinhan Financial Group | 1,482 | 37,767 | ||||||
SK Hynix | 1,131 | 65,663 | ||||||
|
|
| ||||||
| 296,903 | ||||||||
|
|
| ||||||
TAIWAN — 6.5% |
| |||||||
Bizlink Holding | 5,823 | 44,545 | ||||||
Cathay Financial Holding | 28,214 | 33,098 | ||||||
Hiwin Technologies | 5,821 | 29,988 | ||||||
The accompanying notes are an integral part of the financial statements.
19
| The Advisors’ Inner Circle Fund III | Barrow Hanley | |
| Emerging Markets Value Fund | ||
| October 31, 2022 |
| COMMON STOCK — (continued)
| ||||||||
| Shares | Value | |||||||
Pegatron | 17,180 | $ | 31,457 | |||||
|
|
| ||||||
| 139,088 | ||||||||
|
|
| ||||||
THAILAND — 5.7% |
| |||||||
PTT Exploration & Production PCL | 17,531 | 83,601 | ||||||
Thai Beverage PCL | 93,899 | 38,141 | ||||||
|
|
| ||||||
| 121,742 | ||||||||
|
|
| ||||||
UNITED ARAB EMIRATES — 1.3% |
| |||||||
Emaar Properties PJSC | 16,744 | 27,625 | ||||||
|
|
| ||||||
TOTAL COMMON STOCK | ||||||||
(Cost $2,411,175) | 2,088,935 | |||||||
|
|
| ||||||
PREFERRED STOCK — 2.0%
|
| |||||||
BRAZIL — 2.0% |
| |||||||
Cia Energetica de Minas Gerais (B) | 20,047 | 44,087 | ||||||
|
|
| ||||||
TOTAL PREFERRED STOCK | ||||||||
(Cost $36,977) | 44,087 | |||||||
|
|
| ||||||
TOTAL INVESTMENTS— 99.6% | ||||||||
(Cost $2,448,152) | $ | 2,133,022 | ||||||
|
|
| ||||||
Percentages are based on Net Assets of $2,141,096.
* Non-income producing security.
‡ Real Estate Investment Trust.
(A) Level 3 security in accordance with fair value hierarchy.
(B) There is currently no rate available.
Cl — Class
PCL — Public Company Limited
PJSC — Public Joint Stock Company
PLC — Public Limited Company
The following is a summary of the inputs used as of October 31, 2022 in valuing the Fund’s investments carried at value:
| Investments in Securities | Level 1 | Level 2 | Level 3(1) | Total | ||||||||||||
Common Stock | ||||||||||||||||
Brazil | $ | 124,777 | $ | – | $ | – | $ | 124,777 | ||||||||
Chile | 26,773 | – | – | 26,773 | ||||||||||||
China | 469,051 | – | – | 469,051 | ||||||||||||
Greece | 37,915 | – | – | 37,915 | ||||||||||||
Hong Kong | 170,744 | – | – | 170,744 | ||||||||||||
India | 95,166 | – | – | 95,166 | ||||||||||||
Indonesia | 86,203 | – | – | 86,203 | ||||||||||||
Macao | 28,042 | – | – | 28,042 | ||||||||||||
Malaysia | 50,240 | – | – | 50,240 | ||||||||||||
Mexico | 204,257 | – | – | 204,257 | ||||||||||||
Philippines | – | 74,501 | – | 74,501 | ||||||||||||
Russia | – | – | –^ | – | ||||||||||||
Singapore | 35,746 | – | – | 35,746 | ||||||||||||
South Africa | 100,162 | – | – | 100,162 | ||||||||||||
South Korea | 296,903 | – | – | 296,903 | ||||||||||||
Taiwan | 139,088 | – | – | 139,088 | ||||||||||||
Thailand | 121,742 | – | – | 121,742 | ||||||||||||
United Arab Emirates | 27,625 | – | – | 27,625 | ||||||||||||
|
|
|
|
|
|
|
|
|
|
|
| |||||
Total Common Stock | 2,014,434 | 74,501 | – | 2,088,935 | ||||||||||||
Preferred Stock | ||||||||||||||||
Brazil | 44,087 | – | – | 44,087 | ||||||||||||
|
|
|
|
|
|
|
|
|
|
|
| |||||
Total Investments in Securities | $ | 2,058,521 | $ | 74,501 | $ | – | $ | 2,133,022 | ||||||||
|
|
|
|
|
|
|
|
|
|
|
| |||||
| (1) | A reconciliation of Level 3 investments is presented when the fund has a significant amount of Level 3 investments at the end of the period in relation to net assets. Management has concluded that Level 3 investments are not material in relation to net assets. |
| ^ | Includes securities in which the fair value is $0 or has been rounded to $0. |
Amounts designated as “—” are $0.
For more information on valuation inputs, see Note 2 — Significant Accounting Policies in the Notes to Financial Statements.
The accompanying notes are an integral part of the financial statements.
20
| The Advisors’ Inner Circle Fund III | Barrow Hanley | |
| Floating Rate Fund | ||
| October 31, 2022 |
SECTOR WEIGHTINGS † (UNAUDITED) |
† Percentages are based on total investments.
SCHEDULE OF INVESTMENTS |
| |||||||
| BANK LOAN OBLIGATIONS — 83.6%
| ||||||||
| Face Amount | Value | |||||||
AEROSPACE AND DEFENSE — 1.1% |
| |||||||
Peraton Corp., Term B Loan, 1st Lien | ||||||||
7.504%, LIBOR + 3.750%, 02/01/2028 (A)(B) | $ | 1,209,497 | $ | 1,162,411 | ||||
|
|
| ||||||
AUTOMOBILE — 2.6% |
| |||||||
Adient US LLC, Tranche B-1 Term Loan 1st Lien | ||||||||
7.004%, 04/10/2028 | 2,962,500 | 2,858,072 | ||||||
|
|
| ||||||
BEVERAGE, FOOD AND TOBACCO — 1.6% |
| |||||||
8th Avenue Food, Term Loan, 1st Lien | ||||||||
7.865%, 10/01/2025 | 990,000 | 858,825 | ||||||
| BANK LOAN OBLIGATIONS — (continued)
| ||||||||
| Face Amount | Value | |||||||
Alpine US, Term Loan 1st Lien | ||||||||
8.564%, 05/03/2028 | $ | 426,147 | $ | 404,840 | ||||
Woof Holdings, Inc., Initial Term Loan, 1st Lien | ||||||||
7.315%, LIBOR + 3.750%, 12/21/2027 (A) | 492,500 | 470,337 | ||||||
|
|
| ||||||
| 1,734,002 | ||||||||
|
|
| ||||||
| BROADCASTING AND ENTERTAINMENT — 0.5% |
| |||||||
Virgin Media Bristol LLC, Facility Q, 1st Lien | ||||||||
6.662%, LIBOR + 3.250%, 01/31/2029 (A) | 500,000 | 491,530 | ||||||
|
|
| ||||||
BUILDINGS AND REAL ESTATE — 4.6% |
| |||||||
Aegion Corporation, Initial Term Loan, 1st Lien | ||||||||
8.504%, LIBOR + 4.750%, 05/17/2028 (A) | 989,999 | 909,562 | ||||||
Potters Industries, LLC, Initial Term Loan, 1st Lien | ||||||||
7.615%, LIBOR + 4.000%, 12/14/2027 (A) | 1,477,500 | 1,418,400 | ||||||
Werner Finco LP (Werner Finco, Inc.), Initial Term Loan, 1st Lien | ||||||||
7.674%, LIBOR + 4.000%, 07/24/2024 (A) | 1,415,869 | 1,278,997 | ||||||
WireCo WorldGroup Inc., Initial Term Loan, 1st Lien | ||||||||
7.188%, LIBOR + 4.250%, 10/27/2028 (A) | 1,450,833 | 1,413,111 | ||||||
|
|
| ||||||
| 5,020,070 | ||||||||
|
|
| ||||||
CARGO TRANSPORT — 1.7% |
| |||||||
First Student Bidco Inc., Initial Term B Loan, 1st Lien | ||||||||
7.653%, 07/21/2028 (A) | 32,468 | 30,712 | ||||||
5.982%, LIBOR + 3.000%, 07/21/2028 (A) | 362,457 | 340,257 | ||||||
First Student Bidco Inc., Initial Term C Loan, 1st Lien | ||||||||
5.982%, LIBOR + 3.000%, 07/21/2028 (A) | 134,804 | 126,547 | ||||||
First Student Bidco, Inc., Initial Term Loan, 1st Lien | ||||||||
7.115%, 07/21/2028 (A) | 467,532 | 442,258 | ||||||
Kenan Advantage Group, Inc.,The, U.S. Term B-1 Loan, 1st Lien | ||||||||
7.504%, LIBOR + 3.750%, 03/24/2026 (A) | 488,781 | 465,442 | ||||||
Kenan Advantage, Term Loan, 1st Lien | ||||||||
10.365%, 09/01/2027 | 250,000 | 228,437 | ||||||
The accompanying notes are an integral part of the financial statements.
21
| The Advisors’ Inner Circle Fund III | Barrow Hanley | |
| Floating Rate Fund | ||
| October 31, 2022 |
| BANK LOAN OBLIGATIONS — (continued)
| ||||||||
| Face Amount | Value | |||||||
LaserShip, Inc., Initial Loan, 1st Lien | ||||||||
10.377%, LIBOR + 7.500%, 04/30/2029 (A) | $ | 250,000 | $ | 170,000 | ||||
|
|
| ||||||
| 1,803,653 | ||||||||
|
|
| ||||||
| CHEMICALS, PLASTICS AND RUBBER — 3.1% |
| |||||||
DCG Acquisition Corp., Term Loan B, 1st Lien | ||||||||
8.254%, LIBOR + 4.500%, 09/30/2026 (A) | 492,500 | 462,950 | ||||||
Nouryon Finance B.V., Initial Dollar Term Loan, 1st Lien | ||||||||
7.165%, LIBOR + 3.000%, 10/01/2025 (A) | 880,963 | 828,660 | ||||||
Nouryon Finance B.V., Initial Dollar, Term Loan, 1st Lien | ||||||||
7.165%, 10/01/2025 (A) | 228,677 | 215,100 | ||||||
Schenectady International Group, Inc., Term Loan, 1st Lien | ||||||||
9.021%, 10/15/2025 | 907,203 | 726,897 | ||||||
Sparta U.S. Holdco LLC, Initial Term Loan, 1st Lien | ||||||||
6.378%, LIBOR + 3.500%, 08/02/2028 (A) | 248,125 | 234,974 | ||||||
W. R. Grace Holdings LLC, Initial Term Loan, 1st Lien | ||||||||
7.350%, LIBOR + 3.750%, 09/22/2028 (A) | 992,500 | 951,252 | ||||||
|
|
| ||||||
| 3,419,833 | ||||||||
|
|
| ||||||
| COMPUTERS & ELECTRONICS — 0.9% |
| |||||||
Micro Holdings (Internet Brands), Initial Ter Loan, 1st Lien | ||||||||
7.504%, 09/13/2024 (A) | 994,764 | 956,217 | ||||||
|
|
| ||||||
| CONTAINERS, PACKAGING AND GLASS — 1.9% |
| |||||||
Five Star, Term Loan, 1st Lien | ||||||||
7.620%, CME Term SOFR + 4.250%, 05/05/2029 (A) | 500,000 | 477,500 | ||||||
Graham Packaging Company Inc., Initial Term Loan (2021), 1st Lien | ||||||||
6.754%, LIBOR + 3.000%, 08/04/2027 (A) | 1,447,449 | 1,409,048 | ||||||
Pregis TopCo LLC, Third Amendment Refinancing Term Loan, 1st Lien | ||||||||
7.754%, LIBOR + 4.000%, 07/31/2026 (A) | 247,500 | 235,435 | ||||||
|
|
| ||||||
| 2,121,983 | ||||||||
|
|
| ||||||
| BANK LOAN OBLIGATIONS — (continued)
| ||||||||
| Face Amount | Value | |||||||
DIVERSIFIED NATURAL RESOURCES, PRECIOUS METALS AND MINERALS — 2.5% |
| |||||||
Schweitzer-Mauduit International, Inc., Term B Loan, 1st Lien | ||||||||
7.563%, LIBOR + 3.750%, 04/20/2028 (A) | $ | 2,962,500 | $ | 2,755,125 | ||||
|
|
| ||||||
| DIVERSIFIED/CONGLOMERATE MANUFACTURING — 1.3% |
| |||||||
TK Elevator Midco GmbH, Facility B1 (USD), 1st Lien | ||||||||
6.871%, LIBOR + 3.500%, 07/30/2027 (A) | 1,148,982 | 1,089,385 | ||||||
6.807%, 07/30/2027 (A) | 324,908 | 308,055 | ||||||
|
|
| ||||||
| 1,397,440 | ||||||||
|
|
| ||||||
| DIVERSIFIED/CONGLOMERATE SERVICE — 6.2% |
| |||||||
BIFM/Brookfield Global, Term Loan, 1st Lien | ||||||||
7.254%, 05/01/2026 | 965,502 | 914,813 | ||||||
Embecta Corp., Initial Term Loan, 1st Lien | ||||||||
5.754%, CME Term SOFR + 3.000%, 03/30/2029 (A) | 410,978 | 399,935 | ||||||
Medline Borrower, LP, Initial Dollar Term Loan, 1st Lien | ||||||||
7.004%, LIBOR + 3.250%, 10/23/2028 (A)(B) | 995,000 | 913,738 | ||||||
Mercury Borrower, Inc., Initial Term Loan, 1st Lien | ||||||||
7.188%, LIBOR + 3.500%, 08/02/2028 (A) | 993,756 | 929,162 | ||||||
Paya Holdings III, LLC, Initial Term Loan, 1st Lien | ||||||||
7.004%, LIBOR + 3.250%, 06/16/2028 (A) | 990,000 | 960,300 | ||||||
Service Logic Acquisition, Inc., Closing Date Initial Term Loan, 1st Lien | ||||||||
6.806%, LIBOR + 4.000%, 10/29/2027 (A) | 968,335 | 913,866 | ||||||
Service Logic Acquisition, Inc., Delayed Draw Term Loan, 1st Lien | ||||||||
7.080%, 10/29/2027 | 18,358 | 17,326 | ||||||
Sharp Midco LLC, Initial Term Loan, 1st Lien | ||||||||
7.674%, LIBOR + 4.000%, 12/31/2028 (A) | 995,000 | 955,200 | ||||||
Verscend Holding Corp., Term Loan, Tranche B-1, 1st Lien | ||||||||
7.754%, 08/27/2025 | 728,217 | 718,204 | ||||||
|
|
| ||||||
| 6,722,544 | ||||||||
|
|
| ||||||
The accompanying notes are an integral part of the financial statements.
22
| The Advisors’ Inner Circle Fund III | Barrow Hanley | |
| Floating Rate Fund | ||
| October 31, 2022 |
| BANK LOAN OBLIGATIONS — (continued)
| ||||||||
| Face Amount | Value | |||||||
| ECOLOGICAL — 1.4% |
| |||||||
GFL Environmental Inc., 2020 Refinancing Term Loan, 1st Lien | ||||||||
7.415%, LIBOR + 3.000%, 05/30/2025 (A)(B) | $ | 1,483,512 | $ | 1,474,003 | ||||
|
|
| ||||||
| ELECTRONICS — 3.4% |
| |||||||
Cobham Ultra SeniorCo S.a/r.l., Term Loan, 1st Lien | ||||||||
7.063%, 08/03/2029 (A)(B) | 1,000,000 | 962,500 | ||||||
Ingram Micro Inc., Initial Term Loan, 1st Lien | ||||||||
7.174%, LIBOR + 3.500%, 06/30/2028 (A) | 492,513 | 475,275 | ||||||
Proofpoint, Inc., Initial Term Loan, 2nd Lien | ||||||||
6.320%, LIBOR + 3.250%, 08/31/2028 (A) | 496,250 | 471,437 | ||||||
RealPage, Inc., Initial Term Loan, 2nd Lien | ||||||||
6.754%, LIBOR + 3.250%, 04/24/2028 (A) | 496,250 | 465,547 | ||||||
UKG Inc., Initial Term Loan, 1st Lien | ||||||||
7.504%, LIBOR + 3.750%, 05/04/2026 (A) | 472,564 | 458,869 | ||||||
Ultra Clean, Term Loan, 1st Lien | ||||||||
7.504%, 08/27/2025 | 847,933 | 835,002 | ||||||
|
|
| ||||||
| 3,668,630 | ||||||||
|
|
| ||||||
| FINANCE (INCLUDING STRUCTURED PRODUCTS) — 8.6% |
| |||||||
Allspring Buyer LLC, Initial Term Loan, 1st Lien | ||||||||
6.313%, LIBOR + 3.250%, 11/01/2028 (A) | 882,661 | 869,236 | ||||||
Fiserv Investment Solutions, Inc., Initial Term Loan, 1st Lien | ||||||||
6.961%, LIBOR + 4.000%, 02/10/2027 (A) | 977,500 | 916,895 | ||||||
Global IID Parent LLC, Term B Loan, 1st Lien | ||||||||
8.174%, LIBOR + 4.500%, 12/16/2028 (A) | 1,985,000 | 1,875,825 | ||||||
Greystone Select, Term Loan, 1st Lien | ||||||||
9.227%, 06/16/2028 (A) | 490,769 | 453,962 | ||||||
| BANK LOAN OBLIGATIONS — (continued)
| ||||||||
| Face Amount | Value | |||||||
Jane Street Group, LLC, Dollar Term Loan, 1st Lien | ||||||||
6.504%, LIBOR + 2.750%, 01/26/2028 (A) | $ | 1,473,750 | $ | 1,430,068 | ||||
KKR Apple Bidco, LLC, Initial Term Loan, 1st Lien | ||||||||
9.504%, LIBOR + 5.750%, 09/21/2029 (A) | 250,000 | 238,202 | ||||||
KKR Apple Bidco, LLC, Initial Term Loan, 2nd Lien | ||||||||
7.627%, CME Term SOFR + 4.000%, 09/22/2028 (A)(B) | 500,000 | 495,000 | ||||||
Madison IAQ LLC, Initial Term Loan, 1st Lien | ||||||||
6.815%, LIBOR + 3.250%, 06/21/2028 (A) | 493,750 | 445,471 | ||||||
MSP Law PLLC, Term Loan, 1st Lien | ||||||||
0.000%, 04/09/2025 (C)(D) | 564,813 | 564,813 | ||||||
Osmosis Buyer Limited, 2022 Refinancing Term B Loan, 1st Lien | ||||||||
6.858%, CME Term SOFR + 3.750%, 07/31/2028 (A)(B) | 249,375 | 231,555 | ||||||
Russell Investments US Institutional Holdco, Inc., Term Loan, 1st Lien | ||||||||
7.254%, LIBOR + 3.500%, 06/02/2025 (A) | 1,988,664 | 1,831,440 | ||||||
|
|
| ||||||
| 9,352,467 | ||||||||
|
|
| ||||||
| FINANCIAL INTERMEDIARIES — 2.5% |
| |||||||
New SK Holdco Sub, LLC, New Term Loan, Trancjhe 1 | ||||||||
10.226%, CME Term SOFR + 6.750%, 06/30/2027 | 3,060,885 | 2,743,318 | ||||||
|
|
| ||||||
| FOOD & DRUG — 0.4% |
| |||||||
Chefs’ Warehouse, Inc., The, Term Loanst Lien | ||||||||
8.428%, CME Term SOFR + 4.750%, 08/17/2029 | 500,000 | 487,500 | ||||||
|
|
| ||||||
| HEALTH CARE — 1.1% |
| |||||||
Charlotte Buyer, Inc., Initial Term Loan B 1st Lien | ||||||||
9.046%, CME Term SOFR + 5.250%, 02/11/2028 | 500,000 | 472,500 | ||||||
WCG Purchaser Corp., Initial Term Loan, 1st Lien | ||||||||
7.754%, LIBOR + 4.000%, 01/08/2027 | 740,196 | 699,952 | ||||||
|
|
| ||||||
| 1,172,452 | ||||||||
|
|
| ||||||
The accompanying notes are an integral part of the financial statements.
23
| The Advisors’ Inner Circle Fund III | Barrow Hanley | |
| Floating Rate Fund | ||
| October 31, 2022 |
| BANK LOAN OBLIGATIONS — (continued)
| ||||||||
| Face Amount | Value | |||||||
| HEALTHCARE, EDUCATION AND CHILDCARE —11.1% |
| |||||||
Bausch + Lomb Corporation, Initial Term Loan, 1st Lien | ||||||||
6.618%, CME Term SOFR + 3.250%, 05/10/2027 (A) | $ | 997,500 | $ | 933,411 | ||||
Bella Holding Company, LLC, Initial Term Loan, 1st Lien | ||||||||
7.504%, LIBOR + 3.750%, 04/01/2028 (A) | 990,000 | 918,720 | ||||||
CNT Holdings I Corp, Initial Term Loan, 1st Lien | ||||||||
10.248%, LIBOR + 6.750%, 11/06/2028 (A) | 750,000 | 708,750 | ||||||
7.239%, LIBOR + 3.500%, 11/08/2027 (A) | 1,477,500 | 1,435,761 | ||||||
Jazz Pharmaceuticals Public Limited Company, Initial Dollar Term Loan, 2nd Lien | ||||||||
7.254%, LIBOR + 3.500%, 05/05/2028 (A) | 890,726 | 879,039 | ||||||
National Mentor Holdings, Inc., Initial Term C Loan, 2nd Lien | ||||||||
6.760%, LIBOR + 3.750%, 03/02/2028 (A) | 58,309 | 41,346 | ||||||
National Mentor Holdings, Inc., Initial Term Loan, 1st Lien | ||||||||
8.174%, LIBOR + 7.250%, 02/16/2029 (A) | 500,000 | 337,500 | ||||||
7.510%, 03/02/2028 | 1,011,682 | 717,373 | ||||||
7.438%, LIBOR + 3.750%, 03/02/2028 (A) | 817,988 | 580,028 | ||||||
Organon & Co., Dollar Term Loan, 1st Lien | ||||||||
6.188%, LIBOR + 3.000%, 06/02/2028 (A) | 930,833 | 906,399 | ||||||
Regionalcare Hospital Partners Holdings, Inc., Term Loan, Tranche B, 1st Lien | ||||||||
8.165%, 11/16/2025 (A)(B) | 1,520,362 | 1,339,819 | ||||||
Summit Behavioral Healthcare, LLC, Initial Term Loan, 1st Lien | ||||||||
7.730%, LIBOR + 4.750%, 11/24/2028 (A) | 995,000 | 925,350 | ||||||
| BANK LOAN OBLIGATIONS — (continued)
| ||||||||
| Face Amount | Value | |||||||
Valeant, Term Loan, 1st Lien | ||||||||
7.174%, CME Term SOFR + 5.250%, 02/01/2027 (A) | $ | 987,500 | $ | 736,349 | ||||
WCG Purchaser Corp., Initial Term Loan, 1st Lien | ||||||||
7.045%, LIBOR + 4.000%, 01/08/2027 (A) | 1,227,152 | 1,160,432 | ||||||
Women’s Care Holdings, Inc., Initial Term Loan, 1st Lien | ||||||||
7.871%, LIBOR + 4.500%, 01/15/2028 (A) | 493,750 | 461,409 | ||||||
|
|
| ||||||
| 12,081,686 | ||||||||
|
|
| ||||||
| HOME AND OFFICE FURNISHINGS, HOUSEWARES AND DURABLE CONSUMER PRODUCTS — 0.9% |
| |||||||
Pactiv Evergreen Inc., Tranche B-3 U.S. Term Loan, 1st Lien | ||||||||
7.254%, LIBOR + 3.500%, 09/24/2028 (A) | 730,868 | �� | 708,160 | |||||
Pactiv Evergreen Inc., Tranche B-3, Term Loan, 1st Lien | ||||||||
7.254%, 09/24/2028 (A) | 259,133 | 251,081 | ||||||
|
|
| ||||||
| 959,241 | ||||||||
|
|
| ||||||
| HOTELS, MOTELS, INNS AND GAMING — 0.9% |
| |||||||
BRE/Everbright M6 Borrower LLC, Initial Term Loan, 2nd Lien | ||||||||
6.642%, LIBOR + 5.000%, 09/09/2026 (A) | 990,000 | 968,349 | ||||||
|
|
| ||||||
| INDUSTRIAL EQUIPMENT — 0.8% |
| |||||||
AZZ Inc., Intial Term Loan, Tranche 2 | ||||||||
7.384%, CME Term SOFR + 4.250%, 05/13/2029 | 920,769 | 912,712 | ||||||
|
|
| ||||||
| INSURANCE — 0.6% |
| |||||||
Asurion, LLC, New B-4 Term Loan, 1st Lien | ||||||||
9.004%, LIBOR + 5.250%, 01/20/2029 (A) | 1,000,000 | 692,500 | ||||||
|
|
| ||||||
The accompanying notes are an integral part of the financial statements.
24
| The Advisors’ Inner Circle Fund III | Barrow Hanley | |
| Floating Rate Fund | ||
| October 31, 2022 |
| BANK LOAN OBLIGATIONS — (continued)
| ||||||||
| Face Amount | Value | |||||||
| LEISURE, AMUSEMENT, MOTION PICTURES, ENTERTAINMENT — 1.1% |
| |||||||
Scientific Games Holdings LP, Initial Dollar Term Loan, 1st Lien | ||||||||
7.097%, CME Term SOFR + 3.500%, 04/04/2029 (A) | $ | 250,000 | $ | 235,095 | ||||
Topgolf International, Inc., Initial Term Loan, 1st Lien | ||||||||
10.577%, LIBOR + 6.250%, 02/08/2026 (A) | 969,874 | 962,299 | ||||||
|
|
| ||||||
| 1,197,394 | ||||||||
|
|
| ||||||
| MACHINERY (NON-AGRICULTURE, NON-CONSTRUCTION AND NON-ELECTRONIC) — 5.6% |
| |||||||
Alliance Laundry Systems LLC, Initial Term B Loan, 1st Lien | ||||||||
7.409%, 10/08/2027 | 971,786 | 936,383 | ||||||
Apex Tool Group, LLC, Initial Term Loan, 2nd Lien | ||||||||
8.624%, CME Term SOFR + 5.250%, 02/08/2029 (A) | 997,500 | 858,478 | ||||||
AZZ Inc., Initial Term Loan, 1st Lien 6.977%, CME Term SOFR + 4.250%, 05/13/2029 (A) | 333,173 | 330,258 | ||||||
Engineered Machinery, Term Loan, 1st Lien 6.870%, 05/21/2029 | 500,000 | 462,500 | ||||||
Filtration Group Corporation, 2021 Incremental Term Loan, 1st Lien 7.254%, LIBOR + 3.500%, 10/19/2028 (A) | 1,732,500 | 1,669,697 | ||||||
Pro Mach Group, Inc., Closing Date Initial Term Loan, 1st Lien 7.754%, LIBOR + 4.000%, 08/31/2028 (A) | 992,779 | 966,719 | ||||||
SPX Flow T, Inc., Term Loan, 1st Lien 8.329%, CME Term SOFR + 4.500%, 04/05/2029 (A) | 1,000,000 | 943,570 | ||||||
|
|
| ||||||
| 6,167,605 | ||||||||
|
|
| ||||||
| OIL AND GAS — 1.8% |
| |||||||
CQP Holdco LP, Initial Term Loan, 1st Lien 7.424%, LIBOR + 3.750%, 06/05/2028 (A) | 1,975,000 | 1,947,113 | ||||||
|
|
| ||||||
| BANK LOAN OBLIGATIONS — (continued)
| ||||||||
| Face Amount | Value | |||||||
| PERSONAL AND NON-DURABLE CONSUMER PRODUCTS (MANUFACTURING ONLY) — 1.9% |
| |||||||
ABG Intermediate Holdings 2 LLC, Initial Term Loan, 1st Lien 9.830%, CME Term SOFR + 6.000%, 12/20/2029 (A) | $ | 250,000 | $ | 230,000 | ||||
ABG International Holdings 2, LLC, Term Loan, 1st Lien 7.329%, CME Term SOFR + 3.500%, 12/21/2028 (A) | 997,500 | 956,353 | ||||||
Sunshine Luxembourg VII S.a r.l., Facility B3, 1st Lien 7.424%, LIBOR + 3.750%, 10/01/2026 (A)(B) | 980,075 | 931,689 | ||||||
|
|
| ||||||
| 2,118,042 | ||||||||
|
|
| ||||||
| PERSONAL TRANSPORTATION — 1.3% |
| |||||||
AAdvantage Loyality IP Ltd. (American Airlines, Inc.), Initial Term Loan, 1st Lien 8.993%, LIBOR + 4.750%, 04/20/2028 (A) | 500,000 | 494,465 | ||||||
Mileage Plus Holdings LLC (Mileage Plus Intellectual Property Assets, Ltd.), Initial Term Loan, 1st Lien 8.777%, LIBOR + 5.250%, 06/21/2027 (A) | 950,000 | 968,601 | ||||||
|
|
| ||||||
| 1,463,066 | ||||||||
|
|
| ||||||
PRINTING, PUBLISHING AND BROADCASTING — 3.4% |
| |||||||
LABL, Inc., Initial Dollar Term Loan, 1st Lien 7.754%, LIBOR + 5.000%, 10/29/2028 (A) | 992,500 | 913,785 | ||||||
Magnite Inc., Initial Term Loan, 1st Lien 8.070%, LIBOR + 5.000%, 04/28/2028 | 197,917 | 185,052 | ||||||
Magnite, Inc., Initial Term Loan, 1st Lien 8.760%, LIBOR + 5.000%, 04/28/2028 (A) | 1,085,417 | 1,014,865 | ||||||
Magnite, Inc., Initial Term Loan, Tranche 3 8.570%, LIBOR + 5.000%, 04/28/2028 | 197,917 | 185,052 | ||||||
The accompanying notes are an integral part of the financial statements.
25
| The Advisors’ Inner Circle Fund III | Barrow Hanley | |
| Floating Rate Fund | ||
| October 31, 2022 |
| BANK LOAN OBLIGATIONS — (continued)
| ||||||||
| Face Amount | Value | |||||||
ThyssenKrupp Elevator, Term Loan, 1st Lien 7.760%, 09/01/2028 | $ | 1,485,000 | $ | 1,373,625 | ||||
|
|
| ||||||
| 3,672,379 | ||||||||
|
|
| ||||||
| RETAIL STORES — 6.3% |
| |||||||
Allied Universal Holdco LLC (f/k/a USAGM Holdco, LLC), Initial U.S. Dollar Term Loan, 1st Lien 7.504%, LIBOR + 3.750%, 05/12/2028 (A) | 962,769 | 871,912 | ||||||
Imperial Bag, Term Loan, 1st Lien 7.754%, 06/11/2026 | 2,481,250 | 2,375,797 | ||||||
Pet IQ, Term Loan, 1st Lien 7.662%, 04/07/2028 | 987,500 | 898,625 | ||||||
PetSmart LLC, Initial Term Loan, 1st Lien 7.500%, LIBOR + 3.750%, 02/11/2028 (A) | 987,500 | 948,415 | ||||||
Rent-A-Center, Inc., Initial Term Loan (2021), 1st Lien 7.688%, LIBOR + 3.250%, 02/17/2028 (A) | 985,000 | 902,506 | ||||||
Victoria’s Secret & Co., Initial Term Loan, 1st Lien 6.394%, LIBOR + 3.250%, 08/02/2028 (A) | 495,000 | 478,913 | ||||||
Woof Holdings, Inc., Term Loan, 1st Lien 10.815%, 12/21/2028 | 500,000 | 448,750 | ||||||
|
|
| ||||||
| 6,924,918 | ||||||||
|
|
| ||||||
| TELECOMMUNICATIONS — 2.1% |
| |||||||
Frontier Communications Holdings, LLC, TLB, 1st Lien 7.438%, LIBOR + 3.750%, 10/08/2027 (A) | 985,000 | 928,717 | ||||||
MetroNet Systems Holdings, LLC, 2021Term Loan, 1st Lien 7.145%, CME Term SOFR + 3.750%, 06/02/2028 (A) | 497,500 | 483,197 | ||||||
Osmosis Buyer Limited, Term B Loan B 7.844%, CME Term SOFR + 3.750%, 07/31/2028 | 1,000,000 | 929,580 | ||||||
|
|
| ||||||
| 2,341,494 | ||||||||
|
|
| ||||||
| BANK LOAN OBLIGATIONS — (continued)
| ||||||||
| Face Amount | Value | |||||||
| TRANSPORTATION — 0.4% |
| |||||||
Superior Industries, Closing Date Term Loan 7.754%, 05/22/2024 (A) | $ | 453,742 | $ | 432,475 | ||||
|
|
| ||||||
TOTAL BANK LOAN OBLIGATIONS (Cost $96,483,455) | 91,220,224 | |||||||
|
|
| ||||||
| CORPORATE OBLIGATIONS — 11.4%
| ||||||||
| COMMUNICATION SERVICES — 2.6% |
| |||||||
CCO Holdings 4.750%, 03/01/2030 (E) | 1,500,000 | 1,260,600 | ||||||
CSC Holdings 4.125%, 12/01/2030 (E) | 2,000,000 | 1,573,540 | ||||||
|
|
| ||||||
| 2,834,140 | ||||||||
|
|
| ||||||
| FINANCIALS — 1.5% |
| |||||||
Ken Garff Automotive 4.875%, 09/15/2028 (E) | 500,000 | 415,111 | ||||||
Nationstar Mortgage Holdings 5.750%, 11/15/2031 (E) | 1,000,000 | 767,120 | ||||||
Rithm Capital 6.250%, 10/15/2025 (E) | 500,000 | 438,785 | ||||||
|
|
| ||||||
| 1,621,016 | ||||||||
|
|
| ||||||
| HEALTH CARE — 0.8% |
| |||||||
AHP Health Partners 5.750%, 07/15/2029 (E) | 500,000 | 382,500 | ||||||
Bausch Health 5.250%, 01/30/2030 (E) | 1,000,000 | 387,500 | ||||||
Emergent BioSolutions 3.875%, 08/15/2028 (E) | 125,000 | 74,942 | ||||||
|
|
| ||||||
| 844,942 | ||||||||
|
|
| ||||||
| INDUSTRIALS — 4.3% |
| |||||||
AerCap Global Aviation Trust 6.500%, ICE LIBOR USD 3 Month + 4.300%, 06/15/2045 (A)(E) | 1,000,000 | 912,500 | ||||||
Allied Universal Holdco 4.625%, 06/01/2028 (E) | 1,000,000 | 836,534 | ||||||
Harsco 5.750%, 07/31/2027 (E) | 750,000 | 532,238 | ||||||
ILFC E-Capital Trust I 5.115%, 12/21/2065 (A)(E) | 1,700,000 | 1,037,000 | ||||||
The accompanying notes are an integral part of the financial statements.
26
| The Advisors’ Inner Circle Fund III | Barrow Hanley | |
| Floating Rate Fund | ||
| October 31, 2022 |
| CORPORATE OBLIGATIONS — (continued)
| ||||||||
| Face Amount | Value | |||||||
ILFC E-Capital Trust II 5.365%, 12/21/2065 (A)(E) | $ | 1,395,000 | $ | 906,750 | ||||
Waste Pro USA 5.500%, 02/15/2026 (E) | 500,000 | 462,705 | ||||||
|
|
| ||||||
| 4,687,727 | ||||||||
|
|
| ||||||
| INFORMATION TECHNOLOGY — 0.4% |
| |||||||
Entegris Escrow 5.950%, 06/15/2030 (E) | 500,000 | 456,250 | ||||||
|
|
| ||||||
MATERIALS — 1.8% |
| |||||||
Ardagh Metal Packaging Finance USA 4.000%, 09/01/2029 (E) | 500,000 | 379,295 | ||||||
Chemours 4.625%, 11/15/2029 (E) | 1,500,000 | 1,170,000 | ||||||
Pactiv Evergreen Group Issuer 4.375%, 10/15/2028 (E) | 500,000 | 437,500 | ||||||
|
|
| ||||||
| 1,986,795 | ||||||||
|
|
| ||||||
TOTAL CORPORATE OBLIGATIONS (Cost $14,105,808) | 12,430,870 | |||||||
|
|
| ||||||
| WARRANT — 0.0%
| ||||||||
| Number of Warrants | ||||||||
Service King*#(C) | ||||||||
Strike Price $– | 3,233 | 1,616 | ||||||
|
|
| ||||||
TOTAL WARRANT | ||||||||
(Cost $—) | 1,616 | |||||||
|
|
| ||||||
TOTAL INVESTMENTS— 95.0% |
| |||||||
(Cost $110,589,263) | $ | 103,652,710 | ||||||
|
|
| ||||||
Percentages are based on Net Assets of $109,156,139. |
| * | Non-income producing security. |
| # | Expiration date not available. |
| (A) | Variable or floating rate security. The rate shown is the effective interest rate as of period end. The rates on certain securities are not based on published reference rates and spreads and are either determined by the issuer or agent based on current market conditions; by using a formula based on the rates of underlying loans; or by adjusting periodically based on prevailing interest rates. |
| (B) | Unsettled bank loan. Interest rate may not be available. |
| (C) | Level 3 security in accordance with fair value hierarchy. |
| (D) | No interest rate available. |
| (E) | Security exempt from registration under Rule 144A of the Securities Act of 1933. These securities may be resold in transactions exempt from registration normally to qualified institutions. On October 31, 2022, the value of these securities amounted to $12,430,870, representing 11.4% of the Net Assets of the Fund. |
CME — Chicago Mercantile Exchange |
ICE — Intercontinental Exchange |
LLC — Limited Liability Company |
LIBOR — London Interbank Offered Rate |
LP — Limited Partnership |
Ltd. — Limited |
SOFR — Secured Overnight Financing Rate |
The following is a summary of the inputs used as of October 31, 2022 in valuing the Fund’s investments carried at value:
| Investments in Securities | Level 1 | Level 2 | Level 3(1) | Total | ||||||||||||
Bank Loan Obligations | $ | 909,562 | $ | 89,745,849 | $ | 564,813 | $ | 91,220,224 | ||||||||
Corporate Obligations | — | 12,430,870 | — | 12,430,870 | ||||||||||||
Warrant | — | — | 1,616 | 1,616 | ||||||||||||
Total Investments |
|
|
|
|
|
|
|
| ||||||||
in Securities | $ | 909,562 | $ | 102,176,719 | $ | 566,429 | $ | 103,652,710 | ||||||||
|
|
|
|
|
|
|
| |||||||||
| (1) | A reconciliation of Level 3 investments is presented when the fund has a significant amount of Level 3 investments at the end of the period in relation to net assets. Management has concluded that Level 3 investments are not material in relation to net assets. |
Amounts designated as “–” are $0.
For more information on valuation inputs, see Note 2 — Significant Accounting Policies in the Notes to Financial Statements.
The accompanying notes are an integral part of the financial statements.
27
| The Advisors’ Inner Circle Fund III | Barrow Hanley | |
| International Value Fund | ||
| October 31, 2022 |
SECTOR WEIGHTINGS † (UNAUDITED)
|
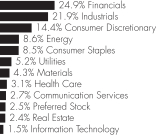
† Percentages are based on total investments.
SCHEDULE OF INVESTMENTS |
| |||||||
| COMMON STOCK — 95.4%
| ||||||||
| Shares | Value | |||||||
CANADA — 5.9% |
| |||||||
Enbridge | 4,300 | $ | 167,537 | |||||
Suncor Energy | 5,380 | 185,053 | ||||||
|
| |||||||
| 352,590 | ||||||||
|
| |||||||
CHINA — 3.6% |
| |||||||
BOC Hong Kong Holdings | 70,500 | 219,143 | ||||||
|
| |||||||
FRANCE — 10.5% |
| |||||||
Accor * | 5,165 | 123,729 | ||||||
Arkema | 504 | 39,906 | ||||||
Danone | 2,831 | 140,838 | ||||||
Thales | 923 | 117,349 | ||||||
Veolia Environnement | 5,051 | 112,761 | ||||||
Vinci | 1,047 | 96,413 | ||||||
|
| |||||||
| 630,996 | ||||||||
|
| |||||||
GERMANY — 7.5% |
| |||||||
Allianz | 715 | 128,742 | ||||||
Daimler Truck Holding * | 4,437 | 118,392 | ||||||
Deutsche Post | 2,612 | 92,695 | ||||||
Rheinmetall | 697 | 113,309 | ||||||
|
| |||||||
| 453,138 | ||||||||
|
| |||||||
HONG KONG — 5.5% |
| |||||||
ASMPT | 2,000 | 11,007 | ||||||
CK Infrastructure Holdings | 18,000 | 85,532 | ||||||
Hongkong Land Holdings | 36,300 | 139,755 | ||||||
Sino Biopharmaceutical | 195,000 | 94,648 | ||||||
|
| |||||||
| 330,942 | ||||||||
|
| |||||||
JAPAN — 13.3% |
| |||||||
Bridgestone | 3,800 | 137,030 | ||||||
Honda Motor | 4,300 | 97,541 | ||||||
Kirin Holdings | 7,700 | 113,381 | ||||||
Koito Manufacturing | 6,900 | 98,097 | ||||||
Komatsu | 4,600 | 88,105 | ||||||
Mitsubishi Electric | 10,700 | 94,267 | ||||||
| COMMON STOCK — 95.4%
| ||||||||
| Shares | Value | |||||||
Nabtesco | 6,167 | $ | 131,266 | |||||
NSK | 8,400 | 44,402 | ||||||
|
| |||||||
| 804,089 | ||||||||
|
| |||||||
MEXICO — 3.0% |
| |||||||
Grupo Financiero Banorte, Cl O | 22,100 | 179,908 | ||||||
|
| |||||||
NETHERLANDS — 9.2% |
| |||||||
Akzo Nobel | 2,210 | 136,371 | ||||||
ING Groep | 29,835 | 293,488 | ||||||
Randstad | 2,549 | 127,061 | ||||||
|
| |||||||
| 556,920 | ||||||||
|
| |||||||
NORWAY — 3.5% |
| |||||||
Aker BP | 4,830 | 153,967 | ||||||
Orkla | 8,432 | 56,904 | ||||||
|
| |||||||
| 210,871 | ||||||||
|
| |||||||
SINGAPORE — 5.7% |
| |||||||
Genting Singapore | 286,700 | 163,036 | ||||||
United Overseas Bank | 9,200 | 180,412 | ||||||
|
| |||||||
| 343,448 | ||||||||
|
| |||||||
SOUTH AFRICA — 1.3% |
| |||||||
Gold Fields | 9,735 | 78,696 | ||||||
|
| |||||||
SOUTH KOREA — 1.3% |
| |||||||
SK Hynix | 1,311 | 76,113 | ||||||
|
| |||||||
SWEDEN — 4.0% |
| |||||||
Elekta, Cl B | 17,618 | 89,516 | ||||||
SKF, Cl B | 10,615 | 153,632 | ||||||
|
| |||||||
| 243,148 | ||||||||
|
| |||||||
SWITZERLAND — 3.2% |
| |||||||
Julius Baer Group | 4,003 | 191,765 | ||||||
|
| |||||||
UNITED KINGDOM — 17.9% |
| |||||||
Ashmore Group PLC | 28,780 | 68,122 | ||||||
Associated British Foods PLC | 6,137 | 94,977 | ||||||
BAE Systems PLC | 12,362 | 115,456 | ||||||
Centrica PLC | 124,697 | 109,569 | ||||||
Coca-Cola Europacific Partners PLC | 2,021 | 95,088 | ||||||
HSBC Holdings PLC | 45,624 | 234,035 | ||||||
Informa PLC | 25,028 | 159,469 | ||||||
Legal & General Group PLC | 36,559 | 97,646 | ||||||
Persimmon PLC | 4,673 | 69,935 | ||||||
WH Smith PLC * | 2,367 | 31,949 | ||||||
|
| |||||||
| 1,076,246 | ||||||||
|
| |||||||
TOTAL COMMON STOCK | 5,748,013 | |||||||
|
| |||||||
PREFERRED STOCK — 2.4%
|
| |||||||
GERMANY — 2.4% |
| |||||||
Henkel & KGaA (A) | 2,281 | 143,773 | ||||||
|
| |||||||
The accompanying notes are an integral part of the financial statements.
28
| The Advisors’ Inner Circle Fund III | Barrow Hanley | |
| International Value Fund | ||
| October 31, 2022 |
| PREFERRED STOCK — (continued)
| ||||||||
| Value | ||||||||
TOTAL PREFERRED STOCK | $ | 143,773 | ||||||
|
| |||||||
TOTAL INVESTMENTS— 97.8% |
| $ | 5,891,786 | |||||
|
| |||||||
Percentages are based on Net Assets of $6,023,388.
| * | Non-income producing security. |
| (A) | There is currently no rate available. |
Cl — Class
PLC — Public Limited Company
As of October 31, 2022, all of the Fund’s investments were considered Level 1, in accordance with the authoritative guidance on fair value measurements and disclosure under U.S. generally accepted accounting principles.
For more information on valuation inputs, see Note 2 — Significant Accounting Policies in the Notes to Financial Statements.
The accompanying notes are an integral part of the financial statements.
29
| The Advisors’ Inner Circle Fund III | Barrow Hanley | |
| Total Return Bond Fund | ||
| October 31, 2022 |
SECTOR WEIGHTINGS † (UNAUDITED)
|
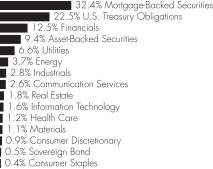
† Percentages are based on total investments.
SCHEDULE OF INVESTMENTS |
| |||||||
| CORPORATE OBLIGATIONS — 34.4%
| ||||||||
| Face Amount | Value | |||||||
COMMUNICATION SERVICES — 2.5% |
| |||||||
AT&T | ||||||||
2.250%, 02/01/2032 | $ | 90,000 | $ | 67,620 | ||||
Charter Communications Operating | ||||||||
3.700%, 04/01/2051 | 85,000 | 50,954 | ||||||
3.500%, 03/01/2042 | 95,000 | 59,358 | ||||||
2.800%, 04/01/2031 | 105,000 | 79,604 | ||||||
Comcast | ||||||||
3.400%, 04/01/2030 | 105,000 | 92,549 | ||||||
2.887%, 11/01/2051 | 103,000 | 61,878 | ||||||
1.950%, 01/15/2031 | 95,000 | 73,643 | ||||||
T-Mobile USA | ||||||||
3.875%, 04/15/2030 | 410,000 | 362,686 | ||||||
Verizon Communications | ||||||||
4.500%, 08/10/2033 | 60,000 | 53,456 | ||||||
3.400%, 03/22/2041 | 180,000 | 127,977 | ||||||
|
|
| ||||||
| 1,029,725 | ||||||||
|
|
| ||||||
CONSUMER DISCRETIONARY — 0.9% |
| |||||||
Anheuser-Busch InBev Worldwide | ||||||||
4.375%, 04/15/2038 | 55,000 | 46,965 | ||||||
AutoNation | ||||||||
3.850%, 03/01/2032 | 135,000 | 105,091 | ||||||
Marriott International | ||||||||
5.000%, 10/15/2027 | 90,000 | 86,622 | ||||||
Tractor Supply | ||||||||
1.750%, 11/01/2030 | 90,000 | 66,812 | ||||||
Whirlpool | ||||||||
4.600%, 05/15/2050 | 70,000 | 50,615 | ||||||
|
|
| ||||||
| 356,105 | ||||||||
|
|
| ||||||
CONSUMER STAPLES — 0.4% |
| |||||||
Coca-Cola Femsa | ||||||||
2.750%, 01/22/2030 | 130,000 | 109,630 | ||||||
| CORPORATE OBLIGATIONS — (continued)
| ||||||||
| Face Amount | Value | |||||||
Mondelez International | ||||||||
1.500%, 02/04/2031 | $ | 85,000 | $ | 62,625 | ||||
|
|
| ||||||
| 172,255 | ||||||||
|
|
| ||||||
ENERGY — 3.6% |
| |||||||
Cheniere Corpus Christi Holdings |
| |||||||
2.742%, 12/31/2039 | 115,000 | 85,334 | ||||||
Chevron USA | ||||||||
2.343%, 08/12/2050 | 85,000 | 50,308 | ||||||
ConocoPhillips | ||||||||
2.125%, 03/08/2024 | 175,000 | 168,504 | ||||||
Diamondback Energy | ||||||||
4.250%, 03/15/2052 | 105,000 | 75,805 | ||||||
3.125%, 03/24/2031 | 205,000 | 167,521 | ||||||
Enbridge | ||||||||
2.500%, 02/14/2025 | 110,000 | 102,783 | ||||||
Gray Oak Pipeline | ||||||||
2.000%, 09/15/2023 (A) | 100,000 | 96,776 | ||||||
Kinder Morgan | ||||||||
4.800%, 02/01/2033 | 50,000 | 44,658 | ||||||
MPLX | ||||||||
4.125%, 03/01/2027 | 85,000 | 78,804 | ||||||
1.750%, 03/01/2026 | 135,000 | 117,699 | ||||||
ONEOK | ||||||||
4.550%, 07/15/2028 | 95,000 | 86,212 | ||||||
Phillips 66 | ||||||||
3.750%, 03/01/2028 (A) | 130,000 | 116,910 | ||||||
Pioneer Natural Resources | ||||||||
2.150%, 01/15/2031 | 40,000 | 30,949 | ||||||
TotalEnergies Capital International | ||||||||
3.127%, 05/29/2050 | 90,000 | 59,398 | ||||||
Williams | ||||||||
5.400%, 03/04/2044 | 85,000 | 72,468 | ||||||
2.600%, 03/15/2031 | 175,000 | 137,112 | ||||||
|
|
| ||||||
| 1,491,241 | ||||||||
|
|
| ||||||
FINANCIALS — 12.3% |
| |||||||
American Express |
| |||||||
4.200%, 11/06/2025 | 135,000 | 131,053 | ||||||
American Honda Finance MTN | ||||||||
2.000%, 03/24/2028 | 80,000 | 67,235 | ||||||
Bank of America | ||||||||
2.592%, U.S. SOFR + 2.150%, 04/29/2031 (B) | 85,000 | 67,111 | ||||||
2.482%, US Treas Yield Curve Rate T Note Const Mat 5 Yr + 1.200%, 09/21/2036 (B) | 95,000 | 67,885 | ||||||
The accompanying notes are an integral part of the financial statements.
30
| The Advisors’ Inner Circle Fund III | Barrow Hanley | |
| Total Return Bond Fund | ||
| October 31, 2022 |
| CORPORATE OBLIGATIONS — (continued)
| ||||||||
| Face Amount | Value | |||||||
2.299%, U.S. SOFR + 1.220%, 07/21/2032 (B) | $ | 235,000 | $ | 174,023 | ||||
Bank of America MTN | ||||||||
5.000%, 01/21/2044 | 200,000 | 170,757 | ||||||
Barclays | ||||||||
2.894%, US Treas Yield Curve Rate T Note Const Mat 1 Yr + 1.300%, 11/24/2032 (B) | 200,000 | 141,611 | ||||||
Berkshire Hathaway Finance | ||||||||
3.850%, 03/15/2052 | 80,000 | 58,679 | ||||||
Charles Schwab | ||||||||
3.250%, 05/22/2029 | 85,000 | 75,151 | ||||||
0.750%, 03/18/2024 | 65,000 | 61,307 | ||||||
Citigroup | ||||||||
4.412%, U.S. SOFR + 3.914%, 03/31/2031 (B) | 350,000 | 312,329 | ||||||
1.281%, U.S. SOFR + 0.528%, 11/03/2025 (B) | 60,000 | 54,369 | ||||||
CME Group | ||||||||
2.650%, 03/15/2032 | 175,000 | 140,792 | ||||||
CNA Financial | ||||||||
4.500%, 03/01/2026 | 110,000 | 106,102 | ||||||
Deutsche Bank NY | ||||||||
3.035%, U.S. SOFR + 1.718%, 05/28/2032 (B) | 140,000 | 98,472 | ||||||
2.311%, U.S. SOFR + 1.219%, 11/16/2027 (B) | 120,000 | 95,785 | ||||||
Fidelity National Financial | ||||||||
3.200%, 09/17/2051 | 90,000 | 48,145 | ||||||
Glencore Funding | ||||||||
2.625%, 09/23/2031 (A) | 85,000 | 63,731 | ||||||
Goldman Sachs Group | ||||||||
2.615%, U.S. SOFR + 1.281%, 04/22/2032 (B) | 75,000 | 57,207 | ||||||
1.542%, U.S. SOFR + 0.818%, 09/10/2027 (B) | 145,000 | 121,685 | ||||||
1.431%, U.S. SOFR + 0.798%, 03/09/2027 (B) | 180,000 | 153,994 | ||||||
Intercontinental Exchange | ||||||||
4.950%, 06/15/2052 | 90,000 | 77,073 | ||||||
JPMorgan Chase | ||||||||
3.882%, ICE LIBOR USD 3 Month + 1.360%, 07/24/2038 (B) | 145,000 | 112,339 | ||||||
| CORPORATE OBLIGATIONS — (continued)
| ||||||||
| Face Amount | Value | |||||||
3.782%, ICE LIBOR USD 3 Month + 1.337%, 02/01/2028 (B) | $ | 150,000 | $ | 137,032 | ||||
2.963%, U.S. SOFR + 1.260%, 01/25/2033 (B) | 135,000 | 105,467 | ||||||
2.301%, U.S. SOFR + 1.160%, 10/15/2025 (B) | 235,000 | 219,189 | ||||||
Mitsubishi UFJ Financial Group | ||||||||
2.193%, 02/25/2025 | 115,000 | 106,079 | ||||||
Moody’s | ||||||||
2.550%, 08/18/2060 | 75,000 | 38,417 | ||||||
Morgan Stanley MTN | ||||||||
3.591%, ICE LIBOR USD 3 Month + 1.340%, 07/22/2028 (B) | 155,000 | 138,923 | ||||||
2.239%, U.S. SOFR + 1.178%, 07/21/2032 (B) | 90,000 | 66,343 | ||||||
1.794%, U.S. SOFR + 1.034%, 02/13/2032 (B) | 170,000 | 122,593 | ||||||
0.864%, U.S. SOFR + 0.745%, 10/21/2025 (B) | 160,000 | 144,315 | ||||||
Northern Trust | ||||||||
6.125%, 11/02/2032 | 95,000 | 95,077 | ||||||
PNC Financial Services Group | ||||||||
3.400%, US Treas Yield Curve Rate T Note Const Mat 5 Yr + 2.595%(B)(C) | 135,000 | 100,744 | ||||||
Progressive | ||||||||
2.500%, 03/15/2027 | 85,000 | 75,852 | ||||||
Royal Bank of Canada MTN | ||||||||
2.250%, 11/01/2024 | 195,000 | 183,213 | ||||||
State Street | ||||||||
2.354%, U.S. SOFR + 0.940%, 11/01/2025 (B) | 135,000 | 126,873 | ||||||
2.200%, 03/03/2031 | 80,000 | 61,265 | ||||||
Toronto-Dominion Bank MTN | ||||||||
3.250%, 03/11/2024 | 270,000 | 262,506 | ||||||
Toyota Motor Credit | ||||||||
2.500%, 03/22/2024 | 175,000 | 169,108 | ||||||
Truist Financial MTN | ||||||||
1.267%, U.S. SOFR + 0.609%, 03/02/2027 (B) | 80,000 | 69,092 | ||||||
US Bancorp | ||||||||
4.967%, U.S. SOFR + 2.110%, 07/22/2033 (B) | 90,000 | 81,956 | ||||||
The accompanying notes are an integral part of the financial statements.
31
| The Advisors’ Inner Circle Fund III | Barrow Hanley | |
| Total Return Bond Fund | ||
| October 31, 2022 |
| CORPORATE OBLIGATIONS — (continued)
| ||||||||
| Face Amount | Value | |||||||
Wells Fargo | ||||||||
5.375%, 11/02/2043 | $ | 90,000 | $ | 76,342 | ||||
Wells Fargo MTN | ||||||||
2.572%, U.S. SOFR + 1.262%, 02/11/2031 (B) | 235,000 | 187,272 | ||||||
|
|
| ||||||
| 5,024,493 | ||||||||
|
|
| ||||||
HEALTH CARE — 1.1% |
| |||||||
Amgen |
| |||||||
4.400%, 05/01/2045 | 85,000 | 68,581 | ||||||
Bristol-Myers Squibb | ||||||||
3.400%, 07/26/2029 | 39,000 | 35,428 | ||||||
Children’s Health System of Texas | ||||||||
2.511%, 08/15/2050 | 90,000 | 49,941 | ||||||
Community Health Network | ||||||||
3.099%, 05/01/2050 | 120,000 | 70,577 | ||||||
CVS Health | ||||||||
4.300%, 03/25/2028 | 53,000 | 49,731 | ||||||
Health Care Service A Mutual Legal Reserve | ||||||||
3.200%, 06/01/2050 (A) | 65,000 | 41,450 | ||||||
Kaiser Foundation Hospitals | ||||||||
3.002%, 06/01/2051 | 70,000 | 43,249 | ||||||
UnitedHealth Group | ||||||||
5.875%, 02/15/2053 | 100,000 | 102,060 | ||||||
|
|
| ||||||
| 461,017 | ||||||||
|
|
| ||||||
INDUSTRIALS — 2.7% |
| |||||||
AerCap Ireland Capital DAC | ||||||||
3.000%, 10/29/2028 | 230,000 | 185,810 | ||||||
American Airlines 2019-1 Class AA Pass Through Trust | ||||||||
3.150%, 02/15/2032 | 86,443 | 70,734 | ||||||
Bayer US Finance II | ||||||||
4.250%, 12/15/2025 (A) | 75,000 | 71,709 | ||||||
Boeing | ||||||||
5.805%, 05/01/2050 | 90,000 | 77,405 | ||||||
Burlington Northern Santa Fe | ||||||||
4.450%, 01/15/2053 | 90,000 | 75,516 | ||||||
Canadian Pacific Railway | ||||||||
3.100%, 12/02/2051 | 130,000 | 82,695 | ||||||
Cargill | ||||||||
1.375%, 07/23/2023 (A) | 65,000 | 63,257 | ||||||
Carlisle | ||||||||
2.200%, 03/01/2032 | 90,000 | 66,180 | ||||||
FedEx | ||||||||
3.250%, 05/15/2041 | 75,000 | 49,742 | ||||||
Quanta Services | ||||||||
3.050%, 10/01/2041 | 100,000 | 61,136 | ||||||
2.900%, 10/01/2030 | 140,000 | 110,506 | ||||||
Union Pacific | ||||||||
4.100%, 09/15/2067 | 85,000 | 61,516 | ||||||
| CORPORATE OBLIGATIONS — (continued)
| ||||||||
| Face Amount | Value | |||||||
Waste Connections | ||||||||
4.200%, 01/15/2033 | $ | 90,000 | $ | 81,390 | ||||
2.200%, 01/15/2032 | 90,000 | 69,244 | ||||||
|
|
| ||||||
| 1,126,840 | ||||||||
|
|
| ||||||
INFORMATION TECHNOLOGY — 1.6% |
| |||||||
Apple |
| |||||||
3.950%, 08/08/2052 | 85,000 | 67,473 | ||||||
Dell International | ||||||||
5.300%, 10/01/2029 | 235,000 | 220,003 | ||||||
3.450%, 12/15/2051 (A) | 95,000 | 53,755 | ||||||
Lam Research | ||||||||
3.750%, 03/15/2026 | 50,000 | 47,938 | ||||||
1.900%, 06/15/2030 | 90,000 | 70,619 | ||||||
Oracle | ||||||||
4.300%, 07/08/2034 | 120,000 | 98,705 | ||||||
VMware | ||||||||
2.200%, 08/15/2031 | 120,000 | 87,344 | ||||||
|
|
| ||||||
| 645,837 | ||||||||
|
|
| ||||||
MATERIALS — 1.0% |
| |||||||
Berry Global | ||||||||
1.650%, 01/15/2027 | 105,000 | 86,524 | ||||||
EI du Pont de Nemours | ||||||||
1.700%, 07/15/2025 | 90,000 | 82,408 | ||||||
International Paper | ||||||||
6.000%, 11/15/2041 | 75,000 | 69,893 | ||||||
Martin Marietta Materials | ||||||||
0.650%, 07/15/2023 | 80,000 | 77,380 | ||||||
Teck Resources | ||||||||
6.000%, 08/15/2040 | 125,000 | 110,009 | ||||||
|
|
| ||||||
| 426,214 | ||||||||
|
|
| ||||||
REAL ESTATE — 1.8% |
| |||||||
Alexandria Real Estate Equities | ||||||||
1.875%, 02/01/2033 | 90,000 | 62,288 | ||||||
American Tower | ||||||||
2.300%, 09/15/2031 | 125,000 | 93,057 | ||||||
Camden Property Trust | ||||||||
3.150%, 07/01/2029 | 75,000 | 64,279 | ||||||
Crown Castle | ||||||||
3.800%, 02/15/2028 | 105,000 | 94,651 | ||||||
2.900%, 04/01/2041 | 85,000 | 53,917 | ||||||
Digital Realty Trust | ||||||||
3.700%, 08/15/2027 | 115,000 | 104,688 | ||||||
Prologis | ||||||||
1.250%, 10/15/2030 | 70,000 | 51,242 | ||||||
Public Storage | ||||||||
2.250%, 11/09/2031 | 180,000 | 138,162 | ||||||
TELUS | ||||||||
3.400%, 05/13/2032 | 85,000 | 69,667 | ||||||
|
|
| ||||||
| 731,951 | ||||||||
|
|
| ||||||
UTILITIES — 6.5% |
| |||||||
American Electric Power | ||||||||
2.031%, 03/15/2024 | 160,000 | 152,744 | ||||||
The accompanying notes are an integral part of the financial statements.
32
| The Advisors’ Inner Circle Fund III | Barrow Hanley | |
| Total Return Bond Fund | ||
| October 31, 2022 |
| CORPORATE OBLIGATIONS — (continued)
| ||||||||
| Face Amount | Value | |||||||
Appalachian Power | ||||||||
4.500%, 03/01/2049 | $ | 50,000 | $ | 38,711 | ||||
Consumers Energy | ||||||||
2.500%, 05/01/2060 | 115,000 | 60,236 | ||||||
DTE Energy | ||||||||
1.050%, 06/01/2025 | 175,000 | 156,244 | ||||||
Duke Energy | ||||||||
2.650%, 09/01/2026 | 110,000 | 99,466 | ||||||
Duke Energy Progress | ||||||||
4.150%, 12/01/2044 | 130,000 | 101,178 | ||||||
Duke Energy Progress NC Storm Funding | ||||||||
2.387%, 07/01/2037 | 360,000 | 280,445 | ||||||
Entergy | ||||||||
2.800%, 06/15/2030 | 60,000 | 48,185 | ||||||
Entergy Arkansas | ||||||||
3.350%, 06/15/2052 | 80,000 | 51,930 | ||||||
Entergy Louisiana | ||||||||
4.000%, 03/15/2033 | 95,000 | 82,881 | ||||||
Exelon | ||||||||
4.050%, 04/15/2030 | 95,000 | 85,230 | ||||||
Florida Power & Light | ||||||||
3.950%, 03/01/2048 | 65,000 | 50,300 | ||||||
Kentucky Utilities | ||||||||
3.300%, 06/01/2050 | 90,000 | 59,142 | ||||||
National Fuel Gas | ||||||||
3.950%, 09/15/2027 | 135,000 | 119,293 | ||||||
National Rural Utilities Cooperative Finance | ||||||||
5.450%, 10/30/2025 | 115,000 | 115,522 | ||||||
National Rural Utilities Cooperative Finance MTN | ||||||||
1.000%, 10/18/2024 | 95,000 | 87,379 | ||||||
Northern States Power | ||||||||
2.600%, 06/01/2051 | 90,000 | 53,582 | ||||||
Ohio Power | ||||||||
2.600%, 04/01/2030 | 90,000 | 73,594 | ||||||
Oklahoma Gas and Electric | ||||||||
0.553%, 05/26/2023 | 125,000 | 121,843 | ||||||
Sabine Pass Liquefaction | ||||||||
4.500%, 05/15/2030 | 65,000 | 59,286 | ||||||
4.200%, 03/15/2028 | 275,000 | 250,755 | ||||||
Sempra Energy | ||||||||
3.300%, 04/01/2025 | 165,000 | 156,225 | ||||||
Sempra Global | ||||||||
3.250%, 01/15/2032 (A) | 105,000 | 82,182 | ||||||
Southern California Gas | ||||||||
2.550%, 02/01/2030 | 75,000 | 61,968 | ||||||
Vistra Operations | ||||||||
5.125%, 05/13/2025 (A) | 210,000 | 202,717 | ||||||
|
|
| ||||||
| 2,651,038 | ||||||||
|
|
| ||||||
TOTAL CORPORATE OBLIGATIONS | 14,116,716 | |||||||
|
|
| ||||||
| MORTGAGE-BACKED SECURITIES — 31.8%
| ||||||||
| Face Amount | Value | |||||||
| AGENCY MORTGAGE BACKED SECURITIES — 30.4% |
| |||||||
FHLMC | ||||||||
5.000%, 11/01/2023 | $ | 12 | $ | 12 | ||||
4.000%, 06/01/2042 to 04/01/2048 | 547,766 | 505,219 | ||||||
3.500%, 09/01/2028 to 01/01/2048 | 382,763 | 346,625 | ||||||
3.000%, 11/01/2032 to 11/01/2049 | 494,998 | 433,727 | ||||||
2.500%, 06/01/2035 to 05/01/2052 | 1,101,428 | 930,478 | ||||||
2.000%, 01/01/2041 | 180,265 | 149,002 | ||||||
FNMA | ||||||||
5.500%, 12/01/2035 | 5,129 | 5,076 | ||||||
5.000%, 05/01/2040 to 03/01/2042 | 73,682 | 73,759 | ||||||
4.500%, 04/01/2034 to 10/01/2049 | 452,965 | 432,500 | ||||||
4.000%, 11/01/2044 to 11/01/2049 | 578,988 | 538,574 | ||||||
3.500%, 06/01/2037 to 07/01/2051 | 1,528,698 | 1,370,156 | ||||||
3.000%, 10/01/2034 to 11/01/2051 | 1,727,510 | 1,491,339 | ||||||
2.500%, 11/01/2041 to 02/01/2052 | 1,543,287 | 1,275,559 | ||||||
2.000%, 11/01/2035 to 04/01/2051 | 1,792,584 | 1,479,767 | ||||||
GNMA | ||||||||
5.000%, 10/15/2039 to 03/20/2050 | 340,195 | 336,669 | ||||||
4.500%, 02/20/2050 | 63,848 | 61,256 | ||||||
4.000%, 12/20/2047 to 03/20/2052 | 661,868 | 611,912 | ||||||
3.500%, 09/15/2041 to 01/20/2052 | 431,785 | 392,523 | ||||||
3.000%, 06/20/2051 to 06/20/2052 | 1,065,759 | 933,978 | ||||||
2.500%, 04/20/2050 to 04/20/2052 | 1,262,344 | 1,073,627 | ||||||
|
|
| ||||||
| 12,441,758 | ||||||||
|
|
| ||||||
| COMMERCIAL MORTGAGE-BACKED SECURITIES — 1.1% |
| |||||||
BX Commercial Mortgage Trust, Ser VOLT, Cl A | ||||||||
4.112%, ICE LIBOR USD 1 Month + 0.700%, 09/15/2036 (A)(B) | 250,000 | 237,473 | ||||||
Cold Storage Trust, Ser ICE5, Cl A | ||||||||
4.312%, ICE LIBOR USD 1 Month + 0.900%, 11/15/2037 (A)(B) | 201,513 | 195,351 | ||||||
|
|
| ||||||
| 432,824 | ||||||||
|
|
| ||||||
The accompanying notes are an integral part of the financial statements.
33
| The Advisors’ Inner Circle Fund III | Barrow Hanley | |
| Total Return Bond Fund | ||
| October 31, 2022 |
| MORTGAGE-BACKED SECURITIES — (continued)
| ||||||||
| Face Amount | Value | |||||||
| NON-AGENCY MORTGAGE-BACKED SECURITY — 0.3% |
| |||||||
Seasoned Loans Structured Transaction Trust, Ser 2020-3, Cl A1C | ||||||||
2.000%, 11/25/2030 | $ | 158,200 | $ | 140,641 | ||||
|
|
| ||||||
TOTAL MORTGAGE-BACKED SECURITIES | 13,015,223 | |||||||
|
|
| ||||||
| U.S. TREASURY OBLIGATIONS — 22.0%
| ||||||||
U.S. Treasury Bonds | ||||||||
2.875%, 05/15/2052 | 280,000 | 217,306 | ||||||
2.250%, 05/15/2041 | 1,380,000 | 995,055 | ||||||
1.750%, 08/15/2041 | 245,000 | 159,901 | ||||||
1.375%, 08/15/2050 | 2,775,000 | 1,479,314 | ||||||
U.S. Treasury Notes | ||||||||
1.500%, 01/31/2027 | 1,110,000 | 989,201 | ||||||
1.500%, 02/15/2030 | 1,270,000 | 1,063,972 | ||||||
1.250%, 07/31/2023 | 1,245,000 | 1,213,875 | ||||||
1.250%, 08/31/2024 | 1,805,000 | 1,700,366 | ||||||
1.125%, 02/28/2025 | 1,315,000 | 1,218,327 | ||||||
|
|
| ||||||
TOTAL U.S. TREASURY OBLIGATIONS |
| 9,037,317 | ||||||
|
|
| ||||||
| ASSET-BACKED SECURITIES — 9.2%
| ||||||||
| AUTOMOTIVE — 5.4% |
| |||||||
Ally Auto Receivables Trust, Ser 2022-1, Cl A3 | ||||||||
3.310%, 11/15/2026 | 155,000 | 150,282 | ||||||
AmeriCredit Automobile Receivables Trust, Ser 2021-1, Cl A3 | ||||||||
0.370%, 08/18/2025 | 112,613 | 110,381 | ||||||
AmeriCredit Automobile Receivables Trust, Ser 2021-2, Cl A3 | ||||||||
0.340%, 12/18/2026 | 125,000 | 120,459 | ||||||
AmeriCredit Automobile Receivables Trust, Ser 2022-2, Cl A3 | ||||||||
4.380%, 04/18/2028 | 130,000 | 127,059 | ||||||
BMW Vehicle Owner Trust, Ser 2022-A, Cl A3 | ||||||||
3.210%, 08/25/2026 | 80,000 | 77,359 | ||||||
Ford Credit Auto Lease Trust, Ser 2022-A, Cl A3 | ||||||||
3.230%, 05/15/2025 | 200,000 | 194,984 | ||||||
Ford Credit Auto Owner Trust, Ser 2021-2, Cl A | ||||||||
1.530%, 05/15/2034 (A) | 205,000 | 177,418 | ||||||
GM Financial Automobile Leasing Trust, Ser 2022-1, Cl A3 | ||||||||
1.900%, 03/20/2025 | 145,000 | 139,163 | ||||||
| ASSET-BACKED SECURITIES — (continued)
| ||||||||
| Face Amount | Value | |||||||
GM Financial Consumer Automobile Receivables Trust, Ser 2020-2, Cl A3 | ||||||||
1.490%, 12/16/2024 | $ | 24,945 | $ | 24,647 | ||||
GM Financial Revolving Receivables Trust, Ser 2021-1, Cl A | ||||||||
1.170%, 06/12/2034 (A) | 155,000 | 132,745 | ||||||
Honda Auto Receivables Owner Trust, Ser 2022-1, Cl A3 | ||||||||
1.880%, 05/15/2026 | 165,000 | 156,179 | ||||||
Mercedes-Benz Auto Lease Trust, Ser 2021-B, Cl A3 | ||||||||
0.400%, 11/15/2024 | 275,000 | 264,781 | ||||||
Toyota Auto Loan Extended Note Trust, Ser 2020-1A, Cl A | ||||||||
1.350%, 05/25/2033 (A) | 215,000 | 193,243 | ||||||
Toyota Auto Receivables Owner Trust, Ser 2020-B, Cl A3 | ||||||||
1.360%, 08/15/2024 | 79,401 | 78,392 | ||||||
Toyota Auto Receivables Owner Trust, Ser 2022-A, Cl A3 | ||||||||
1.230%, 06/15/2026 | 130,000 | 122,826 | ||||||
Volkswagen Auto Loan Enhanced Trust, Ser 2021-1, Cl A3 1.020%, 06/22/2026 | 150,000 | 141,437 | ||||||
|
|
| ||||||
| 2,211,355 | ||||||||
|
|
| ||||||
| CREDIT CARD — 0.5% |
| |||||||
Capital One Multi-Asset Execution Trust, Ser 2021-A1, Cl A1 0.550%, 07/15/2026 | 210,000 | 194,986 | ||||||
|
|
| ||||||
| OTHER ASSET-BACKED SECURITIES — 3.3% |
| |||||||
CNH Equipment Trust, Ser 2020-A, Cl A3 1.160%, 06/16/2025 | 73,444 | 72,136 | ||||||
CNH Equipment Trust, Ser 2021-A, Cl A3 0.400%, 12/15/2025 | 175,000 | 167,504 | ||||||
John Deere Owner Trust, Ser 2022-A, Cl A3 2.320%, 09/16/2026 | 120,000 | 114,063 | ||||||
John Deere Owner Trust, Ser 2022-B, Cl A3 3.740%, 02/16/2027 | 145,000 | 140,943 | ||||||
New Economy Assets Phase 1 Sponsor, Ser 2021-1, Cl A1 1.910%, 10/20/2061 (A) | 235,000 | 196,898 | ||||||
The accompanying notes are an integral part of the financial statements.
34
| The Advisors’ Inner Circle Fund III | Barrow Hanley | |
| Total Return Bond Fund | ||
| October 31, 2022 |
| ASSET-BACKED SECURITIES — (continued)
| ||||||||
| Face Amount | Value | |||||||
PSNH Funding 3, Ser 2018-1, Cl A1 3.094%, 02/01/2026 | $ | 66,309 | $ | 65,433 | ||||
Taco Bell Funding, Ser 2021-1A, Cl A2II | ||||||||
2.294%, 08/25/2051 (A) | 178,650 | 139,331 | ||||||
Verizon Master Trust, Ser 2021-1, Cl A | ||||||||
0.500%, 05/20/2027 | 365,000 | 339,264 | ||||||
Wendy’s Funding, Ser 2021-1A, Cl A2I | ||||||||
2.370%, 06/15/2051 (A) | 177,750 | 137,715 | ||||||
|
|
| ||||||
| 1,373,287 | ||||||||
|
|
| ||||||
TOTAL ASSET-BACKED SECURITIES (Cost $3,941,823) | 3,779,628 | |||||||
|
|
| ||||||
| SOVEREIGN BONDS — 0.5%
| ||||||||
| MEXICO — 0.2% |
| |||||||
Mexico Government International Bond | ||||||||
4.600%, 01/23/2046 | 125,000 | 90,796 | ||||||
|
|
| ||||||
| PANAMA — 0.3% |
| |||||||
Panama Government International Bond | ||||||||
3.160%, 01/23/2030 | 120,000 | 97,652 | ||||||
|
|
| ||||||
TOTAL SOVEREIGN BONDS | 188,448 | |||||||
|
|
| ||||||
TOTAL INVESTMENTS— 97.9% |
| $ | 40,137,332 | |||||
|
|
| ||||||
Percentages are based on Net Assets of $40,986,021. |
| (A) | Security exempt from registration under Rule 144A of the Securities Act of 1933. These securities may be resold in transactions exempt from registration normally to qualified institutions. On October 31, 2022, the value of these securities amounted to $2,202,661, representing 5.4% of the Net Assets of the Fund. |
| (B) | Variable or floating rate security. The rate shown is the effective interest rate as of period end. The rates on certain securities are not based on published reference rates and spreads and are either determined by the issuer or agent based on current market conditions; by using a formula based on the rates of underlying loans; or by adjusting periodically based on prevailing interest rates. |
| (C) | Perpetual security with no stated maturity date. |
Cl — Class
FHLMC — Federal Home Loan Mortgage Corporation
FNMA — Federal National Mortgage Association
GNMA — Government National Mortgage Association
ICE — Intercontinental Exchange
LIBOR — London Interbank Offered Rate
MTN — Medium Term Note
Ser — Series
As of October 31, 2022, all of the Fund’s investments were considered Level 2, in accordance with the authoritative guidance on fair value measurements and disclosure under U.S. generally accepted accounting principles.
For more information on valuation inputs, see Note 2 — Significant Accounting Policies in the Notes to Financial Statements.
The accompanying notes are an integral part of the financial statements.
35
| The Advisors’ Inner Circle Fund III | Barrow Hanley | |
| US Value Opportunities Fund | ||
| October 31, 2022 |
SECTOR WEIGHTINGS † (UNAUDITED)
|
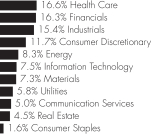
† Percentages are based on total investments.
SCHEDULE OF INVESTMENTS |
| |||||||
| COMMON STOCK — 92.3%
| ||||||||
| Shares | Value | |||||||
COMMUNICATION SERVICES — 4.6% |
| |||||||
Altice USA, Cl A * | 46,223 | $ | 305,534 | |||||
Comcast, Cl A | 28,802 | 914,175 | ||||||
Electronic Arts | 12,782 | 1,610,021 | ||||||
T-Mobile US * | 13,064 | 1,979,980 | ||||||
|
| |||||||
| 4,809,710 | ||||||||
|
| |||||||
CONSUMER DISCRETIONARY — 10.8% |
| |||||||
Advance Auto Parts | 8,121 | 1,542,340 | ||||||
Aptiv PLC * | 10,645 | 969,440 | ||||||
Aramark | 43,266 | 1,579,209 | ||||||
Dollar General | 7,261 | 1,851,918 | ||||||
Las Vegas Sands * | 42,360 | 1,610,104 | ||||||
Lithia Motors, Cl A | 2,519 | 499,140 | ||||||
Marriott Vacations Worldwide | 5,901 | 871,932 | ||||||
MGM Resorts International | 26,395 | 938,870 | ||||||
SeaWorld Entertainment * | 23,494 | 1,366,411 | ||||||
|
| |||||||
| 11,229,364 | ||||||||
|
| |||||||
CONSUMER STAPLES — 1.4% |
| |||||||
Philip Morris International | 16,493 | 1,514,882 | ||||||
|
| |||||||
ENERGY — 7.7% |
| |||||||
Halliburton | 43,898 | 1,598,765 | ||||||
Hess | 18,663 | 2,632,976 | ||||||
Phillips 66 | 15,643 | 1,631,409 | ||||||
Pioneer Natural Resources | 8,495 | 2,178,203 | ||||||
|
| |||||||
| 8,041,353 | ||||||||
|
| |||||||
| FINANCIALS — 15.0% | ||||||||
Allstate | 10,766 | 1,359,207 | ||||||
American Express | 5,869 | 871,253 | ||||||
American International Group | 27,205 | 1,550,685 | ||||||
Axis Capital Holdings | 19,304 | 1,055,350 | ||||||
Berkshire Hathaway, Cl B * | 5,209 | 1,537,124 | ||||||
Chubb | 7,319 | 1,572,780 | ||||||
Jefferies Financial Group | 39,015 | 1,342,506 | ||||||
M&T Bank | 10,803 | 1,818,901 | ||||||
Northern Trust | 13,188 | 1,112,408 | ||||||
US Bancorp | 20,018 | 849,764 | ||||||
| COMMON STOCK — (continued)
| ||||||||
| Shares | Value | |||||||
Wells Fargo | 22,339 | $ | 1,027,370 | |||||
Willis Towers Watson PLC | 7,193 | 1,569,585 | ||||||
|
| |||||||
| 15,666,933 | ||||||||
|
| |||||||
HEALTH CARE — 15.4% |
| |||||||
CVS Health | 15,018 | 1,422,204 | ||||||
Elevance Health | 4,265 | 2,331,974 | ||||||
Envista Holdings * | 28,272 | 933,259 | ||||||
Hologic * | 16,477 | 1,117,141 | ||||||
Humana | 3,421 | 1,909,192 | ||||||
LivaNova PLC * | 15,768 | 742,673 | ||||||
Medtronic PLC | 14,052 | 1,227,302 | ||||||
Merck | 23,621 | 2,390,445 | ||||||
Perrigo PLC | 41,550 | 1,673,634 | ||||||
UnitedHealth Group | 4,116 | 2,284,997 | ||||||
|
| |||||||
| 16,032,821 | ||||||||
|
| |||||||
INDUSTRIALS — 14.2% |
| |||||||
AECOM | 20,956 | 1,577,568 | ||||||
AerCap Holdings * | 16,996 | 907,756 | ||||||
BWX Technologies | 27,953 | 1,592,762 | ||||||
CACI International, Cl A * | 4,997 | 1,519,238 | ||||||
Deere | 4,714 | 1,865,895 | ||||||
JB Hunt Transport Services | 9,729 | 1,664,340 | ||||||
MDU Resources Group | 48,134 | 1,370,856 | ||||||
Raytheon Technologies | 19,240 | 1,824,337 | ||||||
Stanley Black & Decker | 7,396 | 580,512 | ||||||
Vertiv Holdings, Cl A | 133,534 | 1,910,872 | ||||||
|
| |||||||
| 14,814,136 | ||||||||
|
| |||||||
INFORMATION TECHNOLOGY — 6.9% |
| |||||||
Broadcom | 3,149 | 1,480,408 | ||||||
Cognizant Technology Solutions, Cl A | 10,863 | 676,222 | ||||||
Fidelity National Information Services | 16,033 | 1,330,579 | ||||||
Microchip Technology | 15,844 | 978,208 | ||||||
Oracle | 19,816 | 1,547,035 | ||||||
QUALCOMM | 10,297 | 1,211,545 | ||||||
|
| |||||||
| 7,223,997 | ||||||||
|
| |||||||
MATERIALS — 6.7% |
| |||||||
Air Products and Chemicals | 6,377 | 1,596,801 | ||||||
Axalta Coating Systems * | 57,041 | 1,330,196 | ||||||
Corteva | 12,684 | 828,772 | ||||||
DuPont de Nemours | 15,228 | 871,042 | ||||||
Element Solutions | 70,188 | 1,207,233 | ||||||
International Flavors & Fragrances | 12,011 | 1,172,394 | ||||||
|
| |||||||
| 7,006,438 | ||||||||
|
| |||||||
REAL ESTATE — 4.2% |
| |||||||
Corporate Office Properties Trust ‡ | 54,040 | 1,440,166 | ||||||
Howard Hughes * | 10,860 | 666,261 | ||||||
VICI Properties ‡ | 69,829 | 2,235,925 | ||||||
|
| |||||||
| 4,342,352 | ||||||||
|
| |||||||
The accompanying notes are an integral part of the financial statements.
36
| The Advisors’ Inner Circle Fund III | Barrow Hanley | |
| US Value Opportunities Fund | ||
| October 31, 2022 |
| COMMON STOCK — (continued)
| ||||||||
| Shares | Value | |||||||
UTILITIES — 5.4% |
| |||||||
CenterPoint Energy | 48,856 | $ | 1,397,770 | |||||
Entergy | 12,843 | 1,375,999 | ||||||
Exelon | 31,546 | 1,217,360 | ||||||
Pinnacle West Capital | 24,277 | 1,631,657 | ||||||
|
| |||||||
| 5,622,786 | ||||||||
|
| |||||||
TOTAL COMMON STOCK | 96,304,772 | |||||||
|
| |||||||
TOTAL INVESTMENTS— 92.3% |
| $ | 96,304,772 | |||||
|
| |||||||
Percentages are based on Net Assets of $104,306,219. |
| * | Non-income producing security. |
| ‡ | Real Estate Investment Trust. |
Cl — Class
PLC — Public Limited Company
As of October 31, 2022, all of the Fund’s investments were considered Level 1, in accordance with the authoritative guidance on fair value measurements and disclosure under U.S. generally accepted accounting principles.
For more information on valuation inputs, see Note 2 — Significant Accounting Policies in the Notes to Financial Statements.
The accompanying notes are an integral part of the financial statements.
37
| The Advisors’ Inner Circle Fund III | Barrow Hanley Funds | |
| October 31, 2022 |
| STATEMENTS OF ASSETS AND LIABILITIES |
| Concentrated Emerging Markets ESG Opportunities Fund | Credit Opportunities Fund | Emerging Markets Value Fund | Floating Rate Fund | |||||||||||||
Assets: | ||||||||||||||||
Investments in securities at value† | $ | 5,133,727 | $ | 67,386,469 | $ | 2,133,022 | $ | 103,652,710 | ||||||||
Affiliated investments at value†† | – | 24,799,011 | – | – | ||||||||||||
Foreign currency††† | 7,075 | – | 2,588 | – | ||||||||||||
Cash | 5,791 | 3,987,182 | 16,094 | 4,362,194 | ||||||||||||
Deferred offering cost (See Note 2) | 14,698 | 14,698 | 14,223 | 14,698 | ||||||||||||
Receivable due from Investment Adviser | 13,189 | 13,375 | 20,925 | 34,101 | ||||||||||||
Dividends and Interest receivable | 8,058 | 1,147,168 | 5,173 | 628,100 | ||||||||||||
Tax reclaim receivable | 485 | – | 310 | – | ||||||||||||
Receivable for capital shares sold | 32 | 382 | 426 | 1,417,659 | ||||||||||||
Prepaid expenses | 22,345 | 55,358 | 3,378 | 146,495 | ||||||||||||
|
|
|
|
|
|
|
| |||||||||
Total Assets | 5,205,400 | 97,403,643 | 2,196,139 | 110,255,957 | ||||||||||||
|
|
|
|
|
|
|
| |||||||||
Liabilities: | ||||||||||||||||
Payable for investment securities purchased | – | – | 6,485 | 1,006,466 | ||||||||||||
Unrealized loss on foreign currency spot contracts | – | – | 50 | – | ||||||||||||
Audit fees payable | 25,000 | 37,500 | 25,000 | 37,500 | ||||||||||||
Custodian fees payable | 4,969 | 3,211 | 6,808 | 819 | ||||||||||||
Accrued Foreign Capital Gains Tax on Appreciated Securities | – | – | 2,496 | – | ||||||||||||
Miscellaneous fees payable | 6,405 | 6,405 | 6,405 | 6,405 | ||||||||||||
Transfer agent fees payable | 3,220 | 3,919 | 6,385 | 3,905 | ||||||||||||
Payable due to administrator | 867 | 17,139 | 348 | 18,173 | ||||||||||||
Printing fees payable | 445 | 9,555 | 181 | 9,497 | ||||||||||||
Registration fees payable | 438 | 9,340 | 182 | 8,773 | ||||||||||||
Pricing fees payable | 263 | 7,019 | 445 | 847 | ||||||||||||
Chief Compliance Officer fees payable | 151 | 3,239 | 61 | 3,220 | ||||||||||||
Payable due to trustees | 24 | 514 | 10 | 511 | ||||||||||||
Shareholder servicing fees payable (Y Shares ) | – | – | 121 | – | ||||||||||||
Accrued expenses | 174 | 3,726 | 66 | 3,702 | ||||||||||||
|
|
|
|
|
|
|
| |||||||||
Total Liabilities | 41,956 | 101,567 | 55,043 | 1,099,818 | ||||||||||||
|
|
|
|
|
|
|
| |||||||||
Net Assets | $ | 5,163,444 | $ | 97,302,076 | $ | 2,141,096 | $ | 109,156,139 | ||||||||
|
|
|
|
|
|
|
| |||||||||
† Cost of securities | $ | 6,000,482 | $ | 77,339,687 | $ | 2,448,152 | $ | 110,589,263 | ||||||||
†† Cost of affiliated investments | – | 26,084,973 | – | – | ||||||||||||
††† Cost of foreign currency | 7,030 | – | 2,588 | – | ||||||||||||
|
|
|
|
|
|
|
| |||||||||
Net Assets: | ||||||||||||||||
Paid-in Capital | $ | 6,241,186 | $ | 110,461,624 | $ | 2,465,707 | $ | 115,924,726 | ||||||||
Total Distributable Loss | (1,077,742 | ) | (13,159,548 | ) | (324,611 | ) | (6,768,587 | ) | ||||||||
|
|
|
|
|
|
|
| |||||||||
Net Assets | $ | 5,163,444 | $ | 97,302,076 | $ | 2,141,096 | $ | 109,156,139 | ||||||||
|
|
|
|
|
|
|
| |||||||||
I Shares: | ||||||||||||||||
Net Assets | $ | 5,163,444 | $ | 97,302,076 | $ | 2,056,443 | $ | 109,156,139 | ||||||||
Outstanding Shares of Beneficial Interest | 647,813 | 10,762,503 | 242,693 | 11,551,560 | ||||||||||||
Net Asset Value, Offering and Redemption Price Per Share* | $ | 7 .97 | $ | 9 .04 | $ | 8 .47 | $ | 9 .45 | ||||||||
Y Shares: | ||||||||||||||||
Net Assets | N/A | N/A | $ | 84,653 | N/A | |||||||||||
Outstanding Shares of Beneficial Interest | N/A | N/A | 10,003 | N/A | ||||||||||||
Net Asset Value, Offering and Redemption Price Per Share* | N/A | N/A | $ | 8 .46 | N/A | |||||||||||
Amounts designated as “—” are $0.
* Redemption price per share may vary depending on the length of time shares are held.
N/A - Not Applicable
The accompanying notes are an integral part of the financial statements.
38
| The Advisors’ Inner Circle Fund III | Barrow Hanley Funds | |
| October 31, 2022 |
| STATEMENTS OF ASSETS AND LIABILITIES |
| International Value Fund | Total Return Bond Fund | US Value Opportunities Fund | ||||||||||
Assets: | ||||||||||||
Investments in securities at value† | $ | 5,891,786 | $ | 40,137,332 | $ | 96,304,772 | ||||||
Foreign currency†† | 1,161 | – | – | |||||||||
Cash | 104,920 | 1,033,125 | 2,990,531 | |||||||||
Deferred offering cost (See Note 2) | 14,223 | 14,698 | 14,698 | |||||||||
Receivable for investment securities sold | 70,088 | 60,149 | 116,883 | |||||||||
Receivable due from Investment Adviser | 17,393 | 27,554 | 3,783 | |||||||||
Dividends and Interest receivable | 13,771 | 214,830 | 50,169 | |||||||||
Tax reclaim receivable | 3,852 | – | – | |||||||||
Unrealized Appreciation on Spot Contracts | 619 | – | – | |||||||||
Receivable for capital shares sold | 343 | 48 | 4,899,035 | |||||||||
Prepaid expenses | 3,427 | 36,143 | 3,974 | |||||||||
|
|
|
|
|
| |||||||
Total Assets | 6,121,583 | 41,523,879 | 104,383,845 | |||||||||
|
|
|
|
|
| |||||||
Liabilities: | ||||||||||||
Payable for investment securities purchased | 50,747 | 475,002 | – | |||||||||
Audit fees payable | 25,000 | 27,500 | 22,500 | |||||||||
Custodian fees payable | 5,743 | 1,507 | 3,329 | |||||||||
Transfer agent fees payable | 6,428 | 3,450 | 3,748 | |||||||||
Miscellaneous fees payable | 6,405 | 6,405 | 6,405 | |||||||||
Payable due to administrator | 1,361 | 6,614 | 14,525 | |||||||||
Printing fees payable | 729 | 3,364 | 7,157 | |||||||||
Registration fees payable | 684 | 3,230 | 6,487 | |||||||||
Pricing fees payable | 423 | 8,155 | 308 | |||||||||
Chief Compliance Officer fees payable | 247 | 1,140 | 2,426 | |||||||||
Shareholder servicing fees payable (Y Shares ) | 123 | – | – | |||||||||
Payable due to trustees | 39 | 181 | 385 | |||||||||
Accrued expenses | 266 | 1,310 | 10,356 | |||||||||
|
|
|
|
|
| |||||||
Total Liabilities | 98,195 | 537,858 | 77,626 | |||||||||
|
|
|
|
|
| |||||||
Net Assets | $ | 6,023,388 | $ | 40,986,021 | $ | 104,306,219 | ||||||
|
|
|
|
|
| |||||||
† Cost of securities | $ | 6,220,070 | $ | 44,388,497 | $ | 87,244,887 | ||||||
†† Cost of foreign currency | 1,157 | – | – | |||||||||
|
|
|
|
|
| |||||||
Net Assets: | ||||||||||||
Paid-in Capital | $ | 6,985,418 | $ | 45,268,672 | $ | 95,727,016 | ||||||
Total Distributable Earnings / (Loss) | (962,030 | ) | (4,282,651 | ) | 8,579,203 | |||||||
|
|
|
|
|
| |||||||
Net Assets | $ | 6,023,388 | $ | 40,986,021 | $ | 104,306,219 | ||||||
|
|
|
|
|
| |||||||
I Shares: | ||||||||||||
Net Assets | $ | 5,935,672 | $ | 40,986,021 | $ | 104,306,219 | ||||||
Outstanding Shares of Beneficial Interest | 675,668 | 4,537,907 | 10,943,698 | |||||||||
Net Asset Value, Offering and Redemption Price Per Share* | $ | 8 .78 | $ | 9 .03 | $ | 9 .53 | ||||||
Y Shares: | ||||||||||||
Net Assets | $ | 87,716 | N/A | N/A | ||||||||
Outstanding Shares of Beneficial Interest | 10,003 | N/A | N/A | |||||||||
Net Asset Value, Offering and Redemption Price Per Share* | $ | 8 .77 | N/A | N/A | ||||||||
Amounts designated as “—” are $0.
* Redemption price per share may vary depending on the length of time shares are held.
N/A – Not applicable
The accompanying notes are an integral part of the financial statements.
39
| The Advisors’ Inner Circle Fund III | Barrow Hanley Funds | |
| For the period ended October 31, 2022 |
| STATEMENTS OF OPERATIONS |
| Concentrated Emerging Markets ESG Opportunities Fund(1) | Credit Opportunities Fund(1) | Emerging Markets Value Fund(2) | Floating Rate Fund(1) | |||||||||||||
Investment Income | ||||||||||||||||
Dividends | $ | 152,283 | $ | – | $ | 80,661 | $ | – | ||||||||
Interest | 739 | 3,682,419 | 434 | 4,152,633 | ||||||||||||
Income from Affiliated Investments | – | 805,728 | – | – | ||||||||||||
Less: Foreign Taxes Withheld | (11,789 | ) | – | (6,325 | ) | – | ||||||||||
|
|
|
|
|
|
|
|
|
|
|
| |||||
Total Investment Income | 141,233 | 4,488,147 | 74,770 | 4,152,633 | ||||||||||||
|
|
|
|
|
|
|
|
|
|
|
| |||||
Expenses | ||||||||||||||||
Investment Advisory Fees | 27,354 | 386,141 | 14,321 | 278,753 | ||||||||||||
Administration Fees | 5,407 | 118,300 | 33,017 | 114,074 | ||||||||||||
Chief Compliance Officer Fees | 709 | 5,115 | 3,326 | 4,993 | ||||||||||||
Trustees’ Fees | 500 | 11,160 | 4,386 | 10,412 | ||||||||||||
Shareholder Servicing Fees (Y Shares) | – | – | 121 | – | ||||||||||||
Audit Fees | 25,000 | 37,500 | 25,000 | 37,500 | ||||||||||||
Offering Costs (See Note 2) | 22,142 | 22,142 | 57,654 | 22,142 | ||||||||||||
Registration & Filing Fees | 16,843 | 41,285 | 5,352 | 90,241 | ||||||||||||
Custodian Fees | 14,794 | 5,368 | 27,965 | 1,256 | ||||||||||||
Transfer Agent Fees | 11,307 | 14,623 | 35,896 | 14,464 | ||||||||||||
Miscellaneous Fees | 8,466 | 16,474 | 23,949 | 16,405 | ||||||||||||
Legal Fees | 1,337 | 19,402 | 7,277 | 18,657 | ||||||||||||
Printing Fees | 1,320 | 19,724 | 1,709 | 18,324 | ||||||||||||
Pricing Fees | 581 | 15,653 | 1,671 | 1,874 | ||||||||||||
Other Expenses | 11 | 222 | – | 219 | ||||||||||||
|
|
|
|
|
|
|
|
|
|
|
| |||||
Total Expenses | 135,771 | 713,109 | 241,644 | 629,314 | ||||||||||||
|
|
|
|
|
|
|
|
|
|
|
| |||||
Less: | ||||||||||||||||
Investment Advisory Fees Waiver | (27,354 | ) | (211,154 | ) | (14,321 | ) | (257,663 | ) | ||||||||
Reimbursement from Adviser | (77,579 | ) | – | (210,904 | ) | – | ||||||||||
|
|
|
|
|
|
|
|
|
|
|
| |||||
Net Expenses | 30,838 | 501,955 | 16,419 | 371,651 | ||||||||||||
|
|
|
|
|
|
|
|
|
|
|
| |||||
Net Investment Income | 110,395 | 3,986,192 | 58,351 | 3,780,982 | ||||||||||||
|
|
|
|
|
|
|
|
|
|
|
| |||||
Net Realized Gain (Loss) on: | ||||||||||||||||
Investments | (326,580 | ) | (2,068,491 | ) | (61,882 | ) | (544,145 | ) | ||||||||
Affiliated Investments | – | (293,173 | ) | – | – | |||||||||||
Foreign Currency Transactions | 4,309 | – | (3,427 | ) | – | |||||||||||
|
|
|
|
|
|
|
|
|
|
|
| |||||
Net Realized Gain (Loss) | (322,271 | ) | (2,361,664 | ) | (65,309 | ) | (544,145 | ) | ||||||||
|
|
|
|
|
|
|
|
|
|
|
| |||||
Net Unrealized Appreciation (Depreciation) on: | ||||||||||||||||
Investments | (1,000,503 | ) | (8,833,892 | ) | (315,130 | ) | (6,511,749 | ) | ||||||||
Affiliated Securities | – | (1,285,962 | ) | – | – | |||||||||||
Foreign Capital Gains Tax on Appreciated Securities | – | – | (2,496 | ) | – | |||||||||||
Translation of Other Assets and Liabilities Denominated in Foreign Currencies | 889 | – | (27 | ) | – | |||||||||||
|
|
|
|
|
|
|
|
|
|
|
| |||||
Net Unrealized Appreciation (Depreciation) | (999,614 | ) | (10,119,854 | ) | (317,653 | ) | (6,511,749 | ) | ||||||||
|
|
|
|
|
|
|
|
|
|
|
| |||||
Net Realized and Unrealized Loss | (1,321,885 | ) | (12,481,518 | ) | (382,962 | ) | (7,055,894 | ) | ||||||||
|
|
|
|
|
|
|
|
|
|
|
| |||||
Net Decrease in Net Assets from Operations | $ | (1,211,490 | ) | $ | (8,495,326 | ) | $ | (324,611 | ) | $ | (3,274,912 | ) | ||||
|
|
|
|
|
|
|
|
|
|
|
| |||||
| (1) | Commenced operations on April 12, 2022. |
| (2) | Commenced operations on December 29, 2021. |
Amounts designated as “—” are $0 or have been rounded to $0. |
The accompanying notes are an integral part of the financial statements.
40
| The Advisors’ Inner Circle Fund III | Barrow Hanley Funds | |
| For the period ended October 31, 2022 |
| STATEMENTS OF OPERATIONS |
| International Value Fund(1) | Total Return Bond Fund(2) | US Value Opportunities Fund(2) | ||||||||||
Investment Income | ||||||||||||
Dividends | $ | 198,794 | $ | – | $ | 1,013,941 | ||||||
Interest | 1,639 | 796,461 | 14,524 | |||||||||
Less: Foreign Taxes Withheld | (15,013 | ) | – | (1,335 | ) | |||||||
|
|
|
|
|
|
|
|
| ||||
Total Investment Income | 185,420 | 796,461 | 1,027,130 | |||||||||
|
|
|
|
|
|
|
|
| ||||
Expenses | ||||||||||||
Administration Fees | 40,795 | 42,109 | 94,913 | |||||||||
Investment Advisory Fees | 32,585 | 80,036 | 284,151 | |||||||||
Trustees’ Fees | 4,864 | 3,803 | 8,850 | |||||||||
Chief Compliance Officer Fees | 3,628 | 2,112 | 3,980 | |||||||||
Shareholder Servicing Fees (Y Shares) | 123 | – | – | |||||||||
Offering Costs (See Note 2) | 57,654 | 22,142 | 22,142 | |||||||||
Transfer Agent Fees | 36,078 | 12,382 | 13,858 | |||||||||
Audit Fees | 25,000 | 27,500 | 22,500 | |||||||||
Custodian Fees | 19,586 | 2,411 | 7,121 | |||||||||
Miscellaneous Fees | 19,298 | 10,846 | 14,543 | |||||||||
Legal Fees | 8,438 | 7,214 | 15,050 | |||||||||
Registration & Filing Fees | 5,875 | 29,223 | 7,139 | |||||||||
Printing Fees | 2,503 | 6,665 | 14,755 | |||||||||
Pricing Fees | 1,611 | 18,310 | 713 | |||||||||
Other Expenses | – | 78 | 165 | |||||||||
|
|
|
|
|
|
|
|
| ||||
Total Expenses | 258,038 | 264,831 | 509,880 | |||||||||
|
|
|
|
|
|
|
|
| ||||
Less: | ||||||||||||
Investment Advisory Fees Waiver | (32,585 | ) | (80,036 | ) | (143,065 | ) | ||||||
Reimbursement from Adviser | (182,869 | ) | (104,756 | ) | – | |||||||
|
|
|
|
|
|
|
|
| ||||
Net Expenses | 42,584 | 80,039 | 366,815 | |||||||||
|
|
|
|
|
|
|
|
| ||||
Net Investment Income | 142,836 | 716,422 | 660,315 | |||||||||
|
|
|
|
|
|
|
|
| ||||
Net Realized Gain (Loss) on: | ||||||||||||
Investments | (791,612 | ) | (167,073 | ) | (1,140,997 | ) | ||||||
Foreign Currency Transactions | 15,340 | – | – | |||||||||
|
|
|
|
|
|
|
|
| ||||
Net Realized Gain (Loss) | (776,272 | ) | (167,073 | ) | (1,140,997 | ) | ||||||
|
|
|
|
|
|
|
|
| ||||
Net Unrealized Appreciation (Depreciation) on: | ||||||||||||
Investments | (328,284 | ) | (4,082,022 | ) | (4,259,154 | ) | ||||||
Translation of Other Assets and Liabilities Denominated in Foreign Currencies | (310 | ) | – | – | ||||||||
|
|
|
|
|
|
|
|
| ||||
Net Unrealized Appreciation (Depreciation) | (328,594 | ) | (4,082,022 | ) | (4,259,154 | ) | ||||||
|
|
|
|
|
|
|
|
| ||||
Net Realized and Unrealized Loss | (1,104,866 | ) | (4,249,095 | ) | (5,400,151 | ) | ||||||
|
|
|
|
|
|
|
|
| ||||
Net Decrease in Net Assets from Operations | $ | (962,030 | ) | $ | (3,532,673 | ) | $ | (4,739,836 | ) | |||
|
|
|
|
|
|
|
|
| ||||
| (1) | Commenced operations on December 29, 2021. |
| (2) | Commenced operations on April 12, 2022. |
Amounts designated as “—” are $0 or have been rounded to $0. |
The accompanying notes are an integral part of the financial statements.
41
| The Advisors’ Inner Circle Fund III | Barrow Hanley Funds | |
| STATEMENTS OF CHANGES IN NET ASSETS |
| Concentrated Emerging Markets ESG Opportunities Fund | Credit Opportunities Fund | |||||||
| Period Ended October 31, 2022(1) | Period Ended October 31, 2022(1) | |||||||
Operations: | ||||||||
Net Investment Income | $ | 110,395 | $ | 3,986,192 | ||||
Net Realized Gain (Loss) | (322,271 | ) | (2,361,664 | ) | ||||
Net Unrealized Appreciation (Depreciation) | (999,614 | ) | (10,119,854 | ) | ||||
|
|
|
|
|
| |||
Net Decrease in Net Assets Resulting from Operations | (1,211,490 | ) | (8,495,326 | ) | ||||
|
|
|
|
|
| |||
Distributions: | ||||||||
I Shares | — | (3,544,896 | ) | |||||
|
|
|
|
|
| |||
Total Distributions | — | (3,544,896 | ) | |||||
|
|
|
|
|
| |||
Capital Share Transactions: | ||||||||
I Shares | ||||||||
Issued† | 6,374,934 | 127,469,852 | ||||||
Reinvestment of Dividends | — | 3,474,020 | ||||||
Redeemed | — | (21,601,574 | ) | |||||
|
|
|
|
|
| |||
Net Increase in Net Assets from I Shares Transactions | 6,374,934 | 109,342,298 | ||||||
|
|
|
|
|
| |||
Net Increase in Net Assets from Capital Share Transactions | 6,374,934 | 109,342,298 | ||||||
|
|
|
|
|
| |||
Total Increase in Net Assets | 5,163,444 | 97,302,076 | ||||||
Net Assets: | ||||||||
Beginning of Period | — | — | ||||||
|
|
|
|
|
| |||
End of Period | $ | 5,163,444 | $ | 97,302,076 | ||||
|
|
|
|
|
| |||
Share Transactions: | ||||||||
I Shares | ||||||||
Issued | 647,813 | 12,751,757 | ||||||
Reinvestment of Dividends | — | 387,357 | ||||||
Redeemed | — | (2,376,611 | ) | |||||
|
|
|
|
|
| |||
Total Increase in I Shares | 647,813 | 10,762,503 | ||||||
|
|
|
|
|
| |||
Net Increase in Shares Outstanding | 647,813 | 10,762,503 | ||||||
|
|
|
|
|
| |||
| † | Includes transfer of assets from the Predecessor Funds. |
| (1) | The Fund commenced operations on April 12, 2022. |
Amounts designated as “—” are $0.
The accompanying notes are an integral part of the financial statements.
42
| The Advisors’ Inner Circle Fund III | Barrow Hanley Funds | |
| STATEMENTS OF CHANGES IN NET ASSETS |
| Emerging Markets Value Fund | Floating Rate Fund | |||||||
| Period Ended October 31, 2022(1) | Period Ended October 31, 2022(2) | |||||||
Operations: | ||||||||
Net Investment Income | $ | 58,351 | $ | 3,780,982 | ||||
Net Realized Gain (Loss) | (65,309 | ) | (544,145 | ) | ||||
Net Unrealized Appreciation (Depreciation) | (317,653 | ) | (6,511,749 | ) | ||||
|
|
|
|
|
| |||
Net Decrease in Net Assets Resulting from Operations | (324,611 | ) | (3,274,912 | ) | ||||
|
|
|
|
|
| |||
Distributions: | ||||||||
I Shares | — | (3,068,871 | ) | |||||
|
|
|
|
|
| |||
Total Distributions | — | (3,068,871 | ) | |||||
|
|
|
|
|
| |||
Capital Share Transactions: | ||||||||
I Shares | ||||||||
Issued† | 2,365,682 | 121,493,203 | ||||||
Reinvestment of Dividends | — | 3,006,719 | ||||||
Redeemed | — | (9,000,000 | ) | |||||
|
|
|
|
|
| |||
Net Increase in Net Assets from I Shares Transactions | 2,365,682 | 115,499,922 | ||||||
|
|
|
|
|
| |||
Y Shares | ||||||||
Issued | 100,025 | — | ||||||
|
|
|
|
|
| |||
Net Increase in Net Assets from Y Shares Transactions | 100,025 | — | ||||||
|
|
|
|
|
| |||
Net Increase in Net Assets from Capital Share Transactions | 2,465,707 | 115,499,922 | ||||||
|
|
|
|
|
| |||
Total Increase in Net Assets | 2,141,096 | 109,156,139 | ||||||
Net Assets: | ||||||||
Beginning of Period | — | — | ||||||
|
|
|
|
|
| |||
End of Period | $ | 2,141,096 | $ | 109,156,139 | ||||
|
|
|
|
|
| |||
Share Transactions: | ||||||||
I Shares | ||||||||
Issued | 242,693 | 12,162,816 | ||||||
Reinvestment of Dividends | — | 319,530 | ||||||
Redeemed | — | (930,786 | ) | |||||
|
|
|
|
|
| |||
Total Increase in I Shares | 242,693 | 11,551,560 | ||||||
|
|
|
|
|
| |||
Y Shares | ||||||||
Issued | 10,003 | — | ||||||
|
|
|
|
|
| |||
Total Increase in Y Shares | 10,003 | — | ||||||
|
|
|
|
|
| |||
Net Increase in Shares Outstanding | 252,696 | 11,551,560 | ||||||
|
|
|
|
|
| |||
| † | Includes transfer of assets from the Predecessor Funds. |
| (1) | The Fund commenced operations on December 29, 2021. |
| (2) | The Fund commenced operations on April 12, 2022. |
Amounts designated as “—” are $0. |
The accompanying notes are an integral part of the financial statements.
43
| The Advisors’ Inner Circle Fund III | Barrow Hanley Funds | |
| STATEMENTS OF CHANGES IN NET ASSETS |
| International Value Fund | Total Return Bond Fund | |||||||
| Period Ended October 31, 2022(1) | Period Ended October 31, 2022(2) | |||||||
Operations: | ||||||||
Net Investment Income | $ | 142,836 | $ | 716,422 | ||||
Net Realized Gain (Loss) | (776,272 | ) | (167,073 | ) | ||||
Net Unrealized Appreciation (Depreciation) | (328,594 | ) | (4,082,022 | ) | ||||
|
|
|
|
|
| |||
Net Decrease in Net Assets Resulting from Operations | (962,030 | ) | (3,532,673 | ) | ||||
|
|
|
|
|
| |||
Distributions: | ||||||||
I Shares | — | (580,835 | ) | |||||
|
|
|
|
|
| |||
Total Distributions | — | (580,835 | ) | |||||
|
|
|
|
|
| |||
Capital Share Transactions: | ||||||||
I Shares | ||||||||
Issued† | 10,922,844 | 45,018,694 | ||||||
Reinvestment of Dividends | — | 580,835 | ||||||
Redeemed | (4,037,451 | ) | (500,000 | ) | ||||
|
|
|
|
|
| |||
Net Increase in Net Assets from I Shares Transactions | 6,885,393 | 45,099,529 | ||||||
|
|
|
|
|
| |||
Y Shares | ||||||||
Issued | 100,025 | — | ||||||
|
|
|
|
|
| |||
Net Increase in Net Assets from Y Shares Transactions | 100,025 | — | ||||||
|
|
|
|
|
| |||
Net Increase in Net Assets from Capital Share Transactions | 6,985,418 | 45,099,529 | ||||||
|
|
|
|
|
| |||
Total Increase in Net Assets | 6,023,388 | 40,986,021 | ||||||
Net Assets: | ||||||||
Beginning of Period | — | — | ||||||
|
|
|
|
|
| |||
End of Period | $ | 6,023,388 | $ | 40,986,021 | ||||
|
|
|
|
|
| |||
Share Transactions: | ||||||||
I Shares | ||||||||
Issued | 1,142,853 | 4,527,613 | ||||||
Reinvestment of Dividends | — | 61,894 | ||||||
Redeemed | (467,185 | ) | (51,600 | ) | ||||
|
|
|
|
|
| |||
Total Increase in I Shares | 675,668 | 4,537,907 | ||||||
|
|
|
|
|
| |||
Y Shares | ||||||||
Issued | 10,003 | — | ||||||
|
|
|
|
|
| |||
Total Increase in Y Shares | 10,003 | — | ||||||
|
|
|
|
|
| |||
Net Increase in Shares Outstanding | 685,671 | 4,537,907 | ||||||
|
|
|
|
|
| |||
† Includes transfer of assets from the Predecessor Funds.
(1) The Fund commenced operations on December 29, 2021.
(2) The Fund commenced operations on April 12, 2022.
Amounts designated as “—” are $0.
The accompanying notes are an integral part of the financial statements.
44
| The Advisors’ Inner Circle Fund III | Barrow Hanley Funds | |
| STATEMENTS OF CHANGES IN NET ASSETS |
| US Value Opportunities Fund | ||||
| Period Ended October 31, 2022(1) | ||||
Operations: | ||||
Net Investment Income | $ | 660,315 | ||
Net Realized Gain (Loss) | (1,140,997 | ) | ||
Net Unrealized Appreciation (Depreciation) | (4,259,154 | ) | ||
|
|
| ||
Net Decrease in Net Assets Resulting from Operations | (4,739,836 | ) | ||
|
|
| ||
Capital Share Transactions: | ||||
I Shares | ||||
Issued† | 138,315,751 | |||
Redeemed | (29,269,696 | ) | ||
|
|
| ||
Net Increase in Net Assets from I Shares Transactions | 109,046,055 | |||
|
|
| ||
Net Increase in Net Assets from Capital Share Transactions | 109,046,055 | |||
|
|
| ||
Total Increase in Net Assets | 104,306,219 | |||
Net Assets: | ||||
Beginning of Period | — | |||
|
|
| ||
End of Period | $ | 104,306,219 | ||
|
|
| ||
Share Transactions: | ||||
I Shares | ||||
Issued | 14,071,581 | |||
Redeemed | (3,127,883 | ) | ||
|
|
| ||
Total Increase in I Shares | 10,943,698 | |||
|
|
| ||
Net Increase in Shares Outstanding | 10,943,698 | |||
|
|
| ||
† Includes transfer of assets from the Predecessor Funds.
(1) The Fund commenced operations on April 12, 2022.
Amount designated as “—” is $0.
The accompanying notes are an integral part of the financial statements.
45
| The Advisors’ Inner Circle Fund III | Barrow Hanley Funds | |
| FINANCIAL HIGHLIGHTS |
Selected Per Share Data & Ratios
For the period ended October 31,
For a Share Outstanding Throughout the Period
| Net Asset Value, Beginning of Period | Net Investment Income* | Net Realized and Unrealized Loss on Investments | Total from Operations | Distributions from Net Investment Income | Total Distributions | Net Asset Value, End of Period | Total Return† | Net Assets End of Period (000) | Ratio of Expenses to Average Net Assets (including waivers and reimbursements) | Ratio of Expenses to Average Net Assets (excluding waivers and reimbursements) | Ratio of Net Investment Income to Average Net Assets | Portfolio Turnover† | ||||||||||||||||||||||||||||||||||||||||
Concentrated Emerging Markets ESG Opportunities Fund |
| |||||||||||||||||||||||||||||||||||||||||||||||||||
I Shares |
| |||||||||||||||||||||||||||||||||||||||||||||||||||
2022(1) | $ | 10.00 | $ | 0.19 | ($ | 2.22) | ($ | 2.03) | $ | – | $ | – | $ | 7.97 | (20.30) | % | $ | 5,163 | 1.05 | % | 4.62 | % | 3.76 | % | 59 | % | ||||||||||||||||||||||||||
Credit Opportunities Fund |
| |||||||||||||||||||||||||||||||||||||||||||||||||||
I Shares |
| |||||||||||||||||||||||||||||||||||||||||||||||||||
2022(1) | $ | 10.00 | $ | 0.33 | ($ | 1.00) | ($ | 0.67) | $ | (0.29) | $ | (0.29) | $ | 9.04 | (6.63) | % | $ | 97,302 | 0.78 | % | 1.11 | % | 6.19 | % | 29 | % | ||||||||||||||||||||||||||
Emerging Markets Value Fund |
| |||||||||||||||||||||||||||||||||||||||||||||||||||
I Shares |
| |||||||||||||||||||||||||||||||||||||||||||||||||||
2022(2) | $ | 10.00 | $ | 0.29 | ($ | 1.82) | ($ | 1.53) | $ | – | $ | – | $ | 8.47 | (15.30) | % | $ | 2,056 | 0.99 | % | 14.67 | % | 3.55 | % | 40 | % | ||||||||||||||||||||||||||
Y Shares |
| |||||||||||||||||||||||||||||||||||||||||||||||||||
2022(2) | $ | 10.00 | $ | 0.28 | ($ | 1.82) | ($ | 1.54) | $ | – | $ | – | $ | 8.46 | (15.40) | % | $ | 85 | 1.14 | % | 14.82 | % | 3.45 | % | 40 | % | ||||||||||||||||||||||||||
Floating Rate Fund |
| |||||||||||||||||||||||||||||||||||||||||||||||||||
I Shares |
| |||||||||||||||||||||||||||||||||||||||||||||||||||
2022(1) | $ | 10.00 | $ | 0.33 | ($ | 0.61) | ($ | 0.28) | $ | (0.27) | $ | (0.27) | $ | 9.45 | (2.81) | % | $ | 109,156 | 0.60 | % | 1.02 | % | 6.10 | % | 9 | % | ||||||||||||||||||||||||||
International Value Fund |
| |||||||||||||||||||||||||||||||||||||||||||||||||||
I Shares |
| |||||||||||||||||||||||||||||||||||||||||||||||||||
2022(2) | $ | 10.00 | $ | 0.23 | ($ | 1.45) | ($ | 1.22) | $ | – | $ | – | $ | 8.78 | (12.20) | % | $ | 5,935 | 0.86 | % | 5.16 | % | 2.89 | % | 105 | % | ||||||||||||||||||||||||||
Y Shares |
| |||||||||||||||||||||||||||||||||||||||||||||||||||
2022(2) | $ | 10.00 | $ | 0.23 | ($ | 1.46) | ($ | 1.23) | $ | – | $ | – | $ | 8.77 | (12.30) | % | $ | 88 | 1.01 | % | 8.99 | % | 2.79 | % | 105 | % | ||||||||||||||||||||||||||
Total Return Bond Fund |
| |||||||||||||||||||||||||||||||||||||||||||||||||||
I Shares |
| |||||||||||||||||||||||||||||||||||||||||||||||||||
2022(1) | $ | 10.00 | $ | 0.17 | ( $ | 1.00) | ($ | 0.83) | $ | (0.14) | $ | (0.14) | $ | 9.03 | (8.38) | % | $ | 40,986 | 0.35 | % | 1.16 | % | 3.13 | % | 20 | % | ||||||||||||||||||||||||||
US Value Opportunities Fund |
| |||||||||||||||||||||||||||||||||||||||||||||||||||
I Shares |
| |||||||||||||||||||||||||||||||||||||||||||||||||||
2022(1) | $ | 10.00 | $ | 0.07 | ($ | 0.54) | ($ | 0.47) | $ | – | $ | – | $ | 9.53 | (4.70) | % | $ | 104,306 | 0.71 | % | 0.99 | % | 1.28 | % | 47 | % | ||||||||||||||||||||||||||
| * | Per unit data calculated using average shares method. |
| † | Total return and portfolio turnover are for the period indicated and have not been annualized. Total return would have been lower had the Adviser not waived a portion of its fee. Returns shown do not reflect the deduction of taxes that a shareholder would pay on Fund distributions or the redemption of Fund shares. |
| (1) | Commenced operations on April 12, 2022. All ratios for the period have been annualized. |
| (2) | Commenced operations on December 29, 2021. All ratios for the period have been annualized. |
The accompanying notes are an integral part of the financial statements.
46
| The Advisors’ Inner Circle Fund III | Barrow Hanley Funds | |
| October 31, 2022 |
|
1. Organization:
The Advisors’ Inner Circle Fund III (the “Trust”) is organized as a Delaware statutory trust under an Agreement and Declaration of Trust dated December 4, 2013. The Trust is registered under the Investment Company Act of 1940, as amended, as an open-end management investment company with 65 funds. The financial statements herein are those of the Barrow Hanley Concentrated Emerging Markets ESG Opportunities Fund (the “Concentrated Emerging Markets ESG Opportunities Fund”), Barrow Hanley Credit Opportunities Fund (the “Credit Opportunities Fund”), Barrow Hanley Emerging Markets Value Fund (the “Emerging Markets Value Fund”), Barrow Hanley Floating Rate Fund (the “Floating Rate Fund”), Barrow Hanley International Value Fund (the “International Value Fund”), Barrow Hanley Total Return Bond Fund (the “Total Return Bond Fund”), and Barrow Hanley US Value Opportunities Fund (the “US Value Opportunities Fund”) (each a “Fund” and collectively, the “Funds”). The investment objective of Concentrated Emerging Markets ESG Opportunities Fund is to seek long term capital appreciation and consistent income. The investment objective of Credit Opportunities Fund and Floating Rate Fund is to seek to maximize total return, consistent with preservation of capital. The investment objective of Emerging Markets Value is to seek long term capital appreciation and consistent income from dividends. The investment objective of International Value Fund is to seek to obtain higher returns compared to the MSCI EAFE Index, while maintaining lower risk. The investment objective of Total Return Bond Fund is to seek to provide maximum long-term total return. The investment objective of US Value Opportunities Fund is to seek to achieve risk-adjusted equity returns in excess of the Fund’s benchmark over multiple year time periods. Each of the Funds is classified as diversified, as that term is defined under the Investment Company Act of 1940, as amended (the “1940 Act”). Perpetual US Services LLC, doing business as PGIA serves as the Funds’ investment adviser (the “Adviser”). The Emerging Markets Value Fund and International Value Fund commenced operations on December 29, 2021 and currently offer I Shares and Y Shares. The Concentrated Emerging Markets ESG Opportunities Fund, Credit Opportunities Fund, Floating Rate Fund, Total Return Bond Fund, and US Value Opportunities Fund commenced operations on April 12, 2022 and currently offer I Shares. Y Shares of each Fund are currently not available for purchases. The financial statements of the remaining funds of the Trust are presented separately. The assets of each fund are segregated and a shareholder’s interest is limited to the fund in which shares are held.
Each Fund is the successor to the fund listed opposite its name in the table below (each a “Predecessor Fund”). Each Predecessor Fund was a private fund managed by the Sub-Adviser using investment objectives, strategies, policies and restrictions that were in all material respects equivalent to those used by the Sub-Adviser to manage the Predecessor Fund’s corresponding Fund. Each Predecessor Fund dissolved and reorganized into the I Shares and Y Shares of each Fund on April 12, 2022. All of the assets of the Predecessor Funds were transferred in-kind to the Funds in connection with the reorganization.
| Fund | Predecessor Fund | |
| Concentrated Emerging Markets ESG Opportunities Fund | Barrow, Hanley, Mewhinney & Strauss LLC Concentrated Emerging Markets Fund | |
| Credit Opportunities Fund | Barrow, Hanley, Mewhinney & Strauss LLC High Yield Fixed Income Fund | |
| Floating Rate Fund | Barrow, Hanley, Mewhinney & Strauss LLC Bank Loan Fund | |
| Total Return Bond Fund | Barrow, Hanley, Mewhinney & Strauss LLC Core Fixed Income Fund | |
| US Value Opportunities Fund | Barrow, Hanley, Mewhinney & Strauss LLC Diversified Large Cap Value Fund1 | |
1 On April 12, 2022, the Barrow, Hanley, Mewhinney & Strauss LLC Large Cap Value Fund, another private fund managed by the sub-adviser, also contributed its assets to the US Value Opportunities Fund and subsequently dissolved.
2. Significant Accounting Policies:
The following are significant accounting policies, which are consistently followed in the preparation of its financial statements of the Funds. The Funds are investment companies that apply the accounting and reporting guidance issued in Topic 946 by the U.S. Financial Accounting Standards Board (“FASB”).
Use of Estimates — The preparation of financial statements in conformity with U.S. generally accepted accounting principles (“U.S. GAAP”) requires management to make estimates and assumptions that affect the reported amount of assets and liabilities, disclosure of contingent assets and liabilities at the date of the financial statements and the reported amounts of increases and decreases in net assets from operations during the reporting period. Actual results could differ from those estimates and such differences could be material.
Security Valuation — Securities listed on a securities exchange, market or automated quotation system for which quotations are readily available (except for securities traded on the NASDAQ Stock Market (the “NASDAQ”)), including securities traded over the counter, are valued at the last quoted sale price on an exchange or market (foreign or domestic) on which they are traded on valuation date (or at
47
| The Advisors’ Inner Circle Fund III | Barrow Hanley Funds | |
| October 31, 2022 |
approximately 4:00 pm ET if a security’s primary exchange is normally open at that time), or, if there is no such reported sale on the valuation date, at the most recent quoted bid price. For securities traded on NASDAQ, the NASDAQ Official Closing Price will be used. If available, debt securities are priced based upon valuations provided by independent, third-party pricing agents. Such values generally reflect the last reported sales price if the security is actively traded. The third-party pricing agents may also value debt securities at an evaluated bid price by employing methodologies that utilize actual market transactions, broker-supplied valuations, or other methodologies designed to identify the market value for such securities. Such methodologies generally consider such factors as security prices, yields, maturities, call features, ratings and developments relating to specific securities in arriving at valuations. On the first day a new debt security purchase is recorded, if a price is not available on the automated pricing feeds from our primary and secondary pricing vendors nor is it available from an independent broker, the security may be valued at its purchase price. Each day thereafter, the debt security will be valued according to the Trusts’ Fair Value Procedures until an independent source can be secured. Debt obligations with remaining maturities of sixty days or less may be valued at their amortized cost, which approximates market value provided that it is determined the amortized cost continues to approximate fair value. Should existing credit, liquidity or interest rate conditions in the relevant markets and issuer specific circumstances suggest that amortized cost does not approximate fair value, then the amortized cost method may not be used. The prices for foreign securities are reported in local currency and converted to U.S. dollars using currency exchange rates.
Securities for which market prices are not “readily available” are required to be fair valued under the 1940 Act.
In December 2020, the SEC adopted Rule 2a-5 under the 1940 Act, establishing requirements to determine fair value in good faith for purposes of the 1940 Act. The rule permits fund boards to designate a fund’s investment adviser to perform fair-value determinations, subject to board oversight and certain other conditions. The rule also defines when market quotations are “readily available” for purposes of the 1940 Act and requires a fund to fair value a portfolio investment when a market quotation is not readily available. The SEC also adopted new Rule 31a-4 under the 1940 Act, which sets forth recordkeeping requirements associated with fair-value determinations. The compliance date for Rule 2a-5 and Rule 31a-4 was September 8, 2022.
Effective September 8, 2022, and pursuant to the requirements of Rule 2a-5, the Trust’s Board of Trustees (the “Board”) designated the Adviser as the Board’s valuation designee to perform fair-value determinations for the Funds through a Fair Value Committee (the “Committee”) established by the Adviser and approved new Adviser Fair Value Procedures for the Funds. Prior to September 8, 2022, fair-value determinations were performed in accordance with the Trust’s Fair Value Procedures established by the Funds’ Board of Trustees and were implemented through a Fair Value Committee designated by the Board.
Some of the more common reasons that may necessitate that a security be valued using Fair Value Procedures include: the security’s trading has been halted or suspended; the security has been de-listed from a national exchange; the security’s primary trading market is temporarily closed at a time when under normal conditions it would be open; the security has not been traded for an extended period of time; the security’s primary pricing source is not able or willing to provide a price; or trading of the security is subject to local government imposed restrictions. When a security is valued in accordance with the Fair Value Procedures, the Committee will determine the value after taking into consideration relevant information reasonably available to the Committee.
The Funds use Intercontinental Exchange Data Pricing & reference Data LLC. (“ICE”) as a third party fair valuation vendor. ICE provides a fair value for foreign securities held by the Funds based on certain factors and methodologies (involving, generally, tracking valuation correlations between the U.S. market and each non-U.S. security) applied by ICE in the event that there is a movement in the U.S. market that exceeds a specific threshold that has been established by the Committee. The Committee has also established a “confidence interval” which is used to determine the level of correlation between the value of a foreign security and movements in the U.S. market before a particular security is fair valued when the threshold is exceeded. In the event that the threshold established by the Committee is exceeded on a specific day, the Funds value the non-U.S. securities in their portfolios that exceed the applicable “confidence interval” based upon the fair values provided by ICE. In such event, it is not necessary to hold a Committee meeting. In the event that the Adviser believes that the fair values provided by ICE are not reliable, the Adviser contacts the Funds Administrator and requests that a meeting of the Committee be held.
If a local market in which the Funds own securities is closed for one or more days, the Funds shall value all securities held in the corresponding currency based on the fair value prices provided by ICE using the predetermined confidence interval discussed above.
In accordance with the authoritative guidance on fair value measurements and disclosure under U.S. GAAP, the Funds disclose the fair value of their investments in a hierarchy that prioritizes the inputs to valuation techniques used to measure the fair value. The objective of a fair value measurement is to determine the price that would be received to sell an asset or paid to transfer a liability in an orderly
48
| The Advisors’ Inner Circle Fund III | Barrow Hanley Funds | |
| October 31, 2022 |
transaction between market participants at the measurement date (an exit price). Accordingly, the fair value hierarchy gives the highest priority to quoted prices (unadjusted) in active markets for identical assets or liabilities (Level 1) and the lowest priority to unobservable inputs (Level 3). The three levels of the fair value hierarchy under ASC 820 are described below:
Level 1 — Unadjusted quoted prices in active markets for identical, unrestricted assets or liabilities that the Funds have the ability to access at the measurement date;
Level 2 — Other significant observable inputs (includes quoted prices for similar securities, interest rates, prepayment speeds, credit risk, referenced indices, quoted prices in inactive markets, adjusted quoted prices in active markets, adjusted quoted prices on foreign equity securities that were adjusted in accordance with the Adviser’s pricing procedures, etc.)
Level 3 — Prices, inputs or exotic modeling techniques which are both significant to the fair value measurement and unobservable (supported by little or no market activity).
Investments are classified within the level of the lowest significant input considered in determining fair value. Investments classified within Level 3 whose fair value measurement considers several inputs may include Level 1 or Level 2 inputs as components of the overall fair value measurement.
The unobservable inputs used to determine fair value of recurring Level 3 assets may have similar or diverging impacts on valuation. Significant increases and decreases in these inputs in isolation and interrelationships between those inputs could result in significantly higher or lower fair value measurement.
Federal Income Taxes — It is each Fund’s intention to continue to qualify as a regulated investment company for Federal income tax purposes by complying with the appropriate provisions of Subchapter M of the Internal Revenue Code of 1986, as amended, and to distribute substantially all of its income to shareholders. Accordingly, no provision for Federal income taxes has been made in the financial statements.
The Funds evaluate tax positions taken or expected to be taken in the course of preparing the Funds’ tax returns to determine whether it is “more likely- than-not” (i.e., greater than 50-percent) that each tax position will be sustained upon examination by a taxing authority based on the technical merits of the position. Tax positions deemed to meet the more-likely-than-not threshold are recorded as a tax benefit in the current period. The Funds did not record any tax provision in the current period. However, management’s conclusions regarding tax positions taken may be subject to review and adjustment at a later date based on factors including, but not limited to, examination by tax authorities (i.e., the open tax year ends, since inception), on-going analysis of and changes to tax laws, regulations and interpretations thereof.
As of and during the period ended October 31, 2022, the Funds did not have a liability for any unrecognized tax benefits. The Funds recognize interest and penalties, if any, related to unrecognized tax benefits as income tax expense in the Statements of Operations. During the period the Funds did not incur any interest or penalties.
Security Transactions and Investment Income — Security transactions are accounted for on trade date for financial reporting purposes. Dividend income and expense are recorded on the ex-dividend date. Certain dividends from foreign securities will be recorded as soon as the Funds are informed of the dividend if such information is obtained subsequent to the ex-dividend date. Costs used in determining realized gains and losses on the sales of investment securities are based on specific identification. Interest income is recognized on an accrual basis from settlement date. Discounts and premiums on securities purchased are accreted and amortized using the effective interest method. Realized gains (losses) on paydowns of mortgage-backed and asset-backed securities are recorded as an adjustment to interest income.
Foreign Currency Translation — The books and records of the Funds are maintained in U.S. dollars. Investment securities and other assets and liabilities denominated in a foreign currency are translated into U.S. dollars on the date of valuation. The Funds do not isolate that portion of realized or unrealized gains and losses resulting from changes in the foreign exchange rate from fluctuations arising from changes in the market prices of the securities. These gains and losses are included in net realized and unrealized gains and losses on investments on the Statements of Operations. Net realized and unrealized gains and losses on foreign currency transactions represent net foreign exchange gains or losses from foreign currency exchange contracts, disposition of foreign currencies, currency gains or losses realized between trade and settlement dates on securities transactions and the difference between the amount of the investment income and foreign withholding taxes recorded on the Funds’ books and the U.S. dollar equivalent of the amounts actually received or paid.
49
| The Advisors’ Inner Circle Fund III | Barrow Hanley Funds | |
| October 31, 2022 |
Cash — Idle cash may be swept into various time deposit accounts and money market sweep accounts and is classified as cash on the Statements of Assets and Liabilities. The Funds maintain cash in bank deposit accounts which, at times, may exceed United States federally insured limits. Amounts invested are available on the same business day.
Expenses — Expenses of the Trust that can be directly attributed to a particular Fund are borne by that Fund. Expenses which cannot be directly attributed to a Fund are apportioned among the Funds of the Trust based on the number of funds and/or relative net assets.
Dividends and Distributions to Shareholders — The Funds will distribute substantially all of their net investment income and net realized capital gains, if any, at least annually. All distributions are recorded on ex-dividend date.
Investments in REITs — Dividend income from Real Estate Investment Trusts (“REIT”) is recorded based on the income included in distributions received from the REIT investments using published REIT reclassifications, including some management estimates when actual amounts are not available. Distributions received in excess of this estimated amount are recorded as a reduction of the cost of investments or reclassified to capital gains. The actual amounts of income, return of capital, and capital gains are only determined by each REIT after its fiscal year-end, and may differ from the estimated amounts.
Redemption Fees — The Concentrated Emerging Markets ESG Opportunities Fund, Credit Opportunities Fund, Emerging Markets Value Fund, Floating Rate Fund, International Value Fund, Total Return Bond Fund, and US Value Opportunities Fund retain a redemption fee of 1.00% on redemptions of capital shares held for less than thirty days. For the period ended October 31, 2022, no redemption fees were charged.
Deferred Offering Costs — Offering costs of the Funds, including costs of printing the initial prospectus, legal, and registration fees, are amortized to expense over a twelve month period. As of October 31, 2022, the Funds’ have the following remaining to be amortized:
| Deferred Offering Costs | ||||
Concentrated Emerging Markets ESG Opportunities Fund | $ | 14,698 | ||
Credit Opportunities Fund | 14,698 | |||
Emerging Markets Value Fund | 14,223 | |||
Floating Rate Fund | 14,698 | |||
International Value Fund | 14,223 | |||
Total Return Bond Fund | 14,698 | |||
US Value Opportunities Fund | 14,698 | |||
3. Transactions with Affiliates:
Certain officers of the Trust are also employees of SEI Investments Global Funds Services (the “Administrator”), a wholly owned subsidiary of SEI Investments Company, and/or SEI Investments Distribution Co. (the “Distributor”). Such officers are paid no fees by the Trust, other than the Chief Compliance Officer (“CCO”) as described below, for serving as officers of the Trust.
A portion of the services provided by the CCO and his staff, whom are employees of the Administrator, are paid for by the Trust as incurred. The services include regulatory oversight of the Trust’s Advisors and service providers as required by SEC regulations. The CCO’s services and fees have been approved by and are reviewed by the Board.
4. Administration, Distribution, Shareholder Servicing, Transfer Agent and Custody Agreements:
The Funds and SEI Investments Global Fund Services (the “Administrator”) are parties to an Administration Agreement under which the Administrator provides management and administrative services to the Funds. For these services, the Administrator is paid an asset-based fee, which will vary depending on the number of share classes and the average daily net assets of the Funds.
50
| The Advisors’ Inner Circle Fund III | Barrow Hanley Funds | |
| October 31, 2022 |
For the period ended October 31, 2022, the Funds were charged the following for these services:
| Administration Fees | ||||
Concentrated Emerging Markets ESG Opportunities Fund | $5,407 | |||
Credit Opportunities Fund | 118,300 | |||
Emerging Markets Value Fund | 33,017 | |||
Floating Rate Fund | 114,074 | |||
International Value Fund | 40,795 | |||
Total Return Bond Fund | 42,109 | |||
US Value Opportunities Fund | 94,913 | |||
The Trust and the Distribution are parties to a Distribution Agreement. The Distributor receives no fees under the agreement.
The Funds have adopted a shareholder servicing plan that provides that the Funds may pay financial intermediaries for shareholder services in an annual amount not to exceed 0.15% based on the average daily net assets of the Funds’ Y Shares. The Funds do not pay these service fees on shares purchased directly. In addition to payments made directly to financial intermediaries by the Funds, the Adviser or its affiliates may, at their own expense, pay financial intermediaries for these and other services to the Funds’ shareholders.
DST Systems, Inc. serves as the Transfer Agent and dividend disbursing agent for the Funds under a transfer agency agreement.
Brown Brothers Harriman & Co. serves as custodian (the “Custodian”) for the Funds. The Custodian plays no role in determining the investment policies of the Funds or which securities are to be purchased and sold by the Funds.
5. Investment Advisory Agreements and Sub-Advisory Agreements:
The Trust and the Adviser have entered into an investment advisory agreement (the “Advisory Agreement”) with respect to the Funds. Under the Advisory Agreement, the Adviser serves as the investment adviser and makes investment decisions for each Fund and continuously reviews, supervises and administers the investment program of each Fund, subject to the supervision of, and policies established by, the Board.
| Advisory Fee Rate | ||||
Concentrated Emerging Markets ESG Opportunities Fund | 0.93 | % | ||
Credit Opportunities Fund | 0.60 | % | ||
Emerging Markets Value Fund | 0.87 | % | ||
Floating Rate Fund | 0.45 | % | ||
International Value Fund | 0.66 | % | ||
Total Return Bond Fund | 0.35 | % | ||
US Value Opportunities Fund | 0.55 | % | ||
For each Fund, the Adviser has contractually agreed to waive fees and/or reimburse expenses to the extent necessary to keep total Annual Fund operating expenses (excluding interest, taxes, brokerage commissions and other costs and expenses relating to the securities that are purchased and sold by the Fund, shareholder servicing fees, acquired fund fees and expenses, other expenditures which are capitalized in accordance with generally accepted accounting principles and other non-routine expenses, such as litigation (collectively, “excluded expenses”)) for I Shares and Y Shares from exceeding certain levels as set forth below until February 28, 2023 (each, a “contractual expense limit”) for the Emerging Markets Value Fund and the International Value Fund and February 28, 2024 for the Concentrated Emerging Markets ESG Opportunities Fund, the Credit Opportunities Fund, the Floating Rate Fund, the Total Return Bond Fund and US Value Opportunities Fund. This agreement will terminate automatically upon the termination of the Advisory Agreement and may be terminated: (i) by the Board, for any reason at any time; or (ii) by the Adviser, upon ninety (90) days’ prior written notice to the Trust, effective as of the close of business on February 28, 2023 for the Emerging Markets Value Fund and the International Value Fund
51
| The Advisors’ Inner Circle Fund III | Barrow Hanley Funds | |
| October 31, 2022 |
and February 28, 2024 for the Concentrated Emerging Markets ESG Opportunities Fund, the Credit Opportunities Fund, the Floating Rate Fund, the Total Return Bond Fund and US Value Opportunities Fund. The contractual expense limitations for the Funds are as follows:
| I Shares | Y shares | |||||||
Concentrated Emerging Markets ESG Opportunities Fund | 1.05 | % | 1.05 | % | ||||
Credit Opportunities Fund | 0.78 | % | 0.78 | % | ||||
Emerging Markets Value Fund | 0.99 | % | 0.99 | % | ||||
Floating Rate Fund | 0.60 | % | 0.60 | % | ||||
International Value Fund | 0.86 | % | 0.86 | % | ||||
Total Return Bond Fund | 0.35 | % | 0.35 | % | ||||
US Value Opportunities Fund | 0.71 | % | 0.71 | % | ||||
In addition, if at any point it becomes unnecessary for the Adviser to reduce fees or make expense reimbursements, the Board may permit the Adviser to retain the difference between the Total Annual Fund Operating Expenses and the expense caps listed above to recapture all or a portion of its prior fee reductions or reimbursements made during the preceding three-year period.
For the period ended October 31, 2022, the amounts subject to recapture are below:
| Amount Subject to Repayment October 31, 2025 | Total | |||||||
Concentrated Emerging Markets ESG Opportunities Fund | $ | 104,933 | $ | 104,933 | ||||
Credit Opportunities Fund | 211,154 | 211,154 | ||||||
Emerging Markets Value Fund | 225,225 | 225,225 | ||||||
Floating Rate Fund | 257,663 | 257,663 | ||||||
International Value Fund | 215,454 | 215,454 | ||||||
Total Return Bond Fund | 184,792 | 184,792 | ||||||
US Value Opportunities Fund | 143,065 | 143,065 | ||||||
The Adviser further has agreed contractually to waive its investment advisory fee payable by the Credit Opportunities Fund in the amount of the investment advisory fee the Adviser receives from the Floating Rate Fund attributable to the assets of the Credit Opportunities Fund invested in the Floating Rate Fund until February 28, 2024. This agreement will terminate automatically upon the termination of the Fund’s investment advisory agreement and may be terminated: (i) by the Board for any reason at any time; or (ii) by the Adviser, upon ninety (90) days’ prior written notice to the Trust, effective as of the close of business on February 28, 2024.
Barrow, Hanley, Mewhinney & Strauss, LLC, (“Barrow Hanley” or the “Sub-Adviser”), located at 2200 Ross Avenue, 31st Floor, Dallas, TX 75201, serves as a sub-adviser to the Funds. Barrow Hanley, a Delaware limited liability company, is registered as an investment adviser with the SEC and was founded in 1979. Barrow Hanley provides investment advisory services to large institutional clients, mutual funds, employee benefit plans, endowments, foundations, limited liability companies and other institutions and individuals. Barrow Hanley is an indirect subsidiary of Perpetual Limited, a public company listed on the Australian Stock Exchange.
The Sub-Adviser will be responsible for the day-to-day management of each Funds’ investment portfolio in accordance with the investment policies and guidelines of the Funds subject to the general oversight of the Adviser.
The provision of investment advisory services by the Sub-Adviser is governed by an individual investment sub-advisory agreement between the Sub-Adviser and the Adviser (“the Sub-Advisory Agreement”). Under the Sub-Advisory Agreement, the Sub-Adviser is responsible for the day-to-day management of the Funds, makes investment decisions for the Funds and administers the investment program of the Funds, subject to the supervision of, and policies established by, the Adviser and the Board.
After the initial two-year term, the continuance of the Sub-Advisory Agreement must be specifically approved at least annually: (i) by the vote of the Trustees or by a vote of the majority of the outstanding voting securities of the Fund and (ii) by the vote of a majority of the Trustees who are not parties to the Sub-Advisory Agreement or “interested persons” of any party thereto, cast in person at a meeting called for the purpose of voting on such approval. The Sub-Advisory Agreement will terminate automatically in the event of its assignment or in the event of the termination of the Advisory Agreement, and is terminable at any time without penalty by the Board.
52
| The Advisors’ Inner Circle Fund III | Barrow Hanley Funds | |
| October 31, 2022 |
For the services provided pursuant to the Sub-Advisory Agreement, the Sub-Adviser receives an annual fee from the Adviser at the following annual rates based on 50% of the advisory fee rate for each Fund:
| Sub-Adviser Fee Rate | ||||
Concentrated Emerging Markets ESG Opportunities Fund | 0.465 | % | ||
Credit Opportunities Fund | 0.30 | % | ||
Emerging Markets Value | 0.435 | % | ||
Floating Rate Fund | 0.225 | % | ||
International Value | 0.33 | % | ||
Total Return Bond Fund | 0.175 | % | ||
US Value Opportunities Fund | 0.275 | % | ||
6. Investment Transactions:
For the period ended October 31, 2022, the purchases and sales of investment securities other than short-term investments and in-kinds were as follows:
| U.S. Gov’t | Other | Total | |||||||||
Concentrated Emerging Markets ESG Opportunities Fund |
| |||||||||||
Purchases | $ | — | $ | 9,382,006 | $ | 9,382,006 | ||||||
Sales | — | 3,057,141 | 3,057,141 | |||||||||
Credit Opportunities Fund |
| |||||||||||
Purchases | — | 133,071,194 | 133,071,194 | |||||||||
Sales | — | 31,275,377 | 31,275,377 | |||||||||
Emerging Markets Value Fund |
| |||||||||||
Purchases | — | 3,260,956 | 3,260,956 | |||||||||
Sales | — | 750,843 | 750,843 | |||||||||
Floating Rate Fund |
| |||||||||||
Purchases | — | 20,767,975 | 20,767,975 | |||||||||
Sales | — | 1,624,192 | 1,624,192 | |||||||||
International Value Fund |
| |||||||||||
Purchases | — | 12,647,472 | 12,647,472 | |||||||||
Sales | — | 5,635,891 | 5,635,891 | |||||||||
Total Return Bond Fund |
| |||||||||||
Purchases | 27,383,189 | 24,441,641 | 51,824,830 | |||||||||
Sales | 4,029,678 | 4,033,935 | 8,063,613 | |||||||||
US Value Opportunities Fund |
| |||||||||||
Purchases | — | 130,965,749 | 130,965,749 | |||||||||
Sales | — | 42,554,534 | 42,554,534 | |||||||||
7. Federal Tax Information:
The timing and characterization of certain income and capital gains distributions are determined annually in accordance with federal tax regulations which may differ from U.S. GAAP. As a result, net investment income (loss) and net realized gain (loss) on investment transactions for a reporting period may differ significantly from distributions during such period. These book/tax differences may be temporary or permanent in nature. Certain permanent differences are charged or credited to distributable earnings or paid in capital as appropriate, in the period that the differences arise. For the period ended October 31, 2022, there were no permanent differences credited or charged to Paid-in Capital and Distributable earnings.
53
| The Advisors’ Inner Circle Fund III | Barrow Hanley Funds | |
| October 31, 2022 |
The tax character of dividends and distributions declared during the fiscal year ended October 31, 2022 were as follows:
| Ordinary Income | Long-Term Capital Gain | Return of Capital | Total | |||||||||||||
Credit Opportunities Fund | ||||||||||||||||
2022 | $ | 3,544,896 | $ | — | $ | — | $ | 3,544,896 | ||||||||
Floating Rate Fund | ||||||||||||||||
2022 | 3,068,871 | — | — | 3,068,871 | ||||||||||||
Total Return Bond Fund | ||||||||||||||||
2022 | 580,835 | — | — | 580,835 | ||||||||||||
As of October 31, 2022, the components of distributable earnings (accumulated losses) on a tax basis were as follows:
| Undistributed Ordinary Income | Undistributed Long-Term Capital Gain | Capital Loss Carryforwards | Unrealized Appreciation (Depreciation) | Other Temporary Differences | Total Distributable Earnings (Accumulated Losses) | |||||||||||||||||||
Concentrated Emerging Markets ESG Opportunities Fund | $ | 115,421 | $ | — | $ | (318,291 | ) | $ | (874,875 | ) | $ | 3 | $ | (1,077,742 | ) | |||||||||
Credit Opportunities Fund | 441,296 | — | (2,188,057 | ) | (11,412,787 | ) | — | (13,159,548 | ) | |||||||||||||||
Emerging Markets Value Fund | 55,236 | — | (62,096 | ) | (317,751 | ) | — | (324,611 | ) | |||||||||||||||
Floating Rate Fund | 690,247 | — | (459,562 | ) | (6,999,274 | ) | 2 | (6,768,587 | ) | |||||||||||||||
International Value Fund | 159,466 | — | (322,605 | ) | (798,042 | ) | (849 | ) | (962,030 | ) | ||||||||||||||
Total Return Bond Fund | 112,930 | — | (109,291 | ) | (4,286,289 | ) | (1 | ) | (4,282,651 | ) | ||||||||||||||
US Value Opportunities Fund | 664,338 | 368,045 | — | 7,546,820 | | — | | 8,579,203 | ||||||||||||||||
The Funds have capital losses carried forward as follows:
| Short-Term Loss | Long-Term Loss | Total | ||||||||||
Concentrated Emerging Markets ESG Opportunities Fund | $ | 261,262 | $ | 57,029 | $ | 318,291 | ||||||
Credit Opportunities Fund | 516,782 | 1,671,275 | 2,188,057 | |||||||||
Emerging Markets Value Fund | 62,096 | — | 62,096 | |||||||||
Floating Rate Fund | 262,896 | 196,666 | 459,562 | |||||||||
International Value Fund | 322,605 | — | 322,605 | |||||||||
Total Return Bond Fund | 49,686 | 59,605 | 109,291 | |||||||||
For Federal income tax purposes, the difference between Federal tax cost and book cost primarily relates to wash sale transactions. The Federal tax cost and aggregate gross unrealized appreciation and depreciation for investments held by Funds at October 31, 2022, were as follows:
| Federal Tax Cost | Appreciated Securities | Depreciated Securities | Net Unrealized Appreciation/ (Depreciation) | |||||||||||||
Concentrated Emerging Markets ESG Opportunities Fund | $ | 6,009,492 | $ | 146,609 | $ | (1,021,484) | $ | (874,875) | ||||||||
Credit Opportunities Fund | 103,598,267 | 102,949 | (11,515,736) | (11,412,787) | ||||||||||||
Emerging Markets Value Fund | 2,448,251 | 90,572 | (408,323) | (317,751) | ||||||||||||
Floating Rate Fund | 110,651,984 | 10,619 | (7,009,893) | (6,999,274) | ||||||||||||
International Value Fund | 6,689,518 | 169,962 | (968,004) | (798,042) | ||||||||||||
Total Return Bond Fund | 44,423,621 | 3,926 | (4,290,215) | (4,286,289) | ||||||||||||
US Value Opportunities Fund | 88,757,953 | 14,359,696 | (6,812,876) | 7,546,820 | ||||||||||||
54
| The Advisors’ Inner Circle Fund III | Barrow Hanley Funds | |
| October 31, 2022 |
8. Concentration of Risks:
As with all mutual funds, there is no guarantee that the Funds will achieve their investment objectives. You could lose money by investing in the Funds. A Fund share is not a bank deposit and is not insured or guaranteed by the Federal Deposit Insurance Corporation or any government agency. The principal risk factors affecting shareholders’ investments in the Funds are set forth below.
Credit Risk – The risk that the issuer of a security or the counterparty to a contract will default or otherwise become unable to honor a financial obligation.
Interest Rate Risk – As with most funds that invest in fixed income securities, changes in interest rates could affect the value of your investment. Rising interest rates tend to cause the prices of fixed income securities (especially those with longer maturities and lower credit qualities) and the Fund’s share price to fall. Very low or negative interest rates may prevent the Fund from generating positive returns and may increase the risk that if followed by rising interest rates the Fund’s performance will be negatively impacted.
Fixed Income Securities Risk – The prices of the Fund’s fixed income securities respond to economic developments, particularly interest rate changes, as well as to perceptions about the creditworthiness of individual issuers, including governments and their agencies. Generally, the Fund’s fixed income securities will decrease in value if interest rates rise and vice versa. In a low interest rate environment, risks associated with rising rates are heightened. Declines in dealer market-making capacity as a result of structural or regulatory changes could decrease liquidity and/or increase volatility in the fixed income markets.
Corporate Fixed Income Securities Risk – The prices of the Fund’s corporate fixed income securities respond to economic developments, particularly interest rate changes, as well as to perceptions about the creditworthiness and business prospects of individual issuers.
Commercial Paper Risk – Commercial paper is a short-term obligation with a maturity generally ranging from one to 270 days and is issued by U.S. or foreign companies or other entities in order to finance their current operations. Such investments are unsecured and usually discounted from their value at maturity. The value of commercial paper may be affected by changes in the credit rating or financial condition of the issuing entities and will tend to fall when interest rates rise and rise when interest rates fall. Asset-backed commercial paper may be issued by structured investment vehicles or other conduits that are organized to issue the commercial paper and to purchase trade receivables or other financial assets. The repayment of asset-backed commercial paper depends primarily on the cash collections received from such an issuer’s underlying asset portfolio and the issuer’s ability to issue new asset-backed commercial paper.
Equity Risk – Since it purchases equity securities, the Fund is subject to the risk that stock prices may fall over short or extended periods of time. Historically, the equity market has moved in cycles, and the value of the Fund’s securities may fluctuate from day to day. Individual companies may report poor results or be negatively affected by industry and/or economic trends and developments. The prices of securities issued by such companies may suffer a decline in response. These factors contribute to price volatility. Common stock is generally subordinate to preferred stock and debt securities with respect to the payment of dividends and upon the liquidation or bankruptcy of the issuing company.
Emerging Markets Securities Risk – The Fund’s investments in emerging markets securities are considered speculative and subject to heightened risks in addition to the general risks of investing in foreign securities. Unlike more established markets, emerging markets may have governments that are less stable, markets that are less liquid and economies that are less developed. In addition, the securities markets of emerging market countries may consist of companies with smaller market capitalizations and may suffer periods of relative illiquidity; significant price volatility; restrictions on foreign investment; and possible restrictions on repatriation of investment income and capital. Furthermore, foreign investors may be required to register the proceeds of sales, and future economic or political crises could lead to price controls, forced mergers, expropriation or confiscatory taxation, seizure, nationalization or creation of government monopolies. Due to the differences in the nature and quality of financial information of issuers of emerging market securities, including auditing and financial reporting standards, financial information and disclosures about such issuers may be unavailable or, if made available, may be considerably less reliable than publicly available information about other foreign securities.
Custody Risk – Custody risk refers to the risks inherent in the process of clearing and settling trades and to the holding of securities, cash and other assets by local banks, agents and depositories. Low trading volumes and volatile prices in less developed markets make trades harder to complete and settle, and governments or trade groups may compel local agents to hold securities in designated depositories that may not be subject to independent evaluation. Communications between the U.S. and emerging market countries may be unreliable, increasing the risk of delayed settlements or losses of security certificates. Practices in relation to the settlement of securities transactions in emerging markets involve higher risks than those in developed markets. In addition, the laws of certain countries may put limits on the Fund’s ability to recover its assets if a foreign bank or depository or issuer of a security or an agent of any of the foregoing goes bankrupt. The Fund would absorb any loss resulting from such custody problems and may have no successful claim for compensation.
55
| The Advisors’ Inner Circle Fund III | Barrow Hanley Funds | |
| October 31, 2022 |
Foreign Company Risk – Investing in foreign companies, including direct investments and investments through ADRs, poses additional risks since political and economic events unique to a country or region will affect those markets and their issuers. These risks will not necessarily affect the U.S. economy or similar issuers located in the United States. Securities of foreign companies may not be registered with the U.S. Securities and Exchange Commission (the “SEC”) and foreign companies are generally not subject to the same level of regulatory controls imposed on U.S. issuers and, as a consequence, there is generally less publicly available information about foreign securities than is available about domestic securities. Income from foreign securities owned by the Fund may be reduced by a withholding tax at the source, which tax would reduce income received from the securities comprising the Fund’s portfolio. Foreign securities may also be more difficult to value than securities of U.S. issuers and foreign markets and securities may be less liquid. In addition, periodic U.S. Government restrictions on investments in issuers from certain foreign countries may require the Fund to sell such investments at inopportune times, which could result in losses to the Fund. In addition, periodic U.S. Government restrictions on investments in issuers from certain foreign countries may require the Fund to sell such investments at inopportune times, which could result in losses to the Fund.
Foreign Currency Risk – Currency risk is the risk that foreign currencies will decline in value relative to the U.S. dollar, in which case the dollar value of the Fund’s investments in securities denominated in, and/or receiving revenues in, foreign currencies, would be adversely affected.
Geographic Focus Risk – To the extent that it focuses its investments in a particular country or geographic region, the Fund may be more susceptible to economic, political, regulatory or other events or conditions affecting issuers and countries within that country or geographic region. As a result, the Fund may be subject to greater price volatility and risk of loss than a fund holding more geographically diverse investments.
Risk of Investing in China – The Chinese economy is generally considered an emerging market and can be significantly affected by economic and political conditions and policy in China and surrounding Asian countries. A relatively small number of Chinese companies represents a large portion of China’s total market and thus may be more sensitive to adverse political or economic circumstances and market movements. The economy of China differs, often unfavorably, from the U.S. economy in such respects as structure, general development, government involvement, wealth distribution, rate of inflation, growth rate, allocation of resources and capital reinvestment, among others. Under China’s political and economic system, the central government has historically exercised substantial control over virtually every sector of the Chinese economy through administrative regulation and/or state ownership. In addition, expropriation, including nationalization, confiscatory taxation, political, economic or social instability or other developments could adversely affect and significantly diminish the values of the Chinese companies in which the Fund invests. The Fund may invest in shares of Chinese companies traded on stock markets in China or Hong Kong. These stock markets have recently experienced high levels of volatility, which may continue in the future. The Hong Kong stock market may behave differently from the China stock markets and there may be little to no correlation between the performance of the Hong Kong stock market and the China stock markets.
Stock Connect Investing Risk – Trading through Stock Connect is subject to a number of restrictions that may affect the Fund’s investments and returns. For example, trading through Stock Connect is subject to daily quotas that limit the maximum daily net purchases on any particular day, which may restrict or preclude the Fund’s ability to invest in China A Shares through Stock Connect. In addition, investments made through Stock Connect are subject to trading, clearance and settlement procedures that are relatively untested, which could pose risks to the Fund. Moreover, China A Shares purchased through Stock Connect generally may not be sold, purchased or otherwise transferred other than through Stock Connect in accordance with applicable rules. A primary feature of Stock Connect is the application of the home market’s laws and rules applicable to investors in China A Shares. Therefore, the Fund’s investments in China A Shares purchased through Stock Connect are generally subject to Chinese securities regulations and listing rules, among other restrictions. While overseas investors currently are exempt from paying capital gains or value added taxes on income and gains from investments in China A Shares purchased through Stock Connect, these tax rules could be changed, which could result in unexpected tax liabilities for the Fund. Stock Connect will only operate on days when both the China and Hong Kong markets are open for trading and when banks in both markets are open on the corresponding settlement days. There may be occasions when the Fund may be subject to the risk of price fluctuations of China A Shares during the time when Stock Connect is not trading. Stock Connect is a relatively new program. Further developments are likely and there can be no assurance as to the program’s continued existence or whether future developments regarding the program may restrict or adversely affect the Fund’s investments or returns. In addition, the application and interpretation of the laws and regulations of Hong Kong and China, and the rules, policies or guidelines published or applied by relevant regulators and exchanges in respect of Stock Connect are uncertain, and they may have a detrimental effect on the Fund’s investments and returns.
Large Capitalization Risk – The risk that larger, more established companies may be unable to respond quickly to new competitive challenges such as changes in technology and consumer tastes. Larger companies also may not be able to attain the high growth rates of successful smaller companies.
56
| The Advisors’ Inner Circle Fund III | Barrow Hanley Funds | |
| October 31, 2022 |
Small and Medium Capitalization Risk – The risk that small and medium capitalization companies in which the Fund may invest may be more vulnerable to adverse business or economic events than larger, more established companies. In particular, small and medium capitalization companies may have limited product lines, markets and financial resources and may depend upon a relatively small management group. Therefore, small capitalization and medium capitalization stocks may be more volatile than those of larger companies. Small capitalization and medium capitalization stocks may be traded OTC. OTC stocks may trade less frequently and in smaller volume than exchange listed stocks and may have more price volatility than that of exchange-listed stocks.
Depositary Receipts Risk – While ADRs provide an alternative to directly purchasing the underlying foreign securities in their respective national markets and currencies, investments in ADRs continue to be subject to many of the risks associated with investing directly in foreign securities. Investments in ADRs may be less liquid and more volatile than the underlying securities in their primary trading market. If an ADR is denominated in a different currency than its underlying securities, the Fund will be subject to the currency risk of both the investment in the ADR and the underlying security. Holders of ADRs may have limited or no rights to take action with respect to the underlying securities or to compel the issuer of the receipts to take action. The prices of ADRs may differ from the prices of securities upon which they are based. U.S. Government Securities Risk – The Fund’s investment in U.S. government obligations may include securities issued or guaranteed as to principal and interest by the U.S. government, or its agencies or instrumentalities. Payment of principal and interest on U.S. government obligations may be backed by the full faith and credit of the United States or may be backed solely by the issuing or guaranteeing agency or instrumentality itself. There can be no assurance that the U.S. government would provide financial support to its agencies or instrumentalities (including government-sponsored enterprises) where it is not obligated to do so. In addition, U.S. government securities are not guaranteed against price movements due to changing interest rates.
Inflation Protected Securities Risk – The value of inflation protected securities, including TIPS, will generally fluctuate in response to changes in “real” interest rates, generally decreasing when real interest rates rise and increasing when real interest rates fall. Real interest rates represent nominal (or stated) interest rates reduced by the expected impact of inflation. In addition, interest payments on inflation-indexed securities will generally vary up or down along with the rate of inflation.
Municipal Bonds Risk – The Fund could be impacted by events in the municipal securities market. Negative events, such as severe fiscal difficulties, bankruptcy, an economic downturn, unfavorable legislation, court rulings or political developments could adversely affect the ability of municipal issuers to repay principal and to make interest payments.
Bank Loans Risk – Investments in bank loans (through both assignments and participations) are generally subject to the same risks as investments in other types of debt instruments, including, in many cases, investments in high yield bonds. There may be limited public information available regarding bank loans and bank loans may be difficult to value. If the Fund holds a bank loan through another financial institution, or relies on a financial institution to administer the loan, its receipt of principal and interest on the loan may be subject to the credit risk of that financial institution. It is possible that collateral securing a loan, if any, may be insufficient or unavailable to the Fund, and that the Fund’s rights to collateral may be limited by bankruptcy or insolvency laws. In addition, the secondary market for bank loans may be subject to irregular trading activity and wide bid/ask spreads, which may cause the Fund to be unable to realize the full value of its investment in a bank loan. Bank loans may have extended settlement periods that exceed seven days and, accordingly, may be considered illiquid. Purchases and sales of loans in the secondary market generally are subject to contractual restrictions that may delay the Fund’s ability to make timely redemptions.
Bank loans may not be considered “securities,” and purchasers, such as the Fund, therefore may not be entitled to rely on the anti-fraud protections of the federal securities laws.
Mortgage-Backed Securities Risk – Mortgage-backed securities are affected by, among other things, interest rate changes and the possibility of prepayment of the underlying mortgage loans. Mortgage-backed securities are also subject to the risk that underlying borrowers will be unable to meet their obligations.
Asset-Backed Securities Risk – Payment of principal and interest on asset-backed securities is dependent largely on the cash flows generated by the assets backing the securities, and asset-backed securities may not have the benefit of any security interest in the related assets.
Convertible Securities Risk – The value of a convertible security is influenced by changes in interest rates (with investment value declining as interest rates increase and increasing as interest rates decline) and the credit standing of the issuer. The price of a convertible security will also normally vary in some proportion to changes in the price of the underlying common stock because of the conversion or exercise feature.
57
| The Advisors’ Inner Circle Fund III | Barrow Hanley Funds | |
| October 31, 2022 |
High Yield Bond Risk – High yield, or “junk,” bonds are debt securities rated below investment grade. High yield bonds are speculative, involve greater risks of default, downgrade, or price declines and are more volatile and tend to be less liquid than investment-grade securities. Companies issuing high yield bonds are less financially strong, are more likely to encounter financial difficulties, and are more vulnerable to adverse market events and negative sentiments than companies with higher credit ratings.
Liquidity Risk – Certain securities may be difficult or impossible to sell at the time and the price that the Fund would like. The Fund may have to accept a lower price to sell a security, sell other securities to raise cash, or give up an investment opportunity, any of which could have a negative effect on Fund management or performance.
Prepayment Risk – The risk that, in a declining interest rate environment, fixed income securities with stated interest rates may have the principal paid earlier than expected, requiring the Fund to invest the proceeds at generally lower interest rates.
Extension Risk – The risk that rising interest rates may extend the duration of a fixed income security, typically reducing the security’s value.
Active Management Risk – The Fund is subject to the risk that the Adviser’s or the Sub-Adviser’s judgments about the attractiveness, value, or potential appreciation of the Fund’s investments may prove to be incorrect. If the investments selected and strategies employed by the Fund fail to produce the intended results, the Fund could underperform in comparison to its benchmark index or other funds with similar objectives and investment strategies.
New Adviser Risk – The Adviser is a newly registered investment adviser and has not previously managed a mutual fund. As a result, there is no long-term track record against which an investor may judge the Adviser and it is possible the Adviser may not achieve the Fund’s intended investment objective.
New Fund Risk – Because the Fund is new, investors in the Fund bear the risk that the Fund may not be successful in implementing its investment strategy, may not employ a successful investment strategy, or may fail to attract sufficient assets under management to realize economies of scale, any of which could result in the Fund being liquidated at any time without shareholder approval and at a time that may not be favorable for all shareholders. Such liquidation could have negative tax consequences for shareholders and will cause shareholders to incur expenses of liquidation.
Market Risk – The prices of and the income generated by the Fund’s securities may decline in response to, among other things, investor sentiment, general economic and market conditions, regional or global instability, and currency and interest rate fluctuations. In addition, the impact of any epidemic, pandemic or natural disaster, or widespread fear that such events may occur, could negatively affect the global economy, as well as the economies of individual countries, the financial performance of individual companies and sectors, and the markets in general in significant and unforeseen ways. Any such impact could adversely affect the prices and liquidity of the securities and other instruments in which the Fund invests, which in turn could negatively impact the Fund’s performance and cause losses on your investment in the Fund. Market risk may affect a single issuer, an industry, a sector or the equity or bond market as a whole.
LIBOR Replacement Risk – The elimination of the London Inter-Bank Offered Rate (“LIBOR”) may adversely affect the interest rates on, and value of, certain Fund investments for which the value is tied to LIBOR. The U.K. Financial Conduct Authority has announced that it intends to stop compelling or inducing banks to submit LIBOR rates after 2021. The publication of LIBOR on a representative basis ceased for the one-week and two-month U.S. dollar LIBOR settings immediately after December 31, 2021 and is expected to cease for the remaining U.S. dollar LIBOR settings immediately after June 30, 2023. Alternatives to LIBOR are established or in development in most major currencies, including the Secured Overnight Financing Rate (“SOFR”), which is intended to replace U.S. dollar LIBOR. Markets are slowly developing in response to these new rates. Questions around liquidity impacted by these rates, and how to appropriately adjust these rates at the time of transition, remain a concern for the Fund. Accordingly, it is difficult to predict the full impact of the transition away from LIBOR on the Fund until new reference rates and fallbacks for both legacy and new products, instruments and contracts are commercially accepted.
Management/Systematic or Quantitative Process Risk – The value of the Fund may decline if the Adviser’s or the Sub-Adviser’s judgments about the attractiveness, relative value or potential appreciation of a particular security or strategy prove to be incorrect. Because the Adviser and the Sub-Adviser each relies, in part, on a systematic, quantitative screening process in selecting securities for the Fund, the Fund is subject to the additional risk that the Adviser’s or the Sub-Adviser’s judgments regarding the investment criteria underlying the screening process may prove to be incorrect.
58
| The Advisors’ Inner Circle Fund III | Barrow Hanley Funds | |
| October 31, 2022 |
The foregoing is not intended to be a complete discussion of the risks associated with investing in the Funds. A more complete description of risks associated with the Funds is included in the prospectus and statement of additional information.
9. In-Kind Transactions:
The Funds received contributions in-kind of investment securities in connection to the reorganization on April 12, 2022. The securities were received in a tax-free transaction at their current fair value including unrealized appreciation/(deprecation) on the date of the transactions. The Funds made an accounting policy election to carryforward the historical cost basis of the securities transferred given the tax-free nature of the transaction. As a result of this contribution, the following units of the Funds were issued for assets valued at:
Fund Name | Transaction Date | Shares Issued | Securities at Value | Cash | Income Receivable | Other | Total | Unrealized Appreciation /(Depreciation) | ||||||||||||||||||||||||
Concentrated Emerging Markets ESG Opportunities Fund | 4/12/2022 | 572,284 | $ | 3,609,032 | $ | 2,127,409 | $ | 19,404 | $(33,025) | $ | 5,722,820 | $ | 133,748 | |||||||||||||||||||
Credit Opportunities Fund | 4/12/2022 | 12,695,339 | 124,487,417 | 949,695 | 1,516,281 | (3,842 | ) | 126,949,551 | (1,119,326 | ) | ||||||||||||||||||||||
Floating Rate Fund | 4/12/2022 | 11,905,925 | 124,067,612 | 5,066,323 | 519,534 | (10,589,673 | ) | 119,063,796 | (424,804 | ) | ||||||||||||||||||||||
Total Return Bond Fund | 4/12/2022 | 4,278,912 | 41,963,009 | 421,387 | 194,833 | 209,401 | 42,788,630 | (169,143 | ) | |||||||||||||||||||||||
US Value Opportunities Fund | 4/12/2022 | 10,488,203 | 101,862,969 | 2,767,933 | 251,127 | 10 | 104,882,039 | 13,319,039 | ||||||||||||||||||||||||
10. Concentration of Shareholders:
At October 31, 2022, the percentage of total shares outstanding held by shareholders for each Fund, which are comprised of individual shareholders and omnibus accounts that are held on behalf of various individual shareholders was as follows:
| No. of Shareholders I Shares | % Ownership | No, of Shareholders Y Shares | % Ownership | |||||||||||
Concentrated Emerging Markets ESG Opportunities Fund | 4 | 95 | % | — | — | |||||||||
Credit Opportunities Fund | 3 | 54 | % | — | — | |||||||||
Emerging Markets Value Fund | 2 | 100 | % | 1 | 100 | % | ||||||||
Floating Rate Fund | 3 | 89 | % | — | — | |||||||||
International Value Fund | 3 | 100 | % | 1 | 100 | % | ||||||||
Total Return Bond Fund | 6 | 83 | % | — | — | |||||||||
US Value Opportunities Fund | 5 | 88 | % | — | — | |||||||||
11. Indemnifications:
In the normal course of business, the Funds enter into contracts that provide general indemnifications. The Funds’ maximum exposure under these arrangements is dependent on future claims that may be made against the Funds and, therefore, cannot be established; however, based on experience, the risk of loss from such claims is considered remote.
12. Subsequent Events:
The Funds have evaluated the need for additional disclosures and/or adjustments resulting from subsequent events through the date the financial statements were issued. Based on this evaluation, no additional disclosures and/or adjustments were required to the financial statements as of October 31, 2022.
59
| The Advisors’ Inner Circle Fund III | Barrow Hanley Funds | |
| October 31, 2022 |
Report of Independent Registered Public Accounting Firm
|
To the Board of Trustees of The Advisors’ Inner Circle Fund III
and the Shareholders of the Funds:
Opinion on the Financial Statements
We have audited the accompanying statements of assets and liabilities of Barrow Hanley Concentrated Emerging Markets ESG Opportunities Fund, Barrow Hanley Credit Opportunities Fund, Barrow Hanley Emerging Markets Value Fund, Barrow Hanley Floating Rate Fund, Barrow Hanley International Value Fund, Barrow Hanley Total Return Bond Fund, and Barrow Hanley US Value Opportunities Fund (seven of the funds comprising the The Advisors’ Inner Circle Fund III (the Funds)), including the schedules of investments, as of October 31, 2022, the related statements of operations and changes in net assets for the periods listed in Appendix A, and the related notes (collectively, the financial statements) and the financial highlights for the periods then ended. In our opinion, the financial statements and financial highlights present fairly, in all material respects, the financial position of the Funds as of October 31, 2022, the results of their operations for the period then ended, the changes in their net assets for the period then ended, and the financial highlights for the period presented therein, in conformity with U.S. generally accepted accounting principles.
Basis for Opinion
These financial statements and financial highlights are the responsibility of the Funds’ management. Our responsibility is to express an opinion on these financial statements and financial highlights based on our audits. We are a public accounting firm registered with the Public Company Accounting Oversight Board (United States) (PCAOB) and are required to be independent with respect to the Funds in accordance with the U.S. federal securities laws and the applicable rules and regulations of the Securities and Exchange Commission and the PCAOB.
We conducted our audits in accordance with the standards of the PCAOB. Those standards require that we plan and perform the audit to obtain reasonable assurance about whether the financial statements and financial highlights are free of material misstatement, whether due to error or fraud. Our audits included performing procedures to assess the risks of material misstatement of the financial statements and financial highlights, whether due to error or fraud, and performing procedures that respond to those risks. Such procedures included examining, on a test basis, evidence regarding the amounts and disclosures in the financial statements and financial highlights. Such procedures also included confirmation of securities owned as of October 31, 2022, by correspondence with custodians, transfer agents, agent banks and brokers; when replies were not received from brokers, we performed other auditing procedures. Our audits also included evaluating the accounting principles used and significant estimates made by management, as well as evaluating the overall presentation of the financial statements and financial highlights. We believe that our audits provide a reasonable basis for our opinion.

We have served as the auditor of one or more The Advisors’ Inner Circle Fund III investment companies since 2021.
Philadelphia, Pennsylvania
December 29, 2022
60
| The Advisors’ Inner Circle Fund III | Barrow Hanley Funds | |
| October 31, 2022 |
Appendix A
Barrow Hanley Concentrated Emerging Markets ESG Opportunities Fund
Statements of operations and changes in net assets and financial highlights for the period from April 12, 2022 (commencement of operations) through October 31, 2022
Barrow Hanley Credit Opportunities Fund
Statements of operations and changes in net assets and financial highlights for the period from April 12, 2022 (commencement of operations) through October 31, 2022
Barrow Hanley Emerging Markets Value Fund
Statements of operations and changes in net assets and financial highlights for the period from December 29, 2021 (commencement of operations) through October 31, 2022
Barrow Hanley Floating Rate Fund
Statements of operations and changes in net assets and financial highlights for the period from April 12, 2022 (commencement of operations) through October 31, 2022
Barrow Hanley International Value Fund
Statements of operations and changes in net assets and financial highlights for the period from December 29, 2021 (commencement of operations) through October 31, 2022
Barrow Hanley Total Fund
Statements of operations and changes in net assets and financial highlights for the period from April 12, 2022 (commencement of operations) through October 31, 2022
Barrow Hanley US Value Opportunities Fund
Statements of operations and changes in net assets and financial highlights for the period from April 12, 2022 (commencement of operations) through October 31, 2022
61
| The Advisors’ Inner Circle Fund III | Barrow Hanley Funds | |
| October 31, 2022 |
DISCLOSURE OF FUND EXPENSES (Unaudited)
|
All mutual funds have operating expenses. As a shareholder of a mutual fund, your investment is affected by these ongoing costs, which include (among others) costs for Fund management, administrative services, and shareholder reports like this one. It is important for you to understand the impact of these costs on your investment returns.
Operating expenses such as these are deducted from the mutual fund’s gross income and directly reduce your final investment return. These expenses are expressed as a percentage of the mutual fund’s average net assets; this percentage is known as the mutual fund’s expense ratio.
The following examples use the expense ratio and are intended to help you understand the ongoing costs (in dollars) of investing in your Fund and to compare these costs with those of other mutual funds. The examples are based on an investment of $1,000 made at the beginning of the period shown and held for the entire period from May 1, 2022 to October 31, 2022.
The table on the next page illustrates your Fund’s costs in two ways:
• Actual Fund Return. This section helps you to estimate the actual expenses after fee waivers that your Fund incurred over the period. The “Expenses Paid During Period” column shows the actual dollar expense cost incurred by a $1,000 investment in the Fund, and the “Ending Account Value” number is derived from deducting that expense cost from the Fund’s gross investment return.
You can use this information, together with the actual amount you invested in the Fund, to estimate the expenses you paid over that period. Simply divide your ending starting account value by $1,000 to arrive at a ratio (for example, an $8,600 account value divided by $1,000 = 8.6), then multiply that ratio by the number shown for your Fund under “Expenses Paid During Period.”
• Hypothetical 5% Return. This section helps you compare your Fund’s costs with those of other mutual funds. It assumes that the Fund had an annual 5% return before expenses during the year, but that the expense ratio (Column 3) for the period is unchanged. This example is useful in making comparisons because the Securities and Exchange Commission requires all mutual funds to make this 5% calculation. You can assess your Fund’s comparative cost by comparing the hypothetical result for your Fund in the “Expenses Paid During Period” column with those that appear in the same charts in the shareholder reports for other mutual funds.
Note: Because the return is set at 5% for comparison purposes — NOT your Fund’s actual return — the account values shown may not apply to your specific investment.
Beginning Account Value 5/1/22 | Ending Account Value 10/31/22 | Annualized Expense Ratios | Expenses Paid During Period* | |||||||||||||
Concentrated Emerging Markets ESG Opportunities Fund |
| |||||||||||||||
Actual Fund Return |
| |||||||||||||||
I Shares | $ | 1,000.00 | $ | 804.20 | 1.05 | % | $ | 4.77 | ||||||||
Hypothetical 5% Return |
| |||||||||||||||
I Shares | $ | 1,000.00 | $ | 1,019.91 | 1.05 | % | $ | 5.35 | ||||||||
Credit Opportunities Fund |
| |||||||||||||||
Actual Fund Return |
| |||||||||||||||
I Shares | $ | 1,000.00 | $ | 946 .00 | 0.78 | % | $ | 3.83 | ||||||||
Hypothetical 5% Return |
| |||||||||||||||
I Shares | $ | 1,000.00 | $ | 1,021.27 | 0.78 | % | $ | 3.97 | ||||||||
Emerging Markets Value Fund |
| |||||||||||||||
Actual Fund Return |
| |||||||||||||||
I Shares | $ | 1,000.00 | $ | 848.70 | 0.99 | % | $ | 4.61 | ||||||||
Y Shares | 1,000 .00 | 848 .50 | 1.14 | % | 5.31 | |||||||||||
Hypothetical 5% Return |
| |||||||||||||||
I Shares | $ | 1,000.00 | $ | 1,020.21 | 0.99 | % | $ | 5.04 | ||||||||
Y Shares | 1,000 .00 | 1,019 .46 | 1.14 | % | 5.80 | |||||||||||
62
| The Advisors’ Inner Circle Fund III | Barrow Hanley Funds | |
| October 31, 2022 |
Beginning Account Value 5/1/22 | Ending Account Value 10/31/22 | Annualized Expense Ratios | Expenses Paid During Period* | |||||||||||||
Floating Rate Fund |
| |||||||||||||||
Actual Fund Return |
| |||||||||||||||
I Shares | $ | 1,000.00 | $ | 974.80 | 0.60 | % | $ | 2.99 | ||||||||
Hypothetical 5% Return |
| |||||||||||||||
I Shares | $ | 1,000.00 | $ | 1,022.18 | 0.60 | % | $ | 3.06 | ||||||||
International Value Fund |
| |||||||||||||||
Actual Fund Return |
| |||||||||||||||
I Shares | $ | 1,000.00 | $ | 869 .30 | 0.86 | % | $ | 4.05 | ||||||||
Y Shares | 1,000 .00 | 868 .30 | 1.01 | % | 4.76 | |||||||||||
Hypothetical 5% Return |
| |||||||||||||||
I Shares | $ | 1,000.00 | $ | 1,020.87 | 0.86 | % | $ | 4.38 | ||||||||
Y Shares | 1,000 .00 | 1,020 .11 | 1.01 | % | 5.14 | |||||||||||
Total Return Bond Fund |
| |||||||||||||||
Actual Fund Return |
| |||||||||||||||
I Shares | $ | 1,000.00 | $ | 929 .20 | 0.35 | % | $ | 1.70 | ||||||||
Hypothetical 5% Return |
| |||||||||||||||
I Shares | $ | 1,000.00 | $ | 1,023.44 | 0.35 | % | $ | 1.79 | ||||||||
US Value Opportunities Fund |
| |||||||||||||||
Actual Fund Return |
| |||||||||||||||
I Shares | $ | 1,000.00 | $ | 988 .60 | 0.71 | % | $ | 3.56 | ||||||||
Hypothetical 5% Return |
| |||||||||||||||
I Shares | $ | 1,000.00 | $ | 1,021.63 | 0.71 | % | $ | 3.62 | ||||||||
* Expenses are equal to the Fund’s annualized expense ratio multiplied by the average account value over the period, multiplied by 184/365 (to reflect the one-half year period).
63
| The Advisors’ Inner Circle Fund III | Barrow Hanley Funds | |
| October 31, 2022 |
TRUSTEES AND OFFICERS OF THE ADVISORS’ INNER CIRCLE FUND III (Unaudited)
|
Set forth below are the names, years of birth, positions with the Trust, length of term of office, and the principal occupations for the last five years of each of the persons currently serving as Trustees and Officers of the Trust. Unless otherwise noted, the business address of each Trustee is SEI Investments Company, One Freedom Valley Drive, Oaks, Pennsylvania 19456. Trustees who are deemed not to be “interested persons” of the Trust are referred to as “Independent Board Members.” Mr. Doran is a Trustee who may be deemed to be “interested” person of the Trust as that term is defined in the 1940 Act by virtue of their affiliation with the Trust’s Distributor. The Trust’s Statement of Additional Information (“SAI”) includes additional information about the Trustees and Officers. The SAI may be obtained without charge by calling 1-866-778-6397. The following chart lists Trustees and Officers as of October 31, 2022.
Name and Year of Birth | Position with Trust and Length of Time Served1 | Principal Occupations in the Past Five Years | Other Directorships Held in the Past Five Years2 | |||
| INTERESTED TRUSTEES3,4 |
|
| ||||
William M. Doran (Born: 1940) | Chairman of the Board of Trustees (since 2014) | Self-Employed Consultant since 2003. Partner at Morgan, Lewis & Bockius LLP (law firm) from 1976 to 2003. Counsel to the Trust, SEI Investments, SIMC, the Administrator and the Distributor. Secretary of SEI Investments since 1978. | Current Directorships: Trustee of Gallery Trust, Delaware Wilshire Private Markets Master Fund, Delaware Wilshire Private Markets Fund, Delaware Wilshire Private Markets Tender Fund, SEI Daily Income Trust, SEI Institutional International Trust, SEI Institutional Investments Trust, SEI Institutional Managed Trust, SEI Asset Allocation Trust, SEI Tax Exempt Trust, Adviser Managed Trust, New Covenant Funds, SEI Insurance Products Trust and SEI Catholic Values Trust. Director of SEI Investments, SEI Investments (Europe), Limited, SEI Investments—Global Funds Services, Limited, SEI Investments Global, Limited, SEI Investments (Asia), Limited, SEI Global Nominee Ltd., SEI Investments – Unit Trust Management (UK) Limited and SEI Investments Co. Director of the Distributor.
Former Directorships: Trustee of Winton Series Trust to 2017. Trustee of The Advisors’ Inner Circle Fund, The Advisors’ Inner Circle Fund II, Bishop Street Funds, The KP Funds and Winton Diversified Opportunities Fund (closed-end investment company) to 2018. Trustee of Schroder Global Series Trust to 2021. Trustee of Schroder Series Trust to 2022. | |||
| INDEPENDENT TRUSTEES3 |
|
| ||||
Jon C. Hunt (Born: 1951) | Trustee and Lead Independent Trustee (since 2014) | Retired since 2013. Consultant to Management, Convergent Capital Management, LLC (“CCM”) from 2012 to 2013. Managing Director and Chief Operating Officer, CCM from 1998 to 2012. | Current Directorships: Trustee of City National Rochdale Funds, Gallery Trust, Delaware Wilshire Private Markets Master Fund, Delaware Wilshire Private Markets Fund and Delaware Wilshire Private Markets Tender Fund. Director of Chiron Capital Allocation Fund Ltd.
Former Directorships: Trustee of Winton Series Trust to 2017. Trustee of Winton Diversified Opportunities Fund (closed-end investment company) to 2018. Trustee of Schroder Global Series Trust to 2021. Trustee of Schroder Series Trust to 2022. | |||
| 1 | Each Trustee shall hold office during the lifetime of this Trust until the election and qualification of his or her successor, or until he or she sooner dies, resigns, or is removed in accordance with the Trust’s Declaration of Trust. |
| 2 | Directorships of Companies required to report to the Securities and Exchange Commission under the Securities Exchange Act of 1934 (i.e., “public companies”) or other investment companies under the 1940 Act. |
| 3 | Trustees oversee 65 funds in The Advisors’ Inner Circle Fund III. |
| 4 | Denotes Trustees who may be deemed to be “interested” persons of the Fund as that term is defined in the 1940 Act by virtue of their affiliation with the Distributor and/or its affiliates. |
64
| The Advisors’ Inner Circle Fund III | Barrow Hanley Funds | |
| October 31, 2022 |
Name and Year of Birth | Position with Trust and Length of Time Served1 | Principal Occupations in the Past Five Years | Other Directorships Held in the Past Five Years2 | |||
INDEPENDENT TRUSTEES (continued)3 | ||||||
Thomas P. Lemke (Born: 1954) | Trustee (since 2014) | Retired since 2013. Executive Vice President and General Counsel, Legg Mason, Inc. from 2005 to 2013. | Current Directorships: Trustee of Gallery Trust, Delaware Wilshire Private Markets Master Fund, Delaware Wilshire Private Markets Fund, Delaware Wilshire Private Markets Tender Fund, J.P. Morgan Funds (171 Portfolios) and Symmetry Panoramic Trust (16 Portfolios). Director of Chiron Capital Allocation Fund Ltd.
Former Directorships: Trustee of Winton Series Trust and AXA Premier VIP Trust to 2017. Trustee of Winton Diversified Opportunities Fund (closed-end investment company) to 2018. Trustee of Schroder Global Series Trust to 2021. Trustee of Schroder Series Trust to 2022. | |||
Nichelle Maynard-Elliott (Born: 1968) | Trustee (since 2021) | Independent Director since 2018. Executive Director, M&A at Praxair Inc. from 2011-2019. | Current Directorships: Trustee of Gallery Trust, Delaware Wilshire Private Markets Master Fund, Delaware Wilshire Private Markets Fund, Delaware Wilshire Private Markets Tender Fund. Director of Chiron Capital Allocation Fund Ltd. Director of Element Solutions Inc., Director of Xerox Holdings Corporation, and Director of Lucid Group, Inc.
Former Directorships: Trustee of Schroder Global Series Trust to 2021. Trustee of Schroder Series Trust to 2022. | |||
Jay C. Nadel (Born: 1958) | Trustee (since 2016) | Self-Employed Consultant since 2004. Executive Vice President, Bank of New York Broker Dealer from 2002 to 2004. Partner/Managing Director, Weiss Peck & Greer/Robeco from 1986 to 2001. | Current Directorships: Chairman of the Board of Trustees of City National Rochdale Funds. Trustee of Gallery Trust, Delaware Wilshire Private Markets Master Fund, Delaware Wilshire Private Markets Fund and Delaware Wilshire Private Markets Tender Fund. Director of Chiron Capital Allocation Fund Ltd.
Former Directorships: Trustee of Winton Series Trust to 2017. Director of Lapolla Industries, Inc. to 2017. Trustee of Winton Diversified Opportunities Fund (closed-end investment company) to 2018. Trustee of Schroder Global Series Trust to 2021. Trustee of Schroder Series Trust to 2022. | |||
Randall S. Yanker (Born: 1960) | Trustee (since 2014) | Co-Founder and Senior Partner, Alternative Asset Managers, L.P. since 2004. | Current Directorships: Trustee of Gallery Trust, Delaware Wilshire Private Markets Master Fund, Delaware Wilshire Private Markets Fund and Delaware Wilshire Private Markets Tender Fund. Independent Non-Executive Director of HFA Holdings Limited. Director of Chiron Capital Allocation Fund Ltd.
Former Directorships: Trustee of Winton Series Trust to 2017. Trustee of Winton Diversified Opportunities Fund (closed-end investment company) to 2018. Trustee of Schroder Global Series Trust to 2021. Trustee of Schroder Series Trust to 2022. | |||
| 1 | Each Trustee shall hold office during the lifetime of this Trust until the election and qualification of his or her successor, or until he or she sooner dies, resigns, or is removed in accordance with the Trust’s Declaration of Trust. |
| 2 | Directorships of Companies required to report to the Securities and Exchange Commission under the Securities Exchange Act of 1934 (i.e., “public companies”) or other investment companies under the 1940 Act. |
| 3 | Trustees oversee 65 funds in The Advisors’ Inner Circle Fund III. |
65
| The Advisors’ Inner Circle Fund III | Barrow Hanley Funds | |
| October 31, 2022 |
Name and Year of Birth | Position(s) with Trust and Length of Time Served | Principal Occupations in the Past Five Years | Other Directorships Held in the Past Five Years | |||
| OFFICERS | ||||||
Michael Beattie (Born: 1965) | President (since 2014) | Director of Client Service, SEI Investments Company, since 2004. | None. | |||
James Bernstein (Born: 1962) | Vice President (since 2017) Secretary (since 2020) | Attorney, SEI Investments, since 2017.
Prior Positions: Self-employed consultant, 2017. Associate General Counsel & Vice President, Nationwide Funds Group and Nationwide Mutual Insurance Company, from 2002 to 2016. Assistant General Counsel & Vice President, Market Street Funds and Provident Mutual Insurance Company, from 1999 to 2002. | None. | |||
John Bourgeois (Born: 1973) | Assistant Treasurer (since 2017) | Fund Accounting Manager, SEI Investments, since 2000. | None. | |||
Eric C. Griffith (Born: 1969) | Vice President and Assistant Secretary (since 2020) | Counsel at SEI Investments since 2019. Vice President and Assistant General Counsel, JPMorgan Chase & Co., from 2012 to 2018. | None. | |||
Matthew M. Maher (Born: 1975) | Vice President and Assistant Secretary (since 2018) | Counsel at SEI Investments since 2018. Attorney, Blank Rome LLP, from 2015 to 2018. Assistant Counsel & Vice President, Bank of New York Mellon, from 2013 to 2014. Attorney, Dilworth Paxson LLP, from 2006 to 2013. | None. | |||
Andrew Metzger (Born: 1980) | Treasurer, Controller and Chief Financial Officer (since 2021) | Director of Fund Accounting, SEI Investments, since 2020. Senior Director, Embark, from 2019 to 2020. Senior Manager, PricewaterhouseCoopers LLP, from 2002 to 2019. | None. | |||
Robert Morrow (Born: 1968) | Vice President (since 2017) | Account Manager, SEI Investments, since 2007. | None. | |||
Stephen F. Panner (Born: 1970) | Chief Compliance Officer (since 2022) | Chief Compliance Officer of SEI Asset Allocation Trust, SEI Daily Income Trust, SEI Institutional Investments Trust, SEI Institutional International Trust, SEI Institutional Managed Trust, SEI Tax Exempt Trust, Adviser Managed Trust, New Covenant Funds, SEI Catholic Values Trust, SEI Exchange Traded Funds, SEI Structured Credit Fund LP, The Advisors’ Inner Circle Fund, The Advisors’ Inner Circle Fund II, The Advisors’ Inner Circle Fund III, Bishop Street Funds, Frost Family of Funds, Gallery Trust, Delaware Wilshire Private Markets Fund, Delaware Wilshire Private Markets Master Fund, Delaware Wilshire Private Markets Tender Fund and Catholic Responsible Investments Funds since September 2022. Fund Compliance Officer of SEI Investments Company from February 2011 to September 2022. Fund Accounting Director and CFO and Controller for the SEI Funds from July 2005 to February 2011. | None. | |||
Alexander F. Smith (Born: 1977) | Vice President and Assistant Secretary (since 2020) | Counsel at SEI Investments since 2020. Associate Counsel & Manager, Vanguard, 2012 to 2020. Attorney, Stradley Ronon Stevens & Young, LLP, 2008 to 2012. | None. | |||
Bridget E. Sudall (Born: 1980) | Privacy Officer (from 2015 – June 2022 and since November 2022)
Anti-Money (from 2015 – June 2022 and since November 2022) | Senior Associate and AML Officer, Morgan Stanley Alternative Investment Partners, from 2011 to 2015. Investor Services Team Lead, Morgan Stanley Alternative Investment Partners, from 2007 to 2011. | None. | |||
66
| The Advisors’ Inner Circle Fund III | Barrow Hanley Funds | |
| October 31, 2022 |
NOTICE TO SHAREHOLDERS (Unaudited)
|
For shareholders that do not have an October 31, 2022 tax year end, this notice is for informational purposes only. For shareholders with an October 31, 2022 tax year end, please consult your tax advisor as to the pertinence of this notice. For the fiscal year ended October 31, 2022, the Funds are designating the following items with regard to distributions paid during the period.
| Return of Capital | Long Term Capital Gain Distribution | Ordinary Income Distributions | Total Distributions | Dividends Qualifying for Corporate Dividend Receivable Deduction(1) | Qualifying Dividend Income(2) | U.S. Government Interest(3) | Interest Related Dividends(4) | Qualified Short Term Capital Gain(5) | Foreign Tax Credit(6) | Qualifying Business Income(7) | ||||||||||||||||||||||||||||||||||
Concentrated Emerging Markets ESG Opportunities Fund | 0.00 | % | 0.00 | % | 100.00 | % | 100.00 | % | 0.00 | % | 46.68 | % | 0.00 | % | 0.47 | % | 0.00 | % | 100.00 | % | 0.00 | % | ||||||||||||||||||||||
Credit Opportunities Fund | 0.00 | % | 0.00 | % | 100.00 | % | 100.00 | % | 11.80 | % | 11.80 | % | 0.00 | % | 82.05 | % | 0.00 | % | 0.00 | % | 0.00 | % | ||||||||||||||||||||||
Emerging Markets Value Fund | 0.00 | % | 0.00 | % | 100.00 | % | 100.00 | % | 0.00 | % | 75.03 | % | 0.00 | % | 0.00 | % | 0.00 | % | 0.56 | % | 0.00 | % | ||||||||||||||||||||||
Floating Rate Fund | 0.00 | % | 0.00 | % | 100.00 | % | 100.00 | % | 0.00 | % | 0.00 | % | 0.00 | % | 100.00 | % | 0.00 | % | 0.00 | % | 0.00 | % | ||||||||||||||||||||||
International Value Fund | 0.00 | % | 0.00 | % | 100.00 | % | 100.00 | % | 0.00 | % | 85.60 | % | 0.00 | % | 0.76 | % | 0.00 | % | 100.00 | % | 0.00 | % | ||||||||||||||||||||||
Total Return Bond Fund | 0.00 | % | 0.00 | % | 100.00 | % | 100.00 | % | 0.00 | % | 0.00 | % | 18.17 | % | 100.00 | % | 0.00 | % | 0.00 | % | 0.00 | % | ||||||||||||||||||||||
US Value Opportunities Fund | 0.00 | % | 0.00 | % | 0.00 | % | 0.00 | % | 0.00 | % | 0.00 | % | 0.00 | % | 0.00 | % | 0.00 | % | 0.00 | % | 0.00 | % | ||||||||||||||||||||||
| (1) | Qualifying dividends represent dividends which qualify for the corporate dividends received deduction and is reflected as a percentage of ordinary Income distributions (the total of short term capital gain and net investment income distributions). |
| (2) | The percentage in this column represents the amount of “Qualifying Dividend Income” as created by the Jobs and Growth Relief Reconciliation Act of 2003 and is reflected as a percentage of ordinary income distributions (the total of short term capital gain and net investment income distributions). It is the intention of each of the aforementioned funds to designate the maximum amount permitted by law. |
| (3) | “U.S. Government Interest represents the amount of interest that was derived from U.S. Government obligations and distributed during the fiscal year. This amount is reflected as a percentage of total ordinary income distributions (the total of short term capital gain and net investment income distributions). Generally, interest from direct U.S. Government obligations is exempt from state income tax. However, for shareholders who are residents of California, Connecticut and New York, the statutory threshold requirements were not satisfied to permit exemption of these amounts from state income. |
| (4) | The percentage in this column represents the amount of “Interest Related Dividends” and is a percentage of ordinary income distributions. Interest related dividends are exempted from U.S. withholding tax when paid to foreign investors. |
| (5) | The percentage in this column represents the amount of “Qualifying Short-Term Capital Gain” as created by the American Jobs Creation Act of 2004 and is reflected as a percentage of short-term capital gain distributions that is exempt from U.S. withholding tax when paid to foreign investors. |
| (6) | The percentage in this column represents the amount of “Qualifying Foreign Taxes” as a percentage of ordinary distributions during the fiscal year ended October 31, 2022. The Fund intends to pass through a Foreign Tax Credit to shareholders for fiscal year ended 2022. The total amount of foreign source income for the Concentrated Emerging ESG Opportunities Fund is $123,148. The total amount of foreign tax paid for the Concentrated Emerging Markets ESG Opportunities Fund is $11,790. The total amount of foreign source income for the Emerging Markets Value Fund $63,925. The total amount of foreign tax paid for the Emerging Markets Value Fund is $6,325. The total amount of foreign source income for the International Value Fund $158,142. The total amount of foreign tax paid for the International Value Fund is $13,335. |
| (7) | The percentage of this column represents that amount of ordinary dividend income that qualified for 20% Business Income Deduction. |
The information reported herein may differ from the information and distributions taxable to the shareholders for the calendar year ending December 31, 2022. Complete information will be computed and reported in conjunction with your 2022 Form 1099-DIV.
67
Perpetual Funds
PO Box 588
Portland, ME 04112
866-778-6397
Investment Adviser:
Perpetual US Services LLC, doing business as PGIA
155 North Wacker Drive, Suite 4250
Chicago, Illinois 60606
Sub-Adviser
Barrow, Hanley, Mewhinney & Strauss, LLC
2200 Ross Avenue, 31st Floor
Dallas, TX 75201
Administrator:
SEI Investments Global Funds Services
One Freedom Valley Drive
Oaks, PA 19456
Distributor:
SEI Investments Distribution Co.
One Freedom Valley Drive
Oaks, PA 19456
Legal Counsel:
Morgan, Lewis & Bockius LLP
1701 Market Street
Philadelphia, PA 19103
This information must be preceded or accompanied by a current prospectus for the Funds described.
PBH-AR-001-0100
| Item 2. | Code of Ethics. |
The Registrant (also referred to as the “Trust”) has adopted a code of ethics that applies to the Registrant’s principal executive officer, principal financial officer, controller or principal accounting officer, and any person who performs a similar function. There have been no amendments to or waivers granted to this code of ethics during the period covered by this report.
| Item 3. | Audit Committee Financial Expert. |
(a)(1) The Registrant’s board of trustees has determined that the Registrant has at least one audit committee financial expert serving on the audit committee.
(a)(2) The Registrant’s audit committee financial experts are Thomas P. Lemke and Jay Nadel, and each of Mr. Lemke and Mr. Nadel is “independent” as that term is defined in Form N-CSR Item 3 (a)(2).
| Item 4. | Principal Accountant Fees and Services. |
Fees billed by PricewaterhouseCoopers LLP (“PwC”) relate to The Advisors’ Inner Circle Fund III (the “Trust”).
PwC billed the Trust aggregate fees for services rendered to the Trust for the last two fiscal years as follows:
| 2022 | 2021 | |||||||||||||||||||||||||
| All fees and services to the Trust that were pre-approved | All fees and services to service affiliates that were pre-approved | All other fees and services to service affiliates that did not require pre-approval | All fees and services to the Trust that were pre-approved | All fees and services to service affiliates that were pre-approved | All other fees and services to service affiliates that did not require pre-approval | |||||||||||||||||||||
(a) | Audit Fees(1) | $ | 682,615 | None | None | $ | 730,515 | None | $ | 11,990 | ||||||||||||||||
(b) | Audit-Related Fees | None | None | None | $ | 4,000 | None | None | ||||||||||||||||||
(c) | Tax Fees | $ | 88,500 | (4) | None | $ | 126,709 | (2) | None | None | $ | 90,000 | (2) | |||||||||||||
(d) | All Other Fees | None | None | $ | 5,301 | None | None | $ | 1,473 | |||||||||||||||||
Fees billed by Ernst & Young LLP (“E&Y”) relate to the Trust
E&Y billed the Trust aggregate fees for services rendered to the Trust for the last two fiscal years as follows:
| 2022 | 2021 | |||||||||||||||||||||||||
| All fees and services to the Trust that were pre-approved | All fees and services to service affiliates that were pre-approved | All other fees and services to service affiliates that did not require pre-approval | All fees and services to the Trust that were pre-approved | All fees and services to service affiliates that were pre-approved | All other fees and services to service affiliates that did not require pre-approval | |||||||||||||||||||||
(a) | Audit Fees(1) | $ | 131,900 | None | None | $ | 128,050 | None | None | |||||||||||||||||
(b) | Audit-Related Fees | None | None | None | None | None | None | |||||||||||||||||||
(c) | Tax Fees | None | None | None | None | None | None | |||||||||||||||||||
(d) | All Other Fees | None | None | None | None | None | None | |||||||||||||||||||
Fees billed by Deloitte & Touche LLP (“D&T”) relate to the Trust
D&T billed the Trust aggregate fees for services rendered to the Trust for the last two fiscal years as follows
| 2022 | 2021 | |||||||||||||||||||||||||
| All fees and services to the Trust that were pre-approved | All fees and services to service affiliates that were pre-approved | All other fees and services to service affiliates that did not require pre-approval | All fees and services to the Trust that were pre-approved | All fees and services to service affiliates that were pre-approved | All other fees and services to service affiliates that did not require pre-approval | |||||||||||||||||||||
(a) | Audit Fees(1) | $ | 30,050 | None | None | $ | 26,800 | None | None | |||||||||||||||||
(b) | Audit-Related Fees | None | None | None | None | None | None | |||||||||||||||||||
(c) | Tax Fees | None | None | None | None | None | None | |||||||||||||||||||
(d) | All Other Fees | None | None | None | None | None | None | |||||||||||||||||||
Fees billed by KPMG (“KPMG”) relate to the Trust
KPMG billed the Trust aggregate fees for services rendered to the Trust for the last two fiscal years as follows
| 2022 | 2021 | |||||||||||||||||||||||||
| All fees and services to the Trust that were pre-approved | All fees and services to service affiliates that were pre-approved | All other fees and services to service affiliates that did not require pre-approval | All fees and services to the Trust that were pre-approved | All fees and services to service affiliates that were pre-approved | All other fees and services to service affiliates that did not require pre-approval | |||||||||||||||||||||
(a) | Audit Fees(1) | $ | 322,500 | None | None | $ | 25,000 | None | None | |||||||||||||||||
(b) | Audit-Related Fees | None | None | None | None | None | None | |||||||||||||||||||
(c) | Tax Fees | None | None | None | None | None | None | |||||||||||||||||||
(d) | All Other Fees | None | None | $ | 218,015 | (3) | None | None | $ | 206,957 | (3) | |||||||||||||||
Notes:
| (1) | Audit fees include amounts related to the audit of the Trust’s annual financial statements and services normally provided by the accountant in connection with statutory and regulatory filings. |
| (2) | Tax return preparation fees for affiliates of the Funds. |
| (3) | Non-audit fees consist of SSAE No. 18 report over investment management activities and non-statutory audit reports of Legal & General Investment Management America, Inc. |
| (4) | Fees in connection with international withholding tax analysis. |
(e)(1) The Trust’s Audit Committee has adopted and the Board of Trustees has ratified an Audit and Non-Audit Services Pre-Approval Policy (the “Policy”), which sets forth the procedures and the conditions pursuant to which services proposed to be performed by the independent auditor of the Funds may be pre-approved.
The Policy provides that all requests or applications for proposed services to be provided by the independent auditor must be submitted to the Registrant’s Chief Financial Officer (“CFO”) and must include a detailed description of the services proposed to be rendered. The CFO will determine whether such services:
(1) require specific pre-approval;
(2) are included within the list of services that have received the general pre-approval of the Audit Committee pursuant to the Policy; or
(3) have been previously pre-approved in connection with the independent auditor’s annual engagement letter for the applicable year or otherwise. In any instance where services require pre-approval, the Audit Committee will consider whether such services are consistent with SEC’s rules and whether the provision of such services would impair the auditor’s independence.
Requests or applications to provide services that require specific pre-approval by the Audit Committee will be submitted to the Audit Committee by the CFO. The Audit Committee will be informed by the CFO on a quarterly basis of all services rendered by the independent auditor. The Audit Committee has delegated specific pre-approval authority to either the Audit Committee Chair or financial expert, provided that the estimated fee for any such proposed pre-approved service does not exceed $100,000 and any pre-approval decisions are reported to the Audit Committee at its next regularly-scheduled meeting.
Services that have received the general pre-approval of the Audit Committee are identified and described in the Policy. In addition, the Policy sets forth a maximum fee per engagement with respect to each identified service that has received general pre-approval.
All services to be provided by the independent auditor shall be provided pursuant to a signed written engagement letter with the Registrant, the investment adviser, or applicable control affiliate (except that matters as to which an engagement letter would be impractical because of timing issues or because the matter is small may not be the subject of an engagement letter) that sets forth both the services to be provided by the independent auditor and the total fees to be paid to the independent auditor for those services.
In addition, the Audit Committee has determined to take additional measures on an annual basis to meet the Audit Committee’s responsibility to oversee the work of the independent auditor and to assure the auditor’s independence from the Registrant, such as (a) reviewing a formal written statement from the independent auditor delineating all relationships between the independent auditor and the Registrant, and (b) discussing with the independent auditor the independent auditor’s methods and procedures for ensuring independence.
(e)(2) Percentage of fees billed applicable to non-audit services pursuant to waiver of pre-approval requirement were as follows (PwC):
| 2022 | 2021 | |||
Audit-Related Fees | None | None | ||
Tax Fees | None | None | ||
All Other Fees | None | None |
(e)(2) Percentage of fees billed applicable to non-audit services pursuant to waiver of pre-approval requirement were as follows (E&Y):
| 2022 | 2021 | |||
Audit-Related Fees | None | None | ||
Tax Fees | None | None | ||
All Other Fees | None | None |
(e)(2) Percentage of fees billed applicable to non-audit services pursuant to waiver of pre-approval requirement were as follows (D&T):
| 2022 | 2021 | |||
Audit-Related Fees | None | None | ||
Tax Fees | None | None | ||
All Other Fees | None | None |
(e)(2) Percentage of fees billed applicable to non-audit services pursuant to waiver of pre-approval requirement were as follows (KPMG):
| 2022 | 2021 | |||
Audit-Related Fees | None | None | ||
Tax Fees | None | None | ||
All Other Fees | None | None |
(f) Not applicable.
(g) The aggregate non-audit fees and services billed by PwC for services rendered to the Registrant, and rendered to the Registrant’s investment adviser (not including any sub-adviser whose role is primarily portfolio management and is subcontracted with or overseen by another investment adviser), and any entity controlling, controlled by, or under common control with the adviser that provides ongoing services to the Registrant for the last two fiscal-years-ended October 31st were $132,010 and $91,473 for 2022 and 2021, respectively.
(g) The aggregate non-audit fees and services billed by E&Y for services rendered to the Registrant, and rendered to the Registrant’s investment adviser (not including any sub-adviser whose role is primarily portfolio management and is subcontracted with or overseen by another investment adviser), and any entity controlling, controlled by, or under common control with the adviser that provides ongoing services to the Registrant for the last two fiscal-years-ended October 31st were $0 and $0 for 2022 and 2021, respectively.
(g) The aggregate non-audit fees and services billed by D&T for services rendered to the Registrant, and rendered to the Registrant’s investment adviser (not including any sub-adviser whose role is primarily portfolio management and is subcontracted with or overseen by another investment adviser), and any entity controlling, controlled by, or under common control with the adviser that provides ongoing services to the Registrant for the last two fiscal-years-ended October 31st were $0 and $0 for 2022 and 2021, respectively.
(g) The aggregate non-audit fees and services billed by KPMG for services rendered to the Registrant, and rendered to the Registrant’s investment adviser (not including any sub-adviser whose role is primarily portfolio management and is subcontracted with or overseen by another investment adviser), and any entity controlling, controlled by, or under common control with the adviser that provides ongoing services to the Registrant for the last two fiscal-years-ended October 31st were $218,015 and $206,957 for 2022 and 2021, respectively.
(h) During the past fiscal year, all non-audit services provided by the Registrant’s principal accountant to either the Registrant’s investment adviser or to any entity controlling, controlled by,
or under common control with the Registrant’s investment adviser that provides ongoing services to the Registrant were pre-approved by the Audit Committee of Registrant’s Board of Trustees. Included in the Audit Committee’s pre-approval of these non-audit service were the review and consideration as to whether the provision of these non-audit services is compatible with maintaining the principal accountant’s independence.
(i) Not applicable. The Registrant has not retained, for the preparation of the audit report on the financial statements included in the Form N-CSR, a registered public accounting firm that has a branch or office that is located in a foreign jurisdiction and that the Public Company Accounting Oversight Board (the “PCAOB”) has determined that the PCAOB is unable to inspect or investigate completely because of a position taken by an authority in the foreign jurisdiction.
(j) Not applicable. The Registrant is not a “foreign issuer,” as defined in 17 CFR 240.3b-4.
| Item 5. | Audit Committee of Listed Registrants. |
Not applicable to open-end management investment companies.
| Item 6. | Schedule of Investments. |
Schedule of Investments is included as part of the Report to Shareholders filed under Item 1 of this form.
| Item 7. | Disclosure of Proxy Voting Policies and Procedures for Closed-End Management Investment Companies. |
Not applicable to open-end management investment companies.
| Item 8. | Portfolio Managers of Closed-End Management Investment Companies. |
Not applicable to open-end management investment companies.
| Item 9. | Purchases of Equity Securities by Closed-End Management Company and Affiliated Purchasers. |
Not applicable to open-end management investment companies.
| Item 10. | Submission of Matters to a Vote of Security Holders. |
There have been no changes to the procedures by which shareholders may recommend nominees to the Registrant’s Board of Trustees during the period covered by this report.
| Item 11. | Controls and Procedures. |
(a) The Registrant’s principal executive and principal financial officers, or persons performing similar functions, have concluded that the Registrant’s disclosure controls and procedures, as defined in Rule 30a-3(c) under the Act (17 CFR § 270.30a-3(c)), as of a date within 90 days of the filing date of the report, are effective based on the evaluation of these controls and procedures required by Rule 30a-3(b) under the Act (17 CFR § 270.30a-3(b)) and Rule 13a-15(b) or Rule 15d-15(b) under the Exchange Act, as amended (17 CFR § 240.13a-15(b) or § 240.15d-15(b)).
(b) There has been no change in the Registrant’s internal control over financial reporting (as defined in Rule 30a-3(d) under the Act (17 CFR § 270.3a-3(d)) that occurred during the period covered by this report that has materially affected, or is reasonably likely to materially affect, the Registrant’s internal control over financial reporting.
| Item 12. | Disclosure of Securities Lending Activities for Closed-End Management Investment Companies. |
Not applicable to open-end management investment companies.
| Items 13. | Exhibits. |
SIGNATURES
Pursuant to the requirements of the Securities Exchange Act of 1934 and the Investment Company Act of 1940, the Registrant has duly caused this report to be signed on its behalf by the undersigned, thereunto duly authorized.
| (Registrant) | The Advisors’ Inner Circle Fund III | |||||
| By (Signature and Title) | ||||||
/s/ Michael Beattie | ||||||
| Michael Beattie, President | ||||||
| Date: January 6, 2023 | ||||||
Pursuant to the requirements of the Securities Exchange Act of 1934 and the Investment Company Act of 1940, this report has been signed below by the following persons on behalf of the Registrant and in the capacities and on the dates indicated.
| By (Signature and Title) | /s/ Michael Beattie | |||||
| Michael Beattie, President | ||||||
| Date: January 6, 2023 |
| By (Signature and Title) | /s/ Andrew Metzger | |||||
| Andrew Metzger, | ||||||
| Treasurer, Controller, and CFO | ||||||
| Date: January 6, 2023 |