UNITED STATES
SECURITIES AND EXCHANGE COMMISSION
Washington, D.C. 20549
FORM N-CSR
CERTIFIED SHAREHOLDER REPORT OF REGISTERED
MANAGEMENT INVESTMENT COMPANIES
Investment Company Act File Number 811-22920
The Advisors’ Inner Circle Fund III
(Exact name of registrant as specified in charter)
SEI Investments
One Freedom Valley Drive
Oaks, PA 19456
(Address of principal executive offices) (Zip code)
SEI Investments
One Freedom Valley Drive
Oaks, PA 19456
(Name and address of agent for service)
Registrant’s telephone number, including area code: (877) 446-3863
Date of fiscal year end: October 31, 2022
Date of reporting period: October 31, 2022
Item 1. Reports to Stockholders.
A copy of the report transmitted to stockholders pursuant to Rule 30e-1 under the Investment Company Act of 1940, as amended (the “Act”) (17 CFR § 270.30e-1), is attached hereto.
| Ninety One Global Franchise Fund
Ninety One International Franchise Fund
Ninety One Emerging Markets Equity Fund
Ninety One Global Environment Fund
INVESTMENT ADVISER: NINETY ONE NORTH AMERICA, INC. | |
Advisors’ Inner Circle Fund III October 31, 2022 Annual Report |  | |

| THE ADVISORS’ INNER CIRCLE FUND III | NINETY ONE FUNDS | |
| OCTOBER 31, 2022 |
| 1 | ||||
| 17 | ||||
| 30 | ||||
| 32 | ||||
| 34 | ||||
| 38 | ||||
| 44 | ||||
| 62 | ||||
| 64 | ||||
Trustees and Officers of the Advisors’ Inner Circle Fund III | 66 | |||
| 72 | ||||
| 76 | ||||
The Funds file their complete schedules of investments with the Securities and Exchange Commission (“SEC”) for the first and third quarters of each fiscal year as an exhibit to its reports on Form N-PORT (Form N-Q for filings prior to March 31, 2020). The Funds’ Forms N-Q and N-PORT are available on the SEC’s website at https://www.sec.gov, and may be reviewed and copied at the SEC’s Public Reference Room in Washington, DC. Information on the operation of the Public Reference Room may be obtained by calling 1-800-SEC-0330.
A description of the policies and procedures that the Funds use to determine how to vote proxies relating to Fund securities, as well as information relating to how a Fund voted proxies relating to fund securities during the most recent 12-month period ended June 30, is available (i) without charge, upon request, by calling 1-844-IAM-USA1; and (ii) on the SEC’s website at http://www.sec.gov.
| THE ADVISORS’ INNER CIRCLE FUND III | NINETY ONE GLOBAL FRANCHISE FUND OCTOBER 31, 2022 (UNAUDITED) |
Ninety One Global Franchise Fund – Annual Review – November 1, 2021 to October 31, 2022
Fund performance
The Fund broadly matched the MSCI ACWI over the period, delivering an absolute return of -19.91%* over the year, versus the benchmark return of -19.96%. Stock selection in communication services and IT were the standout performers at the sector level, although a lack of exposure to energy – which has surged amid the war in Ukraine – and stock selection in financials offset some of this. Not holding some of the growthier tech names including Amazon, Facebook and Alphabet benefited the fund on a relative basis.
In terms of holdings, healthcare company Johnson & Johnson has had a strong year, rebounding from pandemic disruptions with encouraging results. Financial data provider Factset is another holding that has delivered operational strength throughout the period. Tobacco company Philip Morris has contributed, with a mix of strong results and well-received M&A (buying Swedish Match) lifting the stock. IT security company Check Point Software has outperformed. In February, the company reported Q4 revenue and billings that came in ahead of expectations, lifting the stock to its best month since 2009. We believe the industry backdrop remains supportive, with cyber security likely to remain in demand. Global payments provider Visa continued to recover from its weak 2021, driven by the recovery in cross-border payments volumes post COVID. Medical technology company Becton Dickinson also contributed, with strength across its portfolio. Recently, the company boosted its revenue forecast for the full year.
More negatively, Chinese tech giant Alibaba underperformed the wider portfolio as concerns about government regulation of the sector continues to rumble and weigh on sentiment. We carefully considered the investment case for the stock and have now exited the holding. ASML has detracted following a stellar 2021, although operational strength has remained intact. Moody’s has also been a laggard after cutting its full year outlook due to the issuance market remaining subdued. We believe that the issuance market remains well placed to deliver structural growth, and Moody’s possesses real pricing power, which they can slowly exert. Cosmetics company Estee Lauder has underperformed given the weakening economic outlook, lockdowns in China and the strengthening dollar. Not holding Apple also detracted from relative returns. Gaming company NetEase was another laggard on little specific news other than the broad weakness across global equities. Positively, we note that its recent Q1 results beat consensus estimates due to the newer releases in particular, and the company obtained a license in the latest batch of
1
| THE ADVISORS’ INNER CIRCLE FUND III | NINETY ONE GLOBAL FRANCHISE FUND OCTOBER 31, 2022 (UNAUDITED) |
game approvals in China, which was a positive surprise after being left off recent lists.
* Based on the 40Act Global Franchise Fund, I Share, covering 12m to end-Oct 2022.
Outlook
The risk of recession has ramped up significantly over recent months. The key drivers have been inflation proving far more persistent than anticipated and central banks being explicit that they would be willing to keep policy in restrictive territory, even if growth were to slow. We continue to believe that the best defence against the risk of inflation remains pricing power, the most valuable characteristic companies can possess in such an environment, together with a reasonable starting valuation, and were pleased to see this in evidence during the quarter, with the majority of portfolio holdings delivering robust results.
With investors increasingly concerned about the cumulative effect of rate hikes, growth data points are pointing towards slower growth, particularly in the US and Europe. The energy shock is adding to these growth concerns, and this has persisted over the quarter – particularly in Europe – as the war in Ukraine has continued, with little sign of an impending resolution. The prospect of slowing growth in China and its impact on global markets is another headwind facing markets, and we continue to monitor events very closely.
Looking beyond short-term sentiment, we do not believe the current environment has significantly changed the fundamentals of the companies we own, which continue to compound cashflows at attractive rates. We remain comfortable that the quality attributes we seek (enduring competitive advantages, dominant market positions, strong balance sheets, lower cyclicality, low capital intensity, sustainable cash generation and disciplined capital allocation) are all well suited to both current conditions and for uncertain times ahead. The companies we own have invested substantially to reinforce their business models, with significant exposure to key long-term trends such as data usage and digitalisation, ageing populations and health care, and nutrition and wellness. The portfolio is also very well positioned to contend with the growing threat of climate change, with a carbon footprint that is less than 10% of that emitted by the wider market.
Definition of the Comparative Index
The MSCI All Country World Index (Net) is a market capitalization weighted index designed to provide a broad measure of equity-market performance throughout the world and is calculated with dividends reinvested after deduction of withholding tax.
2
| THE ADVISORS’ INNER CIRCLE FUND III | NINETY ONE GLOBAL FRANCHISE FUND OCTOBER 31, 2022 (UNAUDITED) |
The information may discuss general market activity or industry trends and is not intended to be relied upon as a forecast, research or investment advice. The economic and market views presented herein reflect Ninety One North America, Inc.’s judgment as at the date shown and are subject to change without notice. There is no guarantee that views and opinions expressed will be correct, and Ninety One North America, Inc.’s intentions to buy or sell particular securities in the future may change. The investment views, analysis and market opinions expressed may not reflect those of Ninety One North America, Inc.’s as a whole, and different views may be expressed based on different investment objectives. This communication is based on internal data, public and third party sources. Although we believe the information to be reliable, we have not independently verified it, and we cannot guarantee its accuracy or completeness. Ninety One North America, Inc.’s internal data may not be audited. Holdings are subject to change. Current and future holdings are subject to risk.
3
| THE ADVISORS’ INNER CIRCLE FUND III | NINETY ONE GLOBAL FRANCHISE FUND OCTOBER 31, 2022 (UNAUDITED) |
Comparison of Change in the Value of a $10,000 Investment in the Ninety One Global Franchise Fund, I Shares, versus the MSCI All Country World Index (Net).
AVERAGE ANNUAL TOTAL RETURN FOR THE YEAR ENDED OCTOBER 31, 2022 | ||||||
| 1 Year | 3 Year | Inception to Date* | ||||
I Shares* | -19.91% | 4.86% | 6.45% | |||
A Shares (without sales charge)** | -20.13% | 4.62% | 5.57% | |||
A Shares (with sales charge)** | -24.73% | 2.58% | 4.04% | |||
MSCI All Country World Index (Net) | -19.96% | 4.85% | 4.91% | |||
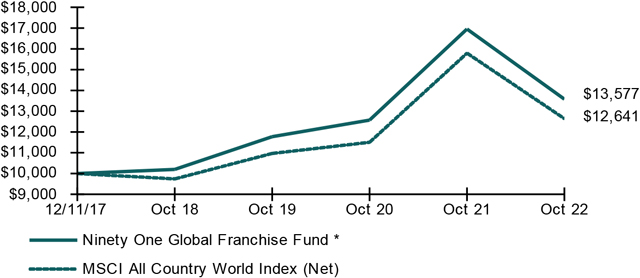
* Fund commenced operations on December 11, 2017. The graph is based on I Shares only; Performance for A Shares would have been lower due to a maximum front-end sales charge of 5.75% and differences in fee structures.
** Commenced operations on September 28, 2018.
The performance data quoted herein represents past performance and the return and value of an investment in the Fund will fluctuate so that, when redeemed, it may be worth less than its original cost. Past performance is no guarantee of future performance and should not be considered as a representation of the future results of the Fund. The Fund’s performance assumes the reinvestment of dividends and capital gains. Index returns assume reinvestment of dividends and, unlike a fund’s returns, do not reflect any fees or expenses. If such fees and expenses were included in the index returns, the performance would have been lower.
Please note that one cannot invest directly in an unmanaged index.
There are no assurances that the Fund will meet its stated objectives. The Fund’s holdings and allocations are subject to change because it is actively managed and should not be considered recommendations to buy individual securities.
Returns shown do not reflect the deduction of taxes that a shareholder would pay on Fund distributions or the redemption of Fund shares.
See definition of comparative index on page 2.
4
| THE ADVISORS’ INNER CIRCLE FUND III | NINETY ONE INTERNATIONAL FRANCHISE FUND OCTOBER 31, 2022 (UNAUDITED) |
Ninety One International Franchise Fund – Annual Review – November 1, 2021 to October 31, 2022
Fund performance
The Fund performed broadly in line with the MSCI All Country World ex-US over the period. The Fund produced an absolute return of -24.59%*, ahead of the index return of -24.73% for the same period. Positioning in consumer staples and stock selection in IT contributed to returns, while stock selection in health care and a lack of exposure to energy – which surged – were the biggest detractors at the sector level.
Smokeless tobacco producer Swedish Match was the standout performer after Philip Morris International (PMI) agreed to buy the company for 106 kronor a share, a premium of nearly 40% on the previous closing price. Philip Morris also outperformed after the deal, which accelerates PMI’s growth profile as it will gain a vast distribution network in the US, which is the world’s biggest market for smoking alternatives.
IT services provider Wolters Kluwer also contributed on the back of strong results, with organic growth performing better than expected, alongside a strong margin. London Stock Exchange and Mastercard also delivered robust results over the period, with the latter suggesting that the lucrative cross-border volume market was recovering.
More negatively, a number of the Chinese holdings detracted given the weak sentiment towards that market. There were also stock specific issues. Clinical research provider Hangzhou Tigermed fell after US President Joe Biden signed an executive order laying out a strategy to bolster domestic biomanufacturing and reduce reliance on China for new medicines, chemicals and other products. While clearly a negative driver of sentiment, we note that recent Q2 results were strong, unveiling a very strong backlog supported by multiple tailwinds. Alibaba faced an uncertain regulatory environment and we have exited this position.
Gaming company NetEase was another laggard on little specific news other than the broad weakness across global equities. Positively, we note that its recent Q1 results beat consensus estimates due to the newer releases in particular, and the company obtained a license in the latest batch of game approvals in China, which was a positive surprise after being left off recent lists.
Online real estate agent REA Group delivered solid results but a soft outlook amid the Reserve Bank of Australia’s move to increase interest rates to quell inflationary
5
| THE ADVISORS’ INNER CIRCLE FUND III | NINETY ONE INTERNATIONAL FRANCHISE FUND OCTOBER 31, 2022 (UNAUDITED) |
pressures. This has driven down home transactions, and REA said China’s economic problems would likely reduce foreign buyer interest. However, we remain confident in REA as it’s a high margin, capital light well managed business with strong network effects.
Lithography equipment maker ASML has detracted, along with much of the chip space, amid the rising rate environment and concerns around global demand growth going forward. We remain confident in the investment thesis. In October, the company delivered very positive results and a solid outlook, with bookings stronger than ever and the orderbook rising to €38bn.
* Based on the 40Act International Franchise Fund, I Share, covering 12m to end-Oct 2022.
Outlook
The risk of recession has ramped up significantly over recent months. The key drivers have been inflation proving far more persistent than anticipated and central banks being explicit that they would be willing to keep policy in restrictive territory, even if growth were to slow. We continue to believe that the best defence against the risk of inflation remains pricing power, the most valuable characteristic companies can possess in such an environment, together with a reasonable starting valuation, and were pleased to see this in evidence during the quarter, with the majority of portfolio holdings delivering robust results.
With investors increasingly concerned about the cumulative effect of rate hikes, growth data points are pointing towards slower growth, particularly in the US and Europe. The energy shock is adding to these growth concerns, and this has persisted over the quarter – particularly in Europe – as the war in Ukraine has continued, with little sign of an impending resolution. The prospect of slowing growth in China and its impact on global markets is another headwind facing markets, and we continue to monitor events very closely.
Looking beyond short-term sentiment, we do not believe the current environment has significantly changed the fundamentals of the companies we own, which continue to compound cashflows at attractive rates. We remain comfortable that the quality attributes we seek (enduring competitive advantages, dominant market positions, strong balance sheets, lower cyclicality, low capital intensity, sustainable cash generation and disciplined capital allocation) are all well suited to both current conditions and for uncertain times ahead. The companies we own have invested substantially to reinforce their business models, with significant exposure to key long-term trends such as data usage and digitalisation, ageing populations and health care, and nutrition and wellness. The portfolio is also very well positioned to contend with the growing threat of climate change.
6
| THE ADVISORS’ INNER CIRCLE FUND III | NINETY ONE INTERNATIONAL FRANCHISE FUND OCTOBER 31, 2022 (UNAUDITED) |
Definition of the Comparative Index
The MSCI ACWI ex USA Index captures large and mid cap representation across 22 of 23 Developed Markets countries (excluding the US) and 27 Emerging Markets countries. With 2,350 constituents, the index covers approximately 85% of the global equity opportunity set outside the US.
The information may discuss general market activity or industry trends and is not intended to be relied upon as a forecast, research or investment advice. The economic and market views presented herein reflect Ninety One North America, Inc.’s judgment as at the date shown and are subject to change without notice. There is no guarantee that views and opinions expressed will be correct, and Ninety One North America, Inc.’s intentions to buy or sell particular securities in the future may change. The investment views, analysis and market opinions expressed may not reflect those of Ninety One North America, Inc.’s as a whole, and different views may be expressed based on different investment objectives. This communication is based on internal data, public and third party sources. Although we believe the information to be reliable, we have not independently verified it, and we cannot guarantee its accuracy or completeness. Ninety One North America, Inc.’s internal data may not be audited. Holdings are subject to change. Current and future holdings are subject to risk
7
| THE ADVISORS’ INNER CIRCLE FUND III | NINETY ONE INTERNATIONAL FRANCHISE FUND OCTOBER 31, 2022 (UNAUDITED) |
Comparison of Change in the Value of a $10,000 Investment in the Ninety One International Franchise Fund, I Shares, versus the MSCI All Country World Index (Net).
AVERAGE ANNUAL TOTAL RETURN FOR THE YEAR ENDED OCTOBER 31, 2022 | ||||
| 1 Year | Inception to Date* | |||
I Shares* | -24.59% | -22.83% | ||
MSCI All Country World ex-US Index (Net) | -24.73% | -22.20% | ||
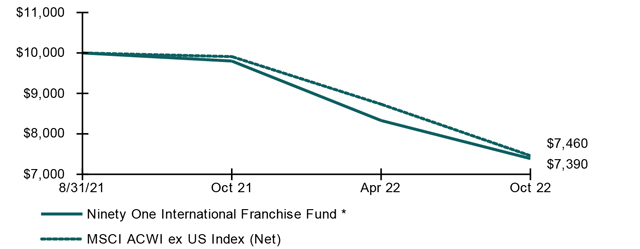
** Fund commenced operations on August 31, 2021. The graph is based on I Shares only.
The performance data quoted herein represents past performance and the return and value of an investment in the Fund will fluctuate so that, when redeemed, it may be worth less than its original cost. Past performance is no guarantee of future performance and should not be considered as a representation of the future results of the Fund. The Fund’s performance assumes the reinvestment of dividends and capital gains. Index returns assume reinvestment of dividends and, unlike a fund’s returns, do not reflect any fees or expenses. If such fees and expenses were included in the index returns, the performance would have been lower.
Please note that one cannot invest directly in an unmanaged index.
There are no assurances that the Fund will meet its stated objectives. The Fund’s holdings and allocations are subject to change because it is actively managed and should not be considered recommendations to buy individual securities.
Returns shown do not reflect the deduction of taxes that a shareholder would pay on Fund distributions or the redemption of Fund shares.
See definition of comparative index on page 7.
8
| THE ADVISORS’ INNER CIRCLE FUND III | NINETY ONE EMERGING MARKETS EQUITY FUND OCTOBER 31, 2022 (UNAUDITED) |
Ninety One Emerging Markets Equity Fund – Annual Review – November 1, 2021 to October 31, 2022
Fund performance
The Fund underperformed the MSCI Emerging Index over the period. The Fund produced an absolute return of -32.04%*, behind the index return of -31.03% for the same period.
Emerging markets (EM) had a difficult twelve months in the period under review. Initial hopes of a recovery from the global pandemic were swiftly followed by worries about supply chain bottlenecks and rising inflation. China market weakness was a significant drag on the benchmark during the year, not helped by increased regulatory intervention in a number of sectors, debt issues afflicting the property sector and periodic localised lockdowns intended to stop the spread of COVID. Russia’s invasion of Ukraine in February intensified risk aversion and caused extreme volatility and high prices for commodities, leading to sharply higher inflation and a lower global growth outlook. A number of central banks tightened monetary policy to try to control inflation.
Stock selection, particularly in financials, detracted from relative returns. A position in Moscow Stock Exchange was the single largest detractor. Benchmark index providers have excluded Russia from global emerging equity and bond market indices holdings in response to the invasion of Ukraine, and so the value of our locally traded Russian shares has been marked down to 1 basis point. In materials, gold miner Polymetal International fell as major holders sold their holdings in response to the rising geopolitical tensions. This position has been exited. Despite receiving its first video game licence from the regulators in 14 months, macroeconomic concerns weighed on NetEase, a bellwether of the Chinese gaming industry. Supply chain issues, inflation and a lack of major gaming titles have affected sentiment. Interest in gaming has also suffered following the easing of lockdown restrictions. A broader A-Share sell-off, following the 20th National Congress of the Chinese Communist Party was a further headwind. Naspers has a 28% stake in Chinese internet conglomerate Tencent, which underperformed as it was fined by regulators for disclosure violations and failing to comply with anti-monopoly rules. The share price also weakened on news of write-downs at subsidiary Prosus’ holdings in Russia. No holding in Brazilian energy giant Petroleo Brasileiro (Petrobras) detracted from relative returns as the company rose on the continuing strength in the price of oil and natural gas, exacerbated by higher geopolitical tensions and Russia’s invasion of Ukraine.
9
| THE ADVISORS’ INNER CIRCLE FUND III | NINETY ONE EMERGING MARKETS EQUITY FUND OCTOBER 31, 2022 (UNAUDITED) |
In contrast, positioning and stock selection in the consumer staples sector proved positive. A diversified Indian conglomerate, ITC rose strongly during the period. Its cigarette business surpassed its pre-pandemic levels, while the non-cigarette fast moving consumer goods (FMCG) have also performed well, helped by focussed cost management and premiumisation. Wal-Mart de Mexico (Walmex) outperformed, helped by the perception that food retailers are natural inflation hedges. Food price pressures can generally be passed on to customers by food retailers with strong brands and high market presence, and thus food price inflation translates directly into rising turnover and often resilient margins. The sector also benefitted from some rotation out of higher growth and more crowded sectors. Fertiliser and industrial chemicals producer, OCI, was supported by attractive demand and supply fundamentals. The company is regarded as a beneficiary of the drive for greater efficiency in food production even as record natural gas and coal prices have led to output cuts in the energy-intensive fertiliser sector. Airport operator TAV contributed to returns as the market increasingly saw earnings improvements for travel-exposed businesses as passenger numbers continue to recover. Not holding integrated Russian energy company Gazprom contributed to relative returns as the share price was affected by the sell-off of Russian financial assets.
* Based on the 40Act Emerging Market Equity Fund, I Share, covering 12m to end-Oct 2022.
Outlook
With markets increasingly nervous after the more hawkish tone set by the Federal Reserve chair at Jackson Hole, there is almost universal consensus that a global recession is on the way. The key question being asked is how severe a recession is being priced into the market? From a bottom-up perspective, we remain sceptical about many sell-side analysts’ earnings forecasts, which we see as vulnerable to downgrades. While the contraction in valuation multiples resulting from weaker share prices suggests that a market bottom could be close, recent corporate results demonstrate there has been significant selling pressure for those that have missed consensus earnings estimates. In our view, the key signal for a market bottom will occur when negative earnings surprises are no longer leading to major price corrections. This will demonstrate that bad news has been sufficiently priced into valuations.
Specifically with regard to EM, we feel the picture is slightly more positive, for two reasons. Firstly, these central banks here have normalised monetary policy much faster than in DM, so they are further through the necessary policy adjustments. Our second reason for feeling a little more confident around EM is a belief that the pendulum of Chinese economic policy is swinging towards more market-friendly stimulatory policies. Given sentiment is extremely negative, such good news should be supportive for the Chinese market and the broader EM asset class.
10
| THE ADVISORS’ INNER CIRCLE FUND III | NINETY ONE EMERGING MARKETS EQUITY FUND OCTOBER 31, 2022 (UNAUDITED) |
We are in an environment of heightened geopolitical risks and with increasing rates, volatility is likely to remain high. Within this uncertainty, companies that can demonstrate consistent earnings upgrades are likely to be rewarded. We continue to believe that bottom-up stock-picking focussed on companies that offer good quality, reasonable valuations, positive earnings and price momentum is the best way to capture these opportunities.
Definition of the Comparative Index
The MSCI Emerging Markets Equity Index (Net) is a free float-adjusted market capitalization index that is designed to measure equity market performance of emerging markets.
The information may discuss general market activity or industry trends and is not intended to be relied upon as a forecast, research or investment advice. The economic and market views presented herein reflect Ninety One North America, Inc.’s judgment as at the date shown and are subject to change without notice. There is no guarantee that views and opinions expressed will be correct, and Ninety One North America, Inc.’s intentions to buy or sell particular securities in the future may change. The investment views, analysis and market opinions expressed may not reflect those of Ninety One North America, Inc.’s as a whole, and different views may be expressed based on different investment objectives. This communication is based on internal data, public and third party sources. Although we believe the information to be reliable, we have not independently verified it, and we cannot guarantee its accuracy or completeness. Ninety One North America, Inc.’s internal data may not be audited. Holdings are subject to change. Current and future holdings are subject to risk.
11
| THE ADVISORS’ INNER CIRCLE FUND III | NINETY ONE EMERGING MARKETS EQUITY FUND OCTOBER 31, 2022 (UNAUDITED) |
Comparison of Change in the Value of a $10,000 Investment in the Ninety One Emerging Markets Equity Fund, I Shares, versus the MSCI Emerging Markets Equity Index (Net).
AVERAGE ANNUAL TOTAL RETURN FOR THE YEAR ENDED OCTOBER 31, 2022 | ||||||
| 1 Year | 3 Year | Inception to Date* | ||||
I Shares* | -32.04% | -5.47% | -2.46% | |||
A Shares (without sales charge)* | -32.22% | -5.70% | -2.69% | |||
A Shares (with sales charge)* | -36.11% | -7.54% | -4.15% | |||
MSCI Emerging Markets Equity Index (Net) | -31.03% | -4.42% | -1.54% | |||
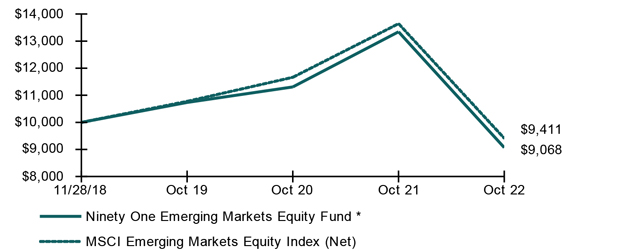
* Fund commenced operations on November 28, 2018. The graph is based on I Shares only; Performance for A Shares would have been lower due to a maximum front-end sales charge of 5.75% and differences in fee structures.
The performance data quoted herein represents past performance and the return and value of an investment in the Fund will fluctuate so that, when redeemed, it may be worth less than its original cost. Past performance is no guarantee of future performance and should not be considered as a representation of the future results of the Fund. The Fund’s performance assumes the reinvestment of dividends and capital gains. Index returns assume reinvestment of dividends and, unlike a fund’s returns, do not reflect any fees or expenses. If such fees and expenses were included in the index returns, the performance would have been lower.
Please note that one cannot invest directly in an unmanaged index.
There are no assurances that the Fund will meet its stated objectives. The Fund’s holdings and allocations are subject to change because it is actively managed and should not be considered recommendations to buy individual securities.
Returns shown do not reflect the deduction of taxes that a shareholder would pay on Fund distributions or the redemption of Fund shares.
See definition of comparative index on page 11.
12
| THE ADVISORS’ INNER CIRCLE FUND III | NINETY ONE GLOBAL ENVIRONMENT FUND OCTOBER 31, 2022 (UNAUDITED) |
Ninety One Global Environment Fund – Annual Review – November 1, 2021 to October 31, 2022
Fund performance
The Fund underperformed the MSCI All Country World Index over the period. The Fund produced an absolute return of -26.33%*, behind the index return of -19.96% for the same period.
At the stock level, the main detractors from relative returns included Xinyi Solar, which declined partly due to concern over cost inflation concurrent with low solar-glass prices. As the leading producer of solar glass globally, we maintain conviction that the company can perform strongly in the long-term due to structural growth drivers including the transition to renewable energy. Other detractors included Beyond Meat, which makes alternative proteins. Its shares were weak on concern over slowing sales. We sold this position in Q3 as we believed the structural-growth case had deteriorated, impairing the financial health of the business. Vestas Wind Systems, which makes equipment for wind-energy generation, also detracted. It underperformed partly after the company lowered its operating profit margin forecast during the period, citing higher costs, supply-chain delays and component shortages. Longer term, a positive outlook for windfarm development globally underpins Vestas’ potential, in our view. Aptiv, a global technology company that mainly serves the auto industry and which is enabling the shift to electrified transport, was another detractor. Rather than any company-specific issues, its underperformance largely reflected the general weakness of the technology and auto sectors in the period, respectively a function of a broad shift from growth to value equities and of concern over the macro outlook. We maintain our view that the company has strong positive exposure to structural growth trends linked to decarbonisation. Wuxi Lead Intelligent Equipment, which manufactures and sells battery-production equipment and services to leading EV battery manufacturers in China and hence is contributing to the transition to cleaner, electrified transport, also detracted. There were some short-term headwinds to revenue growth resulting from Chinese COVID measures in the period, but profitability has improved and we believe the longer-term structural growth outlook for the company remains strong.
The main contributors to relative returns included Sungrow Power Supply, which benefited from broad-based support for renewable energy, which was boosted in the period by the passage of the Inflation Reduction Act in the US, which is supportive of the clean-energy transition. Based in China, Sungrow is one of the world’s largest manufacturers of solar inverters, which are key enablers of solar-power systems. Waste Management, a US waste and environmental-services business, also contributed. It reported solid results amid strong volumes and pricing
13
| THE ADVISORS’ INNER CIRCLE FUND III | NINETY ONE GLOBAL ENVIRONMENT FUND OCTOBER 31, 2022 (UNAUDITED) |
during the period, and benefited additionally from being a high-quality and less cyclical business as concern mounted over the global economic outlook. Other contributors included Zhejiang Sanhua Intelligent Controls, which outperformed partly on the news that battery-producer CATL’s next-generation battery, which will have a 1,000km range and for which Sanhua provides vital components, will go into production next year. Brambles, a reusable pallet provider, was another outperformer as it continued to demonstrate strong pricing and on a positive outlook for 2023. Finally, Trane Technologies performed well following robust earnings that showed strong bookings growth, as well as improved operational execution. The company is the leader in the heating, ventilation and air conditioning (HVAC) sector, which accounts for a significant amount of the energy used in buildings due to aged equipment and low-efficiency systems.
* Based on the 40Act Global Environment Fund, I Share, covering 12m to end-Oct 2022.
Outlook
The global economic outlook is challenging, and a significant slowdown would be a headwind for many businesses. In this context, we continue to take comfort from the fact that every company in the Global Environment portfolio is positively exposed to the powerful structural growth trend of decarbonisation.
In our view, this trend remains firmly intact, as evidenced during the period by the passage of the Inflation Reduction Act. As is always the case with policy, the devil is in the detail. In this case, we think the details are well designed and will support decarbonisation for years to come. Indeed, in important respects the momentum behind decarbonisation has been strengthened in the past year, not least by heightened energy security concerns and spiralling energy costs as a result of the Russia-Ukraine conflict, which we ultimately expect to accelerate the transition to a low-carbon economy.
In the meantime, while some of our holdings are more cyclically exposed than others, we believe that the structural drivers of growth dominate the cyclical drivers for every company that we own. Our analysis of our holdings under different economic scenarios has strengthened our conviction that the Global Environment portfolio has the potential to perform well through an economic cycle and to give investors differentiated exposure relative to broad equities.
Definition of the Comparative Index
The MSCI All Country World Index (Net) is a market capitalization weighted index designed to provide a broad measure of equity-market performance throughout the world and is calculated with dividends reinvested after deduction of withholding tax.
14
| THE ADVISORS’ INNER CIRCLE FUND III | NINETY ONE GLOBAL ENVIRONMENT FUND OCTOBER 31, 2022 (UNAUDITED) |
The information may discuss general market activity or industry trends and is not intended to be relied upon as a forecast, research or investment advice. The economic and market views presented herein reflect Ninety One North America, Inc.’s judgment as at the date shown and are subject to change without notice. There is no guarantee that views and opinions expressed will be correct, and Ninety One North America, Inc.’s intentions to buy or sell particular securities in the future may change. The investment views, analysis and market opinions expressed may not reflect those of Ninety One North America, Inc.’s as a whole, and different views may be expressed based on different investment objectives. This communication is based on internal data, public and third party sources. Although we believe the information to be reliable, we have not independently verified it, and we cannot guarantee its accuracy or completeness. Ninety One North America, Inc.’s internal data may not be audited. Holdings are subject to change. Current and future holdings are subject to risk.
15
| THE ADVISORS’ INNER CIRCLE FUND III | NINETY ONE GLOBAL ENVIRONMENT FUND OCTOBER 31, 2022 (UNAUDITED) |
Comparison of Change in the Value of a $10,000 Investment in the Ninety One Global Environment Fund, I Shares, versus the MSCI All Country World Index (Net).
AVERAGE ANNUAL TOTAL RETURN FOR THE YEAR ENDED OCTOBER 31, 2022 | ||||
| 1 Year | Inception to Date* | |||
I Shares* | -26.33% | -23.23% | ||
MSCI All Country World Index (Net) | -19.96% | -16.83% | ||
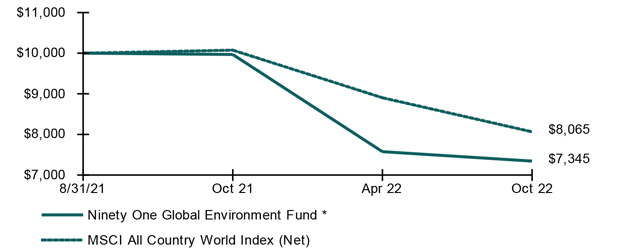
** Commenced operations on August 31, 2021. The graph is based on I Shares only.
The performance data quoted herein represents past performance and the return and value of an investment in the Fund will fluctuate so that, when redeemed, it may be worth less than its original cost. Past performance is no guarantee of future performance and should not be considered as a representation of the future results of the Fund. The Fund’s performance assumes the reinvestment of dividends and capital gains. Index returns assume reinvestment of dividends and, unlike a fund’s returns, do not reflect any fees or expenses. If such fees and expenses were included in the index returns, the performance would have been lower.
Please note that one cannot invest directly in an unmanaged index.
There are no assurances that the Fund will meet its stated objectives. The Fund’s holdings and allocations are subject to change because it is actively managed and should not be considered recommendations to buy individual securities.
Returns shown do not reflect the deduction of taxes that a shareholder would pay on Fund distributions or the redemption of Fund shares.
See definition of comparative index on page 14.
16
| THE ADVISORS’ INNER CIRCLE FUND III | NINETY ONE GLOBAL FRANCHISE FUND OCTOBER 31, 2022 |
SECTOR WEIGHTINGS (unaudited) †:
|
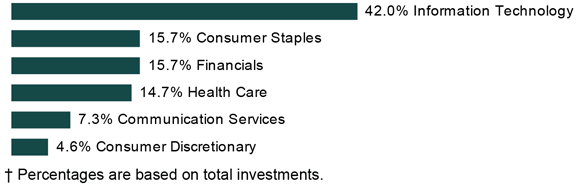
COMMON STOCK — 97.3% |
| Shares | Value | |||||||
CHINA — 2.1% | ||||||||
NetEase ADR | 98,051 | $ | 5,453,597 | |||||
|
| |||||||
GERMANY — 3.2% | ||||||||
Beiersdorf | 85,399 | 8,202,369 | ||||||
|
| |||||||
IRELAND — 2.7% | ||||||||
ICON * | 34,223 | 6,770,678 | ||||||
|
| |||||||
NETHERLANDS — 5.4% | ||||||||
ASML Holding | 28,826 | 13,618,269 | ||||||
|
| |||||||
SOUTH KOREA — 1.6% | ||||||||
Samsung Electronics GDR | 3,897 | 4,062,652 | ||||||
|
| |||||||
SWITZERLAND — 8.1% | ||||||||
Nestle | 98,461 | 10,728,142 | ||||||
Roche Holding | 29,561 | 9,823,143 | ||||||
|
| |||||||
| 20,551,285 | ||||||||
|
| |||||||
UNITED KINGDOM — 1.6% | ||||||||
St. James’s Place | 339,477 | 4,162,604 | ||||||
|
| |||||||
UNITED STATES — 72.6% | ||||||||
Communication Services — 4.9% | ||||||||
Electronic Arts | 64,309 | 8,100,361 | ||||||
Fox | 150,294 | 4,338,988 | ||||||
|
| |||||||
| 12,439,349 | ||||||||
|
| |||||||
The accompanying notes are an integral part of the financial statements.
17
| THE ADVISORS’ INNER CIRCLE FUND III | NINETY ONE GLOBAL FRANCHISE FUND OCTOBER 31, 2022 |
COMMON STOCK — continued |
| Shares | Value | |||||||
Consumer Discretionary — 4.5% | ||||||||
Booking Holdings * | 6,125 | $ | 11,450,565 | |||||
|
| |||||||
Consumer Staples — 7.9% | ||||||||
Estee Lauder, Cl A | 40,156 | 8,050,876 | ||||||
Philip Morris International | 129,636 | 11,907,067 | ||||||
|
| |||||||
| 19,957,943 | ||||||||
|
| |||||||
Financials — 13.6% | ||||||||
Charles Schwab | 80,060 | 6,378,380 | ||||||
FactSet Research Systems | 16,863 | 7,175,038 | ||||||
Moody’s | 51,626 | 13,674,179 | ||||||
S&P Global | 23,121 | 7,427,621 | ||||||
|
| |||||||
| 34,655,218 | ||||||||
|
| |||||||
Health Care — 7.8% | ||||||||
Becton Dickinson | 38,519 | 9,089,328 | ||||||
Johnson & Johnson | 61,505 | 10,700,025 | ||||||
|
| |||||||
| 19,789,353 | ||||||||
|
| |||||||
Information Technology — 33.9% | ||||||||
Autodesk * | 44,763 | 9,592,711 | ||||||
Automatic Data Processing | 33,310 | 8,051,027 | ||||||
Check Point Software Technologies * | 53,823 | 6,955,547 | ||||||
Intuit | 28,838 | 12,328,245 | ||||||
Microsoft | 59,117 | 13,722,829 | ||||||
VeriSign * | 61,070 | 12,242,092 | ||||||
Visa, Cl A | 112,694 | 23,345,689 | ||||||
|
| |||||||
| 86,238,140 | ||||||||
|
| |||||||
| 184,530,568 | ||||||||
|
| |||||||
Total Common Stock | 247,352,022 | |||||||
|
| |||||||
Total Investments— 97.3% | $ | 247,352,022 | ||||||
|
| |||||||
Percentages are based on Net Assets of $254,112,140.
| * | Non-income producing security. |
ADR — American Depositary Receipt
Cl — Class
GDR — Global Depositary Receipt
The accompanying notes are an integral part of the financial statements.
18
| THE ADVISORS’ INNER CIRCLE FUND III | NINETY ONE GLOBAL FRANCHISE FUND OCTOBER 31, 2022 |
As of October 31, 2022, all of the Fund’s investments were considered level 1, in accordance with the authoritative guidance on fair value measurements and disclosure under U.S. GAAP.
The accompanying notes are an integral part of the financial statements.
19
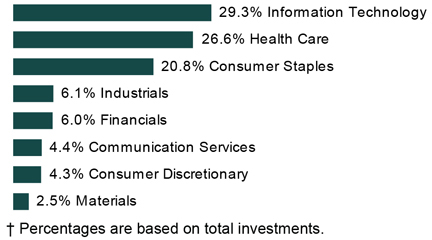
| THE ADVISORS’ INNER CIRCLE FUND III | NINETY ONE INTERNATIONAL FRANCHISE FUND OCTOBER 31, 2022 |
SECTOR WEIGHTINGS (unaudited) †: |
SCHEDULE OF INVESTMENTS
COMMON STOCK — 94.6% |
| Shares | Value | |||||||
AUSTRALIA — 5.5% | ||||||||
CSL | 241 | $ | 43,224 | |||||
REA Group | 438 | 34,055 | ||||||
|
|
| ||||||
| 77,279 | ||||||||
|
|
| ||||||
CANADA — 4.3% | ||||||||
Constellation Software | 42 | 60,654 | ||||||
|
|
| ||||||
CHINA — 4.9% | ||||||||
Hangzhou Tigermed Consulting, Cl H | 2,500 | 16,991 | ||||||
Kweichow Moutai, Cl A | 146 | 27,005 | ||||||
NetEase | 2,300 | 25,081 | ||||||
|
|
| ||||||
| 69,077 | ||||||||
|
|
| ||||||
FRANCE — 9.8% | ||||||||
EssilorLuxottica | 433 | 68,623 | ||||||
Hermes International | 27 | 34,971 | ||||||
L’Oreal | 109 | 34,269 | ||||||
|
|
| ||||||
| 137,863 | ||||||||
|
|
| ||||||
GERMANY — 9.7% | ||||||||
Beiersdorf | 409 | 39,283 | ||||||
SAP | 634 | 61,201 | ||||||
Siemens Healthineers | 773 | 35,587 | ||||||
|
|
| ||||||
| 136,071 | ||||||||
|
|
| ||||||
The accompanying notes are an integral part of the financial statements.
20
| THE ADVISORS’ INNER CIRCLE FUND III | NINETY ONE INTERNATIONAL FRANCHISE FUND OCTOBER 31, 2022 |
COMMON STOCK — continued | ||||||||
| Shares | Value | |||||||
HONG KONG — 2.4% | ||||||||
AIA Group | 4,400 | $ | 33,323 | |||||
|
|
| ||||||
IRELAND — 3.2% | ||||||||
ICON * | 224 | 44,316 | ||||||
|
|
| ||||||
NETHERLANDS — 9.8% | ||||||||
ASML Holding | 138 | 65,195 | ||||||
Heineken | 348 | 29,098 | ||||||
Wolters Kluwer | 412 | 43,794 | ||||||
|
|
| ||||||
| 138,087 | ||||||||
|
|
| ||||||
SWITZERLAND — 14.0% | ||||||||
Alcon | 772 | 47,011 | ||||||
Lonza Group | 66 | 33,991 | ||||||
Nestle | 627 | 68,317 | ||||||
Roche Holding | 144 | 47,851 | ||||||
|
|
| ||||||
| 197,170 | ||||||||
|
|
| ||||||
TAIWAN — 2.1% | ||||||||
Taiwan Semiconductor Manufacturing ADR | 481 | 29,606 | ||||||
|
|
| ||||||
UNITED KINGDOM — 11.1% | ||||||||
Experian | 1,203 | 38,422 | ||||||
InterContinental Hotels Group | 434 | 23,465 | ||||||
London Stock Exchange Group | 544 | 47,388 | ||||||
Reckitt Benckiser Group | 689 | 45,851 | ||||||
|
|
| ||||||
| 155,126 | ||||||||
|
|
| ||||||
UNITED STATES — 17.8% | ||||||||
Accenture, Cl A | 177 | 50,250 | ||||||
Check Point Software Technologies * | 241 | 31,145 | ||||||
Estee Lauder, Cl A | 110 | 22,054 | ||||||
Mastercard, Cl A | 294 | 96,485 | ||||||
Philip Morris International | 538 | 49,415 | ||||||
|
|
| ||||||
| 249,349 | ||||||||
|
|
| ||||||
Total Common Stock | 1,327,921 | |||||||
|
|
| ||||||
The accompanying notes are an integral part of the financial statements.
21
| THE ADVISORS’ INNER CIRCLE FUND III | NINETY ONE INTERNATIONAL FRANCHISE FUND OCTOBER 31, 2022 |
PREFERRED STOCK — 1.5% | ||||||||
| Shares | Value | |||||||
GERMANY — 1.5% | ||||||||
Sartorius (a) (Cost $25,739) | 59 | $ | 20,823 | |||||
|
|
| ||||||
Total Investments— 96.1% | $ | 1,348,744 | ||||||
|
|
| ||||||
Percentages are based on Net Assets of $1,403,421.
* Non-income producing security.
(a) There is currently no rate available.
ADR — American Depositary Receipt
Cl — Class
As of October 31, 2022, all of the Fund’s investments were considered level 1, in accordance with the authoritative guidance on fair value measurements and disclosure under U.S. GAAP.
The accompanying notes are an integral part of the financial statements.
22
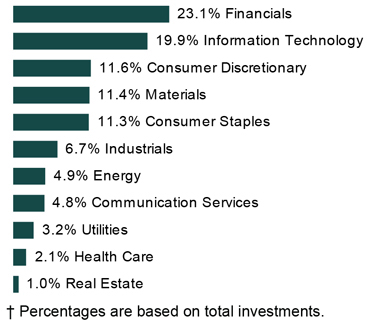
| THE ADVISORS’ INNER CIRCLE FUND III | NINETY ONE EMERGING MARKETS EQUITY FUND OCTOBER 31, 2022 |
SECTOR WEIGHTINGS (unaudited) †: |
SCHEDULE OF INVESTMENTS
COMMON STOCK — 97.2% | ||||||||
| Shares | Value | |||||||
BRAZIL — 5.7% | ||||||||
Atacadao | 361,303 | $ | 1,341,309 | |||||
Banco Bradesco ADR | 534,272 | 2,024,891 | ||||||
Porto Seguro | 373,367 | 1,655,061 | ||||||
Vale ADR, Cl B | 183,659 | 2,376,547 | ||||||
|
| |||||||
| 7,397,808 | ||||||||
|
| |||||||
CHILE — 0.9% | ||||||||
Sociedad Quimica y Minera de Chile ADR | 11,911 | 1,115,822 | ||||||
|
| |||||||
CHINA — 22.3% | ||||||||
Alibaba Group Holding * | 463,236 | 3,626,292 | ||||||
Bosideng International Holdings | 3,052,000 | 1,318,023 | ||||||
China Construction Bank, Cl H | 2,725,000 | 1,447,575 | ||||||
China Longyuan Power Group, Cl H | 1,771,000 | 2,023,716 | ||||||
China Resources Gas Group | 202,100 | 517,489 | ||||||
CITIC | 590,000 | 528,380 | ||||||
Contemporary Amperex Technology, Cl A | 20,081 | 1,025,923 | ||||||
East Money Information, Cl A | 564,062 | 1,206,397 | ||||||
ENN Energy Holdings | 147,500 | 1,466,573 | ||||||
Haier Smart Home, Cl H | 525,000 | 1,313,528 | ||||||
Hongfa Technology, Cl A | 196,284 | 922,712 | ||||||
Inner Mongolia Yili Industrial Group, Cl A | 325,052 | 1,124,094 | ||||||
The accompanying notes are an integral part of the financial statements.
23
| THE ADVISORS’ INNER CIRCLE FUND III | NINETY ONE EMERGING MARKETS EQUITY FUND OCTOBER 31, 2022 |
COMMON STOCK — continued | ||||||||
| Shares | Value | |||||||
CHINA (continued) | ||||||||
Kweichow Moutai, Cl A | 4,194 | $ | 775,751 | |||||
Meituan, Cl B * | 171,300 | 2,723,395 | ||||||
NetEase | 238,300 | 2,598,582 | ||||||
Ping An Insurance Group of China, Cl H | 341,500 | 1,366,026 | ||||||
Tencent Holdings | 70,300 | 1,841,268 | ||||||
Tsingtao Brewery, Cl H | 206,000 | 1,443,340 | ||||||
Zijin Mining Group, Cl H | 1,554,000 | 1,484,742 | ||||||
|
| |||||||
| 28,753,806 | ||||||||
|
| |||||||
HONG KONG — 4.1% | ||||||||
AIA Group | 292,000 | 2,211,431 | ||||||
Hong Kong Exchanges & Clearing | 40,700 | 1,083,626 | ||||||
Pacific Basin Shipping | 2,950,000 | 714,026 | ||||||
WH Group | 2,507,623 | 1,268,211 | ||||||
|
| |||||||
| 5,277,294 | ||||||||
|
| |||||||
HUNGARY — 0.5% | ||||||||
Richter Gedeon Nyrt | 32,133 | 634,633 | ||||||
|
| |||||||
INDIA — 15.4% | ||||||||
HDFC Bank | 114,929 | 2,078,031 | ||||||
Hindustan Aeronautics | 40,193 | 1,228,477 | ||||||
Infosys ADR | 195,203 | 3,656,152 | ||||||
ITC | 585,008 | 2,464,345 | ||||||
LIC Housing Finance | 189,779 | 929,207 | ||||||
Mahindra & Mahindra | 80,849 | 1,317,181 | ||||||
Max Healthcare Institute * | 255,234 | 1,406,944 | ||||||
Muthoot Finance | 99,050 | 1,248,573 | ||||||
Reliance Industries | 147,251 | 4,535,425 | ||||||
Tech Mahindra | 5,389 | 69,230 | ||||||
Zomato * | 1,154,989 | 880,430 | ||||||
|
| |||||||
| 19,813,995 | ||||||||
|
| |||||||
INDONESIA — 2.8% | ||||||||
Bank Central Asia | 3,711,900 | 2,094,228 | ||||||
Telkom Indonesia Persero | 5,486,600 | 1,544,233 | ||||||
|
| |||||||
| 3,638,461 | ||||||||
|
| |||||||
MALAYSIA — 1.2% | ||||||||
CIMB Group Holdings | 1,301,100 | 1,519,051 | ||||||
|
| |||||||
The accompanying notes are an integral part of the financial statements.
24
| THE ADVISORS’ INNER CIRCLE FUND III | NINETY ONE EMERGING MARKETS EQUITY FUND OCTOBER 31, 2022 |
COMMON STOCK — continued | ||||||||
| Shares | Value | |||||||
MEXICO — 5.3% | ||||||||
Arca Continental | 21,617 | $ | 176,277 | |||||
Grupo Aeroportuario del Sureste, Cl B | 43,868 | 1,027,624 | ||||||
Grupo Mexico | 444,472 | 1,598,165 | ||||||
Ternium ADR | 35,899 | 1,033,532 | ||||||
Wal-Mart de Mexico | 793,310 | 3,059,093 | ||||||
|
| |||||||
| 6,894,691 | ||||||||
|
| |||||||
NETHERLANDS — 1.3% | ||||||||
OCI | 42,709 | 1,634,423 | ||||||
|
| |||||||
POLAND — 0.9% | ||||||||
Bank Polska Kasa Opieki | 69,046 | 1,135,102 | ||||||
|
| |||||||
PORTUGAL — 0.7% | ||||||||
Jeronimo Martins SGPS | 41,656 | 863,759 | ||||||
|
| |||||||
QATAR — 1.0% | ||||||||
Qatar National Bank QPSC | 224,811 | 1,230,928 | ||||||
|
| |||||||
RUSSIA — 0.0% | ||||||||
Moscow Exchange MICEX-RTS PJSC (a) | 491,250 | 23,913 | ||||||
|
| |||||||
SAUDI ARABIA — 1.9% | ||||||||
Leejam Sports JSC | 2,740 | 57,679 | ||||||
Saudi Arabian Oil | 173,111 | 1,607,849 | ||||||
Saudi National Bank | 51,001 | 806,233 | ||||||
|
| |||||||
| 2,471,761 | ||||||||
|
| |||||||
SOUTH AFRICA — 6.3% | ||||||||
Anglo American | 67,955 | 2,040,880 | ||||||
Bidcorp | 104,006 | 1,672,698 | ||||||
FirstRand | 447,237 | 1,566,029 | ||||||
Naspers, Cl N | 21,717 | 2,245,380 | ||||||
Netcare | 627,707 | 532,155 | ||||||
|
| |||||||
| 8,057,142 | ||||||||
|
| |||||||
SOUTH KOREA — 9.5% | ||||||||
Kia | 23,076 | 1,074,056 | ||||||
LG | 18,349 | 1,020,212 | ||||||
The accompanying notes are an integral part of the financial statements.
25
| THE ADVISORS’ INNER CIRCLE FUND III | NINETY ONE EMERGING MARKETS EQUITY FUND OCTOBER 31, 2022 |
COMMON STOCK — continued | ||||||||
| Shares | Value | |||||||
SOUTH KOREA (continued) | ||||||||
LG Energy Solution * | 4,391 | $ | 1,627,609 | |||||
Samsung Electronics | 181,485 | 7,567,980 | ||||||
Samsung Life Insurance | 21,185 | 1,002,400 | ||||||
|
| |||||||
| 12,292,257 | ||||||||
|
| |||||||
TAIWAN — 11.9% | ||||||||
Fubon Financial Holding | 1,042,998 | 1,650,799 | ||||||
Hon Hai Precision Industry | 663,000 | 2,109,008 | ||||||
MediaTek | 114,000 | 2,087,361 | ||||||
Taiwan Semiconductor Manufacturing | 778,000 | 9,416,401 | ||||||
Yageo | 4,776 | 54,392 | ||||||
|
| |||||||
| 15,317,961 | ||||||||
|
| |||||||
THAILAND — 1.1% | ||||||||
Bangkok Bank | 373,700 | 1,428,622 | ||||||
|
| |||||||
TURKEY — 0.2% | ||||||||
TAV Havalimanlari Holding * | 67,682 | 285,239 | ||||||
|
| |||||||
UNITED ARAB EMIRATES — 1.9% | ||||||||
Abu Dhabi Commercial Bank PJSC | 496,920 | 1,278,472 | ||||||
Emaar Properties PJSC | 735,230 | 1,213,023 | ||||||
|
| |||||||
| 2,491,495 | ||||||||
|
| |||||||
UNITED KINGDOM — 1.2% | ||||||||
Mondi | 95,495 | 1,607,984 | ||||||
|
| |||||||
UNITED STATES — 1.1% | ||||||||
Mosaic | 27,135 | 1,458,506 | ||||||
|
| |||||||
Total Common Stock | 125,344,653 | |||||||
|
| |||||||
Total Investments— 97.2% | $ | 125,344,653 | ||||||
|
| |||||||
Percentages are based on Net Assets of $128,944,229.
The accompanying notes are an integral part of the financial statements.
26
| THE ADVISORS’ INNER CIRCLE FUND III | NINETY ONE EMERGING MARKETS EQUITY FUND OCTOBER 31, 2022 |
| * | Non-income producing security. |
| (a) | Level 3 security in accordance with fair value hierarchy. |
ADR — American Depositary Receipt
Cl — Class
JSC — Joint-Stock Company
MICEX-RTS — Moscow Interbank Currency Exchange-Russian Trading System
Nyrt — Hungarian Public Limited Company
PJSC — Public Joint-Stock Company
The following is a summary of the level of the inputs used as of October 31, 2022, in valuing the Fund’s investments carried at value:
Investments in Securities | Level 1 | Level 2 | Level 3^ | Total | ||||||||||||
Common Stock | ||||||||||||||||
Brazil | $ | 7,397,808 | $ | — | $ | — | $ | 7,397,808 | ||||||||
Chile | 1,115,822 | — | — | 1,115,822 | ||||||||||||
China | 28,753,806 | — | — | 28,753,806 | ||||||||||||
Hong Kong | 5,277,294 | — | — | 5,277,294 | ||||||||||||
Hungary | — | 634,633 | — | 634,633 | ||||||||||||
India | 19,813,995 | — | — | 19,813,995 | ||||||||||||
Indonesia | 3,638,461 | — | — | 3,638,461 | ||||||||||||
Malaysia | 1,519,051 | — | — | 1,519,051 | ||||||||||||
Mexico | 6,894,691 | — | — | 6,894,691 | ||||||||||||
Netherlands | 1,634,423 | — | — | 1,634,423 | ||||||||||||
Poland | 1,135,102 | — | — | 1,135,102 | ||||||||||||
Portugal | 863,759 | — | — | 863,759 | ||||||||||||
Qatar | 1,230,928 | — | — | 1,230,928 | ||||||||||||
Russia | — | — | 23,913 | 23,913 | ||||||||||||
Saudi Arabia | 2,471,761 | — | — | 2,471,761 | ||||||||||||
South Africa | 8,057,142 | — | — | 8,057,142 | ||||||||||||
South Korea | 12,292,257 | — | — | 12,292,257 | ||||||||||||
Taiwan | 15,317,961 | — | — | 15,317,961 | ||||||||||||
Thailand | 1,428,622 | — | — | 1,428,622 | ||||||||||||
Turkey | 285,239 | — | — | 285,239 | ||||||||||||
United Arab Emirates | 2,491,495 | — | — | 2,491,495 | ||||||||||||
United Kingdom | 1,607,984 | — | — | 1,607,984 | ||||||||||||
United States | 1,458,506 | — | — | 1,458,506 | ||||||||||||
|
|
|
|
|
|
|
| |||||||||
Total Investments in Securities | $ | 124,686,107 | $ | 634,633 | $ | 23,913 | $ | 125,344,653 | ||||||||
|
|
|
|
|
|
|
| |||||||||
^ A reconciliation of Level 3 investments, including certain disclosures related to significant inputs used in valuing Level 3 investments, is only presented when the Fund has over 1% of Level 3 investments at the end of the period in relation to net assets.
Amounts designated as” “—” are $0.
The accompanying notes are an integral part of the financial statements.
27
| THE ADVISORS’ INNER CIRCLE FUND III | NINETY ONE GLOBAL ENVIRONMENT FUND OCTOBER 31, 2022 |
SECTOR WEIGHTINGS (unaudited) †: | ||||
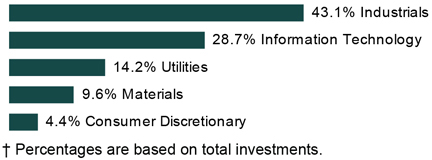
SCHEDULE OF INVESTMENTS COMMON STOCK — 97.9% |
| |||||||
| Shares | Value | |||||||
AUSTRALIA — 4.7% | ||||||||
Brambles | 196,342 | $ | 1,466,438 | |||||
|
| |||||||
CHINA — 16.0% | ||||||||
Contemporary Amperex Technology, Cl A | 8,658 | 442,331 | ||||||
Sungrow Power Supply, Cl A | 47,468 | 851,466 | ||||||
Wuxi Lead Intelligent Equipment, Cl A | 217,077 | 1,489,791 | ||||||
Xinyi Solar Holdings | 1,260,000 | 1,250,393 | ||||||
Zhejiang Sanhua Intelligent Controls, Cl A | 318,154 | 926,311 | ||||||
|
| |||||||
| 4,960,292 | ||||||||
|
| |||||||
DENMARK — 9.5% | ||||||||
Novozymes, Cl B | 27,543 | 1,446,889 | ||||||
Orsted | 14,193 | 1,170,856 | ||||||
Vestas Wind Systems | 17,693 | 348,573 | ||||||
|
| |||||||
| 2,966,318 | ||||||||
|
| |||||||
GERMANY — 3.5% | ||||||||
Infineon Technologies | 44,281 | 1,078,370 | ||||||
|
| |||||||
SPAIN — 4.9% | ||||||||
Iberdrola | 151,462 | 1,538,137 | ||||||
|
| |||||||
TAIWAN — 3.9% | ||||||||
Voltronic Power Technology | 30,000 | 1,219,645 | ||||||
|
| |||||||
UNITED KINGDOM — 4.8% | ||||||||
Croda International | 19,061 | 1,483,534 | ||||||
|
| |||||||
The accompanying notes are an integral part of the financial statements.
28
| THE ADVISORS’ INNER CIRCLE FUND III | NINETY ONE GLOBAL ENVIRONMENT FUND OCTOBER 31, 2022 |
COMMON STOCK — continued | ||||||||
| Shares | Value | |||||||
UNITED STATES — 50.6% | ||||||||
Consumer Discretionary — 4.3% | ||||||||
Aptiv * | 14,854 | $ | 1,352,754 | |||||
|
| |||||||
Industrials — 20.5% | ||||||||
Rockwell Automation | 6,474 | 1,652,812 | ||||||
Schneider Electric | 10,041 | 1,272,852 | ||||||
Trane Technologies | 11,617 | 1,854,421 | ||||||
Waste Management | 9,994 | 1,582,750 | ||||||
|
| |||||||
| 6,362,835 | ||||||||
|
| |||||||
Information Technology — 20.6% | ||||||||
Analog Devices | 8,824 | 1,258,479 | ||||||
ANSYS * | 6,539 | 1,446,165 | ||||||
Autodesk * | 8,434 | 1,807,406 | ||||||
TE Connectivity | 15,387 | 1,880,753 | ||||||
|
| |||||||
| 6,392,803 | ||||||||
|
| |||||||
Utilities — 5.2% | ||||||||
NextEra Energy | 20,803 | 1,612,233 | ||||||
|
| |||||||
| 15,720,625 | ||||||||
|
| |||||||
Total Common Stock | 30,433,359 | |||||||
|
| |||||||
Total Investments— 97.9% | $ | 30,433,359 | ||||||
|
| |||||||
Percentages are based on Net Assets of $31,095,178.
| * | Non-income producing security. |
Cl — Class
As of October 31, 2022, all of the Fund’s investments were considered level 1, in accordance with the authoritative guidance on fair value measurements and disclosure under U.S. GAAP.
The accompanying notes are an integral part of the financial statements.
29
| THE ADVISORS’ INNER CIRCLE FUND III | NINETY ONE FUNDS OCTOBER 31, 2022 |
| ||||||||
| Ninety One Global Franchise Fund | Ninety One International Franchise Fund | |||||||
Assets: | ||||||||
Investments, at Value (Cost $249,343,873 and $1,740,071) | $ | 247,352,022 | $ | 1,348,744 | ||||
Foreign Currency, at Value (Cost $12,516 and $65,839) | 12,687 | 65,850 | ||||||
Cash | 4,491,637 | 27,749 | ||||||
Receivable for Capital Shares Sold | 2,407,841 | – | ||||||
Reclaim Receivable | 254,002 | 1,171 | ||||||
Dividend and Interest Receivable | – | 302 | ||||||
Receivable due from Investment Adviser | – | 18,566 | ||||||
Prepaid Expenses | 14,061 | 12,274 | ||||||
|
|
|
|
|
| |||
Total Assets | 254,532,250 | 1,474,656 | ||||||
|
|
|
|
|
| |||
Liabilities: | ||||||||
Payable for Capital Shares Redeemed | 213,775 | 121 | ||||||
Payable due to Investment Adviser | 103,807 | – | ||||||
Audit Fees Payable | 26,380 | 26,380 | ||||||
Payable due to Administrator | 20,532 | 9,740 | ||||||
Transfer Agent Fees Payable | 15,953 | 4,368 | ||||||
Printing Fees Payable | 6,459 | 1,563 | ||||||
Payable due to Trustees | 6,085 | 35 | ||||||
Chief Compliance Officer Fees Payable | 4,147 | 24 | ||||||
Dividend and Interest Payable | 3,239 | – | ||||||
Custody Fees Payable | 2,060 | 1,511 | ||||||
Distribution Fees Payable - A Shares | 870 | – | ||||||
Due to Broker | – | 27,171 | ||||||
Other Accrued Expenses | 16,803 | 322 | ||||||
|
|
|
|
|
| |||
Total Liabilities | 420,110 | 71,235 | ||||||
|
|
|
|
|
| |||
Net Assets | $ | 254,112,140 | $ | 1,403,421 | ||||
|
|
|
|
|
| |||
| NET ASSETS CONSIST OF: | ||||||||
Paid-in Capital | $ | 260,806,943 | $ | 1,826,045 | ||||
Total Accumulated Losses | (6,694,803 | ) | (422,624 | ) | ||||
|
|
|
|
|
| |||
Net Assets | $ | 254,112,140 | $ | 1,403,421 | ||||
|
|
|
|
|
| |||
I Shares: | ||||||||
Net Assets | $ | 249,939,472 | $ | 1,403,421 | ||||
Outstanding Shares of Beneficial Interest (Unlimited Authorization - No Par Value) | 18,837,818 | 189,937 | ||||||
|
|
|
|
|
| |||
Net Asset Value, Offering and Redemption Price Per Share | $ | 13.27 | $ | 7.39 | ||||
|
|
|
|
|
| |||
A Shares: | ||||||||
Net Assets | $ | 4,172,668 | N/A | |||||
Outstanding Shares of Beneficial Interest (Unlimited Authorization - No Par Value) | 315,971 | N/A | ||||||
|
|
|
|
|
| |||
Net Asset Value, Offering and Redemption Price Per Share | $ | 13.21 | N/A | |||||
|
|
|
|
|
| |||
Maximum Offering Price Per Share ($13.21/94.25%) | $ | 14.02 | N/A | |||||
|
|
|
|
|
| |||
The accompanying notes are an integral part of the financial statements.
30
| THE ADVISORS’ INNER CIRCLE FUND III | NINETY ONE FUNDS OCTOBER 31, 2022 |
STATEMENTS OF ASSETS AND LIABILITIES (continued) |
| Ninety One Emerging Markets Equity Fund | Ninety One Global Environment Fund | |||||||
Assets: | ||||||||
Investments, at Value (Cost $158,639,547 and $36,102,545) | $ | 125,344,653 | $ | 30,433,359 | ||||
Foreign Currency, at Value (Cost $1,163,199 and $48,455) | 1,162,196 | 48,946 | ||||||
Cash | 394,135 | 800,798 | ||||||
Receivable for Investments Sold | 1,863,485 | 449,028 | ||||||
Receivable for Capital Shares Sold | 907,907 | 1,001 | ||||||
Dividend and Interest Receivable | 216,151 | – | ||||||
Reclaim Receivable | 25,810 | 8,345 | ||||||
Unrealized Gain on Foreign Spot Currency Contracts | 229 | 2,122 | ||||||
Receivable due from Investment Adviser | – | 5,852 | ||||||
Prepaid Expenses | 25,747 | 12,769 | ||||||
|
|
|
|
|
| |||
Total Assets | 129,940,313 | 31,762,220 | ||||||
|
|
|
|
|
| |||
Liabilities: | ||||||||
Payable for Investments Purchased | 625,221 | 610,810 | ||||||
Accrued Foreign Capital Gains Tax on Appreciation | 190,556 | – | ||||||
Payable for Capital Shares Redeemed | 45,578 | – | ||||||
Custody Fees Payable | 31,151 | 5,321 | ||||||
Payable due to Investment Adviser | 26,406 | – | ||||||
Audit Fees Payable | 26,380 | 26,380 | ||||||
Transfer Agent Fees Payable | 12,245 | 5,268 | ||||||
Payable due to Administrator | 11,890 | 9,740 | ||||||
Printing Fees Payable | 6,194 | 4,376 | ||||||
Payable due to Trustees | 3,439 | 764 | ||||||
Chief Compliance Officer Fees Payable | 2,344 | 521 | ||||||
Distribution Fees Payable - A Shares | 11 | – | ||||||
Other Accrued Expenses | 14,669 | 3,862 | ||||||
|
|
|
|
|
| |||
Total Liabilities | 996,084 | 667,042 | ||||||
|
|
|
|
|
| |||
Net Assets | $ | 128,944,229 | $ | 31,095,178 | ||||
|
|
|
|
|
| |||
| NET ASSETS CONSIST OF: | ||||||||
Paid-in Capital | $ | 176,362,590 | $ | 37,614,326 | ||||
Total Accumulated Losses | (47,418,361 | ) | (6,519,148 | ) | ||||
|
|
|
|
|
| |||
Net Assets | $ | 128,944,229 | $ | 31,095,178 | ||||
|
|
|
|
|
| |||
I Shares: | ||||||||
Net Assets | $ | 128,941,619 | $ | 31,095,178 | ||||
Outstanding Shares of Beneficial Interest (Unlimited Authorization - No Par Value) | 16,017,111 | 4,252,276 | ||||||
|
|
|
|
|
| |||
Net Asset Value, Offering and Redemption Price Per Share | $8.05 | $7.31 | ||||||
|
|
|
|
|
| |||
A Shares: | ||||||||
Net Assets | $ | 2,610 | N/A | |||||
Outstanding Shares of Beneficial Interest (Unlimited Authorization - No Par Value) | 325 | N/A | ||||||
|
|
|
|
|
| |||
Net Asset Value, Offering and Redemption Price Per Share | $8.03 | N/A | ||||||
|
|
|
|
|
| |||
Maximum Offering Price Per Share ($8.03/94.25%) | $8.52 | N/A | ||||||
|
|
|
|
|
| |||
The accompanying notes are an integral part of the financial statements.
31
| THE ADVISORS’ INNER CIRCLE FUND III | NINETY ONE FUNDS FOR THE YEAR ENDED OCTOBER 31, 2022 |
| Ninety One Global Franchise Fund | Ninety One International Franchise Fund | |||||||
Investment Income: | ||||||||
Dividends | $ | 3,161,558 | $ | 23,632 | ||||
Less: Foreign Taxes Withheld | (142,630 | ) | (1,724 | ) | ||||
|
|
|
|
|
| |||
Total Investment Income | 3,018,928 | 21,908 | ||||||
|
|
|
|
|
| |||
Expenses: | ||||||||
Investment Advisory Fees | 1,941,315 | 11,956 | ||||||
Administration Fees - Note 4 | 257,405 | 96,670 | ||||||
Trustees’ Fees | 27,215 | 158 | ||||||
Distribution Fees - A Shares | 14,656 | – | ||||||
Chief Compliance Officer Fees | 10,712 | 2,374 | ||||||
Transfer Agent Fees | 94,705 | 25,772 | ||||||
Legal Fees | 57,048 | 2,341 | ||||||
Registration and Filing Fees | 54,536 | 8,885 | ||||||
Printing Fees | 44,210 | 2,252 | ||||||
Audit Fees | 26,380 | 26,380 | ||||||
Custodian Fees | 6,200 | 8,064 | ||||||
Other Expenses | 51,948 | 4,540 | ||||||
|
|
|
|
|
| |||
Total Expenses | 2,586,330 | 189,392 | ||||||
|
|
|
|
|
| |||
Less: | ||||||||
Investment Advisory Fees Waiver | (371,159 | ) | (11,956 | ) | ||||
Reimbursement from Adviser | – | (163,860 | ) | |||||
Fees Paid Indirectly — Note 4 | (326 | ) | (26 | ) | ||||
|
|
|
|
|
| |||
Net Expenses | 2,214,845 | 13,550 | ||||||
|
|
|
|
|
| |||
Net Investment Income | 804,083 | 8,358 | ||||||
|
|
|
|
|
| |||
Net Realized Gain (Loss) on: | ||||||||
Investments | (5,211,396 | ) | (38,564 | ) | ||||
Foreign Currency Transactions | (15,548 | ) | (1,017 | ) | ||||
|
|
|
|
|
| |||
Net Realized Gain (Loss) | (5,226,944 | ) | (39,581 | ) | ||||
|
|
|
|
|
| |||
Net Change in Unrealized Appreciation (Depreciation) on: | ||||||||
Investments | (55,008,229 | ) | (416,648 | ) | ||||
Foreign Currency Transactions | (22,327 | ) | (74 | ) | ||||
|
|
|
|
|
| |||
Net Change in Unrealized Appreciation (Depreciation) | (55,030,556 | ) | (416,722 | ) | ||||
|
|
|
|
|
| |||
Net Realized and Net Change in Unrealized Loss | (60,257,500 | ) | (456,303 | ) | ||||
|
|
|
|
|
| |||
Net Decrease in Net Assets Resulting from Operations | $ | (59,453,417 | ) | $ | (447,945 | ) | ||
|
|
|
|
|
| |||
The accompanying notes are an integral part of the financial statements.
32
| THE ADVISORS’ INNER CIRCLE FUND III | NINETY ONE FUNDS FOR THE YEAR ENDED OCTOBER 31, 2022 |
STATEMENTS OF OPERATIONS (continued) |
| Ninety One Emerging Markets Equity Fund | Ninety One Global Environment Fund | |||||||
Investment Income: | ||||||||
Dividends | $ | 5,162,326 | $ | 361,547 | ||||
Less: Foreign Taxes Withheld | (485,029 | ) | (20,387 | ) | ||||
|
|
|
|
|
| |||
Total Investment Income | 4,677,297 | 341,160 | ||||||
|
|
|
|
|
| |||
Expenses: | ||||||||
Investment Advisory Fees | 961,223 | 179,620 | ||||||
Administration Fees - Note 4 | 139,999 | 96,670 | ||||||
Trustees’ Fees | 13,921 | 2,551 | ||||||
Chief Compliance Officer Fees | 6,766 | 3,229 | ||||||
Distribution Fees - A Shares | 109 | – | ||||||
Custodian Fees | 100,234 | 21,471 | ||||||
Transfer Agent Fees | 72,252 | 29,623 | ||||||
Registration and Filing Fees | 48,100 | 11,604 | ||||||
Legal Fees | 27,289 | 5,990 | ||||||
Audit Fees | 26,380 | 26,380 | ||||||
Printing Fees | 15,659 | 4,879 | ||||||
Other Expenses | 65,229 | 10,838 | ||||||
|
|
|
|
|
| |||
Total Expenses | 1,477,161 | 392,855 | ||||||
|
|
|
|
|
| |||
Less: | ||||||||
Investment Advisory Fees Waiver | (386,556 | ) | (177,281 | ) | ||||
Fees Paid Indirectly — Note 4 | (199 | ) | (26 | ) | ||||
|
|
|
|
|
| |||
Net Expenses | 1,090,406 | 215,548 | ||||||
|
|
|
|
|
| |||
Net Investment Income | 3,586,891 | 125,612 | ||||||
|
|
|
|
|
| |||
Net Realized Gain (Loss) on: | ||||||||
Investments | (15,713,369 | ) | (941,269 | ) | ||||
Foreign Currency Transactions | (160,909 | ) | 8,991 | |||||
|
|
|
|
|
| |||
Net Realized Gain (Loss) | (15,874,278 | ) | (932,278 | ) | ||||
|
|
|
|
|
| |||
Net Change in Unrealized Appreciation (Depreciation) on: | ||||||||
Investments | (38,201,211 | ) | (5,935,788 | ) | ||||
Foreign capital gains tax on securities | 68,979 | – | ||||||
Foreign Currency Transactions | 2,912 | 2,304 | ||||||
|
|
|
|
|
| |||
Net Change in Unrealized Appreciation (Depreciation) | (38,129,320 | ) | (5,933,484 | ) | ||||
|
|
|
|
|
| |||
Net Realized and Net Change in Unrealized Loss | (54,003,598 | ) | (6,865,762 | ) | ||||
|
|
|
|
|
| |||
Net Decrease in Net Assets Resulting from Operations | $ | (50,416,707 | ) | $ | (6,740,150 | ) | ||
|
|
|
|
|
| |||
The accompanying notes are an integral part of the financial statements.
33
| THE ADVISORS’ INNER CIRCLE FUND III | NINETY ONE GLOBAL FRANCHISE FUND |
| STATEMENTS OF CHANGES IN NET ASSETS |
| Year Ended October 31, 2022 | Year Ended October 31, 2021 | |||||||
Operations: | ||||||||
Net Investment Income | $ | 804,083 | $ | 281,332 | ||||
Net Realized Gain (Loss) | (5,226,944 | ) | 949,758 | |||||
Net Change in Unrealized Appreciation (Depreciation) | (55,030,556 | ) | 42,575,532 | |||||
|
|
|
|
|
| |||
Net Increase (Decrease) in Net Assets Resulting From Operations | (59,453,417 | ) | 43,806,622 | |||||
|
|
|
|
|
| |||
Distributions: | ||||||||
I Shares | (334,326 | ) | (433,522 | ) | ||||
A Shares | – | (8,224 | ) | |||||
|
|
|
|
|
| |||
Total Distributions | (334,326 | ) | (441,746 | ) | ||||
|
|
|
|
|
| |||
Capital Share Transactions: | ||||||||
I Shares: | ||||||||
Issued | 132,399,157 | 119,983,838 | ||||||
Reinvestment of Distributions | 295,167 | 426,908 | ||||||
Redeemed | (59,742,494 | ) | (22,973,825 | ) | ||||
|
|
|
|
|
| |||
Increase from I Shares Capital Share Transactions | 72,951,830 | 97,436,921 | ||||||
|
|
|
|
|
| |||
A Shares: | ||||||||
Issued | 1,242,535 | 1,929,223 | ||||||
Reinvestment of Distributions | – | 8,224 | ||||||
Redeemed | (2,185,339 | ) | (1,371,960 | ) | ||||
|
|
|
|
|
| |||
Increase (Decrease) from A Shares Capital Share Transactions | (942,804 | ) | 565,487 | |||||
|
|
|
|
|
| |||
Net Increase in Net Assets From Capital Share | ||||||||
Transactions | 72,009,026 | 98,002,408 | ||||||
|
|
|
|
|
| |||
Total Increase in Net Assets | 12,221,283 | 141,367,284 | ||||||
|
|
|
|
|
| |||
Net Assets: | ||||||||
Beginning of Year | 241,890,857 | 100,523,573 | ||||||
|
|
|
|
|
| |||
End of Year | $ | 254,112,140 | $ | 241,890,857 | ||||
|
|
|
|
|
| |||
Shares Transactions: | ||||||||
I Shares: | ||||||||
Issued | 8,822,497 | 7,853,553 | ||||||
Reinvestment of Distributions | 17,486 | 30,170 | ||||||
Redeemed | (4,190,055 | ) | (1,489,944 | ) | ||||
|
|
|
|
|
| |||
Increase in Shares Outstanding from I Shares Transactions | 4,649,928 | 6,393,779 | ||||||
|
|
|
|
|
| |||
A Shares: | ||||||||
Issued | 81,316 | 132,373 | ||||||
Reinvestment of Distributions | – | 582 | ||||||
Redeemed | (155,261 | ) | (89,560 | ) | ||||
|
|
|
|
|
| |||
Increase (Decrease) in Shares Outstanding from A Shares Transactions | (73,945 | ) | 43,395 | |||||
|
|
|
|
|
| |||
Net Increase in Shares Outstanding From Share Transactions | 4,575,983 | 6,437,174 | ||||||
|
|
|
|
|
| |||
The accompanying notes are an integral part of the financial statements.
34
| THE ADVISORS’ INNER CIRCLE FUND III | NINETY ONE INTERNATIONAL FRANCHISE FUND |
STATEMENTS OF CHANGES IN NET ASSETS (continued) |
| Year Ended October 31, 2022 | Period Ended October 31, 2021(1) | |||||||
Operations: | ||||||||
Net Investment Income (Loss) | $ | 8,358 | $ | (775 | ) | |||
Net Realized Loss | (39,581 | ) | (1,672 | ) | ||||
Net Change in Unrealized Appreciation (Depreciation) | (416,722 | ) | 25,319 | |||||
|
|
|
|
|
| |||
Net Increase (Decrease) in Net Assets Resulting From Operations | (447,945 | ) | 22,872 | |||||
|
|
|
|
|
| |||
Capital Share Transactions: | ||||||||
I Shares: | ||||||||
Issued | 332,835 | 1,786,705 | ||||||
Redeemed | (290,276 | ) | (770 | ) | ||||
|
|
|
|
|
| |||
Increase from I Shares Capital Share Transactions | 42,559 | 1,785,935 | ||||||
|
|
|
|
|
| |||
Net Increase in Net Assets From Capital Share Transactions | 42,559 | 1,785,935 | ||||||
|
|
|
|
|
| |||
Total Increase (Decrease) in Net Assets | (405,386 | ) | 1,808,807 | |||||
|
|
|
|
|
| |||
Net Assets: | ||||||||
Beginning of Year or Period | 1,808,807 | – | ||||||
|
|
|
|
|
| |||
End of Year or Period | $ | 1,403,421 | $ | 1,808,807 | ||||
|
|
|
|
|
| |||
Shares Transactions: | ||||||||
I Shares: | ||||||||
Issued | 43,448 | 184,706 | ||||||
Redeemed | (38,139 | ) | (78 | ) | ||||
|
|
|
|
|
| |||
Increase in Shares Outstanding from I Shares Transactions | 5,309 | 184,628 | ||||||
|
|
|
|
|
| |||
Net Increase in Shares Outstanding From Share Transactions | 5,309 | 184,628 | ||||||
|
|
|
|
|
| |||
(1) The Fund commenced operations on August 31, 2021.
The accompanying notes are an integral part of the financial statements.
35
| THE ADVISORS’ INNER CIRCLE FUND III | NINETY ONE EMERGING MARKETS EQUITY FUND |
STATEMENTS OF CHANGES IN NET ASSETS (continued) | ||||||||
| Year Ended October 31, 2022 | Year Ended October 31, 2021 | |||||||
Operations: | ||||||||
Net Investment Income | $ | 3,586,891 | $ | 1,408,455 | ||||
Net Realized Gain (Loss) | (15,874,278 | ) | 9,787,594 | |||||
Net Change in Unrealized Depreciation | (38,129,320 | ) | (2,890,393 | ) | ||||
|
|
|
|
|
| |||
Net Increase (Decrease) in Net Assets Resulting From Operations | (50,416,707 | ) | 8,305,656 | |||||
|
|
|
|
|
| |||
Distributions: | ||||||||
I Shares | (9,557,980 | ) | (732,810 | ) | ||||
A Shares | (1,241 | ) | (140 | ) | ||||
|
|
|
|
|
| |||
Total Distributions | (9,559,221 | ) | (732,950 | ) | ||||
|
|
|
|
|
| |||
Capital Share Transactions: | ||||||||
I Shares: | ||||||||
Issued | 96,348,375 | 80,332,196 | ||||||
Reinvestment of Distributions | 9,535,077 | 732,810 | ||||||
Redeemed | (23,322,017 | ) | (39,108,711 | ) | ||||
|
|
|
|
|
| |||
Increase from I Shares Capital Share Transactions | 82,561,435 | 41,956,295 | ||||||
|
|
|
|
|
| |||
A Shares: | ||||||||
Issued | 3,449,828 | 799,595 | ||||||
Reinvestment of Distributions | 1,241 | 140 | ||||||
Redeemed | (3,500,168 | ) | (797,934 | ) | ||||
|
|
|
|
|
| |||
Increase (Decrease) from A Shares Capital Share Transactions | (49,099 | ) | 1,801 | |||||
|
|
|
|
|
| |||
Net Increase in Net Assets From Capital Share Transactions | 82,512,336 | 41,958,096 | ||||||
|
|
|
|
|
| |||
Total Increase in Net Assets | 22,536,408 | 49,530,802 | ||||||
|
|
|
|
|
| |||
Net Assets: | ||||||||
Beginning of Year | 106,407,821 | 56,877,019 | ||||||
|
|
|
|
|
| |||
End of Year | $ | 128,944,229 | $ | 106,407,821 | ||||
|
|
|
|
|
| |||
Shares Transactions: | ||||||||
I Shares: | ||||||||
Issued | 9,171,351 | 6,138,258 | ||||||
Reinvestment of Distributions | 813,340 | 57,430 | ||||||
Redeemed | (2,261,108 | ) | (3,075,106 | ) | ||||
|
|
|
|
|
| |||
Increase in Shares Outstanding from I Shares Transactions | 7,723,583 | 3,120,582 | ||||||
|
|
|
|
|
| |||
A Shares: | ||||||||
Issued | 340,722 | 59,447 | ||||||
Reinvestment of Distributions | 106 | 11 | ||||||
Redeemed | (341,803 | ) | (59,414 | ) | ||||
|
|
|
|
|
| |||
Increase (Decrease) in Shares Outstanding from A Shares Transactions | (975 | ) | 44 | |||||
|
|
|
|
|
| |||
Net Increase in Shares Outstanding From Share Transactions | 7,722,608 | 3,120,626 | ||||||
|
|
|
|
|
| |||
The accompanying notes are an integral part of the financial statements.
36
| THE ADVISORS’ INNER CIRCLE FUND III | NINETY ONE GLOBAL ENVIRONMENT FUND |
STATEMENTS OF CHANGES IN NET ASSETS (continued) | ||||||||
| Year Ended October 31, 2022 | Period Ended October 31, 2021(1) | |||||||
Operations: | ||||||||
Net Investment Income | $ | 125,612 | $ | 443 | ||||
Net Realized Gain (Loss) | (932,278 | ) | 22,957 | |||||
Net Change in Unrealized Appreciation (Depreciation) | (5,933,484 | ) | 266,123 | |||||
|
|
|
|
|
| |||
Net Increase (Decrease) in Net Assets Resulting From Operations | (6,740,150 | ) | 289,523 | |||||
|
|
|
|
|
| |||
Distributions: | ||||||||
I Shares | (68,521 | ) | – | |||||
|
|
|
|
|
| |||
Total Distributions | (68,521 | ) | – | |||||
|
|
|
|
|
| |||
Capital Share Transactions: | ||||||||
I Shares: | ||||||||
Issued | 23,181,006 | 14,418,422 | ||||||
Reinvestment of Distributions | 68,521 | – | ||||||
Redeemed | (53,392 | ) | (231 | ) | ||||
|
|
|
|
|
| |||
Increase from I Shares Capital Share Transactions | 23,196,135 | 14,418,191 | ||||||
|
|
|
|
|
| |||
Net Increase in Net Assets From Capital Share Transactions | 23,196,135 | 14,418,191 | ||||||
|
|
|
|
|
| |||
Total Increase in Net Assets | 16,387,464 | 14,707,714 | ||||||
|
|
|
|
|
| |||
Net Assets: | ||||||||
Beginning of Year or Period | 14,707,714 | – | ||||||
|
|
|
|
|
| |||
End of Year or Period | $ | 31,095,178 | $ | 14,707,714 | ||||
|
|
|
|
|
| |||
Shares Transactions: | ||||||||
I Shares: | ||||||||
Issued | 2,777,359 | 1,474,636 | ||||||
Reinvestment of Distributions | 7,018 | – | ||||||
Redeemed | (6,714 | ) | (23 | ) | ||||
|
|
|
|
|
| |||
Increase in Shares Outstanding from I Shares Transactions | 2,777,663 | 1,474,613 | ||||||
|
|
|
|
|
| |||
Net Increase in Shares Outstanding From Share Transactions | 2,777,663 | 1,474,613 | ||||||
|
|
|
|
|
| |||
(1) The Fund commenced operations on August 31, 2021.
The accompanying notes are an integral part of the financial statements.
37
| THE ADVISORS’ INNER CIRCLE FUND III | NINETY ONE GLOBAL FRANCHISE FUND |
Selected Per Share Data & Ratios
For a Share Outstanding
| I Shares | ||||||||||||||||||||
| Year Ended October 31, 2022 | Year Ended October 31, 2021 | Year Ended October 31, 2020 | Year Ended October 31, 2019 | Period Ended October 31, 2018(1) | ||||||||||||||||
Net Asset Value, Beginning of Year or Period | $16.59 | $12.35 | $11.67 | $10.19 | $10.00 | |||||||||||||||
|
|
|
|
|
|
|
|
|
|
|
|
|
|
| ||||||
Income from Investment Operations: | ||||||||||||||||||||
Net Investment Income* | 0.05 | 0.03 | 0.07 | 0.09 | 0.08 | |||||||||||||||
Net Realized and Unrealized Gain (Loss) | (3.35 | ) | 4.26 | 0.72 | 1.47 | 0.12 | ||||||||||||||
|
|
|
|
|
|
|
|
|
|
|
|
|
|
| ||||||
Total from Investment Operations | (3.30 | ) | 4.29 | 0.79 | 1.56 | 0.20 | ||||||||||||||
|
|
|
|
|
|
|
|
|
|
|
|
|
|
| ||||||
Dividends and Distributions: | ||||||||||||||||||||
Net Investment Income | (0.02 | ) | (0.05 | ) | (0.07 | ) | (0.08 | ) | (0.01 | ) | ||||||||||
Capital Gains | — | — | (0.04 | ) | — | — | ||||||||||||||
|
|
|
|
|
|
|
|
|
|
|
|
|
|
| ||||||
Total Dividends and Distributions | (0.02 | ) | (0.05 | ) | (0.11 | ) | (0.08 | ) | (0.01 | ) | ||||||||||
|
|
|
|
|
|
|
|
|
|
|
|
|
|
| ||||||
Net Asset Value, End of Year or Period | $13.27 | $16.59 | $12.35 | $11.67 | $10.19 | |||||||||||||||
|
|
|
|
|
|
|
|
|
|
|
|
|
|
| ||||||
Total Return† | (19.91 | )% | 34.85% | 6.77% | 15.45% | 1.98% | ||||||||||||||
|
|
|
|
|
|
|
|
|
|
|
|
|
|
| ||||||
Ratios and Supplemental Data | ||||||||||||||||||||
Net Assets, End of Year or Period (Thousands) | $249,939 | $235,443 | $96,258 | $60,832 | $33,481 | |||||||||||||||
Ratio of Expenses to Average Net Assets | 0.85% | 0.85% | 0.85% | 0.85% | 0.85% | †† | ||||||||||||||
Ratio of Expenses to Average Net Assets (Excluding Waivers and Reimbursements) | 0.99% | 1.02% | 1.24% | 1.56% | 2.10% | †† | ||||||||||||||
Ratio of Net Investment Income to Average Net Assets | 0.32% | 0.17% | 0.60% | 0.79% | 0.93% | †† | ||||||||||||||
Portfolio Turnover Rate | 3% | 5% | 9% | 7% | 9% | ‡ | ||||||||||||||
| * | Per share calculations were performed using average shares for the period. |
| † | Total return is for the period indicated and has not been annualized. Returns shown do not reflect the deductions of taxes that a shareholder would pay on Fund distributions or the redemption of Fund shares. |
| †† | Annualized |
| ‡ | Portfolio turnover is for the period indicated and has not been annualized. |
| (1) | Commenced operations on December 11, 2017. |
Amounts designated as “—” are either not applicable, $0 or have been rounded to $0. |
The accompanying notes are an integral part of the financial statements.
38
| THE ADVISORS’ INNER CIRCLE FUND III | NINETY ONE GLOBAL FRANCHISE FUND |
FINANCIAL HIGHLIGHTS (continued) | ||||||||||||||||||||
Selected Per Share Data & Ratios
For a Share Outstanding
| A Shares | ||||||||||||||||||||
| Year Ended October 31, 2022 | Year Ended October 31, 2021 | Year Ended October 31, 2020 | Year Ended October 31, 2019 | Period Ended October 31, 2018(1) | ||||||||||||||||
Net Asset Value, Beginning of Year or Period | $16.54 | $12.31 | $11.64 | $10.19 | $10.76 | |||||||||||||||
|
|
|
|
|
|
|
|
|
|
|
|
|
|
| ||||||
Income from Investment Operations: | ||||||||||||||||||||
Net Investment Income (Loss)* | 0.01 | — | 0.05 | 0.05 | (0.01 | ) | ||||||||||||||
Net Realized and Unrealized Gain (Loss) | (3.34 | ) | 4.25 | 0.71 | 1.47 | (0.56 | ) | |||||||||||||
|
|
|
|
|
|
|
|
|
|
|
|
|
|
| ||||||
Total from Investment Operations | (3.33 | ) | 4.25 | 0.76 | 1.52 | (0.57 | ) | |||||||||||||
|
|
|
|
|
|
|
|
|
|
|
|
|
|
| ||||||
Dividends and Distributions: | ||||||||||||||||||||
Net Investment Income | — | (0.02 | ) | (0.05 | ) | (0.07 | ) | — | ||||||||||||
Capital Gains | — | — | (0.04 | ) | — | — | ||||||||||||||
|
|
|
|
|
|
|
|
|
|
|
|
|
|
| ||||||
Total Dividends and Distributions | — | (0.02 | ) | (0.09 | ) | (0.07 | ) | — | ||||||||||||
|
|
|
|
|
|
|
|
|
|
|
|
|
|
| ||||||
Net Asset Value, End of Year or Period | $13.21 | $16.54 | $12.31 | $11.64 | $10.19 | |||||||||||||||
|
|
|
|
|
|
|
|
|
|
|
|
|
|
| ||||||
Total Return† | (20.13 | )% | 34.58% | 6.54% | 15.10% | (5.30) | % | |||||||||||||
|
|
|
|
|
|
|
|
|
|
|
|
|
|
| ||||||
Ratios and Supplemental Data | ||||||||||||||||||||
Net Assets, End of Year or Period (Thousands) | $4,173 | $6,448 | $4,266 | $3,427 | $398 | |||||||||||||||
Ratio of Expenses to Average Net Assets | 1.10% | 1.10% | 1.10% | 1.10% | 1.15%†† | (2) | ||||||||||||||
Ratio of Expenses to Average Net Assets (Excluding Waivers and Reimbursements) | 1.24% | 1.28% | 1.49% | 1.78% | 3.35%† | † | ||||||||||||||
Ratio of Net Investment Income (Loss) to Average Net Assets | 0.06% | —% | 0.38% | 0.48% | (1.00)% | †† | ||||||||||||||
Portfolio Turnover Rate | 3% | 5% | 9% | 7% | 9%‡ | |||||||||||||||
| * | Per share calculations were performed using average shares for the period. |
| † | Total return is for the period indicated and has not been annualized. Returns shown do not reflect the deductions of taxes that a shareholder would pay on Fund distributions or the redemption of Fund shares. |
| †† | Annualized |
| ‡ | Portfolio turnover is for the period indicated and has not been annualized. |
| (1) | Commenced operations on September 28, 2018. |
| (2) | Ratio reflects the impact of low level of average net assets. Under normal asset levels, ratio would have been 1.10%. |
Amounts designated as “—” are either not applicable, $0 or have been rounded to $0. |
The accompanying notes are an integral part of the financial statements.
39
| THE ADVISORS’ INNER CIRCLE FUND III | NINETY ONE INTERNATIONAL FRANCHISE FUND |
FINANCIAL HIGHLIGHTS (continued) | ||||||||
Selected Per Share Data & Ratios
For a Share Outstanding
I Shares | ||||||||
| Year Ended October 31, 2022 | Period Ended October 31, 2021(1) | |||||||
Net Asset Value, Beginning of Year or Period | $9.80 | $10.00 | ||||||
|
|
|
|
|
| |||
Income from Investment Operations: | ||||||||
Net Investment Income (Loss)* | 0.04 | (0.01) | ||||||
Net Realized and Unrealized Loss | (2.45) | (0.19) | ||||||
|
|
|
|
|
| |||
Total from Investment Operations | (2.41) | (0.20) | ||||||
|
|
|
|
|
| |||
Net Asset Value, End of Year or Period | $7.39 | $9.80 | ||||||
|
|
|
|
|
| |||
Total Return† | (24.59)% | (2.00)% | ||||||
|
|
|
|
|
| |||
Ratios and Supplemental Data | ||||||||
Net Assets, End of Year or Period (Thousands) | $1,403 | $1,809 | ||||||
Ratio of Expenses to Average Net Assets | 0.85% | 0.85% | †† | |||||
Ratio of Expenses to Average Net Assets (Excluding Waivers and Reimbursements) | 11.88% | 37.19% | †† | |||||
Ratio of Net Investment Income (Loss) to Average Net Assets | 0.52% | (0.54)% | †† | |||||
Portfolio Turnover Rate | 18% | 0% | ‡ | |||||
| * | Per share calculations were performed using average shares for the period. |
| † | Total return is for the period indicated and has not been annualized. Returns shown do not reflect the deductions of taxes that a shareholder would pay on Fund distributions or the redemption of Fund shares. |
| †† | Annualized |
| ‡ | Portfolio turnover is for the period indicated and has not been annualized. |
| (1) | Commenced operations on August 31, 2021. |
The accompanying notes are an integral part of the financial statements.
40
| THE ADVISORS’ INNER CIRCLE FUND III | NINETY ONE EMERGING MARKETS EQUITY FUND |
FINANCIAL HIGHLIGHTS (continued) | ||||||||||||||||
Selected Per Share Data & Ratios For a Share Outstanding | ||||||||||||||||
I Shares | ||||||||||||||||
| Year Ended October 31, 2022 | Year Ended October 31, 2021 | Year Ended October 31, 2020 | Period Ended October 31, 2019(1) | |||||||||||||
Net Asset Value, Beginning of Year or Period | $12.83 | $10.99 | $10.72 | $10.00 | ||||||||||||
|
|
|
|
|
|
|
|
|
|
|
| |||||
Income from Investment Operations: | ||||||||||||||||
Net Investment Income* | 0.29 | 0.20 | 0.18 | 0.32 | ||||||||||||
Net Realized and Unrealized Gain (Loss) | (4.11 | ) | 1.78 | 0.40 | 0.42 | |||||||||||
|
|
|
|
|
|
|
|
|
|
|
| |||||
Total from Investment Operations | (3.82 | ) | 1.98 | 0.58 | 0.74 | |||||||||||
|
|
|
|
|
|
|
|
|
|
|
| |||||
Dividends and Distributions: | ||||||||||||||||
Net Investment Income | (0.19 | ) | (0.14 | ) | (0.31 | ) | (0.02 | ) | ||||||||
Capital Gains | (0.77 | ) | — | — | — | |||||||||||
|
|
|
|
|
|
|
|
|
|
|
| |||||
Total Dividends and Distributions | (0.96 | ) | (0.14 | ) | (0.31 | ) | (0.02 | ) | ||||||||
|
|
|
|
|
|
|
|
|
|
|
| |||||
Net Asset Value, End of Year or Period | $8.05 | $12.83 | $10.99 | $10.72 | ||||||||||||
|
|
|
|
|
|
|
|
|
|
|
| |||||
Total Return† | (32.04)% | 18.00% | 5.32% | 7.37% | ||||||||||||
|
|
|
|
|
|
|
|
|
|
|
| |||||
Ratios and Supplemental Data | ||||||||||||||||
Net Assets, End of Year or Period (Thousands) | $128,942 | $106,391 | $56,863 | $44,973 | ||||||||||||
Ratio of Expenses to Average Net Assets | 0.85% | 0.85% | 0.85% | 0.85% | †† | |||||||||||
Ratio of Expenses to Average Net Assets (Excluding Waivers and Reimbursements) | 1.15% | 1.29% | 1.65% | 1.99% | †† | |||||||||||
Ratio of Net Investment Income to Average Net Assets | 2.80% | 1.52% | 1.74% | 3.31% | †† | |||||||||||
Portfolio Turnover Rate | 29% | 111% | 55% | 62% | ‡ | |||||||||||
| * | Per share calculations were performed using average shares for the period. |
| † | Total return is for the period indicated and has not been annualized. Returns shown do not reflect the deductions of taxes that a shareholder would pay on Fund distributions or the redemption of Fund shares. |
| †† | Annualized |
| ‡ | Portfolio turnover is for the period indicated and has not been annualized. |
| (1) | Commenced operations on November 28, 2018. |
Amounts designated as “—” are either not applicable, $0 or have been rounded to $0. |
The accompanying notes are an integral part of the financial statements.
41
| THE ADVISORS’ INNER CIRCLE FUND III | NINETY ONE EMERGING MARKETS EQUITY FUND |
FINANCIAL HIGHLIGHTS (continued) | ||||||||||||||||
Selected Per Share Data & Ratios For a Share Outstanding | ||||||||||||||||
A Shares | ||||||||||||||||
| Year Ended October 31, 2022 | Year Ended October 31, 2021 | Year Ended October 31, 2020 | Period Ended October 31, 2019(1) | |||||||||||||
Net Asset Value, Beginning of Year or Period | $12.80 | $10.97 | $10.70 | $10.00 | ||||||||||||
|
|
|
|
|
|
|
|
|
|
|
| |||||
Income from Investment Operations: | ||||||||||||||||
Net Investment Income* | 0.09 | 0.13 | 0.16 | 0.28 | ||||||||||||
Net Realized and Unrealized Gain (Loss) | (3.93 | ) | 1.81 | 0.39 | 0.43 | |||||||||||
|
|
|
|
|
|
|
|
|
|
|
| |||||
Total from Investment Operations | (3.84 | ) | 1.94 | 0.55 | 0.71 | |||||||||||
|
|
|
|
|
|
|
|
|
|
|
| |||||
Dividends and Distributions: | ||||||||||||||||
Net Investment Income | (0.16 | ) | (0.11 | ) | (0.28 | ) | (0.01 | ) | ||||||||
Capital Gains | (0.77 | ) | — | — | — | |||||||||||
|
|
|
|
|
|
|
|
|
|
|
| |||||
Total Dividends and Distributions | (0.93 | ) | (0.11 | ) | (0.28 | ) | (0.01 | ) | ||||||||
|
|
|
|
|
|
|
|
|
|
|
| |||||
Net Asset Value, End of Year or Period | $8.03 | $12.80 | $10.97 | $10.70 | ||||||||||||
|
|
|
|
|
|
|
|
|
|
|
| |||||
Total Return† | (32.22)% | 17.70% | 5.09% | 7.14% | ||||||||||||
|
|
|
|
|
|
|
|
|
|
|
| |||||
Ratios and Supplemental Data | ||||||||||||||||
Net Assets, End of Year or Period (Thousands) | $3 | $17 | $14 | $11 | ||||||||||||
Ratio of Expenses to Average Net Assets | 1.10 | % | 1.10 | % | 1.10 | % | 1.10 | %†† | ||||||||
Ratio of Expenses to Average Net Assets (Excluding Waivers and Reimbursements) | 1.42 | % | 1.52 | % | 1.92 | % | 2.24 | %†† | ||||||||
Ratio of Net Investment Income to Average Net Assets | 0.80 | % | 0.99 | % | 1.54 | % | 2.94 | %†† | ||||||||
Portfolio Turnover Rate | 29 | % | 111 | % | 55 | % | 62 | %‡ | ||||||||
| * | Per share calculations were performed using average shares for the period. |
| † | Total return is for the period indicated and has not been annualized. Returns shown do not reflect the deductions of taxes that a shareholder would pay on Fund distributions or the redemption of Fund shares. |
| †† | Annualized |
| ‡ | Portfolio turnover is for the period indicated and has not been annualized. |
| (1) | Commenced operations on November 28, 2018. |
Amounts designated as “—” are either not applicable, $0 or have been rounded to $0. |
The accompanying notes are an integral part of the financial statements.
42
| THE ADVISORS’ INNER CIRCLE FUND III | NINETY ONE GLOBAL ENVIRONMENT FUND |
FINANCIAL HIGHLIGHTS (continued) |
| Selected Per Share Data & Ratios For a Share Outstanding |
I Shares | ||||||||
| Year Ended October 31, 2022 | Period Ended October 31, 2021(1) | |||||||
Net Asset Value, Beginning of Year or Period | $9.97 | $10.00 | ||||||
|
|
|
|
|
| |||
Income from Investment Operations: | ||||||||
Net Investment Income* | 0.04 | — | ||||||
Net Realized and Unrealized Loss | (2.65 | ) | (0.03 | ) | ||||
|
|
|
|
|
| |||
Total from Investment Operations | (2.61 | ) | (0.03 | ) | ||||
|
|
|
|
|
| |||
Dividends and Distributions: | ||||||||
Net Investment Income | (0.02 | ) | — | |||||
Capital Gains | (0.03 | ) | — | |||||
|
|
|
|
|
| |||
Total Dividends and Distributions | (0.05 | ) | — | |||||
|
|
|
|
|
| |||
Net Asset Value, End of Year or Period | $7.31 | $9.97 | ||||||
|
|
|
|
|
| |||
Total Return† | (26.33)% | (0.30)% | ||||||
|
|
|
|
|
| |||
Ratios and Supplemental Data | ||||||||
Net Assets, End of Year or Period (Thousands) | $31,095 | $14,708 | ||||||
Ratio of Expenses to Average Net Assets | 0.90% | 0.90% | †† | |||||
Ratio of Expenses to Average Net Assets (Excluding Waivers and Reimbursements) | 1.64% | 3.71% | †† | |||||
Ratio of Net Investment Income to Average Net Assets | 0.52% | 0.02% | †† | |||||
Portfolio Turnover Rate | 42% | 6% | ‡ | |||||
| * | Per share calculations were performed using average shares for the period. |
| † | Total return is for the period indicated and has not been annualized. Returns shown do not reflect the deductions of taxes that a shareholder would pay on Fund distributions or the redemption of Fund shares. |
| †† | Annualized |
| ‡ | Portfolio turnover is for the period indicated and has not been annualized. |
| (1) | Commenced operations on August 31, 2021. |
Amounts designated as “—” are either not applicable, $0 or have been rounded to $0. |
The accompanying notes are an integral part of the financial statements.
43
| THE ADVISORS’ INNER CIRCLE FUND III | NINETY ONE FUNDS OCTOBER 31, 2022 |
1. Organization:
The Advisors’ Inner Circle Fund III (the “Trust”) is organized as a Delaware statutory trust under a Declaration of Trust dated December 4, 2013. The Trust is registered under the Investment Company Act of 1940, as amended, as an open-end management investment company with 65 funds. The financial statements herein are those of the Ninety One Global Franchise Fund, the Ninety One International Franchise Fund, the Ninety One Emerging Markets Equity Fund and the Ninety One Global Environment Fund (individually, the “Fund” or collectively, the “Funds”). The investment objective of each of the Ninety One Global Franchise Fund, the Ninety One Emerging Markets Equity Fund, and the Ninety One International Franchise Fund is to seek long-term capital growth; the investment objective of the Ninety One Global Environment Fund is to seek capital growth and long-term income. The Funds are classified as non-diversified investment companies. Ninety One North America, Inc. serves as the Funds’ investment adviser (the “Adviser”). The Ninety One Global Franchise Fund commenced operations on December 11, 2017, and currently offers Class I Shares (effective as of December 11, 2017) and Class A Shares (effective as of September 28, 2018). The Ninety One International Franchise Fund commenced operations on August 31, 2021, and currently offers Class I Shares. The Ninety One Emerging Markets Equity Fund commenced operations on November 28, 2018, and currently offers Class I Shares and Class A Shares. The Ninety One Global Environment Fund commenced operations on August 31, 2021, and currently offers Class I Shares. The financial statements of the remaining funds of the Trust are presented separately. The assets of each of the funds are segregated, and a shareholder’s interest is limited to the funds in which shares are held.
2. Significant Accounting Policies:
The following is a summary of the significant accounting policies, which are consistently followed in the preparation of the financial statements of the Funds. The Funds are investment companies that apply the accounting and reporting guidance issued in Topic 946 by the U.S. Financial Accounting Standards Board (“FASB”).
Use of Estimates — The preparation of financial statements in conformity with U.S. generally accepted accounting principles (“U.S. GAAP”) requires management to make estimates and assumptions that affect the reported amounts of assets and liabilities and disclosure of contingent assets and liabilities as of the date of the financial statements and the reported amounts of increases and decreases in net assets from operations during the reporting period. Actual results could differ from those estimates and such differences could be material.
44
| THE ADVISORS’ INNER CIRCLE FUND III | NINETY ONE FUNDS OCTOBER 31, 2022 |
Security Valuation — Securities listed on a securities exchange, market or automated quotation system for which quotations are readily available (except for securities traded on NASDAQ), including securities traded over the counter, are valued at the last quoted sale price on an exchange or market (foreign or domestic) on which they are traded or, if there is no such reported sale on the valuation date, at the most recent quoted bid price. For securities traded on NASDAQ, the NASDAQ official closing price will be used. The prices for foreign securities are reported in local currency and converted to U.S. dollars using currency exchange rates. Prices for most securities held in the Funds are provided daily by recognized independent pricing agents. If a security price cannot be obtained from an independent, third-party pricing agent, the Funds seek to obtain a bid price from at least one independent broker.
Securities for which market prices are not “readily available” are required to be fair valued under the 1940 Act.
In December 2020, the SEC adopted Rule 2a-5 under the 1940 Act, establishing requirements to determine fair value in good faith for purposes of the 1940 Act. The rule permits fund boards to designate a fund’s investment adviser to perform fair-value determinations, subject to board oversight and certain other conditions. The rule also defines when market quotations are “readily available” for purposes of the 1940 Act and requires a fund to fair value a portfolio investment when a market quotation is not readily available. The SEC also adopted new Rule 31a-4 under the 1940 Act, which sets forth recordkeeping requirements associated with fair-value determinations. The compliance date for Rule 2a-5 and Rule 31a-4 was September 8, 2022.
Effective September 8, 2022, and pursuant to the requirements of Rule 2a-5, the Trust’s Board of Trustees (the “Board”) designated the Adviser as the Board’s valuation designee to perform fair-value determinations for the Funds through a Fair Value Committee (the “Committee”) established by the Adviser and approved new Adviser Fair Value Procedures for the Funds. Prior to September 8, 2022, fair-value determinations were performed in accordance with the Trust’s Fair Value Procedures established by the Board and were implemented through a Fair Value Committee designated by the Board.
Some of the more common reasons that may necessitate that a security be valued using fair value procedures include: the security’s trading has been halted or suspended; the security has been de-listed from a national exchange; the security’s primary trading market is temporarily closed at a time when under normal conditions it would be open; the security has not been traded for an extended period of time; the security’s primary pricing source is not able or willing to provide a price; or trading of the security is subject to local government imposed restrictions. When a security is valued in accordance with
45
| THE ADVISORS’ INNER CIRCLE FUND III | NINETY ONE FUNDS OCTOBER 31, 2022 |
the fair value procedures, the Committee will determine the value after taking into consideration relevant information reasonably available to the Committee.
For securities that principally trade on a foreign market or exchange, a significant gap in time can exist between the time of a particular security’s last trade and the time at which the Funds calculate their net asset value. The closing prices of such securities may no longer reflect their market value at the time the Funds calculate net asset value if an event that could materially affect the value of those securities (a “Significant Event”) has occurred between the time of the security’s last close and the time that the Funds calculate net asset value. A Significant Event may relate to a single issuer or to an entire market sector. If the Adviser of the Funds become aware of a Significant Event that has occurred with respect to a security or group of securities after the closing of the exchange or market on which the security or securities principally trade, but before the time at which the Funds calculate its net asset value, it may request that a Committee meeting be called.
The Funds use Intercontinental Exchange Data Pricing & Reference Data, LLC. (“ICE”) as a third party fair valuation vendor. ICE provides a fair value for foreign securities in the Funds based on certain factors and methodologies (involving, generally, tracking valuation correlations between the U.S. market and each non-U.S. security) applied by ICE in the event that there is a movement in the U.S. market that exceeds a specific threshold established by the Committee. The Committee establishes a “confidence interval” which is used to determine the level of correlation between the value of a foreign security and movements in the U.S. market before a particular security is fair valued when the threshold is exceeded. In the event that the threshold established by the Committee is exceeded on a specific day, the Funds value non-U.S. securities that exceed the applicable “confidence interval” based upon the fair values provided by ICE. In such event, it is not necessary to hold a Committee meeting. In the event that the Adviser believes that the fair values provided by ICE are not reliable, the Adviser contacts SEI Investments Global Funds Services (the “Administrator”) and can request that a meeting of the Committee be held.
If a local market in which the Funds own securities is closed for one or more days, the Funds shall value all securities held in that corresponding currency based on the fair value prices provided by ICE using the predetermined confidence interval discussed above.
In accordance with U.S. GAAP, the Funds disclose fair value of their investments in a hierarchy that prioritizes the inputs to valuation techniques used to measure the fair value. The objective of a fair value measurement is to determine the price that would be received to sell an asset or paid to transfer a liability in an orderly transaction between market participants at the measurement date (an exit price).
46
| THE ADVISORS’ INNER CIRCLE FUND III | NINETY ONE FUNDS OCTOBER 31, 2022 |
Accordingly, the fair value hierarchy gives the highest priority to quoted prices (unadjusted) in active markets for identical assets or liabilities (Level 1) and the lowest priority to unobservable inputs (Level 3). The three levels of the fair value hierarchy are described below:
| · | Level 1 — Unadjusted quoted prices in active markets for identical, unrestricted assets or liabilities that the Funds have the ability to access at the measurement date; |
| · | Level 2 — Other significant observable inputs (includes quoted prices for similar securities, interest rates, prepayment speeds, credit risk, referenced indices, quoted prices in inactive markets, adjusted quoted prices in active markets, adjusted quoted prices on foreign equity securities that were adjusted in accordance with the Adviser’s pricing procedures, etc.); and |
| · | Level 3 — Prices, inputs or exotic modeling techniques which are both significant to the fair value measurement and unobservable (supported by little or no market activity). |
Investments are classified within the level of the lowest significant input considered in determining fair value. Investments classified within Level 3 whose fair value measurement considers several inputs may include Level 1 or Level 2 inputs as components of the overall fair value measurement.
Federal Income Taxes — It is the Funds’ intention to continue to qualify as a regulated investment company for Federal income tax purposes by complying with the appropriate provisions of Subchapter M of the Internal Revenue Code of 1986, as amended. Accordingly, no provisions for Federal income taxes have been made in the financial statements.
The Funds evaluate tax positions taken or expected to be taken in the course of preparing the Funds’ tax returns to determine whether it is “more-likely than-not” (i.e., greater than 50-percent) that each tax position will be sustained upon examination by a taxing authority based on the technical merits of the position. Tax positions not deemed to meet the more-likely-than-not threshold are recorded as a tax benefit or expense in the current year. The Funds did not record any tax provision in the current period. However, management’s conclusions regarding tax positions taken may be subject to review and adjustment at a later date based on factors including, but not limited to, examination by tax authorities (i.e., from commencement of operations, as applicable), on-going analysis of and changes to tax laws, regulations and interpretations thereof.
As of and during the year ended October 31, 2022, the Funds did not have a liability for any unrecognized tax benefits. The Funds recognize interest and penalties, if any, related to unrecognized tax benefits as income tax expense
47
| THE ADVISORS’ INNER CIRCLE FUND III | NINETY ONE FUNDS OCTOBER 31, 2022 |
in the Statement of Operations. During the period, the Funds did not incur any significant interest or penalties.
Security Transactions and Investment Income — Security transactions are accounted for on trade date. Costs used in determining realized gains and losses on the sale of investment securities are based on the specific identification method. Dividend income and expense are recorded on the ex-dividend date. Interest income is recognized on the accrual basis from settlement date. Certain dividends from foreign securities will be recorded as soon as the Funds are informed of the dividends if such information is obtained subsequent to the ex-dividend date.
Foreign Currency Translation — The books and records of the Funds are maintained in U.S. dollars. Investment securities and other assets and liabilities denominated in a foreign currency are translated into U.S. dollars on the date of valuation. The Funds do not isolate that portion of realized or unrealized gains and losses resulting from changes in the foreign exchange rate from fluctuations arising from changes in the market prices of the securities. These gains and losses are included in net realized and net change in unrealized gain and loss on investments on the Statement of Operations. Net realized and net change in unrealized gain and loss on foreign currency transactions represent net foreign exchange gains or losses from foreign currency exchange contracts, disposition of foreign currencies, currency gains or losses realized between trade and settlement dates on securities transactions and the difference between the amount of the investment income and foreign withholding taxes recorded on the Funds’ books and the U.S. dollar equivalent of the amounts actually received or paid.
Expenses — Most expenses of the Trust can be directly attributed to a particular fund. Expenses which cannot be directly attributed to a particular fund are apportioned among the funds of the Trust based on the number of funds and/ or relative net assets.
Classes — Class specific expenses are borne by that class of shares. Income, realized and unrealized gains and losses and non-class specific expenses are allocated to the respective class on the basis of relative daily net assets.
Dividends and Distributions to Shareholders — The Funds distribute substantially all of their net investment income annually. Any net realized capital gains are distributed annually. All distributions are recorded on ex-dividend date.
3. Transactions with Affiliates:
Certain officers of the Trust are also employees of SEI Investments Global Funds Services (the “Administrator”), a wholly owned subsidiary of SEI Investments Company, and/or SEI Investments Distribution Co. (the “Distributor”). Such officers
48
| THE ADVISORS’ INNER CIRCLE FUND III | NINETY ONE FUNDS OCTOBER 31, 2022 |
are paid no fees by the Trust, other than the Chief Compliance Officer (“CCO”) as described below, for serving as officers of the Trust.
The services provided by the CCO and his staff are paid for by the Trust as incurred. The services include regulatory oversight of the Trust’s advisers and service providers as required by SEC regulations. The CCO’s services and fees have been approved by and are reviewed by the Board.
4. Administration, Distribution, Custodian and Transfer Agent Agreements:
The Funds and the Administrator are parties to an Administration Agreement under which the Administrator provides administration services to the Funds. For these services, the Administrator is paid an asset based fee, which will vary depending on the number of share classes and the average daily net assets of the Funds. For the year ended October 31, 2022, the Funds incurred $257,405, $94,999, $139,999 and $94,999 for the Ninety One Global Franchise Fund, the Ninety One International Franchise Fund, the Ninety One Emerging Markets Equity Fund and the Ninety One Global Environment Fund, respectively, for these services.
The Trust has adopted a Distribution Plan with respect to A Shares (the “Plan”) in accordance with the provisions of Rule 12b-1 under the 1940 Act, which regulates circumstances under which an investment company may directly or indirectly bear expenses relating to the distribution of its shares. Under the Plan, the Distributor or financial intermediaries may receive up to 0.25% of the average daily net assets of the A Shares as compensation for distribution and shareholder services. For the year ended October 31, 2022, the Funds incurred $14,656, $–, $109 and $– for the Ninety One Global Franchise Fund, the Ninety One International Franchise Fund, the Ninety One Emerging Markets Equity Fund and the Ninety One Global Environment Fund, respectively, for these services.
Brown Brothers Harriman & Co. acts as custodian (the “Custodian”) for the Funds. The Custodian plays no role in determining the investment policies of the Funds or which securities are to be purchased or sold by the Funds.
DST Systems, Inc. serves as the transfer agent and dividend disbursing agent for the Funds under a transfer agency agreement with the Trust.
During the year ended October 31, 2022, the Funds earned cash management credits of $326, $26, $199 and $26 for the Ninety One Global Franchise Fund, the Ninety One International Franchise Fund, the Ninety One Emerging Markets Equity Fund and the Ninety One Global Environment Fund, respectively, which were used to offset transfer agent expenses. This amount is labeled “Fees Paid Indirectly” on the Statement of Operations.
49
| THE ADVISORS’ INNER CIRCLE FUND III | NINETY ONE FUNDS OCTOBER 31, 2022 |
5. Investment Advisory Agreement:
Under the terms of an investment advisory agreement, the Adviser provides investment advisory services to the Funds at a fee calculated at an annual rate. The advisory fees for each Fund are as follows:
| Advisory Fee | ||
Ninety One Global Franchise Fund | 0.75% | |
Ninety One International Franchise Fund | 0.75% | |
Ninety One Emerging Markets Equity Fund | 0.75% | |
Ninety One Global Environment Fund | 0.75% |
The Adviser has contractually agreed to reduce fees and reimburse expenses to the extent necessary to keep total annual fund operating expenses after fee reductions and/or expense reimbursements (excluding any class specific expenses, dividend and interest expenses, taxes, acquired fund fee expenses and non-routine expenses) from exceeding certain contractual expense limitations of the average daily net assets of the Funds’ I Shares and A Shares until February 28, 2023 (the “Expense Limitation”). Accordingly, the contractual expense limitations for each Fund are as follows:
| Contractual Expense Limitations | ||
Ninety One Global Franchise Fund | 0.85% | |
Ninety One International Franchise Fund | 0.85% | |
Ninety One Emerging Markets Equity Fund | 0.85% | |
Ninety One Global Environment Fund | 0.90% |
Refer to waiver of investment advisory fees on the Statement of Operations for fees waived for the year ended October 31, 2022. The Adviser may recover all or a portion of its fee reductions or expense reimbursements, up to the expense cap in place at the time the expenses were waived, within a three-year period from the year in which it reduced its fee or reimbursed expenses if the Funds’ total annual fund operating expenses are below the Expense Limitation. This agreement may be terminated by the Board for any reason at any time, or by the Adviser, upon ninety (90) days’ prior written notice to the Trust, effective as of the close of business on February 28, 2023. During the year ended October 31, 2022, there has been no recoupment of previously waived and reimbursed fees. As of October 31, 2022, the fees which were previously waived by the Adviser which may be subject to possible future reimbursement, are as follows:
50
| THE ADVISORS’ INNER CIRCLE FUND III | NINETY ONE FUNDS OCTOBER 31, 2022 |
| Expiring | Expiring | Expiring | ||||||||||||||
| 2023 | 2024 | 2025 | Total | |||||||||||||
Ninety One Global Franchise Fund | $ | 339,062 | $ | 298,685 | $ | 371,159 | $ | 1,008,906 | ||||||||
Ninety One International Franchise Fund | N/A | 52,014 | 174,145 | 226,159 | ||||||||||||
Ninety One Emerging Markets Equity Fund | 359,145 | 408,170 | 386,556 | 1,153,871 | ||||||||||||
Ninety One Global Environment Fund | N/A | 54,956 | 175,610 | 230,566 | ||||||||||||
6. Investment Transactions:
For the year ended October 31, 2022, the Ninety One Global Franchise Fund made purchases of $81,623,463 and sales of $7,035,555 in investment securities other than long-term U.S. Government and short-term securities. There were no purchases or sales of long-term U.S. Government securities.
For the year ended October 31, 2022, the Ninety One International Franchise Fund made purchases of $294,932 and sales of $277,722 in investment securities other than long-term U.S. Government and short-term securities. There were no purchases or sales of long-term U.S. Government securities.
For the year ended October 31, 2022, the Ninety One Emerging Markets Equity Fund made purchases of $142,318,083 and sales of $36,336,646 in investment securities other than long-term U.S. Government and short-term securities. There were no purchases or sales of long-term U.S. Government securities.
For the year ended October 31, 2022, the Ninety One Global Environment Fund made purchases of $32,181,767 and sales of $9,502,269 in investment securities other than long-term U.S. Government and short-term securities. There were no purchases or sales of long-term U.S. Government securities.
7. Federal Tax Information:
The amount and character of income and capital gain distributions to be paid, if any, are determined in accordance with Federal income tax regulations, which may differ from U.S. GAAP. As a result, net investment income (loss) and net realized gain (loss) on investment transactions for a reporting period may differ significantly from distributions during the year. The book/tax differences may be temporary or permanent. The permanent differences primarily consist of foreign currency translations, net operating loss offset to short-term capital gain, reclassification of distribution and investments in PFICs.
For year ended October 31, 2022, there were no permanent difference between Paid in capital and Distributable earnings.
51
| THE ADVISORS’ INNER CIRCLE FUND III | NINETY ONE FUNDS OCTOBER 31, 2022 |
The tax character of dividends and distributions declared during the last two fiscal periods was as follows:
| Ordinary Income | Long-Term Capital Gain | Total | ||||||||||
Ninety One Global Franchise Fund |
| |||||||||||
2022 | $ | 334,326 | $ | — | $ | 334,326 | ||||||
2021 | 441,746 | — | 441,746 | |||||||||
Ninety One International Franchise Fund | ||||||||||||
2022 | — | — | — | |||||||||
2021 | — | — | — | |||||||||
Ninety One Emerging Markets Equity Fund | ||||||||||||
2022 | 2,179,224 | 7,379,997 | 9,559,221 | |||||||||
2021 | 732,950 | — | 732,950 | |||||||||
Ninety One Global Environment Fund | ||||||||||||
2022 | 68,521 | — | 68,521 | |||||||||
2021 | — | — | — | |||||||||
As of October 31, 2022, the components of distributable earnings (accumulated losses) on a tax basis were as follows:
Ninety One Global Franchise Fund | ||||
Undistributed Ordinary Income | $ | 680,669 | ||
Capital Loss Carryforwards | (5,366,554 | ) | ||
Unrealized Depreciation | (2,008,916 | ) | ||
Other Temporary Differences | (2 | ) | ||
|
|
| ||
Total Accumulated Loss | $ | (6,694,803 | ) | |
|
|
| ||
Ninety One International Franchise Fund | ||||
Undistributed Ordinary Income | $ | 7,342 | ||
Capital Loss Carryforwards | (38,020 | ) | ||
Unrealized Depreciation | (391,947 | ) | ||
Other Temporary Differences | 1 | |||
|
|
| ||
Total Accumulated Loss | $ | (422,624 | ) | |
|
|
| ||
Ninety One Emerging Markets Equity Fund | ||||
Undistributed Ordinary Income | $ | 2,596,212 | ||
Capital Loss Carryforwards | (13,097,783 | ) | ||
Unrealized Depreciation | (36,916,788 | ) | ||
Other Temporary Differences | (2 | ) | ||
|
|
| ||
Total Accumulated Loss | $ | (47,418,361 | ) | |
|
|
| ||
52
| THE ADVISORS’ INNER CIRCLE FUND III | NINETY ONE FUNDS OCTOBER 31, 2022 |
Ninety One Global Environment Fund | ||||
Undistributed Ordinary Income | $ | 104,820 | ||
Capital Loss Carryforwards | (683,869 | ) | ||
Unrealized Depreciation | (5,940,099 | ) | ||
|
|
| ||
Total Accumulated Loss | $ | (6,519,148 | ) | |
|
|
| ||
During the year ended October 31, 2022, none of the funds utilized capital loss carryforwards to offset capital gains.
Capital loss carryforward rules allow for Registered Investment Companies to carry forward capital losses indefinitely and to retain the character of capital loss carryforwards as short-term or long-term.
The Funds have capital losses carried forward as follows:
| Short-Term Loss | Long-Term Loss | Total | ||||||||||
Ninety One Global Franchise Fund | $ | 2,806,825 | $ | 2,559,729 | $ | 5,366,554 | ||||||
Ninety One International Franchise Fund | 38,020 | — | 38,020 | |||||||||
Ninety One Emerging Markets Equity Fund | 7,684,154 | 5,413,629 | 13,097,783 | |||||||||
Ninety One Global Environment Fund * | 460,642 | 223,227 | 683,869 | |||||||||
* The Global Environment Fund utilization of carryforwards will be subject to annual limitations.
The difference between book-basis and tax-basis unrealized appreciation (depreciation) is due to differences in the timing of recognition of gains and losses on investments for tax and book purposes. The Funds’ net unrealized appreciation difference is attributable primarily to wash sales.
The Federal tax cost and aggregate gross unrealized appreciation and depreciation for the investments held by the Funds at October 31, 2022, were as follows:
Federal Tax Cost | Aggregate | Aggregate | Net | |||||||||||||
Ninety One Global Franchise Fund | ||||||||||||||||
| $ | 249,344,994 | $ | 11,504,784 | $ | (13,513,700 | ) | $ | (2,008,916 | ) | |||||||
Ninety One International Franchise Fund | ||||||||||||||||
| 1,740,616 | 55 | (392,002 | ) | (391,947 | ) | |||||||||||
Ninety One Emerging Markets Equity Fund | ||||||||||||||||
| 162,065,687 | 2,781,565 | (39,507,799 | ) | (36,726,234 | )* | |||||||||||
Ninety One Global Environment Fund | ||||||||||||||||
| 36,375,283 | 377,860 | (6,317,959 | ) | (5,940,099 | ) | |||||||||||
* The difference in unrealized depreciation is attributable to Foreign Capital Gains Tax Payable.
53
| THE ADVISORS’ INNER CIRCLE FUND III | NINETY ONE FUNDS OCTOBER 31, 2022 |
8. Concentration of Risks:
As with all management investment companies, a shareholder of the Funds is subject to the risk that his or her investment could lose money. The Funds are subject to the principal risks noted below, any of which may adversely affect the Funds’ net asset value (“NAV”) and ability of a Fund to meet that Fund’s investment objective.
Investing in each Fund involves risk and there is no guarantee that a Fund will achieve its goals. The Adviser’s judgments about the markets, the economy, or companies may not anticipate actual market movements, economic conditions or company performance, and these judgments may affect the return on your investment. In fact, no matter how good of a job the Adviser does, you could lose money on your investment in a Fund, just as you could with similar investments.
The value of your investment in a Fund is based on the value of the securities the Fund holds. These prices change daily due to economic and other events that affect particular companies and other issuers. These price movements, sometimes called volatility, may be greater or lesser depending on the types of securities a Fund owns and the markets in which they trade. The effect on a Fund of a change in the value of a single security will depend on how widely the Fund diversifies its holdings. Each Fund is non-diversified, meaning that it may invest a large percentage of its assets in a single issuer or a relatively small number of issuers. Accordingly, each Fund will be more susceptible to negative events affecting a small number of holdings than a diversified fund.
Climate Change Focused Investment Risk (Global Environment Fund) –Because the Fund focuses its investments in securities of companies involved in climate change-related industries, the Fund will be more susceptible to events or factors affecting these companies, and the market prices of its portfolio securities may be more volatile than those of funds that are more diversified. The Fund is particularly susceptible to changes in global and regional climates, environmental protection regulatory actions, changes in government standards and subsidy levels, changes in taxation and other domestic and international political, regulatory and economic developments.. Because society’s focus on climate change issues is relatively new, the emphasis and direction of governmental policies is subject to significant change, and rapid technological change could render even new approaches and products obsolete. Some companies involved in climate change-related industries have more limited operating histories and smaller market capitalizations on average than companies in other sectors. As a result of these and other factors, the market prices of securities of companies involved in climate change-related industries tend to be considerably more volatile than those of companies in more established sectors and industries.
Depositary Receipts Risk (All Funds) – ADRs are typically trust receipts issued by a U.S. bank or trust company that evidence an indirect interest in underlying securities
54
| THE ADVISORS’ INNER CIRCLE FUND III | NINETY ONE FUNDS OCTOBER 31, 2022 |
issued by a foreign entity. GDRs, EDRs, and other types of Depositary Receipts are typically issued by non-U.S. banks or financial institutions to evidence an interest in underlying securities issued by either a U.S. or a non-U.S. entity. Investments in non-U.S. issuers through ADRs, GDRs, EDRs, and other types of Depositary Receipts generally involve risks applicable to other types of investments in non-U.S. issuers. Investments in Depositary Receipts may be less liquid and more volatile than the underlying securities in their primary trading market. If a Depositary Receipt is denominated in a different currency than its underlying securities, a Fund will be subject to the currency risk of both the investment in the Depositary Receipt and the underlying security. The values of Depositary Receipts may decline for a number of reasons relating to the issuers or sponsors of the Depositary Receipts, including, but not limited to, insolvency of the issuer or sponsor. Holders of Depositary Receipts may have limited or no rights to take action with respect to the underlying securities or to compel the issuer of the receipts to take action. The prices of Depositary Receipts may differ from the prices of securities upon which they are based. In addition, there is risk involved in investing in unsponsored depositary receipts, as there may be less information available about the underlying issuer than there is about an issuer of sponsored depositary receipts and the prices of unsponsored depositary receipts may be more volatile than those of sponsored depositary receipts.
Equity Risk (All Funds) – Equity securities include common and preferred stocks, shares of Depositary Receipts, as well as shares of ETFs that have economic characteristics similar to equity securities. Common stock represents an equity or ownership interest in an issuer. Preferred stock provides a fixed dividend that is paid before any dividends are paid to common stock holders, and which takes precedence over common stock in the event of a liquidation. Like common stock, preferred stocks represent partial ownership in a company, although preferred stock shareholders do not enjoy any of the voting rights of common stockholders. Also, unlike common stock, a preferred stock pays a fixed dividend that does not fluctuate, although the company does not have to pay this dividend if it lacks the financial ability to do so. Investments in equity securities in general are subject to market risks that may cause their prices to fluctuate over time. In addition, the impact of any epidemic, pandemic or natural disaster, or widespread fear that such events may occur, could negatively affect the global economy, as well as the economies of individual countries, the financial performance of individual companies and sectors, and the markets in general in significant and unforeseen ways. Any such impact could adversely affect the prices and liquidity of the securities and other instruments in which a Fund invests, which in turn could negatively impact the Fund’s performance and cause losses on your investment in the Fund. Recent examples include pandemic risks related to COVID-19 and aggressive measures taken worldwide in response by governments, including closing borders, restricting international and domestic travel, and the imposition of prolonged quarantines of large populations, and by businesses, including changes to operations and reducing
55
| THE ADVISORS’ INNER CIRCLE FUND III | NINETY ONE FUNDS OCTOBER 31, 2022 |
staff. The impact of the COVID-19 pandemic may be short term or may last for an extended period of time, and in either case could result in a substantial economic downturn or recession. Fluctuations in the value of equity securities in which a Fund invests will cause the Fund’s net asset value (“NAV”) to fluctuate. An investment in a portfolio of equity securities may be more suitable for long-term investors who can bear the risk of these share price fluctuations.
ESG Criteria Risk (Global Environment Fund) – The Adviser may consider certain ESG factors as part of its decision to buy and sell securities with respect to the Global Environment Fund. Applying ESG factors to the investment analysis may impact the investment decision for securities of certain issuers and therefore the Fund may forgo some market opportunities available to funds that do not use ESG factors. Securities of companies with ESG practices may shift into and out of favor depending on market and economic conditions, and the Fund’s performance may at times be better or worse than the performance of funds that do not use ESG factors.
ETFs Risk (Emerging Markets Equity Fund) – ETFs are pooled investment vehicles, such as registered investment companies and grantor trusts, whose shares are listed and traded on U.S. and non-U.S. stock exchanges or otherwise traded in the over-the-counter market. To the extent that the Fund invests in ETFs, the Fund will be subject to substantially the same risks as those associated with the direct ownership of the securities in which the ETF invests, and the value of the Fund’s investment will fluctuate in response to the performance of the ETF’s holdings. ETFs typically incur fees that are separate from those of the Fund. Accordingly, the Fund’s investments in ETFs will result in the layering of expenses such that shareholders will indirectly bear a proportionate share of the ETFs’ operating expenses, in addition to paying Fund expenses. Because the value of ETF shares depends on the demand in the market, shares may trade at a discount or premium to their NAV and the Adviser may not be able to liquidate the Fund’s holdings at the most optimal time, which could adversely affect the Fund’s performance.
Foreign Currency Risk (All Funds) – Fluctuations in exchange rates between the U.S. dollar and foreign currencies, or between various foreign currencies, may negatively affect a Fund’s performance. Adverse changes in exchange rates may erode or reverse any gains produced by foreign-currency denominated investments and may widen any losses. Currency exchange rates can be volatile and can be affected by, among other factors, the actions or inactions by U.S. or foreign governments, central banks or supranational entities, the imposition of currency controls, speculation, or general economic or political developments in the U.S. or a foreign country.
Foreign Securities/Emerging Markets Risk (All Funds) – Investments in securities of foreign companies (including direct investments as well as investments through Depositary Receipts) can be more volatile than investments in U.S. companies. Diplomatic, political, or economic developments, including nationalization or
56
| THE ADVISORS’ INNER CIRCLE FUND III | NINETY ONE FUNDS OCTOBER 31, 2022 |
appropriation, could affect investments in foreign companies. Foreign securities markets generally have less trading volume and less liquidity than U.S. markets. In addition, the value of securities denominated in foreign currencies, and of dividends from such securities, can change significantly when foreign currencies strengthen or weaken relative to the U.S. dollar. Financial statements of foreign issuers are governed by different accounting, auditing, and financial reporting standards than the financial statements of U.S. issuers and may be less transparent and uniform than in the United States. Thus, there may be less information publicly available about foreign issuers than about most U.S. issuers. Transaction costs are generally higher than those in the United States and expenses for custodial arrangements of foreign securities may be somewhat greater than typical expenses for custodial arrangements of similar U.S. securities. Some foreign governments levy withholding taxes against dividend and interest income. Although in some countries a portion of these taxes are recoverable, the non-recovered portion will reduce the income received from the securities comprising a Fund’s portfolio. These risks may be heightened with respect to emerging market countries since political turmoil and rapid changes in economic conditions are more likely to occur in these countries. Additionally, periodic U.S. Government restrictions on investments in issuers from certain foreign countries may result in a Fund having to sell such prohibited securities at inopportune times. Such prohibited securities may have less liquidity as a result of such U.S. Government designation and the market price of such prohibited securities may decline, which may cause the Fund to incur losses.
Risk of Investing in China (Emerging Markets Equity Fund, Global Environment Fund, and International Franchise Fund) – The economy of China differs, often unfavorably, from the U.S. economy in such respects as structure, general development, government involvement, wealth distribution, rate of inflation, growth rate, allocation of resources and capital reinvestment, among others. Under China’s political and economic system, the central government has historically exercised substantial control over virtually every sector of the Chinese economy through administrative regulation and/or state ownership. Since 1978, the Chinese government has been, and is expected to continue, reforming its economic policies, which has resulted in less direct central and local government control over the business and production activities of Chinese enterprises and companies. Notwithstanding the economic reforms instituted by the Chinese government and the Chinese Communist Party, actions of the Chinese central and local government authorities continue to have a substantial effect on economic conditions in China, which could affect the public and private sector companies in which a Fund invests. In the past, the Chinese government has from time to time taken actions that influence the prices at which certain goods may be sold, encourage companies to invest or concentrate in particular industries, induce mergers between companies in certain industries and induce private companies to publicly offer their securities to increase or continue the rate of economic growth, control the rate of inflation or otherwise regulate economic expansion. It may do so in the future as well. Such actions and a variety of other
57
| THE ADVISORS’ INNER CIRCLE FUND III | NINETY ONE FUNDS OCTOBER 31, 2022 |
centrally planned or determined activities by the Chinese government could have a significant adverse effect on economic conditions in China, the economic prospects for, and the market prices and liquidity of, the securities of Chinese companies and the payments of dividends and interest by Chinese companies. In addition, expropriation, including nationalization, confiscatory taxation, political, economic or social instability or other developments could adversely affect and significantly diminish the values of the Chinese companies in which a Fund invests. A Fund may invest in shares of Chinese companies traded on stock markets in China or Hong Kong. These stock markets have recently experienced high levels of volatility, which may continue in the future. The Hong Kong stock market may behave differently from the China stock markets and there may be little to no correlation between the performance of the Hong Kong stock market and the China stock markets.
In addition, periodically there may be restrictions on investments in Chinese companies. For example, on November 12, 2020, the President of the United States signed an Executive Order prohibiting U.S. persons from purchasing or investing in publicly-traded securities of companies identified by the U.S. Government as “Communist Chinese military companies” or in instruments that are derivative of, or are designed to provide investment exposure to, those companies. The universe of affected securities can change from time to time. As a result of an increase in the number of investors looking to sell such securities, or because of an inability to participate in an investment that the Adviser otherwise believes is attractive, a Fund may incur losses. Certain securities that are or become designated as prohibited securities may have less liquidity as a result of such designation and the market price of such prohibited securities may decline, potentially causing losses to a Fund. In addition, the market for securities of other Chinese-based issuers may also be negatively impacted, resulting in reduced liquidity and price declines.
RQFII Risk (Global Environment Fund) – The Fund intends to invest directly in A-Shares through the Adviser, who is licensed as a RQFII. In addition, the RQFII license of the Adviser may be revoked by the Chinese regulators if, among other things, the Adviser fails to comply with applicable Chinese regulations. If the Adviser’s RQFII license was eliminated, the Fund could be required to dispose of a portion of its A-Shares holdings. This could have a material adverse impact on the Fund’s performance and its ability to meet its investment objective.
Stock Connect Investing Risk (Emerging Markets Equity Fund, Global Environment Fund, and International Franchise Fund) – Trading through Stock Connect is subject to a number of restrictions that may affect a Fund’s investments and returns. For example, trading through Stock Connect is subject to daily quotas that limit the maximum daily net purchases on any particular day, which may restrict or preclude a Fund’s ability to invest in China A Shares through Stock Connect. In addition, investments made through Stock Connect are subject to trading, clearance and settlement procedures that are relatively untested, which could pose risks to a Fund. Moreover, China A Shares purchased through Stock Connect generally may
58
| THE ADVISORS’ INNER CIRCLE FUND III | NINETY ONE FUNDS OCTOBER 31, 2022 |
not be sold, purchased or otherwise transferred other than through Stock Connect in accordance with applicable rules. A primary feature of Stock Connect is the application of the home market’s laws and rules applicable to investors in China A Shares. Therefore, a Fund’s investments in China A Shares purchased through Stock Connect are generally subject to Chinese securities regulations and listing rules, among other restrictions. While overseas investors currently are exempt from paying capital gains or value added taxes on income and gains from investments in China A Shares purchased through Stock Connect, these tax rules could be changed, which could result in unexpected tax liabilities for a Fund. Stock Connect will only operate on days when both the China and Hong Kong markets are open for trading and when banks in both markets are open on the corresponding settlement days. There may be occasions when a Fund may be subject to the risk of price fluctuations of China A Shares during the time when Stock Connect is not trading. Stock Connect is a relatively new program. Further developments are likely and there can be no assurance as to the program’s continued existence or whether future developments regarding the program may restrict or adversely affect a Fund’s investments or returns. In addition, the application and interpretation of the laws and regulations of Hong Kong and China, and the rules, policies or guidelines published or applied by relevant regulators and exchanges in respect of Stock Connect are uncertain, and they may have a detrimental effect on a Fund’s investments and returns.
Fund purchases of China A Shares through Stock Connect involve ownership rights that are exercised differently than those involved in U.S. securities markets. When a Fund buys a Shanghai Stock Exchange-listed or Shenzhen Stock Exchange-listed stock through Stock Connect, the Fund is purchasing a security registered under the name of the Hong Kong Securities Clearing Company Limited (“HKSCC”) that acts as a nominee holder for the beneficial owner of the Shanghai Stock Exchange-listed or Shenzhen Stock Exchange-listed stock. A Fund as the beneficial owner of the Shanghai Stock Exchange-listed or Shenzhen Stock Exchange-listed stock can exercise its rights through its nominee HKSCC. However, due to the indirect nature of holding its ownership interest through a nominee holder, a Fund might encounter difficulty in exercising or timely exercising its rights as the beneficial owner when trading through HKSCC under Stock Connect, and such difficulty may expose a Fund to risk of loss.
Sustainable Investment Risk (Global Environment Fund) – The Fund follows a sustainable investment approach by investing in companies that relate to certain sustainable development themes and demonstrate adherence to ESG practices. Accordingly, the Fund may have a significant portion of its assets invested in securities of companies conducting similar business or business within the same economic sector. Additionally, due to this sustainability approach, the Fund may not be invested in certain industries or sectors. As a result, the Fund may be overweight or underweight in certain industries or sectors relative to its benchmark index, which
59
| THE ADVISORS’ INNER CIRCLE FUND III | NINETY ONE FUNDS OCTOBER 31, 2022 |
may cause the Fund’s performance to be more or less sensitive to developments affecting those sectors. In addition, since ESG investing takes into consideration factors beyond traditional financial analysis, the investment opportunities for the Fund may be limited at times. Further, the regulatory landscape for ESG investing in the United States is still developing and future rules and regulations may require the Fund to modify or alter its investment process. Similarly, government policies incentivizing companies to engage in ESG practices may fall out of favor, which could potentially limit the Fund’s investment universe. There is also a risk that the companies identified through the investment process may fail to adhere to ESG practices, which may cause the Fund to sell a security when it might otherwise be disadvantageous to do so.
9. Other:
At October 31, 2022, 81% of I Shares outstanding were held by five record shareholders and 65% of A Shares outstanding were held by three record shareholders owning 10% or greater of the aggregate total shares outstanding in the Ninety One Global Franchise Fund.
At October 31, 2022, 86% of I Shares outstanding were held by two record shareholders owning 10% or greater of the aggregate total shares outstanding in the Ninety One International Franchise Fund.
At October 31, 2022, 57% of I Shares outstanding were held by four record shareholders and 79% of A Shares outstanding were held by one record shareholder owning 10% or greater of the aggregate total shares outstanding in the Ninety One Emerging Markets Equity Fund.
At October 31, 2022, 90% of I Shares outstanding were held by three record shareholders owning 10% or greater of the aggregate total shares outstanding in the Ninety One Global Environment Fund.
These shareholders were comprised of omnibus accounts that were held on behalf of multiple underlying shareholders.
10. Indemnifications:
In the normal course of business, the Funds enter into contracts that provide general indemnifications. The Funds’ maximum exposure under these arrangements is dependent on future claims that may be made against the Funds and, therefore, cannot be established; however, based on experience, the risk of loss from such claim is considered remote.
11. Subsequent Events:
The Funds have evaluated the need for additional disclosures and/or adjustments resulting from subsequent events through the date the financial statements were
60
| THE ADVISORS’ INNER CIRCLE FUND III | NINETY ONE FUNDS OCTOBER 31, 2022 |
issued. Based on this evaluation, no additional disclosures and/or adjustments were required to the financial statements as of October 31, 2022.
61
| THE ADVISORS’ INNER CIRCLE FUND III | NINETY ONE FUNDS OCTOBER 31, 2022 |
Report of Independent Registered Public Accounting Firm
To the Board of Trustees of The Advisors’ Inner Circle Fund III and Shareholders of Ninety One Global Franchise Fund, Ninety One International Franchise Fund, Ninety One Emerging Markets Equity Fund and Ninety One Global Environment Fund
Opinion on the Financial Statements
We have audited the accompanying statements of assets and liabilities, of Ninety One Global Franchise Fund, Ninety One International Franchise Fund, Ninety One Emerging Markets Equity Fund, and Ninety One Global Environment Fund (collectively referred to as the “Funds”) (four of the series constituting The Advisors’ Inner Circle Fund III (the “Trust”)), including the schedules of investments, as of October 31, 2022, and the related statements of operations, changes in net assets and the financial highlights for each of the periods indicated in the table below and the related notes (collectively referred to as the “financial statements”). In our opinion, the financial statements present fairly, in all material respects, the financial position of the Funds (four of the series constituting The Advisors’ Inner Circle Fund III) at October 31, 2022, the results of their operations, the changes in their net assets and the financial highlights for each of the periods indicated in the table below, in conformity with U.S. generally accepted accounting principles.
The Advisors’ Inner Circle Fund III | Statements of operations | Statements of changes in net assets | Financial highlights | |||
| Ninety One Global Franchise Fund | For the year ended October 31, 2022 | For each of the two years in the period ended October 31, 2022 | For each of the four years in the period ended October 31, 2022 and the period from December 11, 2017 (commencement of operations) through October 31, 2018 | |||
| Ninety One International Franchise Fund | For the year ended October 31, 2022 | For the year ended October 31, 2022 and the period from August 31, 2021 (commencement of operations) through October 31, 2021 | For the year ended October 31, 2022 and the period from August 31, 2021 (commencement of operations) through October 31, 2021 | |||
| Ninety One Emerging Markets Equity Fund | For the year ended October 31, 2022 | For each of the two years in the period ended October 31, 2022 | For each of the three years in the period ended October 31, 2022 and the period from November 28, 2018 (commencement of operations) through October 31, 2019 | |||
| Ninety One Global Environment Fund | For the year ended October 31, 2022 | For the year ended October 31, 2022 and the period from August 31, 2021 (commencement of operations) through October 31, 2021 | For the year ended October 31, 2022 and the period from August 31, 2021 (commencement of operations) through October 31, 2021 | |||
62
| THE ADVISORS’ INNER CIRCLE FUND III | NINETY ONE FUNDS OCTOBER 31, 2022 |
Basis for Opinion
These financial statements are the responsibility of the Trust’s management. Our responsibility is to express an opinion on the Funds’ financial statements based on our audits. We are a public accounting firm registered with the Public Company Accounting Oversight Board (United States) (“PCAOB”) and are required to be independent with respect to the Trust in accordance with the U.S. federal securities laws and the applicable rules and regulations of the Securities and Exchange Commission and the PCAOB.
We conducted our audits in accordance with the standards of the PCAOB. Those standards require that we plan and perform the audit to obtain reasonable assurance about whether the financial statements are free of material misstatement, whether due to error or fraud. The Trust is not required to have, nor were we engaged to perform, an audit of the Trust’s internal control over financial reporting. As part of our audits, we are required to obtain an understanding of internal control over financial reporting, but not for the purpose of expressing an opinion on the effectiveness of the Trust’s internal control over financial reporting. Accordingly, we express no such opinion.
Our audits included performing procedures to assess the risks of material misstatement of the financial statements, whether due to error or fraud, and performing procedures that respond to those risks. Such procedures included examining, on a test basis, evidence regarding the amounts and disclosures in the financial statements. Our procedures included confirmation of securities owned as of October 31, 2022, by correspondence with the custodian and brokers; when replies were not received from brokers, we performed other auditing procedures. Our audits also included evaluating the accounting principles used and significant estimates made by management, as well as evaluating the overall presentation of the financial statements. We believe that our audits provide a reasonable basis for our opinion.

We have served as the auditor of one or more Ninety One North America, Inc. investment companies since 2017.
Philadelphia, Pennsylvania
December 23, 2022
63
| THE ADVISORS’ INNER CIRCLE FUND III | NINETY ONE FUNDS OCTOBER 31, 2022 (UNAUDITED) |
All mutual funds have operating expenses. As a shareholder of a mutual fund, your investment is affected by these ongoing costs, which include (among others) costs for Fund management, administrative services, and shareholder reports like this one. It is important for you to understand the impact of these costs on your investment returns.
Operating expenses such as these are deducted from the mutual fund’s gross income and directly reduce your final investment return. These expenses are expressed as a percentage of the mutual fund’s average net assets; this percentage is known as the mutual fund’s expense ratio.
The following examples use the expense ratio and are intended to help you understand the ongoing costs (in dollars) of investing in your Fund and to compare these costs with those of other mutual funds. The examples are based on an investment of $1,000 made at the beginning of the period shown and held for the entire period from May 1, 2022 to October 31, 2022.
The table on the next page illustrates your Fund’s costs in two ways:
| • | Actual Fund Return. This section helps you to estimate the actual expenses after fee waivers that your Fund incurred over the period. The “Expenses Paid During Period” column shows the actual dollar expense cost incurred by a$1,000 investment in the Fund, and the “Ending Account Value” number is derived from deducting that expense cost from the Fund’s gross investment return. |
You can use this information, together with the actual amount you invested in the Fund, to estimate the expenses you paid over that period. Simply divide your ending starting account value by $1,000 to arrive at a ratio (for example, an $8,600 account value divided by $1,000 = 8.6), then multiply that ratio by the number shown for your Fund under “Expenses Paid During Period.”
| • | Hypothetical 5% Return. This section helps you compare your Fund’s costs with those of other mutual funds. It assumes that the Fund had an annual 5%return before expenses during the year, but that the expense ratio (Column 3) for the period is unchanged. This example is useful in making comparisons because the Securities and Exchange Commission requires all mutual funds to make this 5% calculation. You can assess your Fund’s comparative cost by comparing the hypothetical result for your Fund in the “Expenses Paid During Period” column with those that appear in the same charts in the shareholder reports for other mutual funds. |
Note: Because the return is set at 5% for comparison purposes — NOT your Fund’s actual return — the account values shown may not apply to your specific investment.
64
| THE ADVISORS’ INNER CIRCLE FUND III | NINETY ONE FUNDS OCTOBER 31, 2022 (UNAUDITED) |
| Beginning Account Value 5/01/22 | Ending Account Value 10/31/22 | Annualized Expense Ratios | Expenses Paid During Period* | |||||||||||||
Ninety One Global Franchise Fund | ||||||||||||||||
I Shares | ||||||||||||||||
Actual Fund Return | $1,000.00 | $922.20 | 0.85 | % | $4.12 | |||||||||||
Hypothetical 5% Return | 1,000.00 | 1,020.92 | 0.85 | 4.33 | ||||||||||||
A Shares | ||||||||||||||||
Actual Fund Return | $1,000.00 | $921.20 | 1.10 | % | $5.33 | |||||||||||
Hypothetical 5% Return | 1,000.00 | 1,019.66 | 1.10 | 5.60 | ||||||||||||
Ninety One International Franchise Fund | ||||||||||||||||
I Shares | ||||||||||||||||
Actual Fund Return | $1,000.00 | $887.20 | 0.85 | % | $4.04 | |||||||||||
Hypothetical 5% Return | 1,000.00 | 1,020.92 | 0.85 | 4.33 | ||||||||||||
Ninety One Emerging Markets Equity Fund | ||||||||||||||||
I Shares | ||||||||||||||||
Actual Fund Return | $1,000.00 | $783.80 | 0.85 | % | $3.82 | |||||||||||
Hypothetical 5% Return | 1,000.00 | 1,020.92 | 0.85 | 4.33 | ||||||||||||
A Shares | ||||||||||||||||
Actual Fund Return | $1,000.00 | $782.70 | 1.09 | % | $4.90 | |||||||||||
Hypothetical 5% Return | 1,000.00 | 1,019.71 | 1.09 | 5.55 | ||||||||||||
Ninety One Global Environment Fund | ||||||||||||||||
I Shares | ||||||||||||||||
Actual Fund Return | $1,000.00 | $969.50 | 0.90 | % | $4.47 | |||||||||||
Hypothetical 5% Return | 1,000.00 | 1,020.67 | 0.90 | 4.58 | ||||||||||||
| * | Expenses are equal to the Fund’s annualized expense ratio multiplied by the average account value over the period, multiplied by 184/365 (to reflect the one-half year period shown). |
65
| THE ADVISORS’ INNER CIRCLE FUND III | NINETY ONE FUNDS OCTOBER 31, 2022 |
TRUSTEES AND OFFICERS OF THE ADVISORS’ INNER CIRCLE FUND III (Unaudited) |
Set forth below are the names, years of birth, positions with the Trust, length of term of office, and the principal occupations for the last five years of each of the persons currently serving as Trustees and Officers of the Trust. Unless otherwise noted, the business address of each Trustee is SEI Investments Company, One Freedom Valley Drive, Oaks Pennsylvania 19456. Trustees who are deemed not to be “interested persons” of the Trust are referred to as
| Name and Year of Birth | Position with Trust and Length of Time Served1 | Principal Occupations in the Past Five Years | ||
INTERESTED TRUSTEES3,4 | ||||
William M. Doran (Born: 1940) | Chairman of the Board of Trustees (since 2014) | Self-Employed Consultant since 2003. Partner at Morgan, Lewis & Bockius LLP (law firm) from 1976 to 2003. Counsel to the Trust, SEI Investments, SIMC, the Administrator and the Distributor. Secretary of SEI Investments since 1978. | ||
INDEPENDENT TRUSTEES3 | ||||
Jon C. Hunt (Born: 1951) | Trustee and Lead Independent Trustee (since 2014) | Retired since 2013. Consultant to Management, Convergent Capital Management, LLC (“CCM”) from 2012 to 2013. Managing Director and Chief Operating Officer, CCM from 1998 to 2012. | ||
Thomas P. Lemke (Born: 1954) | Trustee (since 2014) | Retired since 2013. Executive Vice President and General Counsel, Legg Mason, Inc. from 2005 to 2013. | ||
Nichelle Maynard-Elliott (Born: 1968) | Trustee (since 2021) | Independent Director since 2018. Executive Director, M&A at Praxair Inc. from 2011-2019. | ||
| 1 | Each Trustee shall hold office during the lifetime of this Trust until the election and qualification of his or her successor, or until he or she sooner dies, resigns, or is removed in accordance with the Trust’s Declaration of Trust. |
| 2 | Directorships of Companies required to report to the Securities and Exchange Commission under the Securities Exchange Act of 1934 (i.e., “public companies”) or other investment companies under the 1940 Act. |
| 3 | Trustees oversee 65 funds in The Advisors’ Inner Circle Fund III. |
| 4 | Denotes Trustees who may be deemed to be “interested” persons of the Fund as that term is defined in the 1940 Act by virtue of their affiliation with the Distributor and/or its affiliates. |
66
| THE ADVISORS’ INNER CIRCLE FUND III | NINETY ONE FUNDS OCTOBER 31, 2022 |
“Independent Trustees.” Mr. Doran is a Trustee who may be an “interested” persons of the Trust as that term is defined in the 1940 Act by virtue of their affiliation with the Trust’s Distributor. The Trust’s Statement of Additional Information (“SAI”) includes additional information about the Trustees and Officers. The SAI may be obtained without charge by calling 1-844-IAM-USA1. The following chart lists Trustees and Officers as of October 31, 2022.
Other Directorships
Held in the Past Five Years2
Current Directorships: Trustee of Gallery Trust, Delaware Wilshire Private Markets Master Fund, Delaware Wilshire Private Markets Fund, Delaware Wilshire Private Markets Tender Fund, SEI Daily Income Trust, SEI Institutional International Trust, SEI Institutional Investments Trust, SEI Institutional Managed Trust, SEI Asset Allocation Trust, SEI Tax Exempt Trust, Adviser Managed Trust, New Covenant Funds, SEI Insurance Products Trust and SEI Catholic Values Trust. Director of SEI Investments, SEI Investments (Europe), Limited, SEI Investments—Global Funds Services, Limited, SEI Investments Global, Limited, SEI Investments (Asia), Limited, SEI Global Nominee Ltd., SEI Investments – Unit Trust Management (UK) Limited and SEI Investments Co. Director of the Distributor.
Former Directorships: Trustee of Winton Series Trust to 2017. Trustee of The Advisors’ Inner Circle Fund, The Advisors’ Inner Circle Fund II, Bishop Street Funds, The KP Funds and Winton Diversified Opportunities Fund (closed-end investment company) to 2018. Trustee of Schroder Global Series Trust to 2021. Trustee of Schroder Series Trust to 2022.
Current Directorships: Trustee of City National Rochdale Funds, Gallery Trust, Delaware Wilshire Private Markets Master Fund, Delaware Wilshire Private Markets Fund and Delaware Wilshire Private Markets Tender Fund. Director of Chiron Capital Allocation Fund Ltd.
Former Directorships: Trustee of Winton Series Trust to 2017. Trustee of Winton Diversified Opportunities Fund (closed-end investment company) to 2018. Trustee of Schroder Global Series Trust to 2021. Trustee of Schroder Series Trust to 2022.
Current Directorships: Trustee of Gallery Trust, Delaware Wilshire Private Markets Master Fund, Delaware Wilshire Private Markets Fund, Delaware Wilshire Private Markets Tender Fund, J.P. Morgan Funds (171 Portfolios) and Symmetry Panoramic Trust (16 Portfolios). Director of Chiron Capital Allocation Fund Ltd.
Former Directorships: Trustee of Winton Series Trust and AXA Premier VIP Trust to 2017. Trustee of Winton Diversified Opportunities Fund (closed-end investment company) to 2018. Trustee of Schroder Global Series Trust to 2021. Trustee of Schroder Series Trust to 2022.
Current Directorships: Trustee of Gallery Trust, Delaware Wilshire Private Markets Master Fund, Delaware Wilshire Private Markets Fund, Delaware Wilshire Private Markets Tender Fund. Director of Chiron Capital Allocation Fund Ltd. Director of Element Solutions Inc., Director of Xerox Holdings Corporation, and Director of Lucid Group, Inc.
Former Directorships: Trustee of Schroder Global Series Trust to 2021. Trustee of Schroder Series Trust to 2022.
67
| THE ADVISORS’ INNER CIRCLE FUND III | NINETY ONE FUNDS OCTOBER 31, 2022 |
TRUSTEES AND OFFICERS OF THE ADVISORS’ INNER CIRCLE FUND III (Unaudited) |
Name and Year of Birth | Position with Trust and Length of Time Served1 | Principal Occupations in the Past Five Years | ||
INDEPENDENT TRUSTEES (continued)3 | ||||
Jay C. Nadel (Born: 1958) | Trustee (since 2016) | Self-Employed Consultant since 2004. Executive Vice President, Bank of New York Broker Dealer from 2002 to 2004. Partner/Managing Director, Weiss Peck & Greer/Robeco from 1986 to 2001. | ||
Randall S. Yanker (Born: 1960) | Trustee (since 2014) | Co-Founder and Senior Partner, Alternative Asset Managers, L.P. since 2004. | ||
OFFICERS | ||||
Michael Beattie (Born: 1965) | President (since 2014) | Director of Client Service, SEI Investments, since 2004. | ||
James Bernstein (Born: 1962) | Vice President (since 2017) Secretary (since 2020) | Attorney, SEI Investments, since 2017. | ||
| Prior Positions: Self-employed consultant, 2017. Associate General Counsel & Vice President, Nationwide Funds Group and Nationwide Mutual Insurance Company, from 2002 to 2016. Assistant General Counsel & Vice President, Market Street Funds and Provident Mutual Insurance Company, from 1999 to 2002. | ||||
John Bourgeois (Born: 1973) | Assistant Treasurer (since 2017) | Fund Accounting Manager, SEI Investments, since 2000. | ||
| 1 | Each Trustee shall hold office during the lifetime of this Trust until the election and qualification of his or her successor, or until he or she sooner dies, resigns, or is removed in accordance with the Trust’s Declaration of Trust. |
| 2 | Directorships of Companies required to report to the Securities and Exchange Commission under the Securities Exchange Act of 1934 (i.e., “public companies”) or other investment companies under the 1940 Act. |
| 3 | Trustees oversee 65 funds in The Advisors’ Inner Circle Fund III. |
68
| THE ADVISORS’ INNER CIRCLE FUND III | NINETY ONE FUNDS OCTOBER 31, 2022 |
Other Directorships
Held in the Past Five Years2
Current Directorships: Chairman of the Board of Trustees of City National Rochdale Funds. Trustee of Gallery Trust, Delaware Wilshire Private Markets Master Fund, Delaware Wilshire Private Markets Fund and Delaware Wilshire Private Markets Tender Fund. Director of Chiron Capital Allocation Fund Ltd.
Former Directorships: Trustee of Winton Series Trust to 2017. Director of Lapolla Industries, Inc. to 2017. Trustee of Winton Diversified Opportunities Fund (closed-end investment company) to 2018. Trustee of Schroder Global Series Trust to 2021. Trustee of Schroder Series Trust to 2022.
Current Directorships: Trustee of Gallery Trust, Delaware Wilshire Private Markets Master Fund, Delaware Wilshire Private Markets Fund and Delaware Wilshire Private Markets Tender Fund. Independent Non-Executive Director of HFA Holdings Limited. Director of Chiron Capital Allocation Fund Ltd.
Former Directorships: Trustee of Winton Series Trust to 2017. Trustee of Winton Diversified Opportunities Fund (closed-end investment company) to 2018. Trustee of Schroder Global Series Trust to 2021. Trustee of Schroder Series Trust to 2022.
None.
None.
None.
69
| THE ADVISORS’ INNER CIRCLE FUND III | NINETY ONE FUNDS OCTOBER 31, 2022 |
TRUSTEES AND OFFICERS OF THE ADVISORS’ INNER CIRCLE FUND III (Unaudited) |
| Name and Year of Birth | Position(s) with Trust and Length of Time Served | Principal Occupation in the Past Five Years | ||
OFFICERS (continued) | ||||
Eric C. Griffith (Born: 1969) | Vice President and Assistant Secretary (since 2020) | Counsel at SEI Investments since 2019. Vice President and Assistant General Counsel, JPMorgan Chase & Co., from 2012 to 2018. | ||
Matthew M. Maher (Born: 1975) | Vice President and Assistant Secretary (since 2018) | Counsel at SEI Investments since 2018. Attorney, Blank Rome LLP, from 2015 to 2018. Assistant Counsel & Vice President, Bank of New York Mellon, from 2013 to 2014. Attorney, Dilworth Paxson LLP, from 2006 to 2013. | ||
Andrew Metzger (Born: 1980) | Treasurer, Controller and Chief Financial Officer (since 2021) | Director of Fund Accounting, SEI Investments, since 2020. Senior Director, Embark, from 2019 to 2020. Senior Manager, PricewaterhouseCoopers LLP, from 2002 to 2019. | ||
Robert Morrow (Born: 1968) | Vice President (since 2017) | Account Manager, SEI Investments, since 2007. | ||
Stephen F. Panner (Born: 1970) | Chief Compliance Officer (since 2022) | Chief Compliance Officer of SEI Asset Allocation Trust, SEI Daily Income Trust, SEI Institutional Investments Trust, SEI Institutional International Trust, SEI Institutional Managed Trust, SEI Tax Exempt Trust, Adviser Managed Trust, New Covenant Funds, SEI Catholic Values Trust, SEI Exchange Traded Funds, SEI Structured Credit Fund LP, The Advisors’ Inner Circle Fund, The Advisors’ Inner Circle Fund II, The Advisors’ Inner Circle Fund III, Bishop Street Funds, Frost Family of Funds, Gallery Trust, Delaware Wilshire Private Markets Fund, Delaware Wilshire Private Markets Master Fund, Delaware Wilshire Private Markets Tender Fund and Catholic Responsible Investments Funds since September 2022. Fund Compliance Officer of SEI Investments Company from February 2011 to September 2022. Fund Accounting Director and CFO and Controller for the SEI Funds from July 2005 to February 2011. | ||
Alexander F. Smith (Born: 1977) | Vice President and Assistant Secretary (since 2020) | Counsel at SEI Investments since 2020. Associate Counsel & Manager, Vanguard, 2012 to 2020. Attorney, Stradley Ronon Stevens & Young, LLP, 2008 to 2012. | ||
Bridget E. Sudall (Born: 1980) | Privacy Officer (from 2015 – June 2022 and since November 2022) | Senior Associate and AML Officer, Morgan Stanley Alternative Investment Partners, from 2011 to 2015. Investor Services Team Lead, Morgan Stanley Alternative Investment Partners, from 2007 to 2011. | ||
Anti-Money Laundering Officer (from 2015 – June 2022 and since November 2022) | ||||
| 1 | Each Trustee shall hold office during the lifetime of this Trust until the election and qualification of his or her successor, or until he or she sooner dies, resigns, or is removed in accordance with the Trust’s Declaration of Trust. |
| 2 | Trustees oversee 65 funds in The Advisors’ Inner Circle Fund III. |
70
| THE ADVISORS’ INNER CIRCLE FUND III | NINETY ONE FUNDS OCTOBER 31, 2022 |
Other Directorships
Held in the Past Five Years
None.
None.
None.
None.
None.
None.
None.
71
| THE ADVISORS’ INNER CIRCLE FUND III | NINETY ONE FUNDS OCTOBER 31, 2022 (UNAUDITED) |
Pursuant to Section 15 of the Investment Company Act of 1940 (the “1940 Act”), the Funds’ advisory agreement (the “Agreement”) must be renewed at least annually after its initial two-year term: (i) by the vote of the Board of Trustees (the “Board” or the “Trustees”) of The Advisors’ Inner Circle Fund III (the “Trust”) or by a vote of a majority of the shareholders of the Funds; and (ii) by the vote of a majority of the Trustees who are not parties to the Agreement or “interested persons” of any party thereto, as defined in the 1940 Act (the “Independent Trustees”), cast in person at a meeting called for the purpose of voting on such renewal.
A Board meeting was held on June 22-23, 2022 to decide whether to renew the Agreement for an additional one-year term. In preparation for the meeting, the Trustees requested that the Adviser furnish information necessary to evaluate the terms of the Agreement. Prior to the meeting, the Independent Trustees of the Funds met to review and discuss the information provided and submitted a request for additional information to the Adviser, and information was provided in response to this request. The Trustees used this information, as well as other information that the Adviser and other service providers of the Funds presented or submitted to the Board at the meeting and other meetings held during the prior year, to help them decide whether to renew the Agreement for an additional year.
Specifically, the Board requested and received written materials from the Adviser and other service providers of the Funds regarding: (i) the nature, extent and quality of the Adviser’s services; (ii) the Adviser’s investment management personnel; (iii) the Adviser’s operations and financial condition; (iv) the Adviser’s brokerage practices (including any soft dollar arrangements) and investment strategies; (v) the Funds’ advisory fees paid to the Adviser and overall fees and operating expenses compared with peer groups of mutual funds; (vi) the level of the Adviser’s profitability from its relationship with the Funds, including both direct and indirect benefits accruing to the Adviser and its affiliates; (vii) the Adviser’s potential economies of scale; (viii) the Adviser’s compliance program, including a description of material compliance matters and material compliance violations; (ix) the Adviser’s policies on and compliance procedures for personal securities transactions; and (x) the Funds’ performance compared with peer groups of mutual funds and the Funds’ benchmark indices.
Representatives from the Adviser, along with other Fund service providers, presented additional information and participated in question and answer sessions at the Board meeting to help the Trustees evaluate the Adviser’s services, fees and other aspects of the Agreement. The Independent Trustees received advice from independent counsel and met in executive sessions outside the presence of Fund management and the Adviser.
72
| THE ADVISORS’ INNER CIRCLE FUND III | NINETY ONE FUNDS OCTOBER 31, 2022 (UNAUDITED)
|
At the Board meeting, the Trustees, including all of the Independent Trustees, based on their evaluation of the information provided by the Adviser and other service providers of the Funds, renewed the Agreement. In considering the renewal of the Agreement, the Board considered various factors that they determined were relevant, including: (i) the nature, extent and quality of the services provided by the Adviser; (ii) the investment performance of the Funds and the Adviser; (iii) the costs of the services provided and profits realized by the Adviser from its relationship with the Funds, including both direct and indirect benefits accruing to the Adviser and its affiliates; (iv) the extent to which economies of scale are being realized by the Adviser; and (v) whether fee levels reflect such economies of scale for the benefit of Fund investors, as discussed in further detail below.
Nature, Extent and Quality of Services Provided by the Adviser
In considering the nature, extent and quality of the services provided by the Adviser, the Board reviewed the portfolio management services provided by the Adviser to the Funds, including the quality and continuity of the Adviser’s portfolio management personnel, the resources of the Adviser, and the Adviser’s compliance history and compliance program. The Trustees reviewed the terms of the Agreement. The Trustees also reviewed the Adviser’s investment and risk management approaches for the Funds. The most recent investment adviser registration form (“Form ADV”) for the Adviser was available to the Board, as was the response of the Adviser to a detailed series of questions which included, among other things, information about the investment advisory services provided by the Adviser to the Funds.
The Trustees also considered other services provided to the Funds by the Adviser such as selecting broker-dealers for executing portfolio transactions, monitoring adherence to the Funds’ investment restrictions, and monitoring compliance with various Fund policies and procedures and with applicable securities laws and regulations. Based on the factors above, as well as those discussed below, the Board concluded, within the context of its full deliberations, that the nature, extent and quality of the services provided to the Funds by the Adviser were sufficient to support renewal of the Agreement.
Investment Performance of the Funds and the Adviser
The Board was provided with regular reports regarding the Funds’ performance over various time periods. The Trustees also reviewed reports prepared by the Funds’ administrator comparing the Funds’ performance to their benchmark indices and peer groups of mutual funds as classified by Lipper, an independent provider of investment company data, over various periods of time. Representatives from the Adviser provided information regarding and led discussions of factors impacting the performance of the Funds, outlining current market conditions and explaining their
73
| THE ADVISORS’ INNER CIRCLE FUND III | NINETY ONE FUNDS OCTOBER 31, 2022 (UNAUDITED)
|
expectations and strategies for the future. The Trustees determined that the Funds’ performance was satisfactory, or, where the Funds’ performance was materially below their benchmarks and/or peer groups, the Trustees were satisfied by the reasons for the underperformance and/or the steps taken by the Adviser in an effort to improve the performance of the Funds. Based on this information, the Board concluded, within the context of its full deliberations, that the investment results that the Adviser had been able to achieve for the Funds were sufficient to support renewal of the Agreement.
Costs of Advisory Services, Profitability and Economies of Scale
In considering the advisory fees payable by the Funds to the Adviser, the Trustees reviewed, among other things, a report of the advisory fees paid to the Adviser. The Trustees also reviewed reports prepared by the Funds’ administrator comparing the Funds’ net and gross expense ratios and advisory fees to those paid by peer groups of mutual funds as classified by Lipper. The Trustees reviewed the management fees charged by the Adviser to other clients with comparable mandates. The Trustees considered any differences in management fees and took into account the respective demands, resources and complexity associated with the Funds and other client accounts as well as the extensive regulatory, compliance and tax regimes to which the Funds are subject. The Board concluded, within the context of its full deliberations, that the advisory fees were reasonable in light of the nature and quality of the services rendered by the Adviser.
The Trustees reviewed the costs of services provided by and the profits realized by the Adviser from its relationship with the Funds, including both direct benefits and indirect benefits, such as research and brokerage services received under soft dollar arrangements, accruing to the Adviser and its affiliates. The Trustees considered how the Adviser’s profitability was affected by factors such as its organizational structure and method for allocating expenses. The Trustees concluded that the profit margins of the Adviser with respect to the management of the Funds were not unreasonable. The Board also considered the Adviser’s commitment to managing the Funds and its willingness to continue its expense limitation and fee waiver arrangement with the Funds.
The Trustees considered the Adviser’s views relating to economies of scale in connection with the Funds as Fund assets grow and the extent to which the benefits of any such economies of scale are shared with the Funds and Fund shareholders. The Board considered the existence of any economies of scale and whether those were passed along to the Funds’ shareholders through a graduated advisory fee schedule or other means, including fee waivers. The Trustees recognized that economies of scale are difficult to identify and quantify and are rarely identifiable on a fund-by-fund basis. Based on this evaluation, the Board concluded that the
74
| THE ADVISORS’ INNER CIRCLE FUND III | NINETY ONE FUNDS OCTOBER 31, 2022 (UNAUDITED)
|
advisory fee was reasonable in light of the information that was provided to the Trustees by the Adviser with respect to economies of scale.
Renewal of the Agreement
Based on the Board’s deliberations and its evaluation of the information described above and other factors and information it believed relevant in the exercise of its reasonable business judgment, the Board, including all of the Independent Trustees, with the assistance of Fund counsel and Independent Trustees’ counsel, unanimously concluded that the terms of the Agreement, including the fees payable thereunder, were fair and reasonable and agreed to renew the Agreement for another year. In its deliberations, the Board did not identify any absence of information as material to its decision, or any particular factor (or conclusion with respect thereto) or single piece of information that was all-important, controlling or determinative of its decision, but considered all of the factors together, and each Trustee may have attributed different weights to the various factors (and conclusions with respect thereto) and information.
75
| THE ADVISORS’ INNER CIRCLE FUND III | NINETY ONE FUNDS OCTOBER 31, 2022 |
NOTICE TO SHAREHOLDERS (Unaudited)
|
For shareholders that do not have an October 31, 2022, tax year end, this notice is for informational purposes only. For shareholders with an October 31, 2022, tax year end, please consult your tax advisor as to the pertinence of this notice. For the fiscal period ended October 31, 2022, the Funds are designating the following items with regard to distributions paid during the period.
| Long-Term Capital Gain Distributions | Ordinary Income Distributions | Total Distributions | Qualifying for Corporate Dividends received Deduction (1) | Qualifying Dividend Income (2) | ||||||
Ninety One Global Franchise Fund | 0.00% | 100.00% | 100.00% | 100.00% | 100.00% | |||||
Ninety One International Franchise Fund | 0.00% | 0.00% | 0.00% | 0.00% | 0.00% | |||||
Ninety One Emerging Markets Equity Fund | 73.31% | 26.69% | 100.00% | 1.14% | 73.92% | |||||
Ninety One Global Environment Fund | 0.00% | 100.00% | 100.00% | 23.76% | 43.47% | |||||
| Government Interest (3) | Interest Related Dividends (4) | Short-Term Capital Gain Dividends (5) | Qualifying Business Income (6) | Foreign Tax Credit | ||||||
Ninety One Global Franchise Fund | 0.00% | 0.00% | 0.00% | 0.00% | 0.00% | |||||
Ninety One International Franchise Fund | 0.00% | 0.00% | 0.00% | 0.00% | 100.00% (8) | |||||
Ninety One Emerging Markets Equity Fund | 0.00% | 0.00% | 100.00% | 0.00% | 5.04% (7) | |||||
Ninety One Global Environment Fund | 0.00% | 0.00% | 100.00% | 0.00% | 0.00% | |||||
| (1) | Qualifying dividends represent dividends which qualify for the corporate dividends received deduction and is reflected as a percentage of ordinary income distributions (the total of short-term capital gain and net investment income distributions). |
| (2) | The percentage in this column represents the amount of “Qualifying Dividend Income” as created by the Jobs and Growth Tax Relief Reconciliation Act of 2003 and is reflected as a percentage of ordinary income distributions (the total of short-term capital gain and net investment income distributions). It is the intention of the Fund to designate the maximum amount permitted by law. |
76
| THE ADVISORS’ INNER CIRCLE FUND III | NINETY ONE FUNDS OCTOBER 31, 2022 |
| (3) | “U.S. Government Interest” represents the amount of interest that was derived from direct U.S. Government obligations and distributed during the fiscal year. This amount is reflected as a percentage of ordinary income. Generally, interest from direct U.S. Government obligations is exempt from state income tax. However, for shareholders of the Fund who are residents of California, Connecticut and New York, the statutory threshold requirements were not satisfied to permit exemption of these amounts from state income. |
| (4) | The percentage in this column represents the amount of “Interest Related Dividends” and is reflected as a percentage of ordinary income distributions. Interest related dividends are exempted from U.S. withholding tax when paid to foreign investors. |
| (5) | The percentage in this column represents the amount of “Short-Term Capital Gain Dividends” and is reflected as a percentage of short-term capital gain distributions that is exempted from U.S. withholding tax when paid to foreign investors. |
| (6) | The percentage in this column represents the amount of ordinary income that qualified for 20% Business Income Deduction. |
| (7) | The Fund intends to pass through a foreign tax credit to shareholders. For the fiscal year ended October 31, 2022, the total amount of foreign source income was $4,062,417. The total amount of foreign tax credit to be paid is $507,409. Your allocable share of foreign tax credit will be reported on Form 1099-DIV. |
| (8) | The Fund intends to pass through a foreign tax credit to shareholders. For the fiscal year ended October 31, 2022, the total amount of foreign source income was $9,186. The total amount of foreign tax credit to be paid is $1,449. Your allocable share of foreign tax credit will be reported on Form 1099-DIV. |
The information reported herein may differ from the information and distributions taxable to the shareholders for the calendar year ending December 31, 2022. Complete information will be computed and reported in conjunction with your 2022 Form 1099-DIV.
77
Ninety One Funds
P.O. Box 219009
Kansas City, MO 64121-9009
1-844-IAM-USA1
Investment Adviser:
Ninety One North America, Inc.
65 E 55th Street, 30th floor
New York, NY 10022
Administrator:
SEI Investments Global Funds Services
One Freedom Valley Drive
Oaks, PA 19456
Distributor:
SEI Investments Distribution Co.
One Freedom Valley Drive
Oaks, PA 19456
Legal Counsel:
Morgan, Lewis & Bockius LLP
1701 Market Street
Philadelphia, PA 19103
This information must be preceded or accompanied by a current
prospectus for the Fund described.
 | INV-AR-001-0500 |
Item 2. Code of Ethics.
The Registrant (also referred to as the “Trust”) has adopted a code of ethics that applies to the Registrant’s principal executive officer, principal financial officer, controller or principal accounting officer, and any person who performs a similar function. There have been no amendments to or waivers granted to this code of ethics during the period covered by this report.
Item 3. Audit Committee Financial Expert.
(a)(1) The Registrant’s board of trustees has determined that the Registrant has at least one audit committee financial expert serving on the audit committee.
(a)(2) The Registrant’s audit committee financial experts are Thomas P. Lemke and Jay Nadel, and each of Mr. Lemke and Mr. Nadel is “independent” as that term is defined in Form N-CSR Item 3 (a)(2).
Item 4. Principal Accountant Fees and Services.
Fees billed by PricewaterhouseCoopers LLP (“PwC”) relate to The Advisors’ Inner Circle Fund III (the “Trust”).
PwC billed the Trust aggregate fees for services rendered to the Trust for the last two fiscal years as follows:
| 2022 | 2021 | |||||||||||||||||||||
| All fees and services to the Trust that were pre-approved | All fees and services to service affiliates that were pre-approved | All other fees and services to service affiliates that did not require pre-approval | All fees and services to the Trust that were pre-approved | All fees and services to service affiliates that were pre-approved | All other fees and services to service affiliates that did not require pre-approval | |||||||||||||||||
(a) | Audit Fees(1) | $ | 682,615 | None | None | $ | 730,515 | None | $ | 11,990 | ||||||||||||
(b) | Audit-Related Fees | None | None | None | $ | 4,000 | None | None | ||||||||||||||
(c) | Tax Fees | $ | 88,500 | (4) | None | $ | 126,709 | (2) | None | None | $ | 90,000 | (2) | |||||||||
(d) | All Other Fees | None | None | $ | 5,301 | None | None | $ | 1,473 | |||||||||||||
Fees billed by Ernst & Young LLP (“E&Y”) relate to the Trust
E&Y billed the Trust aggregate fees for services rendered to the Trust for the last two fiscal years as follows:
| 2022 | 2021 | |||||||||||||||||
| All fees and services to the Trust that were pre-approved | All fees and services to service affiliates that were pre-approved | All other fees and services to service affiliates that did not require pre-approval | All fees and services to the Trust that were pre-approved | All fees and services to service affiliates that were pre-approved | All other fees and services to service affiliates that did not require pre-approval | |||||||||||||
(a) | Audit Fees(1) | $131,900 | None | None | $128,050 | None | None | |||||||||||
(b) | Audit-Related Fees | None | None | None | None | None | None | |||||||||||
(c) | Tax Fees | None | None | None | None | None | None | |||||||||||
(d) | All Other Fees | None | None | None | None | None | None | |||||||||||
Fees billed by Deloitte & Touche LLP (“D&T”) relate to the Trust
D&T billed the Trust aggregate fees for services rendered to the Trust for the last two fiscal years as follows
| 2022 | 2021 | |||||||||||||||||
| All fees and services to the Trust that were pre-approved | All fees and services to service affiliates that were pre-approved | All other fees and services to service affiliates that did not require pre-approval | All fees and services to the Trust that were pre-approved | All fees and services to service affiliates that were pre-approved | All other fees and services to service affiliates that did not require pre-approval | |||||||||||||
(a) | Audit Fees(1) | $30,050 | None | None | $26,800 | None | None | |||||||||||
(b) | Audit-Related Fees | None | None | None | None | None | None | |||||||||||
(c) | Tax Fees | None | None | None | None | None | None | |||||||||||
(d) | All Other Fees | None | None | None | None | None | None | |||||||||||
Fees billed by KPMG (“KPMG”) relate to the Trust
KPMG billed the Trust aggregate fees for services rendered to the Trust for the last two fiscal years as follows
| 2022 | 2021 | |||||||||||||||||||||
| All fees and services to the Trust that were pre-approved | All fees and services to service affiliates that were pre-approved | All other fees and services to service affiliates that did not require pre-approval | All fees and services to the Trust that were pre-approved | All fees and services to service affiliates that were pre-approved | All other fees and services to service affiliates that did not require pre-approval | |||||||||||||||||
(a) | Audit Fees(1) | $ | 322,500 | None | None | $ | 25,000 | None | None | |||||||||||||
(b) | Audit-Related Fees | None | None | None | None | None | None | |||||||||||||||
(c) | Tax Fees | None | None | None | None | None | None | |||||||||||||||
(d) | All Other Fees | None | None | $ | 218,015 | (3) | None | None | $ | 206,957 | (3) | |||||||||||
Notes:
| (1) | Audit fees include amounts related to the audit of the Trust’s annual financial statements and services normally provided by the accountant in connection with statutory and regulatory filings. |
| (2) | Tax return preparation fees for affiliates of the Funds. |
| (3) | Non-audit fees consist of SSAE No. 18 report over investment management activities and non-statutory audit reports of Legal & General Investment Management America, Inc. |
| (4) | Fees in connection with international withholding tax analysis. |
(e)(1) The Trust’s Audit Committee has adopted and the Board of Trustees has ratified an Audit and Non-Audit Services Pre-Approval Policy (the “Policy”), which sets forth the procedures and the conditions pursuant to which services proposed to be performed by the independent auditor of the Funds may be pre-approved.
The Policy provides that all requests or applications for proposed services to be provided by the independent auditor must be submitted to the Registrant’s Chief Financial Officer (“CFO”) and must include a detailed description of the services proposed to be rendered. The CFO will determine whether such services:
| (1) | require specific pre-approval; |
| (2) | are included within the list of services that have received the general pre-approval of the Audit Committee pursuant to the Policy; or |
| (3) | have been previously pre-approved in connection with the independent auditor’s annual engagement letter for the applicable year or otherwise. In any instance where services require pre-approval, the Audit Committee will consider whether such services are consistent with SEC’s rules and whether the provision of such services would impair the auditor’s independence. |
Requests or applications to provide services that require specific pre-approval by the Audit Committee will be submitted to the Audit Committee by the CFO. The Audit Committee will be informed by the CFO on a quarterly basis of all services rendered by the independent auditor. The Audit Committee has delegated specific pre-approval authority to either the Audit Committee Chair or financial expert, provided that the estimated fee for any such proposed pre-approved service does not exceed $100,000 and any pre-approval decisions are reported to the Audit Committee at its next regularly-scheduled meeting.
Services that have received the general pre-approval of the Audit Committee are identified and described in the Policy. In addition, the Policy sets forth a maximum fee per engagement with respect to each identified service that has received general pre-approval.
All services to be provided by the independent auditor shall be provided pursuant to a signed written engagement letter with the Registrant, the investment adviser, or applicable control affiliate (except that matters as to which an engagement letter would be impractical because of timing issues or because the matter is small may not be the subject of an engagement letter) that sets forth both the services to be provided by the independent auditor and the total fees to be paid to the independent auditor for those services.
In addition, the Audit Committee has determined to take additional measures on an annual basis to meet the Audit Committee’s responsibility to oversee the work of the independent auditor and to assure the auditor’s independence from the Registrant, such as (a) reviewing a formal written statement from the independent auditor delineating all relationships between the independent auditor and the Registrant, and (b) discussing with the independent auditor the independent auditor’s methods and procedures for ensuring independence.
(e)(2) Percentage of fees billed applicable to non-audit services pursuant to waiver of pre-approval requirement were as follows (PwC):
2022 | 2021 | |||
Audit-Related Fees | None | None | ||
Tax Fees | None | None | ||
All Other Fees | None | None |
(e)(2) Percentage of fees billed applicable to non-audit services pursuant to waiver of pre-approval requirement were as follows (E&Y):
2022 | 2021 | |||
Audit-Related Fees | None | None | ||
Tax Fees | None | None | ||
All Other Fees | None | None |
(e)(2) Percentage of fees billed applicable to non-audit services pursuant to waiver of pre-approval requirement were as follows (D&T):
2022 | 2021 | |||
Audit-Related Fees | None | None | ||
Tax Fees | None | None | ||
All Other Fees | None | None |
(e)(2) Percentage of fees billed applicable to non-audit services pursuant to waiver of pre-approval requirement were as follows (KPMG):
2022 | 2021 | |||
Audit-Related Fees | None | None | ||
Tax Fees | None | None | ||
All Other Fees | None | None |
(f) Not applicable.
(g) The aggregate non-audit fees and services billed by PwC for services rendered to the Registrant, and rendered to the Registrant’s investment adviser (not including any sub-adviser whose role is primarily portfolio management and is subcontracted with or overseen by another investment adviser), and any entity controlling, controlled by, or under common control with the adviser that provides ongoing services to the Registrant for the last two fiscal-years-ended October 31st were $132,010 and $91,473 for 2022 and 2021, respectively.
(g) The aggregate non-audit fees and services billed by E&Y for services rendered to the Registrant, and rendered to the Registrant’s investment adviser (not including any sub-adviser whose role is primarily portfolio management and is subcontracted with or overseen by another investment adviser), and any entity controlling, controlled by, or under common control with the adviser that provides ongoing services to the Registrant for the last two fiscal-years-ended October 31st were $0 and $0 for 2022 and 2021, respectively.
(g) The aggregate non-audit fees and services billed by D&T for services rendered to the Registrant, and rendered to the Registrant’s investment adviser (not including any sub-adviser whose role is primarily portfolio management and is subcontracted with or overseen by another investment adviser), and any entity controlling, controlled by, or under common control with the adviser that provides ongoing services to the Registrant for the last two fiscal-years-ended October 31st were $0 and $0 for 2022 and 2021, respectively.
(g) The aggregate non-audit fees and services billed by KPMG for services rendered to the Registrant, and rendered to the Registrant’s investment adviser (not including any sub-adviser whose role is primarily portfolio management and is subcontracted with or overseen by another investment adviser), and any entity controlling, controlled by, or under common control with the adviser that provides ongoing services to the Registrant for the last two fiscal-years-ended October 31st were $218,015 and $206,957 for 2022 and 2021, respectively.
(h) During the past fiscal year, all non-audit services provided by the Registrant’s principal accountant to either the Registrant’s investment adviser or to any entity controlling, controlled by,
or under common control with the Registrant’s investment adviser that provides ongoing services to the Registrant were pre-approved by the Audit Committee of Registrant’s Board of Trustees. Included in the Audit Committee’s pre-approval of these non-audit service were the review and consideration as to whether the provision of these non-audit services is compatible with maintaining the principal accountant’s independence.
(i) Not applicable. The Registrant has not retained, for the preparation of the audit report on the financial statements included in the Form N-CSR, a registered public accounting firm that has a branch or office that is located in a foreign jurisdiction and that the Public Company Accounting Oversight Board (the “PCAOB”) has determined that the PCAOB is unable to inspect or investigate completely because of a position taken by an authority in the foreign jurisdiction.
(j) Not applicable. The Registrant is not a “foreign issuer,” as defined in 17 CFR 240.3b-4.
Item 5. Audit Committee of Listed Registrants.
Not applicable to open-end management investment companies.
Item 6. Schedule of Investments.
Schedule of Investments is included as part of the Report to Shareholders filed under Item 1 of this form.
Item 7. Disclosure of Proxy Voting Policies and Procedures for Closed-End Management Investment Companies.
Not applicable to open-end management investment companies.
Item 8. Portfolio Managers of Closed-End Management Investment Companies.
Not applicable to open-end management investment companies.
Item 9. Purchases of Equity Securities by Closed-End Management Company and Affiliated Purchasers.
Not applicable to open-end management investment companies.
Item 10. Submission of Matters to a Vote of Security Holders.
There have been no changes to the procedures by which shareholders may recommend nominees to the Registrant’s Board of Trustees during the period covered by this report.
Item 11. Controls and Procedures.
(a) The Registrant’s principal executive and principal financial officers, or persons performing similar functions, have concluded that the Registrant’s disclosure controls and procedures, as defined in Rule 30a-3(c) under the Act (17 CFR § 270.30a-3(c)), as of a date within 90 days of the filing date of the report, are effective based on the evaluation of these controls and procedures required by Rule 30a-3(b) under the Act (17 CFR § 270.30a-3(b)) and Rule 13a-15(b) or Rule 15d-15(b) under the Exchange Act, as amended (17 CFR § 240.13a-15(b) or § 240.15d-15(b)).
(b) There has been no change in the Registrant’s internal control over financial reporting (as defined in Rule 30a-3(d) under the Act (17 CFR § 270.3a-3(d)) that occurred during the period covered by this report that has materially affected, or is reasonably likely to materially affect, the Registrant’s internal control over financial reporting.
Item 12. Disclosure of Securities Lending Activities for Closed-End Management Investment Companies.
Not applicable to open-end management investment companies.
Items 13. Exhibits.
SIGNATURES
Pursuant to the requirements of the Securities Exchange Act of 1934 and the Investment Company Act of 1940, the Registrant has duly caused this report to be signed on its behalf by the undersigned, thereunto duly authorized.
| (Registrant) | The Advisors’ Inner Circle Fund III | |||||
| By (Signature and Title) | ||||||
/s/ Michael Beattie | ||||||
| Michael Beattie, President | ||||||
| Date: January 6, 2023 | ||||||
Pursuant to the requirements of the Securities Exchange Act of 1934 and the Investment Company Act of 1940, this report has been signed below by the following persons on behalf of the Registrant and in the capacities and on the dates indicated.
| By (Signature and Title) | /s/ Michael Beattie | |||||
| Michael Beattie, President | ||||||
| Date: January 6, 2023 | ||||||
| By (Signature and Title) | /s/ Andrew Metzger | |||||
| Andrew Metzger, | ||||||
| Treasurer, Controller, and CFO | ||||||
| Date: January 6, 2023 | ||||||