UNITED STATES
SECURITIES AND EXCHANGE COMMISSION
Washington, D.C. 20549
FORM N-CSR
CERTIFIED SHAREHOLDER REPORT OF REGISTERED MANAGEMENT
INVESTMENT COMPANIES
Investment Company Act File Number 811-22920
The Advisors’ Inner Circle Fund III
(Exact name of registrant as specified in charter)
SEI Investments
One Freedom Valley Drive
Oaks, PA 19456
(Address of principal executive offices) (Zip code)
SEI Investments
One Freedom Valley Drive
Oaks, PA 19456
(Name and address of agent for service)
Registrant’s telephone number, including area code: (877) 446-3863
Date of fiscal year end: October 31, 2022
Date of reporting period: October 31, 2022
| Item 1. | Reports to Stockholders. |
A copy of the report transmitted to stockholders pursuant to Rule 30e-1 under the Investment Company Act of 1940, as amended (the “Act”) (17 CFR § 270.30e-1), is attached hereto.
The Advisors’ Inner Circle Fund III

PineBridge Dynamic Asset Allocation Fund
| ANNUAL REPORT | OCTOBER 31, 2022 |
Investment Adviser:
PineBridge Investments LLC |
THE ADVISORS’ INNER CIRCLE FUND III | PINEBRIDGE DYNAMIC | |
| ASSET ALLOCATION FUND | ||
| OCTOBER 31, 2022 |
| 1 | ||||
| 8 | ||||
| 28 | ||||
| 29 | ||||
| 31 | ||||
| 32 | ||||
| 34 | ||||
| 57 | ||||
| 59 | ||||
Trustees and Officers of the Advisors’ Inner Circle Fund III | 62 | |||
| 70 | ||||
| 74 | ||||
The Fund files its complete schedule of investments with the Securities and Exchange Commission (“SEC”) for the first and third quarters of each fiscal year as an exhibit to its report on Form N-PORT (Form N-Q for filings prior to March 31, 2020). The Fund’s Forms N-Q and N-PORT are available on the SEC’s website at http://www.sec.gov, and may be reviewed and copied at the SEC’s Public Reference Room in Washington, DC. Information on the operation of the Public Reference Room may be obtained by calling 1-800-SEC-0330.
A description of the policies and procedures that the Fund uses to determine how to vote proxies relating to Fund securities, as well as information relating to how a Fund voted proxies relating to fund securities during the most recent 12-month period ended June 30, is available (i) without charge, upon request, by calling 1-877-225-4164; and (ii) on the SEC’s website at http://www.sec.gov.
THE ADVISORS’ INNER CIRCLE FUND III | PINEBRIDGE DYNAMIC | |
| ASSET ALLOCATION FUND | ||
| OCTOBER 31, 2022 (UNAUDITED) | ||
We are pleased to offer you the 2022 report for the PineBridge Dynamic Asset Allocation Fund (the “Fund”) for the one-year period ending October 31, 2022. Enclosed we provide a discussion as to how the Fund was managed during the period and our market outlook going forward.
As of October 2022, on a rolling 1 year basis, the Fund had a gross return of -22.17%, underperforming return objective of the Consumer Price Index +5% (CPI+5%). We note that the Fund seeks a total return objective of CPI+5% over rolling five-year periods, while dynamically managing risk to the 60% MSCI ACWI/40% Bloomberg Barclays Global Treasury risk budget over full market cycles. As a long-only total return focused strategy, this has been a particularly challenging year with very few asset classes generating positive return. Global equity¹, global treasury² and global credit³ for instance each experienced sharp declines over the 1-year period in excess of -19%.
Our work on market regimes and correlations, published in 2016, identified periods where correlations between assets shift in conjunction with various rate and inflationary regimes. It is clear we have been moving towards a reflationary regime since mid-2020. Correlations between stocks and bonds went from negative to positive in Q2 2020 and have continued to rise from there – remaining elevated throughout 2022. In mid-2021, however, this move towards reflation shifted temporarily into an overheating regime. We were highlighting these risks in our strategy notes at that time, noting the risk that stickier inflation on the back of a more solid demand backdrop coupled with a classic supply shock could morph into a wage-price spiral. The consequence would be an accelerated liquidity withdrawal on the back of inflationary pressures over the intermediate term given that the Fed was well behind the curve. As such we began to take down our exposure to risk assets, moving below the neutral level of risk in September 2021, along with having very little fixed income duration in our portfolio coming into the new year. The Fund entered the period at a below neutral risk level relative to the Fund’s risk budget as indicated by the Team’s Risk Dial Score (“RDS”) of 3.15 as persistent inflation, stressed global supply chain and policy shifts in China created a below average environment for risk-taking.
Markets were volatile in November 2021 as news emerged that the COVID-19 variant, Omicron, could be more transmissible and potentially evade vaccines. Markets then quickly rebounded in December 2021 as investor sentiment improved as concerns over the severity of Omicron eased. Despite being correct in our view on duration and equity exposure, performance was disappointing in the first quarter of 2022. To start the year the market experienced historically high outflows and crowding into and out
¹Based on MSCI ACWI NTR Index (USD Unhedged) ²Based on Bloomberg Global Treasury TR Index (USD Unhedged) ³Based on Bloomberg Global Agg Credit TR Index (USD Unhedged)
1
THE ADVISORS’ INNER CIRCLE FUND III | PINEBRIDGE DYNAMIC | |
| ASSET ALLOCATION FUND | ||
| OCTOBER 31, 2022 (UNAUDITED) | ||
of certain pockets (such as commodity stocks) of the equity market coupled with a violent value/growth style reversal. This environment proved challenging for asset class styles and security selection approaches that have been top performers for us over previous quarters. For context, MSCI ACWI Value outperformed MSCI ACWI Growth by more than 9% in the Q1 2022 quarter, while it had underperformed by over 11% annualized the five years prior. By no means should you think of the PineBridge Dynamic Asset Allocation Fund as a strategy that perpetually leans growth or value. Coming out of the COVID crisis the Fund owned more cyclical names whereas in contrast as we de-risked throughout the end of 2021 we did so by trimming the cyclical names, leaving our exposures that tilted growth on the notion that their 9–18-month fundamentals would hold up better as growth decelerated throughout 2022.
While headlines will point to a broad value/growth rotation during Q1 2022, what transpired was a much narrower segment within value that contributed to the overall divergence between styles. Commodity related stocks were boosted by rising energy prices on the back of the Russia/Ukraine conflict. In Q1 2022 the MSCI ACWI Energy Index outperformed the broad MSCI ACWI Index by 27%. During the early part of the COVID recovery we bought commodities as they were well below replacement cost and very attractive on our CML with improving prospects. Yet those features no longer existed towards the end of 2021 and we had pruned them. Our style selection within equity, which was the biggest drag on performance in first quarter, suffered as we had minimal exposure to commodity related/energy stocks and a tilt towards growth. While our longer duration equity allocations like US Cyclicals (MSCI definition that excludes defensive leaving the rest of the market labeled US Cyclical even though this index is dominated by technology and acts growthy) and Productivity Basket were top contributors to performance in 2021, they were the largest detractors on returns early on in 2022. We also attempted to hedge the interest rate sensitivity of the remaining growth stocks by stepping up US Financials which usually do very well into a rising rate environment. This time, JPMorgan and Goldman boosted their compensation ratio guidance very significantly when reporting Q4 2021 results. Financials fell quite significantly on the notion of a comp war, which never materialized. Instead, these two intentionally gapped their compensation to distance themselves from peers. Nonetheless the whole group went down in first quarter even as interest rates spiked.
Over the next two quarters of 2022 the Fund’s performance was strong in the context of how broader equity and fixed income markets have done. For context the strategy outperformed global equity1, global treasury2 and global credit3 individually in both Q2 and Q3. The significant changes we made in the Fund over the course of Q1 which helped protect the portfolio from a similar magnitude of drawdown experienced by major liquid asset indices. More specifically we reduced the Fund’s exposure to economically sensitive asset classes like US Financials and European Small Cap Equity as well as longer duration equities such as the Productivity Basket and US Cyclicals (MSCI definition), as a squeeze on fundamentals and capitalization rates in
2
THE ADVISORS’ INNER CIRCLE FUND III | PINEBRIDGE DYNAMIC | |
| ASSET ALLOCATION FUND | ||
| OCTOBER 31, 2022 (UNAUDITED) | ||
the regime ahead was the base case. Within equities we favored asset classes that are more prepared to handle the environment ahead, which we viewed as increasingly operationally challenging with cost pressures mounting. US Quality companies, for instance, were particularly attractive as they can pass through these cost pressures to their prices.
We also prioritized alternatives with low market beta as our expectation was the rise in correlations between risk assets and traditional capital conservation assets would remain elevated throughout the intermediate-term, creating a challenging environment for strong risk-adjusted returns in traditional stocks/bonds. EU carbon credits was a particularly attractive asset class that we’ve identified as an alternative to traditional growth assets. The asset class benefitted from a re-evaluation of energy transition plans as more countries moved up renewable goals in response to supply chain disruptions and geopolitical concerns. In the efforts to pull forward the energy transition plans, countries use more carbon to achieve their goals in the near term. A restructuring of Europe’s reliance on Russian energy should has been a positive driver of capital appreciation of these credits. With these dynamics at play over the 2022, the EU carbon credits allocation has been a top contributor to performance of the Fund performance on a YTD basis.
As recession risks rise and global growth slows, we adjusted to a cautious, more defensive RDS of 3.75 in mid-September 2022 and have maintained that risk level through the end of October 2022. The mid-month RDS change was influenced by the August core and headline CPI data coming in higher than expected. With service inflation not falling as quickly as the market was pricing in and wages on the rise, the Fed will continue to be focused squarely on services inflation. The Fed intends to hike and then hold rates at higher levels than today even if households, businesses, and investors feel the pain. In addition, the Fed is still focused on quantitative tightening which we believe will be more impactful on financial assets. We have been expecting core inflation to remain high thanks to high services inflation, but headline inflation is expected to gradually fall.
It’s our view that despite some temporary reprieves, a global recession will still unfold. While the lagged effect of aggressive central bank tightening leaves most anticipating a softish recession in the second half of 2023, we can’t rule out the possibility that the inflation-spurred spike in corporate profits (which led to tight labor markets, among other factors) unwinds sooner, pulling forward job cuts and the recession. Even during the benign disinflationary period of the last 40 years, when the Fed was your friend and lunged to the rescue, risk assets did not succeed in rallying upon the first rate cut and needed growth to bottom. While outright goods deflation (which should be thought of as transitory) will soon pull-down core inflation, expect the Fed to look through this to the threat of rising service inflation, given problematically tight labor markets. Even after policy rates reach their terminal level, tightening is planned to continue through ongoing QT (quantitative tightening). This unless falling goods
3
THE ADVISORS’ INNER CIRCLE FUND III | PINEBRIDGE DYNAMIC | |
| ASSET ALLOCATION FUND | ||
| OCTOBER 31, 2022 (UNAUDITED) | ||
prices, slowing demand, and sticky labor costs hurt profits so much that employment takes quite a hit, long before the Fed belatedly responds. In Western markets, we welcome falling inflation, yet associate it with falling profits, and await a better entry point for risk assets.
We continue to position the portfolio defensively and opportunistically while taking profits on winners that have appreciated above price target and adding asset classes that demonstrate strong forward-looking fundamentals at attractive valuations. We added longer duration US Treasuries (blend of 20YR & 30YR) in early Q3 2022 as the sharp rise in yields had created an attractive risk/reward trade-off while finally offering downside protection in the case of a global recession. Within equites, China equities sold off hard after the 20th Party Congress, and this after substantially underperforming for the prior five years. While they have recently recovered a bit, a meaningful recovery in fundamentals is likely to begin in the spring of 2023, which is not reflected in current prices. Liquidity in this segment may also slowly ease, in contrast to the tightening elsewhere. We believe the stocks are no longer expensive and are likely to benefit from a cyclical period of strong fundamental improvement, making their risk-reward somewhat attractive in a world where this can be said for fewer and fewer types of equities.
We acknowledge the recent Fund performance has been disappointing. Our Global Dynamic Asset Allocation strategy, which dates back to 2005, has experienced periods of comparable market volatility and similar magnitudes of drawdown in the past. Coming out of these periods the performance has historically recovered quickly. With most of the strategy’s value historically being derived from asset allocation, we are confident in our ability to position the Fund to best take advantage of the dislocations, across the wide array of asset classes, that lie ahead.
Warm Regards,
Michael Kelly
* Productivity Basket is constituted from a blended allocation to stocks of companies that provide productivity-enhancing technologies towards growing capital expenditure intentions globally.
This material represents the manager’s assessment of the portfolio and market environment at a specific point in time and should not be relied upon by the reader as research or investment advice. Investing involves risk including loss of principal. The information provided herein represents the opinion of the manager and is not intended to be a forecast of future events, a guarantee of future results or investment advice.
You cannot invest directly in an index.
4
THE ADVISORS’ INNER CIRCLE FUND III | PINEBRIDGE DYNAMIC | |
| ASSET ALLOCATION FUND | ||
| OCTOBER 31, 2022 (UNAUDITED) | ||
Definition of Comparative Index And Other Investment Terms
Financial Times Stock Exchange (FTSE) World Government Bond Index (WGBI) is a market capitalization weighted index that is designed to measure the performance of fixed-rate, local currency, investment grade sovereign bonds. The WGBI comprises sovereign debt from over 20 countries.
Morgan Stanley Capital International (MSCI) All Country World Index (ACWI) includes large, mid-, small-, and micro-cap segments for all developed markets countries in the index together with large-, mid-, and small-cap segments for the emerging markets countries. The Bloomberg Global Treasury Total Return Index tracks fixed-rate local currency government debt of investment grade countries, including both developed and emerging markets you cannot invest directly in an index.
Bloomberg Global Treasury Total Return Index includes investment-grade, local-currency denominated sovereign debt. All issues in the index are also part of the Global Aggregate Index and must be fixed-rate, non-convertible debt, and have at least a year-to maturity.
5
THE ADVISORS’ INNER CIRCLE FUND III | PINEBRIDGE DYNAMIC | |
| ASSET ALLOCATION FUND | ||
| OCTOBER 31, 2022 (UNAUDITED) | ||
Comparison of Change in the Value of a $1,000,000 Investment in the PineBridge Dynamic Asset Allocation Fund, Institutional Shares, versus the U.S. Consumer Price Index +5%, and a blended benchmark of 60% MSCI ACWI and 40% Bloomberg Global Treasury Total Return Index Hybrid.
TOTAL RETURN FOR THE PERIOD ENDED OCTOBER 31, 2022 | ||||||||
| 1 Year | 3 Year Return | 5 Years | Cumulative Inception to Date* | |||||
Institutional shares | -22.75% | -0.31% | 0.18% | 2.72% | ||||
Investor Servicing shares** | -22.83% | -0.41% | 0.06% | 2.64% | ||||
U.S. Consumer Price Index +5% | 11.57% | 9.32% | 8.52% | 8.14% | ||||
60% MSCI ACWI/ 40% Bloomberg Global Treasury Total Return Index Hybrid | -20.69% | 0.11% | 2.14% | 4.58% | ||||
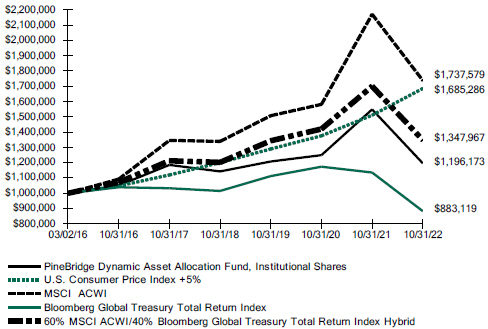
* The PineBridge Dynamic Asset Allocation Fund, Institutional Shares and Investor Servicing Shares, commenced operations on March 2, 2016.
**The graph is based on only Institutional Shares; performance for Investor Shares would be different due to differences in fee structures.
The performance data quoted herein represents past performance and the return and value of an investment in the Fund will fluctuate so that, when redeemed, may be worth less than its original cost.
The Fund’s performance assumes the reinvestment of dividends and capital gains. Index returns assume reinvestment of dividends and, unlike a portfolio’s returns, do not reflect any fees or expenses. If such fees and expenses were included in the index returns, the performance would have been lower. Please note that
6
THE ADVISORS’ INNER CIRCLE FUND III | PINEBRIDGE DYNAMIC | |
| ASSET ALLOCATION FUND | ||
| OCTOBER 31, 2022 (UNAUDITED) | ||
one cannot invest directly in an unmanaged index.
There are no assurances that the Fund will meet its stated objectives. The Fund’s holdings and allocations are subject to change because it is actively managed and should not be considered recommendations to buy individual securities.
Returns shown do not reflect the deduction of taxes that a shareholder would pay on Fund distributions or the redemption of Fund shares.
See definition of comparative index on page 5.
7
THE ADVISORS’ INNER CIRCLE FUND III | PINEBRIDGE DYNAMIC | |
| ASSET ALLOCATION FUND | ||
| OCTOBER 31, 2022 |
SECTOR WEIGHTINGS † (Unaudited)
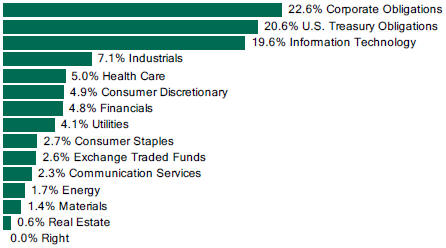
†Percentages are based on total investments. Total investments do not include derivatives such as options, futures contracts, forward contracts, and swap contracts, if applicable.
| Shares | Value | |||||||
Australia — 0.0% | ||||||||
Xero * | 1,565 | $ | 78,152 | |||||
|
| |||||||
Austria — 0.1% | ||||||||
OMV | 1,602 | 73,839 | ||||||
Verbund | 5,878 | 460,358 | ||||||
|
| |||||||
| 534,197 | ||||||||
|
| |||||||
Brazil — 0.4% | ||||||||
Banco do Brasil | 3,800 | 27,271 | ||||||
Itau Unibanco Holding ADR | 92,722 | 539,642 | ||||||
JBS | 7,200 | 34,805 | ||||||
Localiza Rent a Car | 24,900 | 339,552 | ||||||
Lojas Renner | 24,550 | 146,906 | ||||||
MercadoLibre * | 246 | 221,798 | ||||||
Raia Drogasil | 23,800 | 122,006 | ||||||
Suzano | 1,500 | 15,463 | ||||||
|
| |||||||
| 1,447,443 | ||||||||
|
| |||||||
Canada — 0.2% | ||||||||
Algonquin Power & Utilities | 15,654 | 173,276 | ||||||
Element Fleet Management | 4,948 | 65,920 | ||||||
The accompanying notes are an integral part of the financial statements.
8
THE ADVISORS’ INNER CIRCLE FUND III | PINEBRIDGE DYNAMIC | |
| ASSET ALLOCATION FUND | ||
| OCTOBER 31, 2022 |
COMMON STOCK — continued
| Shares | Value | |||||||
Canada — continued | ||||||||
H&R Real Estate Investment Trust | 1,633 | $ | 13,437 | |||||
MEG Energy * | 1,106 | 16,537 | ||||||
Northland Power | 6,652 | 193,552 | ||||||
Shopify, Cl A * | 6,500 | 222,495 | ||||||
Shopify, Cl A * | 200 | 6,857 | ||||||
|
| |||||||
| 692,074 | ||||||||
|
| |||||||
China — 0.4% | ||||||||
Alibaba Group Holding ADR * | 7,322 | 465,533 | ||||||
Baidu ADR * | 2,941 | 225,192 | ||||||
Bilibili ADR * | 498 | 4,442 | ||||||
Pinduoduo ADR * | 14,206 | 778,915 | ||||||
|
| |||||||
| 1,474,082 | ||||||||
|
| |||||||
Colombia — 0.0% | ||||||||
Bancolombia | 4,578 | 32,721 | ||||||
|
| |||||||
Denmark — 0.2% | ||||||||
AP Moller - Maersk, Cl A | 17 | 34,026 | ||||||
Orsted | 3,915 | 322,894 | ||||||
Vestas Wind Systems | 29,478 | 580,616 | ||||||
|
| |||||||
| 937,536 | ||||||||
|
| |||||||
Finland — 0.0% | ||||||||
Fortum | 8,758 | 123,292 | ||||||
|
| |||||||
France — 0.3% | ||||||||
Dassault Systemes | 4,570 | 153,328 | ||||||
Engie | 16,378 | 212,905 | ||||||
LVMH Moet Hennessy Louis Vuitton | 509 | 321,429 | ||||||
Schneider Electric | 1,481 | 187,721 | ||||||
Valeo | 9,003 | 148,495 | ||||||
|
| |||||||
| 1,023,878 | ||||||||
|
| |||||||
Germany — 0.7% | ||||||||
Allianz | 39 | 7,022 | ||||||
Bayer | 3,119 | 164,043 | ||||||
Deutsche Post | 5,290 | 187,732 | ||||||
E.ON | 60,304 | 505,131 | ||||||
Infineon Technologies | 13,411 | 326,564 | ||||||
KION Group | 2,306 | 51,207 | ||||||
Merck KGaA | 1,852 | 301,989 | ||||||
RWE | 6,537 | 251,883 | ||||||
SAP | 5,095 | 491,781 | ||||||
Siemens | 977 | 106,825 | ||||||
The accompanying notes are an integral part of the financial statements.
9
THE ADVISORS’ INNER CIRCLE FUND III | PINEBRIDGE DYNAMIC | |
| ASSET ALLOCATION FUND | ||
| OCTOBER 31, 2022 |
COMMON STOCK — continued
| Shares | Value | |||||||
Germany — continued | ||||||||
Siemens Energy | 38,573 | $ | 450,385 | |||||
|
| |||||||
| 2,844,562 | ||||||||
|
| |||||||
Greece — 0.1% | ||||||||
JUMBO | 39,923 | 567,742 | ||||||
|
| |||||||
Hong Kong — 0.3% | ||||||||
China Overseas Property Holdings | 75,000 | 47,200 | ||||||
China Petroleum & Chemical, Cl H | 266,000 | 105,049 | ||||||
China Shenhua Energy, Cl H | 8,000 | 21,046 | ||||||
CMOC Group, Cl H | 30,000 | 9,669 | ||||||
Ganfeng Lithium, Cl H | 4,400 | 29,764 | ||||||
Geely Automobile Holdings | 256,000 | 275,253 | ||||||
Haidilao International Holding | 7,000 | 10,398 | ||||||
Hangzhou Tigermed Consulting, Cl H | 1,700 | 11,554 | ||||||
Industrial & Commercial Bank of China, Cl H | 232,000 | 100,784 | ||||||
JD Health International * | 6,900 | 37,842 | ||||||
JD.com, Cl A | 9 | 166 | ||||||
PetroChina, Cl H | 130,000 | 49,684 | ||||||
PICC Property & Casualty, Cl H | 16,000 | 14,757 | ||||||
Shenzhou International Group Holdings | 40,100 | 277,903 | ||||||
WuXi AppTec, Cl H | 1,100 | 8,815 | ||||||
Wuxi Biologics Cayman * | 53,000 | 239,692 | ||||||
Xinyi Solar Holdings | 10,000 | 9,924 | ||||||
|
| |||||||
| 1,249,500 | ||||||||
|
| |||||||
Hungary — 0.2% | ||||||||
OTP Bank Nyrt | 6,001 | 130,917 | ||||||
Richter Gedeon Nyrt | 28,707 | 567,846 | ||||||
|
| |||||||
| 698,763 | ||||||||
|
| |||||||
India — 0.6% | ||||||||
Adani Green Energy * | 691 | 17,554 | ||||||
Angel One | 19,078 | 369,368 | ||||||
Avenue Supermarts * | 4,166 | 217,461 | ||||||
Divi’s Laboratories | 6,248 | 272,398 | ||||||
Hindustan Unilever | 10,811 | 333,129 | ||||||
Info Edge India | 3,304 | 156,532 | ||||||
Jubilant Foodworks | 23,565 | 173,640 | ||||||
Reliance Industries | 11,187 | 344,567 | ||||||
Tata Consultancy Services | 7,532 | 290,547 | ||||||
|
| |||||||
| 2,175,196 | ||||||||
|
| |||||||
The accompanying notes are an integral part of the financial statements.
10
THE ADVISORS’ INNER CIRCLE FUND III | PINEBRIDGE DYNAMIC | |
| ASSET ALLOCATION FUND | ||
| OCTOBER 31, 2022 |
COMMON STOCK — continued
| Shares | Value | |||||||
Indonesia — 0.2% | ||||||||
Bank Central Asia | 1,137,200 | $ | 641,600 | |||||
|
| |||||||
Italy — 0.6% | ||||||||
Enel | 22,391 | 99,996 | ||||||
Eni | 6,273 | 82,165 | ||||||
ERG | 9,145 | 286,852 | ||||||
Prysmian | 30,589 | 997,273 | ||||||
STMicroelectronics | 15,133 | 472,584 | ||||||
Terna - Rete Elettrica Nazionale | 53,802 | 356,663 | ||||||
|
| |||||||
| 2,295,533 | ||||||||
|
| |||||||
Japan — 4.9% | ||||||||
Advantest | 2,500 | 132,150 | ||||||
Ajinomoto | 20,700 | 570,209 | ||||||
Asahi Group Holdings | 9,500 | 266,035 | ||||||
Asics | 21,400 | 328,710 | ||||||
Canon | 9,600 | 203,628 | ||||||
Concordia Financial Group | 56,100 | 170,909 | ||||||
Daifuku | 5,400 | 247,675 | ||||||
Dai-ichi Life Holdings | 29,000 | 459,783 | ||||||
Daiichi Sankyo | 24,700 | 791,855 | ||||||
FANUC | 3,900 | 514,859 | ||||||
Fuji Electric | 9,400 | 364,128 | ||||||
Fuji Oil Holdings | 5,200 | 81,867 | ||||||
Fujikura | 60,900 | 360,416 | ||||||
Fujitsu | 1,500 | 172,753 | ||||||
Harmonic Drive Systems | 4,300 | 143,724 | ||||||
Hitachi | 14,100 | 641,017 | ||||||
Hoya | 100 | 9,331 | ||||||
ITOCHU | 18,000 | 465,934 | ||||||
JCR Pharmaceuticals | 6,400 | 95,336 | ||||||
JMDC | 4,000 | 142,305 | ||||||
KDDI | 5,700 | 168,476 | ||||||
Keyence | 4,500 | 1,704,428 | ||||||
Komatsu | 2,800 | 53,629 | ||||||
Lawson | 2,100 | 67,084 | ||||||
M&A Capital Partners * | 5,700 | 145,667 | ||||||
Menicon | 8,200 | 140,458 | ||||||
MINEBEA MITSUMI | 5,200 | 77,076 | ||||||
MISUMI Group | 10,800 | 230,969 | ||||||
Mitsubishi Electric | 44,900 | 395,568 | ||||||
Mitsubishi UFJ Financial Group | 85,100 | 400,333 | ||||||
The accompanying notes are an integral part of the financial statements.
11
THE ADVISORS’ INNER CIRCLE FUND III | PINEBRIDGE DYNAMIC | |
| ASSET ALLOCATION FUND | ||
| OCTOBER 31, 2022 |
COMMON STOCK — continued
| Shares | Value | |||||||
Japan — continued | ||||||||
Mitsui Fudosan | 18,700 | $ | 358,355 | |||||
Morinaga Milk Industry | 2,000 | 56,760 | ||||||
NEC | 26,400 | 874,407 | ||||||
Nidec | 4,100 | 227,148 | ||||||
Nippon Telegraph & Telephone | 43,800 | 1,205,940 | ||||||
Nissan Motor | 15,200 | 48,494 | ||||||
Nitori Holdings | 900 | 81,923 | ||||||
Nittoku | 7,300 | 124,404 | ||||||
NTT Data | 38,300 | 555,588 | ||||||
Pan Pacific International Holdings | 20,500 | 336,531 | ||||||
Raito Kogyo | 16,400 | 223,784 | ||||||
Renesas Electronics * | 48,000 | 402,381 | ||||||
Rengo | 77,400 | 429,436 | ||||||
Seven & i Holdings | 11,800 | 440,749 | ||||||
Shin-Etsu Chemical | 2,200 | 229,920 | ||||||
SHO-BOND Holdings | 3,700 | 160,248 | ||||||
SMC | 600 | 242,590 | ||||||
Solasto | 3,900 | 23,527 | ||||||
Sony Group | 7,300 | 490,349 | ||||||
Sumitomo Mitsui Financial Group | 15,500 | 434,994 | ||||||
Suzuki Motor | 8,700 | 293,715 | ||||||
Taiyo Holdings | 3,200 | 56,470 | ||||||
Tokyu | 64,800 | 747,818 | ||||||
Toyota Motor | 55,400 | 767,318 | ||||||
Trend Micro | 9,900 | 500,010 | ||||||
Ushio | 8,400 | 87,336 | ||||||
Yamaha | 9,200 | 347,718 | ||||||
Yaskawa Electric | 4,900 | 136,097 | ||||||
|
| |||||||
| 19,430,322 | ||||||||
|
| |||||||
Malaysia — 0.0% | ||||||||
CIMB Group Holdings | 19,000 | 22,183 | ||||||
|
| |||||||
Mexico — 0.3% | ||||||||
Grupo Financiero Banorte, Cl O | 87,000 | 708,233 | ||||||
Wal-Mart de Mexico | 153,700 | 593,762 | ||||||
|
| |||||||
| 1,301,995 | ||||||||
|
| |||||||
Netherlands — 0.0% | ||||||||
Adyen * | 8 | 11,484 | ||||||
|
| |||||||
New Zealand — 0.1% | ||||||||
Meridian Energy | 144,264 | 409,310 | ||||||
|
| |||||||
The accompanying notes are an integral part of the financial statements.
12
THE ADVISORS’ INNER CIRCLE FUND III | PINEBRIDGE DYNAMIC | |
| ASSET ALLOCATION FUND | ||
| OCTOBER 31, 2022 |
COMMON STOCK — continued
| Shares | Value | |||||||
Norway — 0.1% | ||||||||
Equinor | 7,410 | $ | 271,100 | |||||
|
| |||||||
Philippines — 0.1% | ||||||||
Metropolitan Bank & Trust | 327,260 | 293,808 | ||||||
|
| |||||||
Poland — 0.0% | ||||||||
PGE Polska Grupa Energetyczna * | 29,034 | 33,145 | ||||||
|
| |||||||
Portugal — 0.2% | ||||||||
EDP - Energias de Portugal | 41,526 | 181,593 | ||||||
EDP Renovaveis | 31,403 | 661,335 | ||||||
|
| |||||||
| 842,928 | ||||||||
|
| |||||||
Russia — 0.0% | ||||||||
Yandex, Cl A *,(A) | 16,554 | – | ||||||
|
| |||||||
Singapore — 0.0% | ||||||||
Sea ADR * | 116 | 5,763 | ||||||
|
| |||||||
South Africa — 0.2% | ||||||||
Absa Group | 37,211 | 404,629 | ||||||
Anglo American Platinum | 95 | 7,557 | ||||||
FirstRand | 110,722 | 387,885 | ||||||
Gold Fields | 1,682 | 13,597 | ||||||
Naspers, Cl N | 1,051 | 108,717 | ||||||
Woolworths Holdings | 5,952 | 20,443 | ||||||
|
| |||||||
| 942,828 | ||||||||
|
| |||||||
South Korea — 0.7% | ||||||||
Celltrion | 1 | 135 | ||||||
Doosan Bobcat | 21,761 | 511,772 | ||||||
Hanwha Solutions | 24,590 | 814,804 | ||||||
Kia | 2,518 | 117,198 | ||||||
Samsung Electronics | 9,834 | 410,081 | ||||||
SK Hynix | 14,066 | 816,637 | ||||||
|
| |||||||
| 2,670,627 | ||||||||
|
| |||||||
Spain — 0.6% | ||||||||
Acciona | 6,372 | 1,146,707 | ||||||
Amadeus IT Group, Cl A * | 1,652 | 86,103 | ||||||
Endesa | 7,608 | 126,951 | ||||||
Iberdrola | 27,323 | 277,445 | ||||||
Red Electrica | 37,025 | 598,246 | ||||||
Repsol | 7,429 | 100,912 | ||||||
|
| |||||||
| 2,336,364 | ||||||||
|
| |||||||
The accompanying notes are an integral part of the financial statements.
13
THE ADVISORS’ INNER CIRCLE FUND III | PINEBRIDGE DYNAMIC | |
| ASSET ALLOCATION FUND | ||
| OCTOBER 31, 2022 |
COMMON STOCK — continued
| Shares | Value | |||||||
Sweden — 0.2% | ||||||||
Epiroc, Cl B | 5,698 | $ | 76,558 | |||||
Evolution | 106 | 9,917 | ||||||
Hexagon, Cl B | 21,407 | 211,720 | ||||||
Nordea Bank Abp | 28,281 | 270,280 | ||||||
|
| |||||||
| 568,475 | ||||||||
|
| |||||||
Switzerland — 0.2% | ||||||||
ABB | 10,253 | 285,059 | ||||||
Accelleron Industries * | 512 | 8,682 | ||||||
Novartis | 1,767 | 142,758 | ||||||
Swatch Group | 412 | 17,215 | ||||||
Zurich Insurance Group | 719 | 306,814 | ||||||
|
| |||||||
| 760,528 | ||||||||
|
| |||||||
Taiwan — 0.5% | ||||||||
Airtac International Group | 12,962 | 297,677 | ||||||
Chailease Holding | 42,152 | 194,915 | ||||||
Delta Electronics | 52,000 | 415,548 | ||||||
Fubon Financial Holding | 6,300 | 9,971 | ||||||
MediaTek | 10,880 | 199,215 | ||||||
Taiwan Semiconductor Manufacturing | 71,600 | 866,599 | ||||||
|
| |||||||
| 1,983,925 | ||||||||
|
| |||||||
Turkey — 0.0% | ||||||||
Aselsan Elektronik Sanayi Ve Ticaret | 16,132 | 27,923 | ||||||
BIM Birlesik Magazalar | 7,443 | 53,581 | ||||||
Ford Otomotiv Sanayi | 1,027 | 20,028 | ||||||
|
| |||||||
| 101,532 | ||||||||
|
| |||||||
United Kingdom — 0.2% | ||||||||
British American Tobacco | 1,690 | 66,544 | ||||||
Experian | 18,413 | 585,760 | ||||||
SSE | 15,596 | 278,299 | ||||||
|
| |||||||
| 930,603 | ||||||||
|
| |||||||
United States — 26.1% | ||||||||
Communication Services — 1.3% | ||||||||
Alphabet, Cl A * | 23,545 | 2,225,238 | ||||||
Alphabet, Cl C * | 1,352 | 127,980 | ||||||
AT&T | 20,740 | 378,090 | ||||||
Interpublic Group | 10,545 | 314,135 | ||||||
Meta Platforms, Cl A * | 9,316 | 867,878 | ||||||
Nexstar Media Group, Cl A | 1,529 | 261,918 | ||||||
Roku, Cl A * | 118 | 6,554 | ||||||
Sirius XM Holdings | 15,346 | 92,690 | ||||||
The accompanying notes are an integral part of the financial statements.
14
THE ADVISORS’ INNER CIRCLE FUND III | PINEBRIDGE DYNAMIC | |
| ASSET ALLOCATION FUND | ||
| OCTOBER 31, 2022 |
COMMON STOCK — continued
| Shares | Value | |||||||
United States — continued | ||||||||
Communication Services — continued | ||||||||
T-Mobile US * | 1,046 | $ | 158,532 | |||||
Trade Desk, Cl A * | 7,016 | 373,532 | ||||||
Warner Bros Discovery * | 7,877 | 102,401 | ||||||
|
| |||||||
| 4,908,948 | ||||||||
|
| |||||||
Consumer Discretionary — 1.8% | ||||||||
Amazon.com * | 7,740 | 792,886 | ||||||
AutoNation * | 1,764 | 187,531 | ||||||
Best Buy | 4,929 | 337,193 | ||||||
Booking Holdings * | 87 | 162,645 | ||||||
Chipotle Mexican Grill, Cl A * | 601 | 900,496 | ||||||
eBay | 301 | 11,992 | ||||||
Etsy * | 120 | 11,269 | ||||||
Grand Canyon Education * | 98 | 9,862 | ||||||
Hanesbrands | 11,990 | 81,772 | ||||||
LKQ | 143 | 7,957 | ||||||
Lowe’s | 2,573 | 501,606 | ||||||
Lululemon Athletica * | 994 | 327,066 | ||||||
Luminar Technologies, Cl A * | 13,959 | 112,928 | ||||||
Marriott International, Cl A | 64 | 10,247 | ||||||
NIKE, Cl B | 11,346 | 1,051,547 | ||||||
Peloton Interactive, Cl A * | 664 | 5,578 | ||||||
Penske Automotive Group | 492 | 54,917 | ||||||
Royal Caribbean Cruises * | 227 | 12,117 | ||||||
Target | 9,761 | 1,603,244 | ||||||
Tesla * | 199 | 45,280 | ||||||
TJX | 3,754 | 270,663 | ||||||
Ulta Beauty * | 1,305 | 547,278 | ||||||
VF | 3,475 | 98,169 | ||||||
|
| |||||||
| 7,144,243 | ||||||||
|
| |||||||
Consumer Staples — 1.2% | ||||||||
Altria Group | 6,439 | 297,933 | ||||||
Colgate-Palmolive | 2,444 | 180,465 | ||||||
Costco Wholesale | 2,438 | 1,222,657 | ||||||
Estee Lauder, Cl A | 3,241 | 649,788 | ||||||
Hershey | 1,695 | 404,715 | ||||||
Kroger | 447 | 21,139 | ||||||
Monster Beverage * | 6,188 | 579,939 | ||||||
Philip Morris International | 1,398 | 128,406 | ||||||
Procter & Gamble | 2,198 | 296,005 | ||||||
The accompanying notes are an integral part of the financial statements.
15
THE ADVISORS’ INNER CIRCLE FUND III | PINEBRIDGE DYNAMIC | |
| ASSET ALLOCATION FUND | ||
| OCTOBER 31, 2022 |
COMMON STOCK — continued
| Shares | Value | |||||||
United States — continued | ||||||||
Consumer Staples — continued | ||||||||
Walmart | 6,235 | $ | 887,427 | |||||
|
| |||||||
| 4,668,474 | ||||||||
|
| |||||||
Energy — 1.0% | ||||||||
Baker Hughes, Cl A | 5,547 | 153,430 | ||||||
Chevron | 4,746 | 858,552 | ||||||
Devon Energy | 3,154 | 243,962 | ||||||
EOG Resources | 2,043 | 278,910 | ||||||
Exxon Mobil | 9,230 | 1,022,776 | ||||||
Marathon Petroleum | 25 | 2,841 | ||||||
Pioneer Natural Resources | 521 | 133,590 | ||||||
Schlumberger | 20,444 | 1,063,701 | ||||||
Valero Energy | 2,382 | 299,060 | ||||||
|
| |||||||
| 4,056,822 | ||||||||
|
| |||||||
Financials — 2.0% | ||||||||
American Express | 6,524 | 968,488 | ||||||
Ameriprise Financial | 214 | 66,152 | ||||||
Bank of America | 15,919 | 573,721 | ||||||
Capital One Financial | 122 | 12,935 | ||||||
Citigroup | 830 | 38,064 | ||||||
Credit Acceptance * | 173 | 80,552 | ||||||
Discover Financial Services | 2,327 | 243,078 | ||||||
Everest Re Group | 792 | 255,547 | ||||||
First Republic Bank | 107 | 12,851 | ||||||
Huntington Bancshares | 39,881 | 605,394 | ||||||
JPMorgan Chase | 7,705 | 969,905 | ||||||
LPL Financial Holdings | 1,213 | 310,103 | ||||||
Regions Financial | 17,990 | 394,880 | ||||||
S&P Global | 5,282 | 1,696,842 | ||||||
SVB Financial Group * | 908 | 209,712 | ||||||
Synchrony Financial | 10,100 | 359,156 | ||||||
T Rowe Price Group | 4,032 | 428,037 | ||||||
Wells Fargo | 11,820 | 543,602 | ||||||
|
| |||||||
| 7,769,019 | ||||||||
|
| |||||||
Health Care — 2.7% | ||||||||
Abbott Laboratories | 5,648 | 558,813 | ||||||
Align Technology * | 1,015 | 197,215 | ||||||
AmerisourceBergen, Cl A | 2,214 | 348,085 | ||||||
Amgen | 39 | 10,544 | ||||||
Azenta | 3,178 | 141,103 | ||||||
The accompanying notes are an integral part of the financial statements.
16
THE ADVISORS’ INNER CIRCLE FUND III | PINEBRIDGE DYNAMIC | |
| ASSET ALLOCATION FUND | ||
| OCTOBER 31, 2022 |
COMMON STOCK — continued
| Shares | Value | |||||||
United States — continued | ||||||||
Health Care — continued | ||||||||
Boston Scientific * | 418 | $ | 18,020 | |||||
Dexcom * | 168 | 20,291 | ||||||
Exact Sciences * | 242 | 8,417 | ||||||
Hologic * | 2,833 | 192,077 | ||||||
IDEXX Laboratories * | 1,252 | 450,319 | ||||||
Intuitive Surgical * | 66 | 16,267 | ||||||
Jazz Pharmaceuticals * | 2,149 | 309,005 | ||||||
Johnson & Johnson | 1,835 | 319,235 | ||||||
McKesson | 4,971 | 1,935,558 | ||||||
Medtronic | 170 | 14,848 | ||||||
Merck | 7,765 | 785,818 | ||||||
Moderna * | 1,897 | 285,176 | ||||||
Molina Healthcare * | 255 | 91,509 | ||||||
Pfizer | 13,636 | 634,756 | ||||||
Regeneron Pharmaceuticals * | 1,922 | 1,439,098 | ||||||
UnitedHealth Group | 496 | 275,354 | ||||||
Veeva Systems, Cl A * | 1,143 | 191,955 | ||||||
Vertex Pharmaceuticals * | 6,085 | 1,898,520 | ||||||
Waters * | 472 | 141,208 | ||||||
Zoetis, Cl A | 2,415 | 364,134 | ||||||
|
| |||||||
| 10,647,325 | ||||||||
|
| |||||||
Industrials — 2.7% | ||||||||
3M | 1,908 | 240,007 | ||||||
Booz Allen Hamilton Holding, Cl A | 4,774 | 519,650 | ||||||
Builders FirstSource * | 1,941 | 119,682 | ||||||
Caterpillar | 1,410 | 305,209 | ||||||
Cintas | 412 | 176,151 | ||||||
Copart * | 1,594 | 183,342 | ||||||
Delta Air Lines * | 475 | 16,117 | ||||||
Dover | 2,137 | 279,285 | ||||||
Emerson Electric | 1,956 | 169,390 | ||||||
Equifax | 2,052 | 347,896 | ||||||
Expeditors International of Washington | 2,178 | 213,117 | ||||||
General Electric | 1,743 | 135,623 | ||||||
Graco | 2,894 | 201,364 | ||||||
Honeywell International | 1,221 | 249,108 | ||||||
Illinois Tool Works | 5,362 | 1,144,948 | ||||||
Lockheed Martin | 573 | 278,868 | ||||||
Northrop Grumman | 684 | 375,523 | ||||||
Old Dominion Freight Line | 503 | 138,124 | ||||||
The accompanying notes are an integral part of the financial statements.
17
THE ADVISORS’ INNER CIRCLE FUND III | PINEBRIDGE DYNAMIC | |
| ASSET ALLOCATION FUND | ||
| OCTOBER 31, 2022 |
COMMON STOCK — continued
| Shares | Value | |||||||
United States — continued | ||||||||
Industrials — continued | ||||||||
Quanta Services | 11,623 | $ | 1,650,931 | |||||
Raytheon Technologies | 6,060 | 574,609 | ||||||
Republic Services, Cl A | 3,589 | 475,973 | ||||||
Robert Half International | 6,627 | 506,700 | ||||||
Rockwell Automation | 1,258 | 321,167 | ||||||
Rollins | 5,926 | 249,366 | ||||||
Schneider National, Cl B | 13,045 | 290,121 | ||||||
Southwest Airlines * | 414 | 15,049 | ||||||
Sunrun * | 19,883 | 447,566 | ||||||
Trane Technologies | 2,624 | 418,869 | ||||||
Trex * | 349 | 16,783 | ||||||
United Parcel Service, Cl B | 3,545 | 594,745 | ||||||
|
| |||||||
| 10,655,283 | ||||||||
|
| |||||||
Information Technology — 11.4% | ||||||||
Accenture, Cl A | 2,770 | 786,403 | ||||||
Adobe * | 4,700 | 1,496,950 | ||||||
Advanced Micro Devices * | 3,288 | 197,477 | ||||||
Akamai Technologies * | 1,988 | 175,600 | ||||||
Alteryx, Cl A * | 1,349 | 65,737 | ||||||
Analog Devices | 415 | 59,187 | ||||||
ANSYS * | 1,311 | 289,941 | ||||||
Appian, Cl A * | 1,577 | 76,989 | ||||||
Apple | 11,151 | 1,709,894 | ||||||
Applied Materials | 6,365 | 561,966 | ||||||
Arista Networks * | 4,412 | 533,234 | ||||||
Arrow Electronics * | 2,967 | 300,438 | ||||||
Atlassian, Cl A * | 64 | 12,975 | ||||||
Autodesk * | 3,471 | 743,835 | ||||||
Automatic Data Processing | 1,510 | 364,967 | ||||||
Bill.com Holdings * | 932 | 124,292 | ||||||
Block, Cl A * | 152 | 9,131 | ||||||
Broadcom | 1,023 | 480,933 | ||||||
Cadence Design Systems * | 7,470 | 1,130,883 | ||||||
CDW | 97 | 16,763 | ||||||
Ceridian HCM Holding * | 711 | 47,061 | ||||||
Check Point Software Technologies * | 3,391 | 438,219 | ||||||
Cisco Systems | 33,646 | 1,528,538 | ||||||
Cognex | 6,115 | 282,696 | ||||||
Coupa Software * | 1,195 | 63,610 | ||||||
Crowdstrike Holdings, Cl A * | 513 | 82,696 | ||||||
The accompanying notes are an integral part of the financial statements.
18
THE ADVISORS’ INNER CIRCLE FUND III | PINEBRIDGE DYNAMIC | |
| ASSET ALLOCATION FUND | ||
| OCTOBER 31, 2022 |
COMMON STOCK — continued
| Shares | Value | |||||||
United States — continued | ||||||||
Information Technology — continued | ||||||||
Datadog, Cl A * | 4,403 | $ | 354,486 | |||||
Dell Technologies, Cl C | 6,288 | 241,459 | ||||||
DocuSign, Cl A * | 1,875 | 90,562 | ||||||
Dropbox, Cl A * | 10,650 | 231,637 | ||||||
Elastic * | 725 | 46,364 | ||||||
Enphase Energy * | 6,243 | 1,916,601 | ||||||
F5 * | 1,707 | 243,947 | ||||||
Fidelity National Information Services | 8,287 | 687,738 | ||||||
First Solar * | 13,169 | 1,917,011 | ||||||
Five9 * | 1,526 | 91,957 | ||||||
Fortinet * | 20,031 | 1,144,972 | ||||||
Gartner * | 1,348 | 406,988 | ||||||
GoDaddy, Cl A * | 1,571 | 126,308 | ||||||
Guidewire Software * | 1,033 | 61,371 | ||||||
Hewlett Packard Enterprise | 39,237 | 559,912 | ||||||
HP | 19,609 | 541,601 | ||||||
HubSpot * | 653 | 193,654 | ||||||
Intel | 345 | 9,808 | ||||||
International Business Machines | 5,293 | 731,969 | ||||||
Intuit | 3,507 | 1,499,242 | ||||||
IPG Photonics * | 1,853 | 158,728 | ||||||
Juniper Networks | 8,873 | 271,514 | ||||||
Kyndryl Holdings * | 999 | 9,660 | ||||||
Lam Research | 1,097 | 444,044 | ||||||
Marvell Technology | 1,728 | 68,567 | ||||||
Mastercard, Cl A | 3,901 | 1,280,230 | ||||||
Microchip Technology | 4,356 | 268,939 | ||||||
Microsoft | 20,308 | 4,714,096 | ||||||
MongoDB, Cl A * | 529 | 96,823 | ||||||
National Instruments | 3,710 | 141,648 | ||||||
nCino * | 5,745 | 180,853 | ||||||
Nutanix, Cl A * | 10,781 | 295,399 | ||||||
NVIDIA | 5,821 | 785,660 | ||||||
NXP Semiconductors | 4,105 | 599,658 | ||||||
Okta, Cl A * | 1,488 | 83,507 | ||||||
ON Semiconductor * | 5,604 | 344,254 | ||||||
Oracle | 13,098 | 1,022,561 | ||||||
Palo Alto Networks * | 4,569 | 783,995 | ||||||
Paychex | 2,890 | 341,916 | ||||||
Paycom Software * | 1,775 | 614,150 | ||||||
The accompanying notes are an integral part of the financial statements.
19
THE ADVISORS’ INNER CIRCLE FUND III | PINEBRIDGE DYNAMIC | |
| ASSET ALLOCATION FUND | ||
| OCTOBER 31, 2022 |
COMMON STOCK — continued
| Shares | Value | |||||||
United States — continued | ||||||||
Information Technology — continued | ||||||||
PayPal Holdings * | 6,498 | $ | 543,103 | |||||
PTC * | 2,455 | 289,273 | ||||||
Pure Storage, Cl A * | 1,948 | 60,115 | ||||||
QUALCOMM | 9,339 | 1,098,827 | ||||||
RingCentral, Cl A * | 1,110 | 39,427 | ||||||
Salesforce * | 3,594 | 584,348 | ||||||
ServiceNow * | 3,284 | 1,381,710 | ||||||
Snowflake, Cl A * | 2,044 | 327,653 | ||||||
Splunk * | 2,067 | 171,788 | ||||||
StoneCo, Cl A * | 7,139 | 74,959 | ||||||
Synopsys * | 3,427 | 1,002,569 | ||||||
TE Connectivity | 2,772 | 338,822 | ||||||
Teradyne | 4,756 | 386,901 | ||||||
Texas Instruments | 5,331 | 856,319 | ||||||
Trimble * | 7,170 | 431,347 | ||||||
Twilio, Cl A * | 1,019 | 75,783 | ||||||
Tyler Technologies * | 214 | 69,193 | ||||||
Unity Software * | 2,833 | 83,574 | ||||||
Viasat * | 386 | 15,811 | ||||||
Visa, Cl A | 1,606 | 332,699 | ||||||
VMware, Cl A | 4,330 | 487,255 | ||||||
Western Digital * | 431 | 14,813 | ||||||
Workday, Cl A * | 1,909 | 297,460 | ||||||
Zebra Technologies, Cl A * | 926 | 262,262 | ||||||
Zoom Video Communications, Cl A * | 1,938 | 161,707 | ||||||
Zscaler * | 1,793 | 276,301 | ||||||
|
| |||||||
| 44,848,223 | ||||||||
|
| |||||||
Materials — 0.5% | ||||||||
CF Industries Holdings | 2,858 | 303,691 | ||||||
Dow | 2,428 | 113,485 | ||||||
Ecolab | 1,206 | 189,426 | ||||||
Nucor | 5,305 | 696,971 | ||||||
United States Steel | 5,639 | 114,810 | ||||||
Westrock | 15,338 | 522,412 | ||||||
|
| |||||||
| 1,940,795 | ||||||||
|
| |||||||
Real Estate — 0.4% | ||||||||
CBRE Group, Cl A * | 12,099 | 858,303 | ||||||
Weyerhaeuser | 21,010 | 649,839 | ||||||
The accompanying notes are an integral part of the financial statements.
20
THE ADVISORS’ INNER CIRCLE FUND III | PINEBRIDGE DYNAMIC | |
| ASSET ALLOCATION FUND | ||
| OCTOBER 31, 2022 |
COMMON STOCK — continued
| Shares | Value | |||||||
United States — continued | ||||||||
Real Estate — continued | ||||||||
Zillow Group, Cl C * | 351 | $ | 10,832 | |||||
|
| |||||||
| 1,518,974 | ||||||||
|
| |||||||
Utilities — 1.1% | ||||||||
Atlantica Sustainable Infrastructure | 21,742 | 602,471 | ||||||
Avangrid | 14,009 | 569,886 | ||||||
Brookfield Renewable, Cl A | 16,020 | 497,100 | ||||||
Clearway Energy, Cl C | 15,540 | 539,860 | ||||||
IDACORP | 2,323 | 243,218 | ||||||
NextEra Energy | 3,464 | 268,460 | ||||||
NRG Energy | 36,379 | 1,615,228 | ||||||
|
| |||||||
| 4,336,223 | ||||||||
|
| |||||||
| 102,494,329 | ||||||||
|
| |||||||
TOTAL COMMON STOCK | 152,227,520 | |||||||
|
| |||||||
| ||||||||
CORPORATE OBLIGATIONS — 16.1% | ||||||||
| Face Amount(1) | ||||||||
Consumer Discretionary — 0.1% | ||||||||
Home Depot | $ | 320,000 | 316,779 | |||||
|
| |||||||
Consumer Staples — 0.7% | ||||||||
General Mills | 2,774,000 | 2,730,884 | ||||||
|
| |||||||
Financials — 11.2% | ||||||||
American Express | 594,000 | 587,794 | ||||||
3.400%, 02/22/2024 | 3,012,000 | 2,938,221 | ||||||
Asian Development Bank MTN | 606,000 | 619,090 | ||||||
0.250%, 07/14/2023 | 631,000 | 611,420 | ||||||
Australia & New Zealand Banking Group MTN | 7,944,000 | 7,935,360 | ||||||
Bank of Montreal MTN | 4,396,000 | 4,385,091 | ||||||
0.400%, 09/15/2023 | 2,998,000 | 2,872,491 | ||||||
Bank of New York Mellon MTN | 619,000 | 613,076 | ||||||
0.350%, 12/07/2023 | 518,000 | 493,431 | ||||||
The accompanying notes are an integral part of the financial statements.
21
THE ADVISORS’ INNER CIRCLE FUND III | PINEBRIDGE DYNAMIC | |
| ASSET ALLOCATION FUND | ||
| OCTOBER 31, 2022 |
CORPORATE OBLIGATIONS — continued
| Face Amount(1) | Value | |||||||
Financials (continued) | ||||||||
Canadian Imperial Bank of Commerce | $ | 3,997,000 | $ | 3,995,484 | ||||
0.450%, 06/22/2023 | 4,996,000 | 4,846,668 | ||||||
European Investment Bank | 1,193,000 | 1,173,196 | ||||||
0.250%, 09/15/2023 | 632,000 | 607,936 | ||||||
Kreditanstalt fuer Wiederaufbau | 1,238,000 | 1,147,069 | ||||||
0.250%, 04/25/2023 | 630,000 | 617,230 | ||||||
Morgan Stanley MTN | 601,000 | 598,655 | ||||||
3.125%, 01/23/2023 | 606,000 | 603,941 | ||||||
State Street | 582,000 | 575,041 | ||||||
Toronto-Dominion Bank MTN | 6,026,000 | 6,022,373 | ||||||
0.450%, 09/11/2023 | 3,157,000 | 3,025,283 | ||||||
|
| |||||||
| 44,268,850 | ||||||||
|
| |||||||
Health Care — 2.0% | ||||||||
AstraZeneca | 3,066,000 | 2,988,575 | ||||||
Astrazeneca Finance | 1,006,000 | 940,334 | ||||||
Gilead Sciences | 2,346,000 | 2,302,721 | ||||||
0.750%, 09/29/2023 | 1,670,000 | 1,607,294 | ||||||
|
| |||||||
| 7,838,924 | ||||||||
|
| |||||||
Information Technology — 0.2% | ||||||||
Microsoft | 496,000 | 485,058 | ||||||
2.375%, 05/01/2023 | 265,000 | 262,368 | ||||||
|
| |||||||
| 747,426 | ||||||||
|
| |||||||
Real Estate — 1.9% | ||||||||
Country Garden Holdings | 1,369,000 | 222,623 | ||||||
4.750%, 01/17/2023 | 709,000 | 500,381 | ||||||
Hopson Development Holdings | 341,000 | 184,140 | ||||||
The accompanying notes are an integral part of the financial statements.
22
THE ADVISORS’ INNER CIRCLE FUND III | PINEBRIDGE DYNAMIC | |
| ASSET ALLOCATION FUND | ||
| OCTOBER 31, 2022 |
CORPORATE OBLIGATIONS — continued
| Face Amount(1) | Value | |||||||
Real Estate (continued) | ||||||||
RKPF Overseas 2019 A | $ | 2,582,000 | $ | 2,344,442 | ||||
6.700%, 09/30/2024 | 1,550,000 | 923,412 | ||||||
5.900%, 03/05/2025 | 950,000 | 380,000 | ||||||
Yanlord Land HK | 1,129,000 | 666,674 | ||||||
6.750%, 04/23/2023 | 2,390,000 | 2,162,950 | ||||||
|
| |||||||
| 7,384,622 | ||||||||
|
| |||||||
TOTAL CORPORATE OBLIGATIONS | 63,287,485 | |||||||
|
| |||||||
| ||||||||
U.S. TREASURY OBLIGATIONS — 14.7% | ||||||||
| ||||||||
U.S. Treasury Bond | 12,922,000 | 10,925,147 | ||||||
3.125%, 02/15/2043 | 4,383,000 | 3,592,519 | ||||||
3.125%, 02/15/2042 | 4,352,000 | 3,614,030 | ||||||
U.S. Treasury Note | 13,564,000 | 13,130,588 | ||||||
2.000%, 06/30/2024 | 13,786,000 | 13,210,327 | ||||||
2.000%, 05/31/2024 | 13,749,000 | 13,199,040 | ||||||
|
| |||||||
TOTAL U.S. TREASURY OBLIGATIONS | 57,671,651 | |||||||
|
| |||||||
| ||||||||
EXCHANGE TRADED FUNDS — 1.8% | ||||||||
| Shares | ||||||||
Invesco DB Base Metals Fund | 160,602 | 2,823,383 | ||||||
iShares MSCI ACWI Fund | 3,512 | 290,688 | ||||||
iShares MSCI Emerging Markets Fund | 8,722 | 298,205 | ||||||
KraneShares Global Carbon Strategy ETF | 53,514 | 2,321,973 | ||||||
Xtrackers Harvest CSI 300 China Fund, Cl A | 60,975 | 1,476,815 | ||||||
|
| |||||||
TOTAL EXCHANGE TRADED FUNDS | 7,211,064 | |||||||
|
| |||||||
| ||||||||
PREFERRED STOCK — 0.0% | ||||||||
| ||||||||
Brazil — 0.0% | ||||||||
Cia Paranaense de Energia 0.000%, ** | 21,600 | 30,985 | ||||||
The accompanying notes are an integral part of the financial statements.
23
THE ADVISORS’ INNER CIRCLE FUND III | PINEBRIDGE DYNAMIC | |
| ASSET ALLOCATION FUND | ||
| OCTOBER 31, 2022 |
PREFERRED STOCK — continued
| Shares | Value | |||||||
Germany — 0.0% | ||||||||
Bayerische Motoren Werke 0.000%, ** | 80 | $ | 5,906 | |||||
|
| |||||||
TOTAL PREFERRED STOCK | 36,891 | |||||||
|
| |||||||
| ||||||||
RIGHT — 0.0% | ||||||||
| Number of Rights | ||||||||
Brazil — 0.0% | ||||||||
Localiza Rent a Car, Strike Price 50.35 BRL, 10/31/2022 * | 76 | 297 | ||||||
|
| |||||||
TOTAL RIGHT | 297 | |||||||
|
| |||||||
TOTAL INVESTMENTS — 71.3% | $ | 280,434,908 | ||||||
|
| |||||||
Percentages are based on Net Assets of $393,496,571. |
| * | Non-income producing security. |
| ** | There is currently no rate available. |
| (1) | In U.S. dollars unless otherwise indicated. |
| (A) | Level 3 security in accordance with fair value hierarchy. |
ACWI — All Country World Index
ADR — American Depositary Receipt
AUD — Australian Dollar
BRL — Brazilian Real
CAD — Canadian Dollar
CHF — Swiss Franc
Cl — Class
EAFE — Europe, Australasia and Far East
ETF — Exchange-Traded Fund
EUR — Euro
FTSE — Financial Times Stock Exchange
GBP — British Pound Sterling
JPY — Japanese Yen
MSCI — Morgan Stanley Capital International
MTN — Medium Term Note
S&P — Standard & Poor’s
SOFR — Secured Overnight Financing Rate
TOPIX- Tokyo Price Index
USD — U.S. Dollar
The accompanying notes are an integral part of the financial statements.
24
THE ADVISORS’ INNER CIRCLE FUND III | PINEBRIDGE DYNAMIC | |
| ASSET ALLOCATION FUND | ||
| OCTOBER 31, 2022 |
A list of the outstanding forward foreign currency contracts held by the Fund at October 31, 2022, is as follows:
| ||||||||||||||||||||||||
| Unrealized | ||||||||||||||||||||||||
| Settlement | Currency to | Appreciation/ | ||||||||||||||||||||||
| Counterparty | Date | Deliver | Currency to Receive | (Depreciation) | ||||||||||||||||||||
| ||||||||||||||||||||||||
Morgan Stanley | 12/21/22 | USD | 43,022,379 | EUR | 42,840,000 | $ | (497,645 | ) | ||||||||||||||||
Morgan Stanley | 12/21/22 | USD | 64,025,932 | JPY | 9,149,520,000 | (2,070,597 | ) | |||||||||||||||||
Morgan Stanley | 12/21/22 | JPY | 6,266,357,000 | USD | 44,509,075 | 2,076,876 | ||||||||||||||||||
Morgan Stanley | 12/21/22 | USD | 4,201,345 | CHF | 4,004,000 | (176,733 | ) | |||||||||||||||||
Morgan Stanley | 12/21/22 | USD | 7,434,076 | AUD | 10,990,000 | (392,221 | ) | |||||||||||||||||
Morgan Stanley | 12/21/22 | USD | 8,824,567 | CAD | 11,599,000 | (305,198 | ) | |||||||||||||||||
Morgan Stanley | 12/21/22 | USD | 8,349,582 | GBP | 7,195,000 | (82,912 | ) | |||||||||||||||||
|
|
| ||||||||||||||||||||||
| $ | (1,448,430 | ) | ||||||||||||||||||||||
|
|
| ||||||||||||||||||||||
The open futures contracts held by the Fund at October 31, 2022, are as follows:
| Unrealized | ||||||||||||||||||||
| Number of | Expiration | Notional | Appreciation/ | |||||||||||||||||
| Type of Contract | Contracts | Date | Amount † | Value | (Depreciation) | |||||||||||||||
Long Contracts | ||||||||||||||||||||
FTSE China A50 | 1,281 | 11/29/22 | $ | 15,144,589 | $ | 14,297,241 | $ | (847,348 | ) | |||||||||||
Hang Seng China Enterprises Index | 399 | 11/29/22 | 13,217,257 | 12,552,541 | (665,223 | ) | ||||||||||||||
TOPIX Index | 31 | 12/8/22 | 3,945,271 | 4,015,333 | 194,982 | |||||||||||||||
U.S. Ultra Long Treasury Bond | 413 | 12/20/22 | 59,029,851 | 52,722,031 | (6,307,820 | ) | ||||||||||||||
|
|
|
|
|
|
|
|
| ||||||||||||
| $ | 91,336,968 | $ | 83,587,146 | $ | (7,625,409 | ) | ||||||||||||||
|
|
|
|
|
|
|
|
| ||||||||||||
Short Contracts | ||||||||||||||||||||
MSCI EAFE Index | (40 | ) | 12/16/22 | $ | (3,633,697 | ) | $ | (3,511,800 | ) | $ | 121,897 | |||||||||
MSCI Emerging Markets | (381 | ) | 12/19/22 | (18,219,049 | ) | (16,261,080 | ) | 1,957,969 | ||||||||||||
S&P 500 Index E-MINI | (197 | ) | 12/16/22 | (38,394,708 | ) | (38,247,550 | ) | 147,158 | ||||||||||||
|
|
|
|
|
|
|
|
| ||||||||||||
| $ | (60,247,454 | ) | $ | (58,020,430 | ) | $ | 2,227,024 | |||||||||||||
|
|
|
|
|
|
|
|
| ||||||||||||
| $ | 31,089,514 | $ | 25,566,716 | $ | (5,398,385 | ) | ||||||||||||||
|
|
|
|
|
|
|
|
| ||||||||||||
| † | The foreign exchange rate for the contract notional amounts are based on prevailing exchange rates on the date the respective contracts were opened. |
The accompanying notes are an integral part of the financial statements.
25
THE ADVISORS’ INNER CIRCLE FUND III | PINEBRIDGE DYNAMIC | |
| ASSET ALLOCATION FUND | ||
| OCTOBER 31, 2022 |
The following is a summary of the level inputs used as of October 31, 2022, in valuing the Fund’s investments and other financial instruments carried at value:
| Investments in Securities | Level 1 | Level 2 | Level 3(1) | Total | ||||||||||||
Common Stock | ||||||||||||||||
Australia | $ | 78,152 | $ | — | $ | — | $ | 78,152 | ||||||||
Austria | 534,197 | — | — | 534,197 | ||||||||||||
Brazil | 1,447,443 | — | — | 1,447,443 | ||||||||||||
Canada | 692,074 | — | — | 692,074 | ||||||||||||
China | 1,474,082 | — | — | 1,474,082 | ||||||||||||
Colombia | 32,721 | — | — | 32,721 | ||||||||||||
Denmark | 937,536 | — | — | 937,536 | ||||||||||||
Finland | 123,292 | — | — | 123,292 | ||||||||||||
France | 1,023,878 | — | — | 1,023,878 | ||||||||||||
Germany | 2,844,562 | — | — | 2,844,562 | ||||||||||||
Greece | 567,742 | — | — | 567,742 | ||||||||||||
Hong Kong | 1,249,500 | — | — | 1,249,500 | ||||||||||||
Hungary | — | 698,763 | — | 698,763 | ||||||||||||
India | 2,175,196 | — | — | 2,175,196 | ||||||||||||
Indonesia | 641,600 | — | — | 641,600 | ||||||||||||
Italy | 2,295,533 | — | — | 2,295,533 | ||||||||||||
Japan | 19,430,322 | — | — | 19,430,322 | ||||||||||||
Malaysia | 22,183 | — | — | 22,183 | ||||||||||||
Mexico | 1,301,995 | — | — | 1,301,995 | ||||||||||||
Netherlands | 11,484 | — | — | 11,484 | ||||||||||||
New Zealand | 409,310 | — | — | 409,310 | ||||||||||||
Norway | 271,100 | — | — | 271,100 | ||||||||||||
Philippines | — | 293,808 | — | 293,808 | ||||||||||||
Poland | 33,145 | — | — | 33,145 | ||||||||||||
Portugal | 842,928 | — | — | 842,928 | ||||||||||||
Russia | — | — | —^ | —^ | ||||||||||||
Singapore | 5,763 | — | — | 5,763 | ||||||||||||
South Africa | 942,828 | — | — | 942,828 | ||||||||||||
South Korea | 2,670,627 | — | — | 2,670,627 | ||||||||||||
Spain | 2,336,364 | — | — | 2,336,364 | ||||||||||||
Sweden | 568,475 | — | — | 568,475 | ||||||||||||
Switzerland | 760,528 | — | — | 760,528 | ||||||||||||
Taiwan | 1,983,925 | — | — | 1,983,925 | ||||||||||||
Turkey | 101,532 | — | — | 101,532 | ||||||||||||
United Kingdom | 930,603 | — | — | 930,603 | ||||||||||||
United States | 102,494,329 | — | — | 102,494,329 | ||||||||||||
|
|
|
|
|
|
|
| |||||||||
Total Common Stock | 151,234,949 | 992,571 | — | 152,227,520 | ||||||||||||
|
|
|
|
|
|
|
| |||||||||
Corporate Obligations | — | 63,287,485 | — | 63,287,485 | ||||||||||||
U.S. Treasury Obligations | — | 57,671,651 | — | 57,671,651 | ||||||||||||
Exchange Traded Funds | 7,211,064 | — | — | 7,211,064 | ||||||||||||
Preferred Stock | 36,891 | — | — | 36,891 | ||||||||||||
Right | 297 | — | — | 297 | ||||||||||||
|
|
|
|
|
|
|
| |||||||||
Total Investments in Securities | $ | 158,483,201 | $ | 121,951,707 | $ | — | $ | 280,434,908 | ||||||||
|
|
|
|
|
|
|
| |||||||||
The accompanying notes are an integral part of the financial statements.
26
THE ADVISORS’ INNER CIRCLE FUND III | PINEBRIDGE DYNAMIC | |
| ASSET ALLOCATION FUND | ||
| OCTOBER 31, 2022 |
| Other Financial Instruments | Level 1 | Level 2 | Level 3 | Total | ||||||||||||
|
|
|
|
|
|
|
|
|
| |||||||
Futures Contracts* | ||||||||||||||||
Unrealized Appreciation | $ | 2,422,006 | $ | – | $ | – | $ | 2,422,006 | ||||||||
Unrealized Depreciation | (7,820,391 | ) | – | – | (7,820,391 | ) | ||||||||||
Forward Foreign Currency | ||||||||||||||||
Contracts* | ||||||||||||||||
Unrealized Appreciation | – | 2,076,876 | – | 2,076,876 | ||||||||||||
Unrealized Depreciation | – | (3,525,306 | ) | – | (3,525,306 | ) | ||||||||||
|
|
|
|
|
|
|
|
|
|
|
| |||||
Total Other Financial Instruments | $ | (5,398,385 | ) | $ | (1,448,430 | ) | $ | – | $ | (6,846,815 | ) | |||||
|
|
|
|
|
|
|
|
|
|
|
| |||||
| (1) | A reconciliation of Level 3 investments and disclosures of significant unobservable inputs are presented when the Fund has a significant amount of Level 3 investments at the beginning and/or end of the period in relation to Net Assets. Management has concluded that Level 3 investments are not material in relation to Net Assets. |
| ^ | This category includes securities with a value of $0. |
| * | Forward foreign currency contracts and futures contracts are valued at the unrealized appreciation (depreciation) on the instrument. |
Amounts designated as “—” are $0.
For more information on valuation inputs, see Note 2 – Significant Accounting Policies in the Notes to Financial Statements.
The accompanying notes are an integral part of the financial statements.
27
THE ADVISORS’ INNER CIRCLE FUND III | PINEBRIDGE DYNAMIC | |
| ASSET ALLOCATION FUND | ||
| OCTOBER 31, 2022 |
| STATEMENT OF ASSETS AND LIABILITIES |
Assets: | ||||
Investments, at Value (Cost $295,848,157) | $ | 280,434,908 | ||
Foreign Currency, at Value (Cost $1,611,323) | 1,625,843 | |||
Cash and Cash Equivalents | 97,672,663 | |||
Cash Pledged as Collateral for Futures Contracts | 10,073,836 | |||
Cash Pledged as Collateral for Forward Foreign Currency Contracts | 5,050,000 | |||
Unrealized Appreciation on Forward Foreign Currency Contracts | 2,076,876 | |||
Dividend and Interest Receivable | 1,315,533 | |||
Variation Margin Receivable | 443,787 | |||
Reclaim Receivable | 183,154 | |||
Receivable for Capital Shares Sold | 14,004 | |||
Receivable for Investment Securities Sold | 6,824 | |||
Unrealized Appreciation on Foreign Spot Currency Contracts | 52 | |||
Other Prepaid Expenses | 10,803 | |||
|
|
| ||
Total Assets | 398,908,283 | |||
|
|
| ||
Liabilities: | ||||
Unrealized Depreciation on Forward Foreign Currency Contracts | 3,525,306 | |||
Variation Margin Payable | 1,232,285 | |||
Cash Collateral for Futures due to Broker | 283,116 | |||
Payable due to Investment Adviser | 171,726 | |||
Payable due to Administrator | 40,398 | |||
Shareholder Servicing Fees Payable | 8,663 | |||
Accrued Foreign Capital Gains Tax on Appreciated Securities | 4,723 | |||
Chief Compliance Officer Fees Payable | 2,543 | |||
Payable for Capital Shares Redeemed | 83 | |||
Payable due to Trustees | 35 | |||
Other Accrued Expenses and Other Payables | 142,834 | |||
|
|
| ||
Total Liabilities | 5,411,712 | |||
|
|
| ||
Net Assets | $ | 393,496,571 | ||
|
|
| ||
NET ASSETS CONSIST OF: | ||||
Paid-in Capital | $ | 465,651,552 | ||
Total Accumulated Losses | (72,154,981 | ) | ||
|
|
| ||
Net Assets | $ | 393,496,571 | ||
|
|
| ||
Institutional Shares: | ||||
Net Assets | $ | 388,513,478 | ||
Outstanding Shares of beneficial interest (unlimited authorization - no par value) | 39,131,336 | |||
Net Asset Value, Offering and Redemption Price Per Share | $ | 9.93 | ||
|
|
| ||
Investor Servicing Shares: | ||||
Net Assets | $ | 4,983,093 | ||
Outstanding Shares of beneficial interest (unlimited authorization - no par value) | 501,966 | |||
Net Asset Value, Offering and Redemption Price Per Share | $ | 9.93 | ||
|
|
|
The accompanying notes are an integral part of the financial statements.
28
THE ADVISORS’ INNER CIRCLE FUND III | PINEBRIDGE DYNAMIC | |
| ASSET ALLOCATION FUND | ||
| STATEMENT OF OPERATIONS |
| Year Ended October 31, 2022 | ||||
Investment Income: | ||||
Dividends | $ | 3,029,151 | ||
Interest | 5,539,510 | |||
Less: Foreign Taxes Withheld | (233,519) | |||
|
| |||
Total Investment Income | 8,335,142 | |||
|
| |||
Expenses: | ||||
Investment Advisory Fees | 3,110,676 | |||
Administration Fees | 497,710 | |||
Trustees’ Fees | 20,437 | |||
Shareholder Servicing Fees, Investor Shares | 8,768 | |||
Chief Compliance Officer Fees | 7,844 | |||
Custodian Fees | 118,125 | |||
Transfer Agent Fees | 67,697 | |||
Registration and Filing Fees | 67,013 | |||
Pricing Fees | 56,346 | |||
Legal Fees | 37,328 | |||
Printing Fees | 36,787 | |||
Audit Fees | 25,480 | |||
Other Expenses | 55,735 | |||
|
| |||
Total Expenses | 4,109,946 | |||
|
| |||
Less: | ||||
Waiver of Investment Advisory Fees | (990,512) | |||
|
| |||
Net Expenses | 3,119,434 | |||
|
| |||
Net Investment Income | 5,215,708 | |||
|
| |||
Net Realized Gain (Loss) on: | ||||
Investments (net of Foreign Capital Gains Tax on Appreciated Securities of $(2,014)) | (38,879,577) | |||
Futures Contracts | (11,439,018) | |||
Forward Foreign Currency Contracts | (7,775,643) | |||
Foreign Currency Transactions | (492,703) | |||
|
| |||
Net Realized Loss | (58,586,941) | |||
|
| |||
The accompanying notes are an integral part of the financial statements.
29
THE ADVISORS’ INNER CIRCLE FUND III | PINEBRIDGE DYNAMIC | |
| ASSET ALLOCATION FUND | ||
| STATEMENT OF OPERATIONS |
| Year Ended October 31, 2022 | ||||
Net Change in Unrealized Appreciation (Depreciation) on: | ||||
Investments | (48,223,431) | |||
Futures Contracts | (5,023,363) | |||
Foreign Capital Gains Tax on Appreciated Securities | 55,326 | |||
Forward Foreign Currency Contracts | (1,091,358) | |||
Foreign Currency Transactions and Translation of Other Assets and Liabilities Denominated in Foreign Currencies | (20,904) | |||
|
|
| ||
Net Change in Unrealized Appreciation (Depreciation) | (54,303,730) | |||
|
|
| ||
Net Realized and Unrealized Loss on Investments, Futures Contracts, | ||||
Foreign Capital Gains Tax on Appreciated Securities, Forward Foreign Currency Contracts and Foreign Currency Transactions and Translation of Other Assets and Liabilities Denominated in Foreign Currencies | (112,890,671) | |||
|
|
| ||
Net Decrease in Net Assets Resulting from Operations | $ | (107,674,963) | ||
|
|
| ||
The accompanying notes are an integral part of the financial statements.
30
THE ADVISORS’ INNER CIRCLE FUND III | PINEBRIDGE DYNAMIC | |
| ASSET ALLOCATION FUND | ||
| STATEMENTS OF CHANGES IN NET ASSETS |
| Year Ended October 31, 2022 | Year Ended October 31, 2021 | |||||||
Operations: | ||||||||
Net Investment Income | $ | 5,215,708 | $ | 2,291,988 | ||||
Net Realized Gain (Loss) | (58,586,941 | ) | 34,445,069 | |||||
Net Change in Unrealized Appreciation (Depreciation) | (54,303,730 | ) | 13,348,046 | |||||
|
|
|
|
|
| |||
Net Increase (Decrease) in Net Assets Resulting From Operations | (107,674,963 | ) | 50,085,103 | |||||
|
|
|
|
|
| |||
Distributions: | ||||||||
Institutional Shares | (26,063,584 | ) | (2,751,544 | ) | ||||
Investor Servicing Shares | (333,355 | ) | (239,597 | ) | ||||
|
|
|
|
|
| |||
Total Distributions | (26,396,939 | ) | (2,991,141 | ) | ||||
|
|
|
|
|
| |||
Capital Share Transactions:(1) | ||||||||
Institutional Shares | ||||||||
Issued | 288,940,688 | 3,979,330 | ||||||
Reinvestment of Distributions | 25,867,199 | 2,702,498 | ||||||
Redeemed | (19,344,900 | ) | (20,022,810 | ) | ||||
|
|
|
|
|
| |||
Net Institutional Shares Transactions | 295,462,987 | (13,340,982 | ) | |||||
|
|
|
|
|
| |||
Investor Servicing Shares | ||||||||
Issued | 353,532 | 1,456,002 | ||||||
Reinvestment of Distributions | 322,444 | 236,731 | ||||||
Redeemed | (597,397 | ) | (16,210,450 | ) | ||||
|
|
|
|
|
| |||
Net Investor Servicing Shares Transactions | 78,579 | (14,517,717 | ) | |||||
|
|
|
|
|
| |||
Net Increase (Decrease) in Net Assets From Capital Share Transactions | 295,541,566 | (27,858,699 | ) | |||||
|
|
|
|
|
| |||
Total Increase in Net Assets | 161,469,664 | 19,235,263 | ||||||
|
|
|
|
|
| |||
Net Assets: | ||||||||
Beginning of Year | 232,026,907 | 212,791,644 | ||||||
|
|
|
|
|
| |||
End of Year | $ | 393,496,571 | $ | 232,026,907 | ||||
|
|
|
|
|
| |||
| (1) | See Note 9 in the Notes to Financial Statements. |
The accompanying notes are an integral part of the financial statements.
31
THE ADVISORS’ INNER CIRCLE FUND III | PINEBRIDGE DYNAMIC | |
| ASSET ALLOCATION FUND | ||
| FINANCIAL HIGHLIGHTS |
| Selected Per Share Date & Ratios | ||
| For a Share Outstanding | ||
| Throughout Each Year | ||
| Institutional Shares | ||
| Year | Year | Year | Year | Year | ||||||||||||||||
| Ended | Ended | Ended | Ended | Ended | ||||||||||||||||
| October 31, | October 31, | October 31, | October 31, | October 31, | ||||||||||||||||
| 2022 | 2021 | 2020 | 2019 | 2018 | ||||||||||||||||
Net Asset Value, Beginning of Year | $ | 13.56 | $ | 11.08 | $ | 10.87 | $ | 10.56 | $ | 11.59 | ||||||||||
|
|
|
|
|
|
|
|
|
| |||||||||||
Income (Loss) from Investment | ||||||||||||||||||||
Operations: | ||||||||||||||||||||
Net Investment Income* | 0.14 | 0.12 | 0.13 | 0.20 | 0.16 | |||||||||||||||
Net Realized and Unrealized Gain (Loss) | (3.07) | 2.52 | 0.25 | 0.37 | (0.54) | |||||||||||||||
|
|
|
|
|
|
|
|
|
| |||||||||||
Total from Investment Operations | (2.93) | 2.64 | 0.38 | 0.57 | (0.38) | |||||||||||||||
|
|
|
|
|
|
|
|
|
| |||||||||||
Dividends and Distributions: | ||||||||||||||||||||
Net Investment Income | (0.04) | (0.16) | (0.17) | (0.03) | (0.21) | |||||||||||||||
Net Realized Gains | (0.66) | – | – | (0.23) | (0.44) | |||||||||||||||
|
|
|
|
|
|
|
|
|
| |||||||||||
Total Dividends and Distributions | (0.70) | (0.16) | (0.17) | (0.26) | (0.65) | |||||||||||||||
|
|
|
|
|
|
|
|
|
| |||||||||||
Net Asset Value, End of Year | $ | 9.93 | $ | 13.56 | $ | 11.08 | $ | 10.87 | $ | 10.56 | ||||||||||
|
|
|
|
|
|
|
|
|
| |||||||||||
Total Return† | (22.75)% | 23.94% | 3.46% | 5.66% | (3.60)% | |||||||||||||||
|
|
|
|
|
|
|
|
|
| |||||||||||
Ratios and Supplemental Data | ||||||||||||||||||||
Net Assets, End of Year (Thousands) | $388,514 | $225,285 | $195,263 | $207,452 | $204,939 | |||||||||||||||
Ratio of Expenses to Average Net Assets | 0.75% | 0.75% | 0.75% | 0.75% | 0.67% | |||||||||||||||
Ratio of Expenses to Average Net Assets (Excluding Waivers and Reimbursements) | 0.99% | 1.05% | 1.13% | 1.13% | 1.13% | |||||||||||||||
Ratio of Net Investment Income to Average Net Assets | 1.26% | 0.95% | 1.24% | 1.88% | 1.46% | |||||||||||||||
Portfolio Turnover Rate | 145% | 130% | 144% | 119% | 109% | |||||||||||||||
Amounts designated as “—” are either not applicable, $0 or have been rounded to $0. |
| * | Per share calculations were performed using average shares for the period. |
| † | Total return is for the period indicated and has not been annualized. Returns shown do not reflect the deductions of taxes that a shareholder would pay on Fund distributions or the redemption of Fund shares. |
The accompanying notes are an integral part of the financial statements.
32
THE ADVISORS’ INNER CIRCLE FUND III | PINEBRIDGE DYNAMIC | |
| ASSET ALLOCATION FUND | ||
| FINANCIAL HIGHLIGHTS (continued) |
| Selected Per Share Date & Ratios | ||
| For a Share Outstanding | ||
| Throughout Each Year | ||
| Investor Servicing Shares | ||
| Year | Year | Year | Year | Year | ||||||||||||||||
| Ended | Ended | Ended | Ended | Ended | ||||||||||||||||
| October 31, | October 31, | October 31, | October 31, | October 31, | ||||||||||||||||
| 2022 | 2021 | 2020 | 2019 | 2018 | ||||||||||||||||
Net Asset Value, Beginning of Year | $ | 13.55 | $ | 11.07 | $ | 10.86 | $ | 10.55 | $ | 11.60 | ||||||||||
|
|
|
|
|
|
|
|
|
| |||||||||||
Income (Loss) from Investment | ||||||||||||||||||||
Operations: | ||||||||||||||||||||
Net Investment Income* | 0.12 | 0.12 | 0.12 | 0.18 | 0.16 | |||||||||||||||
Net Realized and Unrealized Gain (Loss) | (3.06) | 2.51 | 0.25 | 0.38 | (0.57) | |||||||||||||||
|
|
|
|
|
|
|
|
|
| |||||||||||
Total from Investment Operations | (2.94) | 2.63 | 0.37 | 0.56 | (0.41) | |||||||||||||||
|
|
|
|
|
|
|
|
|
| |||||||||||
Dividends and Distributions: | ||||||||||||||||||||
Net Investment Income | (0.02) | (0.15) | (0.16) | (0.02) | (0.20) | |||||||||||||||
Net Realized Gains | (0.66) | – | – | (0.23) | (0.44) | |||||||||||||||
|
|
|
|
|
|
|
|
|
| |||||||||||
Total Dividends and Distributions | (0.68) | (0.15) | (0.16) | (0.25) | (0.64) | |||||||||||||||
|
|
|
|
|
|
|
|
|
| |||||||||||
Net Asset Value, End of Year | $ | 9.93 | $ | 13.55 | $ | 11.07 | $ | 10.86 | $ | 10.55 | ||||||||||
|
|
|
|
|
|
|
|
|
| |||||||||||
Total Return† | (22.83)% | 23.85% | 3.34% | 5.58% | (3.81)% | |||||||||||||||
|
|
|
|
|
|
|
|
|
| |||||||||||
Ratios and Supplemental Data | ||||||||||||||||||||
Net Assets, End of Year (Thousands) | $4,983 | $6,742 | $17,529 | $16,053 | $3,119 | |||||||||||||||
Ratio of Expenses to Average Net Assets | 0.90% | 0.81% | 0.87% | 0.90% | 0.87% | |||||||||||||||
Ratio of Expenses to Average Net Assets (Excluding Waivers and Reimbursements) | 1.14% | 1.11% | 1.25% | 1.28% | 1.30% | |||||||||||||||
Ratio of Net Investment Income to Average Net Assets | 1.04% | 0.94% | 1.11% | 1.69% | 1.39% | |||||||||||||||
Portfolio Turnover Rate | 145% | 130% | 144% | 119% | 109% | |||||||||||||||
Amounts designated as “—” are either not applicable, $0 or have been rounded to $0. |
| * | Per share calculations were performed using average shares for the period. |
| † | Total return is for the period indicated and has not been annualized. Returns shown do not reflect the deductions of taxes that a shareholder would pay on Fund distributions or the redemption of Fund shares. |
The accompanying notes are an integral part of the financial statements.
33
| THE ADVISORS’ INNER CIRCLE FUND III | PINEBRIDGE DYNAMIC | |
| ASSET ALLOCATION FUND | ||
| OCTOBER 31, 2022 | ||
| NOTES TO FINANCIAL STATEMENTS |
1. Organization:
The Advisors’ Inner Circle Fund III (the “Trust”) is organized as a Delaware statutory trust under a Declaration of Trust dated December 4, 2013. The Trust is registered under the Investment Company Act of 1940, as amended, as an open-end management investment company with 65 funds. The financial statements herein are those of the PineBridge Dynamic Asset Allocation Fund (the “Fund”). The investment objective of the Fund is to seek total return. The Fund is classified as a diversified investment company. PineBridge Investments LLC serves as the Fund’s investment adviser (the “Adviser”). The Fund currently offers Institutional Shares and Investor Servicing Shares. The Fund commenced operations on March 2, 2016. The financial statements of the remaining funds of the Trust are presented separately. The assets of each fund are segregated, and a shareholder’s interest is limited to the fund in which shares are held.
2. Significant Accounting Policies:
The following are significant accounting policies, which are consistently followed in the preparation of the financial statements of the Fund. The Fund is an investment company that applies the accounting and reporting guidance issued in Topic 946 by the U.S. Financial Accounting Standards Board (“FASB”).
Use of Estimates — The preparation of financial statements in conformity with U.S. GAAP requires management to make estimates and assumptions that affect the fair value of assets and liabilities and disclosure of contingent assets and liabilities at the date of the financial statements and the reported amounts of revenues and expenses during the reporting period. Actual results could differ from those estimates and such differences could be material.
Security Valuation — Securities listed on a securities exchange, market or automated quotation system for which quotations are readily available (except for securities traded on NASDAQ), including securities traded over the counter, are valued at the last quoted sale price on an exchange or market (foreign or domestic) on which they are traded on the valuation date (or at approximately 4:00 pm Eastern Standard Time if a security’s primary exchange is normally open at that time), or, if there is no such reported sale on the valuation date, at the most recent quoted bid price. For securities traded on NASDAQ, the NASDAQ Official Closing Price will be used. If available, debt securities are priced based upon valuations provided by independent, third-party pricing agents. Such values generally reflect the last reported sales price if the security is actively traded. The third-party pricing agents may also value debt securities at an evaluated bid price by employing methodologies that utilize actual market transactions, broker supplied valuations, or other methodologies designed to identify the market
34
THE ADVISORS’ INNER CIRCLE FUND III | PINEBRIDGE DYNAMIC | |
| ASSET ALLOCATION FUND | ||
| OCTOBER 31, 2022 | ||
value for such securities. Such methodologies generally consider such factors as security prices, yields, maturities, call features, ratings and developments relating to specific securities in arriving at valuations. On the first day a new debt security purchase is recorded, if a price is not available on the automated pricing feeds from our primary and secondary pricing vendors nor is it available from an independent broker, the security may be valued at its purchase price. Each day thereafter, the debt security will be valued according to the Trusts’ Fair Value Procedures until an independent source can be secured. Debt obligations with remaining maturities of sixty days or less may be valued at their amortized cost, which approximates market value provided that it is determined the amortized cost continues to approximate fair value. Should existing credit, liquidity or interest rate conditions in the relevant markets and issuer specific circumstances suggest that amortized cost does not approximate fair value, then the amortized cost method may not be used. The prices for foreign securities are reported in local currency and converted to U.S. dollars using currency exchange rates.
Securities for which market prices are not “readily available” are required to be fair valued under the 1940 Act.
In December 2020, the SEC adopted Rule 2a-5 under the 1940 Act, establishing requirements to determine fair value in good faith for purposes of the 1940 Act. The rule permits fund boards to designate a fund’s investment adviser to perform fair-value determinations, subject to board oversight and certain other conditions. The rule also defines when market quotations are “readily available” for purposes of the 1940 Act and requires a fund to fair value a portfolio investment when a market quotation is not readily available. The SEC also adopted new Rule 31a-4 under the 1940 Act, which sets forth recordkeeping requirements associated with fair-value determinations. The compliance date for Rule 2a-5 and Rule 31a-4 was September 8, 2022.
Effective September 8, 2022, and pursuant to the requirements of Rule 2a-5, the Trust’s Board of Trustees (the “Board”) designated the Adviser as the Board’s valuation designee to perform fair-value determinations for the Fund through a Fair Value Committee (the “Committee”) established by the Adviser and approved new Adviser Fair Value Procedures for the Fund. Prior to September 8, 2022, fair-value determinations were performed in accordance with the Trust’s Fair Value Procedures established by the Fund’s Board and were implemented through the Committee designated by the Board.
Some of the more common reasons that may necessitate that a security be valued using Fair Value Procedures include: the security’s trading has been halted or suspended; the security has been de-listed from a national exchange; the security’s primary trading market is temporarily closed at a time when under normal conditions it would be open; the security has not been traded for
35
THE ADVISORS’ INNER CIRCLE FUND III | PINEBRIDGE DYNAMIC | |
| ASSET ALLOCATION FUND | ||
| OCTOBER 31, 2022 | ||
an extended period of time; the security’s primary pricing source is not able or willing to provide a price; or trading of the security is subject to local government imposed restrictions. When a security is valued in accordance with the Fair Value Procedures, the Committee will determine the value after taking into consideration relevant information reasonably available to the Committee.
Futures contracts that are traded on an exchange are valued at their last reported sales price as of the valuation date.
For securities that principally trade on a foreign market or exchange, a significant gap in time can exist between the time of a particular security’s last trade and the time at which the Fund calculates its net asset value. The closing prices of such securities may no longer reflect their market value at the time the Fund calculates its net asset value if an event that could materially affect the value of those securities (a “Significant Event”) has occurred between the time of the security’s last close and the time that the Fund calculates net asset value. A Significant Event may relate to a single issuer or to an entire market sector. If the Adviser of the Fund becomes aware of a Significant Event that has occurred with respect to a security or group of securities after the closing of the exchange or market on which the security or securities principally trade, but before the time at which the Fund calculates its net asset value, it may request that a Committee meeting be called.
The Fund uses Intercontinental Exchange Data Pricing & Reference Data, LLC (“ICE”) as a third party fair valuation vendor when the fair value trigger is met. ICE provides a fair value for foreign securities in the Fund based on certain factors and methodologies (involving, generally, tracking valuation correlations between the U.S. market and each non-U.S. security) applied by ICE in the event that there is a movement in the U.S. market that exceeds a specific threshold established by the Committee. The Committee establishes a “confidence interval” which is used to determine the level of correlation between the value of a foreign security and movements in the U.S. market before a particular security is fair valued when the threshold is exceeded. In the event that the threshold established by the Committee is exceeded on a specific day, the Fund values its non-U.S. securities that exceed the applicable “confidence interval” based upon the fair values provided by ICE. In such event, it is not necessary to hold a Committee meeting. In the event that the Adviser believes that the fair values provided by ICE are not reliable, the Adviser contacts SEI Investments Global Fund Services (the “Administrator”) and may request that a meeting of the Committee be held.
If a local market in which the Fund owns securities is closed for one or more days, the Fund shall value all securities held in that corresponding currency based on the fair value prices provided by ICE using the predetermined confidence interval discussed above.
36
THE ADVISORS’ INNER CIRCLE FUND III | PINEBRIDGE DYNAMIC | |
| ASSET ALLOCATION FUND | ||
| OCTOBER 31, 2022 | ||
In accordance with U.S. GAAP, the Fund discloses fair value of its investments in a hierarchy that prioritizes the inputs to valuation techniques used to measure the fair value. The objective of a fair value measurement is to determine the price that would be received to sell an asset or paid to transfer a liability in an orderly transaction between market participants at the measurement date (an exit price). Accordingly, the fair value hierarchy gives the highest priority to quoted prices (unadjusted) in active markets for identical assets or liabilities (Level 1) and the lowest priority to unobservable inputs (Level 3). The three levels of the fair value hierarchy are described below:
| • | Level 1 — Unadjusted quoted prices in active markets for identical, unrestricted assets or liabilities that the Fund has the ability to access at the measurement date; |
| • | Level 2 — Other significant observable inputs (includes quoted prices for similar securities, interest rates, prepayment speeds, credit risk, referenced indices, quoted prices in inactive markets, adjusted quoted prices in active markets, adjusted quoted prices on foreign equity securities that were adjusted in accordance with the Adviser’s pricing procedures, etc.); and |
| • | Level 3 — Prices, inputs or exotic modeling techniques which are both significant to the fair value measurement and unobservable (supported by little or no market activity). |
Investments are classified within the level of the lowest significant input considered in determining fair value. Investments classified within Level 3 whose fair value measurement considers several inputs may include Level 1 or Level 2 inputs as components of the overall fair value measurement.
For the year ended October 31, 2022, there have been no significant changes to the Fund’s fair valuation methodology.
Federal Income Taxes — It is the Fund’s intention to continue to qualify as a regulated investment company for Federal income tax purposes by complying with the appropriate provisions of Subchapter M of the Internal Revenue Code of 1986, as amended. Accordingly, no provisions for Federal income taxes have been made in the financial statements.
The Fund evaluates tax positions taken or expected to be taken in the course of preparing the Fund’s tax returns to determine whether it is “more-likely than-not” (i.e., greater than 50-percent) that each tax position will be sustained upon examination by a taxing authority based on the technical merits of the position. Tax positions not deemed to meet the more-likely-than-not threshold are recorded as a tax benefit or expense in the current year. The Fund did not record any tax provision in the current period. However, management’s conclusions regarding tax positions taken may be subject to review and adjustment at a later date based
37
THE ADVISORS’ INNER CIRCLE FUND III | PINEBRIDGE DYNAMIC | |
| ASSET ALLOCATION FUND | ||
| OCTOBER 31, 2022 | ||
on factors including, but not limited to, examination by tax authorities (i.e., the last 3 year ends, as applicable), on-going analysis of and changes to tax laws, regulations and interpretations thereof.
As of and during the year ended October 31, 2022, the Fund did not have a liability for any unrecognized tax benefits. The Fund recognizes interest and penalties, if any, related to unrecognized tax benefits as income tax expense in the Statement of Operations. During year ended October 31, 2022, the Fund did not incur any significant interest or penalties.
Security Transactions and Investment Income — Security transactions are accounted for on trade date. Costs used in determining realized gains and losses on the sale of investment securities are based on the specific identification method. Dividend income and expense are recorded on the ex-dividend date. Interest income is recognized on the accrual basis from settlement date and includes the amortization of premiums and the accretion of discount. Certain dividends from foreign securities will be recorded as soon as the Fund is informed of the dividend if such information is obtained subsequent to the ex-dividend date. Discounts and premiums on fixed income securities are accreted and amortized using the effective interest method. Realized gains (losses) on paydowns of mortgage-backed and asset-backed securities are recorded as an adjustment to interest income.
Foreign Currency Translation — The books and records of the Fund are maintained in U.S. dollars. Investment securities and other assets and liabilities denominated in a foreign currency are translated into U.S. dollars on the date of valuation. The Fund does not isolate that portion of realized or unrealized gains and losses resulting from changes in the foreign exchange rate from fluctuations arising from changes in the market prices of the securities. These gains and losses are included in net realized and unrealized gains and losses on investments on the Statement of Operations. Net realized and unrealized gains and losses on foreign currency transactions represent net foreign exchange gains or losses from foreign currency exchange contracts, disposition of foreign currencies, currency gains or losses realized between trade and settlement dates on securities transactions and the difference between the amount of the investment income and foreign withholding taxes recorded on the Fund’s books and the U.S. dollar equivalent of the amounts actually received or paid.
Forward Foreign Currency Contracts — The Fund enters into forward foreign currency contracts to protect the value of securities held and related receivables and payables against changes in future foreign exchange rates. A forward foreign currency contract is an agreement between two parties to buy and sell currency at a set price on a future date. The market value of the contract will fluctuate with changes in currency exchange rates. The contract is marked-to-market daily
38
THE ADVISORS’ INNER CIRCLE FUND III | PINEBRIDGE DYNAMIC | |
| ASSET ALLOCATION FUND | ||
| OCTOBER 31, 2022 | ||
|
using the current forward rate and the change in market value is recorded by the Fund as unrealized gain or loss. The Fund recognizes realized gains or losses when the contract is closed, equal to the difference between the value of the contract at the time it was opened and the value at the time it was closed. Any realized or unrealized appreciation (depreciation) during the year is presented on the Statement of Operations. Risks may arise from unanticipated movements in the value of a foreign currency relative to the U.S. dollar. Risks may also arise upon entering into these contracts from the potential inability of counterparties to meet the terms of their contracts and are generally limited to the amount of unrealized gain on the contracts at the date of default. Refer to the Fund’s Schedule of Investments for details regarding open forward foreign currency contracts as of October 31, 2022.
For the year ended October 31, 2022, the average quarterly balances of forward foreign currency contracts were as follows:
Average Quarterly Notional Contracts Purchased | $ | (134,807,261 | ) | |||||
Average Quarterly Notional Contracts Sold | $ | 57,539,195 |
Futures Contracts — The Fund utilized futures contracts during the year ended October 31, 2022. To the extent consistent with its investment objective and strategies, the Fund may use futures contracts for tactical hedging purposes as well as to enhance the Fund’s returns. Initial margin deposits of cash or securities are made upon entering into futures contracts. The futures contracts are valued at the settlement price established each day by the board of exchange on which they are traded. The futures contracts are marked to market daily and the resulting changes in value are accounted for as unrealized gains and losses. Variation margin payments are paid or received, depending upon whether unrealized gains or losses are incurred. When the futures contract is closed, the Fund records a realized gain or loss equal to the difference between the proceeds from (or cost of) the closing transaction and the amount invested in the futures contract.
Risks of entering into futures contracts include the possibility that there will be an imperfect price correlation between the futures and the underlying securities. Second, it is possible that a lack of liquidity for futures contracts could exist in the secondary market, resulting in an inability to close a position prior to its maturity date. Third, the futures contract involves the risk that a Fund could lose more than the original margin deposit required to initiate a futures transaction.
Finally, the risk exists that losses could exceed amounts disclosed on the Statement of Assets and Liabilities. Refer to the Fund’s Schedule of Investments for details regarding open futures contracts as of October 31, 2022.
39
THE ADVISORS’ INNER CIRCLE FUND III | PINEBRIDGE DYNAMIC | |
| ASSET ALLOCATION FUND | ||
| OCTOBER 31, 2022 | ||
|
For the year ended October 31, 2022, the average quarterly notional amount of futures contracts held were as follows:
Average Quarterly Notional Balance Long | $ | 55,392,993 | ||||||
Average Quarterly Notional Balance Short | $ | (57,233,040 | ) |
Investments in Real Estate Investment Trusts (“REITs”) — Dividend income from REITs is recorded based on the income included in distributions received from the REIT investments using published REIT reclassifications, including some management estimates when actual amounts are not available. Distributions received in excess of this estimated amount are recorded as a reduction of the cost of investments or reclassified to capital gains. The actual amounts of income, return of capital, and capital gains are only determined by each REIT after its fiscal year-end, and may differ from the estimated amounts.
Master Limited Partnerships — Entities commonly referred to as “MLPs” are generally organized under state law as limited partnerships or limited liability companies. The Funds intend to primarily invest in MLPs receiving partnership taxation treatment under the Internal Revenue Code of 1986 (the “Code”), and whose interests or “units” are traded on securities exchanges like shares of corporate stock. To be treated as a partnership for U.S. federal income tax purposes, an MLP whose units are traded on a securities exchange must receive at least 90% of its income from qualifying sources such as interest, dividends, real estate rents, gain from the sale or disposition of real property, income and gain from mineral or natural resources activities, income and gain from the transportation or storage of certain fuels, and, in certain circumstances, income and gain from commodities or futures, forwards and options with respect to commodities. Mineral or natural resources activities include exploration, development, production, processing, mining, refining, marketing and transportation (including pipelines) of oil and gas, minerals, geothermal energy, fertilizer, timber or industrial source carbon dioxide. An MLP consists of a general partner and limited partners (or in the case of MLPs organized as limited liability companies, a managing member and members). The general partner or managing member typically controls the operations and management of the MLP and has an ownership stake in the partnership. The limited partners or members, through their ownership of limited partner or member interests, provide capital to the entity, are intended to have no role in the operation and management of the entity and receive cash distributions. The MLPs themselves generally do not pay U.S. federal income taxes. Thus, unlike investors in corporate securities, direct MLP investors are generally not subject to double taxation (i.e., corporate level tax and tax on corporate dividends). Currently, most MLPs operate in the energy and/or natural resources sector.
40
THE ADVISORS’ INNER CIRCLE FUND III | PINEBRIDGE DYNAMIC | |
| ASSET ALLOCATION FUND | ||
| OCTOBER 31, 2022 | ||
|
Expenses — Most expenses of the Trust can be directly attributed to a particular fund. Expenses which cannot be directly attributed to a particular fund are apportioned among the funds of the Trust based on the number of funds and/or relative net assets.
Cash — Idle cash may be swept into various time deposit accounts and is classified as cash on the Statement of Assets and Liabilities. The Fund maintains cash in bank deposit accounts which, at times may exceed United States federally insured limits. Amounts invested are available on the same business day.
Dividends and Distributions to Shareholders — The Fund distributes substantially all of its net investment income annually. Any net realized capital gains are distributed annually. All distributions are recorded on the ex-dividend date.
3. Derivative Transactions:
The following tables include the Fund’s exposure by type of risk on derivatives held throughout the period.
The fair value of derivative instruments as of October 31, 2022, was as follows:
Asset Derivatives |
Liability Derivatives | |||||||||||||||||
Statement of Assets and Liability Location | Fair Value | Statement of Assets and Liability Location | Fair Value | |||||||||||||||
| Derivatives not accounted for as hedging instruments: | ||||||||||||||||||
Equity contracts | Unrealized appreciation on futures contracts | $ 2,422,006 | * | Unrealized depreciation on futures contracts | $ 1,512,571 | * | ||||||||||||
Interest rate contracts | Unrealized appreciation on futures contracts | — | * | Unrealized depreciation on futures contracts | 6,307,820 | * | ||||||||||||
Foreign exchange contracts | Unrealized appreciation on forward foreign currency contracts | 2,076,876 | Unrealized depreciation on forward foreign currency contracts | 3,525,306 | ||||||||||||||
|
|
|
| |||||||||||||||
Total | $ 4,498,882 | $11,345,697 | ||||||||||||||||
|
|
|
| |||||||||||||||
*Includes cumulative appreciation (depreciation) of futures contracts as reported in the Schedule of Investments. Only current day’s variation margin, if any, is reported within the Statement of Assets & Liabilities.
41
THE ADVISORS’ INNER CIRCLE FUND III | PINEBRIDGE DYNAMIC | |
| ASSET ALLOCATION FUND | ||
| OCTOBER 31, 2022 | ||
|
The effect of derivative instruments on the Statement of Operations for the year ended October 31, 2022, was as follows:
The amount of realized gain (loss) on derivatives recognized in income:
| Derivatives Not Accounted for as Hedging Instruments | Futures Contracts | Forward Foreign Currency Contracts | Total | |||||||||
Foreign exchange contracts | $ — | $(7,775,643) | $(7,775,643) | |||||||||
Equity contracts | (5,374,246) | — | (5,374,246 | |||||||||
Interest rate contracts | (6,064,772) | — | (6,064,772) | |||||||||
|
|
|
|
|
| |||||||
Total | $(11,439,018) | $(7,775,643) | $(19,214,661) | |||||||||
|
|
|
|
|
| |||||||
Change in unrealized appreciation (depreciation) on derivatives recognized in income:
| Derivatives Not Accounted for as Hedging Instruments | Futures Contracts | Forward Foreign Currency Contracts | Total | |||||||||
Foreign exchange contracts | $ — | $(1,091,358) | $(1,091,358) | |||||||||
Equity contracts | 1,131,592 | — | 1,131,592 | |||||||||
Interest rate contracts | (6,154,955) | — | (6,154,955) | |||||||||
|
|
|
|
|
| |||||||
Total | $(5,023,363) | $(1,091,358) | $(6,114,721) | |||||||||
|
|
|
|
|
| |||||||
4. Offsetting Assets and Liabilities:
The Fund is subject to various netting arrangements with select counterparties (“Master Agreements”). Master Agreements govern the terms of certain transactions, and reduce the counterparty risk associated with relevant transactions by specifying credit protection mechanisms and providing standardization that improves legal certainty. Since different types of transactions have different mechanics and are sometimes traded out of different legal entities of a particular counterparty organization, each type of transaction may be covered by a different Master Agreement, resulting in the need for multiple agreements with a single counterparty. As the Master Agreements are specific to unique operations of different asset types, they allow a Fund to close out and net its total exposure to a specific counterparty entity in the event of a default with respect to all the transactions governed under a single agreement with a specific counterparty entity.
Master Agreements can also help limit counterparty risk by specifying collateral posting arrangements at pre-arranged exposure levels. Under the Master Agreements, collateral is routinely transferred if the total net exposure to certain transactions (net of existing collateral already in place) governed under the relevant Master Agreement
42
THE ADVISORS’ INNER CIRCLE FUND III | PINEBRIDGE DYNAMIC | |
| ASSET ALLOCATION FUND | ||
| OCTOBER 31, 2022 | ||
with a counterparty in a given account exceeds a specified threshold, which typically ranges from zero to $250,000 depending on the counterparty and the type of Master Agreement. United States Treasury Securities and U.S. dollar cash are generally the preferred forms of collateral. Securities and cash pledged as collateral are reflected as assets on the Statement of Assets and Liabilities as either a component of investments at value (securities) or cash pledged as collateral for futures contracts (cash). The market value of any securities received as collateral is not reflected as a component of net asset value. A Fund’s overall exposure to counterparty risk can change substantially within a short period, as it is affected by each transaction subject to the relevant Master Agreement.
The following is a summary of derivatives subject to master netting agreements and the collateral (received)/pledged by counterparty in connection with the master netting agreements as of October 31, 2022:
| Counterparty | Gross Assets in the of Assets and Liabilities | Gross in the of Assets and Liabilities | Net Amount to be Offset | Collateral Pledged or (Received) † | Net Amount ‡ | |||||||||||||||||||||||||||||||||||
| Forward Foreign | ||||||||||||||||||||||||||||||||||||||||
| Currency Contracts | ||||||||||||||||||||||||||||||||||||||||
Morgan Stanley | $ | 2,076,875 | $ | (3,525,306 | ) | $ | (1,448,430 | ) | $ | 1,448,430 | $ | — | ||||||||||||||||||||||||||||
Total | $ | 2,076,875 | $ | (3,525,306 | ) | $ | (1,448,430 | ) | $ | 1,448,430 | $ | — | ||||||||||||||||||||||||||||
† Collateral pledged is limited to the net outstanding amount due to/from the counterparty. The actual collateral amounts pledged may exceed these amounts and may fluctuate in value.
‡ Represents receivable from/payable to counterparty in the event of default.
International Swaps and Derivatives Association, Inc. Master Agreements and Credit Support Annexes (“ISDA Master Agreements”) govern OTC financial derivative transactions entered into by a Fund and select counterparties. ISDA Master Agreements maintain provisions for general obligations, representations, agreements, collateral and events of default or termination. Events of termination include conditions that may entitle counterparties to elect to terminate early and cause settlement of all outstanding transactions under the applicable ISDA Master Agreement. Any election to terminate early could be material to the financial statements. In limited circumstances, the ISDA Master Agreement may contain additional provisions that add additional counterparty protection beyond coverage of existing daily exposure if the counterparty has a decline in credit quality below a predefined level. These amounts, if any, may be segregated with a third party custodian.
43
THE ADVISORS’ INNER CIRCLE FUND III | PINEBRIDGE DYNAMIC | |
| ASSET ALLOCATION FUND | ||
| OCTOBER 31, 2022 | ||
5. Transactions with Affiliates:
Certain officers of the Trust are also employees of SEI Investments Global Funds Services (the “Administrator”), a wholly owned subsidiary of SEI Investments Company, and/or SEI Investments Distribution Co. (the “Distributor”). Such officers are paid no fees by the Trust, other than the Chief Compliance Officer (“CCO”) as described below, for serving as officers of the Trust.
The services provided by the (“CCO”) and his staff are paid for by the Trust as incurred. The services include regulatory oversight of the Trust’s Advisors and service providers as required by SEC regulations. The CCO’s services and fees have been approved by and are reviewed by the Board.
6. Administration, Distribution, Shareholder Servicing, Custodian and Transfer Agent Agreements:
The Fund and the Administrator are parties to an Administration Agreement under which the Administrator provides administration services to the Fund. For these services, the Administrator is paid an asset based fee, which will vary depending on the number of share classes and the average daily net assets of the Fund. For the year ended October 31, 2022, the Fund paid $497,710 for these services.
The Fund has adopted a shareholder servicing plan (the “Service Plan”) under which a shareholder servicing fee of up to 0.15% of average daily net assets of Investor Servicing Shares of the Fund will be paid to other service providers. Under the Service Plan, other service providers may perform, or may compensate other service providers for performing certain shareholder and administrative services. For the year ended October 31, 2022, the Investor Servicing Shares incurred $8,768 for these services. Brown Brothers Harriman & Co. acts as custodian (the “Custodian”) for the Fund. The Custodian plays no role in determining the investment policies of the Fund or which securities are to be purchased or sold by the Fund.
Apex Fund Services serves as the transfer agent and dividend disbursing agent for the Fund under a transfer agency agreement with the Trust.
7. Investment Advisory Agreement:
Under the terms of an investment advisory agreement, the Adviser provides investment advisory services to the Fund at a fee calculated at an annual rate of 0.75% of the Fund’s average daily net assets. The Adviser had contractually agreed to reduce fees and/or reimburse expenses to the extent necessary to keep total annual Fund operating expenses after fee reductions and/or expense reimbursements (excluding any class specific expenses, dividend and interest expenses on securities sold short, interest, taxes, acquired fund fee expenses and non-routine expenses (collectively, “excluded expenses”)) from exceeding 0.75% of the average daily net assets of the
44
THE ADVISORS’ INNER CIRCLE FUND III | PINEBRIDGE DYNAMIC | |
| ASSET ALLOCATION FUND | ||
| OCTOBER 31, 2022 | ||
Fund’s Investor Servicing Shares and Institutional Shares until April 30, 2023 (the “Expense Limitation”). Refer to waiver of investment advisory fees on the Statement of Operations for fees waived for the year ended October 31, 2022. The Adviser may recover all or a portion of its fee reductions or expense reimbursements, up to the expense cap in place at the time the expenses were waived, within a three-year period from the year in which it reduced its fee or reimbursed expenses if the Fund’s total annual fund operating expenses are below the Expense Limitation. This agreement may be terminated by the Board for any reason at any time, or by the Adviser, upon ninety (90) days’ prior written notice to the Trust, effective as of the close of business on April 30, 2023. As of October 31, 2022, the fees which were previously waived and/ or reimbursed to the Fund by the Adviser, which may be subject to possible future reimbursement, up to the expense cap in place at the time the expenses were waived and reimbursed to the Adviser were $788,351, $725,811 and $990,512 expiring in 2023, 2024 and 2025, respectively.
8. Investment Transactions:
The cost of security purchases and the proceeds from security sales other than short-term securities, for the year ended October 31, 2022, were as follows:
Purchases | ||||
U.S. Government | $ | 90,044,842 | ||
Other | 472,446,829 | |||
Sales | ||||
U.S. Government | $ | 27,834,077 | ||
Other | 393,899,805 | |||
45
THE ADVISORS’ INNER CIRCLE FUND III | PINEBRIDGE DYNAMIC | |
| ASSET ALLOCATION FUND | ||
| OCTOBER 31, 2022 | ||
9. Share Transactions:
| Year Ended October 31, 2022 | Year Ended October 31, 2021 | |||||||
Institutional Shares | ||||||||
Issued | 22,168,219 | 304,953 | ||||||
Reinvestment of Distributions | 2,041,425 | 215,167 | ||||||
Redeemed | (1,688,836) | (1,531,296) | ||||||
|
|
|
| |||||
Total Institutional Shares Transactions | 22,520,808 | (1,011,176) | ||||||
|
|
|
| |||||
Investor Servicing Shares | ||||||||
Issued | 30,711 | 114,006 | ||||||
Reinvestment of Distributions | 25,467 | 18,848 | ||||||
Redeemed | (51,618) | (1,218,676) | ||||||
|
|
|
| |||||
Total Investor Servicing Shares Transactions | 4,560 | (1,085,822) | ||||||
|
|
|
| |||||
Net Increase (Decrease) in Shares Outstanding From Share Transactions | 22,525,368 | (2,096,998) | ||||||
|
|
|
| |||||
10. Federal Tax Information:
The amount and character of income and capital gain distributions to be paid, if any, are determined in accordance with Federal income tax regulations, which may differ from U.S. GAAP. As a result, net investment income (loss) and net realized gain (loss) on investment transactions for a reporting period may differ significantly from distributions during such period. These book/tax differences may be temporary or permanent. The permanent differences are primarily related to investments in foreign currency, paydown adjustments, REIT adjustments, recharacterization of distributions, passive foreign investment companies, perpetual bond adjustments and India capital gains adjustments.
The following permanent difference is primarily attributable to net operating losses and a distribution in excess of net investment income being reclassified to/(from) the following accounts: during the year ended October 31, 2022:
Distributable Earnings |
| Paid-in Capital | ||
$4,432,402 | $(4,432,402) |
These reclassifications have no impact on net assets or net asset value per share.
46
THE ADVISORS’ INNER CIRCLE FUND III | PINEBRIDGE DYNAMIC | |
| ASSET ALLOCATION FUND | ||
| OCTOBER 31, 2022 | ||
The tax character of dividends or distributions declared during the years ended October 31.
| Ordinary Income | Long-Term Capital Gain | Total | ||||||||||
2022 | $ | 11,700,941 | $ | 14,695,998 | $ | 26,396,939 | ||||||
2021 | 2,991,141 | — | 2,991,141 | |||||||||
As October 31, 2022 of the components of accumulated losses on a tax basis were as follows:
Capital Loss Carryforwards | $ | (50,805,961) | ||
Unrealized Depreciation | (21,349,016) | |||
Other Temporary Differences | (4) | |||
|
| |||
Total Distributable Earnings | $ | (72,154,981) | ||
|
|
As of October 31, 2022, The Fund has short-term capital losses carried forward of $50,805,961. The utilization of carryforward capital losses may be subject to an annual limitation.
For Federal income tax purposes, the difference between Federal tax cost and book cost are primarily due to mark-to-market on PFIC securities, perpetual bonds and wash sales, which cannot be used for Federal income tax purposes in the current year and have been deferred for use in future years.
The Federal tax cost and aggregate gross unrealized appreciation and depreciation for the investments held by the Fund at October 31, 2022, were as follows:
Federal Tax Cost | Aggregate Gross Unrealized Appreciation | Aggregate Gross Unrealized Depreciation | Net Unrealized Depreciation | |||
$ 300,447,877 | $ 12,861,514 | $ (34,205,808) | $ (21,344,294) |
11. Concentration of Risks:
As with all management investment companies, a shareholder of the Fund is subject to the risk that his or her investment could lose money. The Fund is subject to the principal risks noted below, any of which may adversely affect the Fund’s net asset value (“NAV”) and ability to meet its investment objective.
Asset Allocation Risk – The Fund is subject to asset allocation risk, which is the risk that the Adviser’s allocation of the Fund’s assets among various asset classes will cause the Fund to underperform other funds with a similar investment objective and/ or underperform the markets in which the Fund invests.
Equity Risk – Since it purchases equity securities, the Fund is subject to the risk that
47
THE ADVISORS’ INNER CIRCLE FUND III | PINEBRIDGE DYNAMIC | |
| ASSET ALLOCATION FUND | ||
| OCTOBER 31, 2022 | ||
stock prices may fall over short or extended periods of time. Historically, the equity market has moved in cycles, and the value of the Fund’s securities may fluctuate from day to day. Individual companies may report poor results or be negatively affected by industry and/or economic trends and developments. The prices of securities issued by such companies may suffer a decline in response.
Small- and Mid-Capitalization Company Risk – Small- and mid-capitalization companies may be more vulnerable to adverse business or economic events than larger, more established companies. In particular, investments in these small- and mid-sized companies may pose additional risks, including liquidity risk, because these companies tend to have limited product lines, markets and financial resources, and may depend upon a relatively small management group. Therefore, small- and mid-cap stocks may be more volatile than those of larger companies. These securities may be traded over-the-counter or listed on an exchange.
Foreign Company Risk – Investing in foreign companies, including direct investments and investments through depositary receipts, poses additional risks since political and economic events unique to a country or region will affect those markets and their issuers. These risks will not necessarily affect the U.S. economy or similar issuers located in the U.S. Securities of foreign companies may not be registered with the U.S. Securities and Exchange Commission (the “SEC”) and foreign companies are generally not subject to the regulatory controls imposed on U.S. issuers and, as a consequence, there is generally less publically available information about foreign securities than is available about domestic securities. Income from foreign securities owned by the Fund may be reduced by a withholding tax at the source, which tax would reduce income received from the securities comprising the Fund’s portfolio. Foreign securities may also be more difficult to value than securities of U.S. issuers. While depositary receipts provide an alternative to directly purchasing the underlying foreign securities in their respective national markets and currencies, investments in depositary receipts continue to be subject to many of the risks associated with investing directly in foreign securities.
Emerging Markets Securities Risk – The Fund’s investments in emerging markets securities are considered speculative and subject to heightened risks in addition to the general risks of investing in foreign securities. Unlike more established markets, emerging markets may have governments that are less stable, markets that are less liquid and economies that are less developed. In addition, the securities markets of emerging market countries may consist of companies with smaller market capitalizations and may suffer periods of relative illiquidity; significant price volatility; restrictions on foreign investment; and possible restrictions on repatriation of investment income and capital. Furthermore, foreign investors may be required to register the proceeds of sales, and future economic or political crises could lead to price controls, forced mergers, expropriation or confiscatory taxation, seizure, nationalization or creation of government monopolies.
48
THE ADVISORS’ INNER CIRCLE FUND III | PINEBRIDGE DYNAMIC | |
| ASSET ALLOCATION FUND | ||
| OCTOBER 31, 2022 | ||
Risks of Investing in Other Investment Companies – To the extent the Fund invests in other investment companies, such as open-end funds, closed-end funds and ETFs, the Fund will be subject to substantially the same risks as those associated with the direct ownership of the securities held by such other investment companies. As a shareholder of another investment company, the Fund relies on that investment company to achieve its investment objective. If the investment company fails to achieve its objective, the value of the Fund’s investment could decline, which could adversely affect the Fund’s performance. By investing in another investment company, Fund shareholders indirectly bear the Fund’s proportionate share of the fees and expenses of the other investment company, in addition to the fees and expenses that Fund shareholders directly bear in connection with the Fund’s own operations.
Because ETFs and certain closed-end funds are listed on national stock exchanges and are traded like stocks listed on an exchange, their shares potentially may trade at a discount or premium. Investments in ETFs and certain closed-end funds are also subject to brokerage and other trading costs, which could result in greater expenses to the Fund. In addition, because the value of ETF and certain closed-end fund shares depends on the demand in the market, the Adviser may not be able to liquidate the Fund’s holdings at the most optimal time, which could adversely affect Fund performance.
Derivatives Risk – The Fund’s use of futures contracts, forward contracts, options and swaps is subject to market risk, leverage risk, correlation risk, liquidity risk and hedging risk. Market risk is the risk that the market value of an investment may move up and down, sometimes rapidly and unpredictably. Leverage risk is the risk that since derivatives may be purchased for a fraction of their value, a relatively small price movement in a derivative may result in an immediate and substantial loss or gain for the Fund, and may also cause the Fund to liquidate portfolio positions when it would not be advantageous to do so in order to satisfy its obligations. Correlation risk is the risk that changes in the value of the derivative may not correlate perfectly or at all with the underlying asset, rate or index. Liquidity risk is the risk that certain securities may be difficult or impossible to sell at the time and the price that the Fund would like. Hedging risk is the risk that derivative instruments used for hedging purposes may also limit any potential gain that may result from the increase in value of the hedged asset. To the extent that the Fund engages in hedging strategies, there can be no assurance that such strategy will be effective or that there will be a hedge in place at any given time. The Fund’s use of forwards and swaps is also subject to credit risk and valuation risk. Credit risk is the risk that the counterparty to a derivative contract will default or otherwise become unable to honor a financial obligation. Valuation risk is the risk that a security may be difficult to value. Each of these risks could cause the Fund to lose more than the principal amount invested in a derivative instrument.
Foreign Currency Risk – As a result of the Fund’s investments in securities denominated in, and/or receiving revenues in, foreign currencies, the Fund will be subject to
49
THE ADVISORS’ INNER CIRCLE FUND III | PINEBRIDGE DYNAMIC | |
| ASSET ALLOCATION FUND | ||
| OCTOBER 31, 2022 | ||
currency risk. Currency risk is the risk that foreign currencies will decline in value relative to the U.S. dollar, in which case, the dollar value of an investment in the Fund would be adversely affected.
REITs Risk – REITs are pooled investment vehicles that own, and usually operate, income-producing real estate. REITs are susceptible to the risks associated with direct ownership of real estate, such as the following: declines in property values; increases in property taxes, operating expenses, interest rates or competition; overbuilding; zoning changes; and losses from casualty or condemnation. REITs typically incur fees that are separate from those of the Fund. Accordingly, the Fund’s investments in REITs will result in the layering of expenses such that shareholders will indirectly bear a proportionate share of the REITs’ operating expenses, in addition to paying Fund expenses. REIT operating expenses are not reflected in the fee table and example in this prospectus.
Short Sales Risk – A short sale involves the sale of a security that the Fund does not own in the expectation of purchasing the same security (or a security exchangeable therefore) at a later date at a lower price. Short sales expose the Fund to the risk that it will be required to buy the security sold short (also known as “covering” the short position) at a time when the security has appreciated in value, thus resulting in a loss to the Fund. Investment in short sales may also cause the Fund to incur expenses related to borrowing securities. Reinvesting proceeds received from short selling may create leverage which can amplify the effects of market volatility on the Fund and, therefore, the Fund’s share price. Theoretically, uncovered short sales have the potential to expose the Fund to unlimited losses.
Convertible Securities Risk – The value of a convertible security is influenced by changes in interest rates (with investment value declining as interest rates increase and increasing as interest rates decline) and the credit standing of the issuer. The price of a convertible security will also normally vary in some proportion to changes in the price of the underlying common stock because of the conversion or exercise feature.
Rights and Warrants Risk – Investments in rights or warrants involve the risk of loss of the purchase value of a right or warrant if the right to subscribe to additional shares is not exercised prior to the right’s or warrant’s expiration. Also, the purchase of rights and/or warrants involves the risk that the effective price paid for the right and/or warrant added to the subscription price of the underlying security may exceed the market price of the underlying security in instances such as those where there is no movement in the price of the underlying security.
Preferred Stock Risk – Preferred stocks are sensitive to interest rate changes, and are also subject to equity risk, which is the risk that stock prices will fall over short or extended periods of time. The rights of preferred stocks on the distribution of a company’s assets in the event of a liquidation are generally subordinate to the rights
50
THE ADVISORS’ INNER CIRCLE FUND III | PINEBRIDGE DYNAMIC | |
| ASSET ALLOCATION FUND | ||
| OCTOBER 31, 2022 | ||
associated with a company’s debt securities.
Credit Risk – The credit rating or financial condition of an issuer may affect the value of a fixed income security. Generally, the lower the credit quality of a security, the greater the perceived risk that the issuer will fail to pay interest fully and return principal in a timely manner. If an issuer defaults or becomes unable to honor its financial obligations, the security may lose some or all of its value.
Bank Loans Risk – Investments in bank loans (through both assignments and participations) are generally subject to the same risks as investments in other types of debt instruments, including, in many cases, investments in junk bonds. There may be limited public information available regarding bank loans and bank loans may be difficult to value. If the Fund holds a bank loan through another financial institution, or relies on a financial institution to administer the loan, its receipt of principal and interest on the loan may be subject to the credit risk of that financial institution. It is possible that any collateral securing a loan may be insufficient or unavailable to the Fund, and that the Fund’s rights to collateral may be limited by bankruptcy or insolvency laws. In addition, the secondary market for bank loans may be subject to irregular trading activity, wide bid/ask spreads, and extended trade settlement periods, which may cause the Fund to be unable to realize the full value of its investment in a bank loan.
Bank loans may not be considered “securities,” and purchasers, such as the Fund, therefore may not be entitled to rely on the anti-fraud protections of the federal securities laws.
High Yield Bond Risk – High yield, or “junk,” bonds are debt securities rated below investment grade. High yield bonds are speculative, involve greater risks of default, downgrade, or price declines and are more volatile and tend to be less liquid than investment-grade securities. Companies issuing high yield bonds are less financially strong, are more likely to encounter financial difficulties, and are more vulnerable to adverse market events and negative sentiments than companies with higher credit ratings.
Collateralized Debt Obligations Risk – The risks of an investment in a collateralized debt obligation depend largely on the type of the collateral securities and the class of the debt obligation in which the Fund invests. Collateralized debt obligations are generally subject to credit, interest rate, prepayment and extension, valuation and liquidity risks, which are described elsewhere in this section. These securities also are subject to risk of default on the underlying assets, particularly during periods of economic downturn.
Collateralized Loan Obligation Risk. The risks of an investment in a collateralized loan obligation depend largely on the type of the collateral securities and the class of the debt obligation in which the Fund invests. Collateralized loan obligations
51
THE ADVISORS’ INNER CIRCLE FUND III | PINEBRIDGE DYNAMIC | |
| ASSET ALLOCATION FUND | ||
| OCTOBER 31, 2022 | ||
are generally subject to credit, interest rate, prepayment and extension, valuation and liquidity risks, which are described elsewhere in this section. These securities also are subject to risk of default on the underlying asset, particularly during periods of economic downturn.
Collateralized loan obligations carry additional risks including, but not limited to, (i) the possibility that distributions from collateral securities will not be adequate to make interest of other payments, (ii) the collateral may decline in value or default, (iii) the Fund may invest in obligations that are subordinate to other classes, and (iv) the complex structure of the security may not be fully understood at the time of investment and produce disputes with the issuer or unexpected investment results.
Collateralized Bond Obligation Risk. The pool of high yield securities underlying collateralized bond obligations is typically separated into groupings called tranches representing different degrees of credit quality. The higher quality tranches have greater degrees of protection and pay lower interest rates. The lower tranches, with greater risk, pay higher interest rates.
Corporate Fixed Income Securities Risk – Corporate fixed income securities respond to economic developments, especially changes in interest rates, as well as perceptions of the creditworthiness and business prospects of individual issuers.
Foreign Sovereign Debt Securities Risk – The Fund’s investments in foreign sovereign debt securities are subject to the risks that: (i) the governmental entity that controls the repayment of sovereign debt may not be willing or able to repay the principal and/ or interest when it becomes due, due to factors such as debt service burden, political constraints, cash flow problems and other national economic factors; (ii) governments may default on their debt securities, which may require holders of such securities to participate in debt rescheduling or additional lending to defaulting governments; and (iii) there is no bankruptcy proceeding by which defaulted sovereign debt may be collected in whole or in part.
Mortgage-Backed Securities Risk – Mortgage-backed securities are affected by, among other things, interest rate changes and the possibility of prepayment of the underlying mortgage loans. Mortgage-backed securities are also subject to the risk that underlying borrowers will be unable to meet their obligations.
Asset-Backed Securities Risk – Payment of principal and interest on asset-backed securities is dependent largely on the cash flows generated by the assets backing the securities, and asset-backed securities may not have the benefit of any security interest in the related assets.
Bank Obligations Risk – The Fund’s investments in bank obligations are subject to risks generally applicable to debt securities, as well as to the risk of negative events affecting the banking industry. Obligations of foreign banks and foreign branches of
52
THE ADVISORS’ INNER CIRCLE FUND III | PINEBRIDGE DYNAMIC | |
| ASSET ALLOCATION FUND | ||
| OCTOBER 31, 2022 | ||
U.S. banks are subject to additional risks, including negative political and economic developments in the country in which the bank or branch is located and actions by a foreign government that might adversely affect the payment of principal and interest on such obligations, such as the seizure or nationalization of foreign deposits. Additionally, U.S. and state banking laws and regulations may not apply to foreign branches of U.S. banks, and generally do not apply to foreign banks.
Prepayment and Extension Risk – When interest rates fall, issuers of high interest debt obligations may pay off the debts earlier than expected (prepayment risk), and the Fund may have to reinvest the proceeds at lower yields. When interest rates rise, issuers of lower interest debt obligations may pay off the debts later than expected (extension risk), thus keeping the Fund’s assets tied up in lower interest debt obligations.
Portfolio Turnover Risk – The Fund is subject to portfolio turnover risk since it may buy and sell investments frequently. Such a strategy often involves higher expenses, including brokerage commissions, and may increase the amount of capital gains (in particular, short term gains) realized by the Fund. Shareholders may pay tax on such capital gains.
Active Trading Risk – The Fund may actively trade which may result in higher transaction costs to the Fund. Active trading tends to be more pronounced during periods of increased market volatility.
Affiliated Fund Risk – Due to its own financial interest or other business considerations, the Adviser may have an incentive to invest a portion of the Fund’s assets in pooled investment vehicles sponsored or managed by the Adviser or its affiliates in lieu of investments directly in portfolio securities, or in lieu of investments in pooled investment vehicles sponsored or managed by others. Similarly, the Adviser may have an incentive to delay or decide against the sale of interests held by the Fund in pooled investment vehicles sponsored or managed by the Adviser or its affiliates. Unregistered Funds Risk – Investments in unregistered funds are subject to additional risks beyond those associated with investments in registered investment companies, because investments in unregistered funds do not have the benefit of the protections afforded by the 1940 Act to investors in registered investment companies. In addition, investments in unregistered funds are often illiquid and difficult to value, their marketability may be restricted and the realization of investments from them may take considerable time and/or be costly, in particular because they may have restrictions that allow redemptions only at specific infrequent dates with considerable notice periods and apply lock-ups and/or redemption fees.
Interest Rate Risk – As with most funds that invest in fixed income securities, changes in interest rates could affect the value of your investment. Rising interest rates tend to cause the prices of fixed income securities (especially those with longer maturities and lower credit qualities) and the Fund’s share price to fall.
53
THE ADVISORS’ INNER CIRCLE FUND III | PINEBRIDGE DYNAMIC | |
| ASSET ALLOCATION FUND | ||
| OCTOBER 31, 2022 | ||
U.S. Government Securities Risk – The Fund’s investment in U.S. government obligations may include securities issued or guaranteed as to principal and interest by the U.S. government, or its agencies or instrumentalities. Payment of principal and interest on U.S. government obligations may be backed by the full faith and credit of the United States or may be backed solely by the issuing or guaranteeing agency or instrumentality itself. There can be no assurance that the U.S. government would provide financial support to its agencies or instrumentalities (including government-sponsored enterprises) where it is not obligated to do so. In addition, U.S. government securities are not guaranteed against price movements due to changing interest rates.
LIBOR Replacement Risk – The elimination of the London Inter-Bank Offered Rate (“LIBOR”) may adversely affect the interest rates on, and value of, certain Fund investments for which the value is tied to LIBOR. The U.K. Financial Conduct Authority has announced that it intends to stop compelling or inducing banks to submit LIBOR rates after 2021. However, it remains unclear if LIBOR will continue to exist in its current, or a modified, form. Alternatives to LIBOR are established or in development in most major currencies, including the Secured Overnight Financing Rate (“SOFR”), which is intended to replace U.S. dollar LIBOR. Markets are slowly developing in response to these new rates. Questions around liquidity impacted by these rates, and how to appropriately adjust these rates at the time of transition, remain a concern for the Fund. Accordingly, it is difficult to predict the full impact of the transition away from LIBOR on the Fund until new reference rates and fallbacks for both legacy and new products, instruments and contracts are commercially accepted.
Repurchase Agreements Risk – Under a repurchase agreement, the seller of a security to the Fund agrees to repurchase the security at a mutually agreed-upon time and price. If the seller in a repurchase agreement transaction defaults on its obligation under the agreement, the Fund may suffer delays and incur costs or lose money in exercising its rights under the agreement.
Reverse Repurchase Agreements Risk – Reverse repurchase agreements involve the sale of securities held by the Fund with an agreement to repurchase the securities at an agreed-upon time and price. Reverse repurchase agreements involve the risk that the other party may fail to return the securities in a timely manner or at all. The Fund could lose money if it is unable to recover the securities and the value of the collateral held by the Fund, including the value of the investments made with cash collateral, is less than the value of the securities.
Securities Lending Risk – Securities lending involves the risk that the Fund may lose money because the borrower of the loaned securities fails to return the securities in a timely manner or at all. The Fund could also lose money in the event of a decline in the value of the collateral provided for loaned securities or a decline in the value of any investments made with cash collateral. These events could also trigger adverse tax consequences for the Fund.
54
THE ADVISORS’ INNER CIRCLE FUND III | PINEBRIDGE DYNAMIC | |
| ASSET ALLOCATION FUND | ||
| OCTOBER 31, 2022 | ||
Money Market Instruments Risk – The value of money market instruments may be affected by changing interest rates and by changes in the credit ratings of the investments. An investment in a money market fund is not a bank deposit and is not insured or guaranteed by any bank, the FDIC or any other government agency. A money market fund’s sponsor has no legal obligation to provide financial support to the fund, and there should be no expectation that the sponsor will provide financial support to the fund at any time. Certain money market funds float their net asset value (“NAV”) while others seek to preserve the value of investments at a stable NAV (typically, $1.00 per share). An investment in a money market fund, even an investment in a fund seeking to maintain a stable NAV per share, is not guaranteed and it is possible for the Fund to lose money by investing in these and other types of money market funds. If the liquidity of a money market fund’s portfolio deteriorates below certain levels, the money market fund may suspend redemptions (i.e., impose a redemption gate) and thereby prevent the Fund from selling its investment in the money market fund or impose a fee of up to 2% on amounts the Fund redeems from the money market fund (i.e., impose a liquidity fee). These measures may result in an investment loss or prohibit the Fund from redeeming shares when the Adviser would otherwise redeem shares. Money market funds and the securities they invest in are subject to comprehensive regulations. The enactment of new legislation or regulations, as well as changes in interpretation and enforcement of current laws, may affect the manner of operation, performance and/or yield of money market funds.
Market Risk – The risk that the market value of an investment may move up and down, sometimes rapidly and unpredictably. Markets for securities in which the Fund invests may decline significantly in response to adverse issuer, political, regulatory, market, economic or other developments that may cause broad changes in market value, public perceptions concerning these developments, and adverse investor sentiment or publicity. Similarly, the impact of any epidemic, pandemic or natural disaster, or widespread fear that such events may occur, could negatively affect the global economy, as well as the economies of individual countries, the financial performance of individual companies and sectors, and the markets in general in significant and unforeseen ways. Any such impact could adversely affect the prices and liquidity of the securities and other instruments in which the Fund invests, which in turn could negatively impact the Fund’s performance and cause losses on your investment in the Fund.
The foregoing is not intended to be a complete discussion of the risks associated with investing in the Fund. A more complete description of risks associated with the Fund is included in the prospectus and statement of additional information.
12. Other:
At October 31, 2022, the percentage of total shares outstanding held by shareholders for the Fund, which are comprised of individual shareholders and omnibus accounts
55
THE ADVISORS’ INNER CIRCLE FUND III | PINEBRIDGE DYNAMIC | |
| ASSET ALLOCATION FUND | ||
| OCTOBER 31, 2022 | ||
that are held on behalf of various individual shareholders was as follows:
| No. of | % Ownership | |||||||
Institutional Shares | 3 | 81 | % | |||||
Investor Servicing Shares | 1 | 93 | % | |||||
13. Indemnifications:
In the normal course of business, the Fund enters into contracts that provide general indemnifications. The Fund’s maximum exposure under these arrangements is dependent on future claims that may be made against the Fund and, therefore, cannot be established; however, based on experience, the risk of loss from such claim is considered remote.
14. Subsequent Events:
The Fund has evaluated the need for additional disclosures and/or adjustments resulting from subsequent events through the date the financial statements were issued. Based on this evaluation, no additional disclosures and/or adjustments were required to the financial statements as of October 31, 2022.
56
THE ADVISORS’ INNER CIRCLE FUND III | PINEBRIDGE DYNAMIC | |
| ASSET ALLOCATION FUND | ||
| OCTOBER 31, 2022 | ||
REPORT OF INDEPENDENT REGISTERED PUBLIC ACCOUNTING FIRM
|
To the Board of Trustees of The Advisors’ Inner Circle Fund III and the Shareholders of PineBridge Dynamic Asset Allocation Fund
Opinion on the Financial Statements
We have audited the accompanying statement of assets and liabilities of PineBridge Dynamic Asset Allocation Fund (the “Fund”) (one of the series constituting The Advisors’ Inner Circle Fund III (the “Trust”)), including the schedule of investments, as of October 31, 2022, and the related statement of operations for the year then ended, the statements of changes in net assets for each of the two years in the period then ended, the financial highlights for each of the five years in the period then ended and the related notes (collectively referred to as the “financial statements”). In our opinion, the financial statements present fairly, in all material respects, the financial position of the Fund (one of the series constituting The Advisors’ Inner Circle Fund III) at October 31, 2022, the results of its operations for the year then ended, the changes in its net assets for each of the two years in the period then ended and its financial highlights for each of the five years in the period then ended, in conformity with U.S. generally accepted accounting principles.
Basis for Opinion
These financial statements are the responsibility of the Trust’s management. Our responsibility is to express an opinion on the Fund’s financial statements based on our audits. We are a public accounting firm registered with the Public Company Accounting Oversight Board (United States) (“PCAOB”) and are required to be independent with respect to the Trust in accordance with the U.S. federal securities laws and the applicable rules and regulations of the Securities and Exchange Commission and the PCAOB.
We conducted our audits in accordance with the standards of the PCAOB. Those standards require that we plan and perform the audit to obtain reasonable assurance about whether the financial statements are free of material misstatement, whether due to error or fraud. The Trust is not required to have, nor were we engaged to perform, an audit of the Trust’s internal control over financial reporting. As part of our audits we are required to obtain an understanding of internal control over financial reporting but not for the purpose of expressing an opinion on the effectiveness of the Trust’s internal control over financial reporting. Accordingly, we express no such opinion.
Our audits included performing procedures to assess the risks of material misstatement of the financial statements, whether due to error or fraud, and performing procedures that respond to those risks. Such procedures included examining, on a test basis, evidence regarding the amounts and disclosures in the financial statements. Our procedures included confirmation of securities owned as of October 31, 2022, by correspondence with
57
THE ADVISORS’ INNER CIRCLE FUND III | PINEBRIDGE DYNAMIC | |
| ASSET ALLOCATION FUND | ||
| OCTOBER 31, 2022 | ||
the custodian and brokers. Our audits also included evaluating the accounting principles used and significant estimates made by management, as well as evaluating the overall presentation of the financial statements. We believe that our audits provide a reasonable basis for our opinion.

We have served as the auditor of one or more PineBridge Investments LLC investment companies since 2018.
Philadelphia, Pennsylvania
December 23, 2022
58
THE ADVISORS’ INNER CIRCLE FUND III | PINEBRIDGE DYNAMIC | |
| ASSET ALLOCATION FUND | ||
| OCTOBER 31, 2022 | ||
DISCLOSURE OF FUND EXPENSES (Unaudited)
|
All mutual funds have operating expenses. As a shareholder of a mutual fund, your investment is affected by these ongoing costs, which include (among others) costs for Fund management, administrative services, and shareholder reports like this one. It is important for you to understand the impact of these costs on your investment returns.
Operating expenses such as these are deducted from the mutual fund’s gross income and directly reduce your final investment return. These expenses are expressed as a percentage of the mutual fund’s average net assets; this percentage is known as the mutual fund’s expense ratio.
The following examples use the expense ratio and are intended to help you understand the ongoing costs (in dollars) of investing in your Fund and to compare these costs with those of other mutual funds. The examples are based on an investment of $1,000 made at the beginning of the period shown and held for the entire period from May 1, 2022 to October 31, 2022.
The table on the next page illustrates your Fund’s costs in two ways:
• Actual Fund Return. This section helps you to estimate the actual expenses after fee waivers that your Fund incurred over the period. The “Expenses Paid During Period” column shows the actual dollar expense cost incurred by a $1,000 investment in the Fund, and the “Ending Account Value” number is derived from deducting that expense cost from the Fund’s gross investment return.
You can use this information, together with the actual amount you invested in the Fund, to estimate the expenses you paid over that period. Simply divide your ending starting account value by $1,000 to arrive at a ratio (for example, an $8,600 account value divided by $1,000 = 8.6), then multiply that ratio by the number shown for your Fund under “Expenses Paid During Period.”
• Hypothetical 5% Return. This section helps you compare your Fund’s costs with those of other mutual funds. It assumes that the Fund had an annual 5% return before expenses during the year, but that the expense ratio (Column 3) for the period is unchanged. This example is useful in making comparisons because the Securities and Exchange Commission requires all mutual funds to make this 5%calculation. You can assess your Fund’s comparative cost by comparing the hypothetical result for your Fund in the “Expenses Paid During Period” column with those that appear in the same charts in the shareholder reports for other mutual funds.
59
THE ADVISORS’ INNER CIRCLE FUND III | PINEBRIDGE DYNAMIC | |
| ASSET ALLOCATION FUND | ||
| OCTOBER 31, 2022 | ||
DISCLOSURE OF FUND EXPENSES (Unaudited) - concluded
|
Note: Because the return is set at 5% for comparison purposes — NOT your Fund’s actual return — the account values shown may not apply to your specific investment.
| Beginning Account Value 5/01/22 | Ending Account Value 10/31/22 | Annualized Expense Ratios | Expenses Paid During Period* | |||||||||||||
PineBridge Dynamic Asset Allocation Fund - Institutional |
| |||||||||||||||
Actual Portfolio Return | $1,000.00 | $895.40 | 0.75 % | $3.58 | ||||||||||||
Hypothetical 5% Return | 1,000.00 | 1,021.43 | 0.75 | 3.82 | ||||||||||||
PineBridge Dynamic Asset Allocation Fund - Investor Servicing |
| |||||||||||||||
Actual Portfolio Return | $1,000.00 | $894.60 | 0.90 % | 4.30 | ||||||||||||
Hypothetical 5% Return | 1,000.00 | 1,020.67 | 0.90 | 4.58 | ||||||||||||
| * | Expenses are equal to the Fund’s annualized expense ratio multiplied by the average account value over the period, multiplied by 184/365 (to reflect the one-half year period shown.) |
60
NOTES
THE ADVISORS’ INNER CIRCLE FUND III | PINEBRIDGE DYNAMIC | |
| ASSET ALLOCATION FUND | ||
| OCTOBER 31, 2022 | ||
TRUSTEES AND OFFICERS OF THE ADVISORS’ INNER CIRCLE FUND III (UNAUDITED) |
Set forth below are the names, years of birth, positions with the Trust, length of term of office, and the principal occupations for the last five years of each of the persons currently serving as Trustees and Officers of the Trust. Unless otherwise noted, the business address of each Trustee is SEI Investments Company, One Freedom Valley Drive, Oaks Pennsylvania 19456. Trustees who are deemed not to be “interested persons” of the Trust are referred to as “Independent Trustees.”
Name and Year of Birth
| Position with Trust and Length of Time Served1
| Principal Occupations in the Past Five Years
| ||||
INTERESTED TRUSTEES3,4
| ||||||
William M. Doran (Born: 1940) | Chairman of the Board of Trustees (since 2014) |
| Self-Employed Consultant since 2003. Partner at Morgan, Lewis & Bockius LLP (law firm) from 1976 to 2003. Counsel to the Trust, SEI Investments, SIMC, the Administrator and the Distributor. Secretary of SEI Investments since 1978. | |||
INDEPENDENT TRUSTEES3
| ||||||
Jon C. Hunt (Born: 1951) | Trustee and Lead Independent Trustee (since 2014) | Retired since 2013. Consultant to Management, Convergent Capital Management, LLC (“CCM”) from 2012 to 2013. Managing Director and Chief Operating Officer, CCM from 1998 to 2012. | ||||
Thomas P. Lemke (Born: 1954) | Trustee (since 2014) | Retired since 2013. Executive Vice President and General Counsel, Legg Mason, Inc. from 2005 to 2013. | ||||
Nichelle Maynard-Elliott (Born: 1968) | Trustee (since 2021) | Independent Director since 2018. Executive Director, M&A at Praxair Inc. from 2011-2019. | ||||
| 1 | Each Trustee shall hold office during the lifetime of this Trust until the election and qualification of his or her successor, or until he or she sooner dies, resigns, or is removed in accordance with the Trust’s Declaration of Trust. |
| 2 | Directorships of Companies required to report to the Securities and Exchange Commission under the Securities Exchange Act of 1934 (i.e., “public companies”) or other investment companies under the 1940 Act. |
| 3 | Trustees oversee 65 funds in The Advisors’ Inner Circle Fund III. |
| 4 | Denotes Trustees who may be deemed to be “interested” persons of the Fund as that term is defined in the 1940 Act by virtue of their affiliation with the Distributor and/or its affiliates. |
62
THE ADVISORS’ INNER CIRCLE FUND III | PINEBRIDGE DYNAMIC | |
| ASSET ALLOCATION FUND | ||
| OCTOBER 31, 2022 | ||
Mr. Doran is a Trustee who may be an “interested” person of the Trust as that term is defined in the 1940 Act by virtue of their affiliation with the Trust’s Distributor. The Trust’s Statement of Additional Information (“SAI”) includes additional information about the Trustees and Officers. The SAI may be obtained without charge by calling 1-877-225-4164. The following chart lists Trustees and Officers as of October 31, 2022.
Other Directorships
Held in the Past Five Years2
Current Directorships: Trustee of Gallery Trust, Delaware Wilshire Private Markets Master Fund, Delaware Wilshire Private Markets Fund, Delaware Wilshire Private Markets Tender Fund, SEI Daily Income Trust, SEI Institutional International Trust, SEI Institutional Investments Trust, SEI Institutional Managed Trust, SEI Asset Allocation Trust, SEI Tax Exempt Trust, Adviser Managed Trust, New Covenant Funds, SEI Insurance Products Trust and SEI Catholic Values Trust. Director of SEI Investments, SEI Investments (Europe), Limited, SEI Investments—Global Funds Services, Limited, SEI Investments Global, Limited, SEI Investments (Asia), Limited, SEI Global Nominee Ltd., SEI Investments – Unit Trust Management (UK) Limited and SEI Investments Co. Director of the Distributor.
Former Directorships: Trustee of Winton Series Trust to 2017. Trustee of The Advisors’ Inner Circle Fund, The Advisors’ Inner Circle Fund II, Bishop Street Funds, The KP Funds and Winton Diversified Opportunities Fund (closed-end investment company) to 2018. Trustee of Schroder Global Series Trust to 2021. Trustee of Schroder Series Trust to 2022.
Current Directorships: Trustee of City National Rochdale Funds, Gallery Trust, Delaware Wilshire Private Markets Master Fund, Delaware Wilshire Private Markets Fund and Delaware Wilshire Private Markets Tender Fund. Director of Chiron Capital Allocation Fund Ltd.
Former Directorships: Trustee of Winton Series Trust to 2017. Trustee of Winton Diversified Opportunities Fund (closed-end investment company) to 2018. Trustee of Schroder Global Series Trust to 2021. Trustee of Schroder Series Trust to 2022.
Current Directorships: Trustee of Gallery Trust, Delaware Wilshire Private Markets Master Fund, Delaware Wilshire Private Markets Fund, Delaware Wilshire Private Markets Tender Fund, J.P. Morgan Funds (171 Portfolios) and Symmetry Panoramic Trust (16 Portfolios). Director of Chiron Capital Allocation Fund Ltd.
Former Directorships: Trustee of Winton Series Trust and AXA Premier VIP Trust to 2017. Trustee of Winton Diversified Opportunities Fund (closed-end investment company) to 2018. Trustee of Schroder Global Series Trust to 2021. Trustee of Schroder Series Trust to 2022.
Current Directorships: Trustee of Gallery Trust, Delaware Wilshire Private Markets Master Fund, Delaware Wilshire Private Markets Fund, Delaware Wilshire Private Markets Tender Fund. Director of Chiron Capital Allocation Fund Ltd. Director of Element Solutions Inc., Director of Xerox Holdings Corporation, and Director of Lucid Group, Inc.
Former Directorships: Trustee of Schroder Global Series Trust to 2021. Trustee of Schroder Series Trust to 2022.
63
THE ADVISORS’ INNER CIRCLE FUND III | PINEBRIDGE DYNAMIC | |
| ASSET ALLOCATION FUND | ||
| OCTOBER 31, 2022 | ||
TRUSTEES AND OFFICERS OF THE ADVISORS’ INNER CIRCLE FUND III (UNAUDITED)
|
Name and Year of Birth | Position with Trust and Length of Time Served1 | Principal Occupations in the Past Five Years | ||||
INDEPENDENT TRUSTEES (continued)3 | ||||||
Jay C. Nadel (Born: 1958) | Trustee (since 2016) |
| Self-Employed Consultant since 2004. Executive Vice President, Bank of New York Broker Dealer from 2002 to 2004. Partner/Managing Director, Weiss Peck & Greer/Robeco from 1986 to 2001.
| |||
Randall S. Yanker (Born: 1960) | Trustee (since 2014)
| Co-Founder and Senior Partner, Alternative Asset Managers, L.P. since 2004. | ||||
OFFICERS | ||||||
Michael Beattie (Born: 1965) | President (since 2014) | Director of Client Service, SEI Investments, since 2004. | ||||
James Bernstein (Born: 1962) | Vice President (since 2017) Secretary (since 2020) | Attorney, SEI Investments, since 2017. | ||||
| Prior Positions: Self-employed consultant, 2017. Associate General Counsel & Vice President, Nationwide Funds Group and Nationwide Mutual Insurance Company, from 2002 to 2016. Assistant General Counsel & Vice President, Market Street Funds and Provident Mutual Insurance Company, from 1999 to 2002. | ||||||
John Bourgeois (Born: 1973) | Assistant Treasurer (since 2017) | Fund Accounting Manager, SEI Investments, since 2000. | ||||
| 1 | Each Trustee shall hold office during the lifetime of this Trust until the election and qualification of his or her successor, or until he or she sooner dies, resigns, or is removed in accordance with the Trust’s Declaration of Trust. |
| 2 | Directorships of Companies required to report to the Securities and Exchange Commission under the Securities Exchange Act of 1934 (i.e., “public companies”) or other investment companies under the 1940 Act. |
| 3 | Trustees oversee 65 funds in The Advisors’ Inner Circle Fund III. |
64
THE ADVISORS’ INNER CIRCLE FUND III | PINEBRIDGE DYNAMIC | |
| ASSET ALLOCATION FUND | ||
| OCTOBER 31, 2022 | ||
Other Directorships
Held in the Past Five Years2
Current Directorships: Chairman of the Board of Trustees of City National Rochdale Funds. Trustee of Gallery Trust, Delaware Wilshire Private Markets Master Fund, Delaware Wilshire Private Markets Fund and Delaware Wilshire Private Markets Tender Fund. Director of Chiron Capital Allocation Fund Ltd.
Former Directorships: Trustee of Winton Series Trust to 2017. Director of Lapolla Industries, Inc. to 2017. Trustee of Winton Diversified Opportunities Fund (closed-end investment company) to 2018. Trustee of Schroder Global Series Trust to 2021. Trustee of Schroder Series Trust to 2022.
Current Directorships: Trustee of Gallery Trust, Delaware Wilshire Private Markets Master Fund, Delaware Wilshire Private Markets Fund and Delaware Wilshire Private Markets Tender Fund. Independent Non-Executive Director of HFA Holdings Limited. Director of Chiron Capital Allocation Fund Ltd.
Former Directorships: Trustee of Winton Series Trust to 2017. Trustee of Winton Diversified Opportunities Fund (closed-end investment company) to 2018. Trustee of Schroder Global Series Trust to 2021. Trustee of Schroder Series Trust to 2022.
None.
None.
None.
65
THE ADVISORS’ INNER CIRCLE FUND III | PINEBRIDGE DYNAMIC | |
| ASSET ALLOCATION FUND | ||
| OCTOBER 31, 2022 | ||
TRUSTEES AND OFFICERS OF THE ADVISORS’ INNER CIRCLE FUND III (UNAUDITED)
|
| Name and Year of Birth | Position(s) with Trust and Length of Time Served | Principal Occupation in the Past Five Years | ||||
| OFFICERS (continued) | ||||||
Eric C. Griffith (Born: 1969) | Vice President and Assistant Secretary (since 2020) |
| Counsel at SEI Investments since 2019. Vice President and Assistant General Counsel, JPMorgan Chase & Co., from 2012 to 2018. | |||
Matthew M. Maher (Born: 1975) | Vice President and Assistant Secretary (since 2018) | Counsel at SEI Investments since 2018. Attorney, Blank Rome LLP, from 2015 to 2018. Assistant Counsel & Vice President, Bank of New York Mellon, from 2013 to 2014. Attorney, Dilworth Paxson LLP, from 2006 to 2013. | ||||
Andrew Metzger (Born: 1980) | Treasurer, Controller and Chief Financial Officer (since 2021) | Director of Fund Accounting, SEI Investments, since 2020. Senior Director, Embark, from 2019 to 2020. Senior Manager, PricewaterhouseCoopers LLP, from 2002 to 2019. | ||||
Robert Morrow (Born: 1968) | Vice President (since 2017) | Account Manager, SEI Investments, since 2007. | ||||
66
THE ADVISORS’ INNER CIRCLE FUND III | PINEBRIDGE DYNAMIC | |
| ASSET ALLOCATION FUND | ||
| OCTOBER 31, 2022 | ||
Other Directorships
Held in the Past Five Years
None.
None.
None.
None.
67
THE ADVISORS’ INNER CIRCLE FUND III | PINEBRIDGE DYNAMIC | |
| ASSET ALLOCATION FUND | ||
| OCTOBER 31, 2022 | ||
TRUSTEES AND OFFICERS OF THE ADVISORS’ INNER CIRCLE FUND III (UNAUDITED)
|
| Name and Year of Birth | Position(s) with Trust and Length of Time Served | Principal Occupation in the Past Five Years | ||||
OFFICERS (continued) | ||||||
Stephen F. Panner (Born: 1970) | Chief Compliance Officer (since 2022) |
| Chief Compliance Officer of SEI Asset Allocation Trust, SEI Daily Income Trust, SEI Institutional Investments Trust, SEI Institutional International Trust, SEI Institutional Managed Trust, SEI Tax Exempt Trust, Adviser Managed Trust, New Covenant Funds, SEI Catholic Values Trust, SEI Exchange Traded Funds, SEI Structured Credit Fund LP, The Advisors’ Inner Circle Fund, The Advisors’ Inner Circle Fund II, The Advisors’ Inner Circle Fund III, Bishop Street Funds, Frost Family of Funds, Gallery Trust, Delaware Wilshire Private Markets Fund, Delaware Wilshire Private Markets Master Fund, Delaware Wilshire Private Markets Tender Fund and Catholic Responsible Investments Funds since September 2022. Fund Compliance Officer of SEI Investments Company from February 2011 to September 2022. Fund Accounting Director and CFO and Controller for the SEI Funds from July 2005 to February 2011.
| |||
Alexander F. Smith (Born: 1977) | Vice President and Assistant Secretary (since 2020)
| Counsel at SEI Investments since 2020. Associate Counsel & Manager, Vanguard, 2012 to 2020. Attorney, Stradley Ronon Stevens & Young, LLP, 2008 to 2012. | ||||
Bridget E. Sudall (Born: 1980) | Privacy Officer (from 2015 – June 2022 and since November 2022) | Senior Associate and AML Officer, Morgan Stanley Alternative Investment Partners, from 2011 to 2015. Investor Services Team Lead, Morgan Stanley Alternative Investment Partners, from 2007 to 2011. | ||||
Anti-Money Laundering Officer (from 2015 – June 2022 and since November 2022) | ||||||
68
THE ADVISORS’ INNER CIRCLE FUND III | PINEBRIDGE DYNAMIC | |
| ASSET ALLOCATION FUND | ||
| OCTOBER 31, 2022 | ||
Other Directorships
Held in the Past Five Years
None.
None.
None.
69
THE ADVISORS’ INNER CIRCLE FUND III | PINEBRIDGE DYNAMIC | |
| ASSET ALLOCATION FUND | ||
| OCTOBER 31, 2022 | ||
Pursuant to Section 15 of the Investment Company Act of 1940 (the “1940 Act”), the Fund’s advisory agreement (the “Agreement”) must be renewed at least annually after its initial two-year term: (i) by the vote of the Board of Trustees (the “Board” or the “Trustees”) of The Advisors’ Inner Circle Fund III (the “Trust”) or by a vote of a majority of the shareholders of the Fund; and (ii) by the vote of a majority of the Trustees who are not parties to the Agreement or “interested persons” of any party thereto, as defined in the 1940 Act (the “Independent Trustees”), cast in person at a meeting called for the purpose of voting on such renewal.
A Board meeting was held on September 14-15, 2022 to decide whether to renew the Agreement for an additional one-year term. In preparation for the meeting, the Trustees requested that the Adviser furnish information necessary to evaluate the terms of the Agreement. Prior to the meeting, the Independent Trustees of the Fund met to review and discuss the information provided. The Trustees used this information, as well as other information that the Adviser and other service providers of the Fund presented or submitted to the Board at the meeting and other meetings held during the prior year, to help them decide whether to renew the Agreement for an additional year.
Specifically, the Board requested and received written materials from the Adviser and other service providers of the Fund regarding: (i) the nature, extent and quality of the Adviser’s services; (ii) the Adviser’s investment management personnel; (iii) the Adviser’s operations and financial condition; (iv) the Adviser’s brokerage practices (including any soft dollar arrangements) and investment strategies; (v) the Fund’s advisory fee paid to the Adviser and overall fees and operating expenses compared with a peer group of mutual funds; (vi) the level of the Adviser’s profitability from its relationship with the Fund, including both direct and indirect benefits accruing to the Adviser and its affiliates; (vii) the Adviser’s potential economies of scale; (viii) the Adviser’s compliance program, including a description of material compliance matters and material compliance violations; (ix) the Adviser’s policies on and compliance procedures for personal securities transactions; and (x) the Fund’s performance compared with a peer group of mutual funds and the Fund’s benchmark indices.
Representatives from the Adviser, along with other Fund service providers, presented additional information and participated in question and answer sessions at the Board meeting to help the Trustees evaluate the Adviser’s services, fee and other aspects of the Agreement. The Independent Trustees received advice from independent counsel and met in executive sessions outside the presence of Fund management and the Adviser.
At the Board meeting, the Trustees, including all of the Independent Trustees, based on their evaluation of the information provided by the Adviser and other service providers of the Fund, renewed the Agreement. In considering the renewal of the
70
THE ADVISORS’ INNER CIRCLE FUND III | PINEBRIDGE DYNAMIC | |
| ASSET ALLOCATION FUND | ||
| OCTOBER 31, 2022 | ||
Agreement, the Board considered various factors that they determined were relevant, including: (i) the nature, extent and quality of the services provided by the Adviser; (ii) the investment performance of the Fund and the Adviser; (iii) the costs of the services provided and profits realized by the Adviser from its relationship with the Fund, including both direct and indirect benefits accruing to the Adviser and its affiliates; (iv) the extent to which economies of scale are being realized by the Adviser; and (v) whether fee levels reflect such economies of scale for the benefit of Fund investors, as discussed in further detail below.
Nature, Extent and Quality of Services Provided by the Adviser
In considering the nature, extent and quality of the services provided by the Adviser, the Board reviewed the portfolio management services provided by the Adviser to the Fund, including the quality and continuity of the Adviser’s portfolio management personnel, the resources of the Adviser, and the Adviser’s compliance history and compliance program. The Trustees reviewed the terms of the Agreement. The Trustees also reviewed the Adviser’s investment and risk management approaches for the Fund. The most recent investment adviser registration form (“Form ADV”) for the Adviser was available to the Board, as was the response of the Adviser to a detailed series of questions which included, among other things, information about the investment advisory services provided by the Adviser to the Fund.
The Trustees also considered other services provided to the Fund by the Adviser such as selecting broker-dealers for executing portfolio transactions, monitoring adherence to the Fund’s investment restrictions, and monitoring compliance with various Fund policies and procedures and with applicable securities laws and regulations. Based on the factors above, as well as those discussed below, the Board concluded, within the context of its full deliberations, that the nature, extent and quality of the services provided to the Fund by the Adviser were sufficient to support renewal of the Agreement.
Investment Performance of the Fund and the Adviser
The Board was provided with regular reports regarding the Fund’s performance over various time periods. The Trustees also reviewed reports prepared by the Fund’s administrator comparing the Fund’s performance to its benchmark indices and a peer group of mutual funds as classified by Lipper, an independent provider of investment company data, over various periods of time. Representatives from the Adviser provided information regarding and led discussions of factors impacting the performance of the Fund, outlining current market conditions and explaining their expectations and strategies for the future. The Trustees determined that the Fund’s performance was satisfactory, or, where the Fund’s performance was materially below its benchmarks and/or peer group, the Trustees were satisfied by the reasons for the underperformance and/or the steps taken by the Adviser in an effort to improve the performance of the Fund. Based on this information, the Board concluded, within the
71
THE ADVISORS’ INNER CIRCLE FUND III | PINEBRIDGE DYNAMIC | |
| ASSET ALLOCATION FUND | ||
| OCTOBER 31, 2022 | ||
context of its full deliberations, that the investment results that the Adviser had been able to achieve for the Fund were sufficient to support renewal of the Agreement.
Costs of Advisory Services, Profitability and Economies of Scale
In considering the advisory fee payable by the Fund to the Adviser, the Trustees reviewed, among other things, a report of the advisory fee paid to the Adviser. The Trustees also reviewed reports prepared by the Fund’s administrator comparing the Fund’s net and gross expense ratios and advisory fee to those paid by a peer group of mutual funds as classified by Lipper. The Trustees reviewed the management fees charged by the Adviser to other clients with comparable mandates. The Trustees considered any differences in management fees and took into account the respective demands, resources and complexity associated with the Fund and other client accounts as well as the extensive regulatory, compliance and tax regimes to which the Fund is subject. The Board concluded, within the context of its full deliberations, that the advisory fee was reasonable in light of the nature and quality of the services rendered by the Adviser.
The Trustees reviewed the costs of services provided by and the profits realized by the Adviser from its relationship with the Fund, including both direct benefits and indirect benefits, such as research and brokerage services received under soft dollar arrangements, accruing to the Adviser and its affiliates. The Trustees considered how the Adviser’s profitability was affected by factors such as its organizational structure and method for allocating expenses. The Trustees concluded that the profit margins of the Adviser with respect to the management of the Fund were not unreasonable. The Board also considered the Adviser’s commitment to managing the Fund and its willingness to continue its expense limitation and fee waiver arrangement with the Fund.
The Trustees considered the Adviser’s views relating to economies of scale in connection with the Fund as Fund assets grow and the extent to which the benefits of any such economies of scale are shared with the Fund and Fund shareholders. The Board considered the existence of any economies of scale and whether those were passed along to the Fund’s shareholders through a graduated advisory fee schedule or other means, including fee waivers. The Trustees recognized that economies of scale are difficult to identify and quantify and are rarely identifiable on a fund-by-fund basis. Based on this evaluation, the Board concluded that the advisory fee was reasonable in light of the information that was provided to the Trustees by the Adviser with respect to economies of scale.
Renewal of the Agreement
Based on the Board’s deliberations and its evaluation of the information described above and other factors and information it believed relevant in the exercise of its reasonable business judgment, the Board, including all of the Independent Trustees,
72
THE ADVISORS’ INNER CIRCLE FUND III | PINEBRIDGE DYNAMIC | |
| ASSET ALLOCATION FUND | ||
| OCTOBER 31, 2022 | ||
with the assistance of Fund counsel and Independent Trustees’ counsel, unanimously concluded that the terms of the Agreement, including the fees payable thereunder, were fair and reasonable and agreed to renew the Agreement for another year. In its deliberations, the Board did not identify any absence of information as material to its decision, or any particular factor (or conclusion with respect thereto) or single piece of information that was all-important, controlling or determinative of its decision, but considered all of the factors together, and each Trustee may have attributed different weights to the various factors (and conclusions with respect thereto) and information.
73
THE ADVISORS’ INNER CIRCLE FUND III | PINEBRIDGE DYNAMIC | |
| ASSET ALLOCATION FUND | ||
| OCTOBER 31, 2022 | ||
For shareholders that do not have an October 31, 2022 tax year end, this notice is for informational purposes only. For shareholders with an October 31, 2022 tax year end, please consult your tax advisor as to the pertinence of this notice. For the fiscal year ended October 31, 2022, the Fund is designating the following items with regard to distributions paid during the year.
Return of Capital | Ordinary Income Distributions | Long-Term Capital Gain Distributions | Total Distributions | Qualifying for Corporate Dividends Received Deduction(1) | Qualifying Dividend Income(2) | |||||
| ||||||||||
| 0.00% | 43.79% | 56.21% | 100.00% | 0.00% | 0.00% | |||||
U.S. Government Interest(3) | Interest Related Dividends(4) | Short-Term Capital Gain Dividends(5) | Foreign Tax Credit(6) | Qualified Business Income(7) | ||||
| ||||||||
54.89% | 0.00% | 100.00% | 0.00% | 0.00% | ||||
| 1. | Qualifying dividends represent dividends which qualify for the corporate dividends received deduction and is reflected as a percentage of ordinary Income distributions (the total of short term capital gain and net investment income distributions). |
| 2. | The percentage in this column represents the amount of “Qualifying Dividend Income” as created by the Jobs and Growth Tax Relief Reconciliation Act of 2003 and is reflected as a percentage of ordinary income distributions (the total of short term capital gain and net investment income distributions). It is the intention of each of the aforementioned funds to designate the maximum amount permitted by law. |
| 3. | “U.S. Government Interest” represents the amount of interest that was derived from direct U.S. Government obligations and distributed during the fiscal year. This amount is reflected as a percentage of ordinary income. Generally, interest from direct U.S. Government obligations is exempt from state income tax. However, for shareholders who are residents of California, Connecticut and New York, the statutory threshold requirements were not satisfied to permit exemption of these amounts from state income. |
| 4. | The percentage in this column represents the amount of “Interest Related Dividends” and is reflected as a percentage of ordinary income distribution. Interest related dividends are exempt from U.S. withholding tax when paid to foreign investors. |
| 5. | The percentage of this column represents the amount of “Short Term Capital Gain Dividends” and is reflected as a percentage of short term capital gain distribution that is exempt from U.S. withholding tax when paid to foreign investors. |
| 6. | The percentage in this column represents the amount of “Qualifying Foreign Taxes” as a percentage of ordinary distributions during the fiscal year ended October 31, 2022. The Fund intends to pass through a Foreign Tax Credit to shareholders for fiscal year ended 2022. |
| 7. | The percentage of this column represents that amount of ordinary dividend income that qualified for 20% Business Income Deduction. |
The information reported herein may differ from the information and distributions taxable to the shareholder for the calendar year ending December 31, 2022. Complete information will be computed and reported with your 2022 Form 1099-DIV.
74
PineBridge Investments
Park Avenue Tower
65 East 55th Street
New York, NY 10022
1-877-225-4164
Investment Adviser:
PineBridge Investments LLC
Park Avenue Tower
65 East 55th Street
New York, NY 10022
Administrator:
SEI Investments Global Funds Services
One Freedom Valley Drive
Oaks, PA 19456
Distributor:
SEI Investments Distribution Co.
One Freedom Valley Drive
Oaks, PA 19456
Legal Counsel:
Morgan, Lewis & Bockius LLP
1701 Market Street
Philadelphia, PA 19103
Independent Registered Public Accounting Firm:
Ernst & Young LLP
One Commerce Square
2005 Market Street, Suite 700
Philadelphia, PA 19103
This information must be preceded or accompanied by a current prospectus for the Fund described.
PBI-AR-001-0700
| Item 2. | Code of Ethics. |
The Registrant (also referred to as the “Trust”) has adopted a code of ethics that applies to the Registrant’s principal executive officer, principal financial officer, controller or principal accounting officer, and any person who performs a similar function. There have been no amendments to or waivers granted to this code of ethics during the period covered by this report.
| Item 3. | Audit Committee Financial Expert. |
(a)(1) The Registrant’s board of trustees has determined that the Registrant has at least one audit committee financial expert serving on the audit committee.
(a)(2) The Registrant’s audit committee financial experts are Thomas P. Lemke and Jay Nadel, and each of Mr. Lemke and Mr. Nadel is “independent” as that term is defined in Form N-CSR Item 3 (a)(2).
| Item 4. | Principal Accountant Fees and Services. |
Fees billed by PricewaterhouseCoopers LLP (“PwC”) relate to The Advisors’ Inner Circle Fund III (the “Trust”).
PwC billed the Trust aggregate fees for services rendered to the Trust for the last two fiscal years as follows:
2022 | 2021 | |||||||||||||
All fees and | All fees and | All other fees and | All fees and | All fees and | All other fees and | |||||||||
| (a) | Audit Fees(1) | $682,615 | None | None | $730,515 | None | $11,990 | |||||||
| (b) | Audit-Related Fees | None | None | None | $4,000 | None | None | |||||||
| (c) | Tax Fees | $88,500(4) | None | $126,709(2) | None | None | $90,000(2) | |||||||
| (d) | All Other Fees | None | None | $5,301 | None | None | $1,473 | |||||||
Fees billed by Ernst & Young LLP (“E&Y”) relate to the Trust
E&Y billed the Trust aggregate fees for services rendered to the Trust for the last two fiscal years as follows:
2022 | 2021 | |||||||||||||
All fees and | All fees and | All other fees and | All fees and | All fees and | All other fees and | |||||||||
| (a) | Audit Fees(1) | $131,900 | None | None | $128,050 | None | None | |||||||
| (b) | Audit-Related Fees | None | None | None | None | None | None | |||||||
| (c) | Tax Fees | None | None | None | None | None | None | |||||||
| (d) | All Other Fees | None | None | None | None | None | None | |||||||
Fees billed by Deloitte & Touche LLP (“D&T”) relate to the Trust
D&T billed the Trust aggregate fees for services rendered to the Trust for the last two fiscal years as follows
2022 | 2021 | |||||||||||||
All fees and | All fees and | All other fees and | All fees and | All fees and | All other fees and | |||||||||
| (a) | Audit Fees(1) | $30,050 | None | None | $26,800 | None | None | |||||||
| (b) | Audit-Related Fees | None | None | None | None | None | None | |||||||
| (c) | Tax Fees | None | None | None | None | None | None | |||||||
| (d) | All Other Fees | None | None | None | None | None | None | |||||||
Fees billed by KPMG (“KPMG”) relate to the Trust
KPMG billed the Trust aggregate fees for services rendered to the Trust for the last two fiscal years as follows
2022 | 2021 | |||||||||||||
All fees and | All fees and | All other fees and | All fees and | All fees and | All other fees and | |||||||||
| (a) | Audit Fees(1) | $322,500 | None | None | $25,000 | None | None | |||||||
| (b) | Audit-Related Fees | None | None | None | None | None | None | |||||||
| (c) | Tax Fees | None | None | None | None | None | None | |||||||
| (d) | All Other Fees | None | None | $218,015(3) | None | None | $206,957(3) | |||||||
Notes:
| (1) | Audit fees include amounts related to the audit of the Trust’s annual financial statements and services normally provided by the accountant in connection with statutory and regulatory filings. |
| (2) | Tax return preparation fees for affiliates of the Funds. |
| (3) | Non-audit fees consist of SSAE No. 18 report over investment management activities and non-statutory audit reports of Legal & General Investment Management America, Inc. |
| (4) | Fees in connection with international withholding tax analysis. |
(e)(1) The Trust’s Audit Committee has adopted and the Board of Trustees has ratified an Audit and Non-Audit Services Pre-Approval Policy (the “Policy”), which sets forth the procedures and the conditions pursuant to which services proposed to be performed by the independent auditor of the Funds may be pre-approved.
The Policy provides that all requests or applications for proposed services to be provided by the independent auditor must be submitted to the Registrant’s Chief Financial Officer (“CFO”) and must include a detailed description of the services proposed to be rendered. The CFO will determine whether such services:
| (1) | require specific pre-approval; |
| (2) | are included within the list of services that have received the general pre-approval of the Audit Committee pursuant to the Policy; or |
| (3) | have been previously pre-approved in connection with the independent auditor’s annual engagement letter for the applicable year or otherwise. In any instance where services require pre-approval, the Audit Committee will consider whether such services are consistent with SEC’s rules and whether the provision of such services would impair the auditor’s independence. |
Requests or applications to provide services that require specific pre-approval by the Audit Committee will be submitted to the Audit Committee by the CFO. The Audit Committee will be informed by the CFO on a quarterly basis of all services rendered by the independent auditor. The Audit Committee has delegated specific pre-approval authority to either the Audit Committee Chair or financial expert, provided that the estimated fee for any such proposed pre-approved service does not exceed $100,000 and any pre-approval decisions are reported to the Audit Committee at its next regularly-scheduled meeting.
Services that have received the general pre-approval of the Audit Committee are identified and described in the Policy. In addition, the Policy sets forth a maximum fee per engagement with respect to each identified service that has received general pre-approval.
All services to be provided by the independent auditor shall be provided pursuant to a signed written engagement letter with the Registrant, the investment adviser, or applicable control affiliate (except that matters as to which an engagement letter would be impractical because of timing issues or because the matter is small may not be the subject of an engagement letter) that sets forth both the services to be provided by the independent auditor and the total fees to be paid to the independent auditor for those services.
In addition, the Audit Committee has determined to take additional measures on an annual basis to meet the Audit Committee’s responsibility to oversee the work of the independent auditor and to assure the auditor’s independence from the Registrant, such as (a) reviewing a formal written statement from the independent auditor delineating all relationships between the independent auditor and the Registrant, and (b) discussing with the independent auditor the independent auditor’s methods and procedures for ensuring independence.
(e)(2) Percentage of fees billed applicable to non-audit services pursuant to waiver of pre-approval requirement were as follows (PwC):
| 2022 | 2021 | |||
| Audit-Related Fees | None | None | ||
| Tax Fees | None | None | ||
| All Other Fees | None | None |
(e)(2) Percentage of fees billed applicable to non-audit services pursuant to waiver of pre-approval requirement were as follows (E&Y):
| 2022 | 2021 | |||
| Audit-Related Fees | None | None | ||
| Tax Fees | None | None | ||
| All Other Fees | None | None |
(e)(2) Percentage of fees billed applicable to non-audit services pursuant to waiver of pre-approval requirement were as follows (D&T):
| 2022 | 2021 | |||
| Audit-Related Fees | None | None | ||
| Tax Fees | None | None | ||
| All Other Fees | None | None |
(e)(2) Percentage of fees billed applicable to non-audit services pursuant to waiver of pre-approval requirement were as follows (KPMG):
| 2022 | 2021 | |||
| Audit-Related Fees | None | None | ||
| Tax Fees | None | None | ||
| All Other Fees | None | None |
(f) Not applicable.
(g) The aggregate non-audit fees and services billed by PwC for services rendered to the Registrant, and rendered to the Registrant’s investment adviser (not including any sub-adviser whose role is primarily portfolio management and is subcontracted with or overseen by another investment adviser), and any entity controlling, controlled by, or under common control with the adviser that provides ongoing services to the Registrant for the last two fiscal-years-ended October 31st were $132,010 and $91,473 for 2022 and 2021, respectively.
(g) The aggregate non-audit fees and services billed by E&Y for services rendered to the Registrant, and rendered to the Registrant’s investment adviser (not including any sub-adviser whose role is primarily portfolio management and is subcontracted with or overseen by another investment adviser), and any entity controlling, controlled by, or under common control with the adviser that provides ongoing services to the Registrant for the last two fiscal-years-ended October 31st were $0 and $0 for 2022 and 2021, respectively.
(g) The aggregate non-audit fees and services billed by D&T for services rendered to the Registrant, and rendered to the Registrant’s investment adviser (not including any sub-adviser whose role is primarily portfolio management and is subcontracted with or overseen by another investment adviser), and any entity controlling, controlled by, or under common control with the adviser that provides ongoing services to the Registrant for the last two fiscal-years-ended October 31st were $0 and $0 for 2022 and 2021, respectively.
(g) The aggregate non-audit fees and services billed by KPMG for services rendered to the Registrant, and rendered to the Registrant’s investment adviser (not including any sub-adviser whose role is primarily portfolio management and is subcontracted with or overseen by another investment adviser), and any entity controlling, controlled by, or under common control with the adviser that provides ongoing services to the Registrant for the last two fiscal-years-ended October 31st were $218,015 and $206,957 for 2022 and 2021, respectively.
(h) During the past fiscal year, all non-audit services provided by the Registrant’s principal accountant to either the Registrant’s investment adviser or to any entity controlling, controlled by,
or under common control with the Registrant’s investment adviser that provides ongoing services to the Registrant were pre-approved by the Audit Committee of Registrant’s Board of Trustees. Included in the Audit Committee’s pre-approval of these non-audit service were the review and consideration as to whether the provision of these non-audit services is compatible with maintaining the principal accountant’s independence.
(i) Not applicable. The Registrant has not retained, for the preparation of the audit report on the financial statements included in the Form N-CSR, a registered public accounting firm that has a branch or office that is located in a foreign jurisdiction and that the Public Company Accounting Oversight Board (the “PCAOB”) has determined that the PCAOB is unable to inspect or investigate completely because of a position taken by an authority in the foreign jurisdiction.
(j) Not applicable. The Registrant is not a “foreign issuer,” as defined in 17 CFR 240.3b-4.
| Item 5. Audit | Committee of Listed Registrants. |
Not applicable to open-end management investment companies.
| Item 6. Schedule | of Investments. |
Schedule of Investments is included as part of the Report to Shareholders filed under Item 1 of this form.
| Item 7. Disclosure | of Proxy Voting Policies and Procedures for Closed-End Management Investment Companies. |
Not applicable to open-end management investment companies.
| Item 8. Portfolio | Managers of Closed-End Management Investment Companies. |
Not applicable to open-end management investment companies.
| Item 9. Purchases | of Equity Securities by Closed-End Management Company and Affiliated Purchasers. |
Not applicable to open-end management investment companies.
| Item 10. Submission | of Matters to a Vote of Security Holders. |
There have been no changes to the procedures by which shareholders may recommend nominees to the Registrant’s Board of Trustees during the period covered by this report.
| Item 11. Controls | and Procedures. |
(a) The Registrant’s principal executive and principal financial officers, or persons performing similar functions, have concluded that the Registrant’s disclosure controls and procedures, as defined in Rule 30a-3(c) under the Act (17 CFR § 270.30a-3(c)), as of a date within 90 days of the filing date of the report, are effective based on the evaluation of these controls and procedures required by Rule 30a-3(b) under the Act (17 CFR § 270.30a-3(b)) and Rule 13a-15(b) or Rule 15d-15(b) under the Exchange Act, as amended (17 CFR § 240.13a-15(b) or § 240.15d-15(b)).
(b) There has been no change in the Registrant’s internal control over financial reporting (as defined in Rule 30a-3(d) under the Act (17 CFR § 270.3a-3(d)) that occurred during the period covered by this report that has materially affected, or is reasonably likely to materially affect, the Registrant’s internal control over financial reporting.
| Item 12. Disclosure | of Securities Lending Activities for Closed-End Management Investment Companies. |
Not applicable to open-end management investment companies.
| Items 13. Exhibits. |
SIGNATURES
Pursuant to the requirements of the Securities Exchange Act of 1934 and the Investment Company Act of 1940, the Registrant has duly caused this report to be signed on its behalf by the undersigned, thereunto duly authorized.
| (Registrant) | The Advisors’ Inner Circle Fund III | |
| By (Signature and Title) | ||
| /s/ Michael Beattie | ||
| Michael Beattie, President | ||
| Date: January 6, 2023 | ||
Pursuant to the requirements of the Securities Exchange Act of 1934 and the Investment Company Act of 1940, this report has been signed below by the following persons on behalf of the Registrant and in the capacities and on the dates indicated.
| By (Signature and Title) | /s/ Michael Beattie | |
| Michael Beattie, President | ||
| Date: January 6, 2023 | ||
| By (Signature and Title) | /s/ Andrew Metzger | |
| Andrew Metzger, | ||
| Treasurer, Controller, and CFO | ||
| Date: January 6, 2023 | ||