UNITED STATES
SECURITIES AND EXCHANGE COMMISSION
Washington, D.C. 20549
FORM N-CSR
CERTIFIED SHAREHOLDER REPORT OF REGISTERED MANAGEMENT
INVESTMENT COMPANIES
| Investment Company Act file number | 811-22930 |
USCF ETF Trust
(Exact name of registrant as specified in charter)
1850 Mt. Diablo Blvd., Suite 640
Walnut Creek, CA 94596
(Address of principal executive offices) (Zip code)
USCF Advisers LLC
Mr. Stuart Crumbaugh
1850 Mt. Diablo Blvd., Suite 640
Walnut Creek, CA 94596
(Name and address of agent for service)
Registrant's telephone number, including area code: 510-522-9600
Date of fiscal year end: June 30
Date of reporting period: June 30, 2021
Form N-CSR is to be used by management investment companies to file reports with the Commission not later than 10 days after the transmission to stockholders of any report that is required to be transmitted to stockholders under Rule 30e-1 under the Investment Company Act of 1940 (17 CFR 270.30e-1). The Commission may use the information provided on Form N-CSR in its regulatory, disclosure review, inspection, and policymaking roles.
A registrant is required to disclose the information specified by Form N-CSR, and the Commission will make this information public. A registrant is not required to respond to the collection of information contained in Form N-CSR unless the Form displays a currently valid Office of Management and Budget ("OMB") control number. Please direct comments concerning the accuracy of the information collection burden estimate and any suggestions for reducing the burden to Secretary, Securities and Exchange Commission, 100 F Street, NE, Washington, DC 20549. The OMB has reviewed this collection of information under the clearance requirements of 44 U.S.C. § 3507.
Item 1. Reports to Stockholders.
| (a) | The following is a copy of the report transmitted to shareholders pursuant to Rule 30e-1 under the Investment Company Act of 1940 (17 CFR 270.30e-1). |
Beginning on January 1, 2021, as permitted by regulations adopted by the U.S. Securities and Exchange Commission, paper copies of the funds’ shareholder reports are no longer sent by mail, unless you specifically request paper copies of the reports from your financial intermediary, such as a broker-dealer or bank. Instead, the reports are made available on a website, and you will be notified by mail each time a report is posted and provided with a website link to access the report.
If you already elected to receive shareholder reports electronically, you will not be affected by this change and you need not take any action. Please contact your financial intermediary to elect to receive shareholder reports and other fund communications electronically.
You may elect to receive all future reports in paper free of charge. Please contact your financial intermediary to inform them that you wish to continue receiving paper copies of your shareholder reports and for details about whether your election to receive reports in paper will apply to all funds held with your financial intermediary.
USCF ETF TRUST
TABLE OF CONTENTS
LETTERS TO SHAREHOLDERS (as of June 30, 2021)
USCF SUMMERHAVEN DYNAMIC COMMODITY STRATEGY NO K-1 FUND (“SDCI”)
USCF ETF Trust (the “Trust”) launched the USCF SummerHaven Dynamic Commodity Strategy No K-1 Fund (“SDCI”) on May 2, 2018. SDCI is an innovative approach to commodity investing that uses fundamental signals about underlying physical markets to create an active portfolio for commodity futures investors. The SDCI reflects the performance of a fully collateralized portfolio of 14 commodity futures, selected each month from a universe of 27 eligible commodities based on observable price signals, subject to a diversification requirement across Primary commodity sectors. The Primary commodity sectors for the SDCI include Precious Metals, Industrial Metals, Petroleum and Grains. The Non-Primary sector includes natural gas, softs, and livestock commodities.
For the twelve months ending June 30, 2021, the SDCI Total Return Index increased 54.75%. The large positive return over the last 12-month period is a result of the global economic rebound and market response as COVID-19 vaccinations become available. During that period, the 12-month performance of both SDCI and the SDCI Total Return Index was in line with other commodity benchmarks. For example the BCOM Total Return Index was up 45.61% and the SPGSCI Total Return Index was up 57.37% over the same twelve month period.
The Consumer Price Index (CPI) tracks the average price changes of a basket of goods that consumers buy. The change in CPI is commonly used to measure the rate of inflation. If prices increase quickly, consumers will not be able to buy as many goods on the same budget. In this sense, inflation can erode wealth.
CPI inflation for May 2021 hit 5% compared to one year ago. This figure means that the purchasing power of $1 in May 2020 is equivalent to the purchasing power of $1.05 one year later. In other words, a typical American household will spend several hundred dollars more on just groceries in 2021 compared to 2020.
What is causing inflation to rise, and where will it go next? It turns out that predicting inflation is just as difficult as market-timing in equities and commodities. A recent New York Times story covered research from the Peterson Institute for International Economics on inflation forecasting accuracy, reporting that “nobody forecasts well” including the U.S. Treasury market, TIPS market and well-known economists. Allocators should question any confident prediction for low inflation or transitory inflation when forming diversified portfolios. We believe a prudent investor would position for the unexpected and unpredictable, including positive inflation shocks. Given this uncertainty, we explore the macroeconomic factors underlying current inflationary trends.
Three factors are at work in unison to drive inflation upwards. First, 2020 witnessed an unprecedented monetary event. Money supply as measured by M2 experienced a year-over-year increase of 25%, the highest recorded level in history. Furthermore, money supply has continued to expand in 2021, already logging one of the highest percentage increases only halfway through the year. Compared to the expanding money supply, the U.S. economy has been in a recession since early 2020. With too much money chasing after fewer goods, prices are primed to rise.
| 2 | Annual Report June 30, 2021 |
Second, monetary expansion is matched by an equally grand expansion of the government’s balance sheet as ambitious fiscal policy is unleashed to fight a COVID-19 induced recession. The expansion in government spending through 2020 and 2021 has been the highest in the past 40 years. Greater government spending also contributes to more money in the economy, further causing prices to rise.
While the first two factors have an impact on the current rate of inflation, the third factor has implications for future inflation. During the COVID-19 pandemic, Americans saved at unprecedented rates. From 1980 to 2019, the personal savings rate of Americans never exceeded 15%. In 2020, this figure rose past 15%, and in 2021, it is approaching 20%! This additional savings will be spent at some point – more money chasing goods in the future.
Of the 27 eligible commodities that may be held by the SDCI, all except two have had positive returns in the past year. Furthermore, the rally extends across sectors, with the top performers (50%+ return each) coming from different sectors: grains (corn, soybean complex, wheat, oilseeds), livestock (hogs), and industrial metals (tin, copper, aluminum), energy (crude oil as well as its refined products), and softs (sugar).
Since the Global Financial Crisis (GFC) and the deflationary decade that followed, many investors have positioned their portfolios away from assets that protect against inflation such as commodity futures. This positioning reflects the view that future inflation is likely to remain very low. Investors should be aware that the COVID-19 pandemic is unlike the GFC, and the current economic conditions are unlike those in 2008. An elevated risk of inflation could be painful for unprepared investors.
Definitions:
Bloomberg Commodity Index Total Return (BCOM TR) is an index that tracks the performance of 22 broadly diversified commodity futures contracts. Prior to July 1, 2014, BCOM was known as the Dow Jones-UBS Commodity Index.
S&P GSCI Index (GSCI) is an index that tracks the performance of 24 exchange-traded futures contracts that cover physical commodities spanning five sectors. The S&P GSCI was called the Goldman Sachs Commodity Index (GSCI) before it was purchased by Standard & Poor’s in 2007.
Past performance is no guarantee of future results.
There is no assurance that the investment process will consistently lead to successful investing for each fund.
It is not possible to invest in an index.
| 3 |
Important Considerations:
Commodity and futures trading are highly speculative and generally volatile and is not suitable for all investors.
Investing in SDCI involves risks, including the possible loss of principal. Commodities contain a heightened risk including market and price movements that are outside SDCI’s control and may be influenced by weather and climate conditions, livestock disease, war, terrorism, political conflicts and economic event, interest rates, currency exchange rates, U.S. and non-U.S. government regulation and taxation. Investing in derivatives, including futures and swaps, entails risks relating to liquidity, counterparty, leverage, and credit that may reduce return and increase volatility. Investments held in U.S. government securities and money market instruments can suffer losses. SDCI is exposed to non-diversification risk which results from SDCI’s direct or indirect investment in commodities and futures contracts that are economically identical or substantially similar. For more information about these and other risks including correlation and specific risks regarding each commodity sector and the investment in the Subsidiary, please read SDCI’s prospectus.
| 4 | Annual Report June 30, 2021 |
USCF MIDSTREAM ENERGY INCOME FUND (“UMI”)
USCF ETF Trust (the “Trust”) launched the USCF Midstream Energy Income Fund (“UMI”) on March 24, 2021. Midstream energy has had stellar performance since inception through June 30, 2021. During the same period, UMI posted strong absolute returns and outperformed its benchmark, the Alerian Midstream Energy Select Index. A better U.S. COVID-19 outlook, OPEC+ self-discipline, and increasing travel all contributed to an improving volume outlook. In addition, India and China have seen an uptick in demand, as the world slowly returns to a more normalized state. Although the summer waters are not totally clear due to the looming return of Iranian production and a slower pandemic recovery in some international countries, crude prices have moved steadily upward, and U.S. production volumes are starting to follow.
U.S. crude oil and natural gas production fell significantly during the COVID-19 outbreak and was impacted again this winter by severe weather. However, production has started a V-shaped recovery, which is a positive sign for midstream companies who depend on volumes to support cash flows.
In addition, we have seen a better demand outlook for refined products, as the pandemic impact has lessened in the U.S. and resulted in increased economic activity. We are now in the peak summer driving season and should see continuing positive demand trends, particularly for gasoline and diesel. Jet fuel demand is also headed in the right direction but trails the robust rebound in gasoline and diesel demand. The U.S. Energy Information Administration expects U.S. gasoline consumption to average 8.7 million barrels per day (Mmbpd) in 2021 and 9.0 Mmbpd in 2022. This compares with 8.0 Mmbpd in 2020 and 9.3 Mmbpd in 2019.
All of this adds up to a sunny outlook for midstream volumes, which should enable midstream energy companies to realize their goal of enhancing shareholder returns without the need for increased capital spending.
We believe current management teams at midstream energy companies finally understand their own businesses and what investors want from them. Management teams continue to talk about financial discipline, emphasizing free cash flow and returning capital to shareholders through share buybacks and distribution increases. The companies are also focused on reducing leverage through the payoff of debt, although that goal was slowed somewhat in the tough 2020 environment. We expect de-levering should pick up again over the next few years. We believe these developments better position the sector to handle the inevitable volatility of the energy markets through future cycles.
Contributors (by contribution to returns)
Targa Resources - Results exceeded estimates and raised 2021 EBITDA estimates to 13% higher than 2020.
Energy Transfer - ET is selling at a discount on EV/EBITDA compared with the portfolio and has an attractive 18% FCF yield.
| 5 |
Plains GP Holdings - The company’s assets in the Permian Basin, which has the best return on investment for oil fields in the US, positions the company well for increased demand as the economy rebounds.
Detractors (by contribution to returns)
The portfolio did not have any names detract from absolute returns during the fiscal period.
Definitions:
Alerian Midstream Energy Select Index (AMEIX) is a composite of North American energy infrastructure companies. The capped, float-adjusted, capitalization-weighted index, whose constituents are engaged in midstream activities involving energy commodities, is disseminated real-time on a total-return basis.
Past performance is no guarantee of future results.
There is no assurance that the investment process will consistently lead to successful investing for each fund.
It is not possible to invest in an index.
Important Considerations:
The Fund invests primarily in energy infrastructure companies which may be affected by fluctuations in energy prices and supply and demand of energy fuels. An investment in MLP units involves risks that differ from a similar investment in equity securities, such as common stock, of a corporation.
There is no guarantee that the fund’s objective will be met. Fund concentration generally leads to greater price volatility. Foreign investing involves special risks such as currency fluctuations and political uncertainty. Investment in small companies generally experience greater price volatility.
An investor may lose all or substantially all of an investment. These risks could result in large fluctuations in the price of a particular fund’s respective shares. Funds that focus on a single sector generally experience greater volatility. For further discussion of these and additional risks associated with an investment in UMI, please read the respective fund’s prospectus before investing.
| 6 | Annual Report June 30, 2021 |
COMPARISON OF CHANGE IN VALUE OF $10,000 INVESTMENT IN USCF
SUMMERHAVEN DYNAMIC COMMODITY STRATEGY NO K-1 FUND (“SDCI”),
SUMMERHAVEN DYNAMIC COMMODITY INDEX TOTAL RETURN SM1 AND
BLOOMBERG COMMODITY INDEX TOTAL RETURNSM2 FROM MAY 2, 2018
(INCEPTION DATE)* TO JUNE 30, 2021.
The following graph shows the value as of June 30, 2021 of a $10,000 investment made on May 1, 2018 (commencement of operations). For comparative purposes, the performance of USCF SummerHaven Dynamic Commodity Strategy No K-1 Fund (Net Asset Value and Market Value), the SummerHaven Dynamic Commodity Index Total ReturnSM1 (“SDCITR”) and the performance of Bloomberg Commodity Index Total ReturnSM2 and S&P Goldman Sachs Commodity Index Total Return®3 are shown.

| One Year Return | Annualized | |||||||
USCF SummerHaven Dynamic Commodity Strategy No K-1 Fund (NAV) | 56.04 | % | (1.58 | )% | ||||
USCF SummerHaven Dynamic Commodity Strategy No K-1 Fund (Market Value) | 55.22 | % | (1.78 | )% | ||||
| SummerHaven Dynamic Commodity Index Total ReturnSM1 | 54.75 | % | (1.18 | )% | ||||
| Bloomberg Commodity Index Total ReturnSM2 | 45.61 | % | 3.03 | % | ||||
| * | The inception date is the date the fund started accruing expenses and commenced operations. Shares of SDCI were listed on the NYSE Arca, Inc. on May 3, 2018. |
| 7 |
| 1 | The SummerHaven Dynamic Commodity Index Total ReturnSM (“SDCITR”) is an index designed to reflect the performance of a fully margined and collateralized portfolio of exchange-traded commodities futures contracts. The total return of the SDCITR is based upon the market price movements of its component futures contracts and the return on the hypothetical investments used to collateralize those futures contracts. At any time, the SDCITR is comprised of 14 commodity futures contracts (the “Component Futures Contracts”), weighted equally by notional amount, selected each month based upon a universe of 27 eligible commodities and futures contracts for those commodities. The eligible futures contracts are traded on the Futures Exchanges in major industrialized countries, and typically have active and liquid markets. The eligible futures contracts are physical non-financial commodity futures contracts traded on the Futures Exchanges in major industrialized countries, and typically have active and liquid markets. The eligible futures contracts are denominated in U.S. dollars. Beginning with the commodity selection process that commenced on December 24, 2020, the universe of eligible commodities is categorized into five commodity sectors. Specifically, there are four primary commodity sectors (petroleum; precious metals; industrial metals; and grains) and a non-primary sector. The SDCITR is rules-based and reconstituted and rebalanced monthly using quantitative formulas, subject to the constraint that each of the four primary commodity sectors must be represented by at least one Component Futures Contract. There is no requirement that the non-primary sector be so represented. Previously, the universe of eligible futures commodities were categorized into six sectors: energy; precious metals; industrial metals; grains; softs; and livestock. |
| 2 | The Bloomberg Commodity Index Total ReturnSM (“BCOM”) is an index that tracks the performance of 22 broadly diversified commodity futures contracts. Prior to July 1, 2014, BCOM was known as the Dow Jones-UBS Commodity Index. |
The performance shown represents past performance. Past performance is no guarantee of future results and current performance may be higher or lower than the performance shown. Return calculations assume the reinvestment of distributions and do not reflect taxes that a shareholder would pay on distributions or on the sale of shares. Principal value and investments returns will fluctuate and investors’ shares, when sold, may be worth more or less than the original cost. To obtain the most recent month-end performance data visit www.uscfinvestments.com or call 1-800-920-0259.
The Fund’s NAV is calculated by dividing the value of the Fund’s total assets less its total liabilities by the number of shares outstanding. Share price returns are based on closing prices for the Fund and do not represent the returns an investor would receive if shares were traded at other times.
Shares of ETFs are bought and sold at market price (not NAV) and are not individually redeemed from the Fund. Brokerage commissions apply and will reduce returns. Market returns are based upon the midpoint of the bid/ask spread at 4:00 p.m. Eastern time (when NAV is normally determined for most ETFs), and do not represent the returns you would receive if you traded shares at other times.
| 8 | Annual Report June 30, 2021 |
COMPARISON OF CHANGE IN VALUE OF $10,000 INVESTMENT IN USCF
MIDSTREAM ENERGY INCOME FUND (“UMI”) AND ALERIAN MIDSTREAM
ENERGY SELECT TOTAL RETURN INDEX FROM MARCH 23, 2021
(INCEPTION DATE)* TO JUNE 30, 2021.
The following graph shows the value as of June 30, 2021 of a $10,000 investment made on March 23, 2021 (commencement of operations). For comparative purposes, the performance of USCF Midstream Energy Fund (Net Asset Value and Market Value) and the performance of Alerian Midstream Energy Select Total Return Index are shown.
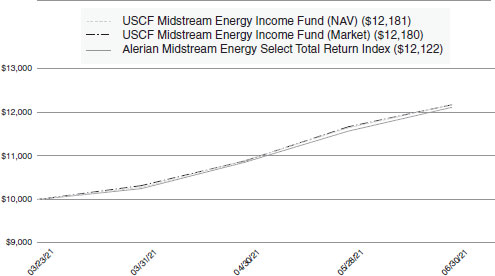
| Since Inception Return^ (3/23/2021) | ||||
| USCF Midstream Energy Income Fund (NAV) | 21.83 | % | ||
| USCF Midstream Energy Income Fund (Market Value) | 21.80 | % | ||
| Alerian Midstream Energy Select Total Return Index | 21.22 | % | ||
| * | The inception date is the date the fund started accruing expenses and commenced operations. Shares of UMI were listed on the NYSE Arca, Inc. on March 24, 2021. |
| ^ | Returns for periods of less than one year are not annualized. |
| 1 | The Alerian Midstream Energy Select Total Return Index is a composite of North American energy infrastructure companies. The capped, float-adjusted, capitalization-weighted index, whose constituents are engaged in midstream activities involving energy commodities, is disseminated real-time on a total-return basis. |
| 9 |
The performance shown represents past performance. Past performance is no guarantee of future results and current performance may be higher or lower than the performance shown. Return calculations assume the reinvestment of distributions and do not reflect taxes that a shareholder would pay on distributions or on the sale of shares. Principal value and investments returns will fluctuate and investors’ shares, when sold, may be worth more or less than the original cost. To obtain the most recent month-end performance data visit www.uscfinvestments.com or call 1-800-920-0259.
The Fund’s NAV is calculated by dividing the value of the Fund’s total assets less its total liabilities by the number of shares outstanding. Share price returns are based on closing prices for the Fund and do not represent the returns an investor would receive if shares were traded at other times.
Shares of ETFs are bought and sold at market price (not NAV) and are not individually redeemed from the Fund. Brokerage commissions apply and will reduce returns. Market returns are based upon the midpoint of the bid/ask spread at 4:00 p.m. Eastern time (when NAV is normally determined for most ETFs), and do not represent the returns you would receive if you traded shares at other times.
| 10 | Annual Report June 30, 2021 |
As a shareholder of one or more of the USCF SummerHaven Dynamic Commodity Strategy No K-1 Fund and the USCF Midstream Energy Income Fund (each a “Fund” and collectively, the “Funds”), each of which is a series of the USCF ETF Trust (the “Trust”), you may incur two potential types of costs: (1) transaction costs, such as brokerage commissions, for purchasing and selling your Fund shares, and (2) ongoing costs, including management fees and other Fund expenses. The following examples are intended to help you understand your ongoing costs (in dollars) of investing in a Fund and to compare these costs with the ongoing costs of investing in other funds. The examples are based on an investment of $1,000 invested at the beginning of the period and held for the entire period from January 1, 2021 until June 30, 2021.
Actual Return. The table below provides information about actual account values and actual expenses. You may use the information in this table, together with the amount you invested, to estimate the expenses that you paid over the period. Simply divide your account value by $1,000 (for example, $8,600 account value divided by $1,000 = 8.6), then multiply the result by the number under the heading “Actual Expenses Paid During the Period” to estimate the expenses you paid on your account during this period.
Hypothetical 5% Return. The table below provides information about hypothetical account values and hypothetical expenses based on each Fund’s actual expense ratio and an assumed rate of return of 5% per year before expenses, which is not the Fund’s actual return. The hypothetical account values and expenses may not be used to estimate the actual ending account balance or expenses you paid for the period. You may use this information to compare ongoing costs of investing in the Fund and other exchange-traded funds. To do so, compare this 5% hypothetical example with the 5% hypothetical examples that appear in the shareholder reports of the other funds.
The expenses shown in the table are meant to highlight ongoing costs only and do not reflect any transaction fees, such as brokerage commission paid on purchases and sales of Fund shares. Therefore, the number under the heading “Hypothetical Expenses Paid During the Period” is useful in comparing ongoing costs only and may not help you determine the relative total costs of owning different funds.
| 11 |
Fund |
Beginning |
Ending |
Annualized | Expenses | ||||||||||||
| USCF SummerHaven Dynamic Commodity Strategy No K-1 Fund | ||||||||||||||||
| Actual(a) | $ | 1,000.00 | $ | 1,264,60 | 0.60 | % | $ | 3.37 | ||||||||
| Hypothetical (5% return before expenses) | $ | 1,000.00 | $ | 1,021.82 | 0.60 | % | $ | 3.01 | ||||||||
| USCF Midstream Energy Income Fund | ||||||||||||||||
| Actual(b) | $ | 1,000.00 | $ | 1,218.30 | 0.85 | % | $ | 2.56 | ||||||||
| Hypothetical (5% return before expenses) | $ | 1,000.00 | $ | 1,020.58 | 0.85 | % | $ | 4.26 | ||||||||
| (a) | Expenses (net of fee waivers and/or expense reimbursements) are equal to the Funds’ annualized expense ratio multiplied by the average account value over the period, multiplied by the number of days (181 days) in the most recent fiscal half-year, then divided by 365 (to reflect the one-half year period). |
| (b) | Expenses (net of fee waivers and/or expense reimbursements) are equal to the Funds’ annualized expense ratio multiplied by the average account value over the period, multiplied by the number of days (99 days) in the most recent fiscal half-year, then divided by 365 (to reflect the one-half year period). |
| 12 | Annual Report June 30, 2021 |
USCF ETF TRUST
USCF SUMMERHAVEN DYNAMIC COMMODITY STRATEGY NO K-1 FUND
CONSOLIDATED SCHEDULE OF INVESTMENTS
AT JUNE 30, 2021
Besides the following listed commodity futures contracts and money market funds of the Fund and its wholly-owned subsidiary, there were no additional investments held by the Fund at June 30, 2021.
The following commodity futures contracts of the Fund’s wholly-owned subsidiary were open at June 30, 2021 (see Security Valuation in the Notes to Financial Statements):
| Number of Contracts | Notional Amount | Expiration Date | Fair Value/ Unrealized Gain (Loss) on Open Commodity Contracts | % of Total Net Assets | ||||||||||||||||
| Open Commodity Futures Contracts – Long | ||||||||||||||||||||
| Foreign Contracts | ||||||||||||||||||||
| LME Nickel Futures LN, July 2021 contracts | 6 | $ | 633,987 | Jul-21 | $ | 21,429 | 0.3 | % | ||||||||||||
| LME Tin Futures LT, July 2021 contracts | 4 | 619,040 | Jul-21 | 38,560 | 0.5 | % | ||||||||||||||
| LME Zinc Futures LX, July 2021 contracts | 3 | 208,896 | Jul-21 | 13,873 | 0.2 | % | ||||||||||||||
| LME Nickel Futures LN, August 2021 contracts | 5 | 550,068 | Aug-21 | (3,828 | ) | (0.1 | )% | |||||||||||||
| LME Tin Futures LT, August 2021 contracts | 4 | 646,020 | Aug-21 | 1,580 | 0.0 | %(a) | ||||||||||||||
| ICE Brent Crude Futures CO, December 2021 contracts | 8 | 506,900 | Oct-21 | 72,060 | 0.9 | % | ||||||||||||||
| 30 | 3,164,911 | 143,674 | 1.8 | % | ||||||||||||||||
| United States Contracts | ||||||||||||||||||||
| CME Lean Hogs Futures LH, August 2021 contracts | 14 | 573,800 | Aug-21 | 4,400 | 0.0 | %(a) | ||||||||||||||
| CME Live Cattle Futures LC, August 2021 contracts | 12 | 586,860 | Aug-21 | 2,220 | 0.0 | %(a) | ||||||||||||||
| CBOT Corn Futures C, September 2021 contracts | 22 | 620,088 | Sep-21 | 39,087 | 0.5 | % | ||||||||||||||
| CBOT Soybean Oil Futures BO, September 2021 contracts | 16 | 583,362 | Sep-21 | 22,494 | 0.3 | % | ||||||||||||||
| COMEX Copper Futures HG, September 2021 contracts | 5 | 560,587 | Sep-21 | (24,462 | ) | (0.3 | )% | |||||||||||||
| COMEX Silver Futures SI, September 2021 contracts | 4 | 560,035 | Sep-21 | (36,155 | ) | (0.5 | )% | |||||||||||||
| CBOT Soybean Meal Futures SM, October 2021 contracts | 16 | 615,800 | Oct-21 | (9,720 | ) | (0.1 | )% | |||||||||||||
| COMEX Gold 100 OZ Futures GC, October 2021 contracts. | 3 | 533,610 | Oct-21 | (1,560 | ) | (0.0 | )%(b) | |||||||||||||
| NYMEX RBOB Gasoline Futures RB, November 2021 contracts | 7 | 572,893 | Oct-21 | 32,365 | 0.4 | % | ||||||||||||||
The accompanying notes are an integral part of the financial statements.
| 13 |
USCF ETF TRUST
USCF SUMMERHAVEN DYNAMIC COMMODITY STRATEGY NO K-1 FUND
CONSOLIDATED SCHEDULE OF INVESTMENTS
AT JUNE 30, 2021 (continued)
| Number of Contracts | Notional Amount | Expiration Date | Fair Value/ Unrealized Gain (Loss) on Open Commodity Contracts | % of Total Net Assets | ||||||||||||||||
| United States Contracts (continued) | ||||||||||||||||||||
| CBOT Soybean Futures, November 2021 contracts | 9 | $ | 594,825 | Nov-21 | $ | 34,725 | 0.4 | % | ||||||||||||
| NYMEX WTI Crude Futures CL, December 2021 contracts | 8 | 473,430 | Nov-21 | 87,610 | 1.1 | % | ||||||||||||||
| 116 | 6,275,290 | 151,004 | 1.8 | % | ||||||||||||||||
| Open Commodity Futures Contracts—Short(c) | ||||||||||||||||||||
| Foreign Contracts | ||||||||||||||||||||
| LME Nickel Futures LN, July 2021 contracts | 6 | (661,452 | ) | Jul-21 | 6,036 | 0.1 | % | |||||||||||||
| LME Tin Futures LT, July 2021 contracts | 4 | (657,680 | ) | Jul-21 | 80 | 0.0 | %(a) | |||||||||||||
| LME Zinc Futures LX, July 2021 contracts | 3 | (208,498 | ) | Jul-21 | (14,271 | ) | (0.2 | )% | ||||||||||||
| 13 | (1,527,630 | ) | (8,155 | ) | (0.1 | )% | ||||||||||||||
| Total Open Commodity Futures Contracts(d) | 159 | $ | 7,912,571 | $ | 286,523 | 3.5 | % | |||||||||||||
The accompanying notes are an integral part of the financial statements.
| 14 | Annual Report June 30, 2021 |
USCF ETF TRUST
USCF SUMMERHAVEN DYNAMIC COMMODITY STRATEGY NO K-1 FUND
CONSOLIDATED SCHEDULE OF INVESTMENTS
AT JUNE 30, 2021 (continued)
| Principal Amount | Market Value | % of Total Net Assets | ||||||||||
| Cash Equivalents | ||||||||||||
| United States – Money Market Funds | ||||||||||||
| Goldman Sachs Financial Square Government Fund – Institutional Shares, 0.03%(e) | 2,092,609 | 2,092,609 | 25.4 | % | ||||||||
| RBC U.S. Government Money Market Fund – Institutional Shares, 0.03%(e) | 4,964,326 | 4,964,326 | 60.4 | % | ||||||||
| Total Money Market Funds (Cost $7,056,935) | $ | 7,056,935 | 85.8 | % | ||||||||
| Total Investments (Cost $7,056,935) | $ | 7,343,458 | 89.3 | % | ||||||||
| Other Assets in Excess of Liabilities | 876,954 | 10.7 | % | |||||||||
| Total Net Assets | $ | 8,220,412 | 100.0 | % | ||||||||
| (a) | Position represents less than 0.05%. |
| (b) | Position represents greater than (0.05)%. |
| (c) | All short contracts are offset by long positions in commodity futures contracts and are acquired solely for the purpose of reducing a long position (e.g., due to a redemption or to reflect a rebalancing of the SDCI). |
| (d) | Collateral amounted to $799,647 on open commodity futures contracts. |
| (e) | Reflects the 7-day yield at June 30, 2021. |
| Summary of Investments by Country^ | ||||
| United States | 98.2 | % | ||
| United Kingdom | 1.8 | |||
| 100.0 | % | |||
| ^ | As a percentage of total investments. |
.
The accompanying notes are an integral part of the financial statements.
| 15 |
USCF ETF TRUST
USCF MIDSTREAM ENERGY INCOME FUND
SCHEDULE OF INVESTMENTS
AT JUNE 30, 2021
| % of Total Net Assets | Shares | Market Value | ||||||||||
| Common Stocks | 75.0 | % | ||||||||||
| Pipelines | 75.0 | % | ||||||||||
| Cheniere Energy, Inc.(a) | 6.4 | % | 74,052 | 6,423,270 | ||||||||
| Enbridge, Inc | 9.0 | % | 223,305 | 8,941,132 | ||||||||
| EnLink Midstream LLC(a) | 2.3 | % | 354,401 | 2,264,622 | ||||||||
| Equitrans Midstream Corp | 2.7 | % | 321,396 | 2,735,080 | ||||||||
| Gibson Energy, Inc. | 3.7 | % | 194,888 | 3,737,858 | ||||||||
| Hess Midstream LP – Class A | 2.6 | % | 103,702 | 2,618,476 | ||||||||
| Inter Pipeline Ltd. | 2.8 | % | 172,352 | 2,804,565 | ||||||||
| Keyera Corp. | 4.7 | % | 172,626 | 4,643,602 | ||||||||
| Kinder Morgan, Inc. | 6.8 | % | 374,231 | 6,822,231 | ||||||||
| ONEOK, Inc. | 4.5 | % | 81,491 | 4,534,159 | ||||||||
| Pembina Pipeline Corp. | 4.4 | % | 136,748 | 4,344,484 | ||||||||
| Plains GP Holdings LP – Class A(a) | 4.6 | % | 382,171 | 4,563,122 | ||||||||
| Targa Resources Corp. | 10.0 | % | 224,264 | 9,968,535 | ||||||||
| TC Energy Corp. | 6.2 | % | 124,780 | 6,179,106 | ||||||||
| Williams Cos., Inc. (The) | 4.3 | % | 160,752 | 4,267,966 | ||||||||
| 74,848,208 | ||||||||||||
| Total Common Stocks | ||||||||||||
| (Cost $65,717,758) | 75.0 | % | 74,848,208 | |||||||||
| Master Limited Partnerships | 24.3 | % | ||||||||||
| Gas | 2.7 | % | ||||||||||
| Western Midstream Partners LP | 2.7 | % | 127,364 | 2,728,137 | ||||||||
| Pipelines | 21.6 | % | ||||||||||
| DCP Midstream LP | 1.8 | % | 59,160 | 1,815,620 | ||||||||
| Energy Transfer LP | 4.5 | % | 424,196 | 4,509,204 | ||||||||
| Enterprise Products Partners LP | 9.2 | % | 378,139 | 9,124,494 | ||||||||
| Holly Energy Partners LP | 0.5 | % | 22,780 | 515,511 | ||||||||
| Magellan Midstream Partners LP | 1.5 | % | 30,786 | 1,505,743 | ||||||||
| MPLX LP | 4.1 | % | 137,088 | 4,059,176 | ||||||||
| 21,529,748 | ||||||||||||
| Total Master Limited Partnerships | ||||||||||||
| (Cost $20,801,816) | 24.3 | % | 24,257,885 | |||||||||
| Money Market Funds | 0.6 | % | ||||||||||
| Dreyfus Government Cash Management Fund, Institutional Shares, 0.03% (Cost $583,532) | 0.6 | % | 583,532 | 583,532 | ||||||||
| Total Investments | ||||||||||||
| (Cost $87,103,106) | 99.9 | % | 99,689,625 | |||||||||
| Other Assets in Excess of Liabilities | 0.1 | % | 95,576 | |||||||||
| Total Net Assets | 100.0 | % | $ | 99,785,201 | ||||||||
| (a) | Non-income producing security. |
The accompanying notes are an integral part of the financial statements.
| 16 | Annual Report June 30, 2021 |
USCF ETF TRUST
USCF MIDSTREAM ENERGY INCOME FUND
SCHEDULE OF INVESTMENTS
AT JUNE 30, 2021 (CONTINUED)
| Summary of Investments by Country^ | ||||
| United States | 69.3 | % | ||
| Canada | 30.7 | |||
| 100.0 | % | |||
| Summary of Investments by Sector^ | ||||
| Energy | 99.4 | % | ||
| Money Market Fund | 0.6 | |||
| 100.0 | % | |||
| ^ | As a percentage of total investments. |
The accompanying notes are an integral part of the financial statements.
| 17 |
USCF ETF TRUST
USCF SUMMERHAVEN DYNAMIC COMMODITY STRATEGY NO K-1 FUND
CONSOLIDATED STATEMENT OF ASSETS AND LIABILITIES
JUNE 30, 2021
| Assets: | ||||
| Investments, at Market Value: | ||||
| Cash and Cash Equivalents | $ | 7,056,935 | ||
| Net Unrealized Appreciation (Depreciation) on Open Commodity Futures Contracts | 286,523 | |||
| Cash | 18,718 | |||
| Receivables: | ||||
| Deposit with broker for futures contracts | 799,647 | |||
| Variation margin on futures contracts | 63,459 | |||
| Dividends and Interest | 135 | |||
| Other Assets | 676 | |||
| Total Assets | 8,226,093 | |||
| Liabilities: | ||||
| Payables: | ||||
| Accrued Management Fees | 5,681 | |||
| Total Liabilities | 5,681 | |||
| Total Net Assets | $ | 8,220,412 | ||
| Net Assets Consist of: | ||||
| Capital Paid In | $ | 7,984,622 | ||
| Total Distributable Earnings (Loss) | 235,790 | |||
| Total Net Assets | $ | 8,220,412 | ||
| Net Asset Value Per Share: | ||||
| Total Net Assets | $ | 8,220,412 | ||
| Shares of Beneficial Interest Outstanding (Unlimited Shares of $0.001 Par Value Authorized) | 400,000 | |||
| Net Asset Value | $ | 20.55 | ||
| Investments, at Cost | $ | 7,056,935 |
The accompanying notes are an integral part of the financial statements.
| 18 | Annual Report June 30, 2021 |
USCF ETF TRUST
USCF MIDSTREAM ENERGY INCOME FUND
STATEMENT OF ASSETS AND LIABILITIES
JUNE 30, 2021
| Assets: | ||||
| Investments, at Market Value | $ | 99,689,625 | ||
| Receivables: | ||||
| Dividends | 164,803 | |||
| Interest | 29 | |||
| Total Assets | 99,854,457 | |||
| Liabilities: | ||||
| Due to custodian | 799 | |||
| Payables: | ||||
| Accrued Management Fees | 68,457 | |||
| Total Liabilities | 69,256 | |||
| Total Net Assets | $ | 99,785,201 | ||
| Net Assets Consist of: | ||||
| Capital Paid In | $ | 87,134,787 | ||
| Total Distributable Earnings (Loss) | 12,650,414 | |||
| Total Net Assets | $ | 99,785,201 | ||
| Net Asset Value Per Share: | ||||
| Total Net Assets | $ | 99,785,201 | ||
| Shares of Beneficial Interest Outstanding (Unlimited Shares of $0.001 Par Value Authorized) | 3,400,000 | |||
| Net Asset Value | $ | 29.35 | ||
| Investments, at Cost | $ | 87,103,106 |
The accompanying notes are an integral part of the financial statements.
| 19 |
USCF ETF TRUST
USCF SUMMERHAVEN DYNAMIC COMMODITY STRATEGY NO K-1 FUND
CONSOLIDATED STATEMENT OF OPERATIONS
FOR THE YEAR ENDED JUNE 30, 2021
| Investment Income: | ||||
| Interest Income | $ | 1,375 | ||
| Total Investment Income | 1,375 | |||
| Expenses: | ||||
| Management Fees | 30,842 | |||
| Total Expenses | 30,842 | |||
| Less Fees Waived (Note 4) | (7,710 | ) | ||
| Net Expenses | 23,132 | |||
| Net Investment Income (Loss) | (21,757 | ) | ||
| Realized and Unrealized Gain (Loss) on Investments: | ||||
| Net Realized Gain (Loss) on Commodity Futures Contracts(a) | 1,248,514 | |||
| Net Change in Unrealized Appreciation (Depreciation) on Commodity Futures Contracts | 246,824 | |||
| Net Change in Realized and Unrealized Gain (Loss) on Commodity Futures Contracts | 1,495,338 | |||
| Net Increase (Decrease) in Net Assets Resulting from Operations | $ | 1,473,581 |
| (a) | Net of commissions of $3,482. |
The accompanying notes are an integral part of the financial statements.
| 20 | Annual Report June 30, 2021 |
USCF ETF TRUST
USCF MIDSTREAM ENERGY INCOME FUND
FOR THE PERIOD ENDED JUNE 30, 2021*
Investment Income: | ||||
| Dividend Income (less net foreign withholding tax $61,126) | $ | 750,386 | ||
| Total Investment Income | 750,386 | |||
| Expenses: | ||||
| Management Fees | 174,897 | |||
| Total Expenses | 174,897 | |||
| Net Investment Income (Loss) | 575,489 | |||
| Realized and Unrealized Gain (Loss) on Investments: | ||||
| Net Realized Gain (Loss) on: | ||||
| Investments | 78,580 | |||
| Foreign currency translations | (6,173 | ) | ||
| Net realized gain (loss) | 72,407 | |||
| Net change in unrealized appreciation (depreciation) on: | ||||
| Investments | 12,586,519 | |||
| Foreign currency translations | 15 | |||
| Net change in unrealized appreciation (depreciation) | 12,586,534 | |||
| Net Change in Realized and Unrealized Gain (Loss) on Investments | 12,658,941 | |||
| Net Increase (Decrease) in Net Assets Resulting from Operations | $ | 13,234,430 |
| * | Inception Date, March 23, 2021. |
The accompanying notes are an integral part of the financial statements.
| 21 |
USCF ETF TRUST
USCF SUMMERHAVEN DYNAMIC COMMODITY STRATEGY NO K-1 FUND
CONSOLIDATED STATEMENTS OF CHANGES IN NET ASSETS
| For the Year Ended June 30, | ||||||||
| 2021 | 2020 | |||||||
| Operations: | ||||||||
| Net Investment Income (Loss) | $ | (21,757 | ) | $ | 33,908 | |||
| Net Realized Gain (Loss) | 1,248,514 | (1,624,675 | ) | |||||
| Net Changes in Unrealized Appreciation (Depreciation) | 246,824 | 60,033 | ||||||
| Net Increase (Decrease) in Net Assets Resulting from Operations | 1,473,581 | (1,530,734 | ) | |||||
| Distributions to Shareholders from: | ||||||||
| Net Investment Income | — | (31,428 | ) | |||||
| Total Distributions to Shareholders | — | (31,428 | ) | |||||
| Shareholder Transactions: | ||||||||
| Proceeds from Shares Sold | 4,112,517 | 1,826,792 | ||||||
| Cost of Shares Redeemed | — | (1,321,701 | ) | |||||
| Net Increase (Decrease) in Net Assets from Shares Transactions | 4,112,517 | 505,091 | ||||||
| Net Increase (Decrease) in Net Assets | 5,586,098 | (1,057,071 | ) | |||||
| Net Assets: | ||||||||
| Beginning of Year | 2,634,314 | 3,691,385 | ||||||
| End of Year | $ | 8,220,412 | $ | 2,634,314 | ||||
| Changes in Shares Outstanding: | ||||||||
| Shares Outstanding, Beginning of Year | 200,000 | 200,000 | ||||||
| Shares Issued | 200,000 | 100,000 | ||||||
| Shares Issued in Reinvestment of Dividends and Distributions | — | — | ||||||
| Shares Redeemed | — | (100,000 | ) | |||||
| Shares Outstanding, End of Year | 400,000 | 200,000 | ||||||
The accompanying notes are an integral part of the financial statements.
| 22 | Annual Report June 30, 2021 |
USCF ETF TRUST
USCF MIDSTREAM ENERGY INCOME FUND
STATEMENTS OF CHANGES IN NET ASSETS
| For the Period Ended June 30, 2021* | ||||
| Operations: | ||||
| Net Investment Income (Loss) | $ | 575,489 | ||
| Net Realized Gain (Loss) | 72,407 | |||
| Net Changes in Unrealized Appreciation (Depreciation) | 12,586,534 | |||
| Net Increase (Decrease) in Net Assets Resulting from Operations | 13,234,430 | |||
| Distributions to Shareholders from: | ||||
| Net Investment Income | (584,016 | ) | ||
| Return of Capital | (221,613 | ) | ||
| Total Distributions to Shareholders | (805,629 | ) | ||
| Shareholder Transactions: | ||||
| Proceeds from Shares Sold | 87,356,400 | |||
| Shares Issued as Reinvestment of Dividends and Distributions | — | |||
| Cost of Shares Redeemed | — | |||
| Net Increase (Decrease) in Net Assets from Shares Transactions | 87,356,400 | |||
| Net Increase (Decrease) in Net Assets | 99,785,201 | |||
| Net Assets: | ||||
| Beginning of Period | — | |||
| End of Period | $ | 99,785,201 | ||
| Changes in Shares Outstanding: | ||||
| Shares Outstanding, Beginning of Period | — | |||
| Shares Issued | 3,400,000 | |||
| Shares Issued in Reinvestment of Dividends and Distributions | — | |||
| Shares Redeemed | — | |||
| Shares Outstanding, End of Period | 3,400,000 | |||
| * | Inception Date, March 23, 2021. |
The accompanying notes are an integral part of the financial statements.
| 23 |
USCF ETF TRUST
USCF SUMMERHAVEN DYNAMIC COMMODITY STRATEGY NO K-1 FUND
CONSOLIDATED FINANCIAL HIGHLIGHTS
SELECTED DATA FOR A SHARE OF COMMON STOCK OUTSTANDING
THROUGHOUT THE PERIOD INDICATED:
| For the | ||||||||||||||||
| Period Ended | ||||||||||||||||
| For the Year Ended June 30, | June 30, | |||||||||||||||
| 2021 | 2020 | 2019 | 2018* | |||||||||||||
| Net Asset Value, Beginning of Period | $ | 13.17 | $ | 18.46 | $ | 21.94 | $ | 22.00 | ||||||||
| Income (Loss) from Operations: | ||||||||||||||||
| Net Investment Income (Loss)(a) | (0.09 | ) | 0.12 | 0.26 | 0.02 | |||||||||||
| Net Realized and Unrealized Gain (Loss) | 7.47 | (5.31 | ) | (3.54 | ) | (0.06 | ) | |||||||||
| Total Income (Loss) from Operations | 7.38 | (5.19 | ) | (3.28 | ) | (0.04 | ) | |||||||||
| Less Distributions From: | ||||||||||||||||
| Net Investment Income (Loss) | — | (0.10 | ) | (0.20 | ) | (0.02 | ) | |||||||||
| Total Distributions | — | (0.10 | ) | (0.20 | ) | (0.02 | ) | |||||||||
| Net Assets Value, End of Period | $ | 20.55 | $ | 13.17 | $ | 18.46 | $ | 21.94 | ||||||||
| Total Return(b) | 56.04 | % | (28.20 | )% | (14.98 | )% | (0.17 | )% | ||||||||
| Net Assets, End of Period (thousands) | $ | 8,220 | $ | 2,634 | $ | 3,691 | $ | 8,774 | ||||||||
| Ratios of Average Net Assets: | ||||||||||||||||
| Gross Expenses | 0.80 | %(c) | 0.94 | %(c) | 0.80 | % | 0.80 | %(d) | ||||||||
| Net Expenses | 0.60 | %(c) | 0.77 | %(c) | 0.80 | % | 0.80 | %(d) | ||||||||
| Net Investment Income (Loss) | (0.56 | )% | 0.73 | % | 1.27 | % | 0.67 | %(d) | ||||||||
| Portfolio Turnover Rate(e) | 0 | % | 0 | % | 123 | % | 19 | % | ||||||||
| * | Inception Date, May 2, 2018. |
| (a) | Per share amounts have been calculated using the average shares method. |
| (b) | Total Return reflects fee waivers and/or expense reimbursement and assumes reinvestment of dividend distributions. In the absence of fee waivers and/or expense reimbursement, the total return would have been lower. Past performance is no guarantee of future results. |
| (c) | Effective August 15, 2019, USCF Advisers, LLC (“the Adviser”) contractually agreed through October 31, 2021 to waive 0.20% of its management fees. |
| (d) | Annualized. |
| (e) | Portfolio turnover rate is not annualized for periods less than one year and does not include securities received or delivered from processing creations or redemptions. |
The accompanying notes are an integral part of the financial statements.
| 24 | Annual Report June 30, 2021 |
USCF ETF TRUST
USCF MIDSTREAM ENERGY INCOME FUND
SELECTED DATA FOR A SHARE OF COMMON STOCK OUTSTANDING
THROUGHOUT THE PERIOD INDICATED:
| For the Period Ended June 30, 2021* | ||||
| Net Asset Value, Beginning of Period | $ | 24.29 | ||
| Income (Loss) from Operations: | ||||
| Net Investment Income (Loss)(a) | 0.21 | |||
| Net Realized and Unrealized Gain (Loss) | 5.09 | |||
| Total Income (Loss) from Operations | 5.30 | |||
| Less Distributions From: | ||||
| Net Investment Income (Loss) | (0.18 | ) | ||
| Return of Capital | (0.06 | ) | ||
| Total Distributions | (0.24 | ) | ||
| Net Assets Value, End of Period | $ | 29.35 | ||
| Total Return(b) | 21.83 | % | ||
| Net Assets, End of Period (thousands) | $ | 99,785 | ||
| Ratios of Average Net Assets: | ||||
| Gross Expenses | 0.85 | %(c) | ||
| Net Expenses | 0.85 | %(c) | ||
| Net Investment Income (Loss) | 2.80 | %(c) | ||
| Portfolio Turnover Rate(d) | 8 | % | ||
| * | Inception Date, March 23, 2021. |
| (a) | Per share amounts have been calculated using the average shares method. |
| (b) | Total Return reflects fee waivers and/or expense reimbursement and assumes reinvestment of dividend distributions. In the absence of fee waivers and/or expense reimbursement, the total return would have been lower. Past performance is no guarantee of future results. |
| (c) | Annualized. |
| (d) | Portfolio turnover rate is not annualized for periods less than one year and does not include securities received or delivered from processing creations or redemptions. |
The accompanying notes are an integral part of the financial statements.
| 25 |
USCF ETF TRUST
NOTES TO FINANCIAL STATEMENTS
JUNE 30, 2021
NOTE 1 – ORGANIZATION
The USCF ETF Trust (the “Trust”) was organized as a Delaware statutory trust in accordance with a Declaration of Trust dated November 6, 2013. The Declaration of Trust was amended and restated on June 16, 2014. The Trust is authorized to have multiple segregated series or portfolios. The Trust is an open-end management investment company registered under the Investment Company Act of 1940 (the “1940 Act”). The Trust currently consists of two investment portfolios, each of which is an exchange-traded fund (“ETF”): the USCF SummerHaven Dynamic Commodity Strategy No K-1 Fund (“SDCI”) and the USCF Midstream Energy Income Fund (“UMI”) (each a “Fund” and collectively, the “Funds”). SDCI commenced operations on May 2, 2018. Shares of SDCI were listed on the NYSE Arca Equity, Inc. (“NYSE Arca”) on May 3, 2018. UMI commenced operations on March 23, 2021. Shares of UMI were listed on NYSE Arca on March 24, 2021. Other series or portfolios may be added to the Trust in the future. The Adviser serves as the investment adviser to each of the Funds and USCF Cayman Commodity 2, the wholly-owned subsidiary of SDCI (the “Subsidiary”). The Adviser has been registered as an investment adviser with the Securities Exchange Commission (the “SEC”) since July 1, 2014 and is a wholly-owned subsidiary of Wainwright Holdings, Inc. SummerHaven Investment Management, LLC serves as the sub-adviser to the Subsidiary. Miller/Howard Investments, Inc. serves as the sub-adviser to UMI.
NOTE 2 – SIGNIFICANT ACCOUNTING POLICIES
The accompanying financial statements were prepared in accordance with U. S. Generally Accepted Accounting Principles (“GAAP”), which require the use of estimates and assumptions made by management. These may affect the reported amounts of assets and liabilities and disclosure of contingent assets and liabilities at the date of the financial statements and the reported amounts of increases and decreases in net assets from operations during the reporting period. Actual results could differ from those estimates. The following is a summary of significant accounting policies consistently followed by the Funds in preparation of their financial statements.
Basis of Presentation
The financial statements have been prepared in conformity with GAAP as detailed in the Financial Accounting Standards Board’s (“FASB”) Accounting Standards Codification (“ASC”). The Funds are investment companies and follow the accounting and reporting guidance in FASB Topic 946.
| 26 | Annual Report June 30, 2021 |
Calculation of Net Asset Value
The Net Asset Value (“NAV”) of a Fund’s shares is calculated each day the national securities exchanges are open for trading. The NAV for SDCI is generally calculated at 2:30 p.m. Eastern Time. For UMI, the NAV is calculated as of the close of regular trading on NYSE Arca, generally 4:00 p.m. Eastern Time. For each Fund, the time at which its NAV is calculated as described herein is it’s “NAV Calculation Time”. If regular trading on NYSE Arca closes earlier than a Fund’s NAV Calculation Time, such Fund’s NAV will be calculated as of that earlier time. NAV per share is calculated by dividing the Fund’s net assets by the number of the Fund’s outstanding shares.
In calculating its NAV, a Fund generally values its assets based on market quotations, last sale prices, or estimates of value furnished by a pricing service or brokers who make markets in such instruments. Debt obligations with maturities of 60 days or less are valued at amortized cost.
Fair value pricing is used by a Fund when reliable market valuations are not readily available or are not deemed to reflect current market values. Securities that may be valued using “fair value” pricing may include, but are not limited to, securities for which there are no current market quotations or whose issuer is in default or bankruptcy, securities subject to corporate actions (such as mergers or reorganizations), securities subject to non-U.S. Investment limits or currency controls, and securities affected by “significant events.” An example of a significant event is an event, occurring after the close of the market in which a security trades but before a Fund’s next NAV Calculation Time that may materially affect the value of the Fund’s investment (e.g., government action, natural disaster, or significant market fluctuation). When fair-value pricing is employed, the prices of securities used by a Fund to calculate its NAV may differ from quoted or published prices for the same securities.
The value of the Funds’ assets that trade in markets outside the United States may fluctuate on days that foreign markets are open (which may include non-Business Days). As such, the value of the Funds’ investments may change on days when you will not be able to purchase or redeem the Funds’ shares.
Security Valuation
i. Securities
Investments by any Fund in securities are carried at market value. All equity securities that are traded on a national securities exchange are valued at the last sale price at the time of the close of the New York Stock Exchange (“NYSE”). If on a particular day an exchange-listed security does not trade, then the mean between the closing bids and asked prices will be used. In the case of securities listed on more than one national securities exchange, the last quoted sale, up to the time of valuation, on the exchange on which the security is principally traded will be used. If there were no sales on that exchange, the last quoted sale on the other exchange will be used.
| 27 |
For securities held by any Fund that are traded on the NASDAQ, the NASDAQ Official Closing Price (e.g., the NASDAQ Closing Cross price, if available) is used. All non- NASDAQ equity securities that are not traded on a listed exchange are valued at the last sale price at the close of the NYSE. If a non-exchange listed security does not trade on a particular day, or if a last sales price or NASDAQ Official Closing Price is not available, then the mean between the closing bid and asked price will be used.
Securities having a remaining maturity of 60 days or less are valued at amortized cost, which approximates market value.
The cost of securities sold is determined on the identified cost basis. When market quotations are not readily available or when events occur that make established valuation methods unreliable, securities of the Funds may be valued at fair value determined in good faith by or under the direction of the Board of Trustees (the “Board”).
Security transactions are recorded on the dates the transactions are entered, which is the trade date.
ii. Master Limited Partnerships
UMI may invest up to 25% of its total assets in certain master limited partnerships (“MLPs”). MLPs are a business venture that exists in the form of a publicly traded limited partnership.
UMI’s ability to meet its investment objective relies in part upon the level of taxable income it receives from the MLPs in which it invests, a factor over which the Fund has no control. The benefit that UMI derives from its investment in MLPs is largely dependent on their being treated as partnerships for U.S. federal income tax purposes. Partnerships do not pay U.S. federal income tax at the partnership level. Rather, each partner is allocated a share of the partnership’s income, gains, losses, deductions and expenses.
An investment in MLP units involves risks that differ from a similar investment in equity securities, such as common stock, of a corporation. As compared to common shareholders of a corporation, holders of MLP units have more limited control and limited rights to vote on matters affecting the partnership.
iii. Treasuries
The Funds may invest in U.S. government obligations. U.S. government obligations include U.S. Treasury obligations and securities issued or guaranteed by various agencies of the U.S. government, or by various instrumentalities which have been established or sponsored by the U.S. government. U.S. Treasury obligations are backed by the “full faith and credit” of the U.S. government. Securities issued or guaranteed by U.S. federal agencies and U.S. government sponsored instrumentalities may or may not be backed by the full faith and credit of the U.S. government.
| 28 | Annual Report June 30, 2021 |
iv. Money Market Instruments
The Funds may invest a portion of their assets in high-quality money market instruments on an ongoing basis. The instruments in which the Funds may invest include: (1) short-term obligations issued by the U.S. government; (2) negotiable certificates of deposit (“CDs”), fixed time deposits and bankers’ acceptances of U.S. and foreign banks and similar institutions; (3) commercial paper rated at the date of purchase “Prime-1” by Moody’s Investors Service, Inc. or “A-1+” or “A-1” by S&P Global, or, if unrated, of comparable quality as determined by the Adviser; and (4) money market mutual funds. CDs are short-term negotiable obligations of commercial banks. Time deposits are non-negotiable deposits maintained in banking institutions for specified periods of time at stated interest rates. Banker’s acceptances are time drafts drawn on commercial banks by borrowers, usually in connection with international transactions.
v. Futures
A commodities futures contract provides for the future sale by one party and the purchase by the other party of a specified amount of a commodity, such as an energy, agricultural or metal commodity, at a specified price, date, time and place. A foreign currency futures contract provides for the future sale by one party and the purchase by the other party of a certain amount of a specified non-U.S. currency at a specified price, date, time and place. An interest rate futures contract provides for the future sale by one party and the purchase by the other party of a certain amount of a specific interest rate sensitive financial instrument (e.g., a debt security) at a specified price, date, time and place. A futures contract on an index is an agreement to be settled by delivery of an amount of cash equal to a specified multiplier times the difference between the value of the index at the close of the last trading day on the contract and the price at which the agreement is made. The clearing house of the exchange on which a futures contract is entered into becomes the counterparty to each purchaser and seller of the futures contract.
SDCI and the Subsidiary may purchase and sell commodity contracts in the form of forwards, futures, and options; may enter into foreign exchange contracts; may enter into swap agreements; may enter into other financial transactions; and may purchase or sell precious metal commodity contracts or options on such contracts in compliance with applicable commodities laws. SDCI and the Subsidiary may also invest in other instruments related to commodities, including structured notes, and securities of commodities finance and operating companies. In the commodity futures market, there are often costs of physical storage associated with purchasing the underlying commodity. The price of the commodity futures contract will reflect the storage costs of purchasing the physical commodity, including the time value of money invested in the physical commodity. To the extent that the storage costs for an underlying commodity change while SDCI and the Subsidiary are invested in futures with respect to that commodity, the value of the futures contract may change proportionately. In the commodity futures markets, producers of the underlying commodity may decide to hedge the price risk of selling the commodity by selling futures contracts today to lock in the price of the commodity at delivery tomorrow. In order to induce speculators to purchase the other side of the same futures contract, the commodity producer generally must sell the futures contract at a lower price than the expected future spot price of the commodity. Conversely, if most hedgers in the futures market are purchasing futures contracts to hedge against a rise in prices, then speculators will only sell the other side of the futures contract at a higher futures price than the expected future spot price of the commodity. The changing nature of the hedgers and speculators in the commodities markets will influence whether futures prices are above or below the expected future spot price, which can have significant implications for SDCI and the Subsidiary. The commodities which underlie commodity futures contracts may be subject to additional economic and non-economic variables, such as drought, floods, weather, livestock disease, embargoes, tariffs, and international economic, political and regulatory developments. These factors may have a larger impact on commodity prices and commodity-linked instruments, including futures contracts, than on traditional securities. Certain commodities are also subject to limited pricing flexibility because of supply and demand factors. Others are subject to broad price fluctuations as a result of the volatility of the prices for certain raw materials and the instability of the supplies of other materials.
| 29 |
When a purchase or sale of a futures contract is made by a fund, the fund is required to deposit with its futures commission merchant (“FCM”) a specified amount of liquid assets (“initial margin”). The margin required for a futures contract is set by the exchange on which the contract is traded and may be modified during the term of the contract. The initial margin is in the nature of a performance bond or good faith deposit on the futures contract that is returned to the fund upon termination of the contract, assuming all contractual obligations have been satisfied. The fund expects to earn taxable interest income on its initial margin deposits.
A futures contract held by a fund is valued daily at the official settlement price on the exchange on which it is traded. Each day the fund pays or receives cash, called “variation margin,” equal to the daily change in value of the futures contract. This process is known as “marking to market.” Variation margin does not represent a borrowing or loan by the fund but is instead a settlement between the fund and the FCM of the amount one would owe the other if the futures contract expired. In accordance with ASC 946-310-45, the variation margin is shown separately on the Consolidated Statement of Assets and Liabilities. In computing daily NAV, the fund will mark to market its open futures positions. Although some futures contracts call for making or taking delivery of the underlying assets, generally these obligations are closed out prior to delivery by offsetting purchases or sales of matching futures contracts (involving the same exchange, underlying security or index and delivery month). If an offsetting purchase price is less than the original sale price, the fund realizes a capital gain, or if it is more, the fund realizes a capital loss. Conversely, if an offsetting sale price is more than the original purchase price, a fund realizes a capital gain, or if it is less, the fund realizes a capital loss. The transaction costs also must be included in these calculations. As discussed below, however, the funds may not always be able to make an offsetting purchase or sale. In the case of a physically settled futures contract, this could result in the funds being required to deliver, or receive, the underlying physical commodity, which could be adverse to the fund.
| 30 | Annual Report June 30, 2021 |
At any time prior to the expiration of a futures contract, the fund may seek to close the position by seeking to take an opposite position, which would operate to terminate the fund’s existing position in the contract. Positions in futures contracts may be closed out only on the exchange on which they were entered into (or through a linked exchange).
No secondary market for such contracts exists. Although the funds may purchase futures contracts only if there is an active market for such contracts, there is no assurance that an active market will exist at any particular time. Most Futures Exchanges limit the amount of fluctuation permitted in futures contract prices during a single trading day. Once the daily limit has been reached in a particular contract, no trades may be made that day at a price beyond that limit or trading may be suspended for specified periods during the day. It is possible that futures contract prices could move to the daily limit for several consecutive trading days with little or no trading, thereby preventing prompt liquidation of futures positions at an advantageous price and subjecting the fund to substantial losses. In such event, and in the event of adverse price movements, the fund would be required to make daily cash payments of variation margin. In such situations, if the fund had insufficient cash, it might have to sell assets to meet daily variation margin requirements at a time when it would be disadvantageous to do so. In addition, if the transaction is entered into for hedging purposes, in such circumstances the fund may realize a loss on a futures contract or option that is not offset by an increase in the value of the hedged position. Losses incurred in futures transactions and the costs of these transactions will affect the performance of the fund. When the fund purchases futures contracts, it will collateralize its position by depositing an amount of cash or liquid securities in an account with the FCM.
When the funds invest in Commodity-Linked Investments (including swaps), they may be required to segregate cash and/or liquid securities to the extent the fund’s obligations are not covered or otherwise offset. Generally, if the fund does not cover its obligations to pay or deliver securities or other assets, the fund will segregate cash or liquid securities in an amount at least equal to the current amount of the obligation. With respect to investments in futures contracts, the fund will deposit initial margin and any applicable daily variation margin in addition to segregating cash or liquid securities sufficient to satisfy its obligation to purchase or provide securities or currencies, or to pay the amount owed at the contract’s expiration.
A summary of the open futures contracts as of June 30, 2021 is included in a table following SDCI’s Schedule of Investments.
| 31 |
The following table summarize the value of SDCI’s derivative instruments held as of June 30, 2021 presented by primary underlying risk exposure:
| Asset Derivatives | Liability Derivatives | |||||||
| Unrealized appreciation on commodity futures contracts* | Unrealized depreciation on commodity futures contracts* | |||||||
| SDCI Commodity Futures Contracts | $ | 376,519 | $ | (89,996 | ) | |||
| * | Included cumulative appreciation or cumulative depreciation of futures contracts as disclosed in the Consolidated Schedule of Investments. Unsettled variation margin is disclosed separately within the Statement of Assets and Liabilities. |
Additionally, the amount of realized and unrealized gains and losses on derivative instruments recognized in SDCI’s earnings during the year ended June 30, 2021 and the related location in the accompanying Consolidated Statement of Operations is summarized in the following tables by primary underlying risk exposure:
The Effect of Derivative Instruments on the Consolidated Statement of Operations
| Year Ended June 30, 2021 | |||||||||||
| Fund | Derivatives not Accounted for as Hedging Instruments | Location of Gain (Loss) on Derivatives | Realized Gain | Change in | |||||||
| SDCI | Open Commodity Futures Contracts | Net Realized Gain (Loss) on Commodity Futures Contracts | $ | 1,248,514 | |||||||
| Net Change in Unrealized Appreciation (Depreciation) on Open Commodity Futures Contracts | $ | 246,824 | |||||||||
For the year ended June 30, 2021, the average monthly volume of derivatives for SDCI was as follows:
| Commodity Futures Contracts (Notional Value) | ||||
| SDCI | $ | 3,797,378 | ||
Fair Value Measurement
The Funds utilize various methods to measure the fair value of most of their investments on a recurring basis. GAAP establishes a hierarchy that prioritizes inputs to valuation methods. The three levels of inputs are:
| 32 | Annual Report June 30, 2021 |
Level 1 – Unadjusted quoted prices in active markets for identical assets or liabilities that the Funds have the ability to access.
Level 2 – Observable inputs other than quoted prices included in Level 1 that are observable for the asset or liability, either directly or indirectly. These inputs may include quoted prices for the identical instrument or an inactive market, prices for similar instruments, interest rates, prepayment speeds, credit risk, yield curves, default rates and similar data.
Level 3 – Unobservable inputs for the asset or liability, to the extent relevant observable inputs are not available; representing the Funds’ own assumptions about the assumptions a market participant would use in valuing the asset or liability, and would be based on the best information available.
The availability of observable inputs can vary from security to security and is affected by a wide variety of factors, including, for example, the type of security, whether the security is new and not yet established in the marketplace, the liquidity of markets, and other characteristics particular to the security. To the extent that valuation is based on models or inputs that are less observable or unobservable in the market, the determination of fair value requires more judgment. Accordingly, the degree of judgment exercised in determining fair value is greatest for instruments categorized in Level 3.
Futures contracts are generally valued at the settlement prices established each day on the exchange on which they are traded and are categorized as Level 1.
The inputs used to measure fair value may fall into different levels of the fair value hierarchy. In such cases for disclosure purposes, the level in the fair value hierarchy within which the fair value measurement falls in its entirety, is determined based on the lowest level input that is significant to the fair value measurement in its entirety.
The following tables summarize the valuation of securities at June 30, 2021 for the Funds, using the fair value hierarchy:
SDCI
| Investments, at fair value | Total | Level 1 | Level 2 | Level 3 | ||||||||||||
| Cash Equivalents: | ||||||||||||||||
| United States Money | ||||||||||||||||
| Market Funds | $ | 7,056,935 | $ | 7,056,935 | $ | — | $ | — | ||||||||
| Total Cash Equivalents, at fair value | $ | 7,056,935 | $ | 7,056,935 | $ | — | $ | — | ||||||||
| Exchange-Traded Futures Contracts: | ||||||||||||||||
| Foreign Contracts | 135,519 | 135,519 | — | — | ||||||||||||
| United States Contracts | 151,004 | 151,004 | — | — | ||||||||||||
| Total Exchange-Traded Futures Contracts | $ | 286,523 | $ | 286,523 | $ | — | $ | — | ||||||||
| Total Investments, at fair value | $ | 7,343,458 | $ | 7,343,458 | $ | — | $ | — | ||||||||
| 33 |
UMI
| Investments, at fair value | Total | Level 1 | Level 2 | Level 3 | ||||||||||||
| Common Stocks: | ||||||||||||||||
| Pipelines | $ | 74,848,208 | $ | 74,848,208 | $ | — | $ | — | ||||||||
| Master Limited Partnerships: | ||||||||||||||||
| Gas | 2,728,137 | 2,728,137 | — | — | ||||||||||||
| Pipelines | 21,529,748 | 21,529,748 | — | — | ||||||||||||
| United States Money Market Funds | $ | 583,532 | $ | 583,532 | $ | — | $ | — | ||||||||
| Total Investments, at fair value | $ | 99,689,625 | $ | 99,689,625 | $ | — | $ | — | ||||||||
Income
Dividend income is recorded on the ex-dividend date, as soon as information is available to the Funds. Distributions to shareholders, which are determined in accordance with income tax regulations, are also recorded on the ex-dividend date. Interest income is recorded as earned. Discounts and premiums on securities purchased are amortized over the life of the respective securities.
Commodity futures contracts, forward contracts, physical commodities and related options are recorded on the trade date. All such transactions are recorded on the identified cost basis and marked to market daily. Unrealized gains or losses on open contracts are reflected in the Consolidated Statement of Assets and Liabilities and represent the difference between the original contract amount and the market value (as determined by exchange settlement prices for futures contracts and related options and cash dealer prices at a predetermined time for forward contracts, physical commodities, and their related options) as of the last business day of the period or as of the last date of the consolidated financial statements. Changes in the unrealized gains or losses between periods are reflected in the Consolidated Statement of Operations.
UMI invests in MLPs which make distributions that are primarily attributable to return of capital. UMI records investment income and return of capital in the Consolidated Statement of Operations using management’s estimate of the percentage of income included in the distributions received from each MLP based on historical information from the MLPs and other industry sources. These estimates may be adjusted based on information received from the MLPs after the tax and fiscal year ends.
The return of capital portion of the MLP distributions is a reduction to investment income and a reduction in the cost basis of each investment which increases net realized gain (loss) and net change in unrealized appreciation (depreciation). If the return of capital distributions exceed its cost basis, the distributions are treated as realized gains. The actual amounts of income and return of capital are only determined by each MLP after its fiscal year-end and may differ from the estimated amounts.
| 34 | Annual Report June 30, 2021 |
Federal and Other Taxes
As of and during the year ended June 30, 2021, for SDCI, and the period ended June 30, 2021, for UMI, the Funds did not have a liability for any unrecognized tax benefits in the accompanying financial statements. The Funds file income tax returns in the U.S. federal jurisdiction and Delaware.
The Funds follow ASC 740 “Income Taxes”, which requires that the financial statements effects of a tax position taken or expected to be taken in a tax return be recognized in the financial statements when it is more likely than not, based on the technical merits, that the position will be sustained upon examination. Management has concluded that the Funds have taken no uncertain tax positions that require adjustment to the financial statements.
It is the Trust’s policy to comply with the federal income and excise tax requirements of the Internal Revenue Code of 1986, as amended, applicable to regulated investment companies. Accordingly, the Funds intend to distribute substantially all of their income and net realized gains on investments, if any, to shareholders each year. Therefore, no federal income tax provision is required in the Funds’ financial statements. Under the applicable foreign tax laws, a withholding tax may be imposed on interest, dividends and capital gains at various rates.
GAAP requires that certain components of net assets be adjusted to reflect permanent differences between financial and tax reporting. These reclassifications have no effect on net assets or NAV per share. The following permanent differences as of June 30, 2021, were reclassified to the following accounts:
| SDCI | UMI | |||||||
| Capital Paid In | $ | 1,248,627 | $ | (221,613 | ) | |||
| Undistributed (Distribution in Excess) Net Investment Income | (113 | ) | 416,669 | |||||
| Undistributed (Accumulated) Net Realized Gain (Loss) | (1,248,514 | ) | (195,056 | ) | ||||
Management has reviewed the tax positions and has concluded that no liability for unrecognized tax benefits should be recorded related to uncertain tax positions taken on returns filed for open tax years or expected to be taken with the 2020 tax returns. SDCI’s federal tax returns for the prior three fiscal years remain subject to examination by the Internal Revenue Service.
| 35 |
Dividends and Distributions
Each Fund intends to pay out dividends on a quarterly basis. Nonetheless, each Fund may not make a dividend payment every quarter. Each Fund intends to distribute its net realized capital gains, if any, to investors annually. Each Fund may occasionally be required to make supplemental distributions at some other time during the year. Distributions in cash may be reinvested automatically in additional whole shares only if the broker through whom you purchased shares makes such option available. Your broker is responsible for distributing the income and capital gain distributions to you.
For federal income tax purposes, distributions of investment income are generally taxable as ordinary income or qualified dividend income to the extent of a Fund’s current and accumulated earnings and profits. Taxes on distributions of capital gains (if any) are determined by how long a Fund owned the investments that generated them, rather than how long you have owned your Fund shares. Sales of assets held by a Fund for more than one year generally result in long-term capital gains and losses, and sales of assets held by such Fund for one year or less generally result in short-term capital gains and losses. Distributions of a Fund’s net capital gain (the excess of realized net long-term capital gains over realized net short-term capital losses) that are properly reported by such Fund as capital gain dividends (“Capital Gain Dividends”) will be taxable as long-term capital gains. For non-corporate shareholders, long-term capital gains are generally subject to tax at reduced maximum rates. Distributions of short-term capital gain will be taxable as ordinary income. Distributions of investment income properly reported by a Fund as “qualified dividend income” are generally taxed to non-corporate shareholders at the same rates applicable to long-term capital gains, provided holding periods and other requirements are met by the Fund and the shareholder. Distributions in excess of a Fund’s current and accumulated earnings and profits will first be treated as a non-taxable return of capital to the extent of a shareholder’s basis in the shares, and thereafter, as gain from the sale of shares. A shareholder’s basis in its shares will be reduced by the amount of any distribution treated as a non-taxable return of capital.
In general, distributions are subject to federal income tax for the year in which they are paid. Certain distributions paid in January, however, may be treated as paid on December 31 of the prior year. Distributions are generally taxable even if they are paid from income or gains earned by a Fund before your investment (and, thus, were included in the price you paid for your shares).
Distributions (other than Capital Gain Dividends and dividends properly reported by us as interest-related dividends or short-term capital gain dividends) paid to individual shareholders that are neither citizens nor residents of the U.S. or to foreign entities will generally be subject to a U.S. withholding tax at the rate of 30%, unless a lower treaty rate applies.
The Trust (or financial intermediaries, such as brokers, through which shareholders own Fund shares) generally is required to withhold and remit to the U.S. Treasury a percentage of the taxable distributions and sale or redemption proceeds paid to any shareholder who fails to properly furnish a correct taxpayer identification number, who has under-reported dividend or interest income, or who fails to certify that he, she or it is not subject to such withholding. In addition, even if shareholders have provided appropriate certifications to the intermediary through which they hold shares, such withholding may apply if the intermediary is a foreign intermediary unless such foreign intermediary either enters into an agreement with the Internal Revenue Service regarding reporting or is located in a jurisdiction that has entered into an Intergovernmental Agreement with the Internal Revenue Service and such foreign intermediary is in compliance with the terms of such intergovernmental agreement and any enabling legislation or administrative actions.
| 36 | Annual Report June 30, 2021 |
Foreign Currency Translation
Non-U.S. Investment securities and other assets and liabilities denominated in foreign currencies are translated into U.S. dollar amounts at the foreign currency exchange rate effective at the end of the reporting period. Cost of investments is translated at the currency exchange rate effective at the trade date. The gain or loss resulting from a change in currency exchange rates between the trade and settlement date of a portfolio transaction is treated as a gain or loss on foreign currency. Likewise, the gain or loss resulting from a change in currency exchange rates between the date the income is accrued and the date it is paid is treated as a gain or loss on foreign currency. The Funds do not isolate that portion of the results of operations arising from changes in foreign exchange rates on investments from the fluctuations arising from changes in the market prices of securities held. Such fluctuations are included with the net realized and unrealized gain or loss on investments.
Indemnification
The Trust will indemnify its officers and trustees for certain liabilities that may arise from the performance of their duties to the Trust. Additionally, in the normal course of business, the Trust enters into contracts that contain a variety of representations and warranties and which provide general indemnities. The Funds’ maximum exposure under these arrangements is unknown, as this would involve future claims that may be made against the Funds that have not yet occurred. However, the Trust expects the risk of loss due to these warranties and indemnities to be remote.
NOTE 3 – RISKS
The Funds’ risks include, but are not limited, to the following:
Cayman Subsidiary Risk. With respect to an investment in SDCI, there is additional risk related to the Subsidiary. The Subsidiary is an exempted company incorporated under the laws of the Cayman Islands and is a wholly-owned subsidiary of SDCI. The Subsidiary allows SDCI to gain exposure to certain types of commodity-linked derivative instruments and satisfy regulated investment company (“RIC”) tax requirements. SDCI is the sole shareholder of the Subsidiary and it is intended that SDCI will remain the sole shareholder and will continue to control the Subsidiary.
| 37 |
By investing in the Subsidiary, SDCI will be indirectly exposed to the risks associated with the Subsidiary’s investments. SDCI may invest up to 25% of its total assets in the Subsidiary. The accompanying Consolidated Schedule of Investments and Consolidated Financial Statements include the positions and accounts of the Subsidiary. All inter-fund balances and transactions, if any, have been eliminated in consolidation.
As of June 30, 2021, SDCI and the Subsidiary net assets were as follows:
| Fund | Total Net Assets | Subsidiary Net Assets | % of Fund Represented by Subsidiary’s Net Assets | |||||||||
| SDCI | $ | 8,220,412 | $ | 1,647,642 | 20.0 | % | ||||||
Other Investment Companies Risk. Each Fund may invest in securities of other registered investment companies, including U.S. government money market funds, mutual funds and other ETFs. As a stockholder in an investment company, a Fund will bear its ratable share of that investment company’s expenses. The Fund will also indirectly bear the risks to which that investment company is subject.
As a matter of fundamental policy, each Fund may not purchase any security if, as a result of that purchase, 25% or more of its total assets would be invested in securities of issuers having their principal business activities in the same industry, provided that this restriction does not limit the Fund’s investments in (i) securities or other instruments issued or guaranteed by the U.S. government or its agencies or instrumentalities, and (ii) securities of other investment companies. When determining compliance with this fundamental policy of the Fund, the Fund will consider the concentration of affiliated and unaffiliated underlying investment companies.
As of June 30, 2021, the SDCI and the Subsidiary invested the following percentages of its respective net assets in concentrations greater than 25% of other investment companies:
| Security Name | Market Value as of June 30, 2021 | % of Fund Total Net Assets as of June 30, 2021 | ||||||
| Goldman Sachs Financial Square Government Fund – Institutional Share Class, 0.3% | $ | 2,092,609 | 25.4 | % | ||||
| RBC U.S. Government Money Market Fund – Institutional Share Class, 0.3% | 4,964,326 | 60.4 | % | |||||
As of June 30, 2021, UMI did not invest more than 25% of its net assets in other investment companies.
Each Fund may redeem its investment from these holdings at any time if the Adviser determines that is in the best interest of the Fund and their shareholders to do so. The performance of the Fund will be directly affected by the performance of these holdings. The financial statements of the above holdings can be found at the Securities and Exchange Commission’s website: www.sec.gov; and should be read in conjunction with the Funds’ financial statements.
| 38 | Annual Report June 30, 2021 |
Market Risk. The trading prices of equity securities fluctuate, sometimes rapidly and unpredictably, in response to a variety of factors. These factors include events impacting the entire market or a specific market segment. The market value of portfolio holdings can be volatile and change quickly. Each Fund’s NAV and market price, like market prices generally, may fluctuate significantly. As a result, an investor could lose money over short or long periods of time, including the possible loss of the entire principal amount of an investment.
Liquidity Risk. Each Fund may not always be able to liquidate its investments at the desired price or time (or at all) or at prices approximating those at which the Funds currently value them. It may be difficult for the Funds to value illiquid holdings accurately. Unexpected market illiquidity may cause major losses at any time or from time to time.
Premium or Discount to NAV Risk. As with all exchange-traded funds (“ETFs”), Fund shares may be bought and sold in the secondary market at market prices. Although it is expected that the market price of the shares of a Fund will approximate the Fund’s NAV, there may be times when the market price and the NAV vary significantly, particularly in times of market stress. Thus, an investor may pay significantly more (or less) than NAV when buying shares of a Fund in the secondary market, or receive significantly more (or less) than NAV when selling those shares in the secondary market. A premium or discount to NAV may be reflected in the spread between “bid” and “ask” prices that are quoted during the course of a trading day. If an investor purchases Fund shares at a time when the market price is at a premium to the NAV of the Fund’s shares, or sells at a time when the market price is at a discount to the NAV of the Fund’s shares, an investor may sustain losses.
Fluctuation of NAV Risk. The market prices of each Fund’s shares will generally fluctuate in accordance with changes in NAV as well as the relative supply of and demand for each Fund’s shares on NYSE Arca. The Adviser cannot predict whether each Fund’s shares will trade below, at, or above NAV.
Secondary Market Risk. Although each Fund’s shares are listed for trading on NYSE Arca and may be listed or traded on U.S. and non-U.S. stock exchanges other than NYSE Arca, there can be no assurance that an active trading market for such shares will develop or be maintained. Investors buying or selling Fund shares in the secondary market will pay brokerage commissions or other charges imposed by brokers and will incur the cost of the difference between “bid” and “ask” prices of the Fund’s shares.
New Fund Risk. Since UMI is a new fund, there can be no assurance that it will grow to or maintain an economically viable size.
Derivatives Risk. With respect to SDCI, the value of a derivative instrument, such as SDCI’s investments in Commodity Interests (as defined below), depends largely on (and is derived from) an underlying asset (or a reference rate or index). Derivative instruments such as cash-settled options, forward contracts, options on futures contracts, cleared swap contracts, swap contracts other than cleared swap contracts, and other options and swaps, collectively with the Component Futures Contracts, are called the “Commodity Interests”. Derivatives create leverage risk because they do not require payment up frontequal to the economic exposure created by owning the derivative. As a result, an adverse change in the value of the underlying asset of a derivative could result in SDCI sustaining a loss that is substantially greater than the amount invested in the derivative, which may make SDCI’s returns more volatile and increase the risk of loss. SDCI may not be able to close out a derivative transaction at a favorable time or price. Derivatives may also be harder to value, less tax efficient, and subject to changing government regulation that could impact SDCI’s ability to use certain derivatives or their cost. Also, derivatives used to gain or limit exposure to a particular market segment may not provide the expected benefits, particularly during adverse market conditions. These risks are greater for SDCI than most other ETFs because SDCI will implement its investment strategy primarily through investments in Commodity Interests, which are derivative instruments.
| 39 |
Commodities Risk. With respect to SDCI, exposure to the commodities markets through investments in Commodity Interests may subject SDCI to greater volatility than investments in traditional securities. The risks and hazards that are inherent in commodity production may cause the price of commodities to fluctuate widely. Significant changes in the value of commodities may lead to volatility in SDCI’s NAV and market price.
Commodities Tax Risk. SDCI intends to qualify as a RIC under subchapter M of the Internal Revenue Code (the “Code”). If it qualifies as a RIC and satisfies certain minimum distribution requirements, SDCI will not be subject to fund-level U.S. federal income tax on income and gains that it timely distributes to shareholders. To qualify as a RIC, SDCI must satisfy certain source-of-income requirements. As discussed above, SDCI intends to gain exposure to the commodities market primarily through its investment in the Subsidiary. SDCI believes based on current law that its taxable income from the Subsidiary will be qualifying income for purposes of the RIC source-of-income requirements. If the income of SDCI from the Subsidiary is treated as non-qualifying income, SDCI might fail to qualify as a RIC and be subject to federal income tax at the fund level. Such adverse effects could also, among other consequences, limit SDCI’s ability to pursue its investment strategy. SDCI seeks to manage its investments in the Subsidiary and in Commodity Interests as necessary to maintain its qualifications as a RIC.
Master Limited Partnership Tax Risk. UMI’s ability to meet its investment objective relies in part upon the level of taxable income it receives from the MLPs in which it invests, a factor over which UMI has no control. The benefit UMI derives from its investment in MLPs is largely dependent on their being treated as partnerships for U.S. federal income tax purposes. Partnerships do not pay U.S. federal income tax at the partnership level. Rather, each partner is allocated a share of the partnership’s income, gains, losses, deductions and expenses. A change in current tax law or a change in the underlying business mix of a given MLP could result in an MLP being treated as a corporation for U.S. federal income tax purposes, which would result in the MLP being required to pay U.S. federal income tax (as well as state and local income taxes) on its taxable income at the applicable corporate tax rate. This would have the effect of reducing the amount of cash available for distribution by an MLP and could result in a significant reduction in the value of UMI’s investment. The classification of an MLP as a corporation for U.S. federal income tax purposes would have the effect of reducing the amount of cash available for distribution by the MLP and causing any such distributions received by UMI to be taxed as dividend income to the extent of the MLP’s current or accumulated earnings and profits. To the extent a distribution received by UMI from an MLP is treated as a return of capital, UMI’s adjusted tax basis in the interests of the MLP may be reduced, which will result in an increase in the amount of income or gain (or decrease in the amount of loss) that will be recognized by UMI for tax purposes upon the sale of any such interests or upon subsequent distributions in respect of such interests. Furthermore, any return of capital distribution received from an MLP may require UMI to restate the character of its distributions and amend any shareholder tax reporting previously issued.
| 40 | Annual Report June 30, 2021 |
Cash Transaction Risk. Creation and redemption transactions are expected to generally settle through payments of cash and/or fixed income securities, which will cause SDCI to incur certain costs, such as brokerage costs, that it would not incur if it made in-kind redemptions.
COVID-19 Risk. As of the date these financial statements were issued, the outbreak of the novel coronavirus (“COVID-19”) continues to adversely impact global commercial activity, and has contributed to significant volatility in financial markets. The global impact of the outbreak and the international response thereto have been rapidly evolving due to the competing factors of the availability of vaccinations and the emergence of new variants. Many countries have reacted by instituting (and in some cases, lifting and reinstituting) quarantines and restrictions on travel. Such measures, as well as the general uncertainty surrounding the dangers and impact of COVID-19, are creating significant disruption in supply chains and economic activity. The outbreak could have a continued adverse impact on economic and market conditions and trigger a period of global economic slowdown. The rapid development and fluidity of this situation precludes any prediction as to the ultimate adverse impact of COVID-19. Nevertheless, COVID-19 presents material uncertainty and risk with respect to the Funds and each Fund’s investments.
NOTE 4 – INVESTMENT ADVISORY AND OTHER AGREEMENTS
Investment Adviser
The Adviser serves as the investment adviser to each Fund pursuant to an investment advisory agreement between the Trust and the Adviser. For SDCI, the Adviser also serves as investment adviser to the Subsidiary pursuant to a separate investment advisory agreement. The Board approved and renewed the advisory agreements for SDCI and the Subsidiary most recently at a meeting held on July 15, 2020. The Board approved the advisory agreement for UMI on February 18, 2021. SummerHaven Investment Management, LLC serves as the sub-adviser to the Subsidiary pursuant to a sub-advisory agreement approved by the Board on May 7, 2020. Miller/Howard Investments, Inc. serves as the sub-adviser to UMI pursuant to a sub-advisory agreement approved by the Board on February 18, 2021.
| 41 |
Management Fees
Each Fund pays the Adviser a unitary management fee as compensation for its services and its assumption of Fund expenses. The Adviser is responsible for all expenses of the Funds except expenses for taxes and governmental fees; brokerage fees; commissions and other transaction expenses; costs of borrowing money, including interest expenses; securities lending expenses; extraordinary expenses (such as litigation and indemnification expenses); and fees and expenses of any independent legal counsel. The Adviser may voluntarily waive any portion of its management fee from time to time, and may discontinue or modify any such voluntary limitations in the future at its discretion. The fees paid to the Adviser are accrued daily and paid monthly. The following table lists the total management fee paid by each Fund.
| Fund | Management Fee | |||
| SDCI | 0.80 | % | ||
| UMI | 0.85 | % | ||
At a meeting of the Board on August 7, 2019, the Board approved an agreement between the Adviser and the Trust pursuant to which the Adviser waives 0.20% of the management fees payable by SDCI. The agreement became effective on August 15, 2019 and has subsequently been renewed on an annual basis. The agreement remained in effect through October 31, 2021, and may be renewed by the Adviser in its sole discretion thereafter. The agreement may be amended or terminated only by the agreement of the Board and the Adviser, and terminated automatically with respect to the Fund in the event of the termination of the Investment Advisory Agreement between the Adviser and such Fund. Amounts waived are not subject to recoupment by the Adviser.
SummerHaven Investment Management, LLC and Miller/Howard Investments, Inc. (each a “Sub-Adviser”, and collectively, the “Sub-Advisers”) receive a management fee equal to a percentage of the Fund’s average daily net assets for the services it provides to each Fund. The Sub-Advisers’ fees are calculated daily and paid monthly by the Adviser out of its management fees. The following table lists the sub-advisory fees paid to the Sub-Advisers.
| Fund | Sub-Advisor Fee | |||
| SDCI | 0.06 | % | ||
| UMI | 0.38 | % | ||
The Adviser and the Sub-Advisers (subject to the Adviser’s oversight) supervise and manage the investment portfolio of each Fund and direct the purchase and sale of each Fund’s investments.
| 42 | Annual Report June 30, 2021 |
Administrator, Custodian and Transfer Agent
The Bank of New York Mellon (“BNY Mellon”) serves as the administrator, custodian and transfer agent for the Funds. Under the Administrative Agency Agreement with the Trust, BNY Mellon performs certain administrative, accounting, transfer agency and dividend disbursing services for the Funds and prepares certain reports filed with the U.S. Securities and Exchange Commission (“SEC”) on behalf of the Trust and the Funds. Under the Custodian Agreement with the Trust, BNY Mellon maintains in separate accounts: cash, securities and other assets of the Funds; keeps all necessary accounts and records, and provides other services. BNY Mellon is required, upon the order of the Trust, to deliver securities held by BNY Mellon and to make payments for securities purchased by the Trust for the Funds.
Buying and Selling Fund Shares
The Funds are ETFs. This means that shares of the Funds may only be purchased and sold on a national securities exchange, such as NYSE Arca, through a broker-dealer. The price of the Fund’s shares is based on market price. Because Fund shares trade at market prices rather than NAV, shares may trade at a price greater than NAV (premium) or less than NAV (discount).
Each Fund issues and redeems shares at NAV only in large blocks of shares (“Creation Baskets” and “Redemption Baskets,” respectively), which only certain institutions or large investors (typically, market makers or other broker-dealers) that have entered into an agreement with ALPS Distributors, Inc. (the “Distributor”) may purchase or redeem. Such institutions and large investors are referred to herein as “Authorized Participants” or “APs.” Currently, Creation Baskets and Redemption Baskets generally consist of 50,000 shares, though this may change from time to time. Authorized Participants are required to pay a transaction fee of $350 to compensate the Fund for brokerage and transaction expenses when purchasing Creation Baskets or redeeming Redemption Baskets.
SDCI generally issues and redeems Creation Baskets and Redemption Baskets in exchange for a designated amount of cash. UMI generally issues and redeems Creation Baskets and Redemption Baskets in exchange for a portfolio of securities closely approximating the holdings of UMI and/or a designated amount of cash.
Distributor
The Distributor serves as the distributor of Creation Baskets and Redemption Baskets for the Funds on an agency basis. The Distributor does not maintain a secondary market in shares.
The Distributor is the distributor of the Trust. The Distributor has entered into a Distribution Agreement with the Trust pursuant to which it distributes shares of the Funds in Creation Basket aggregations. The Distributor is a broker-dealer registered under the Securities Exchange Act of 1934, as amended, and a member of the Financial Industry Regulatory Authority. Fees under the Distribution Agreement are paid by the Adviser. The Adviser may, from time to time and from its own resources, make other distribution-related payments to the Distributor or other persons.
| 43 |
Licensing Agreements
SHIM, an affiliate of the Sub-Advisers, owns and maintains the SDCITR (the “Index”). The Adviser and SHIM have entered into one or more licensing agreements (the “Licensing Agreements”) for the Trust’s use of the Index, for which the Adviser pays SHIM licensing fees. The licensing fees are separate from the fees paid to the Sub-Advisers for sub-advisory services provided to UMI and the Subsidiary.
Investors cannot be assured of the continuation of the Licensing Agreements between SHIM and the Adviser for use of the Index. Should the Licensing Agreements between SHIM and the Adviser be terminated, the Adviser and the Board will consider available alternatives, including finding replacement indexes or liquidating the Fund. Termination of the Licensing Agreements may have an adverse effect on the performance and NAV of the Fund’s shares.
NOTE 5 – INVESTMENT TRANSACTIONS – PURCHASES AND SALES
During the year ended June 30, 2021, for SDCI, and the period ended June 30, 2021, for UMI, the aggregate cost of purchases and proceeds from sales of investments (excluding short-term investments and in-kind transactions) were as follows:
| Fund | Purchases | Sales | In-Kind Creations | In-Kind Redemptions | ||||||||||||
| SDCI | $ | — | $ | — | $ | — | $ | — | ||||||||
| UMI | 5,246,959 | 5,125,759 | 86,671,540 | — | ||||||||||||
NOTE 6 – DISTRIBUTIONS AND TAXES
It is the policy of the Funds to qualify as regulated investment companies by complying with the requirements of the Internal Revenue Code of 1986, as amended, applicable to regulated investment companies and by distributing substantially all of their earnings to shareholders. Therefore, no federal income tax provision is required.
Income distributions and return of capital distributions are determined in accordance with tax regulations, which may differ from GAAP.
| 44 | Annual Report June 30, 2021 |
NOTE 7 – BENEFICIAL OWNERSHIP
Certain owners of the Adviser are also owners and/or trustees of the Funds. These individuals may receive benefits from any management fees paid to the Adviser.
NOTE 8 – DIVIDEND AND TAX COMPONENTS OF CAPITAL
The tax character of distributions paid during the year ended June 30, 2021, for SDCI, and the period ended June 30, 2021, for UMI, were from Ordinary Income and Return of Capital in the amounts as follows:
Fund | Ordinary | Capital | Return of | |||||||||
| SDCI | $ | — | $ | — | $ | — | ||||||
| UMI | 584,016 | — | 221,613 | |||||||||
The tax character of distributions paid during the fiscal year ended June 30, 2020, were from Ordinary Income in the amounts as follows:
Fund | Ordinary | Capital | Return of | |||||||||
| SDCI | $ | 31,428 | $ | — | $ | — | ||||||
| UMI* | N/A | N/A | N/A | |||||||||
| * | Inception Date, March 23, 2021. |
As of June 30, 2021, the components of accumulated earnings on a tax basis were as follows:
| SDCI | UMI | |||||||
| Undistributed Ordinary Income – Net | $ | 1,425,792 | $ | — | ||||
| Capital Loss Carryforwards | $ | — | $ | — | ||||
| Other Book/Tax Temporary Differences | $ | — | $ | — | ||||
| Unrealized Appreciation (Depreciation) | $ | (1,190,002 | ) | $ | 12,650,414 | |||
| Total Accumulated Earnings/(Losses) – Net | $ | 235,790 | $ | 12,650,414 | ||||
NOTE 9 – CAPITAL LOSS CARRY FORWARD
Under the Regulated Investment Company Modernization Act of 2010 (the “Act”), the Fund is permitted to carry forward capital losses incurred in taxable years beginning after December 22, 2010, for an unlimited period. However, any losses incurred during those future taxable years will be required to be utilized prior to the losses incurred in pre-enactment taxable years. As a result of this, pre-enactment capital loss carryforwards may be more likely to expire unused.
As of June 30, 2021, the Funds have not generated a net capital loss carryforward.
| 45 |
NOTE 10 – TAX COST OF INVESTMENTS
As of June 30, 2021, the aggregate cost of investments for federal income tax purposes, the net unrealized appreciation or depreciation and the aggregated gross unrealized appreciation (depreciation) on investments were as follows:
Fund |
Aggregate | Net | Aggregate | Aggregate | ||||||||||||
| SDCI | $ | 8,903,174 | $ | (688,568 | ) | $ | — | $ | (688,568 | ) | ||||||
| UMI | 87,039,226 | 12,650,399 | 12,818,396 | (167,997 | ) | |||||||||||
NOTE 11 – TRUSTEES FEES
The Trust compensates each Trustee who is not an “interested person” of the Trust as defined in the 1940 Act. The Adviser, as a result of each Fund’s unitary management fee, pays for such compensation. The Trustees who are “interested persons” of the Trust do not receive any Trustees’ fees.
NOTE 12 – NEW ACCOUNTING PRONOUNCEMENT
In August 2018, the FASB issued Accounting Standards Update (“ASU”) No. 2018-13, which changes certain fair value measurement disclosure requirements. The new ASU, in addition to other modifications and additions, removes the requirement to disclose the amount and reasons for transfers between Level 1 and Level 2 of the fair value hierarchy, and the Trust’s policy for the timing of transfers between levels. The amendments are effective for financial statements issued for fiscal years beginning after December 15, 2019, and interim periods within those fiscal years. Management has evaluated the implications of certain provisions of the ASU and has determined that there will be no material impacts to the financial statements.
NOTE 13 – SUBSEQUENT EVENTS
The Funds have evaluated the need for disclosure and/or adjustments resulting from subsequent events through the date the financial statements were issued. Based on this evaluation, no adjustments were required to the financial statements.
| 46 | Annual Report June 30, 2021 |
REPORT OF INDEPENDENT REGISTERED PUBLIC ACCOUNTING FIRM
To the Shareholders and Board of Trustees of USCF ETF Trust
Opinion on the Financial Statements
We have audited the consolidated statement of assets and liabilities of the SummerHaven Dynamic Commodity Strategy No K-1 Fund and the and Subsidiary (“SDCI”) and statement of assets and liabilities of the USCF Midstream Energy Income Fund (“UMI”) (each a series of the USCF ETF Trust, the “Trust”, and collectively, the “Funds”), including the consolidated schedule of investments (SDCI) and schedule of investments (UMI) as of June 30, 2021, and the related consolidated statements of operations for the year ended June 30, 2021, changes in net assets for the years ended June 30, 2021 and 2020, and financial highlights for the years ended June 30, 2021, 2020 and 2019 and the period from inception (May 2, 2018) through June 30, 2018 (SDCI), and the related statements of operations for the period from inception (March 23, 2021) through June 30, 2021, changes in net assets for the period from inception (March 23, 2021) through June 30, 2021, and financial highlights for the period from inception (March 23, 2021) through June 30, 2021 (UMI), and the related notes and schedules (collectively referred to as the financial statements).
In our opinion, the financial statements and financial highlights referred to above present fairly, in all material respects, the financial position of the Funds as of June 30, 2021, and the results of their operations for the year ended June 30, 2021, changes in net assets for the years ended June 30, 2021 and 2020, and financial highlights for the years ended June 30, 2021, 2020, 2019 and for the period from inception (May 2, 2018) through June 30, 2018 (SDCI) and for the period from inception (March 23, 2021) through June 30, 2021 (UMI), in conformity with accounting principles generally accepted in the United States of America.
Basis for Opinion
These financial statements and financial highlights are the responsibility of the Trust’s management. Our responsibility is to express an opinion on the Trust’s financial statements and financial highlights based on our audits. We are a public accounting firm registered with the Public Company Accounting Oversight Board (United States) (PCAOB) and are required to be independent with respect to the Trust in accordance with the U.S. federal securities laws and the applicable rules and regulations of the Securities and Exchange Commission and the PCAOB.
| 47 |
We conducted our audits in accordance with the standards of the PCAOB. Those standards require that we plan and perform the audits to obtain reasonable assurance about whether the financial statements are free of material misstatement, whether due to error or fraud. The Trust is not required to have, nor were we engaged to perform, an audit of its internal control over financial reporting. As part of our audits, we are required to obtain an understanding of internal control over financial reporting, but not for the purpose of expressing an opinion on the effectiveness of the Trust’s internal control over financial reporting. Accordingly, we express no such opinion.
Our audits included performing procedures to assess the risks of material misstatement of the financial statements and financial highlights, whether due to error or fraud, and performing procedures that respond to those risks. Such procedures included examining, on a test basis, evidence regarding the amounts and disclosures in the financial statements and financial highlights. Our procedures included confirmation of securities owned as of June 30, 2021, by correspondence with the custodian. Our audits also included evaluating the accounting principles used and significant estimates made by management, as well as evaluating the overall presentation of the financial statements and financial highlights. We believe that our audits provide a reasonable basis for our opinion.
/s/ Spicer Jeffries LLP
We have served as the Trust’s auditor since 2014.
Denver, Colorado
August 24, 2021
| 48 | Annual Report June 30, 2021 |
APPROVAL OF INVESTMENT ADVISORY AND SUB-ADVISORY AGREEMENTS
Board Evaluation and Approval of New Agreements for USCF Midstream Energy Income Fund (“UMI”).
At its quarterly meeting held on February 18, 2021 (the “Meeting”), the Board of Trustees (the “Board”) of USCF ETF Trust (the “Trust”), including the Trustees who are not “interested persons” (as defined in the Investment Company Act of 1940, as amended (the “1940 Act”)) (the “Independent Trustees”), unanimously approved (i) the addition of UMI to the investment advisory agreement between USCF Advisers LLC (the “Adviser”) and the Trust (the “Advisory Agreement”) and a new investment sub-advisory agreement between the Adviser and Miller/Howard, Inc. (“Miller/Howard”) on behalf of UMI (the “Sub-Advisory Agreement” and, together with the Advisory Agreement, the “UMI Agreements”). Each of the UMI Agreements was approved for an initial two year term.
In approving the UMI Agreements, the Board considered information provided by the Adviser and Miller/Howard both before and during the meeting. The Board’s consideration of various factors and its conclusions with respect to such factors formed the basis for the Board’s determination to approve the UMI Agreements. The factors considered by the Board included, but were not limited to: (i) the personnel resources of the Adviser and Miller/Howard; (ii) the experience and expertise of the Adviser and Miller/Howard; (iii) the financial capabilities and resources of the Adviser and Miller/Howard; (iv) the compliance procedures and histories of the Adviser and Miller/Howard; (v) the performance of other accounts in comparison to similarly managed funds, and of the Adviser’s and Miller/ Howard’s other clients; (vi) the amount of the proposed advisory fees and sub-advisory fees in comparison to similarly managed funds of the Adviser’s and Miller/Howard’s other clients; (vii) the estimated total expenses of UMI in comparison to similarly managed funds; (viii) the estimated profitability level of the Adviser and Miller/Howard with respect to the Advisory Agreement and Sub-Advisory Agreement, as applicable; (ix) the extent of any economies of scale and whether the fee structures reflect such economies of scale; (x) the existence of any collateral benefits that may be realized by the Adviser and Miller/ Howard, such as affiliated brokerage arrangements or the use of soft dollars; (xi) any collateral benefits that may be realized by UMI resulting from its relationships with the Adviser and Miller/Howard; and (xii) the effect of the unitary fee structure of UMI. In its consideration of each of the UMI Agreements, the Board did not identify any single factor as all-important or controlling.
In connection with their review of the Advisory Agreement, the Trustees considered the factors listed below.
| 49 |
Nature, Extent and Quality of Services
The Board examined the nature, extent and quality of the services to be provided by the Adviser to UMI. The Board considered the presentations and written information given to the Board in connection with the Meeting, including the Advisory Agreement and information provided by the Adviser in response to the Board’s requests for information. The Board considered the Adviser’s business operations; the Adviser’s investment management process; the Adviser’s experience advising affiliated funds and other accounts; the experience and capability of the Adviser’s senior management and other key personnel; the Adviser’s overall financial strength; and the quality of the Adviser’s compliance program. In addition to investment management services, the Board also considered the nature, extent, and quality of administrative, compliance, and legal services that would be provided, and had been provided to other series of the Trust, by the Adviser. The Board concluded that the nature, extent and quality of the services to be provided by the Adviser would benefit UMI and its’ shareholders.
Fees and Expenses
The Board compared the proposed advisory fee to the advisory fee of other funds managed by the Adviser and other funds with investment strategies similar to that of UMI. The Board considered the differences between a unitary fee structure and an expense limitation agreement arrangement. The Board concluded that UMI’s proposed advisory fee, as well as the overall projected expense ratio, were acceptable considering the complex nature of UMI and its investment strategy, the quality of the services UMI expects to receive from the Adviser and the level of fees paid by similar funds.
Economies of Scale
The Board considered whether economies of scale exist with respect to the management of UMI and determined that UMI was not expected to benefit from economies of scale until it achieved sufficient asset size.
Profitability
The Board considered the anticipated profits that may be realized by the Adviser under the Advisory Agreement, and whether the amount of profit is a fair entrepreneurial profit for the management of UMI. The Board also considered UMI’s operating expenses on the Adviser’s profits.
Collateral Benefits
The Board considered that the Adviser is not affiliated with any of UMI’s other primary service providers, and therefore will not benefit from those contractual relationships.
| 50 | Annual Report June 30, 2021 |
Conclusion
Having requested and received such information from the Adviser as the Board believed to be reasonably necessary to evaluate the terms of the Advisory Agreement, and with the advice of counsel, the Board, including the Independent Trustees, concluded that the advisory fee is reasonable and, in light of the matters that the Trustees have considered to be relevant in the exercise of their reasonable judgment, approved the Advisory Agreement.
In connection with their review of the Sub-Advisory Agreement, the Trustees considered the factors listed below.
Nature, Extent and Quality of Services
The Board examined the nature, extent, and quality of the services to be provided by Miller/ Howard under the Sub-Advisory Agreement. The Board considered the written information provided to the Board prior to and during the Meeting, including information provided by the Adviser and Miller/Howard in response to the Board’s requests for information. The Board considered Miller/Howard’s operations and the services to be provided to UMI, including trading, administrative, compliance, and marking support services. The Board considered Miller/Howard’s experience advising other accounts; its experience managing assets in the midstream energy space; the experience and capability of Miller/Howard’s senior management and other key personnel; Miller/Howard’s overall financial strength; and the quality of Miller/Howard’s compliance program. The Board concluded that the nature, extent, and quality of the services to be provided by Miller/Howard under the Sub-Advisory Agreement would benefit UMI and its shareholders.
Investment Performance
With respect to performance, the Board considered the performance of the other accounts managed by Miller/Howard with similar investment strategies.
Fees and Expenses
The Board reviewed the fees to be paid to Miller/Howard for its services under the Sub-Advisory Agreement. The Board took into account that UMI would not pay any fees to Miller/Howard directly, and that the fees paid to Miller/Howard would be paid from the unitary management fees paid to the Adviser. The Board concluded that the sub-advisory fee was acceptable in light of the quality of the services that the Fund expects to receive from the Miller/Howard.
Economies of Scale
The Board considered whether Miller/Howard would realize economies of scale with respect to the services to be provided to UMI. It was the consensus of the Board that based on the projected size of UMI, economies of scale was not a relevant consideration at this time.
| 51 |
Profitability
The Board considered the anticipated that may be realized by Miller/Howard under the Sub-Advisory Agreement, and whether the amount of profit is a fair entrepreneurial profit for the services to be provided under the Sub-Advisory Agreement. When evaluating Miller/Howard’s estimated profitability, the Board noted that the Sub-Advisory Agreement was negotiated at arms-length by the Adviser and that Miller/Howard had agreed to waive a portion of its fee until UMI gained substantial assets. The Board concluded that Miller/Howard’s expected level of profitability from its relationship with the Trust was not excessive.
Collateral Benefits
The Board considered whether Miller/Howard or its affiliates may receive other benefits as a result of its relationship with the Trust. The Board concluded that the fees to be paid to Miller/Howard were reasonable in relation to the nature, extent, and quality of services to be provided.
Conclusion
Having requested and received such information from the Adviser and Miller/Howard as the Board believed to be reasonably necessary to evaluate the terms of the Sub-Advisory Agreement, the Board, including the Independent Trustees, concluded that the fees to be paid to Miller/Howard were reasonable and, in light of the matters that the Trustees considered to be relevant in the exercise of their reasonable judgment, approved the Sub-Advisory Agreement.
Board Evaluation and Approval of a New Sub-Advisory Agreement with respect to SDCI
At its quarterly meeting held on May 5, 2021 (the “May Meeting”), the Board of the Trust, including the Independent Trustees, unanimously approved a new sub-advisory agreement between the Adviser and SummerHaven Investment Management LLC (“SummerHaven”) on behalf of the wholly-owned subsidiary (the “Subsidiary”) of the USCF SummerHaven Dynamic Commodity Strategy No K-1 Fund (“the SDCI Agreement”). The SDCI Agreement was approved for an initial two year term to commence upon a proposed change in control of SummerHaven that was discussed during the meeting.
In approving the SDCI Agreement, the Board noted that it had received information from SummerHaven about a potential new ownership structure that would lead to a technical change in control of SummerHaven and a termination of the current agreement with respect to the Subsidiary. The Board also noted that it received assurances from the Adviser and SummerHaven that the change in ownership at SummerHaven was not expected to result in a change in the nature or quality of the services provided to the Subsidiary. Additionally, the Board noted that it had previously received and reviewed, including at its prior meetings, substantial information regarding SummerHaven and the services to be provided to the Subsidiary in connection with the Board’s approval of prior agreements. The Board’s consideration of various factors and its conclusions with respect to such factors formed the basis for the Board’s determination to approve the SDCI Agreement.
| 52 | Annual Report June 30, 2021 |
The Board’s conclusions are based on the comprehensive consideration of all information presented to it and did not identify any single factor as all-important or controlling. In connection with their review of the SDCI Agreement, the Trustees considered the factors listed below.
Nature, Extent and Quality of Services
The Board examined the nature, extent, and quality of the services to be provided by SummerHaven under the SDCI Agreement. The Board considered the written information provided to the Board prior to and during the Meeting, including information provided by the Adviser and SummerHaven in response to the Board’s requests for information. The Board considered SummerHaven’s operations and the services currently provided and to be provided to SDCI, including trading, administrative, compliance, and marking support services. The Board considered SummerHaven’s experience advising other accounts; the experience and capability of SummerHaven’s senior management and other key personnel; SummerHaven’s overall financial strength; and the quality of SummerHaven’s compliance program. The Board concluded that the nature, extent, and quality of the services to be provided by SummerHaven under the SDCI Agreement would benefit SDCI and its shareholders.
Investment Performance
With respect to performance, the Board considered the performance of SDCI, as well as the manner in which SummerHaven managed the commodity positions of SDCI’s subsidiary. The Board considered the performance of the other accounts managed by SummerHaven with similar investment strategies. With respect to the SDCI Subsidiary, the Board concluded that the SDCI Subsidiary was performing as expected within the fund structure of SDCI and as compared to SDCI’s benchmark index.
Fees and Expenses
The Board reviewed the fees to be paid to SummerHaven for its services under the SDCI Agreement. The Board took into account that neither SDCI nor SDCI’s subsidiary would pay any fees to SummerHaven directly, and that the fees paid to SummerHaven would be paid from the unitary management fees paid to the Adviser. The Board also noted that the Adviser also paid a SummerHaven affiliate a fee for licensing and services related to the index used as a benchmark by SDCI. The Board concluded that the sub-advisory fees were acceptable in light of the quality of the services that the SDCI Subsidiary had received and expect to receive from SummerHaven.
| 53 |
Economies of Scale
The Board considered whether SummerHaven would realize economies of scale with respect to the services to be provided to the SDCI Subsidiary. It was the consensus of the Board that based on the size of SDCI, economies of scale was not a relevant consideration at this time.
Profitability
The Board considered the anticipated profits realized, and that may be realized, by SummerHaven under the SDCI Agreement and the related licensing agreement, and whether the amount of profit is a fair entrepreneurial profit for the services to be provided under the SDCI Agreement. When evaluating SummerHaven’s estimated profitability, the Board noted that the SDCI Agreement was negotiated at arms-length by the Adviser. The Board concluded that SummerHaven’s expected level of profitability from its relationship with the Trust was not excessive.
Collateral Benefits.
The Board considered whether SummerHaven or its affiliates may receive other benefits as a result of its relationship with the Trust. The Board acknowledged that an affiliate of SummerHaven receives fees under a licensing agreement with the Adviser, and that the Adviser relies on that agreement to use names and marks in connection with SDCI. The Board concluded that the fees to be paid to SummerHaven were reasonable in relation to the nature, extent, and quality of services to be provided.
Conclusion
Having requested and received such information from the Adviser and SummerHaven as the Board believed to be reasonably necessary to evaluate the terms of the SDCI Agreement, the Board, including the Independent Trustees, concluded that the fees to be paid to SummerHaven were reasonable and, in light of the matters that the Trustees considered to be relevant in the exercise of their reasonable judgment, approved the SDCI Agreement.
| 54 | Annual Report June 30, 2021 |
ADDITIONAL INFORMATION (UNAUDITED)
Members of the Board and Officers of the Trust
Set forth below are the names, ages, positions with the Trust, terms of office, and the principal occupations and other directorships for a minimum of the last five years, of each of the persons currently serving as members of the Board and as Executive Officers of the Trust. Also included below is the term of office for each of the Executive Officers of the Trust. The members of the Board serve as Trustees for the life of the Trust or until retirement, removal, or their office is terminated pursuant to the Trust’s Declaration of Trust and Trust Agreement.
The Chairman of the Board, Nicholas D. Gerber, and Management Trustees, Andrew F Ngim and Stuart P. Crumbaugh are interested persons of the Trust as that term is defined under Section 2(a)(19) of the 1940 Act (“Interested Trustees”) because of their affiliation with the Adviser.
Messrs. Thomas E. Gard, Jeremy Henderson, John D. Schwartz, and H. Abram Wilson, and their immediate family members have no affiliation or business connection with the Adviser or the Funds’ principal underwriter or any of their affiliated persons and do not own any stock or other securities issued by the Adviser or the Funds’ principal underwriter. These Trustees are not Interested Persons of the Trust and are referred to herein as “Independent Trustees.”
The following tables present information about the Trustees and Officers. The Statement of Additional Information has additional information about the Trustees and is available without charge, upon request, by contacting the Funds at 1(800) 920-0259, or visiting: www.uscfinvestments.com.
| 55 |
Independent Trustees
| Name and Age(1) | Position(s) Held with Trust | Term of Office and Length of Time Served(2) | Principal Occupation(s) During Past 5 Years | Number of Portfolios in Fund Complex Overseen by Trustee | Other Directorships Held by Trustee (Past 5 Years) | |||||
| Thomas E. Gard Year of Birth: 1959 | Independent Trustee | Since 2015 | Partner of Armanino LLP from 1995 – 2019; Member of Armanino Executive Committee from 2001 –2015; and Partner in Charge of Armanino LLP Audit Department December from 2004 – 2013. Mr. Gard has been retired from 2019 – present. | Three | None | |||||
| Jeremy Henderson Year of Birth: 1956 | Independent Trustee | Since 2014 | Chief Operating Officer, North Island LLC from 2017 – present; Retired from 2007 – 2017; Managing Director of Societe Generale from 1991 – 2007. | Three | None | |||||
| John D. Schwartz Year of Birth: 1968 | Independent Trustee | Since 2014 | President of Sam Clar Office Furniture from 1996 – present. | Three | None | |||||
| H. Abram Wilson Year of Birth: 1946 | Independent Trustee | Since 2014 | San Ramon City, CA Council member from 1999 – 2011, including Mayor of San Ramon City, CA from 2002 –2009. Mr. Wilson has been retired from 2011 – present. | Three | None |
| 56 | Annual Report June 30, 2021 |
Interested Trustees and Officers of the Trust
| Name and Age(1) | Position(s) Held with Trust | Term of Office and Length of Time Served(2) | Principal Occupation(s) During Past 5 Years | Number of Portfolios in Fund Complex Overseen by Trustee | Other Directorships Held by Trustee (Past 5 Years) | |||||
| Nicholas D. Gerber(3) Year of Birth: 1962 | Chairman and Trustee | Since 2014 | Chairman of the Board of Directors of United States Commodity Funds LLC(“USCF”), which is the sponsor of a family of commodity pools whose shares are registered under the Securities Act of 1933 since 2005; President and Chief Executive Officer of USCF from 2005 – June 2015; Serves on Board of Managers of USCF Advisers LLC (“USCF Advisers”) since June 2014 and President and Chief Executive Officer of USCF Advisers from June 2014 – June 2015; Vice President of USCF since June 2015; Chief Executive Officer, President and Secretary of Concierge Technologies, Inc. (“Concierge”) since January 2015; CEO and a member of the Board of Directors of Marygold & Co., a subsidiary of Concierge, since November 2019; Executive Director and member of the Board of Directors of Marygold & Co. (UK) Limited, a newly formed subsidiary of Concierge from August 2021; Co-founded Ameristock Corporation in March 1995, a registered investment adviser under the Investment Advisers Act of 1940 from March 1995 until January 2013; and Portfolio Manager of the Ameristock Mutual Fund, Inc. a mutual fund registered under the 1940 Act, from August 1995 – January 2013. | Three | Management Director of USCF. Chairman of the Board of Concierge since January 26, 2015. |
| 57 |
| Name and Age(1) | Position(s) Held with Trust | Term of Office and Length of Time Served(2) | Principal Occupation(s) During Past 5 Years | Number of Portfolios in Fund Complex Overseen by Trustee | Other Directorships Held by Trustee (Past 5 Years) | |||||
| John P. Love Year of Birth: 1971 | President (Principal Executive Officer) | Since 2015 | Chief Executive Officer and President of USCF since June 2015 and Management Director of USCF since October 2016 and Chairman of the Board of Directors of USCF since 2019; Senior Portfolio Manager of USCF from March 2010 – June 2015; Portfolio Manager of USCF from April 2006 – March 2010; President of USCF Advisers since June 2015 and serves on Board of Managers of USCF Advisers since November 2016. | N/A | N/A | |||||
| Stuart P. Crumbaugh(3) Year of Birth: 1963 | Chief Financial Officer (Principal Accounting and Principal Financial Officer), Treasurer and Trustee | CFO and Treasurer since May 2015; Secretary from May 2015 – October 2016; In-dependent Trustee of USCF ETF Trust from inception – February 2015 and Interested Trustee since February 2015 | Chief Financial Officer of Concierge since December 2017; Treasurer and a member of the Board of Directors of Marygold & Co. since November 2019; Chief Financial Officer (Principal Accounting Officer), Treasurer and Secretary of USCF Advisers and USCF since June 2015 and May 2015, respectively; Treasurer and member of the Board of Directors of Marygold & Co. (UK) Limited, a newly formed subsidiary of Concierge from August 2021; Vice President Finance and Chief Financial Officer of Sikka Software Corporation from April 2014 – April 2015; Vice President, Corporate Controller and Treasurer of Auction.com, LLC from December 2012 – December 2013; Chief Financial Officer of IP Infusion Inc. from March 2011 – September 2012; Consultant from January 2010 – February 2011. | Three | None |
| 58 | Annual Report June 30, 2021 |
| Name and Age(1) | Position(s) Held with Trust | Term of Office and Length of Time Served(2) | Principal Occupation(s) During Past 5 Years | Number of Portfolios in Fund Complex Overseen by Trustee | Other Directorships Held by Trustee (Past 5 Years) | |||||
| Andrew F Ngim(3) Year of Birth: 1960 | Trustee, Vice President, Secretary, and Portfolio Manager | Trustee from 2014 – February 2015 and May 2015 – Present; Secretary since October 2016 | Co-founded USCF in 2005 and has served as a Management Director since May 2005 and Chief Operating Officer since August 2016; Portfolio Manager for the United States Commodity Index Funds Trust since January 2013; Treasurer of USCF from June 2005 – February 2012; Assistant Secretary and Assistant Treasurer of USCF Advisers since June 2013; Prior to and concurrent with his services to USCF, from January 1999 – January 2013, Mr. Ngim served as Managing Director for Ameristock Corporation which he co-founded in March 1995 and was Co-Portfolio manager of Ameristock Mutual Fund, Inc. from January 2000 – January 2013; Portfolio Manager for USCF ETF Trust since 2014. | Three | Management Director of USCF since May 2005. |
| 59 |
| Name and Age(1) | Position(s) Held with Trust | Term of Office and Length of Time Served(2) | Principal Occupation(s) During Past 5 Years | Number of Portfolios in Fund Complex Overseen by Trustee | Other Directorships Held by Trustee (Past 5 Years) | |||||
| Carolyn M. Yu Year of Birth: 1958 | Chief Compliance Officer and AML Officer | Chief Legal Officer from May 2015 – April 2018; Chief Compliance Officer, since February 2015; AML Officer since 2014 | Chief Compliance Officer of USCF since February 2013; General Counsel of USCF from May 2015 – April 2018 and Assistant General Counsel of USCF from August 2011 – April 2015; from May 2015 – April 2018, Ms. Yu served as Chief Legal Officer of USCF Advisers and serves as Chief Compliance Officer of USCF Advisers since May 2015; Associate Counsel, Assistant Chief Compliance Officer of USCF ETF Trust from June 2014 – February 2015; General Counsel of Concierge from November 2017 – December 2018; Branch Chief – Securities Enforcement Branch for the State of Hawaii, Department of Commerce and Consumer Affairs 2008 – 2011. | N/A | N/A | |||||
| Daphne G. Frydman Year of Birth: 1974 | Chief Legal Officer; Assistant Secretary | Chief Legal Officer since May 2018; Assistant Secretary since 2016. | General Counsel of USCF and USCF Advisers since May 2018; Deputy General Counsel of USCF from May 2016 – April 2018; Assistant Secretary since October 2016; Partner at Sutherland Asbill & Brennan LLP from January 2011 – April 2016; and counsel and associate at the same from 2009 – 2010 and from 2001 – 2008, respectively. | N/A | N/A |
| (1) | The address of each Trustee and officer is c/o USCF ETF Trust, 1850 Mt. Diablo Blvd., Suite 640, Walnut Creek, CA 94596. |
| (2) | The Trustees and Officers serve until their successors are duly elected and qualified. |
| (3) | Messrs. Gerber, Crumbaugh and Ngim are “interested persons” of the Trust (as that term is defined in the 1940 Act) because of their affiliation with the Adviser. |
| 60 | Annual Report June 30, 2021 |
ADDITIONAL INFORMATION (UNAUDITED)
Federal Income Tax Information
For the year ended June 30, 2021, the USCF Midstream Energy Income Fund reports the maximum amount allowable under Section 854 of the Internal Revenue Code, but not less than, the following percentages of the ordinary income dividends paid as 1) qualified dividend income (QDI); 2) eligible for corporate dividend received deduction (DRD):
| QDI | DRD | |||||||
| USCF Midstream Energy Income Fund | 100.00 | % | 35.21 | % | ||||
In January 2022 you will be advised on IRS Form 1099-DIV or substitute 1099-DIV as to the federal tax status of the dividends and distributions received by you in calendar year 2021.
| 61 |
www.uscfinvestments.com
1-800-920-0259
The fund is distributed by ALPS Distributors, Inc.
Item 1. Reports to Stockholders (cont.).
| (b) | Not applicable. |
Item 2. Code of Ethics.
| (a) | As of the period ended June 30, 2021 (the “Reporting Period”), the Registrant has adopted a code of ethics that applies to the Registrant’s principal executive officer, principal financial officer, principal accounting officer, controller or persons performing similar functions, regardless of whether these individuals are employed by the registrant or a third party. |
| (c) | During the Reporting Period, there have been no amendments, during the period covered by this report, to a provision of the code of ethics that applies to the Registrant’s principal executive officer, principal financial officer, principal accounting officer or controller, or persons performing similar functions, regardless of whether these individuals are employed by the Registrant or a third party, and that relates to any element of the code of ethics description. |
| (d) | During the Reporting Period, the Registrant has not granted any waivers, including an implicit waiver, from a provision of the code of ethics that applies to the Registrant’s principal executive officer, principal financial officer, principal accounting officer or controller, or persons performing similar functions, regardless of whether these individuals are employed by the Registrant or a third party, that relates to one or more of the items set forth in paragraph (b) of this item’s instructions. |
| (e) | Not applicable. |
| (f) | A copy of the code of ethics is attached hereto as Exhibit 13(a)(1). |
Item 3. Audit Committee Financial Expert.
The Registrant’s Board of Trustees has determined that Mr. Thomas E. Gard is qualified to serve as an audit committee financial expert serving on the Registrant’s audit committee and that he is “independent,” as defined by Item 3 of Form N-CSR.
Item 4. Principal Accountant Fees and Services.
| (a) | Audit Fees |
The aggregate fees billed for each of the last two fiscal years ended June 30, 2021, and June 30, 2020 for professional services rendered by the principal accountant for the audit of the Registrant’s annual financial statements or services that are normally provided by the accountant in connection with statutory and regulatory filings or engagements for that fiscal year were $24,000 in 2021 and $33,000 in 2020.
| (b) | Audit Related Fees |
The aggregate fees billed for each of the last two fiscal years ended June 30, 2021, and June 30, 2020, for assurance and related services rendered to the Registrant by the principal accountant that are reasonably related to the performance of the audit of the Registrant’s financial statements and are not reported under paragraph (a) of this Item were $0 in 2021 and $0 in 2020.
| (c) | Tax Fees |
The aggregate fees billed for each of the last two fiscal years ended June 30, 2021, and June 30, 2020 for professional services rendered to the Registrant by the principal accountant for tax compliance, tax advice and tax planning were $4,000 in 2021 and $2,000 in 2020. These services consisted of (i) review or preparation of U.S. federal, state, local and excise tax returns; (ii) U.S. federal, state and local entity tax planning, advice and assistance regarding statutory, regulatory or administrative developments, and (iii) tax advice regarding tax qualification.
| (d) | All Other Fees |
The aggregate fees billed for each of the last two fiscal years ended June 30, 2021, and June 30, 2020, for products and services provided by the principal accountant, other than the services reported in paragraphs (a) through (c) of this Item were $0 in 2021 and $0 in 2020.
| (e)(1) | Pursuant to the Registrant’s Audit Committee Charter that has been adopted by the audit committee, the audit committee shall approve all audit and permissible non-audit services to be provided to the Registrant and all permissible non-audit services to be provided to its investment adviser or any entity controlling, controlled by or under common control with the investment adviser that provides ongoing services to the Registrant if the engagement relates directly to the operations and financial reporting of the Registrant. |
| (e)(2) | The percentage of services described in paragraphs (b) through (d) of this Item that were approved by the audit committee pursuant to paragraph (c)(7)(i)(C) of Rule 2-01 of Regulation S-X, with respect to: Audit-Related Fees were 0% for 2021 and 0% for 2020; Tax Fees were 14.3% for 2021 and 5.7% for 2020; and all Other Fees were 0% for 2021 and 0% for 2020. |
| (f) | The percentage of hours expended on the principal accountant’s engagement to audit the Registrant’s financial statements for the most recent fiscal year that were attributed to work performed by persons other than the principal accountant’s full-time, permanent employees was less than fifty percent. |
| (g) | The aggregate non-audit fees billed by the Registrant’s accountant for services rendered to the Registrant, and rendered to the Registrant’s investment adviser (not including any sub-adviser whose role is primarily portfolio management and is subcontracted with or overseen by another investment adviser), and any entity controlling, controlled by, or under common control with the investment adviser that provides ongoing services to the Registrant for each of the last two fiscal years of the Registrant were $0 for 2021 and $0 for 2020. |
| (h) | The Registrant’s audit committee has considered whether the provision of non-audit services that were rendered to the Registrant’s investment adviser (not including any sub-adviser whose role is primarily portfolio management and is subcontracted with or overseen by another investment adviser), and any entity controlling, controlled by, or under common control with the investment adviser that provides ongoing services to the Registrant that were not pre-approved pursuant to paragraph (c)(7)(ii) of Rule 2-01 of Regulation S-X is compatible with maintaining the principal accountant’s independence. |
Item 5. Audit Committee of Listed Registrants.
| (a) | The Registrant has a separately designated audit committee established in accordance with Section 3(a)(58)(A) of the Securities Exchange Act of 1934, as amended, which consists of independent trustees of the Registrant. The audit committee members are Jeremy Henderson, John D. Schwartz, H. Abram Wilson and Thomas E. Gard. |
| (b) | Not applicable. |
Item 6. Investments.
| (a) | The Schedule of Investments in securities of unaffiliated issuers as of the close of the Reporting Period is included as part of the report to shareholders filed under Item 1(a) of this Form N-CSR. |
| (b) | Not applicable. |
Item 7. Disclosure of Proxy Voting Policies and Procedures for Closed-End Management Investment Companies.
Not applicable.
Item 8. Portfolio Managers of Closed-End Management Investment Companies.
Not applicable.
Item 9. Purchases of Equity Securities by Closed-End Management Investment Company and Affiliated Purchasers.
Not applicable.
Item 10. Submission of Matters to a Vote of Security Holders.
There have been no material changes to the procedures by which the shareholders may recommend nominees to the Registrant’s Board of Trustees, where those changes were implemented after the registrant last provided disclosure in response to the requirements of Item 407(c)(2)(iv) of Regulation S-K (17 CFR 229.407) (as required by Item 22(b)(15) of Schedule 14A (17 CFR 240.14a-101)), or this Item.
Item 11. Controls and Procedures.
| (a) | The Registrant’s principal executive and principal financial officers, or persons performing similar functions, have concluded that the registrant’s disclosure controls and procedures (as defined in Rule 30a-3(c) under the Investment Company Act of 1940, as amended (the “1940 Act”) (17 CFR 270.30a-3(c))) are effective, as of a date within 90 days of the filing date of the report that includes the disclosure required by this paragraph, based on their evaluation of these controls and procedures required by Rule 30a-3(b) under the 1940 Act (17 CFR 270.30a-3(b)) and Rules 13a-15(b) or 15d-15(b) under the Securities Exchange Act of 1934, as amended (17 CFR 240.13a-15(b) or 240.15d-15(b)). |
| (b) | There were no changes in the Registrant’s internal control over financial reporting (as defined in Rule 30a-3(d) under the 1940 Act (17 CFR 270.30a-3(d))) that occurred during the period covered by this report that has materially affected, or is reasonably likely to materially affect, the registrant’s internal control over financial reporting. |
Item 12. Disclosure of Securities Lending Activities for Closed-End Management Investment Companies.
Not applicable.
Item 13. Exhibits.
| (a)(1) | Code of ethics that is the subject of disclosure required by Item 2 of this Form N-CSR is attached hereto. |
| (a)(2) | Certifications pursuant to Rule 30a-2(a) under the 1940 Act and Section 302 of the Sarbanes-Oxley Act of 2002 are attached hereto. |
| (a)(3) | Not applicable. |
| (a)(4) | Not applicable. |
| (b) | Certifications pursuant to Rule 30a-2(b) under the 1940 Act and Section 906 of the Sarbanes-Oxley Act of 2002 are attached hereto. |
SIGNATURES
Pursuant to the requirements of the Securities Exchange Act of 1934 and the Investment Company Act of 1940, the registrant has duly caused this report to be signed on its behalf by the undersigned, thereunto duly authorized.
| (Registrant) | USCF ETF Trust |
| By (Signature and Title)* | /s/ John P. Love | |
| John P. Love, President and Chief Executive Officer (Principal Executive Officer) |
| Date | 08/30/2021 |
Pursuant to the requirements of the Securities Exchange Act of 1934 and the Investment Company Act of 1940, this report has been signed below by the following persons on behalf of the registrant and in the capacities and on the dates indicated.
| By (Signature and Title)* | /s/ John P. Love | |
| John P. Love, President and Chief Executive Officer (Principal Executive Officer) |
| Date | 08/30/2021 |
| By (Signature and Title)* | /s/ Stuart P. Crumbaugh | |
| Stuart P.Crumbaugh, Treasurer and Chief Financial Officer (Principal Financial Officer) |
| Date | 08/30/2021 |
* Print the name and title of each signing officer under his or her signature.