UNITED STATES
SECURITIES AND EXCHANGE COMMISSION
WASHINGTON, D.C. 20549
FORM N-CSR
CERTIFIED SHAREHOLDER REPORT OF REGISTERED
MANAGEMENT INVESTMENT COMPANIES
811-22933
(Investment Company Act file number)
Griffin Institutional Access Real Estate Fund
(Exact name of registrant as specified in charter)
Griffin Capital Plaza
1520 Grand Avenue
El Segundo, CA 90245
(Address of principal executive offices)
(310) 469.6100
(Registrant's telephone number, including area code)
ALPS Fund Services, Inc.
1290 Broadway, Suite 1100
Denver, CO 80203
(Name and address of agent for service)
Copy to:
Terrence O. Davis, Esq.
Greenberg Traurig, LLP
Terminus 200
3333 Piedmont Road, NE, Suite 2500
Atlanta, GA 30305
Date of fiscal year end:September 30
Date of reporting period:October 1, 2018 – March 31, 2019
Item 1. Reports to Stockholders.
Electronic Reports Disclosure
Beginning on January 1, 2021, as permitted by regulations adopted by the Securities and Exchange Commission, paper copies of the Fund shareholder reports will no longer be sent by mail, unless you specifically request paper copies of the reports from the Fund or from your financial intermediary (such as a broker-dealer or bank). Instead, the reports will be made available on the Fund’s website (www.griffincapital.com), and you will be notified by mail each time a report is posted and provided with a website link to access the report. You may elect to receive all future reports in paper free of charge. If you invest through a financial intermediary, you can contact your financial intermediary to request that you continue to receive paper copies of your shareholder reports. If you invest directly with the Fund, you can call the Fund toll-free at 1-888-926-2688 or submit a signed letter of instruction requesting paper reports to Griffin Institutional Access Real Estate Fund, c/o DST Systems, Inc., 430 W 7th St, Kansas City, MO 64105-1407. Your election to receive reports in paper will apply to all funds held in your account if you invest through your financial intermediary or all funds held with the fund complex if you invest directly with a fund. If you already elected to receive shareholder reports electronically, you will not be affected by this change and you need not take any action. You may elect to receive shareholder reports and other communications from the Fund electronically anytime by contacting your financial intermediary or, if you invest directly with the Fund, by enrolling at www.griffincapital.com.
Table of Contents
| Shareholder Letter | 2 |
| Portfolio Update | 16 |
| Portfolio of Investments | 18 |
| Statement of Assets and Liabilities | 22 |
| Statement of Operations | 23 |
| Statements of Changes in Net Assets | 24 |
| Statement of Cash Flows | 26 |
| Financial Highlights | 27 |
| Notes to Financial Statements | 37 |
| Additional Information | 44 |
| Privacy Notice | 45 |
| 2 | GRIFFIN INSTITUTIONAL ACCESS REAL ESTATE FUND |
| SEMI-ANNUAL REPORT 2019 |
Dear Fellow Shareholders,
We are pleased to present the Griffin Institutional Access® Real Estate Fund (the “Fund”) semi-annual report. Since our last report, the Fund saw record levels of inflows in the first quarter of 2019 and has grown to over $3 billion in assets under management. We greatly appreciate the support of our shareholders and we will remain true to the Fund’s stated objective of delivering returns comprised of income and appreciation with moderate volatility and low correlation to the broader markets. From inception through March 31, 2019, the Fund’s load-waived Class A shares (NASDAQ: GIREX) generated a(n):
| ● | Total cumulative return of 39.33% and a 7.23% annualized return1 |
| ● | Sharpe ratio of 2.821 |
| ● | Standard deviation of 2.27, which is less than that of the Bloomberg Barclays U.S. Aggregate Bond Index (2.89)1 |
| ● | Alpha of 5.211, 2 |
| ● | Beta of 0.101, 2 |
Over the trailing six-month period ending March 31, 2019, financial markets exhibited increased levels of volatility with the S&P 500 declining 903 basis points (bps) in December to end 2018 down 438 bps.3 For those who are keeping score, the S&P 500 exhibited 64 days where the index closed with a return representing a movement of 1% or more, comparing to only 8 days of movement greater than 1% during 2017.3This volatility was most pronounced on December 24, 2018, when the S&P 500 lost 270 bps—its worst performance in history—leading into the Christmas holiday.3 The selloff in the fourth quarter of 2018 was largely driven by Fed concerns, trade tensions with China, and slowing global growth.
The weakness we observed across financial markets at the end of 2018 quickly gave way to strength as we crossed into 2019. Risk assets recovered their December losses and the S&P 500 rallied 13.65% from the start of the year through the end of March.3 Despite the continued backdrop of geopolitical risk and the longest government shutdown on record, markets rallied as labor markets showed strength, surprising even the most optimistic forecasters, when the December payroll statistics were released in early January. Overall, the economy appears to be on solid footing. Gross domestic product (GDP) growth, albeit slowing, remained positive during the fourth quarter and modestly surprised expectations at 2.6%.4 Most recently, in a move to provide stability to financial markets, the Fed announced they would pause quantitative tightening, noting they did not foresee the need for additional upward adjustment to the target rate during the balance of 2019. We view this communication from Fed Chairman Jerome Powell as a tailwind for risk assets moving forward. As always, we will continue to monitor the broader economy for early warning indicators of a pending slowdown. For now, however, we continue to view the risk of a near term recession as low.
Past performance is no guarantee of future results. All metrics are based on load-waived Class A shares and does not reflect a maximum sales charge of 5.75% for Class A shares. If the data reflected the deduction of such fees, the performance would be lower. The Fund offers five share classes: GIREX - Class A, GCREX - Class C, GRIFX - Class I, GLREX - Class L, and GMREX - Class M. For more information on the differences in share classes, refer to the applicable prospectus, which can be found at: www.griffincapital.com.
| GRIFFIN INSTITUTIONAL ACCESS REAL ESTATE FUND | 3 |
| SEMI-ANNUAL REPORT 2019 |
Despite turbulent market conditions, we posted our 19th consecutive quarter of positive performance during the first quarter of 2019 and have started 2019 with three months of above trend returns. Through the end of March, the Fund’s load-waived Class A shares returned 7.94% over the trailing one-year period, outperforming the Bloomberg Barclays U.S. Aggregate Bond Index by 346 bps.3 We were able to generate this strong performance through active management, with a focus on generating returns through investment in securities with strong fundamentals and, at times, dislocated pricing. For example, as publicly traded REITs sold off 13.27% from their 2018 high during the month of December 20183, we added to our exposure as these securities began trading at significant discounts to net asset value (NAV). Given that the selloff was technically driven and did not represent a degradation in fundamentals, publicly traded REITs bounced back off of their December lows, climbing 21.14%.3 In addition to our ability to actively manage across both public and private securities, we selected private securities that were also a positive contributor to Fund performance. Currently, we are invested across 28 different private securities which represent $182 billion of gross asset value within 2,654 assets diversified across markets and managers.5 During the period, we continue to see strong fundamentals across our target markets. Generally speaking, we believe that supply remains in check and demand remains robust as the economic expansion continues. Industrial assets represented the top performing sector during the fourth quarter of 2018, driven by demand for warehouse space to service the increased demands of e-commerce.6 In addition, we expect the multifamily sector will begin to outperform other sectors as strong demographics and a paradigm shift towards renting as opposed to homeownership drive demand for high-quality, well-located multifamily assets.
Moving forward, we believe, as we have said in prior writings, that volatility will normalize. It is during times of heightened volatility that the risk management frameworks of asset managers will be tested. For these reasons, we spend an overwhelming majority of our time determining how we can allocate capital to investment opportunities that we believe will be resilient in the face of volatility, will grow earnings when others struggle, and above all else, will protect the principal dollars that we have invested. Utilizing this framework, we have generated strong risk-adjusted returns since the Fund’s inception. The Fund’s Sharpe ratio of 2.82 is more than three times that of the S&P 500.7 Together with our experienced Sub-Advisers, we will continue to work to create value for our shareholders.
Griffin Institutional Access Real Estate Fund is a closed-end interval fund. Limited liquidity is provided to shareholders only through the Fund’s quarterly repurchase offers for no less than 5% and no more than 25% of the Fund’s shares outstanding at net asset value. The Fund is suitable only for investors who can bear the risks associated with the limited liquidity of the Fund and should be viewed as a long-term investment. There is no secondary market for the Fund’s shares and none is expected to develop.
| 4 | GRIFFIN INSTITUTIONAL ACCESS REAL ESTATE FUND |
| SEMI-ANNUAL REPORT 2019 |
On behalf of the entire Griffin Capital Team, we thank you for your continued confidence.
Sincerely,

Randy I. Anderson, Ph.D., CRE
President, Griffin Capital Asset Management Company, LLC
Portfolio Manager and Founding Partner, Griffin Institutional Access Real Estate Fund
| GRIFFIN INSTITUTIONAL ACCESS REAL ESTATE FUND | 5 |
| SEMI-ANNUAL REPORT 2019 |
PRIVATE FUND DIVERSIFICATION (UNAUDITED)
The Fund’s investment objective is to generate a return comprised of both current income and capital appreciation with moderate volatility and low correlation to the broader markets. To achieve this goal the Fund diversifies its holdings by property type, geography and fund managers.
| Overall Portfolio Allocation | Sector Diversification | |
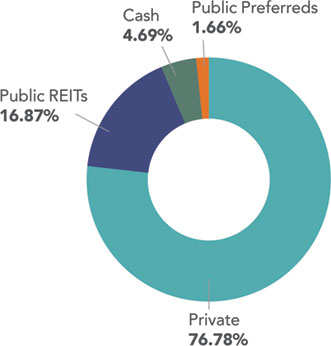 | 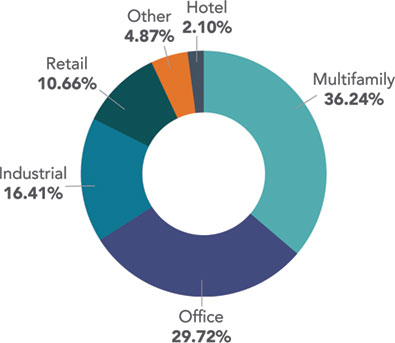 |
Geographic Diversification
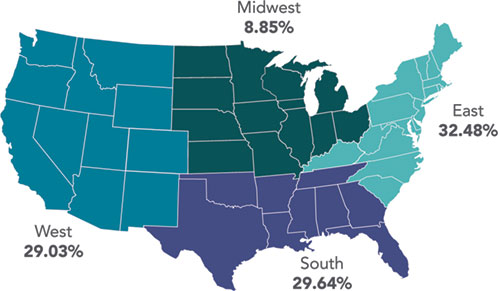
Allocation, Sector, Geographic Diversification, and holdings are subject to change. Diversification does not eliminate the risk of experiencing investment losses. The charts represent the diversification by sector and geography of the private fund holdings as of 4/1/19. Based on market value.
| 6 | GRIFFIN INSTITUTIONAL ACCESS REAL ESTATE FUND |
| SEMI-ANNUAL REPORT 2019 |
PRIVATE FUND ALLOCATION (UNAUDITED)
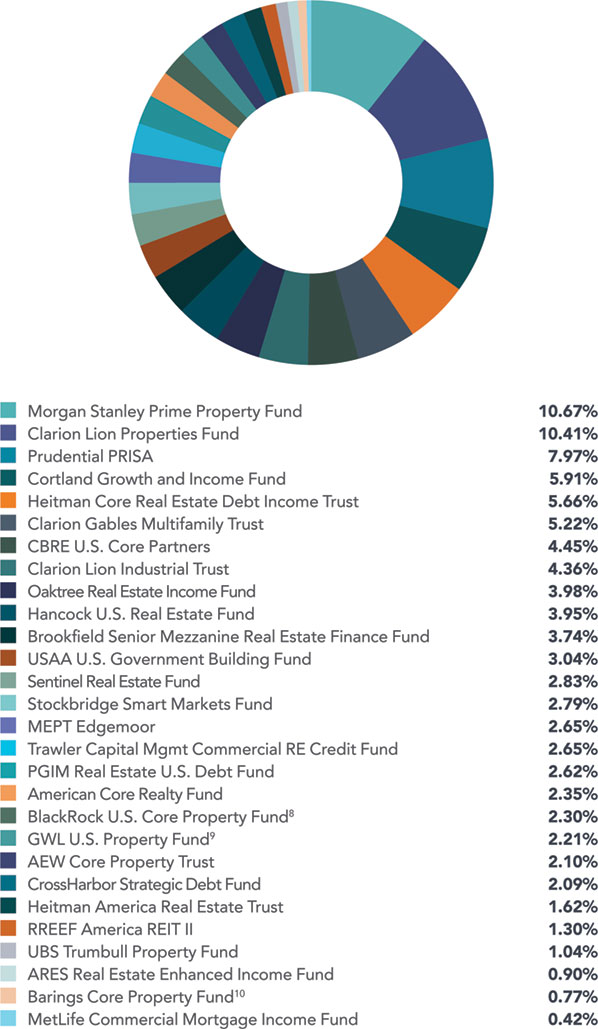
Holdings are subject to change without notice.
| GRIFFIN INSTITUTIONAL ACCESS REAL ESTATE FUND | 7 |
| SEMI-ANNUAL REPORT 2019 |
PRIVATE FUND SUMMARIES (UNAUDITED)
 | AEW Core Property Trustis an open-end core fund that seeks to invest in high quality assets located in top-tier markets with a heavy emphasis on income, liquidity and strong long-term fundamentals. AEW Core Property Trust uses a research-based approach to target markets with high barriers to entry – physical, governmental, or economic – in addition to population and job growth potential. |
 | American Core Realty Fundis a diversified open-end commingled fund that invests primarily in high quality core income-producing office, industrial, retail, and multifamily properties. The American Core Realty Fund focuses its investment activity throughout the United States in major metropolitan markets that are innovation hubs containing high concentrations of our nation’s globally competitive industries and that benefit from highly educated/professional human capital. |
 | ARES Real Estate Enhanced Income Fund’sprincipal objective will be to generate current income with an emphasis on principal protection by creating a diversified portfolio of first mortgage loans secured by commercial real estate across major property types, which primarily includes multifamily, industrial, retail, office and hospitality properties. The ARES Real Estate Enhanced Income Fund will focus on the disciplined origination of first mortgage loans secured by commercial real estate assets with strong sponsorship and located in major markets within the United States. |
 | Barings Core Property Fund10 is a U.S. open-end, diversified core fund that focuses on the four traditional property types and hotels. The Barings Core Property Fund is managed with an emphasis on research, targeting “barrier” markets, which are perceived to reduce the risk of oversupply and offer potential for outsized rent growth and appreciation. |
 | BlackRock U.S. Core Property Fund8 is a diversified core private REIT with an investment objective to provide current income with the potential for long term capital appreciation. The BlackRock U.S. Core Property Fund aims to beat its stated benchmark, the NFI-ODCE, while producing real estate returns and liquidity appropriate for a core fund. |
 | Brookfield Senior Mezzanine Real Estate Finance Fund is an open-end senior real estate debt fund focused on providing primarily floating rate financing secured by commercial property primarily located in the U.S. and secured by generally well-leased/light transitional collateral commercial real estate properties that generate significant cash flow. Brookfield Senior Mezzanine Real Estate Finance Fund will primarily focus on creating investment positions by originating floating rate whole loans, syndicating the first mortgage and retaining the mezzanine exposure. |
 | CBRE U.S. Core Partnersis an open-end core fund that purchases and operates high-quality, income-producing office, industrial, retail, and multifamily assets in select major U.S. metropolitan markets that exhibit strong growth demographics. |
 | Clarion Gables Multifamily Trust, L.P.provides investors access to a high-quality multifamily portfolio with a best-in-class operator and fund manager. Gables is a market-leading, vertically-integrated multifamily real estate company with a 34-year history in the management, construction, development, acquisition and disposition of multifamily communities in the United States. |
| Clarion Lion Industrial Trust is a private REIT focused on the industrial property sector in North America. Clarion Lion Industrial Trust invests primarily in big-box warehouse and distribution centers, with an emphasis on large, core industrial markets throughout the United States. |
| Clarion Lion Properties Fund is a core private REIT with interests in a diversified portfolio of primarily institutional quality real estate assets and related investments located throughout the U.S. The investment objective is to provide a strong income return with potential for long-term capital appreciation. |
 | Cortland Growth and Income Fund, a leading Southern United States focused multifamily owner and operator, is a domestic multifamily open-end core-plus fund focused on acquiring best-in-class, income producing properties in U.S. growth markets. |
 | CrossHarbor Strategic Debt Fund is an open-end debt fund that seeks to generate compelling risk-adjusted current and total returns for investors by originating and managing first mortgage loans secured by core, core-plus, and value-add commercial real estate located throughout the United States. |
 | GWL U.S. Property Fund9 is an open-end real estate fund consisting of a diversified portfolio of institutional quality, income producing assets broadly allocated by property type and geographic location. GWL U.S. Property Fund employs a core plus strategy intertwined with a disciplined risk management process in seeking to achieve its performance objectives. |
 | Hancock U.S. Real Estate Fundis a U.S. open-end core-plus fund that will target properties located in major U.S. markets, with the objective of preserving capital while delivering a combination of income and long-term capital appreciation. The Hancock U.S. Real Estate Fund will target an allocation of 60% core-plus assets and 40% core investments. |
Holdings are subject to change without notice.
| 8 | GRIFFIN INSTITUTIONAL ACCESS REAL ESTATE FUND |
| SEMI-ANNUAL REPORT 2019 |
 | Heitman America Real Estate Trust is an open-end core commingled fund. Heitman America Real Estate Trust’s core strategy encompasses stabilized investments with low to moderate leverage and seeks to objectively minimize risk through diversification in property type, geographic location, and tenant composition. |
| | Heitman Core Real Estate Debt Income Trust is an open-ended, commingled fund, that originates and services first mortgage loans secured by income-producing U.S. commercial real estate. Heitman Core Real Estate Debt Income Trust will seek to originate senior debt financing to high-quality real estate operators in both primary and specialty property sectors. |
 | Bentall Kennedy Multi-Employer Property Trust (“MEPT”) Edgemoor is an open-end, core real estate private equity fund that invests in a portfolio of institutional-quality real estate assets in the U.S. MEPT Edgemoor’s investment strategy is focused on maintaining stable income, building a diversified modern portfolio, using moderate leverage, and providing superior liquidity. Bentall Kennedy MEPT Edgemoor upholds a strong commitment to the principles of Responsible Property Investing. |
 | MetLife Commercial Mortgage Income Fundis a perpetual life, open-end, commercial mortgage debt fund that consists of commercial mortgage loans. MetLife Commercial Mortgage Income Fund seeks to provide consistent current income, attractive risk-adjusted returns and preservation of principal. MetLife Commercial Mortgage Income Fund seeks to achieve its investment objective by creating a portfolio of institutional-quality loans originated by MetLife Investment Management Real Estate’s existing platform, using its investment underwriting guidelines and risk management processes and policies and anticipates being broadly diversified by property type, geography, borrower and loan type. |
 | Morgan Stanley Prime Property Fund is an open-end core fund with a focus on office, retail, multifamily, industrial, self storage and hotel properties located in major real estate markets throughout the United States. |
 | Oaktree Real Estate Income Fund is an open-ended fund that targets investments in commercial real estate, primarily office, multifamily and industrial assets. Oaktree Real Estate Income Fund intends to create value by investing in assets that require modest leasing and capital expenditures. |
 | PGIM Real Estate U.S. Debt Fundis an open-end debt fund that seeks to originate and service first mortgage and subordinate debt, fixed and floating rate loans, secured by stable income producing properties or properties exhibiting light transitional characteristics. PGIM Real Estate U.S. Debt Fund will focus on the four main property types in the top 30 MSAs and intends to provide secure income returns from investing in a low risk, low volatility portfolio of real estate debt, with a focus on capital preservation and stability of income. |
| | Prudential PRISAis organized as a perpetual life, open-ended, commingled fund to invest primarily in core, well-leased, operating real estate assets located in the United States, with an emphasis on income. PRISA is Prudential Real Estate Investors (“PREI”) flagship fund, and represents one of the oldest and largest U.S. core real estate funds available in the marketplace. |
 | RREEF America REIT IIis a core private REIT that provides an average risk exposure to the core real estate market, but does so with significantly different allocations than the index – heavily overweight to industrial assets and the West. |
 | Sentinel Real Estate Fund is a multifamily focused, core private REIT that emphasizes acquisitions of stabilized assets with in-place income with the goal of providing a substantial portion of investor returns in the form of distributed cash. |
 | Stockbridge Smart Markets Fund is an open-end core fund that aims to capture performance in excess of the ODCE Index by acquiring assets in “smart markets” characterized by educated, stable and fast-growing employment bases. The Smart Market Fund’s target market strategy is based on the principle that real estate demand is dependent on jobs which are increasingly being created where there are educated work forces in the U.S. |
 | Trawler Capital Management Commercial Real Estate Credit Fundintends to focus primarily on investing in a diversified portfolio of primarily U.S. commercial real estate debt investments, generally within the mezzanine position of the capital stack. Trawler Capital Management Commercial Real Estate Credit Fund will focus on building and maintaining a portfolio of assets that are intended to provide strong risk adjusted returns in all cycles, with emphasis on stable cash flows. |
 | UBS Trumbull Property Fundis an open-end, diversified Core fund focusing on the four main property types, with a small exposure to hotels. UBS Trumbull Property Fund focuses on top markets for high-quality Core, institutional real estate assets. |
 | USAA U.S. Government Building Fund seeks to provide investors with attractive, risk-adjusted returns generated by the acquisition, build to suit development and operation of buildings located in the United States and leased or intended to be leased to U.S. federal, state and local governments and government agencies and departments. |
Holdings are subject to change without notice.
| GRIFFIN INSTITUTIONAL ACCESS REAL ESTATE FUND | 9 |
| SEMI-ANNUAL REPORT 2019 |
FUND SUB-ADVISERS (UNAUDITED)
| Aon Hewitt Investment Consulting |  |
The Fund’s Private Allocation Sub-Adviser, Aon Hewitt Investment Consulting, Inc., an Aon Company, provides investment consulting services to over 480 clients in North America with total client assets worldwide of over $3.1 trillion as of June 30, 2018, including $2.2 trillion in the U.S. as of September 30, 2018. Approximately 370 investment consulting professionals in the U.S. advise institutional investors such as corporations, public organizations, union associations, health systems, endowments, and foundations.
| CenterSquare Investment Management |  |
The Fund’s Public Allocation Sub-Adviser, CenterSquare Investment Management LLC (“CenterSquare”), is focused exclusively on real estate and structured to provide attractive investment performance to institutional real estate investors. CenterSquare’s team of REIT experts have been a trusted advisor to endowments, pension plans and corporate clients. The firm manages approximately $10 billion across a variety of real estate strategies as of March 31, 2019.
Griffin Capital Advisor, LLC along with CenterSquare Investment Management have designed a public market strategy in line with the objectives of the Fund with a focus on identifying public real estate securities whose current prices are below their intrinsic values. CenterSquare Investment Management has been managing real estate securities portfolios since 1995 across multiple strategies and market cycles.
| 10 | GRIFFIN INSTITUTIONAL ACCESS REAL ESTATE FUND |
| SEMI-ANNUAL REPORT 2019 |
GLOSSARY (UNAUDITED)
Alpha: A measure of risk-adjusted return implying how much a fund/manager outperformed its benchmark, given its risk profile.
Annualized Return: Calculated by annualizing cumulative return (i.e., adjusting it for a period of one year). Annualized return includes capital appreciation and assumes a reinvestment of dividends and distributions.
Basis Point: One basis point is equal to 1/100th of 1%, or 0.01%.
Beta:A measure of systematic risk (volatility), or the sensitivity of a fund to movements in a benchmark. A beta of 1 implies that you can expect the movement of a fund’s return series to match that of the benchmark used to measure beta. A value of less than 1 implies that the fund is less volatile than the index.
Bloomberg Barclays U.S. Aggregate Bond Index: Measures the performance of the U.S. investment grade bond market.
Correlation: A statistical measure of how two securities move in relation to each other. A correlation ranges from -1 to 1. A positive correlation of 1 implies that as one security moves, either up or down, the other security will move in lockstep, in the same direction. A negative correlation of -1 indicates that the securities will move in the opposite direction. If the correlation is 0, the movements of the securities are said to have no correlation; they are completely random.
Cumulative Return: The compound return of an investment. It includes capital appreciation and assumes a reinvestment of dividends and distributions.
NASDAQ: An electronic stock market listing over 5,000 companies. The NASDAQ stock market comprises two separate markets, namely the Nasdaq National Market, which trades large, active securities and the NASDAQ Smallcap Market that trades emerging growth companies.
Net Asset Value (NAV): Represents a fund’s per-share price. NAV is calculated by dividing a fund’s total net assets by its number of shares outstanding.
Quantitative Tightening: A contractionary monetary policy applied by a central bank to decrease the amount of liquidity within the economy.
S&P 500: An index based on market cap of the 500 largest companies having stock listed on the New York Stock Exchange (NYSE) or NASDAQ.
Sharpe Ratio: Measures risk-adjusted returns by calculating the excess return (above the risk free rate) per unit of risk (standard deviation). The higher the ratio, the better the risk-adjusted returns. The average 3 month U.S. Treasury T-bill auction was used as the risk free rate in this material.
Standard Deviation: Measures the average deviations of a return series from its mean, and is often used as a measure of volatility/risk. A large standard deviation implies that there have been large swings in the return series of the manager.
| GRIFFIN INSTITUTIONAL ACCESS REAL ESTATE FUND | 11 |
| SEMI-ANNUAL REPORT 2019 |
IMPORTANT DISCLOSURES (UNAUDITED)
This is neither an offer to sell nor a solicitation to purchase any security. Investors should carefully consider the investment objectives, risks, charges and expense of Griffin Institutional Access®Real Estate Fund (the “Fund”). This and other important information about the Fund is contained in the prospectus, which can be obtained by contacting your financial advisor or visiting www.griffincapital.com. Please read the prospectus carefully before investing.
All Morningstar calculations and metrics are based on monthly data. CALCULATIONS AND METRICS REFLECT A LOAD-WAIVED, CLASS A SHARE (NASDAQ: GIREX). Investors of the load-waived Class A share do not pay a front-end sales charge/load.
Past performance is not a guarantee of future results.Investing in the Fund involves risks, including the risk that you may receive little or no return on your investment or that you may lose part or all of your investment. The ability of the Fund to achieve its investment objective depends, in part, on the ability of the Adviser to allocate effectively the assets of the Fund among the various securities and investments in which the Fund invests. There can be no assurance that the actual allocations will be effective in achieving the Fund’s investment objective or delivering positive returns. The Fund offers multiple different classes of shares. An investment in any share class of the Fund represents an investment in the same assets of the Fund. However, the purchase restrictions and ongoing fees and expenses for each share class are different. Investors will pay offering expenses and, with regard to those share classes that impose a front-end sales load, a sales load of up to 5.75%. An investor will need to receive a total return at least in excess of these expenses to receive an actual return on the investment.
You cannot invest directly in an index. Index performance does not represent actual Fund or portfolio performance. A fund or portfolio may differ significantly from the securities included in the index. Index performance assumes reinvestment of dividends but does not reflect any management fees, transaction costs or other expenses that would be incurred by a fund or portfolio, or brokerage commissions on transactions in fund shares. Such fees, expenses, and commissions could reduce returns.
This material has been distributed for informational purposes only. The views and information discussed in this commentary are as of the date of publication, are subject to change without notification of any kind, and may not reflect the writer’s current views. The views expressed represent an assessment of market conditions at a specific point in time, are opinions only and should not be relied upon as investment advice regarding a particular investment or markets in general. Such information does not constitute a recommendation to buy or sell specific securities or investment vehicles. It should not be assumed that any investment will be profitable or will equal the performance of the fund(s) or any securities or any sectors mentioned herein. The subject matter contained herein has been derived from several sources believed to be reliable and accurate, but not guaranteed, at the time of compilation. Griffin Capital Advisor, LLC and Griffin Capital Securities, LLC do not accept any liability for losses either direct or consequential caused by the use of this information.
This semi-annual report may contain certain forward-looking statements. Such forward-looking statements can generally be identified by our use of forward-looking terminology such as “may,” “will,” “expect,” “intend,” “anticipate,” “estimate,” “believe,” “continue,” or other similar words. Because such statements include risks, uncertainties and contingencies, actual results may differ materially from the expectations, intentions, beliefs, plans or predictions of the future expressed or implied by such forward-looking statements. These risks, uncertainties and contingencies include, but are not limited to: uncertainties relating to changes in general economic and real estate conditions; uncertainties relating to the implementation of our investment strategy; uncertainties relating to capital proceeds; and other risk factors as outlined in the Fund’s prospectus, statement of additional information, annual report and semi-annual report filed with the U.S. Securities and Exchange Commission (the “SEC”).
The Fund’s stated investment objective is to generate a return comprised of both income and capital appreciation with moderate volatility and low correlation to the broader markets. Thus, the Fund expects to generate a total return comprised of both dividend income and appreciation less the fees and expenses of the Fund. Since inception, a portion of the Fund’s total return was comprised of unrealized appreciation representing an increase in the value of its underlying securities, which had not been realized through a sale or other capital transaction. Distributions are determined to be economically earned if the total return of the Fund less fees and expenses of the Fund exceeds the distributions paid, and to the extent that the Fund makes distributions in excess of its total return, less fees and expenses of the Fund, the NAV will decline.
| 12 | GRIFFIN INSTITUTIONAL ACCESS REAL ESTATE FUND |
| SEMI-ANNUAL REPORT 2019 |
The Fund is a closed-end interval fund, the shares have no history of public trading, nor is it intended that the shares will be listed on a public exchange at this time. No secondary market is expected to develop for the Fund’s shares. Limited liquidity is provided to shareholders only through the Fund’s quarterly repurchase offers for no less than 5% and no more than 25% of the Fund’s shares outstanding at net asset value. There is no guarantee that an investor will be able to sell all the shares that the investor desires to sell in the repurchase offer. The investment return and principal value of an investment will fluctuate so that an investor’s shares, when redeemed, may be worth more or less than the original cost. Due to these restrictions, an investor should consider an investment in the Fund to be of limited liquidity. The Fund is suitable only for investors who can bear the risks associated with the limited liquidity of the Fund and should be viewed as a long-term investment. Investing in the Fund is speculative and involves a high degree of risk, including the risks associated with leverage and the risk of a substantial loss of investment. There is no guarantee that the investment strategies will work under all market conditions.
The inception date of the Fund’s Class A shares was 6/30/2014. As of March 31, 2019, the Fund’s load-waived Class A shares returned 7.23% (annualized) since inception and had a one year return of 7.94% (source: Morningstar Direct). The maximum sales charge is 5.75% for Class A shares and 4.25% for Class L shares. Class C shareholders may be subject to a contingent deferred sales charge equal to 1.00% of the original purchase price of Class C shares redeemed during the first 365 days after their purchase. Performance reflects the reinvestment of dividends and distributions. Due to financial statement adjustments, returns may differ. Performance data quoted represents past performance. Past performance is no guarantee of future results and investment returns and principal value of the Fund will fluctuate so that shares, when redeemed, may be worth more or less than their original cost. Current performance may be lower or higher than performance data quoted. Visit www. griffincapital.com for current performance. The total expense ratio after fee waiver, reimbursement and recoupment is 2.11% for Class A, 2.86% for Class C, 1.86% for Class I, 2.35% for Class L, and 2.59% for Class M. The Adviser and the Fund have entered into an expense limitation and reimbursement agreement (the Expense Limitation Agreement) under which the Adviser has agreed contractually to waive its fees and to pay or absorb the ordinary annual operating expenses of the Fund (including offering expenses, but excluding taxes, interest, brokerage commissions, acquired fund fees and expenses and extraordinary expenses), to the extent that they exceed 1.91%, 2.66%, 1.66%, 2.16%, and 2.41% per annum of the Fund’s average daily net assets attributable to Class A, Class C, Class I, Class L, and Class M shares, respectively (the Expense Limitation). In consideration of the Adviser’s agreement to limit the Fund’s expenses, the Fund has agreed to repay the Adviser in the amount of any fees waived and Fund expenses paid or absorbed, subject to the limitations that: (1) the reimbursement for fees and expenses will be made only if payable not more than three years from the date in which they were incurred; and (2) the reimbursement may not be made if it would cause the lesser of the Expense Limitation in place at the time of waiver or at the time of reimbursement to be exceeded. The Expense Limitation Agreement will remain in effect at least until February 1, 2020, unless and until the Board approves its modification or termination. This agreement may be terminated only by the Fund’s Board on 60 days’ written notice to the Adviser. The Fund’s return does not reflect the deduction of all fees, and, if the Fund return reflected the deduction of such fees, the performance would be lower.
Investors in the Fund should understand that the net asset value (“NAV”) of the Fund will fluctuate, which may result in a loss of the principal amount invested. The Fund’s investments may be negatively affected by the broad investment environment and capital markets in which the Fund invests, including the real estate market, the debt market and/or the equity securities market. The value of the Fund’s investments will increase or decrease based on changes in the prices of the investments it holds. This will cause the value of the Fund’s shares to increase or decrease. The Fund is “non-diversified” under the Investment Company Act of 1940 since changes in the financial condition or market value of a single issuer may cause a greater fluctuation in the Fund’s net asset value than in a “diversified” fund. Diversification does not eliminate the risk of experiencing investment losses. Holdings are subject to change without notice. The Fund is not intended to be a complete investment program.
| GRIFFIN INSTITUTIONAL ACCESS REAL ESTATE FUND | 13 |
| SEMI-ANNUAL REPORT 2019 |
The Fund’s investment in Private Investment Funds will require it to bear a pro rata share of the vehicles’ expenses, including management and performance fees. Also, once an investment is made in a Private Investment Fund, neither the Adviser nor any Sub-Adviser will be able to exercise control over investment decisions made by the Private Investment Fund. The Fund will not invest in real estate directly, but, because the Fund will concentrate its investments in securities of REITs and other real estate industry issuers, its portfolio will be significantly impacted by the performance of the real estate market and may experience more volatility and be exposed to greater risk than a more diversified portfolio. The value of companies engaged in the real estate industry is affected by: (i) changes in general economic and market conditions; (ii) changes in the value of real estate properties; (iii) risks related to local economic conditions, overbuilding and increased competition; (iv) increases in property taxes and operating expenses; (v) changes in zoning laws; (vi) casualty and condemnation losses; (vii) variations in rental income, neighborhood values or the appeal of property to tenants; (viii) the availability of financing and (ix) changes in interest rates and leverage. By investing in the Fund, a shareholder will not be deemed to be an investor in any underlying fund and will not have the ability to exercise any rights attributable to an investor in any such underlying fund related to their investment.
The Fund is advised by Griffin Capital Advisor, LLC (“GCA”). GCA is registered as an investment adviser with the SEC pursuant to the provisions of the Investment Advisers Act of 1940, as amended (the “Advisers Act”). GCA is an indirect majority-owned subsidiary of Griffin Capital Company, LLC. The Fund’s private real estate funds allocation is sub-advised by Aon Hewitt Investment Consulting (“Aon”), an Aon Company. Aon is registered as an investment adviser with the SEC pursuant to the provisions of the Advisers Act. The Fund’s public real estate securities allocation is sub-advised by CenterSquare Investment Management LLC (“CenterSquare”). CenterSquare is an investment adviser registered with the SEC pursuant to the provisions of the Advisers Act. Registration with the SEC does not constitute an endorsement by the SEC nor does it imply a certain level of skill or training.
During the six months ending March 31, 2019, the Fund paid distributions of $77,207,668 to its investors, consisting of distributions of $31,858,840 paid in cash and $45,348,828 that was reinvested through the Fund’s distribution reinvestment program.
During that period, the Fund received cash from dividends and distributions from the Fund’s underlying investments totaling $49,893,728, and from realized gains on its investments totaling $32,535,111, and paid cash fees and expenses of $29,589,333.
The Fund’s distribution policy is to make quarterly distributions to shareholders. A portion of the distribution includes a return of capital. Please refer to the Fund’s most recent Section 19(a) notice, available at www.griffincapital.com, and the Fund’s semi-annual or annual reports filed with the the SEC for additional information regarding the composition of distributions. Shareholders should not assume that the source of a distribution from the Fund is net profit. Although such distributions are not currently taxable, such distributions will have the effect of lowering a shareholder’s tax basis in the shares which will result in a higher tax liability when the shares are sold, even if they have not increased in value, or, in fact, have lost value. Distributions are not guaranteed.
The Fund’s most recent annualized distribution rate as of March 31, 2019 was 5.22%. Distributions paid may exceed and, from time to time, have exceeded the Fund’s total return less fees and expenses of the Fund during some periods due to changes in market conditions affecting components of the Fund’s total return, including unrealized appreciation. Please reference the performance table below to view the Fund’s historical returns. Additionally, the Fund’s performance can always be found on the Griffin Capital website (www.griffincapital.com). The following chart presents the quarterly changes to the NAV, total return, and cumulative total return for load-waived Class A shares since inception.1
| 14 | GRIFFIN INSTITUTIONAL ACCESS REAL ESTATE FUND |
| SEMI-ANNUAL REPORT 2019 |
| Period Ending | NAV Return | Total Return | Cumulative Total Return |
| 6/30/14 | N/A | N/A | N/A |
| 9/30/14 | 0.44% | 1.65% | 1.65% |
| 12/31/14 | 2.11% | 3.40% | 5.10% |
| 3/31/15 | 0.98% | 2.28% | 7.50% |
| 6/30/15 | -1.24% | 0.06% | 7.56% |
| 9/30/15 | 1.13% | 2.47% | 10.21% |
| 12/31/15 | 1.01% | 2.34% | 12.79% |
| 3/31/16 | 1.00% | 2.33% | 15.42% |
| 6/30/16 | 0.95% | 2.28% | 18.05% |
| 9/30/16 | -0.04% | 1.28% | 19.57% |
| 12/31/16 | -0.26% | 1.05% | 20.83% |
| 3/31/17 | -0.15% | 1.17% | 22.24% |
| 6/30/17 | 0.26% | 1.59% | 24.18% |
| 9/30/17 | 0.00% | 1.32% | 25.83% |
| 12/31/17 | 0.90% | 2.23% | 28.64% |
| 3/31/18 | -0.97% | 0.34% | 29.08% |
| 6/30/18 | 1.24% | 2.58% | 32.41% |
| 9/30/18 | 0.11% | 1.43% | 34.31% |
| 12/31/18 | -1.04% | 0.27% | 34.67% |
| 3/31/19 | 2.10% | 3.45% | 39.33% |
| GRIFFIN INSTITUTIONAL ACCESS REAL ESTATE FUND | 15 |
| SEMI-ANNUAL REPORT 2019 |
ENDNOTES
| 1. | Data source: Morningstar Direct for the period of 6/30/14 – 3/31/19. Performance reflects the reinvestment of dividends and distributions. Due to financial statement adjustments, returns may differ. Past performance is not a guarantee of future results. A glossary of terms can be found on page 9. |
| 2. | Benchmark: S&P 500. |
| 3. | Data source: Bloomberg. |
| 4. | Source: U.S. Department of Commerce’s Bureau of Economic Analysis, https://www.bea.gov/news/2019/initial-gross-domestic-product-4th-quarter-and-annual-2018 |
| 5. | Data source: Aon Hewitt Investment Consulting. Fund size based on gross asset value (GAV). Fund holdings as of 4/1/19. Fund holdings are subject to change without notice. |
| 6. | Source: MSCI/PREA U.S. Property Fund Index: Core Diversified Open End Funds 4Q 2018. |
| 7. | Data source: Morningstar Direct for the period of 6/30/14 - 3/31/19. Since the Fund’s inception on 6/30/14, the Fund has a Sharpe ratio of 2.82; the S&P 500 recorded a Sharpe ratio of 0.83 over that period. |
| 8. | Formerly known as BlackRock Granite Property Fund. |
| 9. | Formerly known as Guggenheim U.S. Property Fund. |
| 10. | Formerly known as the Cornerstone Patriot Fund. |
| Griffin Institutional Access Real Estate Fund | Portfolio Update |
March 31, 2019 (Unaudited)
Performance(for the periods ended March 31, 2019)
| 6 Month | 1 Year | 3 Year | Since Inception | Inception Date | |
| Griffin Institutional Access Real Estate Fund – A – Without Load | 3.58% | 8.18% | 6.30% | 7.21% | 6/30/14 |
| Griffin Institutional Access Real Estate Fund – A – With Load* | -2.36% | 1.95% | 4.22% | 5.88% | 6/30/14 |
| Griffin Institutional Access Real Estate Fund – C – Without Load | 3.21% | 7.43% | 5.52% | 5.84% | 8/7/15 |
| Griffin Institutional Access Real Estate Fund – C – With Load** | 2.21% | 6.43% | 5.52% | 5.84% | 8/7/15 |
| Griffin Institutional Access Real Estate Fund – I – NAV | 3.73% | 8.48% | 6.59% | 6.89% | 8/7/15 |
| Griffin Institutional Access Real Estate Fund – M – NAV | 3.32% | 7.68% | N/A | 6.35% | 11/16/16 |
| Griffin Institutional Access Real Estate Fund – L – Without Load | 3.47% | 7.95% | N/A | 6.50% | 4/24/17 |
| Griffin Institutional Access Real Estate Fund – L – With Load*** | -0.92% | 3.37% | N/A | 4.14% | 4/24/17 |
| S&P 500® Total Return Index | -1.72% | 9.50% | 13.51% | 10.32% | 6/30/14 |
| Bloomberg Barclays U.S. Aggregate Bond Index | 4.63% | 4.48% | 2.03% | 2.45% | 6/30/14 |
| * | Adjusted for initial maximum sales charge of 5.75%. |
| ** | Adjusted for contingent deferred sales charge of 1.00%. |
| *** | Adjusted for initial maximum sales charge of 4.25%. |
The S&P 500® Total Return Index is an unmanaged index of 500 common stocks chosen for market size, liquidity and industry group representation. It is a market-value weighted index. The index is not actively managed and does not reflect any deduction for fees, expenses or taxes.
The Bloomberg Barclays U.S. Aggregate Bond Index (formerly known as the Barclays Capital U.S. Aggregate Bond Index) is a market value-weighted index of investment grade fixed-rated debt issues, including government, corporate, asset-backed and mortgage-backed securities with a maturity of one year or more.
Indexes are not actively managed and do not reflect deduction for fees, expenses or taxes. An investor cannot invest directly into an index.
The returns shown above do not reflect the deduction of taxes a shareholder would pay on Fund distributions or redemption of Fund shares. The returns shown are net of applicable share class fees.
The performance data quoted above represents past performance. Past performance is not a guarantee of future results. Investment return and value of the Fund shares will fluctuate so that an investor’s shares, when sold or redeemed, may be worth more or less than their original cost. Performance may be lower or higher than performance data quoted. Fund performance current to the most recent month-end is available by calling 1-888-926-2688 or by visiting www.griffincapital.com.
Class A shares are offered subject to a maximum sales charge of 5.75% of the offering price. Class C, Class I and Class M shares are offered at net asset value. Class L shares are offered subject to a maximum sales charge of 4.25% of the offering price. Class C shares may be subject to a 1.00% contingent deferred sales charge on shares redeemed during the first 365 days after their purchase. The Fund’s investment adviser has contractually agreed to waive its fees and to pay or absorb the ordinary annual operating expenses of the Fund (including offering expenses, but excluding taxes, interest, brokerage commissions, acquired fund fees and expenses and extraordinary expenses), to the extent that they exceed 1.91%, 2.66%, 1.66%, 2.41% and 2.16% per annum of the Fund’s average daily net assets attributable to Class A, Class C, Class I, Class M and Class L shares, respectively. The Expense Limitation Agreement will remain in effect at least until February 1, 2020, for Class A, C, I, L and M shares, unless and until the Board approves its modification or termination. Per the Fund's most recent prospectus, the total expense ratio after fee waiver, reimbursement and recoupment is 2.11%, 2.86%, 1.86%, 2.59% and 2.35% for Class A, Class C, Class I, Class M and Class L, respectively. Please review the Fund’s Prospectus for more details regarding the Fund’s fees and expenses. No assurances can be given that the Fund will pay a distribution in the future; or, if any such distribution is paid, the amount or rate of the distribution.
| 16 | 1.888.926.2688 | www.griffincapital.com |
| Griffin Institutional Access Real Estate Fund | Portfolio Update |
March 31, 2019 (Unaudited)
Performance of $10,000 Initial Investment(as of March 31, 2019)
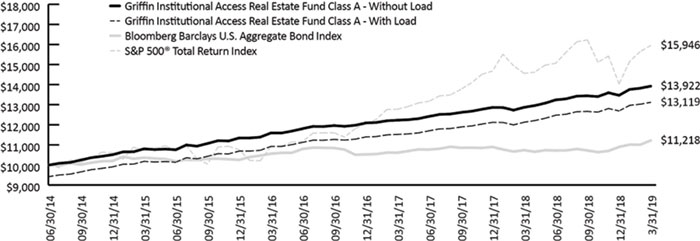
The graph shown above represents historical performance of a hypothetical investment of $10,000 in the Fund since inception. Past performance does not guarantee future results. All returns reflect reinvested dividends, but do not reflect the deduction of taxes that a shareholder would pay on Fund distributions or the redemption of Fund shares.
Sector Allocation(as a % of Net Assets)*
| Private Investment Funds | 71.10% |
| Publicly Traded Securities | 15.83% |
| Preferred Stocks | 1.61% |
| Other | 11.46% |
| TOTALS | 100.00% |
Portfolio Composition(as a % of Net Assets)*
| Real Estate Investment Trusts | 86.93% |
| Preferred Stocks | 1.61% |
| Other Assets in Excess Of Liabilities | 11.46% |
| TOTALS | 100.00% |
| * | Holdings are subject to change. Tables present indicative values only. |
| Semi-Annual Report | March 31, 2019 | 17 |
| Griffin Institutional Access Real Estate Fund | Portfolio of Investments |
March 31, 2019 (Unaudited)
| Description | Shares | Value (Note 2) | ||||||
| REAL ESTATE INVESTMENT TRUSTS (86.93%) | ||||||||
| Private Investment Funds (71.10%)*(a) | ||||||||
| AEW Core Property Trust | 56,182 | $ | 57,680,650 | |||||
| American Core Realty Fund, L.P. | 445 | 56,024,729 | ||||||
| Ares Real Estate Enhanced Income Fund, L.P. | N/A | 21,500,000 | ||||||
| Barings Core Property Fund, L.P. | 139,016 | 18,438,648 | ||||||
| BlackRock US Core Property Fund | N/A | 59,889,476 | ||||||
| Brookfield Senior Mezzanine Real Estate Finance Fund | 85,155 | 86,729,160 | ||||||
| CBRE U.S. Core Partners, L.P. | 74,863,082 | 106,867,114 | ||||||
| Clarion Lion Industrial Trust | 54,291 | 107,554,226 | ||||||
| Clarion Lion Properties Fund, L.P. | 164,132 | 249,106,562 | ||||||
| Cortland Growth and Income Fund, L.P. | 73,276 | 81,213,728 | ||||||
| CrossHarbor Strategic Debt Fund, L.P. | N/A | 50,156,448 | ||||||
| GWL U.S. Property Fund, L.P. | N/A | 68,187,748 | ||||||
| Hancock U.S. Real Estate Fund, L.P. | 72,747 | 92,896,227 | ||||||
| Heitman America Real Estate Trust, L.P. | 34,986 | 43,511,127 | ||||||
| Heitman Core Real Estate Debt Income Trust | 132,028 | 135,501,626 | ||||||
| MEPT Edgemoor, L.P. | 29,043 | 63,160,033 | ||||||
| MetLife Commercial Mortgage Income Fund, L.P. | 9,816 | 10,079,239 | ||||||
| Morgan Stanley Prime Property Fund | 13,432 | 253,942,354 | ||||||
| Oaktree Real Estate Income Fund, L.P. | N/A | 95,415,488 | ||||||
| PGIM Real Estate US Debt Fund, L.P. | 56,257 | 62,658,165 | ||||||
| PRISA L.P. | 113,318 | 190,276,050 | ||||||
| RREEF America REIT II, Inc. | 248,080 | 30,953,686 | ||||||
| Sentinel Real Estate Fund, L.P. | 764 | 67,695,333 | ||||||
| Stockbridge Smart Markets Fund | 47,709 | 74,285,297 | ||||||
| TCM CRE Credit Fund, L.P. | 63,404 | 63,510,003 | ||||||
| UBS Trumbull Property Fund | 2,323 | 26,012,606 | ||||||
| USAA US Government Building Fund, LLC | N/A | 72,768,099 | ||||||
| 2,246,013,822 | ||||||||
| Publicly Traded Securities (15.83%)(a) | ||||||||
| Alexandria Real Estate Equities, Inc. | 81,130 | 11,565,893 | ||||||
| American Homes 4 Rent, Class A | 554,850 | 12,606,192 | ||||||
| Americold Realty Trust | 189,290 | 5,775,238 | ||||||
| AvalonBay Communities, Inc. | 112,820 | 22,646,359 | ||||||
| Boston Properties, Inc. | 86,850 | 11,627,478 | ||||||
| Brandywine Realty Trust | 233,770 | 3,707,592 | ||||||
| Brixmor Property Group, Inc. | 348,460 | 6,401,210 | ||||||
| Camden Property Trust | 112,270 | 11,395,405 | ||||||
| Chesapeake Lodging Trust | 126,510 | 3,518,243 | ||||||
| Columbia Property Trust, Inc. | 170,272 | 3,832,823 | ||||||
| Crown Castle International Corp. | 18,450 | 2,361,600 | ||||||
| CubeSmart | 313,060 | 10,030,442 | ||||||
| CyrusOne, Inc. | 224,720 | 11,784,317 | ||||||
| Duke Realty Corp. | 244,490 | 7,476,504 | ||||||
| Empire State Realty Trust, Inc., Class A | 446,560 | 7,055,648 | ||||||
| Equinix, Inc. | 58,480 | 26,500,797 | ||||||
| Equity Residential | 251,060 | 18,909,839 | ||||||
| Essex Property Trust, Inc. | 19,400 | 5,611,256 | ||||||
| Extra Space Storage, Inc. | 76,990 | 7,846,051 | ||||||
| Federal Realty Investment Trust | 45,730 | 6,303,881 | ||||||
| HCP, Inc. | 552,790 | 17,302,327 | ||||||
| 18 | 1.888.926.2688 | www.griffincapital.com |
| Griffin Institutional Access Real Estate Fund | Portfolio of Investments |
March 31, 2019 (Unaudited)
| Description | Shares | Value (Note 2) | ||||||
| Publicly Traded Securities (continued)(a) | ||||||||
| Healthcare Trust of America, Inc., Class A | 360,320 | $ | 10,301,549 | |||||
| Highwoods Properties, Inc. | 82,900 | 3,878,062 | ||||||
| Hilton Worldwide Holdings, Inc. | 58,560 | 4,866,922 | ||||||
| Host Hotels & Resorts, Inc. | 266,350 | 5,034,015 | ||||||
| Invitation Homes, Inc. | 355,320 | 8,644,936 | ||||||
| Iron Mountain, Inc. | 299,850 | 10,632,681 | ||||||
| JBG SMITH Properties | 91,000 | 3,762,850 | ||||||
| Kilroy Realty Corp. | 170,650 | 12,962,574 | ||||||
| Liberty Property Trust | 93,510 | 4,527,754 | ||||||
| Macerich Co. | 160,040 | 6,937,734 | ||||||
| Mack-Cali Realty Corp. | 285,710 | 6,342,762 | ||||||
| Park Hotels & Resorts, Inc. | 253,100 | 7,866,348 | ||||||
| Pebblebrook Hotel Trust | 78,120 | 2,426,407 | ||||||
| Prologis, Inc. | 393,340 | 28,300,813 | ||||||
| Public Storage | 56,570 | 12,319,815 | ||||||
| QTS Realty Trust, Inc., Class A | 30,480 | 1,371,295 | ||||||
| Realty Income Corp. | 138,180 | 10,164,521 | ||||||
| Regency Centers Corp. | 114,120 | 7,701,959 | ||||||
| Retail Properties of America, Inc., Class A | 539,200 | 6,572,848 | ||||||
| Sabra Health Care REIT, Inc. | 217,020 | 4,225,379 | ||||||
| Simon Property Group, Inc. | 143,154 | 26,084,090 | ||||||
| STAG Industrial, Inc. | 206,390 | 6,119,464 | ||||||
| STORE Capital Corp. | 228,160 | 7,643,360 | ||||||
| Sun Communities, Inc. | 114,770 | 13,602,540 | ||||||
| Sunstone Hotel Investors, Inc. | 373,980 | 5,385,312 | ||||||
| Taubman Centers, Inc. | 80,430 | 4,253,138 | ||||||
| UDR, Inc. | 138,500 | 6,296,210 | ||||||
| Urban Edge Properties | 194,060 | 3,687,140 | ||||||
| Ventas, Inc. | 323,730 | 20,657,211 | ||||||
| VEREIT, Inc. | 1,345,570 | 11,262,421 | ||||||
| VICI Properties, Inc. | 298,900 | 6,539,932 | ||||||
| Vornado Realty Trust | 75,050 | 5,061,372 | ||||||
| WP Carey, Inc. | 134,740 | 10,554,184 | ||||||
| 500,246,693 | ||||||||
| TOTAL REAL ESTATE INVESTMENT TRUSTS | ||||||||
| (Cost $2,504,953,441) | 2,746,260,515 | |||||||
Coupon Rate | |||||||||||
| PREFERRED STOCKS (1.61%)(b) | |||||||||||
| American Homes 4 Rent, Series D | 6.50% | 10,000 | 265,000 | ||||||||
| American Homes 4 Rent, Series E | 6.35% | 56,481 | 1,474,154 | ||||||||
| American Homes 4 Rent, Series F | 5.88% | 23,452 | 578,092 | ||||||||
| American Homes 4 Rent, Series H | 6.25% | 46,899 | 1,181,855 | ||||||||
| Boston Properties, Inc., Series B | 5.25% | 30,000 | 753,300 | ||||||||
| Brookfield Property Partners L.P., Series A | 6.50% | 33,000 | 819,390 | ||||||||
| Brookfield Property REIT, Inc., Series A | 6.38% | 61,000 | 1,543,300 | ||||||||
| Digital Realty Trust, Inc., Series H | 7.38% | 7,382 | 184,402 | ||||||||
| Digital Realty Trust, Inc., Series J | 5.25% | 50,000 | 1,184,000 | ||||||||
| Digital Realty Trust, Inc., Series K | 5.85% | 160,000 | 4,004,800 | ||||||||
| EPR Properties, Series G | 5.75% | 48,500 | 1,153,330 | ||||||||
| Federal Realty Investment Trust, Series C | 5.00% | 65,026 | 1,539,816 | ||||||||
| Semi-Annual Report | March 31, 2019 | 19 |
| Griffin Institutional Access Real Estate Fund | Portfolio of Investments |
March 31, 2019 (Unaudited)
| Description | Coupon Rate | Shares | Value (Note 2) | ||||||||
| Preferred Stocks (continued)(b) | |||||||||||
| Hersha Hospitality Trust, Series C | 6.88% | 15,000 | $ | 362,250 | |||||||
| Hersha Hospitality Trust, Series D | 6.50% | 45,000 | 1,030,050 | ||||||||
| Hersha Hospitality Trust, Series E | 6.50% | 15,000 | 358,200 | ||||||||
| Kimco Realty Corp., Series J | 5.50% | 60,000 | 1,486,800 | ||||||||
| Kimco Realty Corp., Series K | 5.63% | 39,000 | 967,200 | ||||||||
| Kimco Realty Corp., Series M | 5.25% | 13,000 | 302,900 | ||||||||
| National Retail Properties, Inc., Series E | 5.70% | 63,000 | 1,592,010 | ||||||||
| National Retail Properties, Inc., Series F | 5.20% | 66,500 | 1,612,625 | ||||||||
| National Storage Affiliates Trust, Series A | 6.00% | 33,292 | 828,638 | ||||||||
| Pebblebrook Hotel Trust, Series C | 6.50% | 10,000 | 257,400 | ||||||||
| Pebblebrook Hotel Trust, Series D | 6.38% | 12,500 | 328,125 | ||||||||
| Pebblebrook Hotel Trust, Series F | 6.30% | 70,000 | 1,743,000 | ||||||||
| PS Business Parks, Inc., Series U | 5.75% | 53,000 | 1,343,020 | ||||||||
| PS Business Parks, Inc., Series W | 5.20% | 73,000 | 1,752,730 | ||||||||
| PS Business Parks, Inc., Series Y | 5.20% | 16,752 | 397,692 | ||||||||
| Public Storage, Series D | 4.95% | 25,000 | 609,250 | ||||||||
| Public Storage, Series G | 5.05% | 25,000 | 625,500 | ||||||||
| Public Storage, Series H | 5.60% | 150,000 | 3,861,001 | ||||||||
| Public Storage, Series V | 5.38% | 50,000 | 1,238,000 | ||||||||
| Public Storage, Series W | 5.20% | 12,000 | 294,600 | ||||||||
| QTS Realty Trust, Inc., Series A | 7.13% | 27,500 | 693,000 | ||||||||
| Rexford Industrial Realty, Inc., Series A | 5.88% | 59,287 | 1,460,239 | ||||||||
| Rexford Industrial Realty, Inc., Series B | 5.88% | 33,939 | 830,487 | ||||||||
| Saul Centers, Inc., Series D | 6.13% | 26,732 | 647,315 | ||||||||
| Seritage Growth Properties, Series A | 7.00% | 21,832 | 528,334 | ||||||||
| SITE Centers Corp., Series A | 6.38% | 22,571 | 574,432 | ||||||||
| SITE Centers Corp., Series K | 6.25% | 17,514 | 450,810 | ||||||||
| Spirit Realty Capital, Inc., Series A | 6.00% | 35,000 | 837,900 | ||||||||
| Summit Hotel Properties, Inc., Series E | 6.25% | 62,000 | 1,440,880 | ||||||||
| Sunstone Hotel Investors, Inc., Series F | 6.45% | 20,014 | 510,957 | ||||||||
| Taubman Centers, Inc., Series J | 6.50% | 41,000 | 1,060,670 | ||||||||
| Taubman Centers, Inc., Series K | 6.25% | 49,500 | 1,272,150 | ||||||||
| Urstadt Biddle Properties, Inc., Series H | 6.25% | 26,968 | 709,528 | ||||||||
| VEREIT, Inc., Series F | 6.70% | 52,000 | 1,308,840 | ||||||||
| Vornado Realty Trust, Series K | 5.70% | 39,744 | 1,003,139 | ||||||||
| Vornado Realty Trust, Series L | 5.40% | 20,179 | 500,641 | ||||||||
| Vornado Realty Trust, Series M | 5.25% | 63,000 | 1,477,350 | ||||||||
| TOTAL PREFERRED STOCKS | |||||||||||
| (Cost $50,135,841) | 50,979,102 | ||||||||||
| TOTAL INVESTMENTS (88.54%) | |||||||||||
| (Cost $2,555,089,282) | $ | 2,797,239,617 | |||||||||
| Other Assets In Excess Of Liabilities (11.46%) | 361,940,432 | ||||||||||
| NET ASSETS (100.00%) | $ | 3,159,180,049 | |||||||||
| (a) | A portion of these securities is held as collateral for the outstanding Lines of Credit. At March 31, 2019 outstanding collateral amounted to $2,658,865,614. |
| (b) | Security has no contractual maturity date, is not redeemable and contractually pays an indefinite stream of interest. |
Common Abbreviations:
| LLC | - Limited Liability Company |
| L.P. | - Limited Partnerships |
| REIT | - Real Estate Investment Trust |
| 20 | 1.888.926.2688 | www.griffincapital.com |
| Griffin Institutional Access Real Estate Fund | Portfolio of Investments |
March 31, 2019 (Unaudited)
| * | Additional Information on Investments in Private Investment Funds: |
| Value | Security | Redemption Frequency | Redemption Notice (Days) | Unfunded Commitments as of March 31, 2019 | |||||||||
| $ | 57,680,650 | AEW Core Property Trust | Quarterly | 45 | $ | 0 | |||||||
| 56,024,729 | American Core Realty Fund, L.P. | Quarterly | 10 | 0 | |||||||||
| 21,500,000 | Ares Real Estate Enhanced Income Fund, L.P. | Quarterly | 90 | 78,500,000 | |||||||||
| 18,438,648 | Barings Core Property Fund, L.P. | Quarterly | 30 | 0 | |||||||||
| 59,889,476 | BlackRock US Core Property Fund | Quarterly | 60 | 0 | |||||||||
| 86,729,160 | Brookfield Senior Mezzanine Real Estate Finance Fund | Quarterly | 90 | 37,879,082 | |||||||||
| 106,867,114 | CBRE U.S. Core Partners, L.P. | Quarterly | 60 | 0 | |||||||||
| 107,554,226 | Clarion Lion Industrial Trust | Quarterly | 90 | 0 | |||||||||
| 249,106,562 | Clarion Lion Properties Fund, L.P. | Quarterly | 90 | 0 | |||||||||
| 81,213,728 | Cortland Growth and Income Fund, L.P. | Quarterly | 90 | 60,000,000 | |||||||||
| 50,156,448 | CrossHarbor Strategic Debt Fund, L.P. | Quarterly | 90 | 50,000,000 | |||||||||
| 68,187,748 | GWL U.S. Property Fund, L.P. | Quarterly | 90 | 0 | |||||||||
| 92,896,227 | Hancock U.S. Real Estate Fund, L.P. | Quarterly | 60 | 2,407,860 | |||||||||
| 43,511,127 | Heitman America Real Estate Trust, L.P. | Quarterly | 90 | 0 | |||||||||
| 135,501,626 | Heitman Core Real Estate Debt Income Trust | Quarterly | 90 | 0 | |||||||||
| 63,160,033 | MEPT Edgemoor, L.P. | Quarterly | N/A** | 0 | |||||||||
| 10,079,239 | MetLife Commercial Mortgage Income Fund, L.P. | Quarterly | 90 | 0 | |||||||||
| 253,942,354 | Morgan Stanley Prime Property Fund | Quarterly | 90 | 0 | |||||||||
| 95,415,488 | Oaktree Real Estate Income Fund, L.P. | Quarterly | 90 | 0 | |||||||||
| 62,658,165 | PGIM Real Estate US Debt Fund, L.P. | Quarterly | 90 | 37,500,000 | |||||||||
| 190,276,050 | PRISA L.P. | Quarterly | 90 | 0 | |||||||||
| 30,953,686 | RREEF America REIT II, Inc. | Quarterly | 45 | 0 | |||||||||
| 67,695,333 | Sentinel Real Estate Fund, L.P. | Quarterly | N/A** | 0 | |||||||||
| 74,285,297 | Stockbridge Smart Markets Fund | Quarterly | 45 | 0 | |||||||||
| 63,510,003 | TCM CRE Credit Fund, L.P. | Quarterly | 90 | 11,517,500 | |||||||||
| 26,012,606 | UBS Trumbull Property Fund | Quarterly | 60 | 0 | |||||||||
| 72,768,099 | USAA US Government Building Fund, LLC | Quarterly | 60 | 0 | |||||||||
| 2,246,013,822 | 277,804,442 | ||||||||||||
| ** | Written notice required for redemption, no minimum timeline required. |
See Notes to Financial Statements.
| Semi-Annual Report | March 31, 2019 | 21 |
| Griffin Institutional Access Real Estate Fund | Statement of Assets and Liabilities |
March 31, 2019 (Unaudited)
| ASSETS | ||||
| Investments, at value (Cost $2,555,089,282) | $ | 2,797,239,617 | ||
| Cash | 340,116,156 | |||
| Dividend and interest receivables | 19,385,366 | |||
| Receivable for shares sold | 11,199,939 | |||
| Prepaid expenses and other assets | 159,850 | |||
| Total Assets | 3,168,100,928 | |||
| LIABILITIES | ||||
| Investment advisory fees payable (Note 3) | 3,919,419 | |||
| Payable for investments purchased | 1,123,112 | |||
| Distribution fees payable (Note 3) | 672,262 | |||
| Shareholder servicing fees payable (Note 3) | 287,717 | |||
| Transfer agency fees payable (Note 3) | 251,247 | |||
| Administration fees payable (Note 3) | 90,318 | |||
| Lines of credit interest payable (Note 6) | 73,193 | |||
| Custody fees payable | 27,742 | |||
| Audit and tax fees payable | 9,603 | |||
| Chief compliance officer fees payable (Note 3) | 1,439 | |||
| Accrued expenses and other liabilities | 2,464,827 | |||
| Total Liabilities | 8,920,879 | |||
| NET ASSETS | $ | 3,159,180,049 | ||
| NET ASSETS CONSIST OF | ||||
| Paid-in capital | $ | 2,840,574,672 | ||
| Total distributable earnings | 318,605,377 | |||
| NET ASSETS | $ | 3,159,180,049 | ||
| PRICING OF SHARES | ||||
| Class A: | ||||
| Net asset value | $ | 27.18 | ||
| Net assets | $ | 805,922,187 | ||
| Shares of beneficial interest outstanding (unlimited number of shares, no par value common stock authorized) | 29,648,966 | |||
| Maximum offering price per share ((NAV/0.9425), based on maximum sales charge of 5.75% of the offering price) | $ | 28.84 | ||
| Class C: | ||||
| Net asset value and offering | $ | 26.47 | ||
| Net assets | $ | 496,342,016 | ||
| Shares of beneficial interest outstanding (unlimited number of shares, no par value common stock authorized) | 18,752,638 | |||
| Class I: | ||||
| Net asset value and offering | $ | 27.44 | ||
| Net assets | $ | 1,225,026,950 | ||
| Shares of beneficial interest outstanding (unlimited number of shares, no par value common stock authorized) | 44,649,923 | |||
| Class M: | ||||
| Net asset value and offering | $ | 26.87 | ||
| Net assets | $ | 561,086,302 | ||
| Shares of beneficial interest outstanding (unlimited number of shares, no par value common stock authorized) | 20,883,355 | |||
| Class L: | ||||
| Net asset value | $ | 27.08 | ||
| Net assets | $ | 70,802,594 | ||
| Shares of beneficial interest outstanding (unlimited number of shares, no par value common stock authorized) | 2,614,838 | |||
| Maximum offering price per share ((NAV/0.9575), based on maximum sales charge of 4.25% of the offering price) | $ | 28.28 | ||
See Notes to Financial Statements.
| 22 | 1.888.926.2688 | www.griffincapital.com |
| Griffin Institutional Access Real Estate Fund | Statement of Operations |
For the Six Months Ended March 31, 2019 (Unaudited) | ||||
| INVESTMENT INCOME | ||||
| Dividend and interest income | $ | 49,893,728 | ||
| Total Investment Income | 49,893,728 | |||
| EXPENSES | ||||
| Investment advisory fees (Note 3) | 21,224,454 | |||
| Administration fees (Note 3) | 492,172 | |||
| Transfer Agency fees (Note 3) | 520,016 | |||
| Shareholder servicing fees (Note 3): | ||||
| Class A | 893,368 | |||
| Class C | 596,562 | |||
| Class L | 69,127 | |||
| Distribution fees (Note 3): | ||||
| Class C | 1,789,686 | |||
| Class M | 1,749,560 | |||
| Class L | 69,540 | |||
| Interest expense (Note 6) | 905,763 | |||
| Reports to shareholders and printing fees | 496,648 | |||
| Legal fees | 234,075 | |||
| State registration fees | 91,828 | |||
| Trustees' fees (Note 3) | 88,064 | |||
| Insurance fees | 85,499 | |||
| Chief compliance officer fees (Note 3) | 52,270 | |||
| SEC registration fees | 38,373 | |||
| Custody fees | 36,649 | |||
| Audit and tax fees | 12,603 | |||
| Other expenses | 34,904 | |||
| Total Expenses | 29,481,161 | |||
| Fees waived/expenses reimbursed by Adviser (Note 3) | (13,652 | ) | ||
| Expense recoupment of previously waived fees | 121,824 | |||
| Net Expenses | 29,589,333 | |||
| Net Investment Income | 20,304,395 | |||
| Net realized gain on investments | 32,535,111 | |||
| Net change in unrealized appreciation on investments | 47,886,159 | |||
| NET REALIZED AND UNREALIZED GAIN ON INVESTMENTS | 80,421,270 | |||
| NET INCREASE IN NET ASSETS RESULTING FROM OPERATIONS | $ | 100,725,665 | ||
See Notes to Financial Statements.
| Semi-Annual Report | March 31, 2019 | 23 |
| Griffin Institutional Access Real Estate Fund | Statements of Changes in Net Assets |
For the Six Months Ended March 31, 2019 (Unaudited) | For the Year Ended September 30, 2018 | |||||||
| OPERATIONS: | ||||||||
| Net investment income | $ | 20,304,395 | $ | 28,336,093 | ||||
| Net realized gain on investments | 32,535,111 | 11,126,483 | ||||||
| Net change in unrealized appreciation on investments | 47,886,159 | 99,575,298 | ||||||
| Net Increase in Net Assets Resulting from Operations | 100,725,665 | 139,037,874 | ||||||
| DISTRIBUTIONS TO SHAREHOLDERS:(a) | ||||||||
| Class A | ||||||||
| From distributable earnings | (5,042,747 | ) | (5,037,625 | ) | ||||
| From return of capital | (14,926,741 | ) | (30,404,087 | ) | ||||
| Class C | ||||||||
| From distributable earnings | (3,196,219 | ) | (3,392,197 | ) | ||||
| From return of capital | (9,460,940 | ) | (20,473,275 | ) | ||||
| Class I | ||||||||
| From distributable earnings | (7,534,897 | ) | (6,215,713 | ) | ||||
| From return of capital | (22,303,609 | ) | (37,514,323 | ) | ||||
| Class M | ||||||||
| From distributable earnings | (3,313,133 | ) | (2,028,005 | ) | ||||
| From return of capital | (9,807,013 | ) | (12,239,827 | ) | ||||
| Class L | ||||||||
| From distributable earnings | (409,685 | ) | (247,820 | ) | ||||
| From return of capital | (1,212,684 | ) | (1,495,695 | ) | ||||
| Total Distributions to Shareholders | (77,207,668 | ) | (119,048,567 | ) | ||||
| BENEFICIAL INTEREST TRANSACTIONS: | ||||||||
| Class A | ||||||||
| Shares sold | $ | 136,968,702 | $ | 199,774,191 | ||||
| Distributions reinvested | 10,744,493 | 20,061,998 | ||||||
| Shares redeemed | (50,093,174 | ) | (107,606,031 | ) | ||||
| Shares transferred out | (13,298,631 | ) | (43,800,663 | ) | ||||
| Class C | ||||||||
| Shares sold | 48,973,872 | 80,918,179 | ||||||
| Distributions reinvested | 7,546,260 | 14,155,699 | ||||||
| Shares redeemed | (31,484,617 | ) | (69,672,473 | ) | ||||
| Shares transferred out | (1,948,683 | ) | (1,341,871 | ) | ||||
| Class I | ||||||||
| Shares sold | 268,495,633 | 362,907,525 | ||||||
| Distributions reinvested | 15,338,788 | 23,585,133 | ||||||
| Shares redeemed | (78,495,130 | ) | (108,533,370 | ) | ||||
| Shares transferred in | 16,426,830 | 46,165,081 | ||||||
| Class M | ||||||||
| Shares sold | 150,538,735 | 277,294,524 | ||||||
| Distributions reinvested | 10,604,492 | 11,829,030 | ||||||
| Shares redeemed | (4,363,065 | ) | (4,533,021 | ) | ||||
| Shares transferred out | (1,077,197 | ) | (245,332 | ) | ||||
| Class L | ||||||||
| Shares sold | 26,180,310 | 32,893,891 | ||||||
| Distributions reinvested | 1,114,795 | 1,162,174 | ||||||
| Shares redeemed | (2,606,268 | ) | (1,472,707 | ) | ||||
| Shares transferred out | (102,319 | ) | (777,215 | ) | ||||
| Net Increase in Net Assets Derived from Beneficial Interest Transactions | 509,463,826 | 732,764,742 | ||||||
| Net increase in net assets | 532,981,823 | 752,754,049 | ||||||
See Notes to Financial Statements.
| 24 | 1.888.926.2688 | www.griffincapital.com |
| Griffin Institutional Access Real Estate Fund | Statements of Changes in Net Assets |
For the Six Months Ended March 31, 2019 (Unaudited) | For the Year Ended September 30, 2018 | |||||||
| NET ASSETS: | ||||||||
| Beginning of period | 2,626,198,226 | 1,873,444,177 | ||||||
| End of period | $ | 3,159,180,049 | $ | 2,626,198,226 | ||||
| Other Information | ||||||||
| BENEFICIAL INTEREST TRANSACTIONS: | ||||||||
| Class A | ||||||||
| Beginning shares | 26,532,652 | 23,993,905 | ||||||
| Shares sold | 5,055,211 | 7,438,877 | ||||||
| Distributions reinvested | 400,114 | 751,778 | ||||||
| Shares redeemed | (1,849,793 | ) | (4,016,984 | ) | ||||
| Shares transferred out | (489,218 | ) | (1,634,924 | ) | ||||
| Net increase in shares outstanding | 3,116,314 | 2,538,747 | ||||||
| Ending shares | 29,648,966 | 26,532,652 | ||||||
| Class C | ||||||||
| Beginning shares | 17,875,089 | 16,965,585 | ||||||
| Shares sold | 1,853,204 | 3,072,264 | ||||||
| Distributions reinvested | 288,253 | 541,187 | ||||||
| Shares redeemed | (1,190,223 | ) | (2,652,957 | ) | ||||
| Shares transferred out | (73,685 | ) | (50,990 | ) | ||||
| Net increase in shares outstanding | 877,549 | 909,504 | ||||||
| Ending shares | 18,752,638 | 17,875,089 | ||||||
| Class I | ||||||||
| Beginning shares | 36,533,117 | 24,552,452 | ||||||
| Shares sold | 9,817,403 | 13,418,915 | ||||||
| Distributions reinvested | 566,011 | 877,058 | ||||||
| Shares redeemed | (2,865,700 | ) | (4,025,849 | ) | ||||
| Shares transferred in | 599,092 | 1,710,541 | ||||||
| Net increase in shares outstanding | 8,116,806 | 11,980,665 | ||||||
| Ending shares | 44,649,923 | 36,533,117 | ||||||
| Class M | ||||||||
| Beginning shares | 15,075,805 | 4,409,450 | ||||||
| Shares sold | 5,610,858 | 10,399,098 | ||||||
| Distributions reinvested | 398,986 | 445,985 | ||||||
| Shares redeemed | (162,416 | ) | (169,693 | ) | ||||
| Shares transferred out | (39,878 | ) | (9,035 | ) | ||||
| Net increase in shares outstanding | 5,807,550 | 10,666,355 | ||||||
| Ending shares | 20,883,355 | 15,075,805 | ||||||
| Class L | ||||||||
| Beginning shares | 1,706,333 | 519,193 | ||||||
| Shares sold | 967,313 | 1,226,796 | ||||||
| Distributions reinvested | 41,607 | 43,581 | ||||||
| Shares redeemed | (96,593 | ) | (54,499 | ) | ||||
| Shares transferred out | (3,822 | ) | (28,738 | ) | ||||
| Net increase in shares outstanding | 908,505 | 1,187,140 | ||||||
| Ending shares | 2,614,838 | 1,706,333 | ||||||
| (a) | The Fund has substantial investments in real estate investment trusts, or REITs, which are generally not subject to federal income taxes. Distributions that the Fund receives from REITs can be classified as ordinary income, capital gain income or return of capital by the REITs that make these distributions to the Fund. The Fund has estimated the character of distributions for the six-month period ended March 31, 2019 based on the percentage of such distributions attributable to net investment income, net realized gains and return of capital for the fiscal year ended September 30, 2018. |
See Notes to Financial Statements.
| Semi-Annual Report | March 31, 2019 | 25 |
| Griffin Institutional Access Real Estate Fund | Statement of Cash Flows |
For the Six Months Ended March 31, 2019 (Unaudited) | ||||
| Cash Flows from Operating Activities: | ||||
| Net increase in net assets resulting from operations | $ | 100,725,665 | ||
| Purchase of investments | (518,363,998 | ) | ||
| Proceeds from sales | 305,134,586 | |||
| Net realized (gain)/loss on: | ||||
| Investments | (32,535,111 | ) | ||
| Net change in unrealized appreciation on: | ||||
| Investments | (47,886,159 | ) | ||
| (Increase)/Decrease in Assets: | ||||
| Dividend and interest receivables | (2,485,895 | ) | ||
| Prepaid expenses and other assets | (17,183 | ) | ||
| Increase/(Decrease) in Liabilities: | ||||
| Investment advisory fees payable | 768,901 | |||
| Distribution fees payable | 137,014 | |||
| Transfer agency fees payable | 68,218 | |||
| Custody fees payable | 14,057 | |||
| Administration fees payable | 13,135 | |||
| Lines of credit interest payable | 12,915 | |||
| Audit and tax fees payable | (10,897 | ) | ||
| Chief compliance officer fees payable | (14,707 | ) | ||
| Legal fees payable | (55,141 | ) | ||
| Shareholder servicing fees payable | (143,672 | ) | ||
| Accrued expenses and other liabilities | 723,056 | |||
| Net cash used for operating activities | (193,915,216 | ) | ||
| Cash Flows from Financing Activities: | ||||
| Proceeds from shares sold | 630,158,732 | |||
| Payment on shares redeemed | (167,042,254 | ) | ||
| Cash distributions paid | (31,858,840 | ) | ||
| Net cash provided by financing activities | 431,257,648 | |||
| Net increase in cash & cash equivalents | 237,342,422 | |||
| Cash & cash equivalents, beginning of period | $ | 102,773,734 | ||
| Cash & cash equivalents, end of period | $ | 340,116,156 | ||
| Non-cash financing activities not included herein consist of reinvestment of distributions of: | 45,348,828 | |||
| Cash paid during the period for interest from bank borrowing: | $ | 892,848 | ||
See Notes to Financial Statements.
| 26 | 1.888.926.2688 | www.griffincapital.com |
| Griffin Institutional Access Real Estate Fund – Class A | Financial Highlights |
For a Share Outstanding Throughout the Periods Presented
For the Six Months Ended March 31, 2019 (Unaudited) | For the Year Ended September 30, 2018 | For the Year Ended September 30, 2017 | For the Year Ended September 30, 2016 | For the Year Ended September 30, 2015 | For the Period Ended September 30, 2014(a) | ||||||||||||||
| Net asset value, beginning of period | $ | 26.94 | $ | 26.65 | $ | 26.63 | $ | 25.97 | $ | 25.31 | $ | 25.00 | |||||||
| INCOME FROM INVESTMENT OPERATIONS: | |||||||||||||||||||
| Net investment income(b) | 0.21 | 0.38 | 0.28 | 0.24 | 0.09 | 0.01 | |||||||||||||
| Net realized and unrealized gain | 0.74 | 1.32 | 1.14 | 1.81 | 1.90 | 0.60 | |||||||||||||
| Total from investment operations | 0.95 | 1.70 | 1.42 | 2.05 | 1.99 | 0.61 | |||||||||||||
| DISTRIBUTIONS: | |||||||||||||||||||
| From net investment income | – | – | – | (0.02 | ) | – | – | ||||||||||||
| From net realized gain on investments | (0.18 | ) | (0.20 | ) | (0.30 | ) | (0.32 | ) | (0.32 | ) | (0.01 | ) | |||||||
| Return of capital | (0.53 | ) | (1.21 | ) | (1.10 | ) | (1.05 | ) | (1.01 | ) | (0.29 | ) | |||||||
| Total distributions(c)(d) | (0.71 | ) | (1.41 | ) | (1.40 | ) | (1.39 | ) | (1.33 | ) | (0.30 | ) | |||||||
| Net increase in net asset value | 0.24 | 0.29 | 0.02 | 0.66 | 0.66 | 0.31 | |||||||||||||
| Net asset value, end of period | $ | 27.18 | $ | 26.94 | $ | 26.65 | $ | 26.63 | $ | 25.97 | $ | 25.31 | |||||||
| TOTAL RETURN(e) | 3.58 | % | 6.54 | % | 5.47 | % | 8.07 | % | 8.03 | % | 2.46 | % | |||||||
| RATIOS/SUPPLEMENTAL DATA: | |||||||||||||||||||
| Net assets, end of period (000s) | $ | 805,922 | $ | 714,880 | $ | 639,448 | $ | 510,251 | $ | 130,847 | $ | 35,845 | |||||||
| Ratios to Average Net Assets (including interest expense) | |||||||||||||||||||
| Ratio of expenses to average net assets excluding fee waivers and reimbursements/recoupment of previously waived fees(f) | 1.96 | %(g) | 2.11 | % | 2.29 | % | 2.41 | % | 2.82 | % | N/A | ||||||||
| Ratio of expenses to average net assets including fee waivers and reimbursements/recoupment of previously waived fees(f) | 1.97 | %(g) | 2.11 | % | 2.23 | % | 2.23 | % | 1.94 | % | N/A | ||||||||
| Ratio of net investment income to average net assets(f)(h) | 1.55 | %(g) | 1.41 | % | 1.06 | % | 0.92 | % | 0.35 | % | N/A | ||||||||
| Ratios to Average Net Assets (excluding interest expense) | |||||||||||||||||||
| Ratio of expenses to average net assets excluding fee waivers and reimbursements/recoupment of previously waived fees(f) | 1.90 | %(g) | 1.91 | % | 1.97 | % | 2.09 | % | 2.79 | % | 6.77 | %(g) | |||||||
| Ratio of expenses to average net assets including fee waivers and reimbursements/recoupment of previously waived fees(f) | 1.91 | %(g) | 1.91 | % | 1.91 | % | 1.91 | % | 1.91 | % | 1.91 | %(g) | |||||||
| Ratio of net investment income to average net assets excluding fee waivers and reimbursements(f)(h) | 1.50 | %(g) | 1.61 | % | 1.31 | % | 1.05 | % | 0.38 | % | 0.15 | %(g) | |||||||
| Portfolio turnover rate(i) | 11 | % | 15 | % | 11 | % | 8 | % | 29 | % | 7 | % | |||||||
| (a) | The Fund's Class A shares commenced operations on June 30, 2014. |
| (b) | Calculated using the average shares method. |
See Notes to Financial Statements.
| Semi-Annual Report | March 31, 2019 | 27 |
| Griffin Institutional Access Real Estate Fund – Class A | Financial Highlights |
For a Share Outstanding Throughout the Periods Presented
| (c) | Total distributions during a calendar year generally will be made from the Fund’s net investment income, net realized gains on investments and net unrealized gains on investments, if any. The portion of distributions paid not attributable to net investment income or net realized gains on investments, if any, is distributed from the Fund’s assets and is treated by shareholders as a nontaxable distribution (“Return of Capital”) for tax purposes. Return of capital is a tax concept, not an economic concept. The tax character of the Fund’s distributions, in isolation, does not reveal much information about whether the distributions are supported by the Fund’s returns. Reported distributions from net investment income and realized gains on investments are not an indication as to whether or not the Fund’s distributions are supported by the Fund’s returns. The Fund can have distributions from net investment income and realized capital gains in years in which it incurs an economic loss due to unrealized losses not being recognized for tax purposes. A common method in which to determine if the Fund’s distributions are supported by economic returns is to examine the Fund’s Net Asset Value (“NAV”) over the course of a year. If the Fund’s NAV has increased, the Fund will have economically earned more than it has distributed, regardless of whether such distributions are reported as being from net investment income, net realized gains on investments or return of capital. If the Fund’s NAV decreases, the Fund will have distributed more than it has economically earned or it will have incurred an economic loss. |
| (d) | The Fund has substantial investments in real estate investment trusts, or REITs, which are generally not subject to federal income taxes. Distributions that the Fund receives from REITs can be classified as ordinary income, capital gain income or return of capital by the REITs that make these distributions to the Fund. However, it is not possible for the Fund to accurately characterize distributions received from REITs during interim periods because the REIT issuers do not report their tax characterizations until after year end. The Fund has estimated the character of distributions for the six-month period ended March 31, 2019 based on the percentage of such distributions attributable to net investment income, net realized gains and return of capital for the fiscal year ended September 30, 2018. Final characterization of the Fund’s 2019 distributions to its common shareholders is also dependent upon the size or timing of the Fund’s securities transactions prior to year-end. Therefore, it is likely that some portion of the Fund’s 2019 investment income and distributions to its common shareholders will be recharacterized as long term capital gain and return of capital for financial statement and U.S. federal income tax purposes subsequent to year end and reflected accordingly in the Fund’s year-end financial statements. |
| (e) | Total returns are for the period indicated and have not been annualized and do not reflect the impact of sales charge. Total returns would have been lower had certain expenses not been waived during the period. Returns shown do not reflect the deduction of taxes that a shareholder would pay on Fund distributions or the redemption of Fund shares. |
| (f) | The ratios of expenses to average net assets and net investment income to average net assets do not reflect the expenses of the underlying private real estate funds in which the Fund invests which typically range from 0.80% to 1.00% on an annual basis. However, the Fund invests in each underlying private real estate investment fund based upon the net asset value of each such fund which reflects the costs of investing in the applicable fund, including the management fee of the underlying fund and other operating expenses. The net asset value of each underlying private real estate investment fund is incorporated into the ratios described above. |
| (g) | Annualized. |
| (h) | Recognition of net investment income is affected by the timing and declaration of dividends by the underlying investment companies in which the Fund invests. |
| (i) | Portfolio turnover rate for periods less than one full year has not been annualized and is calculated at the Fund level. |
See Notes to Financial Statements.
| 28 | 1.888.926.2688 | www.griffincapital.com |
| Griffin Institutional Access Real Estate Fund – Class C | Financial Highlights |
For a Share Outstanding Throughout the Periods Presented
For the Six Months Ended March 31, 2019 (Unaudited) | For the Year Ended September 30, 2018 | For the Year Ended September 30, 2017 | For the Year Ended September 30, 2016 | For the Period Ended September 30, 2015(a) | ||||||||||||
| Net asset value, beginning of period | $ | 26.33 | $ | 26.24 | $ | 26.42 | $ | 25.95 | $ | 26.20 | ||||||
| INCOME FROM INVESTMENT OPERATIONS: | ||||||||||||||||
| Net investment income(b) | 0.10 | 0.17 | 0.08 | 0.04 | 0.00 | (c) | ||||||||||
| Net realized and unrealized gain | 0.73 | 1.31 | 1.12 | 1.82 | 0.09 | |||||||||||
| Total from investment operations | 0.83 | 1.48 | 1.20 | 1.86 | 0.09 | |||||||||||
| DISTRIBUTIONS: | ||||||||||||||||
| From net investment income | – | – | – | (0.03 | ) | – | ||||||||||
| From net realized gain on investments | (0.18 | ) | (0.20 | ) | (0.30 | ) | (0.32 | ) | – | |||||||
| Return of capital | (0.51 | ) | (1.19 | ) | (1.08 | ) | (1.04 | ) | (0.34 | ) | ||||||
| Total distributions(d)(e) | (0.69 | ) | (1.39 | ) | (1.38 | ) | (1.39 | ) | (0.34 | ) | ||||||
| Net increase/(decrease) in net asset value | 0.14 | 0.09 | (0.18 | ) | 0.47 | (0.25 | ) | |||||||||
| Net asset value, end of period | $ | 26.47 | $ | 26.33 | $ | 26.24 | $ | 26.42 | $ | 25.95 | ||||||
| TOTAL RETURN(f) | 3.21 | % | 5.76 | % | 4.68 | % | 7.30 | % | 0.34 | % | ||||||
| RATIOS/SUPPLEMENTAL DATA: | ||||||||||||||||
| Net assets, end of period (000s) | $ | 496,342 | $ | 470,711 | $ | 445,191 | $ | 302,319 | $ | 13,547 | ||||||
| Ratios to Average Net Assets (including interest expense) | ||||||||||||||||
| Ratio of expenses to average net assets excluding fee waivers and reimbursements/recoupment of previously waived fees(g) | 2.72 | %(h) | 2.86 | % | 3.04 | % | 3.18 | % | 3.32 | %(h) | ||||||
| Ratio of expenses to average net assets including fee waivers and reimbursements/recoupment of previously waived fees(g) | 2.72 | %(h) | 2.86 | % | 2.98 | % | 2.98 | % | 2.69 | %(h) | ||||||
| Ratio of net investment income to average net assets(g)(i) | 0.80 | %(h) | 0.66 | % | 0.30 | % | 0.17 | % | 0.00 | %(h)(j) | ||||||
| Ratios to Average Net Assets (excluding interest expense) | ||||||||||||||||
| Ratio of expenses to average net assets excluding fee waivers and reimbursements/recoupment of previously waived fees(g) | 2.66 | %(h) | 2.66 | % | 2.72 | % | 2.86 | % | 3.29 | %(h) | ||||||
| Ratio of expenses to average net assets including fee waivers and reimbursements/recoupment of previously waived fees(g) | 2.66 | %(h) | 2.66 | % | 2.66 | % | 2.66 | % | 2.66 | %(h) | ||||||
| Ratio of net investment income to average net assets excluding fee waivers and reimbursements(g)(i) | 0.74 | %(h) | 0.86 | % | 0.56 | % | 0.29 | % | 0.03 | %(h) | ||||||
| Portfolio turnover rate(k) | 11 | % | 15 | % | 11 | % | 8 | % | 29 | % | ||||||
| (a) | The Fund's Class C shares commenced operations on August 10, 2015. |
| (b) | Calculated using the average shares method. |
| (c) | Less than $0.005 per share. |
See Notes to Financial Statements.
| Semi-Annual Report | March 31, 2019 | 29 |
| Griffin Institutional Access Real Estate Fund – Class C | Financial Highlights |
| For a Share Outstanding Throughout the Periods Presented |
| (d) | Total distributions during a calendar year generally will be made from the Fund’s net investment income, net realized gains on investments and net unrealized gains on investments, if any. The portion of distributions paid not attributable to net investment income or net realized gains on investments, if any, is distributed from the Fund’s assets and is treated by shareholders as a nontaxable distribution (“Return of Capital”) for tax purposes. Return of capital is a tax concept, not an economic concept. The tax character of the Fund’s distributions, in isolation, does not reveal much information about whether the distributions are supported by the Fund’s returns. Reported distributions from net investment income and realized gains on investments are not an indication as to whether or not the Fund’s distributions are supported by the Fund’s returns. The Fund can have distributions from net investment income and realized capital gains in years in which it incurs an economic loss due to unrealized losses not being recognized for tax purposes. A common method in which to determine if the Fund’s distributions are supported by economic returns is to examine the Fund’s Net Asset Value (“NAV”) over the course of a year. If the Fund’s NAV has increased, the Fund will have economically earned more than it has distributed, regardless of whether such distributions are reported as being from net investment income, net realized gains on investments or return of capital. If the Fund’s NAV decreases, the Fund will have distributed more than it has economically earned or it will have incurred an economic loss. |
| (e) | The Fund has substantial investments in real estate investment trusts, or REITs, which are generally not subject to federal income taxes. Distributions that the Fund receives from REITs can be classified as ordinary income, capital gain income or return of capital by the REITs that make these distributions to the Fund. However, it is not possible for the Fund to accurately characterize distributions received from REITs during interim periods because the REIT issuers do not report their tax characterizations until after year end. The Fund has estimated the character of distributions for the six-month period ended March 31, 2019 based on the percentage of such distributions attributable to net investment income, net realized gains and return of capital for the fiscal year ended September 30, 2018. Final characterization of the Fund’s 2019 distributions to its common shareholders is also dependent upon the size or timing of the Fund’s securities transactions prior to year-end. Therefore, it is likely that some portion of the Fund’s 2019 investment income and distributions to its common shareholders will be recharacterized as long term capital gain and return of capital for financial statement and U.S. federal income tax purposes subsequent to year end and reflected accordingly in the Fund’s year-end financial statements. |
| (f) | Total returns are for the period indicated and have not been annualized and do not reflect the impact of sales charge. Total returns would have been lower had certain expenses not been waived during the period. Returns shown do not reflect the deduction of taxes that a shareholder would pay on Fund distributions or the redemption of Fund shares. |
| (g) | The ratios of expenses to average net assets and net investment income to average net assets do not reflect the expenses of the underlying private real estate funds in which the Fund invests which typically range from 0.80% to 1.00% on an annual basis. However, the Fund invests in each underlying private real estate investment fund based upon the net asset value of each such fund which reflects the costs of investing in the applicable fund, including the management fee of the underlying fund and other operating expenses. The net asset value of each underlying private real estate investment fund is incorporated into the ratios described above. |
| (h) | Annualized. |
| (i) | Recognition of net investment income is affected by the timing and declaration of dividends by the underlying investment companies in which the Fund invests. |
| (j) | Less than 0.005%. |
| (k) | Portfolio turnover rate for periods less than one full year has not been annualized and is calculated at the Fund level. |
See Notes to Financial Statements.
| 30 | 1.888.926.2688 | www.griffincapital.com |
| Griffin Institutional Access Real Estate Fund – Class I | Financial Highlights |
For a Share Outstanding Throughout the Periods Presented
For the Six Months Ended March 31, 2019 (Unaudited) | For the Year Ended September 30, 2018 | For the Year Ended September 30, 2017 | For the Year Ended September 30, 2016 | For the Period Ended September 30, 2015(a) | ||||||||||||
| Net asset value, beginning of period | $ | 27.16 | $ | 26.80 | $ | 26.71 | $ | 25.98 | $ | 26.20 | ||||||
| INCOME FROM INVESTMENT OPERATIONS: | ||||||||||||||||
| Net investment income(b) | 0.25 | 0.45 | 0.35 | 0.31 | 0.03 | |||||||||||
| Net realized and unrealized gain | 0.75 | 1.33 | 1.15 | 1.82 | 0.09 | |||||||||||
| Total from investment operations | 1.00 | 1.78 | 1.50 | 2.13 | 0.12 | |||||||||||
| DISTRIBUTIONS: | ||||||||||||||||
| From net investment income | – | – | – | (0.03 | ) | – | ||||||||||
| From net realized gain on investments | (0.18 | ) | (0.20 | ) | (0.30 | ) | (0.32 | ) | – | |||||||
| Return of capital | (0.54 | ) | (1.22 | ) | (1.11 | ) | (1.05 | ) | (0.34 | ) | ||||||
| Total distributions(c)(d) | (0.72 | ) | (1.42 | ) | (1.41 | ) | (1.40 | ) | (0.34 | ) | ||||||
| Net increase/(decrease) in net asset value | 0.28 | 0.36 | 0.09 | 0.73 | (0.22 | ) | ||||||||||
| Net asset value, end of period | $ | 27.44 | $ | 27.16 | $ | 26.80 | $ | 26.71 | $ | 25.98 | ||||||
| TOTAL RETURN(e) | 3.73 | % | 6.81 | % | 5.75 | % | 8.35 | % | 0.46 | % | ||||||
| RATIOS/SUPPLEMENTAL DATA: | ||||||||||||||||
| Net assets, end of period (000s) | $ | 1,225,027 | $ | 992,272 | $ | 657,954 | $ | 353,907 | $ | 74,095 | ||||||
| Ratios to Average Net Assets (including interest expense) | ||||||||||||||||
| Ratio of expenses to average net assets excluding fee waivers and reimbursements/recoupment of previously waived fees(f) | 1.72 | %(g) | 1.86 | % | 2.04 | % | 2.17 | % | 2.20 | %(g) | ||||||
| Ratio of expenses to average net assets including fee waivers and reimbursements/recoupment of previously waived fees (f) | 1.72 | %(g) | 1.86 | % | 1.97 | % | 1.98 | % | 1.69 | %(g) | ||||||
| Ratio of net investment income to average net assets(f)(h) | 1.80 | %(g) | 1.67 | % | 1.31 | % | 1.16 | % | 0.71 | %(g) | ||||||
| Ratios to Average Net Assets (excluding interest expense) | ||||||||||||||||
| Ratio of expenses to average net assets excluding fee waivers and reimbursements/recoupment of previously waived fees(f) | 1.66 | %(g) | 1.66 | % | 1.73 | % | 1.85 | % | 2.17 | %(g) | ||||||
| Ratio of expenses to average net assets including fee waivers and reimbursements/recoupment of previously waived fees(f) | 1.66 | %(g) | 1.66 | % | 1.66 | % | 1.66 | % | 1.66 | %(g) | ||||||
| Ratio of net investment income to average net assets excluding fee waivers and reimbursements(f)(h) | 1.75 | %(g) | 1.87 | % | 1.55 | % | 1.30 | % | 0.74 | %(g) | ||||||
| Portfolio turnover rate(i) | 11 | % | 15 | % | 11 | % | 8 | % | 29 | % | ||||||
| (a) | The Fund's Class I shares commenced operations on August 10, 2015. |
| (b) | Calculated using the average shares method. |
See Notes to Financial Statements.
| Semi-Annual Report | March 31, 2019 | 31 |
| Griffin Institutional Access Real Estate Fund – Class I | Financial Highlights |
For a Share Outstanding Throughout the Periods Presented
| (c) | Total distributions during a calendar year generally will be made from the Fund’s net investment income, net realized gains on investments and net unrealized gains on investments, if any. The portion of distributions paid not attributable to net investment income or net realized gains on investments, if any, is distributed from the Fund’s assets and is treated by shareholders as a nontaxable distribution (“Return of Capital”) for tax purposes. Return of capital is a tax concept, not an economic concept. The tax character of the Fund’s distributions, in isolation, does not reveal much information about whether the distributions are supported by the Fund’s returns. Reported distributions from net investment income and realized gains on investments are not an indication as to whether or not the Fund’s distributions are supported by the Fund’s returns. The Fund can have distributions from net investment income and realized capital gains in years in which it incurs an economic loss due to unrealized losses not being recognized for tax purposes. A common method in which to determine if the Fund’s distributions are supported by economic returns is to examine the Fund’s Net Asset Value (“NAV”) over the course of a year. If the Fund’s NAV has increased, the Fund will have economically earned more than it has distributed, regardless of whether such distributions are reported as being from net investment income, net realized gains on investments or return of capital. If the Fund’s NAV decreases, the Fund will have distributed more than it has economically earned or it will have incurred an economic loss. |
| (d) | The Fund has substantial investments in real estate investment trusts, or REITs, which are generally not subject to federal income taxes. Distributions that the Fund receives from REITs can be classified as ordinary income, capital gain income or return of capital by the REITs that make these distributions to the Fund. However, it is not possible for the Fund to accurately characterize distributions received from REITs during interim periods because the REIT issuers do not report their tax characterizations until after year end. The Fund has estimated the character of distributions for the six-month period ended March 31, 2019 based on the percentage of such distributions attributable to net investment income, net realized gains and return of capital for the fiscal year ended September 30, 2018. Final characterization of the Fund’s 2019 distributions to its common shareholders is also dependent upon the size or timing of the Fund’s securities transactions prior to year-end. Therefore, it is likely that some portion of the Fund’s 2019 investment income and distributions to its common shareholders will be recharacterized as long term capital gain and return of capital for financial statement and U.S. federal income tax purposes subsequent to year end and reflected accordingly in the Fund’s year-end financial statements. |
| (e) | Total returns are for the period indicated and have not been annualized and do not reflect the impact of sales charge. Total returns would have been lower had certain expenses not been waived during the period. Returns shown do not reflect the deduction of taxes that a shareholder would pay on Fund distributions or the redemption of Fund shares. |
| (f) | The ratios of expenses to average net assets and net investment income to average net assets do not reflect the expenses of the underlying private real estate funds in which the Fund invests which typically range from 0.80% to 1.00% on an annual basis. However, the Fund invests in each underlying private real estate investment fund based upon the net asset value of each such fund which reflects the costs of investing in the applicable fund, including the management fee of the underlying fund and other operating expenses. The net asset value of each underlying private real estate investment fund is incorporated into the ratios described above. |
| (g) | Annualized. |
| (h) | Recognition of net investment income is affected by the timing and declaration of dividends by the underlying investment companies in which the Fund invests. |
| (i) | Portfolio turnover rate for periods less than one full year has not been annualized and is calculated at the Fund level. |
See Notes to Financial Statements.
| 32 | 1.888.926.2688 | www.griffincapital.com |
| Griffin Institutional Access Real Estate Fund – Class M | Financial Highlights |
For a Share Outstanding Throughout the Periods Presented
For the Six Months Ended March 31, 2019 (Unaudited) | For the Year Ended September 30, 2018 | For the Period Ended September 30, 2017(a) | ||||||||
| Net asset value, beginning of period | $ | 26.70 | $ | 26.54 | $ | 26.48 | ||||
| INCOME FROM INVESTMENT OPERATIONS: | ||||||||||
| Net investment income(b) | 0.14 | 0.25 | 0.13 | |||||||
| Net realized and unrealized gain | 0.73 | 1.31 | 1.33 | |||||||
| Total from investment operations | 0.87 | 1.56 | 1.46 | |||||||
| DISTRIBUTIONS: | ||||||||||
| From net realized gain on investments | (0.18 | ) | (0.20 | ) | (0.30 | ) | ||||
| Return of capital | (0.52 | ) | (1.20 | ) | (1.10 | ) | ||||
| Total distributions(c)(d) | (0.70 | ) | (1.40 | ) | (1.40 | ) | ||||
| Net increase/(decrease) in net asset value | 0.17 | 0.16 | 0.06 | |||||||
| Net asset value, end of period | $ | 26.87 | $ | 26.70 | $ | 26.54 | ||||
| TOTAL RETURN(e) | 3.32 | % | 6.03 | % | 5.63 | % | ||||
| RATIOS/SUPPLEMENTAL DATA: | ||||||||||
| Net assets, end of period (000s) | $ | 561,086 | $ | 402,482 | $ | 117,018 | ||||
| Ratios to Average Net Assets (including interest expense) | ||||||||||
| Ratio of expenses to average net assets excluding fee waivers and reimbursements/recoupment of previously waived fees(f) | 2.47 | %(g) | 2.58 | % | 2.71 | %(g) | ||||
| Ratio of expenses to average net assets including fee waivers and reimbursements/recoupment of previously waived fees(f) | 2.47 | %(g) | 2.59 | % | 2.66 | %(g) | ||||
| Ratio of net investment income to average net assets(f)(h) | 1.06 | %(g) | 0.94 | % | 0.57 | %(g) | ||||
| Ratios to Average Net Assets (excluding interest expense) | ||||||||||
| Ratio of expenses to average net assets excluding fee waivers and reimbursements/recoupment of previously waived fees(f) | 2.41 | %(g) | 2.41 | % | 2.46 | %(g) | ||||
| Ratio of expenses to average net assets including fee waivers and reimbursements/recoupment of previously waived fees(f) | 2.41 | %(g) | 2.41 | % | 2.41 | %(g) | ||||
| Ratio of net investment income to average net assets excluding fee waivers and reimbursements(f)(h) | 1.00 | %(g) | 1.14 | % | 0.77 | %(g) | ||||
| Portfolio turnover rate(i) | 11 | % | 15 | % | 11 | % | ||||
| (a) | The Fund’s Class M shares commenced operations on November 17, 2016. |
| (b) | Calculated using the average shares method. |
| (c) | Total distributions during a calendar year generally will be made from the Fund’s net investment income, net realized gains on investments and net unrealized gains on investments, if any. The portion of distributions paid not attributable to net investment income or net realized gains on investments, if any, is distributed from the Fund’s assets and is treated by shareholders as a nontaxable distribution (“Return of Capital”) for tax purposes. Return of capital is a tax concept, not an economic concept. The tax character of the Fund’s distributions, in isolation, does not reveal much information about whether the distributions are supported by the Fund’s returns. Reported distributions from net investment income and realized gains on investments are not an indication as to whether or not the Fund’s distributions are supported by the Fund’s returns. The Fund can have distributions from net investment income and realized capital gains in years in which it incurs an economic loss due to unrealized losses not being recognized for tax purposes. A common method in which to determine if the Fund’s distributions are supported by economic returns is to examine the Fund’s Net Asset Value (“NAV”) over the course of a year. If the Fund’s NAV has increased, the Fund will have economically earned more than it has distributed, regardless of whether such distributions are reported as being from net investment income, net realized gains on investments or return of capital. If the Fund’s NAV decreases, the Fund will have distributed more than it has economically earned or it will have incurred an economic loss. |
See Notes to Financial Statements.
| Semi-Annual Report | March 31, 2019 | 33 |
| Griffin Institutional Access Real Estate Fund – Class M | Financial Highlights |
For a Share Outstanding Throughout the Period Presented
| (d) | The Fund has substantial investments in real estate investment trusts, or REITs, which are generally not subject to federal income taxes. Distributions that the Fund receives from REITs can be classified as ordinary income, capital gain income or return of capital by the REITs that make these distributions to the Fund. However, it is not possible for the Fund to accurately characterize distributions received from REITs during interim periods because the REIT issuers do not report their tax characterizations until after year end. The Fund has estimated the character of distributions for the six-month period ended March 31, 2019 based on the percentage of such distributions attributable to net investment income, net realized gains and return of capital for the fiscal year ended September 30, 2018. Final characterization of the Fund’s 2019 distributions to its common shareholders is also dependent upon the size or timing of the Fund’s securities transactions prior to year-end. Therefore, it is likely that some portion of the Fund’s 2019 investment income and distributions to its common shareholders will be recharacterized as long term capital gain and return of capital for financial statement and U.S. federal income tax purposes subsequent to year end and reflected accordingly in the Fund’s year-end financial statements. |
| (e) | Total returns are for the period indicated and have not been annualized and do not reflect the impact of sales charge. Total returns would have been lower had certain expenses not been waived during the period. Returns shown do not reflect the deduction of taxes that a shareholder would pay on Fund distributions or the redemption of Fund shares. |
| (f) | The ratios of expenses to average net assets and net investment income to average net assets do not reflect the expenses of the underlying private real estate funds in which the Fund invests which typically range from 0.80% to 1.00% on an annual basis. However, the Fund invests in each underlying private real estate investment fund based upon the net asset value of each such fund which reflects the costs of investing in the applicable fund, including the management fee of the underlying fund and other operating expenses. The net asset value of each underlying private real estate investment fund is incorporated into the ratios described above. |
| (g) | Annualized. |
| (h) | Recognition of net investment income is affected by the timing and declaration of dividends by the underlying investment companies in which the Fund invests. |
| (i) | Portfolio turnover rate for periods less than one full year has not been annualized and is calculated at the Fund level. |
See Notes to Financial Statements.
| 34 | 1.888.926.2688 | www.griffincapital.com |
| Griffin Institutional Access Real Estate Fund – Class L | Financial Highlights |
For a Share Outstanding Throughout the Periods Presented
For the Six Months Ended March 31, 2019 (Unaudited) | For the Year Ended September 30, 2018 | For the Period Ended September 30, 2017(a) | ||||||||
| Net asset value, beginning of period | $ | 26.87 | $ | 26.64 | $ | 26.63 | ||||
| INCOME FROM INVESTMENT OPERATIONS: | ||||||||||
| Net investment income(b) | 0.18 | 0.32 | 0.12 | |||||||
| Net realized and unrealized gain | 0.74 | 1.32 | 0.59 | |||||||
| Total from investment operations | 0.92 | 1.64 | 0.71 | |||||||
| DISTRIBUTIONS: | ||||||||||
| From net realized gain on investments | (0.18 | ) | (0.20 | ) | (0.15 | ) | ||||
| Return of capital | (0.53 | ) | (1.21 | ) | (0.55 | ) | ||||
| Total distributions(c)(d) | (0.71 | ) | (1.41 | ) | (0.70 | ) | ||||
| Net increase/(decrease) in net asset value | 0.21 | 0.23 | 0.01 | |||||||
| Net asset value, end of period | $ | 27.08 | $ | 26.87 | $ | 26.64 | ||||
| TOTAL RETURN(e) | 3.47 | % | 6.30 | % | 2.70 | % | ||||
| RATIOS/SUPPLEMENTAL DATA: | ||||||||||
| Net assets, end of period (000s) | $ | 70,803 | $ | 45,853 | $ | 13,833 | ||||
| Ratios to Average Net Assets (including interest expense) | ||||||||||
| Ratio of expenses to average net assets excluding fee waivers and reimbursements/recoupment of previously waived fees(f) | 2.22 | %(g) | 2.34 | % | 2.44 | %(g) | ||||
| Ratio of expenses to average net assets including fee waivers and reimbursements/recoupment of previously waived fees(f) | 2.22 | %(g) | 2.35 | % | 2.39 | %(g) | ||||
| Ratio of net investment income to average net assets(f)(h) | 1.32 | %(g) | 1.19 | % | 1.05 | %(g) | ||||
| Ratios to Average Net Assets (excluding interest expense) | ||||||||||
| Ratio of expenses to average net assets excluding fee waivers and reimbursements/recoupment of previously waived fees(f) | 2.16 | %(g) | 2.16 | % | 2.21 | %(g) | ||||
| Ratio of expenses to average net assets including fee waivers and reimbursements/recoupment of previously waived fees(f) | 2.16 | %(g) | 2.16 | % | 2.16 | %(g) | ||||
| Ratio of net investment income to average net assets excluding fee waivers and reimbursements(f)(h) | 1.26 | %(g) | 1.39 | % | 1.23 | %(g) | ||||
| Portfolio turnover rate(i) | 11 | % | 15 | % | 11 | % | ||||
| (a) | The Fund’s Class L shares commenced operations on April 25, 2017. |
| (b) | Calculated using the average shares method. |
| (c) | Total distributions during a calendar year generally will be made from the Fund’s net investment income, net realized gains on investments and net unrealized gains on investments, if any. The portion of distributions paid not attributable to net investment income or net realized gains on investments, if any, is distributed from the Fund’s assets and is treated by shareholders as a nontaxable distribution (“Return of Capital”) for tax purposes. Return of capital is a tax concept, not an economic concept. The tax character of the Fund’s distributions, in isolation, does not reveal much information about whether the distributions are supported by the Fund’s returns. Reported distributions from net investment income and realized gains on investments are not an indication as to whether or not the Fund’s distributions are supported by the Fund’s returns. The Fund can have distributions from net investment income and realized capital gains in years in which it incurs an economic loss due to unrealized losses not being recognized for tax purposes. A common method in which to determine if the Fund’s distributions are supported by economic returns is to examine the Fund’s Net Asset Value (“NAV”) over the course of a year. If the Fund’s NAV has increased, the Fund will have economically earned more than it has distributed, regardless of whether such distributions are reported as being from net investment income, net realized gains on investments or return of capital. If the Fund’s NAV decreases, the Fund will have distributed more than it has economically earned or it will have incurred an economic loss. |
See Notes to Financial Statements.
| Semi-Annual Report | March 31, 2019 | 35 |
| Griffin Institutional Access Real Estate Fund – Class L | Financial Highlights |
For a Share Outstanding Throughout the Periods Presented
| (d) | The Fund has substantial investments in real estate investment trusts, or REITs, which are generally not subject to federal income taxes. Distributions that the Fund receives from REITs can be classified as ordinary income, capital gain income or return of capital by the REITs that make these distributions to the Fund. However, it is not possible for the Fund to accurately characterize distributions received from REITs during interim periods because the REIT issuers do not report their tax characterizations until after year end. The Fund has estimated the character of distributions for the six-month period ended March 31, 2019 based on the percentage of such distributions attributable to net investment income, net realized gains and return of capital for the fiscal year ended September 30, 2018. Final characterization of the Fund’s 2019 distributions to its common shareholders is also dependent upon the size or timing of the Fund’s securities transactions prior to year-end. Therefore, it is likely that some portion of the Fund’s 2019 investment income and distributions to its common shareholders will be recharacterized as long term capital gain and return of capital for financial statement and U.S. federal income tax purposes subsequent to year end and reflected accordingly in the Fund’s year-end financial statements. |
| (e) | Total returns are for the period indicated and have not been annualized and do not reflect the impact of sales charge. Total returns would have been lower had certain expenses not been waived during the period. Returns shown do not reflect the deduction of taxes that a shareholder would pay on Fund distributions or the redemption of Fund shares. |
| (f) | The ratios of expenses to average net assets and net investment income to average net assets do not reflect the expenses of the underlying private real estate funds in which the Fund invests which typically range from 0.80% to 1.00% on an annual basis. However, the Fund invests in each underlying private real estate investment fund based upon the net asset value of each such fund which reflects the costs of investing in the applicable fund, including the management fee of the underlying fund and other operating expenses. The net asset value of each underlying private real estate investment fund is incorporated into the ratios described above. |
| (g) | Annualized. |
| (h) | Recognition of net investment income is affected by the timing and declaration of dividends by the underlying investment companies in which the Fund invests. |
| (i) | Portfolio turnover rate for periods less than one full year has not been annualized and is calculated at the Fund level. |
See Notes to Financial Statements.
| 36 | 1.888.926.2688 | www.griffincapital.com |
| Griffin Institutional Access Real Estate Fund | Notes to Financial Statements |
March 31, 2019 (Unaudited)
1. ORGANIZATION
Griffin Institutional Access Real Estate Fund (the “Fund”) is registered under the Investment Company Act of 1940, as amended (the “1940 Act”), as a non-diversified, closed-end management investment company. The Fund engages in a continuous offering of shares and operates as an interval fund that offers quarterly repurchases of shares at net asset value. The Fund’s investment adviser is Griffin Capital Advisor, LLC (the “Adviser”). The investment objective of the Fund is to generate a return comprised of both current income and capital appreciation with moderate volatility and low correlation to the broader markets. The Fund pursues its investment objective by strategically investing across private institutional real estate investment funds as well as a diversified set of public real estate securities.
The Fund was organized as a statutory trust on November 5, 2013, under the laws of the State of Delaware. The Fund commenced operations on June 30, 2014, and is authorized to issue an unlimited number of shares with no par value.
The Fund currently offers Class A, Class C, Class I, Class M and Class L shares. Class A shares commenced operations on June 30, 2014, Class C and Class I shares commenced operations on August 10, 2015, Class M shares commenced operations on November 17, 2016 and Class L shares commenced operations on April 25, 2017. The sales load payable by each investor depends on the amount invested, and the class of shares invested into, by such investor in the Fund. Class A and Class L shares are offered subject to a maximum sales charge of 5.75% and 4.25%, respectively, of their offering price. Class C, Class I and Class M shares are offered at net asset value. Class C shares may be subject to a 1.00% contingent deferred sales charge on shares redeemed during the first 365 days after their purchase. Each class represents an interest in the same assets of the Fund and classes are identical except for differences in their sales charge structures and ongoing service and distribution charges. All classes of shares have equal voting privileges except that each class has exclusive voting rights with respect to its service and/or distribution plans. The Fund's income, expenses (other than class specific distribution fees) and realized and unrealized gains and losses are allocated proportionately each day based upon the relative net assets of each class.
2. SIGNIFICANT ACCOUNTING POLICIES
The following is a summary of significant accounting policies followed by the Fund in preparation of its financial statements in conformity with accounting principles generally accepted in the United States of America (“U.S. GAAP”). The Fund is considered an investment company following accounting and reporting guidance inAccounting Standards Codification (“ASC”) Topic 946 – Financial Services – Investment Companies. The preparation of financial statements requires management to make estimates and assumptions that affect the reported amounts of assets and liabilities and disclosure of contingent assets and liabilities at the date of the financial statements and the reported amounts of income and expenses for the period. Actual results could differ from those estimates.
Security Valuation – Portfolio securities of the Fund are valued at their current market values determined on the basis of readily available market quotations. Market quotations are obtained from independent pricing services approved by the Board of Trustees (the “Trustees”). If market quotations are not readily available, or if the available quotations are not believed to be reflective of market value, securities are valued at fair value in good faith pursuant to the procedures adopted by the Trustees. The Trustees have delegated the day to day responsibility for determining fair valuation to the Fair Value Pricing Committee in accordance with the valuation policy approved by the Trustees. Fair valuation procedures may be applied when, for example, (1) a portfolio security is not traded in a public market or the principal market in which the security trades is closed, (2) trading in a portfolio security is suspended and not resumed prior to the normal market close, (3) a portfolio security is not traded in significant volume for a substantial period, or (4) the Adviser determines that the quotation or price for a portfolio security provided by a broker-dealer or independent pricing service is unreliable. There is no single standard for determining fair value of a security. Likewise, there can be no assurance that the Fund will be able to purchase or sell a portfolio security at the fair value price used to calculate the Fund’s NAV.
Valuation of Private REITs – The Fund’s private real estate allocation generally includes open-end private investment funds that elect to be treated as real estate investment trusts (“REIT”). Further, the Fund’s private real estate allocation consists of private funds investing in real estate assets (“Private Equity REITs”) and private funds investing in debt instruments secured or otherwise supported by real estate assets (“Private Debt REITs” and together with Private Equity REITs, the “Private REITs”). The sponsors of each respective Private REIT measure their investment assets at fair value and report a NAV per share on a calendar quarter basis. For non-calendar quarter-end days, the fair value of each Private Equity REIT is estimated by adjusting the most recent sponsor issued NAV for each Private Equity REIT by the change in a proprietary index that the Trustees have deemed to be representative of the entire Private Equity REIT market. The NAVs issued by the sponsors of each respective Private Equity REIT are reflected in the Fund’s NAV on a quarterly basis. With regard to the Private Debt REITs, the Adviser will accrue income on a daily basis and will update the NAVs, generally on a quarterly basis, utilizing the NAVs issued by the sponsors of each respective Private Debt REIT. In the event that a NAV is not provided by a Private REIT following the end of the quarter or if the Adviser becomes aware of developments warranting an update to a Private REIT valuation, the Fund’s fair valuation procedures will be followed. In accordance with Accounting Standards Codification (“ASC”) 820, the Fund has elected to apply the practical expedient and to value its investments in Private REITs at their respective NAVs each quarter. As of March 31, 2019, all of the Fund’s investments in Private REITs were valued at their respective sponsored issued NAVs.
| Semi-Annual Report | March 31, 2019 | 37 |
| Griffin Institutional Access Real Estate Fund | Notes to Financial Statements |
March 31, 2019 (Unaudited)
Fair Value Measurements – A three-tier hierarchy has been established to classify fair value measurements for disclosure purposes. Inputs refer broadly to the assumptions that market participants would use in pricing the asset or liability, including assumptions about risk. Inputs may be observable or unobservable. Observable inputs are inputs that reflect the assumptions market participants would use in pricing the asset or liability that are developed based on market data obtained from sources independent of the reporting entity. Unobservable inputs are inputs that reflect the reporting entity’s own assumptions about the assumptions market participants would use in pricing the asset or liability that are developed based on the best information available. In accordance with the authoritative guidance on fair value measurements and disclosure under U.S. GAAP, the Fund discloses fair value of its investments in a hierarchy that prioritizes the inputs to valuation techniques used to measure the fair value:
| Level 1 – | Unadjusted quoted prices in active markets for identical, unrestricted assets or liabilities that the Fund has the ability to access at the measurement date; |
| Level 2 – | Quoted prices which are not active, quoted prices for similar assets or liabilities in active markets or inputs other than quoted prices that are observable (either directly or indirectly) for substantially the full term of the asset or liability at the measurement date; and |
| Level 3 – | Significant unobservable prices or inputs (including the Fund’s own assumptions in determining the fair value of investments) where there is little or no market activity for the asset or liability at the measurement date. |
The availability of observable inputs can vary from security to security and is affected by a wide variety of factors, including, for example, the type of security, whether the security is new and not yet established in the marketplace, the liquidity of markets and other characteristics particular to the security. To the extent that valuation is based on models or inputs that are less observable or unobservable in the market, the determination of fair value requires more judgment. Accordingly, the degree of judgment exercised in determining fair value is greatest for instruments categorized in Level 3.
An investment level within the fair value hierarchy is based on the lowest level input, individually or in the aggregate, that is significant to fair value measurement. The inputs or methodologies used for valuing securities are not necessarily an indication of the risk or liquidity associated with investing in those securities. The valuation techniques used by the Fund to measure fair value during the six months ended March 31, 2019 maximized the use of observable inputs and minimized the use of unobservable inputs. For the six months ended March 31, 2019, the Fund did not use unobservable inputs (Level 3) when determining fair value. The following is a summary of the fair valuations according to the inputs used in valuing the Fund’s investments as of March 31, 2019:
| Investments in Securities at Value | Level 1 - Quoted Prices | Level 2 - Other Significant Observable Inputs | Level 3 - Significant Unobservable Inputs | Total | ||||||||||||
| Real Estate Investment Trusts | ||||||||||||||||
| Private Investment Funds (Measured at net asset value)(a) | $ | – | $ | – | $ | – | $ | 2,246,013,822 | ||||||||
| Publicly Traded Securities | 500,246,693 | – | – | 500,246,693 | ||||||||||||
| Preferred Stocks | 50,979,102 | – | – | 50,979,102 | ||||||||||||
| Total | $ | 551,225,795 | $ | – | $ | – | $ | 2,797,239,617 | ||||||||
| (a) | In accordance with Subtopic 820-10, certain investments that are measured at fair value using the net asset value per share (or its equivalent) practical expedient have not been classified in the fair value hierarchy. The fair value amounts presented in this table are intended to permit reconciliation of the fair value hierarchy to the amounts presented in the Statement of Assets and Liabilities. |
There were no transfers out of or into level 3 during the six months ended March 31, 2019. It is the Fund’s policy to recognize transfers between levels at the end of the reporting period.
Investment Transactions – Investment security transactions are accounted for on trade date. Gains and losses on securities sold are determined on a specific identification basis.
Investment Income – Interest income is accrued and recorded on a daily basis including amortization of premiums, accretion of discounts and income earned from money market funds. Interest is not accrued on securities that are in default. Dividend income is recorded on the ex-dividend date.
| 38 | 1.888.926.2688 | www.griffincapital.com |
| Griffin Institutional Access Real Estate Fund | Notes to Financial Statements |
March 31, 2019 (Unaudited)
Distributions to Shareholders – Distributions from net investment income, if any, will be declared and paid quarterly. Distributions of net realized capital gains, if any, will be declared and paid annually. Income and capital gains distributions are determined in accordance with income tax regulations, which may differ from U.S. GAAP. Distributions to shareholders are recorded on the ex-dividend date.
Distributions from Underlying REITS – Distributions made to the Fund by the underlying REITs in which the Fund invests may take several forms. Specifically, such distributions may be in the form of dividends, capital gains, and/or a return of capital.
Unfunded Commitments – Typically, when the Fund invests in a Private REIT, the Fund makes a commitment to invest a specified amount of capital in the applicable Private REIT. The capital commitment may be drawn by the general partner of the Private REIT either all at once or through a series of capital calls at the discretion of the general partner. Thus, an Unfunded Commitment represents the portion of the Fund’s overall capital commitment to a particular Private REIT that has not yet been called by the general partner of the Private REIT. Unfunded Commitments may subject the Fund to certain risks. For example, the Fund may be required to: liquidate other portfolio investments, potentially at inopportune times, in order to obtain the cash needed to satisfy its obligations with respect to a capital call; borrow under a credit facility which may result in additional expenses to the Fund; or, to the extent a buyer can be identified and subject to the provisions of the limited partnership agreement of the relevant Private REIT, seek to sell/assign the interest subject to the capital call to a third party thereby eliminating the obligation. In addition, should the Fund be unable to satisfy its commitment obligation on a timely basis and default on a called capital commitment, the underlying Private REIT, pursuant to its limited partnership agreement, typically has a number of potential remedies, including, by way of illustration, a reallocation of the Fund's defaulted commitment amount to other limited partners, a reallocation of a portion of the Fund's existing interest to the other limited partners as a penalty for the default, or the general partner of underlying Private REIT could sue the Fund for breach of contract. As of March 31, 2019, the Fund had total Unfunded Commitments in the amount of $277,804,442.
Real Estate Industry Concentration Risk – Because the Fund will concentrate its investments in real estate securities, its portfolio will be significantly impacted by the performance of the real estate market and may experience more volatility and be exposed to greater risk than a more diversified portfolio. Significant investments in the securities of issuers within the real estate industry and any development affecting the real estate industry will have a greater impact on the value of the net assets of the Fund than would be the case if the Fund did not have significant investments in the real estate industry. The Fund’s investment in real estate equity or debt may be subject to risks similar to those associated with direct investment in real property. The value of the Fund’s shares will be affected by factors affecting the value of real estate and the earnings of companies engaged in the real estate industry. These factors include, among others: (i) changes in general economic and market conditions; (ii) changes in the value of real estate properties; (iii) risks related to local economic conditions, overbuilding and increased competition; (iv) increases in property taxes and operating expenses; (v) changes in zoning laws; (vi) casualty and condemnation losses; (vii) variations in rental income, neighborhood values or the appeal of property to tenants; (viii) the availability of financing and (ix) changes in interest rates. Many real estate companies utilize leverage, which increases investment risk and could adversely affect a company’s operations and market value in periods of rising interest rates. The value of securities of companies in the real estate industry may go through cycles of relative under-performance and outperformance in comparison to equity securities markets in general. As of March 31, 2019, the Fund had 88.54% of the value of its net assets invested within the real estate industry.
Preferred Securities Risk – There are various risks associated with investing in preferred securities, including credit risk, interest rate risk, deferral and omission of distributions, subordination to bonds and other debt securities in a company’s capital structure, limited liquidity, limited voting rights and special redemption rights. Interest rate risk is, in general, the risk that the price of a debt security falls when interest rates rise. Securities with longer maturities tend to be more sensitive to interest rate changes. Credit risk is the risk that an issuer of a security may not be able to make principal and interest or dividend payments on the security as they become due. Holders of preferred securities may not receive dividends, or the payment can be deferred for some period of time. In bankruptcy, creditors are generally paid before the holders of preferred securities.
Concentration of Credit Risk – The Fund places its cash with one banking institution, which is insured by the Federal Deposit Insurance Corporation (“FDIC”). The FDIC limit is $250,000. At various times throughout the year, the amount on deposit may exceed the FDIC limit and subject the Fund to a credit risk. The Fund does not believe that such deposits are subject to any unusual risk associated with investment activities.
Indemnification – The Fund indemnifies its Officers and Trustees for certain liabilities that may arise from the performance of their duties to the Fund. Additionally, in the normal course of business, the Fund enters into contracts that contain a variety of representations and warranties and which provide general indemnities. The Fund’s maximum exposure under these arrangements is unknown, as this would involve future claims that may be made against the Fund that have not yet occurred. However, based on industry experience, the Fund expects the risk of loss due to these warranties and indemnities to be remote.
| Semi-Annual Report | March 31, 2019 | 39 |
| Griffin Institutional Access Real Estate Fund | Notes to Financial Statements |
March 31, 2019 (Unaudited)
Federal Income Taxes – The Fund intends to continue to comply with the requirements of Subchapter M of the Internal Revenue Code applicable to regulated investment companies and will distribute all of its taxable income, if any, to shareholders. Accordingly, no provision for federal income taxes is required in the financial statements.
The Fund recognizes the tax benefits of uncertain tax positions only when the position is “more likely than not” to be sustained assuming examination by tax authorities. Management has reviewed the tax positions and has concluded that no liability for unrecognized tax benefits should be recorded related to uncertain tax positions taken in the Fund’s tax returns for open tax years or expected to be taken in the Fund’s 2019 returns.
3. ADVISORY FEES, ADMINISTRATION FEES AND OTHER AGREEMENTS
Investment Advisory
Pursuant to the Investment Advisory Agreement with the Fund (“Advisory Agreement”), the Adviser is entitled to an investment advisory fee, computed daily and payable monthly at an annual rate of 1.50% of the average daily net assets of the Fund.
The Adviser and the Fund have entered into an expense limitation and reimbursement agreement (the “Expense Limitation Agreement”) under which the Adviser has agreed contractually to waive its fees and to pay or absorb the ordinary annual operating expenses of the Fund (including organizational and offering expenses, but excluding taxes, interest, brokerage commissions, acquired fund fees and expenses and extraordinary expenses) so that the total annual operating expenses of the Fund do not exceed 1.91% per annum of Class A average daily net assets, 2.66% per annum of Class C average daily net assets, 1.66% per annum of Class I average daily net assets, 2.41% per annum of Class M average daily net assets and 2.16% per annum of Class L average daily net assets (the “Expense Limitations”). The Expense Limitation Agreement will be in effect until at least February 1, 2020 and can be extended at the discretion of the Adviser and the Trustees. In consideration of the Adviser’s agreement to limit the Fund’s expenses, the Fund has agreed to repay the Adviser in the amount of any fees waived and Fund expenses paid or absorbed, subject to the limitations that: (1) the reimbursement for fees and expenses will be made only if payable not more than three years from the date on which they were incurred; and (2) the reimbursement may not be made if it would cause the lesser of the Expense Limitations in place at the time of waiver or at the time of reimbursement to be exceeded.
During the six months ended March 31, 2019, the fees waived/reimbursed and recoupment of previously waived fees under the Expense Limitation Agreement were as follows:
Fees (Waived)/ Reimbursed By Advisor | Recoupment of Previously Waived Fees by Advisor | |||||||
| Griffin Institutional Access Real Estate Fund | $ | (13,652 | ) | $ | 121,824 | |||
As of March 31, 2019, the balance of recoupable expenses for the Fund was as follows:
| Fund | Expires September 30, 2019 | Expires September 30, 2020 | Expires September 30, 2021 | Expires September 30, 2022 | ||||||||||||
| Griffin Institutional Access Real Estate Fund | $ | 809,733 | $ | 986,733 | $ | 287,015 | $ | 13,652 | ||||||||
Sub-advisory services are provided to the Fund pursuant to agreements between the Adviser and both Aon Hewitt Investment Consulting, Inc. and CenterSquare Investment Management LLC. (the “Sub-Advisers”). Under the terms of the sub-advisory agreements, the Adviser compensates the Sub-Advisers based on a portion of the Fund’s average daily net assets which they have been allocated to manage.
Fund Administrator and Accounting Fees and Expenses
ALPS Fund Services, Inc. serves as the Fund’s administrator and accounting agent (the “Administrator”) and receives customary fees from the Fund for such services. The Administrator is also reimbursed by the Fund for certain out of pocket expenses.
Transfer Agent
DST Systems, Inc. serves as transfer, dividend paying and shareholder servicing agent for the Fund and receives customary fees from the Fund for such services.
Custodian
UMB Bank, n.a. serves as the Fund’s custodian and receives customary fees from the Fund for such services.
| 40 | 1.888.926.2688 | www.griffincapital.com |
| Griffin Institutional Access Real Estate Fund | Notes to Financial Statements |
March 31, 2019 (Unaudited)
Distributor
The Fund has entered into a Distribution Agreement with ALPS Distributors, Inc. (the “Distributor”) to provide distribution services to the Fund. The Distributor serves as principal underwriter of shares of the Fund. Under the Distribution Agreement the Fund’s Class C and Class M shares will pay to the Distributor a Distribution Fee that will accrue at an annual rate equal to 0.75% of the Fund’s average daily net assets attributable to Class C and Class M shares, payable on a monthly basis. Class L shares will pay to the Distributor a Distribution Fee that will accrue at an annual rate equal to 0.25% of the Fund’s average daily net assets attributable to Class L shares, payable on a monthly basis. For the six months ended March 31, 2019, Class C, Class M and Class L shares incurred distribution fees of $1,789,686, $1,749,560 and $69,540, respectively. Class A and Class I shares are not currently subject to a Distribution Fee. Under the Shareholder Services Plan, the Fund’s Class A, Class C and Class L shares may pay up to 0.25% per year of their average daily net assets for such services. Class I and Class M shares are not currently subject to a shareholder services fee. For the six months ended March 31, 2019, Class A, Class C and Class L shares incurred shareholder servicing fees of $893,368, $596,562 and $69,127, respectively.
The Distributor has entered into a wholesale marketing agreement with Griffin Capital Securities, LLC, a registered broker-dealer affiliate of the Adviser. Pursuant to the terms of the wholesale marketing agreement, Griffin Capital Securities, LLC will seek to market and otherwise promote the Fund through various wholesale distribution channels, including regional and independent retail broker-dealers and registered investment advisers.
Independent Registered Public Accounting Firm
BBD, LLP is the independent registered public accounting firm for the Fund.
Fund Counsel
Greenberg Traurig LLP acts as legal counsel to the Fund.
Compliance Services
Ryan Del Giudice of Griffin Capital Company, LLC serves as the Chief Compliance Officer to the Fund. Separately, Cipperman Compliance Services, LLC provides various compliance services to the Fund pursuant to a consulting agreement between Cipperman Compliance Services LLC and the Fund.
Officer and Trustee Compensation
For the period covered by this report, each Trustee who is not affiliated with the Trust or Adviser received an annual retainer of $50,000, paid quarterly, as well as reimbursement for any reasonable expenses incurred attending the meetings and $500 per non-interested Trustee for each special telephonic meeting (exclusive of one special telephonic meeting per year and any telephonic meeting to review the agenda of any upcoming meeting of the Board). The chairperson of the Audit Committee receives an additional annual retainer of $10,000. None of the Fund’s executive officers receive compensation from the Fund.
Certain Trustees and officers of the Fund are also officers of the Adviser and are not paid by the Fund for serving in such capacities.
4. PURCHASES AND SALES OF INVESTMENT SECURITIES
The cost of purchases and proceeds from the sale of securities, other than short-term securities, for the six months ended March 31, 2019 were as follows:
Purchases of Securities | Proceeds from Sales of Securities | |||||||
| Griffin Institutional Access Real Estate Fund | $ | 506,614,053 | $ | 298,314,730 | ||||
5. TAX BASIS INFORMATION
Distributions are determined in accordance with federal income tax regulations, which differ from U.S. GAAP, and, therefore, may differ significantly in amount or character from net investment income and realized gains for financial reporting purposes. Financial reporting records are adjusted for permanent book/tax differences to reflect tax character but are not adjusted for temporary differences.
The tax character of distributions paid for the year ended September 30, 2018 were as follows:
| Year | Ordinary Income | Long-Term Capital Gain | Return of Capital | |||||||||
| 2018 | – | 16,921,360 | 102,127,207 | |||||||||
| Semi-Annual Report | March 31, 2019 | 41 |
| Griffin Institutional Access Real Estate Fund | Notes to Financial Statements |
March 31, 2019 (Unaudited)
As of March 31, 2019, net unrealized appreciation of investments based on the federal tax cost was as follows:
Gross Appreciation (excess of value over tax cost) | Gross Depreciation (excess of tax cost over value) | Net Unrealized Appreciation/(Depreciation) | Cost of Investments for Income Tax Purposes | |||||||||||||
| Griffin Institutional Access Real Estate Fund | $ | 354,816,028 | $ | (11,770,772 | ) | $ | 343,045,256 | $ | 2,455,016,435 | |||||||
The difference between book basis and tax basis net unrealized appreciation is primarily attributable to the investments in partnerships, wash sales and certain other investments.
The Fund elects to defer to the year ending September 30, 2019, capital losses recognized during the period November 1, 2017 to September 30, 2018 in the amount of $1,098,825.
The Fund elects to defer to the year ending September 30, 2019, late year ordinary losses in the amount of $21,743,284.
6. LINE OF CREDIT
The Fund has entered into secured bank lines of credit through BNP Paribas Prime Brokerage International, Ltd. (“BNP”) and Credit Suisse First Boston Ltd. (“Credit Suisse”) (collectively the “Banks”) for the purpose of investment purchases subject to the limitations of the 1940 Act for borrowings.
Borrowings under the BNP arrangement bear interest at the 3 month LIBOR plus 95 basis points at the time of borrowing. During the six months ended March 31, 2019, the Fund incurred $122,085 of interest expense related to the BNP borrowings. Average borrowings and the average interest rate for the days the BNP line of credit was outstanding during the six months ended March 31, 2019 were $81,800,000 and 3.60%, respectively. The largest outstanding borrowing during the six months ended March 31, 2019 relating to BNP was $103,000,000. As of March 31, 2019, the Fund had no outstanding borrowings relating to BNP.
Borrowings under the Credit Suisse arrangement bear interest at the 3 month LIBOR plus 235 basis points at the time of borrowing. During the six months ended March 31, 2019, the Fund incurred $0 of interest expense related to the Credit Suisse borrowings. As of March 31, 2019, the unused amount under the Credit Suisse arrangement incurred a fee equal to 77.5 basis points. During the six months ended March 31, 2019, the Fund incurred total unused fees of $783,611 which are included in interest expense. Average borrowings and the average interest rate for the days the Credit Suisse line of credit was outstanding during the six months ended March 31, 2019 were $0 and 0%, respectively. The largest outstanding borrowing during the six months ended March 31, 2019 relating to Credit Suisse was $0. As of March 31, 2019, the Fund had no outstanding borrowings and $200,000,000 unused outstanding relating to Credit Suisse.
As collateral for the lines of credit, the Fund grants the Banks a first position security interest in and lien on securities of any kind or description held by the Fund in the collateral accounts. As of March 31, 2019, the Fund had $2,658,865,614 of the private and public securities pledged as collateral for its lines of credit.
7. REPURCHASE OFFERS
The Fund is an interval fund and, as such, has adopted a fundamental policy to make quarterly repurchase offers, at net asset value, of no less than 5% of the Fund’s shares outstanding. There is no guarantee that shareholders will be able to sell all of the shares they desire to sell in a quarterly repurchase offer, although each shareholder will have the right to require the Fund to purchase at least 5% of such shareholder’s shares in each quarterly repurchase. Liquidity will be provided to shareholders only through the Fund’s quarterly repurchases. Shareholders will be notified in writing of each quarterly repurchase offer and the date the repurchase offer ends (the “Repurchase Request Deadline”). Shares will be repurchased at the NAV per share determined as of the close of regular trading on the NYSE no later than the 14th day after the Repurchase Request Deadline, or the next business day if the 14th day is not a business day (each a “Repurchase Pricing Date”).
| 42 | 1.888.926.2688 | www.griffincapital.com |
| Griffin Institutional Access Real Estate Fund | Notes to Financial Statements |
March 31, 2019 (Unaudited)
During the six months ended March 31, 2019, the Fund completed two quarterly repurchase offers. In these offers, the Fund offered to repurchase up to 5% of the number of its outstanding shares as of the Repurchase Pricing Dates. No repurchase offer was oversubscribed. The result of those repurchase offers were as follows:
| Repurchase Offer #1 | Repurchase Offer #2 | |
| Commencement Date | September 28, 2018 | December 28, 2018 |
| Repurchase Request Deadline | November 6, 2018 | February 6, 2019 |
| Repurchase Pricing Date | November 6, 2018 | February 6, 2019 |
| Amount Repurchased | $73,811,767 | $93,230,487 |
| Shares Repurchased | 2,742,643 | 3,422,082 |
8. SUBSEQUENT EVENTS
Subsequent events after the date of the Statement of Assets and Liabilities have been evaluated through the date the financial statements were issued.
The Fund completed a quarterly repurchase offer on May 7, 2019 which resulted in 3,297,304 shares being repurchased for $89,857,817.
Management has determined that there were no other subsequent events to report through the issuance of these financial statements.
| Semi-Annual Report | March 31, 2019 | 43 |
| Griffin Institutional Access Real Estate Fund | Additional Information |
March 31, 2019 (Unaudited)
1. PROXY VOTING POLICIES AND VOTING RECORD
A description of the policies and procedures that the Fund uses to vote proxies relating to its portfolio securities is available without charge upon request by calling toll-free 888-926-2688, or on the Securities and Exchange Commission’s (“SEC”) website at http://www.sec.gov. Information regarding how the Fund voted proxies relating to underlying portfolio securities during the most recent 12-month period ended June 30th is available without charge upon request by calling toll-free 888-926-2688, or on the SEC’s website at http://www.sec.gov.
2. QUARTERLY PORTFOLIO HOLDINGS
The Fund files a complete listing of portfolio holdings for the Fund with the SEC as of the first and third quarters of each fiscal year on Form N-Q. The filings are available upon request by calling 888-926-2688. Furthermore, you may obtain a copy of the filing on the SEC’s website at http://www.sec.gov. The Fund’s Form N-Q may also be reviewed and copied at the SEC’s Public Reference Room in Washington, D.C., and information on the operation of the Public Reference Room may be obtained by calling 1-800-SEC-0330.
| 44 | 1.888.926.2688 | www.griffincapital.com |
| Griffin Institutional Access Real Estate Fund | Privacy Notice |
March 31, 2019 (Unaudited)
Your privacy is important to the Fund. The Fund is committed to maintaining the confidentiality, integrity, and security of your personal information. When you provide personal information, the Fund believes that you should be aware of policies to protect the confidentiality of that information.
The Fund collects the following nonpublic personal information about you:
| ● | Information we receive from you on or in applications or other forms, correspondence, or conversations, including, but not limited to, your name, address, phone number, social security number, assets, income, and date of birth; and |
| ● | Information about your transactions with us, our affiliates, or others, including, but not limited to, your account number and balance, payments history, parties to transactions, cost basis information, and other financial information. |
The Fund does not disclose any nonpublic personal information about our current or former shareholders to affiliated or nonaffiliated third parties, except as permitted by law. For example, the Fund is permitted by law to disclose all of the information we collect, as described above, to our Transfer Agent to process your transactions. Furthermore, the Fund restricts access to your nonpublic personal information to those persons who require such information to provide products or services to you. The Fund maintains physical, electronic, and procedural safeguards that comply with applicable federal and state standards to guard your nonpublic personal information.
In the event that you hold shares of the Fund through a financial intermediary, including, but not limited to, a broker-dealer, bank, or trust company, the privacy policy of your financial intermediary would govern how your nonpublic personal information would be shared with affiliated or non-affiliated third parties.
| Semi-Annual Report | March 31, 2019 | 45 |

Item 2. Code of Ethics.
Not applicable.
Item 3. Audit Committee Financial Expert.
Not applicable.
Item 4. Principal Accountant Fees and Services.
Not applicable.
Item 5. Audit Committee of Listed Registrants.
Not applicable to the registrant.
Item 6. Investments.
| (a) | The Schedule of Investments is included as part of the Report to Stockholders filed under Item 1 of this report. |
| (b) | Not applicable to the registrant. |
Item 7. Disclosure of Proxy Voting Policies and Procedures for Closed-End Management Investment Companies.
Not applicable.
Item 8. Portfolio Managers of Closed-End Management Investment Companies.
| (a) | Not applicable. |
| (b) | Not applicable. |
Item 9. Purchases of Equity Securities by Closed-End Management Investment Company and Affiliated Purchasers.
None.
Item 10. Submission of Matters to a Vote of Security Holders.
No changes have occurred.
Item 11. Controls and Procedures.
| (a) | Based on an evaluation of the registrant’s disclosure controls and procedures (as defined in Rule 30a-3(c) under the 1940 Act), the registrant’s principal executive officer and principal financial officer have concluded that the registrant’s disclosure controls and procedures are effective as of a date within 90 days of the filing date of this report. |
| (b) | There were no significant changes in the registrant’s internal control over financial reporting that occurred during the registrant’s last fiscal half-year that have materially affected, or are reasonably likely to materially affect, the registrant’s internal control over financial reporting. |
Item 12. Disclosure of Securities Lending Activities for Closed-End Management Investment Companies.
None.
Item 13. Exhibits.
| (a)(1) | Not applicable. |
| (a)(2) | Certifications required by Item 13(a)(2) of Form N-CSR are filed herewith as Exhibit 99.CERT. |
| (b) | Certifications required by Item 13(b) of Form N-CSR are filed herewith as Exhibit 99.906CERT. |
SIGNATURES
Pursuant to the requirements of the Securities Exchange Act of 1934 and the Investment Company Act of 1940, the registrant has duly caused this report to be signed on its behalf by the undersigned, thereunto duly authorized.
GRIFFIN INSTITUTIONAL ACCESS REAL ESTATE FUND
| By: | /s/ Kevin Shields | |
| Kevin Shields | ||
| President (Principal Executive Officer) | ||
| Date: | June 6, 2019 |
Pursuant to the requirements of the Securities Exchange Act of 1934 and the Investment Company Act of 1940, this report has been signed below by the following persons on behalf of the registrant and in the capacities and on the dates indicated.
By (Signature and Title)
| By: | /s/ Kevin Shields | |
| Kevin Shields | ||
| President (Principal Executive Officer) | ||
| Date: | June 6, 2019 |
By (Signature and Title)
| By: | /s/ Joseph Miller | |
| Joseph Miller | ||
| Treasurer (Principal Financial Officer) | ||
| Date: | June 6, 2019 |