UNITED STATES
SECURITIES AND EXCHANGE COMMISSION
WASHINGTON, D.C. 20549
FORM N-CSR
CERTIFIED SHAREHOLDER REPORT OF REGISTERED
MANAGEMENT INVESTMENT COMPANIES
811-22933
(Investment Company Act file number)
Griffin Institutional Access Real Estate Fund
(Exact name of registrant as specified in charter)
Griffin Capital Plaza
1520 E. Grand Avenue
El Segundo, CA 90245
(Address of principal executive offices)
(310) 469.6100
(Registrant’s telephone number, including area code)
ALPS Fund Services, Inc.
1290 Broadway, Suite 1000
Denver, CO 80203
(Name and address of agent for service)
Copy to:
Terrence O. Davis, Esq.
Greenberg Traurig, LLP
Terminus 200
3333 Piedmont Road, NE, Suite 2500
Atlanta, GA 30305
Date of fiscal year end: September 30
Date of reporting period: October 1, 2019 –March 31, 2020
Item 1. Reports to Stockholders.

ELECTRONIC REPORTS DISCLOSURE
Beginning on January 1, 2021, as permitted by regulations adopted by the Securities and Exchange Commission, paper copies of the Fund shareholder reports will no longer be sent by mail, unless you specifically request paper copies of the reports from the Fund or from your financial intermediary (such as a broker-dealer or bank). Instead, the reports will be made available on the Fund’s website (www.griffincapital.com), and you will be notified by mail each time a report is posted and provided with a website link to access the report. You may elect to receive all future reports in paper free of charge. If you invest through a financial intermediary, you can contact your financial intermediary to request that you continue to receive paper copies of your shareholder reports. If you invest directly with the Fund, you can call the Fund toll-free at 1-888-926-2688 or submit a signed letter of instruction requesting paper reports to Griffin Institutional Access Real Estate Fund, c/o DST Systems, Inc., 430 W 7th St, Kansas City, MO 64105-1407. Your election to receive reports in paper will apply to all funds held in your account if you invest through your financial intermediary or all funds held with the fund complex if you invest directly with a fund. If you already elected to receive shareholder reports electronically, you will not be affected by this change and you need not take any action. You may elect to receive shareholder reports and other communications from the Fund electronically anytime by contacting your financial intermediary or, if you invest directly with the Fund, by enrolling at www.griffincapital.com.
Table of Contents
| Shareholder Letter | 2 |
| Portfolio Update | 14 |
| Schedule of Investments | 16 |
| Statement of Assets and Liabilities | 21 |
| Statement of Operations | 22 |
| Statements of Changes in Net Assets | 23 |
| Statement of Cash Flows | 25 |
| Financial Highlights | 26 |
| Notes to Financial Statements | 36 |
| Additional Information | 44 |
| Service Providers | 45 |
| Privacy Notice | 46 |
Dear Fellow Shareholders,
We are pleased to present the Griffin Institutional Access® Real Estate Fund (the “Fund”) semi-annual report. We greatly appreciate the support of our shareholders, and we will remain true to the Fund’s stated objective of delivering returns comprised of income and appreciation with moderate volatility and low correlation to the broader markets. From the Fund’s inception on June 30, 2014 through March 31, 2020, the Fund’s load-waived Class A shares (NASDAQ: GIREX) generated a(n):
| ● | Total cumulative return of 37.61% and a 5.71% annualized return1 |
| ● | Sharpe ratio of 1.501 |
| ● | Standard deviation of 3.13%, which is more than four times less than that of the S&P 500 (13.21%)1 |
| ● | Alpha of 3.61%1, 2 |
| ● | Beta of 0.151, 2 |
Moving into 2020, there were no early warning indicators that could have predicted the COVID-19 (coronavirus) global pandemic and a conflict between major oil producers happening almost simultaneously, which has disrupted global economic activity. In fact, not only were there no early warning indicators, many market participants were predicting an uptick in economic growth for 2020.
We, on the other hand, have been speaking at length in many forums about slowing gross domestic product (GDP) growth, the overall level of fragility within broader markets, and the need to diversify. For this reason, we adopted a defensive market bias and began to systematically reduce the Fund’s overall portfolio risk. Our proverbial foot was already “off the gas and feathering the brake pedal” well ahead of these recent events.
The Fund, while certainly impacted by the current crisis, has held up well relative to the broader markets. Moreover, it is important to note that this period, like all periods of market dislocation, creates tremendous buying opportunities for securities that are trading at substantial discounts. We believe the Fund is positioned to take full advantage of these opportunities. By way of example, publicly traded real estate investment trusts (REITs) have sold off considerably since the middle of February when the broad equity market saw increased volatility stemming from COVID-19, and we observe that they are now trading at considerable discounts to net asset value (NAV). Additionally, securitized debt, namely commercial mortgage backed securities (CMBS), have seen significant spread widening. In fact, we have not seen spreads at these levels in BBB CMBS since 2017.
In the latter half of 2019 and heading into 2020, we actively positioned the Fund’s portfolio to handle more volatile market conditions in an effort to manage risk and seek opportunities that we believe provide asymmetric upside potential. We reduced beta to broader markets by lowering the Fund’s exposure to both public and private equity relative to the Fund’s historical average exposure while increasing the Fund’s exposure to real estate debt securities within both public and private markets. Private real estate debt securities have been a contributor to the Fund’s performance since 2017.
Past performance is no guarantee of future results. All metrics are based on load-waived Class A shares and do not reflect any sales charge. The maximum sales charge for Class A shares is 5.75%.If the data reflected the deduction of such charges, the performance would be lower. The Fund offers five share classes: GIREX - Class A, GCREX - Class C, GRIFX - Class I, GLREX - Class L, and GMREX - Class M. For more information on the differences in share classes, refer to the applicable prospectus, which can be found at: www.griffincapital.com.
2
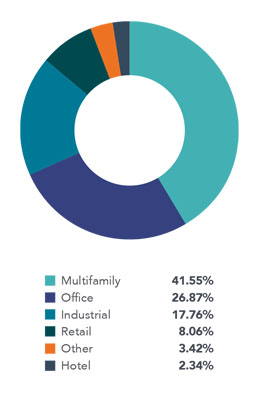
Additionally, we have decreased the Fund’s exposure to cyclical sectors. Within the private portion of the Fund’s portfolio, we have reduced exposure to more GDP-driven sectors, such as office and retail, in favor of multifamily. Multifamily assets have historically proven to be more resilient during periods of slow or negative economic growth. Further, as of the date of this letter, the Fund has no outstanding borrowings related to its credit facilities. Given added levels of uncertainty within markets, the portfolio management team does not believe that the risks associated with the use of constant leverage directly by the Fund are balanced. We have also maintained a substantial position in liquid securities within the Fund’s portfolio, which provides us the necessary dry powder to act on market opportunities as they present themselves.
Moving forward, we will continue to monitor the growth and severity of the coronavirus as well as changes in macroeconomic conditions and their impacts on the market. The entire portfolio management team, along with our team of sub-advisers, is working around the clock, actively managing the Fund’s portfolio construction as new information is revealed and adapting our risk management protocols to meet changes in macroeconomic conditions in an effort to position the Fund appropriately. Information, both on the economic and real estate front, is critical to good decision making. We are also meeting daily with managers of the Fund’s various underlying holdings at some of the largest and most prestigious asset management firms across the globe. These meetings provide real-time data with regard to leasing velocity, potential supply chain disruptions and retail sales data.
Several quarters ago, we wrote about the need to diversify and manage risk as we approached the mature phase of the economic cycle. During periods of volatility, we are quickly reminded of the benefits that come from the inclusion of alternative investments within a mixed asset portfolio. Our goal is to provide stability, or “ballast amidst heavy seas.” To that end, the Fund’s equity beta to the S&P 500 year-to-date through March 31, 2020 was only 0.14.1,2 We believe active management across the Fund’s public and private securities, sectors and underlying managers enabled the Fund to produce favorable results and provide a highly differentiated return profile during the most recent market sell-off. Moving forward, we expect to see substantial opportunities to generate attractive, risk-adjusted returns which will allow us to thoughtfully add risk exposure when appropriate.
Moreover, we will remain vigilant in preserving shareholder capital.
We hope that you and your families are safe and healthy throughout these challenging times and appreciate your continued confidence and support.
Sincerely,

Randy I. Anderson, Ph.D., CRE
President, Griffin Capital Asset Management Company, LLC
Portfolio Manager and Founding Partner, Griffin Institutional Access Real Estate Fund
Griffin Institutional Access Real Estate Fund is a closed-end interval fund. Limited liquidity is provided to shareholders only through the Fund’s quarterly repurchase offers for no less than 5% and no more than 25% of the Fund’s shares outstanding at net asset value. The Fund is suitable only for investors who can bear the risks associated with the limited liquidity of the Fund and should be viewed as a long-term investment. There is no secondary market for the Fund’s shares and none is expected to develop.
Diversification does not eliminate the risk of experiencing investment losses.
3
PRIVATE FUND DIVERSIFICATION AS OF APRIL 1, 2020 (UNAUDITED)
The Fund’s investment objective is to generate a return comprised of both current income and capital appreciation with moderate volatility and low correlation to the broader markets. To achieve this goal the Fund diversifies its holdings by property type, geography and fund manager.
| Overall Portfolio Exposure | Sector Diversification9 |
 |
|
Geographic Diversification9
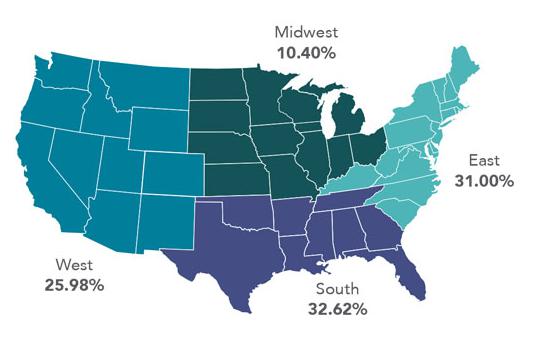
Allocation, Sector, Geographic Diversification, and holdings are subject to change. Diversification does not eliminate the risk of experiencing investment losses.
4
PRIVATE REAL ESTATE EXPOSURE AS OF APRIL 1, 2020 (UNAUDITED) 3, 9
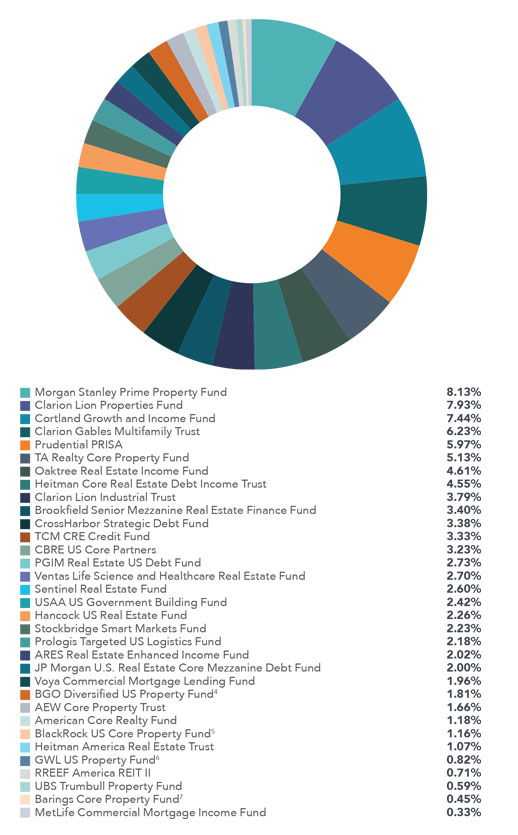
Holdings are subject to change without notice. Diversification does not eliminate the risk of experiencing investment losses.
5
PRIVATE FUND SUMMARIES (UNAUDITED)3
 | AEW Core Property Trustis an open-end core fund that seeks to invest in high quality assets located in top-tier markets with a heavy emphasis on income, liquidity and strong long-term fundamentals. AEW Core Property Trust uses a research-based approach to target markets with high barriers to entry – physical, governmental, or economic – in addition to population and job growth potential. | |
 | American Core Realty Fundis a diversified open-end commingled fund that invests primarily in high quality core income-producing office, industrial, retail, and multifamily properties. The American Core Realty Fund focuses its investment activity throughout the United States in major metropolitan markets that are innovation hubs containing high concentrations of our nation’s globally competitive industries and that benefit from highly educated/professional human capital. | |
 | ARES Real Estate Enhanced Income Fund’sprincipal objective is to generate current income with an emphasis on principal protection by creating a diversified portfolio of first mortgage loans secured by commercial real estate across major property types, which primarily includes multifamily, industrial, retail, office and hospitality properties. The ARES Real Estate Enhanced Income Fund will focus on the disciplined origination of first mortgage loans secured by commercial real estate assets with strong sponsorship and located in major markets within the United States. | |
 | Barings Core Property Fund7 is a U.S. open-end, diversified core fund that focuses on the four traditional property types and hotels. The Barings Core Property Fund is managed with an emphasis on research, targeting “barrier” markets, which are perceived to reduce the risk of oversupply and offer potential for outsized rent growth and appreciation. | |
 | BGO Diversified US Property Fund4is an open-end core real estate private equity fund that invests in a portfolio of institutional-quality real estate assets in the U.S. BGO Diversified’s investment strategy is focused on maintaining stable income, building a diversified modern portfolio, using moderate leverage, and providing superior liquidity. BGO Diversified upholds a strong commitment to the principles of Responsible Property Investing. | |
 | BlackRock U.S. Core Property Fund5 is a diversified core private REIT with an investment objective to provide current income with the potential for long term capital appreciation. The BlackRock U.S. Core Property Fund aims to beat its stated benchmark, the NFI-ODCE, while producing real estate returns and liquidity appropriate for a core fund. | |
 | Brookfield Senior Mezzanine Real Estate Finance Fund is an open-end senior real estate debt fund focused on providing primarily floating rate financing secured by commercial property primarily located in the U.S. and secured by generally well-leased/light transitional collateral commercial real estate properties that generate significant cash flow. Brookfield Senior Mezzanine Real Estate Finance Fund will primarily focus on creating investment positions by originating floating rate whole loans, syndicating the first mortgage and retaining the mezzanine exposure. | |
 | CBRE U.S. Core Partnersis an open-end core fund that purchases and operates high-quality, income-producing office, industrial, retail, and multifamily assets in select major U.S. metropolitan markets that exhibit strong growth demographics. | |
 | Clarion Gables Multifamily Trustprovides investors access to a high-quality multifamily portfolio with a best-in-class operator and fund manager. Gables is a market-leading, vertically-integrated multifamily real estate company with a 34-year history in the management, construction, development, acquisition and disposition of multifamily communities in the United States. | |
| | Clarion Lion Industrial Trust is a private REIT focused on the industrial property sector in North America. Clarion Lion Industrial Trust invests primarily in big-box warehouse and distribution centers, with an emphasis on large, core industrial markets throughout the United States. | |
| | Clarion Lion Properties Fund is a core private REIT with interests in a diversified portfolio of primarily institutional quality real estate assets and related investments located throughout the U.S. The investment objective is to provide a strong income return with potential for long-term capital appreciation. | |
 | Cortland Growth and Income Fund, a leading Southern United States focused multifamily owner and operator, is a domestic multifamily open-end core-plus fund focused on acquiring best-in-class, income producing properties in U.S. growth markets. | |
 | CrossHarbor Strategic Debt Fund is an open-end debt fund that seeks to generate compelling risk-adjusted current and total returns for investors by originating and managing first mortgage loans secured by core, core-plus, and value-add commercial real estate located throughout the United States. | |
 | GWL U.S. Property Fund6 is an open-end real estate fund consisting of a diversified portfolio of institutional quality, income producing assets broadly allocated by property type and geographic location. GWL U.S. Property Fund employs a core plus strategy intertwined with a disciplined risk management process in seeking to achieve its performance objectives. | |
 | Hancock U.S. Real Estate Fundis a U.S. open-end core-plus fund that will target properties located in major U.S. markets, with the objective of preserving capital while delivering a combination of income and long-term capital appreciation. The Hancock U.S. Real Estate Fund will target an allocation of 60% core-plus assets and 40% core investments. | |
 | Heitman America Real Estate Trust is an open-end core commingled fund. Heitman America Real Estate Trust’s core strategy encompasses stabilized investments with low to moderate leverage and seeks to objectively minimize risk through diversification in property type, geographic location, and tenant composition. | |
| | Heitman Core Real Estate Debt Income Trustis an open-ended, commingled fund, that originates and services first mortgage loans secured by income-producing U.S. commercial real estate. Heitman Core Real Estate Debt Income Trust will seek to originate senior debt financing to high-quality real estate operators in both primary and specialty property sectors. |
Holdings are subject to change without notice.
6
 | JP Morgan U.S. Real Estate Core Mezzanine Debt Fund pursues a disciplined, income-producing strategy achieved primarily by investing in a portfolio of real estate and real estate-related assets, consisting of mezzanine debt, B-notes, mortgages, and preferred equity investments. It focuses on the four primary property types including office, multifamily, industrial, and retail, owned and operated by experienced and financially capable sponsors with strong performance experience across investment cycles. | |
 | MetLife Commercial Mortgage Income Fundis a perpetual life, open-end, commercial mortgage debt fund that consists of commercial mortgage loans. MetLife Commercial Mortgage Income Fund seeks to provide consistent current income, attractive risk-adjusted returns and preservation of principal. MetLife Commercial Mortgage Income Fund seeks to achieve its investment objective by creating a portfolio of institutional-quality loans originated by MetLife Investment Management Real Estate’s existing platform, using its investment underwriting guidelines and risk management processes and policies and anticipates being broadly diversified by property type, geography, borrower and loan type. | |
 | Morgan Stanley Prime Property Fund is an open-end core fund with a focus on office, retail, multifamily, industrial, self storage and hotel properties located in major real estate markets throughout the United States. | |
 | Oaktree Real Estate Income Fund is an open-ended fund that targets investments in commercial real estate, primarily office, multifamily and industrial assets. Oaktree Real Estate Income Fund intends to create value by investing in assets that require modest leasing and capital expenditures. | |
 | Prologis Targeted US Logistics Fund launched in 2004 as an open-ended, co-investment venture formed by Prologis to partner with institutional investors in acquiring, operating, and disposing of high-quality logistics facilities in key target markets across the U.S. The Fund seeks enhanced returns through actively managing, repositioning and renovating portfolio-owned assets. | |
 | PGIM Real Estate U.S. Debt Fundis an open-end debt fund that seeks to originate and service first mortgage and subordinate debt, fixed and floating rate loans, secured by stable income producing properties or properties exhibiting light transitional characteristics. PGIM Real Estate U.S. Debt Fund will focus on the four main property types in the top 30 MSAs and intends to provide secure income returns from investing in a low risk, low volatility portfolio of real estate debt, with a focus on capital preservation and stability of income. | |
| | Prudential PRISAis organized as a perpetual life, open-ended, commingled fund to invest primarily in core, well-leased, operating real estate assets located in the United States, with an emphasis on income. PRISA is Prudential Real Estate Investors (“PREI”) flagship fund, and represents one of the oldest and largest U.S. core real estate funds available in the marketplace. | |
 | RREEF America REIT IIis a core private REIT that provides an average risk exposure to the core real estate market, but does so with significantly different allocations than the index — heavily overweight to industrial assets and the West. | |
 | Sentinel Real Estate Fund is a multifamily focused, core private REIT that emphasizes acquisitions of stabilized assets with in-place income with the goal of providing a substantial portion of investor returns in the form of distributed cash. | |
 | Stockbridge Smart Markets Fund is an open-end core fund that aims to capture performance in excess of the ODCE Index by acquiring assets in “smart markets” characterized by educated, stable and fast-growing employment bases. The Smart Market Fund’s target market strategy is based on the principle that real estate demand is dependent on jobs which are increasingly being created where there are educated work forces in the U.S. | |
 | TA Realty Core Property Fund invests and operates a diversified portfolio of commercial real estate assets across industrial, multifamily, office and retail property types. TA Realty Core Property Fund has three primary objectives: build and operate a first-class portfolio of institutional quality core real estate assets, generate consistent outperformance versus industry benchmarks and provide outstanding client service to investors. | |
 | TCM CRE Credit Fundintends to focus primarily on investing in a diversified portfolio of primarily U.S. commercial real estate debt investments, generally within the mezzanine position of the capital stack. Trawler Capital Management Commercial Real Estate Credit Fund will focus on building and maintaining a portfolio of assets that are intended to provide strong risk adjusted returns in all cycles, with emphasis on stable cash flows. | |
 | UBS Trumbull Property Fundis an open-end, diversified Core fund focusing on the four main property types, with a small exposure to hotels. UBS Trumbull Property Fund focuses on top markets for high-quality Core, institutional real estate assets. | |
 | USAA U.S. Government Building Fund seeks to provide investors with attractive, risk-adjusted returns generated by the acquisition, build to suit development and operation of buildings located in the United States and leased or intended to be leased to U.S. federal, state and local governments and government agencies and departments. | |
 | Ventas Life Science and Healthcare Real Estate Fund is an open-ended investment vehicle formed by Ventas, Inc. to invest in high-quality healthcare properties, with a focus on the life science, medical office building, and seniors housing asset classes, in target markets primarily in the United States. The Fund’s primary objective is to generate attractive returns and cash flow with an emphasis on long-term capital growth through investment focused on the healthcare real estate sector. | |
 | Voya Commercial Mortgage Lending Fundis a perpetual life, open-ended, commercial mortgage debt fund. The Fund’s investment objective is to generate consistent current income with attractive risk-adjusted returns, while seeking to preserve capital through risk management of the portfolio of commercial mortgage loans and balance sheet management at the Fund level. The Fund will seek generally to achieve its investment objective by applying disciplined credit underwriting to identify and originate a diversified pool of commercial real estate loans located throughout the U.S., in primary, secondary and select tertiary markets. |
Holdings are subject to change without notice.
7
FUND SUB-ADVISERS (UNAUDITED)
Aon Hewitt Investment Consulting

The Fund’s Private Allocation Sub-Adviser, Aon Hewitt Investment Consulting, Inc., an Aon Company, provides investment consulting services to approximately 480 clients in the United States with total client assets worldwide of over $3.5 trillion including $2.4 trillion in the U.S. as of June 30, 2019. Over 300 investment consulting professionals in the U.S. advise institutional investors such as corporations, public organizations, union associations, health systems, endowments, and foundations.
CenterSquare Investment Management

The Fund’s Public Allocation Sub-Adviser, CenterSquare Investment Management LLC (“CenterSquare”), is focused exclusively on real estate and infrastructure to provide attractive investment performance to institutional real asset investors. CenterSquare’s team of REIT experts have been a trusted advisor to endowments, pension plans and corporate clients. The firm manages approximately $9.6 billion across a variety of real estate strategies as of March 31, 2020.
Griffin Capital Advisor, LLC along with CenterSquare Investment Management have designed a public market strategy in line with the objectives of the Fund with a focus on identifying public real estate securities whose current prices are below their intrinsic values. CenterSquare Investment Management has been managing real estate securities portfolios since 1995 across multiple strategies and market cycles.
8
GLOSSARY (UNAUDITED)
Alpha: A measure of risk-adjusted return implying how much a fund/manager outperformed its benchmark, given its risk profile.
Annualized Return: Calculated by annualizing cumulative return (i.e., adjusting it for a period of one year). Annualized return includes capital appreciation and assumes a reinvestment of dividends and distributions.
Basis Point: One basis point is equal to 1/100th of 1%, or 0.01%.
Beta: A measure of systematic risk (volatility), or the sensitivity of a fund to movements in a benchmark. A beta of 1 implies that you can expect the movement of a fund’s return series to match that of the benchmark used to measure beta. A value of less than 1 implies that the fund is less volatile than the index.
Bloomberg Barclays U.S. Aggregate Bond Index: Measures the performance of the U.S. investment grade bond market.
Correlation: A statistical measure of how two securities move in relation to each other. A correlation ranges from -1 to 1. A positive correlation of 1 implies that as one security moves, either up or down, the other security will move in lockstep, in the same direction. A negative correlation of -1 indicates that the securities will move in the opposite direction. If the correlation is 0, the movements of the securities are said to have no correlation; they are completely random.
Cumulative Return: The compound return of an investment. It includes capital appreciation and assumes a reinvestment of dividends and distributions.
Dry Powder: Refers to cash reserves for purchasing assets or making investments.
NASDAQ: An electronic stock market listing over 5,000 companies. The NASDAQ stock market comprises two separate markets, namely the Nasdaq National Market, which trades large, active securities and the NASDAQ Smallcap Market that trades emerging growth companies.
Net Asset Value (NAV): Represents a fund’s per-share price. NAV is calculated by dividing a fund’s total net assets by its number of shares outstanding.
S&P 500: An index based on market cap of the 500 largest companies having stock listed on the New York Stock Exchange (NYSE) or NASDAQ.
Sharpe Ratio: Measures risk-adjusted returns by calculating the excess return (above the risk free rate) per unit of risk (standard deviation). The higher the ratio, the better the risk-adjusted returns. The average 3 month U.S. Treasury T-bill auction was used as the risk free rate in this material.
Standard Deviation: Measures the average deviations of a return series from its mean, and is often used as a measure of volatility/risk. A large standard deviation implies that there have been large swings in the return series of the manager.
9
IMPORTANT DISCLOSURES (UNAUDITED)
This is neither an offer to sell nor a solicitation to purchase any security. Investors should carefully consider the investment objectives, risks, charges and expenses of Griffin Institutional Access® Real Estate Fund (the “Fund”). This and other important information about the Fund is contained in the prospectus, which can be obtained by visiting www.griffincapital.com. Please read the prospectus carefully before investing.
All Morningstar calculations and metrics are based on monthly data. CALCULATIONS AND METRICS REFLECT A LOAD-WAIVED, CLASS A SHARE (NASDAQ: GIREX). Investors of the load-waived class A share do not pay a front-end sales load/charge. The Fund offers multiple different classes of shares. An investment in any share class of the Fund represents an investment in the same assets of the Fund. However, the purchase restrictions, ongoing fees, expenses, and performance for each share class are different.
Past performance is not a guarantee of future results. Investing in the Fund involves risks, including the risk that you may receive little or no return on your investment or that you may lose part or all of your investment. The ability of the Fund to achieve its investment objective depends, in part, on the ability of the Adviser to allocate effectively the assets of the Fund among the various securities and investments in which the Fund invests. There can be no assurance that the actual allocations will be effective in achieving the Fund’s investment objective or delivering positive returns. The investment return and principal value of an investment will fluctuate so that an investor’s shares, when redeemed, may be worth more or less than the original cost. Current performance may be lower or higher than the performance quoted. The most recent performance is available at www.griffincapital.com or by calling 888.926.2688.
The Fund is a closed-end interval fund, the shares have no history of public trading, nor is it intended that the shares will be listed on a public exchange at this time. No secondary market is expected to develop for the Fund’s shares. Limited liquidity is provided to shareholders only through the Fund’s quarterly repurchase offers for no less than 5% and no more than 25% of the Fund’s shares outstanding at net asset value. There is no guarantee that an investor will be able to sell all the shares that the investor desires to sell in the repurchase offer. The investment return and principal value of an investment will fluctuate so that an investor’s shares, when redeemed, may be worth more or less than the original cost. Due to these restrictions, an investor should consider an investment in the Fund to be of limited liquidity. The Fund is suitable only for investors who can bear the risks associated with the limited liquidity of the Fund and should be viewed as a long-term investment. Investing in the Fund is speculative and involves a high degree of risk, including the risks associated with leverage and the risk of a substantial loss of investment. There is no guarantee that the investment strategies will work under all market conditions.
The Fund’s inception date was 6/30/2014. Per the Fund’s prospectus dated February 1, 2020, the total annual expense ratio is 1.97% for Class A shares. The Adviser and Fund have entered into an expense limitation agreement until at least February 1, 2021 under which the Adviser has contractually agreed to waive its fees and to pay or absorb the ordinary annual operating expenses of the Fund (including offering expenses, but excluding taxes, interest, brokerage commissions, acquired fund fees and expenses and extraordinary expenses) to the extent that they exceed 1.91% for Class A shares. The maximum sales charge is 5.75% for Class A shares. The Fund return does not reflect the deduction of all fees, including third-party brokerage commissions or third-party investment advisory fees paid by investors to a financial intermediary for brokerage services. If the deduction of such fees was reflected, the performance would be lower. Returns shown do not reflect the deduction of taxes that a shareholder would pay on Fund distributions or the redemption of Fund shares.
Investors in the Fund should understand that the net asset value (“NAV”) of the Fund will fluctuate, which may result in a loss of the principal amount invested. The Fund’s investments may be negatively affected by the broad investment environment and capital markets in which the Fund invests, including the real estate market, the debt market and/or the equity securities market. The value of the Fund’s investments will increase or decrease based on changes in the prices of the investments it holds. This will cause the value of the Fund’s shares to increase or decrease. The Fund is “non-diversified” under the Investment Company Act of 1940 since changes in the financial condition or market value of a single issuer may cause a greater fluctuation in the Fund’s net asset value than in a “diversified” fund. Diversification does not eliminate the risk of experiencing investment losses. Holdings are subject to change without notice. The Fund is not intended to be a complete investment program.
The Fund’s investment in Private Investment Funds will require it to bear a pro rata share of the vehicles’ expenses, including management and performance fees. Also, once an investment is made in a Private Investment Fund, neither the Adviser nor any Sub-Adviser will be able to exercise control over investment decisions made by the Private Investment Fund. The Fund will not invest in real estate directly, but, because the Fund will concentrate its investments in securities of REITs and other real estate industry issuers, its portfolio will be significantly impacted by the performance of the real estate market and may experience more volatility and be exposed to greater risk than a more diversified portfolio. The value of companies engaged in the real estate industry is affected by: (i) changes in general economic and market conditions; (ii) changes in the value of real estate properties; (iii) risks related to local economic conditions, overbuilding and increased competition; (iv) increases in property taxes and operating expenses; (v) changes in zoning laws; (vi) casualty and condemnation losses; (vii) variations in rental income, neighborhood values or the appeal of property to tenants; (viii) the availability of financing and (ix) changes in interest rates and leverage. By investing in the Fund, a shareholder will not be deemed to be an investor in any underlying fund and will not have the ability to exercise any rights attributable to an investor in any such underlying fund related to their investment. The Fund may invest in securities of other investment companies, including ETFs. The Fund will indirectly bear its proportionate share of any management fees and other expenses paid by investment companies in which it invests, in addition to the management fees (and other expenses) paid by the Fund.
10
You cannot invest directly in an index. Index performance does not represent actual Fund or portfolio performance. A fund or portfolio may differ significantly from the securities included in the index. Index performance assumes reinvestment of dividends but does not reflect any management fees, transaction costs or other expenses that would be incurred by a fund or portfolio, or brokerage commissions on transactions in fund shares. Such fees, expenses, and commissions could reduce returns.
The Fund is advised by Griffin Capital Advisor, LLC (“GCA”). GCA is registered as an investment adviser with the SEC pursuant to the provisions of the Investment Advisers Act of 1940, as amended (the “Advisers Act”). GCA is an indirect majority-owned subsidiary of Griffin Capital Company, LLC. The Fund’s private real estate funds allocation is sub-advised by Aon Hewitt Investment Consulting (“Aon”), an Aon Company. Aon is registered as an investment adviser with the SEC pursuant to the provisions of the Advisers Act. The Fund’s public real estate securities allocation is sub-advised by CenterSquare Investment Management LLC (“CenterSquare”). CenterSquare is an investment adviser registered with the SEC pursuant to the provisions of the Advisers Act. Registration with the SEC does not constitute an endorsement by the SEC nor does it imply a certain level of skill or training.
This material has been distributed for informational purposes only and should not be considered as investment advice or a recommendation of any particular security, strategy or investment product or be relied upon for any other purpose. Information contained herein has been obtained from sources deemed to be reliable, but not guaranteed. This material represents views as of the date of this publication and is subject to change without notice of any kind.
This semi-annual report may contain certain forward-looking statements. Such forward-looking statements can generally be identified by our use of forward-looking terminology such as “may,” “will,” “expect,” “intend,” “anticipate,” “estimate,” “believe,” “continue,” or other similar words. Because such statements include risks, uncertainties and contingencies, actual results may differ materially from the expectations, intentions, beliefs, plans or predictions of the future expressed or implied by such forward-looking statements. These risks, uncertainties and contingencies include, but are not limited to: uncertainties relating to changes in general economic and real estate conditions; uncertainties relating to the implementation of our investment strategy; uncertainties relating to capital proceeds; and other risk factors as outlined in the Fund’s prospectus, statement of additional information, annual report and semi-annual report filed with the U.S. Securities and Exchange Commission (the “SEC”).
The Fund’s distribution policy is to make quarterly distributions to shareholders. A portion of the distribution may include a return of capital. Please refer to the Fund’s most recent Section 19(a) notice, available at www.griffincapital.com, and the Fund’s semi-annual or annual reports filed with the U.S. Securities and Exchange Commission (the “SEC”) for additional information regarding the composition of distributions. Shareholders should not assume that the source of a distribution from the Fund is net profit. Although such distributions are not currently taxable, such distributions will have the effect of lowering a shareholder’s tax basis in the shares which will result in a higher tax liability when the shares are sold, even if they have not increased in value, or, in fact, have lost value. Distributions are not guaranteed.
During the six months ending March 31, 2020, the Fund paid distributions of $107,230,299 to its investors, consisting of distributions of $46,132,058 paid and $61,098,241 that was reinvested through the Fund’s distribution reinvestment program.
During that period, the Fund recorded dividends and distributions from the Fund’s underlying investments totaling $72,120,233, and realized losses on its investments totaling $137,425,053, and fees and expenses of $42,558,120.
The Fund’s most recent annualized distribution rate as of March 31, 2020 was 5.22%. A portion of the distribution included a return of capital. Distributions paid may exceed and, from time to time, have exceeded the Fund’s total return less fees and expenses of the Fund during some periods due to changes in market conditions affecting components of the Fund’s total return, including unrealized appreciation. Please reference the performance table below to view the Fund’s historical returns. Additionally, the Fund’s performance can always be found on the Griffin Capital website (www.griffincapital.com). The following chart presents the quarterly changes to the NAV, total return, and cumulative total return for load-waived Class A shares since inception.1
11
Period Ending | NAV Return | Total Return | Cumulative Total Return |
6/30/14 | N/A | N/A | N/A |
9/30/14 | 0.44% | 1.65% | 1.65% |
12/31/14 | 2.11% | 3.40% | 5.10% |
3/31/15 | 0.98% | 2.28% | 7.50% |
6/30/15 | -1.24% | 0.06% | 7.56% |
9/30/15 | 1.13% | 2.47% | 10.21% |
12/31/15 | 1.01% | 2.34% | 12.79% |
3/31/16 | 1.00% | 2.33% | 15.42% |
6/30/16 | 0.95% | 2.28% | 18.05% |
9/30/16 | -0.04% | 1.28% | 19.57% |
12/31/16 | -0.26% | 1.05% | 20.83% |
3/31/17 | -0.15% | 1.17% | 22.24% |
6/30/17 | 0.26% | 1.59% | 24.18% |
9/30/17 | 0.00% | 1.32% | 25.83% |
12/31/17 | 0.90% | 2.23% | 28.64% |
3/31/18 | -0.97% | 0.34% | 29.08% |
6/30/18 | 1.24% | 2.58% | 32.41% |
9/30/18 | 0.11% | 1.43% | 34.31% |
12/31/18 | -1.04% | 0.27% | 34.67% |
3/31/19 | 2.10% | 3.45% | 39.33% |
6/30/19 | 0.15% | 1.47% | 41.38% |
9/30/19 | 0.40% | 1.73% | 43.82% |
12/31/19 | -0.11% | 1.21% | 45.56% |
3/31/20 | -6.70% | -5.46% | 37.61% |
12
ENDNOTES
1. | Data source: Morningstar Direct as of March 31, 2020. Performance data uses the Fund’s load-waived, Class A share (NASDAQ: GIREX) and reflects the reinvestment of dividends and other distributions. Due to financial statement adjustments, returns may differ. Past performance is not a guarantee of future results. A glossary of terms can be found on page 9. |
2. | Calculation benchmark: S&P 500. |
3. | Represents the Fund’s direct holdings in private funds in which the underlying holdings of each respective private fund generally consist of real estate-related interests that are not publicly traded. |
4. | Formerly known as MEPT Edgemoor. |
5. | Formerly known as BlackRock Granite Property Fund. |
6. | Formerly known as Guggenheim US Property Fund. |
7. | Formerly known as the Cornerstone Patriot Fund. |
8. | Represents (i) the Fund’s direct holdings in publicly traded, real estate-related securities; (ii) the Fund’s holdings in private funds and registered investment companies in which the underlying holdings are generally publicly traded; and (iii) cash and short-term investments. |
9. | Tables and charts are expressed as a percentage of the Fund’s portfolio allocated to private funds as of April 1, 2020 in which the underlying holdings of such private funds generally consist of real estate-related interests that are not publicly traded. Underlying data and statistics of the Fund’s private real estate exposure as of December 31, 2019. With the exception of the “Private Real Estate Exposure” chart, Ventas Life Science and Healthcare Real Estate Fund is omitted from such calculations due to its limited operating history. Holdings are subject to change without notice. Diversification does not eliminate the risk of experiencing investment losses. |
13
Griffin Institutional Access Real Estate Fund | Portfolio Update |
March 31, 2020 (Unaudited)
Performance (for the periods ended March 31, 2020)
| 6 Month | 1 Year | 3 Year | 5 Year | Since Inception | Inception Date |
Griffin Institutional Access Real Estate Fund – A – With Load* | -10.31% | -7.32% | 1.81% | 3.61% | 4.53% | 6/30/14 |
Griffin Institutional Access Real Estate Fund – A – Without Load | -4.84% | -1.66% | 3.84% | 4.85% | 5.62% | 6/30/14 |
Griffin Institutional Access Real Estate Fund – C – With Load** | -6.19% | -3.41% | 3.07% | N/A | 4.01% | 8/7/15 |
Griffin Institutional Access Real Estate Fund – C – Without Load | -5.19% | -2.41% | 3.07% | N/A | 4.01% | 8/7/15 |
Griffin Institutional Access Real Estate Fund – I – NAV | -4.72% | -1.44% | 4.10% | N/A | 5.04% | 8/7/15 |
Griffin Institutional Access Real Estate Fund – M – NAV | -5.06% | -2.13% | 3.34% | N/A | 3.76% | 11/16/16 |
Griffin Institutional Access Real Estate Fund – L – With Load*** | -8.96% | -6.04% | N/A | N/A | 2.05% | 4/24/17 |
Griffin Institutional Access Real Estate Fund – L – Without Load | -4.92% | -1.88% | N/A | N/A | 3.57% | 4/24/17 |
S&P 500® Total Return Index | -12.31% | -6.98% | 5.10% | 6.73% | 7.10% | 6/30/14 |
Bloomberg Barclays U.S. Aggregate Bond Index | 3.33% | 8.93% | 4.82% | 3.36% | 3.55% | 6/30/14 |
* | Adjusted for initial maximum sales charge of 5.75%. |
** | Adjusted for contingent deferred sales charge of 1.00%. |
*** | Adjusted for initial maximum sales charge of 4.25%. |
The S&P 500® Total Return Index is an unmanaged index of 500 common stocks chosen for market size, liquidity and industry group representation. It is a market-value weighted index. The index is not actively managed and does not reflect any deduction for fees, expenses or taxes.
The Bloomberg Barclays U.S. Aggregate Bond Index (formerly known as the Barclays Capital U.S. Aggregate Bond Index) is a market value-weighted index of investment grade fixed-rated debt issues, including government, corporate, asset-backed and mortgage-backed securities with a maturity of one year or more.
Indexes are not actively managed and do not reflect deduction for fees, expenses or taxes. An investor cannot invest directly into an index.
The returns shown above do not reflect the deduction of taxes a shareholder would pay on Fund distributions or redemption of Fund shares. The returns shown are net of applicable share class fees.
The performance data quoted above represents past performance. Past performance is not a guarantee of future results. Investment return and value of the Fund shares will fluctuate so that an investor’s shares, when sold or redeemed, may be worth more or less than their original cost. Performance may be lower or higher than performance data quoted. Fund performance current to the most recent month-end is available by calling 1-888-926-2688 or by visiting www.griffincapital.com.
Class A shares are offered subject to a maximum sales charge of 5.75% of the offering price. Class C, Class I and Class M shares are offered at net asset value. Class L shares are offered subject to a maximum sales charge of 4.25% of the offering price. Class C shares may be subject to a 1.00% contingent deferred sales charge on shares redeemed during the first 365 days after their purchase. The Fund’s investment adviser has contractually agreed to waive its fees and to pay or absorb the ordinary annual operating expenses of the Fund (including offering expenses, but excluding taxes, interest, brokerage commissions, acquired fund fees and expenses and extraordinary expenses), to the extent that they exceed 1.91%, 2.66%, 1.66%, 2.41% and 2.16% per annum of the Fund’s average daily net assets attributable to Class A, Class C, Class I, Class M and Class L shares, respectively. The Expense Limitation Agreement will remain in effect at least until February 1, 2021, for Class A, Class C, Class I, Class L and Class M shares, unless and until the Board approves its modification or termination. Per the Fund’s most recent prospectus, the total expense ratio after fee waiver, reimbursement and recoupment is 1.97%, 2.73%, 1.72%, 2.45%, and 2.20% for Class A, Class C, Class I, Class M and Class L, respectively. Please review the Fund’s Prospectus for more details regarding the Fund’s fees and expenses. No assurances can be given that the Fund will pay a distribution in the future; or, if any such distribution is paid, the amount or rate of the distribution.
14 | 1.888.926.2688 | www.griffincapital.com |
Griffin Institutional Access Real Estate Fund | Portfolio Update |
March 31, 2020 (Unaudited)
Performance of $10,000 Initial Investment (as of March 31, 2020)
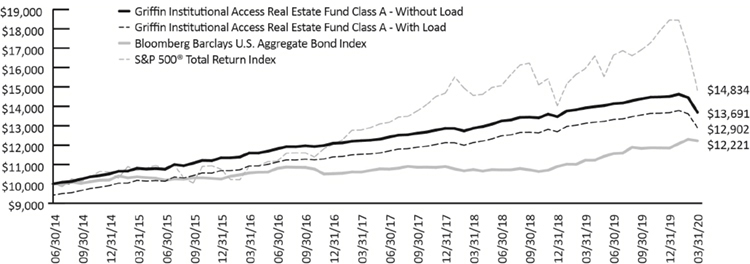
The graph shown above represents historical performance of a hypothetical investment of $10,000 in the Fund since inception. Past performance does not guarantee future results. All returns reflect reinvested dividends, but do not reflect the deduction of taxes that a shareholder would pay on Fund distributions or the redemption of Fund shares.
Sector Allocation (as a % of Net Assets)
Private Investment Funds | 76.03% |
Publicly Traded Securities | 4.95% |
Mutual Fund | 1.84% |
Preferred Stocks | 2.84% |
Short Term Investment | 12.18% |
Other | 2.16% |
TOTALS | 100.00% |
Semi-Annual Report | March 31, 2020 | 15 |
Griffin Institutional Access Real Estate Fund | Schedule of Investments |
March 31, 2020 (Unaudited)
Description |
| Shares |
|
| Value (Note 2) |
| ||
REAL ESTATE INVESTMENT TRUSTS (80.98%) |
|
|
|
|
|
|
|
|
Private Investment Funds (76.03%)* |
|
|
|
|
|
|
|
|
AEW Core Property Trust (U.S.), Inc. |
|
| 48,877 |
|
| $ | 49,769,290 |
|
American Core Realty Fund, L.P. |
|
| 445 |
|
|
| 56,288,137 |
|
Ares Real Estate Enhanced Income Fund, L.P. |
|
| N/A |
|
|
| 62,209,040 |
|
Barings Core Property Fund, L.P. |
|
| 101,597 |
|
|
| 13,752,710 |
|
BGO Diversified US Property Fund, L.P. |
|
| 24,498 |
|
|
| 55,564,530 |
|
BlackRock US Core Property Fund |
|
| N/A |
|
|
| 50,437,700 |
|
Brookfield Senior Mezzanine Real Estate Finance Fund |
|
| 102,072 |
|
|
| 104,074,815 |
|
CBRE U.S. Core Partners, L.P. |
|
| 74,863,082 |
|
|
| 109,643,210 |
|
Clarion Gables Multifamily Trust, L.P. |
|
| 143,690 |
|
|
| 189,591,474 |
|
Clarion Lion Industrial Trust, L.P. |
|
| 54,291 |
|
|
| 118,732,903 |
|
Clarion Lion Properties Fund, L.P. |
|
| 155,932 |
|
|
| 242,784,122 |
|
Cortland Growth and Income Fund, L.P. |
|
| 200,135 |
|
|
| 225,990,430 |
|
CrossHarbor Strategic Debt Fund, L.P. |
|
| N/A |
|
|
| 102,905,964 |
|
GWL U.S. Property Fund, L.P. |
|
| N/A |
|
|
| 26,081,064 |
|
Hancock U.S. Real Estate Fund, L.P. |
|
| 63,179 |
|
|
| 83,744,587 |
|
Heitman America Real Estate Trust, L.P. |
|
| 26,888 |
|
|
| 31,674,835 |
|
Heitman Core Real Estate Debt Income Trust |
|
| 136,367 |
|
|
| 139,633,736 |
|
JPM U.S. Real Estate Mezzanine Debt Fund, L.P. |
|
| 444,420 |
|
|
| 45,141,748 |
|
MetLife Commercial Mortgage Income Fund, L.P. |
|
| 9,938 |
|
|
| 10,088,476 |
|
Morgan Stanley Prime Property Fund |
|
| 12,908 |
|
|
| 247,500,269 |
|
Oaktree Real Estate Income Fund, L.P. |
|
| N/A |
|
|
| 143,354,055 |
|
PGIM Real Estate US Debt Fund, L.P. |
|
| 71,941 |
|
|
| 84,974,007 |
|
PRISA, L.P. |
|
| 103,405 |
|
|
| 183,191,154 |
|
Prologis Targeted U.S. Logistics Fund, L.P. |
|
| 35,450 |
|
|
| 67,120,446 |
|
RREEF America REIT II, Inc. |
|
| 248,080 |
|
|
| 31,639,075 |
|
Sentinel Real Estate Fund, L.P. |
|
| 876 |
|
|
| 79,400,606 |
|
Stockbridge Smart Markets Fund, L.P. |
|
| 42,893 |
|
|
| 68,102,070 |
|
TA Realty Core Property Fund, L.P. |
|
| 136,944 |
|
|
| 157,544,561 |
|
TCM CRE Credit Fund, L.P. |
|
| 102,290 |
|
|
| 101,264,123 |
|
Torchlight Value Fund, LLC |
|
| 59,291 |
|
|
| 52,809,585 |
|
UBS Trumbull Property Fund |
|
| 1,725 |
|
|
| 18,051,339 |
|
USAA US Government Building Fund, LLC |
|
| N/A |
|
|
| 73,169,438 |
|
Ventas Life Science And Healthcare Real Estate Fund |
|
| 85,443 |
|
|
| 83,575,781 |
|
Voya Commercial Mortgage Lending Fund, L.P. |
|
| N/A |
|
|
| 45,001,671 |
|
|
|
|
|
|
|
| 3,154,806,951 |
|
Publicly Traded Securities (4.95%) |
|
|
|
|
|
|
|
|
Alexandria Real Estate Equities, Inc. |
|
| 35,260 |
|
|
| 4,832,736 |
|
American Campus Communities, Inc. |
|
| 42,419 |
|
|
| 1,177,127 |
|
American Homes 4 Rent, Class A |
|
| 87,680 |
|
|
| 2,034,176 |
|
American Tower Corp. |
|
| 14,950 |
|
|
| 3,255,363 |
|
Americold Realty Trust |
|
| 105,740 |
|
|
| 3,599,390 |
|
AvalonBay Communities, Inc. |
|
| 34,207 |
|
|
| 5,034,244 |
|
Boston Properties, Inc. |
|
| 43,904 |
|
|
| 4,049,266 |
|
Brixmor Property Group, Inc. |
|
| 126,120 |
|
|
| 1,198,140 |
|
Camden Property Trust |
|
| 20,320 |
|
|
| 1,610,157 |
|
Columbia Property Trust, Inc. |
|
| 168,950 |
|
|
| 2,111,875 |
|
CoreSite Realty Corp. |
|
| 13,150 |
|
|
| 1,524,085 |
|
Cousins Properties, Inc. |
|
| 114,860 |
|
|
| 3,361,952 |
|
CyrusOne, Inc. |
|
| 77,900 |
|
|
| 4,810,325 |
|
Digital Realty Trust, Inc. |
|
| 57,580 |
|
|
| 7,998,438 |
|
16 | 1.888.926.2688 | www.griffincapital.com |
Griffin Institutional Access Real Estate Fund | Schedule of Investments |
March 31, 2020 (Unaudited)
Description |
| Shares |
|
| Value (Note 2) |
| ||
Publicly Traded Securities (continued) |
|
|
|
|
|
|
|
|
Douglas Emmett, Inc. |
|
| 70,520 |
|
| $ | 2,151,565 |
|
Duke Realty Corp. |
|
| 16,310 |
|
|
| 528,118 |
|
Empire State Realty Trust, Inc., Class A |
|
| 158,320 |
|
|
| 1,418,547 |
|
Equinix, Inc. |
|
| 24,090 |
|
|
| 15,045,891 |
|
Equity Residential |
|
| 177,340 |
|
|
| 10,943,651 |
|
Extra Space Storage, Inc. |
|
| 71,010 |
|
|
| 6,799,918 |
|
First Industrial Realty Trust, Inc. |
|
| 75,270 |
|
|
| 2,501,222 |
|
Healthcare Trust of America, Inc., Class A |
|
| 130,980 |
|
|
| 3,180,194 |
|
Healthpeak Properties, Inc. |
|
| 331,100 |
|
|
| 7,896,735 |
|
Highwoods Properties, Inc. |
|
| 44,968 |
|
|
| 1,592,767 |
|
Host Hotels & Resorts, Inc. |
|
| 243,850 |
|
|
| 2,692,104 |
|
Hudson Pacific Properties, Inc. |
|
| 61,370 |
|
|
| 1,556,343 |
|
Invitation Homes, Inc. |
|
| 274,340 |
|
|
| 5,862,646 |
|
Iron Mountain, Inc. |
|
| 76,260 |
|
|
| 1,814,988 |
|
JBG SMITH Properties |
|
| 135,063 |
|
|
| 4,299,055 |
|
Kilroy Realty Corp. |
|
| 62,800 |
|
|
| 4,000,360 |
|
Life Storage, Inc. |
|
| 31,490 |
|
|
| 2,977,380 |
|
Medical Properties Trust, Inc. |
|
| 270,830 |
|
|
| 4,682,651 |
|
Mid-America Apartment Communities, Inc. |
|
| 19,200 |
|
|
| 1,978,176 |
|
NexPoint Residential Trust, Inc. |
|
| 34,096 |
|
|
| 859,560 |
|
Prologis, Inc. |
|
| 196,230 |
|
|
| 15,771,005 |
|
PS Business Parks, Inc. |
|
| 6,072 |
|
|
| 822,878 |
|
Public Storage |
|
| 23,586 |
|
|
| 4,684,416 |
|
Realty Income Corp. |
|
| 127,320 |
|
|
| 6,348,175 |
|
Regency Centers Corp. |
|
| 67,010 |
|
|
| 2,575,194 |
|
Retail Opportunity Investments Corp. |
|
| 194,180 |
|
|
| 1,609,752 |
|
Retail Properties of America, Inc., Class A |
|
| 284,890 |
|
|
| 1,472,881 |
|
Rexford Industrial Realty, Inc. |
|
| 80,070 |
|
|
| 3,283,671 |
|
RLJ Lodging Trust |
|
| 87,030 |
|
|
| 671,872 |
|
Sabra Health Care REIT, Inc. |
|
| 164,110 |
|
|
| 1,792,081 |
|
SBA Communications Corp. |
|
| 17,630 |
|
|
| 4,759,571 |
|
Simon Property Group, Inc. |
|
| 49,070 |
|
|
| 2,691,980 |
|
STAG Industrial, Inc. |
|
| 138,830 |
|
|
| 3,126,452 |
|
STORE Capital Corp. |
|
| 120,810 |
|
|
| 2,189,077 |
|
Sun Communities, Inc. |
|
| 43,200 |
|
|
| 5,393,520 |
|
Sunstone Hotel Investors, Inc. |
|
| 199,051 |
|
|
| 1,733,734 |
|
UDR, Inc. |
|
| 195,503 |
|
|
| 7,143,680 |
|
Ventas, Inc. |
|
| 131,130 |
|
|
| 3,514,284 |
|
VEREIT, Inc. |
|
| 764,060 |
|
|
| 3,736,253 |
|
VICI Properties, Inc. |
|
| 63,172 |
|
|
| 1,051,182 |
|
WP Carey, Inc. |
|
| 26,730 |
|
|
| 1,552,478 |
|
|
|
|
|
|
|
| 205,303,281 |
|
TOTAL REAL ESTATE INVESTMENT TRUSTS |
|
|
|
|
|
|
|
|
(Cost $3,131,049,412) |
|
|
|
|
|
| 3,360,110,232 |
|
|
|
|
|
|
|
|
|
|
MUTUAL FUND (1.84%) |
|
|
|
|
|
|
|
|
Fidelity Advisor® Real Estate Income Fund, Class Z |
|
| 8,227,866 |
|
|
| 76,601,431 |
|
|
|
|
|
|
|
|
|
|
TOTAL MUTUAL FUND |
|
|
|
|
|
|
|
|
(Cost $99,935,262) |
|
|
|
|
|
| 76,601,431 |
|
Semi-Annual Report | March 31, 2020 | 17 |
Griffin Institutional Access Real Estate Fund | Schedule of Investments |
March 31, 2020 (Unaudited)
Description |
| Coupon Rate |
|
| Shares |
|
| Value (Note 2) |
| |||
PREFERRED STOCKS (2.84%)(a) |
|
|
|
|
|
|
|
|
|
|
|
|
American Homes 4 Rent, Series D |
|
| 6.50 | % |
|
| 4,957 |
|
| $ | 117,283 |
|
American Homes 4 Rent, Series E |
|
| 6.35 | % |
|
| 108,160 |
|
|
| 2,595,840 |
|
American Homes 4 Rent, Series F |
|
| 5.88 | % |
|
| 93,000 |
|
|
| 2,195,730 |
|
American Homes 4 Rent, Series H |
|
| 6.25 | % |
|
| 167,617 |
|
|
| 3,955,761 |
|
Boston Properties, Inc., Series B |
|
| 5.25 | % |
|
| 95,000 |
|
|
| 2,300,900 |
|
Brookfield Property Partners L.P., Series A |
|
| 6.50 | % |
|
| 55,000 |
|
|
| 942,150 |
|
Brookfield Property REIT, Inc., Series A |
|
| 6.38 | % |
|
| 117,000 |
|
|
| 1,655,550 |
|
Digital Realty Trust, Inc., Series G |
|
| 5.88 | % |
|
| 47,923 |
|
|
| 1,163,091 |
|
Digital Realty Trust, Inc., Series J |
|
| 5.25 | % |
|
| 87,000 |
|
|
| 2,068,860 |
|
Digital Realty Trust, Inc., Series K |
|
| 5.85 | % |
|
| 188,483 |
|
|
| 4,704,536 |
|
Digital Realty Trust, Inc., Series L |
|
| 5.20 | % |
|
| 132,500 |
|
|
| 3,054,125 |
|
EPR Properties, Series G |
|
| 5.75 | % |
|
| 164,500 |
|
|
| 2,557,975 |
|
Federal Realty Investment Trust, Series C |
|
| 5.00 | % |
|
| 182,739 |
|
|
| 4,109,800 |
|
Hersha Hospitality Trust, Series C |
|
| 6.88 | % |
|
| 108,000 |
|
|
| 806,760 |
|
Hersha Hospitality Trust, Series D |
|
| 6.50 | % |
|
| 123,669 |
|
|
| 769,221 |
|
Hersha Hospitality Trust, Series E |
|
| 6.50 | % |
|
| 70,000 |
|
|
| 441,700 |
|
Kimco Realty Corp., Series L |
|
| 5.13 | % |
|
| 9,859 |
|
|
| 213,940 |
|
Kimco Realty Corp., Series M |
|
| 5.25 | % |
|
| 74,500 |
|
|
| 1,631,550 |
|
National Retail Properties, Inc., Series F |
|
| 5.20 | % |
|
| 112,000 |
|
|
| 2,458,400 |
|
National Storage Affiliates Trust, Series A |
|
| 6.00 | % |
|
| 156,617 |
|
|
| 3,597,493 |
|
Pebblebrook Hotel Trust, Series C |
|
| 6.50 | % |
|
| 61,000 |
|
|
| 985,150 |
|
Pebblebrook Hotel Trust, Series D |
|
| 6.38 | % |
|
| 12,390 |
|
|
| 199,107 |
|
Pebblebrook Hotel Trust, Series E |
|
| 6.38 | % |
|
| 145,086 |
|
|
| 2,321,376 |
|
Pebblebrook Hotel Trust, Series F |
|
| 6.30 | % |
|
| 177,000 |
|
|
| 2,784,210 |
|
PS Business Parks, Inc., Series W |
|
| 5.20 | % |
|
| 149,579 |
|
|
| 3,434,334 |
|
PS Business Parks, Inc., Series Y |
|
| 5.20 | % |
|
| 90,000 |
|
|
| 2,068,200 |
|
PS Business Parks, Inc., Series Z |
|
| 4.88 | % |
|
| 160,000 |
|
|
| 3,337,600 |
|
Public Storage, Series D |
|
| 4.95 | % |
|
| 33,005 |
|
|
| 779,248 |
|
Public Storage, Series G |
|
| 5.05 | % |
|
| 25,000 |
|
|
| 606,500 |
|
Public Storage, Series H |
|
| 5.60 | % |
|
| 173,000 |
|
|
| 4,411,500 |
|
Public Storage, Series I |
|
| 4.88 | % |
|
| 29,000 |
|
|
| 684,110 |
|
Public Storage, Series J |
|
| 4.70 | % |
|
| 40,000 |
|
|
| 936,800 |
|
Public Storage, Series V |
|
| 5.38 | % |
|
| 216,000 |
|
|
| 5,209,920 |
|
Public Storage, Series W |
|
| 5.20 | % |
|
| 40,000 |
|
|
| 949,600 |
|
QTS Realty Trust, Inc., Series A |
|
| 7.13 | % |
|
| 105,209 |
|
|
| 2,678,621 |
|
Rexford Industrial Realty, Inc., Series A |
|
| 5.88 | % |
|
| 180,000 |
|
|
| 4,176,000 |
|
Rexford Industrial Realty, Inc., Series B |
|
| 5.88 | % |
|
| 79,000 |
|
|
| 1,727,730 |
|
Rexford Industrial Realty, Inc., Series C |
|
| 5.63 | % |
|
| 121,000 |
|
|
| 2,725,525 |
|
Saul Centers, Inc., Series D |
|
| 6.13 | % |
|
| 149,664 |
|
|
| 2,395,492 |
|
Saul Centers, Inc., Series E |
|
| 6.00 | % |
|
| 176,000 |
|
|
| 2,587,200 |
|
Seritage Growth Properties, Series A |
|
| 7.00 | % |
|
| 147,000 |
|
|
| 1,911,000 |
|
SITE Centers Corp., Series A |
|
| 6.38 | % |
|
| 106,671 |
|
|
| 1,988,326 |
|
SITE Centers Corp., Series K |
|
| 6.25 | % |
|
| 105,000 |
|
|
| 1,947,750 |
|
Spirit Realty Capital, Inc., Series A |
|
| 6.00 | % |
|
| 168,000 |
|
|
| 3,573,360 |
|
STAG Industrial, Inc., Series C |
|
| 6.88 | % |
|
| 15,000 |
|
|
| 378,750 |
|
Summit Hotel Properties, Inc., Series D |
|
| 6.45 | % |
|
| 15,000 |
|
|
| 204,600 |
|
Summit Hotel Properties, Inc., Series E |
|
| 6.25 | % |
|
| 180,000 |
|
|
| 2,367,000 |
|
Sunstone Hotel Investors, Inc., Series E |
|
| 6.95 | % |
|
| 117,000 |
|
|
| 2,340,000 |
|
Sunstone Hotel Investors, Inc., Series F |
|
| 6.45 | % |
|
| 27,955 |
|
|
| 538,134 |
|
Taubman Centers, Inc., Series J |
|
| 6.50 | % |
|
| 89,002 |
|
|
| 1,940,244 |
|
Taubman Centers, Inc., Series K |
|
| 6.25 | % |
|
| 20,024 |
|
|
| 440,127 |
|
Urstadt Biddle Properties, Inc., Series H |
|
| 6.25 | % |
|
| 39,315 |
|
|
| 698,628 |
|
Urstadt Biddle Properties, Inc., Series K |
|
| 5.88 | % |
|
| 113,000 |
|
|
| 1,908,762 |
|
18 | 1.888.926.2688 | www.griffincapital.com |
Griffin Institutional Access Real Estate Fund | Schedule of Investments |
March 31, 2020 (Unaudited)
Description |
| Coupon Rate |
|
| Shares |
|
| Value (Note 2) |
| |||
PREFERRED STOCKS (continued) |
|
|
|
|
|
|
|
|
|
| ||
VEREIT, Inc., Series F |
| 6.70 | % |
| 120,021 |
|
| $ | 2,652,464 |
| ||
Vornado Realty Trust, Series K |
|
| 5.70 | % |
|
| 217,500 |
|
|
| 4,708,875 |
|
Vornado Realty Trust, Series L |
|
| 5.40 | % |
|
| 92,000 |
|
|
| 1,858,400 |
|
Vornado Realty Trust, Series M |
|
| 5.25 | % |
|
| 101,000 |
|
|
| 1,975,560 |
|
|
|
|
|
|
|
|
|
|
|
|
|
|
| TOTAL PREFERRED STOCKS | ||||||||||||
(Cost $147,759,253) |
|
|
|
|
|
|
|
|
|
| 117,770,868 |
|
|
|
|
|
|
|
|
|
|
|
|
|
|
|
|
| 7-Day Yield |
|
|
|
|
|
|
|
|
|
SHORT TERM INVESTMENT (12.18%) |
|
|
|
|
|
|
|
|
|
|
|
|
Federated Treasury Obligations Fund, Class IS |
|
| 0.32 | % |
|
| 505,315,180 |
|
|
| 505,315,180 |
|
TOTAL SHORT TERM INVESTMENT |
|
|
|
|
|
|
|
|
|
|
|
|
(Cost $505,315,180) |
|
|
|
|
|
|
|
|
|
| 505,315,180 |
|
|
|
|
|
|
|
|
|
|
|
|
|
|
| TOTAL INVESTMENTS (97.84%) | ||||||||||||
(Cost $3,884,059,107) |
|
|
|
|
|
|
|
|
| $ | 4,059,797,711 |
|
|
|
|
|
|
|
|
|
|
|
|
|
|
Other Assets In Excess Of Liabilities (2.16%) |
|
|
|
|
|
|
|
|
|
| 89,615,756 |
|
NET ASSETS (100.00%) |
|
|
|
|
|
|
|
|
| $ | 4,149,413,467 |
|
(a) | These securities have no contractual maturity date, are not redeemable and contractually pay an indefinite stream of interest. |
Common Abbreviations:
LLC - Limited Liability Company
L.P. - Limited Partnership
REIT - Real Estate Investment Trust
Semi-Annual Report | March 31, 2020 | 19 |
| Griffin Institutional Access Real Estate Fund | Schedule of Investments |
March 31, 2020 (Unaudited)
| * | Additional Information on Investments in Private Investment Funds: |
| Value | Description | Redemption Frequency | Redemption Notice (Days) | Unfunded Commitments March 31, 2020 | ||||||||||||
| $ | 49,769,290 | AEW Core Property Trust (U.S.), Inc. | Quarterly | 45 | $ | 0 | ||||||||||
| 56,288,137 | American Core Realty Fund, L.P. | Quarterly | 10 | 0 | ||||||||||||
| 62,209,040 | Ares Real Estate Enhanced Income Fund, L.P. | Quarterly | 90 | 0 | ||||||||||||
| 13,752,710 | Barings Core Property Fund, L.P. | Quarterly | 30 | 0 | ||||||||||||
| 55,564,530 | BGO Diversified US Property Fund, L.P. | Quarterly | N/A** | 0 | ||||||||||||
| 50,437,700 | BlackRock US Core Property Fund | Quarterly | 60 | 0 | ||||||||||||
| 104,074,815 | Brookfield Senior Mezzanine Real Estate Finance Fund | Quarterly | 90 | 22,998,806 | ||||||||||||
| 109,643,210 | CBRE U.S. Core Partners, L.P. | Quarterly | 60 | 0 | ||||||||||||
| 189,591,474 | Clarion Gables Multifamily Trust, L.P. | Quarterly | 90 | 0 | ||||||||||||
| 118,732,903 | Clarion Lion Industrial Trust, L.P. | Quarterly | 90 | 75,000,000 | ||||||||||||
| 242,784,122 | Clarion Lion Properties Fund, L.P. | Quarterly | 90 | 0 | ||||||||||||
| 225,990,430 | Cortland Growth and Income Fund, L.P. | Quarterly | 90 | 0 | ||||||||||||
| 102,905,964 | CrossHarbor Strategic Debt Fund, L.P. | Quarterly | 90 | 0 | ||||||||||||
| 26,081,064 | GWL U.S. Property Fund, L.P. | Quarterly | 90 | 0 | ||||||||||||
| 83,744,587 | Hancock U.S. Real Estate Fund, L.P. | Quarterly | 60 | 0 | ||||||||||||
| 31,674,835 | Heitman America Real Estate Trust, L.P. | Quarterly | 90 | 0 | ||||||||||||
| 139,633,736 | Heitman Core Real Estate Debt Income Trust | Quarterly | 90 | 45,000,000 | ||||||||||||
| 45,141,748 | JPM U.S. Real Estate Mezzanine Debt Fund, L.P. | Quarterly | 60 | 55,347,045 | ||||||||||||
| 10,088,476 | MetLife Commercial Mortgage Income Fund, L.P. | Quarterly | 90 | 0 | ||||||||||||
| 247,500,269 | Morgan Stanley Prime Property Fund | Quarterly | 90 | 0 | ||||||||||||
| 143,354,055 | Oaktree Real Estate Income Fund, L.P. | Quarterly | 90 | 0 | ||||||||||||
| 84,974,007 | PGIM Real Estate US Debt Fund, L.P. | Quarterly | 90 | 0 | ||||||||||||
| 183,191,154 | PRISA, L.P. | Quarterly | 90 | 0 | ||||||||||||
| 67,120,446 | Prologis Targeted U.S. Logistics Fund, L.P. | Quarterly | 90 | 34,000,000 | ||||||||||||
| 31,639,075 | RREEF America REIT II, Inc. | Quarterly | 45 | 0 | ||||||||||||
| 79,400,606 | Sentinel Real Estate Fund, L.P. | Quarterly | N/A** | 0 | ||||||||||||
| 68,102,070 | Stockbridge Smart Markets Fund, L.P. | Quarterly | 45 | 0 | ||||||||||||
| 157,544,561 | TA Realty Core Property Fund, L.P. | Quarterly | 45 | 0 | ||||||||||||
| 101,264,123 | TCM CRE Credit Fund, L.P. | Quarterly | 90 | 26,500,000 | ||||||||||||
| 52,809,585 | Torchlight Value Fund, LLC | Monthly | 15 | 0 | ||||||||||||
| 18,051,339 | UBS Trumbull Property Fund | Quarterly | 60 | 0 | ||||||||||||
| 73,169,438 | USAA US Government Building Fund, LLC | Quarterly | 60 | 0 | ||||||||||||
| 83,575,781 | Ventas Life Science And Healthcare Real Estate Fund | Quarterly | 90 | 75,000,000 | ||||||||||||
| 45,001,671 | Voya Commercial Mortgage Lending Fund, L.P. | Quarterly | 90 | 15,000,000 | ||||||||||||
| $ | 3,154,806,951 | $ | 348,845,851 | |||||||||||||
| ** | Written notice required for redemption, no minimum timeline required. |
See Notes to Financial Statements.
| 20 | 1.888.926.2688 | www.griffincapital.com |
| Griffin Institutional Access Real Estate Fund | Statement of Assets and Liabilities |
March 31, 2020 (Unaudited)
| ASSETS | ||||
| Investments, at value (Cost $3,884,059,107) | $ | 4,059,797,711 | ||
| Receivable for investments sold | 125,610,204 | |||
| Dividend receivable | 22,245,088 | |||
| Cash | 12,740,769 | |||
| Receivable for shares sold | 3,227,380 | |||
| Prepaid expenses and other assets | 170,330 | |||
| Total Assets | 4,223,791,482 | |||
| LIABILITIES | ||||
| Payable for investments purchased | 63,537,609 | |||
| Payable for investment advisory fees (Note 3) | 5,406,436 | |||
| Payable for distribution fees (Note 3) | 980,721 | |||
| Payable for shareholder servicing fees (Note 3) | 313,187 | |||
| Payable for transfer agency fees (Note 3) | 298,086 | |||
| Payable for lines of credit interest (Note 6) | 233,802 | |||
| Payable for shares redeemed | 175,026 | |||
| Payable for administration fees (Note 3) | 119,302 | |||
| Payable for trustees' fees (Note 3) | 51,296 | |||
| Payable for legal fees | 23,590 | |||
| Payable for audit and tax fees | 11,813 | |||
| Payable for custody fees | 1,713 | |||
| Payable for compliance service fees (Note 3) | 1,625 | |||
| Accrued expenses and other liabilities | 3,223,809 | |||
| Total Liabilities | 74,378,015 | |||
| NET ASSETS | $ | 4,149,413,467 | ||
| NET ASSETS CONSIST OF | ||||
| Paid-in capital | $ | 3,985,913,130 | ||
| Total distributable earnings | 163,500,337 | |||
| NET ASSETS | $ | 4,149,413,467 | ||
| PRICING OF SHARES | ||||
| Class A: | ||||
| Net asset value | $ | 25.36 | ||
| Net assets | $ | 832,292,927 | ||
| Shares of beneficial interest outstanding (unlimited number of shares, no par value common stock authorized) | 32,819,240 | |||
| Maximum offering price per share ((NAV/0.9425), based on maximum sales charge of 5.75% of the offering price) | $ | 26.91 | ||
| Class C: | ||||
| Net asset value and maximum offering price | $ | 24.51 | ||
| Net assets | $ | 538,097,423 | ||
| Shares of beneficial interest outstanding (unlimited number of shares, no par value common stock authorized) | 21,955,037 | |||
| Class I: | ||||
| Net asset value and maximum offering price | $ | 25.66 | ||
| Net assets | $ | 1,750,326,377 | ||
| Shares of beneficial interest outstanding (unlimited number of shares, no par value common stock authorized) | 68,210,633 | |||
| Class M: | ||||
| Net asset value and maximum offering price | $ | 24.95 | ||
| Net assets | $ | 950,966,664 | ||
| Shares of beneficial interest outstanding (unlimited number of shares, no par value common stock authorized) | 38,116,077 | |||
| Class L: | ||||
| Net asset value | $ | 25.21 | ||
| Net assets | $ | 77,730,076 | ||
| Shares of beneficial interest outstanding (unlimited number of shares, no par value common stock authorized) | 3,083,786 | |||
| Maximum offering price per share ((NAV/0.9575), based on maximum sales charge of 4.25% of the offering price) | $ | 26.33 | ||
See Notes to Financial Statements.
| Semi-Annual Report | March 31, 2020 | 21 |
| Griffin Institutional Access Real Estate Fund | Statement of Operations |
For the Six Months March 31, (Unaudited) | ||||
| INVESTMENT INCOME | ||||
| Dividend Income | 72,120,233 | |||
| Total Investment Income | 72,120,233 | |||
| EXPENSES | ||||
| Investment advisory fees (Note 3) | 30,743,059 | |||
| Administration fees (Note 3) | 654,600 | |||
| Transfer agency fees (Note 3) | 684,555 | |||
| Shareholder servicing fees (Note 3): | ||||
| Class A | 1,050,525 | |||
| Class C | 689,445 | |||
| Class L | 108,182 | |||
| Distribution fees (Note 3): | ||||
| Class C | 2,068,335 | |||
| Class M | 3,422,436 | |||
| Class L | 108,182 | |||
| Interest expense (Note 6) | 1,217,824 | |||
| Reports to shareholders and printing fees | 511,371 | |||
| Legal fees | 254,081 | |||
| SEC registration fees | 108,359 | |||
| Trustees' fees (Note 3) | 98,679 | |||
| Insurance fees | 84,451 | |||
| State registration fees | 65,032 | |||
| Compliance service fees (Note 3) | 56,311 | |||
| Custody fees | 38,361 | |||
| Audit and tax fees | 11,813 | |||
| Other expenses | 38,154 | |||
| Total Expenses | 42,013,755 | |||
| Expense recoupment of previously waived fees (Note 3) | 544,365 | |||
| Net Investment Income | 29,562,113 | |||
| Net realized loss on investments | (137,868,802 | ) | ||
| Long-term capital gain distributions from other investment companies | 443,749 | |||
| Net change in unrealized depreciation on investments | (110,002,352 | ) | ||
| NET REALIZED AND UNREALIZED LOSS ON INVESTMENTS | (247,427,405 | ) | ||
| NET DECREASE IN NET ASSETS RESULTING FROM OPERATIONS | $ | (217,865,292 | ) | |
See Notes to Financial Statements.
| 22 | 1.888.926.2688 | www.griffincapital.com |
| Griffin Institutional Access Real Estate Fund | Statements of Changes in Net Assets |
| For the Six Months Ended March 31, 2020 (Unaudited) | For the 2019 | |||||||
| OPERATIONS: | ||||||||
| Net investment income | $ | 29,562,113 | $ | 41,888,890 | ||||
| Net realized gain/(loss) on investments and long-term capital gain distributions from other investment companies | (137,425,053 | ) | 79,653,592 | |||||
| Net change in unrealized appreciation/(depreciation) on investments | (110,002,352 | ) | 91,476,780 | |||||
| Net Increase/(Decrease) in Net Assets Resulting from Operations | (217,865,292 | ) | 213,019,262 | |||||
| DISTRIBUTIONS TO SHAREHOLDERS: | ||||||||
| Class A | ||||||||
| From distributable earnings | (1,598,106 | ) | (15,373,656 | ) | ||||
| From return of capital | (20,412,196 | ) | (26,980,045 | ) | ||||
| Class C | ||||||||
| From distributable earnings | (1,029,597 | ) | (9,788,370 | ) | ||||
| From return of capital | (13,150,765 | ) | (16,602,295 | ) | ||||
| Class I | ||||||||
| From distributable earnings | (3,260,623 | ) | (23,840,687 | ) | ||||
| From return of capital | (41,647,081 | ) | (42,745,732 | ) | ||||
| Class M | ||||||||
| From distributable earnings | (1,757,683 | ) | (11,233,577 | ) | ||||
| From return of capital | (22,450,429 | ) | (20,995,723 | ) | ||||
| Class L | ||||||||
| From distributable earnings | (139,683 | ) | (1,367,810 | ) | ||||
| From return of capital | (1,784,136 | ) | (2,649,815 | ) | ||||
| Total Distributions to Shareholders | (107,230,299 | ) | (171,577,710 | ) | ||||
| BENEFICIAL INTEREST TRANSACTIONS: | ||||||||
| Class A | ||||||||
| Shares sold | $ | 119,347,398 | $ | 270,553,434 | ||||
| Distributions reinvested | 11,239,435 | 22,856,649 | ||||||
| Shares redeemed | (60,133,842 | ) | (114,130,926 | ) | ||||
| Shares transferred out | (52,951,807 | ) | (26,609,912 | ) | ||||
| Class C | ||||||||
| Shares sold | 69,741,157 | 107,960,714 | ||||||
| Distributions reinvested | 8,074,837 | 15,698,844 | ||||||
| Shares redeemed | (28,512,874 | ) | (56,584,257 | ) | ||||
| Shares transferred out | (3,568,002 | ) | (5,262,571 | ) | ||||
| Class I | ||||||||
| Shares sold | 371,165,155 | 543,201,728 | ||||||
| Distributions reinvested | 20,622,830 | 33,972,598 | ||||||
| Shares redeemed | (76,024,720 | ) | (150,571,487 | ) | ||||
| Shares transferred in | 95,358,521 | 34,268,747 | ||||||
| Class M | ||||||||
| Shares sold | 222,500,956 | 386,076,614 | ||||||
| Distributions reinvested | 19,831,914 | 26,083,890 | ||||||
| Shares redeemed | (22,288,684 | ) | (10,726,840 | ) | ||||
| Shares transferred out | (472,899 | ) | (931,992 | ) | ||||
| Class L | ||||||||
| Shares sold | 22,937,426 | 56,223,422 | ||||||
| Distributions reinvested | 1,329,225 | 2,796,301 | ||||||
| Shares redeemed | (2,413,270 | ) | (3,958,347 | ) | ||||
| Shares transferred out | (38,365,813 | ) | (1,464,272 | ) | ||||
| Net Increase in Net Assets Derived from Beneficial Interest Transactions | 677,416,943 | 1,129,452,337 | ||||||
| Net increase in net assets | 352,321,352 | 1,170,893,889 | ||||||
See Notes to Financial Statements.
| Semi-Annual Report | March 31, 2020 | 23 |
| Griffin Institutional Access Real Estate Fund | Statements of Changes in Net Assets |
| For the Six Months Ended March 31, 2020 (Unaudited) | For the Year Ended September 30, 2019 | |||||||
| NET ASSETS: | ||||||||
| Beginning of period | 3,797,092,115 | 2,626,198,226 | ||||||
| End of period | $ | 4,149,413,467 | $ | 3,797,092,115 | ||||
| Other Information | ||||||||
| BENEFICIAL INTEREST TRANSACTIONS: | ||||||||
| Class A | ||||||||
| Beginning shares | 32,142,589 | 26,532,652 | ||||||
| Shares sold | 4,369,761 | 9,937,145 | ||||||
| Distributions reinvested | 429,941 | 844,017 | ||||||
| Shares redeemed | (2,189,400 | ) | (4,197,046 | ) | ||||
| Shares transferred out | (1,933,651 | ) | (974,179 | ) | ||||
| Net increase in shares outstanding | 676,651 | 5,609,937 | ||||||
| Ending shares | 32,819,240 | 32,142,589 | ||||||
| Class C | ||||||||
| Beginning shares | 20,206,313 | 17,875,089 | ||||||
| Shares sold | 2,636,213 | 4,069,997 | ||||||
| Distributions reinvested | 319,356 | 595,897 | ||||||
| Shares redeemed | (1,071,907 | ) | (2,136,675 | ) | ||||
| Shares transferred out | (134,938 | ) | (197,995 | ) | ||||
| Net increase in shares outstanding | 1,748,724 | 2,331,224 | ||||||
| Ending shares | 21,955,037 | 20,206,313 | ||||||
| Class I | ||||||||
| Beginning shares | 53,290,893 | 36,533,117 | ||||||
| Shares sold | 13,435,886 | 19,754,093 | ||||||
| Distributions reinvested | 780,694 | 1,242,119 | ||||||
| Shares redeemed | (2,735,559 | ) | (5,481,351 | ) | ||||
| Shares transferred in | 3,438,719 | 1,242,915 | ||||||
| Net increase in shares outstanding | 14,919,740 | 16,757,776 | ||||||
| Ending shares | 68,210,633 | 53,290,893 | ||||||
| Class M | ||||||||
| Beginning shares | 29,940,573 | 15,075,805 | ||||||
| Shares sold | 8,243,524 | 14,324,122 | ||||||
| Distributions reinvested | 771,928 | 973,903 | ||||||
| Shares redeemed | (823,203 | ) | (398,636 | ) | ||||
| Shares transferred out | (16,745 | ) | (34,621 | ) | ||||
| Net increase in shares outstanding | 8,175,504 | 14,864,768 | ||||||
| Ending shares | 38,116,077 | 29,940,573 | ||||||
| Class L | ||||||||
| Beginning shares | 3,678,857 | 1,706,333 | ||||||
| Shares sold | 845,877 | 2,069,165 | ||||||
| Distributions reinvested | 51,258 | 103,529 | ||||||
| Shares redeemed | (88,361 | ) | (146,356 | ) | ||||
| Shares transferred out | (1,403,845 | ) | (53,814 | ) | ||||
| Net increase/(decrease) in shares outstanding | (595,071 | ) | 1,972,524 | |||||
| Ending shares | 3,083,786 | 3,678,857 | ||||||
See Notes to Financial Statements.
| 24 | 1.888.926.2688 | www.griffincapital.com |
| Griffin Institutional Access Real Estate Fund | Statement of Cash Flows |
For the Six Months March 31, 2020 (Unaudited) | ||||
| Operating Activities: | ||||
| Net decrease in net assets resulting from operations | $ | (217,865,292 | ) | |
| Adjustments to reconcile net decrease in net assets from operations to net cash used in operating activities: | ||||
| Purchase of investments | (1,679,172,458 | ) | ||
| Proceeds from sale of investments | 1,245,342,316 | |||
| Net purchases of short-term investments | (193,282,295 | ) | ||
| Net realized loss on investments | 137,868,802 | |||
| Long-term capital gain distributions from other investment companies | (443,749 | ) | ||
| Net unrealized depreciation on investments | 110,002,352 | |||
| Change in operating assets and liabilities: | ||||
| Dividend receivables | (1,225,856 | ) | ||
| Prepaid expenses and other assets | 3,197 | |||
| Payable for investment advisory fees | 855,256 | |||
| Payable for distribution fees | 151,561 | |||
| Payable for shareholder servicing fees | 5,503 | |||
| Payable for transfer agency fees | (28,055 | ) | ||
| Payable for lines of credit interest | 169,219 | |||
| Payable for administration fees | 15,597 | |||
| Payable for trustees' fees | 46,908 | |||
| Payable for legal fees | (64,296 | ) | ||
| Payable for audit and tax fees | (11,687 | ) | ||
| Payable for custody fees | (2,729 | ) | ||
| Payable for compliance service fees | (29,248 | ) | ||
| Accrued expenses and other liabilities | 346,338 | |||
| Net cash used in operating activities | (597,318,616 | ) | ||
| Financing Activities: | ||||
| Proceeds from shares sold | 811,697,356 | |||
| Cost of shares redeemed | (189,198,364 | ) | ||
| Distributions paid to common shareholders | (46,132,058 | ) | ||
| Net cash provided by financing activities | 576,366,934 | |||
| Cash and cash equivalents, beginning of period | $ | 33,692,451 | ||
| Cash and cash equivalents, end of period | $ | 12,740,769 | ||
| SUPPLEMENTAL DISCLOSURE OF CASH FLOW INFORMATION: | ||||
| Non-cash financing activities not included herein consist of reinvestment of distributions of: | $ | 61,098,241 | ||
| Cash paid during the period for interest from bank borrowing: | $ | 1,048,605 | ||
See Notes to Financial Statements.
| Semi-Annual Report | March 31, 2020 | 25 |
Griffin Institutional Access Real Estate Fund – Class A | Financial Highlights |
For a Share Outstanding Throughout the Periods Presented | |
|
| For the |
|
| For the Year 2019 |
|
| For the Year 2018 |
|
| For the Year 2017 |
|
| For the Year 2016 |
|
| For the Year 2015 |
| ||||||
Net asset value, beginning of period |
| $ | 27.36 |
|
| $ | 26.94 |
|
| $ | 26.65 |
|
| $ | 26.63 |
|
| $ | 25.97 |
|
| $ | 25.31 |
|
INCOME FROM INVESTMENT OPERATIONS: |
|
|
|
|
|
|
|
|
|
|
|
|
|
|
|
|
|
|
|
|
|
|
|
|
Net investment income(a) |
|
| 0.21 |
|
|
| 0.39 |
|
|
| 0.38 |
|
|
| 0.28 |
|
|
| 0.24 |
|
|
| 0.09 |
|
Net realized and unrealized gain/(loss) |
|
| (1.52 | ) |
|
| 1.46 |
|
|
| 1.32 |
|
|
| 1.14 |
|
|
| 1.81 |
|
|
| 1.90 |
|
Total from investment operations |
|
| (1.31 | ) |
|
| 1.85 |
|
|
| 1.70 |
|
|
| 1.42 |
|
|
| 2.05 |
|
|
| 1.99 |
|
DISTRIBUTIONS: |
|
|
|
|
|
|
|
|
|
|
|
|
|
|
|
|
|
|
|
|
|
|
|
|
From net investment income |
|
| (0.04 | ) |
|
| – |
|
|
| – |
|
|
| – |
|
|
| (0.02 | ) |
|
| – |
|
From net realized gain on investments |
|
| (0.01 | ) |
|
| (0.54 | ) |
|
| (0.20 | ) |
|
| (0.30 | ) |
|
| (0.32 | ) |
|
| (0.32 | ) |
Return of capital |
|
| (0.64 | ) |
|
| (0.89 | ) |
|
| (1.21 | ) |
|
| (1.10 | ) |
|
| (1.05 | ) |
|
| (1.01 | ) |
Total distributions(b)(c) |
|
| (0.69 | ) |
|
| (1.43 | ) |
|
| (1.41 | ) |
|
| (1.40 | ) |
|
| (1.39 | ) |
|
| (1.33 | ) |
Net increase/(decrease) in net asset value |
|
| (2.00 | ) |
|
| 0.42 |
|
|
| 0.29 |
|
|
| 0.02 |
|
|
| 0.66 |
|
|
| 0.66 |
|
Net asset value, end of period |
| $ | 25.36 |
|
| $ | 27.36 |
|
| $ | 26.94 |
|
| $ | 26.65 |
|
| $ | 26.63 |
|
| $ | 25.97 |
|
TOTAL RETURN(d) |
|
| (4.84 | )% |
|
| 7.05 | % |
|
| 6.54 | % |
|
| 5.47 | % |
|
| 8.07 | % |
|
| 8.03 | % |
RATIOS/SUPPLEMENTAL DATA: |
|
|
|
|
|
|
|
|
|
|
|
|
|
|
|
|
|
|
|
|
|
|
|
|
Net assets, end of period (000s) |
| $ | 832,293 |
|
| $ | 879,401 |
|
| $ | 714,880 |
|
| $ | 639,448 |
|
| $ | 510,251 |
|
| $ | 130,847 |
|
Ratios to Average Net Assets (including interest expense) |
|
|
|
|
|
|
|
|
|
|
|
|
|
|
|
|
|
|
|
|
|
|
|
|
Ratio of expenses to average net assets excluding fee waivers and reimbursements/recoupment of previously waived fees(e) |
|
| 1.93 | %(f) |
|
| 1.94 | % |
|
| 2.11 | % |
|
| 2.29 | % |
|
| 2.41 | % |
|
| 2.82 | % |
Ratio of expenses to average net assets including fee waivers and reimbursements/recoupment of previously waived fees(e) |
|
| 1.97 | %(f) |
|
| 1.96 | % |
|
| 2.11 | % |
|
| 2.23 | % |
|
| 2.23 | % |
|
| 1.94 | % |
Ratio of net investment income to average net assets(e)(g) |
|
| 1.53 | %(f) |
|
| 1.43 | % |
|
| 1.41 | % |
|
| 1.06 | % |
|
| 0.92 | % |
|
| 0.35 | % |
Ratios to Average Net Assets (excluding interest expense) |
|
|
|
|
|
|
|
|
|
|
|
|
|
|
|
|
|
|
|
|
|
|
|
|
Ratio of expenses to average net assets excluding fee waivers and reimbursements/recoupment of previously waived fees(e) |
|
| 1.87 | %(f) |
|
| 1.89 | % |
|
| 1.91 | % |
|
| 1.97 | % |
|
| 2.09 | % |
|
| 2.79 | % |
Ratio of expenses to average net assets including fee waivers and reimbursements/recoupment of previously waived fees(e) |
|
| 1.91 | %(f) |
|
| 1.91 | % |
|
| 1.91 | % |
|
| 1.91 | % |
|
| 1.91 | % |
|
| 1.91 | % |
Ratio of net investment income to average net assets excluding fee waivers and reimbursements(e)(g) |
|
| 1.63 | %(f) |
|
| 1.50 | % |
|
| 1.61 | % |
|
| 1.31 | % |
|
| 1.05 | % |
|
| 0.38 | % |
Portfolio turnover rate(h) |
|
| 35 | % |
|
| 22 | % |
|
| 15 | % |
|
| 11 | % |
|
| 8 | % |
|
| 29 | % |
See Notes to Financial Statements.
26 | 1.888.926.2688 | www.griffincapital.com |
Griffin Institutional Access Real Estate Fund – Class A | Financial Highlights |
For a Share Outstanding Throughout the Periods Presented | |
(a) | Calculated using the average shares method. |
(b) | Total distributions during a calendar year generally will be made from the Fund’s net investment income, net realized gains on investments and net unrealized gains on investments, if any. The portion of distributions paid not attributable to net investment income or net realized gains on investments, if any, is distributed from the Fund’s assets and is treated by shareholders as a nontaxable distribution (“Return of Capital”) for tax purposes. Return of capital is a tax concept, not an economic concept. The tax character of the Fund’s distributions, in isolation, does not reveal much information about whether the distributions are supported by the Fund’s returns. Reported distributions from net investment income and realized gains on investments are not an indication as to whether or not the Fund’s distributions are supported by the Fund’s returns. The Fund can have distributions from net investment income and realized capital gains in years in which it incurs an economic loss due to unrealized losses not being recognized for tax purposes. A common method in which to determine if the Fund’s distributions are supported by economic returns is to examine the Fund’s Net Asset Value (“NAV”) over the course of a year. If the Fund’s NAV has increased, the Fund will have economically earned more than it has distributed, regardless of whether such distributions are reported as being from net investment income, net realized gains on investments or return of capital. If the Fund’s NAV decreases, the Fund will have distributed more than it has economically earned or it will have incurred an economic loss. |
(c) | The Fund has substantial investments in real estate investment trusts, or REITs, which are generally not subject to federal income taxes. Distributions that the Fund receives from REITs can be classified as ordinary income, capital gain income or return of capital by the REITs that make these distributions to the Fund. However, it is not possible for the Fund to characterize distributions received from REITs during interim periods because the REIT issuers do not report their tax characterizations until after year end. The Fund has estimated the character of distributions for the six-month period ended March 31, 2020 based on the percentage of such distributions attributable to net investment income, net realized gains and return of capital for the fiscal year ended September 30, 2019. Final characterization of the Fund’s 2020 distributions to its common shareholders is also dependent upon the size or timing of the Fund’s securities transactions prior to year-end. Therefore, it is likely that some portion of the Fund’s 2020 investment income and distributions to its common shareholders will be recharacterized as long term capital gain and return of capital for financial statement and U.S. federal income tax purposes subsequent to year end and reflected accordingly in the Fund’s year-end financial statements. |
(d) | Total returns are for the period indicated and do not reflect the impact of sales charge. Total returns would have been lower had certain expenses not been waived during the period. Returns shown do not reflect the deduction of taxes that a shareholder would pay on Fund distributions or the redemption of Fund shares. |
(e) | The ratios of expenses to average net assets and net investment income to average net assets do not reflect the expenses of the underlying private real estate funds in which the Fund invests which typically range from 0.80% to 1.00% on an annual basis. However, the Fund invests in each underlying private real estate investment fund based upon the net asset value of each such fund which reflects the costs of investing in the applicable fund, including the management fee of the underlying fund and other operating expenses. The net asset value of each underlying private real estate investment fund is incorporated into the ratios described above. |
(f) | Annualized. |
(g) | Recognition of net investment income is affected by the timing and declaration of dividends by the underlying investment companies in which the Fund invests. |
(h) | Portfolio turnover rate for periods less than one full year has not been annualized and is calculated at the Fund level. |
See Notes to Financial Statements.
Semi-Annual Report | March 31, 2020 | 27 |
Griffin Institutional Access Real Estate Fund – Class C | Financial Highlights |
For a Share Outstanding Throughout the Periods Presented | |
|
| For the |
|
| For the Year 2019 |
|
| For the Year 2018 |
|
| For the Year 2017 |
|
| For the Year 2016 |
|
| For the 2015(a) |
| ||||||
Net asset value, beginning of period |
| $ | 26.54 |
|
| $ | 26.33 |
|
| $ | 26.24 |
|
| $ | 26.42 |
|
| $ | 25.95 |
|
| $ | 26.20 |
|
INCOME FROM INVESTMENT OPERATIONS: |
|
|
|
|
|
|
|
|
|
|
|
|
|
|
|
|
|
|
|
|
|
|
|
|
Net investment income(b) |
|
| 0.10 |
|
|
| 0.18 |
|
|
| 0.17 |
|
|
| 0.08 |
|
|
| 0.04 |
|
|
| 0.00 | (c) |
Net realized and unrealized gain/(loss) |
|
| (1.46 | ) |
|
| 1.42 |
|
|
| 1.31 |
|
|
| 1.12 |
|
|
| 1.82 |
|
|
| 0.09 |
|
Total from investment operations |
|
| (1.36 | ) |
|
| 1.60 |
|
|
| 1.48 |
|
|
| 1.20 |
|
|
| 1.86 |
|
|
| 0.09 |
|
DISTRIBUTIONS: |
|
|
|
|
|
|
|
|
|
|
|
|
|
|
|
|
|
|
|
|
|
|
|
|
From net investment income |
|
| (0.04 | ) |
|
| – |
|
|
| – |
|
|
| – |
|
|
| (0.03 | ) |
|
| – |
|
From net realized gain on investments |
|
| (0.01 | ) |
|
| (0.52 | ) |
|
| (0.20 | ) |
|
| (0.30 | ) |
|
| (0.32 | ) |
|
| – |
|
Return of capital |
|
| (0.62 | ) |
|
| (0.87 | ) |
|
| (1.19 | ) |
|
| (1.08 | ) |
|
| (1.04 | ) |
|
| (0.34 | ) |
Total distributions(d)(e) |
|
| (0.67 | ) |
|
| (1.39 | ) |
|
| (1.39 | ) |
|
| (1.38 | ) |
|
| (1.39 | ) |
|
| (0.34 | ) |
Net increase/(decrease) in net asset value |
|
| (2.03 | ) |
|
| 0.21 |
|
|
| 0.09 |
|
|
| (0.18 | ) |
|
| 0.47 |
|
|
| (0.25 | ) |
Net asset value, end of period |
| $ | 24.51 |
|
| $ | 26.54 |
|
| $ | 26.33 |
|
| $ | 26.24 |
|
| $ | 26.42 |
|
| $ | 25.95 |
|
TOTAL RETURN(f) |
|
| (5.19 | )% |
|
| 6.24 | % |
|
| 5.76 | % |
|
| 4.68 | % |
|
| 7.30 | % |
|
| 0.34 | % |
RATIOS/SUPPLEMENTAL DATA: |
|
|
|
|
|
|
|
|
|
|
|
|
|
|
|
|
|
|
|
|
|
|
|
|
Net assets, end of period (000s) |
| $ | 538,097 |
|
| $ | 536,289 |
|
| $ | 470,711 |
|
| $ | 445,191 |
|
| $ | 302,319 |
|
| $ | 13,547 |
|
Ratios to Average Net Assets (including interest expense) |
|
|
|
|
|
|
|
|
|
|
|
|
|
|
|
|
|
|
|
|
|
|
|
|
Ratio of expenses to average net assets excluding fee waivers and reimbursements/recoupment of previously waived fees(g) |
|
| 2.69 | %(h) |
|
| 2.70 | % |
|
| 2.86 | % |
|
| 3.04 | % |
|
| 3.18 | % |
|
| 3.32 | %(h) |
Ratio of expenses to average net assets including fee waivers and reimbursements/recoupment of previously waived fees (g) |
|
| 2.72 | %(h) |
|
| 2.72 | % |
|
| 2.86 | % |
|
| 2.98 | % |
|
| 2.98 | % |
|
| 2.69 | %(h) |
Ratio of net investment income to average net assets(g)(i) |
|
| 0.79 | %(h) |
|
| 0.68 | % |
|
| 0.66 | % |
|
| 0.30 | % |
|
| 0.17 | % |
|
| 0.00 | %(h)(j) |
Ratios to Average Net Assets (excluding interest expense) |
|
|
|
|
|
|
|
|
|
|
|
|
|
|
|
|
|
|
|
|
|
|
|
|
Ratio of expenses to average net assets excluding fee waivers and reimbursements/recoupment of previously waived fees(g) |
|
| 2.63 | %(h) |
|
| 2.64 | % |
|
| 2.66 | % |
|
| 2.72 | % |
|
| 2.86 | % |
|
| 3.29 | %(h) |
Ratio of expenses to average net assets including fee waivers and reimbursements/recoupment of previously waived fees(g) |
|
| 2.66 | %(h) |
|
| 2.66 | % |
|
| 2.66 | % |
|
| 2.66 | % |
|
| 2.66 | % |
|
| 2.66 | %(h) |
Ratio of net investment income to average net assets excluding fee waivers and reimbursements(g)(i) |
|
| 0.88 | %(h) |
|
| 0.76 | % |
|
| 0.86 | % |
|
| 0.56 | % |
|
| 0.29 | % |
|
| 0.03 | %(h) |
Portfolio turnover rate(k) |
|
| 35 | % |
|
| 22 | % |
|
| 15 | % |
|
| 11 | % |
|
| 8 | % |
|
| 29 | % |
See Notes to Financial Statements.
28 | 1.888.926.2688 | www.griffincapital.com |
Griffin Institutional Access Real Estate Fund – Class C | Financial Highlights |
For a Share Outstanding Throughout the Periods Presented | |
(a) | The Fund’s Class C shares commenced operations on August 10, 2015. |
(b) | Calculated using the average shares method. |
(c) | Less than $0.005 per share. |
(d) | Total distributions during a calendar year generally will be made from the Fund’s net investment income, net realized gains on investments and net unrealized gains on investments, if any. The portion of distributions paid not attributable to net investment income or net realized gains on investments, if any, is distributed from the Fund’s assets and is treated by shareholders as a nontaxable distribution (“Return of Capital”) for tax purposes. Return of capital is a tax concept, not an economic concept. The tax character of the Fund’s distributions, in isolation, does not reveal much information about whether the distributions are supported by the Fund’s returns. Reported distributions from net investment income and realized gains on investments are not an indication as to whether or not the Fund’s distributions are supported by the Fund’s returns. The Fund can have distributions from net investment income and realized capital gains in years in which it incurs an economic loss due to unrealized losses not being recognized for tax purposes. A common method in which to determine if the Fund’s distributions are supported by economic returns is to examine the Fund’s Net Asset Value (“NAV”) over the course of a year. If the Fund’s NAV has increased, the Fund will have economically earned more than it has distributed, regardless of whether such distributions are reported as being from net investment income, net realized gains on investments or return of capital. If the Fund’s NAV decreases, the Fund will have distributed more than it has economically earned or it will have incurred an economic loss. |
(e) | The Fund has substantial investments in real estate investment trusts, or REITs, which are generally not subject to federal income taxes. Distributions that the Fund receives from REITs can be classified as ordinary income, capital gain income or return of capital by the REITs that make these distributions to the Fund. However, it is not possible for the Fund to characterize distributions received from REITs during interim periods because the REIT issuers do not report their tax characterizations until after year end. The Fund has estimated the character of distributions for the six-month period ended March 31, 2020 based on the percentage of such distributions attributable to net investment income, net realized gains and return of capital for the fiscal year ended September 30, 2019. Final characterization of the Fund’s 2020 distributions to its common shareholders is also dependent upon the size or timing of the Fund’s securities transactions prior to year-end. Therefore, it is likely that some portion of the Fund’s 2020 investment income and distributions to its common shareholders will be recharacterized as long term capital gain and return of capital for financial statement and U.S. federal income tax purposes subsequent to year end and reflected accordingly in the Fund’s year-end financial statements. |
(f) | Total returns are for the period indicated and have not been annualized for periods less than a year and do not reflect the impact of sales charge. Total returns would have been lower had certain expenses not been waived during the period. Returns shown do not reflect the deduction of taxes that a shareholder would pay on Fund distributions or the redemption of Fund shares. |
(g) | The ratios of expenses to average net assets and net investment income to average net assets do not reflect the expenses of the underlying private real estate funds in which the Fund invests which typically range from 0.80% to 1.00% on an annual basis. However, the Fund invests in each underlying private real estate investment fund based upon the net asset value of each such fund which reflects the costs of investing in the applicable fund, including the management fee of the underlying fund and other operating expenses. The net asset value of each underlying private real estate investment fund is incorporated into the ratios described above. |
(h) | Annualized. |
(i) | Recognition of net investment income is affected by the timing and declaration of dividends by the underlying investment companies in which the Fund invests. |
(j) | Less than 0.005%. |
(k) | Portfolio turnover rate for periods less than one full year has not been annualized and is calculated at the Fund level. |
See Notes to Financial Statements.
Semi-Annual Report | March 31, 2020 | 29 |
Griffin Institutional Access Real Estate Fund – Class I | Financial Highlights |
For a Share Outstanding Throughout the Periods Presented
|
| For the Six Months Ended March 31, 2020 (Unaudited) |
|
| For the Year Ended September 30, 2019 |
|
| For the Year Ended September 30, 2018 |
|
| For the Year Ended September 30, 2017 |
|
| For the Year Ended September 30, 2016 |
|
| For the Period Ended September 30, 2015(a) |
| ||||||
Net asset value, beginning of period |
| $ | 27.65 |
|
| $ | 27.16 |
|
| $ | 26.80 |
|
| $ | 26.71 |
|
| $ | 25.98 |
|
| $ | 26.20 |
|
INCOME FROM INVESTMENT OPERATIONS: |
|
|
|
|
|
|
|
|
|
|
|
|
|
|
|
|
| |||||||
Net investment income(b) |
|
| 0.25 |
|
|
| 0.46 |
|
|
| 0.45 |
|
|
| 0.35 |
|
|
| 0.31 |
|
|
| 0.03 |
|
Net realized and unrealized gain/(loss) |
|
| (1.54 | ) |
|
| 1.48 |
|
|
| 1.33 |
|
|
| 1.15 |
|
|
| 1.82 |
|
|
| 0.09 |
|
Total from investment operations |
|
| (1.29 | ) |
|
| 1.94 |
|
|
| 1.78 |
|
|
| 1.50 |
|
|
| 2.13 |
|
|
| 0.12 |
|
|
|
|
|
|
|
|
|
|
|
|
|
|
|
|
|
|
|
|
|
|
|
|
|
|
DISTRIBUTIONS: |
|
|
|
|
|
|
|
|
|
|
|
|
|
|
|
|
|
|
|
|
|
|
|
|
From net investment income |
|
| (0.04 | ) |
|
| – |
|
|
| – |
|
|
| – |
|
|
| (0.03 | ) |
|
| – |
|
From net realized gain on investments |
|
| (0.01 | ) |
|
| (0.55 | ) |
|
| (0.20 | ) |
|
| (0.30 | ) |
|
| (0.32 | ) |
|
| – |
|
Return of capital |
|
| (0.65 | ) |
|
| (0.90 | ) |
|
| (1.22 | ) |
|
| (1.11 | ) |
|
| (1.05 | ) |
|
| (0.34 | ) |
Total distributions(c)(d) |
|
| (0.70 | ) |
|
| (1.45 | ) |
|
| (1.42 | ) |
|
| (1.41 | ) |
|
| (1.40 | ) |
|
| (0.34 | ) |
|
|
|
|
|
|
|
|
|
|
|
|
|
|
|
|
|
|
|
|
|
|
|
|
|
Net increase/(decrease) in net asset value |
|
| (1.99 | ) |
|
| 0.49 |
|
|
| 0.36 |
|
|
| 0.09 |
|
|
| 0.73 |
|
|
| (0.22 | ) |
Net asset value, end of period |
| $ | 25.66 |
|
| $ | 27.65 |
|
| $ | 27.16 |
|
| $ | 26.80 |
|
| $ | 26.71 |
|
| $ | 25.98 |
|
TOTAL RETURN(e) |
|
| (4.72 | )% |
|
| 7.30 | % |
|
| 6.81 | % |
|
| 5.75 | % |
|
| 8.35 | % |
|
| 0.46 | % |
|
|
|
|
|
|
|
|
|
|
|
|
|
|
|
|
|
|
|
|
|
|
|
|
|
RATIOS/SUPPLEMENTAL DATA: |
|
|
|
|
|
|
|
|
|
|
|
|
|
|
|
|
|
|
|
|
|
|
|
|
Net assets, end of period (000s) |
| $ | 1,750,326 |
|
| $ | 1,473,477 |
|
| $ | 992,272 |
|
| $ | 657,954 |
|
| $ | 353,907 |
|
| $ | 74,095 |
|
Ratios to Average Net Assets (including interest expense) |
|
|
|
|
|
|
|
|
|
|
|
|
|
|
|
|
|
|
|
|
|
|
|
|
Ratio of expenses to average net assets excluding fee waivers and reimbursements/recoupment of previously waived fees(f) |
|
| 1.69 | %(g) |
|
| 1.70 | % |
|
| 1.86 | % |
|
| 2.04 | % |
|
| 2.17 | % |
|
| 2.20 | %(g) |
Ratio of expenses to average net assets including fee waivers and reimbursements/recoupment of previously waived fees (f) |
|
| 1.72 | %(g) |
|
| 1.71 | % |
|
| 1.86 | % |
|
| 1.97 | % |
|
| 1.98 | % |
|
| 1.69 | %(g) |
Ratio of net investment income to average net assets(f)(h) |
|
| 1.82 | %(g) |
|
| 1.69 | % |
|
| 1.67 | % |
|
| 1.31 | % |
|
| 1.16 | % |
|
| 0.71 | %(g) |
Ratios to Average Net Assets (excluding interest expense) |
|
|
|
|
|
|
|
|
|
|
|
|
|
|
|
|
|
|
|
|
|
|
|
|
Ratio of expenses to average net assets excluding fee waivers and reimbursements/recoupment of previously waived fees(f) |
|
| 1.63 | %(g) |
|
| 1.65 | % |
|
| 1.66 | % |
|
| 1.73 | % |
|
| 1.85 | % |
|
| 2.17 | %(g) |
Ratio of expenses to average net assets including fee waivers and reimbursements/recoupment of previously waived fees(f) |
|
| 1.66 | %(g) |
|
| 1.66 | % |
|
| 1.66 | % |
|
| 1.66 | % |
|
| 1.66 | % |
|
| 1.66 | %(g) |
Ratio of net investment income to average net assets excluding fee waivers and reimbursements(f)(h) |
|
| 1.91 | %(g) |
|
| 1.76 | % |
|
| 1.87 | % |
|
| 1.55 | % |
|
| 1.30 | % |
|
| 0.74 | %(g) |
Portfolio turnover rate(i) |
|
| 35 | % |
|
| 22 | % |
|
| 15 | % |
|
| 11 | % |
|
| 8 | % |
|
| 29 | % |
See Notes to Financial Statements.
30 | 1.888.926.2688 | www.griffincapital.com |
Griffin Institutional Access Real Estate Fund – Class I | Financial Highlights |
For a Share Outstanding Throughout the Periods Presented
(a) | The Fund’s Class I shares commenced operations on August 10, 2015. |
(b) | Calculated using the average shares method. |
(c) | Total distributions during a calendar year generally will be made from the Fund’s net investment income, net realized gains on investments and net unrealized gains on investments, if any. The portion of distributions paid not attributable to net investment income or net realized gains on investments, if any, is distributed from the Fund’s assets and is treated by shareholders as a nontaxable distribution (“Return of Capital”) for tax purposes. Return of capital is a tax concept, not an economic concept. The tax character of the Fund’s distributions, in isolation, does not reveal much information about whether the distributions are supported by the Fund’s returns. Reported distributions from net investment income and realized gains on investments are not an indication as to whether or not the Fund’s distributions are supported by the Fund’s returns. The Fund can have distributions from net investment income and realized capital gains in years in which it incurs an economic loss due to unrealized losses not being recognized for tax purposes. A common method in which to determine if the Fund’s distributions are supported by economic returns is to examine the Fund’s Net Asset Value (“NAV”) over the course of a year. If the Fund’s NAV has increased, the Fund will have economically earned more than it has distributed, regardless of whether such distributions are reported as being from net investment income, net realized gains on investments or return of capital. If the Fund’s NAV decreases, the Fund will have distributed more than it has economically earned or it will have incurred an economic loss. |
(d) | The Fund has substantial investments in real estate investment trusts, or REITs, which are generally not subject to federal income taxes. Distributions that the Fund receives from REITs can be classified as ordinary income, capital gain income or return of capital by the REITs that make these distributions to the Fund. However, it is not possible for the Fund to characterize distributions received from REITs during interim periods because the REIT issuers do not report their tax characterizations until after year end. The Fund has estimated the character of distributions for the six-month period ended March 31, 2020 based on the percentage of such distributions attributable to net investment income, net realized gains and return of capital for the fiscal year ended September 30, 2019. Final characterization of the Fund’s 2020 distributions to its common shareholders is also dependent upon the size or timing of the Fund’s securities transactions prior to year-end. Therefore, it is likely that some portion of the Fund’s 2020 investment income and distributions to its common shareholders will be recharacterized as long term capital gain and return of capital for financial statement and U.S. federal income tax purposes subsequent to year end and reflected accordingly in the Fund’s year-end financial statements. |
(e) | Total returns are for the period indicated and have not been annualized for periods less than a year and do not reflect the impact of sales charge. Total returns would have been lower had certain expenses not been waived during the period. Returns shown do not reflect the deduction of taxes that a shareholder would pay on Fund distributions or the redemption of Fund shares. |
(f) | The ratios of expenses to average net assets and net investment income to average net assets do not reflect the expenses of the underlying private real estate funds in which the Fund invests which typically range from 0.80% to 1.00% on an annual basis. However, the Fund invests in each underlying private real estate investment fund based upon the net asset value of each such fund which reflects the costs of investing in the applicable fund, including the management fee of the underlying fund and other operating expenses. The net asset value of each underlying private real estate investment fund is incorporated into the ratios described above. |
(g) | Annualized. |
(h) | Recognition of net investment income is affected by the timing and declaration of dividends by the underlying investment companies in which the Fund invests. |
(i) | Portfolio turnover rate for periods less than one full year has not been annualized and is calculated at the Fund level. |
See Notes to Financial Statements.
Semi-Annual Report | March 31, 2020 | 31 |
Griffin Institutional Access Real Estate Fund – Class M | Financial Highlights |
For a Share Outstanding Throughout the Periods Presented
|
| For the |
|
| For the Year |
|
| For the Year |
|
| For the |
| ||||
Net asset value, beginning of period |
| $ | 26.98 |
|
| $ | 26.70 |
|
| $ | 26.54 |
|
| $ | 26.48 |
|
|
|
|
|
|
|
|
|
|
|
|
|
|
|
|
|
|
INCOME FROM INVESTMENT OPERATIONS: |
|
|
|
|
|
|
|
|
|
|
|
|
|
|
|
|
Net investment income(b) |
|
| 0.15 |
|
|
| 0.26 |
|
|
| 0.25 |
|
|
| 0.13 |
|
Net realized and unrealized gain/(loss) |
|
| (1.50 | ) |
|
| 1.44 |
|
|
| 1.31 |
|
|
| 1.33 |
|
Total from investment operations |
|
| (1.35 | ) |
|
| 1.70 |
|
|
| 1.56 |
|
|
| 1.46 |
|
|
|
|
|
|
|
|
|
|
|
|
|
|
|
|
|
|
DISTRIBUTIONS: |
|
|
|
|
|
|
|
|
|
|
|
|
|
|
|
|
From net investment income |
|
| (0.04 | ) |
|
| – |
|
|
| – |
|
|
| – |
|
From net realized gain on investments |
|
| (0.01 | ) |
|
| (0.54 | ) |
|
| (0.20 | ) |
|
| (0.30 | ) |
Return of capital |
|
| (0.63 | ) |
|
| (0.88 | ) |
|
| (1.20 | ) |
|
| (1.10 | ) |
Total distributions(c)(d) |
|
| (0.68 | ) |
|
| (1.42 | ) |
|
| (1.40 | ) |
|
| (1.40 | ) |
|
|
|
|
|
|
|
|
|
|
|
|
|
|
|
|
|
Net increase in net asset value |
|
| (2.03 | ) |
|
| 0.28 |
|
|
| 0.16 |
|
|
| 0.06 |
|
Net asset value, end of period |
| $ | 24.95 |
|
| $ | 26.98 |
|
| $ | 26.70 |
|
| $ | 26.54 |
|
TOTAL RETURN(e) |
|
| (5.06 | )% |
|
| 6.51 | % |
|
| 6.03 | % |
|
| 5.63 | % |
|
|
|
|
|
|
|
|
|
|
|
|
|
|
|
|
|
RATIOS/SUPPLEMENTAL DATA: |
|
|
|
|
|
|
|
|
|
|
|
|
|
|
|
|
Net assets, end of period(000s) |
| $ | 950,967 |
|
| $ | 807,774 |
|
| $ | 402,482 |
|
| $ | 117,018 |
|
Ratios to Average Net Assets (including interest expense) |
|
|
|
|
|
|
|
|
|
|
|
|
|
|
|
|
Ratio of expenses to average net assets excluding fee waivers and reimbursements/recoupment of previously waived fees(f) |
|
| 2.44 | %(g) |
|
| 2.44 | % |
|
| 2.58 | % |
|
| 2.71 | %(g) |
Ratio of expenses to average net assets including fee waivers and reimbursements/recoupment of previously waived fees (f) |
|
| 2.44 | %(g) |
|
| 2.44 | % |
|
| 2.59 | % |
|
| 2.66 | %(g) |
Ratio of net investment income to average net assets(f)(h) |
|
| 1.09 | %(g) |
|
| 0.98 | % |
|
| 0.94 | % |
|
| 0.57 | %(g) |
|
|
|
|
|
|
|
|
|
|
|
|
|
|
|
|
|
Ratios to Average Net Assets (excluding interest expense) |
|
|
|
|
|
|
|
|
|
|
|
|
|
|
|
|
Ratio of expenses to average net assets excluding fee waivers and reimbursements/recoupment of previously waived fees(f) |
|
| 2.38 | %(g) |
|
| 2.39 | % |
|
| 2.41 | % |
|
| 2.46 | %(g) |
Ratio of expenses to average net assets including fee waivers and reimbursements/recoupment of previously waived fees(f) |
|
| 2.38 | %(g) |
|
| 2.39 | % |
|
| 2.41 | % |
|
| 2.41 | %(g) |
Ratio of net investment income to average net assets excluding fee waivers and reimbursements(f)(h) |
|
| 1.15 | %(g) |
|
| 1.03 | % |
|
| 1.14 | % |
|
| 0.77 | %(g) |
Portfolio turnover rate(i) |
|
| 35 | % |
|
| 22 | % |
|
| 15 | % |
|
| 11 | % |
See Notes to Financial Statements.
32 | 1.888.926.2688 | www.griffincapital.com |
Griffin Institutional Access Real Estate Fund – Class M | Financial Highlights |
For a Share Outstanding Throughout the Periods Presented
(a) | The Fund’s Class M shares commenced operations on November 17, 2016. |
(b) | Calculated using the average shares method. |
(c) | Total distributions during a calendar year generally will be made from the Fund’s net investment income, net realized gains on investments and net unrealized gains on investments, if any. The portion of distributions paid not attributable to net investment income or net realized gains on investments, if any, is distributed from the Fund’s assets and is treated by shareholders as a nontaxable distribution (“Return of Capital”) for tax purposes. Return of capital is a tax concept, not an economic concept. The tax character of the Fund’s distributions, in isolation, does not reveal much information about whether the distributions are supported by the Fund’s returns. Reported distributions from net investment income and realized gains on investments are not an indication as to whether or not the Fund’s distributions are supported by the Fund’s returns. The Fund can have distributions from net investment income and realized capital gains in years in which it incurs an economic loss due to unrealized losses not being recognized for tax purposes. A common method in which to determine if the Fund’s distributions are supported by economic returns is to examine the Fund’s Net Asset Value (“NAV”) over the course of a year. If the Fund’s NAV has increased, the Fund will have economically earned more than it has distributed, regardless of whether such distributions are reported as being from net investment income, net realized gains on investments or return of capital. If the Fund’s NAV decreases, the Fund will have distributed more than it has economically earned or it will have incurred an economic loss. |
(d) | The Fund has substantial investments in real estate investment trusts, or REITs, which are generally not subject to federal income taxes. Distributions that the Fund receives from REITs can be classified as ordinary income, capital gain income or return of capital by the REITs that make these distributions to the Fund. However, it is not possible for the Fund to characterize distributions received from REITs during interim periods because the REIT issuers do not report their tax characterizations until after year end. The Fund has estimated the character of distributions for the six-month period ended March 31, 2020 based on the percentage of such distributions attributable to net investment income, net realized gains and return of capital for the fiscal year ended September 30, 2019. Final characterization of the Fund’s 2020 distributions to its common shareholders is also dependent upon the size or timing of the Fund’s securities transactions prior to year-end. Therefore, it is likely that some portion of the Fund’s 2020 investment income and distributions to its common shareholders will be recharacterized as long term capital gain and return of capital for financial statement and U.S. federal income tax purposes subsequent to year end and reflected accordingly in the Fund’s year-end financial statements. |
(e) | Total returns are for the period indicated and have not been annualized for periods less than a year and do not reflect the impact of sales charge. Total returns would have been lower had certain expenses not been waived during the period. Returns shown do not reflect the deduction of taxes that a shareholder would pay on Fund distributions or the redemption of Fund shares. |
(f) | The ratios of expenses to average net assets and net investment income to average net assets do not reflect the expenses of the underlying private real estate funds in which the Fund invests which typically range from 0.80% to 1.00% on an annual basis. However, the Fund invests in each underlying private real estate investment fund based upon the net asset value of each such fund which reflects the costs of investing in the applicable fund, including the management fee of the underlying fund and other operating expenses. The net asset value of each underlying private real estate investment fund is incorporated into the ratios described above. |
(g) | Annualized. |
(h) | Recognition of net investment income is affected by the timing and declaration of dividends by the underlying investment companies in which the Fund invests. |
(i) | Portfolio turnover rate for periods less than one full year has not been annualized and is calculated at the Fund level. |
See Notes to Financial Statements.
Semi-Annual Report | March 31, 2020 | 33 |
Griffin Institutional Access Real Estate Fund – Class L | Financial Highlights |
For a Share Outstanding Throughout the Periods Presented
|
| For the |
|
| For the Year |
|
| For the Year |
|
| For the |
| ||||
Net asset value, beginning of period |
| $ | 27.22 |
|
| $ | 26.87 |
|
| $ | 26.64 |
|
| $ | 26.63 |
|
|
|
|
|
|
|
|
|
|
|
|
|
|
|
|
|
|
INCOME FROM INVESTMENT OPERATIONS: |
|
|
|
|
|
|
|
|
|
|
|
|
|
|
|
|
Net investment income(b) |
|
| 0.17 |
|
|
| 0.33 |
|
|
| 0.32 |
|
|
| 0.12 |
|
Net realized and unrealized gain/(loss) |
|
| (1.49 | ) |
|
| 1.45 |
|
|
| 1.32 |
|
|
| 0.59 |
|
Total from investment operations |
|
| (1.32 | ) |
|
| 1.78 |
|
|
| 1.64 |
|
|
| 0.71 |
|
|
|
|
|
|
|
|
|
|
|
|
|
|
|
|
|
|
DISTRIBUTIONS: |
|
|
|
|
|
|
|
|
|
|
|
|
|
|
|
|
From net investment income |
|
| (0.04 | ) |
|
| 0.00 |
|
|
| – |
|
|
| – |
|
From net realized gain on investments |
|
| (0.01 | ) |
|
| (0.54 | ) |
|
| (0.20 | ) |
|
| (0.15 | ) |
Return of capital |
|
| (0.64 | ) |
|
| (0.89 | ) |
|
| (1.21 | ) |
|
| (0.55 | ) |
Total distributions(c)(d) |
|
| (0.69 | ) |
|
| (1.43 | ) |
|
| (1.41 | ) |
|
| (0.70 | ) |
|
|
|
|
|
|
|
|
|
|
|
|
|
|
|
|
|
Net increase in net asset value |
|
| (2.01 | ) |
|
| 0.35 |
|
|
| 0.23 |
|
|
| 0.01 |
|
Net asset value, end of period |
| $ | 25.21 |
|
| $ | 27.22 |
|
| $ | 26.87 |
|
| $ | 26.64 |
|
TOTAL RETURN(e) |
|
| (4.92 | )% |
|
| 6.77 | % |
|
| 6.30 | % |
|
| 2.70 | % |
|
|
|
|
|
|
|
|
|
|
|
|
|
|
|
|
|
RATIOS/SUPPLEMENTAL DATA: |
|
|
|
|
|
|
|
|
|
|
|
|
|
|
|
|
Net assets, end of period(000s) |
| $ | 77,730 |
|
| $ | 100,151 |
|
| $ | 45,853 |
|
| $ | 13,833 |
|
Ratios to Average Net Assets (including interest expense) |
|
|
|
|
|
|
|
|
|
|
|
|
|
|
|
|
Ratio of expenses to average net assets excluding fee waivers and reimbursements/recoupment of previously waived fees(f) |
|
| 2.18 | %(g) |
|
| 2.19 | % |
|
| 2.34 | % |
|
| 2.44 | %(g) |
Ratio of expenses to average net assets including fee waivers and reimbursements/recoupment of previously waived fees (f) |
|
| 2.18 | %(g) |
|
| 2.19 | % |
|
| 2.35 | % |
|
| 2.39 | %(g) |
Ratio of net investment income to average net assets(f)(h) |
|
| 1.24 | %(g) |
|
| 1.23 | % |
|
| 1.19 | % |
|
| 1.05 | %(g) |
|
|
|
|
|
|
|
|
|
|
|
|
|
|
|
|
|
Ratios to Average Net Assets (excluding interest expense) |
|
|
|
|
|
|
|
|
|
|
|
|
|
|
|
|
Ratio of expenses to average net assets excluding fee waivers and reimbursements/recoupment of previously waived fees(f) |
|
| 2.13 | %(g) |
|
| 2.14 | % |
|
| 2.16 | % |
|
| 2.21 | %(g) |
Ratio of expenses to average net assets including fee waivers and reimbursements/recoupment of previously waived fees(f) |
|
| 2.13 | %(g) |
|
| 2.14 | % |
|
| 2.16 | % |
|
| 2.16 | %(g) |
Ratio of net investment income to average net assets excluding fee waivers and reimbursements(f)(h) |
|
| 1.29 | %(g) |
|
| 1.28 | % |
|
| 1.39 | % |
|
| 1.23 | %(g) |
Portfolio turnover rate(i) |
|
| 35 | % |
|
| 22 | % |
|
| 15 | % |
|
| 11 | % |
See Notes to Financial Statements.
34 | 1.888.926.2688 | www.griffincapital.com |
Griffin Institutional Access Real Estate Fund – Class L | Financial Highlights |
For a Share Outstanding Throughout the Periods Presented
(a) | The Fund’s Class L shares commenced operations on April 25, 2017. |
(b) | Calculated using the average shares method. |
(c) | Total distributions during a calendar year generally will be made from the Fund’s net investment income, net realized gains on investments and net unrealized gains on investments, if any. The portion of distributions paid not attributable to net investment income or net realized gains on investments, if any, is distributed from the Fund’s assets and is treated by shareholders as a nontaxable distribution (“Return of Capital”) for tax purposes. Return of capital is a tax concept, not an economic concept. The tax character of the Fund’s distributions, in isolation, does not reveal much information about whether the distributions are supported by the Fund’s returns. Reported distributions from net investment income and realized gains on investments are not an indication as to whether or not the Fund’s distributions are supported by the Fund’s returns. The Fund can have distributions from net investment income and realized capital gains in years in which it incurs an economic loss due to unrealized losses not being recognized for tax purposes. A common method in which to determine if the Fund’s distributions are supported by economic returns is to examine the Fund’s Net Asset Value (“NAV”) over the course of a year. If the Fund’s NAV has increased, the Fund will have economically earned more than it has distributed, regardless of whether such distributions are reported as being from net investment income, net realized gains on investments or return of capital. If the Fund’s NAV decreases, the Fund will have distributed more than it has economically earned or it will have incurred an economic loss. |
(d) | The Fund has substantial investments in real estate investment trusts, or REITs, which are generally not subject to federal income taxes. Distributions that the Fund receives from REITs can be classified as ordinary income, capital gain income or return of capital by the REITs that make these distributions to the Fund. However, it is not possible for the Fund to characterize distributions received from REITs during interim periods because the REIT issuers do not report their tax characterizations until after year end. The Fund has estimated the character of distributions for the six-month period ended March 31, 2020 based on the percentage of such distributions attributable to net investment income, net realized gains and return of capital for the fiscal year ended September 30, 2019. Final characterization of the Fund’s 2020 distributions to its common shareholders is also dependent upon the size or timing of the Fund’s securities transactions prior to year-end. Therefore, it is likely that some portion of the Fund’s 2020 investment income and distributions to its common shareholders will be recharacterized as long term capital gain and return of capital for financial statement and U.S. federal income tax purposes subsequent to year end and reflected accordingly in the Fund’s year-end financial statements. |
(e) | Total returns are for the period indicated and have not been annualized for periods less than a year and do not reflect the impact of sales charge. Total returns would have been lower had certain expenses not been waived during the period. Returns shown do not reflect the deduction of taxes that a shareholder would pay on Fund distributions or the redemption of Fund shares. |
(f) | The ratios of expenses to average net assets and net investment income to average net assets do not reflect the expenses of the underlying private real estate funds in which the Fund invests which typically range from 0.80% to 1.00% on an annual basis. However, the Fund invests in each underlying private real estate investment fund based upon the net asset value of each such fund which reflects the costs of investing in the applicable fund, including the management fee of the underlying fund and other operating expenses. The net asset value of each underlying private real estate investment fund is incorporated into the ratios described above. |
(g) | Annualized. |
(h) | Recognition of net investment income is affected by the timing and declaration of dividends by the underlying investment companies in which the Fund invests. |
(i) | Portfolio turnover rate for periods less than one full year has not been annualized and is calculated at the Fund level. |
See Notes to Financial Statements.
Semi-Annual Report | March 31, 2020 | 35 |
| Griffin Institutional Access Real Estate Fund | Notes to Financial Statements |
March 31, 2020 (Unaudited)
1.ORGANIZATION
Griffin Institutional Access Real Estate Fund (the “Fund”) is registered under the Investment Company Act of 1940, as amended (the “1940 Act”), as a non-diversified, closed-end management investment company. The Fund engages in a continuous offering of shares and operates as an interval fund that offers quarterly repurchases of shares at Net Asset Value (“NAV”). The Fund’s investment adviser is Griffin Capital Advisor, LLC (the “Adviser”). The investment objective of the Fund is to generate a return comprised of both current income and capital appreciation with moderate volatility and low correlation to the broader markets. The Fund pursues its investment objective by strategically investing across private institutional real estate investment funds as well as a diversified set of public real estate securities.
The Fund was organized as a statutory trust on November 5, 2013, under the laws of the State of Delaware. The Fund commenced operations on June 30, 2014, and is authorized to issue an unlimited number of shares with no par value.
The Fund currently offers Class A, Class C, Class I, Class M and Class L shares. Class A shares commenced operations on June 30, 2014, Class C and Class I shares commenced operations on August 10, 2015, Class M shares commenced operations on November 17, 2016 and Class L shares commenced operations on April 25, 2017. The sales load payable by each investor depends on the amount invested, and the class of shares invested into, by such investor in the Fund. Class A and Class L shares are offered subject to a maximum sales charge of 5.75% and 4.25%, respectively, of their offering price. Class C, Class I and Class M shares are offered at net asset value. Class C shares may be subject to a 1.00% contingent deferred sales charge on shares redeemed during the first 365 days after their purchase. Each class represents an interest in the same assets of the Fund and classes are identical except for differences in their sales charge structures and ongoing service and distribution charges. All classes of shares have equal voting privileges except that each class has exclusive voting rights with respect to its service and/or distribution plans. The Fund’s income, expenses (other than class specific service and distribution fees) and realized and unrealized gains and losses are allocated proportionately each day based upon the relative net assets of each class.
2. SIGNIFICANT ACCOUNTING POLICIES
The following is a summary of significant accounting policies followed by the Fund in preparation of its financial statements in conformity with accounting principles generally accepted in the United States of America (“U.S. GAAP”). The Fund is considered an investment company following accounting and reporting guidance inAccounting Standards Codification (“ASC”) Topic 946 – Financial Services – Investment Companies. The preparation of financial statements requires management to make estimates and assumptions that affect the reported amounts of assets and liabilities and disclosure of contingent assets and liabilities at the date of the financial statements and the reported amounts of income and expenses for the period. Actual results could differ from those estimates.
Security Valuation– Portfolio securities of the Fund are valued at their current market values determined on the basis of readily available market quotations. Market quotations are obtained from independent pricing services approved by the Board of Trustees (the “Trustees”). If market quotations are not readily available, or if the available quotations are not believed to be reflective of market value, securities are valued at fair value in good faith pursuant to the procedures adopted by the Trustees. The Trustees have delegated the day to day responsibility for determining fair valuation to the Fair Value Pricing Committee in accordance with the valuation policy approved by the Trustees. Fair valuation procedures may be applied when, for example, (1) a portfolio security is not traded in a public market or the principal market in which the security trades is closed, (2) trading in a portfolio security is suspended and not resumed prior to the normal market close, (3) a portfolio security is not traded in significant volume for a substantial period, or (4) the Adviser determines that the quotation or price for a portfolio security provided by a broker-dealer or independent pricing service is unreliable. There is no single standard for determining fair value of a security. Likewise, there can be no assurance that the Fund will be able to purchase or sell a portfolio security at the fair value price used to calculate the Fund’s NAV.
Valuation of Private Investment Funds– The Fund’s allocation to Private Investment Funds generally includes open-ended private investment funds that elect to be treated as real estate investment trusts (“REIT”) for tax purposes. Further, the Private Investment Funds generally include private funds that invest in real estate assets (“Private Equity REITs”) and private funds that invest in debt instruments secured or otherwise supported by real estate assets (“Private Debt Funds”). The Private Investment Funds measure their investment assets at fair value and report a NAV on a calendar quarter basis. For non-calendar quarter-end days, the fair value of each Private Equity REIT is determined by adjusting the most recent NAV for each Private Equity REIT by the change in a proprietary index that the Trustees have deemed to be representative of the Private Equity REIT market. With regard to the Private Debt Funds, the Adviser will accrue income on a daily basis and update the NAV, generally on a quarterly basis, utilizing the NAVs issued by the Private Debt Funds. In the event that a NAV is not provided by a Private Investment Fund following the end of the quarter or if the Adviser becomes aware of developments warranting an update to a Private Investment Fund’s valuation, the Adviser shall inform the Fair Value Pricing Committee and a meeting may be called to determine fair value. In accordance with Accounting Standards Codification (“ASC”) 820, the Fund has elected to apply the practical expedient and to value its investments in Private Investment Funds at their respective net asset value each quarter. As of March 31, 2020, all of the Fund’s investments in Private Investment Funds were valued at their respective sponsored issued NAVs.
| 36 | 1.888.926.2688 | www.griffincapital.com |
| Griffin Institutional Access Real Estate Fund | Notes to Financial Statements |
March 31, 2020 (Unaudited)
Fair Value Measurements– A three-tier hierarchy has been established to classify fair value measurements for disclosure purposes. Inputs refer broadly to the assumptions that market participants would use in pricing the asset or liability, including assumptions about risk. Inputs may be observable or unobservable. Observable inputs are inputs that reflect the assumptions market participants would use in pricing the asset or liability that are developed based on market data obtained from sources independent of the reporting entity. Unobservable inputs are inputs that reflect the reporting entity’s own assumptions about the assumptions market participants would use in pricing the asset or liability that are developed based on the best information available. In accordance with the authoritative guidance on fair value measurements and disclosure under U.S. GAAP, the Fund discloses fair value of its investments in a hierarchy that prioritizes the inputs to valuation techniques used to measure the fair value:
| Level 1 | – | Unadjusted quoted prices in active markets for identical, unrestricted assets or liabilities that the Fund has the ability to access at the measurement date; |
| Level 2 | – | Quoted prices which are not active, quoted prices for similar assets or liabilities in active markets or inputs other than quoted prices that are observable (either directly or indirectly) for substantially the full term of the asset or liability at the measurement date; and |
| Level 3 | – | Significant unobservable prices or inputs (including the Fund’s own assumptions in determining the fair value of investments) where there is little or no market activity for the asset or liability at the measurement date. |
The availability of observable inputs can vary from security to security and is affected by a wide variety of factors, including, for example, the type of security, whether the security is new and not yet established in the marketplace, the liquidity of markets and other characteristics particular to the security. To the extent that valuation is based on models or inputs that are less observable or unobservable in the market, the determination of fair value requires more judgment. Accordingly, the degree of judgment exercised in determining fair value is greatest for instruments categorized in Level 3.
An investment level within the fair value hierarchy is based on the lowest level input, individually or in the aggregate, that is significant to fair value measurement. The inputs or methodologies used for valuing securities are not necessarily an indication of the risk or liquidity associated with investing in those securities. The valuation techniques used by the Fund to measure fair value during the six months ended March 31, 2020 maximized the use of observable inputs and minimized the use of unobservable inputs. For the six months ended March 31, 2020, the Fund did not use unobservable inputs (Level 3) when determining fair value. The following is a summary of the fair valuations according to the inputs used in valuing the Fund’s investments as of March 31, 2020:
| Investments in Securities at Value | Level 1 - Quoted Prices | Level 2 - Other Significant Observable Inputs | Level 3 - Significant Unobservable Inputs | Total | ||||||||||||
| Real Estate Investment Trusts | ||||||||||||||||
| Private Investment Funds (Measured at net asset value)(a) | $ | – | $ | – | $ | – | $ | 3,154,806,951 | ||||||||
| Publicly Traded Securities | 205,303,281 | – | – | 205,303,281 | ||||||||||||
| Mutual Fund | 76,601,431 | – | – | 76,601,431 | ||||||||||||
| Preferred Stocks | 117,770,868 | – | – | 117,770,868 | ||||||||||||
| Short Term Investment | 505,315,180 | – | – | 505,315,180 | ||||||||||||
| Total | $ | 904,990,760 | $ | – | $ | – | $ | 4,059,797,711 | ||||||||
| (a) | In accordance with Subtopic 820-10, certain investments that are measured at fair value using the net asset value per share (or its equivalent) practical expedient have not been classified in the fair value hierarchy. The fair value amounts presented in this table are intended to permit reconciliation of the fair value hierarchy to the amounts presented in the Schedule of Investments. |
There were no transfers out of or into Level 3 during the six months ended March 31, 2020.
Investment Transactions– Investment security transactions are accounted for on trade date. Gains and losses on securities sold are determined on a specific identification basis.
Investment Income– Interest income is accrued and recorded on a daily basis including amortization of premiums, accretion of discounts and income earned from money market funds. Dividend income is recorded on the ex-dividend date.
| Semi-Annual Report | March 31, 2020 | 37 |
| Griffin Institutional Access Real Estate Fund | Notes to Financial Statements |
March 31, 2020 (Unaudited)
Distributions to Shareholders– Distributions from net investment income, if any, will be declared and paid quarterly. Distributions of net realized capital gains, if any, will be declared and paid annually. Income and capital gains distributions are determined in accordance with income tax regulations, which may differ from U.S. GAAP. Distributions to shareholders are recorded on the ex-dividend date.
Distributions from Underlying REITS– Distributions made to the Fund by the underlying REITs in which the Fund invests may take several forms. Specifically, such distributions may be in the form of dividends, capital gains, and/or a return of capital.
Unfunded Commitments– Typically, when the Fund invests in a Private Investment Fund, the Fund makes a commitment to invest a specified amount of capital in the applicable Private Investment Fund. The capital commitment may be drawn by the general partner of the Private Investment Fund either all at once or through a series of capital calls at the discretion of the general partner. Thus, an Unfunded Commitment represents the portion of the Fund’s overall capital commitment to a particular Private Investment Fund that has not yet been called by the general partner of the Private Investment Fund. Unfunded Commitments may subject the Fund to certain risks. For example, the Fund may be required to: liquidate other portfolio investments, potentially at inopportune times, in order to obtain the cash needed to satisfy its obligations with respect to a capital call; borrow under a line of credit which may result in additional expenses to the Fund; or, to the extent a buyer can be identified and subject to the provisions of the limited partnership agreement of the relevant Private Investment Fund, seek to sell/assign the interest subject to the capital call to a third party thereby eliminating the obligation. In addition, should the Fund be unable to satisfy its commitment obligation on a timely basis and defaults on a called capital commitment, the underlying Private Investment Fund, pursuant to its limited partnership agreement, typically has a number of potential remedies, including, by way of illustration, a reallocation of the Fund’s defaulted commitment amount to other limited partners, a reallocation of a portion of the Fund’s existing interest to the other limited partners as a penalty for the default, or the general partner of underlying Private Investment Fund could sue the Fund for breach of contract. As of March 31, 2020, the Fund had total Unfunded Commitments in the amount of $348,845,851.
Other Investment Companies –The Fund may invest in securities of other investment companies, including mutual funds and Exchange-Traded Funds (“ETFs”) that invest principally, directly or indirectly, in real estate or real estate related securities. Because mutual funds and ETFs incur their own fees and expenses, shareholders of the Fund will indirectly bear those costs. The Fund will also incur brokerage commissions and related charges when purchasing or selling shares of a mutual fund or an ETF. Unlike mutual funds, which are valued once daily, shares in an ETF may be purchased or sold on a securities exchange throughout the trading day at market prices that are generally close to the NAV of the ETF.
Indemnification– The Fund indemnifies its Officers and Trustees for certain liabilities that may arise from the performance of their duties to the Fund. Additionally, in the normal course of business, the Fund enters into contracts that contain a variety of representations and warranties and which provide general indemnities. The Fund’s maximum exposure under these arrangements is unknown, as this would involve future claims that may be made against the Fund that have not yet occurred. However, based on industry experience, the Fund expects the risk of loss due to these warranties and indemnities to be remote.
Federal Income Taxes– The Fund intends to continue to comply with the requirements of Subchapter M of the Internal Revenue Code applicable to regulated investment companies and will distribute all of its taxable income, if any, to shareholders. Accordingly, no provision for federal income taxes is required in the financial statements.
The Fund recognizes the tax benefits of uncertain tax positions only when the position is “more likely than not” to be sustained assuming examination by tax authorities. Management has reviewed the tax positions and has concluded that no liability for unrecognized tax benefits should be recorded related to uncertain tax positions taken in the Fund’s tax returns for open tax years or expected to be taken in the Fund’s 2020 returns.
3. ADVISORY FEES, ADMINISTRATION FEES AND OTHER AGREEMENTS
Investment Advisory
Pursuant to the Investment Advisory Agreement with the Fund (“Advisory Agreement”), the Adviser is entitled to an investment advisory fee, computed daily and payable monthly at an annual rate of 1.50% of the average daily net assets of the Fund.
The Adviser and the Fund have entered into an expense limitation and reimbursement agreement (the “Expense Limitation Agreement”) under which the Adviser has agreed contractually to waive its fees and to pay or absorb the ordinary annual operating expenses of the Fund (including organizational and offering expenses, but excluding taxes, interest, brokerage commissions, acquired fund fees and expenses and extraordinary expenses) so that the total annual operating expenses of the Fund do not exceed 1.91% per annum of Class A average daily net assets, 2.66% per annum of Class C average daily net assets, 1.66% per annum of Class I average daily net assets, 2.41% per annum of Class M average daily net assets and 2.16% per annum of Class L average daily net assets (the “Expense Limitations”). The Expense Limitation Agreement will remain in effect until February 1, 2021, unless and until the Trustees approve its modification or termination. The Fund does not anticipate that the Trustees will terminate the Expense Limitation Agreement during this period. The Expense Limitation Agreement may not be terminated by the Adviser. In consideration of the Adviser’s agreement to limit the Fund’s expenses, the Fund has agreed to repay the Adviser in the amount of any fees waived and Fund expenses paid or absorbed, subject to the limitations that: (1) the reimbursement for fees and expenses will be made only if payable not more than three years from the date on which they were incurred; and (2) the reimbursement may not be made if it would cause the lesser of the Expense Limitations in place at the time of waiver or at the time of reimbursement to be exceeded.
| 38 | 1.888.926.2688 | www.griffincapital.com |
| Griffin Institutional Access Real Estate Fund | Notes to Financial Statements |
March 31, 2020 (Unaudited)
During the six months ended March 31, 2020, the fees waived/reimbursed and recoupment of previously waived fees under the Expense Limitation Agreement were as follows:
| Recoupment of Previously Waived Fees by Advisor | ||||
| $ | 544,365 | |||
As of March 31, 2020, the balance of recoupable expenses for the Fund was as follows:
Expires September 30, 2020 | Expires September 30, 2021 | Expires September 30, 2022 | ||||||||||
| $ | 346,221 | $ | 287,015 | $ | 53,277 | |||||||
Sub-advisory services are provided to the Fund pursuant to agreements between the Adviser and both Aon Hewitt Investment Consulting, Inc. (“Aon”) and CenterSquare Investment Management LLC. (“CenterSquare” and collectively with Aon, the “Sub-Advisers”). Under the terms of the respective sub-advisory agreement, the Adviser compensates each Sub-Adviser based on a portion of the Fund’s average daily net assets which have been allocated to such Sub-Adviser to manage. Fees paid to each Sub-Adviser are not an expense of the Fund. The fee tables are as follows:
| Annual Sub-Advisory Fee Rate as a Percentage of Average Daily Net Assets Managed by CenterSquare | |
| $0 - $50M | 0.50% |
| $50 - $100M | 0.45% |
| $100 - $150M | 0.40% |
| Over $150M | 0.35% |
| Annual Sub-Advisory Fee Rate as a Percentage of Average Daily Net Assets Advised by Aon | |
| $0 - $500M | 0.15% |
| $500 - $750M | 0.125% |
| $750M - $1B | 0.10% |
| Over $1B | 0.07% |
Fund Administrator and Accounting Fees and Expenses
ALPS Fund Services, Inc. serves as the Fund’s administrator and accounting agent (the “Administrator”) and receives customary fees from the Fund for such services. The Administrator is also reimbursed by the Fund for certain out of pocket expenses.
Transfer Agency Fees and Expenses
DST Systems, Inc. serves as transfer, distribution paying and shareholder servicing agent for the Fund and receives customary fees from the Fund for such services.
Custody Fees and Expenses
UMB Bank, n.a. serves as the Fund’s custodian and receives customary fees from the Fund for such services.
Distribution and Shareholder Servicing Fees and Expenses
The Fund has entered into a Distribution Agreement with ALPS Distributors, Inc. (the “Distributor”) to provide distribution services to the Fund. The Distributor serves as principal underwriter of shares of the Fund. Under the Distribution Agreement the Fund’s Class C and Class M shares will pay to the Distributor a Distribution Fee that will accrue at an annual rate equal to 0.75% of the Fund’s average daily net assets attributable to Class C and Class M shares, payable on a monthly basis. Class L shares will pay to the Distributor a Distribution Fee that will accrue at an annual rate equal to 0.25% of the Fund’s average daily net assets attributable to Class L shares, payable on a monthly basis. For the six months ended March 31, 2020, Class C, Class M and Class L shares incurred distribution fees of $2,068,335, $3,422,436 and $108,182, respectively. Class A and Class I shares are not currently subject to a Distribution Fee. Under the Shareholder Services Plan, the Fund’s Class A, Class C and Class L shares may pay up to 0.25% per year of their average daily net assets for such services. Class I and Class M shares are not currently subject to a shareholder services fee. For the six months ended March 31, 2020, Class A, Class C and Class L shares incurred shareholder servicing fees of $1,050,525, $689,445 and $108,182, respectively.
| Semi-Annual Report | March 31, 2020 | 39 |
| Griffin Institutional Access Real Estate Fund | Notes to Financial Statements |
March 31, 2020 (Unaudited)
The Distributor has entered into a wholesale marketing agreement with Griffin Capital Securities, LLC, a registered broker-dealer affiliate of the Adviser. Pursuant to the terms of the wholesale marketing agreement, Griffin Capital Securities, LLC will seek to market and otherwise promote the Fund through various wholesale distribution channels, including regional and independent retail broker-dealers, wirehouses and registered investment advisers.
Officer and Trustee Compensation
Each Trustee who is not affiliated with the Trust or Adviser receives an annual retainer of $55,000, paid quarterly, as well as reimbursement for any reasonable expenses incurred attending the meetings and $500 per non-interested Trustee per each special telephonic meeting (exclusive of one special telephonic meeting per year). The chairperson of the Audit Committee receives an additional annual retainer of $15,000. None of the executive officers, with the exception of the Chief Compliance Officer, receive compensation from the Fund. Certain Trustees and officers of the Fund are also officers of the Adviser and are not paid by the Fund for serving in such capacities.
4. PURCHASES AND SALES OF INVESTMENT SECURITIES
The cost of purchases and proceeds from the sale of securities, other than short-term securities, for the six months ended March 31, 2020 were as follows:
Purchases of Securities | Proceeds from Sales of Securities | |||||||
| $ | 1,705,767,015 | $ | 1,341,867,068 | |||||
5. TAX BASIS INFORMATION
Distributions are determined in accordance with federal income tax regulations, which differ from U.S. GAAP, and, therefore, may differ significantly in amount or character from net investment income and realized gains for financial reporting purposes. Financial reporting records are adjusted for permanent book/tax differences to reflect tax character but are not adjusted for temporary differences.
The tax character of distributions paid for the year ended September 30, 2019 were as follows:
| Year | Ordinary Income | Long-Term Capital Gain | Return of Capital | ||||||||||
| 2019 | $ | 571,809 | $ | 61,032,291 | $ | 109,973,610 | |||||||
As of March 31, 2020, net unrealized appreciation of investments based on the federal tax cost was as follows:
| Gross Appreciation (excess of value over tax cost) | Gross Depreciation (excess of tax cost over value) | Net Unrealized Appreciation/(Depreciation) | Cost of Investments for Income Tax Purposes | |||||||||||||
| $ | 420,539,864 | $ | (118,442,246 | ) | $ | 302,097,618 | $ | 3,757,700,093 | ||||||||
The difference between book basis and tax basis net unrealized appreciation is primarily attributable to the investments in partnerships, wash sales and certain other investments.
6. LINES OF CREDIT
The Fund has entered into secured bank lines of credit through BNP Paribas Prime Brokerage International, Ltd. (“BNP”) and Credit Suisse First Boston Ltd. (“Credit Suisse” and together with BNP, the “Banks”) subject to the limitations of the 1940 Act for borrowings.
Borrowings under the BNP arrangement bear interest at the 3 month LIBOR plus 95 basis points at the time of borrowing. During the six months ended March 31, 2020, the Fund incurred $91,056 of interest expense related to its outstanding borrowings under the BNP arrangement. During the six months ended March 31, 2020, the average borrowings and average interest rate for days in which the Fund had outstanding borrowings under the BNP arrangement were $105,000,000 and 2.56%, respectively. The largest outstanding borrowing under the BNP arrangement during the six months ended March 31, 2020 was $130,000,000. As of March 31, 2020, the Fund had no outstanding borrowings under the BNP arrangement.
| 40 | 1.888.926.2688 | www.griffincapital.com |
| Griffin Institutional Access Real Estate Fund | Notes to Financial Statements |
March 31, 2020 (Unaudited)
For the period October 1, 2019 to December 15, 2019, borrowings under the Credit Suisse arrangement bore interest at the 3-month LIBOR plus 235 basis points at the time of borrowing and an unused commitment fee rate equal to 77.5 basis points. The Fund and Credit Suisse entered into an amended credit agreement that provides for different economic terms and conditions than the previous arrangement. Thus, for the period December 16, 2019 to March 31, 2020, borrowings under the Credit Suisse arrangement bore interest at LIBOR plus 205 basis points at the time of borrowing and an unused commitment fee rate equal to 59.8 basis points. The Credit Suisse arrangement is subject to a maximum commitment of $450,000,000 although the Fund may request an increase to the maximum commitment subject to certain conditions. During the six months ended March 31, 2020, the Fund incurred $0 of interest expense under the Credit Suisse arrangements and $1,127,047 of total unused fees, which is included in the interest expense line item on the Statement of Operations. During the six months ended March 31, 2020, the average borrowings and average interest rate for days in which the Fund had outstanding borrowings under the Credit Suisse arrangement were $0 and 0%, respectively. As of March 31, 2020, the Fund had no outstanding borrowings under the Credit Suisse arrangement.
As of March 31, 2020, the Fund had no outstanding borrowings and, therefore, no securities were pledged as collateral to the Banks. Certain of the Fund’s underlying investments are pledged as collateral when the Fund borrows from the Banks.
7. REPURCHASE OFFERS
As a continuously offered, closed-end interval fund, the Fund has adopted a fundamental policy in which it offers to repurchase at net asset value no less than 5% of the outstanding shares of the Fund once each quarter. It is possible that a repurchase offer may be oversubscribed and as such there is no guarantee that shareholders will be able to sell all of the shares they desire to sell in a quarterly repurchase offer, although each shareholder will have the right to require the Fund to purchase at least 5% of such shareholder’s shares in each quarterly repurchase. Liquidity will be provided to shareholders only through the Fund’s quarterly repurchase offers. Shareholders will receive written notice of each quarterly repurchase offer (“Repurchase Offer Notice”) that includes the date the repurchase offer period ends (“Repurchase Request Deadline”) and the date the repurchase price will be determined (“Repurchase Pricing Date”). Shares will be repurchased at the NAV per share determined on the Repurchase Pricing Date.
During the six months ended March 31, 2020, the Fund completed two quarterly repurchase offers. The Fund offered to repurchase up to 5% of its outstanding shares as of each respective Repurchase Pricing Date. No repurchase offer was oversubscribed. The results of those repurchase offers were as follows:
| Repurchase Offer #1 | Repurchase Offer #2 | |
| Commencement Date | September 27, 2019 | December 27, 2019 |
| Repurchase Request Deadline | November 5, 2019 | February 5, 2019 |
| Repurchase Pricing Date | November 5, 2019 | February 5, 2019 |
| Amount Repurchased | $80,121,423 | $109,251,967 |
| Shares Repurchased | 2,930,871 | 3,977,559 |
8. RISK FACTORS
COVID-19 Risk– An outbreak of infectious respiratory illness caused by a novel coronavirus known as COVID-19 was first detected in China in December 2019 and has now been detected globally. COVID-19 has resulted in travel restrictions, closed international borders, enhanced health screenings at ports of entry and elsewhere, disruption of and delays in healthcare service preparation and delivery, prolonged quarantines, cancellations, supply chain disruptions, and lower consumer demand, as well as general concern and uncertainty. The impact of COVID-19, and other infectious illness outbreaks that may arise in the future, could adversely affect the economies of many countries or the entire global economy, individual issuers and capital markets in ways that cannot necessarily be foreseen. In addition, the impact of infectious illnesses in emerging market countries may be greater due to generally less established healthcare systems. Public health crises caused by the COVID-19 outbreak may exacerbate other pre-existing political, social and economic risks in certain countries or globally. As such, issuers of real estate securities with properties, operations, productions, offices, and/or personnel in (or other exposure to) areas affected with the virus may experience significant disruptions to their business and/or holdings. Potential impacts on the real estate market may include lower occupancy rates, decreased lease payments, defaults and foreclosures, among other consequences. The extent to which COVID-19 will affect the Fund, the Fund’s service providers and/or such issuer’s operations and results will depend on future developments, which are highly uncertain and cannot be predicted, including new information that may emerge concerning the severity of COVID-19. and the actions taken to contain COVID-19. The duration of the COVID-19 outbreak and its impact on the global economy cannot be determined with certainty.
| Semi-Annual Report | March 31, 2020 | 41 |
| Griffin Institutional Access Real Estate Fund | Notes to Financial Statements |
March 31, 2020 (Unaudited)
Market Risk– An investment in the fund’s shares is subject to investment risk, including the possible loss of the entire principal amount invested. An investment in the fund’s shares represents an indirect investment in the securities owned by the fund. The value of these securities, like other market investments, may move up or down, sometimes rapidly and unpredictably.
Liquidity Risk– There currently is no secondary market for the Fund’s shares and the Adviser does not expect that a secondary market will develop. Limited liquidity is provided to shareholders only through the Fund’s quarterly repurchase offers for no less than 5% of the Fund’s shares outstanding at net asset value. There is no guarantee that shareholders will be able to sell all of the shares they desire in a quarterly repurchase offer. The Fund’s investments also are subject to liquidity risk. Liquidity risk exists when particular investments of the Fund would be difficult to purchase or sell, possibly preventing the Fund from selling such illiquid securities at an advantageous time or price, or possibly requiring the Fund to dispose of other investments at unfavorable times or prices in order to satisfy its obligations.
Real Estate Industry Concentration Risk– Because the Fund will concentrate its investments in real estate securities, its portfolio will be significantly impacted by the performance of the real estate market and may experience more volatility and be exposed to greater risk than a more diversified portfolio. Significant investments in the securities of issuers within the real estate industry and any development affecting the real estate industry will have a greater impact on the value of the net assets of the Fund than would be the case if the Fund did not have significant investments in the real estate industry. The Fund’s investment in real estate equity or debt may be subject to risks similar to those associated with direct investment in real property. The value of the Fund’s shares will be affected by factors affecting the value of real estate and the earnings of companies engaged in the real estate industry. These factors include, among others: (i) changes in general economic and market conditions; (ii) changes in the value of real estate properties; (iii) risks related to local economic conditions, overbuilding and increased competition; (iv) increases in property taxes and operating expenses; (v) changes in zoning laws; (vi) casualty and condemnation losses; (vii) variations in rental income, neighborhood values or the appeal of property to tenants; (viii) the availability of financing and (ix) changes in interest rates. Many real estate companies utilize leverage, which increases investment risk and could adversely affect a company’s operations and market value in periods of rising interest rates. The value of securities of companies in the real estate industry may go through cycles of relative under-performance and outperformance in comparison to equity securities markets in general. As of March 31, 2020, the Fund had 85.65% of the value of its net assets invested within the real estate industry.
REIT Risk -Share prices of Public REITs may decline because of adverse developments affecting the real estate industry and real property values. In general, real estate values can be affected by a variety of factors, including supply and demand for properties, the economic health of the country or of different regions, and the strength of specific industries that rent properties. Qualification as a REIT under the Internal Revenue Code of 1986, as amended (the “Code”) in any particular year is a complex analysis that depends on a number of factors. There can be no assurance that an entity in which the Fund invests with the expectation that it will be taxed as a REIT will, in fact, qualify as a REIT. An entity that fails to qualify as a REIT would be subject to a corporate level tax, would not be entitled to a deduction for dividends paid to its shareholders and would not pass through to its shareholders the character of income earned by the entity. Dividends paid by REITs may not receive preferential tax treatment afforded other dividends.
Preferred Securities Risk– There are various risks associated with investing in preferred securities, including credit risk, interest rate risk, deferral and omission of distributions, subordination to bonds and other debt securities in a company’s capital structure, limited liquidity, limited voting rights and special redemption rights. Interest rate risk is, in general, the risk that the price of a debt security falls when interest rates rise. Securities with longer maturities tend to be more sensitive to interest rate changes. Credit risk is the risk that an issuer of a security may not be able to make principal and interest or dividend payments on the security as they become due. Holders of preferred securities may not receive dividends, or the payment can be deferred for some period of time. In bankruptcy, creditors are generally paid before the holders of preferred securities.
Mortgage-Backed Securities Risk– Mortgage-backed securities represent interests in “pools” of mortgages and often involve risks that are different from or possibly more acute than risks associated with other types of debt instruments. When the Fund invests in mortgage-backed securities, the Fund is subject to the risk that, if the underlying borrowers fail to pay interest or repay principal, the assets backing these securities may not be sufficient to support payments on the securities. Prepayment risk is associated with mortgage-backed securities. If interest rates fall, the underlying debt may be repaid ahead of schedule, reducing the value of the Fund’s investments. If interest rates rise, there may be fewer prepayments, which would cause the average bond maturity to rise, increasing the potential for the Fund to lose money. The value of these securities may be significantly affected by changes in interest rates, the market’s perception of issuers, and the creditworthiness of the parties involved. The ability of the Fund to successfully utilize these instruments may depend on the ability of the Fund’s Adviser or Sub-Adviser to forecast interest rates and other economic factors correctly. These securities may have a structure that makes their reaction to interest rate changes and other factors difficult to predict, making their value highly volatile. The credit risk on such securities is affected by borrowers defaulting on their loans. The values of assets underlying mortgage-backed securities may decline and, therefore, may not be adequate to cover underlying investors. Many of the risks of investing in MBS reflect the risks of investing in the real estate securing the underlying mortgage loans. These risks reflect the effects of local and other economic conditions on real estate markets, the ability of tenants to make loan payments, and the ability of a property to attract and retain tenants.
| 42 | 1.888.926.2688 | www.griffincapital.com |
| Griffin Institutional Access Real Estate Fund | Notes to Financial Statements |
March 31, 2020 (Unaudited)
Concentration of Credit Risk– The Fund places its cash with one banking institution, which is insured by the Federal Deposit Insurance Corporation (“FDIC”). The FDIC limit is $250,000. At various times throughout the year, the amount on deposit may exceed the FDIC limit and subject the Fund to a credit risk. The Fund does not believe that such deposits are subject to any unusual risk associated with investment activities. The Fund may invest cash balances in an open-ended Money Market Mutual Fund (“Money Market Fund”). The Money Market Fund is valued at its closing NAV. The Money Market Fund is not subject to FDIC insurance.
9. SUBSEQUENT EVENTS
Subsequent events after the date of the Statement of Assets and Liabilities have been evaluated through the date the financial statements were issued.
As outlined in the Fund’s Quarterly Repurchase Offer Notice dated March 27, 2020, the Fund offered to repurchase up to 5% of its outstanding shares (the “Repurchase Offer”) at the net asset value of such shares on May 6, 2020 (the “Repurchase Date”). The repurchase requests received by the Fund by the Repurchase Date exceeded the number of shares of the Fund subject to the Repurchase Offer and as such, the Fund determined to repurchase shares on a pro rata basis. Accordingly, the Fund repurchased approximately 67.901% of the total number of shares tendered for repurchase which resulted in 8,277,538 repurchased shares for $210,575,068.
Management has determined that there were no other subsequent events to report through the issuance of these financial statements.
| Semi-Annual Report | March 31, 2020 | 43 |
| Griffin Institutional Access Real Estate Fund | Additional Information |
March 31, 2020 (Unaudited)
1. PROXY VOTING POLICIES AND VOTING RECORD
A description of the policies and procedures that the Fund uses to vote proxies relating to its portfolio securities is available without charge upon request by calling toll-free 888-926-2688, or on the Securities and Exchange Commission’s (“SEC”) website at http://www.sec.gov. Information regarding how the Fund voted proxies relating to underlying portfolio securities during the most recent 12-month period ended June 30th is available without charge upon request by calling toll-free 888-926-2688, or on the SEC’s website at http://www.sec.gov.
2. QUARTERLY PORTFOLIO HOLDINGS
The Fund files its complete schedule of portfolio holdings with the SEC for the first and third quarters of each fiscal year as an exhibit to its reports on Form N-PORT. The Fund’s Form N-PORT reports are available on the SEC’s web site at http://www.sec.gov. Prior to August 29, 2019, the Fund filed its complete schedule of portfolio holdings with the SEC for the first and third quarters of each fiscal year on Form N-Q. The Fund’s Form N-Q’s are available on the SEC’s website at http://www.sec.gov.
| 44 | 1.888.926.2688 | www.griffincapital.com |
| Griffin Institutional Access Real Estate Fund | Service Providers |
March 31, 2020 (Unaudited)
Investment Adviser
Griffin Capital Advisor, LLC
Griffin Capital Plaza, 1520 East Grand Avenue, El Segundo, CA 90245
Investment Sub-Advisers
Aon Hewitt Investment Consulting, Inc.
200 East Randolph Street, Suite 1500, Chicago, IL 60601
CenterSquare Investment Management LLC
630 West Germantown Pike, Suite 300, Plymouth Meeting, PA 19462
Administrator
ALPS Fund Services, Inc.
1290 Broadway, Suite 1000, Denver, CO 80203
Custodian
UMB Bank, n.a.
1010 Grand Blvd., Kansas City, Missouri 64106
Distributor
ALPS Distributors, Inc.
1290 Broadway, Suite 1000, Denver, CO 80203
Independent Registered Public Accounting Firm
BBD, LLP
1835 Market Street, 3rd Floor, Philadelphia, PA 19103
Legal Counsel
Greenberg Traurig, LLP
Terminus 200, 3333 Piedmont Road NE, Suite 2500, Atlanta, GA 30305
Transfer Agent and DRIP Administrator
DST Systems, Inc.
330 W 9th Street, Kansas City, MO 64105
| Semi-Annual Report | March 31, 2020 | 45 |
| Griffin Institutional Access Real Estate Fund | Privacy Notice |
March 31, 2020 (Unaudited)
NOTICE OF PRIVACY POLICY & PRACTICES
The Griffin Institutional Access Real Estate Fund (the “Fund”) is committed to maintaining the confidentiality, integrity, and security of your nonpublic personal information (“NPI”). When you provide personal information, the Fund believes that you should be aware of policies utilized to protect the confidentiality of that information. The Fund needs to share your NPI to conduct everyday business. The following information is intended to help you understand what NPI we collect, how we protect your NPI from unauthorized access and why the Fund may share your NPI with other affiliated and non-affiliated parties.
The Fund collects the following nonpublic personal information about you:
| ● | Information we receive from you on or in applications or other forms, correspondence, or conversations, including, but not limited to, your name, address, phone number, social security number, assets, income, and date of birth; and |
| ● | Information about your transactions with us, our affiliates, or others, including, but not limited to, your account number and balance, payments history, parties to transactions, cost basis information, and other financial information. |
How does the Fund protect your nonpublic personal information?
To protect your nonpublic personal information from unauthorized access and use, the Fund maintains physical, electronic and procedural safeguards that comply with applicable federal and state standards. These measures include computer safeguards and secured files and buildings.
What does the Fund do with your personal information?
The Fund does not permit use of your personal information for any joint marketing or non-business purpose. Further, the Fund does not permit the disclosure of your personal information to non-affiliated parties for marketing purposes. The Fund may, however, disclose your personal information to comply with regulatory requirements, court orders or other legal requirements.
Affiliated Parties
The Fund does not disclose any nonpublic personal information about our current or former shareholders to affiliated parties, except as permitted by applicable law or regulation and as described herein. The Fund may, for example, share NPI with personnel of the Fund’s investment adviser and affiliated broker-dealer which also serves as the Fund’s exclusive wholesale marketing agent. The Fund shares NPI with its affiliates for business purposes only in an effort to service your account(s) which includes, but is not limited to, assisting in processing your transactions, inquiring about your transactions and experience, sending you shareholder reports and other information about the Fund or to otherwise provide the applicable service and maintain your account(s). The Fund’s affiliated parties that receive your NPI are required to protect your NPI, provide it only to personnel who need and use it solely for the purpose for which they received it. The Fund and its affiliated parties that receive your NPI maintain physical, electronic and procedural safeguards that comply with applicable federal and state standards to guard your NPI.
Non-Affiliated Parties
The Fund does not disclose any nonpublic personal information about our current or former shareholders to non-affiliated third parties, except as permitted by applicable law or regulation and as described herein. The Fund may share NPI with non-affiliated service providers and their employees, including the Fund’s administrator, transfer agent, distributor, proxy solicitors and legal counsel, among others. The Fund shares NPI with its non-affiliated service providers to service your account(s) including, but not limited to, processing your transactions, sending you shareholder reports and other information about the Fund or to otherwise provide the applicable service and maintain your account(s). These non-affiliated service providers are required to protect your NPI and use it solely for the purpose for which they received it. The non-affiliated service providers are required to maintain physical, electronic and procedural safeguards that comply with applicable federal and state standards to guard your NPI.
| 46 | 1.888.926.2688 | www.griffincapital.com |
Intentionally Left Blank

Item 2. Code of Ethics.
Not applicable.
Item 3. Audit Committee Financial Expert.
Not applicable.
Item 4. Principal Accountant Fees and Services.
Not applicable.
Item 5. Audit Committee of Listed Registrants.
The Fund is not a listed issuer as defined in Rule 10A-3 under the Securities Exchange Act of 1934, as amended.
Item 6. Investments.
(a) | The Schedule of Investments is included as part of the Report to Stockholders filed under Item 1 of this report. |
(b) | Not applicable to the Fund. |
Item 7. Disclosure of Proxy Voting Policies and Procedures for Closed-End Management Investment Companies.
Not applicable.
Item 8. Portfolio Managers of Closed-End Management Investment Companies.
| (a) | Not applicable. |
| (b) | Not applicable. |
Item 9. Purchases of Equity Securities by Closed-End Management Investment Company and Affiliated Purchasers.
None.
Item 10. Submission of Matters to a Vote of Security Holders.
No changes have occurred.
Item 11. Controls and Procedures.
(a) | Based on an evaluation of the Fund’s disclosure controls and procedures (as defined in Rule 30a-3(c) under the 1940 Act), the registrant’s principal executive officer and principal financial officer have concluded that the registrant’s disclosure controls and procedures are effective as of a date within 90 days of the filing date of this report. |
(b) | There were no significant changes in the Fund’s internal control over financial reporting that occurred during the Fund’s last fiscal half-year that have materially affected, or are reasonably likely to materially affect, the Fund’s internal control over financial reporting. |
Item 12. Disclosure of Securities Lending Activities for Closed-End Management Investment Companies.
None.
Item 13. Exhibits.
(a)(1) | Not applicable. |
(a)(2) | Certifications required by Item 13(a)(2) of Form N-CSR are filed herewith as Exhibit 99.CERT. |
(b) | Certifications required by Item 13(b) of Form N-CSR are filed herewith as Exhibit 99.906CERT. |
SIGNATURES
Pursuant to the requirements of the Securities Exchange Act of 1934 and the Investment Company Act of 1940, the registrant has duly caused this report to be signed on its behalf by the undersigned, thereunto duly authorized.
GRIFFIN INSTITUTIONAL ACCESS REAL ESTATE FUND
By: | /s/ Kevin Shields |
|
| Kevin Shields |
|
| President (Principal Executive Officer) |
|
|
|
|
Date: | June 5, 2020 |
|
Pursuant to the requirements of the Securities Exchange Act of 1934 and the Investment Company Act of 1940, this report has been signed below by the following persons on behalf of the registrant and in the capacities and on the dates indicated.
By (Signature and Title)
By: | /s/ Kevin Shields |
|
| Kevin Shields |
|
| President (Principal Executive Officer) |
|
|
|
|
Date: | June 5, 2020 |
|
By (Signature and Title)
By: | /s/ Joseph Miller |
|
| Joseph Miller |
|
| Treasurer (Principal Financial Officer) |
|
|
|
|
Date: | June 5, 2020 |
|