UNITED STATES
SECURITIES AND EXCHANGE COMMISSION
WASHINGTON, D.C. 20549
FORM N-CSR
CERTIFIED SHAREHOLDER REPORT OF REGISTERED
MANAGEMENT INVESTMENT COMPANIES
811-22933
(Investment Company Act file number)
Griffin Institutional Access Real Estate Fund
(Exact name of registrant as specified in charter)
Griffin Capital Plaza
1520 E. Grand Avenue
El Segundo, CA 90245
(Address of principal executive offices)
(310) 469-6100
(Registrant's telephone number, including area code)
ALPS Fund Services, Inc.
1290 Broadway, Suite 1000
Denver, CO 80203
(Name and address of agent for service)
Copy to:
Terrence O. Davis, Esq.
Greenberg Traurig, LLP
Terminus 200
3333 Piedmont Road, NE, Suite 2500
Atlanta, GA 30305
Date of fiscal year end: September 30
Date of reporting period: October 1, 2020 – September 30, 2021
Item 1. Reports to Stockholders.
ELECTRONIC REPORTS DISCLOSURE
Beginning on January 1, 2021, as permitted by regulations adopted by the Securities and Exchange Commission, paper copies of the Fund’s shareholder reports will no longer be sent by mail, unless you specifically request paper copies of the reports from the Fund or from your financial intermediary (such as a broker-dealer or bank). Instead, the reports will be made available on the Fund’s website (www.griffincapital.com), and you will be notified electronically or by mail, depending on your elections, each time a report is posted and provided with a website link to access the report.
You may elect to receive all future reports in paper, free of charge. If you invest directly with the Fund, you can call the Fund toll-free at 1-888-926-2688 or visit www.griffincapital.com/investor-login to inform the Fund that you wish to continue receiving paper copies of your shareholder reports. If you invest through a financial intermediary, you can contact your financial intermediary to request that you continue to receive paper copies of your shareholder reports. Please note that not all financial intermediaries may offer this service. Your election to receive reports in paper will apply to all funds held in your account if you invest through your financial intermediary or all funds held with the fund sponsor if you invest directly with a fund.
If you already elected to receive shareholder reports electronically, you will not be affected by this change and you need not take any action. You may elect to receive electronic delivery of shareholder reports and other communications by: (i) calling the Fund toll-free at 1-888-926-2688 or visiting www.griffincapital.com/investor-login, if you invest directly with the Fund, or (ii) contacting your financial intermediary, if you invest through a financial intermediary. Please note that not all financial intermediaries may offer this service.
Table of Contents
| Shareholder Letter | 2 |
| Portfolio Update | 15 |
| Schedule of Investments | 17 |
| Statement of Assets and Liabilities | 22 |
| Statement of Operations | 23 |
| Statements of Changes in Net Assets | 24 |
| Statement of Cash Flows | 26 |
| Financial Highlights | 27 |
| Notes to Financial Statements | 38 |
| Report of Independent Registered Public Accounting Firm | 47 |
| Additional Information | 48 |
| Trustees’ Consideration and Approval of Renewal of Advisory Agreements | 49 |
| Trustees and Officers | 53 |
| Service Providers | 55 |
| Privacy Notice | 56 |
Dear Fellow Shareholders,
We are pleased to present the Griffin Institutional Access® Real Estate Fund (the “Fund”) annual report.
We greatly appreciate the support of our shareholders, and we will remain true to the Fund’s stated objective of delivering returns comprised of income and appreciation with moderate volatility and low correlation to the broader markets. The Fund achieved record setting performance during the fiscal year ended September 30, 2021, producing its highest fiscal year return since inception and delivered along the way its two best quarters of performance since inception in the second and third quarters of 2021. This strong performance has fueled asset growth as the Fund reached an all-time high in assets under management as of the time of this writing. During the fiscal year ended September 30, 2021, the Fund’s load-waived Class A shares (NASDAQ: GIREX) delivered a total return of 16.67%, driven by strong performance across private and public real estate allocations1. From the Fund’s inception on June 30, 2014, through September 30, 2021, the Fund’s load-waived Class A shares (NASDAQ: GIREX) generated a(n)1: |  Randy I. Anderson, Ph.D., CRE Chief Executive Officer Griffin Capital Asset Management Company, LLC Portfolio Manager & Founding Partner Griffin Institutional Access Real Estate Fund |
| • | Total cumulative return of 60.51% and a 6.74% annualized return |
| • | Sharpe ratio of 1.83 |
| • | Standard deviation of 3.24%, which is in line with the standard deviation for the Bloomberg U.S. Aggregate Bond Index (3.12%) |
| • | Alpha of 4.16% |
| • | Beta of 0.12 |
Following the shortest recession on record, the U.S. economy has transitioned from the recovery phase to the expansionary phase of the economic cycle. Real GDP experienced outsized growth during the year ended September 30, 2021, as pent-up demand drove increased levels of consumption across most categories. Moving forward we expect the benefits of global fiscal and monetary stimulus to wane with growth reverting to more normalized levels. The U.S. continues to progress in the fight against COVID-19 with over 77% of the population age 18 and older having received at least one dose of the vaccine (including those who received one dose of the single-shot Johnson and Johnson’s Janssen COVID-19 vaccine). Additionally, approximately 94% of the most vulnerable population of adults, age 65 years and older, have also received at least one dose of the vaccine as of September 30, 20212. We believe increasing vaccination levels, coupled with loosening government restrictions, have positively contributed to the labor market recovery as the unemployment rate (U-3) tightened to 4.8% as of September 2021, representing a drastic decline from the peak unemployment rate of 14.8% observed in April 20203. Global supply chains are struggling to keep up with the surge in consumer demand, and lasting effects from last year’s economic downturn have contributed to rising inflation with the Consumer Price Index (CPI) increasing 5.4% year-over-year as of September 20213. As inflation pressures mount, Fed policy will become increasingly more important as market participants search for clues relative the pace of tapering and other policy movements.
Past performance is not indicative of future results. Investment return and the principal value of an investment will fluctuate. Shares may be worth more or less than original cost when redeemed. Investing involves risk, including loss of principal. Fund performance based on load-waived Class A shares and does not reflect any sales charge. The maximum sales charge for Class A shares is 5.75%. If the data reflected the deduction of such charges, the performance would be lower. Performance includes reinvestment of distributions and reflects management fees and other expenses. The Fund offers multiple different classes of shares. An investment in any share class of the Fund represents an investment in the same assets of the Fund. However, the purchase restrictions, ongoing fees, expenses, and performance for each share class are different. For more information on the differences in share classes, refer to the applicable prospectus, which can be found at: www.griffincapital.com.
Due to financial statement adjustments, performance information presented herein for the Fund differs from the Fund’s financial highlights which are prepared in accordance with U.S. GAAP. Such differences generally are attributable to valuation adjustments to certain of the Fund’s investments which are reflected in the financial statements.
2
Additionally, government budget reconciliation, the Biden Administration’s infrastructure bill, and tax legislation remain at the forefront of the agenda in the fourth quarter of 2021. Overall, we are encouraged by the broad economic improvements observed thus far in 2021.
The U.S. commercial real estate market continues to benefit from favorable supply and demand dynamics as the broad economic recovery steadily pushes forward. However, due to the varying impacts of COVID-19 and the subsequent effect on consumer behavior, performance across property types and markets has been uneven, which has led to opportunities for active management. The Fund’s portfolio positioning is informed by our preference for sectors that we believe stand to benefit the most from secular growth trends, including the multifamily, industrial, and specialty sectors (such as life sciences and student housing) which comprise over 83% of the Fund’s private equity real estate portfolio as of October 1, 20214.
U.S. multifamily property fundamentals strengthened significantly during the third quarter of 2021 with the overall national vacancy rate declining to 2.9%, representing a 150 basis point decrease year-over-year, marking the lowest level observed since 19945. Additionally, rent growth was robust, increasing 11.4% year-over-year as of September 2021. This growth represents the largest increase on record with all top 30 markets tracked by YardiMatrix posting positive year-over-year growth6. We believe the pre-pandemic structural undersupply of housing combined with strong job growth, ongoing household formation, and elevated home prices should provide tailwinds for the sector moving forward. The industrial sector has continued to show strength as consumer demand rebounds and companies scramble to adapt to consumer preferences for expeditious delivery of goods. The industrial vacancy rate fell to a record low of 6.0% at the end of the third quarter of 2021 as net absorption improved to 120.3 million square feet, marking the second time in the last four quarters that net absorption has topped 100 million square feet5. Demand for modern, high-quality logistics assets remains robust as e-commerce continues to acquire an increasing share of total retail sales. Additionally, companies are aiming to adjust for supply shortfalls by transitioning from “just-in-time” inventory management to a “just-in-case” supply model which should fuel additional industrial demand moving forward. The specialty property type, consisting of life sciences, healthcare, government specialized facilities, and student housing, continues to benefit from attractive secular growth trends. Life sciences, the dominant component of the Fund’s specialty sector allocation, is comprised of laboratory and research facilities located in primary innovation markets throughout the United States. Record levels of investment from the National Institutes of Health and venture capital companies has been a key driver of demand for lab space. Life sciences companies have raised over $38 billion in the first half of 2021, representing a 77% increase from the first half of 20207. In our view, an aging U.S. population combined with increasing technological and medical innovations should provide strong support for this sector moving forward. The student housing property type continues to benefit from the broad reopening as most colleges and universities have returned to in-person instruction. Early indicators reveal a return to pre-pandemic levels with pre-leasing rising to 94.1% in September 20218. In fact, the student housing property type is forecasted to have the strongest NOI growth across all major sectors over a five-year period with a projected 4.9% compound annual growth rate9. Within the traditional office sector, return-to-office plans that were slated for Labor Day 2021 have generally been delayed due to the late summer surge of the COVID-19 Delta variant. While the lingering impacts related to work-from-home policies present challenges, many companies, particularly technology companies, are actively increasing their office footprints given the value that can be derived through in-person collaboration and culture development. Conditions for the retail sector have improved throughout 2021 as vaccine uptake and efficacy have largely eliminated restrictions on non-essential business and opened the door for increased foot traffic and occupancy. Neighborhood centers remain the most resilient segment of the retail market with national availability rates recovering to levels observed prior to the pandemic5. Consumers are eager to spend and physical retailers providing services or experiences that can’t be easily replicated online stand to benefit the most moving forward for brick-and-mortar retail.
Griffin Institutional Access Real Estate Fund is a closed-end interval fund. Limited liquidity is provided to shareholders only through the Fund’s quarterly repurchase offers for no less than 5% and no more than 25% of the Fund’s shares outstanding at net asset value. The Fund is suitable only for investors who can bear the risks associated with the limited liquidity of the Fund and should be viewed as a long-term investment. There is no secondary market for the Fund’s shares and none is expected to develop.
Diversification does not eliminate the risk of experiencing investment losses. Holdings and allocations are subject to change without notice. Represents the views of Griffin Capital at the time of this letter and is subject to change.
3
By actively investing across all four quadrants of the commercial real estate market (public equity, private equity, public debt, private debt), the Fund tactically allocates based on prevailing market conditions in the pursuit of delivering attractive risk-adjusted returns for our investors. The Fund’s private real estate allocation has significantly outperformed the NCREIF ODCE Index (+3.57% excess return over the trailing one-year period ended 6/30/2110) due in part to active management across the Fund’s multifamily, industrial, and specialty (such as life sciences and student housing) sector allocations. Further, the Fund’s private real estate debt investments continue to deliver strong durable income and have been a positive contributor to performance. Publicly traded real estate equity (as represented by the FTSE Nareit All Equity REITs Index) posted an outsized 31.54% return in the year ended September 30, 2021, while the S&P 500 Index and the Bloomberg U.S. Aggregate Bond Index delivered returns of 30.00% and -0.90%, respectively1. Given the backdrop of low yields and concerns regarding rising inflation, real estate remains a preferred asset allocation tool for investors seeking durable, tax-efficient income with a degree of insulation from inflation. Historically, real estate has served as a hedge against inflation particularly during periods of strong economic growth generally due to positive rent growth and lower vacancy.
Moving forward, we believe positive economic growth, an improving labor market, accommodative monetary policy, and the potential for increased infrastructure spending may provide an attractive backdrop for commercial real estate.
On behalf of the entire Griffin Capital team, we thank you for your continued confidence.
Sincerely,

Randy I. Anderson, Ph.D., CRE
Chief Executive Officer, Griffin Capital Asset Management Company, LLC
Portfolio Manager and Founding Partner, Griffin Institutional Access Real Estate Fund
4
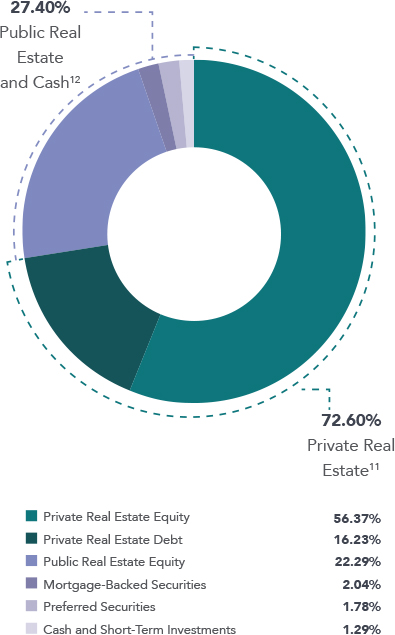
PORTFOLIO EXPOSURE AS OF OCTOBER 1, 2021 (UNAUDITED)
Overall Portfolio Exposure
| Private Real Estate Exposure11 | 73 | % | ||
| Cortland Growth and Income Fund | 7.58 | % | ||
| Clarion Lion Properties Fund | 7.47 | % | ||
| Morgan Stanley Prime Property Fund | 5.15 | % | ||
| Clarion Lion Industrial Trust | 4.41 | % | ||
| Ventas Life Science and Healthcare Real Estate Fund | 4.18 | % | ||
| Oaktree Real Estate Income Fund | 3.87 | % | ||
| TA Realty Core Property Fund | 2.85 | % | ||
| Clarion Gables Multifamily Trust | 2.68 | % | ||
| CA Student Living Income and Growth Fund | 2.30 | % | ||
| CBRE U.S. Core Partners | 2.00 | % | ||
| CBRE U.S. Logistics Partners | 1.90 | % | ||
| Prologis Targeted U.S. Logistics Fund | 1.81 | % | ||
| Sentinel Real Estate Fund | 1.60 | % | ||
| TA Realty Logistics Fund | 1.40 | % | ||
| USAA US Government Building Fund | 1.35 | % | ||
| Dream US Industrial Fund | 1.31 | % | ||
| Prudential PRISA | 0.85 | % | ||
| Stockbridge Smart Markets Fund | 0.67 | % | ||
| Manulife U.S. Real Estate Fund13 | 0.67 | % | ||
| Heitman America Real Estate Trust | 0.45 | % | ||
| GWL U.S. Property Fund | 0.44 | % | ||
| UBS Trumbull Property Fund | 0.34 | % | ||
| BGO Diversified US Property Trust | 0.29 | % | ||
| BlackRock US Core Property Fund | 0.23 | % | ||
| Barings Core Property Fund | 0.20 | % | ||
| ARA Core Property Fund14 | 0.20 | % | ||
| AEW Core Property Trust | 0.17 | % | ||
| Private Real Estate Equity | 56.37 | % | ||
| Heitman Core Real Estate Debt Income Trust | 2.85 | % | ||
| Brookfield Senior Mezzanine Real Estate Finance Fund | 2.62 | % | ||
| TCM CRE Credit Fund | 2.56 | % | ||
| JP Morgan U.S. Real Estate Core Mezzanine Debt Fund | 2.20 | % | ||
| PGIM Real Estate US Debt Fund | 1.64 | % | ||
| CrossHarbor Strategic Debt Fund | 1.61 | % | ||
| ARES Real Estate Enhanced Income Fund | 1.43 | % | ||
| Voya Commercial Mortgage Lending Fund | 1.32 | % | ||
| Private Real Estate Debt | 16.23 | % | ||
| Public Real Estate Exposure and Cash12 | 27 | % | ||
| Public Real Estate Equity | 22.29 | % | ||
| Mortgage-Backed Securities | 2.04 | % | ||
| Preferred Securities | 1.78 | % | ||
| Cash and Short-Term Investments | 1.29 | % |
Past performance is not indicative of future results. Diversification does not eliminate the risk of experiencing investment losses. Holdings and allocations are subject to change without notice.
5
PRIVATE FUND DIVERSIFICATION AS OF OCTOBER 1, 2021 (UNAUDITED)15
Through its investment in private funds, Griffin Institutional Access Real Estate Fund offers immediate diversification by property sector, geography, and exposure to real estate equity and debt.
Private Real Estate Exposure: Geographic Diversification

| Property Sector | Percentage of Total Fund Assets | Percentage of Private Fund Assets | Highlights |
Multifamily Private Real Estate Equity Private Real Estate Debt | 26.02% 20.48% 5.54% | 35.83% 28.21% 7.62% | 667 apartment investments comprised of over 190,000 units diversified across high growth markets. |
Industrial Private Real Estate Equity Private Real Estate Debt | 18.50% 17.45% 1.05% | 25.48% 24.04% 1.44% | 2,071 investments boasting over 617 million square feet of industrial assets including facilities that support the fast-growing e-commerce logistics industries. |
Office Private Real Estate Equity Private Real Estate Debt | 12.07% 6.26% 5.81% | 16.63% 8.63% 8.00% | 277 high-quality office investments in diverse, high-demand metropolitan areas representing over 111 million square feet of space. |
Specialty Private Real Estate Equity Private Real Estate Debt | 9.30% 8.93% 0.37% | 12.81% 12.29% 0.52% | 123 investments spanning over 21 million square feet of life sciences facilities, healthcare assets, and government offices, together with more than 4,700 student housing units across the country. |
Retail Private Real Estate Equity Private Real Estate Debt | 3.41% 2.28% 1.13% | 4.70% 3.14% 1.56% | 240 investments with more than 57 million square feet of retail space. |
Other Private Real Estate Equity Private Real Estate Debt | 2.02% 0.94% 1.08% | 2.78% 1.29% 1.49% | 289 investments comprised of self-storage facilities, parking garages, and land. |
Hospitality Private Real Estate Equity Private Real Estate Debt | 1.28% 0.03% 1.25% | 1.77% 0.04% 1.73% | 23 investments representing over 7,700 keys across the country. |
Past performance is not indicative of future results. Diversification does not eliminate the risk of experiencing investment losses. Holdings and allocations are subject to change without notice.
For purposes of the Investment Company Act of 1940 (the “1940 Act”), the Fund is classified as a non-diversified fund, which means the Fund may invest more than 5% of its total assets in the securities of one or more issuers. However, among the number of issuers, the Fund seeks exposure across multiple sectors of the real estate industry (e.g., industrial, office, and multifamily) and geographic locations. As used herein, the terms “diversify,” “diversified,” and “diversification” are meant to reference that variety and not the Fund’s diversification status under the 1940 Act.
6
PRIVATE FUND SUMMARIES (UNAUDITED)
 | AEW Core Property Trust is an open-end core fund that seeks to invest in high quality assets located in top-tier markets with a heavy emphasis on income, liquidity and strong long-term fundamentals. AEW Core Property Trust uses a research-based approach to target markets with high barriers to entry – physical, governmental, or economic – in addition to population and job growth potential. |
 | ARA Core Property Fund is a diversified open-end commingled fund that invests primarily in high quality core income-producing office, industrial, retail, and multifamily properties. The ARA Core Property Fund focuses its investment activity throughout the United States in major metropolitan markets that are innovation hubs containing high concentrations of our nation’s globally competitive industries and that benefit from highly educated/professional human capital. |
 | ARES Real Estate Enhanced Income Fund is an open-end real estate debt fund with a principal objective to generate current income with an emphasis on principal protection by creating a diversified portfolio of first mortgage loans secured by commercial real estate across major property types, which primarily includes multifamily, industrial, retail, office and hospitality properties. The ARES Real Estate Enhanced Income Fund will focus on the disciplined origination of first mortgage loans secured by commercial real estate assets with strong sponsorship and located in major markets within the United States. |
 | Barings Core Property Fund is a U.S. open-end, diversified core fund that focuses on the four traditional property types and hotels. The Barings Core Property Fund is managed with an emphasis on research, targeting “barrier” markets, which are perceived to reduce the risk of oversupply and offer potential for outsized rent growth and appreciation. |
 | BGO Diversified US Property Fund is an open-end core real estate private equity fund that invests in a portfolio of institutional-quality real estate assets in the U.S. BGO Diversified’s investment strategy is focused on maintaining stable income, building a diversified modern portfolio, using moderate leverage, and providing superior liquidity. BGO Diversified upholds a strong commitment to the principles of Responsible Property Investing. |
 | BlackRock U.S. Core Property Fund is a diversified core private REIT with an investment objective to provide current income with the potential for long term capital appreciation. The BlackRock U.S. Core Property Fund aims to beat its stated benchmark, the NFI-ODCE, while producing real estate returns and liquidity appropriate for a core fund. |
 | Brookfield Senior Mezzanine Real Estate Finance Fund is an open-end senior real estate debt fund focused on providing primarily floating rate financing secured by commercial property primarily located in the U.S. and secured by generally well-leased/light transitional commercial real estate properties that generate significant cash flow. Brookfield Senior Mezzanine Real Estate Finance Fund will primarily focus on creating investment positions by originating floating rate whole loans, syndicating the first mortgage and retaining the mezzanine exposure. |
 | CA Student Living Income and Growth Fund is an open-end private equity real estate fund that is focused exclusively on the student housing sector. The Fund aims to acquire institutional student housing properties at large public and private universities in the United States. |
 | CBRE U.S. Core Partners is an open-end core fund that purchases and operates high-quality, income-producing office, industrial, retail, and multifamily assets in select major U.S. metropolitan markets that exhibit strong growth demographics. |
| | CBRE U.S. Logistics Partners is an open-end private equity real estate fund focused exclusively on the industrial sector. The Fund aims to acquire modern, highly-functional, stabilized logistics assets located in major population and consumption centers while simultaneously implementing a build-to-core strategy capitalizing on major metro markets with favorable supply and demand dynamics. |
 | Clarion Gables Multifamily Trust provides investors access to a high-quality multifamily portfolio with a best-in-class operator and fund manager. Gables is a market-leading, vertically-integrated multifamily real estate company with a 34-year history in the management, construction, development, acquisition and disposition of multifamily communities in the United States. |
| | Clarion Lion Industrial Trust is a private REIT focused on the industrial property sector in North America. Clarion Lion Industrial Trust invests primarily in big-box warehouse and distribution centers, with an emphasis on large, core industrial markets throughout the United States. |
| | Clarion Lion Properties Fund is a core private REIT with interests in a diversified portfolio of primarily institutional quality real estate assets and related investments located throughout the U.S. The investment objective is to provide a strong income return with potential for long-term capital appreciation. |
 | Cortland Growth and Income Fund, a leading Southern United States focused multifamily owner and operator, is a domestic multifamily open-end core-plus fund focused on acquiring best-in-class, income producing properties in U.S. growth markets. |
 | CrossHarbor Strategic Debt Fund is an open-end debt fund that seeks to generate compelling risk-adjusted current and total returns for investors by originating and managing first mortgage loans secured by core, core-plus, and value-add commercial real estate located throughout the United States. |
 | Dream US Industrial Fund is an open-end private equity real estate fund focused exclusively on the industrial sector. The Fund seeks to acquire and develop a portfolio of high-quality and functional industrial assets in strategic markets throughout the United States. The Fund will target core and core-plus assets including bulk distribution, last-mile warehousing, business parks, and light industrial assets in secondary interior distribution markets with a primary focus on markets experiencing strong economic and demographic fundamentals. |
 | GWL U.S. Property Fund is an open-end real estate fund consisting of a diversified portfolio of institutional quality, income producing assets broadly allocated by property type and geographic location. GWL U.S. Property Fund employs a core plus strategy intertwined with a disciplined risk management process in seeking to achieve its performance objectives. |
 | Heitman America Real Estate Trust is an open-end core commingled fund. Heitman America Real Estate Trust’s core strategy encompasses stabilized investments with low to moderate leverage and seeks to objectively minimize risk through diversification in property type, geographic location, and tenant composition. |
Holdings are subject to change without notice.
7
| Heitman Core Real Estate Debt Income Trust is an open-ended, commingled fund, that originates and services first mortgage loans secured by income-producing U.S. commercial real estate. Heitman Core Real Estate Debt Income Trust will seek to originate senior debt financing to high-quality real estate operators in both primary and specialty property sectors. |
 | JP Morgan U.S. Real Estate Core Mezzanine Debt Fund pursues a disciplined, income-producing strategy achieved primarily by investing in a portfolio of real estate and real estate-related assets, consisting of mezzanine debt, B-notes, mortgages, and preferred equity investments. It focuses on the four primary property types including office, multifamily, industrial, and retail, owned and operated by experienced and financially capable sponsors with strong performance experience across investment cycles. |
 | Manulife U.S. Real Estate Fund is a U.S. open-end core-plus fund that will target properties located in major U.S. markets, with the objective of preserving capital while delivering a combination of income and long-term capital appreciation. The Manulife U.S. Real Estate Fund will target an allocation of 60% core-plus assets and 40% core investments. |
 | Morgan Stanley Prime Property Fund is an open-end core fund with a focus on office, retail, multifamily, industrial, self storage and hotel properties located in major real estate markets throughout the United States. |
 | Oaktree Real Estate Income Fund is an open-ended fund that targets investments in commercial real estate, primarily office, multifamily and industrial assets. Oaktree Real Estate Income Fund intends to create value by investing in assets that require modest leasing and capital expenditures. |
 | Prologis Targeted US Logistics Fund launched in 2004 as an open-ended, co-investment venture formed by Prologis to partner with institutional investors in acquiring, operating, and disposing of high-quality logistics facilities in key target markets across the U.S. The Fund seeks enhanced returns through actively managing, repositioning and renovating portfolio-owned assets. |
 | PGIM Real Estate U.S. Debt Fund is an open-end debt fund that seeks to originate and service first mortgage and subordinate debt, fixed and floating rate loans, secured by stable income producing properties or properties exhibiting light transitional characteristics. PGIM Real Estate U.S. Debt Fund will focus on the four main property types in the top 30 MSAs and intends to provide secure income returns from investing in a low risk, low volatility portfolio of real estate debt, with a focus on capital preservation and stability of income. |
| | Prudential PRISA is organized as a perpetual life, open-ended, commingled fund to invest primarily in core, well-leased, operating real estate assets located in the United States, with an emphasis on income. PRISA is Prudential Real Estate Investors (“PREI”) flagship fund, and represents one of the oldest and largest U.S. core real estate funds available in the marketplace. |
 | Sentinel Real Estate Fund is a multifamily focused, core private REIT that emphasizes acquisitions of stabilized assets with in-place income with the goal of providing a substantial portion of investor returns in the form of distributed cash. |
 | Stockbridge Smart Markets Fund is an open-end core fund that aims to capture performance in excess of the ODCE Index by acquiring assets in “smart markets” characterized by educated, stable and fast-growing employment bases. The Smart Market Fund’s target market strategy is based on the principle that real estate demand is dependent on jobs which are increasingly being created where there are educated work forces in the U.S. |
 | TA Realty Core Property Fund invests and operates a diversified portfolio of commercial real estate assets across industrial, multifamily, office and retail property types. TA Realty Core Property Fund has three primary objectives: build and operate a first-class portfolio of institutional quality core real estate assets, generate consistent outperformance versus industry benchmarks and provide outstanding client service to investors. |
| | TA Realty Logistics Fund is an open-end private equity real estate fund focused exclusively on the industrial sector. The Fund seeks to assemble a diversified portfolio of well-located logistics facilities in major distribution hubs and last-mile locations. The Fund targets mainly metropolitan areas of the United States that have population growth, economic growth, market economic diversity, supply constraints, liquidity, volatility, and relative yield necessary to create attractive long-term investment returns. |
 | TCM CRE Credit Fund intends to focus primarily on investing in a diversified portfolio of primarily U.S. commercial real estate debt investments, generally within the mezzanine position of the capital stack. Trawler Capital Management Commercial Real Estate Credit Fund will focus on building and maintaining a portfolio of assets that are intended to provide strong risk adjusted returns in all cycles, with emphasis on stable cash flows. |
 | UBS Trumbull Property Fund is an open-end, diversified Core fund focusing on the four main property types, with a small exposure to hotels. UBS Trumbull Property Fund focuses on top markets for high-quality Core, institutional real estate assets. |
 | USAA U.S. Government Building Fund seeks to provide investors with attractive, risk-adjusted returns generated by the acquisition, build to suit development and operation of buildings located in the United States and leased or intended to be leased to U.S. federal, state and local governments and government agencies and departments. |
 | Ventas Life Science and Healthcare Real Estate Fund is an open-ended investment vehicle formed by Ventas, Inc. to invest in high-quality healthcare properties, with a focus on the life science, medical office building, and seniors housing asset classes, in target markets primarily in the United States. The Fund’s primary objective is to generate attractive returns and cash flow with an emphasis on long-term capital growth through investment focused on the healthcare real estate sector. |
 | Voya Commercial Mortgage Lending Fund is a perpetual life, open-ended, commercial mortgage debt fund. The Fund’s investment objective is to generate consistent current income with attractive risk-adjusted returns, while seeking to preserve capital through risk management of the portfolio of commercial mortgage loans and balance sheet management at the Fund level. The Fund will seek generally to achieve its investment objective by applying disciplined credit underwriting to identify and originate a diversified pool of commercial real estate loans located throughout the U.S., in primary, secondary and select tertiary markets. |
Holdings are subject to change without notice.
8
FUND SUB-ADVISERS (UNAUDITED)
Aon Investments USA

Aon Investments USA Inc., an Aon Company, provides research and advisory services to the portion of the Fund’s investment portfolio that is allocated to private real estate funds. Partnering with Aon Investments USA, a global leader ($3.03 trillion in assets under advisement as of March 31, 2021) within the institutional advisory services space, provides Griffin Capital Advisor with the same level of research and due diligence as the nation’s top endowments, universities and pension funds.
CenterSquare Investment Management

CenterSquare Investment Management LLC (“CenterSquare”) manages the portion of the Fund’s investment portfolio that is allocated to public real estate securities. CenterSquare has been managing real estate securities portfolios since 1995, across multiple strategies and market cycles and had approximately $14.0 billion in real estate assets under management as of September 30, 2021.
Griffin Capital Advisor, LLC along with CenterSquare Investment Management have designed a public market strategy in line with the objectives of the Fund with a focus on identifying public real estate securities whose current prices are below their intrinsic values. CenterSquare Investment Management has been managing real estate securities portfolios since 1995 across multiple strategies and market cycles.
9
GLOSSARY (UNAUDITED)
Alpha: A measure of risk-adjusted return implying how much a fund/manager outperformed its benchmark, given its risk profile.
Annualized Return: Calculated by annualizing cumulative return (i.e., adjusting it for a period of one year). Annualized return includes capital appreciation and assumes a reinvestment of dividends and distributions.
Basis Point: One basis point is equal to 1/100th of 1%, or 0.01%.
Beta: A measure of systematic risk (volatility), or the sensitivity of a fund to movements in a benchmark. A beta of 1 implies that you can expect the movement of a fund’s return series to match that of the benchmark used to measure beta. A value of less than 1 implies that the fund is less volatile than the index.
Bloomberg U.S. Aggregate Bond Index: Measures the performance of the U.S. investment grade bond market.
Consumer Price Index (CPI): Measures the average change in prices over time that consumers pay for a basket of goods and services. The CPI is one of the most frequently used statistics for identifying periods of inflations or deflation.
Correlation: A statistical measure of how two securities move in relation to each other. A correlation ranges from -1 to 1. A positive correlation of 1 implies that as one security moves, either up or down, the other security will move in lockstep, in the same direction. A negative correlation of -1 indicates that the securities will move in the opposite direction. If the correlation is 0, the movements of the securities are said to have no correlation; they are completely random.
Cumulative Return: The compound return of an investment. It includes capital appreciation and assumes a reinvestment of dividends and distributions.
Dry Powder: Refers to cash reserves for purchasing assets or making investments.
Real Gross Domestic Product (GDP): An inflation-adjusted measure that reflects the total market value of all goods and services produced within a country in a given period.
NASDAQ: An electronic stock market listing over 5,000 companies. The NASDAQ stock market comprises two separate markets, namely the Nasdaq National Market, which trades large, active securities and the NASDAQ Smallcap Market that trades emerging growth companies.
Net Asset Value (NAV): Represents a fund’s per-share price. NAV is calculated by dividing a fund’s total net assets by its number of shares outstanding.
S&P 500: An index based on market cap of the 500 largest companies having stock listed on the New York Stock Exchange (NYSE) or NASDAQ.
Sharpe Ratio: Measures risk-adjusted returns by calculating the excess return (above the risk free rate) per unit of risk (standard deviation). The higher the ratio, the better the risk-adjusted returns. The average 3 month U.S. Treasury T-bill auction was used as the risk free rate in this material.
Standard Deviation: Measures the average deviations of a return series from its mean, and is often used as a measure of volatility/risk. A large standard deviation implies that there have been large swings in the return series of the manager.
10
IMPORTANT DISCLOSURES (UNAUDITED)
This is neither an offer to sell nor a solicitation to purchase any security. Investors should carefully consider the investment objectives, risks, charges and expenses of Griffin Institutional Access® Real Estate Fund (the “Fund”). This and other important information about the Fund is contained in the prospectus, which can be obtained by visiting www.griffincapital.com. Please read the prospectus carefully before investing.
All Morningstar calculations and metrics are based on monthly data. CALCULATIONS AND METRICS REFLECT A LOAD-WAIVED, CLASS A SHARE (NASDAQ: GIREX). Investors of the load-waived class A share do not pay a front-end sales load/charge. The Fund offers multiple different classes of shares. An investment in any share class of the Fund represents an investment in the same assets of the Fund. However, the purchase restrictions, ongoing fees, expenses, and performance for each share class are different.
Past performance is not indicative of future results. Investment return and the principal value of an investment will fluctuate. Shares may be worth more or less than original cost when redeemed. Investing involves risk, including loss of principal. Performance includes reinvestment of distributions and reflects management fees and other expenses. The Fund return does not reflect the deduction of all fees, including any applicable Fund share class sales load, third-party brokerage commissions or third-party investment advisory fees paid by investors to a financial intermediary for brokerage services. If the deduction of such fees was reflected, the performance would be lower. Returns shown do not reflect the deduction of taxes that a shareholder would pay on Fund distributions or the redemption of Fund shares. Investing in the Fund involves risks, including the risk that you may receive little or no return on your investment or that you may lose part or all of your investment. The ability of the Fund to achieve its investment objective depends, in part, on the ability of the Adviser to allocate effectively the assets of the Fund among the various securities and investments in which the Fund invests. There can be no assurance that the actual allocations will be effective in achieving the Fund’s investment objective or delivering positive returns. Current performance may be lower or higher than the performance quoted. The most recent performance is available at www.griffincapital.com or by calling 888.926.2688.
The Fund is a closed-end interval fund, the shares have no history of public trading, nor is it intended that the shares will be listed on a public exchange at this time. No secondary market is expected to develop for the Fund’s shares. Limited liquidity is provided to shareholders only through the Fund’s quarterly repurchase offers for no less than 5% and no more than 25% of the Fund’s shares outstanding at net asset value. There is no guarantee that an investor will be able to sell all the shares that the investor desires to sell in the repurchase offer. The investment return and principal value of an investment will fluctuate so that an investor’s shares, when redeemed, may be worth more or less than the original cost. Due to these restrictions, an investor should consider an investment in the Fund to be of limited liquidity. The Fund is suitable only for investors who can bear the risks associated with the limited liquidity of the Fund and should be viewed as a long-term investment. Investing in the Fund is speculative and involves a high degree of risk, including the risks associated with leverage and the risk of a substantial loss of investment. There is no guarantee that the investment strategies will work under all market conditions.
The Fund’s inception date was June 30, 2014. Per the Fund’s prospectus dated February 1, 2021, the total annual expense ratio is 2.0% for Class A shares. The Adviser and Fund have entered into an expense limitation agreement until at least February 1, 2022 under which the Adviser has contractually agreed to waive its fees and to pay or absorb the ordinary annual operating expenses of the Fund (including offering expenses, but excluding taxes, interest, brokerage commissions, acquired fund fees and expenses and extraordinary expenses) to the extent that they exceed 1.91% for Class A shares.
Investors in the Fund should understand that the net asset value (“NAV”) of the Fund will fluctuate, which may result in a loss of the principal amount invested. All investments contain risk and may lose value The Fund’s investments may be negatively affected by the broad investment environment and capital markets in which the Fund invests, including the real estate market, the debt market and/or the equity securities market. The value of the Fund’s investments will increase or decrease based on changes in the prices of the investments it holds. This will cause the value of the Fund’s shares to increase or decrease. For purposes of the Investment Company Act of 1940, as amended (the “1940 Act”), the Fund is classified as a non-diversified fund, which means the Fund may invest more than 5% of its total assets in the securities of one or more issuers. However, among the number of issuers, the Fund seeks exposure across multiple sectors of the real estate industry (e.g., industrial, office, and multifamily) and geographic locations. As used herein, the terms “diversify,” “diversified,” and “diversification” are meant to reference that variety and not the Fund’s diversification status under the 1940 Act. Diversification does not eliminate the risk of experiencing investment losses. Holdings are subject to change without notice. The Fund is not intended to be a complete investment program.
The Fund will not invest in real estate directly, but, because the Fund will concentrate its investments in securities of REITs and other real estate industry issuers, its portfolio will be significantly impacted by the performance of the real estate market and may experience more volatility and be exposed to greater risk than a more diversified portfolio. The value of companies engaged in the real estate industry is affected by: (i) changes in general economic and market conditions; (ii) changes in the value of real estate properties; (iii) risks related to local economic conditions, overbuilding and increased competition; (iv) increases in property taxes and operating expenses; (v) changes in zoning laws; (vi) casualty and condemnation losses; (vii) variations in rental income, neighborhood values or the appeal of property to tenants; (viii) the availability of financing and (ix) changes in interest rates and leverage. The value of securities of companies in the real estate industry may go through cycles of relative underperformance and outperformance in comparison to equity securities markets in general. By investing in the Fund, a shareholder will not be deemed to be an investor in any underlying fund and will not have the ability to exercise any rights attributable to an investor in any such underlying fund related to their investment. The Fund may invest in securities of other investment companies, including ETFs. The Fund will indirectly bear its proportionate share of any management fees and other expenses paid by investment companies in which it invests, in addition to the management fees (and other expenses) paid by the Fund.
11
The Fund is advised by Griffin Capital Advisor, LLC (“GCA”). GCA is registered as an investment adviser with the SEC pursuant to the provisions of the Investment Advisers Act of 1940, as amended (the “Advisers Act”). GCA is an indirect majority-owned subsidiary of Griffin Capital Company, LLC. The Fund’s private real estate funds allocation is sub-advised by Aon Investments USA Inc. (“Aon”), an Aon Company. Aon is registered as an investment adviser with the SEC pursuant to the provisions of the Advisers Act. The Fund’s public real estate securities allocation is sub-advised by CenterSquare Investment Management LLC (“CenterSquare”). CenterSquare is an investment adviser registered with the SEC pursuant to the provisions of the Advisers Act. Registration with the SEC does not constitute an endorsement by the SEC nor does it imply a certain level of skill or training.
This material has been distributed for informational purposes only and should not be considered as investment advice or a recommendation of any particular security, strategy or investment product or be relied upon for any other purpose. The views expressed represent an assessment of market conditions at a specific point in time, are opinions only and should not be relied upon as investment advice regarding a particular investment or markets in general. Such information does not constitute a recommendation to buy or sell specific securities or investment vehicles. It should not be assumed that any investment will be profitable or will equal the performance of the fund(s) or any securities or any sectors mentioned herein. Information contained herein has been obtained from sources deemed to be reliable, but not guaranteed. Griffin Capital and its affiliates do not provide tax, legal or accounting advice. This material is not intended to provide, and should not be relied on for, tax, legal or accounting advice. You should consult your own tax, legal and accounting advisors before engaging in any transaction. This material represents views as of the date of this presentation and is subject to change without notice of any kind.
This annual report may contain certain forward-looking statements. Such forward-looking statements can generally be identified by our use of forward-looking terminology such as “may,” “will,” “expect,” “intend,” “anticipate,” “estimate,” “believe,” “continue,” or other similar words. Because such statements include risks, uncertainties and contingencies, actual results may differ materially from the expectations, intentions, beliefs, plans or predictions of the future expressed or implied by such forward-looking statements. These risks, uncertainties and contingencies include, but are not limited to: uncertainties relating to changes in general economic and real estate conditions; uncertainties relating to the implementation of our investment strategy; uncertainties relating to capital proceeds; and other risk factors as outlined in the Fund’s prospectus, statement of additional information, annual report and semi-annual report filed with the U.S. Securities and Exchange Commission (the “SEC”).
During the fiscal year ending September 30, 2021, the Fund paid distributions of $209,173,653 to its investors, consisting of distributions of $81,016,877 paid and $128,156,776 that was reinvested through the Fund’s distribution reinvestment program.
During the fiscal year ending September 30, 2021, the Fund recorded dividends and distributions from the Fund’s underlying investments totaling $136,748,880, and realized gain on its investments totaling $120,393,155, and fees and expenses of $82,927,973.
The Fund’s distribution policy is to make quarterly distributions to shareholders. Shareholders should not assume that the source of a distribution from the Fund is net profit. The Fund’s most recent annualized distribution rate as of September 30, 2021 was 5.22%. A portion of the distribution included a return of capital. Please refer to the Fund’s most recent Section 19(a) notice for an estimate of the composition of the Fund’s most recent distribution, available at www.griffincapital.com, and the Fund’s semi-annual or annual reports filed with the U.S. Securities and Exchange Commission (the “SEC”) for additional information regarding the composition of distributions. The Fund’s distributions may be affected by numerous factors, including but not limited to changes in Fund expenses, investment performance, realized and projected market returns, fluctuations in market interest rates, and other factors. Distributions paid may exceed and, from time to time, have exceeded the Fund’s total return less fees and expenses of the Fund during some periods due to changes in market conditions affecting components of the Fund’s total return, including unrealized appreciation. Please reference the performance table below to view the Fund’s historical returns. Additionally, the Fund’s performance can always be found on the Griffin Capital website (www. griffincapital.com). The following chart presents the quarterly changes to the NAV, total return, and cumulative total return for load-waived Class A shares since inception.1 There is no assurance that the Fund’s distribution rate will be sustainable in the future nor are distributions guaranteed.
12
| Period Ending | NAV Return | Total Return | Cumulative Total Return |
| 6/30/14 | N/A | N/A | N/A |
| 9/30/14 | 0.44% | 1.65% | 1.65% |
| 12/31/14 | 2.11% | 3.40% | 5.10% |
| 3/31/15 | 0.98% | 2.28% | 7.50% |
| 6/30/15 | -1.24% | 0.06% | 7.56% |
| 9/30/15 | 1.13% | 2.47% | 10.21% |
| 12/31/15 | 1.01% | 2.34% | 12.79% |
| 3/31/16 | 1.00% | 2.33% | 15.42% |
| 6/30/16 | 0.95% | 2.28% | 18.05% |
| 9/30/16 | -0.04% | 1.28% | 19.57% |
| 12/31/16 | -0.26% | 1.05% | 20.83% |
| 3/31/17 | -0.15% | 1.17% | 22.24% |
| 6/30/17 | 0.26% | 1.59% | 24.18% |
| 9/30/17 | 0.00% | 1.32% | 25.83% |
| 12/31/17 | 0.90% | 2.23% | 28.64% |
| 3/31/18 | -0.97% | 0.34% | 29.08% |
| 6/30/18 | 1.24% | 2.58% | 32.41% |
| 9/30/18 | 0.11% | 1.43% | 34.31% |
| 12/31/18 | -1.04% | 0.27% | 34.67% |
| 3/31/19 | 2.10% | 3.45% | 39.33% |
| 6/30/19 | 0.15% | 1.47% | 41.38% |
| 9/30/19 | 0.40% | 1.73% | 43.82% |
| 12/31/19 | -0.11% | 1.21% | 45.56% |
| 3/31/20 | -6.70% | -5.46% | 37.61% |
| 6/30/20 | -2.63% | -1.34% | 35.77% |
| 9/30/20 | 0.00% | 1.33% | 37.57% |
| 12/31/20 | 1.41% | 2.76% | 41.37% |
| 3/31/21 | 2.07% | 3.42% | 46.20% |
| 6/30/21 | 3.66% | 5.04% | 53.56% |
| 9/30/21 | 3.15% | 4.52% | 60.51% |
13
ENDNOTES
| 1. | Past performance is not indicative of future results. Investment return and the principal value of an investment will fluctuate. Shares may be worth more or less than original cost when redeemed. Investing involves risk, including loss of principal. Performance includes reinvestment of distributions and reflects management fees and other expenses. The Fund return does not reflect the deduction of all fees, including any applicable Fund share class sales load, third-party brokerage commissions or third-party investment advisory fees paid by investors to a financial intermediary for brokerage services. If the deduction of such fees was reflected, the performance would be lower. Returns shown do not reflect the deduction of taxes that a shareholder would pay on Fund distributions or the redemption of Fund shares. Due to financial statement adjustments, performance information presented herein for the Fund differs from the Fund’s financial highlights which are prepared in accordance with U.S. GAAP. Such differences generally are attributable to valuation adjustments to certain of the Fund’s investments which are reflected in the financial statements. Current performance may be lower or higher than the performance quoted. The most recent performance is available at www.griffincapital.com or by calling 888.926.2688. As of 9/30/21, the Fund’s load-waived, Class A share had a one-year return of 16.67% and a five-year annualized return of 6.07%, the FTSE Nareit All Equity REITs Index had a one-year return of 31.54% and a five-year annualized return of 8.41%, the S&P 500 Index had a one-year return of 30.00% and a five-year annualized return of 16.90%, and the Bloomberg US Aggregate Bond Index had a one-year return of -0.90% and a five-year annualized return of 2.94%. Alpha and beta calculation benchmark: S&P 500. Assets and securities contained within indices are different than the assets and securities contained in Griffin Institutional Access Real Estate Fund and will therefore have different risk and reward profiles. An investment cannot be made in an index, which is unmanaged and has returns that do not reflect any trading, management or other costs. There are limitations when comparing the Griffin Institutional Access Real Estate Fund to indices. Many open-end funds which track these indices offer daily liquidity, while closed-end interval funds offer liquidity on a periodic basis. Deteriorating general market conditions will reduce the value of stock securities. Fixed income risks include interest-rate and credit risk, bond values fluctuate in price so the value of your investment can go down depending on market conditions. Real estate securities and debt obligations may decline because of adverse developments affecting the real estate industry and real property values. |
| 2. | CDC – COVID Data Tracker. |
| 3. | Bureau of Labor Statistics; U.S. Department of Labor. |
| 4. | Fund size based on Gross Asset Value (GAV). Fund holdings as of 10/1/21. Fund holdings are subject to change without notice. The Fund is “non-diversified” under the Investment Company Act of 1940 (the “1940 Act”) since changes in the financial condition or market value of a single issuer may cause a greater fluctuation in the Fund’s net asset value than in a “diversified” fund. Diversification does not eliminate the risk of experiencing investment losses. For purposes of the 1940 Act, the Fund is classified as a non-diversified fund, which means the Fund may invest more than 5% of its total assets in the securities of one or more issuers. However, among the number of issuers, the Fund seeks exposure across multiple sectors of the real estate industry (e.g., industrial, office, and multifamily) and geographic locations. As used herein, the terms “diversify,” “diversified,” and “diversification” are meant to reference that variety and not the Fund’s diversification status under the 1940 Act. The Fund is not intended to be a complete investment program. |
| 5. | CBRE Econometric Advisors, Q3 2021. |
| 6. | YardiMatrix – National Multifamily Report, September 2021. |
| 7. | JLL – 2021 Life Sciences Real Estate Outlook. |
| 8. | Real Page – Student Housing Occupancy Surges, Ending Season at Record High, October 14, 2021. |
| 9. | Green Street Same-Store NOI Growth by Sector, June 1, 2021. |
| 10. | Griffin Capital Advisor, LLC, NCREIF ODCE Net Index as of 6/30/21. |
| 11. | Represents the Fund’s direct holdings in private funds in which the underlying holdings of each respective private fund generally consist of real estate-related interests that are not publicly traded. |
| 12. | Represents (i) the Fund’s direct holdings in publicly traded, real estate-related securities; (ii) the Fund’s holdings in private funds and registered investment companies in which the underlying holdings are generally publicly traded; and (iii) cash and short-term investments. |
| 13. | Formerly known as Hancock U.S. Real Estate Fund. |
| 14. | Formerly known as American Core Realty Fund. |
| 15. | Metrics express the Fund’s portfolio allocated to private funds in which the underlying holdings of such private funds generally consist of real estate-related interests that are not publicly traded as of October 1, 2021. Underlying data and statistics of the Fund’s private real estate exposure generally as of June 30, 2021, however, in limited circumstances, data for certain private funds is as of the most recent quarter end. Holdings are subject to change without notice. Diversification does not eliminate the risk of experiencing investment losses. |
14
| Griffin Institutional Access Real Estate Fund | Portfolio Update |
| September 30, 2021 (Unaudited) |
Performance (for the periods ended September 30, 2021)
| 6 Month | 1 Year | 3 Year | 5 Year | Since Inception | Inception Date | |
| Griffin Institutional Access Real Estate Fund – A – With Load* | 3.95% | 10.28% | 4.28% | 4.97% | 5.98% | 6/30/14 |
| Griffin Institutional Access Real Estate Fund – A – Without Load | 10.28% | 17.00% | 6.35% | 6.21% | 6.85% | 6/30/14 |
| Griffin Institutional Access Real Estate Fund – C – With Load** | 8.86% | 15.13% | 5.55% | 5.42% | 5.65% | 8/7/15 |
| Griffin Institutional Access Real Estate Fund – C – Without Load | 9.86% | 16.13% | 5.55% | 5.42% | 5.65% | 8/7/15 |
| Griffin Institutional Access Real Estate Fund – I – NAV | 10.37% | 17.31% | 6.61% | 6.48% | 6.70% | 8/7/15 |
| Griffin Institutional Access Real Estate Fund – M – NAV | 10.00% | 16.45% | 5.83% | N/A | 5.99% | 11/16/16 |
| Griffin Institutional Access Real Estate Fund – L – With Load*** | 5.44% | 11.78% | 4.57% | N/A | 5.13% | 4/24/17 |
| Griffin Institutional Access Real Estate Fund – L – Without Load | 10.11% | 16.75% | 6.10% | N/A | 6.16% | 4/24/17 |
| S&P 500® Total Return Index | 9.18% | 30.00% | 15.99% | 16.90% | 13.67% | 6/30/14 |
| Bloomberg U.S. Aggregate Bond Index | 1.88% | -0.90% | 5.36% | 2.94% | 3.17% | 6/30/14 |
| * | Adjusted for initial maximum sales charge of 5.75%. |
| ** | Adjusted for contingent deferred sales charge of 1.00%. |
| *** | Adjusted for initial maximum sales charge of 4.25%. |
The S&P 500® Total Return Index is an unmanaged index of 500 common stocks chosen for market size, liquidity and industry group representation. It is a market-value weighted index. The index is not actively managed and does not reflect any deduction for fees, expenses or taxes.
The Bloomberg U.S. Aggregate Bond Index measures the performance of the U.S. investment grade bond market.
Past performance is not indicative of future results. Investment return and the principal value of an investment will fluctuate. Shares may be worth more or less than original cost when redeemed. Investing involves risk, including loss of principal. Fund performance includes reinvestment of distributions and reflects management fees and other expenses. The Fund return does not reflect the deduction of all fees, including third-party brokerage commissions or third-party investment advisory fees paid by investors to a financial intermediary for brokerage services. If the deduction of such fees was reflected, the performance would be lower. Returns shown do not reflect the deduction of taxes that a shareholder would pay on Fund distributions or the redemption of Fund shares. Current performance may be lower or higher than the performance quoted. The most recent performance is available at www.griffincapital.com or by calling 888.926.2688. An investment cannot be made in an index, which is unmanaged and has returns that do not reflect any trading, management or other costs. Index performance does not represent actual Fund or portfolio performance, nor does it represent actual performance of the Fund’s Adviser or sub-advisers.
Class A shares are offered subject to a maximum sales charge of 5.75% of the offering price. Class C, Class I and Class M shares are offered at net asset value. Class L shares are offered subject to a maximum sales charge of 4.25% of the offering price. Class C shares may be subject to a 1.00% contingent deferred sales charge on shares redeemed during the first 365 days after their purchase. The Fund’s investment adviser has contractually agreed to waive its fees and to pay or absorb the ordinary annual operating expenses of the Fund (including offering expenses, but excluding taxes, interest, brokerage commissions, acquired fund fees and expenses and extraordinary expenses), to the extent that they exceed 1.91%, 2.66%, 1.66%, 2.41% and 2.16% per annum of the Fund’s average daily net assets attributable to Class A, Class C, Class I, Class M and Class L shares, respectively. The Expense Limitation Agreement will remain in effect at least until February 1, 2022, for Class A, Class C, Class I, Class L and Class M shares, unless and until the Board approves its modification or termination. Per the Fund's most recent prospectus, the total expense ratio after recoupment, if applicable, is 2.00%, 2.75%, 1.75%, 2.49%, and 2.23% for Class A, Class C, Class I, Class M and Class L, respectively. Please review the Fund’s Prospectus for more details regarding the Fund’s fees and expenses. No assurances can be given that the Fund will pay a distribution in the future; or, if any such distribution is paid, the amount or rate of the distribution.
| Annual Report | September 30, 2021 | 15 |
| Griffin Institutional Access Real Estate Fund | Portfolio Update |
| September 30, 2021 (Unaudited) |

The graph shown above represents historical performance of a hypothetical investment of $10,000 in the Fund since inception. Past performance is not indicative of future results. Investment return and the principal value of an investment will fluctuate. Shares may be worth more or less than original cost when redeemed. Investing involves risk, including loss of principal. Fund performance includes reinvestment of distributions and reflects management fees and other expenses. The Fund return does not reflect the deduction of all fees, including third-party brokerage commissions or third-party investment advisory fees paid by investors to a financial intermediary for brokerage services. If the deduction of such fees was reflected, the performance would be lower. Returns shown do not reflect the deduction of taxes that a shareholder would pay on Fund distributions or the redemption of Fund shares. The most recent performance is available at www.griffincapital.com or by calling 888.926.2688. An investment cannot be made in an index, which is unmanaged and has returns that do not reflect any trading, management or other costs. Index performance does not represent actual Fund or portfolio performance, nor does it represent actual performance of the Fund’s Adviser or sub-advisers.
Sector Allocation (as a % of Net Assets)
| Private Investment Funds | 77.68 | % | ||
| Publicly Traded Securities | 22.83 | % | ||
| Preferred Stocks | 1.86 | % | ||
| Short Term Investment | 0.09 | % | ||
| Liabilities in Excess of Other Assets | -2.46 | % | ||
| TOTAL | 100.00 | % |
| 16 | 1.888.926.2688 | www.griffincapital.com |
| Griffin Institutional Access Real Estate Fund | Schedule of Investments |
| September 30, 2021 |
| Description | Shares | Value (Note 2) | ||||||
| REAL ESTATE INVESTMENT TRUSTS (100.51%)(a) | ||||||||
| Private Investment Funds (77.68%)* | ||||||||
| AEW Core Property Trust (U.S.), Inc. | 15,982 | $ | 17,537,532 | |||||
| ARA Core Property Fund, L.P.(b) | 68 | 9,119,161 | ||||||
| Ares Real Estate Enhanced Income Fund, L.P. | N/A | 65,651,393 | ||||||
| Barings Core Property Fund, L.P. | 75,755 | 10,774,864 | ||||||
| BGO Diversified US Property Fund, L.P. | 15,516 | 39,821,141 | ||||||
| BlackRock US Core Property Fund | N/A | 10,320,329 | ||||||
| Brookfield Senior Mezzanine Real Estate Finance Fund | 116,537 | 120,638,104 | ||||||
| CA Student Living Income and Growth Fund | 85,518 | 101,808,006 | ||||||
| CBRE U.S. Core Partners, L.P. | 57,556,725 | 96,413,477 | ||||||
| CBRE U.S. Logistics Partners, L.P. | 86,160,000 | 86,185,717 | ||||||
| Clarion Gables Multifamily Trust, L.P. | 88,035 | 126,516,805 | ||||||
| Clarion Lion Industrial Trust, L.P. | 65,367 | 195,914,114 | ||||||
| Clarion Lion Properties Fund, L.P. | 200,008 | 340,180,109 | ||||||
| Cortland Growth and Income Fund, L.P. | 261,181 | 341,208,519 | ||||||
| CrossHarbor Strategic Debt Fund, L.P. | N/A | 81,392,840 | ||||||
| Dream U.S. Industrial Fund, L.P. | 52,000 | 58,871,784 | ||||||
| GWL U.S. Property Fund, L.P. | N/A | 21,549,255 | ||||||
| Heitman America Real Estate Trust, L.P. | 17,783 | 23,028,449 | ||||||
| Heitman Core Real Estate Debt Income Trust | 124,516 | 125,360,105 | ||||||
| JPM U.S. Real Estate Mezzanine Debt Fund, L.P. | 981,301 | 100,889,813 | ||||||
| Manulife U.S. Real Estate Fund, L.P.(c) | 19,523 | 32,627,836 | ||||||
| Morgan Stanley Prime Property Fund | 9,695 | 195,630,041 | ||||||
| Oaktree Real Estate Income Fund, L.P. | N/A | 180,007,317 | ||||||
| PGIM Real Estate US Debt Fund, L.P. | 58,860 | 75,502,942 | ||||||
| Principal Real Estate Liquid Debt Fund, L.P. | 3,435,515 | 93,067,594 | ||||||
| PRISA, L.P. | 19,408 | 39,346,939 | ||||||
| Prologis Targeted U.S. Logistics Fund, L.P. | 34,887 | 87,504,476 | ||||||
| Sentinel Real Estate Fund, L.P. | 705 | 74,605,360 | ||||||
| Stockbridge Smart Markets Fund, L.P. | 17,454 | 31,306,744 | ||||||
| TA Realty Core Property Fund, L.P. | 101,640 | 136,746,262 | ||||||
| TA Realty Logistics Fund, L.P. | 62,250 | 62,047,599 | ||||||
| TCM CRE Credit Fund, L.P. | 116,302 | 117,068,091 | ||||||
| UBS Trumbull Property Fund | 1,533 | 16,084,815 | ||||||
| USAA US Government Building Fund, LLC | N/A | 59,154,825 | ||||||
| Ventas Life Science and Healthcare Real Estate Fund | 155,111 | 187,440,893 | ||||||
| Voya Commercial Mortgage Lending Fund, L.P. | N/A | 60,535,144 | ||||||
| 3,421,858,395 | ||||||||
| Publicly Traded Securities (22.83%) | ||||||||
| Acadia Realty Trust | 675,580 | 13,788,588 | ||||||
| Agree Realty Corp. | 317,110 | 21,002,195 | ||||||
| American Campus Communities, Inc. | 537,046 | 26,019,879 | ||||||
| Americold Realty Trust | 440,925 | 12,808,871 | ||||||
| Apple Hospitality REIT, Inc. | 173,925 | 2,735,840 | ||||||
| AvalonBay Communities, Inc. | 167,540 | 37,133,566 | ||||||
| Brandywine Realty Trust | 389,934 | 5,232,914 | ||||||
| Brixmor Property Group, Inc. | 1,305,130 | 28,856,424 | ||||||
| Broadstone Net Lease, Inc., Class A | 133,759 | 3,318,561 | ||||||
| Cousins Properties, Inc. | 366,140 | 13,653,361 | ||||||
| Digital Realty Trust, Inc. | 208,870 | 30,171,271 | ||||||
| Diversified Healthcare Trust | 778,500 | 2,639,115 | ||||||
| Annual Report | September 30, 2021 | 17 |
| Griffin Institutional Access Real Estate Fund | Schedule of Investments |
| September 30, 2021 |
| Description | Shares | Value (Note 2) | ||||||
| Publicly Traded Securities (continued) | ||||||||
| Duke Realty Corp. | 569,090 | $ | 27,242,338 | |||||
| Empire State Realty Trust, Inc., Class A | 443,230 | 4,445,597 | ||||||
| EPR Properties | 87,710 | 4,331,120 | ||||||
| Equinix, Inc. | 92,750 | 73,284,557 | ||||||
| Equity Residential | 468,840 | 37,938,533 | ||||||
| Essex Property Trust, Inc. | 52,704 | 16,851,577 | ||||||
| Extra Space Storage, Inc. | 111,790 | 18,779,602 | ||||||
| First Industrial Realty Trust, Inc. | 222,567 | 11,591,289 | ||||||
| Four Corners Property Trust, Inc. | 150,790 | 4,050,219 | ||||||
| Gaming and Leisure Properties, Inc. | 147,287 | 6,822,334 | ||||||
| Healthpeak Properties, Inc. | 188,230 | 6,301,940 | ||||||
| Host Hotels & Resorts, Inc. | 1,088,130 | 17,769,163 | ||||||
| Hudson Pacific Properties, Inc. | 355,890 | 9,349,230 | ||||||
| Independence Realty Trust, Inc. | 191,859 | 3,904,331 | ||||||
| Invitation Homes, Inc. | 1,277,700 | 48,974,241 | ||||||
| JBG SMITH Properties | 445,210 | 13,182,668 | ||||||
| Kilroy Realty Corp. | 226,620 | 15,004,510 | ||||||
| Life Storage, Inc. | 239,490 | 27,479,083 | ||||||
| Medical Properties Trust, Inc. | 1,023,050 | 20,532,613 | ||||||
| MGM Growth Properties LLC, Class A | 354,910 | 13,593,053 | ||||||
| Mid-America Apartment Communities, Inc. | 60,790 | 11,352,533 | ||||||
| Omega Healthcare Investors, Inc. | 105,462 | 3,159,642 | ||||||
| Outfront Media, Inc. | 281,970 | 7,105,644 | ||||||
| Park Hotels & Resorts, Inc. | 428,328 | 8,198,198 | ||||||
| Phillips Edison & Co., Inc. | 205,390 | 6,307,527 | ||||||
| Prologis, Inc. | 584,740 | 73,343,938 | ||||||
| Public Storage | 105,740 | 31,415,354 | ||||||
| Retail Opportunity Investments Corp. | 236,213 | 4,114,830 | ||||||
| Retail Properties of America, Inc., Class A | 731,188 | 9,417,701 | ||||||
| Rexford Industrial Realty, Inc. | 353,670 | 20,070,773 | ||||||
| RPT Realty | 573,193 | 7,313,943 | ||||||
| Sabra Health Care REIT, Inc. | 714,900 | 10,523,328 | ||||||
| SBA Communications Corp. | 59,550 | 19,685,444 | ||||||
| Simon Property Group, Inc. | 227,570 | 29,577,273 | ||||||
| SL Green Realty Corp. | 107,520 | 7,616,717 | ||||||
| STORE Capital Corp. | 387,180 | 12,401,375 | ||||||
| Sun Communities, Inc. | 163,340 | 30,234,234 | ||||||
| UDR, Inc. | 581,660 | 30,816,347 | ||||||
| Ventas, Inc. | 582,621 | 32,166,505 | ||||||
| VEREIT, Inc. | 266,846 | 12,069,445 | ||||||
| VICI Properties, Inc. | 676,762 | 19,226,808 | ||||||
| Welltower, Inc. | 367,360 | 30,270,464 | ||||||
| Xenia Hotels & Resorts, Inc. | 594,335 | 10,543,503 | ||||||
| 1,005,720,109 | ||||||||
| TOTAL REAL ESTATE INVESTMENT TRUSTS | ||||||||
| (Cost $3,779,482,359) | 4,427,578,504 | |||||||
| Description | Coupon Rate | Shares | Value (Note 2) | |||||||||
| PREFERRED STOCKS (1.86%)(d) | ||||||||||||
| Agree Realty Corp., Series A | 4.25 | % | 50,300 | 1,264,542 | ||||||||
| American Homes 4 Rent, Series F | 5.88 | % | 15,000 | 382,350 | ||||||||
| 18 | 1.888.926.2688 | www.griffincapital.com |
| Griffin Institutional Access Real Estate Fund | Schedule of Investments |
| September 30, 2021 |
| Description | Coupon Rate | Shares | Value (Note 2) | |||||||||
| PREFERRED STOCKS (continued) | ||||||||||||
| American Homes 4 Rent, Series G | 5.88 | % | 15,000 | $ | 388,950 | |||||||
| American Homes 4 Rent, Series H | 6.25 | % | 179,000 | 4,813,310 | ||||||||
| Chatham Lodging Trust, Series A | 6.63 | % | 19,800 | 504,108 | ||||||||
| DiamondRock Hospitality Co., Series A | 8.25 | % | 45,000 | 1,218,600 | ||||||||
| Digital Realty Trust, Inc., Series K | 5.85 | % | 147,065 | 4,044,287 | ||||||||
| Digital Realty Trust, Inc., Series L | 5.20 | % | 46,000 | 1,251,200 | ||||||||
| DigitalBridge Group, Inc., Series I | 7.15 | % | 64,000 | 1,648,640 | ||||||||
| DigitalBridge Group, Inc., Series J | 7.13 | % | 20,000 | 523,200 | ||||||||
| EPR Properties, Series G | 5.75 | % | 39,979 | 1,036,256 | ||||||||
| Federal Realty Investment Trust, Series C | 5.00 | % | 84,143 | 2,143,122 | ||||||||
| Hersha Hospitality Trust, Series C | 6.88 | % | 81,500 | 2,009,790 | ||||||||
| Hersha Hospitality Trust, Series D | 6.50 | % | 30,000 | 732,000 | ||||||||
| Kimco Realty Corp., Series L | 5.13 | % | 14,641 | 381,691 | ||||||||
| Kimco Realty Corp., Series M | 5.25 | % | 75,000 | 1,965,750 | ||||||||
| National Storage Affiliates Trust, Series A | 6.00 | % | 139,933 | 3,667,644 | ||||||||
| Pebblebrook Hotel Trust, Series E | 6.38 | % | 119,238 | 2,934,447 | ||||||||
| Pebblebrook Hotel Trust, Series G | 6.38 | % | 42,500 | 1,085,875 | ||||||||
| Pebblebrook Hotel Trust, Series H | 5.70 | % | 89,000 | 2,225,000 | ||||||||
| PS Business Parks, Inc., Series X | 5.25 | % | 23,500 | 621,810 | ||||||||
| PS Business Parks, Inc., Series Z | 4.88 | % | 145,000 | 4,002,000 | ||||||||
| Public Storage, Series H | 5.60 | % | 50,000 | 1,395,500 | ||||||||
| Public Storage, Series J | 4.70 | % | 17,000 | 461,040 | ||||||||
| Public Storage, Series L | 4.63 | % | 165,000 | 4,501,200 | ||||||||
| Rexford Industrial Realty, Inc., Series B | 5.88 | % | 74,000 | 1,938,060 | ||||||||
| Rexford Industrial Realty, Inc., Series C | 5.63 | % | 56,000 | 1,475,600 | ||||||||
| Saul Centers, Inc., Series D | 6.13 | % | 107,000 | 2,807,680 | ||||||||
| Saul Centers, Inc., Series E | 6.00 | % | 59,702 | 1,580,312 | ||||||||
| Seritage Growth Properties, Series A | 7.00 | % | 168,025 | 4,251,033 | ||||||||
| SITE Centers Corp., Series A | 6.38 | % | 175,000 | 4,532,500 | ||||||||
| SL Green Realty Corp., Series I | 6.50 | % | 287 | 7,448 | ||||||||
| Spirit Realty Capital, Inc., Series A | 6.00 | % | 176,734 | 4,600,386 | ||||||||
| Summit Hotel Properties, Inc., Series E | 6.25 | % | 98,000 | 2,550,940 | ||||||||
| Summit Hotel Properties, Inc., Series F | 5.88 | % | 33,476 | 874,781 | ||||||||
| Sunstone Hotel Investors, Inc., Series H | 6.13 | % | 87,500 | 2,262,750 | ||||||||
| Sunstone Hotel Investors, Inc., Series I | 5.70 | % | 110,431 | 2,796,113 | ||||||||
| Urstadt Biddle Properties, Inc., Series H | 6.25 | % | 94,000 | 2,455,280 | ||||||||
| Urstadt Biddle Properties, Inc., Series K | 5.88 | % | 8,000 | 210,000 | ||||||||
| Vornado Realty Trust, Series K | 5.70 | % | 100,000 | 2,502,000 | ||||||||
| Vornado Realty Trust, Series M | 5.25 | % | 13,000 | 339,040 | ||||||||
| Vornado Realty Trust, Series O | 4.45 | % | 59,000 | 1,444,320 | ||||||||
| TOTAL PREFERRED STOCKS | ||||||||||||
| (Cost $75,472,552) | 81,830,555 | |||||||||||
| 7-Day Yield | Shares | Value (Note 2) | ||||||||||
| SHORT TERM INVESTMENT (0.09%) | ||||||||||||
| Federated Hermes Treasury Obligations Fund, Class IS | 0.01 | % | 4,152,750 | 4,152,750 | ||||||||
| TOTAL SHORT TERM INVESTMENT | ||||||||||||
| (Cost $4,152,750) | 4,152,750 | |||||||||||
| Annual Report | September 30, 2021 | 19 |
| Griffin Institutional Access Real Estate Fund | Schedule of Investments |
| September 30, 2021 |
| Value (Note 2) | ||||||||||||
| TOTAL INVESTMENTS (102.46%) | ||||||||||||
| (Cost $3,859,107,661) | $ | 4,513,561,809 | ||||||||||
| Liabilities in Excess of Other Assets (-2.46%) | (108,544,331 | ) | ||||||||||
| NET ASSETS (100.00%) | $ | 4,405,017,478 | ||||||||||
| (a) | A portion of these securities is held as collateral for the outstanding Lines of Credit. At September 30, 2021 outstanding collateral amounted to $3,940,812,867. |
| (b) | Effective May 28, 2021, American Core Realty Fund, L.P. changed its name to ARA Core Property Fund, L.P. Other than this change, there were no other substantive changes to the fund or its management. |
| (c) | Effective June 15, 2021, Hancock U.S. Real Estate Fund, L.P. changed its name to Manulife U.S. Real Estate Fund, L.P.. Other than this change, there were no other substantive changes to the fund or its management. |
| (d) | These securities have no contractual maturity date, are not redeemable and contractually pay an indefinite stream of dividends. |
Common Abbreviations:
LLC - Limited Liability Company
L.P. - Limited Partnership
REIT - Real Estate Investment Trust
| 20 | 1.888.926.2688 | www.griffincapital.com |
| Griffin Institutional Access Real Estate Fund | Schedule of Investments |
| September 30, 2021 |
| * | Additional Information on Investments in Private Investment Funds: |
| Value | Fund Name | Redemption Frequency | Redemption Notice (Days) | Unfunded Commitment as of September 30, 2021 | ||||||||||
| $ | 17,537,532 | AEW Core Property Trust (U.S.), Inc. | Quarterly | 45 | $ | 0 | ||||||||
| 9,119,161 | ARA Core Property Fund, L.P. | Quarterly | 10 | 0 | ||||||||||
| 65,651,393 | Ares Real Estate Enhanced Income Fund, L.P. | Quarterly | 90 | 0 | ||||||||||
| 10,774,864 | Barings Core Property Fund, L.P. | Quarterly | 30 | 0 | ||||||||||
| 39,821,141 | BGO Diversified US Property Fund, L.P. | Quarterly | N/A** | 0 | ||||||||||
| 10,320,329 | BlackRock US Core Property Fund | Quarterly | 60 | 0 | ||||||||||
| 120,638,104 | Brookfield Senior Mezzanine Real Estate Finance Fund | Quarterly | 90 | 9,150,410 | ||||||||||
| 101,808,006 | CA Student Living Income and Growth Fund | Quarterly | 90 | 0 | ||||||||||
| 96,413,477 | CBRE U.S. Core Partners, L.P. | Quarterly | 60 | 0 | ||||||||||
| 86,185,717 | CBRE U.S. Logistics Partners, L.P. | Quarterly | 90 | 113,840,000 | ||||||||||
| 126,516,805 | Clarion Gables Multifamily Trust, L.P. | Quarterly | 90 | 0 | ||||||||||
| 195,914,114 | Clarion Lion Industrial Trust, L.P. | Quarterly | 90 | 20,000,000 | ||||||||||
| 340,180,109 | Clarion Lion Properties Fund, L.P. | Quarterly | 90 | 0 | ||||||||||
| 341,208,519 | Cortland Growth and Income Fund, L.P. | Quarterly | 90 | 15,000,000 | ||||||||||
| 81,392,840 | CrossHarbor Strategic Debt Fund, L.P. | Quarterly | 90 | 0 | ||||||||||
| 58,871,784 | Dream U.S. Industrial Fund, L.P. | Quarterly | 60 | 48,000,000 | ||||||||||
| 21,549,255 | GWL U.S. Property Fund, L.P. | Quarterly | 90 | 0 | ||||||||||
| 23,028,449 | Heitman America Real Estate Trust, L.P. | Quarterly | 90 | 0 | ||||||||||
| 125,360,105 | Heitman Core Real Estate Debt Income Trust | Quarterly | 90 | 8,791,200 | ||||||||||
| 100,889,813 | JPM U.S. Real Estate Mezzanine Debt Fund, L.P. | Quarterly | 60 | 0 | ||||||||||
| 32,627,836 | Manulife U.S. Real Estate Fund, L.P. | Quarterly | 60 | 0 | ||||||||||
| 195,630,041 | Morgan Stanley Prime Property Fund | Quarterly | 90 | 40,000,000 | ||||||||||
| 180,007,317 | Oaktree Real Estate Income Fund, L.P. | Quarterly | 90 | 0 | ||||||||||
| 75,502,942 | PGIM Real Estate US Debt Fund, L.P. | Quarterly | 90 | 0 | ||||||||||
| 93,067,594 | Principal Real Estate Liquid Debt Fund, L.P. | Monthly | 10 | 0 | ||||||||||
| 39,346,939 | PRISA, L.P. | Quarterly | 90 | 0 | ||||||||||
| 87,504,476 | Prologis Targeted U.S. Logistics Fund, L.P. | Quarterly | 90 | 0 | ||||||||||
| 74,605,360 | Sentinel Real Estate Fund, L.P. | Quarterly | N/A** | 0 | ||||||||||
| 31,306,744 | Stockbridge Smart Markets Fund, L.P. | Quarterly | 45 | 0 | ||||||||||
| 136,746,262 | TA Realty Core Property Fund, L.P. | Quarterly | 45 | 0 | ||||||||||
| 62,047,599 | TA Realty Logistics Fund, L.P. | Quarterly | 45 | 87,750,000 | ||||||||||
| 117,068,091 | TCM CRE Credit Fund, L.P. | Quarterly | 90 | 12,400,000 | ||||||||||
| 16,084,815 | UBS Trumbull Property Fund | Quarterly | 60 | 0 | ||||||||||
| 59,154,825 | USAA US Government Building Fund, LLC | Quarterly | 60 | 0 | ||||||||||
| 187,440,893 | Ventas Life Science and Healthcare Real Estate Fund | Quarterly | 90 | 50,000,000 | ||||||||||
| 60,535,144 | Voya Commercial Mortgage Lending Fund, L.P. | Quarterly | 90 | 0 | ||||||||||
| $ | 3,421,858,395 | $ | 404,931,610 | |||||||||||
| ** | Written notice required for redemption, no minimum timeline required. |
See Notes to Financial Statements.
| Annual Report | September 30, 2021 | 21 |
| Griffin Institutional Access Real Estate Fund | Statement of Assets and Liabilities |
| September 30, 2021 |
| ASSETS | ||||
| Investments, at fair value (Cost $3,859,107,661) | $ | 4,513,561,809 | ||
| Dividend receivable | 25,854,029 | |||
| Cash | 17,960,830 | |||
| Receivable for shares sold | 8,677,855 | |||
| Receivable for investments sold | 3,660,012 | |||
| Prepaid expenses and other assets | 84,735 | |||
| Total Assets | 4,569,799,270 | |||
| LIABILITIES | ||||
| Payable for lines of credit (Note 6) | 139,000,000 | |||
| Payable for investments purchased | 9,669,957 | |||
| Payable for investment advisory fees (Note 3) | 5,316,279 | |||
| Payable for distribution fees (Note 3) | 1,016,798 | |||
| Payable for transfer agency fees (Note 3) | 372,715 | |||
| Payable for shareholder servicing fees (Note 3) | 268,550 | |||
| Payable for lines of credit interest (Note 6) | 170,070 | |||
| Payable for administration fees (Note 3) | 115,974 | |||
| Payable for legal fees | 89,297 | |||
| Payable for custody fees | 51,806 | |||
| Payable for trustees' fees (Note 3) | 46,589 | |||
| Payable for compliance service fees (Note 3) | 31,488 | |||
| Payable for audit and tax fees | 26,000 | |||
| Accrued expenses and other liabilities | 8,606,269 | |||
| Total Liabilities | 164,781,792 | |||
| NET ASSETS | $ | 4,405,017,478 | ||
| NET ASSETS CONSIST OF | ||||
| Paid-in capital | $ | 3,662,548,732 | ||
| Total distributable earnings | 742,468,746 | |||
| NET ASSETS | $ | 4,405,017,478 | ||
| PRICING OF SHARES | ||||
| Class A: | ||||
| Net asset value | $ | 27.67 | ||
| Net assets | $ | 719,324,278 | ||
| Shares of beneficial interest outstanding (unlimited number of shares, no par value common stock authorized) | 25,999,162 | |||
| Maximum offering price per share ((NAV/0.9425), based on maximum sales charge of 5.75% of the offering price) | $ | 29.35 | ||
| Class C: | ||||
| Net asset value and maximum offering price | $ | 26.44 | ||
| Net assets | $ | 513,219,838 | ||
| Shares of beneficial interest outstanding (unlimited number of shares, no par value common stock authorized) | 19,411,530 | |||
| Class I: | ||||
| Net asset value and maximum offering price | $ | 28.10 | ||
| Net assets | $ | 1,947,651,647 | ||
| Shares of beneficial interest outstanding (unlimited number of shares, no par value common stock authorized) | 69,310,612 | |||
| Class M: | ||||
| Net asset value and maximum offering price | $ | 27.02 | ||
| Net assets | $ | 1,136,372,708 | ||
| Shares of beneficial interest outstanding (unlimited number of shares, no par value common stock authorized) | 42,059,375 | |||
| Class L: | ||||
| Net asset value | $ | 27.40 | ||
| Net assets | $ | 88,449,007 | ||
| Shares of beneficial interest outstanding (unlimited number of shares, no par value common stock authorized) | 3,227,904 | |||
| Maximum offering price per share ((NAV/0.9575), based on maximum sales charge of 4.25% of the offering price) | $ | 28.62 | ||
See Notes to Financial Statements.
| 22 | 1.888.926.2688 | www.griffincapital.com |
| Griffin Institutional Access Real Estate Fund | Statement of Operations |
| For the Year Ended September 30, 2021 | ||||
| INVESTMENT INCOME | ||||
| Dividend Income | $ | 136,748,880 | ||
| Total Investment Income | 136,748,880 | |||
| EXPENSES | ||||
| Investment advisory fees (Note 3) | 59,307,497 | |||
| Administration fees (Note 3) | 1,268,630 | |||
| Transfer agency fees (Note 3) | 1,895,612 | |||
| Shareholder servicing fees (Note 3): | ||||
| Class A | 1,746,397 | |||
| Class C | 1,242,313 | |||
| Class L | 203,134 | |||
| Distribution fees (Note 3): | ||||
| Class C | 3,726,939 | |||
| Class M | 7,485,128 | |||
| Class L | 203,134 | |||
| Interest expense (Note 6) | 2,964,940 | |||
| Reports to shareholders and printing fees | 1,138,687 | |||
| Legal fees | 502,763 | |||
| Insurance fees | 196,531 | |||
| Trustees' fees (Note 3) | 185,564 | |||
| Custody fees | 185,385 | |||
| Compliance service fees (Note 3) | 112,490 | |||
| State registration fees | 107,529 | |||
| SEC registration fees | 63,304 | |||
| Audit and tax fees | 26,000 | |||
| Other expenses | 84,459 | |||
| Total Expenses | 82,646,436 | |||
| Expense recoupment of previously waived fees (Note 3) | 281,537 | |||
| Net Expenses | 82,927,973 | |||
| Net Investment Income | 53,820,907 | |||
| Net realized gain on investments | 120,393,155 | |||
| Net change in unrealized appreciation on investments | 447,149,332 | |||
| NET REALIZED AND UNREALIZED GAIN ON INVESTMENTS | 567,542,487 | |||
| NET INCREASE IN NET ASSETS RESULTING FROM OPERATIONS | $ | 621,363,394 | ||
See Notes to Financial Statements.
| Annual Report | September 30, 2021 | 23 |
| Griffin Institutional Access Real Estate Fund | Statements of Changes in Net Assets |
| For the Year Ended September 30, 2021 | For the Year Ended September 30, 2020 | |||||||
| OPERATIONS: | ||||||||
| Net investment income | $ | 53,820,907 | $ | 54,340,648 | ||||
| Net realized gain/(loss) on investments and long-term capital gain distributions from other investments | 120,393,155 | (160,395,866 | ) | |||||
| Net change in unrealized appreciation/(depreciation) on investments | 447,149,332 | (78,436,140 | ) | |||||
| Net Increase/(Decrease) in Net Assets Resulting from Operations | 621,363,394 | (184,491,358 | ) | |||||
| DISTRIBUTIONS TO SHAREHOLDERS: | ||||||||
| Class A | ||||||||
| From distributable earnings | (9,380,559 | ) | (11,217,395 | ) | ||||
| From return of capital | (27,699,106 | ) | (31,152,341 | ) | ||||
| Class C | ||||||||
| From distributable earnings | (6,455,894 | ) | (7,201,941 | ) | ||||
| From return of capital | (19,598,666 | ) | (20,341,353 | ) | ||||
| Class I | ||||||||
| From distributable earnings | (20,787,679 | ) | (22,220,126 | ) | ||||
| From return of capital | (67,807,905 | ) | (65,288,868 | ) | ||||
| Class M | ||||||||
| From distributable earnings | (12,412,060 | ) | (11,896,230 | ) | ||||
| From return of capital | (40,664,890 | ) | (36,960,896 | ) | ||||
| Class L | ||||||||
| From distributable earnings | (1,056,223 | ) | (928,324 | ) | ||||
| From return of capital | (3,310,671 | ) | (3,045,393 | ) | ||||
| Total Distributions to Shareholders | (209,173,653 | ) | (210,252,867 | ) | ||||
| BENEFICIAL INTEREST TRANSACTIONS: | ||||||||
| Class A | ||||||||
| Shares sold | 59,477,036 | 141,333,948 | ||||||
| Distributions reinvested | 21,991,597 | 23,711,348 | ||||||
| Shares redeemed | (150,491,558 | ) | (139,056,725 | ) | ||||
| Exchanged out | (21,574,559 | ) | (92,007,643 | ) | ||||
| Class C | ||||||||
| Shares sold | 33,762,465 | 81,929,996 | ||||||
| Distributions reinvested | 15,244,687 | 16,030,646 | ||||||
| Shares redeemed | (74,043,072 | ) | (74,781,484 | ) | ||||
| Exchanged out | (9,465,810 | ) | (5,639,213 | ) | ||||
| Class I | ||||||||
| Shares sold | 456,694,008 | 456,751,216 | ||||||
| Distributions reinvested | 45,758,339 | 42,478,149 | ||||||
| Shares redeemed | (395,319,000 | ) | (328,458,174 | ) | ||||
| Exchanged in | 36,022,495 | 140,118,543 | ||||||
| Class M | ||||||||
| Shares sold | 150,986,412 | 249,642,265 | ||||||
| Distributions reinvested | 42,142,125 | 39,615,004 | ||||||
| Shares redeemed | (95,637,583 | ) | (55,504,294 | ) | ||||
| Exchanged out | (4,299,397 | ) | (4,105,874 | ) | ||||
| Class L | ||||||||
| Shares sold | 8,810,216 | 26,720,072 | ||||||
| Distributions reinvested | 3,020,028 | 2,792,460 | ||||||
| Shares redeemed | (9,391,852 | ) | (5,728,428 | ) | ||||
| Exchanged out | (682,729 | ) | (38,365,813 | ) | ||||
| Net Increase in Net Assets Derived from Beneficial Interest Transactions | 113,003,848 | 477,475,999 | ||||||
| Net increase in net assets | 525,193,589 | 82,731,774 | ||||||
See Notes to Financial Statements.
| 24 | 1.888.926.2688 | www.griffincapital.com |
| Griffin Institutional Access Real Estate Fund | Statements of Changes in Net Assets |
| For the Year Ended September 30, 2021 | For the Year Ended September 30, 2020 | |||||||
| NET ASSETS: | ||||||||
| Beginning of year | 3,879,823,889 | 3,797,092,115 | ||||||
| End of year | $ | 4,405,017,478 | $ | 3,879,823,889 | ||||
| Other Information | ||||||||
| BENEFICIAL INTEREST TRANSACTIONS: | ||||||||
| Class A | ||||||||
| Beginning shares | 29,505,770 | 32,142,589 | ||||||
| Shares sold | 2,261,507 | 5,241,802 | ||||||
| Distributions reinvested | 843,757 | 930,476 | ||||||
| Shares redeemed | (5,785,650 | ) | (5,313,837 | ) | ||||
| Shares transferred out | (826,222 | ) | (3,495,260 | ) | ||||
| Net decrease in shares outstanding | (3,506,608 | ) | (2,636,819 | ) | ||||
| Ending shares | 25,999,162 | 29,505,770 | ||||||
| Class C | ||||||||
| Beginning shares | 20,802,789 | 20,206,313 | ||||||
| Shares sold | 1,332,105 | 3,137,134 | ||||||
| Distributions reinvested | 609,837 | 650,609 | ||||||
| Shares redeemed | (2,961,768 | ) | (2,970,780 | ) | ||||
| Shares transferred out | (371,433 | ) | (220,487 | ) | ||||
| Net increase/(decrease) in shares outstanding | (1,391,259 | ) | 596,476 | |||||
| Ending shares | 19,411,530 | 20,802,789 | ||||||
| Class I | ||||||||
| Beginning shares | 64,327,639 | 53,290,893 | ||||||
| Shares sold | 16,968,556 | 16,787,615 | ||||||
| Distributions reinvested | 1,724,150 | 1,646,834 | ||||||
| Shares redeemed | (15,066,821 | ) | (12,602,940 | ) | ||||
| Shares transferred in | 1,357,088 | 5,205,237 | ||||||
| Net increase in shares outstanding | 4,982,973 | 11,036,746 | ||||||
| Ending shares | 69,310,612 | 64,327,639 | ||||||
| Class M | ||||||||
| Beginning shares | 38,533,911 | 29,940,573 | ||||||
| Shares sold | 5,814,577 | 9,339,187 | ||||||
| Distributions reinvested | 1,648,596 | 1,580,554 | ||||||
| Shares redeemed | (3,766,078 | ) | (2,162,000 | ) | ||||
| Shares transferred out | (171,631 | ) | (164,403 | ) | ||||
| Net increase in shares outstanding | 3,525,464 | 8,593,338 | ||||||
| Ending shares | 42,059,375 | 38,533,911 | ||||||
| Class L | ||||||||
| Beginning shares | 3,161,055 | 3,678,857 | ||||||
| Shares sold | 338,360 | 996,164 | ||||||
| Distributions reinvested | 116,717 | 110,403 | ||||||
| Shares redeemed | (361,451 | ) | (220,524 | ) | ||||
| Shares transferred out | (26,777 | ) | (1,403,845 | ) | ||||
| Net increase/(decrease) in shares outstanding | 66,849 | (517,802 | ) | |||||
| Ending shares | 3,227,904 | 3,161,055 | ||||||
See Notes to Financial Statements.
| Annual Report | September 30, 2021 | 25 |
| Griffin Institutional Access Real Estate Fund | Statement of Cash Flows |
| For the Year Ended September 30, 2021 | ||||
| Operating Activities: | ||||
| Net increase in net assets resulting from operations | $ | 621,363,394 | ||
| Adjustments to reconcile net increase in net assets resulting from operations to net cash used in operating activities: | ||||
| Purchase of investments | (1,863,725,433 | ) | ||
| Proceeds from sale of investments | 1,640,769,954 | |||
| Net proceeds from short-term investments | 126,519,137 | |||
| Net realized gain on investments | (120,393,155 | ) | ||
| Net change in unrealized appreciation on investments | (447,149,332 | ) | ||
| Change in operating assets and liabilities: | ||||
| Dividend receivables | 633,266 | |||
| Pre-funded asset commitment | 5,531,477 | |||
| Prepaid expenses and other assets | 50,091 | |||
| Payable for investment advisory fees | 628,224 | |||
| Payable for distribution fees | 119,308 | |||
| Payable for shareholder servicing fees | (3,840 | ) | ||
| Payable for transfer agency fees | 41,104 | |||
| Payable for lines of credit interest | 50,470 | |||
| Payable for administration fees | 9,313 | |||
| Payable for trustees' fees | 1,589 | |||
| Payable for legal fees | (28,427 | ) | ||
| Payable for audit and tax fees | 2,500 | |||
| Payable for custody fees | 17,206 | |||
| Payable for compliance service fees | (3,655 | ) | ||
| Accrued expenses and other liabilities | 6,177,213 | |||
| Net cash used in operating activities | (29,389,596 | ) | ||
| Financing Activities: | ||||
| Cash provided by lines of credit | 139,000,000 | |||
| Proceeds from shares sold | 704,529,539 | |||
| Cost of shares redeemed | (724,883,065 | ) | ||
| Distributions paid to shareholders | (81,016,877 | ) | ||
| Net cash provided by financing activities | 37,629,597 | |||
| Cash and cash equivalents, beginning of year | $ | 9,720,829 | ||
| Cash and cash equivalents, end of year | $ | 17,960,830 | ||
| SUPPLEMENTAL DISCLOSURE OF CASH FLOW INFORMATION: | ||||
| Non-cash financing activities not included herein consist of reinvestment of distributions of: | $ | 128,156,776 | ||
| Cash paid during the year for interest from bank borrowing: | $ | 2,914,470 | ||
See Notes to Financial Statements.
| 26 | 1.888.926.2688 | www.griffincapital.com |
| Griffin Institutional Access Real Estate Fund – Class A | Financial Highlights |
| For a Share Outstanding Throughout the Years Presented | |
| For the Year Ended September 30, 2021 | For the Year Ended September 30, 2020 | For the Year Ended September 30, 2019 | For the Year Ended September 30, 2018 | For the Year Ended September 30, 2017 | ||||||||||||||||
| Net asset value, beginning of year | $ | 24.93 | $ | 27.36 | $ | 26.94 | $ | 26.65 | $ | 26.63 | ||||||||||
| INCOME FROM INVESTMENT OPERATIONS: | ||||||||||||||||||||
| Net investment income(a) | 0.39 | 0.38 | 0.39 | 0.38 | 0.28 | |||||||||||||||
| Net realized and unrealized gain/(loss) | 3.74 | (1.46 | ) | 1.46 | 1.32 | 1.14 | ||||||||||||||
| Total from investment operations | 4.13 | (1.08 | ) | 1.85 | 1.70 | 1.42 | ||||||||||||||
| DISTRIBUTIONS: | ||||||||||||||||||||
| From net investment income | (0.15 | ) | (0.36 | ) | – | – | – | |||||||||||||
| From net realized gain on investments | (0.19 | ) | – | (0.54 | ) | (0.20 | ) | (0.30 | ) | |||||||||||
| Return of capital | (1.05 | ) | (0.99 | ) | (0.89 | ) | (1.21 | ) | (1.10 | ) | ||||||||||
| Total distributions(b) | (1.39 | ) | (1.35 | ) | (1.43 | ) | (1.41 | ) | (1.40 | ) | ||||||||||
| Net increase/(decrease) in net asset value | 2.74 | (2.43 | ) | 0.42 | 0.29 | 0.02 | ||||||||||||||
| Net asset value, end of year | $ | 27.67 | $ | 24.93 | $ | 27.36 | $ | 26.94 | $ | 26.65 | ||||||||||
| TOTAL RETURN(c) | 17.00 | % | (3.96 | )% | 7.05 | % | 6.54 | % | 5.47 | % | ||||||||||
| RATIOS/SUPPLEMENTAL DATA: | ||||||||||||||||||||
| Net assets, end of year (000s) | $ | 719,324 | $ | 735,511 | $ | 879,401 | $ | 714,880 | $ | 639,448 | ||||||||||
| Ratios to Average Net Assets (including interest expense) | ||||||||||||||||||||
Ratio of expenses to average net assets excluding fee waivers and reimbursements/recoupment of previously waived fees(d) | 1.97 | % | 1.95 | % | 1.94 | % | 2.11 | % | 2.29 | % | ||||||||||
Ratio of expenses to average net assets including fee waivers and reimbursements/recoupment of previously waived fees(d) | 1.98 | % | 1.97 | % | 1.96 | % | 2.11 | % | 2.23 | % | ||||||||||
Ratio of net investment income to average net assets including fee waivers and reimbursements(d)(e) | 1.48 | % | 1.45 | % | 1.43 | % | 1.41 | % | 1.06 | % | ||||||||||
| Ratios to Average Net Assets (excluding interest expense) | ||||||||||||||||||||
Ratio of expenses to average net assets excluding fee waivers and reimbursements/recoupment of previously waived fees(d) | 1.89 | % | 1.89 | % | 1.89 | % | 1.91 | % | 1.97 | % | ||||||||||
Ratio of expenses to average net assets including fee waivers and reimbursements/recoupment of previously waived fees(d) | 1.90 | % | 1.91 | % | 1.91 | % | 1.91 | % | 1.91 | % | ||||||||||
Ratio of net investment income to average net assets excluding fee waivers and reimbursements(d)(e) | 1.57 | % | 1.53 | % | 1.50 | % | 1.61 | % | 1.31 | % | ||||||||||
| Portfolio turnover rate | 42 | % | 51 | % | 22 | % | 15 | % | 11 | % | ||||||||||
See Notes to Financial Statements.
| Annual Report | September 30, 2021 | 27 |
| Griffin Institutional Access Real Estate Fund – Class A | Financial Highlights |
| For a Share Outstanding Throughout the Years Presented | |
| (a) | Calculated using the average shares method. |
| (b) | Total distributions during a calendar year generally will be made from the Fund’s net investment income, net realized gains on investments and net unrealized gains on investments, if any. The portion of distributions paid not attributable to net investment income or net realized gains on investments, if any, is distributed from the Fund’s assets and is treated by shareholders as a nontaxable distribution (“Return of Capital”) for tax purposes. Return of capital is a tax concept, not an economic concept. The tax character of the Fund’s distributions, in isolation, does not reveal much information about whether the distributions are supported by the Fund’s returns. Reported distributions from net investment income and realized gains on investments are not an indication as to whether or not the Fund’s distributions are supported by the Fund’s returns. The Fund can have distributions from net investment income and realized capital gains in years in which it incurs an economic loss due to unrealized losses not being recognized for tax purposes. A common method in which to determine if the Fund’s distributions are supported by economic returns is to examine the Fund’s Net Asset Value (“NAV”) over the course of a year. If the Fund’s NAV has increased, the Fund will have economically earned more than it has distributed, regardless of whether such distributions are reported as being from net investment income, net realized gains on investments or return of capital. If the Fund’s NAV decreases, the Fund will have distributed more than it has economically earned or it will have incurred an economic loss. |
| (c) | Total returns are for the year indicated. Total returns would have been lower had certain expenses not been waived or recouped by the Adviser during the year. Returns shown do not reflect the deduction of taxes that a shareholder would pay on Fund distributions or the redemption of Fund shares. |
| (d) | The ratios of expenses to average net assets and net investment income to average net assets do not reflect the expenses of the underlying private real estate funds in which the Fund invests which typically range from 0.80% to 1.00% on an annual basis. However, the Fund invests in each underlying private real estate investment fund based upon the net asset value of each such fund which reflects the costs of investing in the applicable fund, including the management fee of the underlying fund and other operating expenses. The net asset value of each underlying private real estate investment fund is incorporated into the ratios described above. |
| (e) | Recognition of net investment income is affected by the timing and declaration of dividends by the underlying investments in which the Fund invests. |
See Notes to Financial Statements.
| 28 | 1.888.926.2688 | www.griffincapital.com |
| Griffin Institutional Access Real Estate Fund – Class C | Financial Highlights |
| For a Share Outstanding Throughout the Years Presented | |
| For the Year Ended September 30, 2021 | For the Year Ended September 30, 2020 | For the Year Ended September 30, 2019 | For the Year Ended September 30, 2018 | For the Year Ended September 30, 2017 | ||||||||||||||||
| Net asset value, beginning of year | $ | 24.00 | $ | 26.54 | $ | 26.33 | $ | 26.24 | $ | 26.42 | ||||||||||
| INCOME FROM INVESTMENT OPERATIONS: | ||||||||||||||||||||
| Net investment income(a) | 0.18 | 0.18 | 0.18 | 0.17 | 0.08 | |||||||||||||||
| Net realized and unrealized gain/(loss) | 3.59 | (1.41 | ) | 1.42 | 1.31 | 1.12 | ||||||||||||||
| Total from investment operations | 3.77 | (1.23 | ) | 1.60 | 1.48 | 1.20 | ||||||||||||||
| DISTRIBUTIONS: | ||||||||||||||||||||
| From net investment income | (0.13 | ) | (0.35 | ) | – | – | – | |||||||||||||
| From net realized gain on investments | (0.19 | ) | – | (0.52 | ) | (0.20 | ) | (0.30 | ) | |||||||||||
| Return of capital | (1.01 | ) | (0.96 | ) | (0.87 | ) | (1.19 | ) | (1.08 | ) | ||||||||||
| Total distributions(b) | (1.33 | ) | (1.31 | ) | (1.39 | ) | (1.39 | ) | (1.38 | ) | ||||||||||
| Net increase/(decrease) in net asset value | 2.44 | (2.54 | ) | 0.21 | 0.09 | (0.18 | ) | |||||||||||||
| Net asset value, end of year | $ | 26.44 | $ | 24.00 | $ | 26.54 | $ | 26.33 | $ | 26.24 | ||||||||||
| TOTAL RETURN(c) | 16.13 | % | (4.68 | )% | 6.24 | % | 5.76 | % | 4.68 | % | ||||||||||
| RATIOS/SUPPLEMENTAL DATA: | ||||||||||||||||||||
| Net assets, end of year (000s) | $ | 513,220 | $ | 499,225 | $ | 536,289 | $ | 470,711 | $ | 445,191 | ||||||||||
| Ratios to Average Net Assets (including interest expense) | ||||||||||||||||||||
Ratio of expenses to average net assets excluding fee waivers and reimbursements/recoupment of previously waived fees(d) | 2.72 | % | 2.71 | % | 2.70 | % | 2.86 | % | 3.04 | % | ||||||||||
Ratio of expenses to average net assets including fee waivers and reimbursements/recoupment of previously waived fees (d) | 2.73 | % | 2.72 | % | 2.72 | % | 2.86 | % | 2.98 | % | ||||||||||
Ratio of net investment income to average net assets including fee waivers and reimbursements(d)(e) | 0.72 | % | 0.71 | % | 0.68 | % | 0.66 | % | 0.30 | % | ||||||||||
| Ratios to Average Net Assets (excluding interest expense) | ||||||||||||||||||||
Ratio of expenses to average net assets excluding fee waivers and reimbursements/recoupment of previously waived fees(d) | 2.64 | % | 2.65 | % | 2.64 | % | 2.66 | % | 2.72 | % | ||||||||||
Ratio of expenses to average net assets including fee waivers and reimbursements/recoupment of previously waived fees(d) | 2.65 | % | 2.66 | % | 2.66 | % | 2.66 | % | 2.66 | % | ||||||||||
Ratio of net investment income to average net assets excluding fee waivers and reimbursements(d)(e) | 0.81 | % | 0.78 | % | 0.76 | % | 0.86 | % | 0.56 | % | ||||||||||
| Portfolio turnover rate | 42 | % | 51 | % | 22 | % | 15 | % | 11 | % | ||||||||||
See Notes to Financial Statements.
| Annual Report | September 30, 2021 | 29 |
| Griffin Institutional Access Real Estate Fund – Class C | Financial Highlights |
| For a Share Outstanding Throughout the Years Presented | |
| (a) | Calculated using the average shares method. |
| (b) | Total distributions during a calendar year generally will be made from the Fund’s net investment income, net realized gains on investments and net unrealized gains on investments, if any. The portion of distributions paid not attributable to net investment income or net realized gains on investments, if any, is distributed from the Fund’s assets and is treated by shareholders as a nontaxable distribution (“Return of Capital”) for tax purposes. Return of capital is a tax concept, not an economic concept. The tax character of the Fund’s distributions, in isolation, does not reveal much information about whether the distributions are supported by the Fund’s returns. Reported distributions from net investment income and realized gains on investments are not an indication as to whether or not the Fund’s distributions are supported by the Fund’s returns. The Fund can have distributions from net investment income and realized capital gains in years in which it incurs an economic loss due to unrealized losses not being recognized for tax purposes. A common method in which to determine if the Fund’s distributions are supported by economic returns is to examine the Fund’s Net Asset Value (“NAV”) over the course of a year. If the Fund’s NAV has increased, the Fund will have economically earned more than it has distributed, regardless of whether such distributions are reported as being from net investment income, net realized gains on investments or return of capital. If the Fund’s NAV decreases, the Fund will have distributed more than it has economically earned or it will have incurred an economic loss. |
| (c) | Total returns are for the year indicated. Total returns would have been lower had certain expenses not been waived or recouped by the Adviser during the year. Returns shown do not reflect the deduction of taxes that a shareholder would pay on Fund distributions or the redemption of Fund shares. |
| (d) | The ratios of expenses to average net assets and net investment income to average net assets do not reflect the expenses of the underlying private real estate funds in which the Fund invests which typically range from 0.80% to 1.00% on an annual basis. However, the Fund invests in each underlying private real estate investment fund based upon the net asset value of each such fund which reflects the costs of investing in the applicable fund, including the management fee of the underlying fund and other operating expenses. The net asset value of each underlying private real estate investment fund is incorporated into the ratios described above. |
| (e) | Recognition of net investment income is affected by the timing and declaration of dividends by the underlying investments in which the Fund invests. |
See Notes to Financial Statements.
| 30 | 1.888.926.2688 | www.griffincapital.com |
| Griffin Institutional Access Real Estate Fund – Class I | Financial Highlights |
| For a Share Outstanding Throughout the Years Presented | |
| For the Year Ended September 30, 2021 | For the Year Ended September 30, 2020 | For the Year Ended September 30, 2019 | For the Year Ended September 30, 2018 | For the Year Ended September 30, 2017 | ||||||||||||||||
| Net asset value, beginning of year | $ | 25.25 | $ | 27.65 | $ | 27.16 | $ | 26.80 | $ | 26.71 | ||||||||||
| INCOME FROM INVESTMENT OPERATIONS: | ||||||||||||||||||||
| Net investment income(a) | 0.46 | 0.45 | 0.46 | 0.45 | 0.35 | |||||||||||||||
| Net realized and unrealized gain/(loss) | 3.80 | (1.48 | ) | 1.48 | 1.33 | 1.15 | ||||||||||||||
| Total from investment operations | 4.26 | (1.03 | ) | 1.94 | 1.78 | 1.50 | ||||||||||||||
| DISTRIBUTIONS: | ||||||||||||||||||||
| From net investment income | (0.15 | ) | (0.37 | ) | – | – | – | |||||||||||||
| From net realized gain on investments | (0.19 | ) | – | (0.55 | ) | (0.20 | ) | (0.30 | ) | |||||||||||
| Return of capital | (1.07 | ) | (1.00 | ) | (0.90 | ) | (1.22 | ) | (1.11 | ) | ||||||||||
| Total distributions(b) | (1.41 | ) | (1.37 | ) | (1.45 | ) | (1.42 | ) | (1.41 | ) | ||||||||||
| Net increase/(decrease) in net asset value | 2.85 | (2.40 | ) | 0.49 | 0.36 | 0.09 | ||||||||||||||
| Net asset value, end of year | $ | 28.10 | $ | 25.25 | $ | 27.65 | $ | 27.16 | $ | 26.80 | ||||||||||
| TOTAL RETURN(c) | 17.31 | % | (3.75 | )% | 7.30 | % | 6.81 | % | 5.75 | % | ||||||||||
| RATIOS/SUPPLEMENTAL DATA: | ||||||||||||||||||||
| Net assets, end of year (000s) | $ | 1,947,652 | $ | 1,624,344 | $ | 1,473,477 | $ | 992,272 | $ | 657,954 | ||||||||||
| Ratios to Average Net Assets (including interest expense) | ||||||||||||||||||||
Ratio of expenses to average net assets excluding fee waivers and reimbursements/recoupment of previously waived fees(d) | 1.72 | % | 1.71 | % | 1.70 | % | 1.86 | % | 2.04 | % | ||||||||||
| Ratio of expenses to average net assets including fee waivers and reimbursements/recoupment of previously waived fees(d) | 1.73 | % | 1.72 | % | 1.71 | % | 1.86 | % | 1.97 | % | ||||||||||
Ratio of net investment income to average net assets including fee waivers and reimbursements(d)(e) | 1.72 | % | 1.71 | % | 1.69 | % | 1.67 | % | 1.31 | % | ||||||||||
| Ratios to Average Net Assets (excluding interest expense) | ||||||||||||||||||||
Ratio of expenses to average net assets excluding fee waivers and reimbursements/recoupment of previously waived fees(d) | 1.65 | % | 1.65 | % | 1.65 | % | 1.66 | % | 1.73 | % | ||||||||||
Ratio of expenses to average net assets including fee waivers and reimbursements/recoupment of previously waived fees(d) | 1.66 | % | 1.66 | % | 1.66 | % | 1.66 | % | 1.66 | % | ||||||||||
Ratio of net investment income to average net assets excluding fee waivers and reimbursements(d)(e) | 1.80 | % | 1.79 | % | 1.76 | % | 1.87 | % | 1.55 | % | ||||||||||
| Portfolio turnover rate | 42 | % | 51 | % | 22 | % | 15 | % | 11 | % | ||||||||||
See Notes to Financial Statements.
| Annual Report | September 30, 2021 | 31 |
| Griffin Institutional Access Real Estate Fund – Class I | Financial Highlights |
| For a Share Outstanding Throughout the Years Presented | |
| (a) | Calculated using the average shares method. |
| (b) | Total distributions during a calendar year generally will be made from the Fund’s net investment income, net realized gains on investments and net unrealized gains on investments, if any. The portion of distributions paid not attributable to net investment income or net realized gains on investments, if any, is distributed from the Fund’s assets and is treated by shareholders as a nontaxable distribution (“Return of Capital”) for tax purposes. Return of capital is a tax concept, not an economic concept. The tax character of the Fund’s distributions, in isolation, does not reveal much information about whether the distributions are supported by the Fund’s returns. Reported distributions from net investment income and realized gains on investments are not an indication as to whether or not the Fund’s distributions are supported by the Fund’s returns. The Fund can have distributions from net investment income and realized capital gains in years in which it incurs an economic loss due to unrealized losses not being recognized for tax purposes. A common method in which to determine if the Fund’s distributions are supported by economic returns is to examine the Fund’s Net Asset Value (“NAV”) over the course of a year. If the Fund’s NAV has increased, the Fund will have economically earned more than it has distributed, regardless of whether such distributions are reported as being from net investment income, net realized gains on investments or return of capital. If the Fund’s NAV decreases, the Fund will have distributed more than it has economically earned or it will have incurred an economic loss. |
| (c) | Total returns are for the year indicated. Total returns would have been lower had certain expenses not been waived or recouped by the Adviser during the year. Returns shown do not reflect the deduction of taxes that a shareholder would pay on Fund distributions or the redemption of Fund shares. |
| (d) | The ratios of expenses to average net assets and net investment income to average net assets do not reflect the expenses of the underlying private real estate funds in which the Fund invests which typically range from 0.80% to 1.00% on an annual basis. However, the Fund invests in each underlying private real estate investment fund based upon the net asset value of each such fund which reflects the costs of investing in the applicable fund, including the management fee of the underlying fund and other operating expenses. The net asset value of each underlying private real estate investment fund is incorporated into the ratios described above. |
| (e) | Recognition of net investment income is affected by the timing and declaration of dividends by the underlying investments in which the Fund invests. |
See Notes to Financial Statements.
| 32 | 1.888.926.2688 | www.griffincapital.com |
| Griffin Institutional Access Real Estate Fund – Class M | Financial Highlights |
| For a Share Outstanding Throughout the Years or Periods Presented | |
| For the Year Ended September 30, 2021 | For the Year Ended September 30, 2020 | For the Year Ended September 30, 2019 | For the Year Ended September 30, 2018 | For the Period Ended September 30, 2017(a) | ||||||||||||||||
| Net asset value, beginning of year or period | $ | 24.46 | $ | 26.98 | $ | 26.70 | $ | 26.54 | $ | 26.48 | ||||||||||
| INCOME FROM INVESTMENT OPERATIONS: | ||||||||||||||||||||
| Net investment income(b) | 0.25 | 0.25 | 0.26 | 0.25 | 0.13 | |||||||||||||||
| Net realized and unrealized gain/(loss) | 3.67 | (1.44 | ) | 1.44 | 1.31 | 1.33 | ||||||||||||||
| Total from investment operations | 3.92 | (1.19 | ) | 1.70 | 1.56 | 1.46 | ||||||||||||||
| DISTRIBUTIONS: | ||||||||||||||||||||
| From net investment income | (0.14 | ) | (0.35 | ) | – | – | – | |||||||||||||
| From net realized gain on investments | (0.19 | ) | – | (0.54 | ) | (0.20 | ) | (0.30 | ) | |||||||||||
| Return of capital | (1.03 | ) | (0.98 | ) | (0.88 | ) | (1.20 | ) | (1.10 | ) | ||||||||||
| Total distributions(c) | (1.36 | ) | (1.33 | ) | (1.42 | ) | (1.40 | ) | (1.40 | ) | ||||||||||
| Net increase in net asset value | 2.56 | (2.52 | ) | 0.28 | 0.16 | 0.06 | ||||||||||||||
| Net asset value, end of year or period | $ | 27.02 | $ | 24.46 | $ | 26.98 | $ | 26.70 | $ | 26.54 | ||||||||||
| TOTAL RETURN(d) | 16.45 | % | (4.44 | )% | 6.51 | % | 6.03 | % | 5.63 | % | ||||||||||
| RATIOS/SUPPLEMENTAL DATA: | ||||||||||||||||||||
| Net assets, end of year or period (000s) | $ | 1,136,373 | $ | 942,531 | $ | 807,774 | $ | 402,482 | $ | 117,018 | ||||||||||
| Ratios to Average Net Assets (including interest expense) | ||||||||||||||||||||
Ratio of expenses to average net assets excluding fee waivers and reimbursements/recoupment of previously waived fees(e) | 2.47 | % | 2.46 | % | 2.44 | % | 2.58 | % | 2.71 | %(f) | ||||||||||
Ratio of expenses to average net assets including fee waivers and reimbursements/recoupment of previously waived fees (e) | 2.47 | % | 2.46 | % | 2.44 | % | 2.59 | % | 2.66 | %(f) | ||||||||||
Ratio of net investment income to average net assets including fee waivers and reimbursements(e)(g) | 0.99 | % | 0.98 | % | 0.98 | % | 0.94 | % | 0.57 | %(f) | ||||||||||
| Ratios to Average Net Assets (excluding interest expense) | ||||||||||||||||||||
Ratio of expenses to average net assets excluding fee waivers and reimbursements/recoupment of previously waived fees(e) | 2.40 | % | 2.40 | % | 2.39 | % | 2.41 | % | 2.46 | %(f) | ||||||||||
Ratio of expenses to average net assets including fee waivers and reimbursements/recoupment of previously waived fees(e) | 2.40 | % | 2.40 | % | 2.39 | % | 2.41 | % | 2.41 | %(f) | ||||||||||
Ratio of net investment income to average net assets excluding fee waivers and reimbursements(e)(g) | 1.06 | % | 1.04 | % | 1.03 | % | 1.14 | % | 0.77 | %(f) | ||||||||||
| Portfolio turnover rate | 42 | % | 51 | % | 22 | % | 15 | % | 11 | %(h) | ||||||||||
See Notes to Financial Statements.
| Annual Report | September 30, 2021 | 33 |
| Griffin Institutional Access Real Estate Fund – Class M | Financial Highlights |
| For a Share Outstanding Throughout the Years or Periods Presented | |
| (a) | The Fund’s Class M shares commenced operations on November 17, 2016. |
| (b) | Calculated using the average shares method. |
| (c) | Total distributions during a calendar year generally will be made from the Fund’s net investment income, net realized gains on investments and net unrealized gains on investments, if any. The portion of distributions paid not attributable to net investment income or net realized gains on investments, if any, is distributed from the Fund’s assets and is treated by shareholders as a nontaxable distribution (“Return of Capital”) for tax purposes. Return of capital is a tax concept, not an economic concept. The tax character of the Fund’s distributions, in isolation, does not reveal much information about whether the distributions are supported by the Fund’s returns. Reported distributions from net investment income and realized gains on investments are not an indication as to whether or not the Fund’s distributions are supported by the Fund’s returns. The Fund can have distributions from net investment income and realized capital gains in periods/years in which it incurs an economic loss due to unrealized losses not being recognized for tax purposes. A common method in which to determine if the Fund’s distributions are supported by economic returns is to examine the Fund’s Net Asset Value (“NAV”) over the course of a period/year. If the Fund’s NAV has increased, the Fund will have economically earned more than it has distributed, regardless of whether such distributions are reported as being from net investment income, net realized gains on investments or return of capital. If the Fund’s NAV decreases, the Fund will have distributed more than it has economically earned or it will have incurred an economic loss. |
| (d) | Total returns are for the period/year indicated and have not been annualized for periods less than a year. Total returns would have been lower had certain expenses not been waived or recouped by the Adviser during the period/year. Returns shown do not reflect the deduction of taxes that a shareholder would pay on Fund distributions or the redemption of Fund shares. |
| (e) | The ratios of expenses to average net assets and net investment income to average net assets do not reflect the expenses of the underlying private real estate funds in which the Fund invests which typically range from 0.80% to 1.00% on an annual basis. However, the Fund invests in each underlying private real estate investment fund based upon the net asset value of each such fund which reflects the costs of investing in the applicable fund, including the management fee of the underlying fund and other operating expenses. The net asset value of each underlying private real estate investment fund is incorporated into the ratios described above. |
| (f) | Annualized. |
| (g) | Recognition of net investment income is affected by the timing and declaration of dividends by the underlying investments in which the Fund invests. |
| (h) | Portfolio turnover rate for periods less than one full year has not been annualized and is calculated at the Fund level. |
See Notes to Financial Statements.
| 34 | 1.888.926.2688 | www.griffincapital.com |
| Griffin Institutional Access Real Estate Fund – Class L | Financial Highlights |
| For a Share Outstanding Throughout the Years or Periods Presented | |
| For the Year Ended September 30, 2021 | For the Year Ended September 30, 2020 | For the Year Ended September 30, 2019 | For the Year Ended September 30, 2018 | For the Period Ended September 30, 2017(a) | ||||||||||||||||
| Net asset value, beginning of year or period | $ | 24.74 | $ | 27.22 | $ | 26.87 | $ | 26.64 | $ | 26.63 | ||||||||||
| INCOME FROM INVESTMENT OPERATIONS: | ||||||||||||||||||||
| Net investment income(b) | 0.32 | 0.31 | 0.33 | 0.32 | 0.12 | |||||||||||||||
| Net realized and unrealized gain/(loss) | 3.71 | (1.45 | ) | 1.45 | 1.32 | 0.59 | ||||||||||||||
| Total from investment operations | 4.03 | (1.14 | ) | 1.78 | 1.64 | 0.71 | ||||||||||||||
| DISTRIBUTIONS: | ||||||||||||||||||||
| From net investment income | (0.14 | ) | (0.35 | ) | – | – | – | |||||||||||||
| From net realized gain on investments | (0.19 | ) | – | (0.54 | ) | (0.20 | ) | (0.15 | ) | |||||||||||
| Return of capital | (1.04 | ) | (0.99 | ) | (0.89 | ) | (1.21 | ) | (0.55 | ) | ||||||||||
| Total distributions(c) | (1.37 | ) | (1.34 | ) | (1.43 | ) | (1.41 | ) | (0.70 | ) | ||||||||||
| Net increase in net asset value | 2.66 | (2.48 | ) | 0.35 | 0.23 | 0.01 | ||||||||||||||
| Net asset value, end of year or period | $ | 27.40 | $ | 24.74 | $ | 27.22 | $ | 26.87 | $ | 26.64 | ||||||||||
| TOTAL RETURN(d) | 16.75 | % | (4.20 | )% | 6.77 | % | 6.30 | % | 2.70 | % | ||||||||||
| RATIOS/SUPPLEMENTAL DATA: | ||||||||||||||||||||
| Net assets, end of year or period (000s) | $ | 88,449 | $ | 78,213 | $ | 100,151 | $ | 45,853 | $ | 13,833 | ||||||||||
| Ratios to Average Net Assets (including interest expense) | ||||||||||||||||||||
Ratio of expenses to average net assets excluding fee waivers and reimbursements/recoupment of previously waived fees(e) | 2.21 | % | 2.20 | % | 2.19 | % | 2.34 | % | 2.44 | %(f) | ||||||||||
| Ratio of expenses to average net assets including fee waivers and reimbursements/recoupment of previously waived fees(e) | 2.21 | % | 2.20 | % | 2.19 | % | 2.35 | % | 2.39 | %(f) | ||||||||||
Ratio of net investment income to average net assets including fee waivers and reimbursements(e)(g) | 1.24 | % | 1.19 | % | 1.23 | % | 1.19 | % | 1.05 | %(f) | ||||||||||
| Ratios to Average Net Assets (excluding interest expense) | ||||||||||||||||||||
Ratio of expenses to average net assets excluding fee waivers and reimbursements/recoupment of previously waived fees(e) | 2.13 | % | 2.14 | % | 2.14 | % | 2.16 | % | 2.21 | %(f) | ||||||||||
Ratio of expenses to average net assets including fee waivers and reimbursements/recoupment of previously waived fees(e) | 2.13 | % | 2.14 | % | 2.14 | % | 2.16 | % | 2.16 | %(f) | ||||||||||
Ratio of net investment income to average net assets excluding fee waivers and reimbursements(e)(g) | 1.32 | % | 1.25 | % | 1.28 | % | 1.39 | % | 1.23 | %(f) | ||||||||||
| Portfolio turnover rate | 42 | % | 51 | % | 22 | % | 15 | % | 11 | %(h) | ||||||||||
See Notes to Financial Statements.
| Annual Report | September 30, 2021 | 35 |
| Griffin Institutional Access Real Estate Fund – Class L | Financial Highlights |
| For a Share Outstanding Throughout the Years or Periods Presented | |
| (a) | The Fund’s Class L shares commenced operations on April 25, 2017. |
| (b) | Calculated using the average shares method. |
| (c) | Total distributions during a calendar year generally will be made from the Fund’s net investment income, net realized gains on investments and net unrealized gains on investments, if any. The portion of distributions paid not attributable to net investment income or net realized gains on investments, if any, is distributed from the Fund’s assets and is treated by shareholders as a nontaxable distribution (“Return of Capital”) for tax purposes. Return of capital is a tax concept, not an economic concept. The tax character of the Fund’s distributions, in isolation, does not reveal much information about whether the distributions are supported by the Fund’s returns. Reported distributions from net investment income and realized gains on investments are not an indication as to whether or not the Fund’s distributions are supported by the Fund’s returns. The Fund can have distributions from net investment income and realized capital gains in periods/years in which it incurs an economic loss due to unrealized losses not being recognized for tax purposes. A common method in which to determine if the Fund’s distributions are supported by economic returns is to examine the Fund’s Net Asset Value (“NAV”) over the course of a period/year. If the Fund’s NAV has increased, the Fund will have economically earned more than it has distributed, regardless of whether such distributions are reported as being from net investment income, net realized gains on investments or return of capital. If the Fund’s NAV decreases, the Fund will have distributed more than it has economically earned or it will have incurred an economic loss. |
| (d) | Total returns are for the period/year indicated and have not been annualized for periods less than a year. Total returns would have been lower had certain expenses not been waived or recouped by the Adviser during the period/year. Returns shown do not reflect the deduction of taxes that a shareholder would pay on Fund distributions or the redemption of Fund shares. |
| (e) | The ratios of expenses to average net assets and net investment income to average net assets do not reflect the expenses of the underlying private real estate funds in which the Fund invests which typically range from 0.80% to 1.00% on an annual basis. However, the Fund invests in each underlying private real estate investment fund based upon the net asset value of each such fund which reflects the costs of investing in the applicable fund, including the management fee of the underlying fund and other operating expenses. The net asset value of each underlying private real estate investment fund is incorporated into the ratios described above. |
| (f) | Annualized. |
| (g) | Recognition of net investment income is affected by the timing and declaration of dividends by the underlying investments in which the Fund invests. |
| (h) | Portfolio turnover rate for periods less than one full year has not been annualized and is calculated at the Fund level. |
See Notes to Financial Statements.
| 36 | 1.888.926.2688 | www.griffincapital.com |
| Griffin Institutional Access Real Estate Fund | Financial Highlights |
| For a Share Outstanding Throughout the Years or Periods Presented | |
Information about the Fund's senior securities as of September 30, 2021 is shown in the following table:
| For the Year Ended September 30, 2021 | For the Year Ended September 30, 2020 | For the Year Ended September 30, 2019 | For the Year Ended September 30, 2018 | For the Year Ended September 30, 2017 | ||||||||||||||||
| Lines of Credit Total Amount Outstanding (000's) | $ | 139,000 | N/A | N/A | N/A | $ | 69,500 | |||||||||||||
Asset Coverage Per $1,000 of Lines of Credit Outstanding(a) | 32,691 | N/A | N/A | N/A | 27,956 | |||||||||||||||
| (a) | Calculated by subtracting the Fund’s total liabilities (excluding the indebtedness represented by the Lines of Credit) from the Fund’s total assets and dividing by the total amount outstanding on the Lines of Credit. The Asset Coverage ratio is then multiplied by $1,000 to determine the "Asset Coverage Per $1,000 of Lines of Credit Outstanding." |
See Notes to Financial Statements.
| Annual Report | September 30, 2021 | 37 |
| Griffin Institutional Access Real Estate Fund | Notes to Financial Statements |
| September 30, 2021 |
1. ORGANIZATION
Griffin Institutional Access Real Estate Fund (the “Fund”) is registered under the Investment Company Act of 1940, as amended (the “1940 Act”), as a non-diversified, closed-end management investment company. The Fund engages in a continuous offering of shares and operates as an interval fund that offers quarterly repurchases of shares at Net Asset Value (“NAV”). The Fund’s investment adviser is Griffin Capital Advisor, LLC (the “Adviser”). The investment objective of the Fund is to generate a return comprised of both current income and capital appreciation with moderate volatility and low correlation to the broader markets. The Fund pursues its investment objective by strategically investing across private institutional real estate investment funds as well as a diversified set of public real estate securities.
The Fund was organized as a statutory trust on November 5, 2013, under the laws of the State of Delaware. The Fund commenced operations on June 30, 2014 and is authorized to issue an unlimited number of shares with no par value.
The Fund currently offers Class A, Class C, Class I, Class M and Class L shares. Class A shares commenced operations on June 30, 2014, Class C and Class I shares commenced operations on August 10, 2015, Class M shares commenced operations on November 17, 2016 and Class L shares commenced operations on April 25, 2017. The sales load payable by each investor depends on the amount invested, and the class of shares invested into, by such investor in the Fund. Class A and Class L shares are offered subject to a maximum sales charge of 5.75% and 4.25%, respectively, of their offering price. Class C, Class I and Class M shares are offered at net asset value. Class C shares may be subject to a 1.00% contingent deferred sales charge on shares redeemed during the first 365 days after their purchase. Each class represents an interest in the same assets of the Fund and classes are identical except for differences in their sales charge structures and ongoing service and distribution charges. All classes of shares have equal voting privileges except that each class has exclusive voting rights with respect to its service and/or distribution plans. The Fund's income, expenses (other than class specific service and distribution fees) and realized and unrealized gains and losses are allocated proportionately each day based upon the relative net assets of each class.
2. SIGNIFICANT ACCOUNTING POLICIES
The following is a summary of significant accounting policies followed by the Fund in preparation of its financial statements in conformity with accounting principles generally accepted in the United States of America (“U.S. GAAP”). The Fund is considered an investment company following accounting and reporting guidance in Accounting Standards Codification (“ASC”) Topic 946 – Financial Services – Investment Companies. The preparation of financial statements requires management to make estimates and assumptions that affect the reported amounts of assets and liabilities and disclosure of contingent assets and liabilities at the date of the financial statements and the reported amounts of income and expenses for the period. Actual results could differ from those estimates.
Determination of Net Asset Value – The net asset value of shares of the Fund is determined following the close of regular trading on the NYSE, generally 4:00 p.m. Eastern time, on each day the NYSE is open for trading. Each of the Fund’s share classes will be offered at net asset value plus the applicable sales load, if any. The Fund’s net asset value per share is calculated, on a class-specific basis, by dividing the value of the Fund’s total assets (the value of the securities the Fund holds plus cash or other assets, including interest accrued but not yet received), less accrued expenses and other liabilities of the Fund by the total number of shares outstanding. During the continuous offering, the price of the shares will increase or decrease on a daily basis according to the net asset value of the shares.
Valuation of Public Securities – Readily marketable portfolio securities listed on a public exchange are valued at their current market values determined on the basis of market or dealer quotations obtained from independent pricing services approved by the Board. Such quotes typically utilize official closing prices, generally the last sale price, reported to the applicable securities exchange if readily available. If there has been no sale on such day that value is being determined, the securities are valued at the last reported sale price unless the Fair Value Pricing Committee believes the price is no longer reliable. If market prices become unreliable because of events occurring after the close of trading, then the security is valued by such method as the Fair Value Pricing Committee shall determine in good faith to reflect its fair market value. Portfolio securities traded on more than one securities exchange are valued at the last sale price on the business day as of which such value is being determined as reflected by the exchange representing the principal market for such securities. Securities trading on NASDAQ are valued at NASDAQ official closing price.
The Board will determine in good faith, the fair value of securities for which market or dealer quotations are not readily available or deemed unreliable. In determining the fair value of publicly traded securities for which market or dealer quotations are not readily available or unreliable the Adviser, together with the Fair Value Pricing Committee, will take into account all reasonably available information that may be relevant to a particular security including, but not limited to: pricing history, current market level, supply and demand of the respective security; comparison to the values and current pricing of securities that have comparable characteristics; knowledge of historical market information with respect to the security; fundamental analytical data, such as periodic financial statements, and other factors or information relevant to the security, issuer, or market. For securities that are fair valued in ordinary course of Fund operations, the Board has delegated the day to day responsibility for determining fair valuation to the Fair Value Pricing Committee in accordance with the policies approved by the Board. Fair valuation involves subjective judgments, and it is possible that the fair value determined for a security may differ materially from the value that could be realized upon the sale of the security.
| 38 | 1.888.926.2688 | www.griffincapital.com |
| Griffin Institutional Access Real Estate Fund | Notes to Financial Statements |
| September 30, 2021 |
Valuation of Private Investment Funds – The Fund’s allocation to Private Investment Funds generally includes open-end private investment funds that elect to be treated as REITs for tax purposes. The Private Investment Funds generally include private funds investing in real estate assets (“Private Equity REITs”) and private funds investing in debt instruments secured or otherwise supported by real estate assets (“Private Debt Funds”). The sponsors or agents of the Private Investment Funds measure their investment assets at fair value and report a NAV per share no less frequently than quarterly (“Sponsor NAV”). The Private Investment Funds have generally adopted valuation practices consistent with the valuation standards and techniques established by professional industry associations that advise the institutional real estate investment community. Such valuation standards seek general application of U.S. Generally Accepted Accounting Principles (GAAP) fair value standards, uniform appraisal standards and the engagement of independent valuation advisory firms.
The valuations of the Private Investment Funds have a considerable impact on the Fund’s NAV as a significant portion of the Fund’s assets are invested in Private Investment Funds. Market and dealer quotations are generally not readily available for the Private Investment Funds in which the Fund invests, and as such, the Fund utilizes Sponsor NAVs or other valuation methodologies approved by the Fair Value Pricing Committee when determining the fair value of the Private Investment Funds. The Fund may also use a third-party valuation specialist to assist in determining fair value of the Private Investment Funds held in the Fund’s portfolio.
Private Equity REITs. The Private Equity REITs produce Sponsor NAVs no less frequently than quarterly. Such Sponsor NAVs are reviewed by the Adviser upon receipt and subsequently applied to the Fund’s NAV following consultation with the Private Equity REIT sponsor, if necessary. In between receipt of Sponsor NAVs, the value of each Private Equity REIT is adjusted daily by the change in a proprietary index (the “Index”) that the Fund’s Board has deemed representative of the private equity real estate market. This process is applied daily to each respective Private Equity REIT until the receipt of the next Sponsor NAV. The Index seeks to reflect market conditions of the broader private equity real estate market in an effort to ensure any such changes in market conditions are reflected in the NAV of the Fund. The Index is comprised of private real estate investment funds (“Index Constituents”) that produce a daily NAV and generally hold institutional quality assets. The Index is monitored by the Adviser on a regular basis, and the Adviser will consult with the Fair Value Pricing Committee if monitoring suggests a modification to the Index Constituents or other change(s) to the Index to better reflect market conditions. Further, in the event that a Sponsor NAV is not provided by a Private Equity REIT following the conclusion of such Private Equity REIT’s valuation period, the Adviser shall inform the Fair Value Pricing Committee and a meeting may be called to determine fair value.
Private Debt Funds. The Private Debt Funds produce Sponsor NAVs no less frequently than quarterly. Such Sponsor NAVs are reviewed by the Adviser upon receipt and subsequently applied to the Fund’s NAV following consultation with the Private Debt Fund sponsor, if necessary. The Fund will, in certain cases, accrue income on a daily basis for each Private Debt Fund based on the prior period’s distribution rate and/or guidance provided by each respective Private Debt Fund sponsor. In the event that a Sponsor NAV is not provided by a Private Debt Fund following the conclusion of such Private Debt Fund’s valuation period, or if the Adviser becomes aware of an event warranting an update to a Private Debt Fund valuation, the Adviser shall inform the Fair Value Pricing Committee and a meeting may be called to determine fair value.
Fair Value Measurements – A three-tier hierarchy has been established to classify fair value measurements for disclosure purposes. Inputs refer broadly to the assumptions that market participants would use in pricing the asset or liability, including assumptions about risk. Inputs may be observable or unobservable. Observable inputs are inputs that reflect the assumptions market participants would use in pricing the asset or liability that are developed based on market data obtained from sources independent of the reporting entity. Unobservable inputs are inputs that reflect the reporting entity’s own assumptions about the assumptions market participants would use in pricing the asset or liability that are developed based on the best information available. In accordance with the authoritative guidance on fair value measurements and disclosure under U.S. GAAP, the Fund discloses fair value of its investments in a hierarchy that prioritizes the inputs to valuation techniques used to measure the fair value:
| Level 1 – | Unadjusted quoted prices in active markets for identical, unrestricted assets or liabilities that the Fund has the ability to access at the measurement date; |
| Level 2 – | Quoted prices which are not active, quoted prices for similar assets or liabilities in active markets or inputs other than quoted prices that are observable (either directly or indirectly) for substantially the full term of the asset or liability at the measurement date; and |
| Level 3 – | Significant unobservable prices or inputs (including the Fund’s own assumptions in determining the fair value of investments) where there is little or no market activity for the asset or liability at the measurement date. |
| Annual Report | September 30, 2021 | 39 |
| Griffin Institutional Access Real Estate Fund | Notes to Financial Statements |
| September 30, 2021 |
The availability of observable inputs can vary from security to security and is affected by a wide variety of factors, including, for example, the type of security, whether the security is new and not yet established in the marketplace, the liquidity of markets and other characteristics particular to the security. To the extent that valuation is based on models or inputs that are less observable or unobservable in the market, the determination of fair value requires more judgment. Accordingly, the degree of judgment exercised in determining fair value is greatest for instruments categorized in Level 3.
An investment level within the fair value hierarchy is based on the lowest level input, individually or in the aggregate, that is significant to fair value measurement. The inputs or methodologies used for valuing securities are not necessarily an indication of the risk or liquidity associated with investing in those securities. The valuation techniques used by the Fund to measure fair value during the year ended September 30, 2021 maximized the use of observable inputs and minimized the use of unobservable inputs. For the year ended September 30, 2021, the Fund did not use unobservable inputs (Level 3) when determining fair value. The following is a summary of the fair valuations according to the inputs used in valuing the Fund’s investments as of September 30, 2021:
| Investments in Securities at Value | Level 1 - Quoted Prices | Level 2 - Other Significant Observable Inputs | Level 3 - Significant Unobservable Inputs | Total | ||||||||||||
| Real Estate Investment Trusts | ||||||||||||||||
| Private Investment Funds (Measured at net asset value)(a) | $ | – | $ | – | $ | – | $ | 3,421,858,395 | ||||||||
| Publicly Traded Securities | 1,005,720,109 | – | – | 1,005,720,109 | ||||||||||||
| Preferred Stocks | 81,830,555 | – | – | 81,830,555 | ||||||||||||
| Short Term Investment | 4,152,750 | – | – | 4,152,750 | ||||||||||||
| Total | $ | 1,091,703,414 | $ | – | $ | – | $ | 4,513,561,809 | ||||||||
| (a) | In accordance with Subtopic 820-10, certain investments that are measured at fair value using the net asset value per share (or its equivalent) practical expedient have not been classified in the fair value hierarchy. The fair value amounts presented in this table are intended to permit reconciliation of the fair value hierarchy to the amounts presented in the Schedule of Investments. |
The carrying and fair value of the Fund's debt obligation as of September 30, 2021 for which the Fund has determined would be categorized as Level 2 in the fair value hierarchy was $139,000,000. For the year ended September 30, 2021, the Fund did not use any significant unobservable inputs (Level 3) when determining fair value.
Investment Transactions – Investment security transactions are accounted for on trade date. Gains and losses on securities sold are determined on a specific identification basis. Non-cash dividends included in dividend income, if any, are recorded at the fair market value of the security received.
Investment Income – Interest income is accrued and recorded on a daily basis including income earned from money market funds. Dividend income is recorded on the ex-dividend date.
Distributions to Shareholders – Distributions from net investment income, if any, will be declared and paid quarterly. Distributions of net realized capital gains, if any, will be declared and paid annually. Income and capital gains distributions are determined in accordance with income tax regulations, which may differ from U.S. GAAP. Distributions to shareholders are recorded on the ex-dividend date.
Distributions from Underlying Real Estate Investment Trusts – Distributions made to the Fund by the underlying REITs in which the Fund invests may take several forms. Specifically, such distributions may be in the form of dividends, capital gains, and/or a return of capital.
Unfunded Commitments – Typically, when the Fund invests in a Private Investment Fund, the Fund makes a commitment to invest a specified amount of capital in the applicable Private Investment Fund. The capital commitment may be drawn by the general partner of the Private Investment Fund either all at once or through a series of capital calls at the discretion of the general partner. Thus, an Unfunded Commitment represents the portion of the Fund’s overall capital commitment to a particular Private Investment Fund that has not yet been called by the general partner of the Private Investment Fund. Unfunded Commitments may subject the Fund to certain risks. For example, the Fund may be required to: liquidate other portfolio investments, potentially at inopportune times, in order to obtain the cash needed to satisfy its obligations with respect to a capital call; borrow under a line of credit which may result in additional expenses to the Fund; or, to the extent a buyer can be identified and subject to the provisions of the limited partnership agreement of the relevant Private Investment Fund, seek to sell/assign the interest subject to the capital call to a third party thereby eliminating the obligation. In addition, should the Fund be unable to satisfy its commitment obligation on a timely basis and defaults on a called capital commitment, the underlying Private Investment Fund, pursuant to its limited partnership agreement, typically has a number of potential remedies, including, by way of illustration, a reallocation of the Fund's defaulted commitment amount to other limited partners, a reallocation of a portion of the Fund's existing interest to the other limited partners as a penalty for the default, or the general partner of underlying Private Investment Fund could sue the Fund for breach of contract. As of September 30, 2021, the Fund had total Unfunded Commitments in the amount of $404,931,610.
| 40 | 1.888.926.2688 | www.griffincapital.com |
| Griffin Institutional Access Real Estate Fund | Notes to Financial Statements |
| September 30, 2021 |
Indemnification – The Fund indemnifies its Officers and Trustees for certain liabilities that may arise from the performance of their duties to the Fund. Additionally, in the normal course of business, the Fund enters into contracts that contain a variety of representations and warranties and which provide general indemnities. The Fund’s maximum exposure under these arrangements is unknown, as this would involve future claims that may be made against the Fund that have not yet occurred. However, based on industry experience, the Fund expects the risk of loss due to these warranties and indemnities to be remote.
Federal Income Taxes – The Fund intends to continue to comply with the requirements of Subchapter M of the Internal Revenue Code applicable to regulated investment companies and will distribute all of its taxable income, if any, to shareholders. Accordingly, no provision for federal income taxes is required in the financial statements.
The Fund recognizes the tax benefits of uncertain tax positions only when the position is “more likely than not” to be sustained assuming examination by tax authorities. Management has reviewed the tax positions and has concluded that no liability for unrecognized tax benefits should be recorded related to uncertain tax positions taken in the Fund’s tax returns for open tax years or expected to be taken in the Fund’s 2021 returns.
3. ADVISORY FEES, ADMINISTRATION FEES AND OTHER AGREEMENTS
Investment Advisory
Pursuant to the Investment Advisory Agreement with the Fund (“Advisory Agreement”), the Adviser is entitled to an investment advisory fee, computed daily and payable monthly at an annual rate of 1.50% of the average daily net assets of the Fund.
The Adviser and the Fund have entered into an expense limitation and reimbursement agreement (the “Expense Limitation Agreement”) under which the Adviser has agreed contractually to waive its fees and to pay or absorb the ordinary annual operating expenses of the Fund (including organizational and offering expenses, but excluding taxes, interest, brokerage commissions, acquired fund fees and expenses and extraordinary expenses) so that the total annual operating expenses of the Fund do not exceed 1.91% per annum of Class A average daily net assets, 2.66% per annum of Class C average daily net assets, 1.66% per annum of Class I average daily net assets, 2.41% per annum of Class M average daily net assets and 2.16% per annum of Class L average daily net assets (the “Expense Limitations”). The Expense Limitation Agreement will remain in effect until February 1, 2022, unless and until the Trustees approve its modification or termination. The Fund does not anticipate that the Trustees will terminate the Expense Limitation Agreement during this period. The Expense Limitation Agreement may not be terminated by the Adviser. In consideration of the Adviser’s agreement to limit the Fund’s expenses, the Fund has agreed to repay the Adviser in the amount of any fees waived and Fund expenses paid or absorbed, subject to the limitations that: (1) the reimbursement for fees and expenses will be made only if payable not more than three years from the date on which they were incurred; and (2) the reimbursement may not be made if it would cause the lesser of the Expense Limitations in place at the time of waiver or at the time of reimbursement to be exceeded.
During the year ended September 30, 2021, the Fund recouped $281,537 of previously waived fees under the Expense Limitation Agreement. The Fund does not have a balance of recoupable expenses.
Sub-advisory services are provided to the Fund pursuant to agreements between the Adviser and both Aon Investments USA Inc. (“Aon”) and CenterSquare Investment Management LLC. (“CenterSquare” and collectively with Aon, the “Sub-Advisers”). Under the terms of the respective sub-advisory agreement, the Adviser compensates each Sub-Adviser based on a portion of the Fund’s average daily net assets which have been allocated to such Sub-Adviser to manage. Fees paid to each Sub-Adviser are not an expense of the Fund. The fee tables are as follows:
| Annual Sub-Advisory Fee Rate as a Percentage of Average Daily Net Assets Managed by CenterSquare | |
| $0 - $50M | 0.50% |
| $50 - $100M | 0.45% |
| $100 - $150M | 0.40% |
| Over $150M | 0.35% |
| Annual Sub-Advisory Fee Rate as a Percentage of Average Daily Net Assets Advised by Aon | |
| $0 - $500M | 0.15% |
| $500 - $750M | 0.125% |
| $750M - $1B | 0.10% |
| Over $1B | 0.07% |
| Annual Report | September 30, 2021 | 41 |
| Griffin Institutional Access Real Estate Fund | Notes to Financial Statements |
| September 30, 2021 |
Fund Administrator and Accounting Fees and Expenses
ALPS Fund Services, Inc. serves as the Fund’s administrator and accounting agent (the “Administrator”) and receives customary fees from the Fund for such services. The Administrator is also reimbursed by the Fund for certain out of pocket expenses.
Transfer Agency Fees and Expenses
DST Systems, Inc. serves as transfer, distribution paying and shareholder servicing agent for the Fund and receives customary fees from the Fund for such services.
Custody Fees and Expenses
UMB Bank, n.a. serves as the Fund’s custodian and receives customary fees from the Fund for such services.
Distribution and Shareholder Servicing Fees and Expenses
The Fund has entered into a Distribution Agreement with ALPS Distributors, Inc. (the “Distributor”) to provide distribution services to the Fund. The Distributor serves as principal underwriter of shares of the Fund. Under the Distribution Agreement the Fund’s Class C and Class M shares will pay to the Distributor a Distribution Fee that will accrue at an annual rate equal to 0.75% of the Fund’s average daily net assets attributable to Class C and Class M shares, payable on a monthly basis. Class L shares will pay to the Distributor a Distribution Fee that will accrue at an annual rate equal to 0.25% of the Fund’s average daily net assets attributable to Class L shares, payable on a monthly basis. For the year ended September 30, 2021, Class C, Class M and Class L shares incurred distribution fees of $3,726,939, $7,485,128 and $203,134, respectively. Class A and Class I shares are not currently subject to a Distribution Fee. Under the Shareholder Services Plan, the Fund’s Class A, Class C and Class L shares may pay up to 0.25% per year of their average daily net assets for such services. Class I and Class M shares are not currently subject to a shareholder services fee. For the year ended September 30, 2021, Class A, Class C and Class L shares incurred shareholder servicing fees of $1,746,397, $1,242,313 and $203,134, respectively.
The Distributor has entered into a wholesale marketing agreement with Griffin Capital Securities, LLC, a registered broker-dealer affiliate of the Adviser. Pursuant to the terms of the wholesale marketing agreement, Griffin Capital Securities, LLC will seek to market and otherwise promote the Fund through various wholesale distribution channels, including regional and independent retail broker-dealers, wirehouses and registered investment advisers.
Officer and Trustee Compensation
Each "non-interested Trustee" receives an annual retainer of $55,000, paid quarterly, as well as reimbursement for any reasonable expenses incurred attending the meetings and $500 per non-interested Trustee per each special telephonic meeting (exclusive of one special telephonic meeting per year). The Chair of the Audit Committee receives an additional $15,000 annually. None of the executive officers, with the exception of the Chief Compliance Officer, receive compensation from the Fund. Certain Trustees and officers of the Fund are also officers of the Adviser and are not paid by the Fund for serving in such capacities.
4. PURCHASES AND SALES OF INVESTMENT SECURITIES
The cost of purchases and proceeds from the sale of securities, other than short-term securities, for the year ended September 30, 2021 were as follows:
| Purchases of Securities | Proceeds from Sales of Securities | |||||||
| $ | 1,873,395,390 | $ | 1,628,706,513 | |||||
| 42 | 1.888.926.2688 | www.griffincapital.com |
| Griffin Institutional Access Real Estate Fund | Notes to Financial Statements |
| September 30, 2021 |
5. TAX BASIS INFORMATION
Distributions are determined in accordance with federal income tax regulations, which differ from U.S. GAAP, and, therefore, may differ significantly in amount or character from net investment income and realized gains for financial reporting purposes. Financial reporting records are adjusted for permanent book/tax differences to reflect tax character but are not adjusted for temporary differences.
For the year ended September 30, 2021, the following reclassifications were recorded to reflect tax character. These differences had no effect on operations or net assets and were primarily attributed to book/tax distribution differences and non-deductible expenses.
| Paid-in Capital | Total Distributable Earnings | |||||||
| $ | (1,619,999 | ) | $ | 1,619,999 | ||||
The tax character of distributions paid for each of the fiscal years were as follows:
| Year | Ordinary Income | Long-Term Capital Gain | Return of Capital | |||||||||
| 2021 | $ | 21,446,511 | $ | 28,645,904 | $ | 159,081,238 | ||||||
| 2020 | 53,464,016 | – | 156,788,851 | |||||||||
As of September 30, 2021, the components of accumulated earnings/(deficit) on a tax basis were as follows:
| Other cumulative effect of timing differences | Net unrealized appreciation/ (depreciation) on investments | Total | ||||||||||
| $ | (16,685,909 | ) | $ | 759,154,655 | $ | 742,468,746 | ||||||
As of September 30, 2021, net unrealized appreciation of investments based on the federal tax cost was as follows:
| Gross Appreciation (excess of value over tax cost) | Gross Depreciation (excess of tax cost over value) | Net Unrealized Appreciation/ (Depreciation) | Cost of Investments for Income Tax Purposes | |||||||||||||
| $ | 775,767,000 | $ | (16,612,345 | ) | $ | 759,154,655 | $ | 3,754,407,154 | ||||||||
The difference between book basis and tax basis distributable earnings and unrealized appreciation/(depreciation) is primarily attributable to the tax deferral of losses on wash sales, investments in partnerships, and certain other investments.
The Fund elects to defer to the period ending September 30, 2022, late year ordinary losses in the amount of $16,685,909.
6. LINES OF CREDIT
The Fund has entered into secured bank lines of credit through BNP Paribas Prime Brokerage International, Ltd. (“BNP”) and Credit Suisse First Boston Ltd. ("Credit Suisse" and together with BNP, the "Banks") subject to the limitations of the 1940 Act for borrowings.
Borrowings under the BNP arrangement bear interest at the 3 month LIBOR plus 95 basis points at the time of borrowing. During the year ended September 30, 2021, the Fund had outstanding borrowings for 166 days and incurred $229,561 of interest expense related to its outstanding borrowings under the BNP arrangement. For the 166 days during which the Fund had outstanding borrowings under the BNP arrangement, average borrowings were $44,090,361 and the average interest rate was 1.13%. As of September 30, 2021, the outstanding borrowing under the BNP arrangement was $139,000,000.
Borrowings under the Credit Suisse arrangement bear interest at the 3 month LIBOR plus 205 basis points at the time of borrowing and an unused commitment fee rate equal to 59.8 basis points. The Credit Suisse arrangement is subject to a maximum commitment of $450,000,000 although the Fund may request an increase to the maximum commitment subject to certain conditions. During the year ended September 30, 2021, the Fund had outstanding borrowings for 3 days and incurred $7,003 of interest expense related to its outstanding borrowings under the Credit Suisse arrangement. The Fund also incurred $2,728,376 of total unused commitment fees, which is included in the interest expense line item on the Statement of Operations. For the three days during which the Fund had outstanding borrowings under the Credit Suisse arrangement, average borrowings were $50,000,000 and the average interest rate was 1.69%. The largest outstanding borrowing under the Credit Suisse arrangement during the year ended September 30, 2021 was $50,000,000.
| Annual Report | September 30, 2021 | 43 |
| Griffin Institutional Access Real Estate Fund | Notes to Financial Statements |
| September 30, 2021 |
As collateral for the lines of credit, the Fund grants the Banks a first position security interest in and lien on securities of any kind or description held by the Fund in the collateral accounts. As of September 30, 2021, the Fund had $3,940,812,867 of securities pledged as collateral to the Banks.
7. REPURCHASE OFFERS
As a continuously offered, closed-end interval fund, the Fund has adopted a fundamental policy in which it offers to repurchase at net asset value no less than 5% of the outstanding shares of the Fund once each quarter. If shareholders tender for repurchase more than the amount in a repurchase offer, the Fund may, but is not required to, repurchase an additional amount of shares not to exceed 2% of the outstanding shares of the Fund on the repurchase request deadline. If the Fund determines not to repurchase more than the amount in a repurchase offer, or if shareholders tender shares in an amount exceeding the amount in a repurchase offer plus 2% of the outstanding shares on the repurchase request deadline, the Fund will repurchase the shares on a pro rata basis. It is possible that a repurchase offer may be oversubscribed and as such there is no guarantee that shareholders will be able to sell all of the shares they desire to sell in a quarterly repurchase offer, although each shareholder will have the right to require the Fund to purchase at least 5% of such shareholder’s shares in each quarterly repurchase. Liquidity will be provided to shareholders only through the Fund’s quarterly repurchase offers. Shareholders will receive written notice of each quarterly repurchase offer ("Repurchase Offer Notice") that includes the date the repurchase offer period ends ("Repurchase Request Deadline") and the date the repurchase price will be determined ("Repurchase Pricing Date"). Shares will be repurchased at the NAV per share determined on the Repurchase Pricing Date.
During the year ended September 30, 2021, the Fund completed four quarterly repurchase offers in which the Fund offered to repurchase up to 5% of its outstanding shares as of each respective Repurchase Request Deadline. Shareholder repurchase requests received by the Fund in good order by the November 10, 2020 and February 9, 2021 Repurchase Request Deadlines exceeded the number of Fund shares subject to each repurchase offer and, as such, the Fund determined to repurchase shares on a pro rata basis. Accordingly, the Fund repurchased approximately 58% of the total number of shares tendered for repurchase on November 10, 2020, and approximately 58% of the total number of shares tendered for repurchase on February 9, 2021. The results of the aforementioned repurchase offers were as follows:
| Repurchase Offer #1 | Repurchase Offer #2 | Repurchase Offer #3 | Repurchase Offer #4 | |
| Commencement Date | September 29, 2020 | December 29, 2020 | March 29, 2021 | June 29, 2021 |
| Repurchase Request Deadline | November 10, 2020 | February 9, 2021 | May 6, 2021 | August 5, 2021 |
| Repurchase Pricing Date | November 10, 2020 | February 9, 2021 | May 6, 2021 | August 5, 2021 |
| Amount Repurchased | $200,171,480 | $199,690,040 | $231,566,728 | $93,454,817 |
| Shares Repurchased | 7,909,235 | 7,787,790 | 8,827,176 | 3,417,567 |
8. PRINCIPAL RISK FACTORS
Concentration of Credit Risk – The Fund places its cash with one banking institution, which is insured by the Federal Deposit Insurance Corporation (“FDIC”). The FDIC limit is $250,000. At various times throughout the year, the amount on deposit may exceed the FDIC limit and subject the Fund to a credit risk. The Fund does not believe that such deposits are subject to any unusual risk associated with investment activities. The Fund may invest cash balances in an open-end Money Market Mutual Fund (“Money Market Fund”). The Money Market Fund is valued at its closing NAV. The Money Market Fund is not subject to FDIC insurance.
LIBOR Risk – Holdings of certain of the Fund’s underlying investments, and the Fund’s financing terms, may be based on floating rates, such as LIBOR. LIBOR, or the London Interbank Offered Rate, is a benchmark that dictates daily interest rates on loans and financial instruments globally. Plans are underway to phase out the use of LIBOR by the end of 2021, which indicates the continuation of LIBOR and other reference rates on the current basis cannot and will not be guaranteed after 2021. Any replacement rate chosen may be less favorable than the current rates. Until the announcement of the replacement rate, the Fund may continue to borrow under its credit facilities at rates that reference LIBOR and invest in underlying funds that may hold underlying assets referencing LIBOR or otherwise use LIBOR. There remains uncertainty regarding the nature of any replacement rate and the impact of the transition from LIBOR on the Fund’s transactions and the financial markets generally. As such, the potential effect of a transition away from LIBOR on the Fund’s investments and/or the Fund’s credit facilities cannot yet be determined.
Liquidity Risk – There currently is no secondary market for the Fund’s shares and the Adviser does not expect that a secondary market will develop. Limited liquidity is provided to shareholders only through the Fund’s quarterly repurchase offers for no less than 5% of the Fund’s shares outstanding at net asset value. There is no guarantee that shareholders will be able to sell all of the shares they desire in a quarterly repurchase offer. The Fund’s investments also are subject to liquidity risk. Liquidity risk exists when particular investments of the Fund would be difficult to purchase or sell, possibly preventing the Fund from selling such illiquid securities at an advantageous time or price, or possibly requiring the Fund to dispose of other investments at unfavorable times or prices in order to satisfy its obligations.
| 44 | 1.888.926.2688 | www.griffincapital.com |
| Griffin Institutional Access Real Estate Fund | Notes to Financial Statements |
| September 30, 2021 |
Market Risk – An investment in the fund’s shares is subject to investment risk, including the possible loss of the entire principal amount invested. An investment in the fund’s shares represents an indirect investment in the securities owned by the fund. The value of these securities, like other market investments, may move up or down, sometimes rapidly and unpredictably.
Mortgage-Backed Securities Risk – Mortgage-backed securities represent interests in “pools” of mortgages and often involve risks that are different from or possibly more acute than risks associated with other types of debt instruments. When the Fund invests in mortgage-backed securities, the Fund is subject to the risk that, if the underlying borrowers fail to pay interest or repay principal, the assets backing these securities may not be sufficient to support payments on the securities. Prepayment risk is associated with mortgage-backed securities. If interest rates fall, the underlying debt may be repaid ahead of schedule, reducing the value of the Fund’s investments. If interest rates rise, there may be fewer prepayments, which would cause the average bond maturity to rise, increasing the potential for the Fund to lose money. The value of these securities may be significantly affected by changes in interest rates, the market’s perception of issuers, and the creditworthiness of the parties involved. The ability of the Fund to successfully utilize these instruments may depend on the ability of the Fund’s Adviser or Sub-Adviser to forecast interest rates and other economic factors correctly. These securities may have a structure that makes their reaction to interest rate changes and other factors difficult to predict, making their value highly volatile. The credit risk on such securities is affected by borrowers defaulting on their loans. The values of assets underlying mortgage-backed securities may decline and, therefore, may not be adequate to cover underlying investors. Many of the risks of investing in MBS reflect the risks of investing in the real estate securing the underlying mortgage loans. These risks reflect the effects of local and other economic conditions on real estate markets, the ability of tenants to make loan payments, and the ability of a property to attract and retain tenants.
Pandemic Risk – An outbreak of infectious respiratory illness caused by a novel coronavirus known as COVID-19 was first detected in December 2019 and has now been detected globally. COVID-19 has resulted in travel restrictions, closed international borders, enhanced health screenings at ports of entry and elsewhere, disruption of and delays in healthcare service preparation and delivery, prolonged quarantines, cancellations, supply chain disruptions, and lower consumer demand, as well as general concern and uncertainty. The impact of COVID-19, and other infectious illness outbreaks that may arise in the future, could adversely affect the economies of many countries or the entire global economy, individual issuers and capital markets in ways that cannot necessarily be foreseen. In addition, the impact of infectious illnesses in emerging market countries may be greater due to generally less established healthcare systems. Public health crises caused by the COVID-19 outbreak, or other infectious diseases, may exacerbate other pre-existing political, social and economic risks in certain countries or globally. As such, issuers of real estate securities with properties, operations, productions, offices, and/or personnel in (or other exposure to) areas affected by diseases outbreaks may experience significant disruptions to their business and/or holdings. Potential impacts on the real estate market may include lower occupancy rates, decreased lease payments, defaults and foreclosures, among other consequences. The extent to which COVID-19 or other infectious diseases will affect the Fund, the Fund’s service providers and/or such issuer’s operations and results will depend on future developments, which are highly uncertain and cannot be predicted, including new information that may emerge concerning the severity of COVID-19 and the actions taken to contain COVID-19. The duration of the COVID-19 outbreak cannot be determined with certainty.
Preferred Securities Risk – There are various risks associated with investing in preferred securities, including credit risk, interest rate risk, deferral and omission of distributions, subordination to bonds and other debt securities in a company’s capital structure, limited liquidity, limited voting rights and special redemption rights. Interest rate risk is, in general, the risk that the price of a debt security falls when interest rates rise. Securities with longer maturities tend to be more sensitive to interest rate changes. Credit risk is the risk that an issuer of a security may not be able to make principal and interest or dividend payments on the security as they become due. Holders of preferred securities may not receive dividends, or the payment can be deferred for some period of time. In bankruptcy, creditors are generally paid before the holders of preferred securities.
Private Investment Fund Risk – The Fund’s investment in Private Investment Funds will require it to bear a pro rata share of the vehicles’ expenses, including management and performance fees. The fees the Fund pays to invest in a Private Investment Fund may be higher than if the manager of the Private Investment Fund managed the Fund’s assets directly. The performance fees charged by certain Private Investment Funds may create an incentive for its manager to make investments that are riskier and/or more speculative than those it might have made in the absence of a performance fee. Furthermore, Private Investment Funds, like the other Underlying Funds in which the Fund may invest, are subject to specific risks, depending on the nature of the vehicle, and also may employ leverage such that their returns are more than one times that of their benchmark which could amplify losses suffered by the Fund when compared to unleveraged investments. Shareholders of the Private Investment Funds are not entitled to the protections of the 1940 Act. For example, Private Investment Funds need not have independent boards, shareholder approval of advisory contracts may not be required, the Private Investment Funds may utilize leverage and may engage in joint transactions with affiliates. These characteristics present additional risks for shareholders.
Real Estate Industry Concentration Risk – Because the Fund will concentrate its investments in real estate securities, its portfolio will be significantly impacted by the performance of the real estate market and may experience more volatility and be exposed to greater risk than a more diversified portfolio. Significant investments in the securities of issuers within the real estate industry and any development affecting the real estate industry will have a greater impact on the value of the net assets of the Fund than would be the case if the Fund did not have significant investments in the real estate industry. The Fund’s investment in real estate equity or debt may be subject to risks similar to those associated with direct investment in real property. The value of the Fund’s shares will be affected by factors affecting the value of real estate and the earnings of companies engaged in the real estate industry. These factors include, among others: (i) changes in general economic and market conditions; (ii) changes in the value of real estate properties; (iii) risks related to local economic conditions, overbuilding and increased competition; (iv) increases in property taxes and operating expenses; (v) changes in zoning laws; (vi) casualty and condemnation losses; (vii) variations in rental income, neighborhood values or the appeal of property to tenants; (viii) the availability of financing and (ix) changes in interest rates. Many real estate companies utilize leverage, which increases investment risk and could adversely affect a company’s operations and market value in periods of rising interest rates. The value of securities of companies in the real estate industry may go through cycles of relative under-performance and outperformance in comparison to equity securities markets in general. As of September 30, 2021, the Fund had 102.37% of the value of its net assets invested within the real estate industry.
| Annual Report | September 30, 2021 | 45 |
| Griffin Institutional Access Real Estate Fund | Notes to Financial Statements |
| September 30, 2021 |
REIT Risk – Share prices of Public REITs may decline because of adverse developments affecting the real estate industry and real property values. In general, real estate values can be affected by a variety of factors, including supply and demand for properties, the economic health of the country or of different regions, and the strength of specific industries that rent properties. Qualification as a REIT under the Internal Revenue Code of 1986, as amended (the “Code”) in any particular year is a complex analysis that depends on a number of factors. There can be no assurance that an entity in which the Fund invests with the expectation that it will be taxed as a REIT will, in fact, qualify as a REIT. An entity that fails to qualify as a REIT would be subject to a corporate level tax, would not be entitled to a deduction for dividends paid to its shareholders and would not pass through to its shareholders the character of income earned by the entity. Dividends paid by REITs may not receive preferential tax treatment afforded other dividends.
9. SUBSEQUENT EVENTS
Subsequent events after the date of the Statement of Assets and Liabilities have been evaluated through the date the financial statements were issued.
The Fund completed a quarterly repurchase offer on November 4, 2021 which resulted in 2,932,811 shares being repurchased for $82,959,958. All shareholder repurchase requests received by the Fund in good order were honored in their full amounts.
Management has determined that there were no other subsequent events to report through the issuance of these financial statements.
| 46 | 1.888.926.2688 | www.griffincapital.com |
| Report of Independent Registered | |
| Griffin Institutional Access Real Estate Fund | Public Accounting Firm |

To the Board of Trustees and Shareholders of
Griffin Institutional Access Real Estate Fund
Opinion on the Financial Statements
We have audited the accompanying statement of assets and liabilities of Griffin Institutional Access Real Estate Fund (the “Fund”), including the schedule of investments, as of September 30, 2021, and the related statements of operations and cash flows for the year then ended, the statements of changes in net assets for each of the years in the two-year period then ended and the financial highlights as noted in the table below, and the related notes (collectively referred to as the “financial statements”). In our opinion, the financial statements present fairly, in all material respects, the financial position of the Fund as of September 30, 2021, and the results of its operations and cash flows for the year then ended, the changes in its net assets for each of the years in the two-year period then ended and its financial highlights as noted in the table below, in conformity with accounting principles generally accepted in the United States of America.
| Share Class | Financial Highlights |
| Class A | For each of the years in the five-year period ended September 30, 2021 |
| Class C | For each of the years in the five-year period ended September 30, 2021 |
| Class I | For each of the years in the five-year period ended September 30, 2021 |
| Class M | For each of the years in the four-year period ended September 30, 2021 and for the period from November 17, 2016 (commencement of operations) through September 30, 2017 |
| Class L | For each of the years in the four-year period ended September 30, 2021 and for the period from April 25, 2017 (commencement of operations) through September 30, 2017 |
Basis for Opinion
These financial statements are the responsibility of the Fund’s management. Our responsibility is to express an opinion on the Fund's financial statements based on our audits. We are a public accounting firm registered with the Public Company Accounting Oversight Board (United States) (“PCAOB”) and are required to be independent with respect to the Fund in accordance with the U.S. federal securities law and the applicable rules and regulations of the Securities and Exchange Commission and the PCAOB.
We conducted our audits in accordance with the standards of the PCAOB. Those standards require that we plan and perform the audits to obtain reasonable assurance about whether the financial statements are free of material misstatement, whether due to error or fraud. The Fund is not required to have, nor were we engaged to perform, an audit of its internal control over financial reporting. As part of our audits we are required to obtain an understanding of internal control over financial reporting but not for the purpose of expressing an opinion on the effectiveness of the Fund’s internal control over financial reporting. Accordingly, we express no such opinion.
Our audits included performing procedures to assess the risk of material misstatement of the financial statements, whether due to error or fraud, and performing procedures that respond to those risks. Such procedures included examining, on a test basis, evidence regarding the amounts and disclosures in the financial statements. Our procedures included confirmation of securities owned as of September 30, 2021 by correspondence with the custodian, brokers, and other appropriate parties. Our audits also included evaluating the accounting principles used and significant estimates made by management, as well as evaluating the overall presentation of the financial statements. We believe that our audits provide a reasonable basis for our opinion.

BBD, LLP
We have served as the auditor of Griffin Institutional Access Real Estate Fund since 2014.
Philadelphia, Pennsylvania
November 24, 2021
| Annual Report | September 30, 2021 | 47 |
| Griffin Institutional Access Real Estate Fund | Additional Information |
| September 30, 2021 (Unaudited) |
1. PROXY VOTING POLICIES AND VOTING RECORD
A description of the policies and procedures that the Fund uses to vote proxies relating to its portfolio securities is available without charge upon request by calling toll-free 888-926-2688, or on the Securities and Exchange Commission’s (“SEC”) website at http://www.sec.gov. Information regarding how the Fund voted proxies relating to underlying portfolio securities during the most recent 12-month period ended June 30th is available without charge upon request by calling toll-free 888-926-2688, or on the SEC’s website at http://www.sec.gov.
2. QUARTERLY PORTFOLIO HOLDINGS
The Fund files its complete schedule of portfolio holdings with the SEC for the first and third quarters of each fiscal year as an exhibit to its reports on Form N-PORT. The Fund’s Form N-PORT reports are available on the SEC’s web site at http://www.sec.gov.
| 48 | 1.888.926.2688 | www.griffincapital.com |
| Griffin Institutional Access Real Estate Fund | Trustees’ Consideration and Approval of Renewal of Advisory Agreements |
| September 30, 2021 (Unaudited) |
Trustees Consideration and Approval of Continuation of Advisory Agreement with Griffin Capital Advisor, LLC
Griffin Capital Advisor, LLC (the “Adviser”) supervises the investments of the Fund pursuant to an Investment Advisory Agreement. At a meeting of the Fund’s Board of Trustees on June 8, 2021 the Trustees approved the continuation of the Investment Advisory Agreement for a one-year term. In considering whether to approve the Investment Advisory Agreement, the Trustees reviewed and considered the information they deemed reasonably necessary, including the following material factors: (i) the nature, extent, and quality of the services provided by the Adviser; (ii) the investment performance of the Fund; (iii) the costs of the services provided by the Adviser; (iv) the profits to be realized by the Adviser and its affiliates from the relationship with the Fund; (v) the extent to which economies of scale would be realized as the Fund grows and whether advisory fee levels reflect those economies of scale for the benefit of the Fund’s investors.
At the meeting, the Trustees reviewed various informational materials, including the Investment Advisory Agreement for the Fund and a memorandum from the Adviser to the Trustees containing information about the advisory firm and its business. The memorandum provided information about the Adviser’s finances, personnel, services to the Fund, investment advice, fees, and compliance program. It also contained information on Fund expenses, including comparative expense ratio information for other investment companies with strategies similar to the Fund. The Trustees also reviewed a memorandum from the Fund’s legal counsel that summarized the fiduciary duties and responsibilities of the Board of Trustees in reviewing and approving the Investment Advisory Agreement, including the types of information and factors that should be considered in order to make an informed decision.
The Independent Trustees were assisted by Counsel throughout the Investment Advisory Agreement review process. The Board relied upon the advice of Counsel and their own business judgment in determining the material factors to be considered in evaluating the Investment Advisory Agreement and the weight to be given to each factor considered. The conclusions reached by the Trustees were based on a comprehensive evaluation of all of the information provided and were not the result of any one factor. Moreover, each Trustee may have afforded different weight to the various factors in reaching his conclusions with respect to the approval of the Investment Advisory Agreement.
The nature, extent, and quality of the services provided by the Adviser. The Trustees evaluated the Adviser’s staffing, personnel, and methods of operating; the education and experience of the Adviser’s personnel; the Adviser’s compliance programs, policies, and procedures; the financial condition of the Adviser; and the level of commitment to the Fund and the Adviser by the principals of the Adviser. The Trustees considered the responsibilities of the Adviser under the Management Agreement and reviewed the services provided to the Fund including, without limitation, the Adviser’s procedures for formulating investment recommendations and assuring compliance with the Fund’s investment objectives and limitations, coordination of services for the Fund among the Fund’s service providers, expertise and experience in the field, and efforts to promote the Fund, grow the Fund’s assets, and assist in the distribution of Fund shares. The Trustees noted that the Adviser seeks to achieve the Fund’s investment objective of generation of a balanced return comprised of current income and capital appreciation with moderate volatility and low correlation to the broader markets, through pursuing strategic investing across private institutional real estate investment funds as well as a diversified set of public real estate securities. The Trustees also noted that the Adviser continues its process of allocating between public and private real estate securities and allows the Fund to invest across a diversified set of investment managers and strategies as well as to provide investment exposure across property types and geographies. The Board noted the Adviser’s robust investment process, which has benefited the Fund through negotiation of fee reductions and other benefits for the Fund. The Trustees reviewed the balance sheet of the Adviser and discussed the financial stability and profitability of the firm. The Trustees noted that the Fund’s principal officers are personnel of the Adviser, and its affiliates serve the Fund without additional compensation (with the exception of the Fund’s chief compliance officer). The Board noted that the depth of experience of the personnel of the Adviser continues to grow, as shown by the Adviser’s engagement of new personnel. The Board recognized the attention given to the Adviser by other financial advisers in the real estate industry for their knowledge of private fund investments. After reviewing the foregoing information and other information in the Adviser’s Memorandum (e.g., the Adviser’s Form ADV and descriptions of the Adviser’s business and compliance program), the Board concluded that the nature, extent, and quality of the services provided by the Adviser to the Fund were satisfactory.
The investment performance of the Fund and the Adviser. The Trustees noted the Fund’s strong positive performance since its inception. The Board acknowledged that the Fund outperformed the Bloomberg U.S. Aggregate Bond Index, and underperformed the S&P 500 in each of the since inception and the annualized periods through April 30, 2021. The Board took note of the underperformance to the S&P 500, which was related to general bull market that has occurred since that time, especially since the end of market turmoil in the first quarter of 2020. The Board also did note that the Fund had provided better risk-adjusted returns than the S&P 500 since inception. The Trustees further noted that the Fund outperformed all but one of its peers in the since inception through April 30, 2021 period. After reviewing the Fund’s performance and other factors, the Board concluded that it was satisfied with the performance of the Fund.
The costs of the services to be provided by the Adviser. The Trustees evaluated the current and projected asset levels of the Fund; and the overall expenses of the Fund, including the nature and frequency of advisory fee payments.
| Annual Report | September 30, 2021 | 49 |
| Griffin Institutional Access Real Estate Fund | Trustees’ Consideration and Approval of Renewal of Advisory Agreements |
| September 30, 2021 (Unaudited) |
The Trustees then compared the fees and expenses of the Fund (including the management fee) to other peer funds comparable in terms of the type of fund, the nature of its investment strategy, and its style of investment management, among other factors. The Trustees determined that the base management fee was higher than other funds, but noted that other funds had externalized certain services that the Adviser provided (such as research) as part of its management fees, and agreed that it was important to consider the entire expense ratio in the comparison. In that regard, they noted that the net expense ratio was below the average of the peer group. The Board considered that other peer funds also utilized less laborious strategies.
The Trustees noted that the Adviser had agreed to an Expense Limitation Agreement, which limits the Fund’s annual operating expenses, that was still in effect. The Trustees also considered potential benefits for the Adviser in managing the Fund, including promotion of the Adviser’s name.
Following further consideration and discussion of the foregoing, the Board concluded that the fee paid to the Adviser by the Fund was fair and reasonable in relation to the nature and quality of the services provided by the Adviser and that they reflected charges that were within a range of what could have been negotiated at arm’s length.
The profits to be realized by the Adviser and its affiliates from the relationship with the Fund. The Trustees reviewed the Adviser’s profitability analysis in connection with its management of the Fund, and noted that the Adviser earned what the Board considered to be a reasonable profit from its relationship with the Fund. The Board concluded that the Adviser’s profitability was not excessive.
The extent to which economies of scale would be realized as the Fund grows and whether advisory fee levels reflect those economies of scale for the benefit of the Fund’s investors. The Trustees considered that the Fund’s fee arrangements with the Adviser involved both the management fee and an Expense Limitation Agreement. The Trustees noted that, while the management fee remains the same at all asset levels, the Fund’s shareholders continue to benefit from the Fund’s expense limitation arrangement until the Fund’s assets grew to a level where the Fund’s expenses fell below the cap set by the arrangement, and the Adviser begins receiving its full fee. The Trustees also noted that the Fund’s shareholders would benefit from economies of scale under the Fund’s agreements with service providers other than the Adviser. Further, the size of the Fund has allowed the Adviser to lead additional negotiations to reduce the Fund’s fees when making investments, which, while time intensive for the Adviser, reflected significant benefits to the Fund. Following further discussion of the Fund’s current and projected asset levels, expectations for growth, and fee levels, the Board determined that the Fund’s fee arrangements were fair and reasonable in relation to the nature and quality of the services provided by the Adviser and that the Expense Limitation Agreement has provided savings for the benefit of the Fund’s investors.
Based upon all of the foregoing considerations, the Board of Trustees, including a majority of the Independent Trustees, approved the continuation of the Investment Advisory Agreement for the Fund.
Trustees Consideration and Approval of Continuation of Sub-Advisory Agreement with Aon Investments USA Inc.
Aon Investments USA Inc. (“Aon”) provides advisory services to the Fund by recommending private investment securities in which to invest to the Adviser pursuant to an Investment Sub-Advisory Agreement. At a meeting of the Fund’s Board of Trustees on June 8, 2021, the Trustees approved the continuation of the Investment Sub-Advisory Agreement for a one-year term. In considering whether to approve the Investment Sub-Advisory Agreement, the Trustees reviewed and considered the information they deemed reasonably necessary, including the following material factors: (i) the nature, extent, and quality of the services provided by Aon; (ii) the investment performance of the Fund and Aon; (iii) the costs of the services provided by Aon; (iv) the profits to be realized by Aon and its affiliates from the relationship with the Fund; (v) the extent to which economies of scale would be realized as the Fund grows and whether the advisory fee levels reflect these economies of scale for benefit of the Fund’s investors.
The nature, extent, and quality of the services provided by Aon. The Trustees evaluated Aon’s staffing, personnel, and methods of operating; the education and experience of Aon’s personnel; Aon’s compliance program, policies, and procedures; the financial condition of Aon; and the level of commitment to the Fund and Aon by the principals of Aon. The Trustees reviewed the balance sheet of Aon (specifically its parent company) and discussed the financial stability and profitability of the firm. The Trustees considered the responsibilities of Aon under the Investment Sub- Advisory Agreement and reviewed the services provided to the Fund including, without limitation, Aon’s procedures for formulating investment recommendations and assuring compliance with the Fund’s investment objectives and limitations, and efforts to promote the Fund, and grow the Fund’s assets. The Trustees noted that Aon supports the Adviser in seeking to achieve the Fund’s investment objective to generate a balanced return comprised of current income and capital appreciation with moderate volatility and low correlation to the broader markets by pursuing strategically investing across private institutional real estate investment funds. The Board also noted that Aon provides data and information utilized by the Adviser in investing across a diversified set of investment managers and strategies as well as to provide investment exposure across property types and geographies. The Trustees observed the fact that Aon had added significant experience and talent to its team through a recent acquisition. The Board noted the preliminary results of an examination of the firm and that the findings did not relate to the services provided to the Fund. After reviewing the foregoing information and further information in the memorandum from Aon (e.g., Aon’s Form ADV and descriptions of Aon’s business and compliance program), the Board concluded that the nature, extent, and quality of the services provided by Aon were satisfactory.
| 50 | 1.888.926.2688 | www.griffincapital.com |
| Griffin Institutional Access Real Estate Fund | Trustees’ Consideration and Approval of Renewal of Advisory Agreements |
| September 30, 2021 (Unaudited) |
The investment performance of the Fund and Aon. The Trustees discussed the performance of the private investments portion of the Fund. The Trustees noted the Fund’s continued strong performance in the period since inception and recalled their deliberations relating to the Adviser. The Board agreed that they should consider the performance of the Fund as a whole in reviewing this factor and noted that Adviser continued to be satisfied with Aon’s performance and the data provided.
The costs of the services to be provided by Aon. The Trustees evaluated the overall expenses of the Fund, including the nature and frequency of advisory and sub-advisory fee payments. The Trustees also considered potential benefits for Aon in managing the Fund, including promotion of Aon’s name. The Trustees noted that the Adviser paid the fee to Aon out of its management fee, agreeing that, accordingly, the Fund’s overall management fee and expenses was the appropriate vehicle to compare to other funds. The Board recalled their deliberations relating to the Adviser’s cost of services. Following further consideration and discussion of the foregoing, the Board concluded that the fees to be paid to Aon indirectly by the Fund were fair and reasonable in relation to the nature and quality of the services provided by Aon and that they reflected charges that were within a range of what could have been negotiated at arm’s length.
The profits to be realized by Aon and its affiliates from the relationship with the Fund. The Trustees reviewed Aon’s profitability analysis in connection with its management of the Fund, and noted that Aon earned what the Board considered to be a reasonable profit from its relationship with the Fund. The Board concluded that Aon’s profitability was not excessive.
The extent to which economies of scale would be realized as the Fund grows and whether the advisory fee levels reflect these economies of scale for benefit of the Fund’s investors. The Trustees considered that the Fund’s fee arrangements with Aon and noted that the sub-advisory fee contained break points, which caused the Adviser to pay lower fees to Aon based on higher asset levels. Following further discussion of the Fund’s current and projected asset levels, expectations for growth, and levels of fees, the Board determined that the Fund’s fee arrangements were fair and reasonable in relation to the nature and quality of the services provided by Aon.
Based upon all of the foregoing considerations, the Board of Trustees, including a majority of the Independent Trustees, approved the continuation of the Investment Sub-Advisory Agreement with Aon.
Trustees Consideration and Approval of Continuation of Sub-Advisory Agreement with CenterSquare Investment Management LLC
CenterSquare Investment Management LLC (“CenterSquare”) provides advisory services to the Fund by managing the portion of the Fund’s assets allocated to public real estate related securities, subject to the direction and oversight of the Adviser pursuant to an Investment Sub-Advisory Agreement. At a meeting of the Fund’s Board of Trustees on June 8, 2021, the Trustees approved the continuation of the Investment Sub-Advisory Agreement for a one-year term. In considering whether to approve the Investment Sub-Advisory Agreement, the Trustees reviewed and considered the information they deemed reasonably necessary, including the following material factors: (i) the nature, extent, and quality of the services provided by CenterSquare; (ii) the investment performance of the Fund and CenterSquare; (iii) the costs of the services provided by CenterSquare; (iv) the profits to be realized by CenterSquare and its affiliates from the relationship with the Fund; (v) the extent to which economies of scale would be realized as the Fund grows and whether the advisory fee levels reflect these economies of scale for benefit of the Fund’s investors.
(i) The nature, extent, and quality of the services provided by CenterSquare. The Trustees evaluated CenterSquare’s staffing, personnel, and methods of operating; the education and experience of CenterSquare’s personnel; CenterSquare’s compliance program, policies, and procedures; the financial condition of CenterSquare; and the level of commitment to the Fund and CenterSquare by the principals of CenterSquare. The Trustees reviewed the balance sheet of CenterSquare (specifically its parent company) and discussed the financial stability and profitability of the firm. The Trustees considered the responsibilities of CenterSquare under the Investment Sub-Advisory Agreement and reviewed the services provided to the Fund including, without limitation, CenterSquare’s procedures for formulating investment recommendations and assuring compliance with the Fund’s investment objectives and limitations, and efforts to promote the Fund, and grow the Fund’s assets. The Trustees noted that CenterSquare supports the Adviser in seeking to achieve the Fund’s investment objective to generate a balanced return comprised of current income and capital appreciation with moderate volatility and low correlation to the broader markets by investing in publicly traded, income producing, equity and certain debt real estate related securities.
After reviewing the foregoing information and further information in the memorandum from CenterSquare (e.g., CenterSquare’s Form ADV and descriptions of CenterSquare’s business and compliance program), the Board concluded that the nature, extent, and quality of the services provided by CenterSquare were satisfactory.
(ii) The investment performance of the Fund and CenterSquare. The Trustees discussed the performance of the public real estate related securities portion of the Fund. The Trustees noted the Fund’s continued strong performance in the period since inception and recalled their deliberations relating to the Adviser. The Board agreed that they should consider the performance of the Fund as a whole in reviewing this factor and noted that
| Annual Report | September 30, 2021 | 51 |
| Griffin Institutional Access Real Estate Fund | Trustees’ Consideration and Approval of Renewal of Advisory Agreements |
| September 30, 2021 (Unaudited) |
Adviser continued to be satisfied with CenterSquare’s performance. After reviewing these considerations, the Board concluded that the investment performance of CenterSquare was satisfactory.
(iii) The costs of the services to be provided by CenterSquare. The Trustees evaluated the overall expenses of the Fund, including the nature and frequency of advisory and sub-advisory fee payments. The Trustees also considered potential benefits for CenterSquare in providing services to the Fund. The Trustees noted that the Adviser paid the fee to CenterSquare out of its management fee, agreeing that, accordingly, the Fund’s overall management fee and expenses was the appropriate vehicle to compare to other funds. The Board also noted that CenterSquare represented that the sub-advisory fee being charged to the Fund was a material discount from the its standard fee schedule. The Board recalled their deliberations relating to the Adviser’s cost of services. Following further consideration and discussion of the foregoing, the Board concluded that the fees to be paid to CenterSquare by the Fund were fair and reasonable in relation to the nature and quality of the services provided by CenterSquare and that they reflected charges that were within a range of what could have been negotiated at arm’s length.
(iv) The profits to be realized by CenterSquare and its affiliates from the relationship with the Fund. The Trustees reviewed CenterSquare’s profitability analysis in connection with its management of the Fund, and noted that CenterSquare earned what the Board considered to be a reasonable profit from its relationship with the Fund. The Board concluded that CenterSquare’s profitability was not excessive.
(v) The extent to which economies of scale would be realized as the Fund grows and whether the advisory fee levels reflect these economies of scale for benefit of the Fund’s investors. The Trustees considered that the Fund’s fee arrangements with CenterSquare and noted that the sub-advisory fee contained break points, which caused the Adviser to pay lower fees to CenterSquare based on higher asset levels. Following further discussion of the Fund’s current and projected asset levels, expectations for growth, and levels of fees, the Board determined that the Fund’s fee arrangements were fair and reasonable in relation to the nature and quality of the services provided by CenterSquare.
Based upon all of the foregoing considerations, the Board of Trustees, including a majority of the Independent Trustees, approved the continuation of the Investment Sub-Advisory Agreement with CenterSquare.
| 52 | 1.888.926.2688 | www.griffincapital.com |
| Griffin Institutional Access Real Estate Fund | Trustees and Officers |
| September 30, 2021 (Unaudited) |
The business and affairs of the Fund are managed under the direction of the Trustees. Information concerning the Trustees and officers of the Fund is set forth below. Generally, each Trustee and officer serves an indefinite term or until certain circumstances such as his resignation, death, or otherwise as specified in the Fund’s organizational documents. Any Trustee may be removed at a meeting of shareholders by a vote meeting the requirements of the Fund’s organizational documents. The Statement of Additional Information of the Fund includes additional information about the Trustees and officers and is available, without charge, upon request by calling the Fund toll-free at 888-926-2688.
INDEPENDENT TRUSTEES
| Name and Birth Year | Position/Term of Office* | Principal Occupation During Past Five Years | Number of Portfolios in Fund Complex** Overseen by Trustee | Other Directorships held by Trustee During Last Five Years |
| Nathan Headrick (1974) | Trustee Since 2014 | Managing Director, BluWater Group (financial services firm), 2019 - present; Managing Director and Founder, Triloma Financial Group (private equity firm), 2013 - 2019. | 2 | Griffin Institutional Access Credit Fund, 2017 - present. |
| Robb Chapin (1962) | Trustee Since 2014 | Chief Executive Officer and Co-Chief Investment Officer, Bridge Seniors Housing Fund Manager, LLC (real estate fund management), 2013 -present. | 2 | Griffin Institutional Access Credit Fund, 2017 - present; Bridge Seniors Housing & Medical Properties Fund, LP (real estate fund), 2013 - present. |
| Ira Cohen (1959) | Trustee Since 2014 | Executive Vice President, Recognos Financial (financial data services firm), 2015 - present; and Chief Executive Officer, Ira Cohen Consulting, LLC (mutual fund operations consulting firm), 2005 - present. | 2 | Griffin Institutional Access Credit Fund, 2017 - present; Valued Advisers Trust (all series), 2010 - present; Angel Oak Financial Strategies Income Term Trust, 2018 - present; Angel Oak Strategic Credit Fund, 2017 - present; and Angel Oak Funds Trust (for all of its series), 2014 - present. |
| Annual Report | September 30, 2021 | 53 |
| Griffin Institutional Access Real Estate Fund | Trustees and Officers |
| September 30, 2021 (Unaudited) |
INTERESTED TRUSTEES AND OFFICERS
| Name and Birth Year | Position/Term of Office* | Principal Occupation During Past Five Years | Number of Portfolios in Fund Complex** Overseen by Trustee | Other Directorships held by Trustee During Last Five Years |
| Kevin Shields (1958) | President and Trustee Since 2014 | Chairman and Chief Executive Officer, Griffin Capital Company, LLC, 1995 - present; Chief Executive Officer, Griffin Capital Credit Advisor, LLC, 2017 - present; Chairman and Chief Executive Officer, Griffin Capital Securities, LLC, 1995-present; President and Director, Griffin Capital BDC Corp., 2014 - 2017; Executive Chairman, 2019 - present, Chairman of the Board of Directors, 2013 - present, and Chief Executive Officer, 2013 - 2019, Griffin Capital Essential Asset REIT, Inc. and Executive Chairman 2018 - 2019, and Chief Executive Officer, 2008 - 2018, EA 1. | 2 | President and Trustee, Griffin Institutional Access Credit Fund, 2017 - present; Chairman, Griffin Capital Company, LLC, 1995 - present; Director, EA 1, 2008 - 2018; Director, Griffin Capital Essential Asset REIT Inc., 2013 - present; Director, Griffin Capital BDC Corp., 2014 - 2017. |
| Randy Anderson (1968) | Chairman, Secretary and Trustee Since 2014 | Chief Economist, Griffin Capital Company, LLC, 2014 - present; Chief Executive Officer, Griffin Capital Asset Management Company, LLC, 2021 - present; Chief Investment Officer, Griffin Capital Advisor, LLC, 2014 - present; Chief Investment Officer, Griffin Capital Credit Advisor, LLC, 2017 - present; President, Griffin Capital Asset Management Company, LLC, 2014 - present. | 2 | Chairman, Secretary and Trustee, Griffin Institutional Access Credit Fund, 2017 - present; Executive Vice President, Griffin Capital BDC Corp., 2014 - 2017. |
| Joseph Miller (1963) | Treasurer Since 2014 | Chief Financial Officer and Chief Operating Officer, Griffin Capital Company, LLC, 2007 - present; Treasurer, Griffin Institutional Access Credit Fund, 2017 - present; and Chief Financial Officer, Griffin Capital BDC Corp., 2014 - 2017. | N/A | N/A |
| Ryan Del Giudice (1990) | Chief Compliance Officer Since 2018, Vice President and Assistant Secretary Since 2020 | Chief Compliance Officer, Griffin Capital Advisor, LLC, 2018 - present; Chief Compliance Officer, Griffin Capital Credit Advisor, LLC, 2018 - present; Chief Compliance Officer, Griffin Institutional Access Credit Fund 2018 - present; Vice President, Cipperman Compliance Services, LLC, 2015 - 2017. | N/A | N/A |
| Madeline Arment (1989) | Assistant Treasurer Since 2019 | Assistant Treasurer, Griffin Institutional Access Credit Fund; Fund Controller, ALPS Fund Services, Inc., 2018 - present; Manager of Investment Operations, Shelton Capital Management, 2016 - 2018. | N/A | N/A |
| * | The term of office for each Trustee and officer listed above will continue indefinitely. |
| ** | The term “Fund Complex” refers to the Griffin Institutional Access Real Estate Fund and the Griffin Institutional Access Credit Fund. |
| 54 | 1.888.926.2688 | www.griffincapital.com |
| Griffin Institutional Access Real Estate Fund | Service Providers |
| September 30, 2021 (Unaudited) |
Investment Adviser
Griffin Capital Advisor, LLC
Griffin Capital Plaza, 1520 East Grand Avenue, El Segundo, CA 90245
Investment Sub-Advisers
Aon Investments USA Inc.
200 East Randolph Street, Suite 1500, Chicago, IL 60601
CenterSquare Investment Management LLC
630 West Germantown Pike, Suite 300, Plymouth Meeting, PA 19462
Administrator
ALPS Fund Services, Inc.
1290 Broadway, Suite 1000, Denver, CO 80203
Custodian
UMB Bank, n.a.
1010 Grand Blvd., Kansas City, Missouri 64106
Distributor
ALPS Distributors, Inc.
1290 Broadway, Suite 1000, Denver, CO 80203
Independent Registered Public Accounting Firm
BBD, LLP
1835 Market Street, 3rd Floor, Philadelphia, PA 19103
Legal Counsel
Greenberg Traurig, LLP
Terminus 200, 3333 Piedmont Road NE, Suite 2500, Atlanta, GA 30305
Transfer Agent and DRIP Administrator
DST Systems, Inc.
330 W 9th Street, Kansas City, MO 64105
| Annual Report | September 30, 2021 | 55 |
| Griffin Institutional Access Real Estate Fund | Privacy Notice |
| September 30, 2021 (Unaudited) |
NOTICE OF PRIVACY POLICY & PRACTICES
The Griffin Institutional Access Real Estate Fund (the “Fund”) is committed to maintaining the confidentiality, integrity, and security of your nonpublic personal information (“NPI”). When you provide personal information, the Fund believes that you should be aware of policies utilized to protect the confidentiality of that information. The Fund needs to share your NPI to conduct everyday business. The following information is intended to help you understand what NPI we collect, how we protect your NPI from unauthorized access and why the Fund may share your NPI with other affiliated and non-affiliated parties.
The Fund collects the following nonpublic personal information about you:
| · | Information we receive from you on or in applications or other forms, correspondence, or conversations, including, but not limited to, your name, address, phone number, social security number, assets, income, and date of birth; and |
| · | Information about your transactions with us, our affiliates, or others, including, but not limited to, your account number and balance, payments history, parties to transactions, cost basis information, and other financial information. |
How does the Fund protect your nonpublic personal information?
To protect your nonpublic personal information from unauthorized access and use, the Fund maintains physical, electronic and procedural safeguards that comply with applicable federal and state standards. These measures include computer safeguards and secured files and buildings.
What does the Fund do with your personal information?
The Fund does not permit use of your personal information for any joint marketing or non-business purpose. Further, the Fund does not permit the disclosure of your personal information to non-affiliated parties for marketing purposes. The Fund may, however, disclose your personal information to comply with regulatory requirements, court orders or other legal requirements.
Affiliated Parties
The Fund does not disclose any nonpublic personal information about our current or former shareholders to affiliated parties, except as permitted by applicable law or regulation and as described herein. The Fund may, for example, share NPI with personnel of the Fund’s investment adviser and affiliated broker-dealer which also serves as the Fund’s exclusive wholesale marketing agent. The Fund shares NPI with its affiliates for business purposes only in an effort to service your account(s) which includes, but is not limited to, assisting in processing your transactions, inquiring about your transactions and experience, sending you shareholder reports and other information about the Fund or to otherwise provide the applicable service and maintain your account(s). The Fund’s affiliated parties that receive your NPI are required to protect your NPI, provide it only to personnel who need and use it solely for the purpose for which they received it. The Fund and its affiliated parties that receive your NPI maintain physical, electronic and procedural safeguards that comply with applicable federal and state standards to guard your NPI.
Non-Affiliated Parties
The Fund does not disclose any nonpublic personal information about our current or former shareholders to non-affiliated third parties, except as permitted by applicable law or regulation and as described herein. The Fund may share NPI with non-affiliated service providers and their employees, including the Fund’s administrator, transfer agent, distributor, proxy solicitors and legal counsel, among others. The Fund shares NPI with its non-affiliated service providers to service your account(s) including, but not limited to, processing your transactions, sending you shareholder reports and other information about the Fund or to otherwise provide the applicable service and maintain your account(s). These non-affiliated service providers are required to protect your NPI and use it solely for the purpose for which they received it. The non-affiliated service providers are required to maintain physical, electronic and procedural safeguards that comply with applicable federal and state standards to guard your NPI.
| 56 | 1.888.926.2688 | www.griffincapital.com |

Item 2. Code of Ethics.
| (a) | The Griffin Institutional Access Real Estate Fund (the “Fund”) has adopted a Code of Ethics that applies to the Fund's principal executive officer and principal financial officer. |
(b) Not applicable.
| (c) | During the period covered by this report, there were no amendments to the Fund’s Code of Ethics. |
| (d) | During the period covered by this report, the Fund had not granted any express or implicit waivers from the Code of Ethics. |
| (e) | Not applicable. |
| (f) | The Fund’s Code of Ethics is attached hereto as exhibit 13(A)(1). |
Item 3. Audit Committee Financial Expert.
The Board of Trustees (the “Board”) of the Fund has determined that the Fund has at least one audit committee financial expert serving on its Audit Committee. The Board has designated Ira Cohen as the Fund’s audit committee financial expert. Mr. Cohen is “independent” as defined in paragraph (a)(2) of Item 3 to Form N-CSR.
Item 4. Principal Accountant Fees and Services.
| (a) | Audit Fees: For the Fund’s last two fiscal years ended September 30, 2020 and September 30, 2021, the aggregate fees billed for professional services rendered by the principal accountant for the audit of the Fund’s annual financial statements or services that are normally provided by the accountant in connection with statutory and regulatory filings or engagements were $20,500 and $23,000, respectively. |
| (b) | Audit-Related Fees: For the Fund’s last two fiscal years ended September 30, 2020 and September 30, 2021, the aggregate fees billed for assurance and related services by the principal accountant that are reasonably related to the performance of the audit of the Fund’s financial statements and not otherwise reported under paragraph (a) of Item 4 of this report were $0 and $0, respectively. |
| (c) | Tax Fees: For the Fund’s last two fiscal years ended September 30, 2020 and September 30, 2021, the aggregate fees billed for professional services rendered by the principal accountant for tax compliance, tax advice and tax planning, which were comprised of the preparation of excise filings and income tax returns for the Fund were $3,000 and $3,000, respectively. |
| (d) | All Other Fees: For the Fund’s last two fiscal years ended September 30, 2020 and September 30, 2021, the aggregate fees billed for products and services other than the services reported in paragraphs (a) through (c) of Item 4 of this report, were provided by the principal accountant, $0 and $0, respectively. |
| (e) | (1) | The audit committee’s pre-approval policies and procedures require that all services to be performed by the Fund’s principal accountant must be pre-approved by the Fund’s Audit Committee. |
| (2) | No services described in paragraphs (b) through (d) of Item 4 of this report were approved by the Fund’s Audit Committee pursuant to paragraph (c)(7)(i)(C) of Rule 2-01 of Regulation S-X. |
| (f) | Not applicable to the Fund. |
| (g) | For the Fund’s last two fiscal year ended September 30, 2020 and September 30, 2021, the aggregate non-audit fees for services rendered to the Fund, the Fund’s investment adviser and any entity controlling, controlled by, or under common control with the adviser that provides ongoing services to the Fund were $3,000 and $3,000, respectively. |
| (h) | The Fund's Audit Committee has considered whether the provision of non-audit services to the Fund's investment adviser and any entity controlling, controlled by, or under common control with the investment adviser that provides ongoing services to the Fund, that were not pre-approved pursuant to paragraph (c)(7)(ii) of Rule 2-01 of Regulation S-X, is compatible with maintaining the principal accountant's independence. |
Item 5. Audit Committee of Listed Registrants.
The Fund is not a listed issuer as defined in Rule 10A-3 under the Securities Exchange Act of 1934, as amended.
Item 6. Investments.
| (a) | The schedule of investments is included as part of the Reports to Stockholders filed under Item 1 of this report. |
| (b) | Not applicable to the Fund. |
Item 7. Disclosure of Proxy Voting Policies and Procedures for Closed-End Management Investment Companies.
The proxy voting policies and procedures of Griffin Capital Advisor, LLC and CenterSquare Investment Management LLC are attached hereto as exhibit EX 99.Item 7.
Item 8. Portfolio Managers of Closed-End Management Investment Companies.
Randy I. Anderson Ph.D., CRE — Dr. Anderson serves as the Chairman of the Fund’s Board and one of the Fund’s Portfolio Managers, positions he has held since inception. Dr. Anderson has served as Chief Investment Officer and a Principal of Griffin Capital Advisor, LLC (the “Adviser”) since its formation in 2014. Dr. Anderson has also served as a member of the Investment Committee of the Adviser since its formation in 2014. Additionally, Dr. Anderson serves as the Chief Economist of Griffin Capital, a position he has held since joining Griffin Capital in 2014. In addition, Dr. Anderson serves as Chief Executive Officer of Griffin Capital Asset Management Company, LLC, and has held such position since January 2021. Dr. Anderson previously served as President of Griffin Capital Asset Management Company, LLC from 2015 to 2020.
Dr. Anderson is also the Chief Investment Officer and a Principal of Griffin Capital Credit Advisor, LLC, positions he has held since its formation in 2017. Dr. Anderson has also served as a member of the Investment Committee of Griffin Capital Credit Advisor, LLC since its formation in 2017. Dr. Anderson also serves as Chairman of the Board of Trustees of Griffin Institutional Access Credit Fund (“GIACF”), a position he has held since GIACF’s formation. Dr. Anderson has served as the Dean’s Adjunct Professor of Real Estate Capital Markets at Florida Atlantic University since 2019. From 2012 to 2013, Dr. Anderson held several senior executive positions at Bluerock Real Estate LLC, including founding partner of the Bluerock Total Income Plus Real Estate Fund, where he was the Portfolio Manager. Dr. Anderson served as the Howard Phillips Eminent Scholar Chair and Professor of Real Estate at the University of Central Florida from 2008 through 2013, where he was responsible for growing the real estate program, including the establishment of the Professional MS in Real Estate. While at the University of Central Florida, Dr. Anderson was a member of the University Foundation Investment Sub-Committee which provides investment advice for the endowment, was the academic member of the Florida Association of Realtors Education Foundation Advisory Board, and was an ex-officio board member of the Central Florida Commercial Association of Realtors. In 2007, Dr. Anderson was President, Chief Executive Officer, and founding partner of Franklin Square Capital Partners, where he helped establish, strategically organize, and capitalize the firm. From 2005 through 2007, Dr. Anderson also served as Chief Economist for CNL Financial Group as well as Divisional President for CNL Real Estate Advisors. Prior to CNL, Dr. Anderson was the Chief Economist and Director of Research for the Marcus and Millichap Company from 2002 through 2005 and Vice President of Research at Prudential Real Estate Advisors from 2001 through 2002.
Dr. Anderson is a former co-editor of the Journal of Real Estate Portfolio Management and the Journal of Real Estate Literature. Dr. Anderson received the Kinnard Young Scholar Award from the American Real Estate Society, an award which recognizes outstanding real estate scholarship for young academics, served as the Executive Director for the American Real Estate Society, was named a Homer Hoyt Fellow and a NAIOP Distinguished Fellow, and has been invited to guest lecture at leading global universities. Dr. Anderson received his B.A. in Finance from North Central College in 1991 as a Presidential Scholar and holds a Ph.D. in Finance as a Presidential Fellow from the University of Alabama, where he graduated with highest distinction in 1996.
Spencer J. Propper — Mr. Propper serves as one of the Fund’s Portfolio Managers and as Vice President and a Principal of the Adviser. Mr. Propper has served as a member of the Investment Committee of the Adviser since its formation in 2014. Mr. Propper is also the Vice President and a Principal of Griffin Capital Credit Advisor, LLC. Mr. Propper has also served as a member of the Investment Committee of Griffin Capital Credit Advisor, LLC since its formation in 2017. Additionally, Mr. Propper serves as Managing Director of Griffin Capital and Chief Operating Officer of Griffin Capital Asset Management Company, LLC. Mr. Propper joined Griffin Capital in 2014. Previously, Mr. Propper was a Director at Lakemont Group, a boutique real estate investment banking and consulting firm. Within this role, Mr. Propper provided portfolio management services to the Bluerock Total Income Plus Real Estate Fund. Additionally, at the Lakemont Group, Mr. Propper was responsible for overseeing projects for a variety of clients including pension funds, private equity firms and publicly traded real estate companies and specialized in structured finance, market analysis and strategic due diligence. Mr. Propper holds a Master of Business Administration and Bachelor of Science in Finance and Real Estate from the University of Central Florida.
Dr. Anderson and Mr. Propper receive a fixed salary, retirement plan benefits, and distributions, if any, through ownership shares in the Adviser. Dr. Anderson and Mr. Propper are also entitled to receive a discretionary bonus, based upon, among other things, the performance of the Fund and Adviser.
As of September 30, 2021, Dr. Anderson and Mr. Propper were responsible for the management of the following types of accounts in addition to the Fund:
Other Accounts By Type | Total Number of Accounts by Account Type | Total Assets By Account Type | Number of Accounts by Type Subject to a Performance Fee | Total Assets By Account Type Subject to a Performance Fee | ||||
| Registered Investment Companies | 1 | $701,017,495 | 0 | $0 | ||||
| Other Pooled Investment Vehicles | 0 | $0 | 0 | $0 | ||||
| Other Accounts | 0 | $0 | 0 | $0 |
Because the Portfolio Managers may manage assets for other registered investment companies (“Client Accounts”) or may be affiliated with such Client Accounts, there may be an incentive to favor one Client Account over another, resulting in conflicts of interest. For example, affiliates of the Adviser may, directly or indirectly, receive fees from Client Accounts that are higher than the fee the Adviser receives from the Fund. In those instances, a portfolio manager may have an incentive to favor the Client Accounts over the Fund. Notwithstanding the difference in principal investment strategies between the Fund and the Client Accounts, the Adviser has various policies and procedures that it believes are reasonably designed to address these and other conflicts of interest.
As of September 30, 2021, Dr. Anderson and Mr. Propper did not have direct beneficial ownership in Fund shares. Dr. Anderson and Mr. Propper hold minority profit interests in Griffin Capital, LLC. Griffin Capital, LLC is the indirect parent company of Griffin Capital Vertical Partners, L.P., which owns shares in the Fund totaling more than $1,000,000.
Item 9. Purchases of Equity Securities by Closed-End Management Investment Company and Affiliates Purchasers.
None.
Item 10. Submission of Matters to a Vote of Security Holders.
No changes have occurred.
Item 11. Controls and Procedures.
| (a) | Based on an evaluation of the Fund’s disclosure controls and procedures (as defined in Rule 30a-3(c) under the 1940 Act), the Fund’s principal executive officer and principal financial officer have concluded that the Fund’s disclosure controls and procedures are effective as of a date within 90 days of the filing date of this report. |
| (b) | There were no significant changes in the Fund’s internal control over financial reporting that occurred during the Fund’s last fiscal half-year that have materially affected, or are reasonably likely to materially affect, the Fund’s internal control over financial reporting. |
Item 12. Disclosure of Securities Lending Activities for Closed-End Management Investment Companies.
None.
Item 13. Exhibits.
| (a)(1) | The Fund’s Code of Ethics, which is the subject of the disclosure required by Item 2 of Form N-CSR, is attached hereto as exhibit EX 99.13(A)(1). |
| (a)(2) | Certifications required by Item 13(a)(2) of Form N-CSR are filed herewith as Exhibit 99.CERT.
|
| (a)(3) | None.
|
| (a)(4) | Not applicable. |
| (a)(5) | The proxy voting policies and procedures of the Fund’s investment adviser and investment sub-adviser are attached hereto in response to Item 7 of Form N-CSR. |
| (b) | Certifications required by Item 13(b) of Form N-CSR are filed herewith as Exhibit 99.906CERT. |
SIGNATURES
Pursuant to the requirements of the Securities Exchange Act of 1934 and the Investment Company Act of 1940, the Registrant has duly caused this report to be signed on its behalf by the undersigned, thereunto duly authorized.
GRIFFIN INSTITUTIONAL ACCESS REAL ESTATE FUND
| By: | /s/ Kevin Shields | |
| Kevin Shields | ||
| President (Principal Executive Officer) | ||
| Date: | December 6, 2021 |
Pursuant to the requirements of the Securities Exchange Act of 1934 and the Investment Company Act of 1940, this report has been signed below by the following persons on behalf of the Registrant and in the capacities and on the dates indicated.
| By: | /s/ Kevin Shields | |
| Kevin Shields | ||
| President (Principal Executive Officer) | ||
| Date: | December 6, 2021 |
| By: | /s/ Joseph Miller | |
| Joseph Miller | ||
| Treasurer (Principal Financial Officer) | ||
| Date: | December 6, 2021 |