UNITED STATES
SECURITIES AND EXCHANGE COMMISSION
WASHINGTON, D.C. 20549
FORM N-CSR
CERTIFIED SHAREHOLDER REPORT OF REGISTERED
MANAGEMENT INVESTMENT COMPANIES
811-22933
(Investment Company Act file number)
Apollo Diversified Real Estate Fund
(Exact name of registrant as specified in charter)
Apollo Global Management, Inc.
9 West 57th Street, New York
New York 10019
(Address of principal executive offices)
(212) 515-3200
(Registrant's telephone number, including area code)
ALPS Fund Services, Inc.
1290 Broadway, Suite 1000
Denver, CO 80203
(Name and address of agent for service)
Copy to:
Terrence O. Davis, Esq.
Greenberg Traurig, LLP
Terminus 200
3333 Piedmont Road, NE, Suite 2500
Atlanta, GA 30305
Date of fiscal year end: September 30
Date of reporting period: October 1, 2021 – September 30, 2022
Item 1. Reports to Stockholders.

Apollo Diversified
Real Estate Fund
Annual Report
September 30, 2022
Effective May 2, 2022, Griffin Institutional Access® Real Estate Fund was renamed Apollo Diversified Real Estate Fund.
Table of Contents
| Shareholder Letter | 3 |
| Portfolio Update | 16 |
| Schedule of Investments | 18 |
| Statement of Assets and Liabilities | 23 |
| Statement of Operations | 24 |
| Statements of Changes in Net Assets | 25 |
| Statement of Cash Flows | 27 |
| Financial Highlights | 28 |
| Notes to Financial Statements | 39 |
| Report of Independent Registered Public Accounting Firm | 48 |
| Additional Information | 49 |
| Trustees and Officers | 50 |
| Service Providers | 52 |
| Privacy Notice | 53 |
Dear Fellow Shareholders,
We are pleased to present the Apollo Diversified Real Estate Fund (the “Fund”)1 annual report. We greatly appreciate the support of our shareholders, and we seek to remain true to the Fund’s stated objective of delivering returns comprised of income and appreciation with moderate volatility and low correlation to the broader markets. Despite challenging economic conditions that have characterized most of 2022, the Fund continued to deliver impressive outperformance relative to both stocks and bonds. The Fund’s load-waived Class A shares (NASDAQ: GIREX) returned 10.76% in the one-year period ended September 30, 2022, while the S&P 500 Index and the Bloomberg U.S. Aggregate Bond Index delivered returns of -15.47% and -14.60% respectively, during the same period.2 From the Fund’s inception on June 30, 2014, through September 30, 2022, the Fund’s load-waived Class A shares generated a(n)2:
|
Randy I. Anderson, Ph.D., CRE Portfolio Manager, Apollo Diversified Real Estate Fund |

| ● | Total cumulative return of 77.78% and a 7.22% annualized return |
| ● | Sharpe ratio of 1.60 |
| ● | Standard deviation of 3.99%, which is in line with the standard deviation for the Bloomberg U.S. Aggregate Bond Index (4.12%) |
| ● | Alpha of 4.78% |
| ● | Beta of 0.15 |
The U.S. economy continued to struggle with inflation, slowing economic growth, and the associated monetary policy designed to address the same. Bottlenecks that plagued global supply chains since the start of the pandemic and elevated wage growth have contributed to year-over-year inflation levels not seen in decades. Recently, falling food and energy prices have offered a reprieve from the record high inflation prints, but elevated price levels remain relatively broad based, impacting the core components of inflation. In return, the Federal Reserve (“Fed”) has aggressively implemented tighter monetary policy in an effort to slow inflation and bring price stability to markets. The tightening financial conditions led to a modest decline in gross domestic product (GDP) during the first half of 2022. However, despite this economic contraction, labor markets remained strong with the U.S. unemployment rate at 3.5% in September of 2022.3 Market participants will be carefully watching further policy actions from the Federal Reserve and corresponding impacts on risk assets.
Commercial real estate fundamentals have remained strong, particularly within the Fund’s high-conviction sectors – multifamily, industrial, and specialty (such as life sciences and student housing) properties. These sectors generally consist of property types that benefit from secular growth trends which are fundamental, long-term and may be driven by evolving consumer behavior, demographic changes, or technological innovation. Such secular growth trends benefit from structural demand drivers that persist across macroeconomic regimes and are generally stable over time. Consistent with the broader inflation story, elevated prices for both labor and materials have made adding new supply increasingly difficult, contributing to a favorable supply and demand dynamic that has led to continued rent growth within those sectors benefitting from secular growth trends. In order to potentially capitalize on this dynamic, the Fund’s portfolio management team has been focused on actively positioning the portfolio accordingly. As of October 3, 2022, 88.23% of the Fund’s private equity real estate portfolio is allocated to high-conviction sectors.4
The multifamily sector continued to perform well, driven by healthy releasing spreads. The multifamily occupancy rate, according to CBRE Econometric Advisors, was 96.1% as of Q3 2022, well above the 15-year average national occupancy rate of 95.1%.5 Tight occupancy amidst strong demand contributed to robust growth with rents increasing 10.4% year-over-year across CBRE Econometric Advisors’ national sample of 69 markets as of Q3 2022.5 Sharp increases in mortgage rates coupled with the meteoric rise in residential home prices exhibited post-pandemic have pushed many would-be homebuyers to the rental market, potentially bolstering demand for multifamily assets. Nationally, the U.S. continues to be deeply undersupplied, with some estimates suggesting that it would take millions of new housing units to reach equilibrium.6
Past performance is not indicative of future results. Investment return and the principal value of an investment will fluctuate. Shares may be worth more or less than original cost when redeemed. Investing involves risk, including loss of principal. Fund performance based on load-waived Class A shares and does not reflect any sales charge. The maximum sales charge for Class A shares is 5.75%. If the data reflected the deduction of such charges, the performance would be lower. Performance includes reinvestment of distributions and reflects management fees and other expenses. The Fund offers multiple different classes of shares. An investment in any share class of the Fund represents an investment in the same assets of the Fund. However, the purchase restrictions, ongoing fees, expenses, and performance for each share class are different. For more information on the differences in share classes, refer to the applicable prospectus, which can be found at: www.apollodiversifiedrealestatefund.com.
Due to financial statement adjustments, performance information presented herein for the Fund differs from the Fund’s financial highlights which are prepared in accordance with U.S. GAAP. Such differences generally are attributable to valuation adjustments to certain of the Fund’s investments which are reflected in the financial statements.
3
The industrial sector remained historically strong with broad-based demand and extremely well occupied existing inventory. The national vacancy rate continued to register at a record low of 2.9% as of Q3 2022, down 70 basis points year-over-year according to data from CBRE Econometric Advisors.5 Underlying this strong occupancy at the national level, there are specific markets that remained exceptionally tight on both a relative and absolute basis. Among the leaders in occupancy are Los Angeles, Savannah, and Riverside which have vacancy rates of 0.8%, 0.1%, and 1.2% respectively.5 These conditions have led to outsized rent growth with CBRE Econometric Advisors reporting a 12.1% year-over-year increase as of Q3 2022, marking the fastest growth rate in more than 20 years.5 Year-to-date net absorption of approximately 326 million square feet continues to outpace completions of 267 million square feet during the same period ended Q3 2022, with 71.9% of new deliveries that were completed in the first half of 2022 being either preleased or presold to the ultimate occupier.5, 7 Demand for modern, well-located industrial facilities remained strong from a wide tenant base of businesses and logistics operators seeking to re-tool their supply chains in an effort to reduce both transportation costs (the highest portion of a company’s logistics spend)7 and risk associated with lost sales due to insufficient inventory levels or other supply chain bottlenecks. The continued adoption of e-commerce and omnichannel retailing remained a tailwind for industrial assets and may provide a supportive environment for increased demand and further rent growth.
The specialty sector consists of property types such as life sciences, healthcare, government buildings, and student housing. These assets are highly specialized and are often built for a specific use and have differentiated supply and demand drivers. The largest component of the Fund’s specialty allocation is within the life sciences property type and primarily consists of laboratory facilities which, in many cases, are used by research organizations across various scientific disciplines. The demand for life sciences facilities remained robust, specifically in markets across the country with large, highly educated talent pools. Lab space across the 12 largest life sciences markets in the U.S. saw rental rates increase by 5.8% quarter-over-quarter in Q2 2022 as large pharmaceutical companies continued to lease space.7 Employment growth within Biotech R&D jobs grew at a record rate of 14.0% year-over-year as of Q2 2022. This compares favorably to the broader U.S. employment market which saw expansion of 4.2% during the same period.3 The combination of robust job growth and tight vacancy in many of the top innovation clusters across the country should provide a favorable backdrop for this property type moving forward. The second largest component of the Fund’s specialty allocation is within the student housing property type. Pre-leased occupancy in August 2022 (the last full month in the pre-lease season) continued to break records with 95.7% of student housing beds at the core 175 universities tracked by RealPage being pre-leased for the Fall 2022 academic year. This marked the highest August reading on record and sits 430 bps higher than July’s record pre-leased occupancy.8 Students’ desire for a more traditional educational experience should provide a tailwind in demand for dedicated student housing assets that are in close proximity to top-tier private and public educational institutions throughout the country.
Increased leasing activity within the traditional office sector has led to a modest 1.5% year-over-year increase in rent growth as of Q3 2022 according to data from CBRE Econometric Advisors.5 Vacancy rates across most markets are still below their record highs observed during the pandemic. Office utilization remains well below pre-pandemic levels as most businesses maintain flexibility with hybrid work arrangements. The benefits of working and collaborating in person remains an attractive proposition for companies seeking to develop both a firm culture and an environment that fosters creativity and innovation. Moving forward, the office market is expected to remain bifurcated between aging, commoditized product and modern, well-amenitized assets particularly those in desirable locations.
This bifurcation in asset performance has also been observed in the retail sector with neighborhood, grocery-anchored centers faring better than malls, especially malls in secondary and tertiary markets. Overall, there has been improvement in operating fundamentals for the retail sector with the availability rate falling to 5.0% in Q3 2022, a level not seen in more than 15 years.5 Total retail employment has completely recovered from the pandemic trough and completions remain at historical lows which should aid the sector overall.3, 5 While the retail sector may remain challenged in aggregate, the combination of strong consumer demand and limited new supply has maintained the downward trajectory of availability rates and may provide for resiliency across certain segments of the retail sector moving forward.
Apollo Diversified Real Estate Fund is a closed-end interval fund. Limited liquidity is provided to shareholders only through the Fund’s quarterly repurchase offers for no less than 5% and no more than 25% of the Fund’s shares outstanding at net asset value. The Fund is suitable only for investors who can bear the risks associated with the limited liquidity of the Fund and should be viewed as a long-term investment. There is no secondary market for the Fund’s shares, and none is expected to develop.
Diversification does not eliminate the risk of experiencing investment losses. Holdings and allocations are subject to change without notice.
4
We believe dispersion in sector performance we have observed since the onset of the pandemic will persist, providing potential opportunities for active management. During the trailing one-year period ended June 30, 2022, the Fund’s private portfolio delivered 296bps of outperformance relative to the NCREIF ODCE Index.9 Further, the Fund utilizes an actively managed investment approach with the ability to invest across all four quadrants of the commercial real estate market: private equity, private debt, public equity, and public debt. This flexibility in investment mandate allows for a dynamic allocation strategy to take advantage of relative value discrepancies between public and private markets. As of the time of writing, publicly traded real estate investment trusts (REITs) are trading at significant discounts to net asset value (NAV) (73% Price/NAV as of September 30, 2022).10 Over the last 25 years, when REITs have been priced below 85% Price/NAV, they have delivered an average return of 29% over one year, and 55% over three years.11
Looking ahead to the balance of 2022, the outlook for the economy overall remains relatively opaque with uncertainty around the path of inflation and Fed policy. With the potential for further volatility, portfolio construction and downside protection are of paramount importance. We believe the Fund may offer investors an attractive alternative to traditional fixed income with lower volatility to the broader markets. The Fund’s portfolio management team remains focused on allocating to core, well leased properties in sectors with secular, rather than cyclical, demand drivers that may further grow rent. As of October 3, 2022, the Fund provides exposure to over 3,900 investments representing over $290 billion in gross property value that is 95% occupied.4 The Fund is diversified by property type, geography, and across all four quadrants of the commercial real estate opportunity set. While future economic conditions remain unclear, we believe the Fund’s exposure to high-quality commercial real estate particularly within our high-conviction sectors should continue to deliver attractive risk-adjusted returns to our investors.
We thank you for your continued confidence and support.
Sincerely,

Randy I. Anderson, Ph.D., CRE
Portfolio Manager, Apollo Diversified Real Estate Fund
5
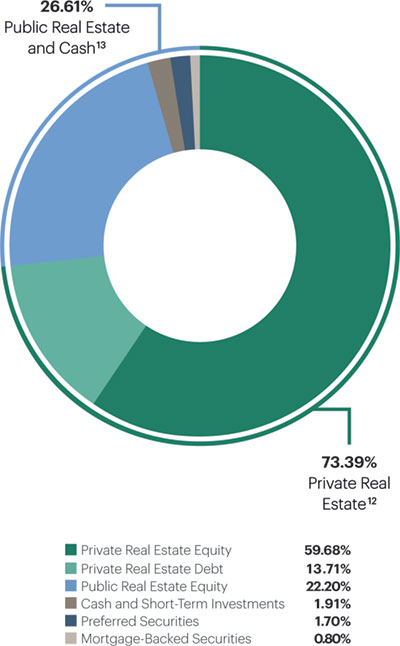
Portfolio Exposure as of October 3, 2022 (Unaudited)
Overall Portfolio Exposure
| Private Real Estate Exposure12 | 73 | % | ||
| Cortland Growth and Income Fund | 6.65 | % | ||
| Clarion Lion Properties Fund | 6.47 | % | ||
| Clarion Lion Industrial Trust | 4.59 | % | ||
| Morgan Stanley Prime Property Fund | 4.19 | % | ||
| Oaktree Real Estate Income Fund | 4.08 | % | ||
| CBRE U.S. Logistics Partners | 4.01 | % | ||
| CBRE U.S. Core Partners | 3.93 | % | ||
| Ventas Life Science and Healthcare Real Estate Fund | 3.41 | % | ||
| Clarion Gables Multifamily Trust | 3.30 | % | ||
| TA Realty Core Property Fund | 3.26 | % | ||
| TA Realty Logistics Fund | 2.89 | % | ||
| Dream US Industrial Fund | 2.39 | % | ||
| Prologis Targeted U.S. Logistics Fund | 1.92 | % | ||
| CA Student Living Income and Growth Fund | 1.77 | % | ||
| Manulife U.S. Real Estate Fund | 1.57 | % | ||
| Sentinel Real Estate Fund | 1.30 | % | ||
| USAA U.S. Government Building Fund | 1.11 | % | ||
| GWL U.S. Property Fund | 0.74 | % | ||
| Prudential PRISA | 0.72 | % | ||
| Stockbridge Smart Markets Fund | 0.61 | % | ||
| Heitman America Real Estate Trust | 0.28 | % | ||
| BGO Diversified U.S. Property Trust | 0.26 | % | ||
| UBS Trumbull Property Fund | 0.23 | % | ||
| Private Real Estate Equity | 59.68 | % | ||
| Brookfield Senior Mezzanine Real Estate Finance Fund | 2.06 | % | ||
| CBRE U.S. Credit Partners | 2.01 | % | ||
| TCM CRE Credit Fund | 2.00 | % | ||
| ARES Real Estate Enhanced Income Fund | 1.66 | % | ||
| JP Morgan U.S. Real Estate Core Mezzanine Debt Fund | 1.64 | % | ||
| Heitman Core Real Estate Debt Income Trust | 1.60 | % | ||
| PGIM Real Estate US Debt Fund | 0.98 | % | ||
| Voya Commercial Mortgage Lending Fund | 0.97 | % | ||
| CrossHarbor Strategic Debt Fund | 0.79 | % | ||
| Private Real Estate Debt | 13.71 | % | ||
| Public Real Estate Exposure and Cash13 | 27 | % | ||
| Public Real Estate Equity | 22.20 | % | ||
| Cash and Short-Term Investments | 1.91 | % | ||
| Preferred Securities | 1.70 | % | ||
| Mortgage-Backed Securities | 0.80 | % |
Portfolio Exposure as of 10/3/22
Past performance is not indicative of future results. Diversification does not eliminate the risk of experiencing investment losses. Holdings and allocations are subject to change without notice.
6
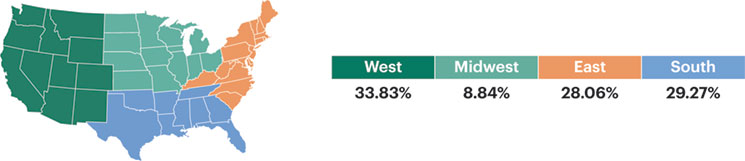
Private Fund Diversification as of October 3, 2022 (Unaudited)
Through its investment in private funds, Apollo Diversified Real Estate Fund offers immediate diversification by property sector, geography, and exposure to real estate equity and debt.
Private Real Estate Exposure: Geographic Diversification14
| Property Sector | Percentage of Total Fund Assets | Percentage of Private Fund Assets14 | Highlights14 |
| Multifamily Private Real Estate Equity Private Real Estate Debt | 26.67% 20.22% 6.45% | 36.34% 27.55% 8.79% | 757 apartment investments comprised of over 287,000 units diversified across high-growth markets. |
| Industrial Private Real Estate Equity Private Real Estate Debt | 25.25% 24.11% 1.14% | 34.40% 32.85% 1.55% | 2,177 investments boasting over 671 million square feet of industrial assets including facilities that support the fast-growing e-commerce logistics industries. |
| Specialty Private Real Estate Equity Private Real Estate Debt | 8.51% 8.33% 0.18% | 11.60% 11.35% 0.25% | 195 investments spanning over 26 million square feet of life sciences facilities, healthcare assets, and government offices, together with more than 24,000 student housing beds across the country. |
| Office Private Real Estate Equity Private Real Estate Debt | 7.59% 4.09% 3.50% | 10.34% 5.57% 4.77% | 234 high-quality office investments in diverse, high- demand metropolitan areas representing over 94 million square feet of space. |
| Other Private Real Estate Equity Private Real Estate Debt | 2.37% 1.25% 1.12% | 3.22% 1.70% 1.52% | 350 investments comprised of self-storage facilities, parking garages, and land. |
| Retail Private Real Estate Equity Private Real Estate Debt | 2.20% 1.66% 0.54% | 3.01% 2.27% 0.74% | 174 investments with more than 44 million square feet of retail space. |
| Hospitality Private Real Estate Equity Private Real Estate Debt | 0.80% 0.02% 0.78% | 1.09% 0.03% 1.06% | 24 investments representing over 6,500 keys across the country. |
Past performance is not indicative of future results. Diversification does not eliminate the risk of experiencing investment losses. Holdings and allocations are subject to change without notice.
7
Private Fund Summaries (Unaudited)
 | ARES Real Estate Enhanced Income Fund is an open-end real estate debt fund with a principal objective to generate current income with an emphasis on principal protection by creating a diversified portfolio of first mortgage loans secured by commercial real estate across major property types, which primarily includes multifamily, industrial, retail, office and hospitality properties. The ARES Real Estate Enhanced Income Fund will focus on the disciplined origination of first mortgage loans secured by commercial real estate assets with strong sponsorship and located in major markets within the United States. |
 | BGO Diversified US Property Fund is an open-end core real estate private equity fund that invests in a portfolio of institutional-quality real estate assets in the U.S. BGO Diversified’s investment strategy is focused on maintaining stable income, building a diversified modern portfolio, using moderate leverage, and providing superior liquidity. BGO Diversified upholds a strong commitment to the principles of Responsible Property Investing. |
 | Brookfield Senior Mezzanine Real Estate Finance Fund is an open-end senior real estate debt fund focused on providing primarily floating rate financing secured by commercial property primarily located in the U.S. and secured by generally well-leased/light transitional commercial real estate properties that generate significant cash flow. Brookfield Senior Mezzanine Real Estate Finance Fund will primarily focus on creating investment positions by originating floating rate whole loans, syndicating the first mortgage and retaining the mezzanine exposure. |
 | CA Student Living Income and Growth Fund is an open-end private equity real estate fund that is focused exclusively on the student housing sector. The Fund aims to acquire institutional student housing properties at large public and private universities in the United States. |
 | CBRE U.S. Core Partners is an open-end core fund that purchases and operates high-quality, income-producing office, industrial, retail, and multifamily assets in select major U.S. metropolitan markets that exhibit strong growth demographics. |
| | CBRE U.S. Credit Partners is an open-end private debt fund focused on generating current income by constructing a portfolio of first mortgage loans and subordinated debt secured by high-quality income-producing commercial real estate diversified by product type and geography. |
| | CBRE U.S. Logistics Partners is an open-end private equity real estate fund focused exclusively on the industrial sector. The Fund aims to acquire modern, highly-functional, stabilized logistics assets located in major population and consumption centers while simultaneously implementing a build-to-core strategy capitalizing on major metro markets with favorable supply and demand dynamics. |
 | Clarion Gables Multifamily Trust provides investors access to a high-quality multifamily portfolio with a best-in-class operator and fund manager. Gables is a market-leading, vertically-integrated multifamily real estate company with a 34 - year history in the management, construction, development, acquisition and disposition of multifamily communities in the United States. |
| | Clarion Lion Industrial Trust is a private REIT focused on the industrial property sector in North America. Clarion Lion Industrial Trust invests primarily in big-box warehouse and distribution centers, with an emphasis on large, core industrial markets throughout the United States. |
| | Clarion Lion Properties Fund is a core private REIT with interests in a diversified portfolio of primarily institutional quality real estate assets and related investments located throughout the U.S. The investment objective is to provide a strong income return with potential for long-term capital appreciation. |
 | Cortland Growth and Income Fund, a leading Southern United States focused multifamily owner and operator, is a domestic multifamily open-end core-plus fund focused on acquiring best-in-class, income producing properties in U.S. growth markets. |
 | CrossHarbor Strategic Debt Fund is an open-end debt fund that seeks to generate compelling risk-adjusted current and total returns for investors by originating and managing first mortgage loans secured by core, core-plus, and value-add commercial real estate located throughout the United States. |
 | Dream US Industrial Fund is an open-end private equity real estate fund focused exclusively on the industrial sector. The Fund seeks to acquire and develop a portfolio of high-quality and functional industrial assets in strategic markets throughout the United States. The Fund will target core and core-plus assets including bulk distribution, last-mile warehousing, business parks, and light industrial assets in secondary interior distribution markets with a primary focus on markets experiencing strong economic and demographic fundamentals. |
 | GWL U.S. Property Fund is an open-end real estate fund consisting of a diversified portfolio of institutional quality, income producing assets broadly allocated by property type and geographic location. GWL U.S. Property Fund employs a core plus strategy intertwined with a disciplined risk management process in seeking to achieve its performance objectives. |
 | Heitman America Real Estate Trust is an open-end core commingled fund. Heitman America Real Estate Trust’s core strategy encompasses stabilized investments with low to moderate leverage and seeks to objectively minimize risk through diversification in property type, geographic location, and tenant composition. |
| | Heitman Core Real Estate Debt Income Trust is an open-ended, commingled fund, that originates and services first mortgage loans secured by income-producing U.S. commercial real estate. Heitman Core Real Estate Debt Income Trust will seek to originate senior debt financing to high-quality real estate operators in both primary and specialty property sectors. |
Holdings are subject to change without notice.
8
 | JP Morgan U.S. Real Estate Core Mezzanine Debt Fund pursues a disciplined, income-producing strategy achieved primarily by investing in a portfolio of real estate and real estate-related assets, consisting of mezzanine debt, B-notes, ALTs by mortgages, and preferred equity investments. It focuses on the four primary property types including office, multifamily, industrial, and retail, owned and operated by experienced and financially capable sponsors with strong performance experience across investment cycles. |
 | Manulife U.S. Real Estate Fund is a U.S. open-end core-plus fund that will target properties located in major U.S. markets, with the objective of preserving capital while delivering a combination of income and long-term capital appreciation. The Manulife U.S. Real Estate Fund will target an allocation of 60% core-plus assets and 40% core investments. |
 | Morgan Stanley Prime Property Fund is an open-end core fund with a focus on office, retail, multifamily, industrial, self storage and hotel properties located in major real estate markets throughout the United States. |
 | Oaktree Real Estate Income Fund is an open-ended fund that targets investments in commercial real estate, primarily office, multifamily and industrial assets. Oaktree Real Estate Income Fund intends to create value by investing in assets that require modest leasing and capital expenditures. |
 | Prologis Targeted US Logistics Fund launched in 2004 as an open-ended, co-investment venture formed by Prologis to partner with institutional investors in acquiring, operating, and disposing of high-quality logistics facilities in key target markets across the U.S. The Fund seeks enhanced returns through actively managing, repositioning and renovating portfolio-owned assets. |
 | PGIM Real Estate U.S. Debt Fund is an open-end debt fund that seeks to originate and service first mortgage and subordinate debt, fixed and floating rate loans, secured by stable income producing properties or properties exhibiting light transitional characteristics. PGIM Real Estate U.S. Debt Fund will focus on the four main property types in the top 30 MSAs and intends to provide secure income returns from investing in a low risk, low volatility portfolio of real estate debt, with a focus on capital preservation and stability of income. |
| | Prudential PRISA is organized as a perpetual life, open-ended, commingled fund to invest primarily in core, well-leased, operating real estate assets located in the United States, with an emphasis on income. PRISA is Prudential Real Estate Investors (“PREI”) flagship fund, and represents one of the oldest and largest U.S. core real estate funds available in the marketplace. |
 | Sentinel Real Estate Fund is a multifamily focused, core private REIT that emphasizes acquisitions of stabilized assets with in-place income with the goal of providing a substantial portion of investor returns in the form of distributed cash. |
 | Stockbridge Smart Markets Fund is an open-end core fund that aims to capture performance in excess of the ODCE Index by acquiring assets in “smart markets” characterized by educated, stable and fast-growing employment bases. The Smart Market Fund’s target market strategy is based on the principle that real estate demand is dependent on jobs which are increasingly being created where there are educated work forces in the U.S. |
 | TA Realty Core Property Fund invests and operates a diversified portfolio of commercial real estate assets across industrial, multifamily, office and retail property types. TA Realty Core Property Fund has three primary objectives: build and operate a first-class portfolio of institutional quality core real estate assets, generate consistent outperformance versus industry benchmarks and provide outstanding client service to investors. |
| | TA Realty Logistics Fund is an open-end private equity real estate fund focused exclusively on the industrial sector. The Fund seeks to assemble a diversified portfolio of well-located logistics facilities in major distribution hubs and last-mile locations. The Fund targets mainly metropolitan areas of the United States that have population growth, economic growth, market economic diversity, supply constraints, liquidity, volatility, and relative yield necessary to create attractive long-term investment returns. |
 | TCM CRE Credit Fund intends to focus primarily on investing in a diversified portfolio of primarily U.S. commercial real estate debt investments, generally within the mezzanine position of the capital stack. Trawler Capital Management Commercial Real Estate Credit Fund will focus on building and maintaining a portfolio of assets that are intended to provide strong risk adjusted returns in all cycles, with emphasis on stable cash flows. |
 | UBS Trumbull Property Fund is an open-end, diversified Core fund focusing on the four main property types, with a small exposure to hotels. UBS Trumbull Property Fund focuses on top markets for high-quality Core, institutional real estate assets. |
 | USAA U.S. Government Building Fund seeks to provide investors with attractive, risk-adjusted returns generated by the acquisition, build to suit development and operation of buildings located in the United States and leased or intended to be leased to U.S. federal, state and local governments and government agencies and departments. |
 | Ventas Life Science and Healthcare Real Estate Fund is an open-ended investment vehicle formed by Ventas, Inc. to invest in high-quality healthcare properties, with a focus on the life science, medical office building, and seniors housing asset classes, in target markets primarily in the United States. The Fund’s primary objective is to generate attractive returns and cash flow with an emphasis on long-term capital growth through investment focused on the healthcare real estate sector. |
 | Voya Commercial Mortgage Lending Fund is a perpetual life, open-ended, commercial mortgage debt fund. The Fund’s investment objective is to generate consistent current income with attractive risk-adjusted returns, while seeking to preserve capital through risk management of the portfolio of commercial mortgage loans and balance sheet management at the Fund level. The Fund will seek generally to achieve its investment objective by applying disciplined credit underwriting to identify and originate a diversified pool of commercial real estate loans located throughout the U.S., in primary, secondary and select tertiary markets. |
Holdings are subject to change without notice.
9
Fund Sub-Advisers (Unaudited)
| Aon Investments USA Inc. |  |
Aon Investments USA Inc. (“Aon”), an Aon Company, provides research and advisory services to the portion of the Fund’s investment portfolio that is allocated to private real estate funds. Partnering with Aon, a global leader ($4.1 trillion in assets under advisement as of June 30, 2021) within the institutional advisory services space, provides Apollo Real Estate Fund Adviser with the same level of research and due diligence as the nation’s top endowments, universities and pension funds.
| CenterSquare Investment Management LLC |  |
CenterSquare Investment Management LLC (“CenterSquare”) manages the portion of the Fund’s investment portfolio that is allocated to public real estate securities.
CenterSquare has been managing real estate securities portfolios since 1995, across multiple strategies and market cycles and had approximately $13 billion in real estate assets under management as of September 30, 2022.
Apollo Real Estate Fund Adviser, LLC along with CenterSquare Investment Management have designed a public market strategy in line with the objectives of the Fund with a focus on identifying public real estate securities whose current prices are below their intrinsic values. CenterSquare Investment Management has been managing real estate securities portfolios since 1995 across multiple strategies and market cycles.
10
Glossary (Unaudited)
Alpha: A measure of risk-adjusted return implying how much a fund/manager outperformed its benchmark, given its risk profile.
Annualized Return: Calculated by annualizing cumulative return (i.e., adjusting it for a period of one year). Annualized return includes capital appreciation and assumes a reinvestment of dividends and distributions.
Basis Point (bp): A unit of measure used to describe the percentage change. One basis point is equivalent to 0.01% (1/100th of a percent) or 0.0001 in decimal form.
Beta: A measure of systematic risk (volatility), or the sensitivity of a fund to movements in a benchmark. A beta of 1 implies that you can expect the movement of a fund’s return series to match that of the benchmark used to measure beta. A value of less than 1 implies that the fund is less volatile than the index.
Bloomberg U.S. Aggregate Bond Index: An unmanaged index of domestic investment-grade bonds, including corporate, government and mortgage-backed securities.
Correlation: A statistical measure of how two securities move in relation to each other. A correlation ranges from -1 to 1. A positive correlation of 1 implies that as one security moves, either up or down, the other security will move in lockstep, in the same direction. A negative correlation of -1 indicates that the securities will move in the opposite direction. If the correlation is 0, the movements of the securities are said to have no correlation; they are completely random.
Cumulative Return: The compound return of an investment. It includes capital appreciation and assumes a reinvestment of dividends and distributions.
Net Asset Value (NAV): Represents a fund’s per-share price. NAV is calculated by dividing a fund’s total net assets by its number of shares outstanding.
NCREIF Fund Index – Open End Diversified Core Equity (NFI-ODCE): An index of investment returns reporting on both a historical and current basis the results of certain open-end commingled funds pursuing a core investment strategy. The NFI-ODCE Index is capitalization-weighted.
S&P 500 Index: An index based on market cap of the 500 largest companies having stock listed on the New York Stock Exchange (NYSE) or NASDAQ.
Sharpe Ratio: Measures risk-adjusted returns by calculating the excess return (above the risk-free rate) per unit of risk (standard deviation). The higher the ratio, the better the risk-adjusted returns. The average three-month U.S. Treasury T-bill auction was used as the risk-free rate in this material.
Standard Deviation: Measures the average deviations of a return series from its mean, and is often used as a measure of volatility/risk. A large standard deviation implies that there have been large swings in the return series of the manager.
11
Risk Disclosures and Other Important Information (Unaudited)
This material is neither an offer to sell nor a solicitation to purchase any security. Investors should carefully consider the investment objectives, risks, charges and expenses of Apollo Diversified Real Estate Fund (the “Fund”). This information and other important details about the Fund are contained in the prospectus, which can be obtained by visiting www.apollodiversifiedrealestatefund.com. Please read the prospectus carefully before investing.
All Morningstar calculations and metrics are based on monthly data. CALCULATIONS AND METRICS REFLECT A LOAD-WAIVED, CLASS A SHARE (NASDAQ: GIREX). Investors of the load-waived class A share do not pay a front-end sales load/charge. The Fund offers multiple different classes of shares. An investment in any share class of the Fund represents an investment in the same assets of the Fund. However, the purchase restrictions, ongoing fees, expenses, and performance for each share class are different.
Past performance is not indicative of future results. Investment return and the principal value of an investment will fluctuate. Shares may be worth more or less than original cost when redeemed. Investing involves risk, including loss of principal. Performance includes reinvestment of distributions and reflects management fees and other expenses. The Fund return does not reflect the deduction of all fees, including any applicable Fund share class sales load, third-party brokerage commissions or third-party investment advisory fees paid by investors to a financial intermediary for brokerage services. If the deduction of such fees was reflected, the performance would be lower. Returns shown do not reflect the deduction of taxes that a shareholder would pay on Fund distributions or the redemption of Fund shares. Investing in the Fund involves risks, including the risk that you may receive little or no return on your investment or that you may lose part or all of your investment. The ability of the Fund to achieve its investment objective depends, in part, on the ability of the Adviser to effectively allocate the assets of the Fund among the various securities and investments in which the Fund invests. There can be no assurance that the actual allocations will be effective in achieving the Fund’s investment objective or delivering positive returns. Current performance may be lower or higher than the performance quoted. The most recent performance is available at www.apollodiversifiedrealestatefund.com or by calling 888.926.2688.
The Fund is a closed-end interval fund, the shares have no history of public trading, nor is it intended that the shares will be listed on a public exchange at this time. No secondary market is expected to develop for the Fund’s shares. Limited liquidity is provided to shareholders only through the Fund’s quarterly repurchase offers for no less than 5% and no more than 25% of the Fund’s shares outstanding at net asset value. There is no guarantee that an investor will be able to sell all the shares that the investor desires to sell in the repurchase offer. The investment return and principal value of an investment will fluctuate so that an investor’s shares, when redeemed, may be worth more or less than the original cost. Due to these restrictions, an investor should consider an investment in the Fund to be of limited liquidity. The Fund is suitable only for investors who can bear the risks associated with the limited liquidity of the Fund and should be viewed as a long-term investment. Investing in the Fund is speculative and involves a high degree of risk, including the risks associated with leverage and the risk of a substantial loss of investment. There is no guarantee that the investment strategies will work under all market conditions. You should carefully consider which class of shares to purchase.
The Fund’s inception date was June 30, 2014. Per the Fund’s prospectus dated May 2, 2022, the total annual expense ratio is 1.98% for Class A shares. The Adviser and Fund have entered into an expense limitation agreement until at least May 31, 2023 under which the Adviser has contractually agreed to waive its fees and to pay or absorb the ordinary annual operating expenses of the Fund (including offering expenses, but excluding taxes, interest, brokerage commissions, acquired fund fees and expenses and extraordinary expenses) to the extent that they exceed 1.91% for Class A shares.
Investors in the Fund should understand that the net asset value (“NAV”) of the Fund will fluctuate, which may result in a loss of the principal amount invested. The Fund’s investments may be negatively affected by the broad investment environment and capital markets in which the Fund invests, including the real estate market, the debt market and/or the equity securities market. The value of the Fund’s investments will increase or decrease based on changes in the prices of the investments it holds. This will cause the value of the Fund’s shares to increase or decrease. The Fund is “diversified” under the Investment Company Act of 1940. Diversification does not eliminate the risk of experiencing investment losses. Holdings are subject to change without notice. The Fund is not intended to be a complete investment program.
The Fund will not invest in real estate directly, but, because the Fund will concentrate its investments in securities of REITs and other real estate industry issuers, its portfolio will be significantly impacted by the performance of the real estate market and may experience more volatility and be exposed to greater risk than a more diversified portfolio. The value of companies engaged in the real estate industry is affected by: (i) changes in general economic and market conditions; (ii) changes in the value of real estate properties; (iii) risks related to local economic conditions, overbuilding and increased competition; (iv) increases in property taxes and operating expenses; (v) changes in zoning laws; (vi) casualty and condemnation losses; (vii) variations in rental income, neighborhood values or the appeal of property to tenants; (viii) the availability of financing and (ix) changes in interest rates and leverage. The value of securities of companies in the real estate industry may go through cycles of relative underperformance and outperformance in comparison to equity securities markets in general. By investing in the Fund, a shareholder will not be deemed to be an investor in any underlying fund and will not have the ability to exercise any rights attributable to an investor in any such underlying fund related to their investment. The Fund’s investment in Private Investment Funds will require it to bear a pro rata share of the vehicles’ expenses, including management and performance fees. Also, once an investment is made in a Private Investment Fund, neither the Adviser nor any Sub-Adviser will be able to exercise control over investment decisions made by the Private Investment Fund. The Fund may invest in securities of other investment companies, including ETFs. The Fund will indirectly bear its proportionate share of any management fees and other expenses paid by investment companies in which it invests, in addition to the management fees (and other expenses) paid by the Fund.
The Fund is advised by Apollo Real Estate Fund Adviser, LLC (“AREFA”). AREFA is registered as an investment adviser with the SEC pursuant to the provisions of the 1940 Act, as amended. AREFA is an indirect majority- owned subsidiary of Apollo Global Management, Inc. The Fund’s private real estate funds allocation is sub-advised by Aon Investments USA Inc. (“Aon”), an Aon Company. Aon is registered as an investment adviser with the SEC pursuant to the provisions of the 1940 Act. The Fund’s public real estate securities allocation is sub-advised by CenterSquare Investment Management LLC (“CenterSquare”). CenterSquare is an investment adviser registered with the SEC pursuant to the provisions of the 1940 Act. Registration with the SEC does not constitute an endorsement by the SEC nor does it imply a certain level of skill or training.
This material may not be distributed, transmitted or otherwise communicated to others, in whole or in part, without the express written consent of Apollo Global Management, Inc. (together with its subsidiaries, “Apollo”).
This material has been distributed for informational purposes only and should not be considered as investment advice or a recommendation of any particular security, strategy or investment product or be relied upon for any other purpose. The views expressed represent an assessment of market conditions at a specific point in time, are opinions only and should not be relied upon as investment advice regarding a particular investment or markets in general. Such information does not constitute a recommendation to buy or sell specific securities or investment vehicles. It should not be assumed that any investment will be profitable or will equal the performance of the fund(s) or any securities or any sectors mentioned herein. Information contained herein has been obtained from sources deemed to be reliable, but not guaranteed. Apollo Global Management and its affiliates do not provide tax, legal or accounting advice. This material is not intended to provide, and should not be relied on for, tax, legal or accounting advice. You should consult your own tax, legal and accounting advisors before engaging in any transaction. This material represents views as of the date of this presentation and is subject to change without notice of any kind.
12
This annual report may contain certain forward-looking statements. Such forward-looking statements can generally be identified by our use of forward-looking terminology such as “may,” “will,” “expect,” “intend,” “anticipate,” “estimate,” “believe,” “continue,” or other similar words. Because such statements include risks, uncertainties and contingencies, actual results may differ materially from the expectations, intentions, beliefs, plans or predictions of the future expressed or implied by such forward-looking statements. These risks, uncertainties and contingencies include, but are not limited to: uncertainties relating to changes in general economic and real estate conditions; uncertainties relating to the implementation of our investment strategy; uncertainties relating to capital proceeds; and other risk factors as outlined in the Fund’s prospectus, statement of additional information, annual report and semi-annual report filed with the Securities and Exchange Commission.
During the fiscal year ending September 30, 2022, the Fund paid distributions of $289,622,285 to its investors, consisting of distributions of $110,349,489 paid and $179,272,796 that was reinvested through the Fund’s distribution reinvestment program.
During the fiscal year ending September 30, 2022, the Fund recorded dividends and distributions from the Fund’s underlying investments totaling $171,362,333, and realized gain on its investments totaling $68,575,306, and fees and expenses of $111,626,258.
The Fund’s distribution policy is to make quarterly distributions to shareholders. Shareholders should not assume that the source of a distribution from the Fund is net profit. The Fund’s most recent annualized distribution rate as of September 30, 2022 was 5.22%. A portion of the Fund’s distributions includes return of capital. Please refer to the Fund’s most recent Section 19(a) notice for an estimate of the composition of the Fund’s most recent distribution, available at www.apollodiversifiedrealestatefund.com, and the Fund’s semi-annual or annual reports filed with the U.S. Securities and Exchange Commission (the “SEC”) for additional information regarding the composition of distributions. The Fund’s distributions may be affected by numerous factors, including but not limited to changes in Fund expenses, investment performance, realized and projected market returns, fluctuations in market interest rates, and other factors. Distributions paid may exceed and, from time to time, have exceeded the Fund’s total return less fees and expenses of the Fund during some periods due to changes in market conditions affecting components of the Fund’s total return, including unrealized appreciation. Please reference the performance table below to view the Fund’s historical returns. Additionally, the Fund’s performance can always be found on the Apollo Global Management, Inc. website (www.apollo.com). The following chart presents the quarterly changes to the NAV, total return, and cumulative total return for load-waived Class A shares since inception.2 There is no assurance that the Fund’s distribution rate will be sustainable in the future nor are distributions guaranteed.
13
| Period Ending | NAV Return | Total Return | Cumulative Total Return |
6/30/14 | N/A | N/A | N/A |
| 9/30/14 | 0.44% | 1.65% | 1.65% |
| 12/31/14 | 2.11% | 3.40% | 5.10% |
| 3/31/15 | 0.98% | 2.28% | 7.50% |
| 6/30/15 | -1.24% | 0.06% | 7.56% |
| 9/30/15 | 1.13% | 2.47% | 10.21% |
| 12/31/15 | 1.01% | 2.34% | 12.79% |
| 3/31/16 | 1.00% | 2.33% | 15.42% |
| 6/30/16 | 0.95% | 2.28% | 18.05% |
| 9/30/16 | -0.04% | 1.28% | 19.57% |
| 12/31/16 | -0.26% | 1.05% | 20.83% |
| 3/31/17 | -0.15% | 1.17% | 22.24% |
| 6/30/17 | 0.26% | 1.59% | 24.18% |
| 9/30/17 | 0.00% | 1.32% | 25.83% |
| 12/31/17 | 0.90% | 2.23% | 28.64% |
| 3/31/18 | -0.97% | 0.34% | 29.08% |
| 6/30/18 | 1.24% | 2.58% | 32.41% |
| 9/30/18 | 0.11% | 1.43% | 34.31% |
| 12/31/18 | -1.04% | 0.27% | 34.67% |
| 3/31/19 | 2.10% | 3.45% | 39.33% |
| 6/30/19 | 0.15% | 1.47% | 41.38% |
| 9/30/19 | 0.40% | 1.73% | 43.82% |
| 12/31/19 | -0.11% | 1.21% | 45.56% |
| 3/31/20 | -6.70% | -5.46% | 37.61% |
| 6/30/20 | -2.63% | -1.34% | 35.77% |
| 9/30/20 | 0.00% | 1.33% | 37.57% |
| 12/31/20 | 1.41% | 2.76% | 41.37% |
| 3/31/21 | 2.07% | 3.42% | 46.20% |
| 6/30/21 | 3.66% | 5.04% | 53.56% |
| 9/30/21 | 3.15% | 4.52% | 60.51% |
| 12/31/21 | 7.21% | 8.62% | 74.35% |
| 3/31/22 | 2.85% | 4.21% | 81.69% |
| 6/30/22 | -0.92% | 0.38% | 82.39% |
| 9/30/22 | -3.80% | -2.53% | 77.78% |
14
| 1. | Effective May 2, 2022, Griffin Institutional Access® Real Estate Fund has been renamed Apollo Diversified Real Estate Fund. |
| 2. | Past performance is not indicative of future results. Investment return and the principal value of an investment will fluctuate. Shares may be worth more or less than original cost when redeemed. Investing involves risk, including loss of principal. Performance source: Morningstar Direct. Performance includes reinvestment of distributions and reflects management fees and other expenses. The Fund return does not reflect the deduction of all fees, including any applicable Fund share class sales load, third-party brokerage commissions or third-party investment advisory fees paid by investors to a financial intermediary for brokerage services. If the deduction of such fees was reflected, the performance would be lower. Returns shown do not reflect the deduction of taxes that a shareholder would pay on Fund distributions or the redemption of Fund shares. Current performance may be lower or higher than the performance quoted. The most recent performance is available at www.apollodiversifiedrealestatefund.com or by calling 888.926.2688. As of 9/30/22, the Fund’s load-waived, Class A share had a one-year return of 10.76% and a five-year annualized return of 7.16%, the S&P 500 Index had a one-year return of -15.47% and a five-year annualized return of 9.24%, and the Bloomberg U.S. Aggregate Bond Index had a one-year return of -14.60% and a five-year annualized return of -0.27%. Alpha and beta calculation benchmark: S&P 500 Index. Assets and securities contained within indices are different than the assets and securities contained in Apollo Diversified Real Estate Fund and will therefore have different risk and reward profiles. An investment cannot be made in an index, which is unmanaged and has returns that do not reflect any trading, management or other costs. There are limitations when comparing the Apollo Diversified Real Estate Fund to indices. Many open-end funds which track these indices offer daily liquidity, while closed-end interval funds offer liquidity on a periodic basis. Deteriorating general market conditions will reduce the value of stock securities. Fixed income risks include interest-rate and credit risk, bond values fluctuate in price so the value of your investment can go down depending on market conditions. Real estate securities and debt obligations may decline because of adverse developments affecting the real estate industry and real property values. |
| 3. | Bureau of Labor Statistics; U.S. Department of Labor. |
| 4. | Fund holdings as of October 3, 2022. Fund size based on Gross Asset Value (GAV). Occupancy calculation is based on the Fund’s allocation to private real estate equity funds. Occupancy is the rate of which underlying properties are occupied, typically through leases. Fund holdings are subject to change without notice. Diversification does not eliminate the risk of experiencing investment losses. The Fund is not intended to be a complete investment program. |
| 5. | CBRE Econometric Advisors. |
| 6. | Freddie Mac. |
| 7. | CBRE Research. |
| 8. | Real Page Market Analytics. |
| 9. | Apollo Analysts, NCREIF-ODCE Net Index. |
| 10. | BofA Securities. |
| 11. | Apollo Analysts, CenterSquare, BofA Securities, Morningstar Direct. Past performance is not indicative of future results. |
| 12. | Represents the Fund’s direct holdings in private funds in which the underlying holdings of each respective private fund generally consist of real estate-related interests that are not publicly traded. Holdings and allocations are subject to change without notice. |
| 13. | Represents (i) the Fund’s direct holdings in publicly traded, real estate-related securities; (ii) the Fund’s holdings in private funds and registered investment companies in which the underlying holdings are generally publicly traded; and (iii) cash and short-term investments. Holdings and allocations are subject to change without notice. |
| 14. | Metrics express the Fund’s portfolio allocated to private funds in which the underlying holdings of such private funds generally consist of real estate-related interests that are not publicly traded as of October 3, 2022. Underlying data and statistics of the Fund’s private real estate exposure generally as of June 30, 2022, however, in limited circumstances, data for certain private funds is as of the most recent quarter end. Holdings are subject to change without notice. Diversification does not eliminate the risk of experiencing investment losses. |
15
| Apollo Diversified Real Estate Fund | Portfolio Update |
September 30, 2022 (Unaudited)
Performance (for the periods ended September 30, 2022)
| 6 Month | 1 Year | 3 Year | 5 Year | Since Inception | Inception Date | |
| Apollo Diversified Real Estate Fund – A – With Load* | -9.01% | 3.85% | 5.28% | 5.88% | 6.48% | 6/30/14 |
| Apollo Diversified Real Estate Fund – A – Without Load | -3.45% | 10.19% | 7.38% | 7.15% | 7.25% | 6/30/14 |
| Apollo Diversified Real Estate Fund – C – With Load** | -4.82% | 8.38% | 6.58% | 6.35% | 6.16% | 8/7/15 |
| Apollo Diversified Real Estate Fund – C – Without Load | -3.82% | 9.38% | 6.58% | 6.35% | 6.16% | 8/7/15 |
| Apollo Diversified Real Estate Fund – I – NAV | -3.38% | 10.45% | 7.64% | 7.41% | 7.22% | 8/7/15 |
| Apollo Diversified Real Estate Fund – M – NAV | -3.71% | 9.64% | 6.85% | 6.62% | 6.60% | 11/16/16 |
| Apollo Diversified Real Estate Fund – L – With Load*** | -7.68% | 5.24% | 5.59% | 5.97% | 6.00% | 4/24/17 |
| Apollo Diversified Real Estate Fund – L – Without Load | -3.58% | 9.93% | 7.13% | 6.89% | 6.85% | 4/24/17 |
| S&P 500® Total Return Index | -20.20% | -15.47% | 8.16% | 9.24% | 9.66% | 6/30/14 |
| Bloomberg U.S. Aggregate Bond Index | -9.22% | -14.60% | -3.26% | -0.27% | 0.83% | 6/30/14 |
| * | Adjusted for initial maximum sales charge of 5.75%. |
| ** | Adjusted for contingent deferred sales charge of 1.00%. |
| *** | Adjusted for initial maximum sales charge of 4.25%. |
The S&P 500® Total Return Index is an unmanaged index of 500 common stocks chosen for market size, liquidity and industry group representation. It is a market-value weighted index. The index is not actively managed and does not reflect any deduction for fees, expenses or taxes.
The Bloomberg U.S. Aggregate Bond Index measures the performance of the U.S. investment grade bond market.
Past performance is not indicative of future results. Investment return and the principal value of an investment will fluctuate. Shares may be worth more or less than original cost when redeemed. Investing involves risk, including loss of principal. Fund performance includes reinvestment of distributions and reflects management fees and other expenses. The Fund return does not reflect the deduction of all fees, including third-party brokerage commissions or third-party investment advisory fees paid by investors to a financial intermediary for brokerage services. If the deduction of such fees was reflected, the performance would be lower. Returns shown do not reflect the deduction of taxes that a shareholder would pay on Fund distributions or the redemption of Fund shares. Current performance may be lower or higher than the performance quoted. The most recent performance is available at www.apollodiversifiedrealestatefund.com or by calling 888.926.2688. An investment cannot be made in an index, which is unmanaged and has returns that do not reflect any trading, management or other costs. Index performance does not represent actual Fund or portfolio performance, nor does it represent actual performance of the Fund’s Adviser or sub-advisers.
Class A shares are offered subject to a maximum sales charge of 5.75% of the offering price. Class L shares are offered subject to a maximum sales charge of 4.25% of the offering price. Class C, Class I and Class M shares are offered at net asset value. Class C shares may be subject to a 1.00% contingent deferred sales charge on shares redeemed during the first 365 days after their purchase. The Fund’s investment adviser has contractually agreed to waive its fees and to pay or absorb the ordinary annual operating expenses of the Fund (including offering expenses, but excluding taxes, interest, brokerage commissions, acquired fund fees and expenses and extraordinary expenses), to the extent that they exceed 1.91%, 2.66%, 1.66%, 2.41% and 2.16% per annum of the Fund’s average daily net assets attributable to Class A, Class C, Class I, Class M and Class L shares, respectively. The Expense Limitation Agreement will remain in effect for Class A, Class C, Class I, Class L and Class M shares, unless and until the Fund's Board of Trustees (the "Board") approves its modification or termination. Per the Fund's most recent prospectus, the total expense ratio after recoupment, if applicable, is 1.98%, 2.73%, 1.73%, 2.47%, and 2.21% for Class A, Class C, Class I, Class M and Class L, respectively. Please review the Fund’s Prospectus for more details regarding the Fund’s fees and expenses. No assurances can be given that the Fund will pay a distribution in the future; or, if any such distribution is paid, the amount or rate of the distribution.
| 16 | 1.888.926.2688 | www.apollo.com |
| Apollo Diversified Real Estate Fund | Portfolio Update |
September 30, 2022 (Unaudited)
Performance of $10,000 Initial Investment (as of September 30, 2022)

The graph shown above represents historical performance of a hypothetical investment of $10,000 in the Fund since inception. Past performance is not indicative of future results. Investment return and the principal value of an investment will fluctuate. Shares may be worth more or less than original cost when redeemed. Investing involves risk, including loss of principal. Fund performance includes reinvestment of distributions and reflects management fees and other expenses. The Fund return does not reflect the deduction of all fees, including third-party brokerage commissions or third-party investment advisory fees paid by investors to a financial intermediary for brokerage services. If the deduction of such fees was reflected, the performance would be lower. Returns shown do not reflect the deduction of taxes that a shareholder would pay on Fund distributions or the redemption of Fund shares. The most recent performance is available at www.apollodiversifiedrealestatefund.com or by calling 888.926.2688. An investment cannot be made in an index, which is unmanaged and has returns that do not reflect any trading, management or other costs. Index performance does not represent actual Fund or portfolio performance, nor does it represent actual performance of the Fund’s Adviser or sub-advisers.
Sector Allocation (as a % of Net Assets)
| Private Investment Funds | 78.25% |
| Publicly Traded Securities | 22.54% |
| Preferred Stocks | 1.73% |
| Short Term Investments | 0.01% |
| Liabilities in Excess of Other Assets | -2.53% |
| Total | 100.00% |
| Annual Report | September 30, 2022 | 17 |
| Apollo Diversified Real Estate Fund | Schedule of Investments |
| September 30, 2022 |
| Description | Shares | Value (Note 2) | ||||||
| REAL ESTATE INVESTMENT TRUSTS (100.79%)(a) | ||||||||
| Private Investment Funds (78.25%)* | ||||||||
| Ares Real Estate Enhanced Income Fund, L.P. | N/A | $ | 100,583,854 | |||||
| BGO Diversified US Property Fund, L.P. | 5,252 | 16,577,182 | ||||||
| Brookfield Senior Mezzanine Real Estate Finance Fund | 125,384 | 127,153,578 | ||||||
| CA Student Living Income and Growth Fund | 85,518 | 111,403,883 | ||||||
| CBRE U.S. Core Partners, L.P. | 118,589,710 | 247,688,013 | ||||||
| CBRE U.S. Credit Partners, L.P. | 118,171 | 125,648,341 | ||||||
| CBRE U.S. Logistics Partners, L.P. | 186,538,435 | 248,127,709 | ||||||
| Clarion Gables Multifamily Trust, L.P. | 88,035 | 172,519,534 | ||||||
| Clarion Lion Industrial Trust, L.P. | 70,092 | 295,690,862 | ||||||
| Clarion Lion Properties Fund, L.P. | 200,008 | 410,123,634 | ||||||
| Cortland Growth and Income Fund, L.P. | 282,858 | 488,878,375 | ||||||
| CrossHarbor Strategic Debt Fund, L.P. | N/A | 56,766,103 | ||||||
| Dream U.S. Industrial Fund, L.P. | 87,224 | 149,204,332 | ||||||
| GWL U.S. Property Fund, L.P. | N/A | 46,892,896 | ||||||
| Heitman America Real Estate Trust, L.P. | 11,138 | 17,664,979 | ||||||
| Heitman Core Real Estate Debt Income Trust | 98,436 | 99,002,514 | ||||||
| JPM U.S. Real Estate Mezzanine Debt Fund, L.P. | 975,832 | 101,407,200 | ||||||
| Manulife U.S. Real Estate Fund, L.P. | 54,385 | 106,299,052 | ||||||
| Morgan Stanley Prime Property Fund | 10,956 | 257,123,394 | ||||||
| Oaktree Real Estate Income Fund, L.P. | N/A | 249,372,021 | ||||||
| PGIM Real Estate US Debt Fund, L.P. | 44,692 | 60,718,106 | ||||||
| Principal Real Estate Liquid Debt Fund, L.P. | 2,176,607 | 49,177,843 | ||||||
| PRISA, L.P. | 18,164 | 44,208,454 | ||||||
| Prologis Targeted U.S. Logistics Fund, L.P. | 35,080 | 117,523,465 | ||||||
| Sentinel Real Estate Fund, L.P. | 627 | 82,957,522 | ||||||
| Stockbridge Smart Markets Fund, L.P. | 17,807 | 37,617,088 | ||||||
| TA Realty Core Property Fund, L.P. | 125,724 | 202,983,154 | ||||||
| TA Realty Logistics Fund, L.P. | 144,334 | 180,691,098 | ||||||
| TCM CRE Credit Fund, L.P. | 122,263 | 122,433,054 | ||||||
| UBS Trumbull Property Fund | 1,214 | 14,477,129 | ||||||
| USAA US Government Building Fund, LLC | N/A | 69,700,348 | ||||||
| Ventas Life Science and Healthcare Real Estate Fund | 155,111 | 213,300,358 | ||||||
| Voya Commercial Mortgage Lending Fund, L.P. | N/A | 59,511,100 | ||||||
| 4,683,426,175 | ||||||||
| Publicly Traded Securities (22.54%) | ||||||||
| Acadia Realty Trust | 986,806 | 12,453,492 | ||||||
| Agree Realty Corp. | 488,470 | 33,010,803 | ||||||
| Alexandria Real Estate Equities, Inc. | 181,317 | 25,418,830 | ||||||
| American Homes 4 Rent, Class A | 1,114,754 | 36,575,079 | ||||||
| Americold Realty Trust, Inc. | 675,109 | 16,607,681 | ||||||
| Apartment Investment & Management Co., Class A | 248,791 | 1,816,174 | ||||||
| Apple Hospitality REIT, Inc. | 572,527 | 8,049,730 | ||||||
| AvalonBay Communities, Inc. | 267,160 | 49,208,200 | ||||||
| Boston Properties, Inc. | 25,830 | 1,936,475 | ||||||
| Brixmor Property Group, Inc. | 1,671,619 | 30,874,803 | ||||||
| Broadstone Net Lease, Inc., Class A | 1,112,352 | 17,274,827 | ||||||
| Cousins Properties, Inc. | 564,251 | 13,175,261 | ||||||
| DiamondRock Hospitality Co. | 208,348 | 1,564,693 | ||||||
| Digital Realty Trust, Inc. | 501,130 | 49,702,073 | ||||||
| Douglas Emmett, Inc. | 396,999 | 7,118,192 | ||||||
| 18 | 1.888.926.2688 | www.apollo.com |
| Apollo Diversified Real Estate Fund | Schedule of Investments |
| September 30, 2022 |
| Description | Shares | Value (Note 2) | ||||||
| Publicly Traded Securities (continued) | ||||||||
| Duke Realty Corp. | 759,618 | $ | 36,613,588 | |||||
| Equinix, Inc. | 131,434 | 74,764,916 | ||||||
| Equity Residential | 788,372 | 52,994,366 | ||||||
| Essex Property Trust, Inc. | 48,100 | 11,651,263 | ||||||
| Extra Space Storage, Inc. | 104,225 | 18,000,700 | ||||||
| First Industrial Realty Trust, Inc. | 628,106 | 28,145,430 | ||||||
| Four Corners Property Trust, Inc. | 413,220 | 9,995,792 | ||||||
| Gaming and Leisure Properties, Inc. | 160,448 | 7,098,220 | ||||||
| Healthpeak Properties, Inc. | 898,490 | 20,593,391 | ||||||
| Highwoods Properties, Inc. | 299,180 | 8,065,893 | ||||||
| Host Hotels & Resorts, Inc. | 359,610 | 5,710,607 | ||||||
| Invitation Homes, Inc. | 1,687,253 | 56,978,534 | ||||||
| JBG SMITH Properties | 543,063 | 10,090,111 | ||||||
| Kilroy Realty Corp. | 589,300 | 24,815,423 | ||||||
| Life Storage, Inc. | 315,653 | 34,961,726 | ||||||
| Medical Properties Trust, Inc. | 1,789,119 | 21,218,951 | ||||||
| Mid-America Apartment Communities, Inc. | 160,538 | 24,894,628 | ||||||
| Omega Healthcare Investors, Inc. | 226,711 | 6,685,707 | ||||||
| Outfront Media, Inc. | 679,762 | 10,325,585 | ||||||
| Park Hotels & Resorts, Inc. | 645,765 | 7,271,314 | ||||||
| Prologis, Inc. | 897,109 | 91,146,273 | ||||||
| Public Storage | 265,300 | 77,682,493 | ||||||
| Realty Income Corp. | 739,110 | 43,016,202 | ||||||
| Regency Centers Corp. | 259,530 | 13,975,690 | ||||||
| Rexford Industrial Realty, Inc. | 508,344 | 26,433,888 | ||||||
| RPT Realty | 1,311,431 | 9,914,418 | ||||||
| Ryman Hospitality Properties, Inc. | 77,940 | 5,735,605 | ||||||
| Sabra Health Care REIT, Inc. | 994,664 | 13,049,992 | ||||||
| SBA Communications Corp. | 40,978 | 11,664,388 | ||||||
| Simon Property Group, Inc. | 424,550 | 38,103,362 | ||||||
| Spirit Realty Capital, Inc. | 435,508 | 15,747,969 | ||||||
| Sun Communities, Inc. | 363,300 | 49,165,389 | ||||||
| Sunstone Hotel Investors, Inc. | 207,790 | 1,957,382 | ||||||
| UDR, Inc. | 920,127 | 38,378,497 | ||||||
| Urban Edge Properties | 675,720 | 9,014,105 | ||||||
| Ventas, Inc. | 1,291,519 | 51,880,318 | ||||||
| Veris Residential, Inc. | 895,999 | 10,187,509 | ||||||
| VICI Properties, Inc. | 605,647 | 18,078,563 | ||||||
| Welltower, Inc. | 515,670 | 33,167,894 | ||||||
| Xenia Hotels & Resorts, Inc. | 1,092,217 | 15,061,672 | ||||||
| 1,349,024,067 | ||||||||
| TOTAL REAL ESTATE INVESTMENT TRUSTS | ||||||||
| (Cost $5,042,256,820) | 6,032,450,242 | |||||||
| Description | Coupon Rate | Shares | Value (Note 2) | |||||||||
| PREFERRED STOCKS (1.73%)(b) | ||||||||||||
| Agree Realty Corp., Series A | 4.25 | % | 125,000 | 2,123,750 | ||||||||
| American Homes 4 Rent, Series G | 5.88 | % | 35,000 | 787,500 | ||||||||
| American Homes 4 Rent, Series H | 6.25 | % | 214,000 | 5,131,720 | ||||||||
| Chatham Lodging Trust, Series A | 6.63 | % | 40,177 | 832,869 | ||||||||
| Annual Report | September 30, 2022 | 19 |
| Apollo Diversified Real Estate Fund | Schedule of Investments |
| September 30, 2022 |
| Description | Coupon Rate | Shares | Value (Note 2) | |||||||||
| PREFERRED STOCKS (continued) | ||||||||||||
| DiamondRock Hospitality Co., Series A | 8.25 | % | 126,000 | $ | 3,099,600 | |||||||
| Digital Realty Trust, Inc., Series J | 5.25 | % | 77,000 | 1,653,960 | ||||||||
| Digital Realty Trust, Inc., Series K | 5.85 | % | 171,000 | 3,806,460 | ||||||||
| Digital Realty Trust, Inc., Series L | 5.20 | % | 68,500 | 1,441,925 | ||||||||
| DigitalBridge Group, Inc., Series I | 7.15 | % | 136,345 | 3,048,674 | ||||||||
| DigitalBridge Group, Inc., Series J | 7.13 | % | 47,000 | 1,065,020 | ||||||||
| EPR Properties, Series G | 5.75 | % | 149,000 | 2,673,060 | ||||||||
| Federal Realty Investment Trust, Series C | 5.00 | % | 167,000 | 3,495,310 | ||||||||
| Hersha Hospitality Trust, Series C | 6.88 | % | 135,000 | 2,713,500 | ||||||||
| Hersha Hospitality Trust, Series D | 6.50 | % | 64,287 | 1,202,810 | ||||||||
| Hudson Pacific Properties, Inc., Series C | 4.75 | % | 194,000 | 3,237,860 | ||||||||
| Kimco Realty Corp., Series L | 5.13 | % | 32,658 | 688,431 | ||||||||
| Kimco Realty Corp., Series M | 5.25 | % | 162,000 | 3,478,140 | ||||||||
| National Storage Affiliates Trust, Series A | 6.00 | % | 198,000 | 4,439,160 | ||||||||
| Pebblebrook Hotel Trust, Series E | 6.38 | % | 166,000 | 3,436,200 | ||||||||
| Pebblebrook Hotel Trust, Series F | 6.30 | % | 39,000 | 738,660 | ||||||||
| Pebblebrook Hotel Trust, Series G | 6.38 | % | 69,000 | 1,290,300 | ||||||||
| Pebblebrook Hotel Trust, Series H | 5.70 | % | 89,000 | 1,499,650 | ||||||||
| PS Business Parks, Inc., Series Z | 4.88 | % | 145,000 | 1,979,250 | ||||||||
| Public Storage, Series F | 5.15 | % | 30,000 | 654,600 | ||||||||
| Public Storage, Series G | 5.05 | % | 88,205 | 1,905,228 | ||||||||
| Public Storage, Series H | 5.60 | % | 84,750 | 2,029,762 | ||||||||
| Public Storage, Series J | 4.70 | % | 25,000 | 510,500 | ||||||||
| Public Storage, Series L | 4.63 | % | 165,000 | 3,324,750 | ||||||||
| Rexford Industrial Realty, Inc., Series B | 5.88 | % | 112,000 | 2,602,880 | ||||||||
| Rexford Industrial Realty, Inc., Series C | 5.63 | % | 106,789 | 2,368,580 | ||||||||
| Saul Centers, Inc., Series D | 6.13 | % | 125,000 | 2,653,750 | ||||||||
| Saul Centers, Inc., Series E | 6.00 | % | 73,487 | 1,553,515 | ||||||||
| Seritage Growth Properties, Series A | 7.00 | % | 73,359 | 1,651,318 | ||||||||
| SITE Centers Corp., Series A | 6.38 | % | 212,000 | 4,320,560 | ||||||||
| SL Green Realty Corp., Series I | 6.50 | % | 114,000 | 2,474,940 | ||||||||
| Spirit Realty Capital, Inc., Series A | 6.00 | % | 244,000 | 5,599,800 | ||||||||
| Summit Hotel Properties, Inc., Series E | 6.25 | % | 148,000 | 2,595,920 | ||||||||
| Summit Hotel Properties, Inc., Series F | 5.88 | % | 41,196 | 744,824 | ||||||||
| Sunstone Hotel Investors, Inc., Series H | 6.13 | % | 152,000 | 3,078,000 | ||||||||
| Sunstone Hotel Investors, Inc., Series I | 5.70 | % | 110,431 | 2,047,391 | ||||||||
| Urstadt Biddle Properties, Inc., Series H | 6.25 | % | 116,087 | 2,437,827 | ||||||||
| Urstadt Biddle Properties, Inc., Series K | 5.88 | % | 19,182 | 389,395 | ||||||||
| Vornado Realty Trust, Series L | 5.40 | % | 121,000 | 2,234,870 | ||||||||
| Vornado Realty Trust, Series M | 5.25 | % | 70,000 | 1,220,100 | ||||||||
| Vornado Realty Trust, Series N | 5.25 | % | 93,000 | 1,639,590 | ||||||||
| Vornado Realty Trust, Series O | 4.45 | % | 120,000 | 1,924,800 | ||||||||
| TOTAL PREFERRED STOCKS | ||||||||||||
| (Cost $120,240,302) | 103,826,709 | |||||||||||
| 20 | 1.888.926.2688 | www.apollo.com |
| Apollo Diversified Real Estate Fund | Schedule of Investments |
| September 30, 2022 |
| 7-Day Yield | Shares | Value (Note 2) | ||||||||||
| SHORT TERM INVESTMENT (0.01%) | ||||||||||||
| MSILF Treasury Portfolio | 2.77 | % | 498,555 | $ | 498,555 | |||||||
| TOTAL SHORT TERM INVESTMENT | ||||||||||||
| (Cost $498,555) | 498,555 | |||||||||||
| TOTAL INVESTMENTS (102.53%) | ||||||||||||
| (Cost $5,162,995,677) | $ | 6,136,775,506 | ||||||||||
| Liabilities in Excess of Other Assets (-2.53%) | (151,312,576 | ) | ||||||||||
| NET ASSETS (100.00%) | $ | 5,985,462,930 | ||||||||||
| (a) | A portion of these securities are held as collateral for the outstanding Lines of Credit. At September 30, 2022 outstanding collateral amounted to $5,456,125,895. |
| (b) | These securities have no contractual maturity date, are not redeemable and contractually pay an indefinite stream of dividends. |
Common Abbreviations:
LLC - Limited Liability Company
L.P.- Limited Partnership
REIT - Real Estate Investment Trust
| Annual Report | September 30, 2022 | 21 |
| Apollo Diversified Real Estate Fund | Schedule of Investments |
| September 30, 2022 |
| * | Additional Information on Investments in Private Investment Funds: |
| Value | Fund Name | Redemption Frequency | Redemption Notice (Days) | Unfunded Commitment as of September 30, 2022 | |||||||||
| $ | 100,583,854 | Ares Real Estate Enhanced Income Fund, L.P. | Quarterly | 90 | $ | 0 | |||||||
| 16,577,182 | BGO Diversified US Property Fund, L.P. | Quarterly | N/A** | 0 | |||||||||
| 127,153,578 | Brookfield Senior Mezzanine Real Estate Finance Fund | Quarterly | 90 | 0 | |||||||||
| 111,403,883 | CA Student Living Income and Growth Fund | Quarterly | 90 | 0 | |||||||||
| 247,688,013 | CBRE U.S. Core Partners, L.P. | Quarterly | 60 | 0 | |||||||||
| 125,648,341 | CBRE U.S. Credit Partners, L.P. | Quarterly | 60 | 0 | |||||||||
| 248,127,709 | CBRE U.S. Logistics Partners, L.P. | Quarterly | 90 | 0 | |||||||||
| 172,519,534 | Clarion Gables Multifamily Trust, L.P. | Quarterly | 90 | 35,000,000 | |||||||||
| 295,690,862 | Clarion Lion Industrial Trust, L.P. | Quarterly | 90 | 0 | |||||||||
| 410,123,634 | Clarion Lion Properties Fund, L.P. | Quarterly | 90 | 0 | |||||||||
| 488,878,375 | Cortland Growth and Income Fund, L.P. | Quarterly | 90 | 0 | |||||||||
| 56,766,103 | CrossHarbor Strategic Debt Fund, L.P. | Quarterly | 90 | 0 | |||||||||
| 149,204,332 | Dream U.S. Industrial Fund, L.P. | Quarterly | 60 | 35,000,000 | |||||||||
| 46,892,896 | GWL U.S. Property Fund, L.P. | Quarterly | 90 | 0 | |||||||||
| 17,664,979 | Heitman America Real Estate Trust, L.P. | Quarterly | 90 | 0 | |||||||||
| 99,002,514 | Heitman Core Real Estate Debt Income Trust | Quarterly | 90 | 0 | |||||||||
| 101,407,200 | JPM U.S. Real Estate Mezzanine Debt Fund, L.P. | Quarterly | 60 | 0 | |||||||||
| 106,299,052 | Manulife U.S. Real Estate Fund, L.P. | Quarterly | 60 | 0 | |||||||||
| 257,123,394 | Morgan Stanley Prime Property Fund | Quarterly | 90 | 0 | |||||||||
| 249,372,021 | Oaktree Real Estate Income Fund, L.P. | Quarterly | 90 | 0 | |||||||||
| 60,718,106 | PGIM Real Estate US Debt Fund, L.P. | Quarterly | 90 | 0 | |||||||||
| 49,177,843 | Principal Real Estate Liquid Debt Fund, L.P. | Monthly | 10 | 0 | |||||||||
| 44,208,454 | PRISA, L.P. | Quarterly | 90 | 0 | |||||||||
| 117,523,465 | Prologis Targeted U.S. Logistics Fund, L.P. | Quarterly | 90 | 0 | |||||||||
| 82,957,522 | Sentinel Real Estate Fund, L.P. | Quarterly | N/A** | 0 | |||||||||
| 37,617,088 | Stockbridge Smart Markets Fund, L.P. | Quarterly | 45 | 40,000,000 | |||||||||
| 202,983,154 | TA Realty Core Property Fund, L.P. | Quarterly | 45 | 0 | |||||||||
| 180,691,098 | TA Realty Logistics Fund, L.P. | Quarterly | 45 | 0 | |||||||||
| 122,433,054 | TCM CRE Credit Fund, L.P. | Quarterly | 90 | 0 | |||||||||
| 14,477,129 | UBS Trumbull Property Fund | Quarterly | 60 | 0 | |||||||||
| 69,700,348 | USAA US Government Building Fund, LLC | Quarterly | 60 | 0 | |||||||||
| 213,300,358 | Ventas Life Science and Healthcare Real Estate Fund | Quarterly | 90 | 50,000,000 | |||||||||
| 59,511,100 | Voya Commercial Mortgage Lending Fund, L.P. | Quarterly | 90 | 0 | |||||||||
| $ | 4,683,426,175 | $ | 160,000,000 | ||||||||||
| ** | Written notice required for redemption, no minimum timeline required. |
See Notes to Financial Statements.
| 22 | 1.888.926.2688 | www.apollo.com |
| Apollo Diversified Real Estate Fund | Statement of Assets and Liabilities |
| September 30, 2022 |
| ASSETS | ||||
| Investments, at fair value (Cost $5,162,995,677) | $ | 6,136,775,506 | ||
| Dividend receivable | 19,930,306 | |||
| Receivable for shares sold | 7,758,337 | |||
| Cash | 5,931,609 | |||
| Receivable for investments sold | 3,475,490 | |||
| Prepaid expenses and other assets | 376,331 | |||
| Total Assets | 6,174,247,579 | |||
| LIABILITIES | ||||
| Payable for lines of credit (Note 6) | 172,750,000 | |||
| Payable for investment advisory fees (Note 3) | 7,477,541 | |||
| Payable for investments purchased | 4,743,980 | |||
| Payable for distribution fees (Note 3) | 1,279,088 | |||
| Payable for lines of credit interest (Note 6) | 706,523 | |||
| Payable for shareholder servicing fees (Note 3) | 298,846 | |||
| Payable for legal fees | 225,712 | |||
| Payable for administration fees (Note 3) | 157,626 | |||
| Payable for transfer agency fees (Note 3) | 126,321 | |||
| Payable for compliance service fees (Note 3) | 120,509 | |||
| Payable for custody fees | 49,379 | |||
| Payable for audit and tax fees | 28,500 | |||
| Accrued expenses and other liabilities | 820,624 | |||
| Total Liabilities | 188,784,649 | |||
| NET ASSETS | $ | 5,985,462,930 | ||
| NET ASSETS CONSIST OF | ||||
| Paid-in capital | $ | 4,862,227,314 | ||
| Total distributable earnings | 1,123,235,616 | |||
| NET ASSETS | $ | 5,985,462,930 | ||
| PRICING OF SHARES | ||||
| Class A: | ||||
| Net asset value | $ | 28.93 | ||
| Net assets | $ | 756,171,492 | ||
| Shares of beneficial interest outstanding (unlimited number of shares, no par value common stock authorized) | 26,141,537 | |||
| Maximum offering price per share ((NAV/0.9425), based on maximum sales charge of 5.75% of the offering price) | $ | 30.69 | ||
| Class C: | ||||
| Net asset value and maximum offering price | $ | 27.44 | ||
| Net assets | $ | 572,527,651 | ||
| Shares of beneficial interest outstanding (unlimited number of shares, no par value common stock authorized) | 20,867,730 | |||
| Class I: | ||||
| Net asset value and maximum offering price | $ | 29.45 | ||
| Net assets | $ | 3,125,199,388 | ||
| Shares of beneficial interest outstanding (unlimited number of shares, no par value common stock authorized) | 106,105,048 | |||
| Class M: | ||||
| Net asset value and maximum offering price | $ | 28.11 | ||
| Net assets | $ | 1,430,889,813 | ||
| Shares of beneficial interest outstanding (unlimited number of shares, no par value common stock authorized) | 50,907,845 | |||
| Class L: | ||||
| Net asset value | $ | 28.58 | ||
| Net assets | $ | 100,674,586 | ||
| Shares of beneficial interest outstanding (unlimited number of shares, no par value common stock authorized) | 3,522,234 | |||
| Maximum offering price per share ((NAV/0.9575), based on maximum sales charge of 4.25% of the offering price) | $ | 29.85 | ||
See Notes to Financial Statements.
| Annual Report | September 30, 2022 | 23 |
| Apollo Diversified Real Estate Fund | Statement of Operations |
| For the Year Ended September 30, 2022 | ||||
| INVESTMENT INCOME | ||||
| Dividend Income | $ | 171,362,333 | ||
| Total Investment Income | 171,362,333 | |||
| EXPENSES | ||||
| Investment advisory fees (Note 3) | 81,598,149 | |||
| Administration fees (Note 3) | 1,641,041 | |||
| Transfer agency fees (Note 3) | 1,768,330 | |||
| Shareholder servicing fees (Note 3): | ||||
| Class A | 1,812,210 | |||
| Class C | 1,411,867 | |||
| Class L | 237,082 | |||
| Distribution fees (Note 3): | ||||
| Class C | 4,235,602 | |||
| Class M | 10,205,022 | |||
| Class L | 237,082 | |||
| Credit facility interest expense (Note 6) | 6,001,056 | |||
| Reports to shareholders and printing fees | 906,520 | |||
| Legal fees | 463,829 | |||
| Compliance service fees (Note 3) | 263,543 | |||
| Trustees' fees (Note 3) | 204,411 | |||
| Custody fees | 203,333 | |||
| State registration fees | 128,813 | |||
| Insurance fees | 101,664 | |||
| SEC registration fees | 92,563 | |||
| Audit and tax fees | 28,500 | |||
| Other expenses | 85,641 | |||
| Total Expenses | 111,626,258 | |||
| Net Investment Income | 59,736,075 | |||
| Net realized gain on investments | 68,575,306 | |||
| Net change in unrealized appreciation on investments | 319,325,681 | |||
| NET REALIZED AND UNREALIZED GAIN ON INVESTMENTS | 387,900,987 | |||
| NET INCREASE IN NET ASSETS RESULTING FROM OPERATIONS | $ | 447,637,062 | ||
See Notes to Financial Statements.
| 24 | 1.888.926.2688 | www.apollo.com |
| Apollo Diversified Real Estate Fund | Statements of Changes in Net Assets |
| For the Year Ended September 30, 2022 | For the Year Ended September 30, 2021 | |||||||
| OPERATIONS: | ||||||||
| Net investment income | $ | 59,736,075 | $ | 53,820,907 | ||||
| Net realized gain on investments and long-term capital gain distributions from investments | 68,575,306 | 120,393,155 | ||||||
| Net change in unrealized appreciation on investments | 319,325,681 | 447,149,332 | ||||||
| Net Increase in Net Assets Resulting from Operations | 447,637,062 | 621,363,394 | ||||||
| DISTRIBUTIONS TO SHAREHOLDERS: | ||||||||
| Class A | ||||||||
| From distributable earnings | (10,243,397 | ) | (9,380,559 | ) | ||||
| From return of capital | (28,083,778 | ) | (27,699,106 | ) | ||||
| Class C | ||||||||
| From distributable earnings | (8,075,248 | ) | (6,455,894 | ) | ||||
| From return of capital | (21,511,984 | ) | (19,598,666 | ) | ||||
| Class I | ||||||||
| From distributable earnings | (34,465,458 | ) | (20,787,679 | ) | ||||
| From return of capital | (110,175,752 | ) | (67,807,905 | ) | ||||
| Class M | ||||||||
| From distributable earnings | (18,749,741 | ) | (12,412,060 | ) | ||||
| From return of capital | (53,168,012 | ) | (40,664,890 | ) | ||||
| Class L | ||||||||
| From distributable earnings | (1,400,488 | ) | (1,056,223 | ) | ||||
| From return of capital | (3,748,427 | ) | (3,310,671 | ) | ||||
| Total Distributions to Shareholders | (289,622,285 | ) | (209,173,653 | ) | ||||
| BENEFICIAL INTEREST TRANSACTIONS: | ||||||||
| Class A | ||||||||
| Shares sold | 131,483,791 | 59,477,036 | ||||||
| Distributions reinvested | 22,073,114 | 21,991,597 | ||||||
| Shares redeemed | (59,176,876 | ) | (150,491,558 | ) | ||||
| Exchanged out | (85,958,713 | ) | (21,574,559 | ) | ||||
| Class C | ||||||||
| Shares sold | 80,426,769 | 33,762,465 | ||||||
| Distributions reinvested | 17,247,900 | 15,244,687 | ||||||
| Shares redeemed | (44,422,937 | ) | (74,043,072 | ) | ||||
| Exchanged out | (11,887,651 | ) | (9,465,810 | ) | ||||
| Class I | ||||||||
| Shares sold | 1,153,636,274 | 456,694,008 | ||||||
| Distributions reinvested | 80,243,043 | 45,758,339 | ||||||
| Shares redeemed | (224,476,290 | ) | (395,319,000 | ) | ||||
| Exchanged in | 99,867,186 | 36,022,495 | ||||||
| Class M | ||||||||
| Shares sold | 256,674,116 | 150,986,412 | ||||||
| Distributions reinvested | 56,209,581 | 42,142,125 | ||||||
| Shares redeemed | (56,967,573 | ) | (95,637,583 | ) | ||||
| Exchanged out | (1,216,125 | ) | (4,299,397 | ) | ||||
| Class L | ||||||||
| Shares sold | 11,705,859 | 8,810,216 | ||||||
| Distributions reinvested | 3,499,158 | 3,020,028 | ||||||
| Shares redeemed | (5,725,254 | ) | (9,391,852 | ) | ||||
| Exchanged out | (804,697 | ) | (682,729 | ) | ||||
| Net Increase in Net Assets Derived from Beneficial Interest Transactions | 1,422,430,675 | 113,003,848 | ||||||
| Net increase in net assets | 1,580,445,452 | 525,193,589 | ||||||
See Notes to Financial Statements.
| Annual Report | September 30, 2022 | 25 |
| Apollo Diversified Real Estate Fund | Statements of Changes in Net Assets |
| For the Year Ended September 30, 2022 | For the Year Ended September 30, 2021 | |||||||
| NET ASSETS: | ||||||||
| Beginning of year | 4,405,017,478 | 3,879,823,889 | ||||||
| End of year | $ | 5,985,462,930 | $ | 4,405,017,478 | ||||
| Other Information | ||||||||
| BENEFICIAL INTEREST TRANSACTIONS: | ||||||||
| Class A | ||||||||
| Beginning shares | 25,999,162 | 29,505,770 | ||||||
| Shares sold | 4,400,863 | 2,261,507 | ||||||
| Distributions reinvested | 749,773 | 843,757 | ||||||
| Shares redeemed | (1,996,174 | ) | (5,785,650 | ) | ||||
| Shares transferred out | (3,012,087 | ) | (826,222 | ) | ||||
| Net increase/(decrease) in shares outstanding | 142,375 | (3,506,608 | ) | |||||
| Ending shares | 26,141,537 | 25,999,162 | ||||||
| Class C | ||||||||
| Beginning shares | 19,411,530 | 20,802,789 | ||||||
| Shares sold | 2,835,758 | 1,332,105 | ||||||
| Distributions reinvested | 615,826 | 609,837 | ||||||
| Shares redeemed | (1,573,953 | ) | (2,961,768 | ) | ||||
| Shares transferred out | (421,431 | ) | (371,433 | ) | ||||
| Net increase/(decrease) in shares outstanding | 1,456,200 | (1,391,259 | ) | |||||
| Ending shares | 20,867,730 | 19,411,530 | ||||||
| Class I | ||||||||
| Beginning shares | 69,310,612 | 64,327,639 | ||||||
| Shares sold | 38,113,525 | 16,968,556 | ||||||
| Distributions reinvested | 2,677,065 | 1,724,150 | ||||||
| Shares redeemed | (7,422,461 | ) | (15,066,821 | ) | ||||
| Shares transferred in | 3,426,307 | 1,357,088 | ||||||
| Net increase in shares outstanding | 36,794,436 | 4,982,973 | ||||||
| Ending shares | 106,105,048 | 69,310,612 | ||||||
| Class M | ||||||||
| Beginning shares | 42,059,375 | 38,533,911 | ||||||
| Shares sold | 8,909,155 | 5,814,577 | ||||||
| Distributions reinvested | 1,960,600 | 1,648,596 | ||||||
| Shares redeemed | (1,979,038 | ) | (3,766,078 | ) | ||||
| Shares transferred out | (42,247 | ) | (171,631 | ) | ||||
| Net increase in shares outstanding | 8,848,470 | 3,525,464 | ||||||
| Ending shares | 50,907,845 | 42,059,375 | ||||||
| Class L | ||||||||
| Beginning shares | 3,227,904 | 3,161,055 | ||||||
| Shares sold | 397,211 | 338,360 | ||||||
| Distributions reinvested | 120,172 | 116,717 | ||||||
| Shares redeemed | (196,408 | ) | (361,451 | ) | ||||
| Shares transferred out | (26,645 | ) | (26,777 | ) | ||||
| Net increase in shares outstanding | 294,330 | 66,849 | ||||||
| Ending shares | 3,522,234 | 3,227,904 | ||||||
See Notes to Financial Statements.
| 26 | 1.888.926.2688 | www.apollo.com |
| Apollo Diversified Real Estate Fund | Statement of Cash Flows |
| For the Year Ended September 30, 2022 | ||||
| Operating Activities: | ||||
| Net increase in net assets resulting from operations | $ | 447,637,062 | ||
| Adjustments to reconcile net increase in net assets resulting from operations to net cash used in operating activities: | ||||
| Purchase of investments | (2,302,582,815 | ) | ||
| Proceeds from sale of investments | 1,058,874,455 | |||
| Net proceeds from short-term investments | 3,654,195 | |||
| Net realized gain on investments | (68,575,306 | ) | ||
| Net change in unrealized appreciation on investments | (319,325,681 | ) | ||
| Change in operating assets and liabilities: | ||||
| Dividend receivables | 5,923,723 | |||
| Prepaid expenses and other assets | (291,596 | ) | ||
| Payable for investment advisory fees | 2,161,262 | |||
| Payable for distribution fees | 262,290 | |||
| Payable for shareholder servicing fees | 30,296 | |||
| Payable for transfer agency fees | (246,394 | ) | ||
| Payable for lines of credit interest | 536,453 | |||
| Payable for administration fees | 41,652 | |||
| Payable for trustees' fees | (46,589 | ) | ||
| Payable for legal fees | 136,415 | |||
| Payable for audit and tax fees | 2,500 | |||
| Payable for custody fees | (2,427 | ) | ||
| Payable for compliance service fees | 89,021 | |||
| Accrued expenses and other liabilities | (7,785,645 | ) | ||
| Net cash used in operating activities | (1,179,507,129 | ) | ||
| Financing Activities: | ||||
| Cash provided by lines of credit | 33,750,000 | |||
| Proceeds from shares sold | 1,634,846,327 | |||
| Cost of shares redeemed | (390,768,930 | ) | ||
| Distributions paid to shareholders | (110,349,489 | ) | ||
| Net cash provided by financing activities | 1,167,477,908 | |||
| Cash and cash equivalents, beginning of year | $ | 17,960,830 | ||
| Cash and cash equivalents, end of year | $ | 5,931,609 | ||
| SUPPLEMENTAL DISCLOSURE OF CASH FLOW INFORMATION: | ||||
| Non-cash financing activities not included herein consist of reinvestment of distributions of: | $ | 179,272,796 | ||
| Cash paid during the year for interest from bank borrowing: | $ | 5,464,603 | ||
See Notes to Financial Statements.
| Annual Report | September 30, 2022 | 27 |
| Apollo Diversified Real Estate Fund – Class A | Financial Highlights |
For a Share Outstanding Throughout the Years Presented
For the Year Ended September 30, 2022 | For the Year Ended September 30, 2021 | For the Year Ended September 30, 2020 | For the Year Ended September 30, 2019 | For the Year Ended September 30, 2018 | ||||||||||||||||
| Net asset value, beginning of year | $ | 27.67 | $ | 24.93 | $ | 27.36 | $ | 26.94 | $ | 26.65 | ||||||||||
| INCOME FROM INVESTMENT OPERATIONS: | ||||||||||||||||||||
| Net investment income(a) | 0.35 | 0.39 | 0.38 | 0.39 | 0.38 | |||||||||||||||
| Net realized and unrealized gain/(loss) | 2.47 | 3.74 | (1.46 | ) | 1.46 | 1.32 | ||||||||||||||
| Total from investment operations | 2.82 | 4.13 | (1.08 | ) | 1.85 | 1.70 | ||||||||||||||
| DISTRIBUTIONS: | ||||||||||||||||||||
| From net investment income | (0.04 | ) | (0.15 | ) | (0.36 | ) | – | – | ||||||||||||
| From net realized gain on investments | (0.39 | ) | (0.19 | ) | – | (0.54 | ) | (0.20 | ) | |||||||||||
| Return of capital | (1.13 | ) | (1.05 | ) | (0.99 | ) | (0.89 | ) | (1.21 | ) | ||||||||||
| Total distributions(b) | (1.56 | ) | (1.39 | ) | (1.35 | ) | (1.43 | ) | (1.41 | ) | ||||||||||
| Net increase/(decrease) in net asset value | 1.26 | 2.74 | (2.43 | ) | 0.42 | 0.29 | ||||||||||||||
| Net asset value, end of year | $ | 28.93 | $ | 27.67 | $ | 24.93 | $ | 27.36 | $ | 26.94 | ||||||||||
| TOTAL RETURN(c) | 10.19 | % | 17.00 | % | (3.96 | )% | 7.05 | % | 6.54 | % | ||||||||||
| RATIOS/SUPPLEMENTAL DATA: | ||||||||||||||||||||
| Net assets, end of year (000s) | $ | 756,171 | $ | 719,324 | $ | 735,511 | $ | 879,401 | $ | 714,880 | ||||||||||
| Ratios to Average Net Assets (including interest expense) | ||||||||||||||||||||
| Ratio of expenses to average net assets excluding fee waivers and reimbursements/recoupment of previously waived fees(d) | 1.98 | % | 1.97 | % | 1.95 | % | 1.94 | % | 2.11 | % | ||||||||||
| Ratio of expenses to average net assets including fee waivers and reimbursements/recoupment of previously waived fees(d) | 1.98 | % | 1.98 | % | 1.97 | % | 1.96 | % | 2.11 | % | ||||||||||
| Ratio of net investment income to average net assets including fee waivers and reimbursements(d)(e) | 1.16 | % | 1.48 | % | 1.45 | % | 1.43 | % | 1.41 | % | ||||||||||
| Ratios to Average Net Assets (excluding interest expense) | ||||||||||||||||||||
| Ratio of expenses to average net assets excluding fee waivers and reimbursements/recoupment of previously waived fees(d) | 1.87 | % | 1.89 | % | 1.89 | % | 1.89 | % | 1.91 | % | ||||||||||
| Ratio of expenses to average net assets including fee waivers and reimbursements/recoupment of previously waived fees(d) | 1.87 | % | 1.90 | % | 1.91 | % | 1.91 | % | 1.91 | % | ||||||||||
| Ratio of net investment income to average net assets excluding fee waivers and reimbursements(d)(e) | 1.27 | % | 1.57 | % | 1.53 | % | 1.50 | % | 1.61 | % | ||||||||||
| Portfolio turnover rate | 19 | % | 42 | % | 51 | % | 22 | % | 15 | % | ||||||||||
See Notes to Financial Statements.
| 28 | 1.888.926.2688 | www.apollo.com |
| Apollo Diversified Real Estate Fund – Class A | Financial Highlights |
For a Share Outstanding Throughout the Years Presented
| (a) | Calculated using the average shares method. |
| (b) | Total distributions during a calendar year generally will be made from the Fund’s net investment income, net realized gains on investments and net unrealized gains on investments, if any. The portion of distributions paid not attributable to net investment income or net realized gains on investments, if any, is distributed from the Fund’s assets and is treated by shareholders as a nontaxable distribution (“Return of Capital”) for tax purposes. Return of capital is a tax concept, not an economic concept. The tax character of the Fund’s distributions, in isolation, does not reveal much information about whether the distributions are supported by the Fund’s returns. Reported distributions from net investment income and realized gains on investments are not an indication as to whether or not the Fund’s distributions are supported by the Fund’s returns. The Fund can have distributions from net investment income and realized capital gains in years in which it incurs an economic loss due to unrealized losses not being recognized for tax purposes. A common method in which to determine if the Fund’s distributions are supported by economic returns is to examine the Fund’s Net Asset Value (“NAV”) over the course of a year. If the Fund’s NAV has increased, the Fund will have economically earned more than it has distributed, regardless of whether such distributions are reported as being from net investment income, net realized gains on investments or return of capital. If the Fund’s NAV decreases, the Fund will have distributed more than it has economically earned or it will have incurred an economic loss. |
| (c) | Total returns are for the period indicated. Total returns would have been lower had certain expenses not been waived or recouped by the Adviser during the year. Returns shown do not reflect the deduction of taxes that a shareholder would pay on Fund distributions or the redemption of Fund shares. |
| (d) | The ratios of expenses to average net assets and net investment income to average net assets do not reflect the expenses of the underlying private real estate funds in which the Fund invests which typically range from 0.80% to 1.00% on an annual basis. However, the Fund invests in each underlying private real estate investment fund based upon the net asset value of each such fund which reflects the costs of investing in the applicable fund, including the management fee of the underlying fund and other operating expenses. The net asset value of each underlying private real estate investment fund is incorporated into the ratios described above. |
| (e) | Recognition of net investment income is affected by the timing and declaration of dividends by the underlying investments in which the Fund invests. |
See Notes to Financial Statements.
| Annual Report | September 30, 2022 | 29 |
| Apollo Diversified Real Estate Fund – Class C | Financial Highlights |
For a Share Outstanding Throughout the Years Presented
For the Year Ended September 30, 2022 | For the Year Ended September 30, 2021 | For the Year Ended September 30, 2020 | For the Year Ended September 30, 2019 | For the Year Ended September 30, 2018 | ||||||||||||||||
| Net asset value, beginning of year | $ | 26.44 | $ | 24.00 | $ | 26.54 | $ | 26.33 | $ | 26.24 | ||||||||||
| INCOME FROM INVESTMENT OPERATIONS: | ||||||||||||||||||||
| Net investment income(a) | 0.12 | 0.18 | 0.18 | 0.18 | 0.17 | |||||||||||||||
| Net realized and unrealized gain/(loss) | 2.36 | 3.59 | (1.41 | ) | 1.42 | 1.31 | ||||||||||||||
| Total from investment operations | 2.48 | 3.77 | (1.23 | ) | 1.60 | 1.48 | ||||||||||||||
| DISTRIBUTIONS: | ||||||||||||||||||||
| From net investment income | (0.03 | ) | (0.13 | ) | (0.35 | ) | – | – | ||||||||||||
| From net realized gain on investments | (0.39 | ) | (0.19 | ) | – | (0.52 | ) | (0.20 | ) | |||||||||||
| Return of capital | (1.06 | ) | (1.01 | ) | (0.96 | ) | (0.87 | ) | (1.19 | ) | ||||||||||
| Total distributions(b) | (1.48 | ) | (1.33 | ) | (1.31 | ) | (1.39 | ) | (1.39 | ) | ||||||||||
| Net increase/(decrease) in net asset value | 1.00 | 2.44 | (2.54 | ) | 0.21 | 0.09 | ||||||||||||||
| Net asset value, end of year | $ | 27.44 | $ | 26.44 | $ | 24.00 | $ | 26.54 | $ | 26.33 | ||||||||||
| TOTAL RETURN(c) | 9.38 | % | 16.13 | % | (4.68 | )% | 6.24 | % | 5.76 | % | ||||||||||
| RATIOS/SUPPLEMENTAL DATA: | ||||||||||||||||||||
| Net assets, end of year (000s) | $ | 572,528 | $ | 513,220 | $ | 499,225 | $ | 536,289 | $ | 470,711 | ||||||||||
| Ratios to Average Net Assets (including interest expense) | ||||||||||||||||||||
| Ratio of expenses to average net assets excluding fee waivers and reimbursements/recoupment of previously waived fees(d) | 2.73 | % | 2.72 | % | 2.71 | % | 2.70 | % | 2.86 | % | ||||||||||
| Ratio of expenses to average net assets including fee waivers and reimbursements/recoupment of previously waived fees (d) | 2.73 | % | 2.73 | % | 2.72 | % | 2.72 | % | 2.86 | % | ||||||||||
| Ratio of net investment income to average net assets including fee waivers and reimbursements(d)(e) | 0.41 | % | 0.72 | % | 0.71 | % | 0.68 | % | 0.66 | % | ||||||||||
| Ratios to Average Net Assets (excluding interest expense) | ||||||||||||||||||||
| Ratio of expenses to average net assets excluding fee waivers and reimbursements/recoupment of previously waived fees(d) | 2.62 | % | 2.64 | % | 2.65 | % | 2.64 | % | 2.66 | % | ||||||||||
| Ratio of expenses to average net assets including fee waivers and reimbursements/recoupment of previously waived fees(d) | 2.62 | % | 2.65 | % | 2.66 | % | 2.66 | % | 2.66 | % | ||||||||||
| Ratio of net investment income to average net assets excluding fee waivers and reimbursements(d)(e) | 0.52 | % | 0.81 | % | 0.78 | % | 0.76 | % | 0.86 | % | ||||||||||
| Portfolio turnover rate | 19 | % | 42 | % | 51 | % | 22 | % | 15 | % | ||||||||||
See Notes to Financial Statements.
| 30 | 1.888.926.2688 | www.apollo.com |
| Apollo Diversified Real Estate Fund – Class C | Financial Highlights |
For a Share Outstanding Throughout the Years Presented
| (a) | Calculated using the average shares method. |
| (b) | Total distributions during a calendar year generally will be made from the Fund’s net investment income, net realized gains on investments and net unrealized gains on investments, if any. The portion of distributions paid not attributable to net investment income or net realized gains on investments, if any, is distributed from the Fund’s assets and is treated by shareholders as a nontaxable distribution (“Return of Capital”) for tax purposes. Return of capital is a tax concept, not an economic concept. The tax character of the Fund’s distributions, in isolation, does not reveal much information about whether the distributions are supported by the Fund’s returns. Reported distributions from net investment income and realized gains on investments are not an indication as to whether or not the Fund’s distributions are supported by the Fund’s returns. The Fund can have distributions from net investment income and realized capital gains in years in which it incurs an economic loss due to unrealized losses not being recognized for tax purposes. A common method in which to determine if the Fund’s distributions are supported by economic returns is to examine the Fund’s Net Asset Value (“NAV”) over the course of a year. If the Fund’s NAV has increased, the Fund will have economically earned more than it has distributed, regardless of whether such distributions are reported as being from net investment income, net realized gains on investments or return of capital. If the Fund’s NAV decreases, the Fund will have distributed more than it has economically earned or it will have incurred an economic loss. |
| (c) | Total returns are for the period indicated. Total returns would have been lower had certain expenses not been waived or recouped by the Adviser during the year. Returns shown do not reflect the deduction of taxes that a shareholder would pay on Fund distributions or the redemption of Fund shares. |
| (d) | The ratios of expenses to average net assets and net investment income to average net assets do not reflect the expenses of the underlying private real estate funds in which the Fund invests which typically range from 0.80% to 1.00% on an annual basis. However, the Fund invests in each underlying private real estate investment fund based upon the net asset value of each such fund which reflects the costs of investing in the applicable fund, including the management fee of the underlying fund and other operating expenses. The net asset value of each underlying private real estate investment fund is incorporated into the ratios described above. |
| (e) | Recognition of net investment income is affected by the timing and declaration of dividends by the underlying investments in which the Fund invests. |
See Notes to Financial Statements.
| Annual Report | September 30, 2022 | 31 |
| Apollo Diversified Real Estate Fund – Class I | Financial Highlights |
For a Share Outstanding Throughout the Years Presented
For the Year Ended September 30, 2022 | For the Year Ended September 30, 2021 | For the Year Ended September 30, 2020 | For the Year Ended September 30, 2019 | For the Year Ended September 30, 2018 | ||||||||||||||||
| Net asset value, beginning of year | $ | 28.10 | $ | 25.25 | $ | 27.65 | $ | 27.16 | $ | 26.80 | ||||||||||
| INCOME FROM INVESTMENT OPERATIONS: | ||||||||||||||||||||
| Net investment income(a) | 0.44 | 0.46 | 0.45 | 0.46 | 0.45 | |||||||||||||||
| Net realized and unrealized gain/(loss) | 2.49 | 3.80 | (1.48 | ) | 1.48 | 1.33 | ||||||||||||||
| Total from investment operations | 2.93 | 4.26 | (1.03 | ) | 1.94 | 1.78 | ||||||||||||||
| DISTRIBUTIONS: | ||||||||||||||||||||
| From net investment income | (0.05 | ) | (0.15 | ) | (0.37 | ) | – | – | ||||||||||||
| From net realized gain on investments | (0.39 | ) | (0.19 | ) | – | (0.55 | ) | (0.20 | ) | |||||||||||
| Return of capital | (1.14 | ) | (1.07 | ) | (1.00 | ) | (0.90 | ) | (1.22 | ) | ||||||||||
| Total distributions(b) | (1.58 | ) | (1.41 | ) | (1.37 | ) | (1.45 | ) | (1.42 | ) | ||||||||||
| Net increase/(decrease) in net asset value | 1.35 | 2.85 | (2.40 | ) | 0.49 | 0.36 | ||||||||||||||
| Net asset value, end of year | $ | 29.45 | $ | 28.10 | $ | 25.25 | $ | 27.65 | $ | 27.16 | ||||||||||
| TOTAL RETURN(c) | 10.45 | % | 17.31 | % | (3.75 | )% | 7.30 | % | 6.81 | % | ||||||||||
| RATIOS/SUPPLEMENTAL DATA: | ||||||||||||||||||||
| Net assets, end of year (000s) | $ | 3,125,199 | $ | 1,947,652 | $ | 1,624,344 | $ | 1,473,477 | $ | 992,272 | ||||||||||
| Ratios to Average Net Assets (including interest expense) | ||||||||||||||||||||
| Ratio of expenses to average net assets excluding fee waivers and reimbursements/recoupment of previously waived fees(d) | 1.71 | % | 1.72 | % | 1.71 | % | 1.70 | % | 1.86 | % | ||||||||||
| Ratio of expenses to average net assets including fee waivers and reimbursements/recoupment of previously waived fees (d) | 1.71 | % | 1.73 | % | 1.72 | % | 1.71 | % | 1.86 | % | ||||||||||
| Ratio of net investment income to average net assets including fee waivers and reimbursements(d)(e) | 1.45 | % | 1.72 | % | 1.71 | % | 1.69 | % | 1.67 | % | ||||||||||
| Ratios to Average Net Assets (excluding interest expense) | ||||||||||||||||||||
| Ratio of expenses to average net assets excluding fee waivers and reimbursements/recoupment of previously waived fees(d) | 1.60 | % | 1.65 | % | 1.65 | % | 1.65 | % | 1.66 | % | ||||||||||
| Ratio of expenses to average net assets including fee waivers and reimbursements/recoupment of previously waived fees(d) | 1.60 | % | 1.66 | % | 1.66 | % | 1.66 | % | 1.66 | % | ||||||||||
| Ratio of net investment income to average net assets excluding fee waivers and reimbursements(d)(e) | 1.56 | % | 1.80 | % | 1.79 | % | 1.76 | % | 1.87 | % | ||||||||||
| Portfolio turnover rate | 19 | % | 42 | % | 51 | % | 22 | % | 15 | % | ||||||||||
See Notes to Financial Statements.
| 32 | 1.888.926.2688 | www.apollo.com |
| Apollo Diversified Real Estate Fund – Class I | Financial Highlights |
For a Share Outstanding Throughout the Years Presented
| (a) | Calculated using the average shares method. |
| (b) | Total distributions during a calendar year generally will be made from the Fund’s net investment income, net realized gains on investments and net unrealized gains on investments, if any. The portion of distributions paid not attributable to net investment income or net realized gains on investments, if any, is distributed from the Fund’s assets and is treated by shareholders as a nontaxable distribution (“Return of Capital”) for tax purposes. Return of capital is a tax concept, not an economic concept. The tax character of the Fund’s distributions, in isolation, does not reveal much information about whether the distributions are supported by the Fund’s returns. Reported distributions from net investment income and realized gains on investments are not an indication as to whether or not the Fund’s distributions are supported by the Fund’s returns. The Fund can have distributions from net investment income and realized capital gains in years in which it incurs an economic loss due to unrealized losses not being recognized for tax purposes. A common method in which to determine if the Fund’s distributions are supported by economic returns is to examine the Fund’s Net Asset Value (“NAV”) over the course of a year. If the Fund’s NAV has increased, the Fund will have economically earned more than it has distributed, regardless of whether such distributions are reported as being from net investment income, net realized gains on investments or return of capital. If the Fund’s NAV decreases, the Fund will have distributed more than it has economically earned or it will have incurred an economic loss. |
| (c) | Total returns are for the period indicated. Total returns would have been lower had certain expenses not been waived or recouped by the Adviser during the year. Returns shown do not reflect the deduction of taxes that a shareholder would pay on Fund distributions or the redemption of Fund shares. |
| (d) | The ratios of expenses to average net assets and net investment income to average net assets do not reflect the expenses of the underlying private real estate funds in which the Fund invests which typically range from 0.80% to 1.00% on an annual basis. However, the Fund invests in each underlying private real estate investment fund based upon the net asset value of each such fund which reflects the costs of investing in the applicable fund, including the management fee of the underlying fund and other operating expenses. The net asset value of each underlying private real estate investment fund is incorporated into the ratios described above. |
| (e) | Recognition of net investment income is affected by the timing and declaration of dividends by the underlying investments in which the Fund invests. |
See Notes to Financial Statements.
| Annual Report | September 30, 2022 | 33 |
| Apollo Diversified Real Estate Fund – Class M | Financial Highlights |
For a Share Outstanding Throughout the Years Presented
For the Year Ended September 30, 2022 | For the Year Ended September 30, 2021 | For the Year Ended September 30, 2020 | For the Year Ended September 30, 2019 | For the Year Ended September 30, 2018 | ||||||||||||||||
| Net asset value, beginning of year | $ | 27.02 | $ | 24.46 | $ | 26.98 | $ | 26.70 | $ | 26.54 | ||||||||||
| INCOME FROM INVESTMENT OPERATIONS: | ||||||||||||||||||||
| Net investment income(a) | 0.20 | 0.25 | 0.25 | 0.26 | 0.25 | |||||||||||||||
| Net realized and unrealized gain/(loss) | 2.40 | 3.67 | (1.44 | ) | 1.44 | 1.31 | ||||||||||||||
| Total from investment operations | 2.60 | 3.92 | (1.19 | ) | 1.70 | 1.56 | ||||||||||||||
| DISTRIBUTIONS: | ||||||||||||||||||||
| From net investment income | (0.03 | ) | (0.14 | ) | (0.35 | ) | – | – | ||||||||||||
| From net realized gain on investments | (0.39 | ) | (0.19 | ) | – | (0.54 | ) | (0.20 | ) | |||||||||||
| Return of capital | (1.09 | ) | (1.03 | ) | (0.98 | ) | (0.88 | ) | (1.20 | ) | ||||||||||
| Total distributions(b) | (1.51 | ) | (1.36 | ) | (1.33 | ) | (1.42 | ) | (1.40 | ) | ||||||||||
| Net increase in net asset value | 1.09 | 2.56 | (2.52 | ) | 0.28 | 0.16 | ||||||||||||||
| Net asset value, end of year | $ | 28.11 | $ | 27.02 | $ | 24.46 | $ | 26.98 | $ | 26.70 | ||||||||||
| TOTAL RETURN(c) | 9.64 | % | 16.45 | % | (4.44 | )% | 6.51 | % | 6.03 | % | ||||||||||
| RATIOS/SUPPLEMENTAL DATA: | ||||||||||||||||||||
| Net assets, end of year (000s) | $ | 1,430,890 | $ | 1,136,373 | $ | 942,531 | $ | 807,774 | $ | 402,482 | ||||||||||
| Ratios to Average Net Assets (including interest expense) | ||||||||||||||||||||
| Ratio of expenses to average net assets excluding fee waivers and reimbursements/recoupment of previously waived fees(d) | 2.47 | % | 2.47 | % | 2.46 | % | 2.44 | % | 2.58 | % | ||||||||||
| Ratio of expenses to average net assets including fee waivers and reimbursements/recoupment of previously waived fees (d) | 2.47 | % | 2.47 | % | 2.46 | % | 2.44 | % | 2.59 | % | ||||||||||
| Ratio of net investment income to average net assets including fee waivers and reimbursements(d)(e) | 0.67 | % | 0.99 | % | 0.98 | % | 0.98 | % | 0.94 | % | ||||||||||
| Ratios to Average Net Assets (excluding interest expense) | ||||||||||||||||||||
| Ratio of expenses to average net assets excluding fee waivers and reimbursements/recoupment of previously waived fees(d) | 2.36 | % | 2.40 | % | 2.40 | % | 2.39 | % | 2.41 | % | ||||||||||
| Ratio of expenses to average net assets including fee waivers and reimbursements/recoupment of previously waived fees(d) | 2.36 | % | 2.40 | % | 2.40 | % | 2.39 | % | 2.41 | % | ||||||||||
| Ratio of net investment income to average net assets excluding fee waivers and reimbursements(d)(e) | 0.78 | % | 1.06 | % | 1.04 | % | 1.03 | % | 1.14 | % | ||||||||||
| Portfolio turnover rate | 19 | % | 42 | % | 51 | % | 22 | % | 15 | % | ||||||||||
See Notes to Financial Statements.
| 34 | 1.888.926.2688 | www.apollo.com |
| Apollo Diversified Real Estate Fund – Class M | Financial Highlights |
For a Share Outstanding Throughout the Years Presented
| (a) | Calculated using the average shares method. |
| (b) | Total distributions during a calendar year generally will be made from the Fund’s net investment income, net realized gains on investments and net unrealized gains on investments, if any. The portion of distributions paid not attributable to net investment income or net realized gains on investments, if any, is distributed from the Fund’s assets and is treated by shareholders as a nontaxable distribution (“Return of Capital”) for tax purposes. Return of capital is a tax concept, not an economic concept. The tax character of the Fund’s distributions, in isolation, does not reveal much information about whether the distributions are supported by the Fund’s returns. Reported distributions from net investment income and realized gains on investments are not an indication as to whether or not the Fund’s distributions are supported by the Fund’s returns. The Fund can have distributions from net investment income and realized capital gains in years in which it incurs an economic loss due to unrealized losses not being recognized for tax purposes. A common method in which to determine if the Fund’s distributions are supported by economic returns is to examine the Fund’s Net Asset Value (“NAV”) over the course of a year. If the Fund’s NAV has increased, the Fund will have economically earned more than it has distributed, regardless of whether such distributions are reported as being from net investment income, net realized gains on investments or return of capital. If the Fund’s NAV decreases, the Fund will have distributed more than it has economically earned or it will have incurred an economic loss. |
| (c) | Total returns are for the period indicated. Total returns would have been lower had certain expenses not been waived or recouped by the Adviser during the year. Returns shown do not reflect the deduction of taxes that a shareholder would pay on Fund distributions or the redemption of Fund shares. |
| (d) | The ratios of expenses to average net assets and net investment income to average net assets do not reflect the expenses of the underlying private real estate funds in which the Fund invests which typically range from 0.80% to 1.00% on an annual basis. However, the Fund invests in each underlying private real estate investment fund based upon the net asset value of each such fund which reflects the costs of investing in the applicable fund, including the management fee of the underlying fund and other operating expenses. The net asset value of each underlying private real estate investment fund is incorporated into the ratios described above. |
| (e) | Recognition of net investment income is affected by the timing and declaration of dividends by the underlying investments in which the Fund invests. |
See Notes to Financial Statements.
| Annual Report | September 30, 2022 | 35 |
| Apollo Diversified Real Estate Fund – Class L | Financial Highlights |
For a Share Outstanding Throughout the Years Presented
| For the Year Ended September 30, 2022 | For the Year Ended September 30, 2021 | For the Year Ended September 30, 2020 | For the Year Ended September 30, 2019 | For the Year Ended September 30, 2018 | ||||||||||||||||
| Net asset value, beginning of year | $ | 27.40 | $ | 24.74 | $ | 27.22 | $ | 26.87 | $ | 26.64 | ||||||||||
| INCOME FROM INVESTMENT OPERATIONS: | ||||||||||||||||||||
| Net investment income(a) | 0.27 | 0.32 | 0.31 | 0.33 | 0.32 | |||||||||||||||
| Net realized and unrealized gain/(loss) | 2.45 | 3.71 | (1.45 | ) | 1.45 | 1.32 | ||||||||||||||
| Total from investment operations | 2.72 | 4.03 | (1.14 | ) | 1.78 | 1.64 | ||||||||||||||
| DISTRIBUTIONS: | ||||||||||||||||||||
| From net investment income | (0.04 | ) | (0.14 | ) | (0.35 | ) | – | – | ||||||||||||
| From net realized gain on investments | (0.39 | ) | (0.19 | ) | – | (0.54 | ) | (0.20 | ) | |||||||||||
| Return of capital | (1.11 | ) | (1.04 | ) | (0.99 | ) | (0.89 | ) | (1.21 | ) | ||||||||||
| Total distributions(b) | (1.54 | ) | (1.37 | ) | (1.34 | ) | (1.43 | ) | (1.41 | ) | ||||||||||
| Net increase in net asset value | 1.18 | 2.66 | (2.48 | ) | 0.35 | 0.23 | ||||||||||||||
| Net asset value, end of year | $ | 28.58 | $ | 27.40 | $ | 24.74 | $ | 27.22 | $ | 26.87 | ||||||||||
| TOTAL RETURN(c) | 9.93 | % | 16.75 | % | (4.20 | )% | 6.77 | % | 6.30 | % | ||||||||||
| RATIOS/SUPPLEMENTAL DATA: | ||||||||||||||||||||
| Net assets, end of year (000s) | $ | 100,675 | $ | 88,449 | $ | 78,213 | $ | 100,151 | $ | 45,853 | ||||||||||
| Ratios to Average Net Assets (including interest expense) | ||||||||||||||||||||
| Ratio of expenses to average net assets excluding fee waivers and reimbursements/recoupment of previously waived fees(d) | 2.21 | % | 2.21 | % | 2.20 | % | 2.19 | % | 2.34 | % | ||||||||||
| Ratio of expenses to average net assets including fee waivers and reimbursements/recoupment of previously waived fees (d) | 2.21 | % | 2.21 | % | 2.20 | % | 2.19 | % | 2.35 | % | ||||||||||
| Ratio of net investment income to average net assets including fee waivers and reimbursements(d)(e) | 0.93 | % | 1.24 | % | 1.19 | % | 1.23 | % | 1.19 | % | ||||||||||
| Ratios to Average Net Assets (excluding interest expense) | ||||||||||||||||||||
| Ratio of expenses to average net assets excluding fee waivers and reimbursements/recoupment of previously waived fees(d) | 2.10 | % | 2.13 | % | 2.14 | % | 2.14 | % | 2.16 | % | ||||||||||
| Ratio of expenses to average net assets including fee waivers and reimbursements/recoupment of previously waived fees(d) | 2.10 | % | 2.13 | % | 2.14 | % | 2.14 | % | 2.16 | % | ||||||||||
| Ratio of net investment income to average net assets excluding fee waivers and reimbursements(d)(e) | 1.04 | % | 1.32 | % | 1.25 | % | 1.28 | % | 1.39 | % | ||||||||||
| Portfolio turnover rate | 19 | % | 42 | % | 51 | % | 22 | % | 15 | % | ||||||||||
See Notes to Financial Statements.
| 36 | 1.888.926.2688 | www.apollo.com |
| Apollo Diversified Real Estate Fund – Class L | Financial Highlights |
For a Share Outstanding Throughout the Years Presented
| (a) | Calculated using the average shares method. |
| (b) | Total distributions during a calendar year generally will be made from the Fund’s net investment income, net realized gains on investments and net unrealized gains on investments, if any. The portion of distributions paid not attributable to net investment income or net realized gains on investments, if any, is distributed from the Fund’s assets and is treated by shareholders as a nontaxable distribution (“Return of Capital”) for tax purposes. Return of capital is a tax concept, not an economic concept. The tax character of the Fund’s distributions, in isolation, does not reveal much information about whether the distributions are supported by the Fund’s returns. Reported distributions from net investment income and realized gains on investments are not an indication as to whether or not the Fund’s distributions are supported by the Fund’s returns. The Fund can have distributions from net investment income and realized capital gains in years in which it incurs an economic loss due to unrealized losses not being recognized for tax purposes. A common method in which to determine if the Fund’s distributions are supported by economic returns is to examine the Fund’s Net Asset Value (“NAV”) over the course of a year. If the Fund’s NAV has increased, the Fund will have economically earned more than it has distributed, regardless of whether such distributions are reported as being from net investment income, net realized gains on investments or return of capital. If the Fund’s NAV decreases, the Fund will have distributed more than it has economically earned or it will have incurred an economic loss. |
| (c) | Total returns are for the period indicated. Total returns would have been lower had certain expenses not been waived or recouped by the Adviser during the year. Returns shown do not reflect the deduction of taxes that a shareholder would pay on Fund distributions or the redemption of Fund shares. |
| (d) | The ratios of expenses to average net assets and net investment income to average net assets do not reflect the expenses of the underlying private real estate funds in which the Fund invests which typically range from 0.80% to 1.00% on an annual basis. However, the Fund invests in each underlying private real estate investment fund based upon the net asset value of each such fund which reflects the costs of investing in the applicable fund, including the management fee of the underlying fund and other operating expenses. The net asset value of each underlying private real estate investment fund is incorporated into the ratios described above. |
| (e) | Recognition of net investment income is affected by the timing and declaration of dividends by the underlying investments in which the Fund invests. |
See Notes to Financial Statements.
| Annual Report | September 30, 2022 | 37 |
| Apollo Diversified Real Estate Fund | Financial Highlights |
For a Share Outstanding Throughout the Years Presented
Information about the Fund's senior securities is shown in the following table:
| For the Year Ended September 30, 2022 | For the Year Ended September 30, 2021 | For the Year Ended September 30, 2020 | For the Year Ended September 30, 2019 | For the Year Ended September 30, 2018 | ||||||||||||||||
| Lines of Credit Total Amount Outstanding (000's) | $ | 172,750 | $ | 139,000 | N/A | N/A | N/A | |||||||||||||
| Asset Coverage Per $1,000 of Lines of Credit | ||||||||||||||||||||
| Outstanding(a) | $ | 35,648 | $ | 32,691 | N/A | N/A | N/A | |||||||||||||
| (a) | Calculated by subtracting the Fund’s total liabilities (excluding the indebtedness represented by the Lines of Credit) from the Fund’s total assets and dividing by the total amount outstanding on the Lines of Credit. The Asset Coverage ratio is then multiplied by $1,000 to determine the "Asset Coverage Per $1,000 of Lines of Credit Outstanding." |
See Notes to Financial Statements.
| 38 | 1.888.926.2688 | www.apollo.com |
| Apollo Diversified Real Estate Fund | Notes to Financial Statements |
September 30, 2022
1. ORGANIZATION
Apollo Diversified Real Estate Fund (formerly, Griffin Institutional Access Real Estate Fund) (the "Fund") is registered with the U.S. Securities and Exchange Commission ("SEC") under the Investment Company Act of 1940, as amended (the "1940 Act"), as a diversified, closed-end management investment company. The Fund engages in a continuous offering of shares and operates as an interval fund that offers quarterly repurchases of shares at Net Asset Value (“NAV”). The Fund was organized as a statutory trust on November 5, 2013, under the laws of the State of Delaware. The Fund commenced operations on June 30, 2014 and is authorized to issue an unlimited number of shares with no par value. The Fund’s investment adviser is Apollo Real Estate Fund Adviser, LLC (formerly, Griffin Capital Advisor, LLC) (the "Adviser"), a registered investment adviser under the Investment Advisers Act of 1940, as amended (the “Advisers Act”) and an affiliate of Apollo Global Management, Inc. and its consolidated subsidiaries ("Apollo"). The investment objective of the Fund is to generate a return comprised of both current income and capital appreciation with moderate volatility and low correlation to the broader markets. The Fund pursues its investment objective by strategically investing across private institutional real estate investment funds as well as a diversified set of public real estate securities.
The Fund currently offers Class A, Class C, Class I, Class M and Class L shares. Class A shares commenced operations on June 30, 2014, Class C and Class I shares commenced operations on August 10, 2015, Class M shares commenced operations on November 17, 2016 and Class L shares commenced operations on April 25, 2017. The sales load payable by each investor depends on the amount invested, and the class of shares invested into, by such investor in the Fund. Class A and Class L shares are offered subject to a maximum sales charge of 5.75% and 4.25%, respectively, of their offering price. Class C, Class I and Class M shares are offered at net asset value. Class C shares may be subject to a 1.00% contingent deferred sales charge on shares redeemed during the first 365 days after their purchase. Each class represents an interest in the same assets of the Fund and classes are identical except for differences in their sales charge structures and ongoing service and distribution charges. All classes of shares have equal voting privileges except that each class has exclusive voting rights with respect to its service and/or distribution plans. The Fund's income, expenses (other than class specific service and distribution fees) and realized and unrealized gains and losses are allocated proportionately each day based upon the relative net assets of each class.
2. SIGNIFICANT ACCOUNTING POLICIES
The following is a summary of significant accounting policies followed by the Fund in preparation of its financial statements in conformity with accounting principles generally accepted in the United States of America (“U.S. GAAP”). The Fund is considered an investment company following accounting and reporting guidance in Accounting Standards Codification (“ASC”) Topic 946 – Financial Services – Investment Companies. The preparation of financial statements requires management to make estimates and assumptions that affect the reported amounts of assets and liabilities and disclosure of contingent assets and liabilities at the date of the financial statements and the reported amounts of income and expenses for the period. Actual results could differ from those estimates.
Determination of Net Asset Value – The net asset value of shares of the Fund is determined following the close of regular trading on the NYSE, generally 4:00 p.m. Eastern time, on each day the NYSE is open for trading. Each of the Fund’s share classes will be offered at net asset value plus the applicable sales load, if any. The Fund’s net asset value per share is calculated, on a class-specific basis, by dividing the value of the Fund’s total assets (the value of the securities the Fund holds plus cash or other assets, including interest accrued but not yet received), less accrued expenses and other liabilities of the Fund by the total number of shares outstanding. During the continuous offering, the price of the shares will increase or decrease on a daily basis according to the net asset value of the shares.
Valuation of Public Securities – Readily marketable portfolio securities listed on a public exchange are valued at their current market values determined on the basis of market quotations obtained from independent pricing services approved by the Board. Such quotes typically utilize official closing prices, generally the last sale price, reported to the applicable securities exchange if readily available. Portfolio securities traded on more than one securities exchange are valued at the last sale price on the business day as of which such value is being determined as reflected by the exchange representing the principal market for such securities. Securities trading on NASDAQ are valued at NASDAQ official closing price.
If market or dealer quotations are not readily available or deemed unreliable, the Adviser will determine in good faith, the fair value of such securities. For securities that are fair valued in ordinary course of Fund operations, the Board has designated the performance of fair value determinations to the Adviser as valuation designee, subject to the Board’s oversight. The Adviser has established a Valuation Committee to help oversee the implementation of procedures for fair value determinations. In determining the fair value of a security for which there are no readily available market or dealer quotations, the Adviser and the Valuation Committee, will take into account all reasonably available information that may be relevant to a particular security including, but not limited to: pricing history, current market level, supply and demand of the respective security; the enterprise value of the portfolio company; the portfolio company’s ability to make payments and its earnings and discounted cash flow, comparison to the values and current pricing of publicly traded securities that have comparable characteristics; comparison to publicly traded securities including factors such as yield, maturity, and credit quality; knowledge of historical market information with respect to the security; fundamental analytical data, such as periodic financial statements, and other factors or information relevant to the security, issuer, or market. Fair valuation involves subjective judgments, and it is possible that the fair value determined for a security may differ materially from the value that could be realized upon the sale of the security.
| Annual Report | September 30, 2022 | 39 |
| Apollo Diversified Real Estate Fund | Notes to Financial Statements |
September 30, 2022
Valuation of Private Investment Funds – The Fund’s allocation to Private Investment Funds generally includes open-end private investment funds that elect to be treated as Funds for tax purposes. The Private Investment Funds generally include private funds investing in real estate assets (“Private Equity Funds”) and private funds investing in debt instruments secured or otherwise supported by real estate assets (“Private Debt Funds”). The sponsors or agents of the Private Investment Funds measure their investment assets at fair value and report a NAV per share no less frequently than quarterly (“Sponsor NAV”). The Private Investment Funds have generally adopted valuation practices consistent with the valuation standards and techniques established by professional industry associations that advise the institutional real estate investment community. Such valuation standards seek general application of U.S. Generally Accepted Accounting Principles (GAAP) fair value standards, uniform appraisal standards and the engagement of independent valuation advisory firms.
The valuations of the Private Investment Funds have a considerable impact on the Fund’s NAV as a significant portion of the Fund’s assets are invested in Private Investment Funds. Market and dealer quotations are generally not readily available for the Private Investment Funds in which the Fund invests, and as such, the Fund utilizes Sponsor NAVs or other valuation methodologies when determining the fair value of the Private Investment Funds. The Fund may also use a third-party valuation specialist to assist in determining fair value of the Private Investment Funds held in the Fund’s portfolio.
Private Equity Funds. The Private Equity Funds produce Sponsor NAVs no less frequently than quarterly. Such Sponsor NAVs are reviewed by the Adviser upon receipt and subsequently applied to the Fund’s NAV following consultation with the Private Equity Fund sponsor, if necessary. In between receipt of Sponsor NAVs, where applicable, the value of each Private Equity Fund is adjusted daily by the change in a proprietary index (the “Index”) that the Fund’s Board has deemed representative of the private equity real estate market. This process is applied daily to each respective Private Equity Fund until the receipt of the next Sponsor NAV. The Index seeks to reflect market conditions of the broader private equity real estate market in an effort to ensure any such changes in market conditions are reflected in the NAV of the Fund. The Index is comprised of private real estate investment funds (“Index Constituents”) that produce a daily NAV and generally hold institutional quality assets. The Index is monitored by the Adviser on a regular basis, and the Adviser will consult with the Valuation Committee if monitoring suggests a modification to the Index Constituents or other change(s) to the Index to better reflect market conditions. Further, in the event that a Sponsor NAV is not provided by a Private Equity Fund following the conclusion of such Private Equity Fund’s valuation period, the Adviser shall inform the Valuation Committee and a meeting may be called to determine fair value.
Private Debt Funds. The Private Debt Funds produce Sponsor NAVs no less frequently than quarterly. Such Sponsor NAVs are reviewed by the Adviser upon receipt and subsequently applied to the Fund’s NAV following consultation with the Private Debt Fund sponsor, if necessary. The Fund will, in certain cases, accrue income on a daily basis for each Private Debt Fund based on the prior period’s distribution rate and/or guidance provided by each respective Private Debt Fund sponsor. In the event that a Sponsor NAV is not provided by a Private Debt Fund following the conclusion of such Private Debt Fund’s valuation period, or if the Adviser becomes aware of an event warranting an update to a Private Debt Fund valuation, the Adviser shall inform the Valuation Committee and a meeting may be called to determine fair value.
Fair Value Measurements – A three-tier hierarchy has been established to classify fair value measurements for disclosure purposes. Inputs refer broadly to the assumptions that market participants would use in pricing the asset or liability, including assumptions about risk. Inputs may be observable or unobservable. Observable inputs are inputs that reflect the assumptions market participants would use in pricing the asset or liability that are developed based on market data obtained from sources independent of the reporting entity. Unobservable inputs are inputs that reflect the reporting entity’s own assumptions about the assumptions market participants would use in pricing the asset or liability that are developed based on the best information available. In accordance with the authoritative guidance on fair value measurements and disclosure under U.S. GAAP, the Fund discloses fair value of its investments in a hierarchy that prioritizes the inputs to valuation techniques used to measure the fair value:
| Level 1 – | Unadjusted quoted prices in active markets for identical, unrestricted assets or liabilities that the Fund has the ability to access at the measurement date; |
| Level 2 – | Quoted prices which are not active, quoted prices for similar assets or liabilities in active markets or inputs other than quoted prices that are observable (either directly or indirectly) for substantially the full term of the asset or liability at the measurement date; and |
| Level 3 – | Significant unobservable prices or inputs (including the Fund’s own assumptions in determining the fair value of investments) where there is little or no market activity for the asset or liability at the measurement date. |
The availability of observable inputs can vary from security to security and is affected by a wide variety of factors, including, for example, the type of security, whether the security is new and not yet established in the marketplace, the liquidity of markets and other characteristics particular to the security. To the extent that valuation is based on models or inputs that are less observable or unobservable in the market, the determination of fair value requires more judgment. Accordingly, the degree of judgment exercised in determining fair value is greatest for instruments categorized in Level 3.
| 40 | 1.888.926.2688 | www.apollo.com |
| Apollo Diversified Real Estate Fund | Notes to Financial Statements |
September 30, 2022
An investment level within the fair value hierarchy is based on the lowest level input, individually or in the aggregate, that is significant to fair value measurement. The inputs or methodologies used for valuing securities are not necessarily an indication of the risk or liquidity associated with investing in those securities. The valuation techniques used by the Fund to measure fair value during the year ended September 30, 2022 maximized the use of observable inputs and minimized the use of unobservable inputs. For the year ended September 30, 2022, the Fund did not use unobservable inputs (Level 3) when determining fair value. The following is a summary of the fair valuations according to the inputs used in valuing the Fund’s investments as of September 30, 2022:
| Investments in Securities at Value | Level 1 - Quoted Prices | Level 2 - Other Significant Observable Inputs | Level 3 - Significant Unobservable Inputs | Total | ||||||||||||
| Real Estate Investment Trusts | ||||||||||||||||
| Private Investment Funds (Measured at net asset value)(a) | $ | – | $ | – | $ | – | $ | 4,683,426,175 | ||||||||
| Publicly Traded Securities | 1,349,024,067 | – | – | 1,349,024,067 | ||||||||||||
| Preferred Stocks | 103,826,709 | – | – | 103,826,709 | ||||||||||||
| Short Term Investment | 498,555 | – | – | 498,555 | ||||||||||||
| Total | $ | 1,453,349,331 | $ | – | $ | – | $ | 6,136,775,506 | ||||||||
| (a) | In accordance with Subtopic 820-10, certain investments that are measured at fair value using the net asset value per share (or its equivalent) practical expedient have not been classified in the fair value hierarchy. The fair value amounts presented in this table are intended to permit reconciliation of the fair value hierarchy to the amounts presented in the Schedule of Investments. |
The carrying and fair value of the Fund's debt obligation as of September 30, 2022 for which the Fund has determined would be categorized as Level 2 in the fair value hierarchy was $172,750,000. For the year ended September 30, 2022, the Fund did not use any significant unobservable inputs (Level 3) when determining fair value.
Investment Transactions – Investment security transactions are accounted for on trade date. Gains and losses on securities sold are determined on a specific identification basis. Non-cash dividends included in dividend income, if any, are recorded at the fair market value of the security received.
Investment Income – Interest income is accrued and recorded on a daily basis including income earned from money market funds. Dividend income is recorded on the ex-dividend date.
Distributions to Shareholders – Distributions from net investment income, if any, will be declared and paid quarterly. Distributions of net realized capital gains, if any, will be declared and paid annually. Income and capital gains distributions are determined in accordance with income tax regulations, which may differ from U.S. GAAP. Distributions to shareholders are recorded on the ex-dividend date.
Distributions from Underlying Real Estate Investment Trusts – Distributions made to the Fund by the underlying REITs in which the Fund invests may take several forms. Specifically, such distributions may be in the form of dividends, capital gains, and/or return of capital.
Unfunded Commitments – Typically, when the Fund invests in a Private Investment Fund, the Fund makes a commitment to invest a specified amount of capital in the applicable Private Investment Fund. The capital commitment may be drawn by the general partner of the Private Investment Fund either all at once or through a series of capital calls at the discretion of the general partner. Thus, an Unfunded Commitment represents the portion of the Fund’s overall capital commitment to a particular Private Investment Fund that has not yet been called by the general partner of the Private Investment Fund. Unfunded Commitments may subject the Fund to certain risks. For example, the Fund may be required to: liquidate other portfolio investments, potentially at inopportune times, in order to obtain the cash needed to satisfy its obligations with respect to a capital call; borrow under a line of credit which may result in additional expenses to the Fund; or, to the extent a buyer can be identified and subject to the provisions of the limited partnership agreement of the relevant Private Investment Fund, seek to sell/assign the interest subject to the capital call to a third party thereby eliminating the obligation. In addition, should the Fund be unable to satisfy its commitment obligation on a timely basis and defaults on a called capital commitment, the underlying Private Investment Fund, pursuant to its limited partnership agreement, typically has a number of potential remedies, including, by way of illustration, a reallocation of the Fund's defaulted commitment amount to other limited partners, a reallocation of a portion of the Fund's existing interest to the other limited partners as a penalty for the default, or the general partner of underlying Private Investment Fund could sue the Fund for breach of contract. As of September 30, 2022, the Fund had total Unfunded Commitments in the amount of $160,000,000.
| Annual Report | September 30, 2022 | 41 |
| Apollo Diversified Real Estate Fund | Notes to Financial Statements |
September 30, 2022
Indemnification – The Fund indemnifies its Officers and Trustees for certain liabilities that may arise from the performance of their duties to the Fund. Additionally, in the normal course of business, the Fund enters into contracts that contain a variety of representations and warranties and which provide general indemnities. The Fund’s maximum exposure under these arrangements is unknown, as this would involve future claims that may be made against the Fund that have not yet occurred. However, based on industry experience, the Fund expects the risk of loss due to these warranties and indemnities to be remote.
Federal Income Taxes – The Fund intends to continue to comply with the requirements of Subchapter M of the Internal Revenue Code applicable to regulated investment companies and will distribute all of its taxable income, if any, to shareholders. Accordingly, no provision for federal income taxes is required in the financial statements.
The Fund recognizes the tax benefits of uncertain tax positions only when the position is “more likely than not” to be sustained assuming examination by tax authorities. Management has reviewed the tax positions and has concluded that no liability for unrecognized tax benefits should be recorded related to uncertain tax positions taken in the Fund’s tax returns for open tax years or expected to be taken in the Fund’s 2022 returns.
3. ADVISORY FEES, ADMINISTRATION FEES AND OTHER AGREEMENTS
Investment Advisory
Pursuant to the Investment Advisory Agreement with the Fund (“Advisory Agreement”), the Adviser is entitled to an investment advisory fee, computed daily and payable monthly at an annual rate of 1.50% of the average daily net assets of the Fund.
The Adviser and the Fund have entered into an expense limitation and reimbursement agreement (the “Expense Limitation Agreement”) under which the Adviser has agreed contractually to waive its fees and to pay or absorb the ordinary annual operating expenses of the Fund (including organizational and offering expenses, but excluding taxes, interest, brokerage commissions, acquired fund fees and expenses and extraordinary expenses) so that the total annual operating expenses of the Fund do not exceed 1.91% per annum of Class A average daily net assets, 2.66% per annum of Class C average daily net assets, 1.66% per annum of Class I average daily net assets, 2.41% per annum of Class M average daily net assets and 2.16% per annum of Class L average daily net assets (the “Expense Limitations”). The Expense Limitation Agreement will remain in effect until May 31, 2023, unless and until the Trustees approve its modification or termination. The Fund does not anticipate that the Trustees will terminate the Expense Limitation Agreement during this period. The Expense Limitation Agreement may not be terminated by the Adviser. In consideration of the Adviser’s agreement to limit the Fund’s expenses, the Fund has agreed to repay the Adviser in the amount of any fees waived and Fund expenses paid or absorbed, subject to the limitations that: (1) the reimbursement for fees and expenses will be made only if payable not more than three years from the date on which they were incurred; and (2) the reimbursement may not be made if it would cause the lesser of the Expense Limitations in place at the time of waiver or at the time of reimbursement to be exceeded.
The Adviser did not recoup any previously waived fees nor does it have a balance of recoupable expenses.
Sub-advisory services are provided to the Fund pursuant to agreements between the Adviser and both Aon Investments USA Inc. (“Aon”) and CenterSquare Investment Management LLC. (“CenterSquare” and collectively with Aon, the “Sub-Advisers”). Under the terms of the respective sub-advisory agreement, the Adviser compensates each Sub-Adviser based on a portion of the Fund’s average daily net assets which have been allocated to such Sub-Adviser to manage. Fees paid to each Sub-Adviser are not an expense of the Fund. The fee tables are as follows:
| Annual Sub-Advisory Fee Rate as a Percentage of Average Daily Net Assets Managed by CenterSquare | |
| $0 - $50M | 0.50% |
| $50 - $100M | 0.45% |
| $100 - $150M | 0.40% |
| Over $150M | 0.35% |
| Annual Sub-Advisory Fee Rate as a Percentage of Average Daily Net Assets Advised by Aon | |
| $0 - $500M | 0.15% |
| $500 - $750M | 0.125% |
| $750M - $1B | 0.10% |
| Over $1B | 0.07% |
| 42 | 1.888.926.2688 | www.apollo.com |
| Apollo Diversified Real Estate Fund | Notes to Financial Statements |
September 30, 2022
Fund Administrator and Accounting Fees and Expenses
ALPS Fund Services, Inc. serves as the Fund’s administrator and accounting agent (the “Administrator”) and receives customary fees from the Fund for such services. The Administrator is also reimbursed by the Fund for certain out of pocket expenses.
Transfer Agency Fees and Expenses
DST Systems, Inc. serves as transfer, distribution paying and shareholder servicing agent for the Fund and receives customary fees from the Fund for such services.
Custody Fees and Expenses
UMB Bank, n.a. serves as the Fund’s custodian and receives customary fees from the Fund for such services.
Distribution and Shareholder Servicing Fees and Expenses
The Fund has entered into a Distribution Agreement with ALPS Distributors, Inc. (the “Distributor”) to provide distribution services to the Fund. The Distributor serves as principal underwriter of shares of the Fund. Under the Distribution Agreement the Fund’s Class C and Class M shares will pay to the Distributor a Distribution Fee that will accrue at an annual rate equal to 0.75% of the Fund’s average daily net assets attributable to Class C and Class M shares, payable on a monthly basis. Class L shares will pay to the Distributor a Distribution Fee that will accrue at an annual rate equal to 0.25% of the Fund’s average daily net assets attributable to Class L shares, payable on a monthly basis. For the year ended September 30, 2022, Class C, Class M and Class L shares incurred distribution fees of $4,235,602, $10,205,022 and $237,082, respectively. Class A and Class I shares are not currently subject to a Distribution Fee. Under the Shareholder Services Plan, the Fund’s Class A, Class C and Class L shares may pay up to 0.25% per year of their average daily net assets for such services. Class I and Class M shares are not currently subject to a shareholder services fee. For the year ended September 30, 2022, Class A, Class C and Class L shares incurred shareholder servicing fees of $1,812,210, $1,411,867 and $237,082, respectively.
The Distributor has entered into a wholesale marketing agreement with Griffin Capital Securities, LLC, a registered broker-dealer affiliate of the Adviser. Pursuant to the terms of the wholesale marketing agreement, Griffin Capital Securities, LLC will seek to market and otherwise promote the Fund through various wholesale distribution channels, including regional and independent retail broker-dealers, wirehouses and registered investment advisers.
Officer and Trustee Compensation
As of December 14, 2021, each Independent Trustee receives an annual retainer of $57,750, paid quarterly, as well as reimbursement for any reasonable expenses incurred attending the meetings and $500 per Independent Trustee per each special telephonic meeting (exclusive of one special telephonic meeting per year). The Independent Trustees also received $2,000 per special meeting related to the sale of the Adviser’s former parent company to Apollo. The Chair of the Audit Committee receives an additional $15,750 annually. None of the executive officers, with the exception of the Chief Compliance Officer, receive compensation from the Fund. Certain Trustees and officers of the Fund are also officers of the Adviser and are not paid by the Fund for serving in such capacities.
Prior to December 14, 2021, each Independent Trustee received an annual retainer of $55,000, paid quarterly, as well as reimbursement for any reasonable expenses incurred attending the meetings and $500 per Independent Trustee per each special telephonic meeting (exclusive of one special telephonic meeting per year). The Independent Trustees also received $2,000 per special meeting related to the sale of the Adviser’s former parent company to Apollo. The Chair of the Audit Committee received an additional $15,000 annually. None of the executive officers, with the exception of the Chief Compliance Officer, received compensation from the Fund. Certain Trustees and officers of the Fund are also officers of the Adviser and were not paid by the Fund for serving in such capacities.
4. PURCHASES AND SALES OF INVESTMENT SECURITIES
The cost of purchases and proceeds from the sale of securities, other than short-term securities, for the year ended September 30, 2022 were as follows:
| Purchases of Securities | Proceeds from Sales of Securities | ||||||||
| $ | 2,297,656,838 | $ | 1,033,166,364 | ||||||
| Annual Report | September 30, 2022 | 43 |
| Apollo Diversified Real Estate Fund | Notes to Financial Statements |
September 30, 2022
5. TAX BASIS INFORMATION
Distributions are determined in accordance with federal income tax regulations, which differ from U.S. GAAP, and, therefore, may differ significantly in amount or character from net investment income and realized gains for financial reporting purposes. Financial reporting records are adjusted for permanent book/tax differences to reflect tax character but are not adjusted for temporary differences.
For the year ended September 30, 2022, the following reclassifications were recorded to reflect tax character. These differences had no effect on operations or net assets and were primarily attributed to book/tax distribution differences and non-deductible expenses.
| Paid-in Capital | Total Distributable Earnings | ||||||||
| $ | (6,064,139 | ) | $ | 6,064,139 | |||||
The tax character of distributions paid for each of the fiscal years were as follows:
| Year | Ordinary Income | Long-Term Capital Gain | Return of Capital | ||||||||||
| 2022 | $ | 6,900,018 | $ | 66,034,313 | $ | 216,687,954 | |||||||
| 2021 | $ | 21,446,511 | $ | 28,645,904 | $ | 159,081,238 | |||||||
As of September 30, 2022, the components of accumulated earnings/(deficit) on a tax basis were as follows:
| Other cumulative effect of timing differences | Net unrealized appreciation/(depreciation) on investments | Total | |||||||||||
| $ | (64,006,036 | ) | $ | 1,187,241,652 | $ | 1,123,235,616 | |||||||
As of September 30, 2022, net unrealized appreciation of investments based on the federal tax cost was as follows:
| Gross Appreciation (excess of value over tax cost) | Gross Depreciation (excess of tax cost over value) | Net Unrealized Appreciation/(Depreciation) | Cost of Investments for Income Tax Purposes | ||||||||||||||
| $ | 1,452,311,015 | $ | (265,069,363 | ) | $ | 1,187,241,652 | $ | 4,949,533,854 | |||||||||
The Fund elects to defer to the period ending September 30, 2023, late year ordinary losses in the amount of $64,001,632.
The difference between book basis and tax basis distributable earnings and unrealized appreciation/(depreciation) is primarily attributable to the tax deferral of losses on wash sales, investments in partnerships, and certain other investments.
6. LINES OF CREDIT
As of September 30, 2022, the Fund had secured bank lines of credit through BNP Paribas Prime Brokerage International, Ltd. (“BNP”) and Credit Suisse First Boston Ltd. ("Credit Suisse" and together with BNP, the "Banks") subject to the limitations of the 1940 Act for borrowings.
From October 1, 2021 to December 28, 2021, borrowings under the BNP arrangement bore interest at the 3 month LIBOR plus 95 basis points at the time of borrowing and OBFR plus 121 basis points from December 29, 2021 to May 17, 2022. Effective May 18, 2022 borrowings under the BNP arrangement bear interest at OBFR plus 60 basis points at the time of borrowing. During the year ended September 30, 2022, the Fund had outstanding borrowings for 361 days and incurred $3,272,681 of interest expense related to its outstanding borrowings under the BNP arrangement. For the 361 days during which the Fund had outstanding borrowings under the BNP arrangement, average borrowings were $177,223,684 and the average interest rate was 1.72%. As of September 30, 2022, the outstanding borrowing under the BNP arrangement was $172,750,000.
Borrowings under the Credit Suisse arrangement bore interest at the 3 month LIBOR plus 205 basis points at the time of borrowing and an unused commitment fee rate equal to 59.8 basis points. The Credit Suisse arrangement was subject to a maximum commitment of $450,000,000 although the Fund had the ability to request an increase to the maximum commitment subject to certain conditions. During the year ended September 30, 2022, the Fund had no outstanding borrowings and incurred no interest expense related to its outstanding borrowings under the Credit Suisse arrangement. The Fund also incurred $2,728,375 of total unused commitment fees, which is included in the interest expense line item on the Statement of Operations. As described in the Subsequent Events note below, the Credit Suisse arrangement terminated on November 21, 2022. The Fund paid off any outstanding obligations under the arrangement as of that date.
| 44 | 1.888.926.2688 | www.apollo.com |
| Apollo Diversified Real Estate Fund | Notes to Financial Statements |
September 30, 2022
As collateral for the lines of credit, the Fund grants the Banks a first position security interest in and lien on securities of any kind or description held by the Fund in the collateral accounts. As of September 30, 2022, the Fund had $5,456,125,895 of securities pledged as collateral to the Banks.
7. REPURCHASE OFFERS
As a continuously offered, closed-end interval fund, the Fund has adopted a fundamental policy in which it offers to repurchase at net asset value no less than 5% of the outstanding shares of the Fund once each quarter. If shareholders tender for repurchase more than the amount in a repurchase offer, the Fund may, but is not required to, repurchase an additional amount of shares not to exceed 2% of the outstanding shares of the Fund on the repurchase request deadline. If the Fund determines not to repurchase more than the amount in a repurchase offer, or if shareholders tender shares in an amount exceeding the amount in a repurchase offer plus 2% of the outstanding shares on the repurchase request deadline, the Fund will repurchase the shares on a pro rata basis. It is possible that a repurchase offer may be oversubscribed and as such there is no guarantee that shareholders will be able to sell all of the shares they desire to sell in a quarterly repurchase offer, although each shareholder will have the right to require the Fund to purchase at least 5% of such shareholder’s shares in each quarterly repurchase. Liquidity will be provided to shareholders only through the Fund’s quarterly repurchase offers. Shareholders will receive written notice of each quarterly repurchase offer ("Repurchase Offer Notice") that includes the date the repurchase offer period ends ("Repurchase Request Deadline") and the date the repurchase price will be determined ("Repurchase Pricing Date"). Shares will be repurchased at the NAV per share determined on the Repurchase Pricing Date.
During the year ended September 30, 2022, the Fund completed four quarterly repurchase offers in which the Fund offered to repurchase up to 5% of its outstanding shares as of each respective Repurchase Request Deadline. Shareholder repurchase requests received by the Fund in good order by the November 4, 2021, February 8, 2022, May 10, 2022 and August 9, 2022 Repurchase Request Deadlines were honored in their full amounts. The results of the aforementioned repurchase offers were as follows:
| Repurchase Offer #1 | Repurchase Offer #2 | Repurchase Offer #3 | Repurchase Offer #4 | |
| Commencement Date | September 28, 2021 | December 29, 2021 | March 31, 2022 | June 30, 2022 |
| Repurchase Request Deadline | November 4, 2021 | February 8, 2022 | May 10, 2022 | August 9, 2022 |
| Repurchase Pricing Date | November 4, 2021 | February 8, 2022 | May 10, 2022 | August 9, 2022 |
| Amount Repurchased | $82,959,958 | $92,535,657 | $107,733,534 | $107,539,781 |
| Shares Repurchased | 2,932,811 | 3,143,638 | 3,592,353 | 3,499,232 |
8. PRINCIPAL RISK FACTORS
The following list is not intended to be a comprehensive listing of all of the potential risks associated with the Fund. For a more comprehensive list of potential risks the Fund may be subject to, please refer to the Fund’s Prospectus and Statement of Additional Information (“SAI”).
Concentration of Credit Risk – The Fund places its cash with one banking institution, which is insured by the Federal Deposit Insurance Corporation (“FDIC”). The FDIC limit is $250,000. At various times throughout the year, the amount on deposit may exceed the FDIC limit and subject the Fund to a credit risk. The Fund does not believe that such deposits are subject to any unusual risk associated with investment activities. The Fund may invest cash balances in an open-end Money Market Mutual Fund (“Money Market Fund”). The Money Market Fund is valued at its closing NAV. The Money Market Fund is not subject to FDIC insurance.
LIBOR Risk – Holding of certain of the Fund’s underlying investments may use a floating rate based on the London Interbank Offered Rate (“LIBOR”), which is the offered rate for short-term Eurodollar deposits between major international banks. As of December 31, 2021, the United Kingdom Financial Conduct Authority (“FCA”) and LIBOR’s administrator, ICE Benchmark Administration, have ceased the publication of all non-U.S. dollar LIBOR and the one-week and two-month U.S. dollar LIBOR rates, but the most widely used U.S. dollar LIBOR settings will continue to be published until June 30, 2023. Further, on March 15, 2022, the Consolidated Appropriations Act of 2022, which includes the Adjustable Interest Rate (LIBOR) Act, was signed into law in the United States. This legislation establishes a uniform benchmark replacement process for financial contracts that mature after June 30, 2023 that do not contain clearly defined or practicable fallback provisions.
The U.S. Federal Reserve, based on the recommendations of the New York Federal Reserve’s Alternative Reference Rate Committee (comprised of major derivative market participants and their regulators), has begun publishing the Secured Overnight Financing Rate (referred to as “SOFR”), which is their preferred alternative rate for U.S. dollar LIBOR. Proposals for alternative reference rates for other currencies have also been announced or have already begun publication. Markets are in the process of developing in response to these new rates. Although financial regulators and industry working groups have suggested alternative reference rates, such as the European Interbank Offer Rate, the Sterling Overnight Interbank Average Rate and SOFR, there has been no global consensus as to an alternative rate and the process for amending existing contracts or instruments to transition away from LIBOR remains incomplete.
| Annual Report | September 30, 2022 | 45 |
| Apollo Diversified Real Estate Fund | Notes to Financial Statements |
September 30, 2022
The elimination of LIBOR or changes to other reference rates or any other changes or reforms to the determination or supervision of reference rates could have an adverse impact on the market for, or value of, any securities or payments linked to those reference rates, which may adversely affect Fund performance and/or net asset value. Uncertainty and risk also remain regarding the willingness and ability of issuers and lenders to include revised provisions in new and existing contracts or instruments. Consequently, the transition away from LIBOR to other reference rates may lead to increased volatility and illiquidity in markets that are tied to LIBOR, fluctuations in values of LIBOR-related investments or investments in issuers that utilize LIBOR, increased difficulty in borrowing or refinancing and diminished effectiveness of hedging strategies, potentially adversely affecting Fund performance. Furthermore, the risks associated with the expected discontinuation of LIBOR and transition to alternative rates may be exacerbated if the work necessary to effect an orderly transition to an alternative reference rate is not completed in a timely manner.
Liquidity Risk – There currently is no secondary market for the Fund’s shares and the Adviser does not expect that a secondary market will develop. Limited liquidity is provided to shareholders only through the Fund’s quarterly repurchase offers for no less than 5% of the Fund’s shares outstanding at net asset value. There is no guarantee that shareholders will be able to sell all of the shares they desire in a quarterly repurchase offer. The Fund’s investments also are subject to liquidity risk. Liquidity risk exists when particular investments of the Fund would be difficult to purchase or sell, possibly preventing the Fund from selling such illiquid securities at an advantageous time or price, or possibly requiring the Fund to dispose of other investments at unfavorable times or prices in order to satisfy its obligations.
Market Risk – An investment in the fund’s shares is subject to investment risk, including the possible loss of the entire principal amount invested. An investment in the fund’s shares represents an indirect investment in the securities owned by the fund. The value of these securities, like other market investments, may move up or down, sometimes rapidly and unpredictably.
Mortgage-Backed Securities Risk – Mortgage-backed securities represent interests in “pools” of mortgages and often involve risks that are different from or possibly more acute than risks associated with other types of debt instruments. When the Fund invests in mortgage-backed securities, the Fund is subject to the risk that, if the underlying borrowers fail to pay interest or repay principal, the assets backing these securities may not be sufficient to support payments on the securities. Prepayment risk is associated with mortgage-backed securities. If interest rates fall, the underlying debt may be repaid ahead of schedule, reducing the value of the Fund’s investments. If interest rates rise, there may be fewer prepayments, which would cause the average bond maturity to rise, increasing the potential for the Fund to lose money. The value of these securities may be significantly affected by changes in interest rates, the market’s perception of issuers, and the creditworthiness of the parties involved. The ability of the Fund to successfully utilize these instruments may depend on the ability of the Fund’s Adviser or Sub-Adviser to forecast interest rates and other economic factors correctly. These securities may have a structure that makes their reaction to interest rate changes and other factors difficult to predict, making their value highly volatile. The credit risk on such securities is affected by borrowers defaulting on their loans. The values of assets underlying mortgage-backed securities may decline and, therefore, may not be adequate to cover underlying investors. Many of the risks of investing in MBS reflect the risks of investing in the real estate securing the underlying mortgage loans. These risks reflect the effects of local and other economic conditions on real estate markets, the ability of tenants to make loan payments, and the ability of a property to attract and retain tenants.
Pandemic Risk – The novel coronavirus COVID-19 continues to cause disruptions in the global economy and the financial markets. As the pandemic has evolved, the impact across countries and markets has varied based on the spread of the virus, regulation and public response. Further, the pandemic and the responses thereto have caused various disruptions to the global supply chain, affecting wide swaths of manufacturing, automotive and consumer goods, among other sectors. While the health and economic outlook may improve in the short-term in some markets, such improvements may be uncertain and short-lived due to the rise of potential new variants and increased cases and hospitalizations, as well as potential increased restrictions in the response thereto. Further, the negative economic consequences, including to the global supply chain, caused by the pandemic may be prolonged and take years to resolve, if ever. Further, issuers that operate in the hospitality, healthcare, travel and entertainment industries may continue to face adverse market conditions due to future restrictions, which could result in adverse performance and potentially bankruptcy. Further, the disruptions caused by the pandemic have contributed to the global and U.S. rise in inflation, which may further increase in the future. Changes in the nature of the pandemic, including any increases in virality and/or lethality, may have negative consequences for the Fund, its service providers and issuers. While the Adviser is actively monitoring the course of the pandemic and its consequences, the uncertainty triggered by the pandemic is likely to continue and may have chilling effects on the overall market and the Fund’s performance.
Preferred Securities Risk – There are various risks associated with investing in preferred securities, including credit risk, interest rate risk, deferral and omission of distributions, subordination to bonds and other debt securities in a company’s capital structure, limited liquidity, limited voting rights and special redemption rights. Interest rate risk is, in general, the risk that the price of a debt security falls when interest rates rise. Securities with longer maturities tend to be more sensitive to interest rate changes. Credit risk is the risk that an issuer of a security may not be able to make principal and interest or dividend payments on the security as they become due. Holders of preferred securities may not receive dividends, or the payment can be deferred for some period of time. In bankruptcy, creditors are generally paid before the holders of preferred securities.
| 46 | 1.888.926.2688 | www.apollo.com |
| Apollo Diversified Real Estate Fund | Notes to Financial Statements |
| September 30, 2022 |
Private Investment Fund Risk – The Fund’s investment in Private Investment Funds will require it to bear a pro rata share of the vehicles’ expenses, including management and performance fees. The fees the Fund pays to invest in a Private Investment Fund may be higher than if the manager of the Private Investment Fund managed the Fund’s assets directly. The performance fees charged by certain Private Investment Funds may create an incentive for its manager to make investments that are riskier and/or more speculative than those it might have made in the absence of a performance fee. Furthermore, Private Investment Funds, like the other Underlying Funds in which the Fund may invest, are subject to specific risks, depending on the nature of the vehicle, and also may employ leverage such that their returns are more than one times that of their benchmark which could amplify losses suffered by the Fund when compared to unleveraged investments. Shareholders of the Private Investment Funds are not entitled to the protections of the 1940 Act. For example, Private Investment Funds need not have independent boards, shareholder approval of advisory contracts may not be required, the Private Investment Funds may utilize leverage and may engage in joint transactions with affiliates. These characteristics present additional risks for shareholders.
Real Estate Industry Concentration Risk – Because the Fund will concentrate its investments in real estate securities, its portfolio will be significantly impacted by the performance of the real estate market and may experience more volatility and be exposed to greater risk than a more diversified portfolio. Significant investments in the securities of issuers within the real estate industry and any development affecting the real estate industry will have a greater impact on the value of the net assets of the Fund than would be the case if the Fund did not have significant investments in the real estate industry. The Fund’s investment in real estate equity or debt may be subject to risks similar to those associated with direct investment in real property. The value of the Fund’s shares will be affected by factors affecting the value of real estate and the earnings of companies engaged in the real estate industry. These factors include, among others: (i) changes in general economic and market conditions; (ii) changes in the value of real estate properties; (iii) risks related to local economic conditions, overbuilding and increased competition; (iv) increases in property taxes and operating expenses; (v) changes in zoning laws; (vi) casualty and condemnation losses; (vii) variations in rental income, neighborhood values or the appeal of property to tenants; (viii) the availability of financing and (ix) changes in interest rates. Many real estate companies utilize leverage, which increases investment risk and could adversely affect a company’s operations and market value in periods of rising interest rates. The value of securities of companies in the real estate industry may go through cycles of relative under-performance and outperformance in comparison to equity securities markets in general. As of September 30, 2022, the Fund had 102.52% of the value of its net assets invested within the real estate industry.
REIT Risk – Share prices of REITs may decline because of adverse developments affecting the real estate industry and real property values. In general, real estate values can be affected by a variety of factors, including supply and demand for properties, the economic health of the country or of different regions, and the strength of specific industries that rent properties. Qualification as a REIT under the Internal Revenue Code of 1986, as amended (the “Code”) in any particular year is a complex analysis that depends on a number of factors. There can be no assurance that an entity in which the Fund invests with the expectation that it will be taxed as a REIT will, in fact, qualify as a REIT. An entity that fails to qualify as a REIT would be subject to a corporate level tax, would not be entitled to a deduction for dividends paid to its shareholders and would not pass through to its shareholders the character of income earned by the entity. Dividends paid by REITs may not receive preferential tax treatment afforded other dividends.
9. SUBSEQUENT EVENTS
Subsequent events after the date of the Statement of Assets and Liabilities have been evaluated through the date the financial statements were issued.
The Fund completed a quarterly repurchase offer on November 8, 2022 which resulted in 8,117,358 shares being repurchased for $236,125,835. All shareholder repurchase requests received by the Fund in good order were honored in their full amounts.
On November 21, 2022, the Fund's lending arrangement with Credit Suisse was terminated. The Fund paid off all fees and no longer has any outstanding obligations under the Credit Suisse arrangement as of the termination date, November 21, 2022. On that date, the Fund entered into an arrangement with Bank of America, n.a. {"Bank of America"). The Bank of America arrangement is subject to a maximum commitment of $450,000,000 although the Fund may request an increase to the maximum commitment subject to certain conditions.
Management has determined that there were no other subsequent events to report through the issuance of these financial statements.
| Annual Report | September 30, 2022 | 47 |
| Report of Independent Registered | |
| Apollo Diversified Real Estate Fund | Public Accounting Firm |

To the Board of Trustees
and the Shareholders of Apollo Diversified Real Estate Fund
Opinion on the Financial Statements
We have audited the accompanying statement of assets and liabilities of Apollo Diversified Real Estate Fund (formerly Griffin Institutional Access Real Estate Fund) (the “Fund”), including the schedule of investments, as of September 30, 2022, and the related statements of operations and cash flows for the year then ended, the statements of changes in net assets for each of the years in the two-year period then ended and the financial highlights for each of the years in the five-year period then ended, and the related notes (collectively referred to as the “financial statements”). In our opinion, the financial statements present fairly, in all material respects, the financial position of the Fund as of September 30, 2022, and the results of its operations and cash flows for the year then ended, the changes in its net assets for each of the years in the two-year period then ended and its financial highlights for each of the years in the five-year period then ended, in conformity with accounting principles generally accepted in the United States of America.
Basis for Opinion
These financial statements are the responsibility of the Fund’s management. Our responsibility is to express an opinion on the Fund's financial statements based on our audits. We are a public accounting firm registered with the Public Company Accounting Oversight Board (United States) (“PCAOB”) and are required to be independent with respect to the Fund in accordance with the U.S. federal securities law and the applicable rules and regulations of the Securities and Exchange Commission and the PCAOB.
We conducted our audits in accordance with the standards of the PCAOB. Those standards require that we plan and perform the audits to obtain reasonable assurance about whether the financial statements are free of material misstatement, whether due to error or fraud. The Fund is not required to have, nor were we engaged to perform, an audit of its internal control over financial reporting. As part of our audits we are required to obtain an understanding of internal control over financial reporting but not for the purpose of expressing an opinion on the effectiveness of the Fund’s internal control over financial reporting. Accordingly, we express no such opinion.
Our audits included performing procedures to assess the risk of material misstatement of the financial statements, whether due to error or fraud, and performing procedures that respond to those risks. Such procedures included examining, on a test basis, evidence regarding the amounts and disclosures in the financial statements. Our procedures included confirmation of securities owned as of September 30, 2022 by correspondence with the custodian, brokers, and other appropriate parties. Our audits also included evaluating the accounting principles used and significant estimates made by management, as well as evaluating the overall presentation of the financial statements. We believe that our audits provide a reasonable basis for our opinion.

BBD, LLP
We have served as the auditor of Apollo Diversified Real Estate Fund (formerly Griffin Institutional access Real Estate Fund) since 2014.
Philadelphia, Pennsylvania
November 25, 2022
| 48 | 1.888.926.2688 | www.apollo.com |
| Apollo Diversified Real Estate Fund | Additional Information |
September 30, 2022 (Unaudited)
1. PROXY VOTING POLICIES AND VOTING RECORD
A description of the policies and procedures that the Fund uses to vote proxies relating to its portfolio securities is available without charge upon request by calling toll-free 888-926-2688, or on the Securities and Exchange Commission’s (“SEC”) website at http://www.sec.gov. Information regarding how the Fund voted proxies relating to underlying portfolio securities during the most recent 12-month period ended June 30th is available without charge upon request by calling toll-free 888-926-2688, or on the SEC’s website at http://www.sec.gov.
2. QUARTERLY PORTFOLIO HOLDINGS
The Fund files its complete schedule of portfolio holdings with the SEC for the first and third quarters of each fiscal year as an exhibit to its reports on Form N-PORT. The Fund’s Form N-PORT reports are available on the SEC’s web site at http://www.sec.gov.
| Annual Report | September 30, 2022 | 49 |
| Apollo Diversified Real Estate Fund | Trustees and Officers |
September 30, 2022 (Unaudited)
The business and affairs of the Fund are managed under the direction of the Trustees. Information concerning the Trustees and officers of the Fund is set forth below. Generally, each Trustee and officer serves an indefinite term or until certain circumstances such as his resignation, death, or otherwise as specified in the Fund’s organizational documents. Any Trustee may be removed at a meeting of shareholders by a vote meeting the requirements of the Fund’s organizational documents. The Statement of Additional Information of the Fund includes additional information about the Trustees and officers and is available, without charge, upon request by calling the Fund toll-free at 888-926-2688.
INDEPENDENT TRUSTEES
| Name and Birth Year | Position/Term of Office* | Principal Occupation During Past Five Years | Number of Portfolios in Fund Complex** Overseen by Trustee | Other Directorships held by Trustee During Last Five Years |
| Nathan Headrick (1974) | Trustee Since 2014 | Managing Director, BluWater Group (financial services firm), 2019 -present; Managing Director and Founder, Triloma Financial Group (private equity firm), 2013 -2019. | 1 | Apollo Diversified Credit Fund, 2017 - 2022. |
| Robb Chapin (1962) | Trustee Since 2014 | Chief Executive Officer and Co-Chief Investment Officer, Bridge Seniors Housing Fund Manager, LLC (real estate fund management), 2013 -present. | 1 | Apollo Diversified Credit Fund, 2017 - 2022; Bridge Seniors Housing & Medical Properties Fund, LP (real estate fund), 2013 - present. |
| Ira Cohen (1959) | Trustee Since 2014 | Executive Vice President, Recognos Financial (financial data services firm), 2015 - present; and Chief Executive Officer, Ira Cohen Consulting, LLC (mutual fund operations consulting firm), 2005 - present. | 1 | Apollo Diversified Credit Fund, 2017 - 2022; Valued Advisers Trust (all series), 2010 - present; Angel Oak Financial Strategies Income Term Trust, 2018 - present; Angel Oak Strategic Credit Fund, 2017 - present; and Angel Oak Funds Trust (for all of its series), 2014 - present |
| 50 | 1.888.926.2688 | www.apollo.com |
| Apollo Diversified Real Estate Fund | Trustees and Officers |
September 30, 2022 (Unaudited)
INTERESTED TRUSTEES AND OFFICERS
| Name and Birth Year | Position/Term of Office* | Principal Occupation During Past Five Years | Number of Portfolios in Fund Complex** Overseen by Trustee | Other Directorships held by Trustee During Last Five Years |
| Randy Anderson (1968) | Chairman, Secretary and Trustee Since 2014 and President Since 2022 | Partner, Apollo Global Management, Inc., 2022 – present; Chief Economist, Griffin Capital Company, LLC, 2014 - 2022; Chief Executive Officer, Griffin Capital Asset Management Company, LLC, 2021 - 2022; Chief Investment Officer, Griffin Capital Advisor, LLC, 2014 - 2022; Chief Investment Officer, Griffin Capital Credit Advisor, LLC, 2017 - 2022; President, Griffin Capital Asset Management Company, LLC, 2014 - 2022. | 1 | Co-Chief Executive Officer, Co-President and Director, Apollo Realty Income Solutions, Inc., 2022-present; Chairman, Secretary and Trustee, Apollo Diversified Credit Fund, 2017 - 2022; Executive Vice President, Griffin Capital BDC Corp., 2014 - 2017. |
| Kenneth Seifert (1978) | Treasurer and Chief Financial Officer Since 2022 | Principal and Director, Apollo Global Management, Inc., since 2021 and 2017, respectively. Treasurer and Chief Financial Officer of Apollo Diversified Credit Fund since 2022. Treasurer and Chief Financial Officer of Apollo Senior Floating Rate Fund and Apollo Tactical Income Fund since 2021, Controller 2017-2021. | N/A | N/A |
| Ryan Del Giudice (1990) | Chief Compliance Officer Since 2018, Vice President and Assistant Secretary Since 2020 | Principal, Apollo Global Management, Inc., 2022 – present. Chief Compliance Officer of Apollo Diversified Credit Fund since 2018 and Vice President and Assistant Secretary since 2020. Chief Compliance Officer, Apollo Real Estate Fund Adviser, LLC and Apollo Capital Credit Adviser, LLC 2018 - 2022. Vice President, Cipperman Compliance Services, LLC, 2015 - 2017. | N/A | N/A |
| * | The term of office for each Trustee and officer listed above will continue indefinitely. |
| ** | The term “Fund Complex” refers to the Apollo Diversified Real Estate Fund. |
| Annual Report | September 30, 2022 | 51 |
| Apollo Diversified Real Estate Fund | Service Providers |
September 30, 2022 (Unaudited)
Investment Adviser
Apollo Real Estate Fund Adviser, LLC
9 W 57th Street, New York, NY 10019
Investment Sub-Advisers
Aon Investments USA Inc.
200 East Randolph Street, Suite 1500, Chicago, IL 60601
CenterSquare Investment Management LLC
630 West Germantown Pike, Suite 300, Plymouth Meeting, PA 19462
Administrator
ALPS Fund Services, Inc.
1290 Broadway, Suite 1000, Denver, CO 80203
Custodian
UMB Bank, n.a.
1010 Grand Blvd., Kansas City, Missouri 64106
Distributor
ALPS Distributors, Inc.
1290 Broadway, Suite 1000, Denver, CO 80203
Independent Registered Public Accounting Firm
BBD, LLP
1835 Market Street, 3rd Floor, Philadelphia, PA 19103
Legal Counsel
Greenberg Traurig, LLP
Terminus 200, 3333 Piedmont Road NE, Suite 2500, Atlanta, GA 30305
Transfer Agent and DRIP Administrator
DST Systems, Inc.
330 W 9th Street, Kansas City, MO 64105
| 52 | 1.888.926.2688 | www.apollo.com |
| Apollo Diversified Real Estate Fund | Privacy Notice |
September 30, 2022 (Unaudited)
NOTICE OF PRIVACY POLICY & PRACTICES
Apollo Diversified Real Estate Fund (the “Fund”) is committed to maintaining the confidentiality, integrity, and security of your nonpublic personal information (“NPI”). When you provide personal information, the Fund believes that you should be aware of policies utilized to protect the confidentiality of that information. The Fund needs to share your NPI to conduct everyday business. The following information is intended to help you understand what NPI we collect, how we protect your NPI from unauthorized access and why the Fund may share your NPI with other affiliated and non-affiliated parties.
The Fund collects the following nonpublic personal information about you:
| ● | Information we receive from you on or in applications or other forms, correspondence, or conversations, including, but not limited to, your name, address, phone number, social security number, assets, income, and date of birth; and |
| ● | Information about your transactions with us, our affiliates, or others, including, but not limited to, your account number and balance, payments history, parties to transactions, cost basis information, and other financial information. |
How does the Fund protect your nonpublic personal information?
To protect your nonpublic personal information from unauthorized access and use, the Fund maintains physical, electronic and procedural safeguards that comply with applicable federal and state standards. These measures include computer safeguards and secured files and buildings.
What does the Fund do with your personal information?
The Fund does not permit use of your personal information for any joint marketing or non-business purpose. Further, the Fund does not permit the disclosure of your personal information to non-affiliated parties for marketing purposes. The Fund may, however, disclose your personal information to comply with regulatory requirements, court orders or other legal requirements.
Affiliated Parties
The Fund does not disclose any nonpublic personal information about our current or former shareholders to affiliated parties, except as permitted by applicable law or regulation and as described herein. The Fund may, for example, share NPI with personnel of the Fund’s investment adviser and affiliated broker-dealer which also serves as the Fund’s exclusive wholesale marketing agent. The Fund shares NPI with its affiliates for business purposes only in an effort to service your account(s) which includes, but is not limited to, assisting in processing your transactions, inquiring about your transactions and experience, sending you shareholder reports and other information about the Fund or to otherwise provide the applicable service and maintain your account(s). The Fund’s affiliated parties that receive your NPI are required to protect your NPI, provide it only to personnel who need and use it solely for the purpose for which they received it. The Fund and its affiliated parties that receive your NPI maintain physical, electronic and procedural safeguards that comply with applicable federal and state standards to guard your NPI.
Non-Affiliated Parties
The Fund does not disclose any nonpublic personal information about our current or former shareholders to non-affiliated third parties, except as permitted by applicable law or regulation and as described herein. The Fund may share NPI with non-affiliated service providers and their employees, including the Fund’s administrator, transfer agent, distributor, proxy solicitors and legal counsel, among others. The Fund shares NPI with its non-affiliated service providers to service your account(s) including, but not limited to, processing your transactions, sending you shareholder reports and other information about the Fund or to otherwise provide the applicable service and maintain your account(s). These non-affiliated service providers are required to protect your NPI and use it solely for the purpose for which they received it. The non-affiliated service providers are required to maintain physical, electronic and procedural safeguards that comply with applicable federal and state standards to guard your NPI.
| Annual Report | September 30, 2022 | 53 |
Intentionally Left Blank

Item 2. Code of Ethics.
| (a) | Apollo Diversified Real Estate Fund (the “Fund”) has adopted a Code of Ethics that applies to the Fund’s principal executive officer and principal financial officer. |
| (b) | Not applicable. |
| (c) | During the period covered by this report, there were no amendments to the Fund’s Code of Ethics. |
| (d) | During the period covered by this report, the Fund had not granted any express or implicit waivers from the Code of Ethics. |
| (e) | Not applicable. |
| (f) | The Fund’s Code of Ethics is attached hereto as exhibit 13(A)(1). |
Item 3. Audit Committee Financial Expert.
The Board of Trustees (the “Board”) of the Fund has determined that the Fund has at least one audit committee financial expert serving on its Audit Committee. The Board has designated Ira Cohen as the Fund’s audit committee financial expert. Mr. Cohen is “independent” as defined in paragraph (a)(2) of Item 3 to Form N-CSR.
Item 4. Principal Accountant Fees and Services.
| (a) | Audit Fees: For the Fund’s last two fiscal years ended September 30, 2021 and September 30, 2022, the aggregate fees billed for professional services rendered by the principal accountant for the audit of the Fund’s annual financial statements or services that are normally provided by the accountant in connection with statutory and regulatory filings or engagements were $23,000 and $25,500, respectively. |
| (b) | Audit-Related Fees: For the Fund’s last two fiscal years ended September 30, 2021 and September 30, 2022, the aggregate fees billed for assurance and related services by the principal accountant that are reasonably related to the performance of the audit of the Fund’s financial statements and not otherwise reported under paragraph (a) of Item 4 of this report were $0 and $0, respectively. |
| (c) | Tax Fees: For the Fund’s last two fiscal years ended September 30, 2021 and September 30, 2022, the aggregate fees billed for professional services rendered by the principal accountant for tax compliance, tax advice and tax planning, which were comprised of the preparation of excise filings and income tax returns for the Fund were $3,000 and $3,000, respectively. |
| (d) | All Other Fees: For the Fund’s last two fiscal years ended September 30, 2021 and September 30, 2022, the aggregate fees billed for products and services other than the services reported in paragraphs (a) through (c) of Item 4 of this report, were provided by the principal accountant, $0 and $0, respectively. |
| (e) | (1) | The audit committee’s pre-approval policies and procedures require that all services to be performed by the Fund’s principal accountant must be pre-approved by the Fund’s Audit Committee. |
| (2) | No services described in paragraphs (b) through (d) of Item 4 of this report were approved by the Fund’s Audit Committee pursuant to paragraph (c)(7)(i)(C) of Rule 2-01 of Regulation S-X. |
| (f) | Not applicable to the Fund. |
| (g) | For the Fund’s last two fiscal year ended September 30, 2021 and September 30, 2022, the aggregate non-audit fees for services rendered to the Fund, the Fund’s investment adviser and any entity controlling, controlled by, or under common control with the adviser that provides ongoing services to the Fund were $3,000 and $3,000, respectively. |
| (h) | The Fund’s Audit Committee has considered whether the provision of non-audit services to the Fund’s investment adviser and any entity controlling, controlled by, or under common control with the investment adviser that provides ongoing services to the Fund, that were not pre-approved pursuant to paragraph (c)(7)(ii) of Rule 2-01 of Regulation S-X, is compatible with maintaining the principal accountant’s independence. |
Item 5. Audit Committee of Listed Registrants.
The Fund is not a listed issuer as defined in Rule 10A-3 under the Securities Exchange Act of 1934, as amended.
Item 6. Investments.
| (a) | The schedule of investments is included as part of the Reports to Stockholders filed under Item 1 of this report. |
| (b) | Not applicable to the Fund. |
Item 7. Disclosure of Proxy Voting Policies and Procedures for Closed-End Management Investment Companies.
The proxy voting policies and procedures of Apollo Real Estate Fund Adviser, LLC and CenterSquare Investment Management LLC are attached hereto as exhibit EX 99.Item 7.
Item 8. Portfolio Managers of Closed-End Management Investment Companies.
| (a)(1) | Randy I. Anderson Ph.D., CRE — Dr. Anderson is a Partner at Apollo Global Management, Inc. (“AGMI”). Dr. Anderson serves as the Chairman of the Fund’s Board of Trustees and one of the Fund’s Portfolio Managers, positions he has held since inception. He also has served as the President of the Fund since May 2022. Dr. Anderson has served as a member of the Investment Committee of Apollo Real Estate Fund Adviser, LLC (the “Adviser”) since its formation in 2014. Dr. Anderson has also served as the Co-Chief Executive Officer, Co-President and a director of Apollo Realty Income Solutions, Inc. since June 2022. Dr. Anderson has also been a member of the Investment Committee of ARIS Management, LLC, the investment adviser to Apollo Realty Income Solutions, Inc. since June 2022. Previously, Dr. Anderson served as the Chief Economist of Griffin Capital Company, LLC, a position he held from 2014 to 2022. In addition, Dr. Anderson served as Chief Executive Officer of Griffin Capital Asset Management Company, LLC, from 2021 to 2022. Dr. Anderson previously served as President of Griffin Capital Asset Management Company, LLC from 2015 to 2020.
From 2012-2013, Dr. Anderson held several senior executive positions at Bluerock Real Estate LLC, including founding partner of the Bluerock Total Income Plus Real Estate Fund, where he was the Portfolio Manager. Dr. Anderson served as the Howard Phillips Eminent Scholar Chair and Professor of Real Estate at the University of Central Florida from 2008 through 2013, where he was responsible for growing the real estate program, including the establishment of the Professional MS in Real Estate. While at the University of Central Florida, Dr. Anderson was a member of the University Foundation Investment Sub-Committee which provides investment advice for the endowment, was the academic member of the Florida Association of Realtors Education Foundation Advisory Board, and was an ex-officio board member of the Central Florida Commercial Association of Realtors. In 2007, Dr. Anderson was President, Chief Executive Officer, and founding partner of Franklin Square Capital Partners, where he helped establish, strategically organize, and capitalize the firm. From 2005 through 2007, Dr. Anderson also served as Chief Economist for CNL Financial Group as well as Divisional President for CNL Real Estate Advisors. Prior to CNL, Dr. Anderson was the Chief Economist and Director of Research for the Marcus and Millichap Company from 2002 through 2005 and Vice President of Research at Prudential Real Estate Advisors from 2001 through 2002.
Dr. Anderson is a former co-editor of the Journal of Real Estate Portfolio Management and the Journal of Real Estate Literature. Dr. Anderson received the Kinnard Young Scholar Award from the American Real Estate Society, an award which recognizes outstanding real estate scholarship for young academics, served as the Executive Director for the American Real Estate Society, was named a Homer Hoyt Fellow and a NAIOP Distinguished Fellow, and has been invited to guest lecture at leading global universities. Dr. Anderson received his B.A. in Finance from North Central College in 1991 as a Presidential Scholar and holds a Ph.D. in Finance as a Presidential Fellow from the University of Alabama, where he graduated with highest distinction in 1996.
Spencer J. Propper — Mr. Propper is a Partner at AGMI. Mr. Propper serves as one of the Fund’s Portfolio Managers and has served as a member of the Investment Committee of the Adviser since its formation in 2014. Mr. Propper has also served as the Co-Chief Investment Officer and a member of the Investment Committee of ARIS Management, LLC since June 2022. Previously, Mr. Propper served as Managing Director of Griffin Capital Company, LLC and Chief Operating Officer of Griffin Capital Asset Management Company, LLC. Prior to his roles with the Fund and the Adviser, Mr. Propper was a Director at Lakemont Group, a boutique real estate investment banking and consulting firm. Within this role Mr. Propper provided portfolio management services to the Bluerock Total Income Plus Real Estate Fund. Additionally, at the Lakemont Group, Mr. Propper was responsible for overseeing projects for a variety of clients including pension funds, private equity firms and publicly traded real estate companies and specialized in structured finance, market analysis and strategic due diligence. Mr. Propper holds a Master of Business Administration and Bachelor of Science in Finance and Real Estate from the University of Central Florida. |
| (a)(2) | As of September 30, 2022, Dr. Anderson and Mr. Propper were responsible for the management of the following types of accounts in addition to the Fund: |
Other Accounts By Type | Total Number of Accounts by Account Type | Total Assets By Account Type | Number of Accounts by Type Subject to a Performance Fee | Total Assets By Account Type Subject to a Performance Fee |
| Registered Investment Companies | 0 | $0 | 0 | $0 |
| Other Pooled Investment Vehicles1 | 1 | $0 | 1 | $0 |
| Other Accounts | 0 | $0 | 0 | $0 |
Actual or apparent conflicts of interest may arise when a Portfolio Manager has day-to-day management responsibilities with respect to more than one fund or other account.
Certain inherent conflicts of interest arise from the fact that the Portfolio Managers, the Adviser and its affiliates provide investment management services both to the Fund and the other Apollo-advised funds, including other funds, client accounts, proprietary accounts and any other investment vehicles that the Adviser and its affiliates may establish from time to time, in which the Fund will not have an interest. The Portfolio Managers, the Adviser and its affiliates may give advice and recommend securities to the other Apollo-advised funds that may differ from advice given to, or securities recommended or bought for, the Fund, even though their investment objectives may be the same or similar to those of the Fund.
The Adviser will seek to manage potential conflicts of interest in good faith; nonetheless, the portfolio strategies employed by the Portfolio Managers, the Adviser and its affiliates in managing the other Apollo-advised funds could conflict with the transactions and strategies employed by the Portfolio Managers in managing the Fund and may affect the prices and availability of the securities and instruments in which the Fund invests. Conversely, participation in specific investment opportunities may be appropriate, at times, for both the Fund and the other Apollo-advised funds. It is the policy of the Adviser to generally share appropriate investment opportunities (and sale opportunities) with the other Apollo-advised funds to the extent consistent with applicable legal requirements. In general, this policy will result in such opportunities being allocated pro rata among the Fund and the other Apollo-advised funds. Nevertheless, investments and/or opportunities may be allocated other than on a pro rata basis, to the extent it is done in good faith and does not, or is not reasonably expected to, result in an improper disadvantage or advantage to one participating Apollo-advised fund as compared to another participating Apollo-advised fund.
|
| 1 | Apollo Realty Income Solutions, Inc. had yet to commence operations as of September 30, 2022. |
In the event investment opportunities are allocated among the Fund and the other Apollo-advised funds, the fund may not be able to structure its investment portfolio in the manner desired. Although the Adviser endeavors to allocate investment opportunities in a fair and equitable manner, it is possible that the fundd may not be given the opportunity to participate in certain investments made by the other Apollo-advised funds or portfolio managers affiliated with the Adviser. Furthermore, the Fund and the other Apollo-advised funds may make investments in securities where the prevailing trading activity may make impossible the receipt of the same price or execution on the entire volume of securities purchased or sold by the Fund and the other Apollo-advised funds. When this occurs, the various prices may be averaged, and the Fund will be charged or credited with the average price. Thus, the effect of the aggregation may operate on some occasions to the disadvantage of the Fund. In addition, under certain circumstances, the Fund may not be charged the same commission or commission equivalent rates in connection with a bunched or aggregated order.
It is possible that other Apollo-advised funds may make investments in the same or similar securities at different times and on different terms than the Fund. From time to time, the Fund and the other Apollo-advised funds may make investments at different levels of an issuer’s capital structure or otherwise in different classes of an issuer’s securities. Such investments may inherently give rise to conflicts of interest or perceived conflicts of interest between or among the various classes of securities that may be held by such entities. Conflicts may also arise because portfolio decisions regarding the Fund may benefit the other Apollo-advised funds. For example, the sale of a long position or establishment of a short position by the Fund may impair the price of the same security sold short by (and therefore benefit) one or more Apollo-advised funds, and the purchase of a security or covering of a short position in a security by the Fund may increase the price of the same security held by (and therefore benefit) one or more Apollo-advised funds.
While these conflicts cannot be eliminated, the Adviser, when consistent with fund objectives, guidelines and other fiduciary considerations and when practicable, the Fund and the other Apollo-advised funds may hold investments in the same levels of an issuer’s capital structure in the same proportion at each level.
Although the professional staff of the Adviser will devote as much time to the management of the Fund as the Adviser deems appropriate to perform its obligations, the professional staff of the Adviser may have conflicts in allocating its time and services among the Fund and other affiliated investment vehicles and accounts. The Adviser and its affiliates are not restricted from forming additional investment funds, from entering into other investment advisory relationships or from engaging in other business activities, even though such activities may be in competition with the Fund and/or may involve substantial time and resources of the Adviser and its professional staff. These activities could be viewed as creating a conflict of interest in that the time and effort of the members of the Adviser and their officers and employees will not be devoted exclusively to the business of the Fund but will be allocated between the business of the registrant and the management of the monies of other clients of the Adviser’s affiliates. |
A conflict of interest may arise where the financial or other benefits available to a Portfolio Manager differ among the accounts that he manages. If the structure of the Adviser’s (or its affiliates’) management fee or the Portfolio Manager’s compensation differs among accounts (such as where certain accounts pay higher management fees or performance based management fees), the Portfolio Managers may be motivated to favor accounts in which they have investment interests, or in which the Adviser or its affiliates have investment interests. Similarly, the desire to maintain assets under management or to enhance a Portfolio Manager’s performance record or to derive other rewards, financial or otherwise, could influence the Portfolio Manager in affording preferential treatment to those accounts that could most significantly benefit the Portfolio Manager. For example, as reflected above, if a Portfolio Manager manages accounts that have performance fee arrangements, certain portions of his compensation will depend on the achievement of performance milestones on those accounts. The Portfolio Manager could be incented to afford preferential treatment to those accounts and thereby be subject to a potential conflict of interest.
The Fund and the Adviser’s affiliates have adopted compliance policies and procedures that are reasonably designed to address the various conflicts of interest that may arise for the Adviser and its staff members. However, there is no guarantee that such policies and procedures will be able to detect and prevent every situation in which an actual or potential conflict may arise. |
| (a)(3) | The Adviser’s financial arrangements with its portfolio managers, its competitive compensation and its career path emphasis at all levels reflect the value senior management places on key resources. Compensation may include a variety of components and may vary from year to year based on a number of factors. The principal components of compensation include base compensation and discretionary compensation. |
| ● | Base Compensation. Generally, portfolio managers receive an annual salary that is consistent with the market rate of annual salaries paid to similarly situated investment professionals. |
| ● | Discretionary Compensation. Portfolio managers also receive discretionary compensation generally consisting of two components: an annual bonus and carried interest. |
| ● | Annual Bonus. Generally, a portfolio manager receives an annual bonus based on such person’s individual performance, operational performance for the Apollo-advised funds for which such person serves, and such portfolio manager’s impact on the overall operating performance and potential to contribute to long-term value and growth. A portion of each annual bonus may be deferred and, at the discretion of Apollo, may be in the form of cash or equity of an Apollo entity, such as restricted stock units of Apollo Global Management, Inc. |
| ● | Carried Interest. Generally, a portfolio manager receives carried interests with respect to the Apollo-advised funds for which such person serves as a portfolio manager, subject to standard terms and conditions, including vesting. |
| (a)(4) | As of September 30, 2021, Dr. Anderson and Mr. Propper did not have direct beneficial ownership in Fund shares. |
Item 9. Purchases of Equity Securities by Closed-End Management Investment Company and Affiliates Purchasers.
None.
Item 10. Submission of Matters to a Vote of Security Holders.
No changes have occurred.
Item 11. Controls and Procedures.
| (a) | Based on an evaluation of the Fund’s disclosure controls and procedures (as defined in Rule 30a-3(c) under the 1940 Act), the Fund’s principal executive officer and principal financial officer have concluded that the Fund’s disclosure controls and procedures are effective as of a date within 90 days of the filing date of this report. |
| (b) | There were no significant changes in the Fund’s internal control over financial reporting that occurred during the Fund’s last fiscal half-year that have materially affected, or are reasonably likely to materially affect, the Fund’s internal control over financial reporting. |
Item 12. Disclosure of Securities Lending Activities for Closed-End Management Investment Companies.
None.
Item 13. Exhibits.
| (a)(1) | The Fund’s Code of Ethics, which is the subject of the disclosure required by Item 2 of Form N-CSR, is attached hereto as exhibit EX 99.13(A)(1). |
| (a)(2) | Certifications required by Item 13(a)(2) of Form N-CSR are filed herewith as Exhibit 99.CERT.
|
| (a)(3) | None.
|
| (a)(4) | Not applicable. |
| (a)(5) | The proxy voting policies and procedures of the Fund’s investment adviser and investment sub-adviser are attached hereto in response to Item 7 of Form N-CSR. |
| (b) | Certifications required by Item 13(b) of Form N-CSR are filed herewith as Exhibit 99.906CERT. |
SIGNATURES
Pursuant to the requirements of the Securities Exchange Act of 1934 and the Investment Company Act of 1940, the Registrant has duly caused this report to be signed on its behalf by the undersigned, thereunto duly authorized.
APOLLO DIVERSIFIED REAL ESTATE FUND
| By: | /s/ Randy Anderson | |
| Randy Anderson | ||
| Chairman and President (Principal Executive Officer) | ||
| Date: | December 6, 2022 |
Pursuant to the requirements of the Securities Exchange Act of 1934 and the Investment Company Act of 1940, this report has been signed below by the following persons on behalf of the Registrant and in the capacities and on the dates indicated.
| By: | /s/ Randy Anderson | |
| Randy Anderson | ||
| Chairman and President (Principal Executive Officer) | ||
| Date: | December 6, 2022 |
| By: | /s/ Kenneth Seifert | |
| Kenneth Seifert | ||
| Treasurer and Chief Financial Officer (Principal Financial Officer) | ||
| Date: | December 6, 2022 |