
1 INVESTOR PRESENTATION June 2022 NYSE: VRTV © Veritiv 2022 | All Rights Reserved EXHIBIT 99.1
© Veritiv 2022 | All Rights Reserved 2 Safe Harbor Provision Certain statements contained in this presentation regarding Veritiv Corporation’s (the "Company") future operating results, p erf ormance, strategy, business plans, prospects, guidance, and any other statements not constituting historical fact are "forward - looking statements" subject to the safe harbor created by the Private Securities Litigation Reform Act of 1995. Where possible, the words "believe," "expect," "anticipate," "continue," "intend," "should," "will," "would," "planned," "est ima ted," "potential," "goal," "outlook,“ “target,” "may," "predicts," "could," or the negative of such terms, or other comparable expressions, have been used to identify such forward - looking stateme nts. All forward - looking statements reflect only the Company’s current beliefs and assumptions with respect to future operating results, performance, business plans, prospects, g uid ance and other matters, and are based on information currently available to the Company. Accordingly, the statements are subject to significant risks, uncertainties a nd contingencies, which could cause the Company’s actual operating results, performance, business plans, prospects or guidance to differ materially from those expressed in, or implie d b y, these statements. Factors that could cause actual results to differ materially from current expectations include the risks and other factors de scr ibed under "Risk Factors" and elsewhere in our Annual Report on Form 10 - K and in the Company's other publicly available reports filed with the Securities and Exchange Commission ("SE C"). Such risks and other factors, which in some instances are beyond the Company's control, include: adverse impacts of the COVID - 19 pandemic; the industry - wide decline in dema nd for paper and related products; increased competition from existing and non - traditional sources; procurement and other risks in obtaining packaging, facility products and paper from our suppliers for resale to our customers; changes in prices for raw materials; changes in trade policies and regulations; increases in the cost of fuel and third - party fr eight and the availability of third - party freight providers; the loss of any of our significant customers; inability to realize expected benefits of restructuring plans; adverse developments in general business and economic conditions that could impair our ability to use net operating loss carryforwards and other deferred tax assets; our ability to adequately protect o ur material intellectual property and other proprietary rights, or to defend successfully against intellectual property infringement claims by third parties; our ability to attract, train and ret ain highly qualified employees; our pension and health care costs and participation in multi - employer pension, health and welfare plans; the effects of work stoppages, union negotiations a nd labor disputes; our ability to generate sufficient cash to service our debt; increasing interest rates; our ability to refinance or restructure our debt on reasonable terms and cond iti ons as might be necessary from time to time; our ability to comply with the covenants contained in our debt agreements; costs to comply with laws, rules and regulations, including envir onm ental, health and safety laws, and to satisfy any liability or obligation imposed under such laws; changes in tax laws; adverse results from litigation, governmental investiga tio ns or audits, or tax - related proceedings or audits; regulatory changes and judicial rulings impacting our business; the impact of adverse developments in general business and ec ono mic conditions as well as conditions in the global capital and credit markets on demand for our products and services, our business including our international operations, and our customers; foreign currency fluctuations; inclement weather, widespread outbreak of an illness, anti - terrorism measures and other disruptions to our supply chain, distribution syst em and operations; our dependence on a variety of information technology and telecommunications systems and the Internet; our reliance on third - party vendors for various services ; cybersecurity risks; and other events of which we are presently unaware or that we currently deem immaterial that may result in unexpected adverse operating results. The Company i s n ot obligated to update the information contained in this presentation beyond the published date and is not responsible for changes made to this document by wire services or Inte rne t service providers. This presentation is being furnished to the SEC through a Form 8 - K. We reference non - GAAP financial measures in this presentation. Please see the appendix for reconciliations of non - GAAP measures to the most comparable United States ("U.S.") GAAP measures.

© Veritiv 2022 | All Rights Reserved 3 Who is Veritiv? Sal Abbate Chief Executive Officer: September 2020 Previous Veritiv Roles: • Chief Operating Officer: January 2020 • Chief Commercial Officer: April 2018 Previous Experience: • Andersen Windows, SVP Chief Sales & Marketing Officer 2011 – 2018 • Eastman Chemical (formerly Solutia), VP Global Sales & Marketing 2008 – 2011 Steve Smith Chief Financial Officer: March 2014 Investor Engagement Scott Palfreeman Vice President, Finance & Investor Relations: September 2020 Previous Experience: • American Greetings: Chief Financial Officer: 2006 – 2014; VP of Investor Relations and Treasurer: 2003 – 2006 • General Cable, Vice President and Treasurer: 1999 - 2003 Leadership team is aligned around commercial - led strategy

© Veritiv 2022 | All Rights Reserved • 115 distribution centers in North America • 16 million square feet of distribution center space • 700+ truck fleet • 13 packaging design centers in North America and Asia 4 Veritiv at a Glance 4 NET SALES 1 $7.1 BILLION • Serving customers across a wide array of industries both in North America and globally • Conducting business with a diversified customer base including more than half of Fortune 500 ® companies • Sourcing globally from leading manufacturers Extensive Supply Chain Network 2 1. Last twelve months as of March 31, 2022 HQ ATLANTA GA LARGEST B2B PACKAGING DISTRIBUTOR IN NORTH AMERICA FORTUNE 500 ® COMPANY ~$2.1 BILLION MARKET CAP (June 1, 2022) • Xpedx was spun off from International Paper • Unisource was previously owned 60/40 by Bain Capital and Georgia - Pacific • Bain Capital and Georgia - Pacific held 49% of shares when Veritiv went public in July 2014. Completed exit in March 2021. Founded in 2014 | Merger of Xpedx and Unisource A leading full - service provider of packaging products, services and solutions. Additionally, Veritiv provides facility supplies and solutions, print and publishing products, and logistics solutions. 2. As of March 31, 2022

© Veritiv 2022 | All Rights Reserved Print Solutions Sourcing Globally to Deliver Best - in - Class Printing Product Line - up and Service Packaging Total Packaging Solution from Concept to Delivery Facility Solutions Providing Products and Expertise to Maintain a Clean and Healthy Environment 5 Segment Portfolio 56% 67% Sales 1 Adj. EBITDA 1 Segment Mix 1. Last twelve months as of March 31, 2022; Corporate and Other is excluded from the calculation for percentage of Adjusted E BIT DA and Net Sales by Segment 13% 9% 31% 24% Adj. EBITDA Margin 1 10.6% 6.0% 6.9%

© Veritiv 2022 | All Rights Reserved 8% 23% 69% 8% Well diversified Packaging business Product Assortment 3 6 2 Top 9 Competitors Leader in highly fragmented competitive landscape within Packaging industry All Others Customer / Industry Sectors Heavy Manufacturing Food & Beverage Light Manufacturing Other Wholesale & Retail Corrugated & Fiber Flexibles (Films, Cushioning, Bags, Tapes and Mailers) Ancillary Packaging (Labels, Surface Protection, Adhesives) Automation Equipment & Other Rigid 3 Approximately 50% of packaging products are custom 1 Based on management estimates 2 Veritiv estimated market share based on last twelve months sales as of March 31, 2022 $45 BILLION 1 ~ Healthcare Transportation Leader in Fragmented and Attractive Packaging Industry

© Veritiv 2022 | All Rights Reserved Key Messages 7 2 3 4 Invest in Growth Earnings Expansion & Low Leverage 1 Inflection Point in Business Fundamentals Strategic Portfolio Transformation

© Veritiv 2022 | All Rights Reserved Segment Mix Transformation Strategic Shift to Packaging FY 2014 1, 2 $154 MILLION $403 MILLION 1. Pro Forma 2. See appendix for reconciliations of non - GAAP measures to the most comparable U.S. GAAP measures; Corporate and Other is excluded from the calculation for percentage of Adjusted EBITDA by Segment. 3. Last twelve months as of March 31, 2022 LTM 1Q22 2, 3 Packaging 55% 8 ADJUSTED EBITDA BY SEGMENT Packaging 8 - Year Adj. EBITDA CAGR: +14% (14% Adj. EBITDA CAGR since 2017) 1 FY 2022 Adj. EBITDA Guidance: $445 - $485M 55% 15% 30% Packaging 55% 9% 67% 24% Packaging Facility Sol. Print Solutions Print Solutions Packaging Facility Sol.
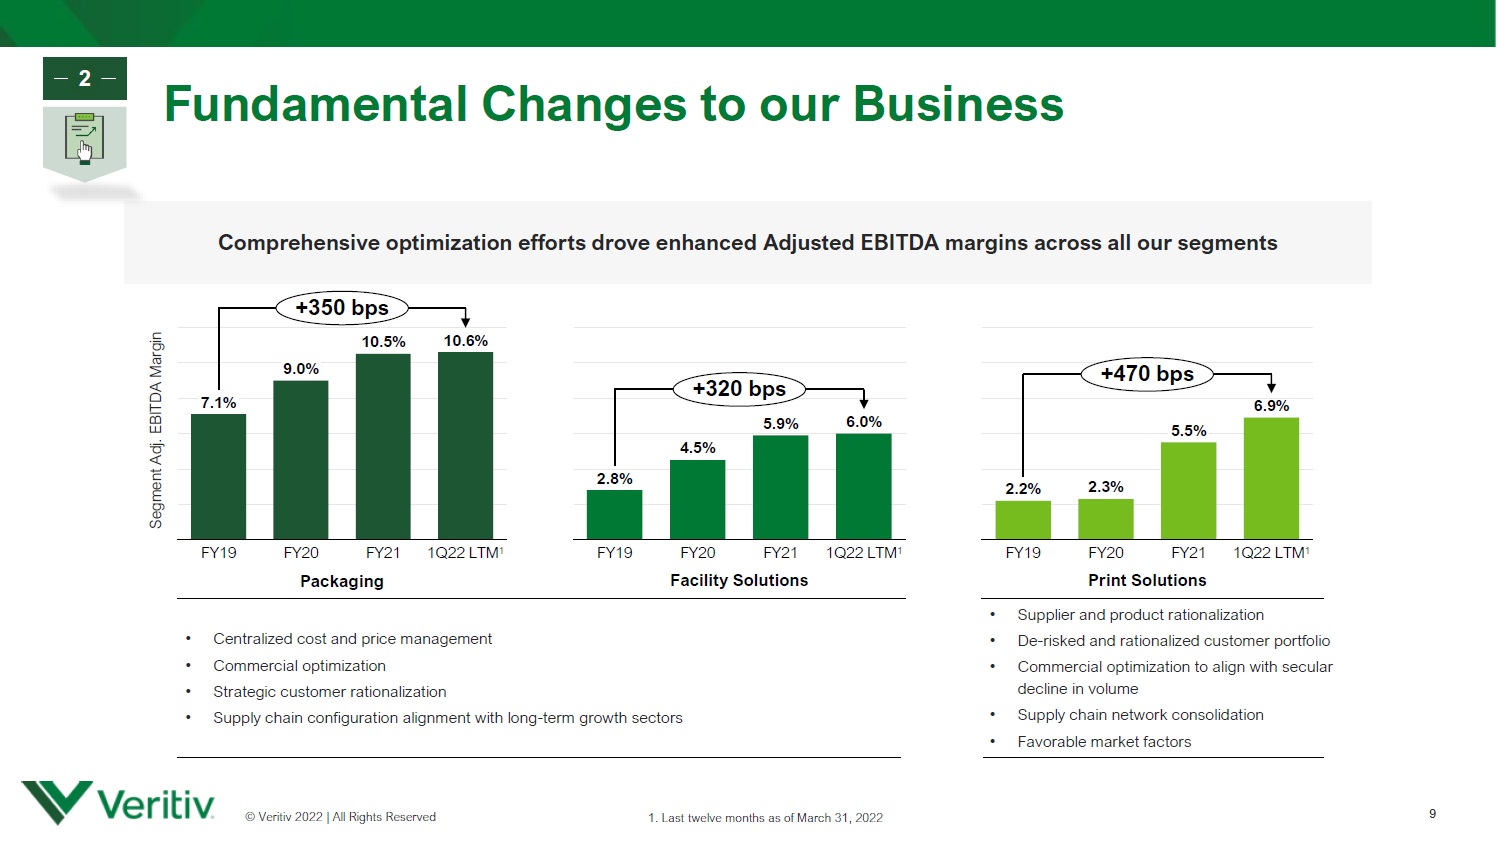
© Veritiv 2022 | All Rights Reserved Fundamental Changes to our Business 9 Packaging Facility Solutions Print Solutions • Centralized cost and price management • Commercial optimization • Strategic customer rationalization • Supply chain configuration alignment with long - term growth sectors • Supplier and product rationalization • De - risked and rationalized customer portfolio • Commercial optimization to align with secular decline in volume • Supply chain network consolidation • Favorable market factors Comprehensive optimization efforts drove enhanced Adjusted EBITDA margins across all our segments Segment Adj. EBITDA Margin 2 1. Last twelve months as of March 31, 2022 9.0% 10.6% FY20 FY19 FY21 1Q22 LTM 1 7.1% 10.5% +350 bps FY20 1Q22 LTM 1 5.9% 2.8% FY19 FY21 4.5% 6.0% +320 bps FY19 FY20 FY21 1Q22 LTM 1 6.9% 2.2% 2.3% 5.5% +470 bps

© Veritiv 2022 | All Rights Reserved Sustainable Margin Improvements 10 Multi - year commercial and supply chain optimization initiatives drove 300+ basis points of improvements in Adjusted EBITDA margin across all segments. OUTLOOK: Adjusted EBITDA margins for all segments expected to be at or above prior year levels for remainder of 2022. Segment Adj. EBITDA Margin 2 1. Last twelve months as of March 31, 2022 2.8% 2.2% 0.0% 10.0% 2.0% 8.0% 6.0% 4.0% 12.0% + 3.5% 7.1% + 3.2% Facility Solutions + 1.6% + 3.1% Print Solutions Packaging 6.9% 1Q22 LTM 1 5.3% 6.0% 1Q22 LTM 1 10.6% 1Q22 LTM 1 Favorable Market Factors Commercial and Supply Chain Optimization FY’19 Adj. EBITDA Margin (Baseline)

© Veritiv 2022 | All Rights Reserved Packaging Growth Above Market GDP+ Growth Rate 11 Above Market Organic Growth 100 - 200 bps above market Inorganic Growth Disciplined approach to acquisitions Large & Diverse Customer Base GDP - like growth • Scope & scale acquisitions • Continue to increase high - margin segment mix • Focus on high - growth sectors • Differentiate with specialized solutions • Leverage scale to win with growing and blue - chip companies • Diversified customer base across footprint (no customer greater than 5% of revenue) • Extensive product offering and expertise Above market growth driven by a combination of organic and inorganic growth initiatives 3

© Veritiv 2022 | All Rights Reserved Trajectory for 2022 Earnings Guidance 1. See appendix for reconciliations of non - GAAP measures to the most comparable U.S. GAAP measures. 12 Adjusted EBITDA and EPS growth in 2020 despite COVID - related headwinds; accelerated earnings growth in 2021 and 2022 4 $18.00 - $21.00 $445 - $485M ($0.85) ($0.99) ($1.84) $2.08 $ 0.00 $ - 5.00 $ 5.00 $ 10.00 $ 15.00 $ 20.00 $ 25.00 FY17 FY18 FY19 FY20 FY21 FY22E $9.01 $18.00 – $21.00 Diluted EPS $ 0 M $ 100 M $ 300 M $ 200 M $ 400 M $ 500 M $ 445M – $ 485M FY18 FY17 FY19 FY20 FY21 $156M FY22E $176M $185M $188M $343M +22% CAGR Adjusted EBITDA 1

© Veritiv 2022 | All Rights Reserved Optionality from Cash Flow, Low Leverage 13 Reduction in net leverage below long - term target of 3x enabled active share repurchase program and investments in growth. Record low net leverage provides both financial and strategic optionality. 4 1. Cash flow from operations less capital expenditures. 2. Calculated as net debt divided by trailing twelve months of Adjusted EBITDA. 3 . S ee appendix for reconciliations of non - GAAP measures to the most comparable U.S. GAAP measures . 1.0 x 5.0 x 0.0 x 2.0 x 3.0 x 4.0 x FY17 FY18 1.1 x FY19 FY20 FY21 1Q22 LTM 2.1 x 4.6 x 4.7 x 4.1 x 1.1 x - 3.5 x Net Leverage Ratio 2,3 $ - 100 M $ 300 M $ 0 M $ 100 M $ 200 M $266M FY18 FY21 FY17 FY19 FY20 FY22E $4M ($30M) $247M $134M ~ $250M Free Cash Flow 1,3

© Veritiv 2022 | All Rights Reserved Conclusion 14 1. See appendix for reconciliations of non - GAAP measures to the most comparable U.S. GAAP measures. 2. Calculated as net debt divided by trailing twelve months of Adjusted EBITDA, as of March 31, 2022. 2 3 4 Investment in Growth Earnings Expansion & Low Leverage FY21 Adj. EBITDA CAGR of 13% in Packaging since 2017; - Investments in organic growth - Disciplined approach to inorganic growth FY21 Adj. EBITDA CAGR of 18% overall since 2017 Net Leverage 2 of 1.1x 1 ; improved from 4.6x in 2017 1 Inflection Point in Business Fundamentals More than doubled Adj. EBITDA Margin 1 from 2% in 2017 to 5% in FY21; - Commercial and supply chain optimization - Segment mix shift to Packaging - Packaging growth Strategic Portfolio Transformation Packaging mix shift from 55% to 67% of total Segment Adj. EBITDA since 2014

© Veritiv 2022 | All Rights Reserved APPENDIX NYSE: VRTV © Veritiv 2022 | All Rights Reserved

© Veritiv 2022 | All Rights Reserved 16 Value - Added Services 1 In - House Same - Day Delivery Capability Source Product from Leading and Niche Manufacturers Comprehensive Hub & Spoke Warehousing Footprint across North America Network of Global Suppliers Veritiv - Managed Supply Chain Product Design , Prototype & Structural Testing Contract Product Packaging , Inventory and Program Management Solutions Expertise for Quality, Economic Fit, and Sustainability 1 Approximately 50% of packaging products are custom Full - Service Packaging Solutions Provider Product Concept to Delivery

© Veritiv 2022 | All Rights Reserved 2021 Corporate Social Responsibility Report published in May 2022 • Recent Progress: • Developed supplier quality, social and environmental performance assessment program • Best in class safety rating • Launched Women and African American Employee Resource Groups (ERGs) • DEI performance target incorporated into 2022 annual incentive compensation plan • 1/3 of board members are female • Expanded portfolio of products with one or more sustainability attributes • ESG Goals | Commitment to Improvement: • 50% Reduction of total Scope 1 and Scope 2 GHG Emissions from 2020 base level by 2030 • Recycling Program – increase diversion rate to 30% by end of 2023 • Implement Environmental Management System meeting ISO Certification standard at nearly all U.S. facilities by the end of 2026 • Increase number of employees from underrepresented groups; launch three - year DE&I action plan • Complete ESG assessment of our top 100 suppliers by the end of 2023 17 Sustainability and Corporate Responsibility

© Veritiv 2022 | All Rights Reserved Proactive Changes to Segment Portfolio 18 Strategic acquisition and divestitures enhanced shift in segment portfolio mix toward Packaging All - American Containers Packaging Acquisition 2017 Strategic Customer Exits (Print) 2017 Wide Format Exit (Print) 2018 Saalfeld Redistribution Exit (Facility Solutions) Late 2019 Veritiv Express Exit (Print) 2020 1 Rollsource Exit (Print) 2021 Veritiv Canada (Primarily Facility Solutions & Print) 2022

© Veritiv 2022 | All Rights Reserved 1. Figures based on FY 2021 results of Veritiv Canada, Inc. as a percentage of Veritiv Consolidated. | 2. Excluding non - core fo od service packaging <9% of Adj. EBITDA ~10% of Sales ~15% of Employee Base Canada 1 by the numbers: Why Sell Canada? • Highly concentrated across lower margin products, customers and sectors • Less than 20% of sales in Canada were Packaging 2 • Proceeds from sale will be reinvested in higher margin growth businesses, the current share repurchase program of $200M, and other capital priorities 1 Strategic Portfolio Transformation Veritiv Canada Divestiture 19

© Veritiv 2022 | All Rights Reserved Accelerated Earnings Potential 20 Inflection point in business fundamentals and segment portfolio transformation expected to drive long - term earnings growth and margin expansion Segment Mix Shift to Packaging Packaging Growth Business Process Optimization & Operational Changes Significant progress in 2020 - 2021 toward long - term earnings targets Historical 3 - 5 Year Target 1 2 3 1 2 3 2

© Veritiv 2022 | All Rights Reserved Veritiv is an indispensable partner, developing Packaging solutions from concept to delivery Value - Added Solutions Broad Product and Customer Expertise Higher - Growth Customer Sectors End - to - End Digital Ecosystem Enhanced Customer Experience Comprehensive Supply Chain & Leading Suppliers - Foundational Enablers - Organic Growth Above Market GDP+ Growth Rate 3 21

© Veritiv 2022 | All Rights Reserved Inorganic Growth Objectives Disciplined Approach to Acquisitions Packaging 73% Print 11% Facility Solutions 11% Packaging 55% Print 20% 22 Acquisition Considerations : Targeted Financial Parameters : • EBITDA: $5 - $100M • EBITDA Margins > 10% Scope (EBITDA: $5 - $ 50M ) • Packaging goods & services: - Enhanced product offering - Unique service capability - Deep industry expertise - Proprietary technology Scale (EBITDA: $25 - $ 100M ) • Synergistic companies with similar product & service capabilities • Micro to small - cap 2017 Acquisition: All - American Containers Non - auction process, family - owned rigid packaging business 3

© Veritiv 2022 | All Rights Reserved Disciplined Capital Allocation 23 4 Reduction in net leverage below long - term target of 3x enabled active share repurchase program and investments in growth. Record low net leverage provides both financial and strategic optionality. Capital Allocation Priorities: • Invest in the business: • Organic • Inorganic • Return value to shareholders 2022 CapEx : Approximately $ 30M Active $200M Share Repurchase Program Scope and/or Scale Acquisitions Disciplined Approach

© Veritiv 2022 | All Rights Reserved Board of Directors 24 Stephen E. Macadam, Chairman Former CEO of EnPro (Industrial Distribution ) Salvatore A. Abbate Chief Executive Officer, Veritiv Shantella E. Cooper Former Chief Transformation Officer of WestRock (Paper & Packaging) David E. Flitman CEO of Builders FirstSource (Building Materials) Tracy A. Leinbach Former CFO of Ryder (Supply Chain Logistics) Gregory B. Morrison Former Chief Information Officer of Cox Enterprises (Communication) Michael P. Muldowney CEO of Foxford Capital, LLC (Financial Services) Charles G. Ward, III Former Partner at Perella Weinberg Partners (Financial Services) Autumn R. Bayles SVP, Global Supply Chain of Aramark (Food & Facilities)

© Veritiv 2022 | All Rights Reserved Senior Leadership Team 25 Salvatore A. Abbate Chief Executive Officer Stephen J. Smith Senior Vice President and Chief Financial Officer Dean A. Adelman Senior Vice President and Chief Human Resources Officer Daniel B. Calderwood Senior Vice President, Marketing and Business Management Susan B. Salyer Senior Vice President, General Counsel and Corporate Secretary Stephanie E. Mayerle Senior Vice President, Sales Karen K. Renner Senior Vice President and Chief Information Officer Peter C. Troup Vice President, Corporate Development Michael D. Walkenhorst Senior Vice President, Developing Businesses and Global Operations Daniel J. Watkoske Senior Vice President of Print and Publishing

© Veritiv 2022 | All Rights Reserved Appendix Reconciliation of Non - GAAP Financial Measures We supplement our financial information prepared in accordance with U.S. GAAP with certain non - GAAP measures including Adjusted EBITDA (earnings before interest, income taxes, depreciation and amortization, restructuring charges, net, integration and acquisition expenses and other simil ar charges including any severance costs, costs associated with warehouse and office openings or closings, consolidation, and relocation and other business optimization expe nse s, stock - based compensation expense, changes in the LIFO reserve, non - restructuring asset impairment charges, non - restructuring severance charges, non - restructuring pension charges, net, fair value adjustments related to contingent liabilities assumed in mergers and acquisitions and certain other adjustments), free cash f low and other non - GAAP measures such as the Net Debt to Adjusted EBITDA ratio. We believe investors commonly use Adjusted EBITDA, free cash flow and these other non - GAAP me asures as key financial metrics for valuing companies. In addition, the credit agreement governing our Asset - Based Lending Facility (the "ABL Facility") permits us to exclude the foregoing and other charges in calculating "Consolidated EBITDA", as defined in the ABL Facility. Adjusted EBITDA, free cash flow and these other non - GAAP measures are not alternative measures of financial performance or liqui dity under U.S. GAAP. Non - GAAP measures do not have definitions under U.S. GAAP and may be defined differently by, and not be comparable to, similarly title d m easures used by other companies. As a result, we consider and evaluate non - GAAP measures in connection with a review of the most directly comparable measure calculate d in accordance with U.S. GAAP. We caution investors not to place undue reliance on such non - GAAP measures and to consider them with the most directly comparable U .S. GAAP measures. Adjusted EBITDA, free cash flow and these other non - GAAP measures have limitations as analytical tools and should not be considered in isolation or as a substitute for analyzing our results as reported under U.S. GAAP. Please see the following tables for reconciliations of non - GAAP measures to the most comparable U.S. G AAP measures. 26

© Veritiv 2022 | All Rights Reserved Appendix Reconciliation of Non - GAAP Financial Measures 27 Low High Net income (loss) $ 270 $ 305 Interest expense, net 15 15 Income tax expense (benefit) 80 95 Depreciation and amortization 50 50 Other reconciling items 30 20 Adjusted EBITDA $ 445 $ 485 Forecast for Year Ending December 31, 2022 Table I.a. VERITIV CORPORATION NET INCOME (LOSS) TO ADJUSTED EBITDA GUIDANCE (in millions, unaudited)

© Veritiv 2022 | All Rights Reserved Appendix Reconciliation of Non - GAAP Financial Measures 28 1Q22 LTM 2021 2020 2019 2018 2017 Veritiv As Reported Pro Forma Adjustments* Veritiv Pro Forma Net income (loss) 201.8$ 144.6$ 34.2$ (29.5)$ (15.7)$ (13.3)$ (19.6)$ $ (16.2) $ (35.8) Interest expense, net 15.6 17.2 25.1 38.1 42.3 31.2 14.0 12.4 26.4 Income tax expense (benefit) 49.6 52.9 8.8 0.7 5.5 11.4 (2.1) 6.8 4.7 Depreciation and amortization 53.4 55.2 57.7 53.5 53.5 54.2 37.6 16.8 54.4 EBITDA 320.4 269.9 125.8 62.8 85.6 83.5 29.9 19.8 49.7 Restructuring charges, net 13.8 15.4 52.2 28.8 21.3 16.7 4.0 0.2 4.2 Facility closure charges, including (gain) loss from asset disposition (0.8) 0.1 (3.7) - - - - - - Stock-based compensation 9.0 7.4 17.7 14.6 18.1 15.7 4.0 0.1 4.1 LIFO reserve (decrease) increase 49.5 43.6 (1.5) (3.7) 19.9 7.1 6.3 1.3 7.6 Non-restructuring asset impairment charges - - - - 0.4 8.4 - - - Non-restructuring severance charges 8.7 7.8 4.1 8.4 4.9 3.5 2.6 0.4 3.0 Non-restructuring pension charges, net 0.5 0.5 7.2 6.6 11.3 2.2 - - - Gain on sale of joint venture - - - - - - - (6.6) (6.6) Integration, acquisition and merger expenses - - - 17.5 31.8 36.5 75.1 14.1 89.2 Fair value adjustment on Tax Receivable Agreement contingent liability - - (19.1) 0.3 (1.2) (9.4) 1.7 - 1.7 Fair value adjustment on contingent consideration liability - - 1.0 13.1 (12.3) 2.0 - - - Escheat audit contingent liability - - (0.2) 3.7 2.5 7.5 - - - Other 1.5 (2.1) 4.1 3.8 3.1 2.7 (1.7) 2.3 0.6 Loss from discontinued operations, net of income taxes - - - - - - 0.1 - 0.1 Adjusted EBITDA 402.6$ 342.6$ 187.6$ 155.9$ 185.4$ 176.4$ 122.0$ 31.6$ 153.6$ Net Sales 7,149.3$ 6,850.5$ 6,345.6$ 7,659.4$ 8,696.2$ 8,364.7$ 7,406.5$ 1,907.6$ $ 9,314.1 Adjusted EBITDA Margin 5.6% 5.0% 3.0% 2.0% 2.1% 2.1% 1.6% 1.6% * Pro forma adjustments take into account the merger with UWW Holdings, Inc. and the related financing as if they occurred on January 1, 2014, as well as purchase accounting adjustments and adjustments for one-time costs related to the merger. Year Ended December 31, Table l.b VERITIV CORPORATION NET INCOME (LOSS) TO ADJUSTED EBITDA; ADJUSTED EBITDA MARGIN (in millions, unaudited) Year Ended December 31, 2014
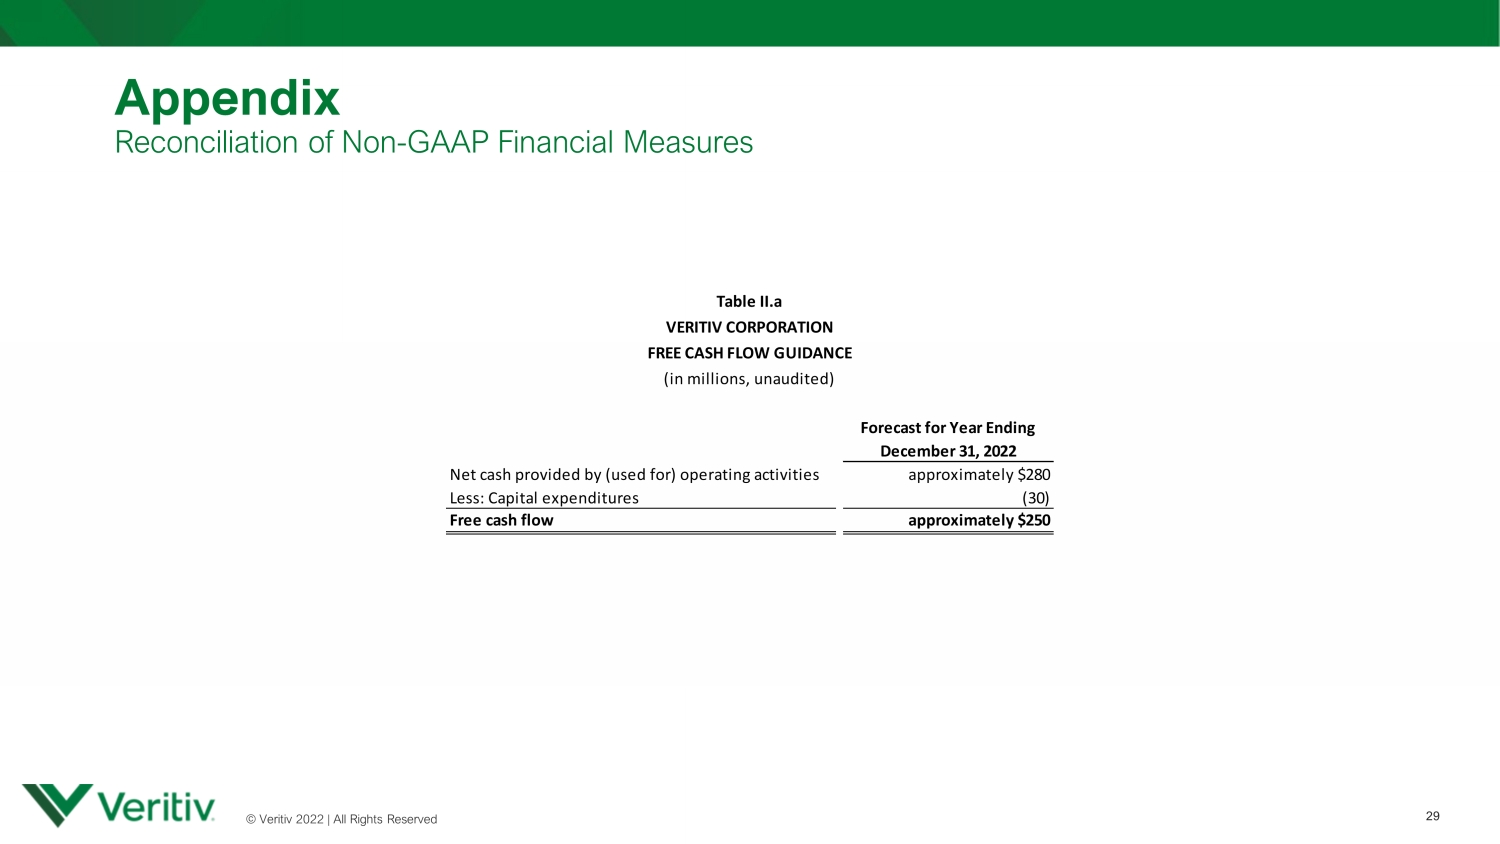
© Veritiv 2022 | All Rights Reserved Appendix Reconciliation of Non - GAAP Financial Measures 29 Forecast for Year Ending December 31, 2022 Net cash provided by (used for) operating activities approximately $280 Less: Capital expenditures (30) Free cash flow approximately $250 Table II.a VERITIV CORPORATION FREE CASH FLOW GUIDANCE (in millions, unaudited)
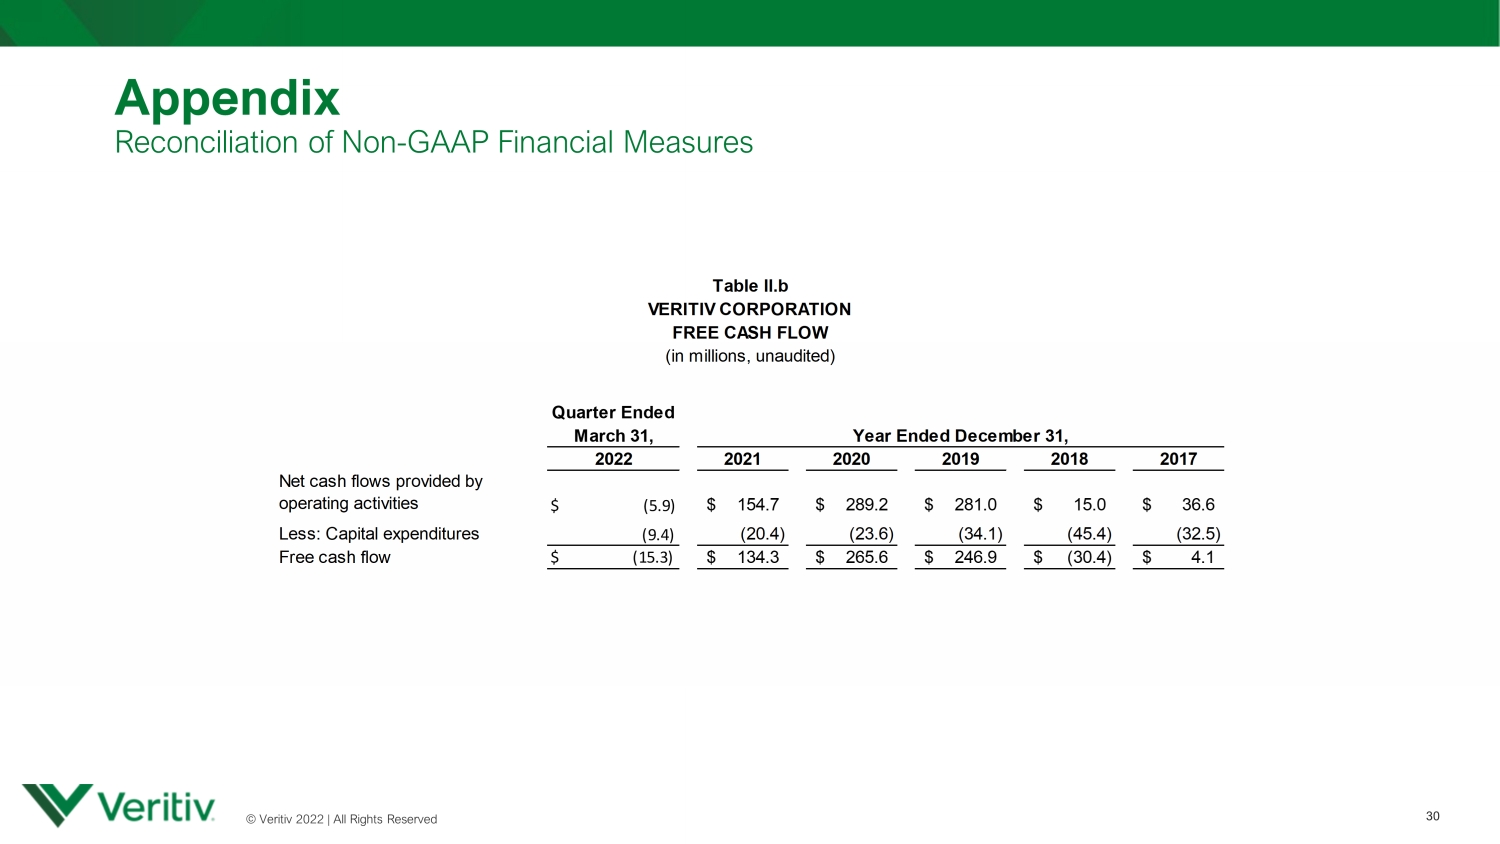
© Veritiv 2022 | All Rights Reserved Appendix Reconciliation of Non - GAAP Financial Measures 30 VERITIV CORPORATION FREE CASH FLOW (in millions, unaudited) Quarter Ended March 31, 2022 2021 2020 2019 2018 2017 Net cash flows provided by operating activities $ (5.9) 154.7$ 289.2$ 281.0$ 15.0$ 36.6$ Less: Capital expenditures (9.4) (20.4) (23.6) (34.1) (45.4) (32.5) Free cash flow $ (15.3) 134.3$ 265.6$ 246.9$ (30.4)$ 4.1$ Table ll.b Year Ended December 31,

© Veritiv 2022 | All Rights Reserved Appendix Reconciliation of Non - GAAP Financial Measures 31 1Q22 LTM 2021 2020 2019 2018 2017 Amount drawn on ABL Facility 474.2$ 440.8$ 520.2$ 673.2$ 932.1$ 897.7$ Less: Cash and cash equivalents (33.8) (49.3) (120.6) (38.0) (64.3) (80.3) Net debt 440.4$ 391.5$ 399.6$ 635.2$ 867.8$ 817.4$ Last twelve months Adjusted EBITDA 402.6$ 342.6$ 187.6$ 155.9$ 185.4$ 176.4$ Net debt to Adjusted EBITDA 1.1 1.1 2.1 4.1 4.7 4.6 1Q22 LTM 2021 2020 2019 2018 2017 Net income (loss) 201.8$ 144.6$ 34.2$ (29.5)$ (15.7)$ (13.3)$ Interest expense, net 15.6 17.2 25.1 38.1 42.3 31.2 Income tax expense (benefit) 49.6 52.9 8.8 0.7 5.5 11.4 Depreciation and amortization 53.4 55.2 57.7 53.5 53.5 54.2 EBITDA 320.4 269.9 125.8 62.8 85.6 83.5 Restructuring charges, net 13.8 15.4 52.2 28.8 21.3 16.7 Facility closure charges, including (gain) loss from asset disposition (0.8) 0.1 (3.7) - - - Stock-based compensation 9.0 7.4 17.7 14.6 18.1 15.7 LIFO reserve (decrease) increase 49.5 43.6 (1.5) (3.7) 19.9 7.1 Non-restructuring asset impairment charges - - - - 0.4 8.4 Non-restructuring severance charges 8.7 7.8 4.1 8.4 4.9 3.5 Non-restructuring pension charges, net 0.5 0.5 7.2 6.6 11.3 2.2 Integration, acquisition and merger expenses - - - 17.5 31.8 36.5 Fair value adjustment on Tax Receivable Agreement contingent liability - - (19.1) 0.3 (1.2) (9.4) Fair value adjustment on contingent consideration liability - - 1.0 13.1 (12.3) 2.0 Escheat audit contingent liability - - (0.2) 3.7 2.5 7.5 Other 1.5 (2.1) 4.1 3.8 3.1 2.7 Adjusted EBITDA 402.6$ 342.6$ 187.6$ 155.9$ 185.4$ 176.4$ Table lll VERITIV CORPORATION NET DEBT TO ADJUSTED EBITDA (in millions, unaudited) Year Ended December 31,

INVESTOR PRESENTATION 32 June 2022 NYSE: VRTV © Veritiv 2022 | All Rights Reserved